North Royalton, OH Map & Demographics
North Royalton Map
North Royalton Overview
$47,679
PER CAPITA INCOME
$106,546
AVG FAMILY INCOME
$81,511
AVG HOUSEHOLD INCOME
30.5%
WAGE / INCOME GAP [ % ]
69.5¢/ $1
WAGE / INCOME GAP [ $ ]
$8,843
FAMILY INCOME DEFICIT
0.44
INEQUALITY / GINI INDEX
31,120
TOTAL POPULATION
15,400
MALE POPULATION
15,720
FEMALE POPULATION
97.96
MALES / 100 FEMALES
102.08
FEMALES / 100 MALES
45.0
MEDIAN AGE
2.8
AVG FAMILY SIZE
2.3
AVG HOUSEHOLD SIZE
17,666
LABOR FORCE [ PEOPLE ]
67.4%
PERCENT IN LABOR FORCE
4.2%
UNEMPLOYMENT RATE
North Royalton Zip Codes
North Royalton Area Codes
Income in North Royalton
Income Overview in North Royalton
Per Capita Income in North Royalton is $47,679, while median incomes of families and households are $106,546 and $81,511 respectively.
| Characteristic | Number | Measure |
| Per Capita Income | 31,120 | $47,679 |
| Median Family Income | 8,678 | $106,546 |
| Mean Family Income | 8,678 | $135,361 |
| Median Household Income | 13,541 | $81,511 |
| Mean Household Income | 13,541 | $108,864 |
| Income Deficit | 8,678 | $8,843 |
| Wage / Income Gap (%) | 31,120 | 30.51% |
| Wage / Income Gap ($) | 31,120 | 69.49¢ per $1 |
| Gini / Inequality Index | 31,120 | 0.44 |
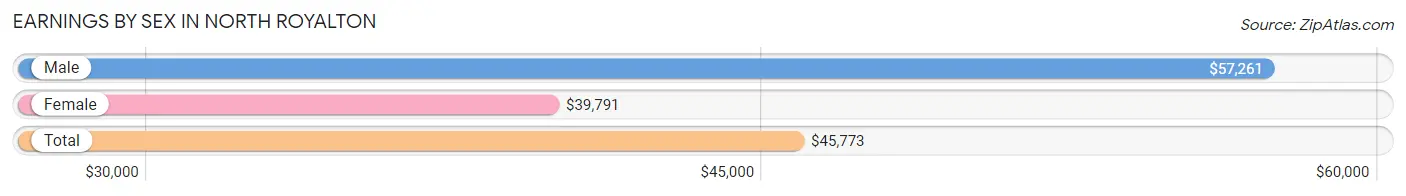
Earnings by Sex in North Royalton
Average Earnings in North Royalton are $45,773, $57,261 for men and $39,791 for women, a difference of 30.5%.
| Sex | Number | Average Earnings |
| Male | 9,405 (51.2%) | $57,261 |
| Female | 8,956 (48.8%) | $39,791 |
| Total | 18,361 (100.0%) | $45,773 |
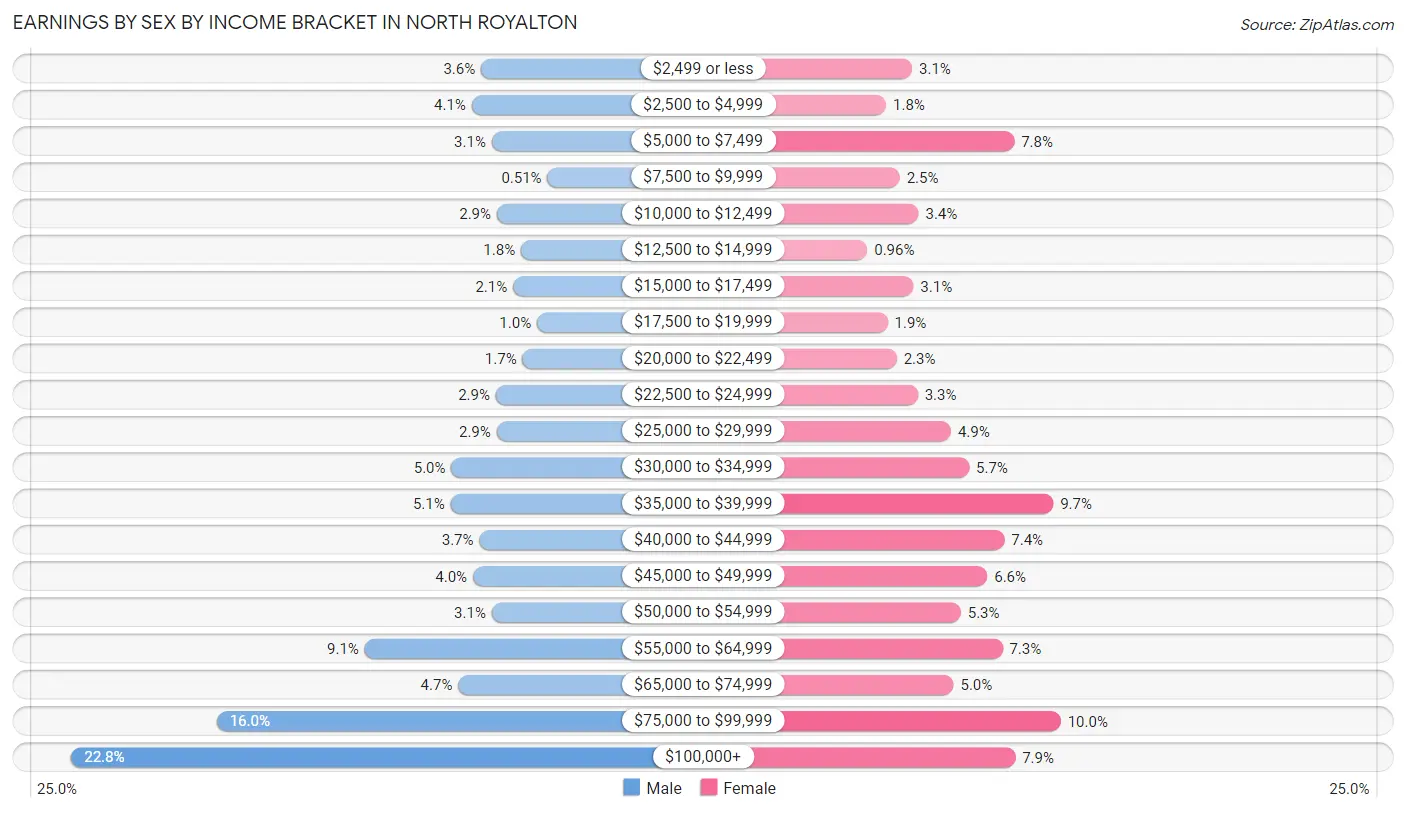
Earnings by Sex by Income Bracket in North Royalton
The most common earnings brackets in North Royalton are $100,000+ for men (2,145 | 22.8%) and $75,000 to $99,999 for women (897 | 10.0%).
| Income | Male | Female |
| $2,499 or less | 340 (3.6%) | 274 (3.1%) |
| $2,500 to $4,999 | 382 (4.1%) | 165 (1.8%) |
| $5,000 to $7,499 | 293 (3.1%) | 702 (7.8%) |
| $7,500 to $9,999 | 48 (0.5%) | 222 (2.5%) |
| $10,000 to $12,499 | 271 (2.9%) | 301 (3.4%) |
| $12,500 to $14,999 | 165 (1.8%) | 86 (1.0%) |
| $15,000 to $17,499 | 199 (2.1%) | 279 (3.1%) |
| $17,500 to $19,999 | 94 (1.0%) | 171 (1.9%) |
| $20,000 to $22,499 | 158 (1.7%) | 210 (2.3%) |
| $22,500 to $24,999 | 276 (2.9%) | 297 (3.3%) |
| $25,000 to $29,999 | 272 (2.9%) | 437 (4.9%) |
| $30,000 to $34,999 | 471 (5.0%) | 513 (5.7%) |
| $35,000 to $39,999 | 475 (5.1%) | 866 (9.7%) |
| $40,000 to $44,999 | 348 (3.7%) | 661 (7.4%) |
| $45,000 to $49,999 | 376 (4.0%) | 589 (6.6%) |
| $50,000 to $54,999 | 293 (3.1%) | 478 (5.3%) |
| $55,000 to $64,999 | 853 (9.1%) | 653 (7.3%) |
| $65,000 to $74,999 | 441 (4.7%) | 448 (5.0%) |
| $75,000 to $99,999 | 1,505 (16.0%) | 897 (10.0%) |
| $100,000+ | 2,145 (22.8%) | 707 (7.9%) |
| Total | 9,405 (100.0%) | 8,956 (100.0%) |
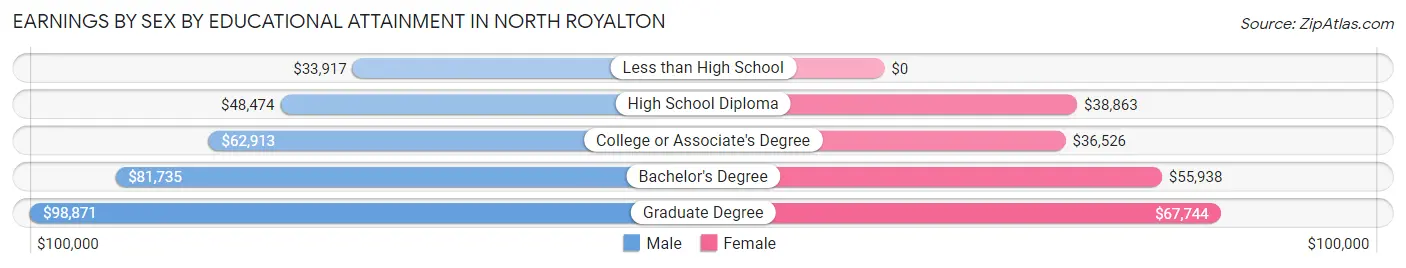
Earnings by Sex by Educational Attainment in North Royalton
Average earnings in North Royalton are $63,264 for men and $44,389 for women, a difference of 29.8%. Men with an educational attainment of graduate degree enjoy the highest average annual earnings of $98,871, while those with less than high school education earn the least with $33,917. Women with an educational attainment of graduate degree earn the most with the average annual earnings of $67,744, while those with college or associate's degree education have the smallest earnings of $36,526.
| Educational Attainment | Male Income | Female Income |
| Less than High School | $33,917 | $0 |
| High School Diploma | $48,474 | $38,863 |
| College or Associate's Degree | $62,913 | $36,526 |
| Bachelor's Degree | $81,735 | $55,938 |
| Graduate Degree | $98,871 | $67,744 |
| Total | $63,264 | $44,389 |
Family Income in North Royalton
Family Income Brackets in North Royalton
According to the North Royalton family income data, there are 1,996 families falling into the $100,000 to $149,999 income range, which is the most common income bracket and makes up 23.0% of all families. Conversely, the less than $10,000 income bracket is the least frequent group with only 69 families (0.8%) belonging to this category.
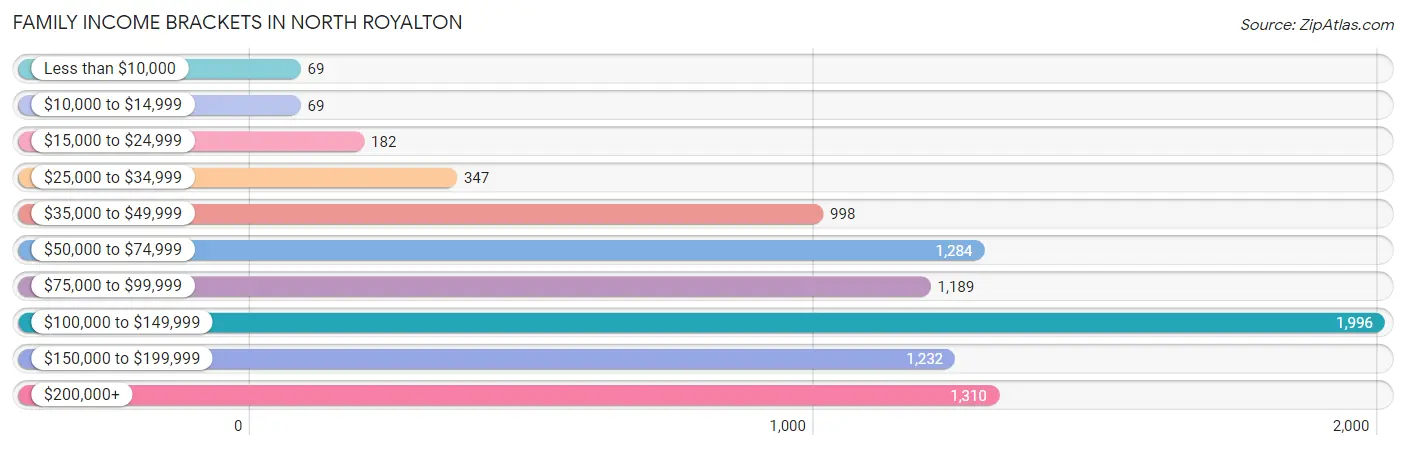
| Income Bracket | # Families | % Families |
| Less than $10,000 | 69 | 0.8% |
| $10,000 to $14,999 | 69 | 0.8% |
| $15,000 to $24,999 | 182 | 2.1% |
| $25,000 to $34,999 | 347 | 4.0% |
| $35,000 to $49,999 | 998 | 11.5% |
| $50,000 to $74,999 | 1,284 | 14.8% |
| $75,000 to $99,999 | 1,189 | 13.7% |
| $100,000 to $149,999 | 1,996 | 23.0% |
| $150,000 to $199,999 | 1,232 | 14.2% |
| $200,000+ | 1,310 | 15.1% |
Family Income by Famaliy Size in North Royalton
7+ person families (90 | 1.0%) account for the highest median family income in North Royalton with $196,087 per family, while 2-person families (4,687 | 54.0%) have the highest median income of $41,292 per family member.
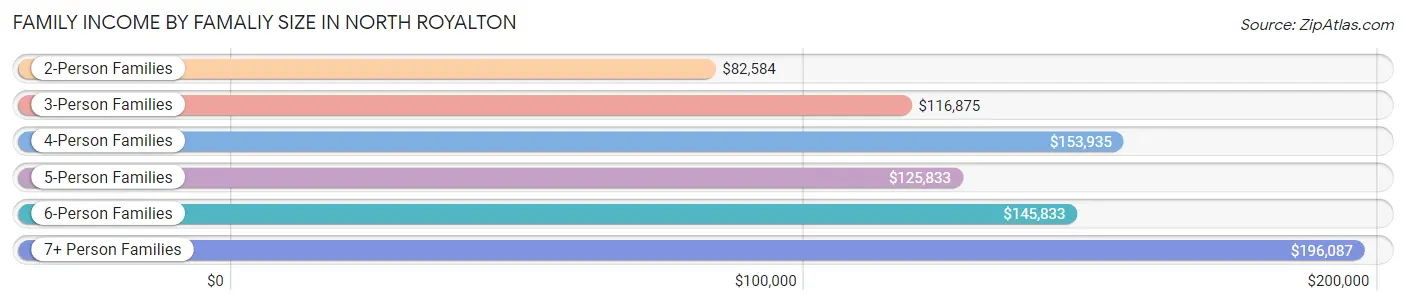
| Income Bracket | # Families | Median Income |
| 2-Person Families | 4,687 (54.0%) | $82,584 |
| 3-Person Families | 1,922 (22.2%) | $116,875 |
| 4-Person Families | 1,377 (15.9%) | $153,935 |
| 5-Person Families | 488 (5.6%) | $125,833 |
| 6-Person Families | 114 (1.3%) | $145,833 |
| 7+ Person Families | 90 (1.0%) | $196,087 |
| Total | 8,678 (100.0%) | $106,546 |
Family Income by Number of Earners in North Royalton
The median family income in North Royalton is $106,546, with families comprising 3+ earners (1,205) having the highest median family income of $159,792, while families with no earners (1,192) have the lowest median family income of $63,813, accounting for 13.9% and 13.7% of families, respectively.
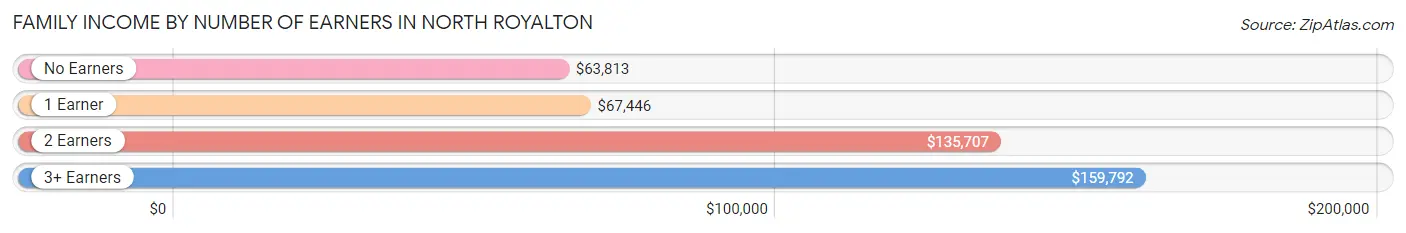
| Number of Earners | # Families | Median Income |
| No Earners | 1,192 (13.7%) | $63,813 |
| 1 Earner | 2,795 (32.2%) | $67,446 |
| 2 Earners | 3,486 (40.2%) | $135,707 |
| 3+ Earners | 1,205 (13.9%) | $159,792 |
| Total | 8,678 (100.0%) | $106,546 |
Household Income in North Royalton
Household Income Brackets in North Royalton
With 2,573 households falling in the category, the $100,000 to $149,999 income range is the most frequent in North Royalton, accounting for 19.0% of all households. In contrast, only 257 households (1.9%) fall into the less than $10,000 income bracket, making it the least populous group.
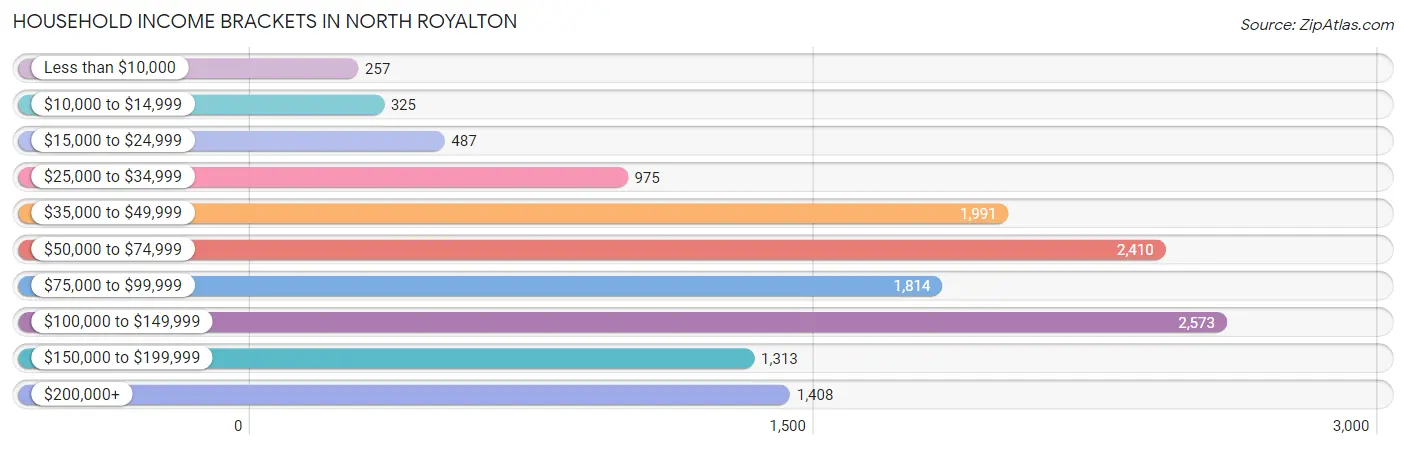
| Income Bracket | # Households | % Households |
| Less than $10,000 | 257 | 1.9% |
| $10,000 to $14,999 | 325 | 2.4% |
| $15,000 to $24,999 | 487 | 3.6% |
| $25,000 to $34,999 | 975 | 7.2% |
| $35,000 to $49,999 | 1,991 | 14.7% |
| $50,000 to $74,999 | 2,410 | 17.8% |
| $75,000 to $99,999 | 1,814 | 13.4% |
| $100,000 to $149,999 | 2,573 | 19.0% |
| $150,000 to $199,999 | 1,313 | 9.7% |
| $200,000+ | 1,408 | 10.4% |
Household Income by Householder Age in North Royalton
The median household income in North Royalton is $81,511, with the highest median household income of $97,166 found in the 45 to 64 years age bracket for the primary householder. A total of 5,369 households (39.7%) fall into this category. Meanwhile, the 65+ years age bracket for the primary householder has the lowest median household income of $59,754, with 3,973 households (29.3%) in this group.
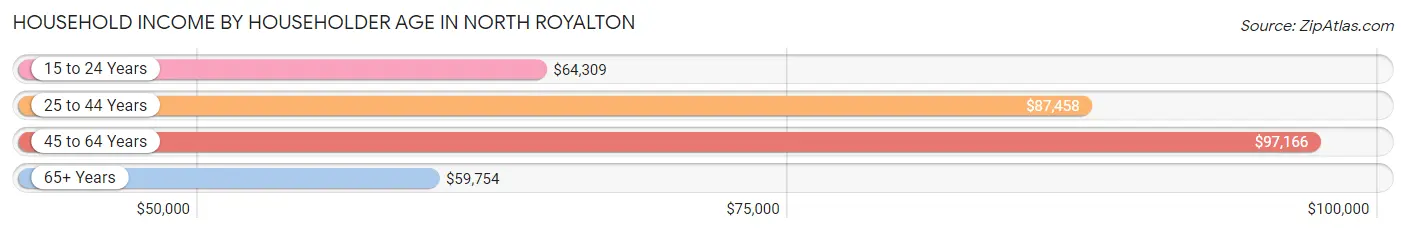
| Income Bracket | # Households | Median Income |
| 15 to 24 Years | 548 (4.1%) | $64,309 |
| 25 to 44 Years | 3,651 (27.0%) | $87,458 |
| 45 to 64 Years | 5,369 (39.7%) | $97,166 |
| 65+ Years | 3,973 (29.3%) | $59,754 |
| Total | 13,541 (100.0%) | $81,511 |
Poverty in North Royalton
Income Below Poverty by Sex and Age in North Royalton
With 4.7% poverty level for males and 6.2% for females among the residents of North Royalton, 15 year old males and 75 year old and over females are the most vulnerable to poverty, with 48 males (17.1%) and 225 females (19.7%) in their respective age groups living below the poverty level.
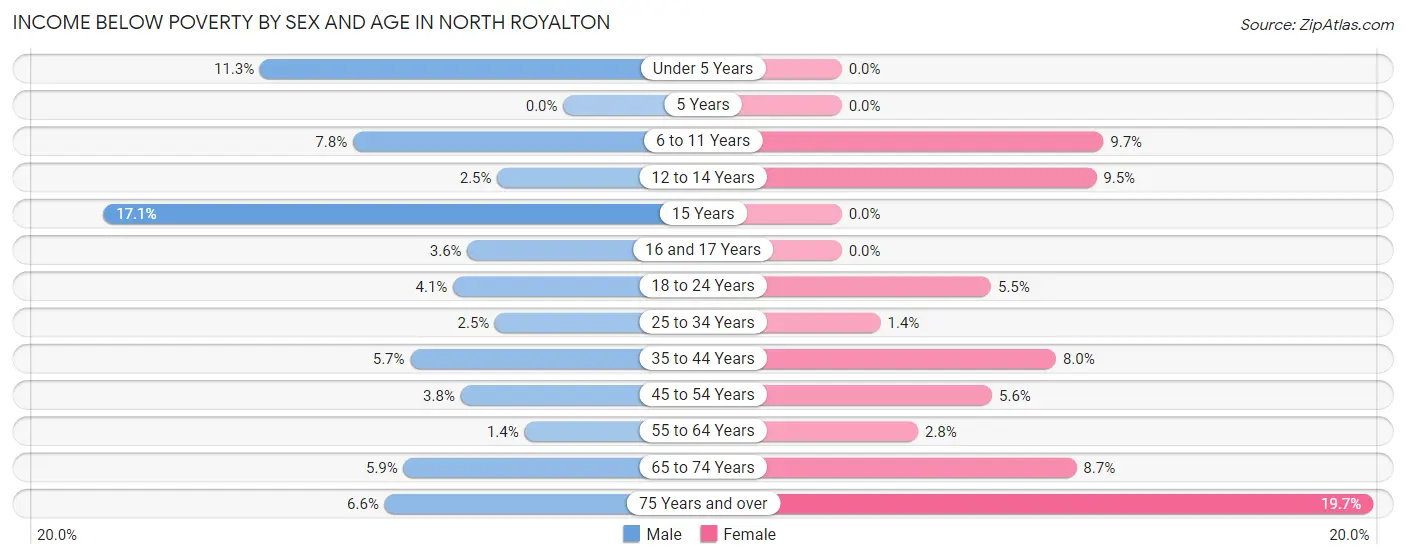
| Age Bracket | Male | Female |
| Under 5 Years | 67 (11.3%) | 0 (0.0%) |
| 5 Years | 0 (0.0%) | 0 (0.0%) |
| 6 to 11 Years | 106 (7.8%) | 76 (9.7%) |
| 12 to 14 Years | 11 (2.5%) | 31 (9.5%) |
| 15 Years | 48 (17.1%) | 0 (0.0%) |
| 16 and 17 Years | 11 (3.6%) | 0 (0.0%) |
| 18 to 24 Years | 51 (4.1%) | 79 (5.5%) |
| 25 to 34 Years | 56 (2.5%) | 28 (1.4%) |
| 35 to 44 Years | 88 (5.7%) | 136 (8.0%) |
| 45 to 54 Years | 74 (3.8%) | 145 (5.6%) |
| 55 to 64 Years | 33 (1.4%) | 68 (2.8%) |
| 65 to 74 Years | 113 (5.9%) | 175 (8.7%) |
| 75 Years and over | 67 (6.6%) | 225 (19.7%) |
| Total | 725 (4.7%) | 963 (6.2%) |
Income Above Poverty by Sex and Age in North Royalton
According to the poverty statistics in North Royalton, males aged 5 years and females aged under 5 years are the age groups that are most secure financially, with 100.0% of males and 100.0% of females in these age groups living above the poverty line.
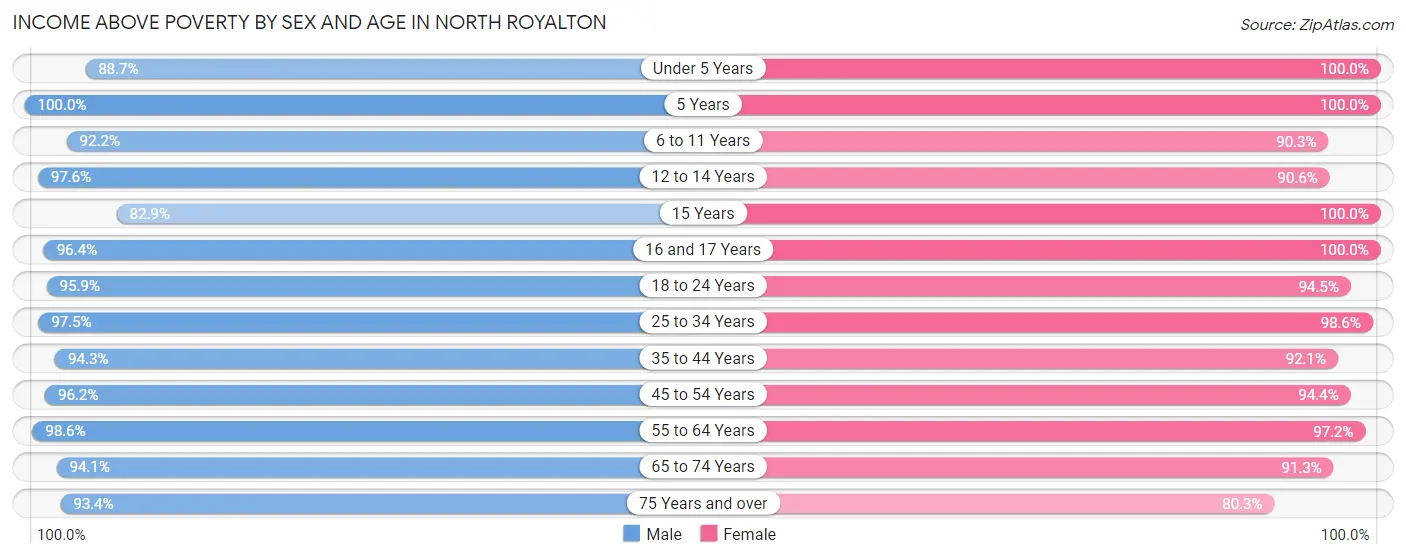
| Age Bracket | Male | Female |
| Under 5 Years | 528 (88.7%) | 542 (100.0%) |
| 5 Years | 159 (100.0%) | 160 (100.0%) |
| 6 to 11 Years | 1,251 (92.2%) | 707 (90.3%) |
| 12 to 14 Years | 438 (97.6%) | 297 (90.5%) |
| 15 Years | 233 (82.9%) | 138 (100.0%) |
| 16 and 17 Years | 298 (96.4%) | 240 (100.0%) |
| 18 to 24 Years | 1,197 (95.9%) | 1,346 (94.5%) |
| 25 to 34 Years | 2,156 (97.5%) | 1,919 (98.6%) |
| 35 to 44 Years | 1,462 (94.3%) | 1,574 (92.0%) |
| 45 to 54 Years | 1,868 (96.2%) | 2,454 (94.4%) |
| 55 to 64 Years | 2,258 (98.6%) | 2,332 (97.2%) |
| 65 to 74 Years | 1,794 (94.1%) | 1,835 (91.3%) |
| 75 Years and over | 943 (93.4%) | 916 (80.3%) |
| Total | 14,585 (95.3%) | 14,460 (93.8%) |
Income Below Poverty Among Married-Couple Families in North Royalton
The poverty statistics for married-couple families in North Royalton show that 3.3% or 225 of the total 6,839 families live below the poverty line. Families with 3 or 4 children have the highest poverty rate of 10.3%, comprising of 29 families. On the other hand, families with 5 or more children have the lowest poverty rate of 0.0%, which includes 0 families.
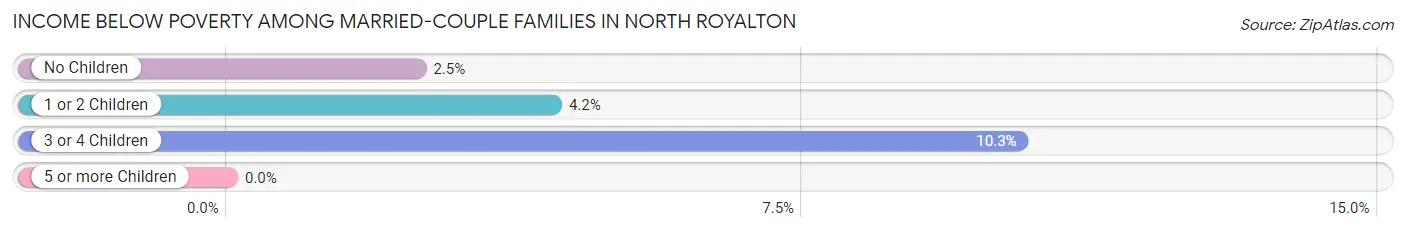
| Children | Above Poverty | Below Poverty |
| No Children | 4,438 (97.5%) | 112 (2.5%) |
| 1 or 2 Children | 1,901 (95.8%) | 84 (4.2%) |
| 3 or 4 Children | 252 (89.7%) | 29 (10.3%) |
| 5 or more Children | 23 (100.0%) | 0 (0.0%) |
| Total | 6,614 (96.7%) | 225 (3.3%) |
Income Below Poverty Among Single-Parent Households in North Royalton
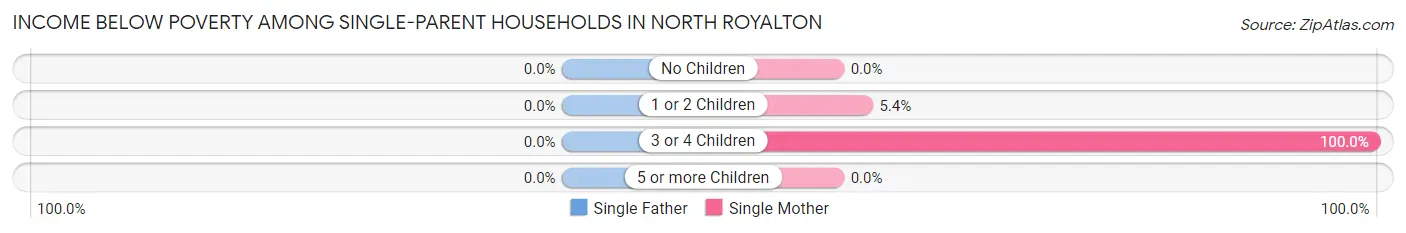
| Children | Single Father | Single Mother |
| No Children | 0 (0.0%) | 0 (0.0%) |
| 1 or 2 Children | 0 (0.0%) | 46 (5.4%) |
| 3 or 4 Children | 0 (0.0%) | 27 (100.0%) |
| 5 or more Children | 0 (0.0%) | 0 (0.0%) |
| Total | 0 (0.0%) | 73 (5.4%) |
Income Below Poverty Among Married-Couple vs Single-Parent Households in North Royalton
The poverty data for North Royalton shows that 225 of the married-couple family households (3.3%) and 73 of the single-parent households (4.0%) are living below the poverty level. Within the married-couple family households, those with 3 or 4 children have the highest poverty rate, with 29 households (10.3%) falling below the poverty line. Among the single-parent households, those with 3 or 4 children have the highest poverty rate, with 27 household (24.5%) living below poverty.
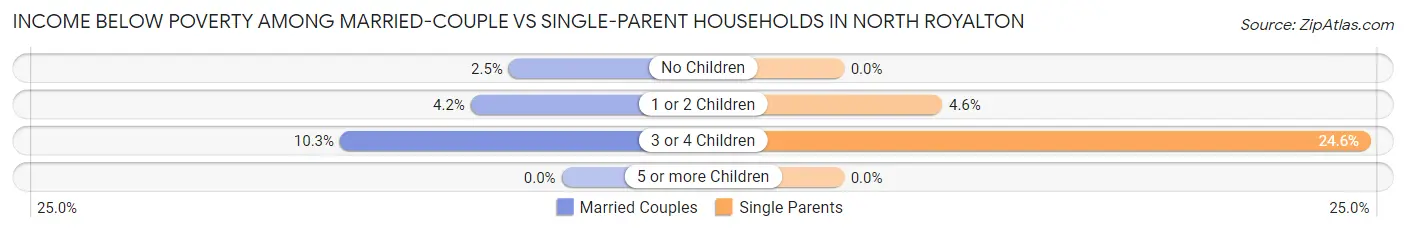
| Children | Married-Couple Families | Single-Parent Households |
| No Children | 112 (2.5%) | 0 (0.0%) |
| 1 or 2 Children | 84 (4.2%) | 46 (4.6%) |
| 3 or 4 Children | 29 (10.3%) | 27 (24.5%) |
| 5 or more Children | 0 (0.0%) | 0 (0.0%) |
| Total | 225 (3.3%) | 73 (4.0%) |
Race in North Royalton
The most populous races in North Royalton are White / Caucasian (27,195 | 87.4%), Hispanic or Latino (1,443 | 4.6%), and Asian (1,385 | 4.4%).
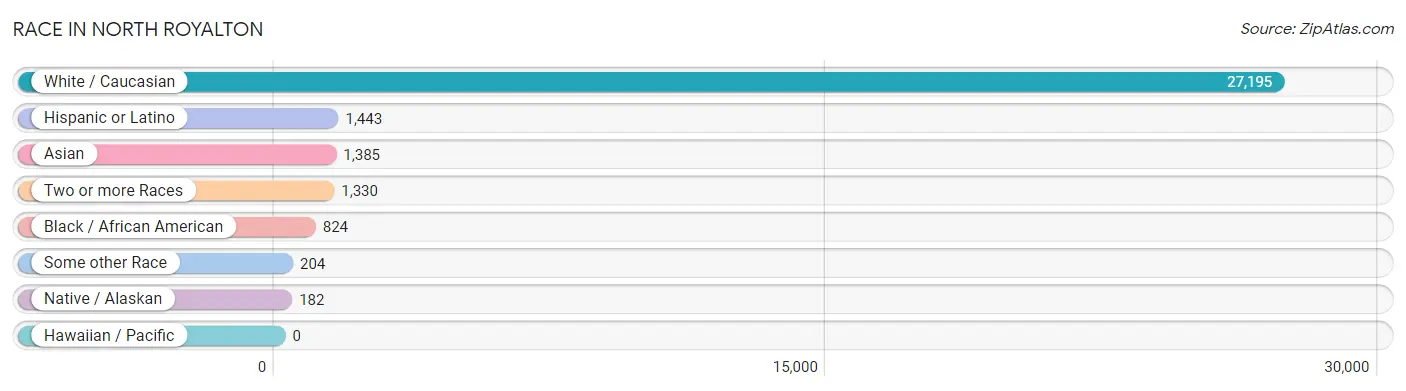
| Race | # Population | % Population |
| Asian | 1,385 | 4.4% |
| Black / African American | 824 | 2.6% |
| Hawaiian / Pacific | 0 | 0.0% |
| Hispanic or Latino | 1,443 | 4.6% |
| Native / Alaskan | 182 | 0.6% |
| White / Caucasian | 27,195 | 87.4% |
| Two or more Races | 1,330 | 4.3% |
| Some other Race | 204 | 0.7% |
| Total | 31,120 | 100.0% |
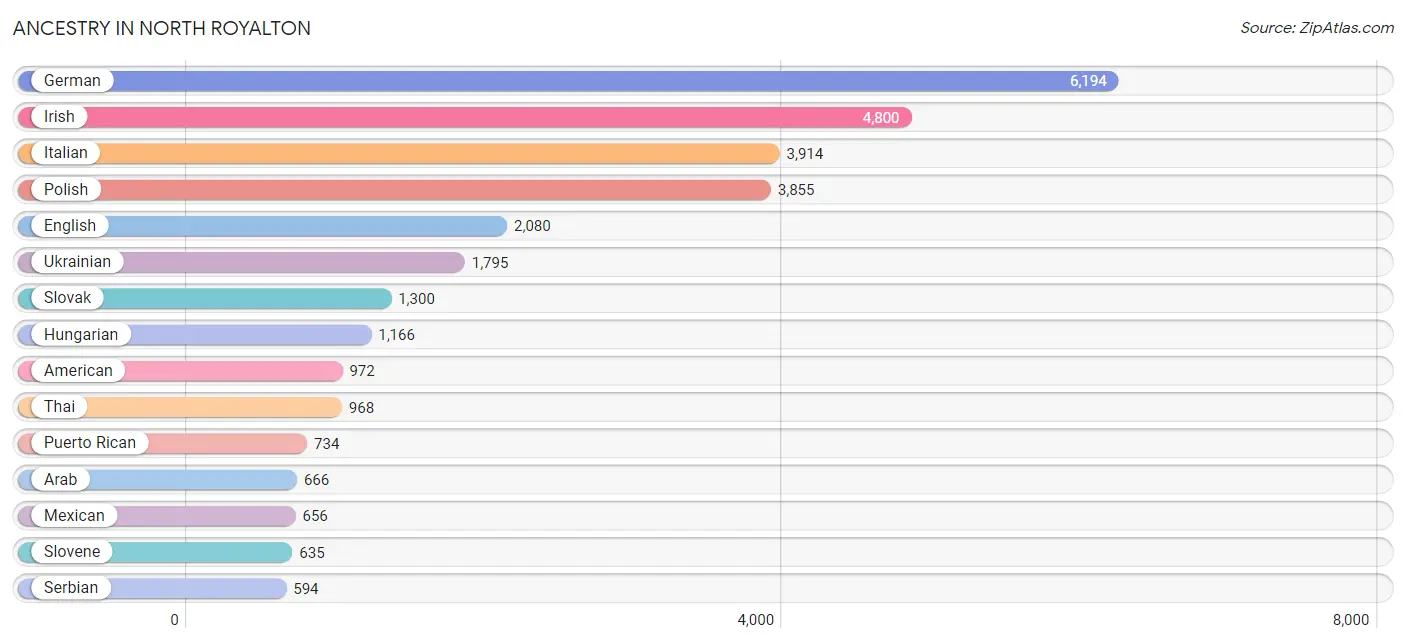
Ancestry in North Royalton
The most populous ancestries reported in North Royalton are German (6,194 | 19.9%), Irish (4,800 | 15.4%), Italian (3,914 | 12.6%), Polish (3,855 | 12.4%), and English (2,080 | 6.7%), together accounting for 67.0% of all North Royalton residents.
| Ancestry | # Population | % Population |
| Albanian | 36 | 0.1% |
| Alsatian | 7 | 0.0% |
| American | 972 | 3.1% |
| Apache | 3 | 0.0% |
| Arab | 666 | 2.1% |
| Austrian | 124 | 0.4% |
| Bangladeshi | 20 | 0.1% |
| Belgian | 49 | 0.2% |
| Bhutanese | 16 | 0.1% |
| British | 20 | 0.1% |
| Burmese | 119 | 0.4% |
| Central American | 5 | 0.0% |
| Central American Indian | 36 | 0.1% |
| Cherokee | 45 | 0.1% |
| Chilean | 10 | 0.0% |
| Colombian | 23 | 0.1% |
| Croatian | 411 | 1.3% |
| Czech | 492 | 1.6% |
| Czechoslovakian | 73 | 0.2% |
| Danish | 22 | 0.1% |
| Dutch | 249 | 0.8% |
| Eastern European | 321 | 1.0% |
| Egyptian | 171 | 0.5% |
| English | 2,080 | 6.7% |
| European | 285 | 0.9% |
| Finnish | 60 | 0.2% |
| French | 590 | 1.9% |
| French Canadian | 50 | 0.2% |
| German | 6,194 | 19.9% |
| Greek | 321 | 1.0% |
| Hungarian | 1,166 | 3.7% |
| Indian (Asian) | 226 | 0.7% |
| Iranian | 14 | 0.0% |
| Irish | 4,800 | 15.4% |
| Italian | 3,914 | 12.6% |
| Jordanian | 15 | 0.1% |
| Korean | 292 | 0.9% |
| Lebanese | 263 | 0.9% |
| Lithuanian | 98 | 0.3% |
| Macedonian | 35 | 0.1% |
| Mexican | 656 | 2.1% |
| Mexican American Indian | 111 | 0.4% |
| Nicaraguan | 5 | 0.0% |
| Northern European | 60 | 0.2% |
| Norwegian | 177 | 0.6% |
| Pakistani | 85 | 0.3% |
| Palestinian | 156 | 0.5% |
| Peruvian | 9 | 0.0% |
| Polish | 3,855 | 12.4% |
| Portuguese | 186 | 0.6% |
| Puerto Rican | 734 | 2.4% |
| Romanian | 214 | 0.7% |
| Russian | 359 | 1.1% |
| Scandinavian | 73 | 0.2% |
| Scotch-Irish | 77 | 0.3% |
| Scottish | 340 | 1.1% |
| Serbian | 594 | 1.9% |
| Slavic | 22 | 0.1% |
| Slovak | 1,300 | 4.2% |
| Slovene | 635 | 2.0% |
| South American | 42 | 0.1% |
| Spaniard | 6 | 0.0% |
| Sri Lankan | 74 | 0.2% |
| Swedish | 86 | 0.3% |
| Swiss | 41 | 0.1% |
| Syrian | 17 | 0.1% |
| Thai | 968 | 3.1% |
| Ukrainian | 1,795 | 5.8% |
| Welsh | 133 | 0.4% |
| West Indian | 36 | 0.1% | View All 70 Rows |
Immigrants in North Royalton
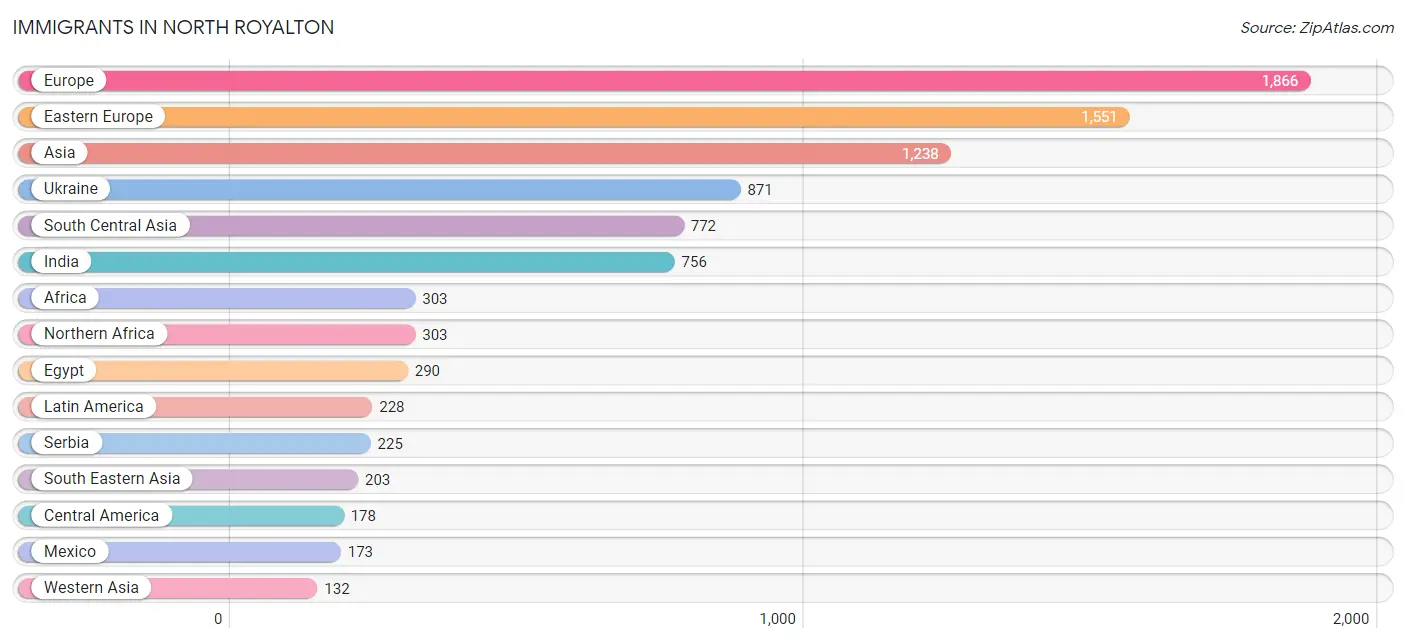
The most numerous immigrant groups reported in North Royalton came from Europe (1,866 | 6.0%), Eastern Europe (1,551 | 5.0%), Asia (1,238 | 4.0%), Ukraine (871 | 2.8%), and South Central Asia (772 | 2.5%), together accounting for 20.2% of all North Royalton residents.
| Immigration Origin | # Population | % Population |
| Africa | 303 | 1.0% |
| Asia | 1,238 | 4.0% |
| Austria | 7 | 0.0% |
| Belarus | 17 | 0.1% |
| Bosnia and Herzegovina | 32 | 0.1% |
| Brazil | 18 | 0.1% |
| Canada | 34 | 0.1% |
| Central America | 178 | 0.6% |
| China | 47 | 0.2% |
| Colombia | 23 | 0.1% |
| Croatia | 50 | 0.2% |
| Eastern Asia | 87 | 0.3% |
| Eastern Europe | 1,551 | 5.0% |
| Egypt | 290 | 0.9% |
| England | 49 | 0.2% |
| Europe | 1,866 | 6.0% |
| France | 6 | 0.0% |
| Germany | 106 | 0.3% |
| Greece | 31 | 0.1% |
| Hong Kong | 12 | 0.0% |
| Hungary | 13 | 0.0% |
| India | 756 | 2.4% |
| Italy | 52 | 0.2% |
| Jordan | 15 | 0.1% |
| Korea | 40 | 0.1% |
| Kuwait | 15 | 0.1% |
| Latin America | 228 | 0.7% |
| Lebanon | 43 | 0.1% |
| Mexico | 173 | 0.6% |
| Morocco | 13 | 0.0% |
| Nicaragua | 5 | 0.0% |
| Northern Africa | 303 | 1.0% |
| Northern Europe | 107 | 0.3% |
| Peru | 9 | 0.0% |
| Philippines | 101 | 0.3% |
| Poland | 75 | 0.2% |
| Romania | 130 | 0.4% |
| Russia | 53 | 0.2% |
| Serbia | 225 | 0.7% |
| South America | 50 | 0.2% |
| South Central Asia | 772 | 2.5% |
| South Eastern Asia | 203 | 0.6% |
| Southern Europe | 89 | 0.3% |
| Spain | 6 | 0.0% |
| Syria | 6 | 0.0% |
| Taiwan | 8 | 0.0% |
| Thailand | 25 | 0.1% |
| Ukraine | 871 | 2.8% |
| Vietnam | 72 | 0.2% |
| Western Asia | 132 | 0.4% |
| Western Europe | 119 | 0.4% | View All 51 Rows |
Sex and Age in North Royalton
Sex and Age in North Royalton
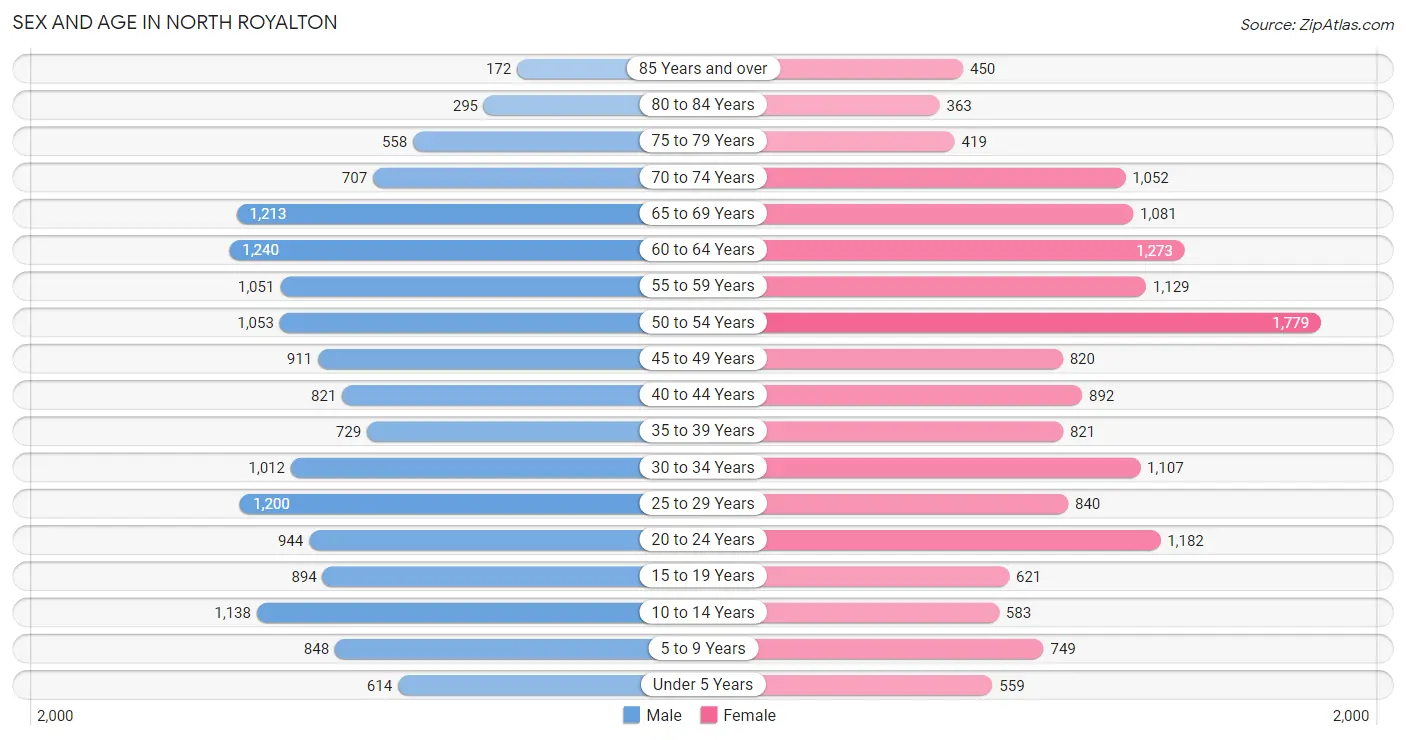
The most populous age groups in North Royalton are 60 to 64 Years (1,240 | 8.1%) for men and 50 to 54 Years (1,779 | 11.3%) for women.
| Age Bracket | Male | Female |
| Under 5 Years | 614 (4.0%) | 559 (3.6%) |
| 5 to 9 Years | 848 (5.5%) | 749 (4.8%) |
| 10 to 14 Years | 1,138 (7.4%) | 583 (3.7%) |
| 15 to 19 Years | 894 (5.8%) | 621 (4.0%) |
| 20 to 24 Years | 944 (6.1%) | 1,182 (7.5%) |
| 25 to 29 Years | 1,200 (7.8%) | 840 (5.3%) |
| 30 to 34 Years | 1,012 (6.6%) | 1,107 (7.0%) |
| 35 to 39 Years | 729 (4.7%) | 821 (5.2%) |
| 40 to 44 Years | 821 (5.3%) | 892 (5.7%) |
| 45 to 49 Years | 911 (5.9%) | 820 (5.2%) |
| 50 to 54 Years | 1,053 (6.8%) | 1,779 (11.3%) |
| 55 to 59 Years | 1,051 (6.8%) | 1,129 (7.2%) |
| 60 to 64 Years | 1,240 (8.1%) | 1,273 (8.1%) |
| 65 to 69 Years | 1,213 (7.9%) | 1,081 (6.9%) |
| 70 to 74 Years | 707 (4.6%) | 1,052 (6.7%) |
| 75 to 79 Years | 558 (3.6%) | 419 (2.7%) |
| 80 to 84 Years | 295 (1.9%) | 363 (2.3%) |
| 85 Years and over | 172 (1.1%) | 450 (2.9%) |
| Total | 15,400 (100.0%) | 15,720 (100.0%) |
Families and Households in North Royalton
Median Family Size in North Royalton
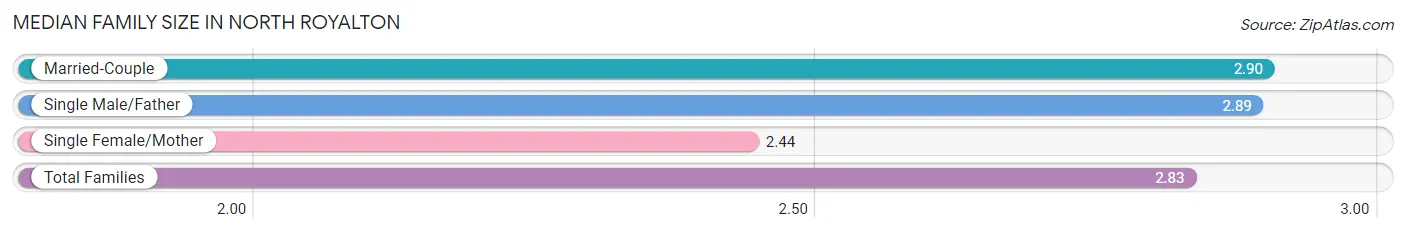
The median family size in North Royalton is 2.83 persons per family, with married-couple families (6,839 | 78.8%) accounting for the largest median family size of 2.9 persons per family. On the other hand, single female/mother families (1,343 | 15.5%) represent the smallest median family size with 2.44 persons per family.
| Family Type | # Families | Family Size |
| Married-Couple | 6,839 (78.8%) | 2.90 |
| Single Male/Father | 496 (5.7%) | 2.89 |
| Single Female/Mother | 1,343 (15.5%) | 2.44 |
| Total Families | 8,678 (100.0%) | 2.83 |
Median Household Size in North Royalton
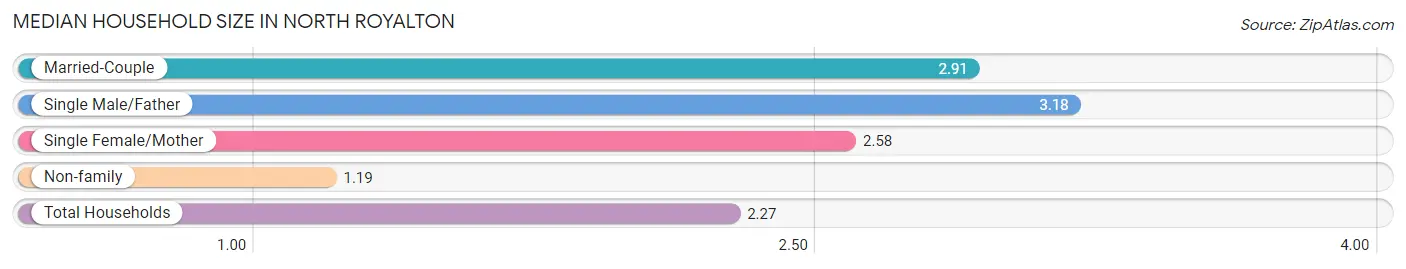
The median household size in North Royalton is 2.27 persons per household, with single male/father households (496 | 3.7%) accounting for the largest median household size of 3.18 persons per household. non-family households (4,863 | 35.9%) represent the smallest median household size with 1.19 persons per household.
| Household Type | # Households | Household Size |
| Married-Couple | 6,839 (50.5%) | 2.91 |
| Single Male/Father | 496 (3.7%) | 3.18 |
| Single Female/Mother | 1,343 (9.9%) | 2.58 |
| Non-family | 4,863 (35.9%) | 1.19 |
| Total Households | 13,541 (100.0%) | 2.27 |
Household Size by Marriage Status in North Royalton
Out of a total of 13,541 households in North Royalton, 8,678 (64.1%) are family households, while 4,863 (35.9%) are nonfamily households. The most numerous type of family households are 2-person households, comprising 4,480, and the most common type of nonfamily households are 1-person households, comprising 4,020.
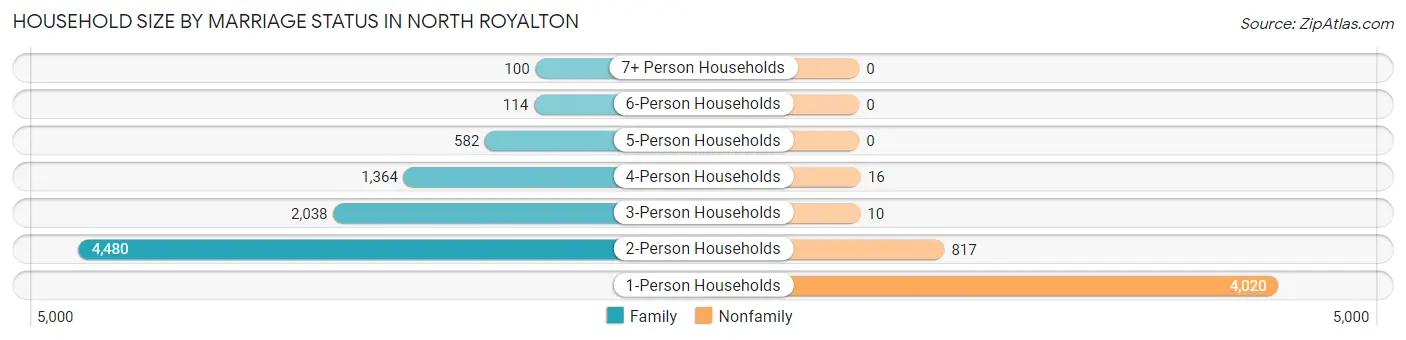
| Household Size | Family Households | Nonfamily Households |
| 1-Person Households | - | 4,020 (29.7%) |
| 2-Person Households | 4,480 (33.1%) | 817 (6.0%) |
| 3-Person Households | 2,038 (15.0%) | 10 (0.1%) |
| 4-Person Households | 1,364 (10.1%) | 16 (0.1%) |
| 5-Person Households | 582 (4.3%) | 0 (0.0%) |
| 6-Person Households | 114 (0.8%) | 0 (0.0%) |
| 7+ Person Households | 100 (0.7%) | 0 (0.0%) |
| Total | 8,678 (64.1%) | 4,863 (35.9%) |
Female Fertility in North Royalton
Fertility by Age in North Royalton
Average fertility rate in North Royalton is 57.0 births per 1,000 women. Women in the age bracket of 20 to 34 years have the highest fertility rate with 89.0 births per 1,000 women. Women in the age bracket of 20 to 34 years acount for 73.7% of all women with births.
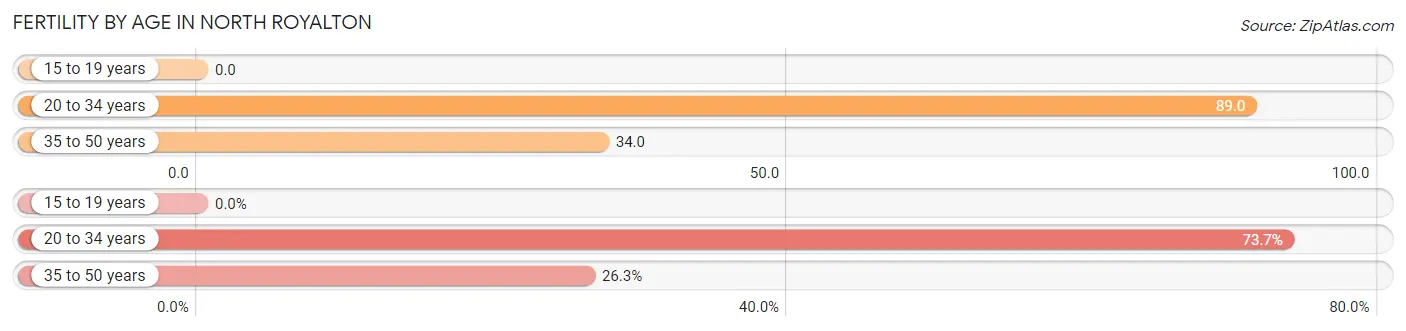
| Age Bracket | Women with Births | Births / 1,000 Women |
| 15 to 19 years | 0 (0.0%) | 0.0 |
| 20 to 34 years | 278 (73.7%) | 89.0 |
| 35 to 50 years | 99 (26.3%) | 34.0 |
| Total | 377 (100.0%) | 57.0 |
Fertility by Age by Marriage Status in North Royalton
76.1% of women with births (377) in North Royalton are married. The highest percentage of unmarried women with births falls into 35 to 50 years age bracket with 62.6% of them unmarried at the time of birth, while the lowest percentage of unmarried women with births belong to 20 to 34 years age bracket with 10.1% of them unmarried.
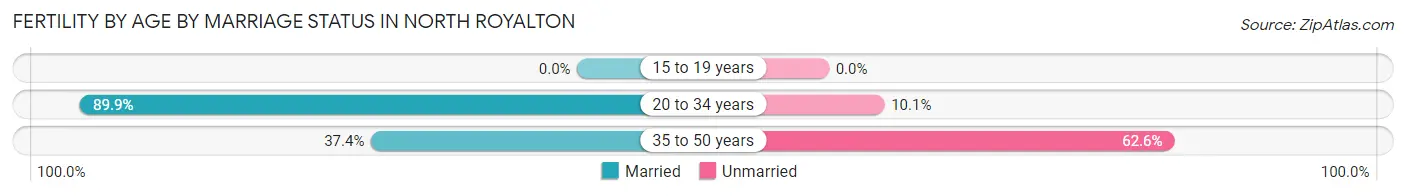
| Age Bracket | Married | Unmarried |
| 15 to 19 years | 0 (0.0%) | 0 (0.0%) |
| 20 to 34 years | 250 (89.9%) | 28 (10.1%) |
| 35 to 50 years | 37 (37.4%) | 62 (62.6%) |
| Total | 287 (76.1%) | 90 (23.9%) |
Fertility by Education in North Royalton
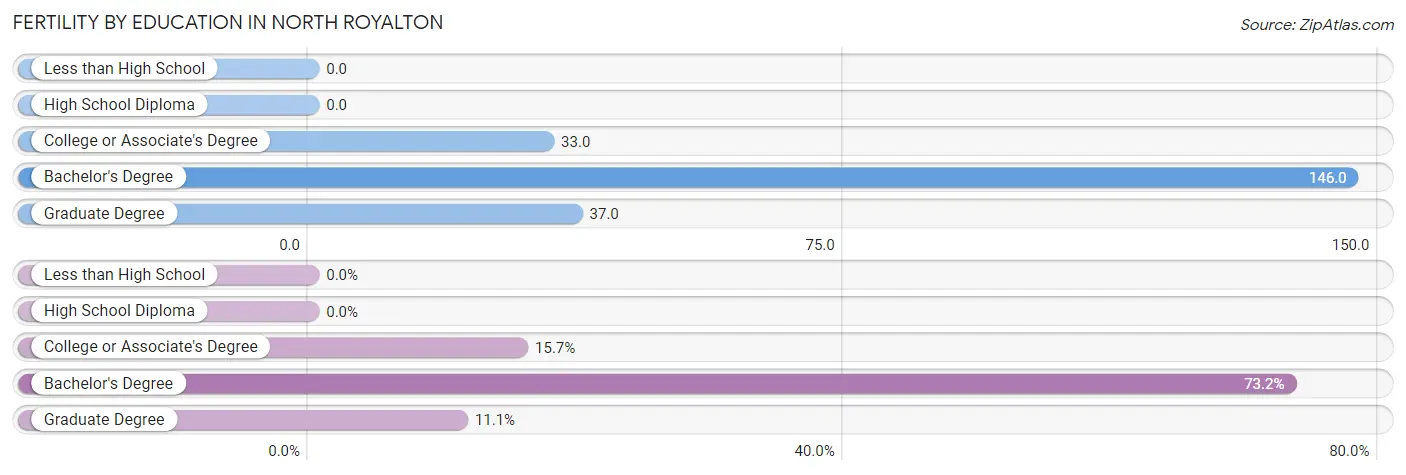
| Educational Attainment | Women with Births | Births / 1,000 Women |
| Less than High School | 0 (0.0%) | 0.0 |
| High School Diploma | 0 (0.0%) | 0.0 |
| College or Associate's Degree | 59 (15.7%) | 33.0 |
| Bachelor's Degree | 276 (73.2%) | 146.0 |
| Graduate Degree | 42 (11.1%) | 37.0 |
| Total | 377 (100.0%) | 57.0 |
Fertility by Education by Marriage Status in North Royalton
23.9% of women with births in North Royalton are unmarried. Women with the educational attainment of college or associate's degree are most likely to be married with 84.8% of them married at childbirth, while women with the educational attainment of graduate degree are least likely to be married with 45.2% of them unmarried at childbirth.
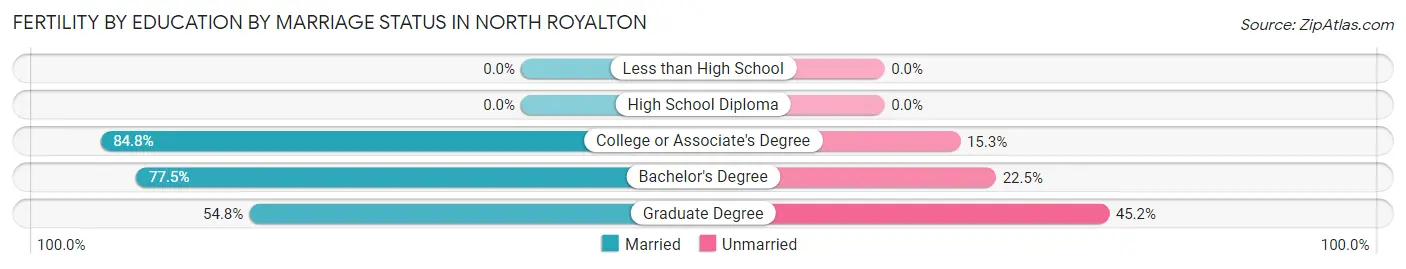
| Educational Attainment | Married | Unmarried |
| Less than High School | 0 (0.0%) | 0 (0.0%) |
| High School Diploma | 0 (0.0%) | 0 (0.0%) |
| College or Associate's Degree | 50 (84.8%) | 9 (15.2%) |
| Bachelor's Degree | 214 (77.5%) | 62 (22.5%) |
| Graduate Degree | 23 (54.8%) | 19 (45.2%) |
| Total | 287 (76.1%) | 90 (23.9%) |
Employment Characteristics in North Royalton
Employment by Class of Employer in North Royalton
Among the 16,532 employed individuals in North Royalton, private company employees (11,468 | 69.4%), not-for-profit organizations (1,510 | 9.1%), and local government employees (1,303 | 7.9%) make up the most common classes of employment.
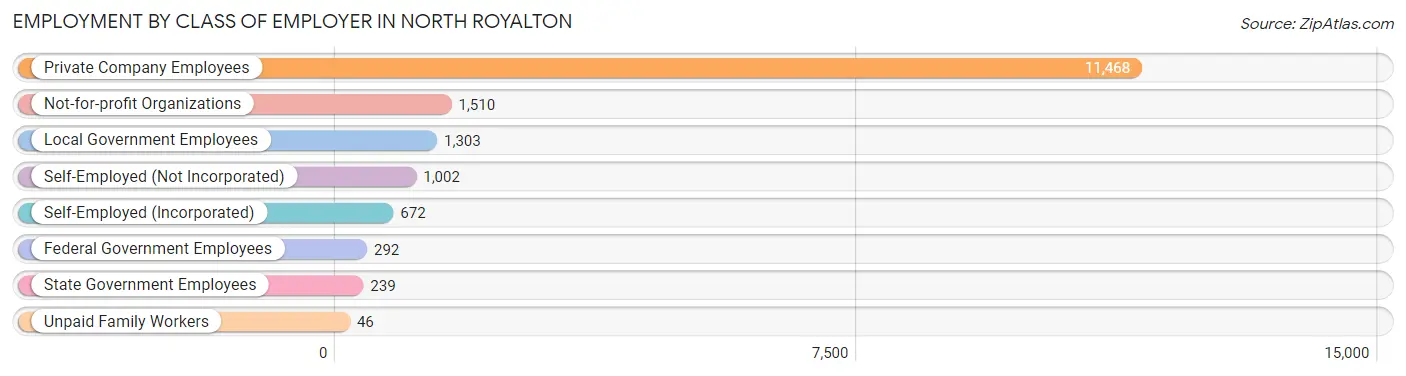
| Employer Class | # Employees | % Employees |
| Private Company Employees | 11,468 | 69.4% |
| Self-Employed (Incorporated) | 672 | 4.1% |
| Self-Employed (Not Incorporated) | 1,002 | 6.1% |
| Not-for-profit Organizations | 1,510 | 9.1% |
| Local Government Employees | 1,303 | 7.9% |
| State Government Employees | 239 | 1.5% |
| Federal Government Employees | 292 | 1.8% |
| Unpaid Family Workers | 46 | 0.3% |
| Total | 16,532 | 100.0% |
Employment Status by Age in North Royalton
According to the labor force statistics for North Royalton, out of the total population over 16 years of age (26,210), 67.4% or 17,666 individuals are in the labor force, with 4.2% or 742 of them unemployed. The age group with the highest labor force participation rate is 30 to 34 years, with 93.3% or 1,977 individuals in the labor force. Within the labor force, the 16 to 19 years age range has the highest percentage of unemployed individuals, with 9.8% or 51 of them being unemployed.
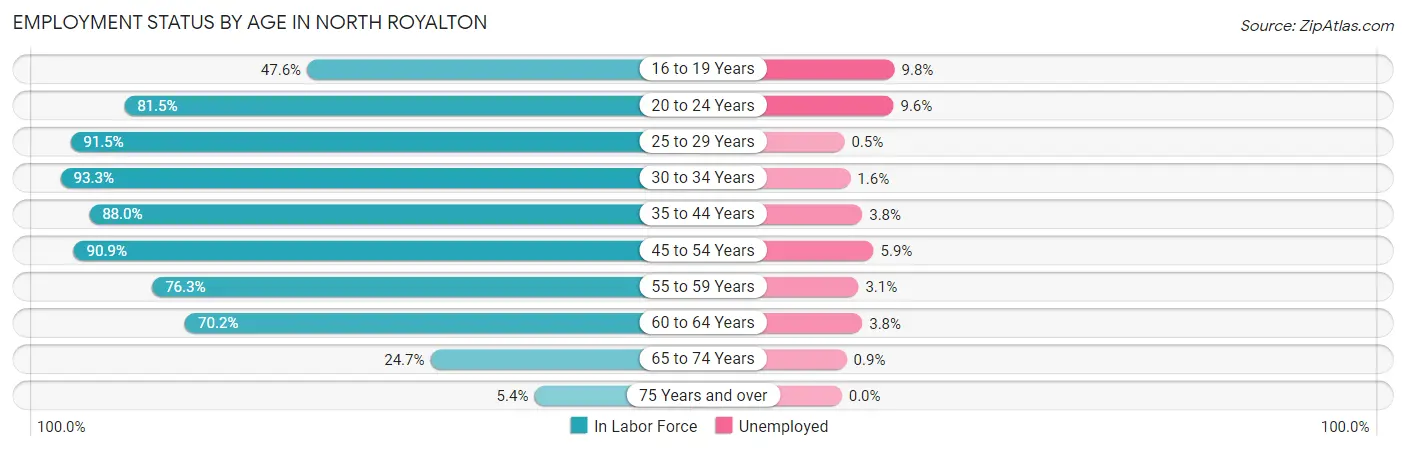
| Age Bracket | In Labor Force | Unemployed |
| 16 to 19 Years | 522 (47.6%) | 51 (9.8%) |
| 20 to 24 Years | 1,733 (81.5%) | 166 (9.6%) |
| 25 to 29 Years | 1,867 (91.5%) | 9 (0.5%) |
| 30 to 34 Years | 1,977 (93.3%) | 32 (1.6%) |
| 35 to 44 Years | 2,871 (88.0%) | 109 (3.8%) |
| 45 to 54 Years | 4,148 (90.9%) | 245 (5.9%) |
| 55 to 59 Years | 1,663 (76.3%) | 52 (3.1%) |
| 60 to 64 Years | 1,764 (70.2%) | 67 (3.8%) |
| 65 to 74 Years | 1,001 (24.7%) | 9 (0.9%) |
| 75 Years and over | 122 (5.4%) | 0 (0.0%) |
| Total | 17,666 (67.4%) | 742 (4.2%) |
Employment Status by Educational Attainment in North Royalton
According to labor force statistics for North Royalton, 85.7% of individuals (14,293) out of the total population between 25 and 64 years of age (16,678) are in the labor force, with 3.6% or 515 of them being unemployed. The group with the highest labor force participation rate are those with the educational attainment of bachelor's degree or higher, with 88.7% or 6,425 individuals in the labor force. Within the labor force, individuals with college / associate degree education have the highest percentage of unemployment, with 6.5% or 261 of them being unemployed.
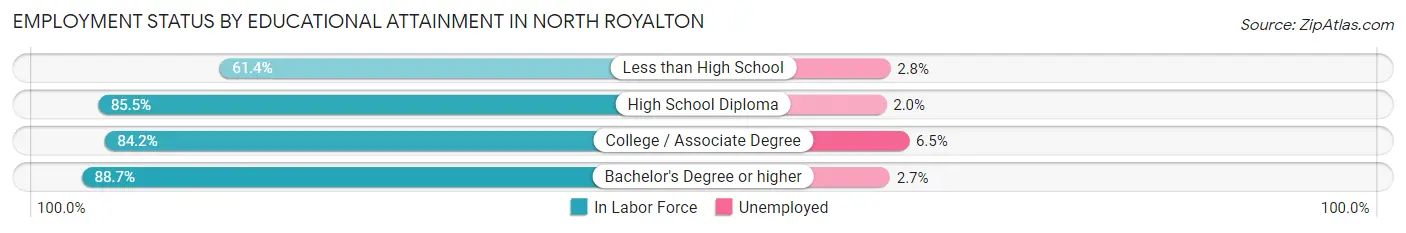
| Educational Attainment | In Labor Force | Unemployed |
| Less than High School | 358 (61.4%) | 16 (2.8%) |
| High School Diploma | 3,489 (85.5%) | 82 (2.0%) |
| College / Associate Degree | 4,017 (84.2%) | 310 (6.5%) |
| Bachelor's Degree or higher | 6,425 (88.7%) | 196 (2.7%) |
| Total | 14,293 (85.7%) | 600 (3.6%) |
Employment Occupations by Sex in North Royalton
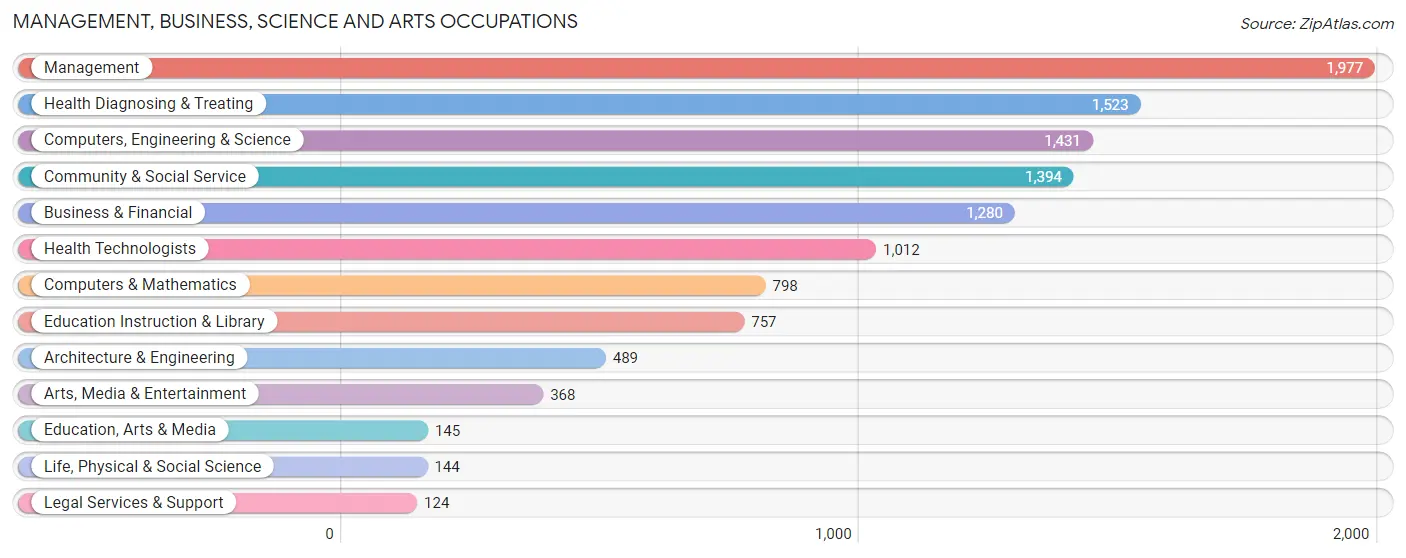
Management, Business, Science and Arts Occupations
The most common Management, Business, Science and Arts occupations in North Royalton are Management (1,977 | 11.7%), Health Diagnosing & Treating (1,523 | 9.0%), Computers, Engineering & Science (1,431 | 8.5%), Community & Social Service (1,394 | 8.2%), and Business & Financial (1,280 | 7.6%).
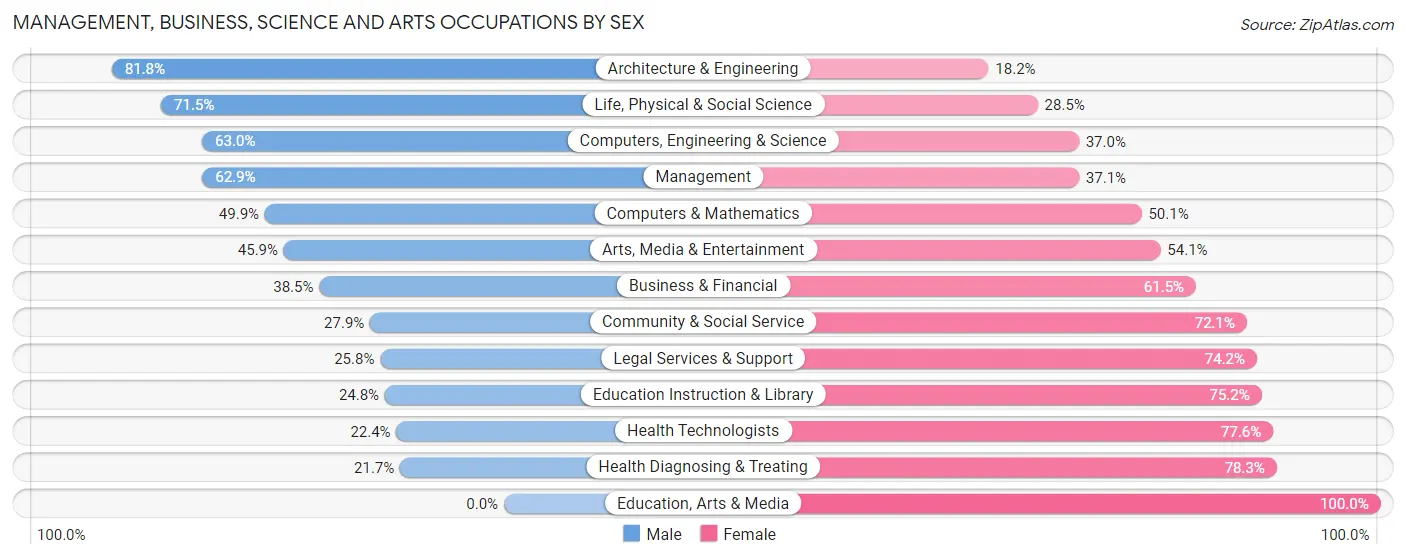
Management, Business, Science and Arts Occupations by Sex
Within the Management, Business, Science and Arts occupations in North Royalton, the most male-oriented occupations are Architecture & Engineering (81.8%), Life, Physical & Social Science (71.5%), and Computers, Engineering & Science (63.0%), while the most female-oriented occupations are Education, Arts & Media (100.0%), Health Diagnosing & Treating (78.3%), and Health Technologists (77.6%).
| Occupation | Male | Female |
| Management | 1,244 (62.9%) | 733 (37.1%) |
| Business & Financial | 493 (38.5%) | 787 (61.5%) |
| Computers, Engineering & Science | 901 (63.0%) | 530 (37.0%) |
| Computers & Mathematics | 398 (49.9%) | 400 (50.1%) |
| Architecture & Engineering | 400 (81.8%) | 89 (18.2%) |
| Life, Physical & Social Science | 103 (71.5%) | 41 (28.5%) |
| Community & Social Service | 389 (27.9%) | 1,005 (72.1%) |
| Education, Arts & Media | 0 (0.0%) | 145 (100.0%) |
| Legal Services & Support | 32 (25.8%) | 92 (74.2%) |
| Education Instruction & Library | 188 (24.8%) | 569 (75.2%) |
| Arts, Media & Entertainment | 169 (45.9%) | 199 (54.1%) |
| Health Diagnosing & Treating | 330 (21.7%) | 1,193 (78.3%) |
| Health Technologists | 227 (22.4%) | 785 (77.6%) |
| Total (Category) | 3,357 (44.1%) | 4,248 (55.9%) |
| Total (Overall) | 8,580 (50.7%) | 8,349 (49.3%) |
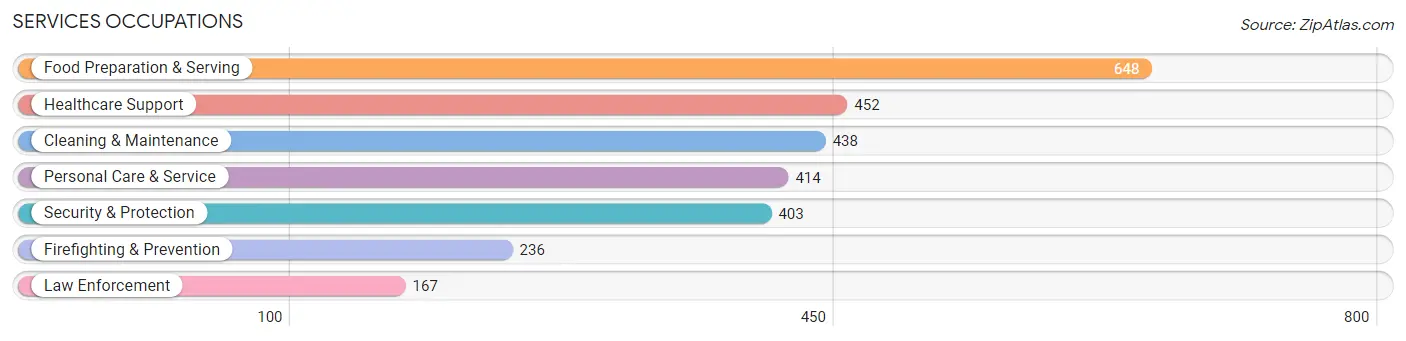
Services Occupations
The most common Services occupations in North Royalton are Food Preparation & Serving (648 | 3.8%), Healthcare Support (452 | 2.7%), Cleaning & Maintenance (438 | 2.6%), Personal Care & Service (414 | 2.5%), and Security & Protection (403 | 2.4%).
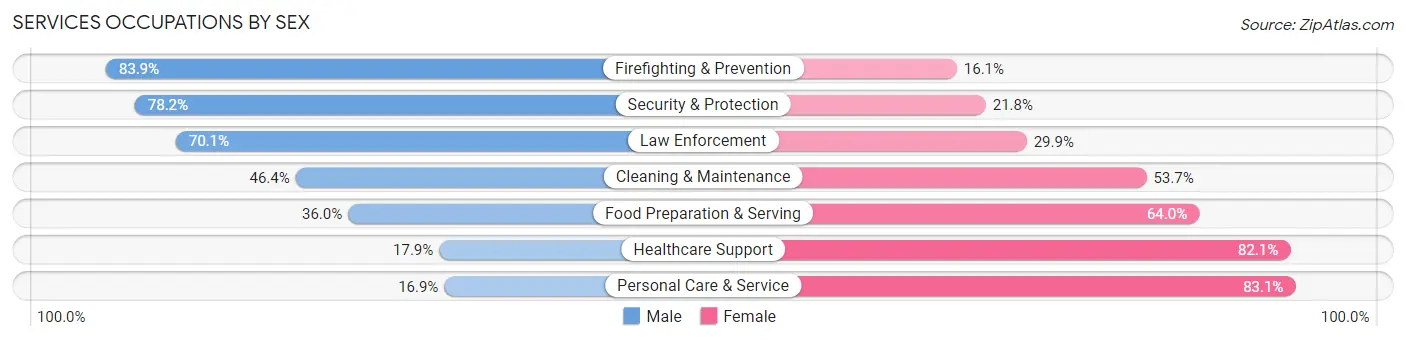
Services Occupations by Sex
Within the Services occupations in North Royalton, the most male-oriented occupations are Firefighting & Prevention (83.9%), Security & Protection (78.2%), and Law Enforcement (70.1%), while the most female-oriented occupations are Personal Care & Service (83.1%), Healthcare Support (82.1%), and Food Preparation & Serving (64.0%).
| Occupation | Male | Female |
| Healthcare Support | 81 (17.9%) | 371 (82.1%) |
| Security & Protection | 315 (78.2%) | 88 (21.8%) |
| Firefighting & Prevention | 198 (83.9%) | 38 (16.1%) |
| Law Enforcement | 117 (70.1%) | 50 (29.9%) |
| Food Preparation & Serving | 233 (36.0%) | 415 (64.0%) |
| Cleaning & Maintenance | 203 (46.4%) | 235 (53.6%) |
| Personal Care & Service | 70 (16.9%) | 344 (83.1%) |
| Total (Category) | 902 (38.3%) | 1,453 (61.7%) |
| Total (Overall) | 8,580 (50.7%) | 8,349 (49.3%) |
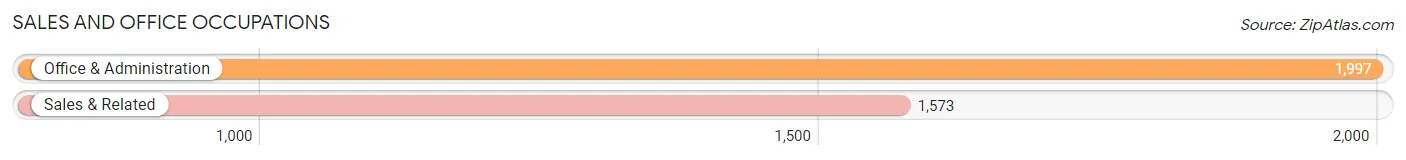
Sales and Office Occupations
The most common Sales and Office occupations in North Royalton are Office & Administration (1,997 | 11.8%), and Sales & Related (1,573 | 9.3%).
Sales and Office Occupations by Sex
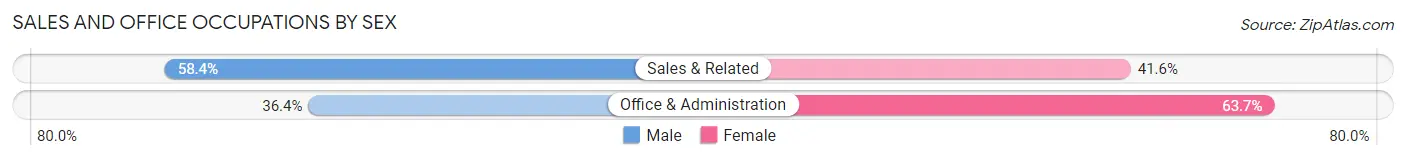
| Occupation | Male | Female |
| Sales & Related | 919 (58.4%) | 654 (41.6%) |
| Office & Administration | 726 (36.3%) | 1,271 (63.6%) |
| Total (Category) | 1,645 (46.1%) | 1,925 (53.9%) |
| Total (Overall) | 8,580 (50.7%) | 8,349 (49.3%) |
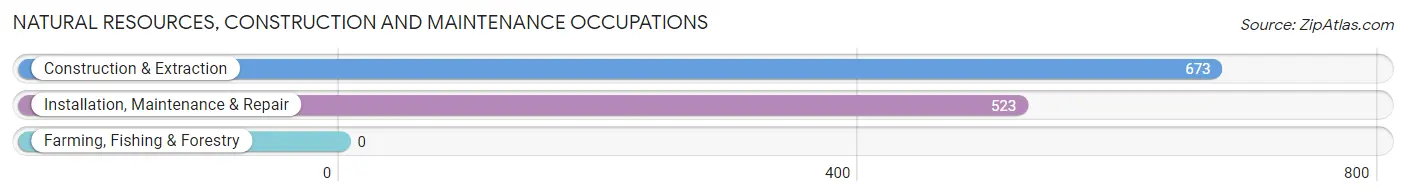
Natural Resources, Construction and Maintenance Occupations
The most common Natural Resources, Construction and Maintenance occupations in North Royalton are Construction & Extraction (673 | 4.0%), and Installation, Maintenance & Repair (523 | 3.1%).
Natural Resources, Construction and Maintenance Occupations by Sex
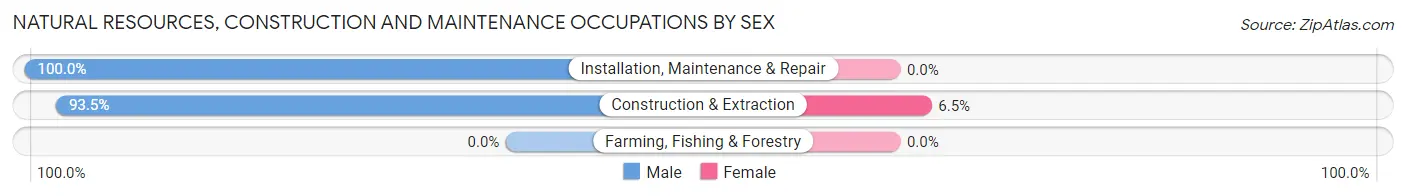
| Occupation | Male | Female |
| Farming, Fishing & Forestry | 0 (0.0%) | 0 (0.0%) |
| Construction & Extraction | 629 (93.5%) | 44 (6.5%) |
| Installation, Maintenance & Repair | 523 (100.0%) | 0 (0.0%) |
| Total (Category) | 1,152 (96.3%) | 44 (3.7%) |
| Total (Overall) | 8,580 (50.7%) | 8,349 (49.3%) |
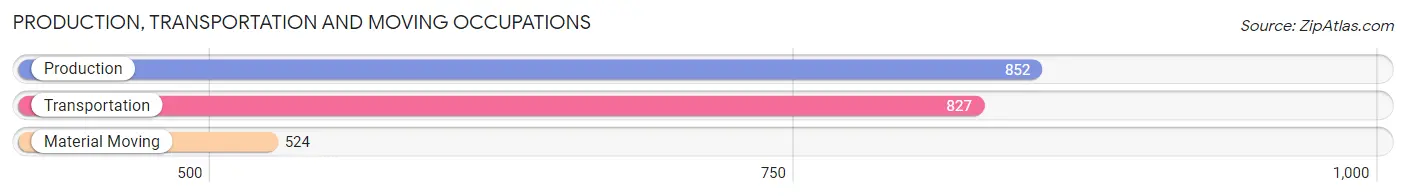
Production, Transportation and Moving Occupations
The most common Production, Transportation and Moving occupations in North Royalton are Production (852 | 5.0%), Transportation (827 | 4.9%), and Material Moving (524 | 3.1%).
Production, Transportation and Moving Occupations by Sex
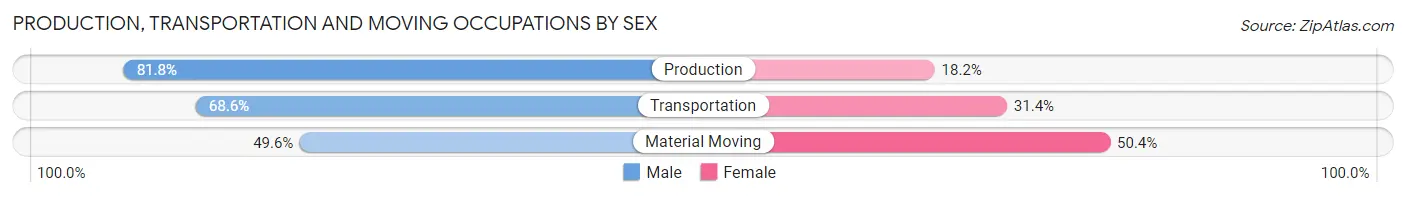
| Occupation | Male | Female |
| Production | 697 (81.8%) | 155 (18.2%) |
| Transportation | 567 (68.6%) | 260 (31.4%) |
| Material Moving | 260 (49.6%) | 264 (50.4%) |
| Total (Category) | 1,524 (69.2%) | 679 (30.8%) |
| Total (Overall) | 8,580 (50.7%) | 8,349 (49.3%) |
Employment Industries by Sex in North Royalton
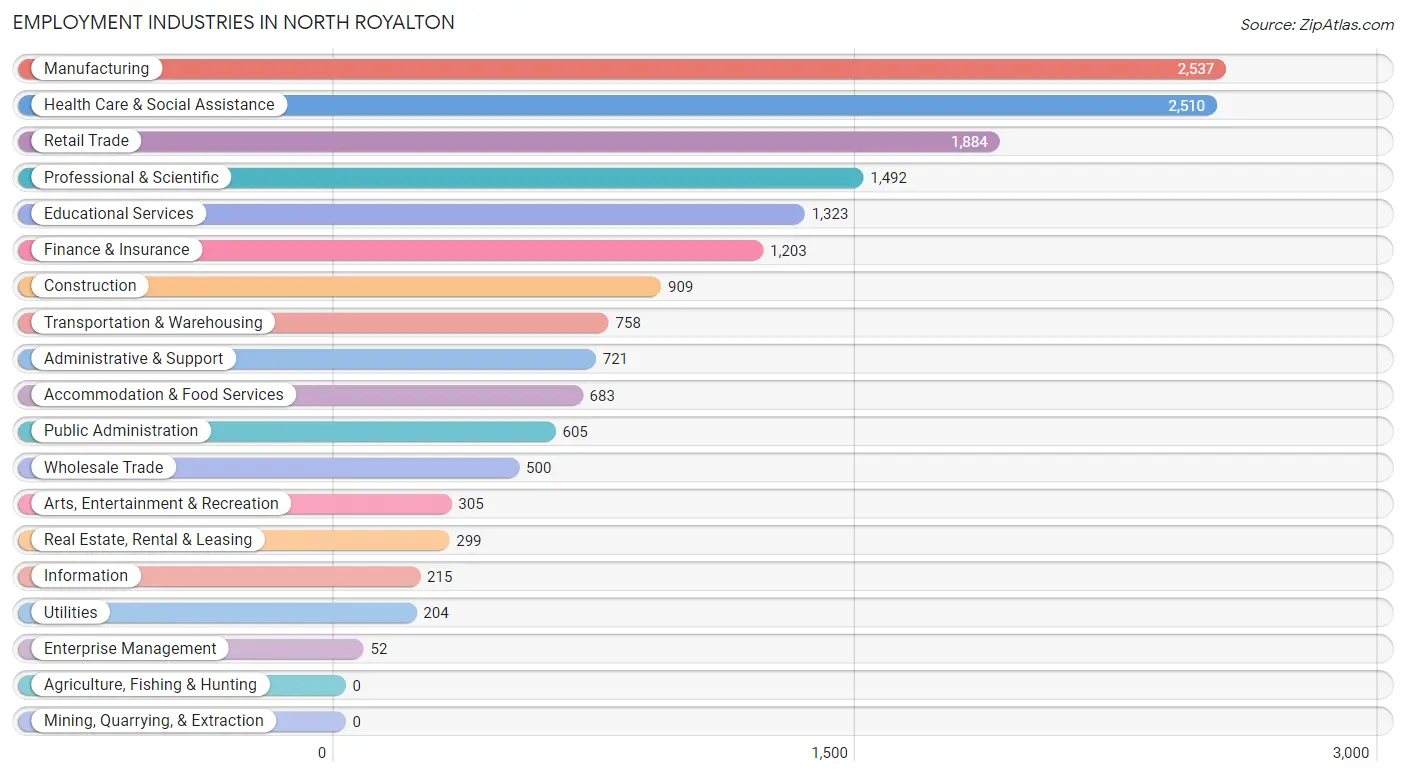
Employment Industries in North Royalton
The major employment industries in North Royalton include Manufacturing (2,537 | 15.0%), Health Care & Social Assistance (2,510 | 14.8%), Retail Trade (1,884 | 11.1%), Professional & Scientific (1,492 | 8.8%), and Educational Services (1,323 | 7.8%).
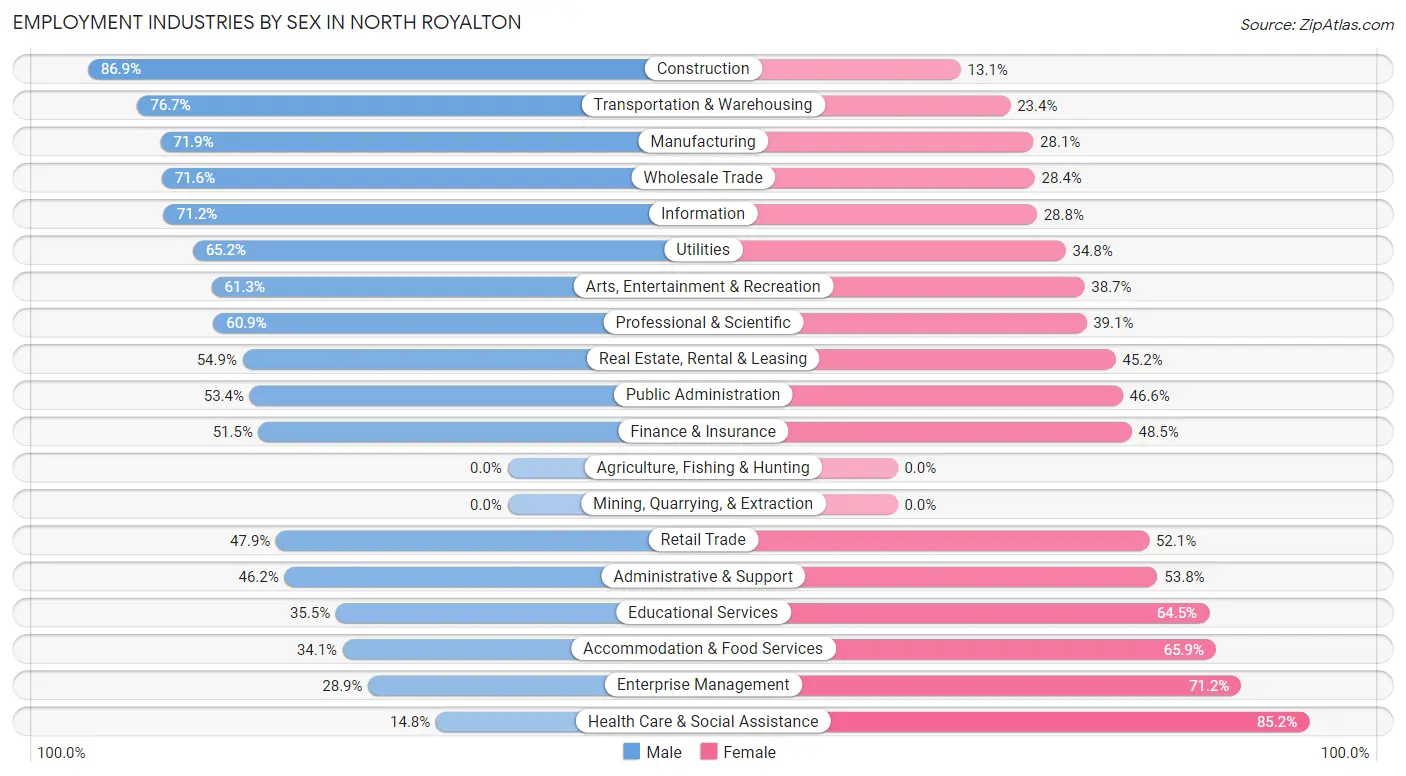
Employment Industries by Sex in North Royalton
The North Royalton industries that see more men than women are Construction (86.9%), Transportation & Warehousing (76.6%), and Manufacturing (71.9%), whereas the industries that tend to have a higher number of women are Health Care & Social Assistance (85.2%), Enterprise Management (71.2%), and Accommodation & Food Services (65.9%).
| Industry | Male | Female |
| Agriculture, Fishing & Hunting | 0 (0.0%) | 0 (0.0%) |
| Mining, Quarrying, & Extraction | 0 (0.0%) | 0 (0.0%) |
| Construction | 790 (86.9%) | 119 (13.1%) |
| Manufacturing | 1,824 (71.9%) | 713 (28.1%) |
| Wholesale Trade | 358 (71.6%) | 142 (28.4%) |
| Retail Trade | 903 (47.9%) | 981 (52.1%) |
| Transportation & Warehousing | 581 (76.6%) | 177 (23.4%) |
| Utilities | 133 (65.2%) | 71 (34.8%) |
| Information | 153 (71.2%) | 62 (28.8%) |
| Finance & Insurance | 620 (51.5%) | 583 (48.5%) |
| Real Estate, Rental & Leasing | 164 (54.8%) | 135 (45.2%) |
| Professional & Scientific | 909 (60.9%) | 583 (39.1%) |
| Enterprise Management | 15 (28.8%) | 37 (71.2%) |
| Administrative & Support | 333 (46.2%) | 388 (53.8%) |
| Educational Services | 470 (35.5%) | 853 (64.5%) |
| Health Care & Social Assistance | 372 (14.8%) | 2,138 (85.2%) |
| Arts, Entertainment & Recreation | 187 (61.3%) | 118 (38.7%) |
| Accommodation & Food Services | 233 (34.1%) | 450 (65.9%) |
| Public Administration | 323 (53.4%) | 282 (46.6%) |
| Total | 8,580 (50.7%) | 8,349 (49.3%) |
Education in North Royalton
School Enrollment in North Royalton
The most common levels of schooling among the 6,339 students in North Royalton are college / undergraduate (1,486 | 23.4%), elementary school (1,385 | 21.8%), and middle school (1,330 | 21.0%).
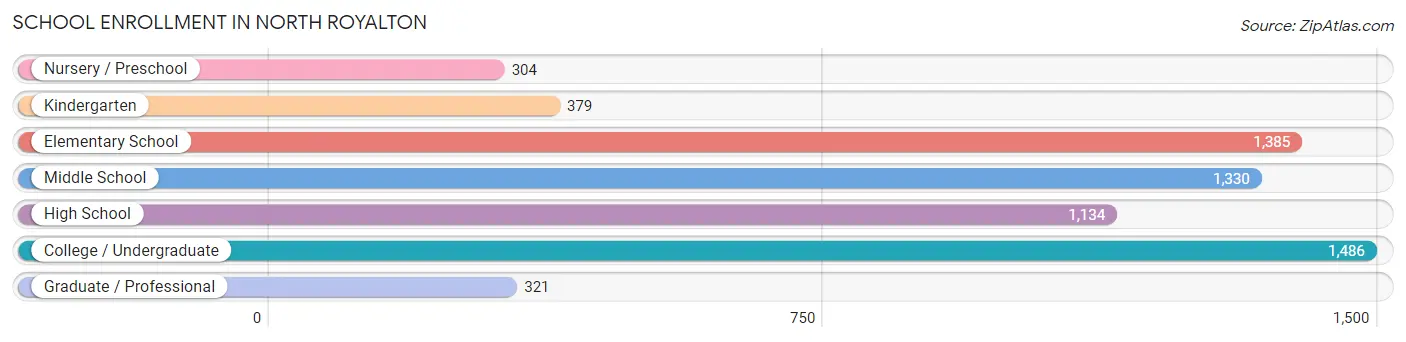
| School Level | # Students | % Students |
| Nursery / Preschool | 304 | 4.8% |
| Kindergarten | 379 | 6.0% |
| Elementary School | 1,385 | 21.8% |
| Middle School | 1,330 | 21.0% |
| High School | 1,134 | 17.9% |
| College / Undergraduate | 1,486 | 23.4% |
| Graduate / Professional | 321 | 5.1% |
| Total | 6,339 | 100.0% |
School Enrollment by Age by Funding Source in North Royalton
Out of a total of 6,339 students who are enrolled in schools in North Royalton, 1,312 (20.7%) attend a private institution, while the remaining 5,027 (79.3%) are enrolled in public schools. The age group of 3 to 4 year olds has the highest likelihood of being enrolled in private schools, with 112 (56.9% in the age bracket) enrolled. Conversely, the age group of 18 to 19 year olds has the lowest likelihood of being enrolled in a private school, with 438 (91.6% in the age bracket) attending a public institution.
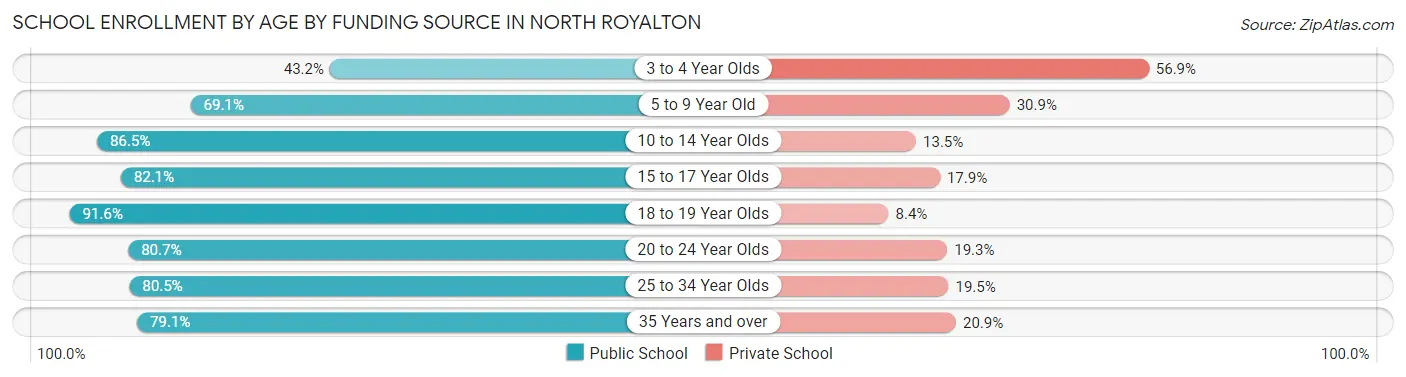
| Age Bracket | Public School | Private School |
| 3 to 4 Year Olds | 85 (43.1%) | 112 (56.9%) |
| 5 to 9 Year Old | 1,052 (69.1%) | 471 (30.9%) |
| 10 to 14 Year Olds | 1,481 (86.5%) | 231 (13.5%) |
| 15 to 17 Year Olds | 773 (82.1%) | 169 (17.9%) |
| 18 to 19 Year Olds | 438 (91.6%) | 40 (8.4%) |
| 20 to 24 Year Olds | 635 (80.7%) | 152 (19.3%) |
| 25 to 34 Year Olds | 375 (80.5%) | 91 (19.5%) |
| 35 Years and over | 185 (79.1%) | 49 (20.9%) |
| Total | 5,027 (79.3%) | 1,312 (20.7%) |
Educational Attainment by Field of Study in North Royalton
Business (2,523 | 26.2%), education (1,322 | 13.8%), science & technology (1,166 | 12.1%), engineering (1,032 | 10.7%), and psychology (548 | 5.7%) are the most common fields of study among 9,618 individuals in North Royalton who have obtained a bachelor's degree or higher.
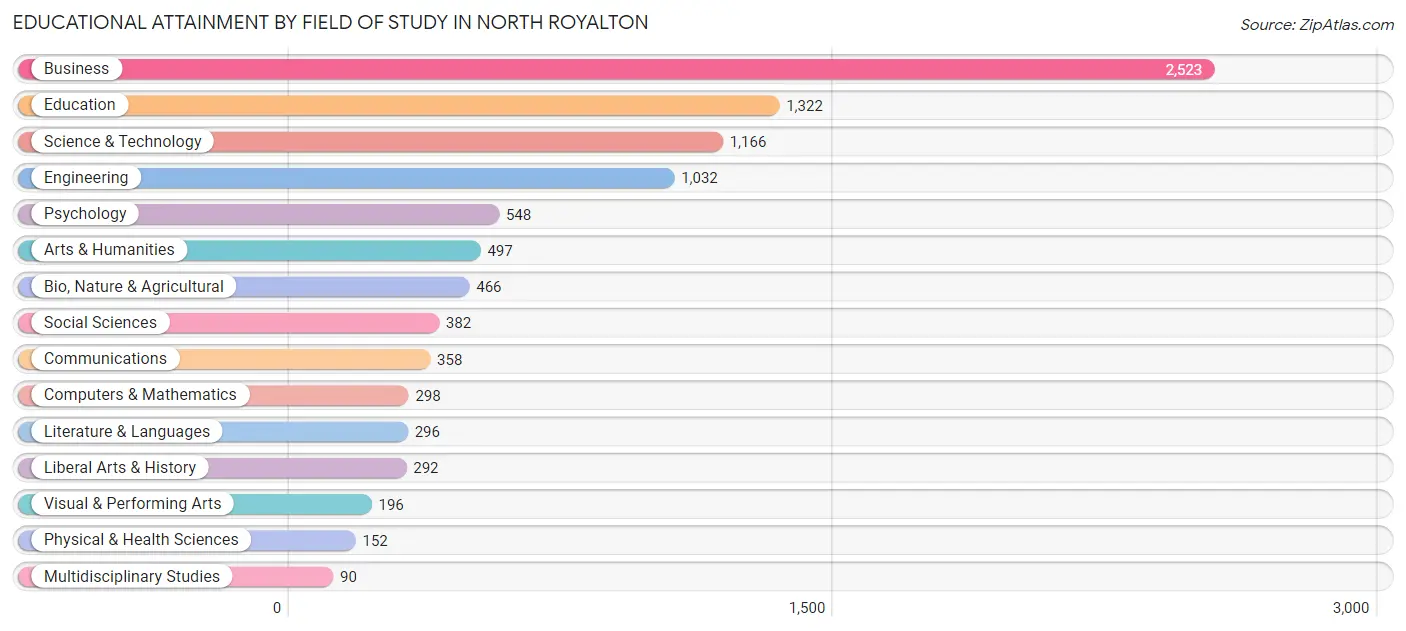
| Field of Study | # Graduates | % Graduates |
| Computers & Mathematics | 298 | 3.1% |
| Bio, Nature & Agricultural | 466 | 4.9% |
| Physical & Health Sciences | 152 | 1.6% |
| Psychology | 548 | 5.7% |
| Social Sciences | 382 | 4.0% |
| Engineering | 1,032 | 10.7% |
| Multidisciplinary Studies | 90 | 0.9% |
| Science & Technology | 1,166 | 12.1% |
| Business | 2,523 | 26.2% |
| Education | 1,322 | 13.8% |
| Literature & Languages | 296 | 3.1% |
| Liberal Arts & History | 292 | 3.0% |
| Visual & Performing Arts | 196 | 2.0% |
| Communications | 358 | 3.7% |
| Arts & Humanities | 497 | 5.2% |
| Total | 9,618 | 100.0% |
Transportation & Commute in North Royalton
Vehicle Availability by Sex in North Royalton
The most prevalent vehicle ownership categories in North Royalton are males with 2 vehicles (3,715, accounting for 44.4%) and females with 2 vehicles (3,013, making up 45.6%).
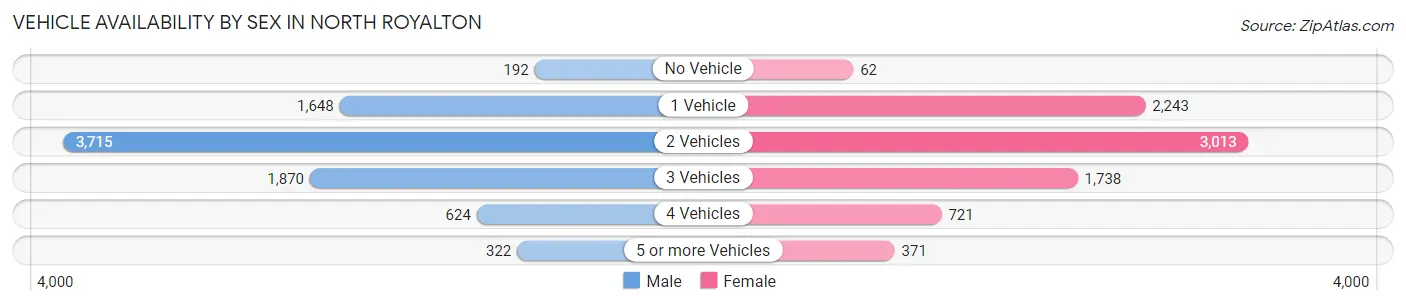
| Vehicles Available | Male | Female |
| No Vehicle | 192 (2.3%) | 62 (0.8%) |
| 1 Vehicle | 1,648 (19.7%) | 2,243 (27.5%) |
| 2 Vehicles | 3,715 (44.4%) | 3,013 (37.0%) |
| 3 Vehicles | 1,870 (22.3%) | 1,738 (21.3%) |
| 4 Vehicles | 624 (7.4%) | 721 (8.8%) |
| 5 or more Vehicles | 322 (3.8%) | 371 (4.5%) |
| Total | 8,371 (100.0%) | 8,148 (100.0%) |
Commute Time in North Royalton
The most frequently occuring commute durations in North Royalton are 30 to 34 minutes (2,693 commuters, 18.0%), 20 to 24 minutes (2,282 commuters, 15.3%), and 15 to 19 minutes (1,958 commuters, 13.1%).
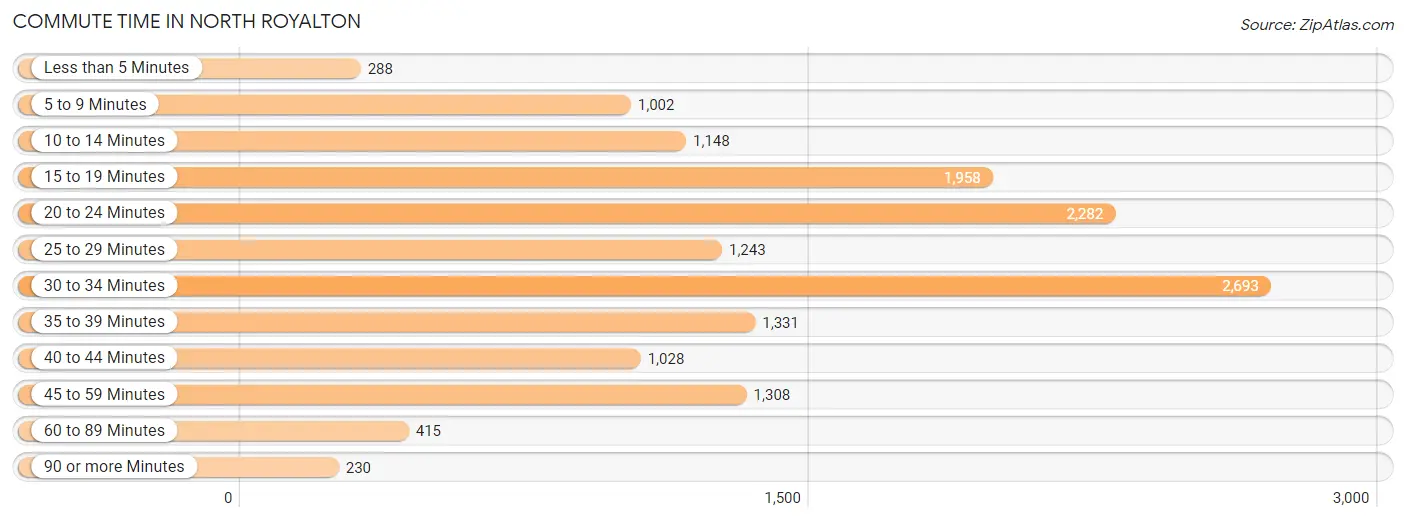
| Commute Time | # Commuters | % Commuters |
| Less than 5 Minutes | 288 | 1.9% |
| 5 to 9 Minutes | 1,002 | 6.7% |
| 10 to 14 Minutes | 1,148 | 7.7% |
| 15 to 19 Minutes | 1,958 | 13.1% |
| 20 to 24 Minutes | 2,282 | 15.3% |
| 25 to 29 Minutes | 1,243 | 8.3% |
| 30 to 34 Minutes | 2,693 | 18.0% |
| 35 to 39 Minutes | 1,331 | 8.9% |
| 40 to 44 Minutes | 1,028 | 6.9% |
| 45 to 59 Minutes | 1,308 | 8.8% |
| 60 to 89 Minutes | 415 | 2.8% |
| 90 or more Minutes | 230 | 1.5% |
Commute Time by Sex in North Royalton
The most common commute times in North Royalton are 30 to 34 minutes (1,531 commuters, 20.4%) for males and 30 to 34 minutes (1,162 commuters, 15.7%) for females.
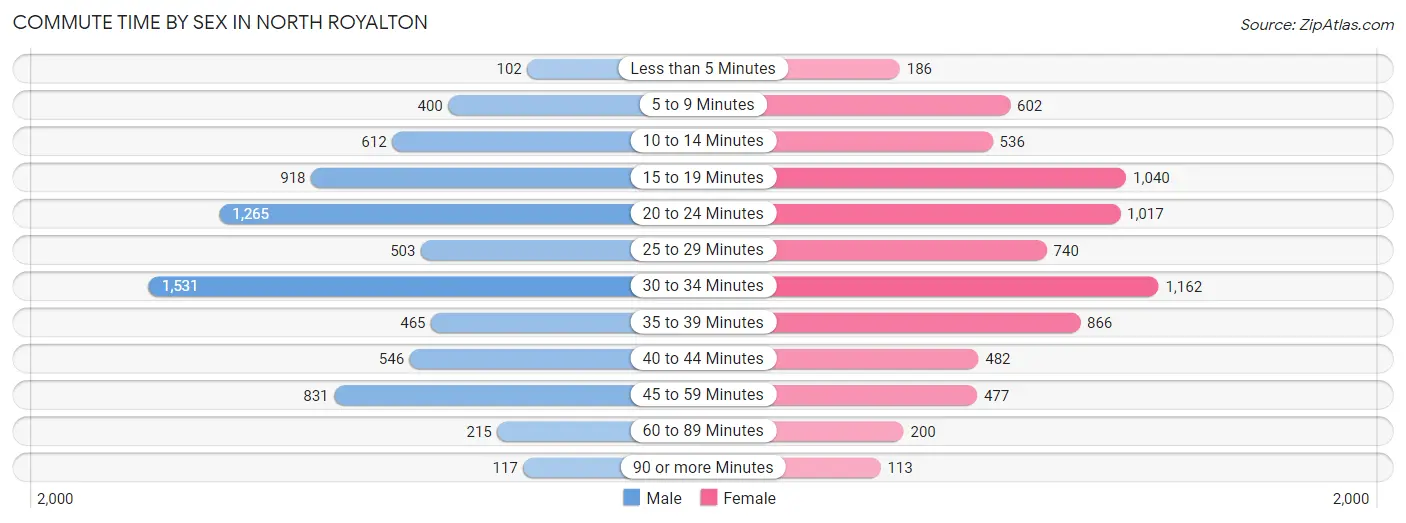
| Commute Time | Male | Female |
| Less than 5 Minutes | 102 (1.4%) | 186 (2.5%) |
| 5 to 9 Minutes | 400 (5.3%) | 602 (8.1%) |
| 10 to 14 Minutes | 612 (8.2%) | 536 (7.2%) |
| 15 to 19 Minutes | 918 (12.2%) | 1,040 (14.0%) |
| 20 to 24 Minutes | 1,265 (16.9%) | 1,017 (13.7%) |
| 25 to 29 Minutes | 503 (6.7%) | 740 (10.0%) |
| 30 to 34 Minutes | 1,531 (20.4%) | 1,162 (15.7%) |
| 35 to 39 Minutes | 465 (6.2%) | 866 (11.7%) |
| 40 to 44 Minutes | 546 (7.3%) | 482 (6.5%) |
| 45 to 59 Minutes | 831 (11.1%) | 477 (6.4%) |
| 60 to 89 Minutes | 215 (2.9%) | 200 (2.7%) |
| 90 or more Minutes | 117 (1.6%) | 113 (1.5%) |
Time of Departure to Work by Sex in North Royalton
The most frequent times of departure to work in North Royalton are 7:00 AM to 7:29 AM (1,053, 14.0%) for males and 7:00 AM to 7:29 AM (1,227, 16.5%) for females.
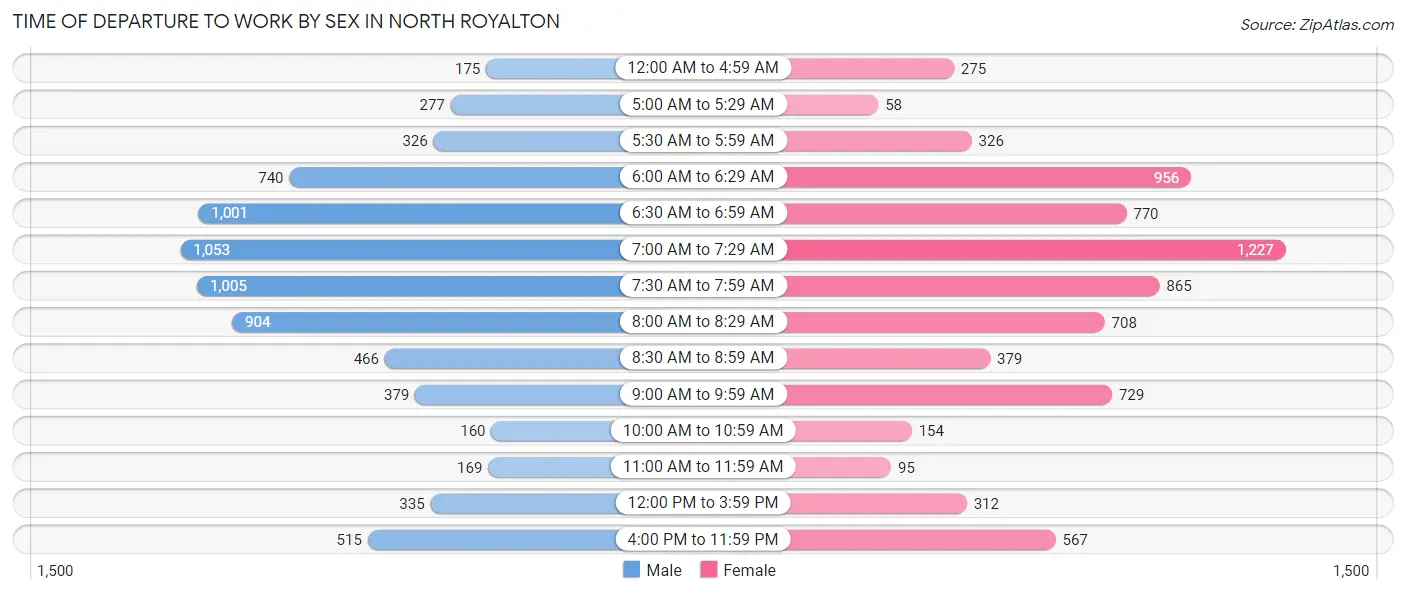
| Time of Departure | Male | Female |
| 12:00 AM to 4:59 AM | 175 (2.3%) | 275 (3.7%) |
| 5:00 AM to 5:29 AM | 277 (3.7%) | 58 (0.8%) |
| 5:30 AM to 5:59 AM | 326 (4.3%) | 326 (4.4%) |
| 6:00 AM to 6:29 AM | 740 (9.9%) | 956 (12.9%) |
| 6:30 AM to 6:59 AM | 1,001 (13.3%) | 770 (10.4%) |
| 7:00 AM to 7:29 AM | 1,053 (14.0%) | 1,227 (16.5%) |
| 7:30 AM to 7:59 AM | 1,005 (13.4%) | 865 (11.7%) |
| 8:00 AM to 8:29 AM | 904 (12.0%) | 708 (9.5%) |
| 8:30 AM to 8:59 AM | 466 (6.2%) | 379 (5.1%) |
| 9:00 AM to 9:59 AM | 379 (5.1%) | 729 (9.8%) |
| 10:00 AM to 10:59 AM | 160 (2.1%) | 154 (2.1%) |
| 11:00 AM to 11:59 AM | 169 (2.2%) | 95 (1.3%) |
| 12:00 PM to 3:59 PM | 335 (4.5%) | 312 (4.2%) |
| 4:00 PM to 11:59 PM | 515 (6.9%) | 567 (7.6%) |
| Total | 7,505 (100.0%) | 7,421 (100.0%) |
Housing Occupancy in North Royalton
Occupancy by Ownership in North Royalton
Of the total 13,541 dwellings in North Royalton, owner-occupied units account for 9,488 (70.1%), while renter-occupied units make up 4,053 (29.9%).
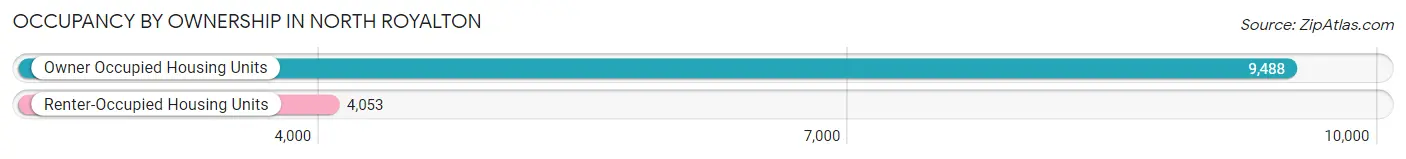
| Occupancy | # Housing Units | % Housing Units |
| Owner Occupied Housing Units | 9,488 | 70.1% |
| Renter-Occupied Housing Units | 4,053 | 29.9% |
| Total Occupied Housing Units | 13,541 | 100.0% |
Occupancy by Household Size in North Royalton
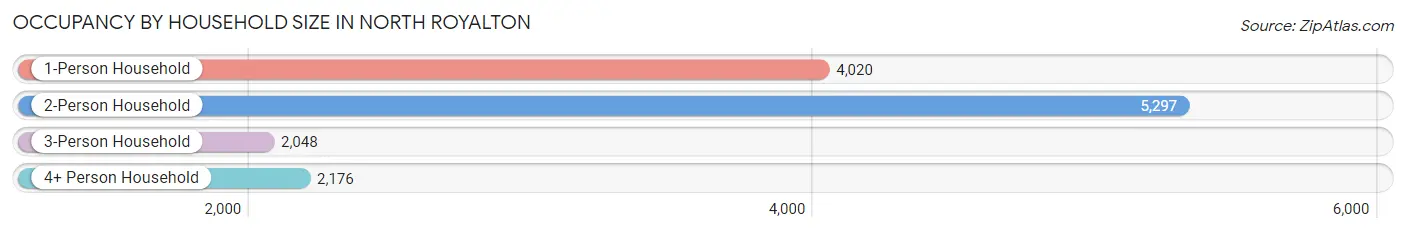
| Household Size | # Housing Units | % Housing Units |
| 1-Person Household | 4,020 | 29.7% |
| 2-Person Household | 5,297 | 39.1% |
| 3-Person Household | 2,048 | 15.1% |
| 4+ Person Household | 2,176 | 16.1% |
| Total Housing Units | 13,541 | 100.0% |
Occupancy by Ownership by Household Size in North Royalton
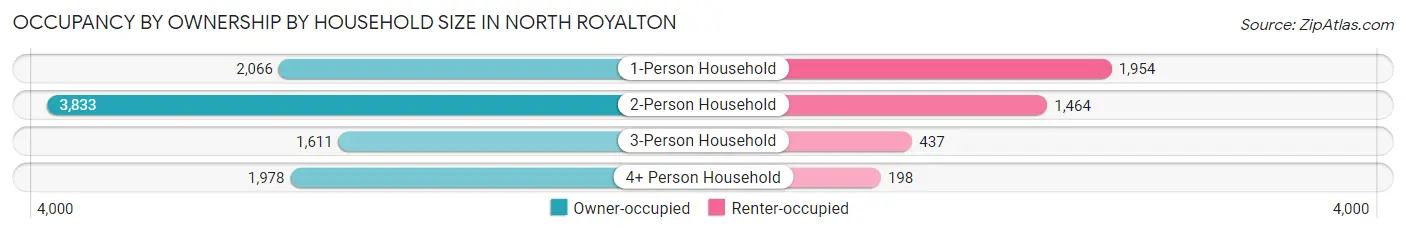
| Household Size | Owner-occupied | Renter-occupied |
| 1-Person Household | 2,066 (51.4%) | 1,954 (48.6%) |
| 2-Person Household | 3,833 (72.4%) | 1,464 (27.6%) |
| 3-Person Household | 1,611 (78.7%) | 437 (21.3%) |
| 4+ Person Household | 1,978 (90.9%) | 198 (9.1%) |
| Total Housing Units | 9,488 (70.1%) | 4,053 (29.9%) |
Occupancy by Educational Attainment in North Royalton
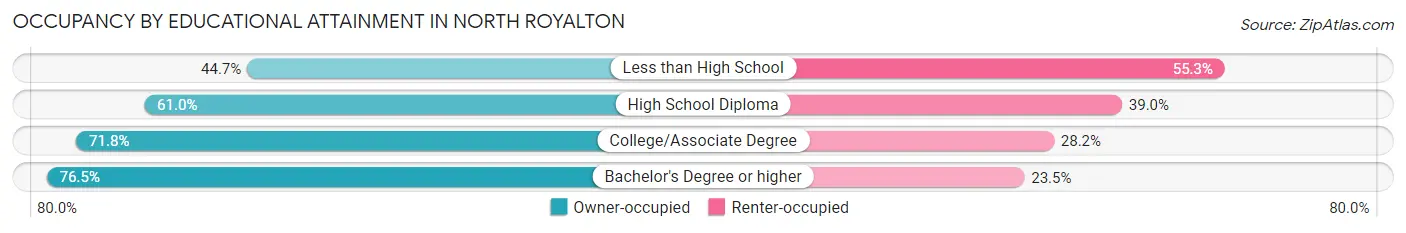
| Household Size | Owner-occupied | Renter-occupied |
| Less than High School | 190 (44.7%) | 235 (55.3%) |
| High School Diploma | 2,158 (61.0%) | 1,378 (39.0%) |
| College/Associate Degree | 2,903 (71.8%) | 1,139 (28.2%) |
| Bachelor's Degree or higher | 4,237 (76.5%) | 1,301 (23.5%) |
Occupancy by Age of Householder in North Royalton
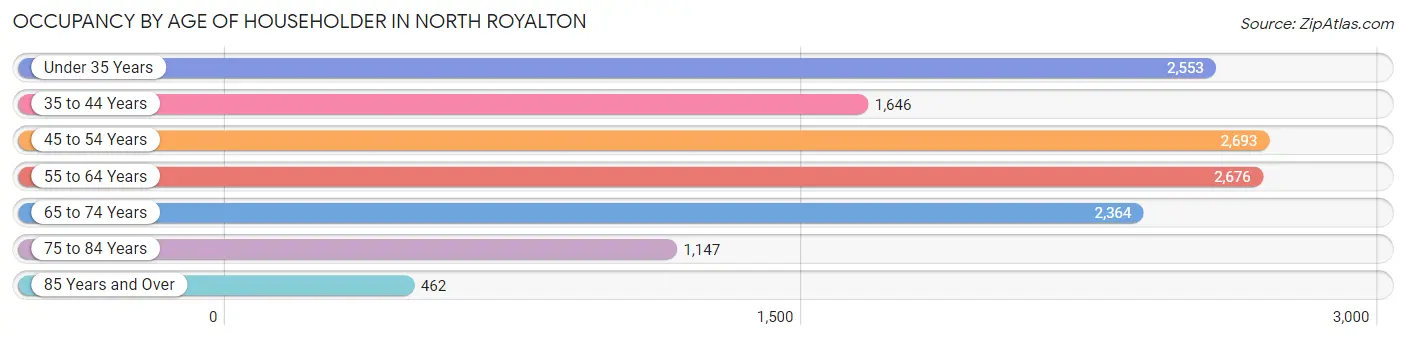
| Age Bracket | # Households | % Households |
| Under 35 Years | 2,553 | 18.9% |
| 35 to 44 Years | 1,646 | 12.2% |
| 45 to 54 Years | 2,693 | 19.9% |
| 55 to 64 Years | 2,676 | 19.8% |
| 65 to 74 Years | 2,364 | 17.5% |
| 75 to 84 Years | 1,147 | 8.5% |
| 85 Years and Over | 462 | 3.4% |
| Total | 13,541 | 100.0% |
Housing Finances in North Royalton
Median Income by Occupancy in North Royalton
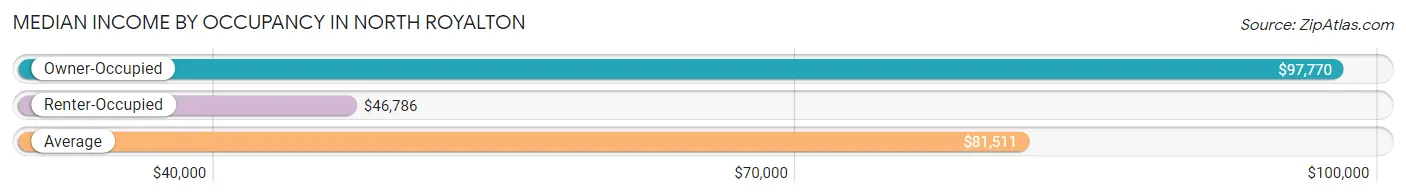
| Occupancy Type | # Households | Median Income |
| Owner-Occupied | 9,488 (70.1%) | $97,770 |
| Renter-Occupied | 4,053 (29.9%) | $46,786 |
| Average | 13,541 (100.0%) | $81,511 |
Occupancy by Householder Income Bracket in North Royalton
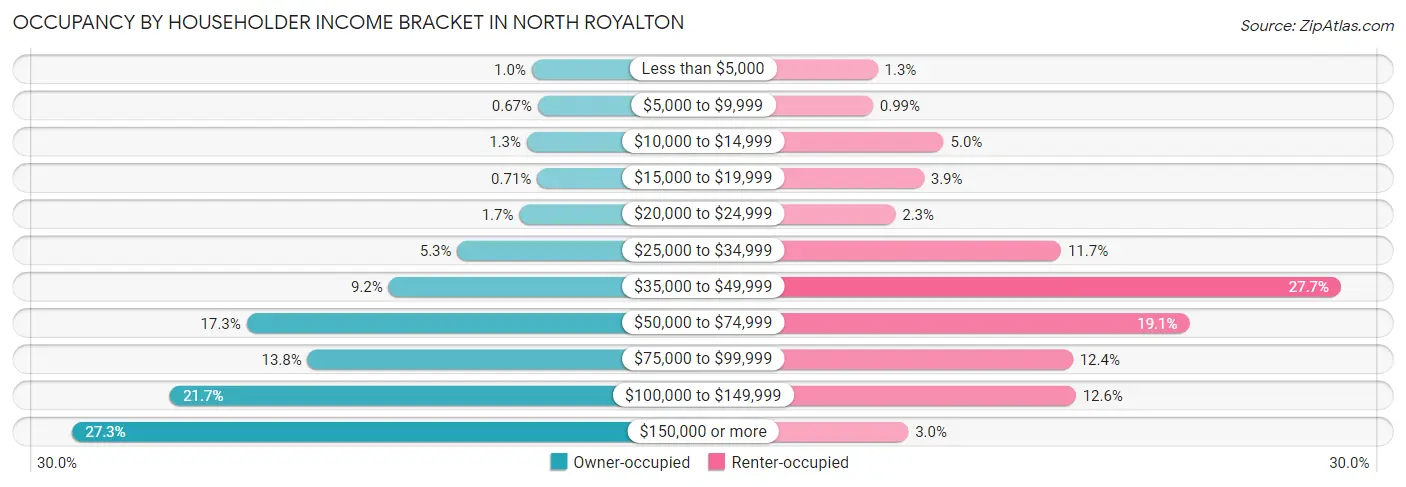
| Income Bracket | Owner-occupied | Renter-occupied |
| Less than $5,000 | 97 (1.0%) | 51 (1.3%) |
| $5,000 to $9,999 | 64 (0.7%) | 40 (1.0%) |
| $10,000 to $14,999 | 123 (1.3%) | 204 (5.0%) |
| $15,000 to $19,999 | 67 (0.7%) | 158 (3.9%) |
| $20,000 to $24,999 | 164 (1.7%) | 92 (2.3%) |
| $25,000 to $34,999 | 500 (5.3%) | 476 (11.7%) |
| $35,000 to $49,999 | 873 (9.2%) | 1,124 (27.7%) |
| $50,000 to $74,999 | 1,643 (17.3%) | 773 (19.1%) |
| $75,000 to $99,999 | 1,312 (13.8%) | 503 (12.4%) |
| $100,000 to $149,999 | 2,058 (21.7%) | 510 (12.6%) |
| $150,000 or more | 2,587 (27.3%) | 122 (3.0%) |
| Total | 9,488 (100.0%) | 4,053 (100.0%) |
Monthly Housing Cost Tiers in North Royalton
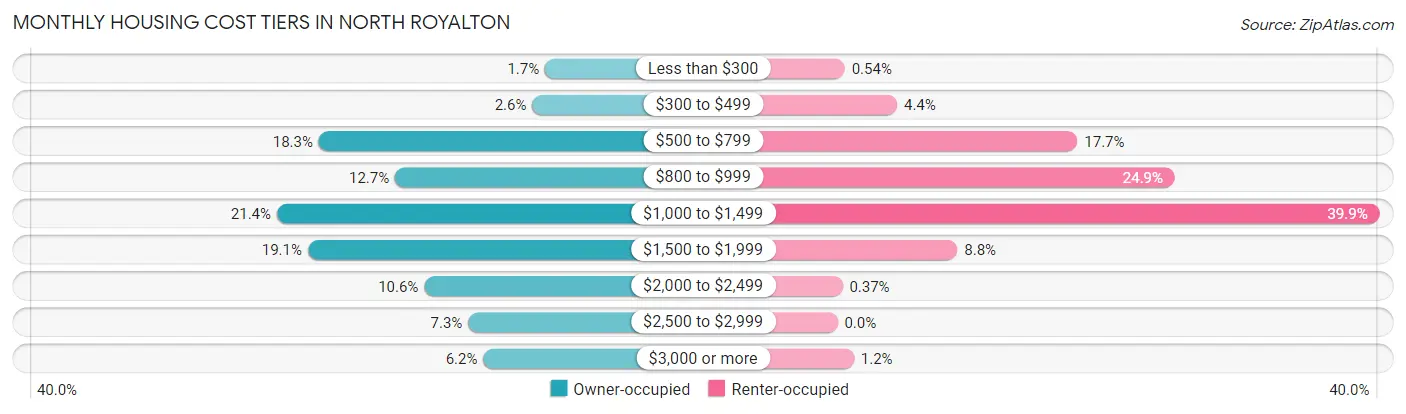
| Monthly Cost | Owner-occupied | Renter-occupied |
| Less than $300 | 158 (1.7%) | 22 (0.5%) |
| $300 to $499 | 248 (2.6%) | 178 (4.4%) |
| $500 to $799 | 1,739 (18.3%) | 716 (17.7%) |
| $800 to $999 | 1,207 (12.7%) | 1,007 (24.8%) |
| $1,000 to $1,499 | 2,032 (21.4%) | 1,618 (39.9%) |
| $1,500 to $1,999 | 1,816 (19.1%) | 358 (8.8%) |
| $2,000 to $2,499 | 1,003 (10.6%) | 15 (0.4%) |
| $2,500 to $2,999 | 695 (7.3%) | 0 (0.0%) |
| $3,000 or more | 590 (6.2%) | 49 (1.2%) |
| Total | 9,488 (100.0%) | 4,053 (100.0%) |
Physical Housing Characteristics in North Royalton
Housing Structures in North Royalton
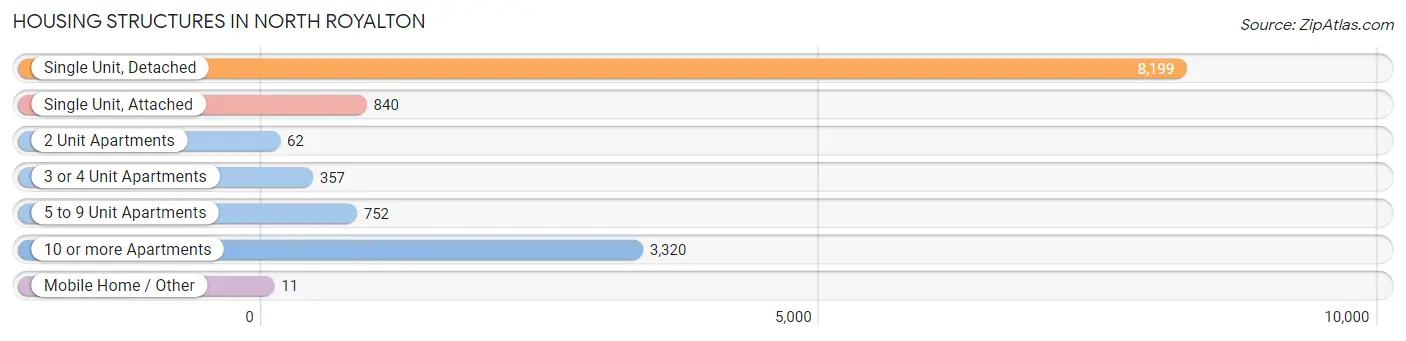
| Structure Type | # Housing Units | % Housing Units |
| Single Unit, Detached | 8,199 | 60.6% |
| Single Unit, Attached | 840 | 6.2% |
| 2 Unit Apartments | 62 | 0.5% |
| 3 or 4 Unit Apartments | 357 | 2.6% |
| 5 to 9 Unit Apartments | 752 | 5.6% |
| 10 or more Apartments | 3,320 | 24.5% |
| Mobile Home / Other | 11 | 0.1% |
| Total | 13,541 | 100.0% |
Housing Structures by Occupancy in North Royalton
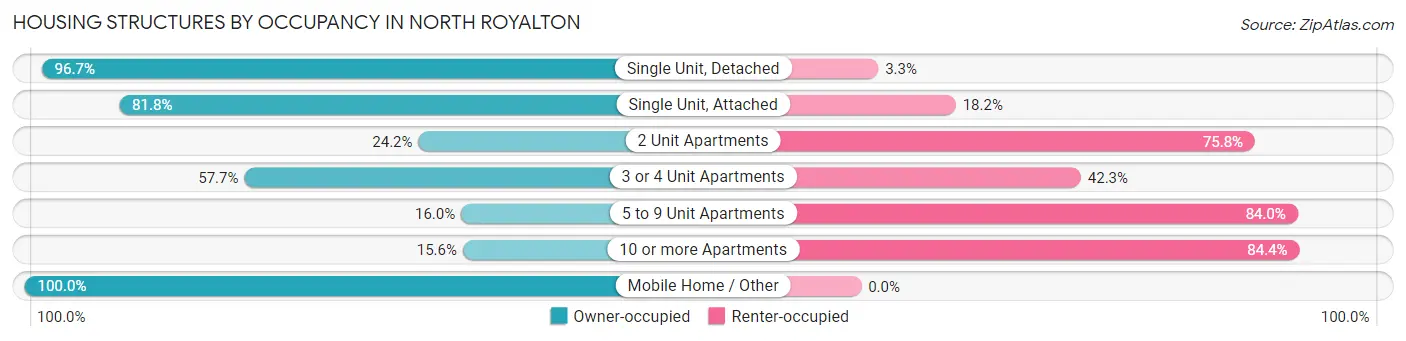
| Structure Type | Owner-occupied | Renter-occupied |
| Single Unit, Detached | 7,930 (96.7%) | 269 (3.3%) |
| Single Unit, Attached | 687 (81.8%) | 153 (18.2%) |
| 2 Unit Apartments | 15 (24.2%) | 47 (75.8%) |
| 3 or 4 Unit Apartments | 206 (57.7%) | 151 (42.3%) |
| 5 to 9 Unit Apartments | 120 (16.0%) | 632 (84.0%) |
| 10 or more Apartments | 519 (15.6%) | 2,801 (84.4%) |
| Mobile Home / Other | 11 (100.0%) | 0 (0.0%) |
| Total | 9,488 (70.1%) | 4,053 (29.9%) |
Housing Structures by Number of Rooms in North Royalton
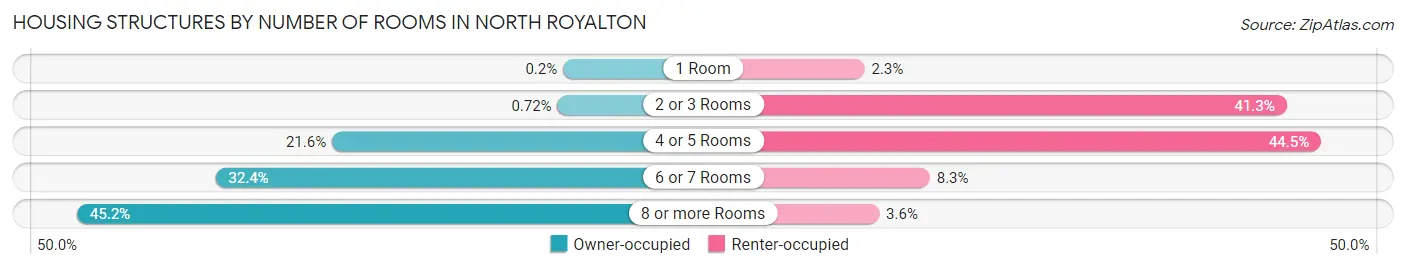
| Number of Rooms | Owner-occupied | Renter-occupied |
| 1 Room | 19 (0.2%) | 92 (2.3%) |
| 2 or 3 Rooms | 68 (0.7%) | 1,674 (41.3%) |
| 4 or 5 Rooms | 2,047 (21.6%) | 1,803 (44.5%) |
| 6 or 7 Rooms | 3,069 (32.4%) | 337 (8.3%) |
| 8 or more Rooms | 4,285 (45.2%) | 147 (3.6%) |
| Total | 9,488 (100.0%) | 4,053 (100.0%) |
Housing Structure by Heating Type in North Royalton
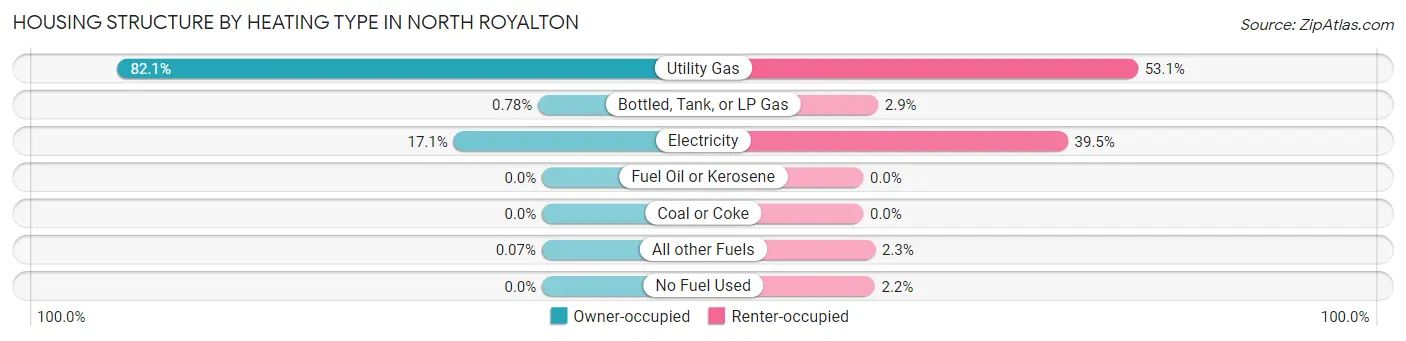
| Heating Type | Owner-occupied | Renter-occupied |
| Utility Gas | 7,785 (82.1%) | 2,151 (53.1%) |
| Bottled, Tank, or LP Gas | 74 (0.8%) | 116 (2.9%) |
| Electricity | 1,622 (17.1%) | 1,602 (39.5%) |
| Fuel Oil or Kerosene | 0 (0.0%) | 0 (0.0%) |
| Coal or Coke | 0 (0.0%) | 0 (0.0%) |
| All other Fuels | 7 (0.1%) | 94 (2.3%) |
| No Fuel Used | 0 (0.0%) | 90 (2.2%) |
| Total | 9,488 (100.0%) | 4,053 (100.0%) |
Household Vehicle Usage in North Royalton
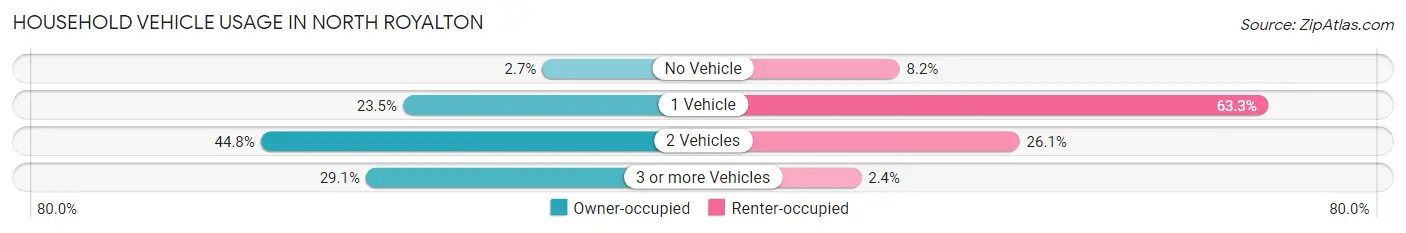
| Vehicles per Household | Owner-occupied | Renter-occupied |
| No Vehicle | 255 (2.7%) | 331 (8.2%) |
| 1 Vehicle | 2,231 (23.5%) | 2,565 (63.3%) |
| 2 Vehicles | 4,246 (44.8%) | 1,058 (26.1%) |
| 3 or more Vehicles | 2,756 (29.0%) | 99 (2.4%) |
| Total | 9,488 (100.0%) | 4,053 (100.0%) |
Real Estate & Mortgages in North Royalton
Real Estate and Mortgage Overview in North Royalton
| Characteristic | Without Mortgage | With Mortgage |
| Housing Units | 3,648 | 5,840 |
| Median Property Value | $253,000 | $270,500 |
| Median Household Income | $73,750 | $1,963 |
| Monthly Housing Costs | $759 | $553 |
| Real Estate Taxes | $5,037 | $15 |
Property Value by Mortgage Status in North Royalton
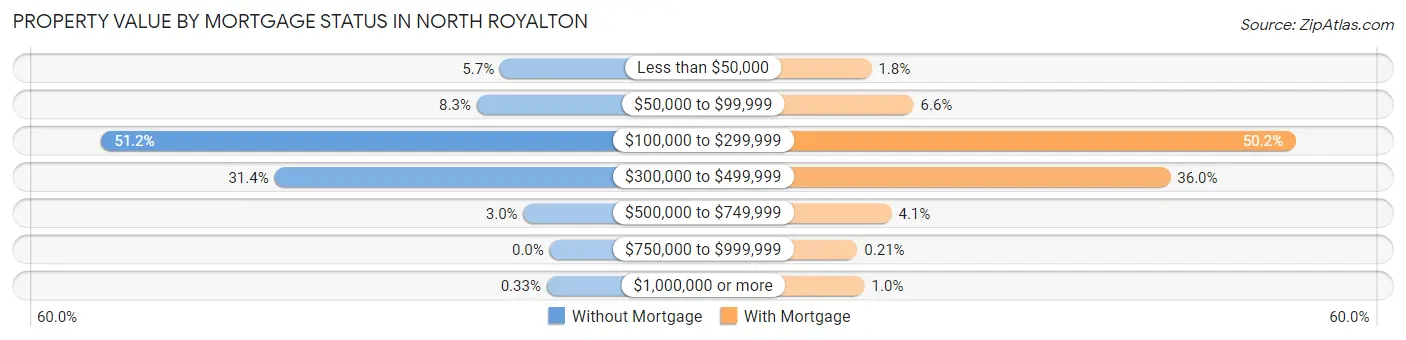
| Property Value | Without Mortgage | With Mortgage |
| Less than $50,000 | 207 (5.7%) | 106 (1.8%) |
| $50,000 to $99,999 | 304 (8.3%) | 387 (6.6%) |
| $100,000 to $299,999 | 1,869 (51.2%) | 2,933 (50.2%) |
| $300,000 to $499,999 | 1,147 (31.4%) | 2,101 (36.0%) |
| $500,000 to $749,999 | 109 (3.0%) | 240 (4.1%) |
| $750,000 to $999,999 | 0 (0.0%) | 12 (0.2%) |
| $1,000,000 or more | 12 (0.3%) | 61 (1.0%) |
| Total | 3,648 (100.0%) | 5,840 (100.0%) |
Household Income by Mortgage Status in North Royalton
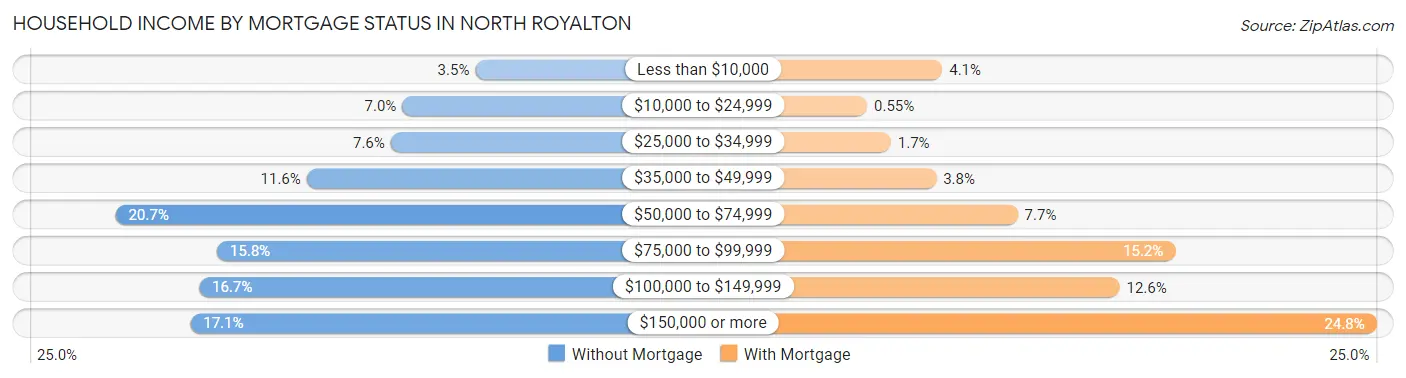
| Household Income | Without Mortgage | With Mortgage |
| Less than $10,000 | 129 (3.5%) | 241 (4.1%) |
| $10,000 to $24,999 | 256 (7.0%) | 32 (0.5%) |
| $25,000 to $34,999 | 276 (7.6%) | 98 (1.7%) |
| $35,000 to $49,999 | 422 (11.6%) | 224 (3.8%) |
| $50,000 to $74,999 | 754 (20.7%) | 451 (7.7%) |
| $75,000 to $99,999 | 578 (15.8%) | 889 (15.2%) |
| $100,000 to $149,999 | 609 (16.7%) | 734 (12.6%) |
| $150,000 or more | 624 (17.1%) | 1,449 (24.8%) |
| Total | 3,648 (100.0%) | 5,840 (100.0%) |
Property Value to Household Income Ratio in North Royalton
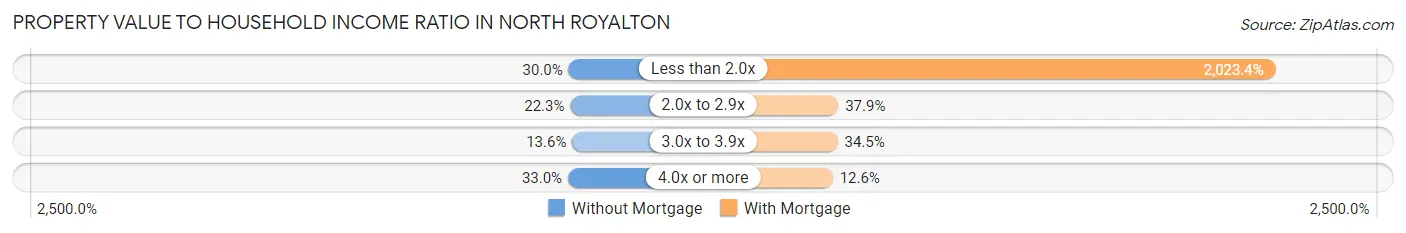
| Value-to-Income Ratio | Without Mortgage | With Mortgage |
| Less than 2.0x | 1,096 (30.0%) | 118,168 (2,023.4%) |
| 2.0x to 2.9x | 812 (22.3%) | 2,211 (37.9%) |
| 3.0x to 3.9x | 495 (13.6%) | 2,014 (34.5%) |
| 4.0x or more | 1,204 (33.0%) | 738 (12.6%) |
| Total | 3,648 (100.0%) | 5,840 (100.0%) |
Real Estate Taxes by Mortgage Status in North Royalton
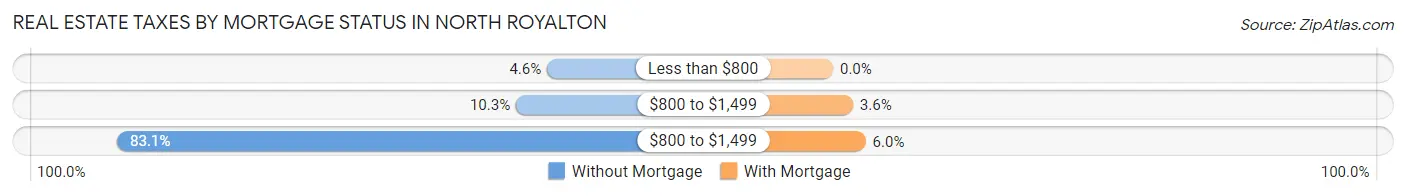
| Property Taxes | Without Mortgage | With Mortgage |
| Less than $800 | 167 (4.6%) | 0 (0.0%) |
| $800 to $1,499 | 374 (10.2%) | 212 (3.6%) |
| $800 to $1,499 | 3,032 (83.1%) | 348 (6.0%) |
| Total | 3,648 (100.0%) | 5,840 (100.0%) |
Health & Disability in North Royalton
Health Insurance Coverage by Age in North Royalton
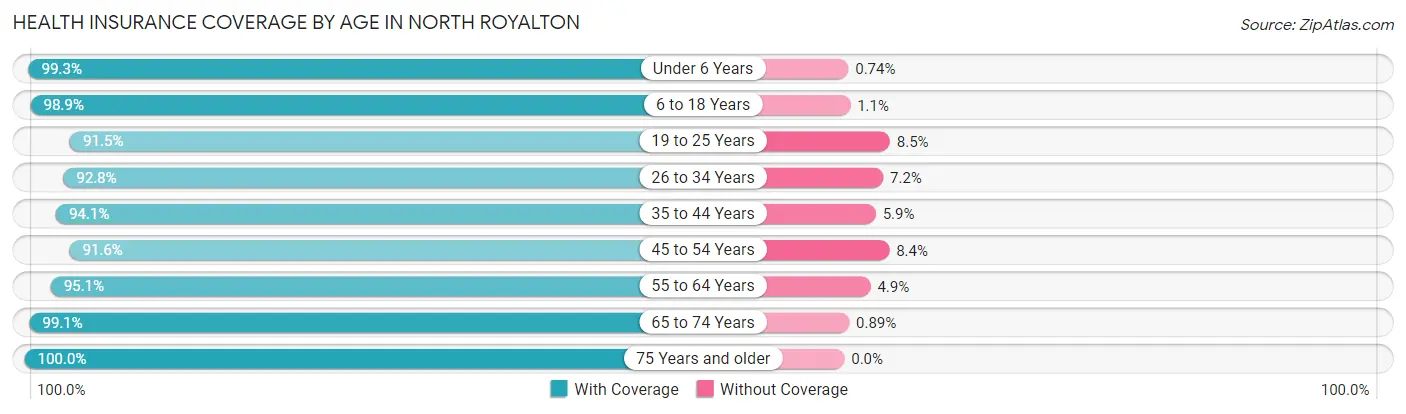
| Age Bracket | With Coverage | Without Coverage |
| Under 6 Years | 1,481 (99.3%) | 11 (0.7%) |
| 6 to 18 Years | 4,295 (98.9%) | 48 (1.1%) |
| 19 to 25 Years | 2,695 (91.5%) | 250 (8.5%) |
| 26 to 34 Years | 3,257 (92.8%) | 254 (7.2%) |
| 35 to 44 Years | 3,069 (94.1%) | 191 (5.9%) |
| 45 to 54 Years | 4,161 (91.6%) | 380 (8.4%) |
| 55 to 64 Years | 4,462 (95.1%) | 229 (4.9%) |
| 65 to 74 Years | 3,882 (99.1%) | 35 (0.9%) |
| 75 Years and older | 2,151 (100.0%) | 0 (0.0%) |
| Total | 29,453 (95.5%) | 1,398 (4.5%) |
Health Insurance Coverage by Citizenship Status in North Royalton
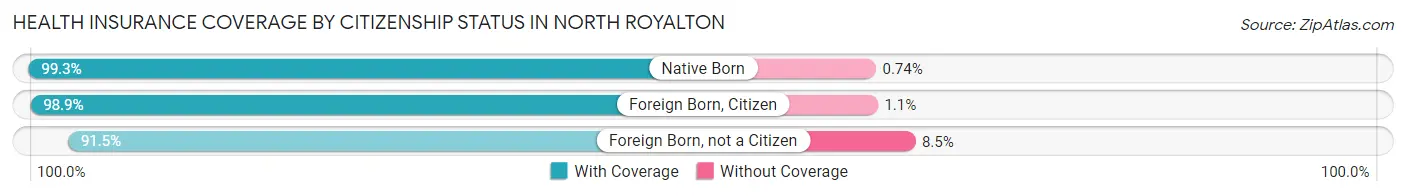
| Citizenship Status | With Coverage | Without Coverage |
| Native Born | 1,481 (99.3%) | 11 (0.7%) |
| Foreign Born, Citizen | 4,295 (98.9%) | 48 (1.1%) |
| Foreign Born, not a Citizen | 2,695 (91.5%) | 250 (8.5%) |
Health Insurance Coverage by Household Income in North Royalton
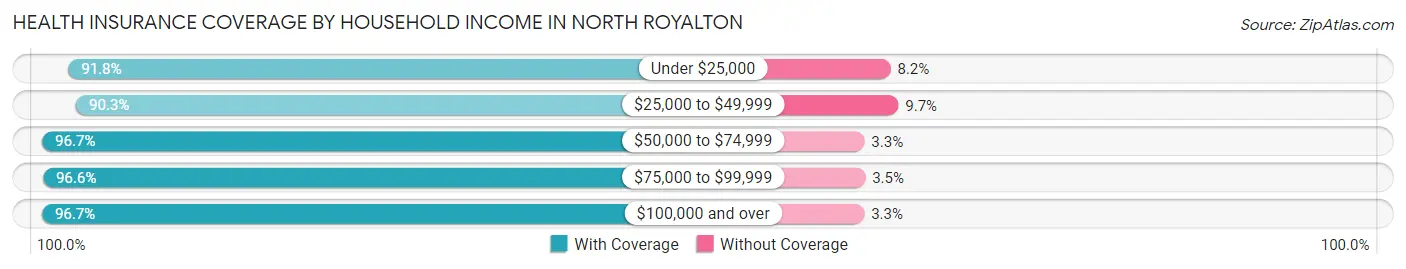
| Household Income | With Coverage | Without Coverage |
| Under $25,000 | 1,455 (91.8%) | 130 (8.2%) |
| $25,000 to $49,999 | 4,310 (90.3%) | 461 (9.7%) |
| $50,000 to $74,999 | 4,307 (96.7%) | 147 (3.3%) |
| $75,000 to $99,999 | 3,951 (96.6%) | 141 (3.5%) |
| $100,000 and over | 15,355 (96.7%) | 518 (3.3%) |
Public vs Private Health Insurance Coverage by Age in North Royalton
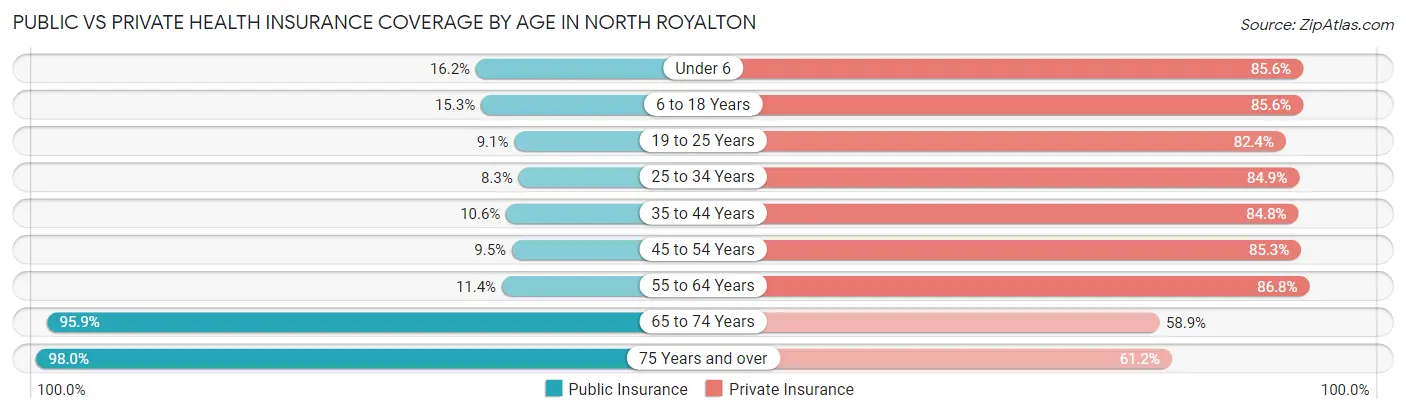
| Age Bracket | Public Insurance | Private Insurance |
| Under 6 | 242 (16.2%) | 1,277 (85.6%) |
| 6 to 18 Years | 664 (15.3%) | 3,717 (85.6%) |
| 19 to 25 Years | 268 (9.1%) | 2,427 (82.4%) |
| 25 to 34 Years | 292 (8.3%) | 2,980 (84.9%) |
| 35 to 44 Years | 346 (10.6%) | 2,763 (84.8%) |
| 45 to 54 Years | 433 (9.5%) | 3,871 (85.3%) |
| 55 to 64 Years | 535 (11.4%) | 4,071 (86.8%) |
| 65 to 74 Years | 3,758 (95.9%) | 2,306 (58.9%) |
| 75 Years and over | 2,107 (98.0%) | 1,317 (61.2%) |
| Total | 8,645 (28.0%) | 24,729 (80.2%) |
Disability Status by Sex by Age in North Royalton
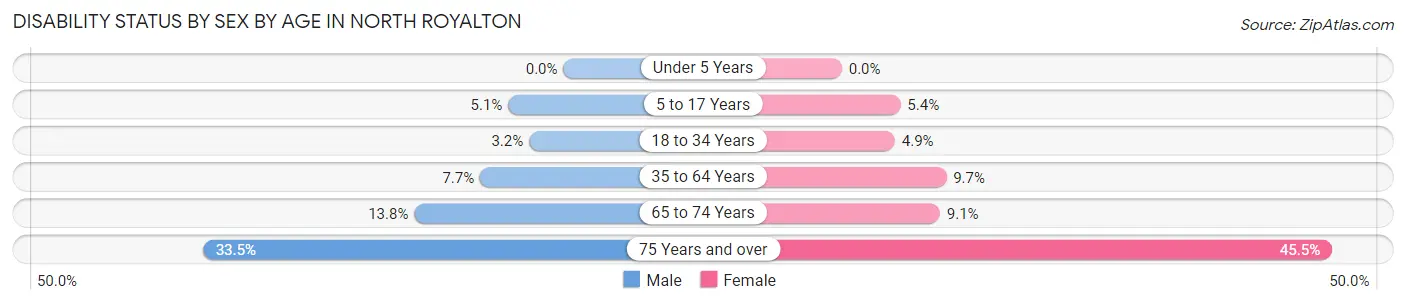
| Age Bracket | Male | Female |
| Under 5 Years | 0 (0.0%) | 0 (0.0%) |
| 5 to 17 Years | 132 (5.1%) | 93 (5.4%) |
| 18 to 34 Years | 110 (3.2%) | 166 (4.9%) |
| 35 to 64 Years | 447 (7.7%) | 650 (9.7%) |
| 65 to 74 Years | 264 (13.8%) | 183 (9.1%) |
| 75 Years and over | 338 (33.5%) | 519 (45.5%) |
Disability Class by Sex by Age in North Royalton
Disability Class: Hearing Difficulty
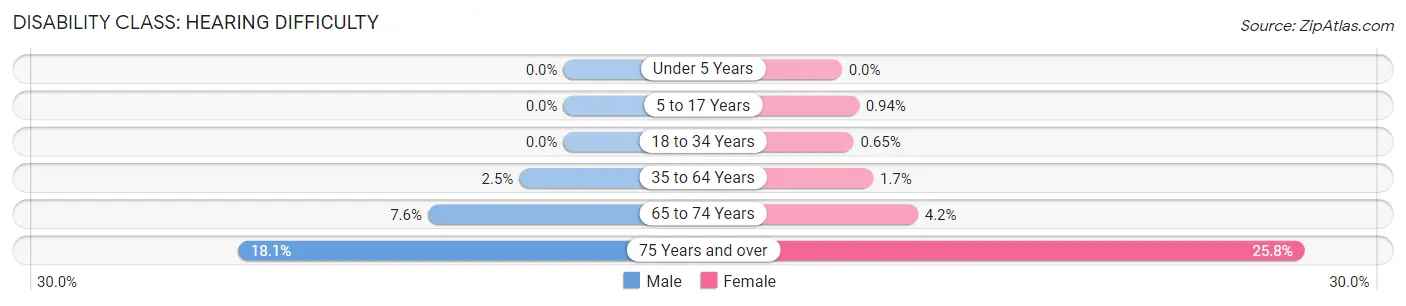
| Age Bracket | Male | Female |
| Under 5 Years | 0 (0.0%) | 0 (0.0%) |
| 5 to 17 Years | 0 (0.0%) | 16 (0.9%) |
| 18 to 34 Years | 0 (0.0%) | 22 (0.6%) |
| 35 to 64 Years | 142 (2.5%) | 117 (1.7%) |
| 65 to 74 Years | 144 (7.5%) | 85 (4.2%) |
| 75 Years and over | 183 (18.1%) | 294 (25.8%) |
Disability Class: Vision Difficulty
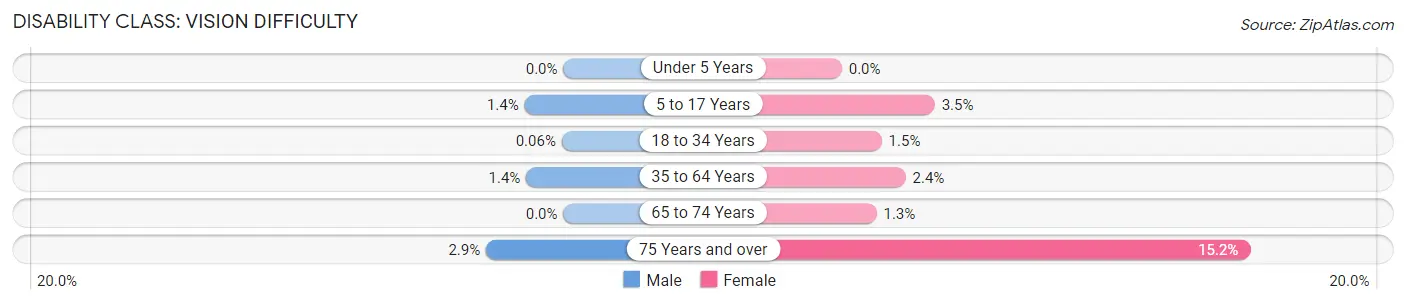
| Age Bracket | Male | Female |
| Under 5 Years | 0 (0.0%) | 0 (0.0%) |
| 5 to 17 Years | 37 (1.4%) | 59 (3.5%) |
| 18 to 34 Years | 2 (0.1%) | 50 (1.5%) |
| 35 to 64 Years | 80 (1.4%) | 159 (2.4%) |
| 65 to 74 Years | 0 (0.0%) | 26 (1.3%) |
| 75 Years and over | 29 (2.9%) | 173 (15.2%) |
Disability Class: Cognitive Difficulty
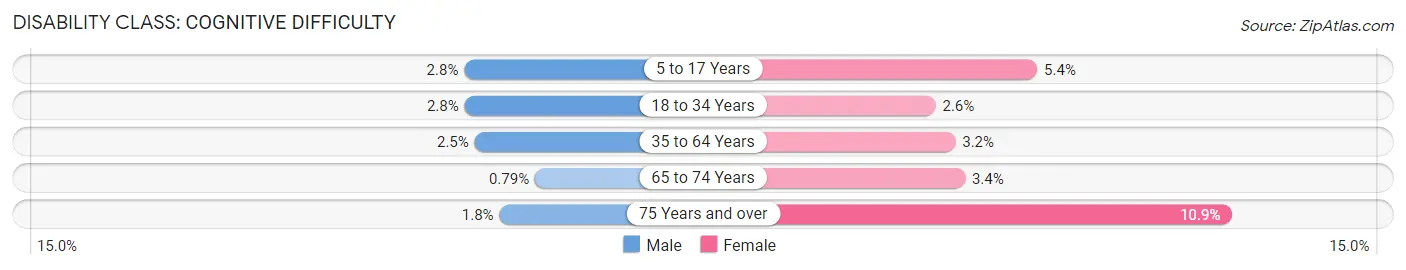
| Age Bracket | Male | Female |
| 5 to 17 Years | 71 (2.8%) | 93 (5.4%) |
| 18 to 34 Years | 95 (2.8%) | 88 (2.6%) |
| 35 to 64 Years | 143 (2.5%) | 212 (3.2%) |
| 65 to 74 Years | 15 (0.8%) | 69 (3.4%) |
| 75 Years and over | 18 (1.8%) | 124 (10.9%) |
Disability Class: Ambulatory Difficulty
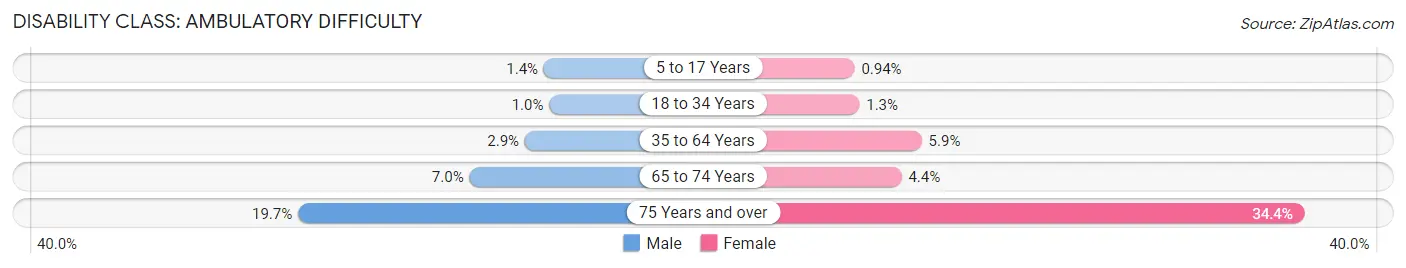
| Age Bracket | Male | Female |
| 5 to 17 Years | 37 (1.4%) | 16 (0.9%) |
| 18 to 34 Years | 36 (1.0%) | 44 (1.3%) |
| 35 to 64 Years | 165 (2.9%) | 398 (5.9%) |
| 65 to 74 Years | 133 (7.0%) | 89 (4.4%) |
| 75 Years and over | 199 (19.7%) | 392 (34.4%) |
Disability Class: Self-Care Difficulty
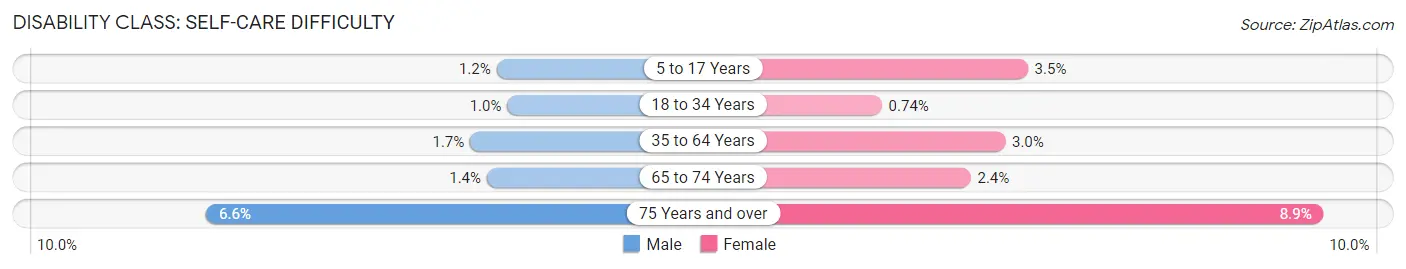
| Age Bracket | Male | Female |
| 5 to 17 Years | 32 (1.2%) | 59 (3.5%) |
| 18 to 34 Years | 36 (1.0%) | 25 (0.7%) |
| 35 to 64 Years | 100 (1.7%) | 203 (3.0%) |
| 65 to 74 Years | 27 (1.4%) | 48 (2.4%) |
| 75 Years and over | 67 (6.6%) | 102 (8.9%) |
Technology Access in North Royalton
Computing Device Access in North Royalton
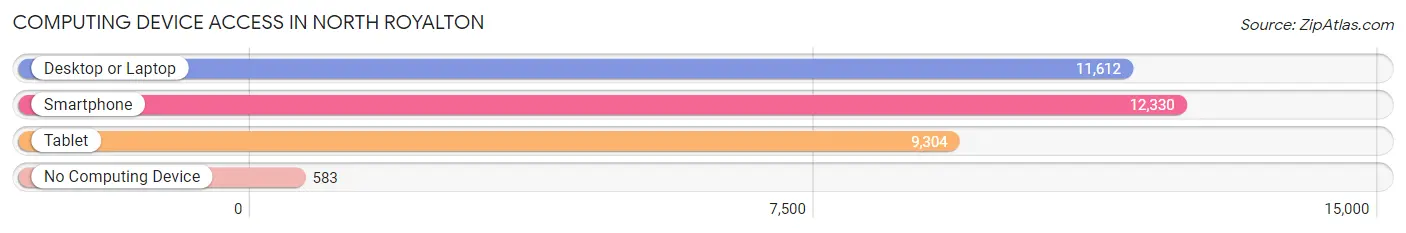
| Device Type | # Households | % Households |
| Desktop or Laptop | 11,612 | 85.8% |
| Smartphone | 12,330 | 91.1% |
| Tablet | 9,304 | 68.7% |
| No Computing Device | 583 | 4.3% |
| Total | 13,541 | 100.0% |
Internet Access in North Royalton
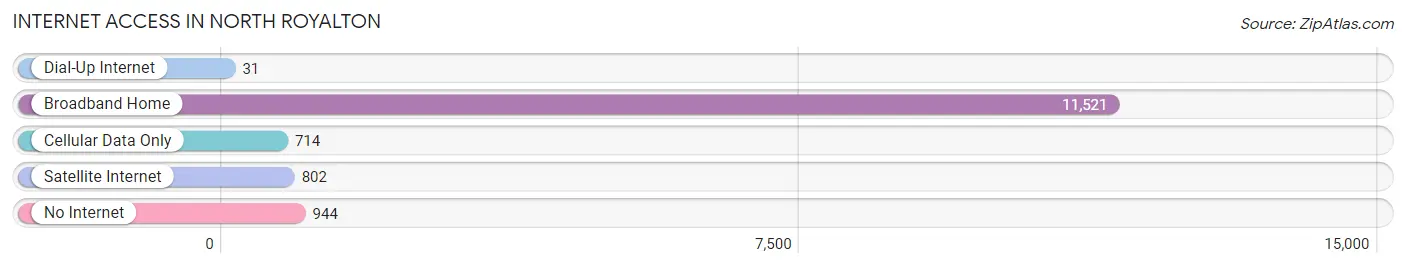
| Internet Type | # Households | % Households |
| Dial-Up Internet | 31 | 0.2% |
| Broadband Home | 11,521 | 85.1% |
| Cellular Data Only | 714 | 5.3% |
| Satellite Internet | 802 | 5.9% |
| No Internet | 944 | 7.0% |
| Total | 13,541 | 100.0% |
North Royalton Summary
Royalton, Ohio is a small city located in Cuyahoga County, Ohio. It is part of the Greater Cleveland metropolitan area and is located approximately 15 miles south of downtown Cleveland. The city has a population of approximately 30,000 people and is home to a variety of businesses, schools, and recreational activities.
History
The area that is now Royalton was first settled in 1810 by a group of settlers from Connecticut. The settlers named the area Royalton after the town of Royalton, Connecticut. The area was originally part of the Connecticut Western Reserve, which was a large tract of land that was set aside by the United States government for settlement by people from the original thirteen colonies.
The first post office in Royalton was established in 1820 and the first school was built in 1825. The first church was built in 1827 and the first newspaper was established in 1829. The first railroad line was built in 1851 and the first bank was established in 1853.
In 1868, Royalton was incorporated as a village and in 1871, it was incorporated as a city. The city grew rapidly during the late 19th and early 20th centuries, and by the 1950s, it had become a major industrial center.
Geography
Royalton is located in Cuyahoga County, Ohio, approximately 15 miles south of downtown Cleveland. The city is situated on the banks of the Cuyahoga River and is bordered by the cities of North Royalton, Broadview Heights, and Parma. The city covers an area of approximately 8.5 square miles and has a population of approximately 30,000 people.
The city is located in a region of rolling hills and is home to a variety of parks and recreational areas. The city is also home to a number of lakes, including Lake Royalton, which is a popular spot for fishing and boating.
Economy
Royalton is home to a variety of businesses and industries. The city is home to a number of manufacturing companies, including a steel mill, a paper mill, and a plastics plant. The city is also home to a number of retail stores, restaurants, and other businesses.
The city is also home to a number of educational institutions, including the Royalton-Brunswick School District, which serves the city and the surrounding area. The city is also home to a number of churches and other religious organizations.
Demographics
As of the 2010 census, the population of Royalton was 30,444. The racial makeup of the city was 87.3% White, 8.2% African American, 0.4% Native American, 1.2% Asian, 0.1% Pacific Islander, 0.7% from other races, and 2.1% from two or more races. Hispanic or Latino of any race were 2.3% of the population.
The median household income in Royalton was $50,945 and the median family income was $60,945. The per capita income in Royalton was $25,945. About 6.3% of families and 8.2% of the population were below the poverty line, including 10.3% of those under age 18 and 6.2% of those age 65 or over.
Royalton is a small city with a rich history and a diverse population. The city is home to a variety of businesses, schools, and recreational activities, and is a great place to live and work.
Common Questions
What is Per Capita Income in North Royalton?
Per Capita income in North Royalton is $47,679.
What is the Median Family Income in North Royalton?
Median Family Income in North Royalton is $106,546.
What is the Median Household income in North Royalton?
Median Household Income in North Royalton is $81,511.
What is Income or Wage Gap in North Royalton?
Income or Wage Gap in North Royalton is 30.5%.
Women in North Royalton earn 69.5 cents for every dollar earned by a man.
What is Family Income Deficit in North Royalton?
Family Income Deficit in North Royalton is $8,843.
Families that are below poverty line in North Royalton earn $8,843 less on average than the poverty threshold level.
What is Inequality or Gini Index in North Royalton?
Inequality or Gini Index in North Royalton is 0.44.
What is the Total Population of North Royalton?
Total Population of North Royalton is 31,120.
What is the Total Male Population of North Royalton?
Total Male Population of North Royalton is 15,400.
What is the Total Female Population of North Royalton?
Total Female Population of North Royalton is 15,720.
What is the Ratio of Males per 100 Females in North Royalton?
There are 97.96 Males per 100 Females in North Royalton.
What is the Ratio of Females per 100 Males in North Royalton?
There are 102.08 Females per 100 Males in North Royalton.
What is the Median Population Age in North Royalton?
Median Population Age in North Royalton is 45.0 Years.
What is the Average Family Size in North Royalton
Average Family Size in North Royalton is 2.8 People.
What is the Average Household Size in North Royalton
Average Household Size in North Royalton is 2.3 People.
How Large is the Labor Force in North Royalton?
There are 17,666 People in the Labor Forcein in North Royalton.
What is the Percentage of People in the Labor Force in North Royalton?
67.4% of People are in the Labor Force in North Royalton.
What is the Unemployment Rate in North Royalton?
Unemployment Rate in North Royalton is 4.2%.