Cuyahoga Falls, OH Map & Demographics
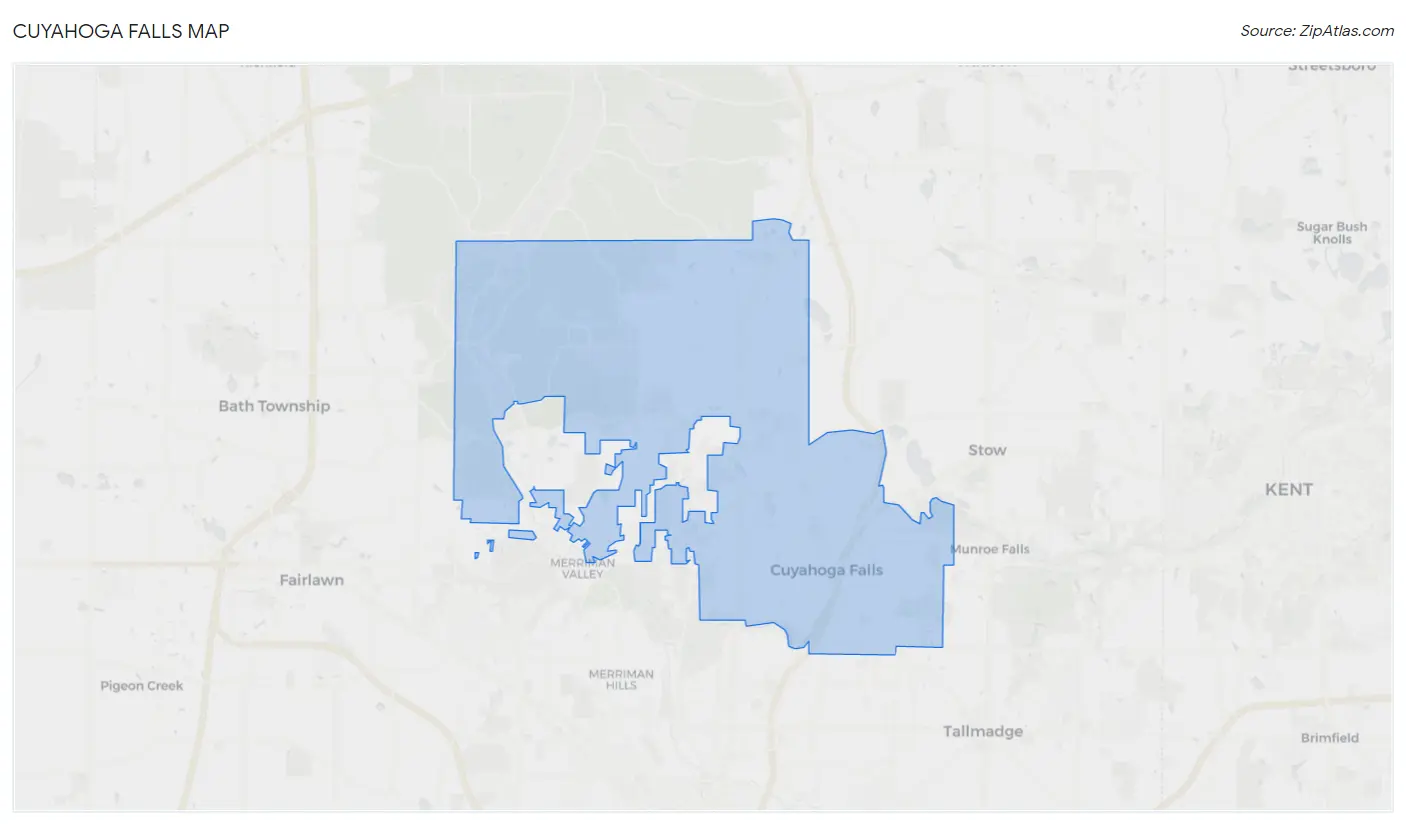
Cuyahoga Falls Map
Cuyahoga Falls Overview
$40,121
PER CAPITA INCOME
$88,827
AVG FAMILY INCOME
$67,922
AVG HOUSEHOLD INCOME
21.7%
WAGE / INCOME GAP [ % ]
78.3¢/ $1
WAGE / INCOME GAP [ $ ]
$10,703
FAMILY INCOME DEFICIT
0.44
INEQUALITY / GINI INDEX
50,916
TOTAL POPULATION
24,413
MALE POPULATION
26,503
FEMALE POPULATION
92.11
MALES / 100 FEMALES
108.56
FEMALES / 100 MALES
37.8
MEDIAN AGE
2.9
AVG FAMILY SIZE
2.2
AVG HOUSEHOLD SIZE
29,622
LABOR FORCE [ PEOPLE ]
69.3%
PERCENT IN LABOR FORCE
4.4%
UNEMPLOYMENT RATE
Cuyahoga Falls Area Codes
Income in Cuyahoga Falls
Income Overview in Cuyahoga Falls
Per Capita Income in Cuyahoga Falls is $40,121, while median incomes of families and households are $88,827 and $67,922 respectively.
| Characteristic | Number | Measure |
| Per Capita Income | 50,916 | $40,121 |
| Median Family Income | 12,788 | $88,827 |
| Mean Family Income | 12,788 | $106,382 |
| Median Household Income | 23,148 | $67,922 |
| Mean Household Income | 23,148 | $87,101 |
| Income Deficit | 12,788 | $10,703 |
| Wage / Income Gap (%) | 50,916 | 21.75% |
| Wage / Income Gap ($) | 50,916 | 78.25¢ per $1 |
| Gini / Inequality Index | 50,916 | 0.44 |
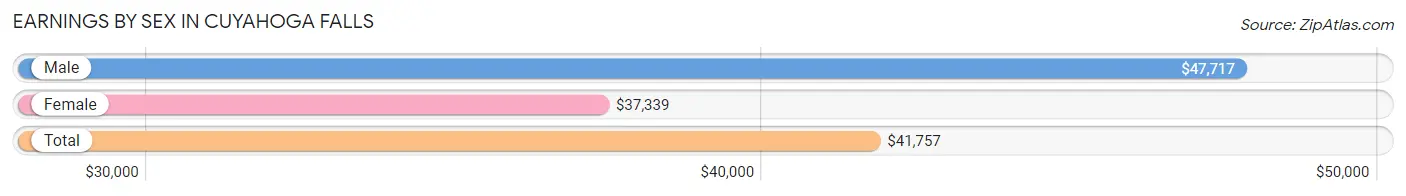
Earnings by Sex in Cuyahoga Falls
Average Earnings in Cuyahoga Falls are $41,757, $47,717 for men and $37,339 for women, a difference of 21.7%.
| Sex | Number | Average Earnings |
| Male | 15,583 (51.2%) | $47,717 |
| Female | 14,842 (48.8%) | $37,339 |
| Total | 30,425 (100.0%) | $41,757 |
Earnings by Sex by Income Bracket in Cuyahoga Falls
The most common earnings brackets in Cuyahoga Falls are $75,000 to $99,999 for men (2,072 | 13.3%) and $55,000 to $64,999 for women (1,393 | 9.4%).
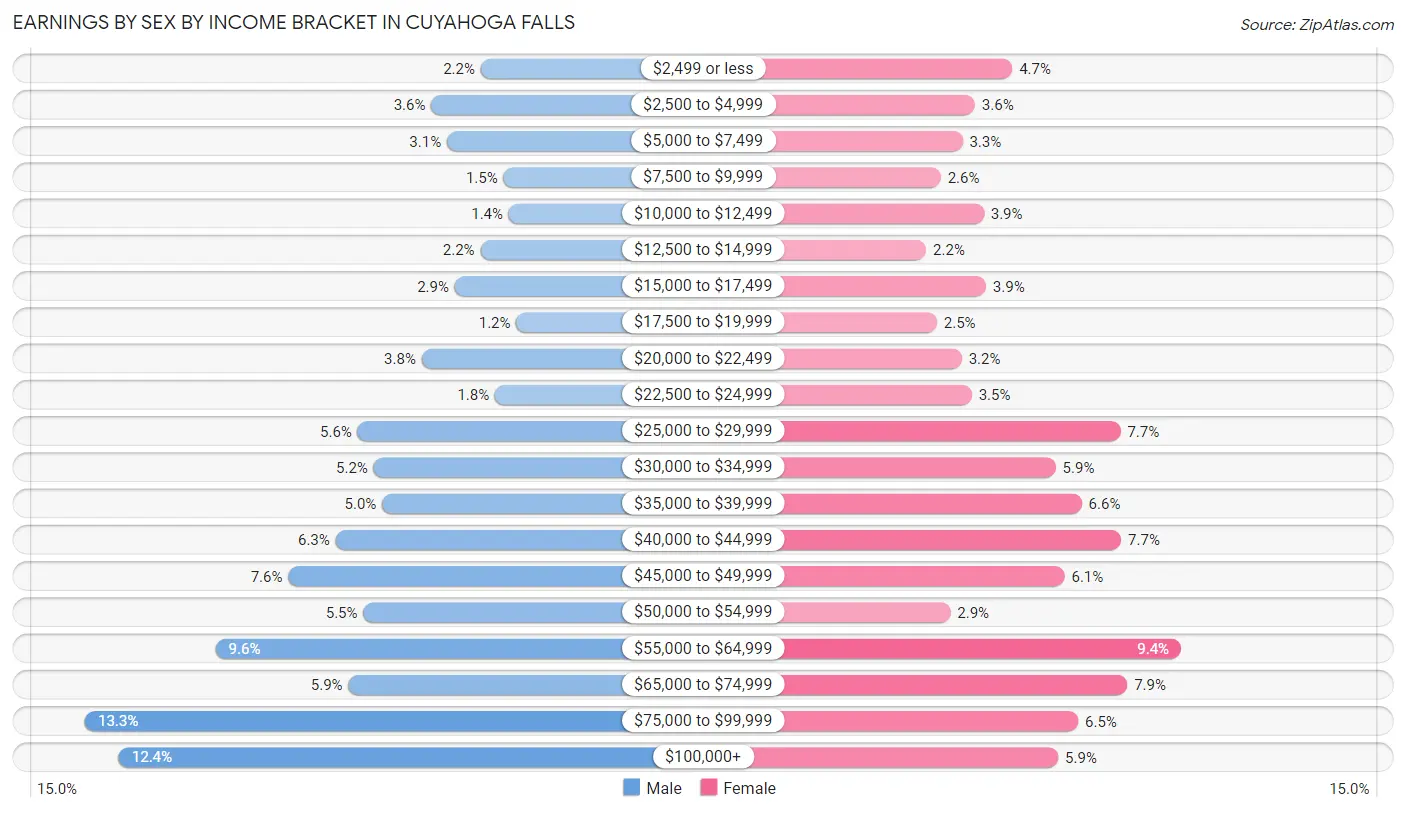
| Income | Male | Female |
| $2,499 or less | 339 (2.2%) | 690 (4.6%) |
| $2,500 to $4,999 | 557 (3.6%) | 535 (3.6%) |
| $5,000 to $7,499 | 488 (3.1%) | 483 (3.3%) |
| $7,500 to $9,999 | 240 (1.5%) | 392 (2.6%) |
| $10,000 to $12,499 | 216 (1.4%) | 571 (3.8%) |
| $12,500 to $14,999 | 341 (2.2%) | 331 (2.2%) |
| $15,000 to $17,499 | 453 (2.9%) | 580 (3.9%) |
| $17,500 to $19,999 | 184 (1.2%) | 375 (2.5%) |
| $20,000 to $22,499 | 599 (3.8%) | 480 (3.2%) |
| $22,500 to $24,999 | 278 (1.8%) | 521 (3.5%) |
| $25,000 to $29,999 | 879 (5.6%) | 1,141 (7.7%) |
| $30,000 to $34,999 | 808 (5.2%) | 871 (5.9%) |
| $35,000 to $39,999 | 772 (5.0%) | 979 (6.6%) |
| $40,000 to $44,999 | 976 (6.3%) | 1,145 (7.7%) |
| $45,000 to $49,999 | 1,183 (7.6%) | 908 (6.1%) |
| $50,000 to $54,999 | 854 (5.5%) | 432 (2.9%) |
| $55,000 to $64,999 | 1,500 (9.6%) | 1,393 (9.4%) |
| $65,000 to $74,999 | 919 (5.9%) | 1,169 (7.9%) |
| $75,000 to $99,999 | 2,072 (13.3%) | 965 (6.5%) |
| $100,000+ | 1,925 (12.3%) | 881 (5.9%) |
| Total | 15,583 (100.0%) | 14,842 (100.0%) |
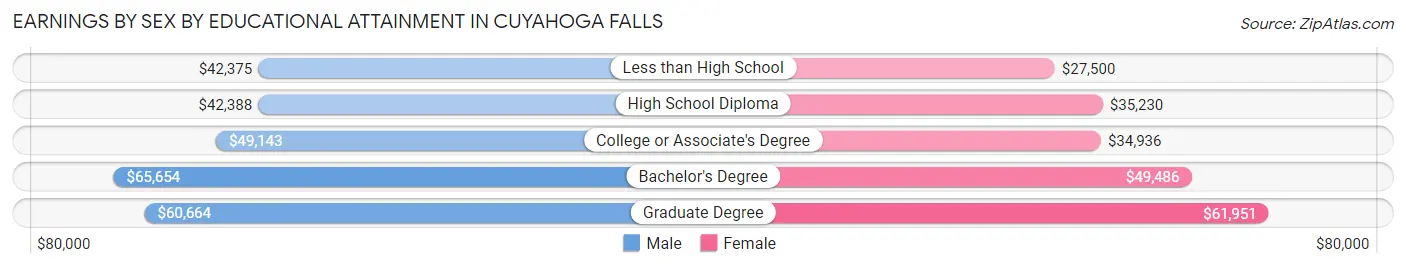
Earnings by Sex by Educational Attainment in Cuyahoga Falls
Average earnings in Cuyahoga Falls are $51,308 for men and $41,275 for women, a difference of 19.6%. Men with an educational attainment of bachelor's degree enjoy the highest average annual earnings of $65,654, while those with less than high school education earn the least with $42,375. Women with an educational attainment of graduate degree earn the most with the average annual earnings of $61,951, while those with less than high school education have the smallest earnings of $27,500.
| Educational Attainment | Male Income | Female Income |
| Less than High School | $42,375 | $27,500 |
| High School Diploma | $42,388 | $35,230 |
| College or Associate's Degree | $49,143 | $34,936 |
| Bachelor's Degree | $65,654 | $49,486 |
| Graduate Degree | $60,664 | $61,951 |
| Total | $51,308 | $41,275 |
Family Income in Cuyahoga Falls
Family Income Brackets in Cuyahoga Falls
According to the Cuyahoga Falls family income data, there are 2,916 families falling into the $100,000 to $149,999 income range, which is the most common income bracket and makes up 22.8% of all families. Conversely, the $10,000 to $14,999 income bracket is the least frequent group with only 102 families (0.8%) belonging to this category.
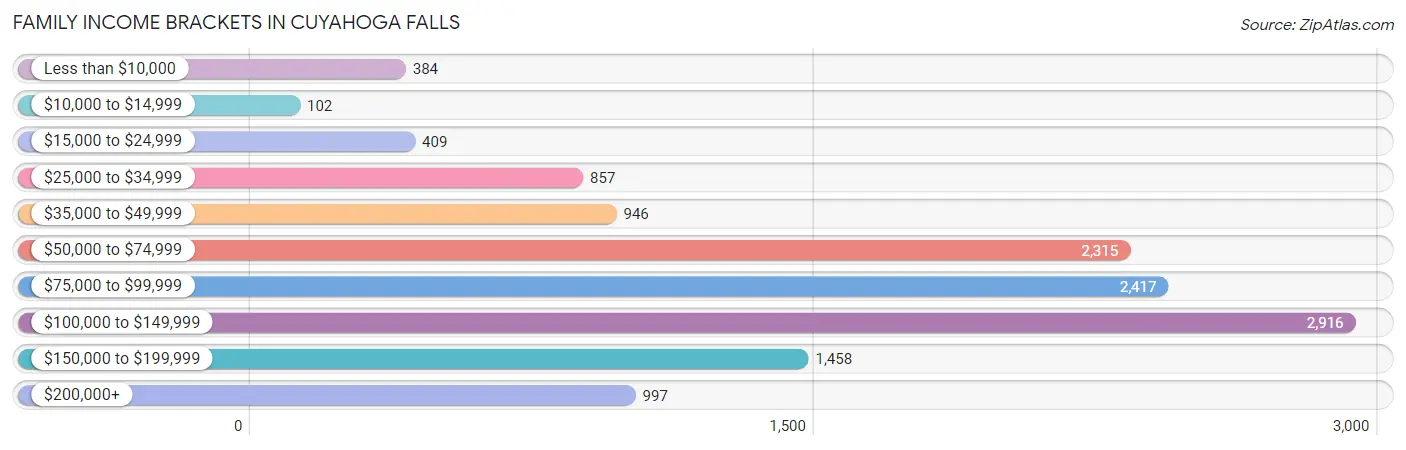
| Income Bracket | # Families | % Families |
| Less than $10,000 | 384 | 3.0% |
| $10,000 to $14,999 | 102 | 0.8% |
| $15,000 to $24,999 | 409 | 3.2% |
| $25,000 to $34,999 | 857 | 6.7% |
| $35,000 to $49,999 | 946 | 7.4% |
| $50,000 to $74,999 | 2,315 | 18.1% |
| $75,000 to $99,999 | 2,417 | 18.9% |
| $100,000 to $149,999 | 2,916 | 22.8% |
| $150,000 to $199,999 | 1,458 | 11.4% |
| $200,000+ | 997 | 7.8% |
Family Income by Famaliy Size in Cuyahoga Falls
6-person families (236 | 1.8%) account for the highest median family income in Cuyahoga Falls with $184,500 per family, while 2-person families (6,902 | 54.0%) have the highest median income of $42,025 per family member.
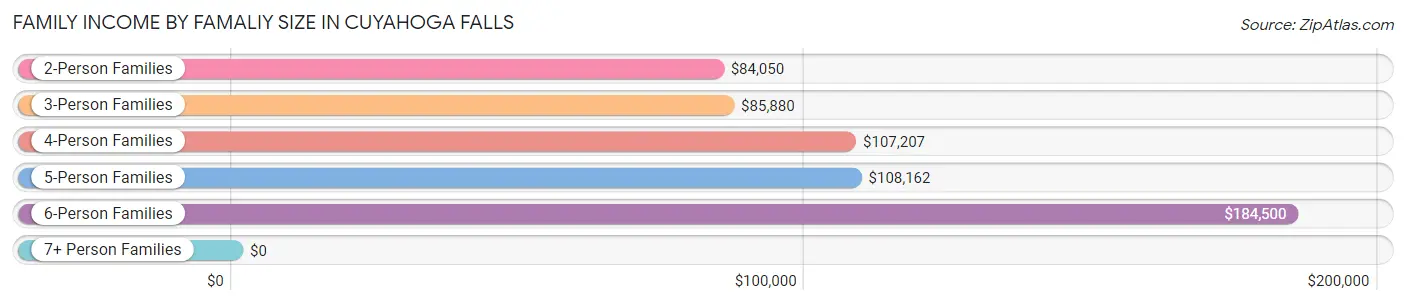
| Income Bracket | # Families | Median Income |
| 2-Person Families | 6,902 (54.0%) | $84,050 |
| 3-Person Families | 2,666 (20.8%) | $85,880 |
| 4-Person Families | 2,069 (16.2%) | $107,207 |
| 5-Person Families | 819 (6.4%) | $108,162 |
| 6-Person Families | 236 (1.8%) | $184,500 |
| 7+ Person Families | 96 (0.7%) | $0 |
| Total | 12,788 (100.0%) | $88,827 |
Family Income by Number of Earners in Cuyahoga Falls
The median family income in Cuyahoga Falls is $88,827, with families comprising 3+ earners (1,308) having the highest median family income of $143,100, while families with no earners (1,695) have the lowest median family income of $56,163, accounting for 10.2% and 13.3% of families, respectively.
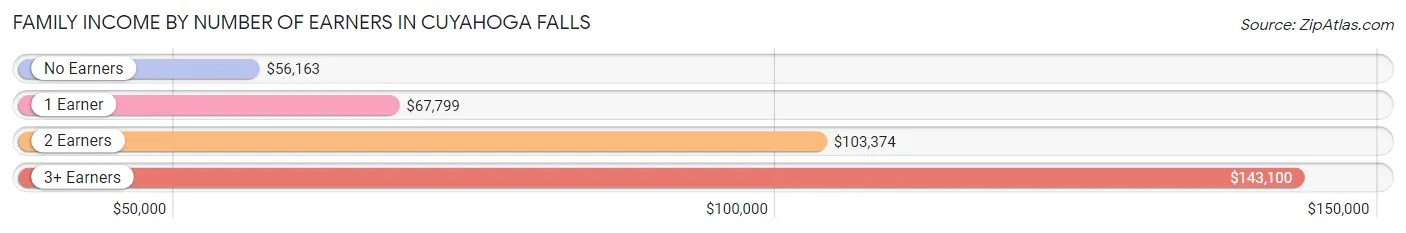
| Number of Earners | # Families | Median Income |
| No Earners | 1,695 (13.3%) | $56,163 |
| 1 Earner | 3,804 (29.7%) | $67,799 |
| 2 Earners | 5,981 (46.8%) | $103,374 |
| 3+ Earners | 1,308 (10.2%) | $143,100 |
| Total | 12,788 (100.0%) | $88,827 |
Household Income in Cuyahoga Falls
Household Income Brackets in Cuyahoga Falls
With 4,653 households falling in the category, the $50,000 to $74,999 income range is the most frequent in Cuyahoga Falls, accounting for 20.1% of all households. In contrast, only 856 households (3.7%) fall into the $10,000 to $14,999 income bracket, making it the least populous group.
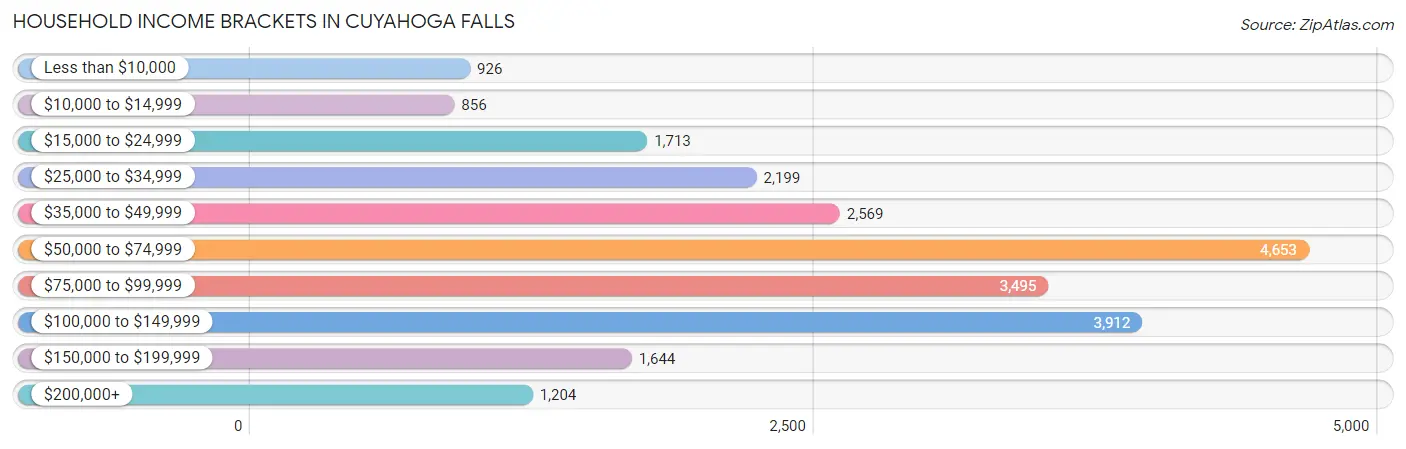
| Income Bracket | # Households | % Households |
| Less than $10,000 | 926 | 4.0% |
| $10,000 to $14,999 | 856 | 3.7% |
| $15,000 to $24,999 | 1,713 | 7.4% |
| $25,000 to $34,999 | 2,199 | 9.5% |
| $35,000 to $49,999 | 2,569 | 11.1% |
| $50,000 to $74,999 | 4,653 | 20.1% |
| $75,000 to $99,999 | 3,495 | 15.1% |
| $100,000 to $149,999 | 3,912 | 16.9% |
| $150,000 to $199,999 | 1,644 | 7.1% |
| $200,000+ | 1,204 | 5.2% |
Household Income by Householder Age in Cuyahoga Falls
The median household income in Cuyahoga Falls is $67,922, with the highest median household income of $87,794 found in the 45 to 64 years age bracket for the primary householder. A total of 7,299 households (31.5%) fall into this category. Meanwhile, the 65+ years age bracket for the primary householder has the lowest median household income of $45,146, with 6,014 households (26.0%) in this group.
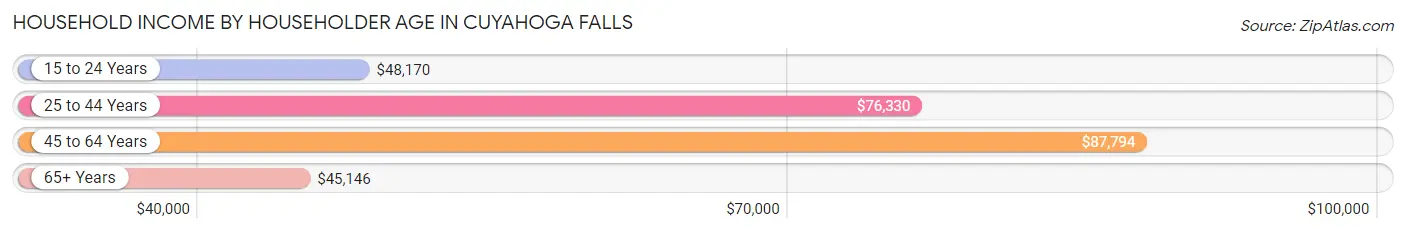
| Income Bracket | # Households | Median Income |
| 15 to 24 Years | 1,463 (6.3%) | $48,170 |
| 25 to 44 Years | 8,372 (36.2%) | $76,330 |
| 45 to 64 Years | 7,299 (31.5%) | $87,794 |
| 65+ Years | 6,014 (26.0%) | $45,146 |
| Total | 23,148 (100.0%) | $67,922 |
Poverty in Cuyahoga Falls
Income Below Poverty by Sex and Age in Cuyahoga Falls
With 8.3% poverty level for males and 10.6% for females among the residents of Cuyahoga Falls, 5 year old males and 16 and 17 year old females are the most vulnerable to poverty, with 40 males (24.4%) and 107 females (17.3%) in their respective age groups living below the poverty level.
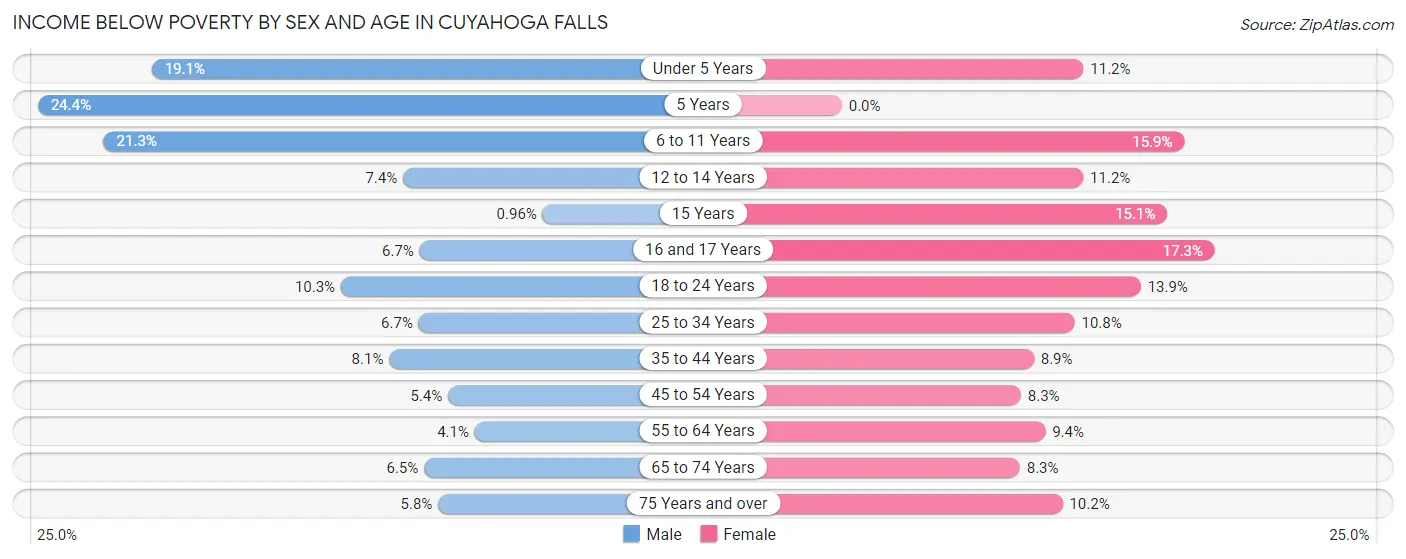
| Age Bracket | Male | Female |
| Under 5 Years | 262 (19.1%) | 171 (11.2%) |
| 5 Years | 40 (24.4%) | 0 (0.0%) |
| 6 to 11 Years | 315 (21.3%) | 278 (15.9%) |
| 12 to 14 Years | 48 (7.4%) | 54 (11.2%) |
| 15 Years | 2 (1.0%) | 29 (15.1%) |
| 16 and 17 Years | 34 (6.7%) | 107 (17.3%) |
| 18 to 24 Years | 212 (10.3%) | 345 (13.9%) |
| 25 to 34 Years | 309 (6.7%) | 545 (10.8%) |
| 35 to 44 Years | 261 (8.1%) | 270 (8.9%) |
| 45 to 54 Years | 154 (5.3%) | 218 (8.3%) |
| 55 to 64 Years | 136 (4.1%) | 313 (9.4%) |
| 65 to 74 Years | 161 (6.5%) | 217 (8.3%) |
| 75 Years and over | 74 (5.8%) | 225 (10.2%) |
| Total | 2,008 (8.3%) | 2,772 (10.6%) |
Income Above Poverty by Sex and Age in Cuyahoga Falls
According to the poverty statistics in Cuyahoga Falls, males aged 15 years and females aged 5 years are the age groups that are most secure financially, with 99.0% of males and 100.0% of females in these age groups living above the poverty line.
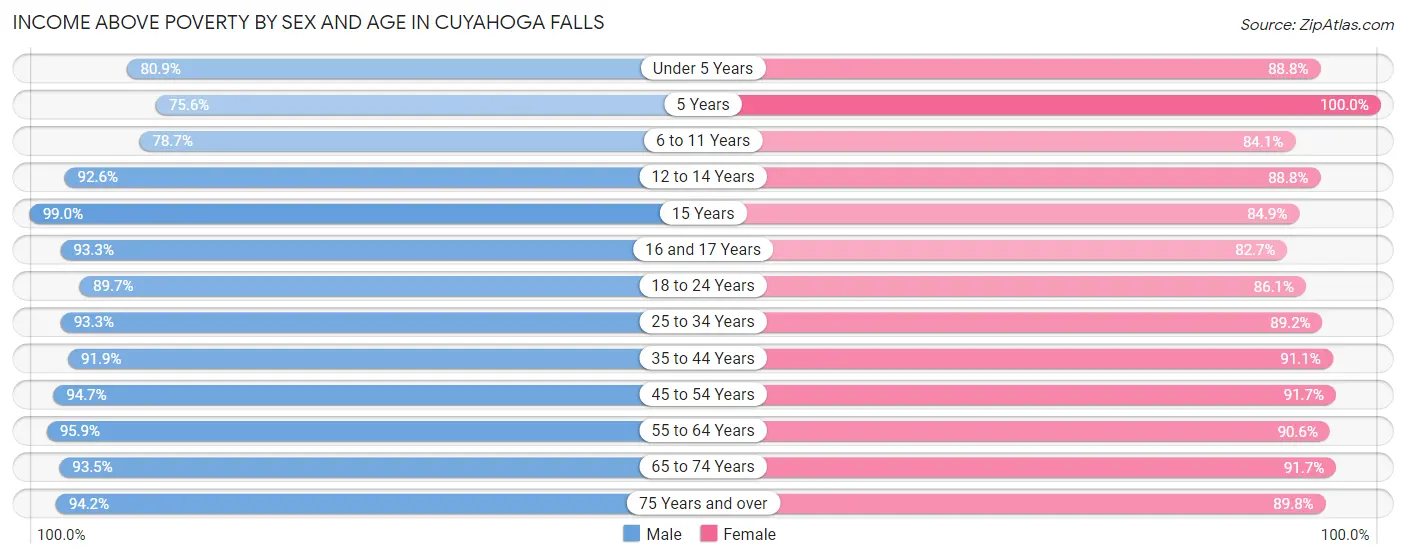
| Age Bracket | Male | Female |
| Under 5 Years | 1,110 (80.9%) | 1,355 (88.8%) |
| 5 Years | 124 (75.6%) | 161 (100.0%) |
| 6 to 11 Years | 1,162 (78.7%) | 1,471 (84.1%) |
| 12 to 14 Years | 597 (92.6%) | 428 (88.8%) |
| 15 Years | 207 (99.0%) | 163 (84.9%) |
| 16 and 17 Years | 476 (93.3%) | 511 (82.7%) |
| 18 to 24 Years | 1,842 (89.7%) | 2,143 (86.1%) |
| 25 to 34 Years | 4,295 (93.3%) | 4,500 (89.2%) |
| 35 to 44 Years | 2,970 (91.9%) | 2,762 (91.1%) |
| 45 to 54 Years | 2,725 (94.7%) | 2,406 (91.7%) |
| 55 to 64 Years | 3,170 (95.9%) | 3,001 (90.6%) |
| 65 to 74 Years | 2,333 (93.5%) | 2,410 (91.7%) |
| 75 Years and over | 1,199 (94.2%) | 1,972 (89.8%) |
| Total | 22,210 (91.7%) | 23,283 (89.4%) |
Income Below Poverty Among Married-Couple Families in Cuyahoga Falls
The poverty statistics for married-couple families in Cuyahoga Falls show that 3.4% or 335 of the total 9,920 families live below the poverty line. Families with 5 or more children have the highest poverty rate of 75.0%, comprising of 39 families. On the other hand, families with no children have the lowest poverty rate of 1.6%, which includes 102 families.
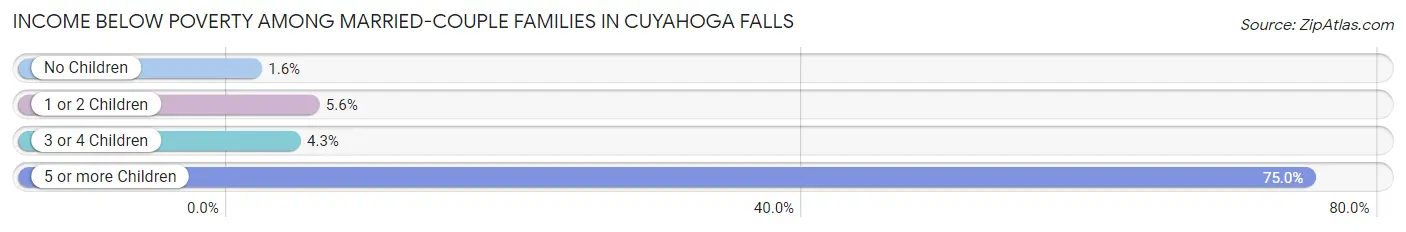
| Children | Above Poverty | Below Poverty |
| No Children | 6,186 (98.4%) | 102 (1.6%) |
| 1 or 2 Children | 2,832 (94.4%) | 169 (5.6%) |
| 3 or 4 Children | 554 (95.7%) | 25 (4.3%) |
| 5 or more Children | 13 (25.0%) | 39 (75.0%) |
| Total | 9,585 (96.6%) | 335 (3.4%) |
Income Below Poverty Among Single-Parent Households in Cuyahoga Falls
According to the poverty data in Cuyahoga Falls, 11.1% or 96 single-father households and 21.5% or 430 single-mother households are living below the poverty line. Among single-father households, those with 1 or 2 children have the highest poverty rate, with 91 households (23.0%) experiencing poverty. Likewise, among single-mother households, those with 3 or 4 children have the highest poverty rate, with 93 households (56.4%) falling below the poverty line.
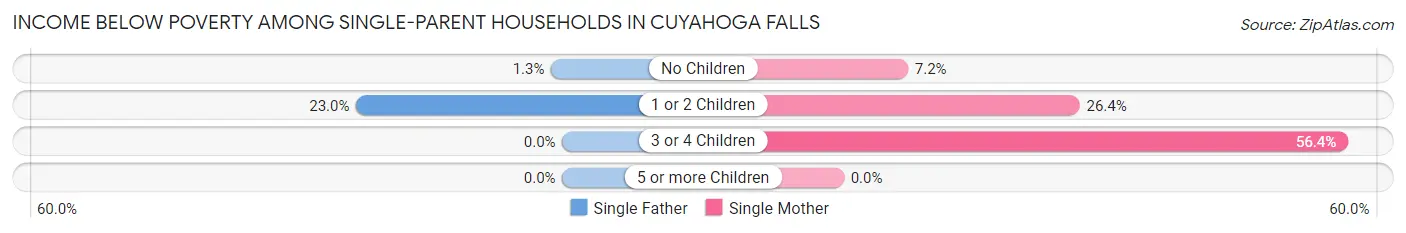
| Children | Single Father | Single Mother |
| No Children | 5 (1.3%) | 55 (7.2%) |
| 1 or 2 Children | 91 (23.0%) | 282 (26.4%) |
| 3 or 4 Children | 0 (0.0%) | 93 (56.4%) |
| 5 or more Children | 0 (0.0%) | 0 (0.0%) |
| Total | 96 (11.1%) | 430 (21.5%) |
Income Below Poverty Among Married-Couple vs Single-Parent Households in Cuyahoga Falls
The poverty data for Cuyahoga Falls shows that 335 of the married-couple family households (3.4%) and 526 of the single-parent households (18.3%) are living below the poverty level. Within the married-couple family households, those with 5 or more children have the highest poverty rate, with 39 households (75.0%) falling below the poverty line. Among the single-parent households, those with 3 or 4 children have the highest poverty rate, with 93 household (39.4%) living below poverty.
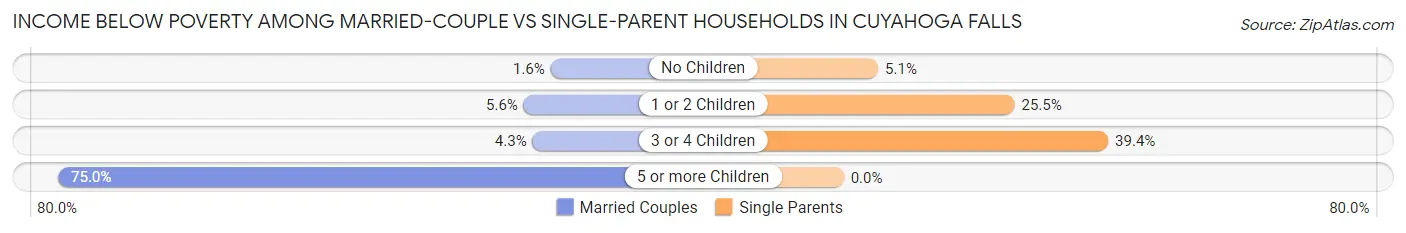
| Children | Married-Couple Families | Single-Parent Households |
| No Children | 102 (1.6%) | 60 (5.1%) |
| 1 or 2 Children | 169 (5.6%) | 373 (25.5%) |
| 3 or 4 Children | 25 (4.3%) | 93 (39.4%) |
| 5 or more Children | 39 (75.0%) | 0 (0.0%) |
| Total | 335 (3.4%) | 526 (18.3%) |
Race in Cuyahoga Falls
The most populous races in Cuyahoga Falls are White / Caucasian (42,526 | 83.5%), Asian (2,827 | 5.6%), and Black / African American (2,444 | 4.8%).
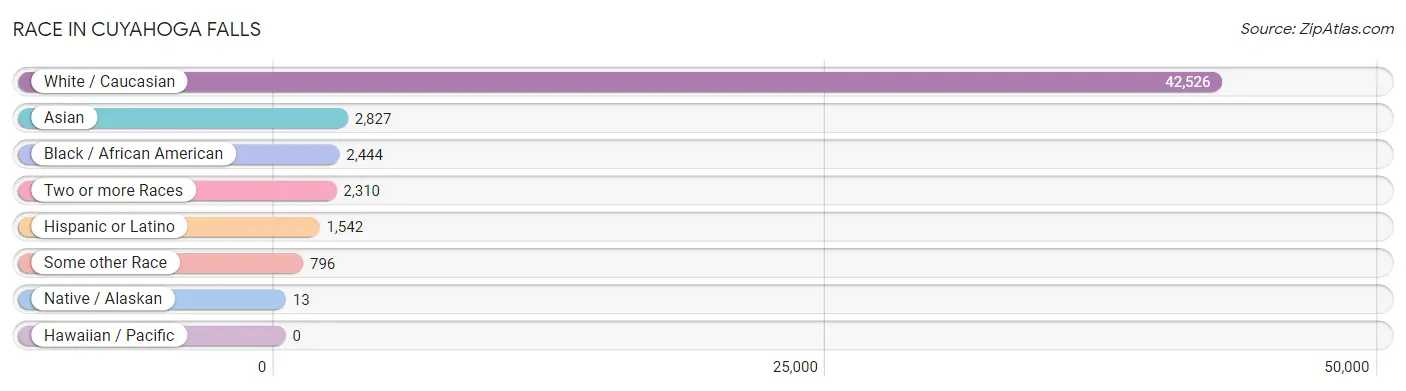
| Race | # Population | % Population |
| Asian | 2,827 | 5.6% |
| Black / African American | 2,444 | 4.8% |
| Hawaiian / Pacific | 0 | 0.0% |
| Hispanic or Latino | 1,542 | 3.0% |
| Native / Alaskan | 13 | 0.0% |
| White / Caucasian | 42,526 | 83.5% |
| Two or more Races | 2,310 | 4.5% |
| Some other Race | 796 | 1.6% |
| Total | 50,916 | 100.0% |
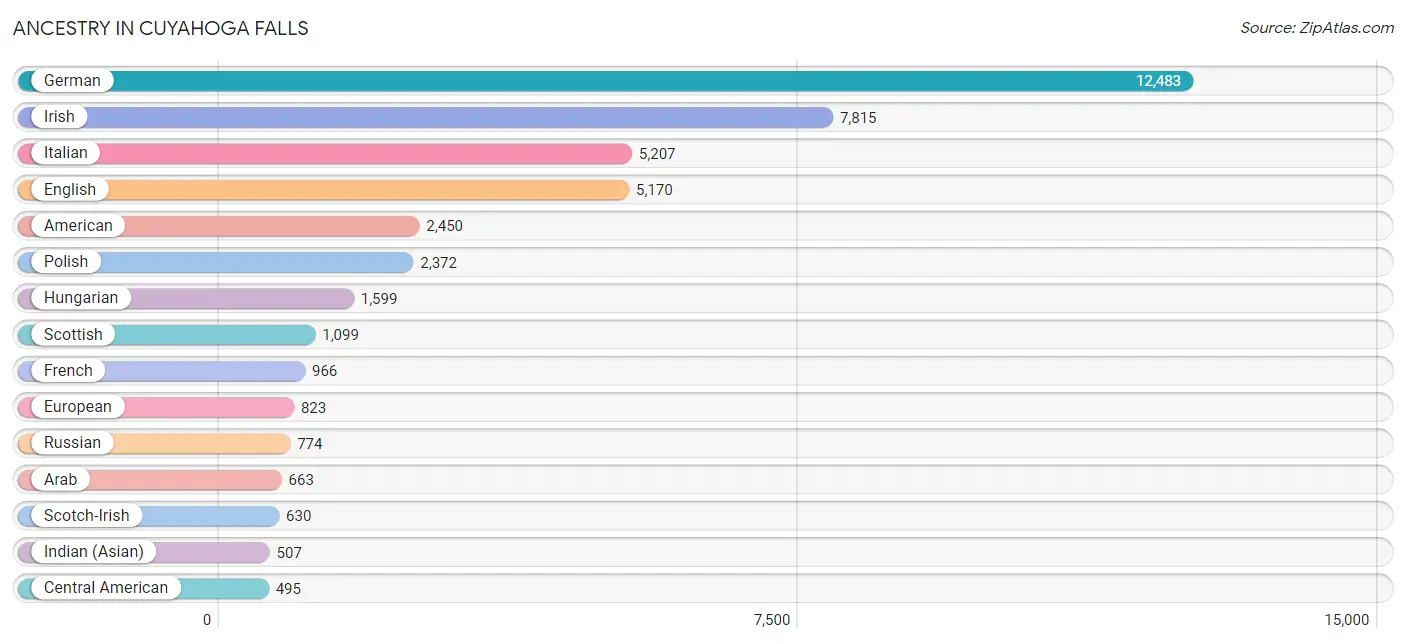
Ancestry in Cuyahoga Falls
The most populous ancestries reported in Cuyahoga Falls are German (12,483 | 24.5%), Irish (7,815 | 15.3%), Italian (5,207 | 10.2%), English (5,170 | 10.2%), and American (2,450 | 4.8%), together accounting for 65.1% of all Cuyahoga Falls residents.
| Ancestry | # Population | % Population |
| African | 122 | 0.2% |
| Alsatian | 7 | 0.0% |
| American | 2,450 | 4.8% |
| Apache | 89 | 0.2% |
| Arab | 663 | 1.3% |
| Armenian | 14 | 0.0% |
| Australian | 11 | 0.0% |
| Austrian | 193 | 0.4% |
| Belgian | 65 | 0.1% |
| Bhutanese | 24 | 0.1% |
| Blackfeet | 39 | 0.1% |
| British | 375 | 0.7% |
| Burmese | 9 | 0.0% |
| Canadian | 8 | 0.0% |
| Carpatho Rusyn | 13 | 0.0% |
| Central American | 495 | 1.0% |
| Central American Indian | 13 | 0.0% |
| Cherokee | 223 | 0.4% |
| Chilean | 57 | 0.1% |
| Colombian | 27 | 0.1% |
| Croatian | 274 | 0.5% |
| Cuban | 35 | 0.1% |
| Czech | 476 | 0.9% |
| Czechoslovakian | 125 | 0.3% |
| Danish | 61 | 0.1% |
| Dominican | 9 | 0.0% |
| Dutch | 376 | 0.7% |
| Eastern European | 94 | 0.2% |
| English | 5,170 | 10.2% |
| Ethiopian | 11 | 0.0% |
| European | 823 | 1.6% |
| Filipino | 36 | 0.1% |
| Finnish | 29 | 0.1% |
| French | 966 | 1.9% |
| French Canadian | 145 | 0.3% |
| German | 12,483 | 24.5% |
| Ghanaian | 154 | 0.3% |
| Greek | 282 | 0.5% |
| Guamanian / Chamorro | 21 | 0.0% |
| Guatemalan | 149 | 0.3% |
| Hungarian | 1,599 | 3.1% |
| Indian (Asian) | 507 | 1.0% |
| Indonesian | 22 | 0.0% |
| Iranian | 18 | 0.0% |
| Irish | 7,815 | 15.3% |
| Italian | 5,207 | 10.2% |
| Jamaican | 16 | 0.0% |
| Korean | 95 | 0.2% |
| Lebanese | 124 | 0.2% |
| Lithuanian | 92 | 0.2% |
| Macedonian | 282 | 0.5% |
| Malaysian | 28 | 0.1% |
| Mexican | 398 | 0.8% |
| Mongolian | 8 | 0.0% |
| Navajo | 7 | 0.0% |
| Nigerian | 61 | 0.1% |
| Northern European | 57 | 0.1% |
| Norwegian | 128 | 0.3% |
| Pakistani | 8 | 0.0% |
| Panamanian | 21 | 0.0% |
| Pennsylvania German | 77 | 0.2% |
| Peruvian | 16 | 0.0% |
| Polish | 2,372 | 4.7% |
| Portuguese | 128 | 0.3% |
| Puerto Rican | 479 | 0.9% |
| Romanian | 482 | 0.9% |
| Russian | 774 | 1.5% |
| Salvadoran | 325 | 0.6% |
| Scandinavian | 131 | 0.3% |
| Scotch-Irish | 630 | 1.2% |
| Scottish | 1,099 | 2.2% |
| Serbian | 158 | 0.3% |
| Slavic | 66 | 0.1% |
| Slovak | 477 | 0.9% |
| Slovene | 352 | 0.7% |
| South African | 10 | 0.0% |
| South American | 100 | 0.2% |
| Spaniard | 20 | 0.0% |
| Spanish | 6 | 0.0% |
| Sri Lankan | 71 | 0.1% |
| Subsaharan African | 358 | 0.7% |
| Swedish | 388 | 0.8% |
| Swiss | 384 | 0.7% |
| Syrian | 33 | 0.1% |
| Thai | 385 | 0.8% |
| Ukrainian | 342 | 0.7% |
| Welsh | 477 | 0.9% |
| West Indian | 13 | 0.0% |
| Yugoslavian | 104 | 0.2% | View All 89 Rows |
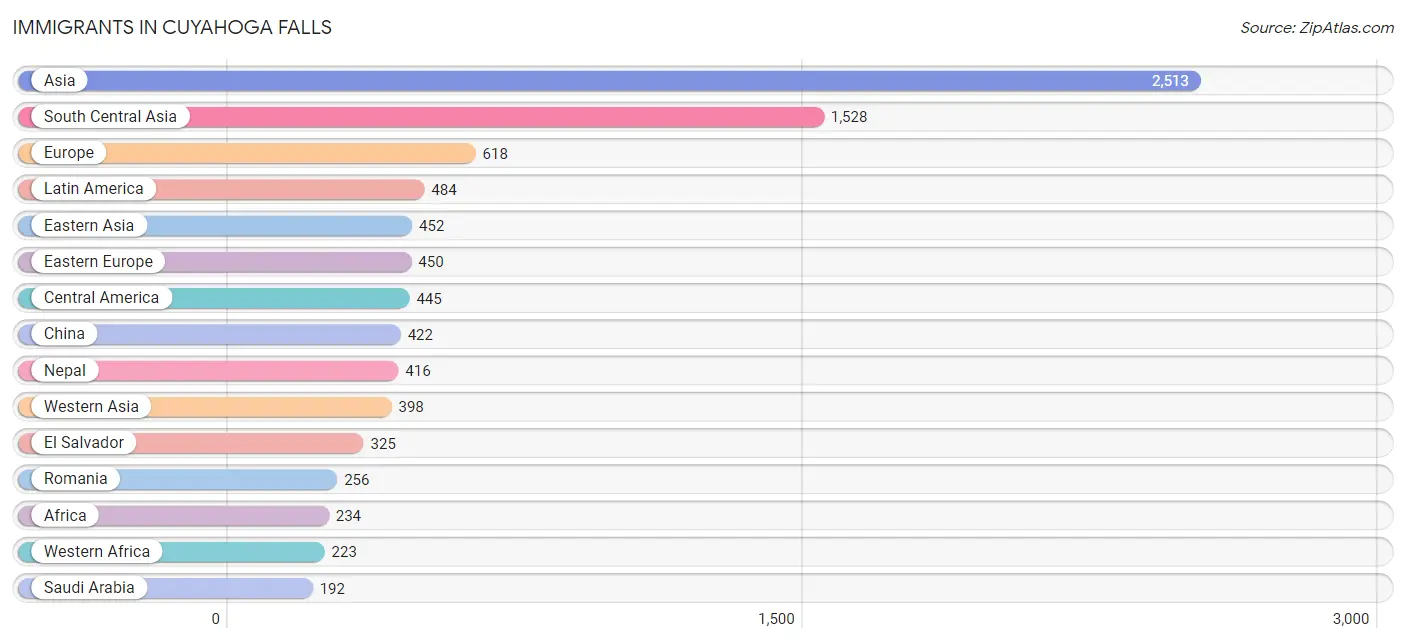
Immigrants in Cuyahoga Falls
The most numerous immigrant groups reported in Cuyahoga Falls came from Asia (2,513 | 4.9%), South Central Asia (1,528 | 3.0%), Europe (618 | 1.2%), Latin America (484 | 0.9%), and Eastern Asia (452 | 0.9%), together accounting for 11.0% of all Cuyahoga Falls residents.
| Immigration Origin | # Population | % Population |
| Africa | 234 | 0.5% |
| Asia | 2,513 | 4.9% |
| Bangladesh | 36 | 0.1% |
| Belgium | 12 | 0.0% |
| Bosnia and Herzegovina | 20 | 0.0% |
| Brazil | 11 | 0.0% |
| Canada | 30 | 0.1% |
| Caribbean | 16 | 0.0% |
| Central America | 445 | 0.9% |
| China | 422 | 0.8% |
| Colombia | 12 | 0.0% |
| Croatia | 13 | 0.0% |
| Eastern Africa | 11 | 0.0% |
| Eastern Asia | 452 | 0.9% |
| Eastern Europe | 450 | 0.9% |
| El Salvador | 325 | 0.6% |
| England | 13 | 0.0% |
| Ethiopia | 11 | 0.0% |
| Europe | 618 | 1.2% |
| Germany | 62 | 0.1% |
| Ghana | 154 | 0.3% |
| Guatemala | 54 | 0.1% |
| Hungary | 4 | 0.0% |
| India | 127 | 0.3% |
| Iran | 18 | 0.0% |
| Iraq | 27 | 0.1% |
| Ireland | 25 | 0.1% |
| Italy | 5 | 0.0% |
| Jamaica | 16 | 0.0% |
| Korea | 30 | 0.1% |
| Laos | 28 | 0.1% |
| Latin America | 484 | 0.9% |
| Liberia | 15 | 0.0% |
| Malaysia | 8 | 0.0% |
| Mexico | 45 | 0.1% |
| Nepal | 416 | 0.8% |
| Nigeria | 54 | 0.1% |
| North Macedonia | 21 | 0.0% |
| Northern Europe | 89 | 0.2% |
| Oceania | 24 | 0.1% |
| Panama | 21 | 0.0% |
| Philippines | 31 | 0.1% |
| Romania | 256 | 0.5% |
| Russia | 26 | 0.1% |
| Saudi Arabia | 192 | 0.4% |
| Scotland | 9 | 0.0% |
| Serbia | 17 | 0.0% |
| South America | 23 | 0.1% |
| South Central Asia | 1,528 | 3.0% |
| South Eastern Asia | 135 | 0.3% |
| Southern Europe | 5 | 0.0% |
| Sweden | 10 | 0.0% |
| Syria | 64 | 0.1% |
| Taiwan | 52 | 0.1% |
| Thailand | 8 | 0.0% |
| Ukraine | 34 | 0.1% |
| Uzbekistan | 157 | 0.3% |
| Vietnam | 50 | 0.1% |
| Western Africa | 223 | 0.4% |
| Western Asia | 398 | 0.8% |
| Western Europe | 74 | 0.2% |
| Yemen | 93 | 0.2% | View All 62 Rows |
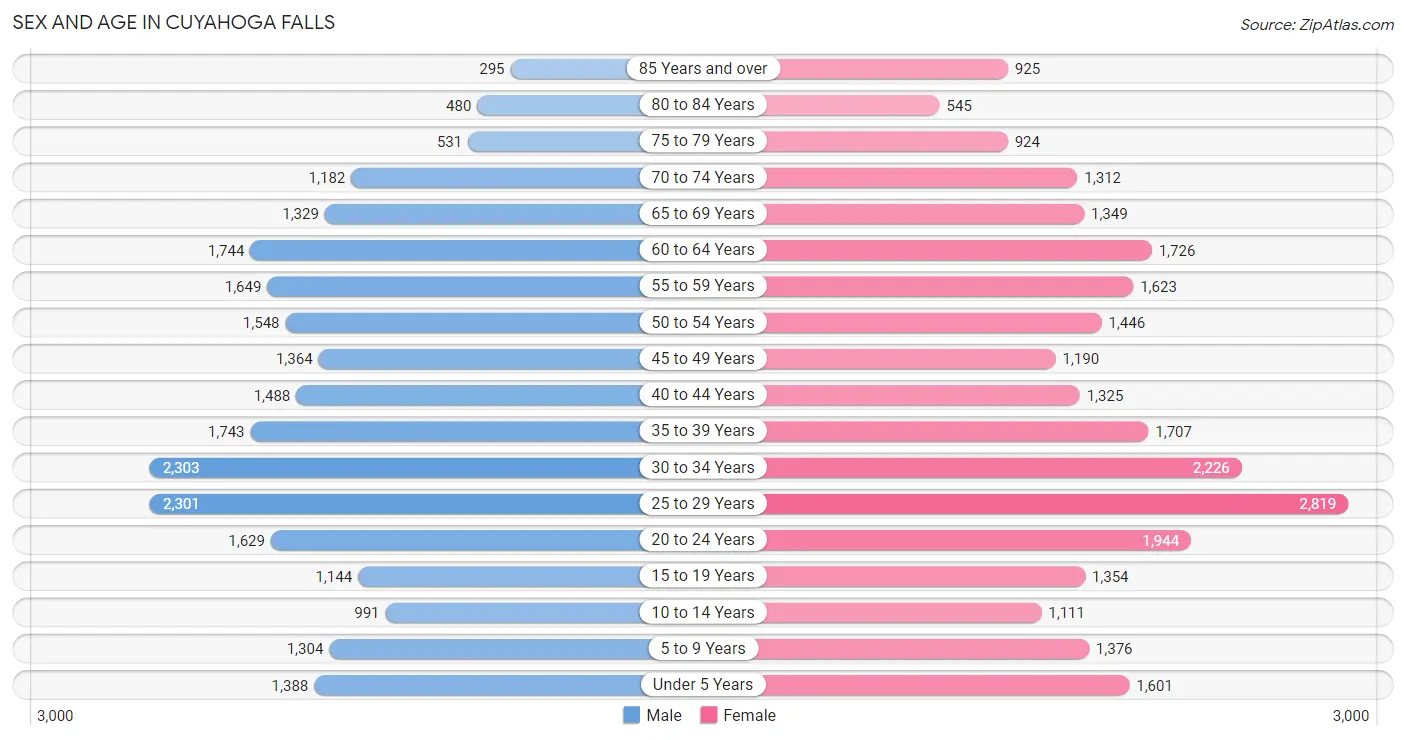
Sex and Age in Cuyahoga Falls
Sex and Age in Cuyahoga Falls
The most populous age groups in Cuyahoga Falls are 30 to 34 Years (2,303 | 9.4%) for men and 25 to 29 Years (2,819 | 10.6%) for women.
| Age Bracket | Male | Female |
| Under 5 Years | 1,388 (5.7%) | 1,601 (6.0%) |
| 5 to 9 Years | 1,304 (5.3%) | 1,376 (5.2%) |
| 10 to 14 Years | 991 (4.1%) | 1,111 (4.2%) |
| 15 to 19 Years | 1,144 (4.7%) | 1,354 (5.1%) |
| 20 to 24 Years | 1,629 (6.7%) | 1,944 (7.3%) |
| 25 to 29 Years | 2,301 (9.4%) | 2,819 (10.6%) |
| 30 to 34 Years | 2,303 (9.4%) | 2,226 (8.4%) |
| 35 to 39 Years | 1,743 (7.1%) | 1,707 (6.4%) |
| 40 to 44 Years | 1,488 (6.1%) | 1,325 (5.0%) |
| 45 to 49 Years | 1,364 (5.6%) | 1,190 (4.5%) |
| 50 to 54 Years | 1,548 (6.3%) | 1,446 (5.5%) |
| 55 to 59 Years | 1,649 (6.8%) | 1,623 (6.1%) |
| 60 to 64 Years | 1,744 (7.1%) | 1,726 (6.5%) |
| 65 to 69 Years | 1,329 (5.4%) | 1,349 (5.1%) |
| 70 to 74 Years | 1,182 (4.8%) | 1,312 (5.0%) |
| 75 to 79 Years | 531 (2.2%) | 924 (3.5%) |
| 80 to 84 Years | 480 (2.0%) | 545 (2.1%) |
| 85 Years and over | 295 (1.2%) | 925 (3.5%) |
| Total | 24,413 (100.0%) | 26,503 (100.0%) |
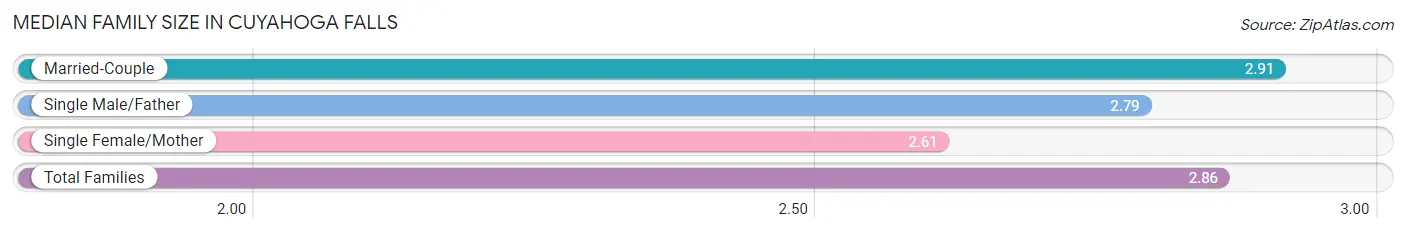
Families and Households in Cuyahoga Falls
Median Family Size in Cuyahoga Falls
The median family size in Cuyahoga Falls is 2.86 persons per family, with married-couple families (9,920 | 77.6%) accounting for the largest median family size of 2.91 persons per family. On the other hand, single female/mother families (2,002 | 15.7%) represent the smallest median family size with 2.61 persons per family.
| Family Type | # Families | Family Size |
| Married-Couple | 9,920 (77.6%) | 2.91 |
| Single Male/Father | 866 (6.8%) | 2.79 |
| Single Female/Mother | 2,002 (15.7%) | 2.61 |
| Total Families | 12,788 (100.0%) | 2.86 |
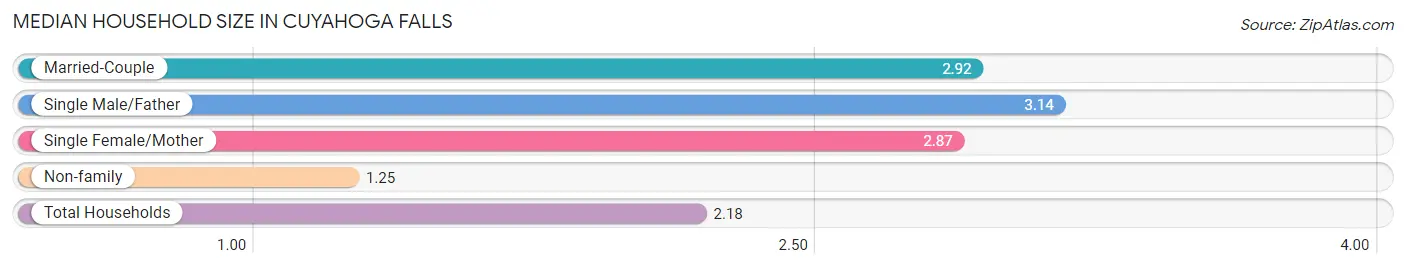
Median Household Size in Cuyahoga Falls
The median household size in Cuyahoga Falls is 2.18 persons per household, with single male/father households (866 | 3.7%) accounting for the largest median household size of 3.14 persons per household. non-family households (10,360 | 44.8%) represent the smallest median household size with 1.25 persons per household.
| Household Type | # Households | Household Size |
| Married-Couple | 9,920 (42.8%) | 2.92 |
| Single Male/Father | 866 (3.7%) | 3.14 |
| Single Female/Mother | 2,002 (8.6%) | 2.87 |
| Non-family | 10,360 (44.8%) | 1.25 |
| Total Households | 23,148 (100.0%) | 2.18 |
Household Size by Marriage Status in Cuyahoga Falls
Out of a total of 23,148 households in Cuyahoga Falls, 12,788 (55.2%) are family households, while 10,360 (44.8%) are nonfamily households. The most numerous type of family households are 2-person households, comprising 6,465, and the most common type of nonfamily households are 1-person households, comprising 8,215.
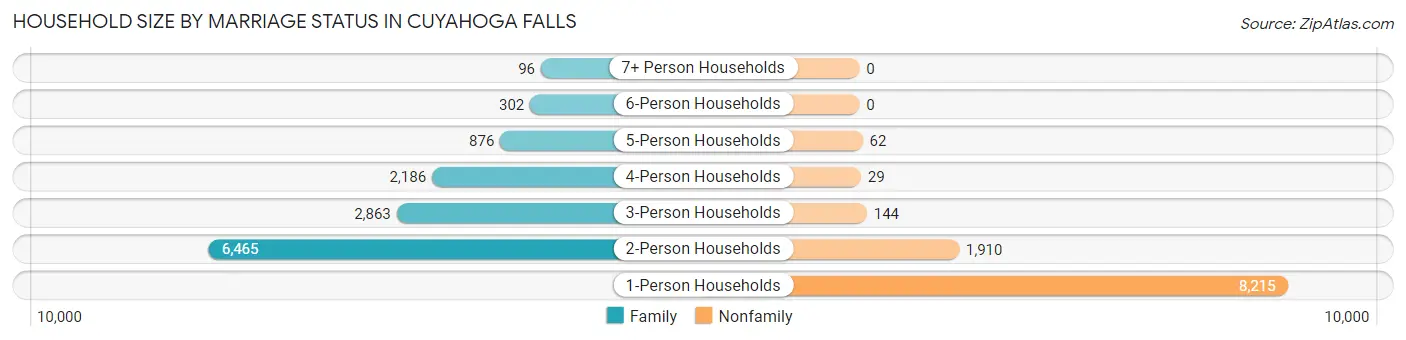
| Household Size | Family Households | Nonfamily Households |
| 1-Person Households | - | 8,215 (35.5%) |
| 2-Person Households | 6,465 (27.9%) | 1,910 (8.3%) |
| 3-Person Households | 2,863 (12.4%) | 144 (0.6%) |
| 4-Person Households | 2,186 (9.4%) | 29 (0.1%) |
| 5-Person Households | 876 (3.8%) | 62 (0.3%) |
| 6-Person Households | 302 (1.3%) | 0 (0.0%) |
| 7+ Person Households | 96 (0.4%) | 0 (0.0%) |
| Total | 12,788 (55.2%) | 10,360 (44.8%) |
Female Fertility in Cuyahoga Falls
Fertility by Age in Cuyahoga Falls
Average fertility rate in Cuyahoga Falls is 51.0 births per 1,000 women. Women in the age bracket of 20 to 34 years have the highest fertility rate with 66.0 births per 1,000 women. Women in the age bracket of 20 to 34 years acount for 70.6% of all women with births.
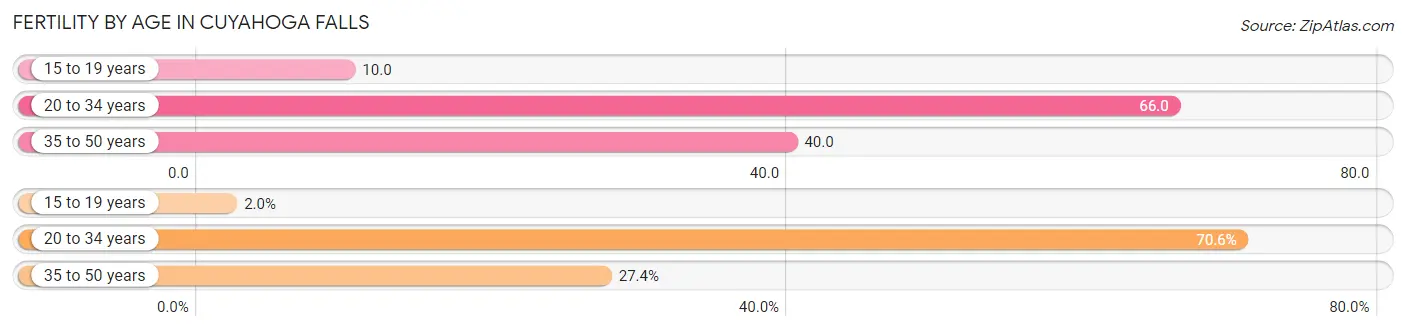
| Age Bracket | Women with Births | Births / 1,000 Women |
| 15 to 19 years | 13 (2.0%) | 10.0 |
| 20 to 34 years | 464 (70.6%) | 66.0 |
| 35 to 50 years | 180 (27.4%) | 40.0 |
| Total | 657 (100.0%) | 51.0 |
Fertility by Age by Marriage Status in Cuyahoga Falls
72.9% of women with births (657) in Cuyahoga Falls are married. The highest percentage of unmarried women with births falls into 20 to 34 years age bracket with 28.4% of them unmarried at the time of birth, while the lowest percentage of unmarried women with births belong to 15 to 19 years age bracket with 0.0% of them unmarried.
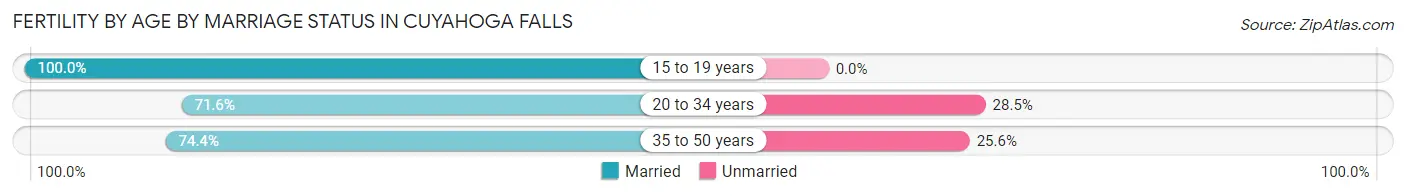
| Age Bracket | Married | Unmarried |
| 15 to 19 years | 13 (100.0%) | 0 (0.0%) |
| 20 to 34 years | 332 (71.6%) | 132 (28.4%) |
| 35 to 50 years | 134 (74.4%) | 46 (25.6%) |
| Total | 479 (72.9%) | 178 (27.1%) |
Fertility by Education in Cuyahoga Falls
Average fertility rate in Cuyahoga Falls is 51.0 births per 1,000 women. Women with the education attainment of less than high school have the highest fertility rate of 81.0 births per 1,000 women, while women with the education attainment of bachelor's degree have the lowest fertility at 39.0 births per 1,000 women. Women with the education attainment of college or associate's degree represent 26.2% of all women with births.
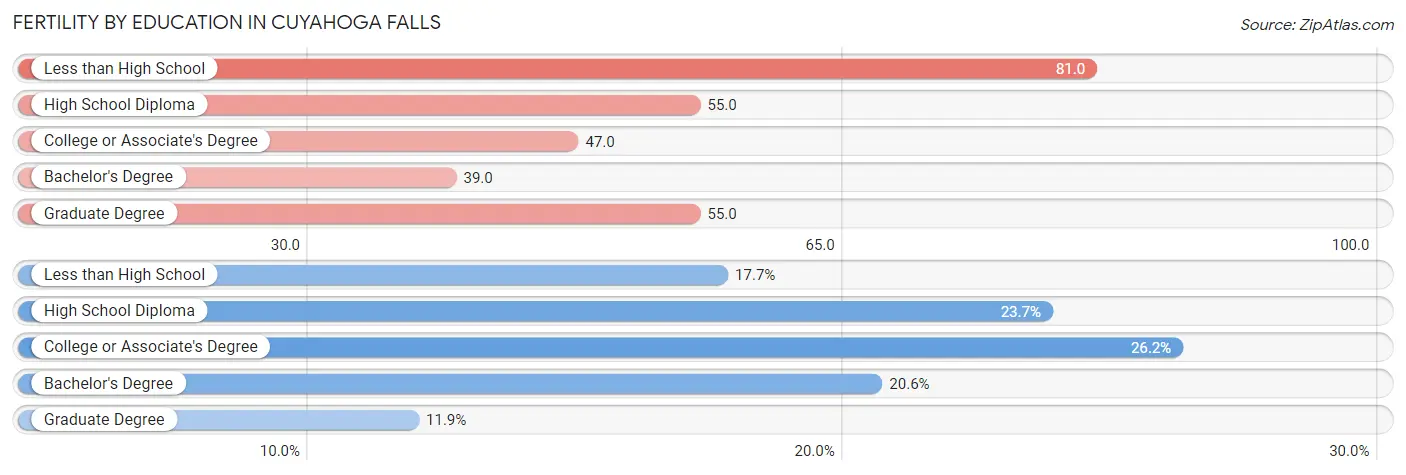
| Educational Attainment | Women with Births | Births / 1,000 Women |
| Less than High School | 116 (17.7%) | 81.0 |
| High School Diploma | 156 (23.7%) | 55.0 |
| College or Associate's Degree | 172 (26.2%) | 47.0 |
| Bachelor's Degree | 135 (20.5%) | 39.0 |
| Graduate Degree | 78 (11.9%) | 55.0 |
| Total | 657 (100.0%) | 51.0 |
Fertility by Education by Marriage Status in Cuyahoga Falls
27.1% of women with births in Cuyahoga Falls are unmarried. Women with the educational attainment of bachelor's degree are most likely to be married with 95.6% of them married at childbirth, while women with the educational attainment of high school diploma are least likely to be married with 42.9% of them unmarried at childbirth.
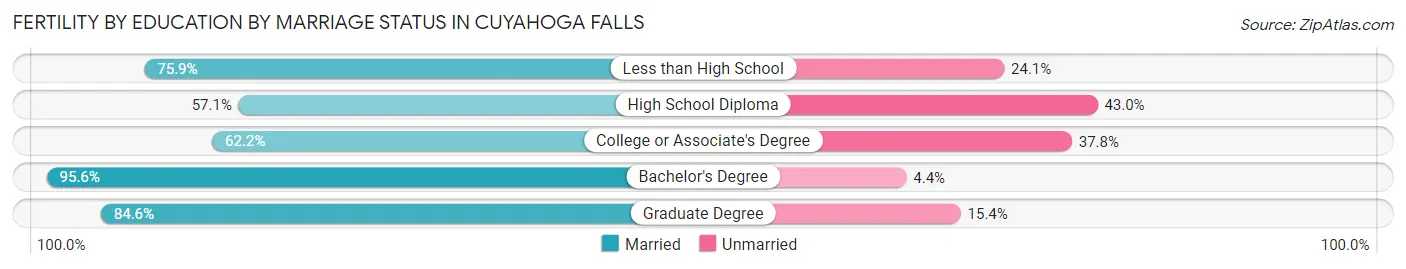
| Educational Attainment | Married | Unmarried |
| Less than High School | 88 (75.9%) | 28 (24.1%) |
| High School Diploma | 89 (57.1%) | 67 (42.9%) |
| College or Associate's Degree | 107 (62.2%) | 65 (37.8%) |
| Bachelor's Degree | 129 (95.6%) | 6 (4.4%) |
| Graduate Degree | 66 (84.6%) | 12 (15.4%) |
| Total | 479 (72.9%) | 178 (27.1%) |
Employment Characteristics in Cuyahoga Falls
Employment by Class of Employer in Cuyahoga Falls
Among the 27,587 employed individuals in Cuyahoga Falls, private company employees (19,835 | 71.9%), not-for-profit organizations (2,807 | 10.2%), and self-employed (not incorporated) (1,549 | 5.6%) make up the most common classes of employment.
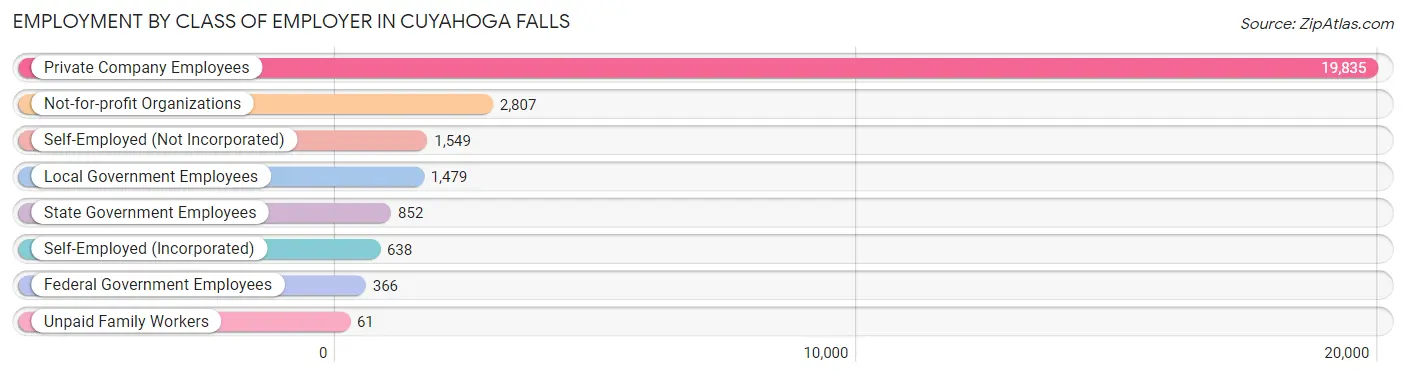
| Employer Class | # Employees | % Employees |
| Private Company Employees | 19,835 | 71.9% |
| Self-Employed (Incorporated) | 638 | 2.3% |
| Self-Employed (Not Incorporated) | 1,549 | 5.6% |
| Not-for-profit Organizations | 2,807 | 10.2% |
| Local Government Employees | 1,479 | 5.4% |
| State Government Employees | 852 | 3.1% |
| Federal Government Employees | 366 | 1.3% |
| Unpaid Family Workers | 61 | 0.2% |
| Total | 27,587 | 100.0% |
Employment Status by Age in Cuyahoga Falls
According to the labor force statistics for Cuyahoga Falls, out of the total population over 16 years of age (42,744), 69.3% or 29,622 individuals are in the labor force, with 4.4% or 1,303 of them unemployed. The age group with the highest labor force participation rate is 25 to 29 years, with 89.9% or 4,603 individuals in the labor force. Within the labor force, the 16 to 19 years age range has the highest percentage of unemployed individuals, with 18.1% or 224 of them being unemployed.
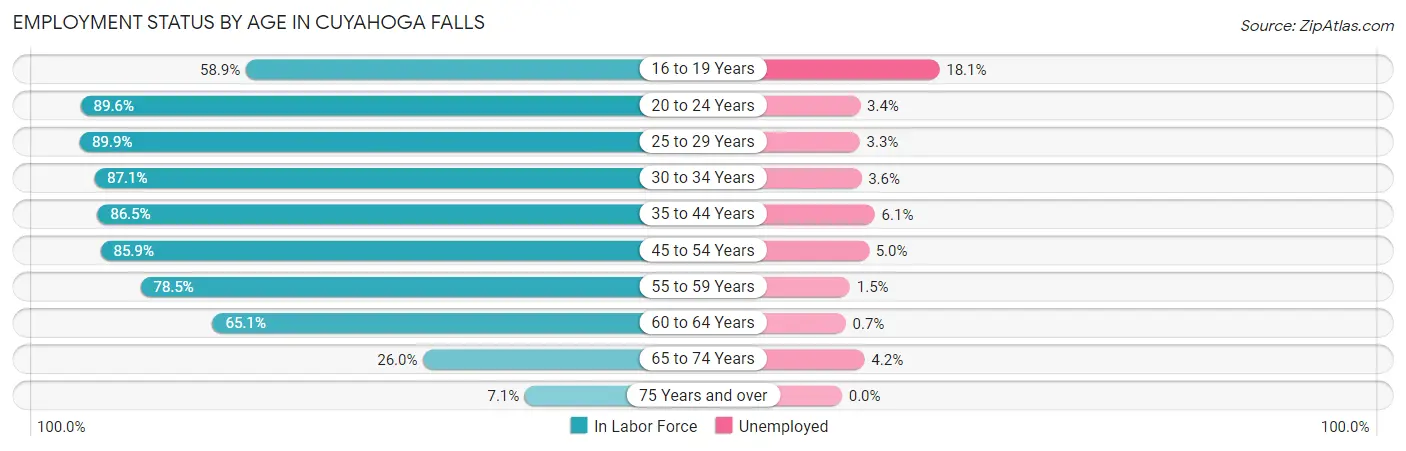
| Age Bracket | In Labor Force | Unemployed |
| 16 to 19 Years | 1,235 (58.9%) | 224 (18.1%) |
| 20 to 24 Years | 3,201 (89.6%) | 109 (3.4%) |
| 25 to 29 Years | 4,603 (89.9%) | 152 (3.3%) |
| 30 to 34 Years | 3,945 (87.1%) | 142 (3.6%) |
| 35 to 44 Years | 5,417 (86.5%) | 330 (6.1%) |
| 45 to 54 Years | 4,766 (85.9%) | 238 (5.0%) |
| 55 to 59 Years | 2,569 (78.5%) | 39 (1.5%) |
| 60 to 64 Years | 2,259 (65.1%) | 16 (0.7%) |
| 65 to 74 Years | 1,345 (26.0%) | 56 (4.2%) |
| 75 Years and over | 263 (7.1%) | 0 (0.0%) |
| Total | 29,622 (69.3%) | 1,303 (4.4%) |
Employment Status by Educational Attainment in Cuyahoga Falls
According to labor force statistics for Cuyahoga Falls, 83.5% of individuals (23,549) out of the total population between 25 and 64 years of age (28,202) are in the labor force, with 3.9% or 918 of them being unemployed. The group with the highest labor force participation rate are those with the educational attainment of bachelor's degree or higher, with 88.4% or 9,713 individuals in the labor force. Within the labor force, individuals with less than high school education have the highest percentage of unemployment, with 10.2% or 74 of them being unemployed.
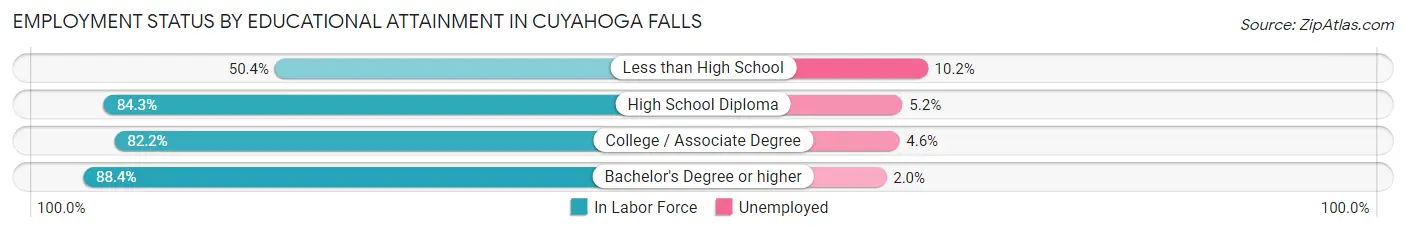
| Educational Attainment | In Labor Force | Unemployed |
| Less than High School | 727 (50.4%) | 147 (10.2%) |
| High School Diploma | 6,131 (84.3%) | 378 (5.2%) |
| College / Associate Degree | 6,986 (82.2%) | 391 (4.6%) |
| Bachelor's Degree or higher | 9,713 (88.4%) | 220 (2.0%) |
| Total | 23,549 (83.5%) | 1,100 (3.9%) |
Employment Occupations by Sex in Cuyahoga Falls
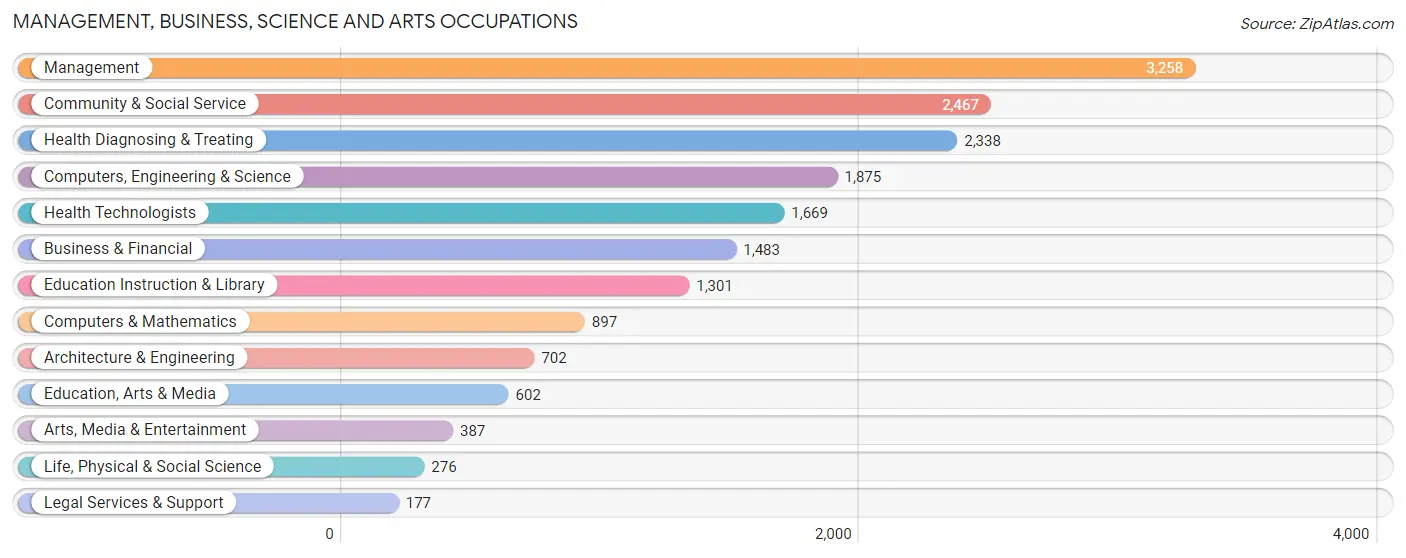
Management, Business, Science and Arts Occupations
The most common Management, Business, Science and Arts occupations in Cuyahoga Falls are Management (3,258 | 11.5%), Community & Social Service (2,467 | 8.7%), Health Diagnosing & Treating (2,338 | 8.3%), Computers, Engineering & Science (1,875 | 6.6%), and Health Technologists (1,669 | 5.9%).
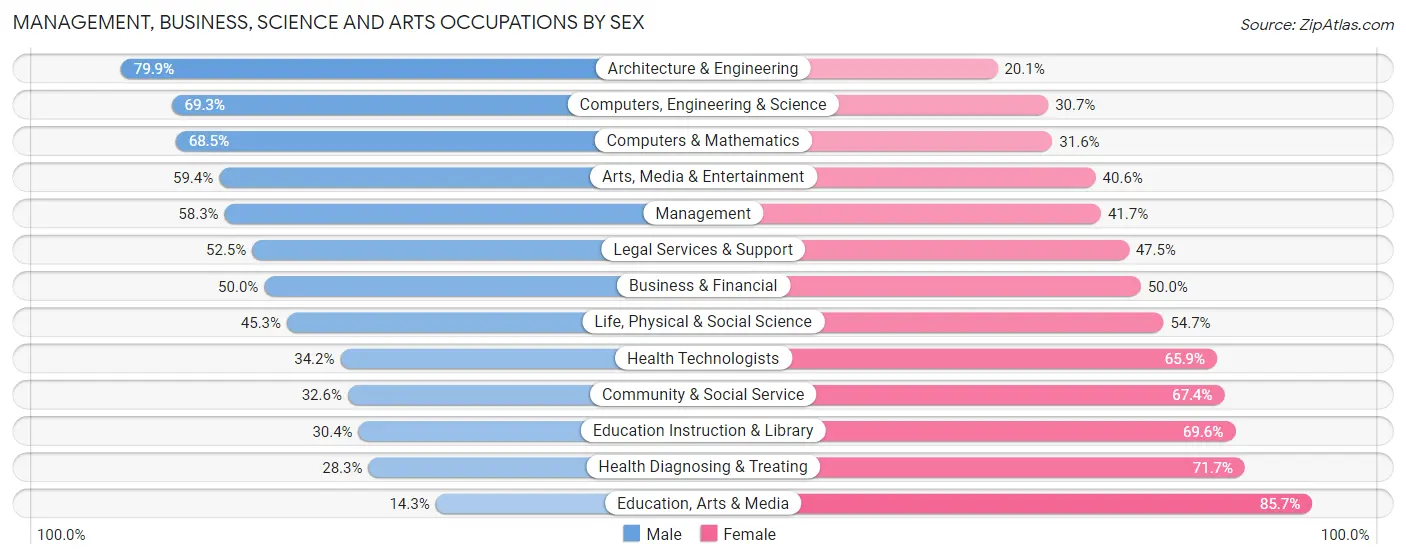
Management, Business, Science and Arts Occupations by Sex
Within the Management, Business, Science and Arts occupations in Cuyahoga Falls, the most male-oriented occupations are Architecture & Engineering (79.9%), Computers, Engineering & Science (69.3%), and Computers & Mathematics (68.4%), while the most female-oriented occupations are Education, Arts & Media (85.7%), Health Diagnosing & Treating (71.7%), and Education Instruction & Library (69.6%).
| Occupation | Male | Female |
| Management | 1,900 (58.3%) | 1,358 (41.7%) |
| Business & Financial | 742 (50.0%) | 741 (50.0%) |
| Computers, Engineering & Science | 1,300 (69.3%) | 575 (30.7%) |
| Computers & Mathematics | 614 (68.4%) | 283 (31.6%) |
| Architecture & Engineering | 561 (79.9%) | 141 (20.1%) |
| Life, Physical & Social Science | 125 (45.3%) | 151 (54.7%) |
| Community & Social Service | 804 (32.6%) | 1,663 (67.4%) |
| Education, Arts & Media | 86 (14.3%) | 516 (85.7%) |
| Legal Services & Support | 93 (52.5%) | 84 (47.5%) |
| Education Instruction & Library | 395 (30.4%) | 906 (69.6%) |
| Arts, Media & Entertainment | 230 (59.4%) | 157 (40.6%) |
| Health Diagnosing & Treating | 662 (28.3%) | 1,676 (71.7%) |
| Health Technologists | 570 (34.2%) | 1,099 (65.8%) |
| Total (Category) | 5,408 (47.3%) | 6,013 (52.6%) |
| Total (Overall) | 14,638 (51.7%) | 13,649 (48.2%) |
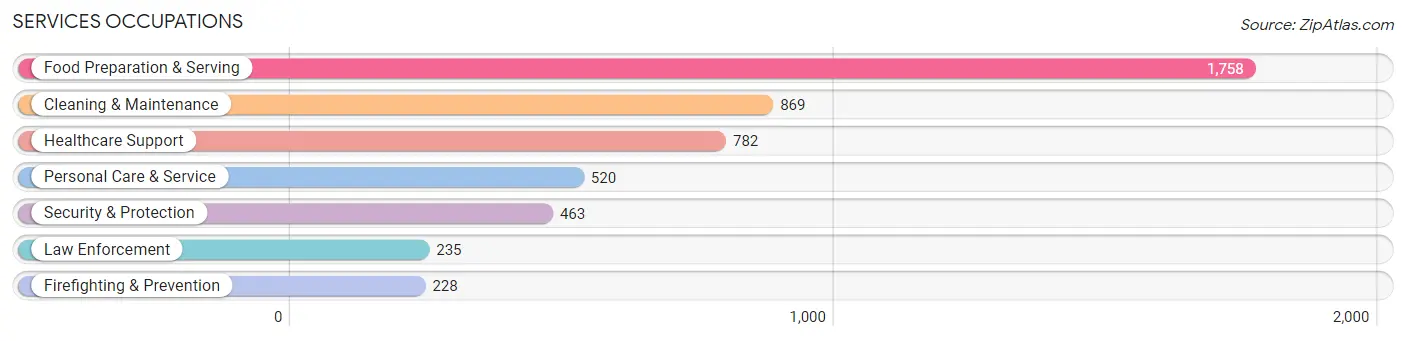
Services Occupations
The most common Services occupations in Cuyahoga Falls are Food Preparation & Serving (1,758 | 6.2%), Cleaning & Maintenance (869 | 3.1%), Healthcare Support (782 | 2.8%), Personal Care & Service (520 | 1.8%), and Security & Protection (463 | 1.6%).
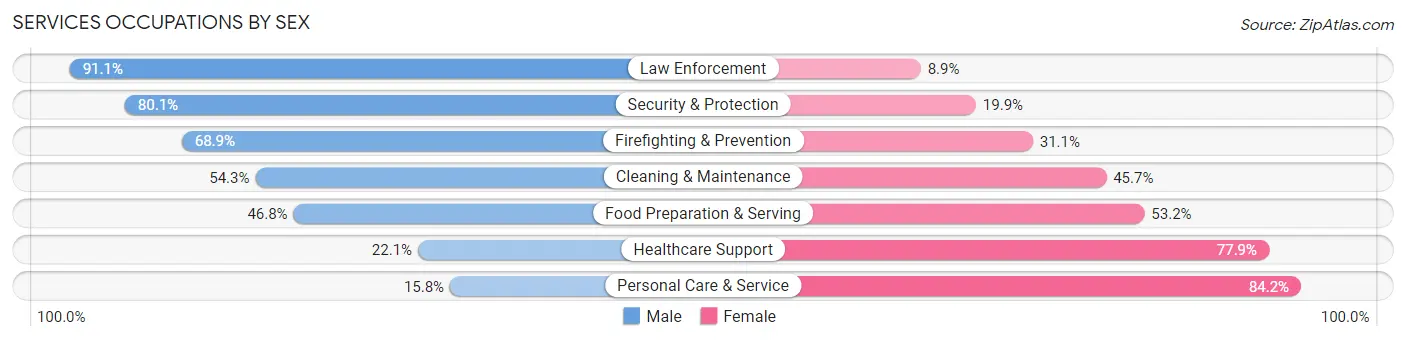
Services Occupations by Sex
Within the Services occupations in Cuyahoga Falls, the most male-oriented occupations are Law Enforcement (91.1%), Security & Protection (80.1%), and Firefighting & Prevention (68.9%), while the most female-oriented occupations are Personal Care & Service (84.2%), Healthcare Support (77.9%), and Food Preparation & Serving (53.2%).
| Occupation | Male | Female |
| Healthcare Support | 173 (22.1%) | 609 (77.9%) |
| Security & Protection | 371 (80.1%) | 92 (19.9%) |
| Firefighting & Prevention | 157 (68.9%) | 71 (31.1%) |
| Law Enforcement | 214 (91.1%) | 21 (8.9%) |
| Food Preparation & Serving | 822 (46.8%) | 936 (53.2%) |
| Cleaning & Maintenance | 472 (54.3%) | 397 (45.7%) |
| Personal Care & Service | 82 (15.8%) | 438 (84.2%) |
| Total (Category) | 1,920 (43.7%) | 2,472 (56.3%) |
| Total (Overall) | 14,638 (51.7%) | 13,649 (48.2%) |
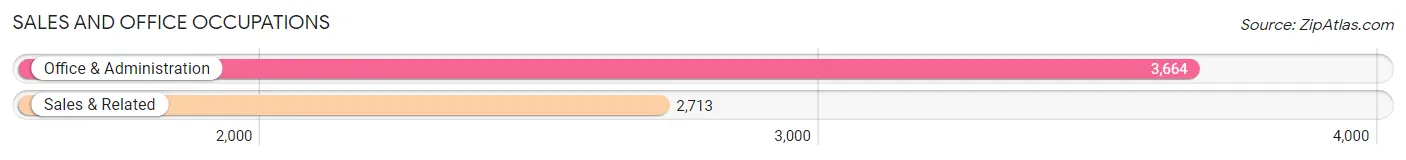
Sales and Office Occupations
The most common Sales and Office occupations in Cuyahoga Falls are Office & Administration (3,664 | 13.0%), and Sales & Related (2,713 | 9.6%).
Sales and Office Occupations by Sex
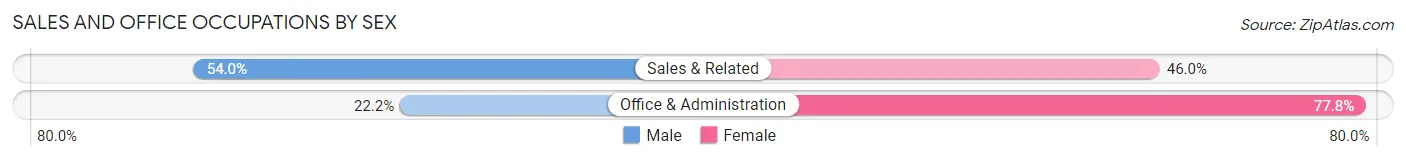
| Occupation | Male | Female |
| Sales & Related | 1,464 (54.0%) | 1,249 (46.0%) |
| Office & Administration | 815 (22.2%) | 2,849 (77.8%) |
| Total (Category) | 2,279 (35.7%) | 4,098 (64.3%) |
| Total (Overall) | 14,638 (51.7%) | 13,649 (48.2%) |
Natural Resources, Construction and Maintenance Occupations
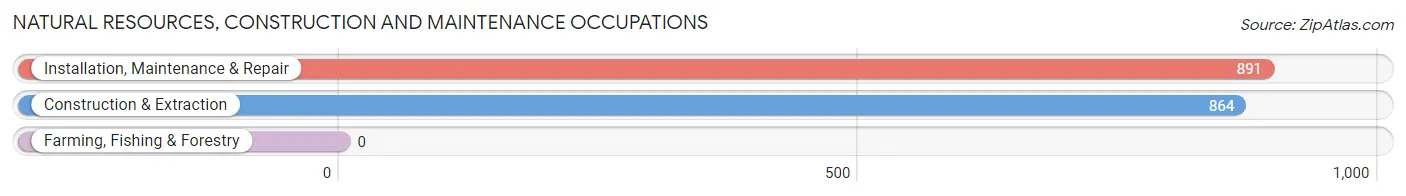
The most common Natural Resources, Construction and Maintenance occupations in Cuyahoga Falls are Installation, Maintenance & Repair (891 | 3.2%), and Construction & Extraction (864 | 3.0%).
Natural Resources, Construction and Maintenance Occupations by Sex
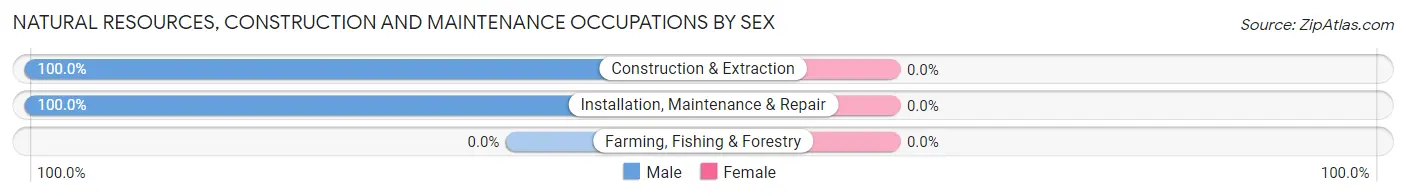
| Occupation | Male | Female |
| Farming, Fishing & Forestry | 0 (0.0%) | 0 (0.0%) |
| Construction & Extraction | 864 (100.0%) | 0 (0.0%) |
| Installation, Maintenance & Repair | 891 (100.0%) | 0 (0.0%) |
| Total (Category) | 1,755 (100.0%) | 0 (0.0%) |
| Total (Overall) | 14,638 (51.7%) | 13,649 (48.2%) |
Production, Transportation and Moving Occupations
The most common Production, Transportation and Moving occupations in Cuyahoga Falls are Production (2,154 | 7.6%), Material Moving (1,141 | 4.0%), and Transportation (1,047 | 3.7%).
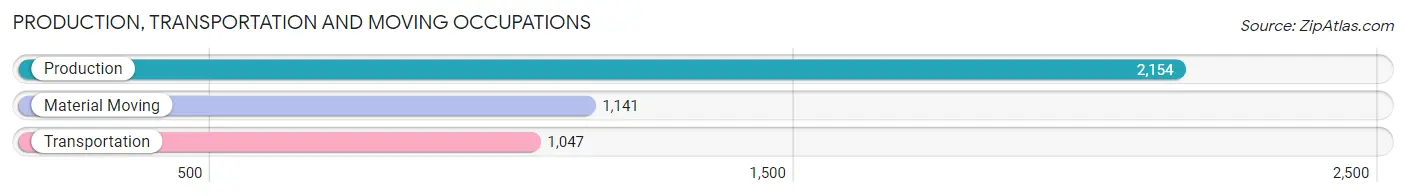
Production, Transportation and Moving Occupations by Sex
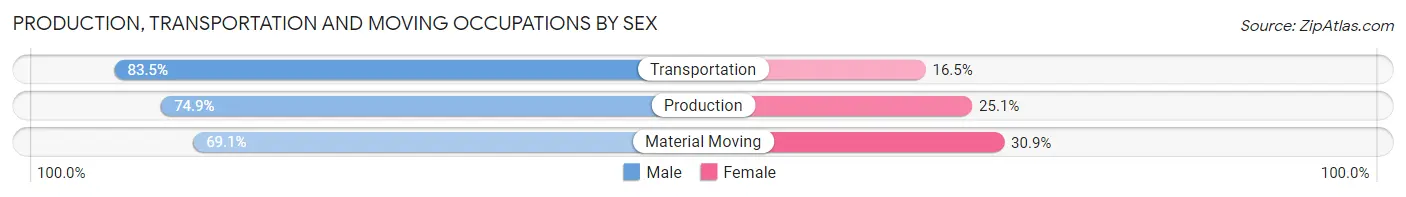
| Occupation | Male | Female |
| Production | 1,614 (74.9%) | 540 (25.1%) |
| Transportation | 874 (83.5%) | 173 (16.5%) |
| Material Moving | 788 (69.1%) | 353 (30.9%) |
| Total (Category) | 3,276 (75.4%) | 1,066 (24.5%) |
| Total (Overall) | 14,638 (51.7%) | 13,649 (48.2%) |
Employment Industries by Sex in Cuyahoga Falls
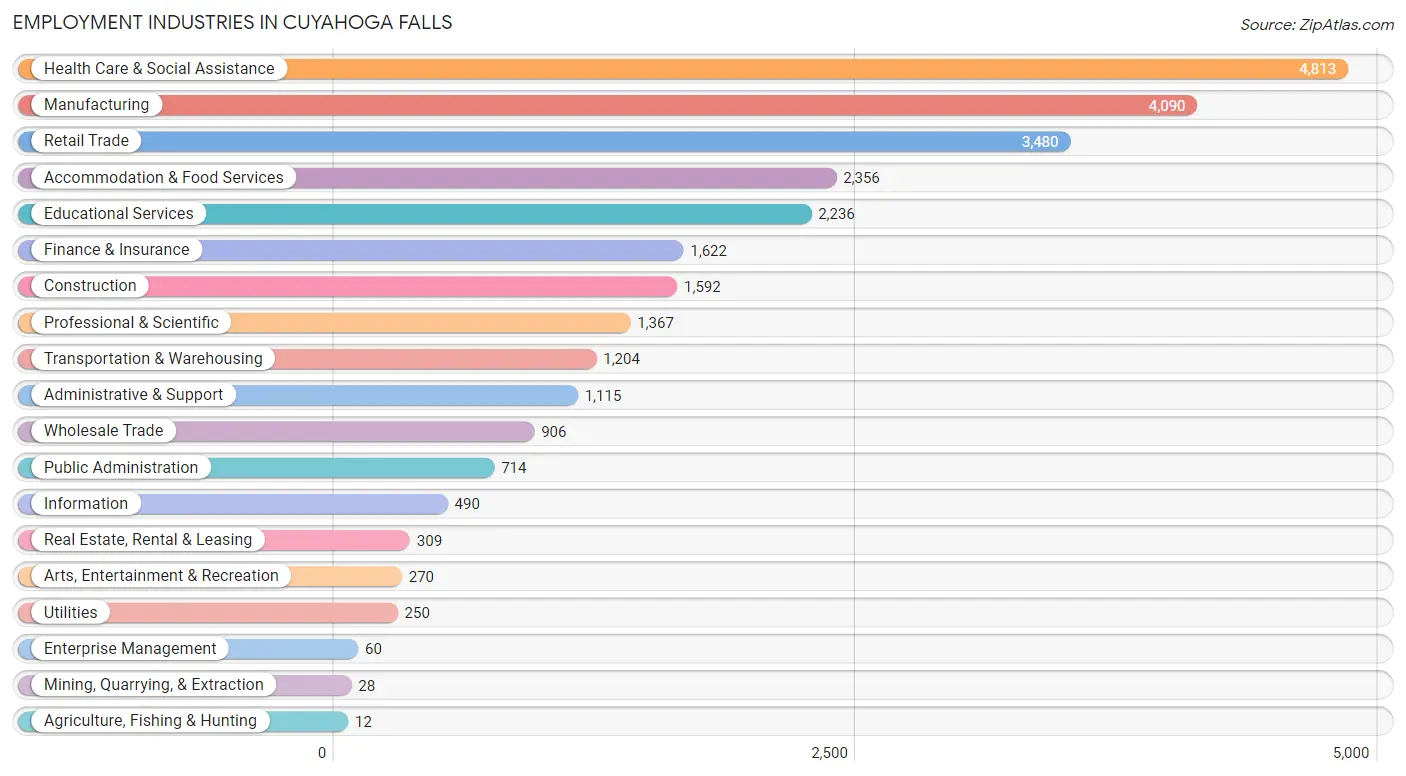
Employment Industries in Cuyahoga Falls
The major employment industries in Cuyahoga Falls include Health Care & Social Assistance (4,813 | 17.0%), Manufacturing (4,090 | 14.5%), Retail Trade (3,480 | 12.3%), Accommodation & Food Services (2,356 | 8.3%), and Educational Services (2,236 | 7.9%).
Employment Industries by Sex in Cuyahoga Falls
The Cuyahoga Falls industries that see more men than women are Agriculture, Fishing & Hunting (100.0%), Mining, Quarrying, & Extraction (100.0%), and Construction (86.4%), whereas the industries that tend to have a higher number of women are Health Care & Social Assistance (76.0%), Arts, Entertainment & Recreation (64.8%), and Educational Services (63.5%).
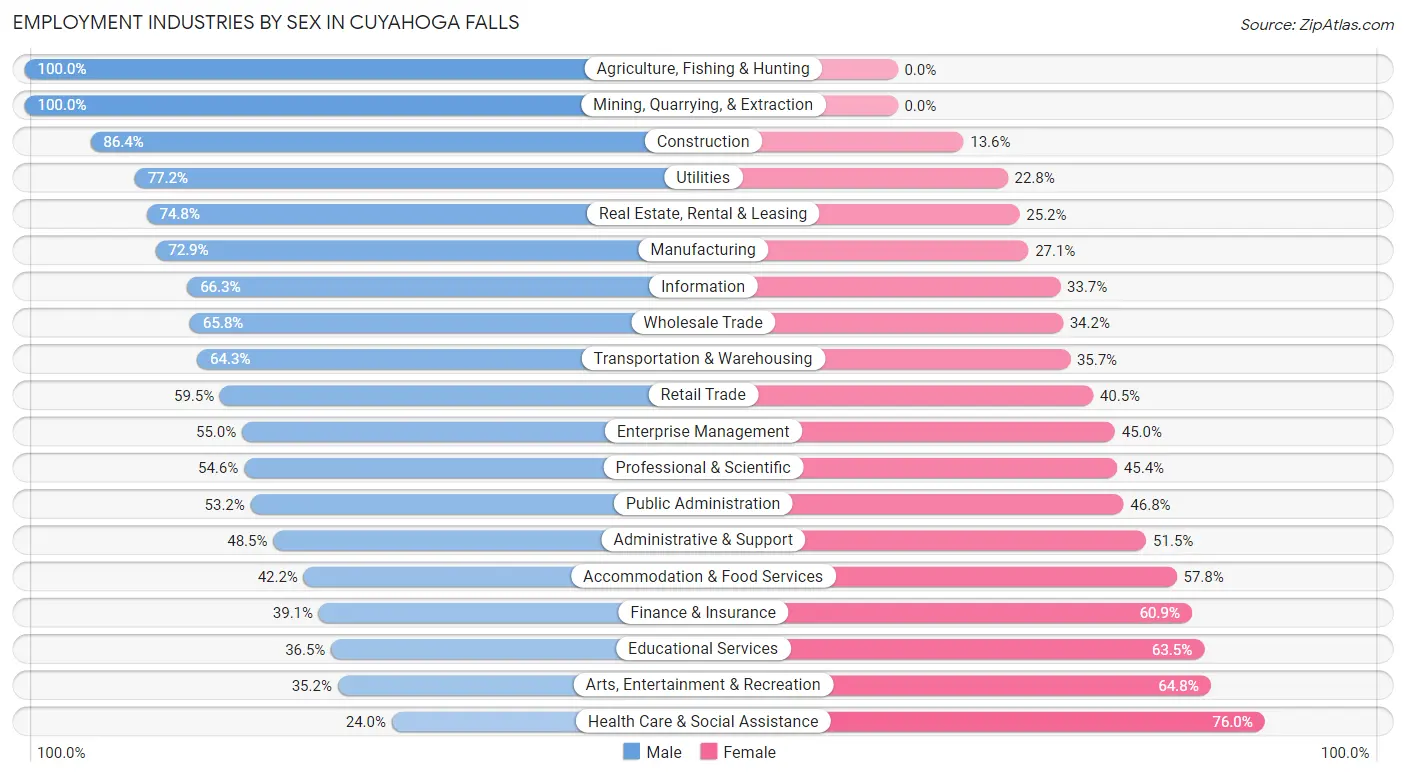
| Industry | Male | Female |
| Agriculture, Fishing & Hunting | 12 (100.0%) | 0 (0.0%) |
| Mining, Quarrying, & Extraction | 28 (100.0%) | 0 (0.0%) |
| Construction | 1,375 (86.4%) | 217 (13.6%) |
| Manufacturing | 2,983 (72.9%) | 1,107 (27.1%) |
| Wholesale Trade | 596 (65.8%) | 310 (34.2%) |
| Retail Trade | 2,072 (59.5%) | 1,408 (40.5%) |
| Transportation & Warehousing | 774 (64.3%) | 430 (35.7%) |
| Utilities | 193 (77.2%) | 57 (22.8%) |
| Information | 325 (66.3%) | 165 (33.7%) |
| Finance & Insurance | 634 (39.1%) | 988 (60.9%) |
| Real Estate, Rental & Leasing | 231 (74.8%) | 78 (25.2%) |
| Professional & Scientific | 746 (54.6%) | 621 (45.4%) |
| Enterprise Management | 33 (55.0%) | 27 (45.0%) |
| Administrative & Support | 541 (48.5%) | 574 (51.5%) |
| Educational Services | 817 (36.5%) | 1,419 (63.5%) |
| Health Care & Social Assistance | 1,155 (24.0%) | 3,658 (76.0%) |
| Arts, Entertainment & Recreation | 95 (35.2%) | 175 (64.8%) |
| Accommodation & Food Services | 995 (42.2%) | 1,361 (57.8%) |
| Public Administration | 380 (53.2%) | 334 (46.8%) |
| Total | 14,638 (51.7%) | 13,649 (48.2%) |
Education in Cuyahoga Falls
School Enrollment in Cuyahoga Falls
The most common levels of schooling among the 10,215 students in Cuyahoga Falls are college / undergraduate (2,162 | 21.2%), elementary school (2,070 | 20.3%), and high school (1,798 | 17.6%).
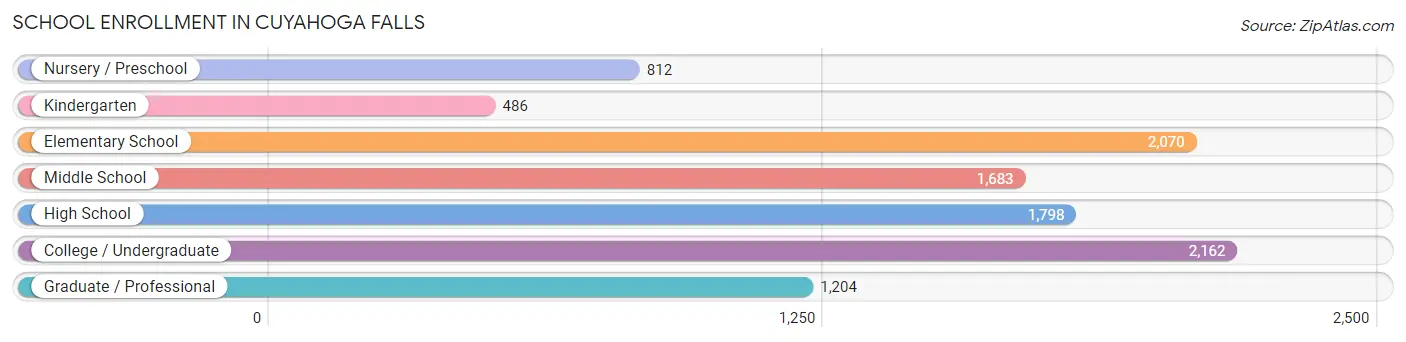
| School Level | # Students | % Students |
| Nursery / Preschool | 812 | 8.0% |
| Kindergarten | 486 | 4.8% |
| Elementary School | 2,070 | 20.3% |
| Middle School | 1,683 | 16.5% |
| High School | 1,798 | 17.6% |
| College / Undergraduate | 2,162 | 21.2% |
| Graduate / Professional | 1,204 | 11.8% |
| Total | 10,215 | 100.0% |
School Enrollment by Age by Funding Source in Cuyahoga Falls
Out of a total of 10,215 students who are enrolled in schools in Cuyahoga Falls, 2,319 (22.7%) attend a private institution, while the remaining 7,896 (77.3%) are enrolled in public schools. The age group of 3 to 4 year olds has the highest likelihood of being enrolled in private schools, with 379 (60.3% in the age bracket) enrolled. Conversely, the age group of 18 to 19 year olds has the lowest likelihood of being enrolled in a private school, with 445 (93.1% in the age bracket) attending a public institution.
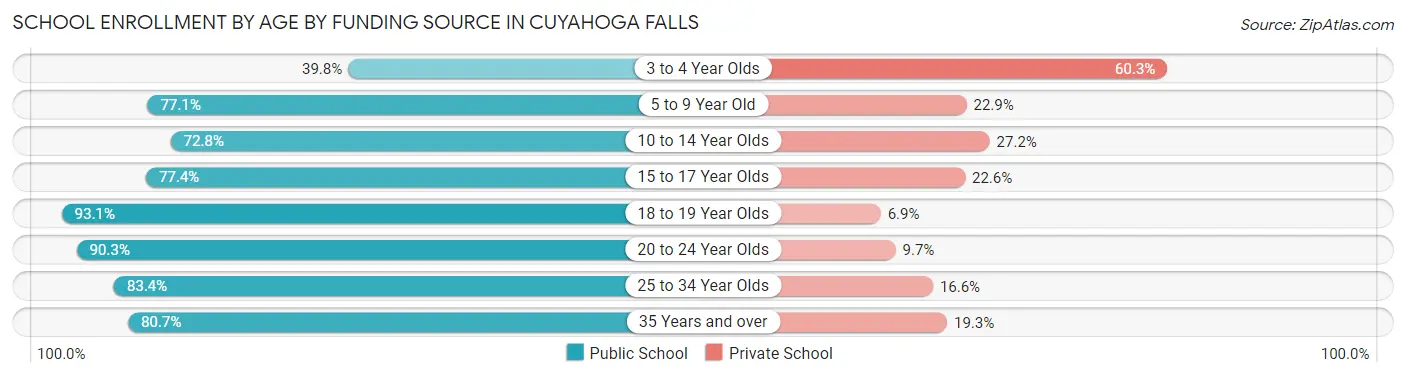
| Age Bracket | Public School | Private School |
| 3 to 4 Year Olds | 250 (39.8%) | 379 (60.3%) |
| 5 to 9 Year Old | 1,930 (77.1%) | 573 (22.9%) |
| 10 to 14 Year Olds | 1,516 (72.8%) | 566 (27.2%) |
| 15 to 17 Year Olds | 1,102 (77.4%) | 322 (22.6%) |
| 18 to 19 Year Olds | 445 (93.1%) | 33 (6.9%) |
| 20 to 24 Year Olds | 1,046 (90.3%) | 112 (9.7%) |
| 25 to 34 Year Olds | 1,233 (83.4%) | 246 (16.6%) |
| 35 Years and over | 373 (80.7%) | 89 (19.3%) |
| Total | 7,896 (77.3%) | 2,319 (22.7%) |
Educational Attainment by Field of Study in Cuyahoga Falls
Business (2,929 | 20.5%), education (2,120 | 14.8%), science & technology (1,641 | 11.5%), engineering (935 | 6.5%), and bio, nature & agricultural (904 | 6.3%) are the most common fields of study among 14,288 individuals in Cuyahoga Falls who have obtained a bachelor's degree or higher.
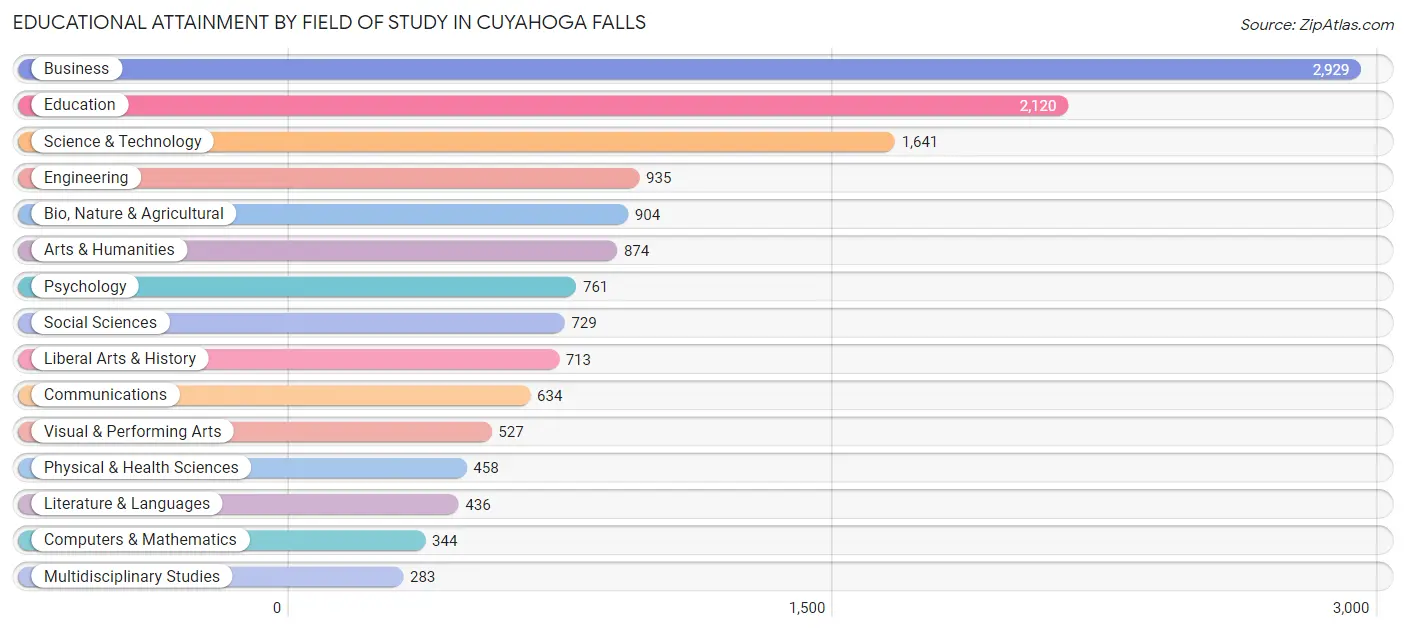
| Field of Study | # Graduates | % Graduates |
| Computers & Mathematics | 344 | 2.4% |
| Bio, Nature & Agricultural | 904 | 6.3% |
| Physical & Health Sciences | 458 | 3.2% |
| Psychology | 761 | 5.3% |
| Social Sciences | 729 | 5.1% |
| Engineering | 935 | 6.5% |
| Multidisciplinary Studies | 283 | 2.0% |
| Science & Technology | 1,641 | 11.5% |
| Business | 2,929 | 20.5% |
| Education | 2,120 | 14.8% |
| Literature & Languages | 436 | 3.0% |
| Liberal Arts & History | 713 | 5.0% |
| Visual & Performing Arts | 527 | 3.7% |
| Communications | 634 | 4.4% |
| Arts & Humanities | 874 | 6.1% |
| Total | 14,288 | 100.0% |
Transportation & Commute in Cuyahoga Falls
Vehicle Availability by Sex in Cuyahoga Falls
The most prevalent vehicle ownership categories in Cuyahoga Falls are males with 2 vehicles (7,153, accounting for 50.3%) and females with 2 vehicles (6,148, making up 53.6%).
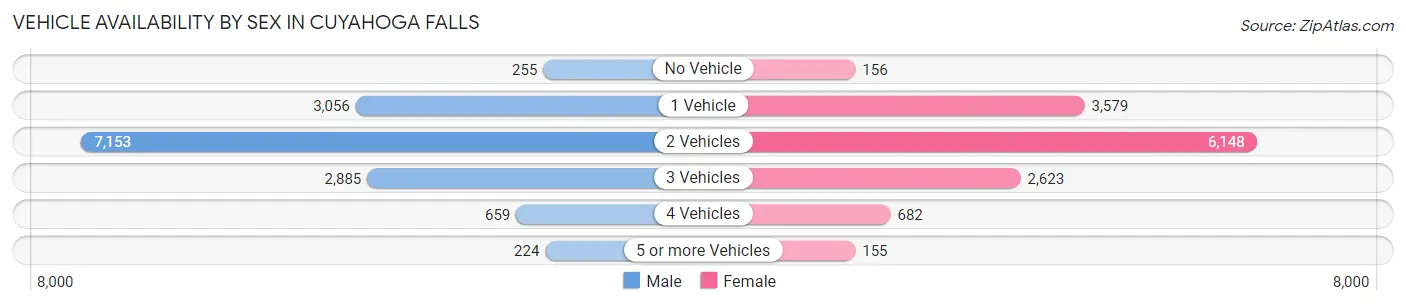
| Vehicles Available | Male | Female |
| No Vehicle | 255 (1.8%) | 156 (1.2%) |
| 1 Vehicle | 3,056 (21.5%) | 3,579 (26.8%) |
| 2 Vehicles | 7,153 (50.3%) | 6,148 (46.1%) |
| 3 Vehicles | 2,885 (20.3%) | 2,623 (19.7%) |
| 4 Vehicles | 659 (4.6%) | 682 (5.1%) |
| 5 or more Vehicles | 224 (1.6%) | 155 (1.2%) |
| Total | 14,232 (100.0%) | 13,343 (100.0%) |
Commute Time in Cuyahoga Falls
The most frequently occuring commute durations in Cuyahoga Falls are 15 to 19 minutes (4,438 commuters, 17.9%), 10 to 14 minutes (3,604 commuters, 14.5%), and 20 to 24 minutes (3,538 commuters, 14.2%).
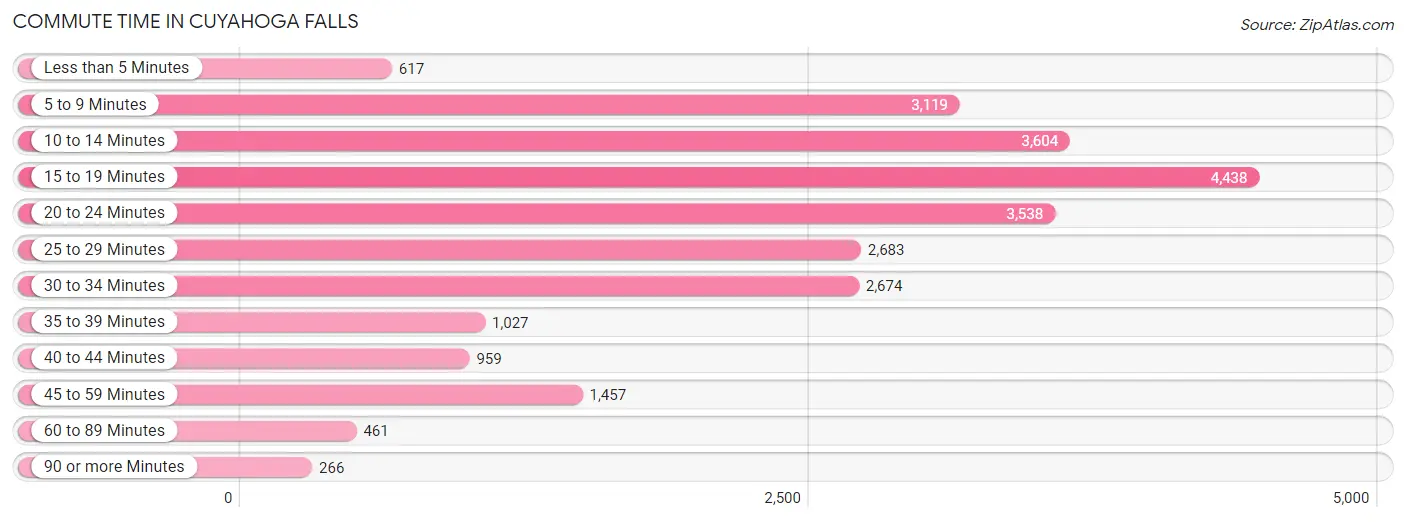
| Commute Time | # Commuters | % Commuters |
| Less than 5 Minutes | 617 | 2.5% |
| 5 to 9 Minutes | 3,119 | 12.6% |
| 10 to 14 Minutes | 3,604 | 14.5% |
| 15 to 19 Minutes | 4,438 | 17.9% |
| 20 to 24 Minutes | 3,538 | 14.2% |
| 25 to 29 Minutes | 2,683 | 10.8% |
| 30 to 34 Minutes | 2,674 | 10.8% |
| 35 to 39 Minutes | 1,027 | 4.1% |
| 40 to 44 Minutes | 959 | 3.9% |
| 45 to 59 Minutes | 1,457 | 5.9% |
| 60 to 89 Minutes | 461 | 1.9% |
| 90 or more Minutes | 266 | 1.1% |
Commute Time by Sex in Cuyahoga Falls
The most common commute times in Cuyahoga Falls are 15 to 19 minutes (2,320 commuters, 17.5%) for males and 15 to 19 minutes (2,118 commuters, 18.3%) for females.
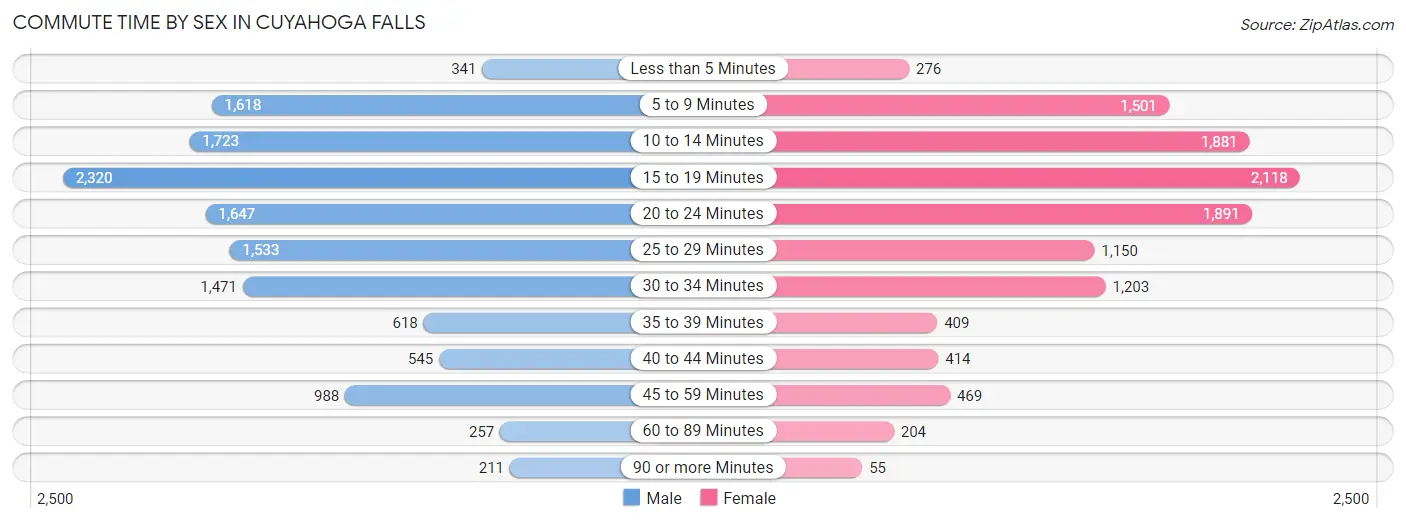
| Commute Time | Male | Female |
| Less than 5 Minutes | 341 (2.6%) | 276 (2.4%) |
| 5 to 9 Minutes | 1,618 (12.2%) | 1,501 (13.0%) |
| 10 to 14 Minutes | 1,723 (13.0%) | 1,881 (16.3%) |
| 15 to 19 Minutes | 2,320 (17.5%) | 2,118 (18.3%) |
| 20 to 24 Minutes | 1,647 (12.4%) | 1,891 (16.3%) |
| 25 to 29 Minutes | 1,533 (11.6%) | 1,150 (9.9%) |
| 30 to 34 Minutes | 1,471 (11.1%) | 1,203 (10.4%) |
| 35 to 39 Minutes | 618 (4.7%) | 409 (3.5%) |
| 40 to 44 Minutes | 545 (4.1%) | 414 (3.6%) |
| 45 to 59 Minutes | 988 (7.4%) | 469 (4.1%) |
| 60 to 89 Minutes | 257 (1.9%) | 204 (1.8%) |
| 90 or more Minutes | 211 (1.6%) | 55 (0.5%) |
Time of Departure to Work by Sex in Cuyahoga Falls
The most frequent times of departure to work in Cuyahoga Falls are 7:00 AM to 7:29 AM (1,951, 14.7%) for males and 7:30 AM to 7:59 AM (2,068, 17.9%) for females.
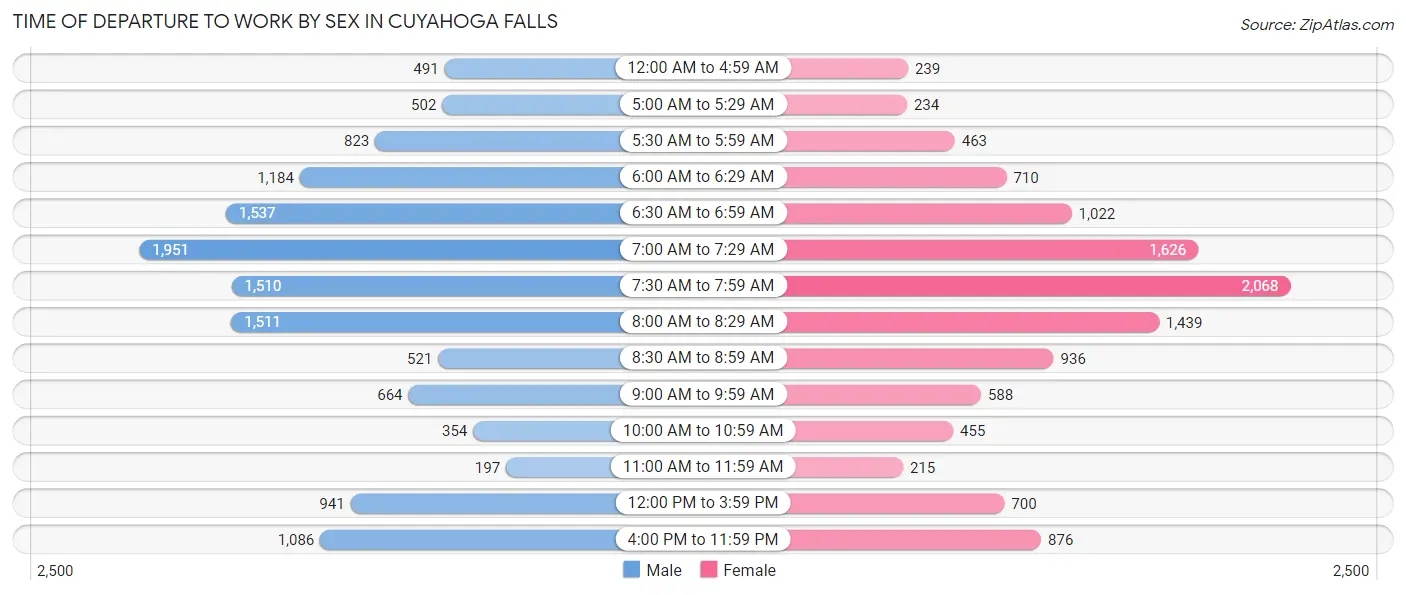
| Time of Departure | Male | Female |
| 12:00 AM to 4:59 AM | 491 (3.7%) | 239 (2.1%) |
| 5:00 AM to 5:29 AM | 502 (3.8%) | 234 (2.0%) |
| 5:30 AM to 5:59 AM | 823 (6.2%) | 463 (4.0%) |
| 6:00 AM to 6:29 AM | 1,184 (8.9%) | 710 (6.1%) |
| 6:30 AM to 6:59 AM | 1,537 (11.6%) | 1,022 (8.8%) |
| 7:00 AM to 7:29 AM | 1,951 (14.7%) | 1,626 (14.1%) |
| 7:30 AM to 7:59 AM | 1,510 (11.4%) | 2,068 (17.9%) |
| 8:00 AM to 8:29 AM | 1,511 (11.4%) | 1,439 (12.4%) |
| 8:30 AM to 8:59 AM | 521 (3.9%) | 936 (8.1%) |
| 9:00 AM to 9:59 AM | 664 (5.0%) | 588 (5.1%) |
| 10:00 AM to 10:59 AM | 354 (2.7%) | 455 (3.9%) |
| 11:00 AM to 11:59 AM | 197 (1.5%) | 215 (1.9%) |
| 12:00 PM to 3:59 PM | 941 (7.1%) | 700 (6.0%) |
| 4:00 PM to 11:59 PM | 1,086 (8.2%) | 876 (7.6%) |
| Total | 13,272 (100.0%) | 11,571 (100.0%) |
Housing Occupancy in Cuyahoga Falls
Occupancy by Ownership in Cuyahoga Falls
Of the total 23,148 dwellings in Cuyahoga Falls, owner-occupied units account for 14,375 (62.1%), while renter-occupied units make up 8,773 (37.9%).
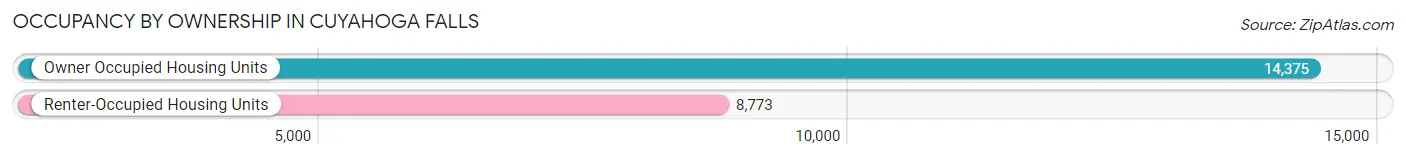
| Occupancy | # Housing Units | % Housing Units |
| Owner Occupied Housing Units | 14,375 | 62.1% |
| Renter-Occupied Housing Units | 8,773 | 37.9% |
| Total Occupied Housing Units | 23,148 | 100.0% |
Occupancy by Household Size in Cuyahoga Falls
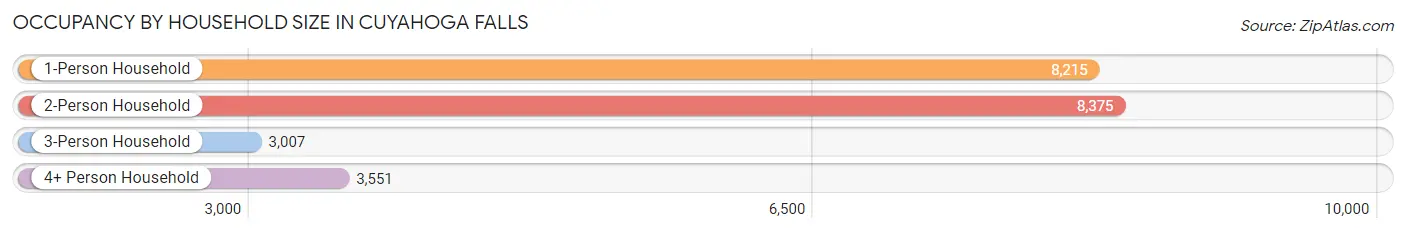
| Household Size | # Housing Units | % Housing Units |
| 1-Person Household | 8,215 | 35.5% |
| 2-Person Household | 8,375 | 36.2% |
| 3-Person Household | 3,007 | 13.0% |
| 4+ Person Household | 3,551 | 15.3% |
| Total Housing Units | 23,148 | 100.0% |
Occupancy by Ownership by Household Size in Cuyahoga Falls
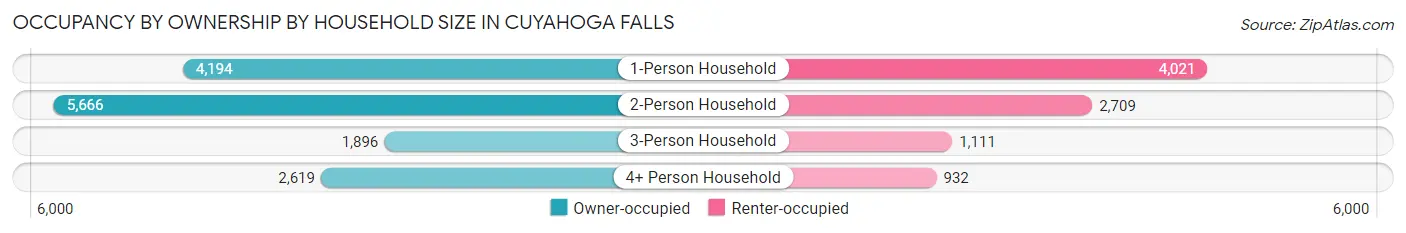
| Household Size | Owner-occupied | Renter-occupied |
| 1-Person Household | 4,194 (51.0%) | 4,021 (48.9%) |
| 2-Person Household | 5,666 (67.6%) | 2,709 (32.4%) |
| 3-Person Household | 1,896 (63.0%) | 1,111 (36.9%) |
| 4+ Person Household | 2,619 (73.8%) | 932 (26.3%) |
| Total Housing Units | 14,375 (62.1%) | 8,773 (37.9%) |
Occupancy by Educational Attainment in Cuyahoga Falls
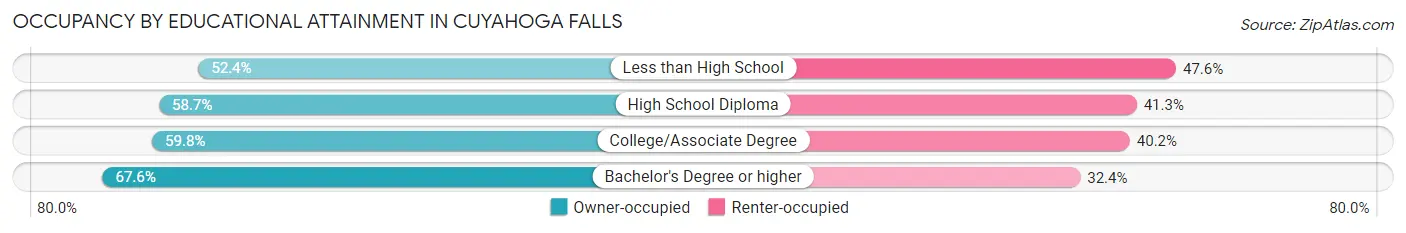
| Household Size | Owner-occupied | Renter-occupied |
| Less than High School | 560 (52.4%) | 508 (47.6%) |
| High School Diploma | 3,588 (58.7%) | 2,528 (41.3%) |
| College/Associate Degree | 4,324 (59.8%) | 2,912 (40.2%) |
| Bachelor's Degree or higher | 5,903 (67.6%) | 2,825 (32.4%) |
Occupancy by Age of Householder in Cuyahoga Falls
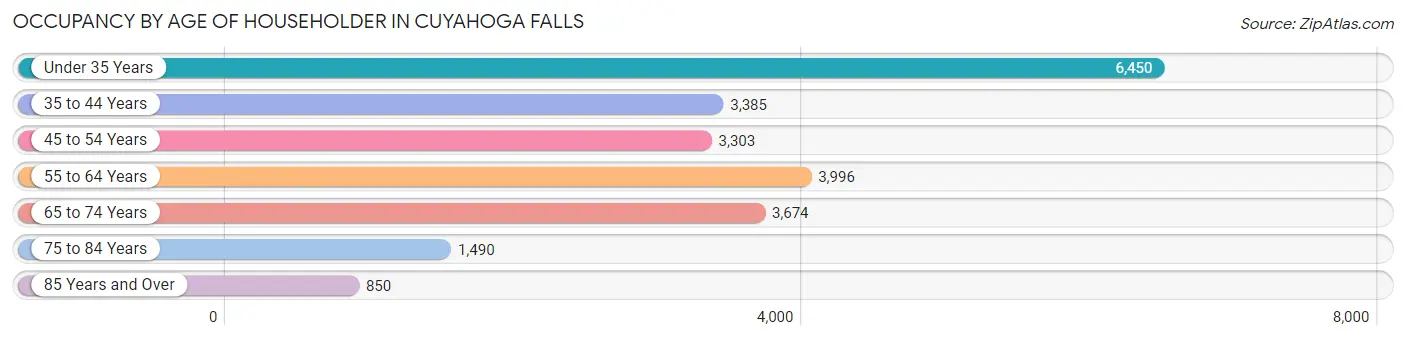
| Age Bracket | # Households | % Households |
| Under 35 Years | 6,450 | 27.9% |
| 35 to 44 Years | 3,385 | 14.6% |
| 45 to 54 Years | 3,303 | 14.3% |
| 55 to 64 Years | 3,996 | 17.3% |
| 65 to 74 Years | 3,674 | 15.9% |
| 75 to 84 Years | 1,490 | 6.4% |
| 85 Years and Over | 850 | 3.7% |
| Total | 23,148 | 100.0% |
Housing Finances in Cuyahoga Falls
Median Income by Occupancy in Cuyahoga Falls
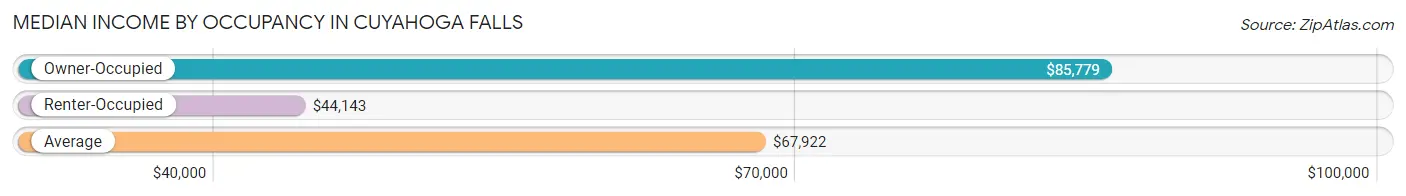
| Occupancy Type | # Households | Median Income |
| Owner-Occupied | 14,375 (62.1%) | $85,779 |
| Renter-Occupied | 8,773 (37.9%) | $44,143 |
| Average | 23,148 (100.0%) | $67,922 |
Occupancy by Householder Income Bracket in Cuyahoga Falls
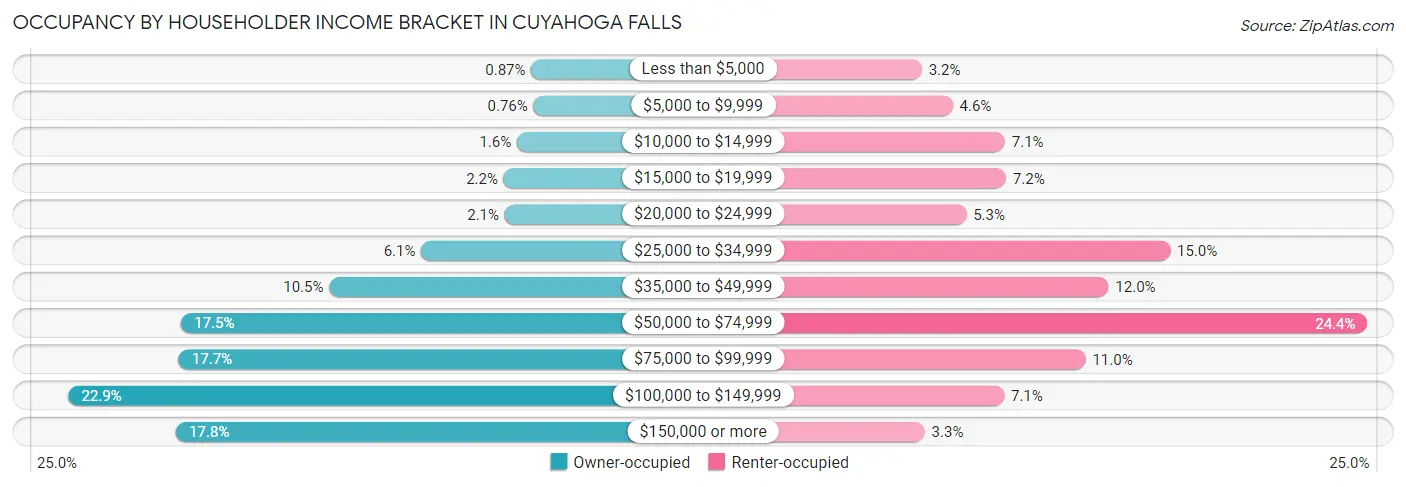
| Income Bracket | Owner-occupied | Renter-occupied |
| Less than $5,000 | 125 (0.9%) | 276 (3.2%) |
| $5,000 to $9,999 | 109 (0.8%) | 405 (4.6%) |
| $10,000 to $14,999 | 223 (1.5%) | 624 (7.1%) |
| $15,000 to $19,999 | 314 (2.2%) | 628 (7.2%) |
| $20,000 to $24,999 | 306 (2.1%) | 462 (5.3%) |
| $25,000 to $34,999 | 879 (6.1%) | 1,314 (15.0%) |
| $35,000 to $49,999 | 1,508 (10.5%) | 1,056 (12.0%) |
| $50,000 to $74,999 | 2,522 (17.5%) | 2,138 (24.4%) |
| $75,000 to $99,999 | 2,537 (17.6%) | 961 (11.0%) |
| $100,000 to $149,999 | 3,294 (22.9%) | 620 (7.1%) |
| $150,000 or more | 2,558 (17.8%) | 289 (3.3%) |
| Total | 14,375 (100.0%) | 8,773 (100.0%) |
Monthly Housing Cost Tiers in Cuyahoga Falls
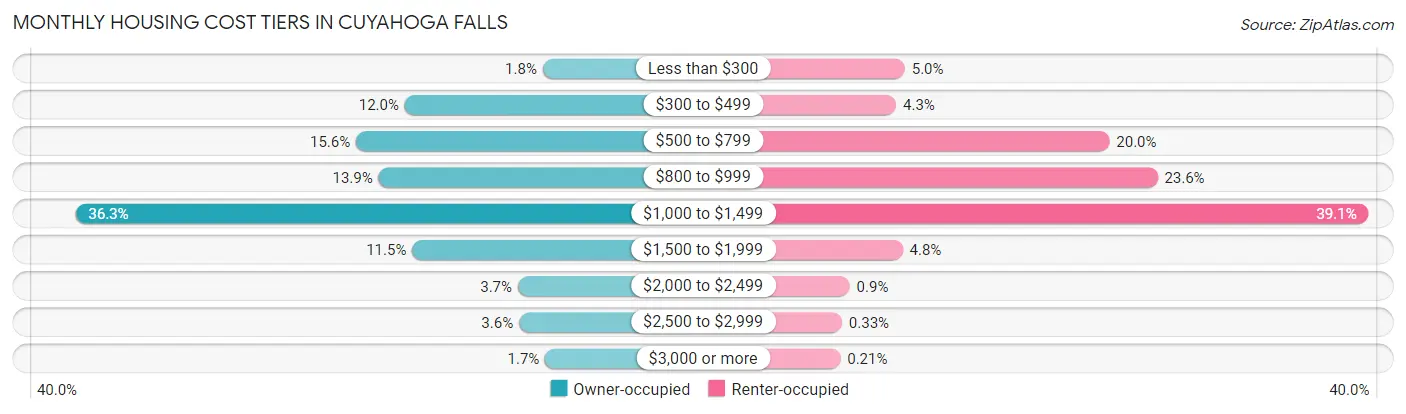
| Monthly Cost | Owner-occupied | Renter-occupied |
| Less than $300 | 265 (1.8%) | 435 (5.0%) |
| $300 to $499 | 1,725 (12.0%) | 379 (4.3%) |
| $500 to $799 | 2,241 (15.6%) | 1,757 (20.0%) |
| $800 to $999 | 2,003 (13.9%) | 2,068 (23.6%) |
| $1,000 to $1,499 | 5,212 (36.3%) | 3,431 (39.1%) |
| $1,500 to $1,999 | 1,646 (11.5%) | 421 (4.8%) |
| $2,000 to $2,499 | 528 (3.7%) | 79 (0.9%) |
| $2,500 to $2,999 | 516 (3.6%) | 29 (0.3%) |
| $3,000 or more | 239 (1.7%) | 18 (0.2%) |
| Total | 14,375 (100.0%) | 8,773 (100.0%) |
Physical Housing Characteristics in Cuyahoga Falls
Housing Structures in Cuyahoga Falls
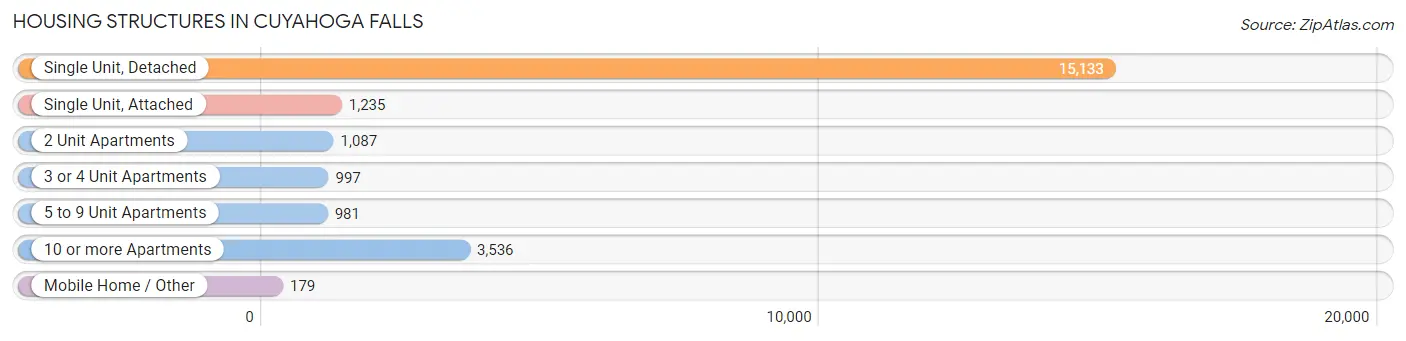
| Structure Type | # Housing Units | % Housing Units |
| Single Unit, Detached | 15,133 | 65.4% |
| Single Unit, Attached | 1,235 | 5.3% |
| 2 Unit Apartments | 1,087 | 4.7% |
| 3 or 4 Unit Apartments | 997 | 4.3% |
| 5 to 9 Unit Apartments | 981 | 4.2% |
| 10 or more Apartments | 3,536 | 15.3% |
| Mobile Home / Other | 179 | 0.8% |
| Total | 23,148 | 100.0% |
Housing Structures by Occupancy in Cuyahoga Falls
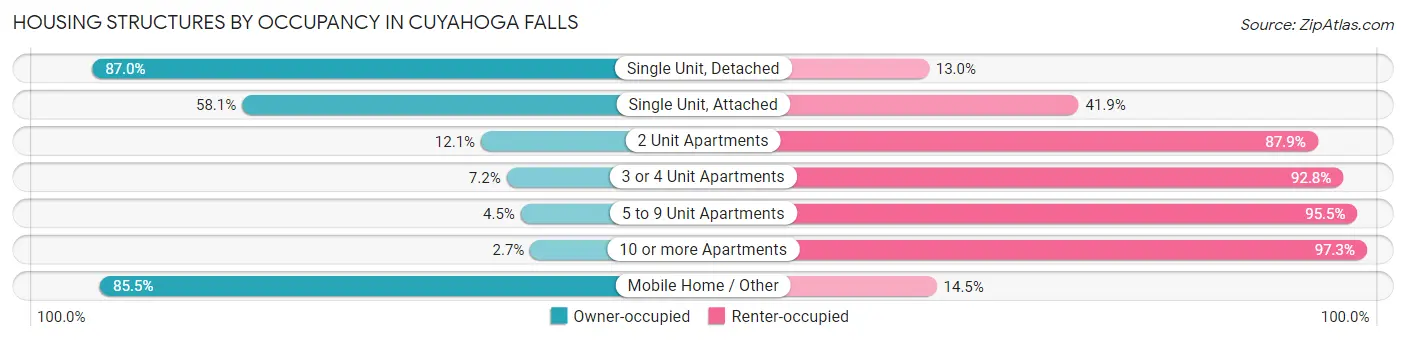
| Structure Type | Owner-occupied | Renter-occupied |
| Single Unit, Detached | 13,162 (87.0%) | 1,971 (13.0%) |
| Single Unit, Attached | 718 (58.1%) | 517 (41.9%) |
| 2 Unit Apartments | 132 (12.1%) | 955 (87.9%) |
| 3 or 4 Unit Apartments | 72 (7.2%) | 925 (92.8%) |
| 5 to 9 Unit Apartments | 44 (4.5%) | 937 (95.5%) |
| 10 or more Apartments | 94 (2.7%) | 3,442 (97.3%) |
| Mobile Home / Other | 153 (85.5%) | 26 (14.5%) |
| Total | 14,375 (62.1%) | 8,773 (37.9%) |
Housing Structures by Number of Rooms in Cuyahoga Falls
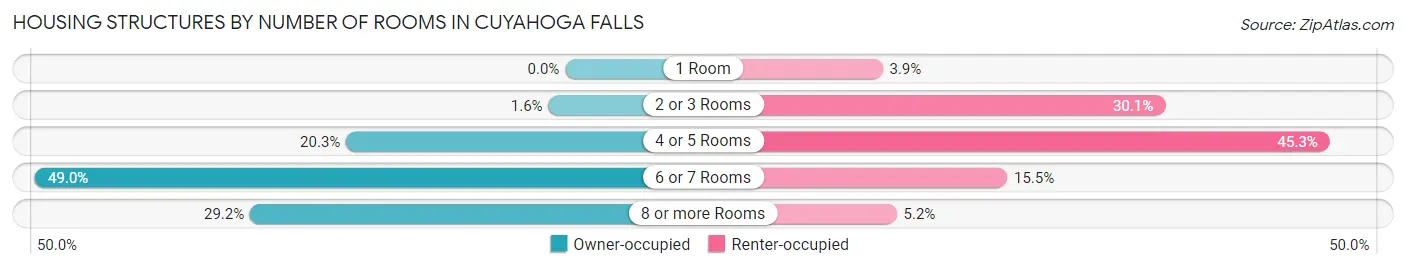
| Number of Rooms | Owner-occupied | Renter-occupied |
| 1 Room | 0 (0.0%) | 346 (3.9%) |
| 2 or 3 Rooms | 223 (1.5%) | 2,638 (30.1%) |
| 4 or 5 Rooms | 2,912 (20.3%) | 3,973 (45.3%) |
| 6 or 7 Rooms | 7,050 (49.0%) | 1,356 (15.5%) |
| 8 or more Rooms | 4,190 (29.1%) | 460 (5.2%) |
| Total | 14,375 (100.0%) | 8,773 (100.0%) |
Housing Structure by Heating Type in Cuyahoga Falls
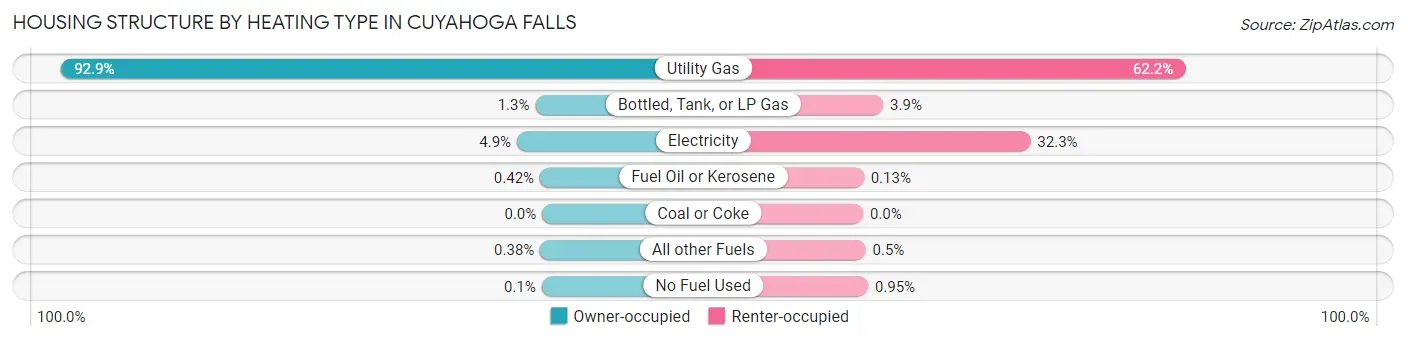
| Heating Type | Owner-occupied | Renter-occupied |
| Utility Gas | 13,357 (92.9%) | 5,457 (62.2%) |
| Bottled, Tank, or LP Gas | 188 (1.3%) | 341 (3.9%) |
| Electricity | 699 (4.9%) | 2,837 (32.3%) |
| Fuel Oil or Kerosene | 61 (0.4%) | 11 (0.1%) |
| Coal or Coke | 0 (0.0%) | 0 (0.0%) |
| All other Fuels | 55 (0.4%) | 44 (0.5%) |
| No Fuel Used | 15 (0.1%) | 83 (0.9%) |
| Total | 14,375 (100.0%) | 8,773 (100.0%) |
Household Vehicle Usage in Cuyahoga Falls
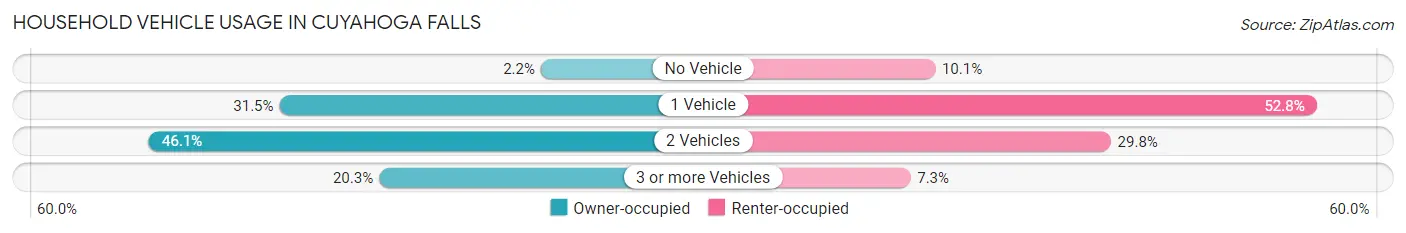
| Vehicles per Household | Owner-occupied | Renter-occupied |
| No Vehicle | 313 (2.2%) | 885 (10.1%) |
| 1 Vehicle | 4,522 (31.5%) | 4,634 (52.8%) |
| 2 Vehicles | 6,622 (46.1%) | 2,612 (29.8%) |
| 3 or more Vehicles | 2,918 (20.3%) | 642 (7.3%) |
| Total | 14,375 (100.0%) | 8,773 (100.0%) |
Real Estate & Mortgages in Cuyahoga Falls
Real Estate and Mortgage Overview in Cuyahoga Falls
| Characteristic | Without Mortgage | With Mortgage |
| Housing Units | 4,343 | 10,032 |
| Median Property Value | $158,400 | $161,100 |
| Median Household Income | $65,689 | $1,918 |
| Monthly Housing Costs | $550 | $234 |
| Real Estate Taxes | $2,714 | $243 |
Property Value by Mortgage Status in Cuyahoga Falls
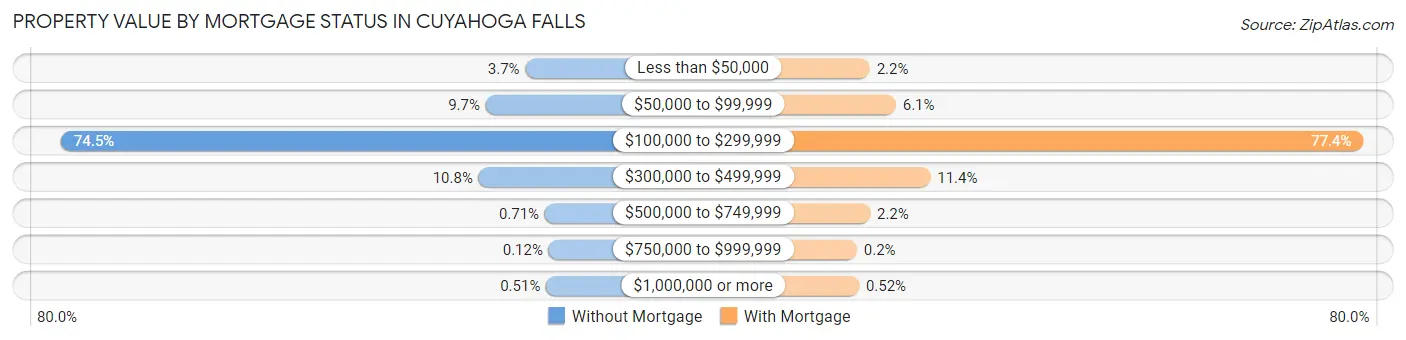
| Property Value | Without Mortgage | With Mortgage |
| Less than $50,000 | 160 (3.7%) | 217 (2.2%) |
| $50,000 to $99,999 | 422 (9.7%) | 615 (6.1%) |
| $100,000 to $299,999 | 3,234 (74.5%) | 7,763 (77.4%) |
| $300,000 to $499,999 | 469 (10.8%) | 1,143 (11.4%) |
| $500,000 to $749,999 | 31 (0.7%) | 222 (2.2%) |
| $750,000 to $999,999 | 5 (0.1%) | 20 (0.2%) |
| $1,000,000 or more | 22 (0.5%) | 52 (0.5%) |
| Total | 4,343 (100.0%) | 10,032 (100.0%) |
Household Income by Mortgage Status in Cuyahoga Falls
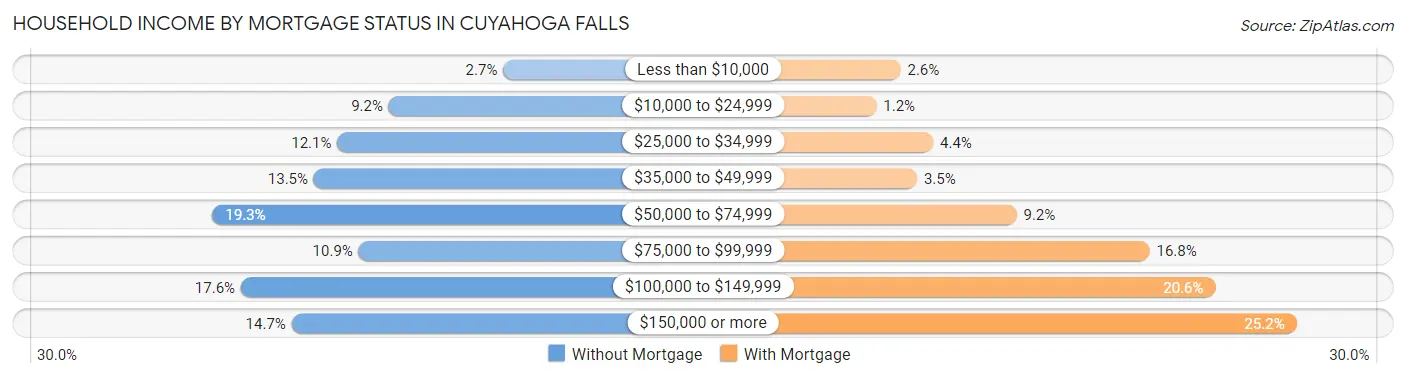
| Household Income | Without Mortgage | With Mortgage |
| Less than $10,000 | 115 (2.6%) | 258 (2.6%) |
| $10,000 to $24,999 | 399 (9.2%) | 119 (1.2%) |
| $25,000 to $34,999 | 527 (12.1%) | 444 (4.4%) |
| $35,000 to $49,999 | 585 (13.5%) | 352 (3.5%) |
| $50,000 to $74,999 | 837 (19.3%) | 923 (9.2%) |
| $75,000 to $99,999 | 474 (10.9%) | 1,685 (16.8%) |
| $100,000 to $149,999 | 766 (17.6%) | 2,063 (20.6%) |
| $150,000 or more | 640 (14.7%) | 2,528 (25.2%) |
| Total | 4,343 (100.0%) | 10,032 (100.0%) |
Property Value to Household Income Ratio in Cuyahoga Falls
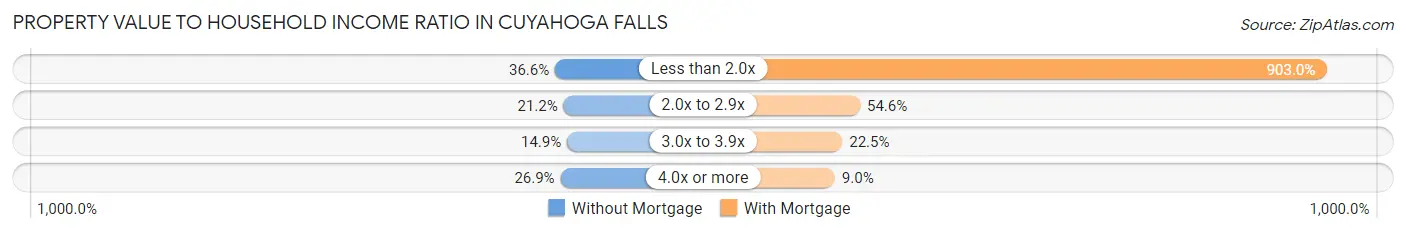
| Value-to-Income Ratio | Without Mortgage | With Mortgage |
| Less than 2.0x | 1,589 (36.6%) | 90,584 (903.0%) |
| 2.0x to 2.9x | 921 (21.2%) | 5,480 (54.6%) |
| 3.0x to 3.9x | 645 (14.8%) | 2,258 (22.5%) |
| 4.0x or more | 1,166 (26.9%) | 906 (9.0%) |
| Total | 4,343 (100.0%) | 10,032 (100.0%) |
Real Estate Taxes by Mortgage Status in Cuyahoga Falls
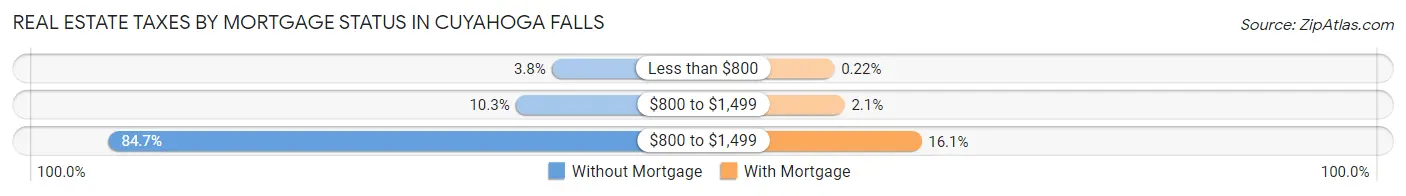
| Property Taxes | Without Mortgage | With Mortgage |
| Less than $800 | 163 (3.7%) | 22 (0.2%) |
| $800 to $1,499 | 449 (10.3%) | 210 (2.1%) |
| $800 to $1,499 | 3,677 (84.7%) | 1,617 (16.1%) |
| Total | 4,343 (100.0%) | 10,032 (100.0%) |
Health & Disability in Cuyahoga Falls
Health Insurance Coverage by Age in Cuyahoga Falls
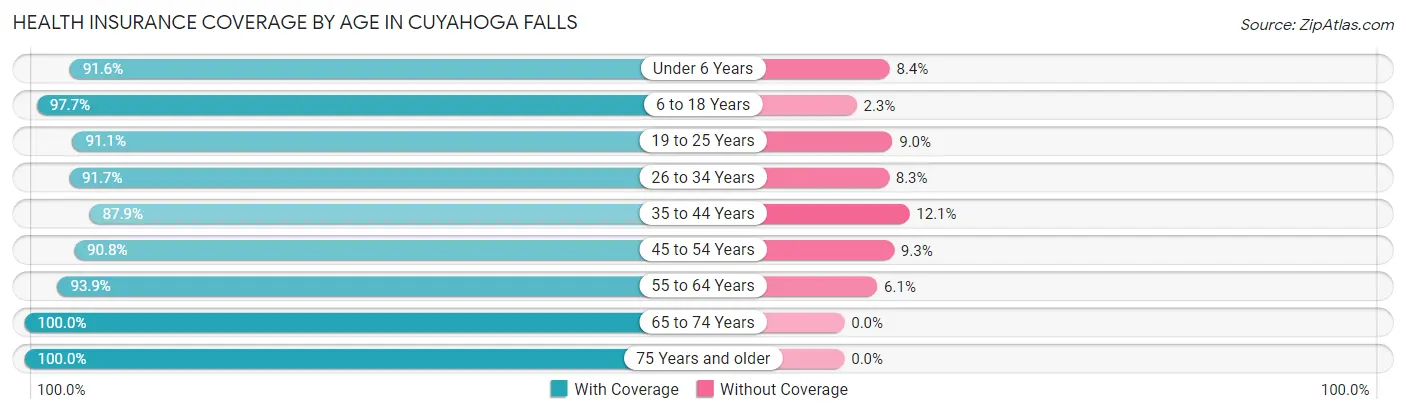
| Age Bracket | With Coverage | Without Coverage |
| Under 6 Years | 3,058 (91.6%) | 282 (8.4%) |
| 6 to 18 Years | 6,160 (97.7%) | 144 (2.3%) |
| 19 to 25 Years | 4,495 (91.0%) | 442 (8.9%) |
| 26 to 34 Years | 8,156 (91.7%) | 737 (8.3%) |
| 35 to 44 Years | 5,503 (87.9%) | 760 (12.1%) |
| 45 to 54 Years | 4,994 (90.7%) | 509 (9.2%) |
| 55 to 64 Years | 6,214 (93.9%) | 406 (6.1%) |
| 65 to 74 Years | 5,121 (100.0%) | 0 (0.0%) |
| 75 Years and older | 3,470 (100.0%) | 0 (0.0%) |
| Total | 47,171 (93.5%) | 3,280 (6.5%) |
Health Insurance Coverage by Citizenship Status in Cuyahoga Falls
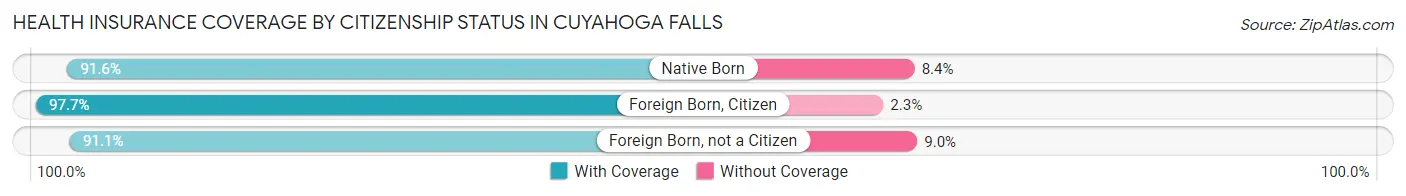
| Citizenship Status | With Coverage | Without Coverage |
| Native Born | 3,058 (91.6%) | 282 (8.4%) |
| Foreign Born, Citizen | 6,160 (97.7%) | 144 (2.3%) |
| Foreign Born, not a Citizen | 4,495 (91.0%) | 442 (8.9%) |
Health Insurance Coverage by Household Income in Cuyahoga Falls
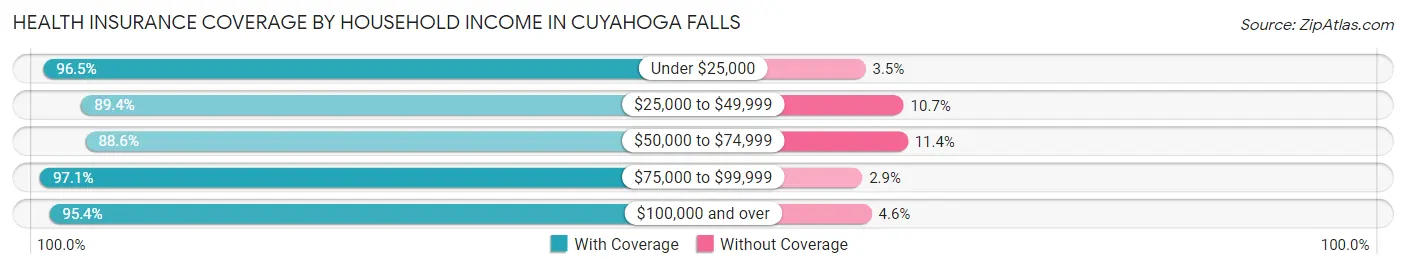
| Household Income | With Coverage | Without Coverage |
| Under $25,000 | 4,782 (96.5%) | 174 (3.5%) |
| $25,000 to $49,999 | 7,296 (89.3%) | 870 (10.6%) |
| $50,000 to $74,999 | 8,490 (88.6%) | 1,094 (11.4%) |
| $75,000 to $99,999 | 7,839 (97.1%) | 233 (2.9%) |
| $100,000 and over | 18,670 (95.4%) | 909 (4.6%) |
Public vs Private Health Insurance Coverage by Age in Cuyahoga Falls
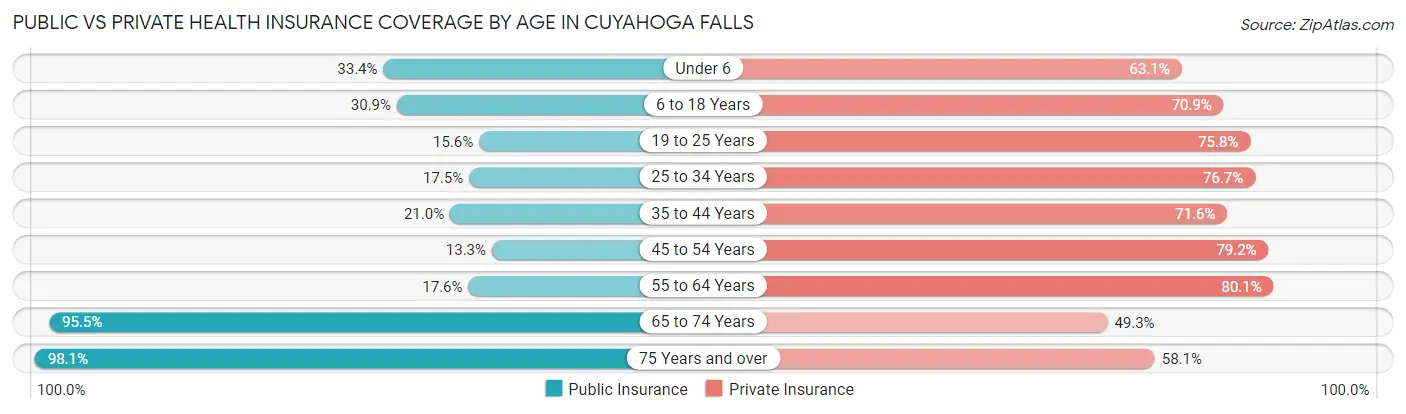
| Age Bracket | Public Insurance | Private Insurance |
| Under 6 | 1,116 (33.4%) | 2,107 (63.1%) |
| 6 to 18 Years | 1,948 (30.9%) | 4,468 (70.9%) |
| 19 to 25 Years | 772 (15.6%) | 3,742 (75.8%) |
| 25 to 34 Years | 1,555 (17.5%) | 6,822 (76.7%) |
| 35 to 44 Years | 1,318 (21.0%) | 4,482 (71.6%) |
| 45 to 54 Years | 730 (13.3%) | 4,358 (79.2%) |
| 55 to 64 Years | 1,167 (17.6%) | 5,305 (80.1%) |
| 65 to 74 Years | 4,888 (95.5%) | 2,525 (49.3%) |
| 75 Years and over | 3,404 (98.1%) | 2,016 (58.1%) |
| Total | 16,898 (33.5%) | 35,825 (71.0%) |
Disability Status by Sex by Age in Cuyahoga Falls
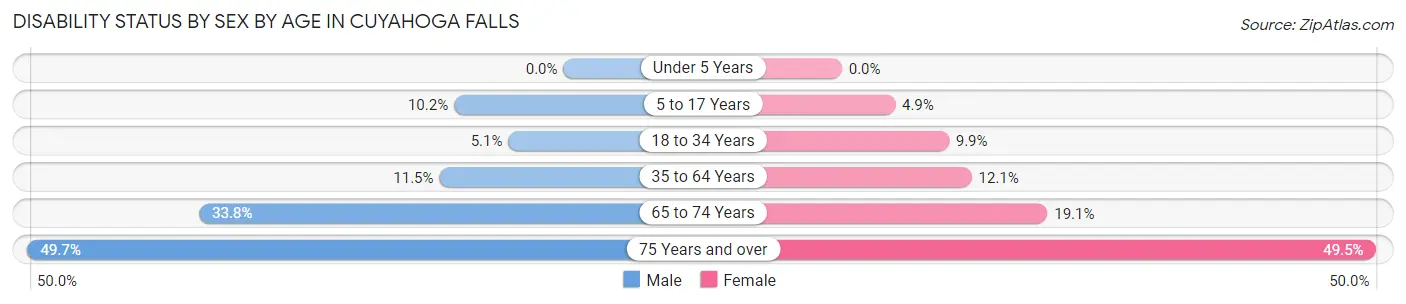
| Age Bracket | Male | Female |
| Under 5 Years | 0 (0.0%) | 0 (0.0%) |
| 5 to 17 Years | 306 (10.2%) | 163 (4.9%) |
| 18 to 34 Years | 340 (5.1%) | 746 (9.9%) |
| 35 to 64 Years | 1,084 (11.5%) | 1,081 (12.0%) |
| 65 to 74 Years | 843 (33.8%) | 501 (19.1%) |
| 75 Years and over | 633 (49.7%) | 1,088 (49.5%) |
Disability Class by Sex by Age in Cuyahoga Falls
Disability Class: Hearing Difficulty
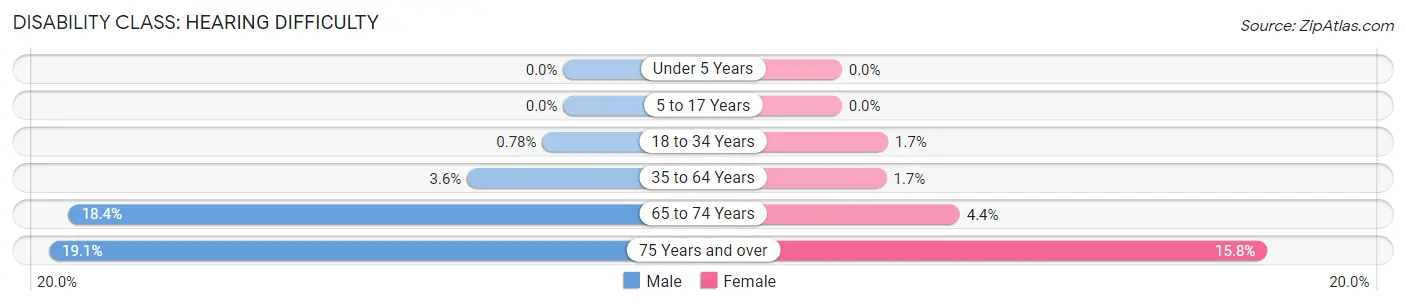
| Age Bracket | Male | Female |
| Under 5 Years | 0 (0.0%) | 0 (0.0%) |
| 5 to 17 Years | 0 (0.0%) | 0 (0.0%) |
| 18 to 34 Years | 52 (0.8%) | 129 (1.7%) |
| 35 to 64 Years | 336 (3.6%) | 149 (1.7%) |
| 65 to 74 Years | 458 (18.4%) | 115 (4.4%) |
| 75 Years and over | 243 (19.1%) | 347 (15.8%) |
Disability Class: Vision Difficulty
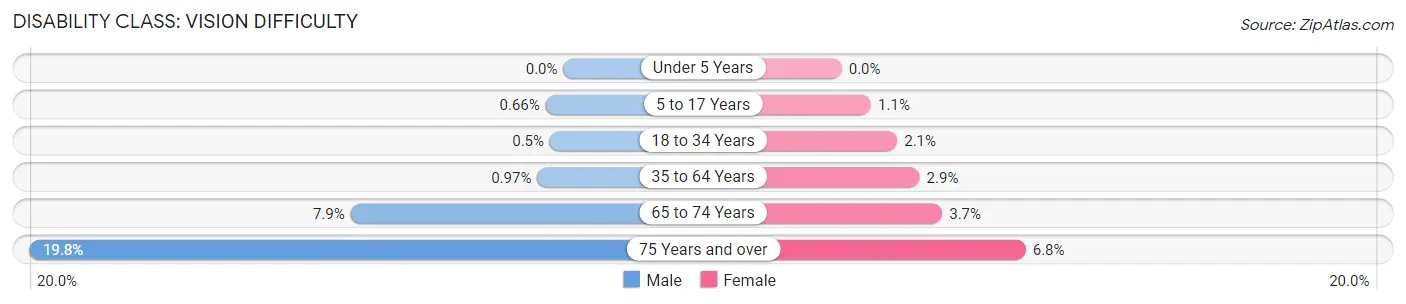
| Age Bracket | Male | Female |
| Under 5 Years | 0 (0.0%) | 0 (0.0%) |
| 5 to 17 Years | 20 (0.7%) | 36 (1.1%) |
| 18 to 34 Years | 33 (0.5%) | 155 (2.1%) |
| 35 to 64 Years | 91 (1.0%) | 259 (2.9%) |
| 65 to 74 Years | 197 (7.9%) | 98 (3.7%) |
| 75 Years and over | 252 (19.8%) | 150 (6.8%) |
Disability Class: Cognitive Difficulty
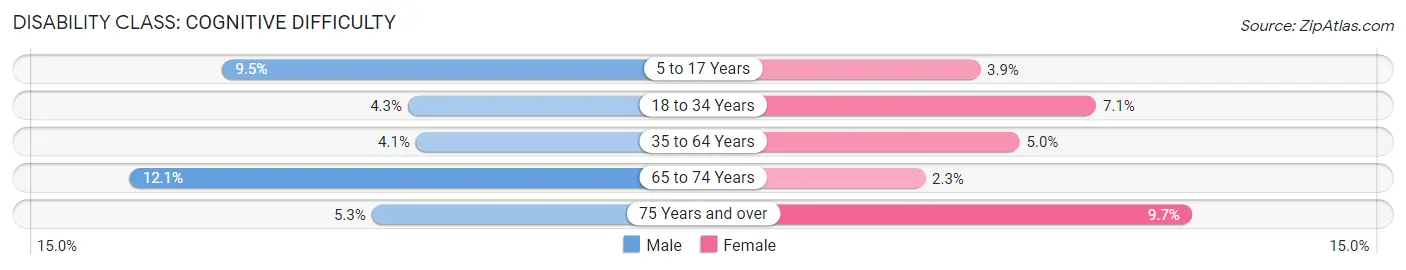
| Age Bracket | Male | Female |
| 5 to 17 Years | 286 (9.5%) | 127 (3.8%) |
| 18 to 34 Years | 288 (4.3%) | 532 (7.1%) |
| 35 to 64 Years | 387 (4.1%) | 444 (5.0%) |
| 65 to 74 Years | 301 (12.1%) | 61 (2.3%) |
| 75 Years and over | 68 (5.3%) | 214 (9.7%) |
Disability Class: Ambulatory Difficulty
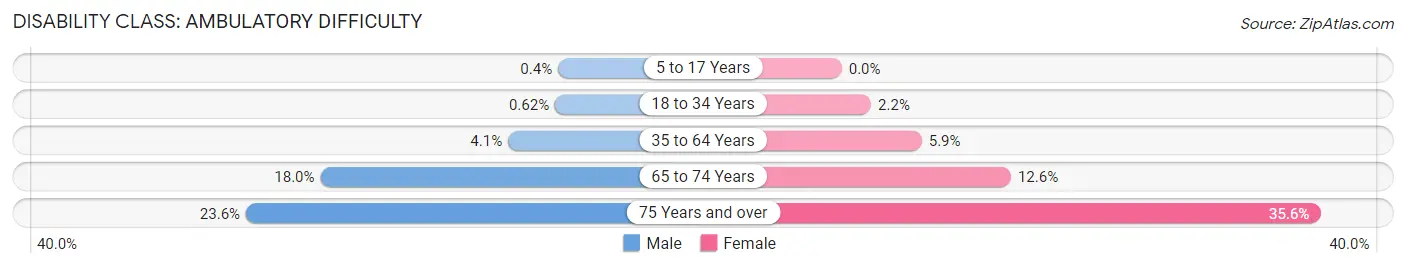
| Age Bracket | Male | Female |
| 5 to 17 Years | 12 (0.4%) | 0 (0.0%) |
| 18 to 34 Years | 41 (0.6%) | 164 (2.2%) |
| 35 to 64 Years | 387 (4.1%) | 533 (5.9%) |
| 65 to 74 Years | 450 (18.0%) | 330 (12.6%) |
| 75 Years and over | 300 (23.6%) | 782 (35.6%) |
Disability Class: Self-Care Difficulty
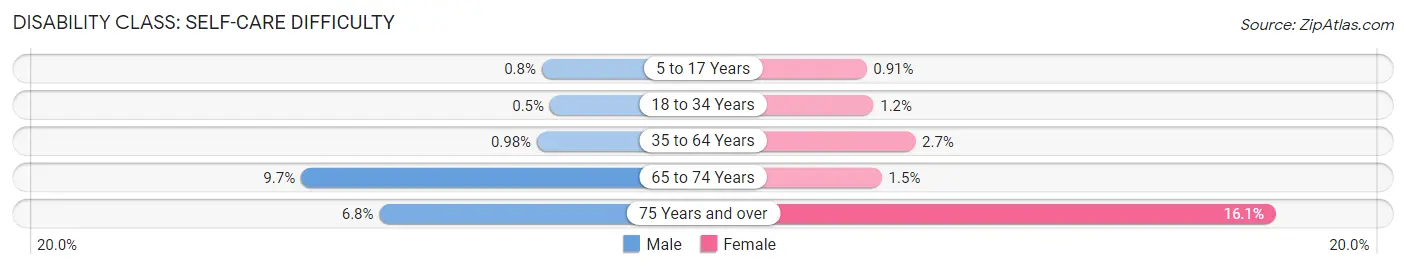
| Age Bracket | Male | Female |
| 5 to 17 Years | 24 (0.8%) | 30 (0.9%) |
| 18 to 34 Years | 33 (0.5%) | 88 (1.2%) |
| 35 to 64 Years | 92 (1.0%) | 244 (2.7%) |
| 65 to 74 Years | 243 (9.7%) | 39 (1.5%) |
| 75 Years and over | 87 (6.8%) | 354 (16.1%) |
Technology Access in Cuyahoga Falls
Computing Device Access in Cuyahoga Falls
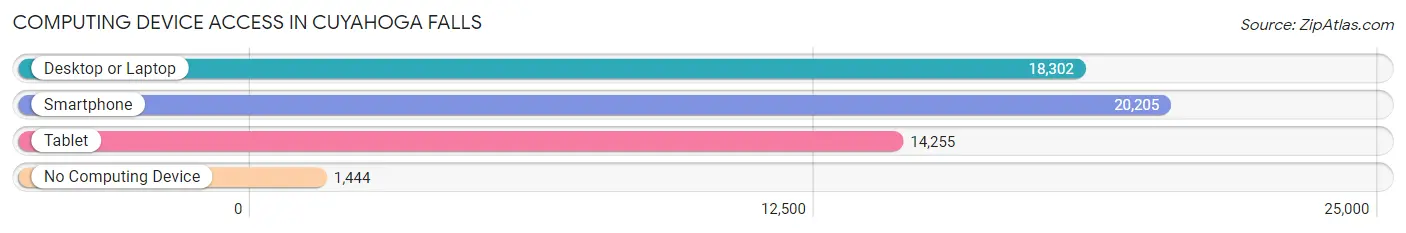
| Device Type | # Households | % Households |
| Desktop or Laptop | 18,302 | 79.1% |
| Smartphone | 20,205 | 87.3% |
| Tablet | 14,255 | 61.6% |
| No Computing Device | 1,444 | 6.2% |
| Total | 23,148 | 100.0% |
Internet Access in Cuyahoga Falls
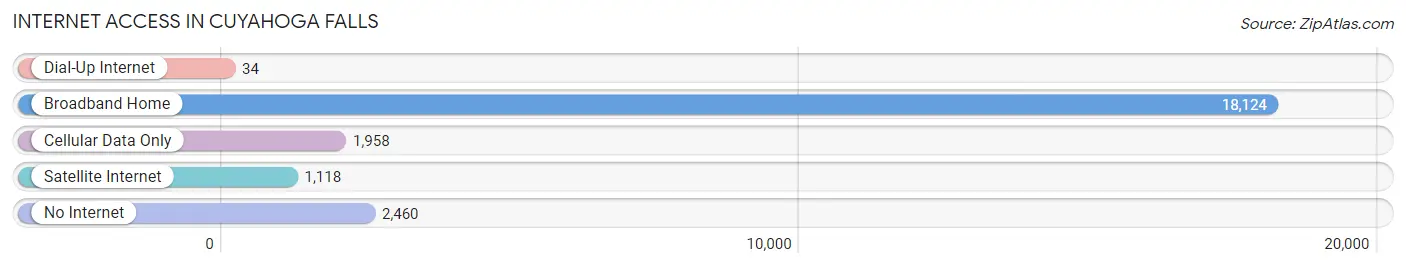
| Internet Type | # Households | % Households |
| Dial-Up Internet | 34 | 0.2% |
| Broadband Home | 18,124 | 78.3% |
| Cellular Data Only | 1,958 | 8.5% |
| Satellite Internet | 1,118 | 4.8% |
| No Internet | 2,460 | 10.6% |
| Total | 23,148 | 100.0% |
Cuyahoga Falls Summary
Cuyahoga Falls is a city located in Summit County, Ohio, United States. It is situated on the Cuyahoga River and is part of the Akron Metropolitan Statistical Area. The city has a population of approximately 49,652 people as of the 2010 census.
History
The area that is now Cuyahoga Falls was originally inhabited by the Native American people known as the Mound Builders. The first European settlers arrived in the area in the late 1700s and early 1800s. The area was first known as Manchester, and was later renamed Cuyahoga Falls in 1812. The name was chosen to reflect the numerous waterfalls that were located in the area.
In 1825, the Ohio and Erie Canal was constructed, connecting the Cuyahoga River to Lake Erie. This allowed for increased trade and commerce in the area, and the city began to grow. In 1836, the first post office was established in the city, and in 1841, the first school was built.
In 1844, the first railroad line was constructed in the city, connecting it to Akron and Cleveland. This allowed for increased industrial development in the area, and the city began to grow rapidly. By the late 1800s, Cuyahoga Falls had become a major industrial center, with numerous factories and mills located in the city.
In the early 1900s, the city began to develop into a residential area, and by the 1950s, the population had grown to over 20,000 people. The city continued to grow throughout the 20th century, and by the 2010 census, the population had grown to over 49,000 people.
Geography
Cuyahoga Falls is located in Summit County, Ohio, and is situated on the Cuyahoga River. The city has a total area of 16.2 square miles, of which 15.9 square miles is land and 0.3 square miles is water. The city is located approximately 25 miles south of Cleveland and 40 miles north of Akron.
The city is located in a hilly region, and is surrounded by several parks and recreational areas. The city is also home to several waterfalls, including Brandywine Falls, which is located in the Cuyahoga Valley National Park.
Economy
Cuyahoga Falls has a diverse economy, with a variety of industries located in the city. The city is home to several large companies, including FirstEnergy, Goodyear Tire & Rubber Company, and the Akron-Canton Airport.
The city is also home to several smaller businesses, including restaurants, retail stores, and professional services. The city is also home to several educational institutions, including the University of Akron and Kent State University.
Demographics
As of the 2010 census, the population of Cuyahoga Falls was 49,652 people. The racial makeup of the city was 87.3% White, 8.2% African American, 0.4% Native American, 1.3% Asian, 0.1% Pacific Islander, 0.7% from other races, and 2.0% from two or more races. Hispanic or Latino of any race were 2.3% of the population.
The median household income in the city was $45,945, and the median family income was $54,945. The per capita income in the city was $23,945. About 8.3% of the population was below the poverty line.
Conclusion
Cuyahoga Falls is a city located in Summit County, Ohio, United States. It is situated on the Cuyahoga River and is part of the Akron Metropolitan Statistical Area. The city has a population of approximately 49,652 people as of the 2010 census. The city has a diverse economy, with a variety of industries located in the city. The racial makeup of the city was 87.3% White, 8.2% African American, 0.4% Native American, 1.3% Asian, 0.1% Pacific Islander, 0.7% from other races, and 2.0% from two or more races. The median household income in the city was $45,945, and the median family income was $54,945. The per capita income in the city was $23,945. Cuyahoga Falls is a vibrant city with a rich history and a bright future.
Common Questions
What is Per Capita Income in Cuyahoga Falls?
Per Capita income in Cuyahoga Falls is $40,121.
What is the Median Family Income in Cuyahoga Falls?
Median Family Income in Cuyahoga Falls is $88,827.
What is the Median Household income in Cuyahoga Falls?
Median Household Income in Cuyahoga Falls is $67,922.
What is Income or Wage Gap in Cuyahoga Falls?
Income or Wage Gap in Cuyahoga Falls is 21.7%.
Women in Cuyahoga Falls earn 78.3 cents for every dollar earned by a man.
What is Family Income Deficit in Cuyahoga Falls?
Family Income Deficit in Cuyahoga Falls is $10,703.
Families that are below poverty line in Cuyahoga Falls earn $10,703 less on average than the poverty threshold level.
What is Inequality or Gini Index in Cuyahoga Falls?
Inequality or Gini Index in Cuyahoga Falls is 0.44.
What is the Total Population of Cuyahoga Falls?
Total Population of Cuyahoga Falls is 50,916.
What is the Total Male Population of Cuyahoga Falls?
Total Male Population of Cuyahoga Falls is 24,413.
What is the Total Female Population of Cuyahoga Falls?
Total Female Population of Cuyahoga Falls is 26,503.
What is the Ratio of Males per 100 Females in Cuyahoga Falls?
There are 92.11 Males per 100 Females in Cuyahoga Falls.
What is the Ratio of Females per 100 Males in Cuyahoga Falls?
There are 108.56 Females per 100 Males in Cuyahoga Falls.
What is the Median Population Age in Cuyahoga Falls?
Median Population Age in Cuyahoga Falls is 37.8 Years.
What is the Average Family Size in Cuyahoga Falls
Average Family Size in Cuyahoga Falls is 2.9 People.
What is the Average Household Size in Cuyahoga Falls
Average Household Size in Cuyahoga Falls is 2.2 People.
How Large is the Labor Force in Cuyahoga Falls?
There are 29,622 People in the Labor Forcein in Cuyahoga Falls.
What is the Percentage of People in the Labor Force in Cuyahoga Falls?
69.3% of People are in the Labor Force in Cuyahoga Falls.
What is the Unemployment Rate in Cuyahoga Falls?
Unemployment Rate in Cuyahoga Falls is 4.4%.