Geneva on the Lake, OH Map & Demographics
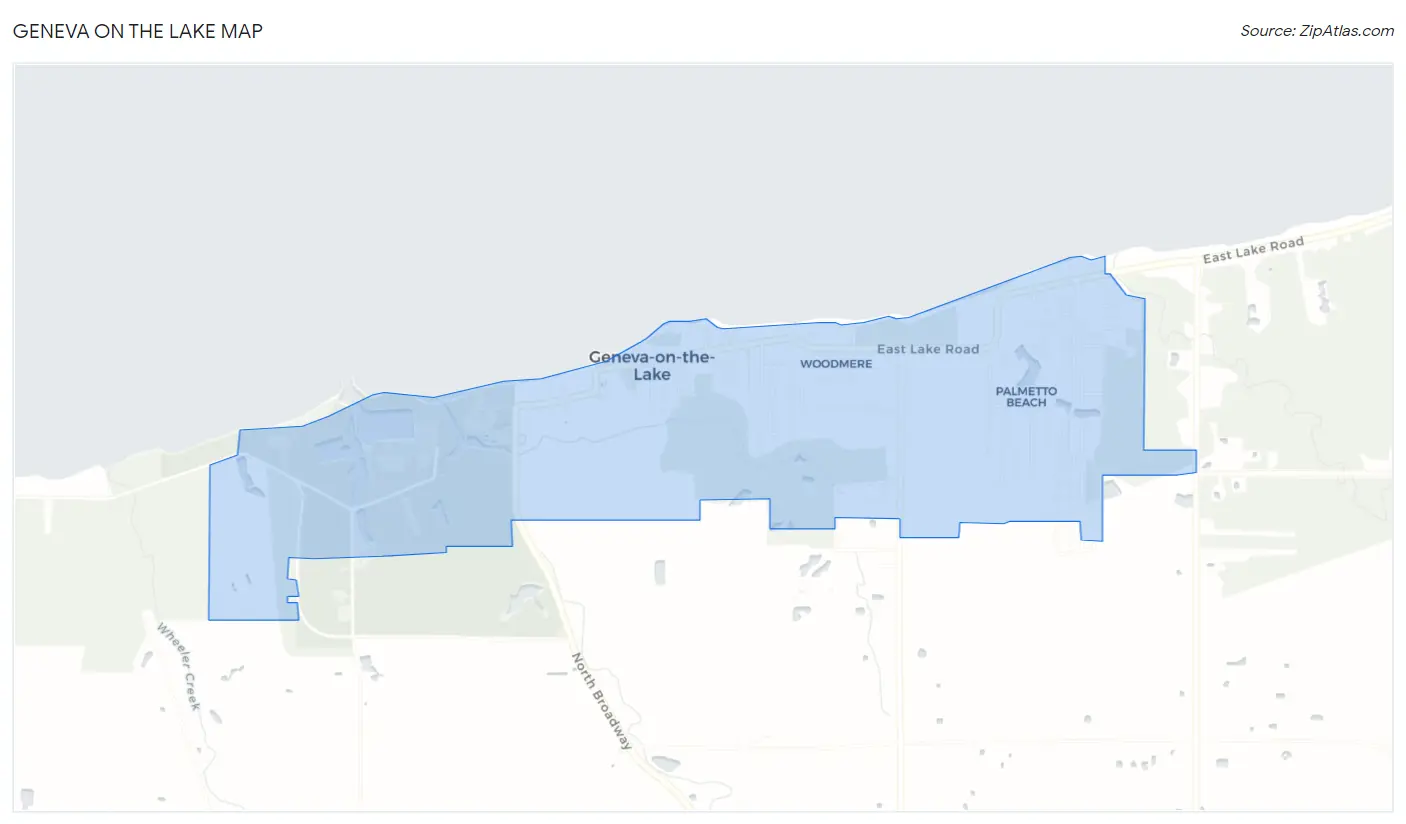
Geneva on the Lake Map
Geneva on the Lake Overview
$28,050
PER CAPITA INCOME
$61,528
AVG FAMILY INCOME
$45,755
AVG HOUSEHOLD INCOME
36.3%
WAGE / INCOME GAP [ % ]
63.7¢/ $1
WAGE / INCOME GAP [ $ ]
0.41
INEQUALITY / GINI INDEX
1,085
TOTAL POPULATION
550
MALE POPULATION
535
FEMALE POPULATION
102.80
MALES / 100 FEMALES
97.27
FEMALES / 100 MALES
48.9
MEDIAN AGE
3.3
AVG FAMILY SIZE
2.0
AVG HOUSEHOLD SIZE
539
LABOR FORCE [ PEOPLE ]
58.3%
PERCENT IN LABOR FORCE
6.9%
UNEMPLOYMENT RATE
Income in Geneva on the Lake
Income Overview in Geneva on the Lake
Per Capita Income in Geneva on the Lake is $28,050, while median incomes of families and households are $61,528 and $45,755 respectively.
| Characteristic | Number | Measure |
| Per Capita Income | 1,085 | $28,050 |
| Median Family Income | 195 | $61,528 |
| Mean Family Income | 195 | $72,687 |
| Median Household Income | 529 | $45,755 |
| Mean Household Income | 529 | $54,643 |
| Income Deficit | 195 | $0 |
| Wage / Income Gap (%) | 1,085 | 36.34% |
| Wage / Income Gap ($) | 1,085 | 63.66¢ per $1 |
| Gini / Inequality Index | 1,085 | 0.41 |
Earnings by Sex in Geneva on the Lake
Average Earnings in Geneva on the Lake are $36,331, $43,011 for men and $27,381 for women, a difference of 36.3%.
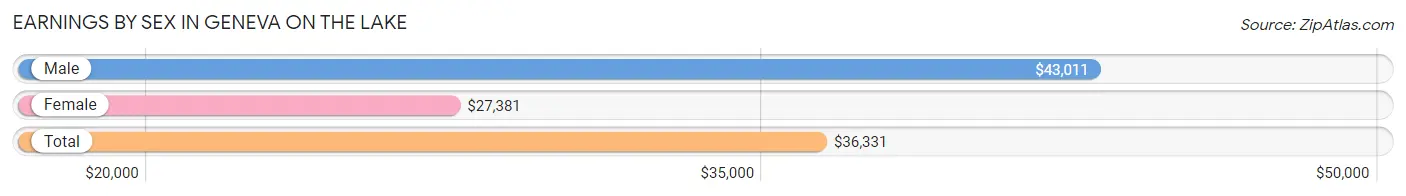
| Sex | Number | Average Earnings |
| Male | 289 (54.0%) | $43,011 |
| Female | 246 (46.0%) | $27,381 |
| Total | 535 (100.0%) | $36,331 |
Earnings by Sex by Income Bracket in Geneva on the Lake
The most common earnings brackets in Geneva on the Lake are $45,000 to $49,999 for men (65 | 22.5%) and $45,000 to $49,999 for women (34 | 13.8%).
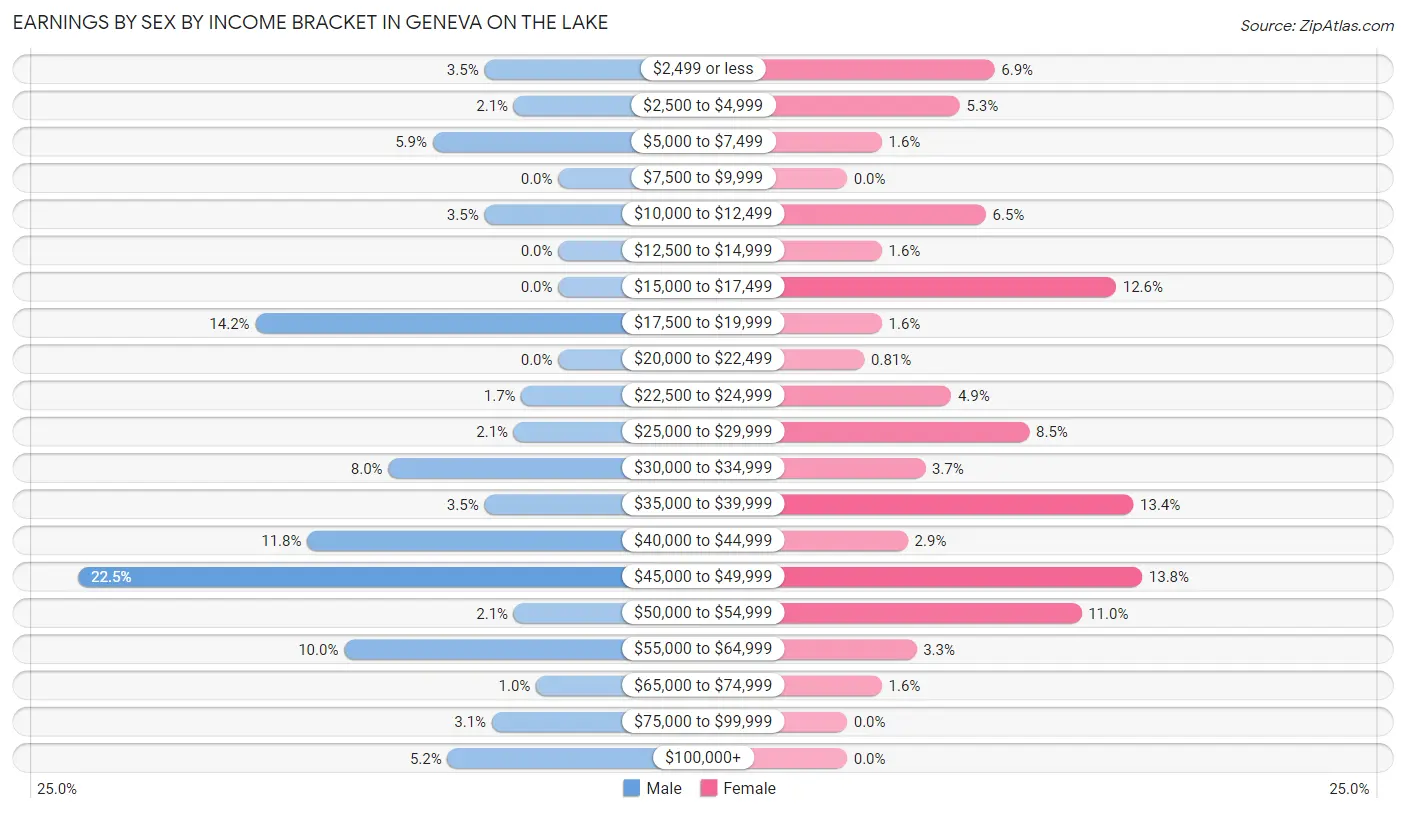
| Income | Male | Female |
| $2,499 or less | 10 (3.5%) | 17 (6.9%) |
| $2,500 to $4,999 | 6 (2.1%) | 13 (5.3%) |
| $5,000 to $7,499 | 17 (5.9%) | 4 (1.6%) |
| $7,500 to $9,999 | 0 (0.0%) | 0 (0.0%) |
| $10,000 to $12,499 | 10 (3.5%) | 16 (6.5%) |
| $12,500 to $14,999 | 0 (0.0%) | 4 (1.6%) |
| $15,000 to $17,499 | 0 (0.0%) | 31 (12.6%) |
| $17,500 to $19,999 | 41 (14.2%) | 4 (1.6%) |
| $20,000 to $22,499 | 0 (0.0%) | 2 (0.8%) |
| $22,500 to $24,999 | 5 (1.7%) | 12 (4.9%) |
| $25,000 to $29,999 | 6 (2.1%) | 21 (8.5%) |
| $30,000 to $34,999 | 23 (8.0%) | 9 (3.7%) |
| $35,000 to $39,999 | 10 (3.5%) | 33 (13.4%) |
| $40,000 to $44,999 | 34 (11.8%) | 7 (2.9%) |
| $45,000 to $49,999 | 65 (22.5%) | 34 (13.8%) |
| $50,000 to $54,999 | 6 (2.1%) | 27 (11.0%) |
| $55,000 to $64,999 | 29 (10.0%) | 8 (3.3%) |
| $65,000 to $74,999 | 3 (1.0%) | 4 (1.6%) |
| $75,000 to $99,999 | 9 (3.1%) | 0 (0.0%) |
| $100,000+ | 15 (5.2%) | 0 (0.0%) |
| Total | 289 (100.0%) | 246 (100.0%) |
Earnings by Sex by Educational Attainment in Geneva on the Lake
Average earnings in Geneva on the Lake are $43,289 for men and $31,750 for women, a difference of 26.7%. Men with an educational attainment of high school diploma enjoy the highest average annual earnings of $45,575, while those with college or associate's degree education earn the least with $34,293. Women with an educational attainment of high school diploma earn the most with the average annual earnings of $37,778, while those with college or associate's degree education have the smallest earnings of $27,054.
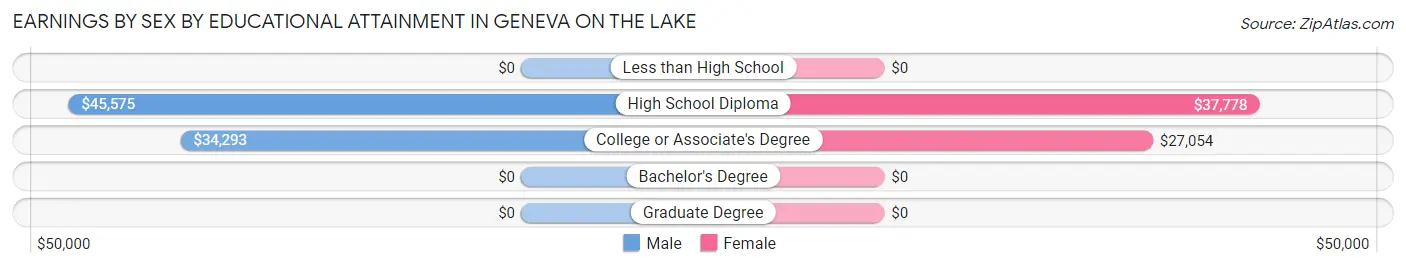
| Educational Attainment | Male Income | Female Income |
| Less than High School | - | - |
| High School Diploma | $45,575 | $37,778 |
| College or Associate's Degree | $34,293 | $27,054 |
| Bachelor's Degree | - | - |
| Graduate Degree | - | - |
| Total | $43,289 | $31,750 |
Family Income in Geneva on the Lake
Family Income Brackets in Geneva on the Lake
According to the Geneva on the Lake family income data, there are 45 families falling into the $35,000 to $49,999 income range, which is the most common income bracket and makes up 23.1% of all families. Conversely, the $200,000+ income bracket is the least frequent group with only 4 families (2.1%) belonging to this category.
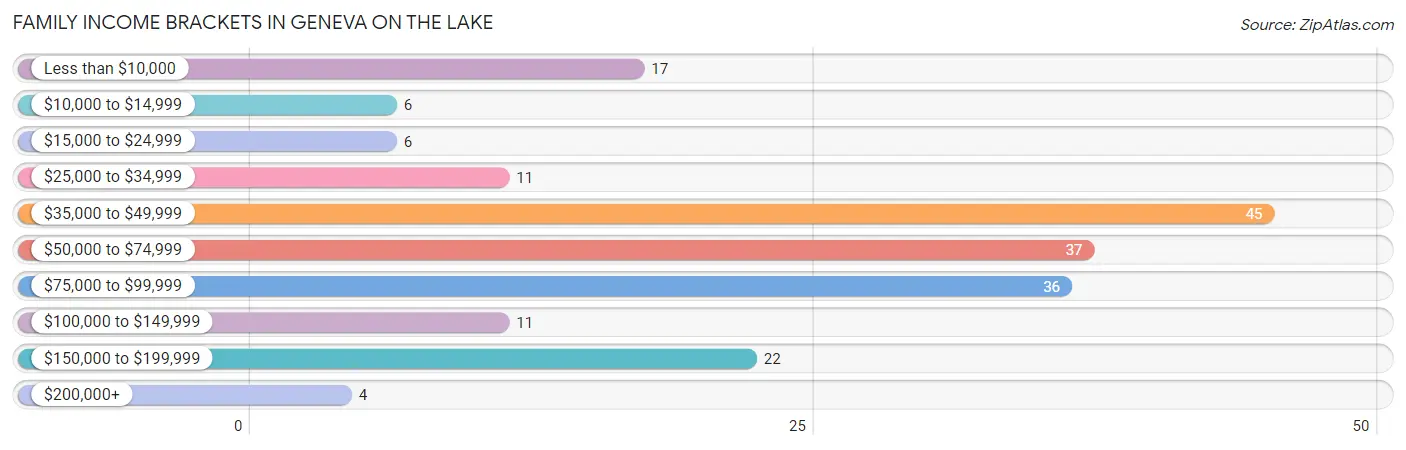
| Income Bracket | # Families | % Families |
| Less than $10,000 | 17 | 8.7% |
| $10,000 to $14,999 | 6 | 3.1% |
| $15,000 to $24,999 | 6 | 3.1% |
| $25,000 to $34,999 | 11 | 5.6% |
| $35,000 to $49,999 | 45 | 23.1% |
| $50,000 to $74,999 | 37 | 19.0% |
| $75,000 to $99,999 | 36 | 18.5% |
| $100,000 to $149,999 | 11 | 5.6% |
| $150,000 to $199,999 | 22 | 11.3% |
| $200,000+ | 4 | 2.1% |
Family Income by Famaliy Size in Geneva on the Lake
3-person families (46 | 23.6%) account for the highest median family income in Geneva on the Lake with $67,778 per family, while 2-person families (100 | 51.3%) have the highest median income of $23,750 per family member.
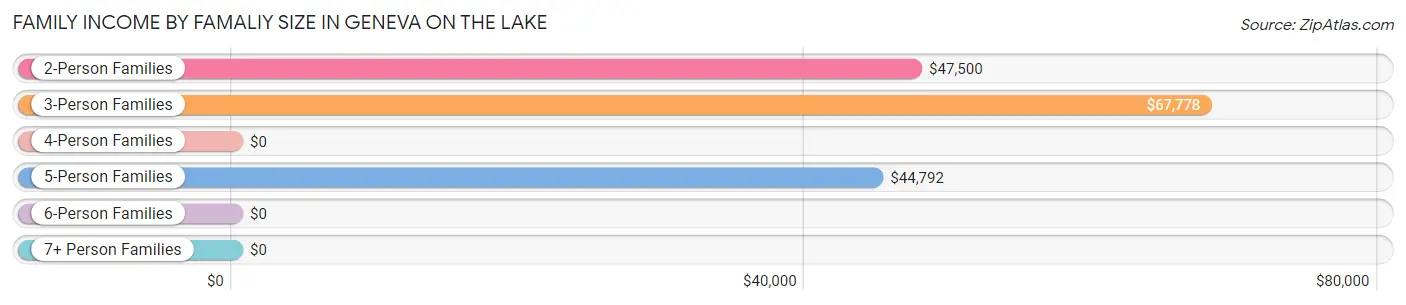
| Income Bracket | # Families | Median Income |
| 2-Person Families | 100 (51.3%) | $47,500 |
| 3-Person Families | 46 (23.6%) | $67,778 |
| 4-Person Families | 33 (16.9%) | $0 |
| 5-Person Families | 11 (5.6%) | $44,792 |
| 6-Person Families | 5 (2.6%) | $0 |
| 7+ Person Families | 0 (0.0%) | $0 |
| Total | 195 (100.0%) | $61,528 |
Family Income by Number of Earners in Geneva on the Lake
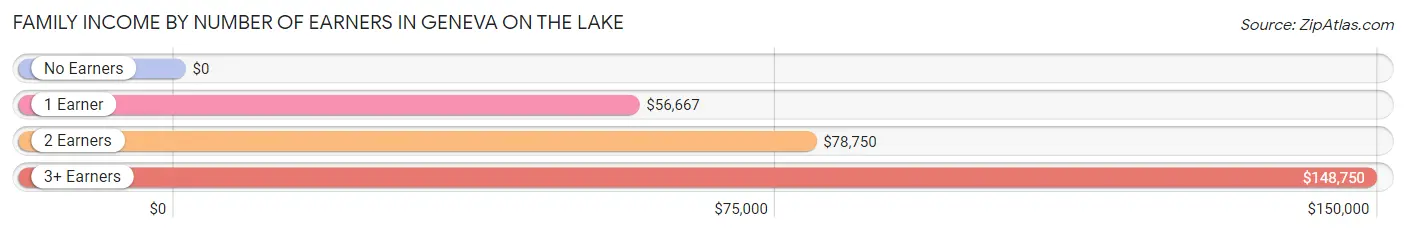
| Number of Earners | # Families | Median Income |
| No Earners | 43 (22.1%) | $0 |
| 1 Earner | 100 (51.3%) | $56,667 |
| 2 Earners | 30 (15.4%) | $78,750 |
| 3+ Earners | 22 (11.3%) | $148,750 |
| Total | 195 (100.0%) | $61,528 |
Household Income in Geneva on the Lake
Household Income Brackets in Geneva on the Lake
With 118 households falling in the category, the $35,000 to $49,999 income range is the most frequent in Geneva on the Lake, accounting for 22.3% of all households. In contrast, only 4 households (0.8%) fall into the $200,000+ income bracket, making it the least populous group.
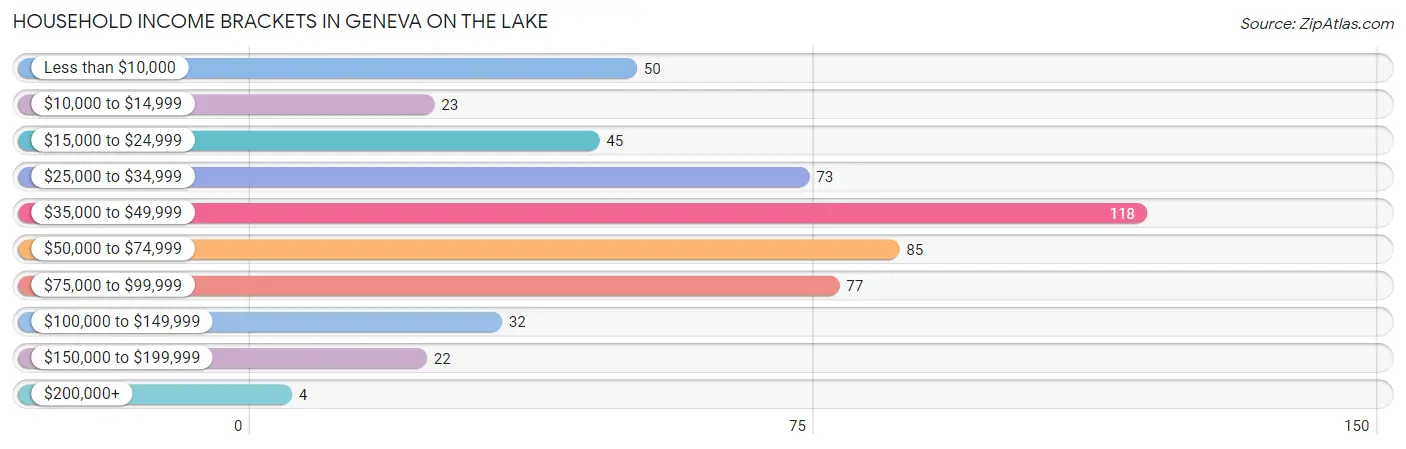
| Income Bracket | # Households | % Households |
| Less than $10,000 | 50 | 9.5% |
| $10,000 to $14,999 | 23 | 4.3% |
| $15,000 to $24,999 | 45 | 8.5% |
| $25,000 to $34,999 | 73 | 13.8% |
| $35,000 to $49,999 | 118 | 22.3% |
| $50,000 to $74,999 | 85 | 16.1% |
| $75,000 to $99,999 | 77 | 14.6% |
| $100,000 to $149,999 | 32 | 6.0% |
| $150,000 to $199,999 | 22 | 4.2% |
| $200,000+ | 4 | 0.8% |
Household Income by Householder Age in Geneva on the Lake
The median household income in Geneva on the Lake is $45,755, with the highest median household income of $60,769 found in the 15 to 24 years age bracket for the primary householder. A total of 18 households (3.4%) fall into this category. Meanwhile, the 65+ years age bracket for the primary householder has the lowest median household income of $31,094, with 198 households (37.4%) in this group.
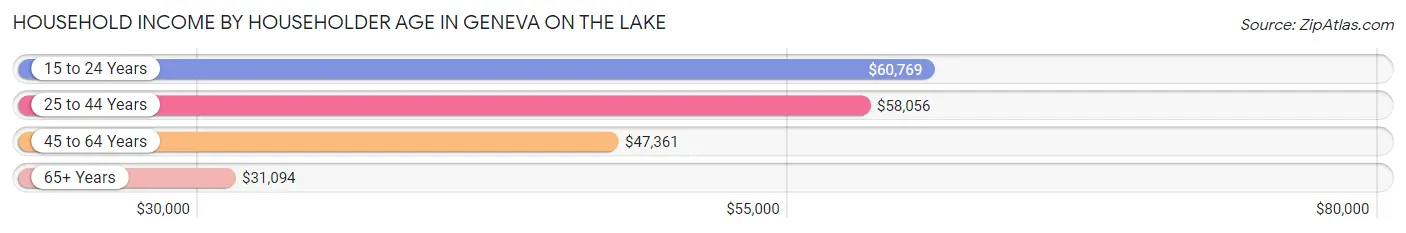
| Income Bracket | # Households | Median Income |
| 15 to 24 Years | 18 (3.4%) | $60,769 |
| 25 to 44 Years | 78 (14.7%) | $58,056 |
| 45 to 64 Years | 235 (44.4%) | $47,361 |
| 65+ Years | 198 (37.4%) | $31,094 |
| Total | 529 (100.0%) | $45,755 |
Poverty in Geneva on the Lake
Income Below Poverty by Sex and Age in Geneva on the Lake
With 11.8% poverty level for males and 19.1% for females among the residents of Geneva on the Lake, 65 to 74 year old males and 35 to 44 year old females are the most vulnerable to poverty, with 20 males (23.8%) and 37 females (43.5%) in their respective age groups living below the poverty level.
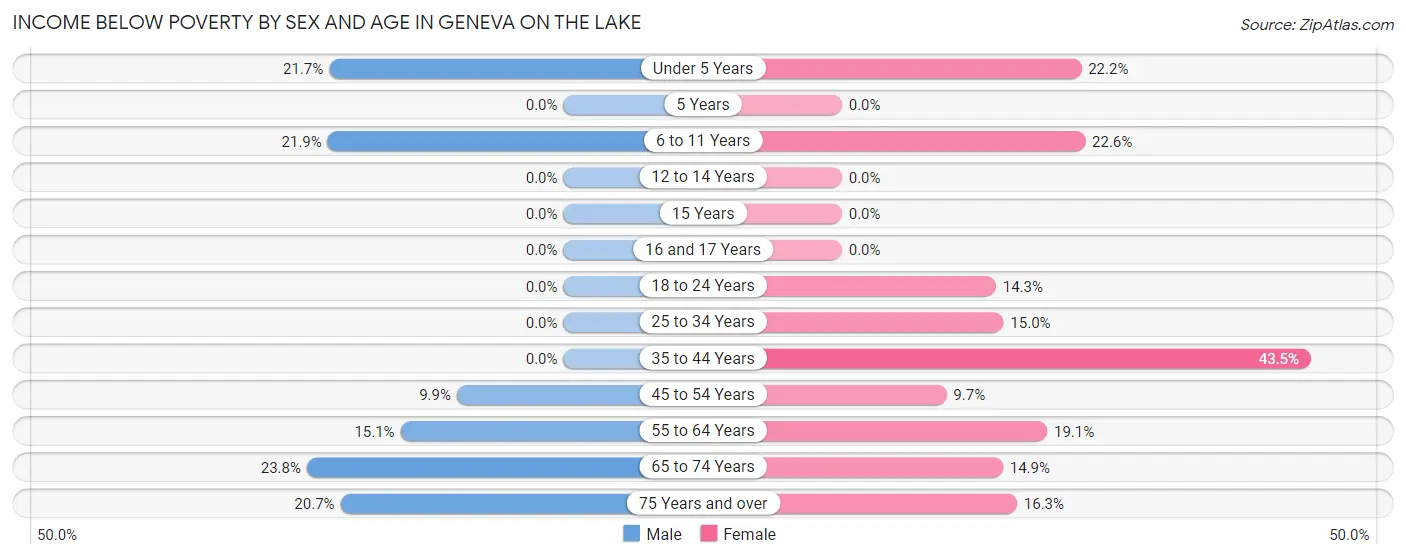
| Age Bracket | Male | Female |
| Under 5 Years | 10 (21.7%) | 2 (22.2%) |
| 5 Years | 0 (0.0%) | 0 (0.0%) |
| 6 to 11 Years | 7 (21.9%) | 7 (22.6%) |
| 12 to 14 Years | 0 (0.0%) | 0 (0.0%) |
| 15 Years | 0 (0.0%) | 0 (0.0%) |
| 16 and 17 Years | 0 (0.0%) | 0 (0.0%) |
| 18 to 24 Years | 0 (0.0%) | 2 (14.3%) |
| 25 to 34 Years | 0 (0.0%) | 6 (15.0%) |
| 35 to 44 Years | 0 (0.0%) | 37 (43.5%) |
| 45 to 54 Years | 9 (9.9%) | 10 (9.7%) |
| 55 to 64 Years | 13 (15.1%) | 12 (19.1%) |
| 65 to 74 Years | 20 (23.8%) | 13 (14.9%) |
| 75 Years and over | 6 (20.7%) | 13 (16.3%) |
| Total | 65 (11.8%) | 102 (19.1%) |
Income Above Poverty by Sex and Age in Geneva on the Lake
According to the poverty statistics in Geneva on the Lake, males aged 12 to 14 years and females aged 12 to 14 years are the age groups that are most secure financially, with 100.0% of males and 100.0% of females in these age groups living above the poverty line.
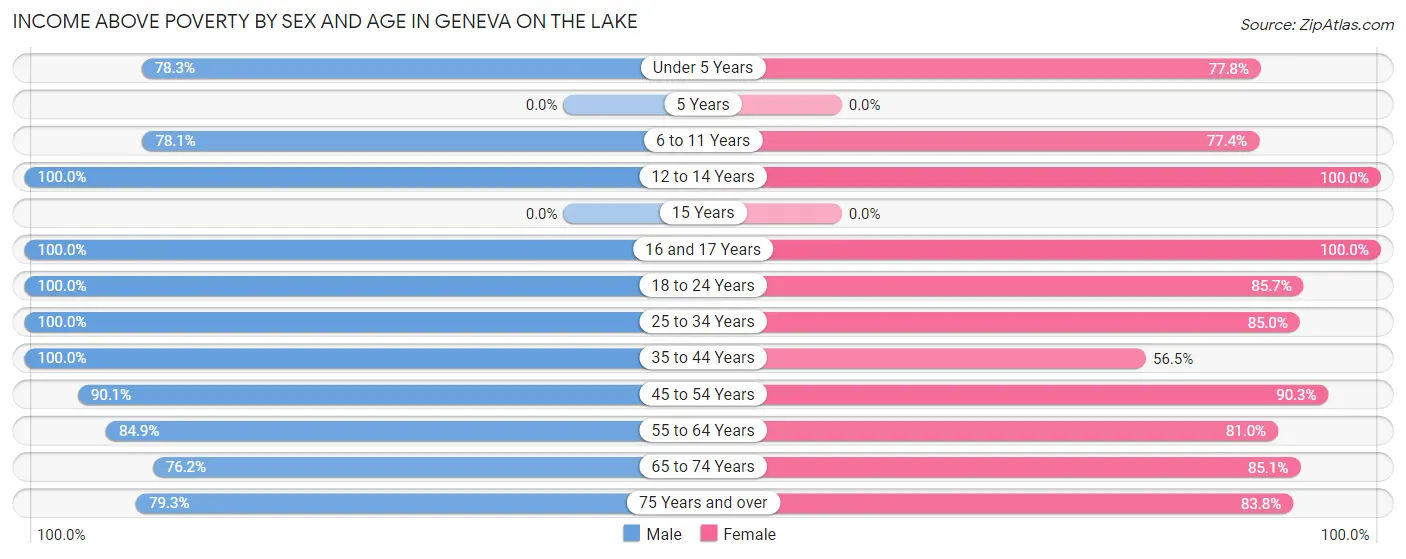
| Age Bracket | Male | Female |
| Under 5 Years | 36 (78.3%) | 7 (77.8%) |
| 5 Years | 0 (0.0%) | 0 (0.0%) |
| 6 to 11 Years | 25 (78.1%) | 24 (77.4%) |
| 12 to 14 Years | 22 (100.0%) | 20 (100.0%) |
| 15 Years | 0 (0.0%) | 0 (0.0%) |
| 16 and 17 Years | 4 (100.0%) | 3 (100.0%) |
| 18 to 24 Years | 31 (100.0%) | 12 (85.7%) |
| 25 to 34 Years | 67 (100.0%) | 34 (85.0%) |
| 35 to 44 Years | 58 (100.0%) | 48 (56.5%) |
| 45 to 54 Years | 82 (90.1%) | 93 (90.3%) |
| 55 to 64 Years | 73 (84.9%) | 51 (80.9%) |
| 65 to 74 Years | 64 (76.2%) | 74 (85.1%) |
| 75 Years and over | 23 (79.3%) | 67 (83.8%) |
| Total | 485 (88.2%) | 433 (80.9%) |
Income Below Poverty Among Married-Couple Families in Geneva on the Lake
The poverty statistics for married-couple families in Geneva on the Lake show that 15.6% or 15 of the total 96 families live below the poverty line. Families with no children have the highest poverty rate of 19.7%, comprising of 15 families. On the other hand, families with 1 or 2 children have the lowest poverty rate of 0.0%, which includes 0 families.
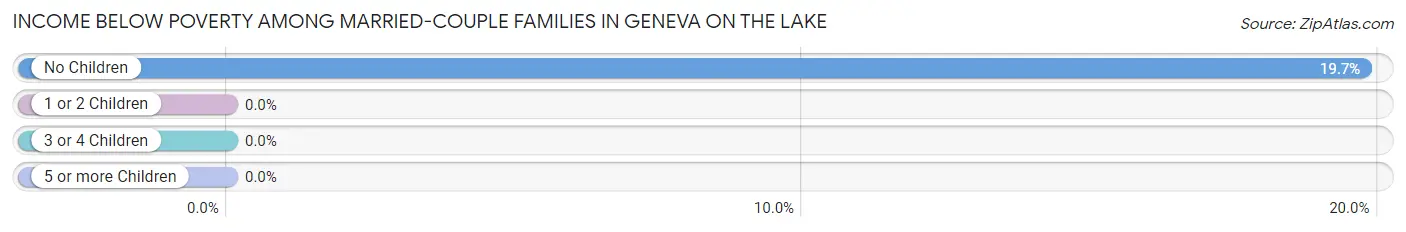
| Children | Above Poverty | Below Poverty |
| No Children | 61 (80.3%) | 15 (19.7%) |
| 1 or 2 Children | 18 (100.0%) | 0 (0.0%) |
| 3 or 4 Children | 2 (100.0%) | 0 (0.0%) |
| 5 or more Children | 0 (0.0%) | 0 (0.0%) |
| Total | 81 (84.4%) | 15 (15.6%) |
Income Below Poverty Among Single-Parent Households in Geneva on the Lake
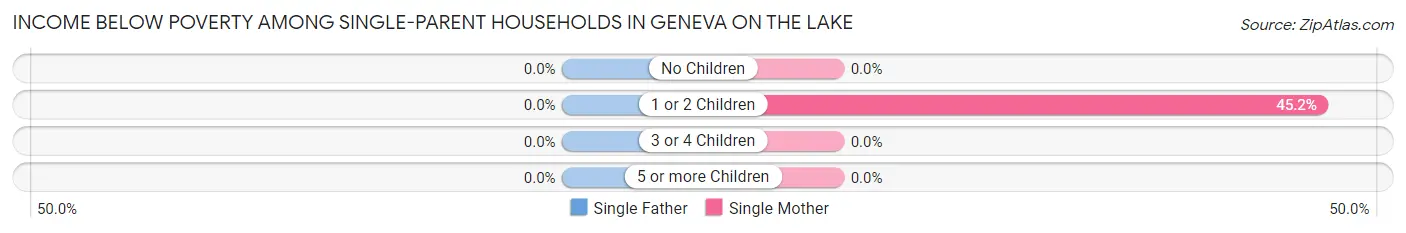
| Children | Single Father | Single Mother |
| No Children | 0 (0.0%) | 0 (0.0%) |
| 1 or 2 Children | 0 (0.0%) | 14 (45.2%) |
| 3 or 4 Children | 0 (0.0%) | 0 (0.0%) |
| 5 or more Children | 0 (0.0%) | 0 (0.0%) |
| Total | 0 (0.0%) | 14 (22.2%) |
Income Below Poverty Among Married-Couple vs Single-Parent Households in Geneva on the Lake
The poverty data for Geneva on the Lake shows that 15 of the married-couple family households (15.6%) and 14 of the single-parent households (14.1%) are living below the poverty level. Within the married-couple family households, those with no children have the highest poverty rate, with 15 households (19.7%) falling below the poverty line. Among the single-parent households, those with 1 or 2 children have the highest poverty rate, with 14 household (35.0%) living below poverty.
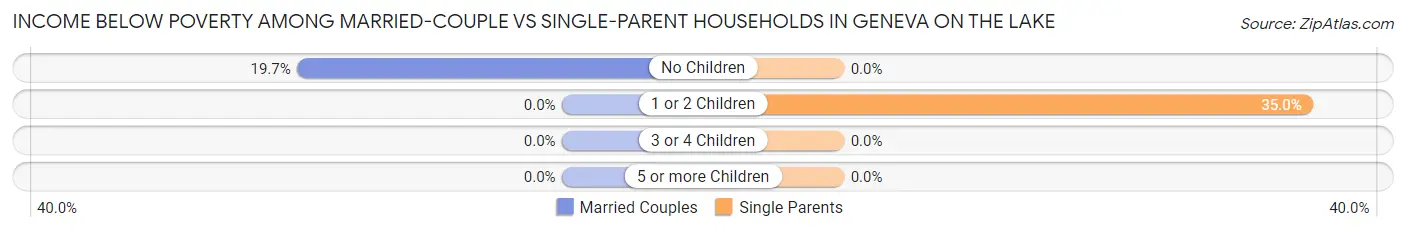
| Children | Married-Couple Families | Single-Parent Households |
| No Children | 15 (19.7%) | 0 (0.0%) |
| 1 or 2 Children | 0 (0.0%) | 14 (35.0%) |
| 3 or 4 Children | 0 (0.0%) | 0 (0.0%) |
| 5 or more Children | 0 (0.0%) | 0 (0.0%) |
| Total | 15 (15.6%) | 14 (14.1%) |
Race in Geneva on the Lake
The most populous races in Geneva on the Lake are White / Caucasian (945 | 87.1%), Two or more Races (74 | 6.8%), and Asian (43 | 4.0%).
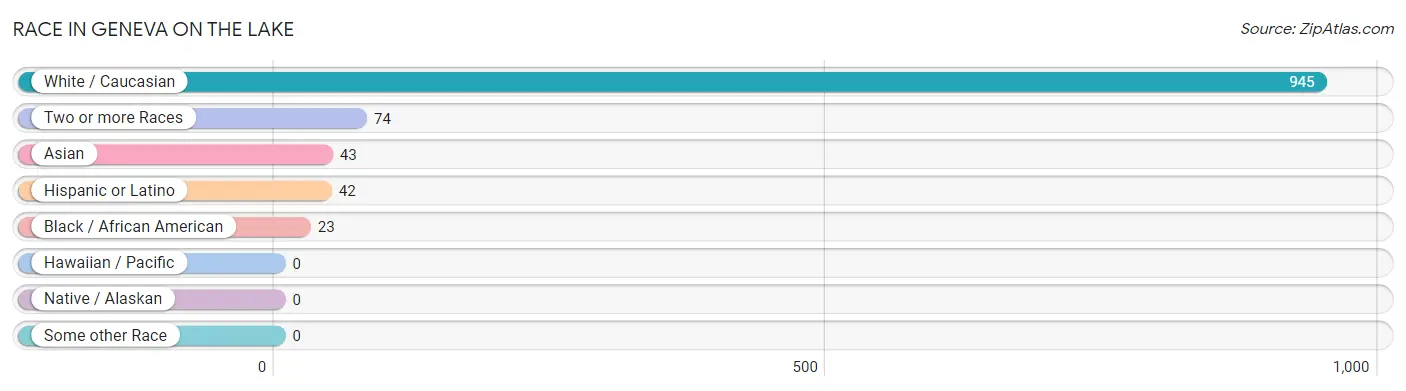
| Race | # Population | % Population |
| Asian | 43 | 4.0% |
| Black / African American | 23 | 2.1% |
| Hawaiian / Pacific | 0 | 0.0% |
| Hispanic or Latino | 42 | 3.9% |
| Native / Alaskan | 0 | 0.0% |
| White / Caucasian | 945 | 87.1% |
| Two or more Races | 74 | 6.8% |
| Some other Race | 0 | 0.0% |
| Total | 1,085 | 100.0% |
Ancestry in Geneva on the Lake
The most populous ancestries reported in Geneva on the Lake are English (167 | 15.4%), American (137 | 12.6%), Irish (130 | 12.0%), Italian (123 | 11.3%), and German (118 | 10.9%), together accounting for 62.2% of all Geneva on the Lake residents.
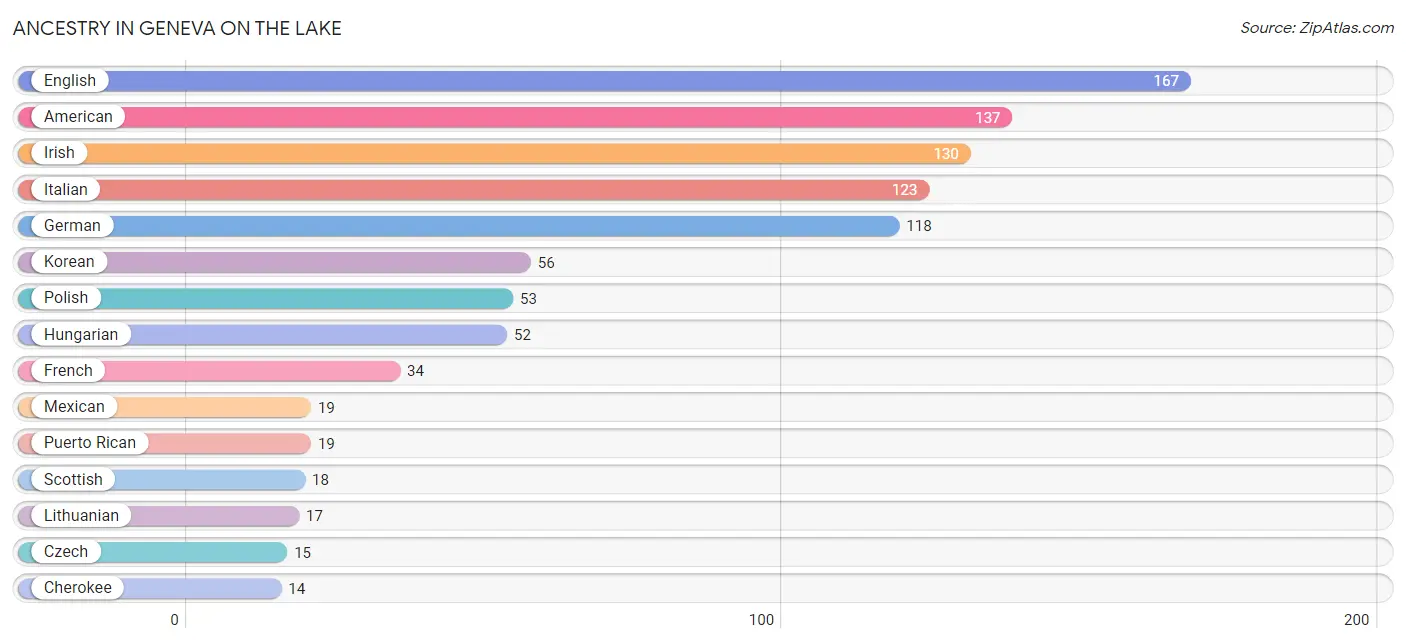
| Ancestry | # Population | % Population |
| American | 137 | 12.6% |
| Austrian | 4 | 0.4% |
| British | 6 | 0.5% |
| Burmese | 6 | 0.5% |
| Central American | 4 | 0.4% |
| Cherokee | 14 | 1.3% |
| Croatian | 7 | 0.6% |
| Czech | 15 | 1.4% |
| Dutch | 3 | 0.3% |
| English | 167 | 15.4% |
| French | 34 | 3.1% |
| French Canadian | 4 | 0.4% |
| German | 118 | 10.9% |
| Hungarian | 52 | 4.8% |
| Irish | 130 | 12.0% |
| Italian | 123 | 11.3% |
| Korean | 56 | 5.2% |
| Lithuanian | 17 | 1.6% |
| Mexican | 19 | 1.8% |
| Northern European | 2 | 0.2% |
| Norwegian | 10 | 0.9% |
| Pennsylvania German | 3 | 0.3% |
| Polish | 53 | 4.9% |
| Puerto Rican | 19 | 1.8% |
| Russian | 8 | 0.7% |
| Salvadoran | 4 | 0.4% |
| Scotch-Irish | 10 | 0.9% |
| Scottish | 18 | 1.7% |
| Slovak | 10 | 0.9% |
| Swedish | 3 | 0.3% |
| Thai | 6 | 0.5% |
| Welsh | 6 | 0.5% | View All 32 Rows |
Immigrants in Geneva on the Lake
The most numerous immigrant groups reported in Geneva on the Lake came from Asia (37 | 3.4%), Philippines (31 | 2.9%), South Eastern Asia (31 | 2.9%), Europe (27 | 2.5%), and France (24 | 2.2%), together accounting for 13.8% of all Geneva on the Lake residents.
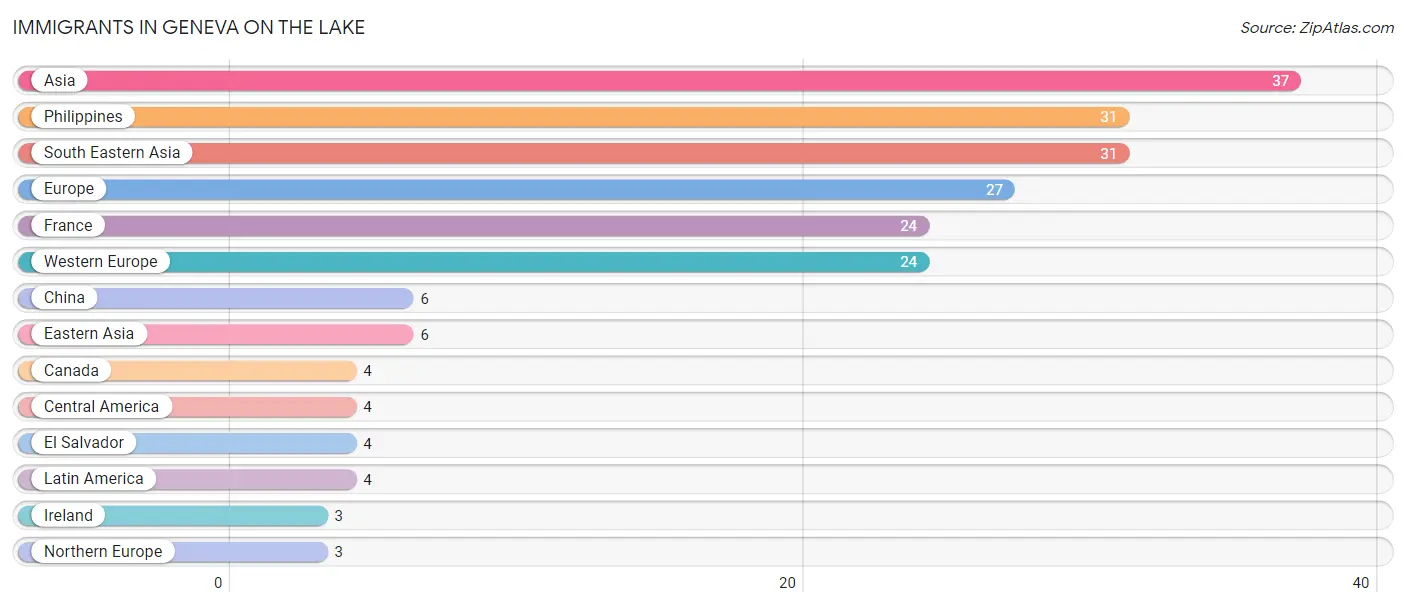
| Immigration Origin | # Population | % Population |
| Asia | 37 | 3.4% |
| Canada | 4 | 0.4% |
| Central America | 4 | 0.4% |
| China | 6 | 0.5% |
| Eastern Asia | 6 | 0.5% |
| El Salvador | 4 | 0.4% |
| Europe | 27 | 2.5% |
| France | 24 | 2.2% |
| Ireland | 3 | 0.3% |
| Latin America | 4 | 0.4% |
| Northern Europe | 3 | 0.3% |
| Philippines | 31 | 2.9% |
| South Eastern Asia | 31 | 2.9% |
| Western Europe | 24 | 2.2% | View All 14 Rows |
Sex and Age in Geneva on the Lake
Sex and Age in Geneva on the Lake
The most populous age groups in Geneva on the Lake are 50 to 54 Years (61 | 11.1%) for men and 45 to 49 Years (62 | 11.6%) for women.
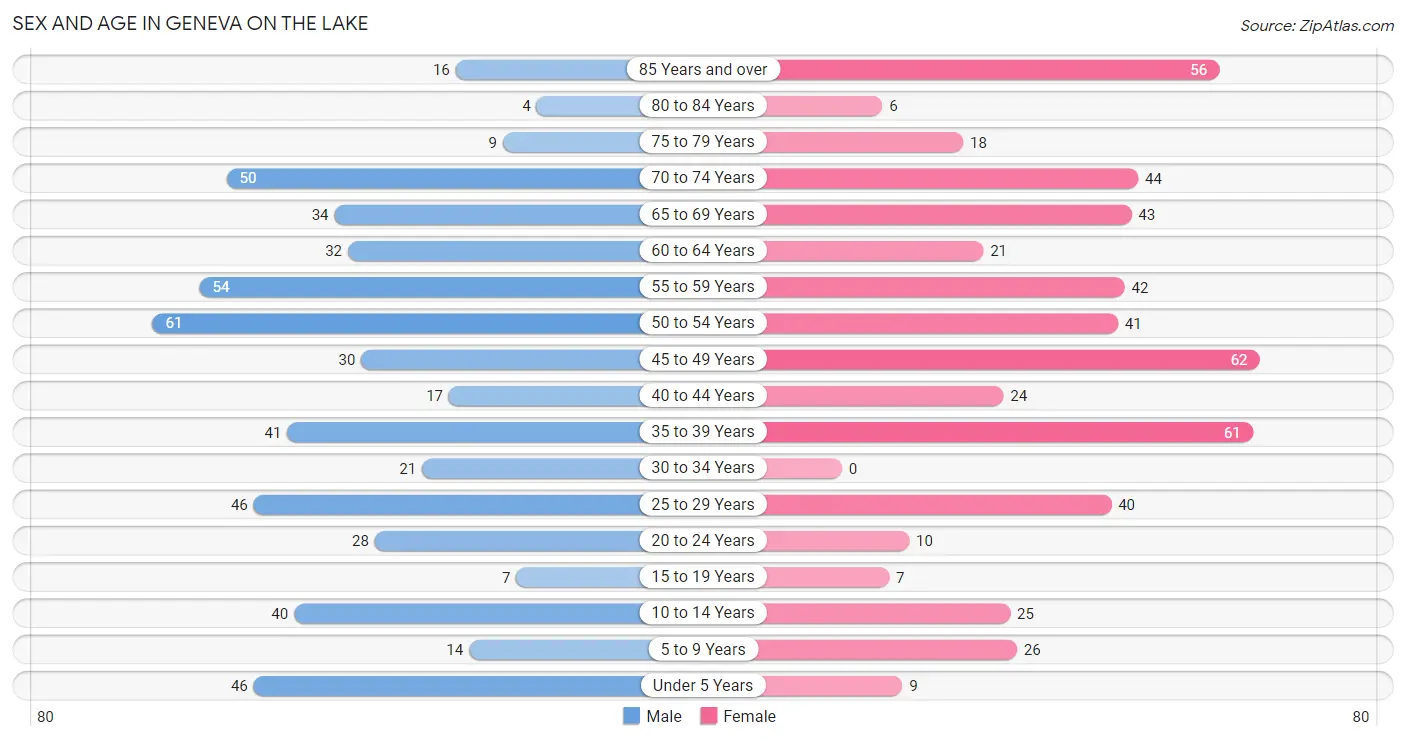
| Age Bracket | Male | Female |
| Under 5 Years | 46 (8.4%) | 9 (1.7%) |
| 5 to 9 Years | 14 (2.5%) | 26 (4.9%) |
| 10 to 14 Years | 40 (7.3%) | 25 (4.7%) |
| 15 to 19 Years | 7 (1.3%) | 7 (1.3%) |
| 20 to 24 Years | 28 (5.1%) | 10 (1.9%) |
| 25 to 29 Years | 46 (8.4%) | 40 (7.5%) |
| 30 to 34 Years | 21 (3.8%) | 0 (0.0%) |
| 35 to 39 Years | 41 (7.4%) | 61 (11.4%) |
| 40 to 44 Years | 17 (3.1%) | 24 (4.5%) |
| 45 to 49 Years | 30 (5.4%) | 62 (11.6%) |
| 50 to 54 Years | 61 (11.1%) | 41 (7.7%) |
| 55 to 59 Years | 54 (9.8%) | 42 (7.9%) |
| 60 to 64 Years | 32 (5.8%) | 21 (3.9%) |
| 65 to 69 Years | 34 (6.2%) | 43 (8.0%) |
| 70 to 74 Years | 50 (9.1%) | 44 (8.2%) |
| 75 to 79 Years | 9 (1.6%) | 18 (3.4%) |
| 80 to 84 Years | 4 (0.7%) | 6 (1.1%) |
| 85 Years and over | 16 (2.9%) | 56 (10.5%) |
| Total | 550 (100.0%) | 535 (100.0%) |
Families and Households in Geneva on the Lake
Median Family Size in Geneva on the Lake
The median family size in Geneva on the Lake is 3.29 persons per family, with single female/mother families (63 | 32.3%) accounting for the largest median family size of 3.46 persons per family. On the other hand, single male/father families (36 | 18.5%) represent the smallest median family size with 3.17 persons per family.
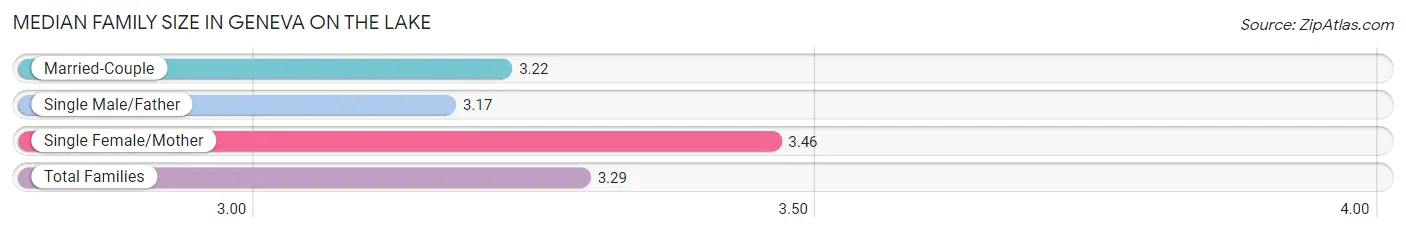
| Family Type | # Families | Family Size |
| Married-Couple | 96 (49.2%) | 3.22 |
| Single Male/Father | 36 (18.5%) | 3.17 |
| Single Female/Mother | 63 (32.3%) | 3.46 |
| Total Families | 195 (100.0%) | 3.29 |
Median Household Size in Geneva on the Lake
The median household size in Geneva on the Lake is 2.05 persons per household, with single female/mother households (63 | 11.9%) accounting for the largest median household size of 3.97 persons per household. non-family households (334 | 63.1%) represent the smallest median household size with 1.18 persons per household.
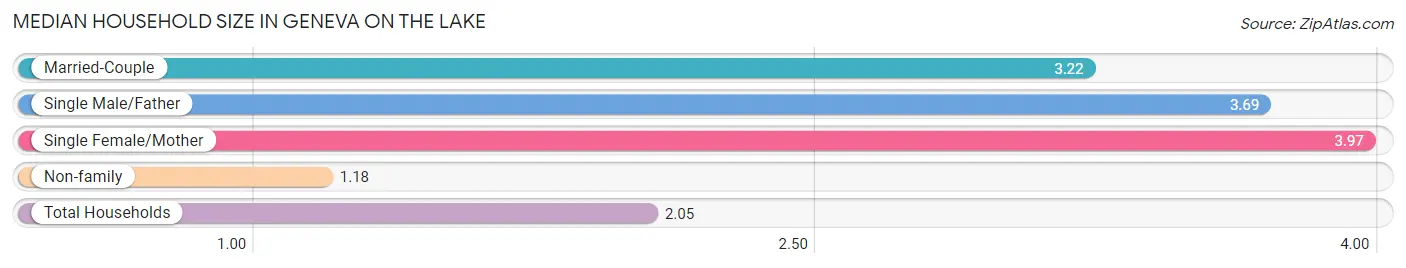
| Household Type | # Households | Household Size |
| Married-Couple | 96 (18.1%) | 3.22 |
| Single Male/Father | 36 (6.8%) | 3.69 |
| Single Female/Mother | 63 (11.9%) | 3.97 |
| Non-family | 334 (63.1%) | 1.18 |
| Total Households | 529 (100.0%) | 2.05 |
Household Size by Marriage Status in Geneva on the Lake
Out of a total of 529 households in Geneva on the Lake, 195 (36.9%) are family households, while 334 (63.1%) are nonfamily households. The most numerous type of family households are 2-person households, comprising 84, and the most common type of nonfamily households are 1-person households, comprising 268.
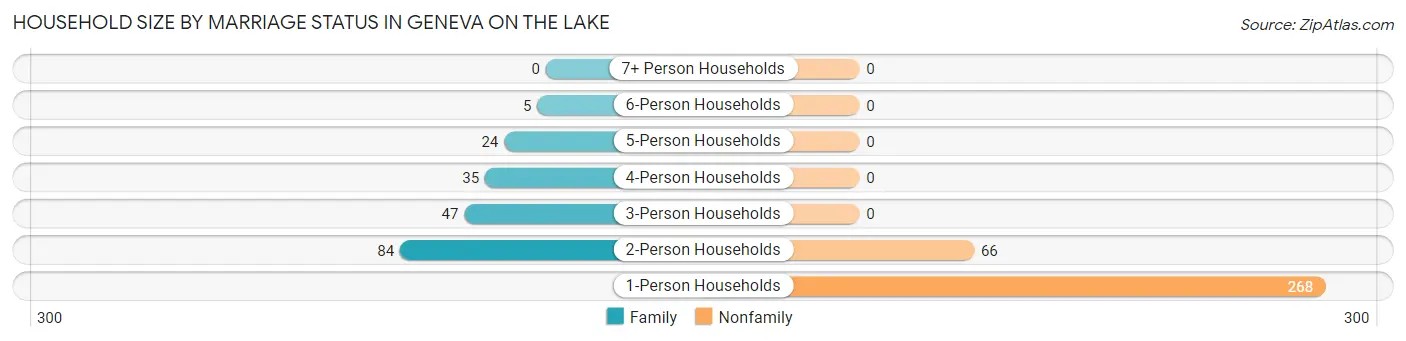
| Household Size | Family Households | Nonfamily Households |
| 1-Person Households | - | 268 (50.7%) |
| 2-Person Households | 84 (15.9%) | 66 (12.5%) |
| 3-Person Households | 47 (8.9%) | 0 (0.0%) |
| 4-Person Households | 35 (6.6%) | 0 (0.0%) |
| 5-Person Households | 24 (4.5%) | 0 (0.0%) |
| 6-Person Households | 5 (0.9%) | 0 (0.0%) |
| 7+ Person Households | 0 (0.0%) | 0 (0.0%) |
| Total | 195 (36.9%) | 334 (63.1%) |
Female Fertility in Geneva on the Lake
Fertility by Age in Geneva on the Lake
| Age Bracket | Women with Births | Births / 1,000 Women |
| 15 to 19 years | 0 (0.0%) | 0.0 |
| 20 to 34 years | 0 (0.0%) | 0.0 |
| 35 to 50 years | 0 (0.0%) | 0.0 |
| Total | 0 (0.0%) | 0.0 |
Fertility by Age by Marriage Status in Geneva on the Lake
| Age Bracket | Married | Unmarried |
| 15 to 19 years | 0 (0.0%) | 0 (0.0%) |
| 20 to 34 years | 0 (0.0%) | 0 (0.0%) |
| 35 to 50 years | 0 (0.0%) | 0 (0.0%) |
| Total | 0 (0.0%) | 0 (0.0%) |
Fertility by Education in Geneva on the Lake
| Educational Attainment | Women with Births | Births / 1,000 Women |
| Less than High School | 0 (0.0%) | 0.0 |
| High School Diploma | 0 (0.0%) | 0.0 |
| College or Associate's Degree | 0 (0.0%) | 0.0 |
| Bachelor's Degree | 0 (0.0%) | 0.0 |
| Graduate Degree | 0 (0.0%) | 0.0 |
| Total | 0 (0.0%) | 0.0 |
Fertility by Education by Marriage Status in Geneva on the Lake
| Educational Attainment | Married | Unmarried |
| Less than High School | 0 (0.0%) | 0 (0.0%) |
| High School Diploma | 0 (0.0%) | 0 (0.0%) |
| College or Associate's Degree | 0 (0.0%) | 0 (0.0%) |
| Bachelor's Degree | 0 (0.0%) | 0 (0.0%) |
| Graduate Degree | 0 (0.0%) | 0 (0.0%) |
| Total | 0 (0.0%) | 0 (0.0%) |
Employment Characteristics in Geneva on the Lake
Employment by Class of Employer in Geneva on the Lake
Among the 481 employed individuals in Geneva on the Lake, private company employees (368 | 76.5%), self-employed (incorporated) (50 | 10.4%), and not-for-profit organizations (27 | 5.6%) make up the most common classes of employment.
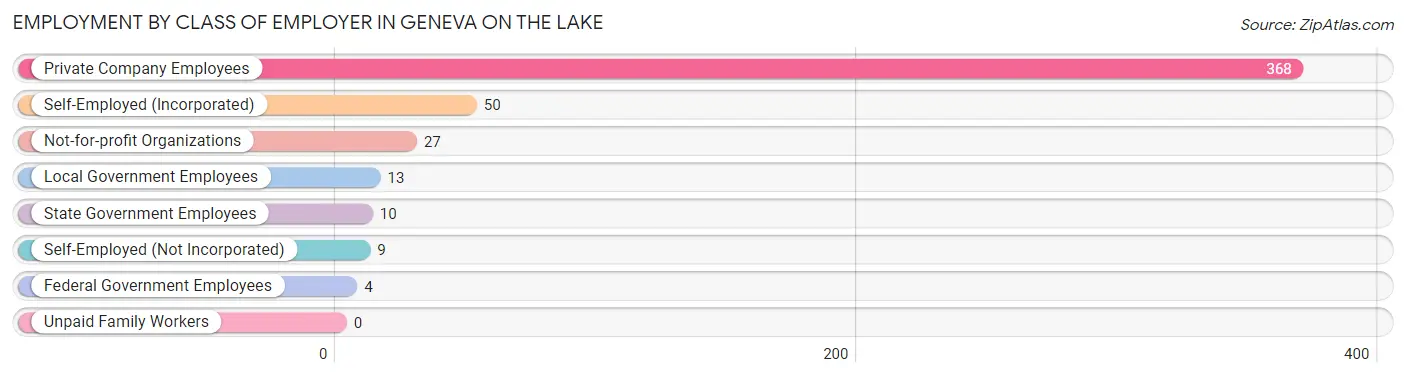
| Employer Class | # Employees | % Employees |
| Private Company Employees | 368 | 76.5% |
| Self-Employed (Incorporated) | 50 | 10.4% |
| Self-Employed (Not Incorporated) | 9 | 1.9% |
| Not-for-profit Organizations | 27 | 5.6% |
| Local Government Employees | 13 | 2.7% |
| State Government Employees | 10 | 2.1% |
| Federal Government Employees | 4 | 0.8% |
| Unpaid Family Workers | 0 | 0.0% |
| Total | 481 | 100.0% |
Employment Status by Age in Geneva on the Lake
According to the labor force statistics for Geneva on the Lake, out of the total population over 16 years of age (925), 58.3% or 539 individuals are in the labor force, with 6.9% or 37 of them unemployed. The age group with the highest labor force participation rate is 25 to 29 years, with 88.4% or 76 individuals in the labor force. Within the labor force, the 35 to 44 years age range has the highest percentage of unemployed individuals, with 17.5% or 21 of them being unemployed.
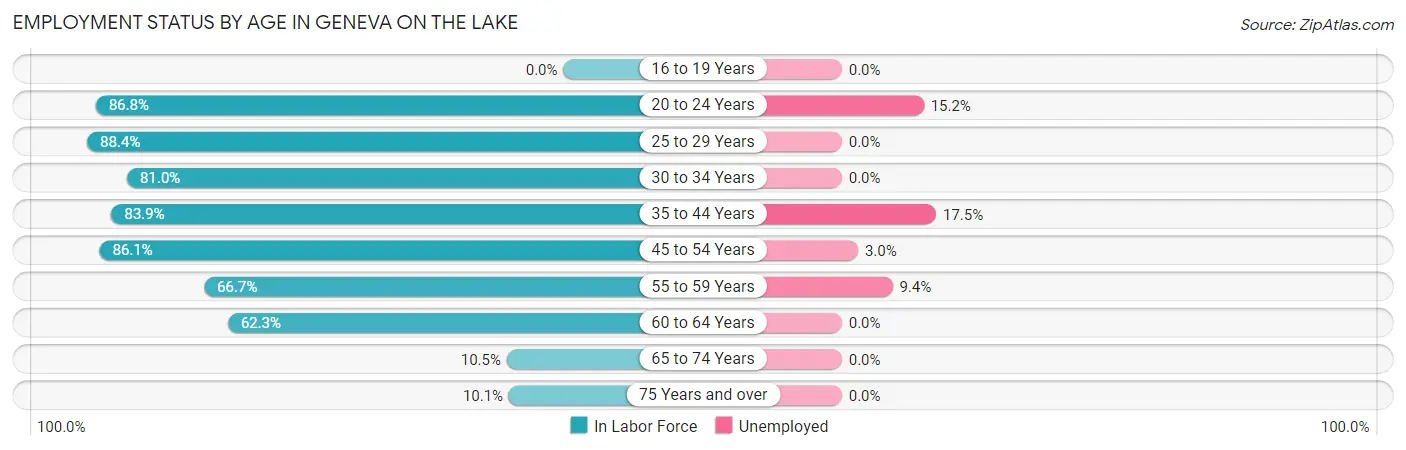
| Age Bracket | In Labor Force | Unemployed |
| 16 to 19 Years | 0 (0.0%) | 0 (0.0%) |
| 20 to 24 Years | 33 (86.8%) | 5 (15.2%) |
| 25 to 29 Years | 76 (88.4%) | 0 (0.0%) |
| 30 to 34 Years | 17 (81.0%) | 0 (0.0%) |
| 35 to 44 Years | 120 (83.9%) | 21 (17.5%) |
| 45 to 54 Years | 167 (86.1%) | 5 (3.0%) |
| 55 to 59 Years | 64 (66.7%) | 6 (9.4%) |
| 60 to 64 Years | 33 (62.3%) | 0 (0.0%) |
| 65 to 74 Years | 18 (10.5%) | 0 (0.0%) |
| 75 Years and over | 11 (10.1%) | 0 (0.0%) |
| Total | 539 (58.3%) | 37 (6.9%) |
Employment Status by Educational Attainment in Geneva on the Lake
According to labor force statistics for Geneva on the Lake, 80.4% of individuals (477) out of the total population between 25 and 64 years of age (593) are in the labor force, with 6.7% or 32 of them being unemployed. The group with the highest labor force participation rate are those with the educational attainment of college / associate degree, with 83.0% or 176 individuals in the labor force. Within the labor force, individuals with less than high school education have the highest percentage of unemployment, with 64.3% or 9 of them being unemployed.
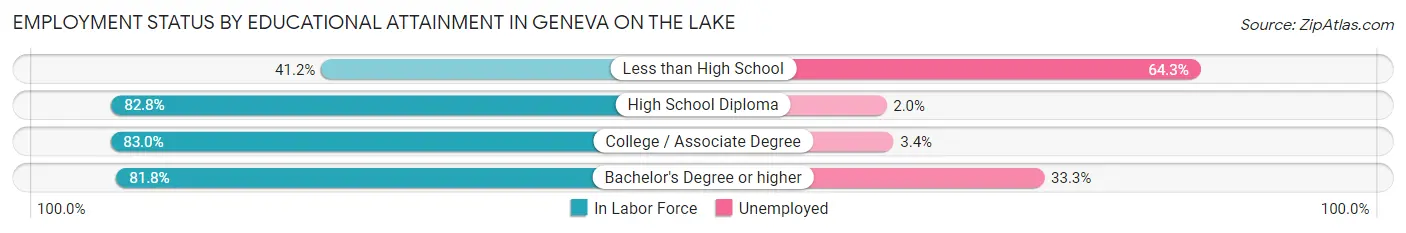
| Educational Attainment | In Labor Force | Unemployed |
| Less than High School | 14 (41.2%) | 22 (64.3%) |
| High School Diploma | 251 (82.8%) | 6 (2.0%) |
| College / Associate Degree | 176 (83.0%) | 7 (3.4%) |
| Bachelor's Degree or higher | 36 (81.8%) | 15 (33.3%) |
| Total | 477 (80.4%) | 40 (6.7%) |
Employment Occupations by Sex in Geneva on the Lake
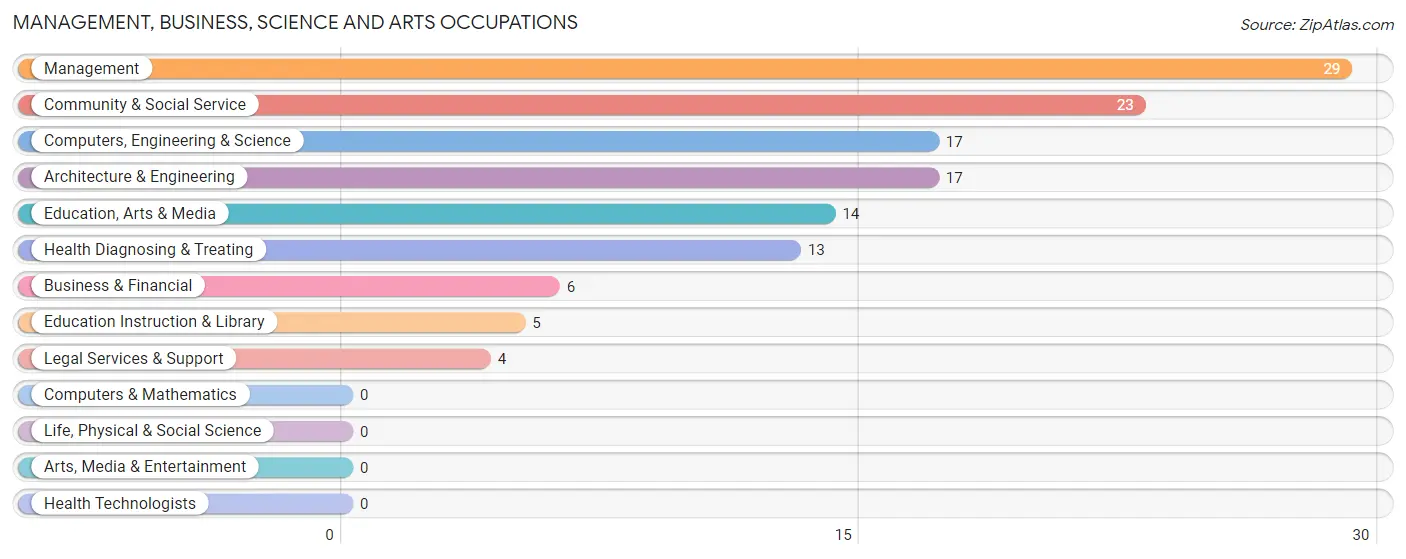
Management, Business, Science and Arts Occupations
The most common Management, Business, Science and Arts occupations in Geneva on the Lake are Management (29 | 5.8%), Community & Social Service (23 | 4.6%), Computers, Engineering & Science (17 | 3.4%), Architecture & Engineering (17 | 3.4%), and Education, Arts & Media (14 | 2.8%).
Management, Business, Science and Arts Occupations by Sex
Within the Management, Business, Science and Arts occupations in Geneva on the Lake, the most male-oriented occupations are Computers, Engineering & Science (100.0%), Architecture & Engineering (100.0%), and Legal Services & Support (100.0%), while the most female-oriented occupations are Health Diagnosing & Treating (100.0%), Education, Arts & Media (71.4%), and Education Instruction & Library (60.0%).
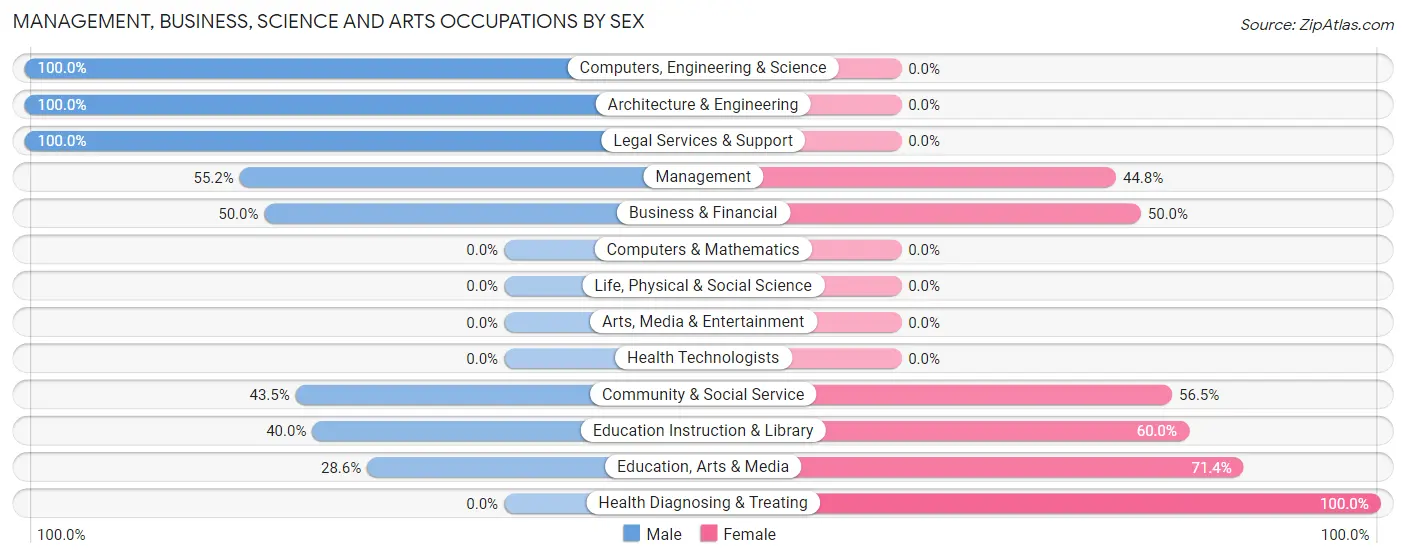
| Occupation | Male | Female |
| Management | 16 (55.2%) | 13 (44.8%) |
| Business & Financial | 3 (50.0%) | 3 (50.0%) |
| Computers, Engineering & Science | 17 (100.0%) | 0 (0.0%) |
| Computers & Mathematics | 0 (0.0%) | 0 (0.0%) |
| Architecture & Engineering | 17 (100.0%) | 0 (0.0%) |
| Life, Physical & Social Science | 0 (0.0%) | 0 (0.0%) |
| Community & Social Service | 10 (43.5%) | 13 (56.5%) |
| Education, Arts & Media | 4 (28.6%) | 10 (71.4%) |
| Legal Services & Support | 4 (100.0%) | 0 (0.0%) |
| Education Instruction & Library | 2 (40.0%) | 3 (60.0%) |
| Arts, Media & Entertainment | 0 (0.0%) | 0 (0.0%) |
| Health Diagnosing & Treating | 0 (0.0%) | 13 (100.0%) |
| Health Technologists | 0 (0.0%) | 0 (0.0%) |
| Total (Category) | 46 (52.3%) | 42 (47.7%) |
| Total (Overall) | 277 (55.2%) | 225 (44.8%) |
Services Occupations
The most common Services occupations in Geneva on the Lake are Food Preparation & Serving (45 | 9.0%), Healthcare Support (13 | 2.6%), Security & Protection (7 | 1.4%), Firefighting & Prevention (7 | 1.4%), and Personal Care & Service (3 | 0.6%).
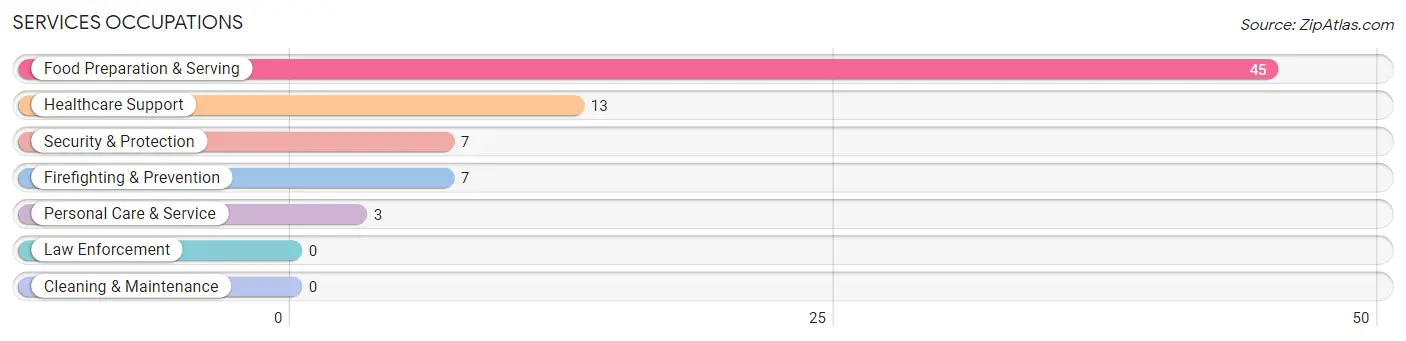
Services Occupations by Sex
Within the Services occupations in Geneva on the Lake, the most male-oriented occupations are Healthcare Support (100.0%), Personal Care & Service (100.0%), and Security & Protection (57.1%), while the most female-oriented occupations are Food Preparation & Serving (57.8%), Security & Protection (42.9%), and Firefighting & Prevention (42.9%).
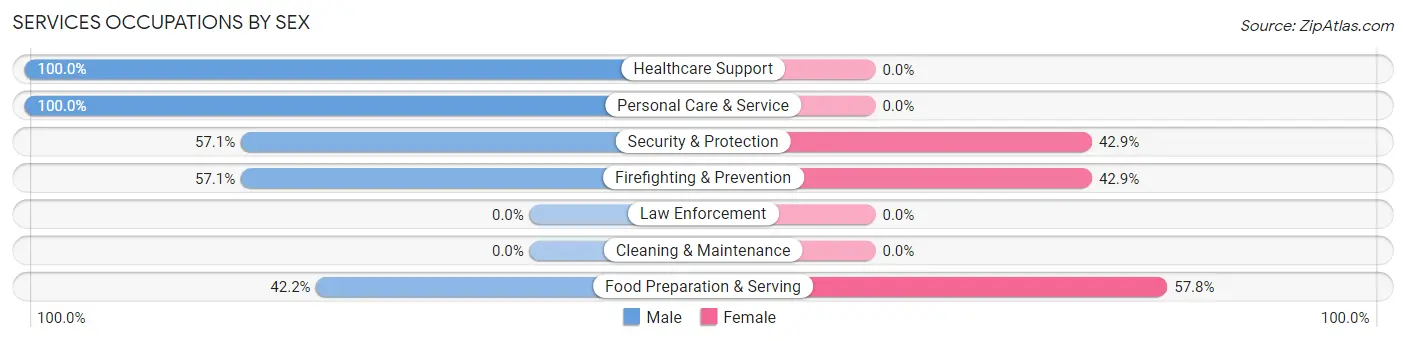
| Occupation | Male | Female |
| Healthcare Support | 13 (100.0%) | 0 (0.0%) |
| Security & Protection | 4 (57.1%) | 3 (42.9%) |
| Firefighting & Prevention | 4 (57.1%) | 3 (42.9%) |
| Law Enforcement | 0 (0.0%) | 0 (0.0%) |
| Food Preparation & Serving | 19 (42.2%) | 26 (57.8%) |
| Cleaning & Maintenance | 0 (0.0%) | 0 (0.0%) |
| Personal Care & Service | 3 (100.0%) | 0 (0.0%) |
| Total (Category) | 39 (57.4%) | 29 (42.6%) |
| Total (Overall) | 277 (55.2%) | 225 (44.8%) |
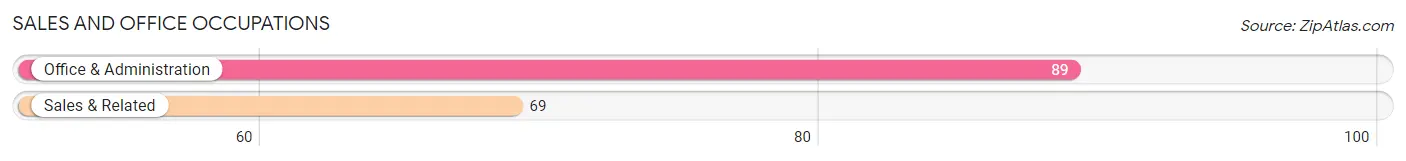
Sales and Office Occupations
The most common Sales and Office occupations in Geneva on the Lake are Office & Administration (89 | 17.7%), and Sales & Related (69 | 13.8%).
Sales and Office Occupations by Sex
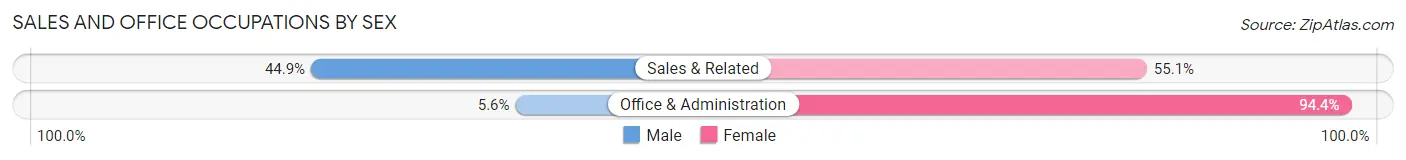
| Occupation | Male | Female |
| Sales & Related | 31 (44.9%) | 38 (55.1%) |
| Office & Administration | 5 (5.6%) | 84 (94.4%) |
| Total (Category) | 36 (22.8%) | 122 (77.2%) |
| Total (Overall) | 277 (55.2%) | 225 (44.8%) |
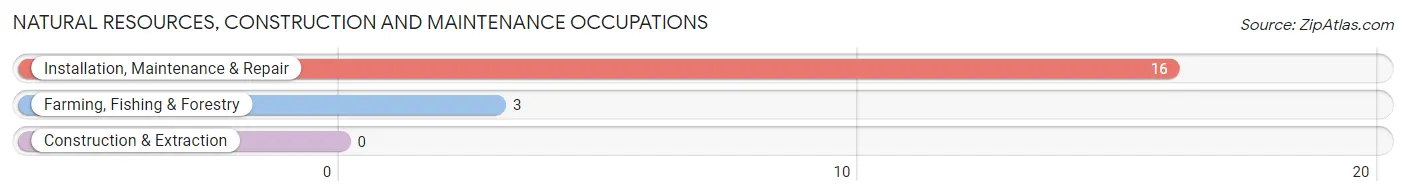
Natural Resources, Construction and Maintenance Occupations
The most common Natural Resources, Construction and Maintenance occupations in Geneva on the Lake are Installation, Maintenance & Repair (16 | 3.2%), and Farming, Fishing & Forestry (3 | 0.6%).
Natural Resources, Construction and Maintenance Occupations by Sex
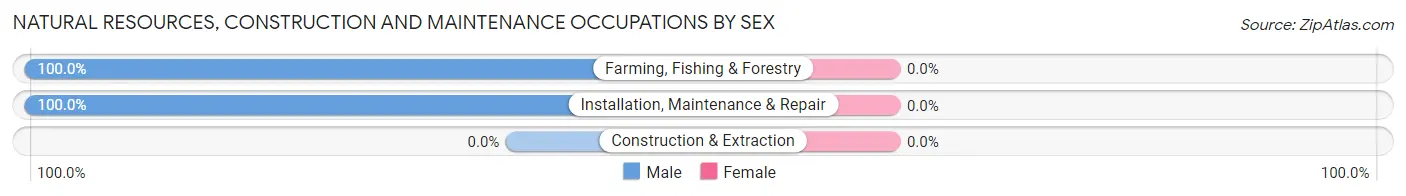
| Occupation | Male | Female |
| Farming, Fishing & Forestry | 3 (100.0%) | 0 (0.0%) |
| Construction & Extraction | 0 (0.0%) | 0 (0.0%) |
| Installation, Maintenance & Repair | 16 (100.0%) | 0 (0.0%) |
| Total (Category) | 19 (100.0%) | 0 (0.0%) |
| Total (Overall) | 277 (55.2%) | 225 (44.8%) |
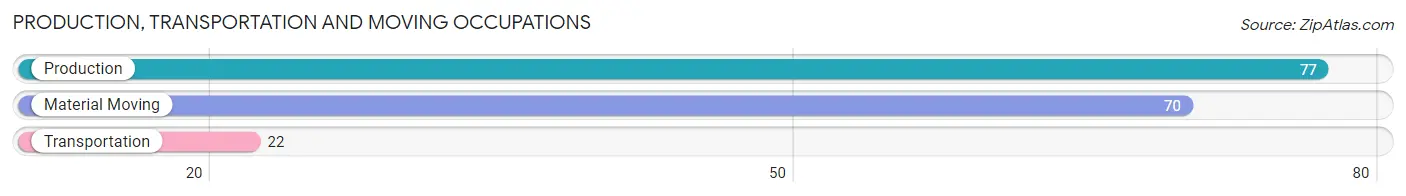
Production, Transportation and Moving Occupations
The most common Production, Transportation and Moving occupations in Geneva on the Lake are Production (77 | 15.3%), Material Moving (70 | 13.9%), and Transportation (22 | 4.4%).
Production, Transportation and Moving Occupations by Sex
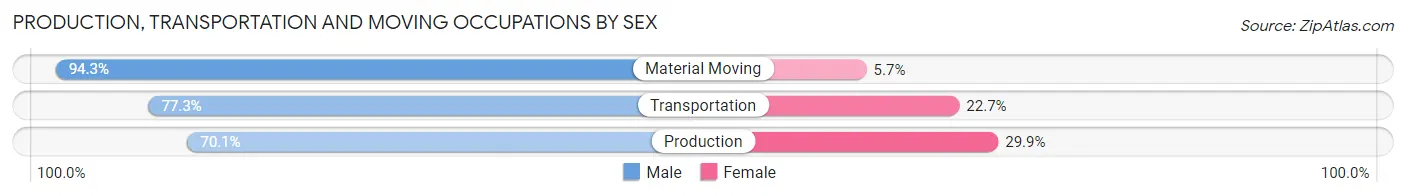
| Occupation | Male | Female |
| Production | 54 (70.1%) | 23 (29.9%) |
| Transportation | 17 (77.3%) | 5 (22.7%) |
| Material Moving | 66 (94.3%) | 4 (5.7%) |
| Total (Category) | 137 (81.1%) | 32 (18.9%) |
| Total (Overall) | 277 (55.2%) | 225 (44.8%) |
Employment Industries by Sex in Geneva on the Lake
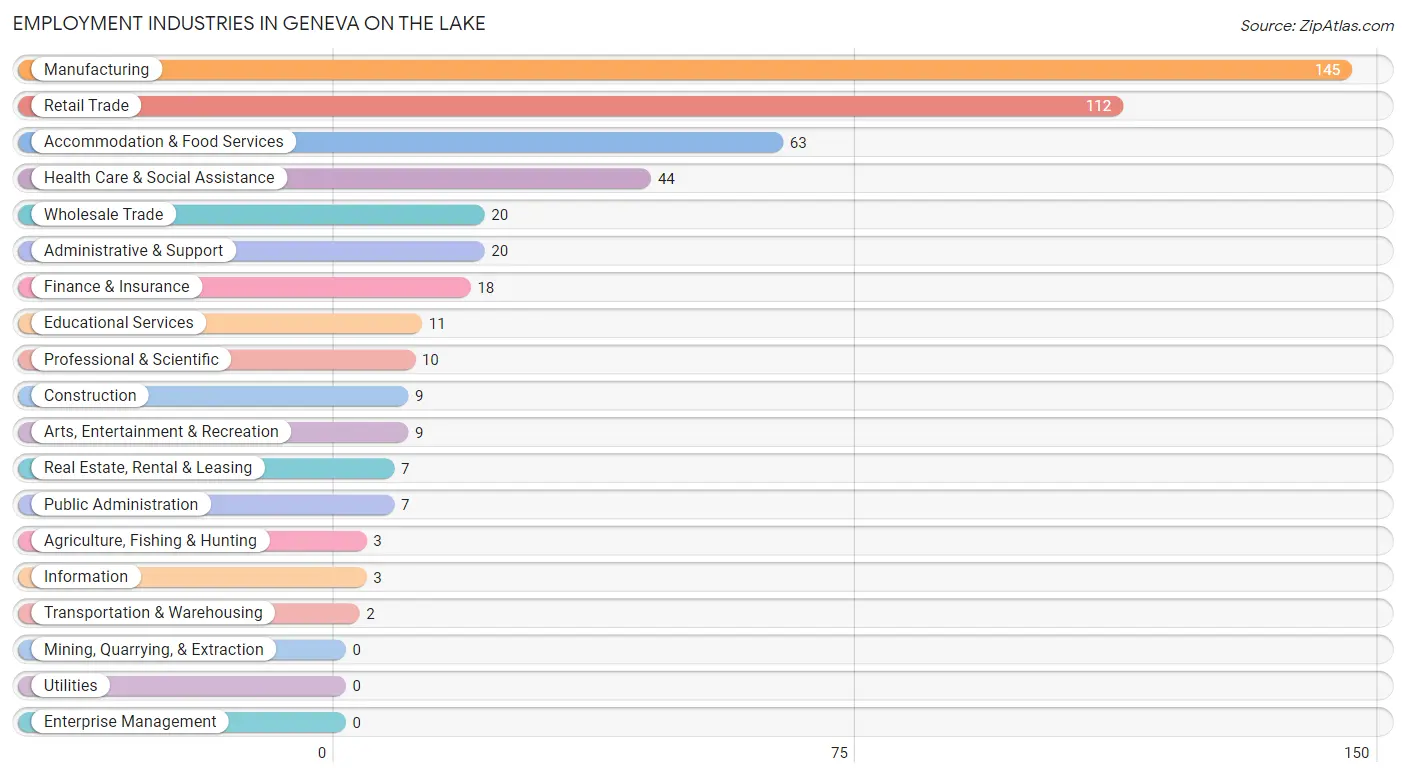
Employment Industries in Geneva on the Lake
The major employment industries in Geneva on the Lake include Manufacturing (145 | 28.9%), Retail Trade (112 | 22.3%), Accommodation & Food Services (63 | 12.6%), Health Care & Social Assistance (44 | 8.8%), and Wholesale Trade (20 | 4.0%).
Employment Industries by Sex in Geneva on the Lake
The Geneva on the Lake industries that see more men than women are Agriculture, Fishing & Hunting (100.0%), Construction (100.0%), and Wholesale Trade (100.0%), whereas the industries that tend to have a higher number of women are Transportation & Warehousing (100.0%), Information (100.0%), and Finance & Insurance (100.0%).
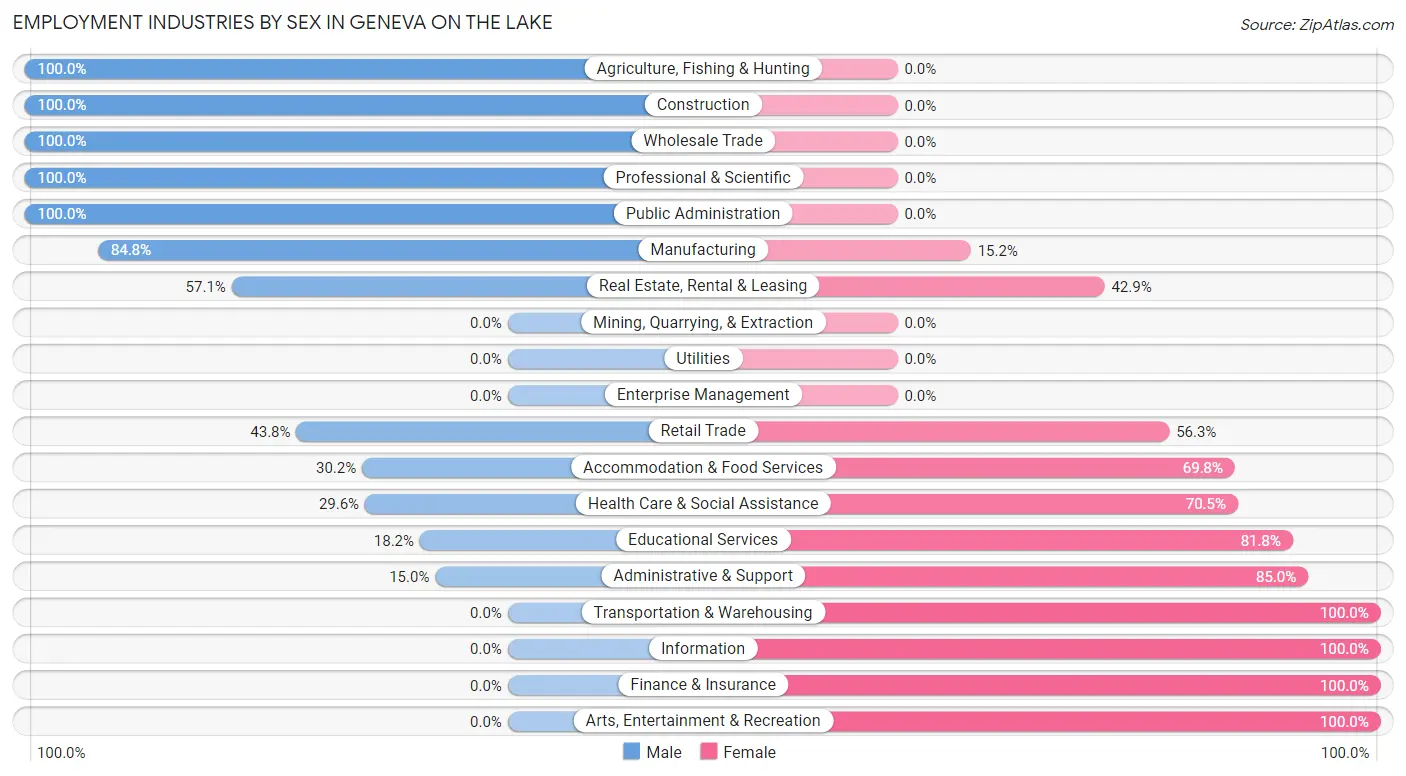
| Industry | Male | Female |
| Agriculture, Fishing & Hunting | 3 (100.0%) | 0 (0.0%) |
| Mining, Quarrying, & Extraction | 0 (0.0%) | 0 (0.0%) |
| Construction | 9 (100.0%) | 0 (0.0%) |
| Manufacturing | 123 (84.8%) | 22 (15.2%) |
| Wholesale Trade | 20 (100.0%) | 0 (0.0%) |
| Retail Trade | 49 (43.8%) | 63 (56.2%) |
| Transportation & Warehousing | 0 (0.0%) | 2 (100.0%) |
| Utilities | 0 (0.0%) | 0 (0.0%) |
| Information | 0 (0.0%) | 3 (100.0%) |
| Finance & Insurance | 0 (0.0%) | 18 (100.0%) |
| Real Estate, Rental & Leasing | 4 (57.1%) | 3 (42.9%) |
| Professional & Scientific | 10 (100.0%) | 0 (0.0%) |
| Enterprise Management | 0 (0.0%) | 0 (0.0%) |
| Administrative & Support | 3 (15.0%) | 17 (85.0%) |
| Educational Services | 2 (18.2%) | 9 (81.8%) |
| Health Care & Social Assistance | 13 (29.5%) | 31 (70.5%) |
| Arts, Entertainment & Recreation | 0 (0.0%) | 9 (100.0%) |
| Accommodation & Food Services | 19 (30.2%) | 44 (69.8%) |
| Public Administration | 7 (100.0%) | 0 (0.0%) |
| Total | 277 (55.2%) | 225 (44.8%) |
Education in Geneva on the Lake
School Enrollment in Geneva on the Lake
The most common levels of schooling among the 151 students in Geneva on the Lake are elementary school (48 | 31.8%), nursery / preschool (36 | 23.8%), and high school (35 | 23.2%).
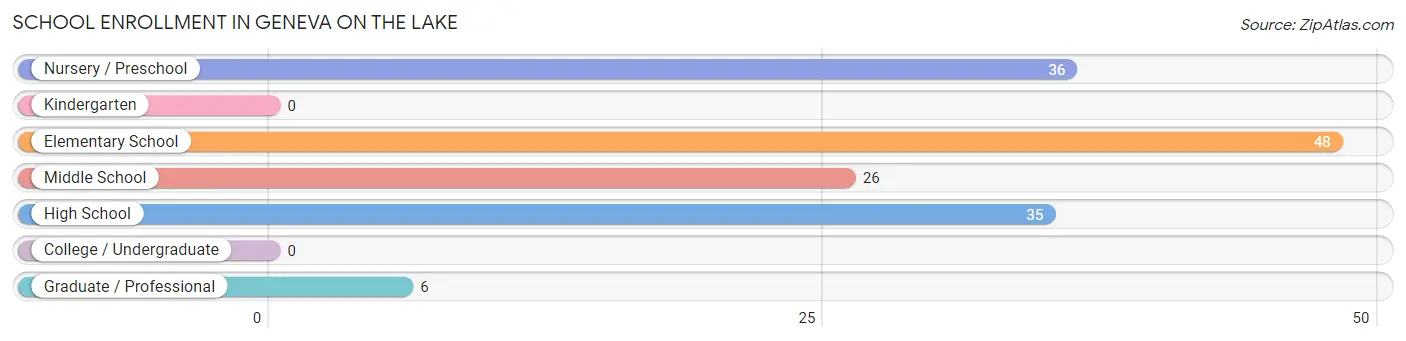
| School Level | # Students | % Students |
| Nursery / Preschool | 36 | 23.8% |
| Kindergarten | 0 | 0.0% |
| Elementary School | 48 | 31.8% |
| Middle School | 26 | 17.2% |
| High School | 35 | 23.2% |
| College / Undergraduate | 0 | 0.0% |
| Graduate / Professional | 6 | 4.0% |
| Total | 151 | 100.0% |
School Enrollment by Age by Funding Source in Geneva on the Lake
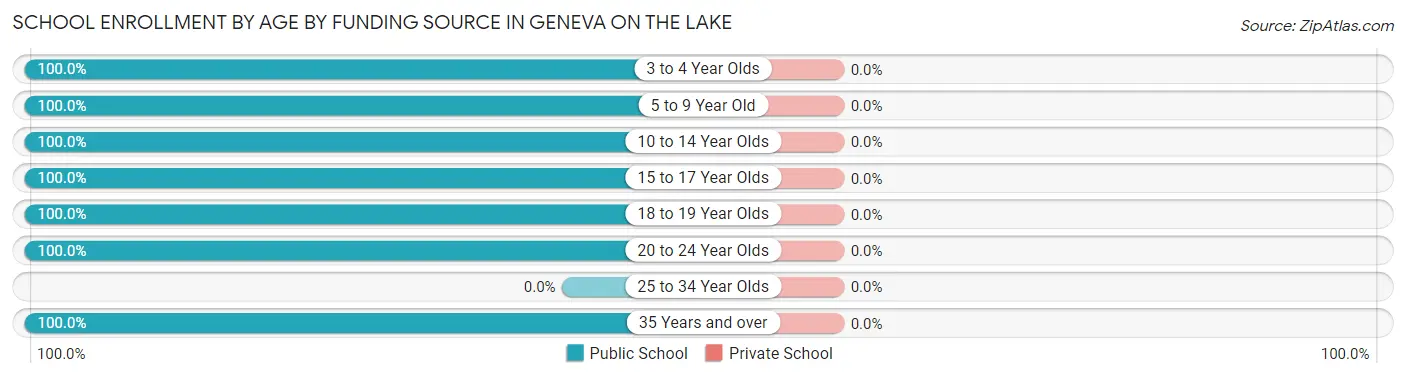
| Age Bracket | Public School | Private School |
| 3 to 4 Year Olds | 36 (100.0%) | 0 (0.0%) |
| 5 to 9 Year Old | 33 (100.0%) | 0 (0.0%) |
| 10 to 14 Year Olds | 65 (100.0%) | 0 (0.0%) |
| 15 to 17 Year Olds | 7 (100.0%) | 0 (0.0%) |
| 18 to 19 Year Olds | 4 (100.0%) | 0 (0.0%) |
| 20 to 24 Year Olds | 3 (100.0%) | 0 (0.0%) |
| 25 to 34 Year Olds | 0 (0.0%) | 0 (0.0%) |
| 35 Years and over | 3 (100.0%) | 0 (0.0%) |
| Total | 151 (100.0%) | 0 (0.0%) |
Educational Attainment by Field of Study in Geneva on the Lake
Education (20 | 21.3%), social sciences (18 | 19.2%), science & technology (12 | 12.8%), arts & humanities (10 | 10.6%), and business (9 | 9.6%) are the most common fields of study among 94 individuals in Geneva on the Lake who have obtained a bachelor's degree or higher.
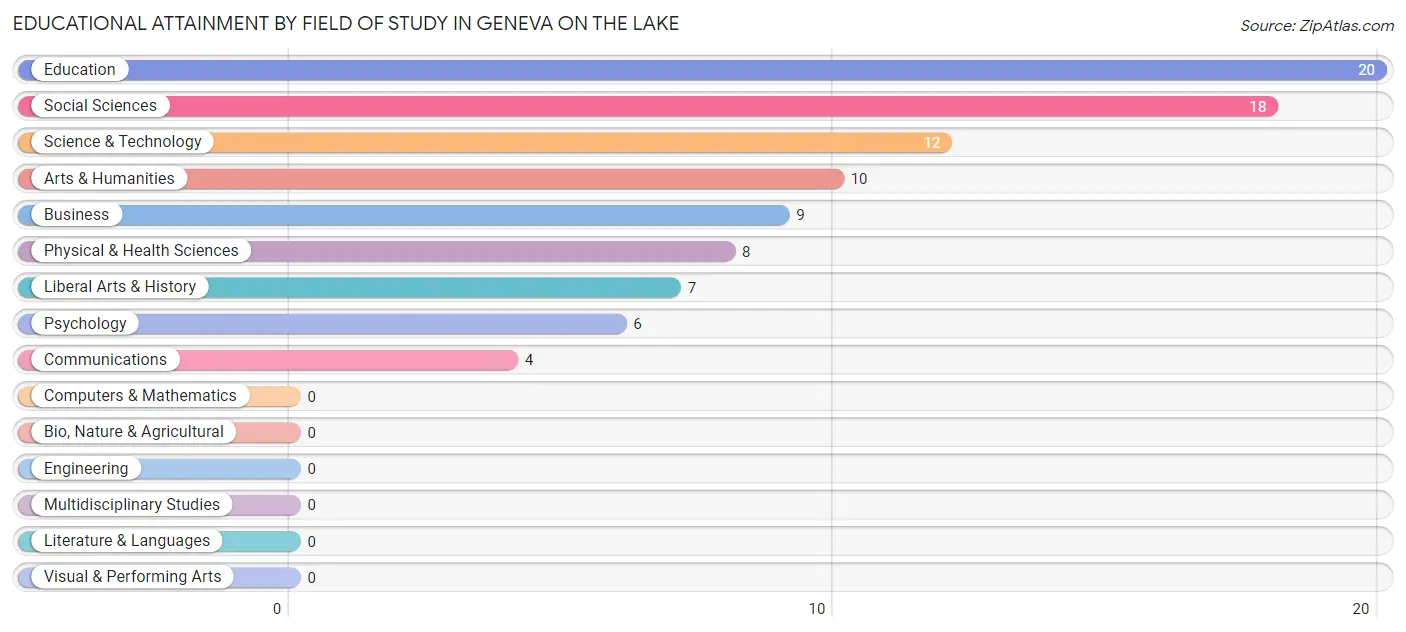
| Field of Study | # Graduates | % Graduates |
| Computers & Mathematics | 0 | 0.0% |
| Bio, Nature & Agricultural | 0 | 0.0% |
| Physical & Health Sciences | 8 | 8.5% |
| Psychology | 6 | 6.4% |
| Social Sciences | 18 | 19.2% |
| Engineering | 0 | 0.0% |
| Multidisciplinary Studies | 0 | 0.0% |
| Science & Technology | 12 | 12.8% |
| Business | 9 | 9.6% |
| Education | 20 | 21.3% |
| Literature & Languages | 0 | 0.0% |
| Liberal Arts & History | 7 | 7.4% |
| Visual & Performing Arts | 0 | 0.0% |
| Communications | 4 | 4.3% |
| Arts & Humanities | 10 | 10.6% |
| Total | 94 | 100.0% |
Transportation & Commute in Geneva on the Lake
Vehicle Availability by Sex in Geneva on the Lake
The most prevalent vehicle ownership categories in Geneva on the Lake are males with 1 vehicle (113, accounting for 41.5%) and females with 1 vehicle (84, making up 54.1%).
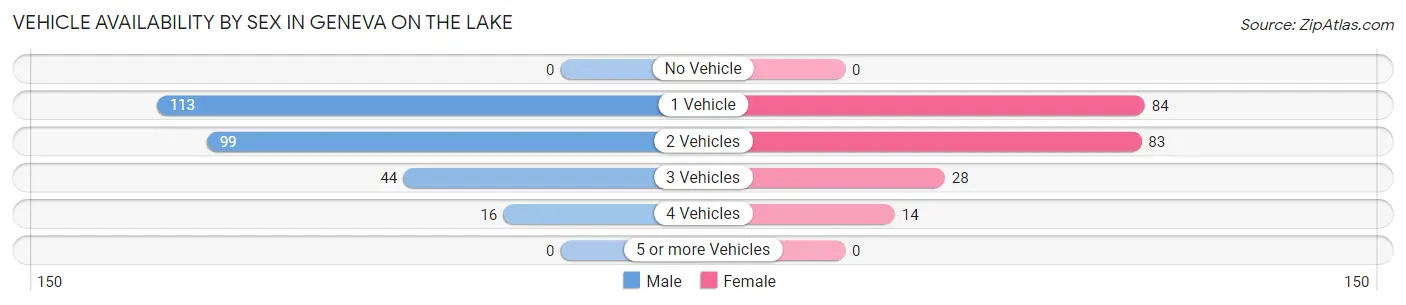
| Vehicles Available | Male | Female |
| No Vehicle | 0 (0.0%) | 0 (0.0%) |
| 1 Vehicle | 113 (41.5%) | 84 (40.2%) |
| 2 Vehicles | 99 (36.4%) | 83 (39.7%) |
| 3 Vehicles | 44 (16.2%) | 28 (13.4%) |
| 4 Vehicles | 16 (5.9%) | 14 (6.7%) |
| 5 or more Vehicles | 0 (0.0%) | 0 (0.0%) |
| Total | 272 (100.0%) | 209 (100.0%) |
Commute Time in Geneva on the Lake
The most frequently occuring commute durations in Geneva on the Lake are 5 to 9 minutes (74 commuters, 16.4%), 15 to 19 minutes (71 commuters, 15.7%), and 10 to 14 minutes (67 commuters, 14.8%).
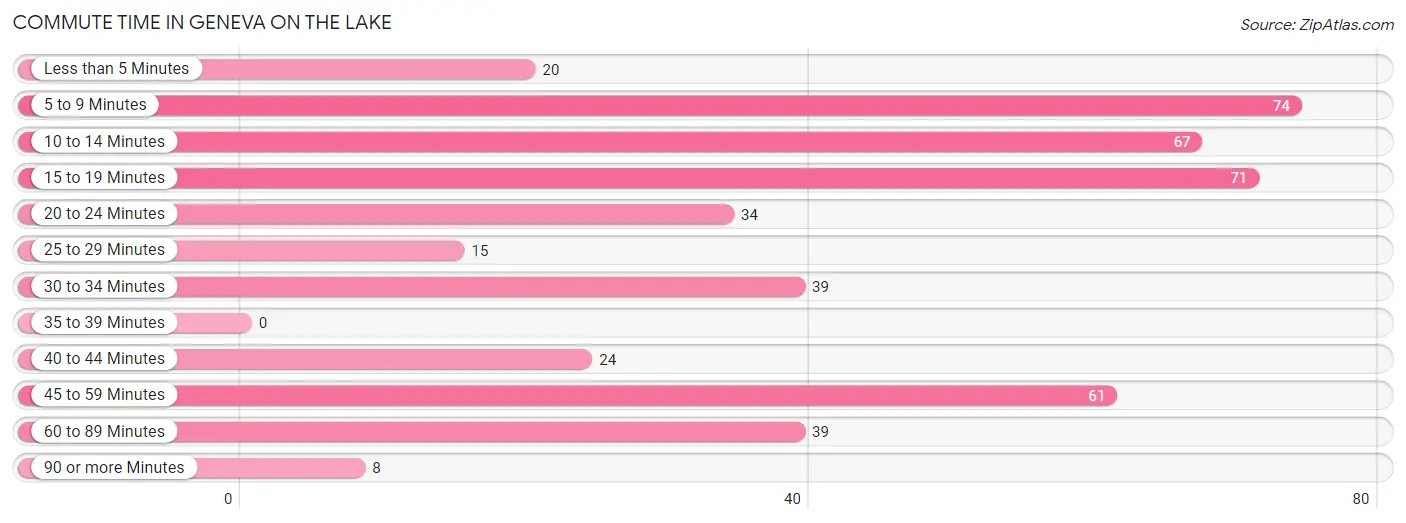
| Commute Time | # Commuters | % Commuters |
| Less than 5 Minutes | 20 | 4.4% |
| 5 to 9 Minutes | 74 | 16.4% |
| 10 to 14 Minutes | 67 | 14.8% |
| 15 to 19 Minutes | 71 | 15.7% |
| 20 to 24 Minutes | 34 | 7.5% |
| 25 to 29 Minutes | 15 | 3.3% |
| 30 to 34 Minutes | 39 | 8.6% |
| 35 to 39 Minutes | 0 | 0.0% |
| 40 to 44 Minutes | 24 | 5.3% |
| 45 to 59 Minutes | 61 | 13.5% |
| 60 to 89 Minutes | 39 | 8.6% |
| 90 or more Minutes | 8 | 1.8% |
Commute Time by Sex in Geneva on the Lake
The most common commute times in Geneva on the Lake are 10 to 14 minutes (45 commuters, 17.3%) for males and 5 to 9 minutes (45 commuters, 23.4%) for females.
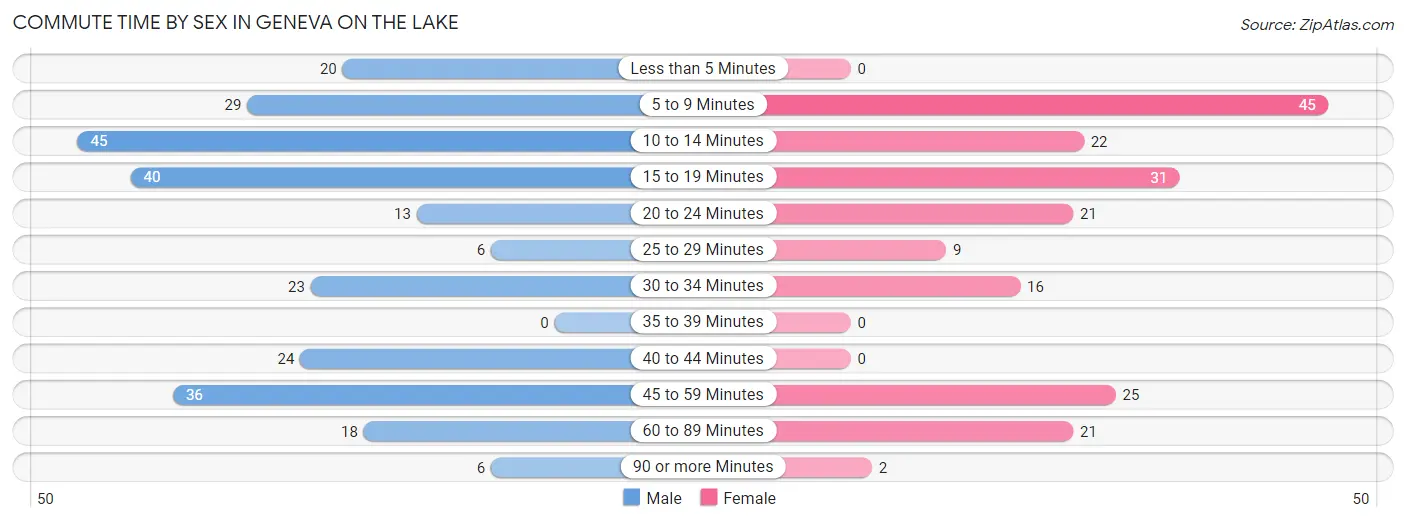
| Commute Time | Male | Female |
| Less than 5 Minutes | 20 (7.7%) | 0 (0.0%) |
| 5 to 9 Minutes | 29 (11.2%) | 45 (23.4%) |
| 10 to 14 Minutes | 45 (17.3%) | 22 (11.5%) |
| 15 to 19 Minutes | 40 (15.4%) | 31 (16.2%) |
| 20 to 24 Minutes | 13 (5.0%) | 21 (10.9%) |
| 25 to 29 Minutes | 6 (2.3%) | 9 (4.7%) |
| 30 to 34 Minutes | 23 (8.8%) | 16 (8.3%) |
| 35 to 39 Minutes | 0 (0.0%) | 0 (0.0%) |
| 40 to 44 Minutes | 24 (9.2%) | 0 (0.0%) |
| 45 to 59 Minutes | 36 (13.9%) | 25 (13.0%) |
| 60 to 89 Minutes | 18 (6.9%) | 21 (10.9%) |
| 90 or more Minutes | 6 (2.3%) | 2 (1.0%) |
Time of Departure to Work by Sex in Geneva on the Lake
The most frequent times of departure to work in Geneva on the Lake are 4:00 PM to 11:59 PM (40, 15.4%) for males and 6:00 AM to 6:29 AM (34, 17.7%) for females.
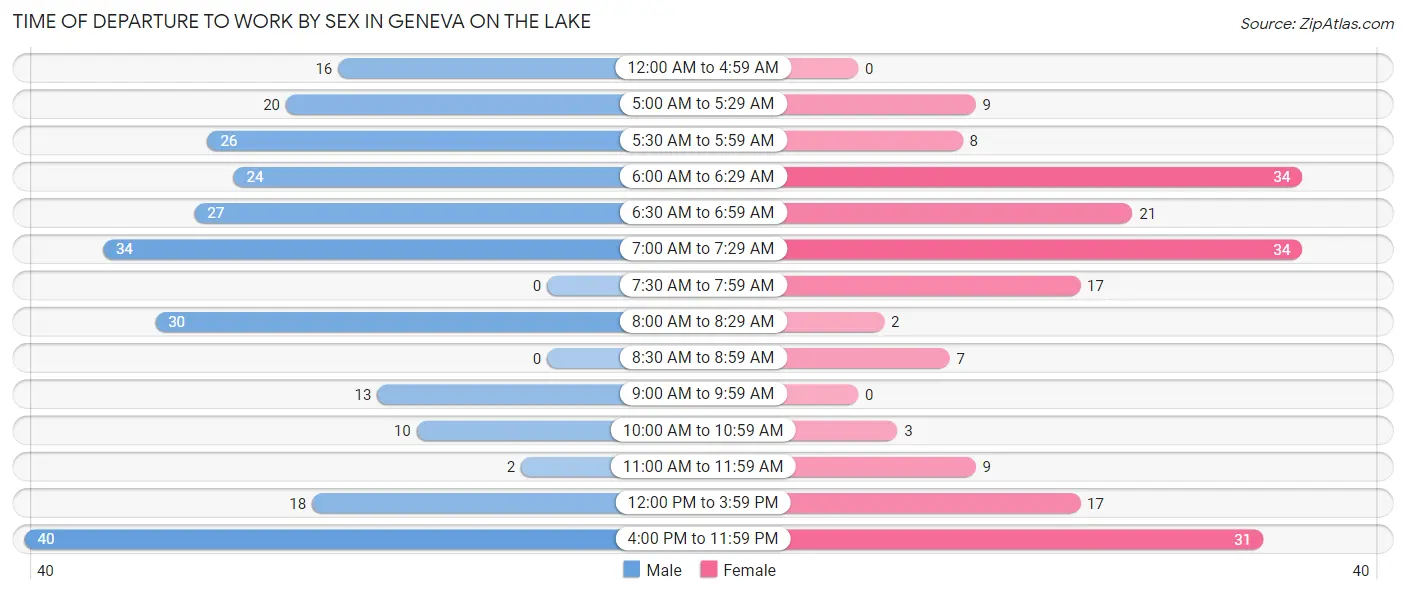
| Time of Departure | Male | Female |
| 12:00 AM to 4:59 AM | 16 (6.1%) | 0 (0.0%) |
| 5:00 AM to 5:29 AM | 20 (7.7%) | 9 (4.7%) |
| 5:30 AM to 5:59 AM | 26 (10.0%) | 8 (4.2%) |
| 6:00 AM to 6:29 AM | 24 (9.2%) | 34 (17.7%) |
| 6:30 AM to 6:59 AM | 27 (10.4%) | 21 (10.9%) |
| 7:00 AM to 7:29 AM | 34 (13.1%) | 34 (17.7%) |
| 7:30 AM to 7:59 AM | 0 (0.0%) | 17 (8.8%) |
| 8:00 AM to 8:29 AM | 30 (11.5%) | 2 (1.0%) |
| 8:30 AM to 8:59 AM | 0 (0.0%) | 7 (3.6%) |
| 9:00 AM to 9:59 AM | 13 (5.0%) | 0 (0.0%) |
| 10:00 AM to 10:59 AM | 10 (3.8%) | 3 (1.6%) |
| 11:00 AM to 11:59 AM | 2 (0.8%) | 9 (4.7%) |
| 12:00 PM to 3:59 PM | 18 (6.9%) | 17 (8.8%) |
| 4:00 PM to 11:59 PM | 40 (15.4%) | 31 (16.2%) |
| Total | 260 (100.0%) | 192 (100.0%) |
Housing Occupancy in Geneva on the Lake
Occupancy by Ownership in Geneva on the Lake
Of the total 529 dwellings in Geneva on the Lake, owner-occupied units account for 366 (69.2%), while renter-occupied units make up 163 (30.8%).
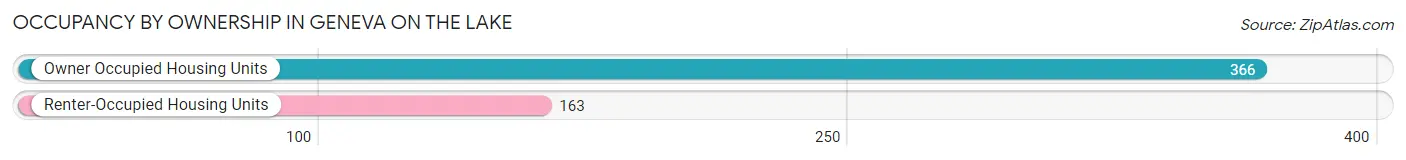
| Occupancy | # Housing Units | % Housing Units |
| Owner Occupied Housing Units | 366 | 69.2% |
| Renter-Occupied Housing Units | 163 | 30.8% |
| Total Occupied Housing Units | 529 | 100.0% |
Occupancy by Household Size in Geneva on the Lake
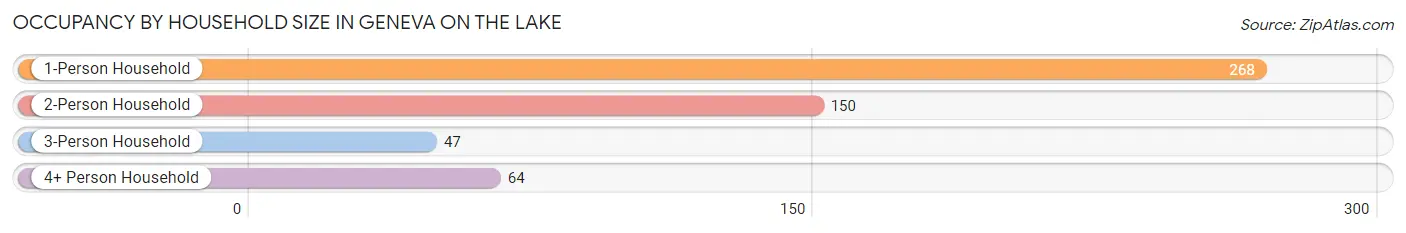
| Household Size | # Housing Units | % Housing Units |
| 1-Person Household | 268 | 50.7% |
| 2-Person Household | 150 | 28.4% |
| 3-Person Household | 47 | 8.9% |
| 4+ Person Household | 64 | 12.1% |
| Total Housing Units | 529 | 100.0% |
Occupancy by Ownership by Household Size in Geneva on the Lake
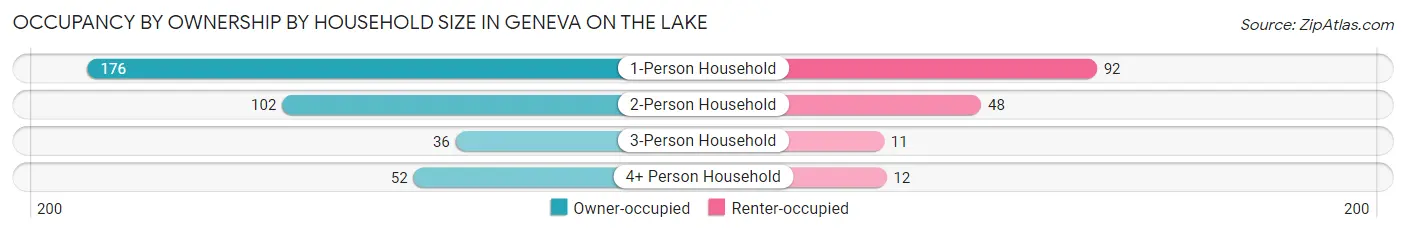
| Household Size | Owner-occupied | Renter-occupied |
| 1-Person Household | 176 (65.7%) | 92 (34.3%) |
| 2-Person Household | 102 (68.0%) | 48 (32.0%) |
| 3-Person Household | 36 (76.6%) | 11 (23.4%) |
| 4+ Person Household | 52 (81.2%) | 12 (18.8%) |
| Total Housing Units | 366 (69.2%) | 163 (30.8%) |
Occupancy by Educational Attainment in Geneva on the Lake
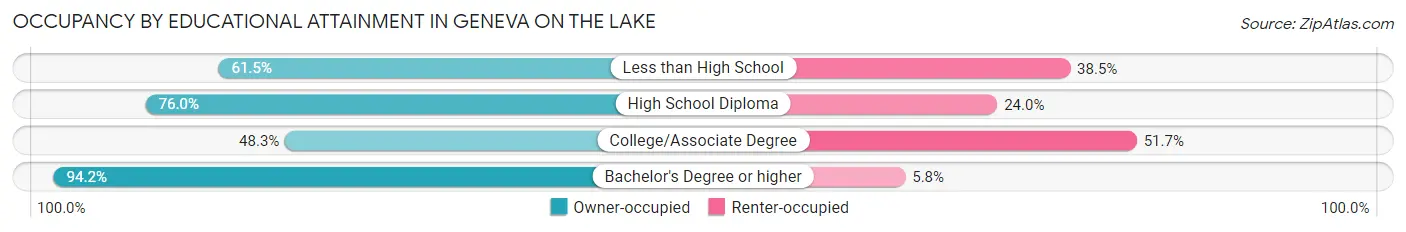
| Household Size | Owner-occupied | Renter-occupied |
| Less than High School | 16 (61.5%) | 10 (38.5%) |
| High School Diploma | 228 (76.0%) | 72 (24.0%) |
| College/Associate Degree | 73 (48.3%) | 78 (51.7%) |
| Bachelor's Degree or higher | 49 (94.2%) | 3 (5.8%) |
Occupancy by Age of Householder in Geneva on the Lake
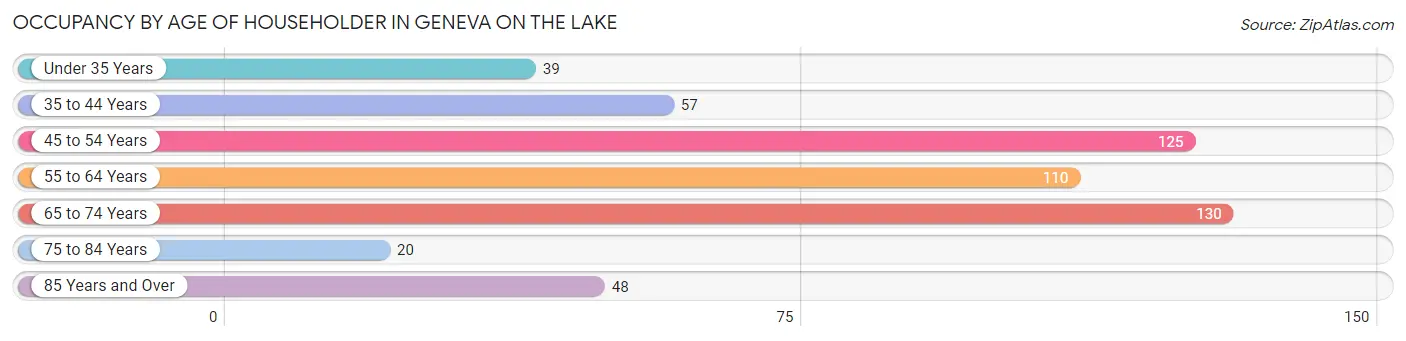
| Age Bracket | # Households | % Households |
| Under 35 Years | 39 | 7.4% |
| 35 to 44 Years | 57 | 10.8% |
| 45 to 54 Years | 125 | 23.6% |
| 55 to 64 Years | 110 | 20.8% |
| 65 to 74 Years | 130 | 24.6% |
| 75 to 84 Years | 20 | 3.8% |
| 85 Years and Over | 48 | 9.1% |
| Total | 529 | 100.0% |
Housing Finances in Geneva on the Lake
Median Income by Occupancy in Geneva on the Lake
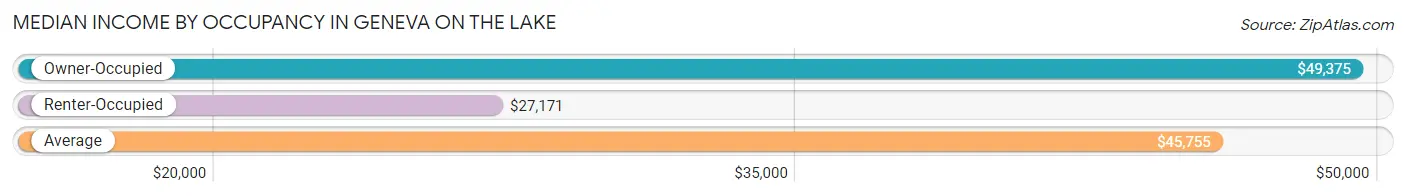
| Occupancy Type | # Households | Median Income |
| Owner-Occupied | 366 (69.2%) | $49,375 |
| Renter-Occupied | 163 (30.8%) | $27,171 |
| Average | 529 (100.0%) | $45,755 |
Occupancy by Householder Income Bracket in Geneva on the Lake
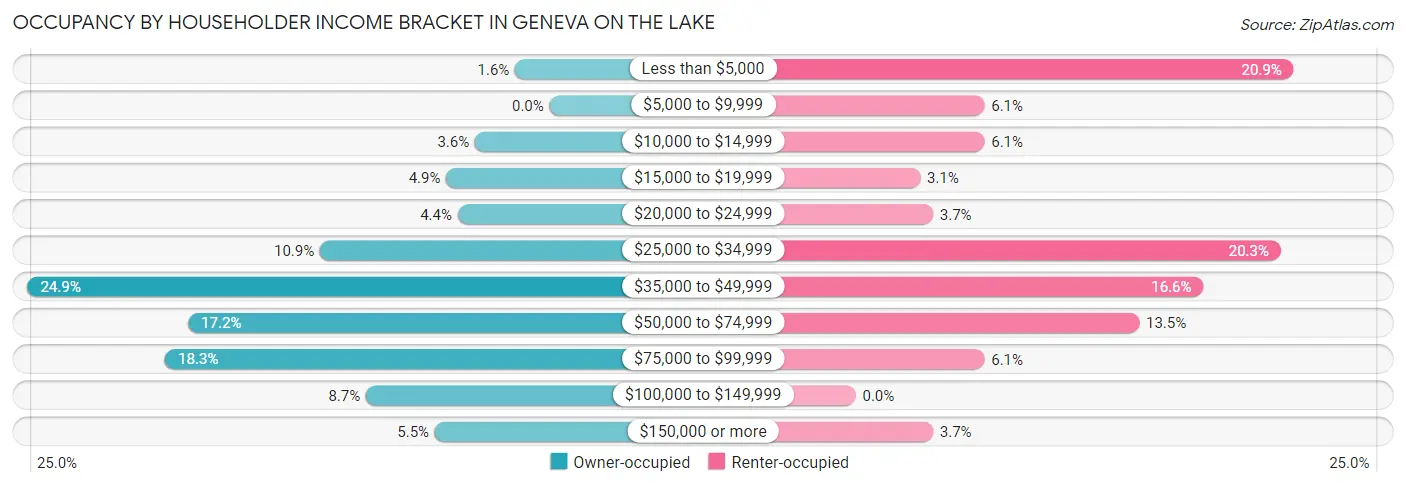
| Income Bracket | Owner-occupied | Renter-occupied |
| Less than $5,000 | 6 (1.6%) | 34 (20.9%) |
| $5,000 to $9,999 | 0 (0.0%) | 10 (6.1%) |
| $10,000 to $14,999 | 13 (3.5%) | 10 (6.1%) |
| $15,000 to $19,999 | 18 (4.9%) | 5 (3.1%) |
| $20,000 to $24,999 | 16 (4.4%) | 6 (3.7%) |
| $25,000 to $34,999 | 40 (10.9%) | 33 (20.3%) |
| $35,000 to $49,999 | 91 (24.9%) | 27 (16.6%) |
| $50,000 to $74,999 | 63 (17.2%) | 22 (13.5%) |
| $75,000 to $99,999 | 67 (18.3%) | 10 (6.1%) |
| $100,000 to $149,999 | 32 (8.7%) | 0 (0.0%) |
| $150,000 or more | 20 (5.5%) | 6 (3.7%) |
| Total | 366 (100.0%) | 163 (100.0%) |
Monthly Housing Cost Tiers in Geneva on the Lake
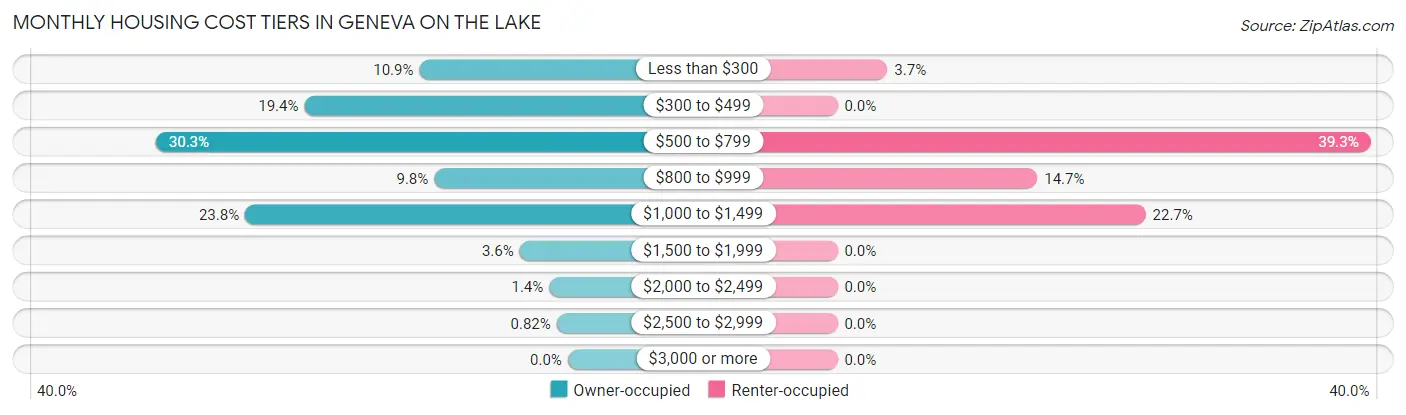
| Monthly Cost | Owner-occupied | Renter-occupied |
| Less than $300 | 40 (10.9%) | 6 (3.7%) |
| $300 to $499 | 71 (19.4%) | 0 (0.0%) |
| $500 to $799 | 111 (30.3%) | 64 (39.3%) |
| $800 to $999 | 36 (9.8%) | 24 (14.7%) |
| $1,000 to $1,499 | 87 (23.8%) | 37 (22.7%) |
| $1,500 to $1,999 | 13 (3.5%) | 0 (0.0%) |
| $2,000 to $2,499 | 5 (1.4%) | 0 (0.0%) |
| $2,500 to $2,999 | 3 (0.8%) | 0 (0.0%) |
| $3,000 or more | 0 (0.0%) | 0 (0.0%) |
| Total | 366 (100.0%) | 163 (100.0%) |
Physical Housing Characteristics in Geneva on the Lake
Housing Structures in Geneva on the Lake
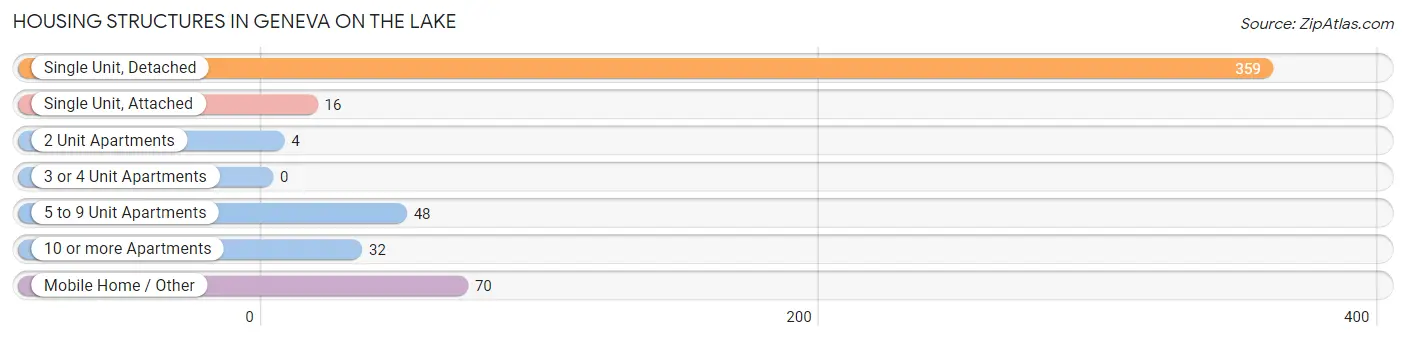
| Structure Type | # Housing Units | % Housing Units |
| Single Unit, Detached | 359 | 67.9% |
| Single Unit, Attached | 16 | 3.0% |
| 2 Unit Apartments | 4 | 0.8% |
| 3 or 4 Unit Apartments | 0 | 0.0% |
| 5 to 9 Unit Apartments | 48 | 9.1% |
| 10 or more Apartments | 32 | 6.0% |
| Mobile Home / Other | 70 | 13.2% |
| Total | 529 | 100.0% |
Housing Structures by Occupancy in Geneva on the Lake
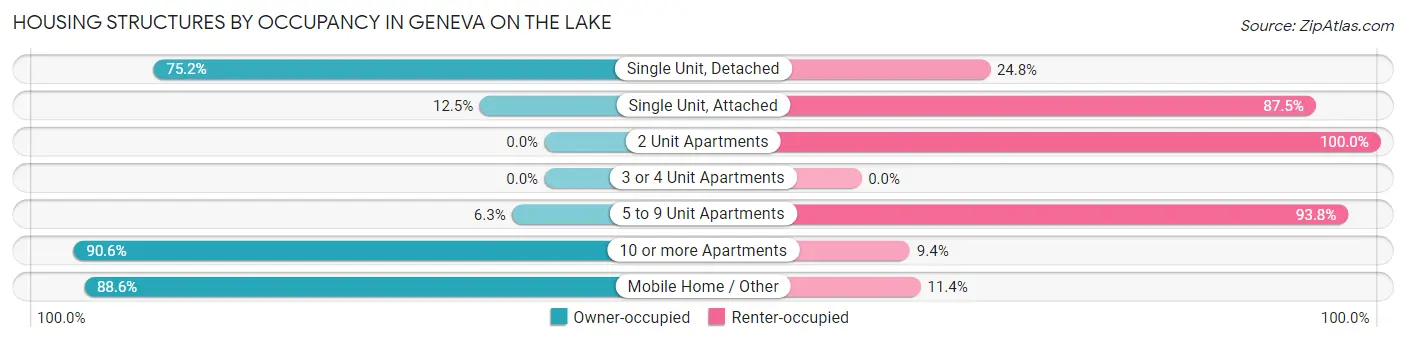
| Structure Type | Owner-occupied | Renter-occupied |
| Single Unit, Detached | 270 (75.2%) | 89 (24.8%) |
| Single Unit, Attached | 2 (12.5%) | 14 (87.5%) |
| 2 Unit Apartments | 0 (0.0%) | 4 (100.0%) |
| 3 or 4 Unit Apartments | 0 (0.0%) | 0 (0.0%) |
| 5 to 9 Unit Apartments | 3 (6.2%) | 45 (93.8%) |
| 10 or more Apartments | 29 (90.6%) | 3 (9.4%) |
| Mobile Home / Other | 62 (88.6%) | 8 (11.4%) |
| Total | 366 (69.2%) | 163 (30.8%) |
Housing Structures by Number of Rooms in Geneva on the Lake
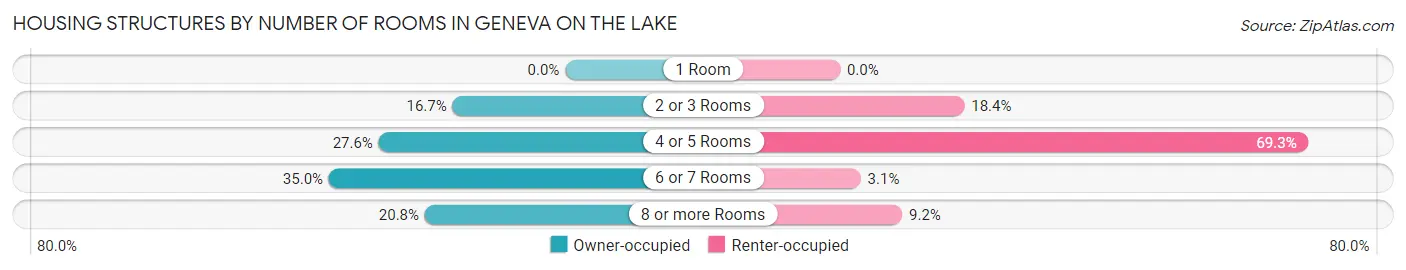
| Number of Rooms | Owner-occupied | Renter-occupied |
| 1 Room | 0 (0.0%) | 0 (0.0%) |
| 2 or 3 Rooms | 61 (16.7%) | 30 (18.4%) |
| 4 or 5 Rooms | 101 (27.6%) | 113 (69.3%) |
| 6 or 7 Rooms | 128 (35.0%) | 5 (3.1%) |
| 8 or more Rooms | 76 (20.8%) | 15 (9.2%) |
| Total | 366 (100.0%) | 163 (100.0%) |
Housing Structure by Heating Type in Geneva on the Lake
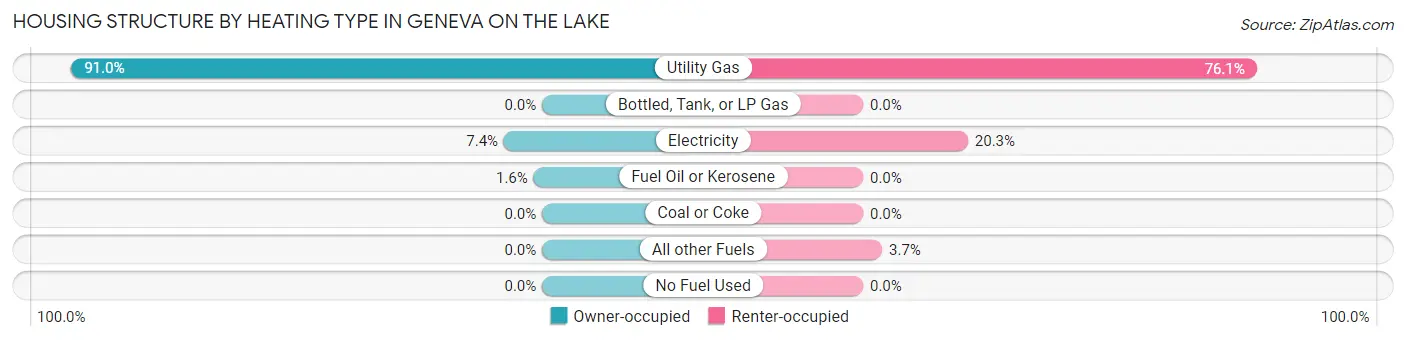
| Heating Type | Owner-occupied | Renter-occupied |
| Utility Gas | 333 (91.0%) | 124 (76.1%) |
| Bottled, Tank, or LP Gas | 0 (0.0%) | 0 (0.0%) |
| Electricity | 27 (7.4%) | 33 (20.3%) |
| Fuel Oil or Kerosene | 6 (1.6%) | 0 (0.0%) |
| Coal or Coke | 0 (0.0%) | 0 (0.0%) |
| All other Fuels | 0 (0.0%) | 6 (3.7%) |
| No Fuel Used | 0 (0.0%) | 0 (0.0%) |
| Total | 366 (100.0%) | 163 (100.0%) |
Household Vehicle Usage in Geneva on the Lake
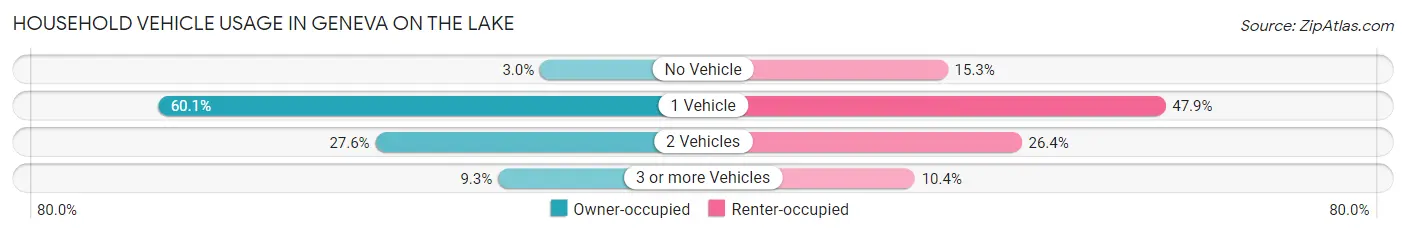
| Vehicles per Household | Owner-occupied | Renter-occupied |
| No Vehicle | 11 (3.0%) | 25 (15.3%) |
| 1 Vehicle | 220 (60.1%) | 78 (47.8%) |
| 2 Vehicles | 101 (27.6%) | 43 (26.4%) |
| 3 or more Vehicles | 34 (9.3%) | 17 (10.4%) |
| Total | 366 (100.0%) | 163 (100.0%) |
Real Estate & Mortgages in Geneva on the Lake
Real Estate and Mortgage Overview in Geneva on the Lake
| Characteristic | Without Mortgage | With Mortgage |
| Housing Units | 225 | 141 |
| Median Property Value | $114,800 | $117,400 |
| Median Household Income | $46,331 | $6 |
| Monthly Housing Costs | $507 | $0 |
| Real Estate Taxes | $2,187 | $13 |
Property Value by Mortgage Status in Geneva on the Lake
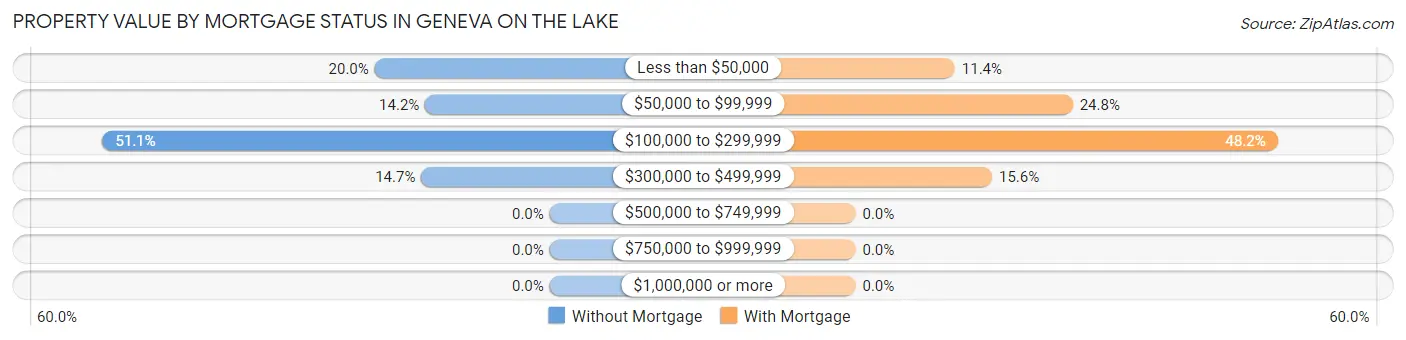
| Property Value | Without Mortgage | With Mortgage |
| Less than $50,000 | 45 (20.0%) | 16 (11.4%) |
| $50,000 to $99,999 | 32 (14.2%) | 35 (24.8%) |
| $100,000 to $299,999 | 115 (51.1%) | 68 (48.2%) |
| $300,000 to $499,999 | 33 (14.7%) | 22 (15.6%) |
| $500,000 to $749,999 | 0 (0.0%) | 0 (0.0%) |
| $750,000 to $999,999 | 0 (0.0%) | 0 (0.0%) |
| $1,000,000 or more | 0 (0.0%) | 0 (0.0%) |
| Total | 225 (100.0%) | 141 (100.0%) |
Household Income by Mortgage Status in Geneva on the Lake
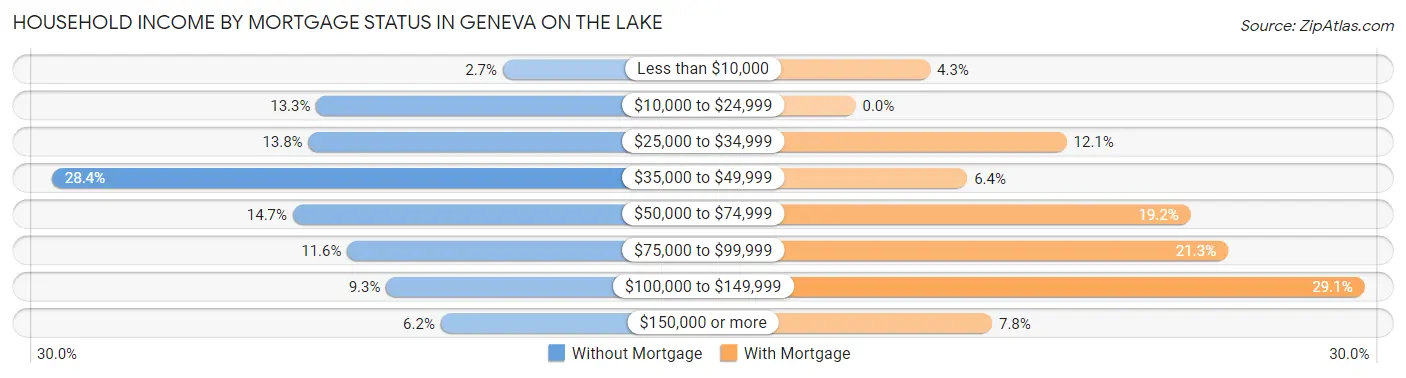
| Household Income | Without Mortgage | With Mortgage |
| Less than $10,000 | 6 (2.7%) | 6 (4.3%) |
| $10,000 to $24,999 | 30 (13.3%) | 0 (0.0%) |
| $25,000 to $34,999 | 31 (13.8%) | 17 (12.1%) |
| $35,000 to $49,999 | 64 (28.4%) | 9 (6.4%) |
| $50,000 to $74,999 | 33 (14.7%) | 27 (19.2%) |
| $75,000 to $99,999 | 26 (11.6%) | 30 (21.3%) |
| $100,000 to $149,999 | 21 (9.3%) | 41 (29.1%) |
| $150,000 or more | 14 (6.2%) | 11 (7.8%) |
| Total | 225 (100.0%) | 141 (100.0%) |
Property Value to Household Income Ratio in Geneva on the Lake
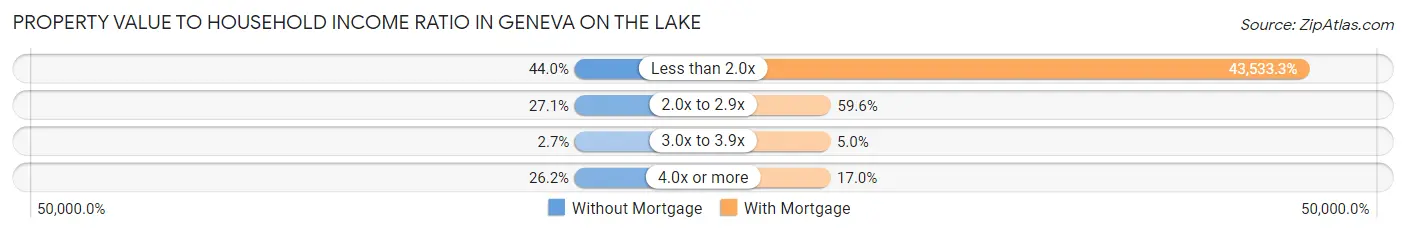
| Value-to-Income Ratio | Without Mortgage | With Mortgage |
| Less than 2.0x | 99 (44.0%) | 61,382 (43,533.3%) |
| 2.0x to 2.9x | 61 (27.1%) | 84 (59.6%) |
| 3.0x to 3.9x | 6 (2.7%) | 7 (5.0%) |
| 4.0x or more | 59 (26.2%) | 24 (17.0%) |
| Total | 225 (100.0%) | 141 (100.0%) |
Real Estate Taxes by Mortgage Status in Geneva on the Lake
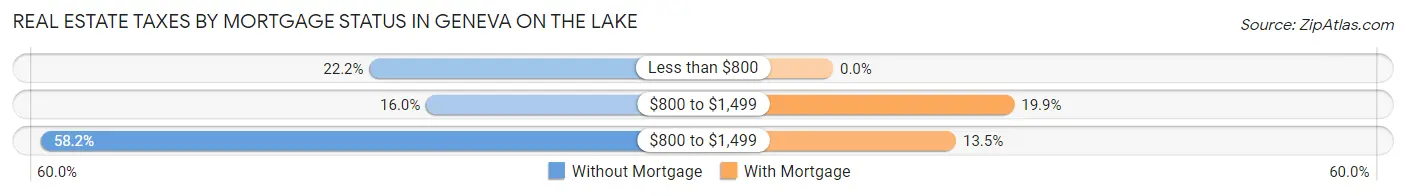
| Property Taxes | Without Mortgage | With Mortgage |
| Less than $800 | 50 (22.2%) | 0 (0.0%) |
| $800 to $1,499 | 36 (16.0%) | 28 (19.9%) |
| $800 to $1,499 | 131 (58.2%) | 19 (13.5%) |
| Total | 225 (100.0%) | 141 (100.0%) |
Health & Disability in Geneva on the Lake
Health Insurance Coverage by Age in Geneva on the Lake
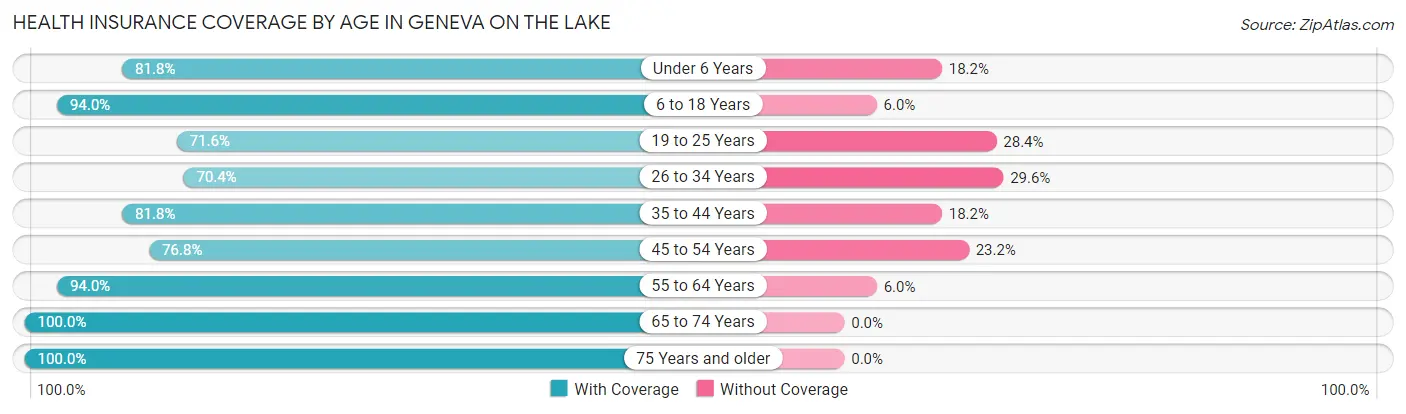
| Age Bracket | With Coverage | Without Coverage |
| Under 6 Years | 45 (81.8%) | 10 (18.2%) |
| 6 to 18 Years | 109 (94.0%) | 7 (6.0%) |
| 19 to 25 Years | 48 (71.6%) | 19 (28.4%) |
| 26 to 34 Years | 57 (70.4%) | 24 (29.6%) |
| 35 to 44 Years | 117 (81.8%) | 26 (18.2%) |
| 45 to 54 Years | 149 (76.8%) | 45 (23.2%) |
| 55 to 64 Years | 140 (94.0%) | 9 (6.0%) |
| 65 to 74 Years | 171 (100.0%) | 0 (0.0%) |
| 75 Years and older | 109 (100.0%) | 0 (0.0%) |
| Total | 945 (87.1%) | 140 (12.9%) |
Health Insurance Coverage by Citizenship Status in Geneva on the Lake
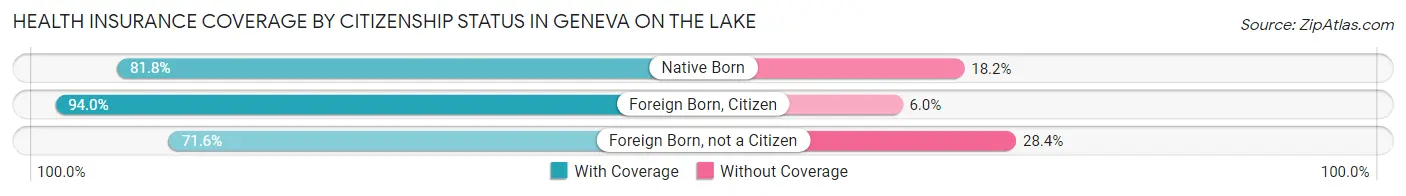
| Citizenship Status | With Coverage | Without Coverage |
| Native Born | 45 (81.8%) | 10 (18.2%) |
| Foreign Born, Citizen | 109 (94.0%) | 7 (6.0%) |
| Foreign Born, not a Citizen | 48 (71.6%) | 19 (28.4%) |
Health Insurance Coverage by Household Income in Geneva on the Lake
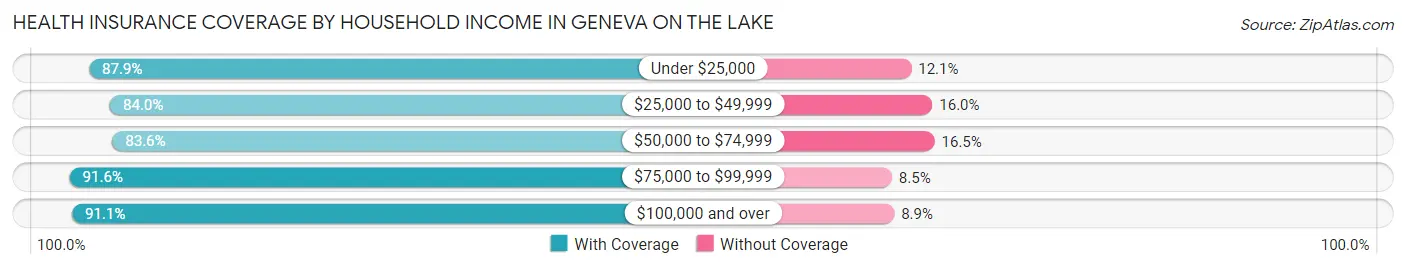
| Household Income | With Coverage | Without Coverage |
| Under $25,000 | 131 (87.9%) | 18 (12.1%) |
| $25,000 to $49,999 | 262 (84.0%) | 50 (16.0%) |
| $50,000 to $74,999 | 193 (83.6%) | 38 (16.5%) |
| $75,000 to $99,999 | 195 (91.5%) | 18 (8.5%) |
| $100,000 and over | 164 (91.1%) | 16 (8.9%) |
Public vs Private Health Insurance Coverage by Age in Geneva on the Lake
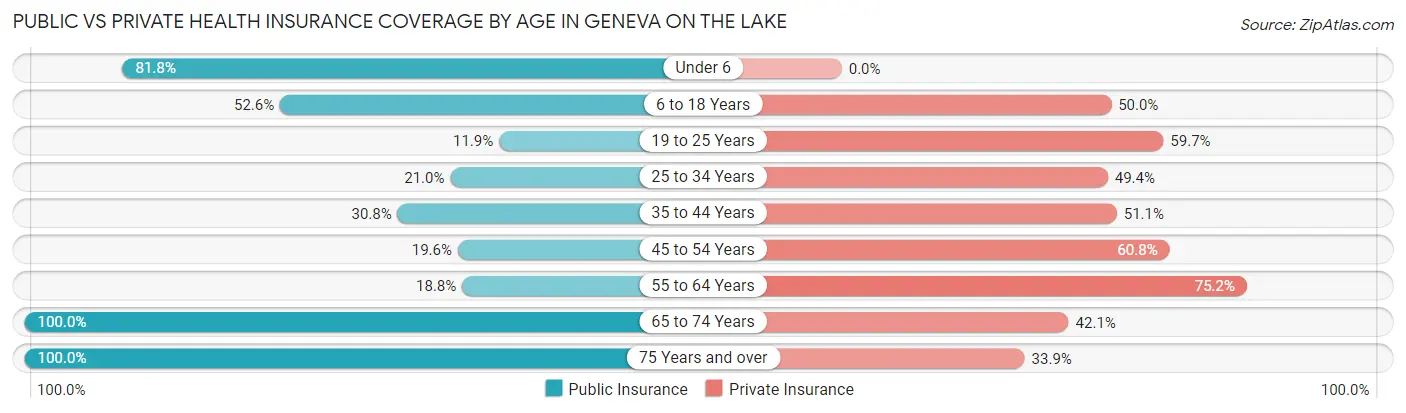
| Age Bracket | Public Insurance | Private Insurance |
| Under 6 | 45 (81.8%) | 0 (0.0%) |
| 6 to 18 Years | 61 (52.6%) | 58 (50.0%) |
| 19 to 25 Years | 8 (11.9%) | 40 (59.7%) |
| 25 to 34 Years | 17 (21.0%) | 40 (49.4%) |
| 35 to 44 Years | 44 (30.8%) | 73 (51.0%) |
| 45 to 54 Years | 38 (19.6%) | 118 (60.8%) |
| 55 to 64 Years | 28 (18.8%) | 112 (75.2%) |
| 65 to 74 Years | 171 (100.0%) | 72 (42.1%) |
| 75 Years and over | 109 (100.0%) | 37 (33.9%) |
| Total | 521 (48.0%) | 550 (50.7%) |
Disability Status by Sex by Age in Geneva on the Lake

| Age Bracket | Male | Female |
| Under 5 Years | 0 (0.0%) | 0 (0.0%) |
| 5 to 17 Years | 14 (24.1%) | 0 (0.0%) |
| 18 to 34 Years | 27 (27.6%) | 9 (16.7%) |
| 35 to 64 Years | 43 (18.3%) | 36 (14.3%) |
| 65 to 74 Years | 11 (13.1%) | 32 (36.8%) |
| 75 Years and over | 17 (58.6%) | 45 (56.2%) |
Disability Class by Sex by Age in Geneva on the Lake
Disability Class: Hearing Difficulty
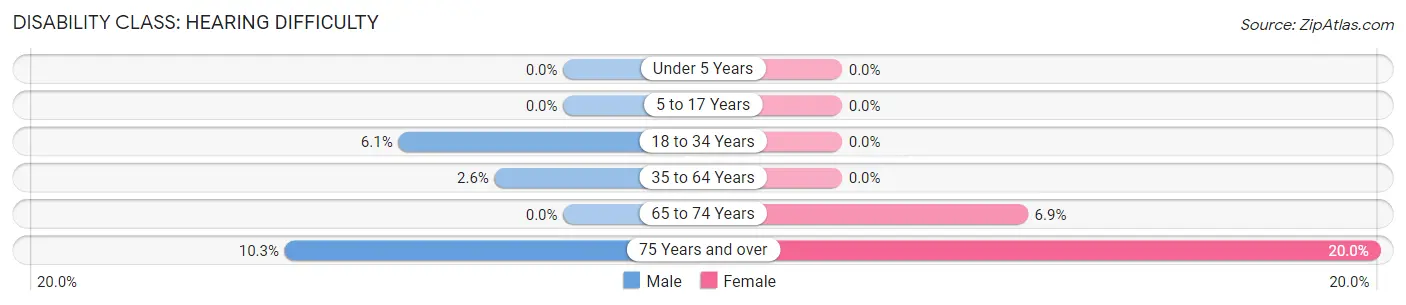
| Age Bracket | Male | Female |
| Under 5 Years | 0 (0.0%) | 0 (0.0%) |
| 5 to 17 Years | 0 (0.0%) | 0 (0.0%) |
| 18 to 34 Years | 6 (6.1%) | 0 (0.0%) |
| 35 to 64 Years | 6 (2.5%) | 0 (0.0%) |
| 65 to 74 Years | 0 (0.0%) | 6 (6.9%) |
| 75 Years and over | 3 (10.3%) | 16 (20.0%) |
Disability Class: Vision Difficulty
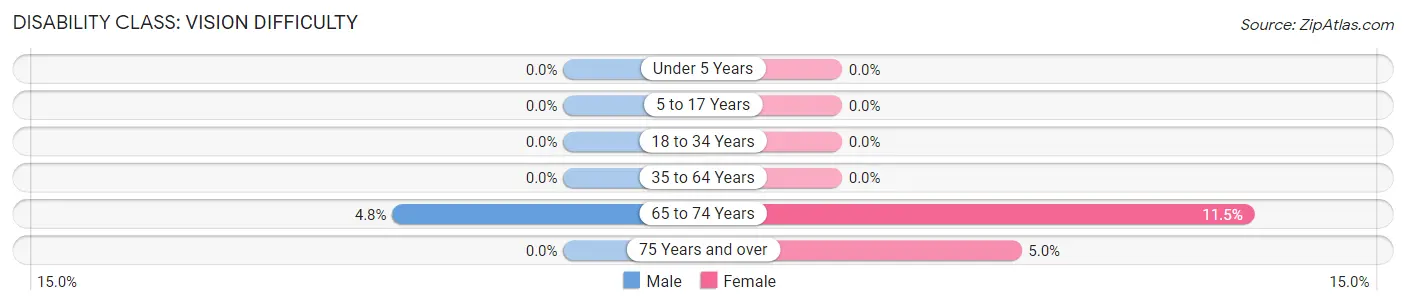
| Age Bracket | Male | Female |
| Under 5 Years | 0 (0.0%) | 0 (0.0%) |
| 5 to 17 Years | 0 (0.0%) | 0 (0.0%) |
| 18 to 34 Years | 0 (0.0%) | 0 (0.0%) |
| 35 to 64 Years | 0 (0.0%) | 0 (0.0%) |
| 65 to 74 Years | 4 (4.8%) | 10 (11.5%) |
| 75 Years and over | 0 (0.0%) | 4 (5.0%) |
Disability Class: Cognitive Difficulty
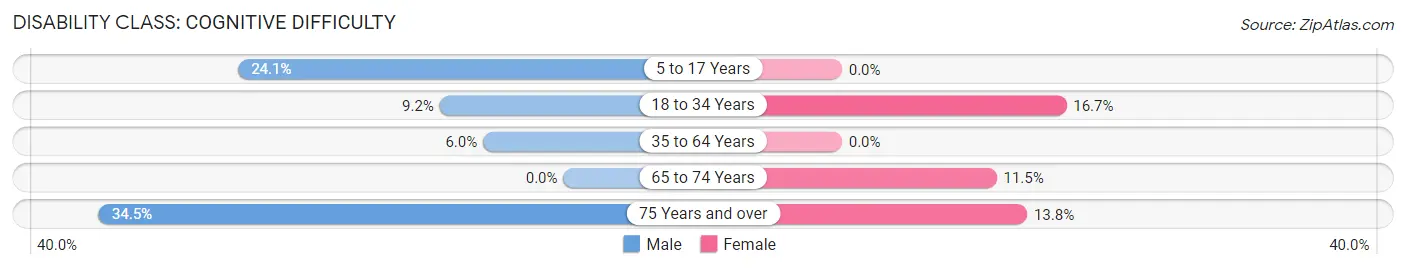
| Age Bracket | Male | Female |
| 5 to 17 Years | 14 (24.1%) | 0 (0.0%) |
| 18 to 34 Years | 9 (9.2%) | 9 (16.7%) |
| 35 to 64 Years | 14 (6.0%) | 0 (0.0%) |
| 65 to 74 Years | 0 (0.0%) | 10 (11.5%) |
| 75 Years and over | 10 (34.5%) | 11 (13.8%) |
Disability Class: Ambulatory Difficulty
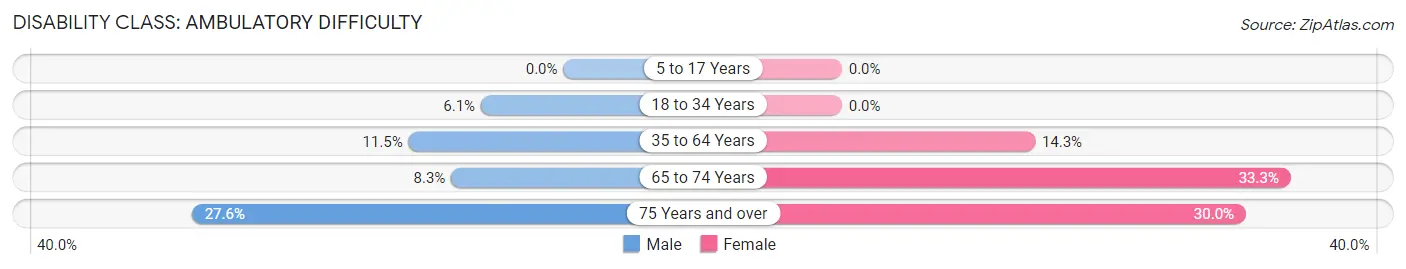
| Age Bracket | Male | Female |
| 5 to 17 Years | 0 (0.0%) | 0 (0.0%) |
| 18 to 34 Years | 6 (6.1%) | 0 (0.0%) |
| 35 to 64 Years | 27 (11.5%) | 36 (14.3%) |
| 65 to 74 Years | 7 (8.3%) | 29 (33.3%) |
| 75 Years and over | 8 (27.6%) | 24 (30.0%) |
Disability Class: Self-Care Difficulty
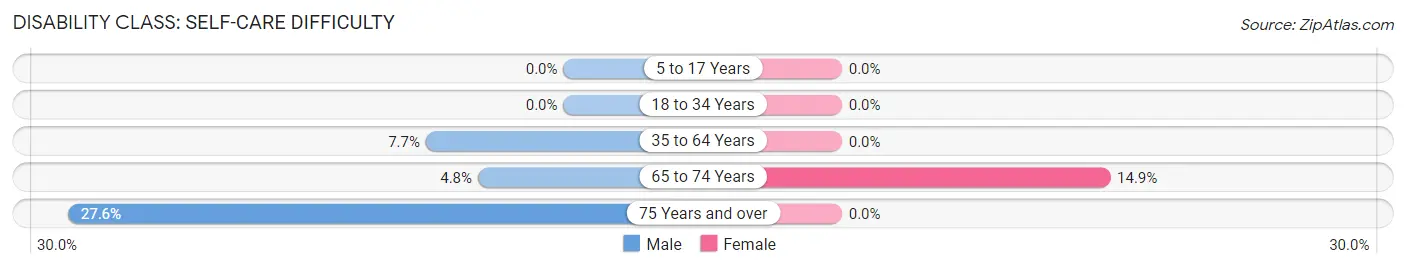
| Age Bracket | Male | Female |
| 5 to 17 Years | 0 (0.0%) | 0 (0.0%) |
| 18 to 34 Years | 0 (0.0%) | 0 (0.0%) |
| 35 to 64 Years | 18 (7.7%) | 0 (0.0%) |
| 65 to 74 Years | 4 (4.8%) | 13 (14.9%) |
| 75 Years and over | 8 (27.6%) | 0 (0.0%) |
Technology Access in Geneva on the Lake
Computing Device Access in Geneva on the Lake
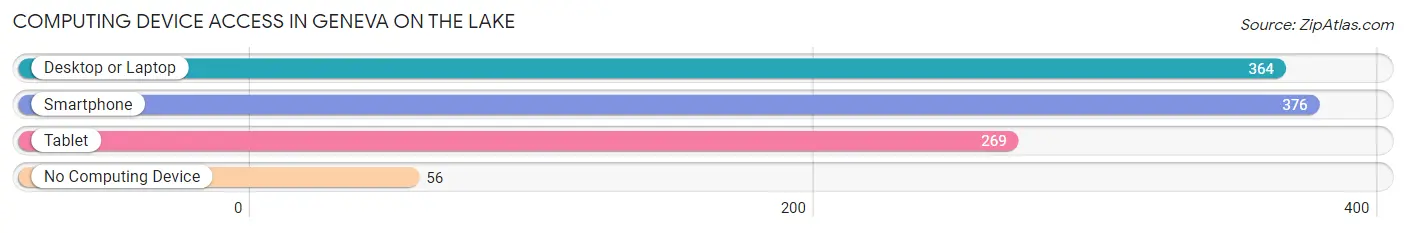
| Device Type | # Households | % Households |
| Desktop or Laptop | 364 | 68.8% |
| Smartphone | 376 | 71.1% |
| Tablet | 269 | 50.8% |
| No Computing Device | 56 | 10.6% |
| Total | 529 | 100.0% |
Internet Access in Geneva on the Lake
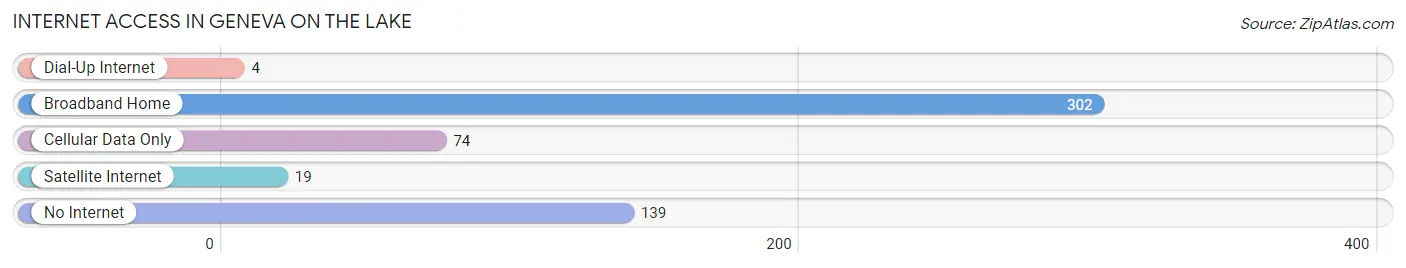
| Internet Type | # Households | % Households |
| Dial-Up Internet | 4 | 0.8% |
| Broadband Home | 302 | 57.1% |
| Cellular Data Only | 74 | 14.0% |
| Satellite Internet | 19 | 3.6% |
| No Internet | 139 | 26.3% |
| Total | 529 | 100.0% |
Geneva on the Lake Summary
Geneva On The Lake, Ohio is a small village located in Ashtabula County, Ohio. It is situated on the shores of Lake Erie and is a popular tourist destination. The village is known for its quaint shops, restaurants, and attractions.
Geography
Geneva On The Lake is located in the northeast corner of Ashtabula County, Ohio. It is situated on the south shore of Lake Erie, approximately 40 miles east of Cleveland. The village is bordered by the townships of Saybrook, Geneva, and Harpersfield. The total area of the village is 0.7 square miles, all of which is land. The village is located at an elevation of 602 feet above sea level.
The climate in Geneva On The Lake is classified as humid continental, with warm summers and cold winters. The average temperature in the summer is around 75 degrees Fahrenheit, while the average temperature in the winter is around 25 degrees Fahrenheit. Precipitation is fairly evenly distributed throughout the year, with an average of around 40 inches of rain and snow per year.
Economy
The economy of Geneva On The Lake is largely driven by tourism. The village is a popular destination for visitors from all over the country, who come to enjoy the lake, the shops, and the attractions. The village is home to several restaurants, bars, and shops, as well as a number of hotels and motels.
The village also has a number of manufacturing and industrial businesses, including a steel mill, a plastics factory, and a paper mill. These businesses provide employment for many of the residents of the village.
Demographics
As of the 2010 census, the population of Geneva On The Lake was 1,876. The population is fairly evenly split between males and females, with 49.3% male and 50.7% female. The median age of the population is 44.7 years.
The racial makeup of the village is 97.2% White, 0.9% African American, 0.3% Native American, 0.3% Asian, and 1.3% from other races. The median household income is $41,944, and the median family income is $50,000.
Conclusion
Geneva On The Lake is a small village located in Ashtabula County, Ohio. It is situated on the shores of Lake Erie and is a popular tourist destination. The village is known for its quaint shops, restaurants, and attractions. The economy of the village is largely driven by tourism, and the population is fairly evenly split between males and females. The racial makeup of the village is 97.2% White, 0.9% African American, 0.3% Native American, 0.3% Asian, and 1.3% from other races. The median household income is $41,944, and the median family income is $50,000.
Common Questions
What is Per Capita Income in Geneva on the Lake?
Per Capita income in Geneva on the Lake is $28,050.
What is the Median Family Income in Geneva on the Lake?
Median Family Income in Geneva on the Lake is $61,528.
What is the Median Household income in Geneva on the Lake?
Median Household Income in Geneva on the Lake is $45,755.
What is Income or Wage Gap in Geneva on the Lake?
Income or Wage Gap in Geneva on the Lake is 36.3%.
Women in Geneva on the Lake earn 63.7 cents for every dollar earned by a man.
What is Inequality or Gini Index in Geneva on the Lake?
Inequality or Gini Index in Geneva on the Lake is 0.41.
What is the Total Population of Geneva on the Lake?
Total Population of Geneva on the Lake is 1,085.
What is the Total Male Population of Geneva on the Lake?
Total Male Population of Geneva on the Lake is 550.
What is the Total Female Population of Geneva on the Lake?
Total Female Population of Geneva on the Lake is 535.
What is the Ratio of Males per 100 Females in Geneva on the Lake?
There are 102.80 Males per 100 Females in Geneva on the Lake.
What is the Ratio of Females per 100 Males in Geneva on the Lake?
There are 97.27 Females per 100 Males in Geneva on the Lake.
What is the Median Population Age in Geneva on the Lake?
Median Population Age in Geneva on the Lake is 48.9 Years.
What is the Average Family Size in Geneva on the Lake
Average Family Size in Geneva on the Lake is 3.3 People.
What is the Average Household Size in Geneva on the Lake
Average Household Size in Geneva on the Lake is 2.0 People.
How Large is the Labor Force in Geneva on the Lake?
There are 539 People in the Labor Forcein in Geneva on the Lake.
What is the Percentage of People in the Labor Force in Geneva on the Lake?
58.3% of People are in the Labor Force in Geneva on the Lake.
What is the Unemployment Rate in Geneva on the Lake?
Unemployment Rate in Geneva on the Lake is 6.9%.