Centerville, OH Map & Demographics
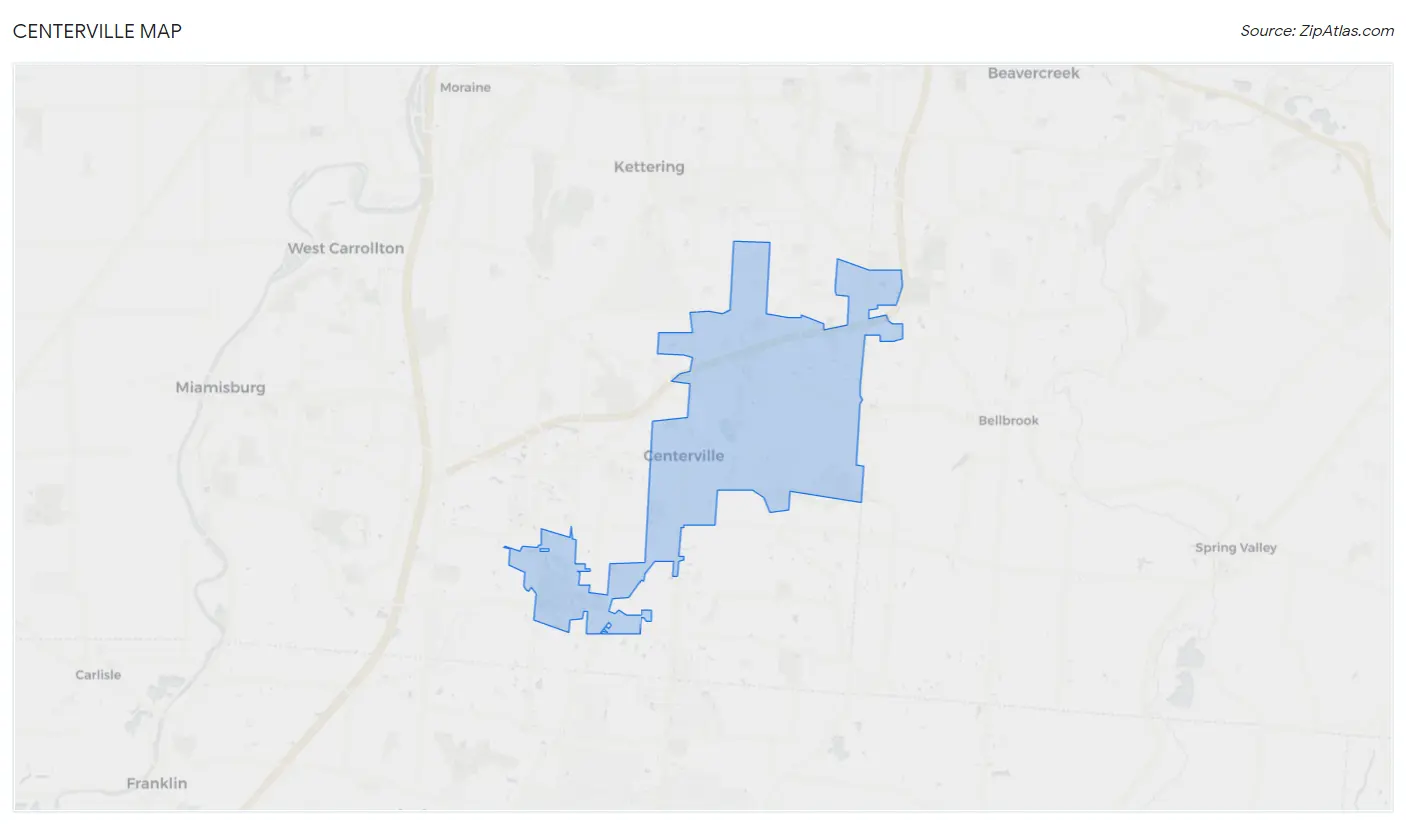
Centerville Map
Centerville Overview
$49,208
PER CAPITA INCOME
$113,962
AVG FAMILY INCOME
$79,509
AVG HOUSEHOLD INCOME
38.3%
WAGE / INCOME GAP [ % ]
61.7¢/ $1
WAGE / INCOME GAP [ $ ]
0.44
INEQUALITY / GINI INDEX
24,510
TOTAL POPULATION
11,502
MALE POPULATION
13,008
FEMALE POPULATION
88.42
MALES / 100 FEMALES
113.09
FEMALES / 100 MALES
49.7
MEDIAN AGE
2.7
AVG FAMILY SIZE
2.1
AVG HOUSEHOLD SIZE
12,776
LABOR FORCE [ PEOPLE ]
61.1%
PERCENT IN LABOR FORCE
3.2%
UNEMPLOYMENT RATE
Centerville Area Codes
Income in Centerville
Income Overview in Centerville
Per Capita Income in Centerville is $49,208, while median incomes of families and households are $113,962 and $79,509 respectively.
| Characteristic | Number | Measure |
| Per Capita Income | 24,510 | $49,208 |
| Median Family Income | 6,662 | $113,962 |
| Mean Family Income | 6,662 | $130,718 |
| Median Household Income | 11,489 | $79,509 |
| Mean Household Income | 11,489 | $103,868 |
| Income Deficit | 6,662 | $0 |
| Wage / Income Gap (%) | 24,510 | 38.27% |
| Wage / Income Gap ($) | 24,510 | 61.73¢ per $1 |
| Gini / Inequality Index | 24,510 | 0.44 |
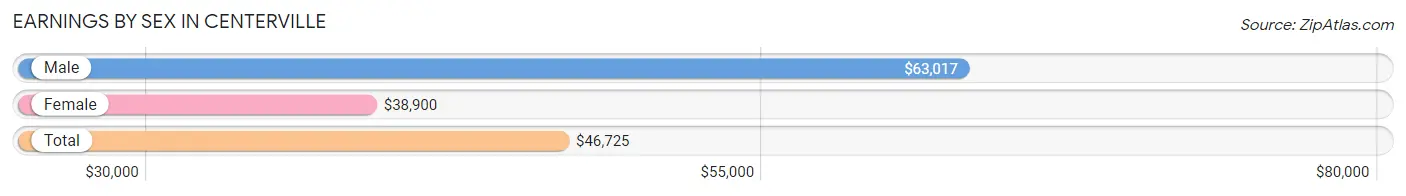
Earnings by Sex in Centerville
Average Earnings in Centerville are $46,725, $63,017 for men and $38,900 for women, a difference of 38.3%.
| Sex | Number | Average Earnings |
| Male | 6,805 (50.9%) | $63,017 |
| Female | 6,561 (49.1%) | $38,900 |
| Total | 13,366 (100.0%) | $46,725 |
Earnings by Sex by Income Bracket in Centerville
The most common earnings brackets in Centerville are $100,000+ for men (1,663 | 24.4%) and $100,000+ for women (763 | 11.6%).
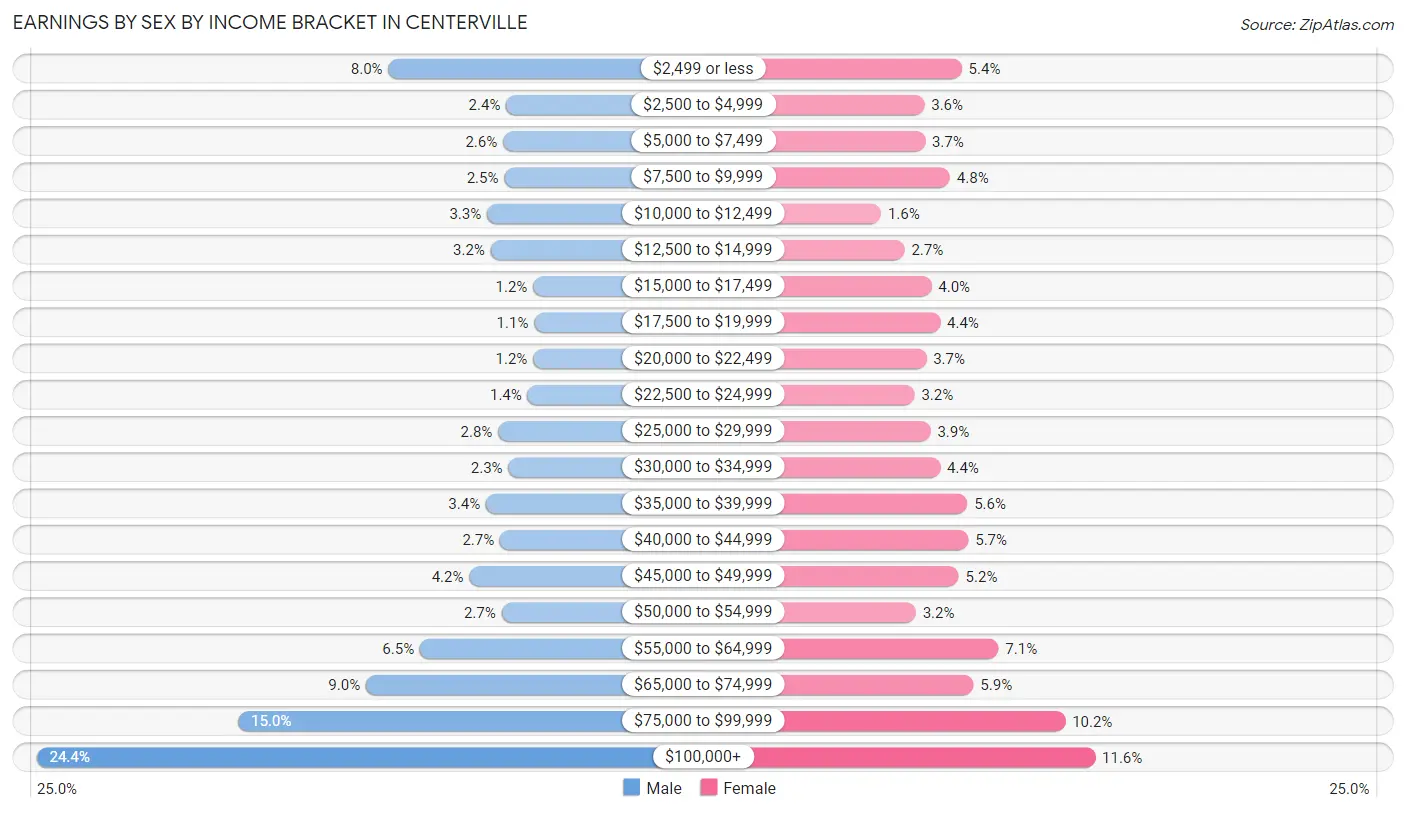
| Income | Male | Female |
| $2,499 or less | 542 (8.0%) | 353 (5.4%) |
| $2,500 to $4,999 | 166 (2.4%) | 238 (3.6%) |
| $5,000 to $7,499 | 176 (2.6%) | 240 (3.7%) |
| $7,500 to $9,999 | 172 (2.5%) | 317 (4.8%) |
| $10,000 to $12,499 | 227 (3.3%) | 105 (1.6%) |
| $12,500 to $14,999 | 216 (3.2%) | 177 (2.7%) |
| $15,000 to $17,499 | 80 (1.2%) | 260 (4.0%) |
| $17,500 to $19,999 | 77 (1.1%) | 287 (4.4%) |
| $20,000 to $22,499 | 80 (1.2%) | 244 (3.7%) |
| $22,500 to $24,999 | 98 (1.4%) | 208 (3.2%) |
| $25,000 to $29,999 | 192 (2.8%) | 257 (3.9%) |
| $30,000 to $34,999 | 159 (2.3%) | 287 (4.4%) |
| $35,000 to $39,999 | 231 (3.4%) | 370 (5.6%) |
| $40,000 to $44,999 | 186 (2.7%) | 373 (5.7%) |
| $45,000 to $49,999 | 284 (4.2%) | 344 (5.2%) |
| $50,000 to $54,999 | 181 (2.7%) | 212 (3.2%) |
| $55,000 to $64,999 | 441 (6.5%) | 466 (7.1%) |
| $65,000 to $74,999 | 613 (9.0%) | 389 (5.9%) |
| $75,000 to $99,999 | 1,021 (15.0%) | 671 (10.2%) |
| $100,000+ | 1,663 (24.4%) | 763 (11.6%) |
| Total | 6,805 (100.0%) | 6,561 (100.0%) |
Earnings by Sex by Educational Attainment in Centerville
Average earnings in Centerville are $69,405 for men and $43,491 for women, a difference of 37.3%. Men with an educational attainment of graduate degree enjoy the highest average annual earnings of $114,941, while those with less than high school education earn the least with $23,942. Women with an educational attainment of graduate degree earn the most with the average annual earnings of $75,842, while those with high school diploma education have the smallest earnings of $21,875.
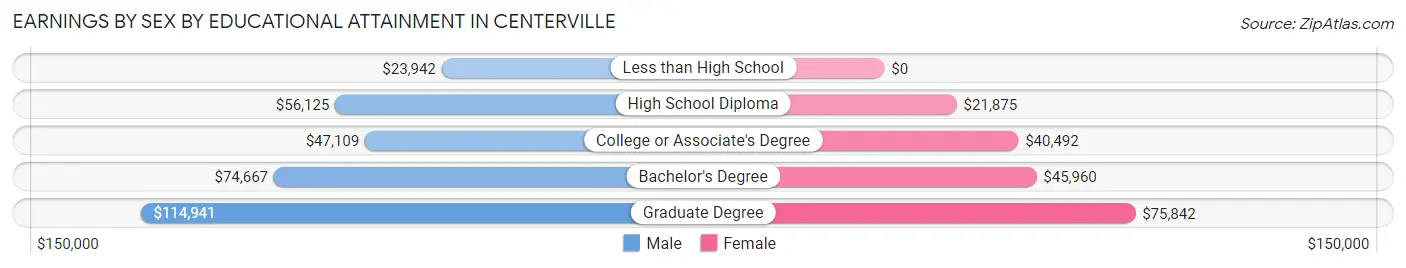
| Educational Attainment | Male Income | Female Income |
| Less than High School | $23,942 | $0 |
| High School Diploma | $56,125 | $21,875 |
| College or Associate's Degree | $47,109 | $40,492 |
| Bachelor's Degree | $74,667 | $45,960 |
| Graduate Degree | $114,941 | $75,842 |
| Total | $69,405 | $43,491 |
Family Income in Centerville
Family Income Brackets in Centerville
According to the Centerville family income data, there are 1,532 families falling into the $100,000 to $149,999 income range, which is the most common income bracket and makes up 23.0% of all families. Conversely, the less than $10,000 income bracket is the least frequent group with only 113 families (1.7%) belonging to this category.
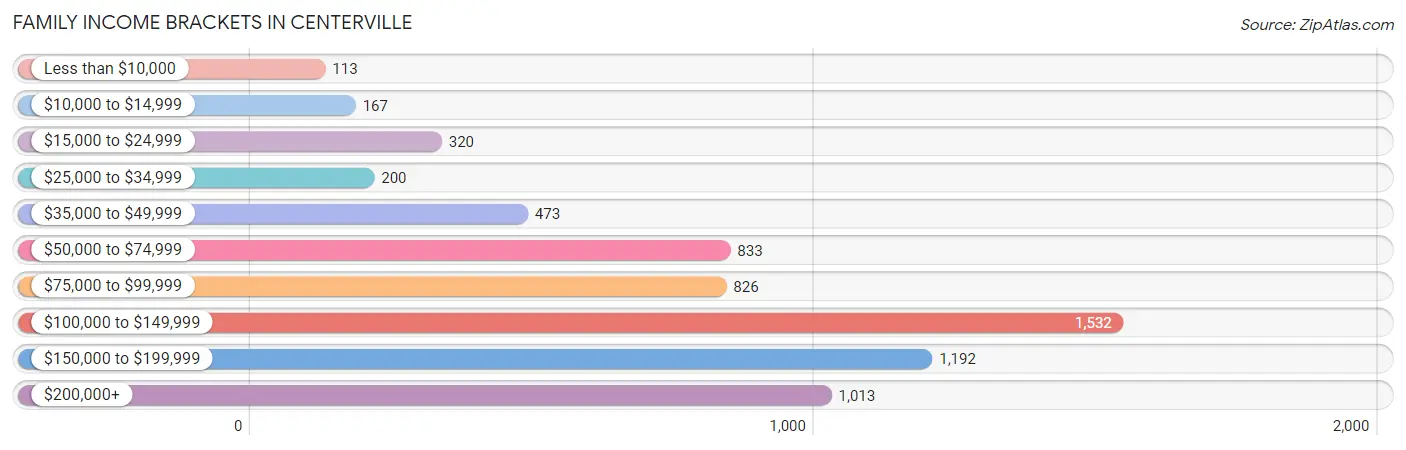
| Income Bracket | # Families | % Families |
| Less than $10,000 | 113 | 1.7% |
| $10,000 to $14,999 | 167 | 2.5% |
| $15,000 to $24,999 | 320 | 4.8% |
| $25,000 to $34,999 | 200 | 3.0% |
| $35,000 to $49,999 | 473 | 7.1% |
| $50,000 to $74,999 | 833 | 12.5% |
| $75,000 to $99,999 | 826 | 12.4% |
| $100,000 to $149,999 | 1,532 | 23.0% |
| $150,000 to $199,999 | 1,192 | 17.9% |
| $200,000+ | 1,013 | 15.2% |
Family Income by Famaliy Size in Centerville
4-person families (1,009 | 15.1%) account for the highest median family income in Centerville with $145,139 per family, while 2-person families (4,002 | 60.1%) have the highest median income of $52,069 per family member.
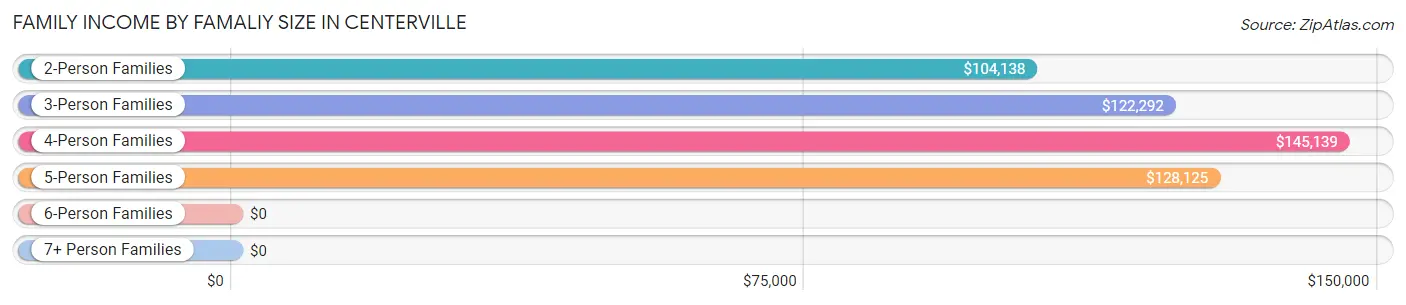
| Income Bracket | # Families | Median Income |
| 2-Person Families | 4,002 (60.1%) | $104,138 |
| 3-Person Families | 1,236 (18.5%) | $122,292 |
| 4-Person Families | 1,009 (15.1%) | $145,139 |
| 5-Person Families | 289 (4.3%) | $128,125 |
| 6-Person Families | 112 (1.7%) | $0 |
| 7+ Person Families | 14 (0.2%) | $0 |
| Total | 6,662 (100.0%) | $113,962 |
Family Income by Number of Earners in Centerville
The median family income in Centerville is $113,962, with families comprising 3+ earners (559) having the highest median family income of $162,952, while families with no earners (1,105) have the lowest median family income of $79,297, accounting for 8.4% and 16.6% of families, respectively.
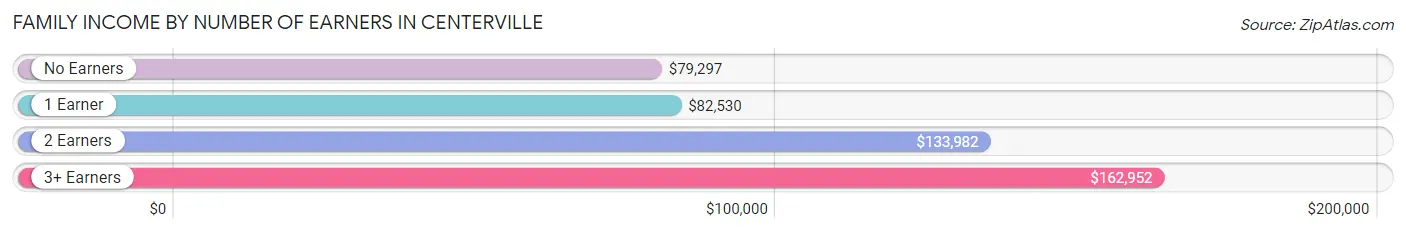
| Number of Earners | # Families | Median Income |
| No Earners | 1,105 (16.6%) | $79,297 |
| 1 Earner | 1,833 (27.5%) | $82,530 |
| 2 Earners | 3,165 (47.5%) | $133,982 |
| 3+ Earners | 559 (8.4%) | $162,952 |
| Total | 6,662 (100.0%) | $113,962 |
Household Income in Centerville
Household Income Brackets in Centerville
With 2,011 households falling in the category, the $100,000 to $149,999 income range is the most frequent in Centerville, accounting for 17.5% of all households. In contrast, only 322 households (2.8%) fall into the less than $10,000 income bracket, making it the least populous group.
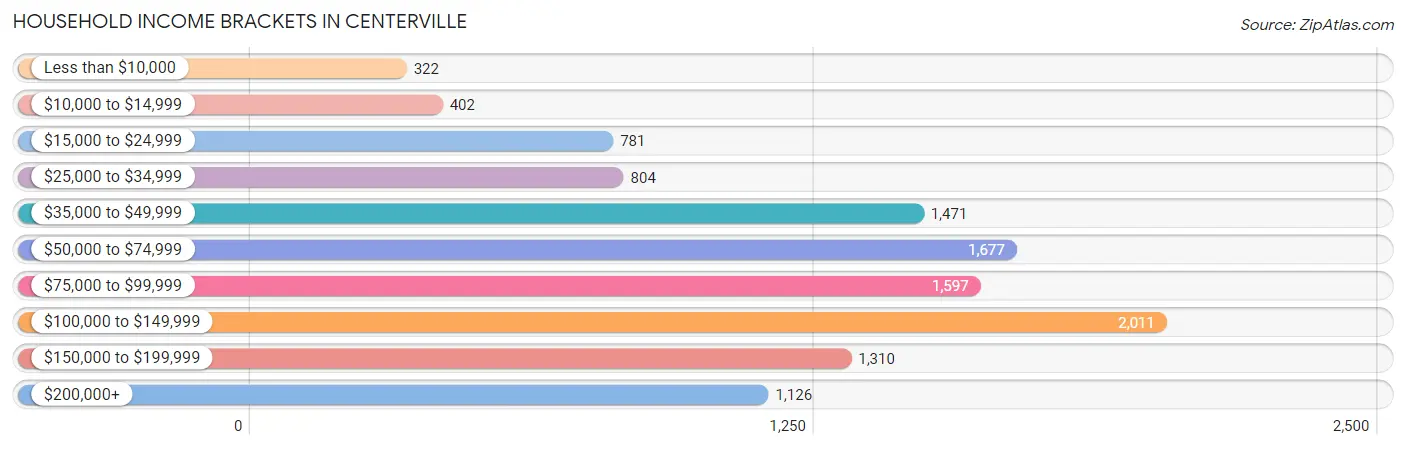
| Income Bracket | # Households | % Households |
| Less than $10,000 | 322 | 2.8% |
| $10,000 to $14,999 | 402 | 3.5% |
| $15,000 to $24,999 | 781 | 6.8% |
| $25,000 to $34,999 | 804 | 7.0% |
| $35,000 to $49,999 | 1,471 | 12.8% |
| $50,000 to $74,999 | 1,677 | 14.6% |
| $75,000 to $99,999 | 1,597 | 13.9% |
| $100,000 to $149,999 | 2,011 | 17.5% |
| $150,000 to $199,999 | 1,310 | 11.4% |
| $200,000+ | 1,126 | 9.8% |
Household Income by Householder Age in Centerville
The median household income in Centerville is $79,509, with the highest median household income of $96,364 found in the 45 to 64 years age bracket for the primary householder. A total of 3,538 households (30.8%) fall into this category. Meanwhile, the 15 to 24 years age bracket for the primary householder has the lowest median household income of $35,238, with 360 households (3.1%) in this group.
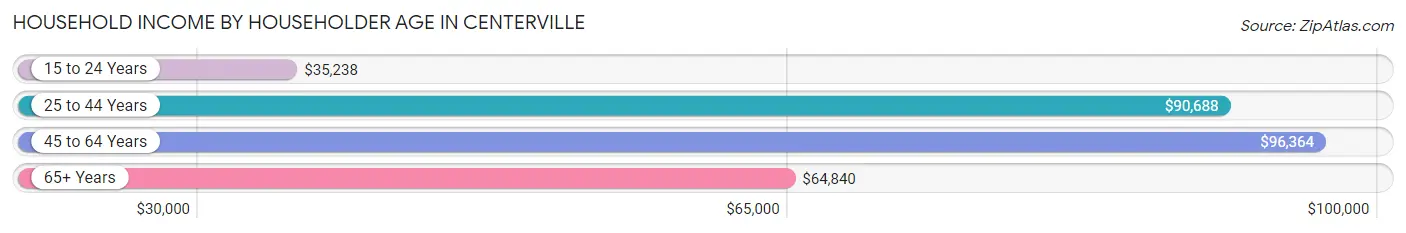
| Income Bracket | # Households | Median Income |
| 15 to 24 Years | 360 (3.1%) | $35,238 |
| 25 to 44 Years | 3,091 (26.9%) | $90,688 |
| 45 to 64 Years | 3,538 (30.8%) | $96,364 |
| 65+ Years | 4,500 (39.2%) | $64,840 |
| Total | 11,489 (100.0%) | $79,509 |
Poverty in Centerville
Income Below Poverty by Sex and Age in Centerville
With 8.1% poverty level for males and 7.7% for females among the residents of Centerville, under 5 year old males and 25 to 34 year old females are the most vulnerable to poverty, with 139 males (18.9%) and 320 females (23.4%) in their respective age groups living below the poverty level.
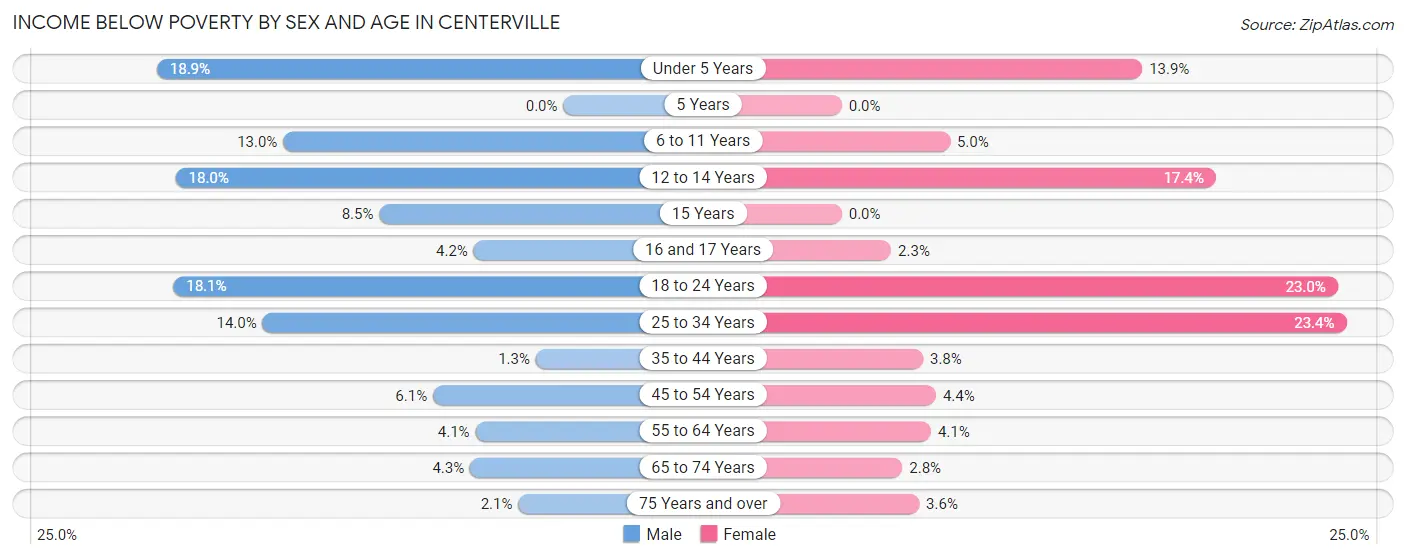
| Age Bracket | Male | Female |
| Under 5 Years | 139 (18.9%) | 92 (13.9%) |
| 5 Years | 0 (0.0%) | 0 (0.0%) |
| 6 to 11 Years | 85 (13.0%) | 26 (5.0%) |
| 12 to 14 Years | 34 (18.0%) | 51 (17.3%) |
| 15 Years | 21 (8.5%) | 0 (0.0%) |
| 16 and 17 Years | 16 (4.2%) | 8 (2.3%) |
| 18 to 24 Years | 143 (18.1%) | 159 (23.0%) |
| 25 to 34 Years | 235 (14.0%) | 320 (23.4%) |
| 35 to 44 Years | 15 (1.3%) | 50 (3.8%) |
| 45 to 54 Years | 64 (6.0%) | 56 (4.4%) |
| 55 to 64 Years | 69 (4.1%) | 76 (4.1%) |
| 65 to 74 Years | 57 (4.3%) | 60 (2.8%) |
| 75 Years and over | 24 (2.1%) | 71 (3.6%) |
| Total | 902 (8.1%) | 969 (7.7%) |
Income Above Poverty by Sex and Age in Centerville
According to the poverty statistics in Centerville, males aged 5 years and females aged 5 years are the age groups that are most secure financially, with 100.0% of males and 100.0% of females in these age groups living above the poverty line.
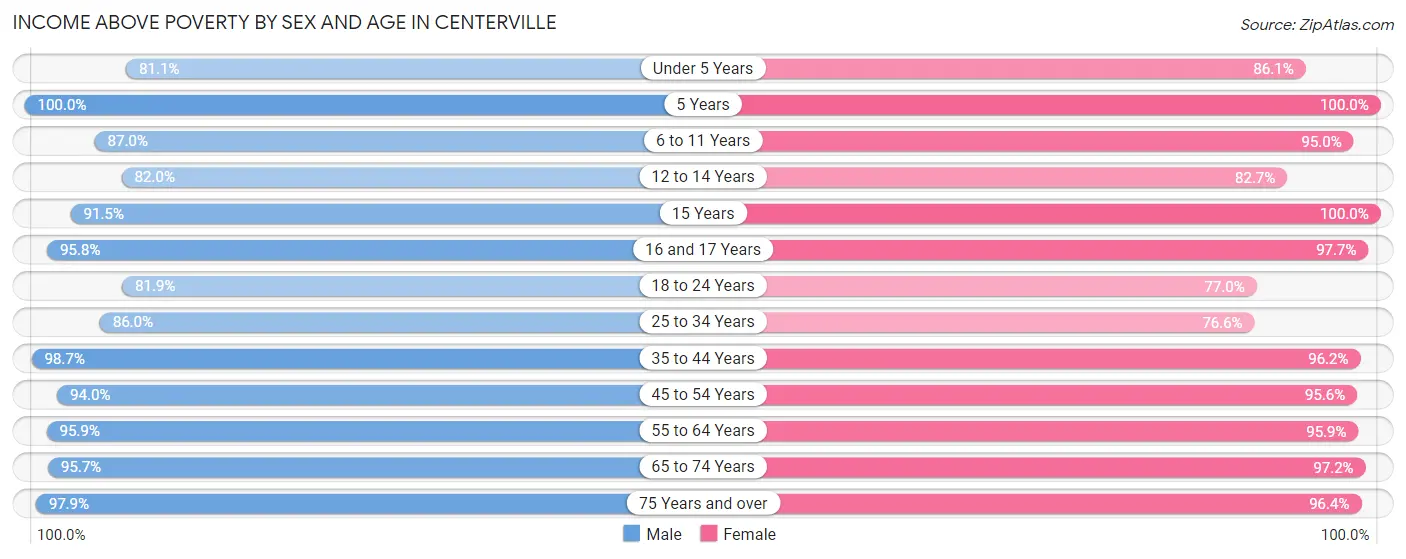
| Age Bracket | Male | Female |
| Under 5 Years | 598 (81.1%) | 568 (86.1%) |
| 5 Years | 87 (100.0%) | 38 (100.0%) |
| 6 to 11 Years | 569 (87.0%) | 492 (95.0%) |
| 12 to 14 Years | 155 (82.0%) | 243 (82.7%) |
| 15 Years | 225 (91.5%) | 149 (100.0%) |
| 16 and 17 Years | 369 (95.8%) | 342 (97.7%) |
| 18 to 24 Years | 647 (81.9%) | 532 (77.0%) |
| 25 to 34 Years | 1,448 (86.0%) | 1,047 (76.6%) |
| 35 to 44 Years | 1,160 (98.7%) | 1,276 (96.2%) |
| 45 to 54 Years | 993 (94.0%) | 1,226 (95.6%) |
| 55 to 64 Years | 1,621 (95.9%) | 1,758 (95.9%) |
| 65 to 74 Years | 1,259 (95.7%) | 2,079 (97.2%) |
| 75 Years and over | 1,122 (97.9%) | 1,907 (96.4%) |
| Total | 10,253 (91.9%) | 11,657 (92.3%) |
Income Below Poverty Among Married-Couple Families in Centerville
The poverty statistics for married-couple families in Centerville show that 1.6% or 83 of the total 5,284 families live below the poverty line. Families with 3 or 4 children have the highest poverty rate of 15.0%, comprising of 37 families. On the other hand, families with 1 or 2 children have the lowest poverty rate of 0.9%, which includes 13 families.
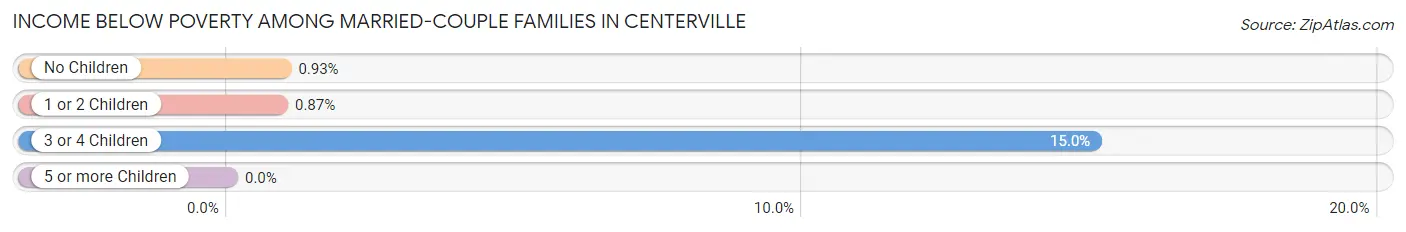
| Children | Above Poverty | Below Poverty |
| No Children | 3,517 (99.1%) | 33 (0.9%) |
| 1 or 2 Children | 1,475 (99.1%) | 13 (0.9%) |
| 3 or 4 Children | 209 (85.0%) | 37 (15.0%) |
| 5 or more Children | 0 (0.0%) | 0 (0.0%) |
| Total | 5,201 (98.4%) | 83 (1.6%) |
Income Below Poverty Among Single-Parent Households in Centerville
According to the poverty data in Centerville, 64.4% or 145 single-father households and 26.3% or 303 single-mother households are living below the poverty line. Among single-father households, those with no children have the highest poverty rate, with 145 households (75.1%) experiencing poverty. Likewise, among single-mother households, those with 1 or 2 children have the highest poverty rate, with 291 households (36.7%) falling below the poverty line.
| Children | Single Father | Single Mother |
| No Children | 145 (75.1%) | 0 (0.0%) |
| 1 or 2 Children | 0 (0.0%) | 291 (36.7%) |
| 3 or 4 Children | 0 (0.0%) | 12 (24.5%) |
| 5 or more Children | 0 (0.0%) | 0 (0.0%) |
| Total | 145 (64.4%) | 303 (26.3%) |
Income Below Poverty Among Married-Couple vs Single-Parent Households in Centerville
The poverty data for Centerville shows that 83 of the married-couple family households (1.6%) and 448 of the single-parent households (32.5%) are living below the poverty level. Within the married-couple family households, those with 3 or 4 children have the highest poverty rate, with 37 households (15.0%) falling below the poverty line. Among the single-parent households, those with 1 or 2 children have the highest poverty rate, with 291 household (35.3%) living below poverty.
| Children | Married-Couple Families | Single-Parent Households |
| No Children | 33 (0.9%) | 145 (28.7%) |
| 1 or 2 Children | 13 (0.9%) | 291 (35.3%) |
| 3 or 4 Children | 37 (15.0%) | 12 (24.5%) |
| 5 or more Children | 0 (0.0%) | 0 (0.0%) |
| Total | 83 (1.6%) | 448 (32.5%) |
Race in Centerville
The most populous races in Centerville are White / Caucasian (20,766 | 84.7%), Black / African American (1,406 | 5.7%), and Asian (1,094 | 4.5%).
| Race | # Population | % Population |
| Asian | 1,094 | 4.5% |
| Black / African American | 1,406 | 5.7% |
| Hawaiian / Pacific | 19 | 0.1% |
| Hispanic or Latino | 1,062 | 4.3% |
| Native / Alaskan | 12 | 0.1% |
| White / Caucasian | 20,766 | 84.7% |
| Two or more Races | 888 | 3.6% |
| Some other Race | 325 | 1.3% |
| Total | 24,510 | 100.0% |
Ancestry in Centerville
The most populous ancestries reported in Centerville are German (6,759 | 27.6%), Irish (3,253 | 13.3%), English (3,169 | 12.9%), American (1,483 | 6.0%), and Italian (1,265 | 5.2%), together accounting for 65.0% of all Centerville residents.
| Ancestry | # Population | % Population |
| African | 87 | 0.4% |
| American | 1,483 | 6.0% |
| Arab | 400 | 1.6% |
| Argentinean | 11 | 0.0% |
| Austrian | 110 | 0.4% |
| Basque | 25 | 0.1% |
| Belgian | 12 | 0.1% |
| Bhutanese | 89 | 0.4% |
| Brazilian | 18 | 0.1% |
| British | 196 | 0.8% |
| Bulgarian | 34 | 0.1% |
| Burmese | 62 | 0.3% |
| Canadian | 22 | 0.1% |
| Central American | 205 | 0.8% |
| Central American Indian | 68 | 0.3% |
| Cherokee | 18 | 0.1% |
| Choctaw | 15 | 0.1% |
| Croatian | 15 | 0.1% |
| Czech | 48 | 0.2% |
| Czechoslovakian | 63 | 0.3% |
| Danish | 65 | 0.3% |
| Dutch | 531 | 2.2% |
| Eastern European | 142 | 0.6% |
| Ecuadorian | 9 | 0.0% |
| English | 3,169 | 12.9% |
| European | 590 | 2.4% |
| Filipino | 79 | 0.3% |
| Finnish | 13 | 0.1% |
| French | 646 | 2.6% |
| French Canadian | 39 | 0.2% |
| German | 6,759 | 27.6% |
| Greek | 101 | 0.4% |
| Guamanian / Chamorro | 19 | 0.1% |
| Guatemalan | 87 | 0.4% |
| Honduran | 14 | 0.1% |
| Hungarian | 198 | 0.8% |
| Indian (Asian) | 216 | 0.9% |
| Iranian | 106 | 0.4% |
| Iraqi | 51 | 0.2% |
| Irish | 3,253 | 13.3% |
| Iroquois | 12 | 0.1% |
| Italian | 1,265 | 5.2% |
| Japanese | 106 | 0.4% |
| Korean | 61 | 0.3% |
| Latvian | 47 | 0.2% |
| Lebanese | 65 | 0.3% |
| Lithuanian | 93 | 0.4% |
| Macedonian | 7 | 0.0% |
| Mexican | 417 | 1.7% |
| Mongolian | 22 | 0.1% |
| Northern European | 78 | 0.3% |
| Norwegian | 273 | 1.1% |
| Pakistani | 38 | 0.2% |
| Palestinian | 65 | 0.3% |
| Pennsylvania German | 48 | 0.2% |
| Peruvian | 4 | 0.0% |
| Polish | 847 | 3.5% |
| Portuguese | 18 | 0.1% |
| Potawatomi | 14 | 0.1% |
| Puerto Rican | 356 | 1.5% |
| Romanian | 27 | 0.1% |
| Russian | 125 | 0.5% |
| Salvadoran | 87 | 0.4% |
| Scandinavian | 48 | 0.2% |
| Scotch-Irish | 395 | 1.6% |
| Scottish | 624 | 2.5% |
| Slovak | 157 | 0.6% |
| Slovene | 38 | 0.2% |
| South American | 24 | 0.1% |
| Spaniard | 31 | 0.1% |
| Spanish | 25 | 0.1% |
| Sri Lankan | 306 | 1.3% |
| Subsaharan African | 481 | 2.0% |
| Sudanese | 144 | 0.6% |
| Swedish | 214 | 0.9% |
| Swiss | 81 | 0.3% |
| Syrian | 4 | 0.0% |
| Thai | 420 | 1.7% |
| Ukrainian | 44 | 0.2% |
| Welsh | 340 | 1.4% | View All 80 Rows |
Immigrants in Centerville
The most numerous immigrant groups reported in Centerville came from Asia (922 | 3.8%), South Central Asia (546 | 2.2%), India (462 | 1.9%), Europe (434 | 1.8%), and Africa (350 | 1.4%), together accounting for 11.1% of all Centerville residents.
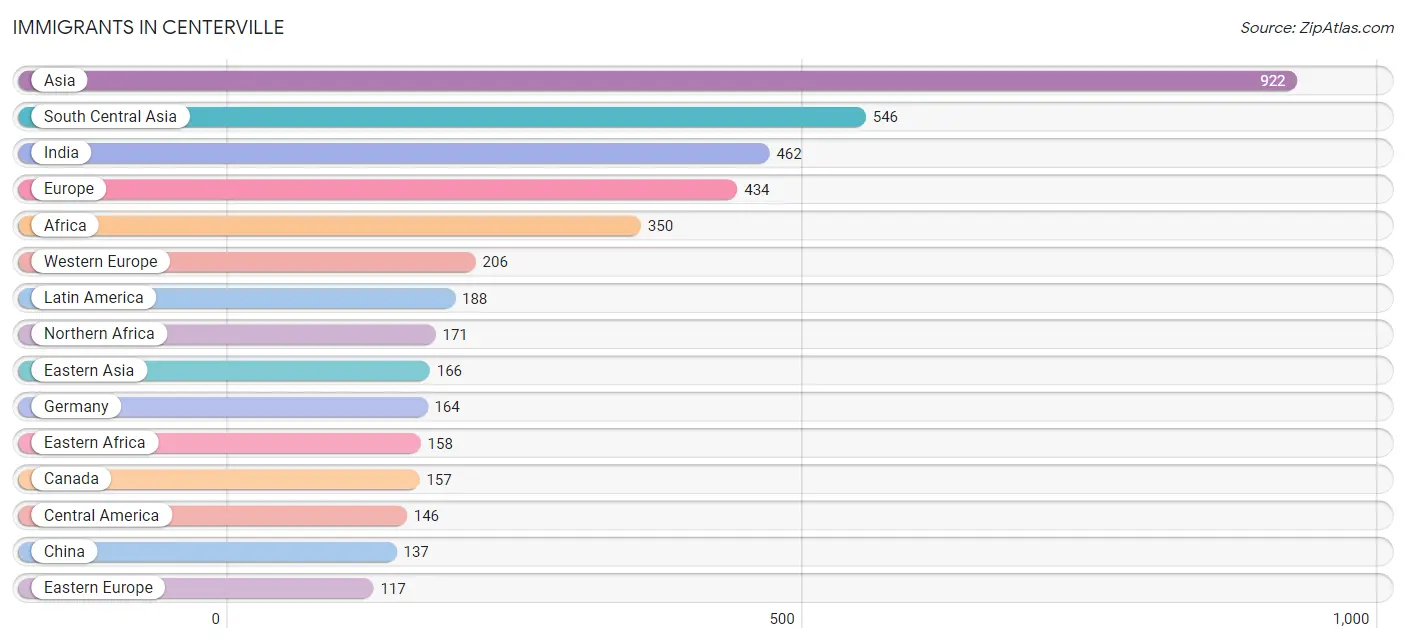
| Immigration Origin | # Population | % Population |
| Africa | 350 | 1.4% |
| Argentina | 11 | 0.0% |
| Asia | 922 | 3.8% |
| Brazil | 18 | 0.1% |
| Bulgaria | 27 | 0.1% |
| Canada | 157 | 0.6% |
| Central America | 146 | 0.6% |
| China | 137 | 0.6% |
| Eastern Africa | 158 | 0.6% |
| Eastern Asia | 166 | 0.7% |
| Eastern Europe | 117 | 0.5% |
| Ecuador | 9 | 0.0% |
| Egypt | 78 | 0.3% |
| El Salvador | 40 | 0.2% |
| England | 10 | 0.0% |
| Europe | 434 | 1.8% |
| France | 16 | 0.1% |
| Germany | 164 | 0.7% |
| Greece | 8 | 0.0% |
| Guatemala | 87 | 0.4% |
| Honduras | 6 | 0.0% |
| Hungary | 5 | 0.0% |
| India | 462 | 1.9% |
| Iran | 54 | 0.2% |
| Iraq | 25 | 0.1% |
| Italy | 7 | 0.0% |
| Japan | 29 | 0.1% |
| Jordan | 37 | 0.2% |
| Kuwait | 49 | 0.2% |
| Latin America | 188 | 0.8% |
| Malaysia | 22 | 0.1% |
| Mexico | 13 | 0.1% |
| Netherlands | 26 | 0.1% |
| Northern Africa | 171 | 0.7% |
| Northern Europe | 77 | 0.3% |
| Norway | 15 | 0.1% |
| Pakistan | 30 | 0.1% |
| Peru | 4 | 0.0% |
| Romania | 10 | 0.0% |
| Russia | 34 | 0.1% |
| Scotland | 34 | 0.1% |
| Senegal | 21 | 0.1% |
| South America | 42 | 0.2% |
| South Central Asia | 546 | 2.2% |
| South Eastern Asia | 88 | 0.4% |
| Southern Europe | 15 | 0.1% |
| Sudan | 93 | 0.4% |
| Taiwan | 72 | 0.3% |
| Ukraine | 41 | 0.2% |
| Vietnam | 66 | 0.3% |
| Western Africa | 21 | 0.1% |
| Western Asia | 111 | 0.4% |
| Western Europe | 206 | 0.8% | View All 53 Rows |
Sex and Age in Centerville
Sex and Age in Centerville
The most populous age groups in Centerville are 60 to 64 Years (1,056 | 9.2%) for men and 70 to 74 Years (1,193 | 9.2%) for women.
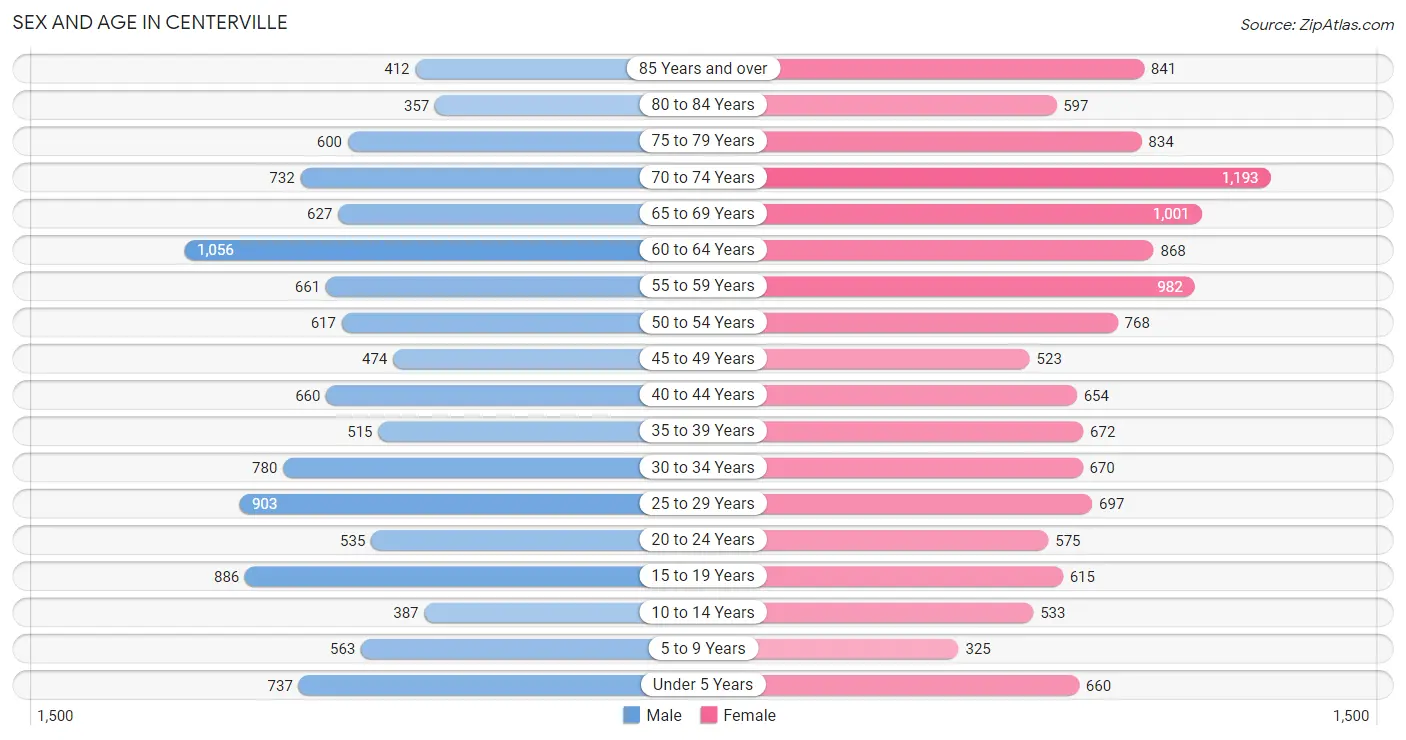
| Age Bracket | Male | Female |
| Under 5 Years | 737 (6.4%) | 660 (5.1%) |
| 5 to 9 Years | 563 (4.9%) | 325 (2.5%) |
| 10 to 14 Years | 387 (3.4%) | 533 (4.1%) |
| 15 to 19 Years | 886 (7.7%) | 615 (4.7%) |
| 20 to 24 Years | 535 (4.6%) | 575 (4.4%) |
| 25 to 29 Years | 903 (7.9%) | 697 (5.4%) |
| 30 to 34 Years | 780 (6.8%) | 670 (5.1%) |
| 35 to 39 Years | 515 (4.5%) | 672 (5.2%) |
| 40 to 44 Years | 660 (5.7%) | 654 (5.0%) |
| 45 to 49 Years | 474 (4.1%) | 523 (4.0%) |
| 50 to 54 Years | 617 (5.4%) | 768 (5.9%) |
| 55 to 59 Years | 661 (5.8%) | 982 (7.5%) |
| 60 to 64 Years | 1,056 (9.2%) | 868 (6.7%) |
| 65 to 69 Years | 627 (5.4%) | 1,001 (7.7%) |
| 70 to 74 Years | 732 (6.4%) | 1,193 (9.2%) |
| 75 to 79 Years | 600 (5.2%) | 834 (6.4%) |
| 80 to 84 Years | 357 (3.1%) | 597 (4.6%) |
| 85 Years and over | 412 (3.6%) | 841 (6.5%) |
| Total | 11,502 (100.0%) | 13,008 (100.0%) |
Families and Households in Centerville
Median Family Size in Centerville
The median family size in Centerville is 2.72 persons per family, with married-couple families (5,284 | 79.3%) accounting for the largest median family size of 2.81 persons per family. On the other hand, single male/father families (225 | 3.4%) represent the smallest median family size with 1.95 persons per family.
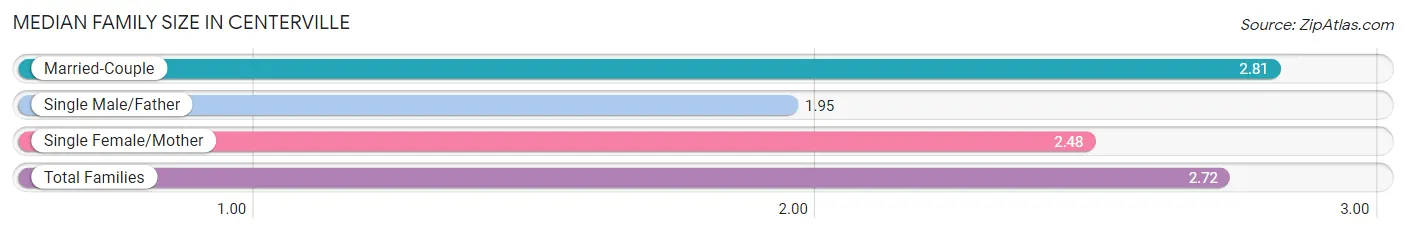
| Family Type | # Families | Family Size |
| Married-Couple | 5,284 (79.3%) | 2.81 |
| Single Male/Father | 225 (3.4%) | 1.95 |
| Single Female/Mother | 1,153 (17.3%) | 2.48 |
| Total Families | 6,662 (100.0%) | 2.72 |
Median Household Size in Centerville
The median household size in Centerville is 2.07 persons per household, with married-couple households (5,284 | 46.0%) accounting for the largest median household size of 2.81 persons per household. non-family households (4,827 | 42.0%) represent the smallest median household size with 1.15 persons per household.
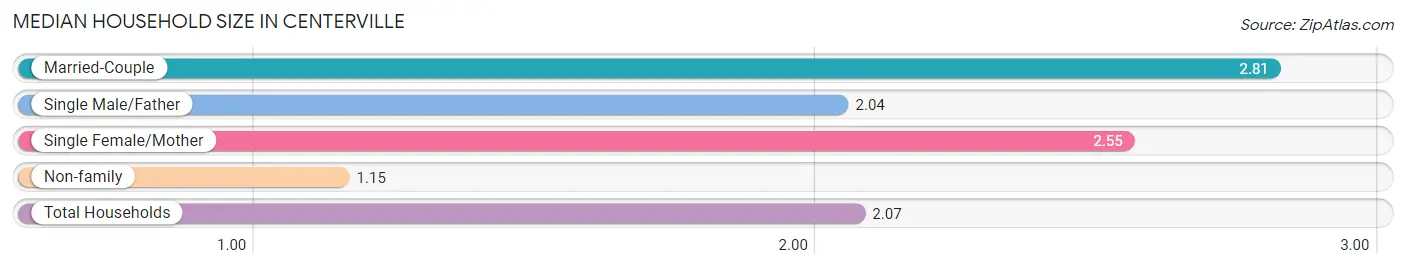
| Household Type | # Households | Household Size |
| Married-Couple | 5,284 (46.0%) | 2.81 |
| Single Male/Father | 225 (2.0%) | 2.04 |
| Single Female/Mother | 1,153 (10.0%) | 2.55 |
| Non-family | 4,827 (42.0%) | 1.15 |
| Total Households | 11,489 (100.0%) | 2.07 |
Household Size by Marriage Status in Centerville
Out of a total of 11,489 households in Centerville, 6,662 (58.0%) are family households, while 4,827 (42.0%) are nonfamily households. The most numerous type of family households are 2-person households, comprising 3,927, and the most common type of nonfamily households are 1-person households, comprising 4,122.
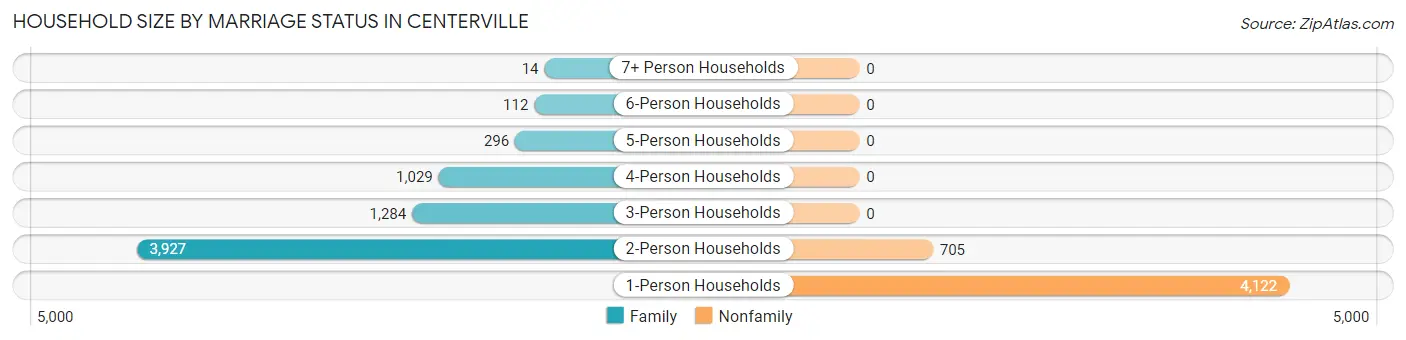
| Household Size | Family Households | Nonfamily Households |
| 1-Person Households | - | 4,122 (35.9%) |
| 2-Person Households | 3,927 (34.2%) | 705 (6.1%) |
| 3-Person Households | 1,284 (11.2%) | 0 (0.0%) |
| 4-Person Households | 1,029 (9.0%) | 0 (0.0%) |
| 5-Person Households | 296 (2.6%) | 0 (0.0%) |
| 6-Person Households | 112 (1.0%) | 0 (0.0%) |
| 7+ Person Households | 14 (0.1%) | 0 (0.0%) |
| Total | 6,662 (58.0%) | 4,827 (42.0%) |
Female Fertility in Centerville
Fertility by Age in Centerville
Average fertility rate in Centerville is 86.0 births per 1,000 women. Women in the age bracket of 20 to 34 years have the highest fertility rate with 162.0 births per 1,000 women. Women in the age bracket of 20 to 34 years acount for 81.1% of all women with births.
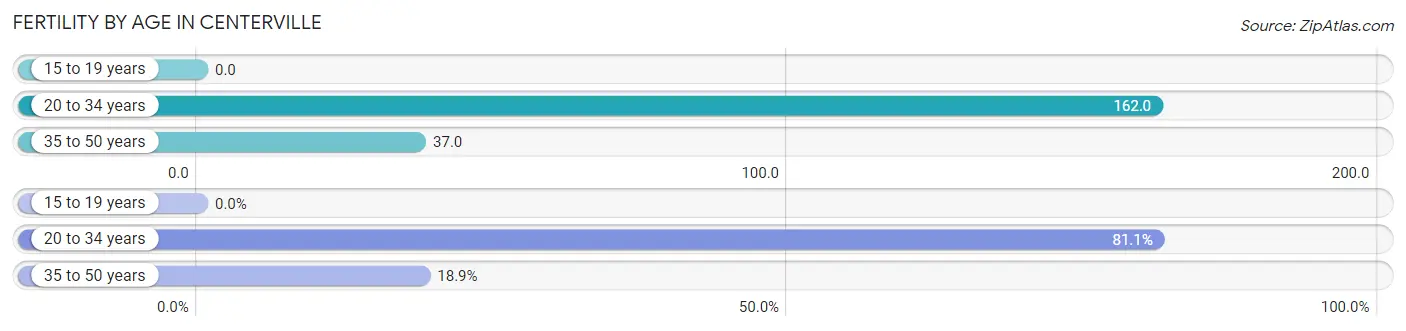
| Age Bracket | Women with Births | Births / 1,000 Women |
| 15 to 19 years | 0 (0.0%) | 0.0 |
| 20 to 34 years | 314 (81.1%) | 162.0 |
| 35 to 50 years | 73 (18.9%) | 37.0 |
| Total | 387 (100.0%) | 86.0 |
Fertility by Age by Marriage Status in Centerville
56.1% of women with births (387) in Centerville are married. The highest percentage of unmarried women with births falls into 20 to 34 years age bracket with 54.1% of them unmarried at the time of birth, while the lowest percentage of unmarried women with births belong to 35 to 50 years age bracket with 0.0% of them unmarried.
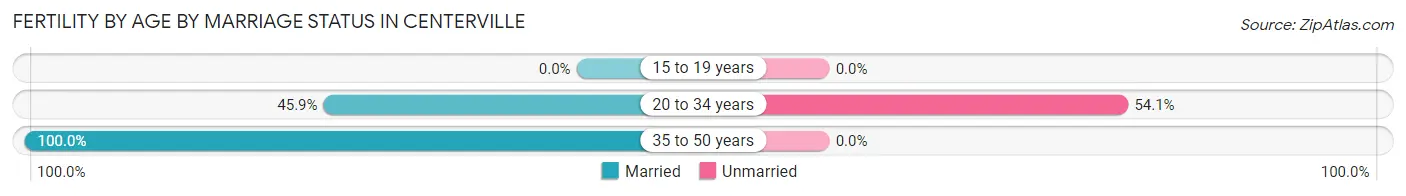
| Age Bracket | Married | Unmarried |
| 15 to 19 years | 0 (0.0%) | 0 (0.0%) |
| 20 to 34 years | 144 (45.9%) | 170 (54.1%) |
| 35 to 50 years | 73 (100.0%) | 0 (0.0%) |
| Total | 217 (56.1%) | 170 (43.9%) |
Fertility by Education in Centerville
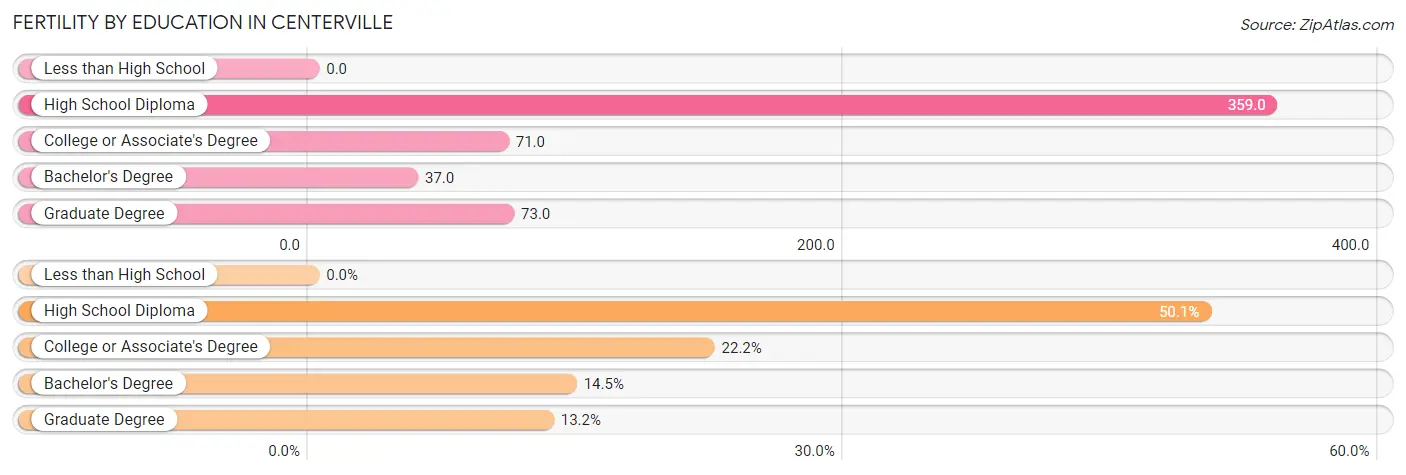
| Educational Attainment | Women with Births | Births / 1,000 Women |
| Less than High School | 0 (0.0%) | 0.0 |
| High School Diploma | 194 (50.1%) | 359.0 |
| College or Associate's Degree | 86 (22.2%) | 71.0 |
| Bachelor's Degree | 56 (14.5%) | 37.0 |
| Graduate Degree | 51 (13.2%) | 73.0 |
| Total | 387 (100.0%) | 86.0 |
Fertility by Education by Marriage Status in Centerville
43.9% of women with births in Centerville are unmarried. Women with the educational attainment of college or associate's degree are most likely to be married with 100.0% of them married at childbirth, while women with the educational attainment of high school diploma are least likely to be married with 87.6% of them unmarried at childbirth.
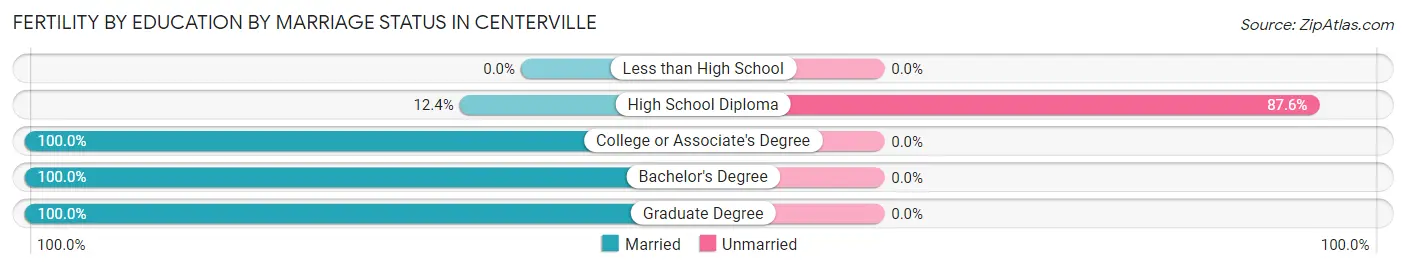
| Educational Attainment | Married | Unmarried |
| Less than High School | 0 (0.0%) | 0 (0.0%) |
| High School Diploma | 24 (12.4%) | 170 (87.6%) |
| College or Associate's Degree | 86 (100.0%) | 0 (0.0%) |
| Bachelor's Degree | 56 (100.0%) | 0 (0.0%) |
| Graduate Degree | 51 (100.0%) | 0 (0.0%) |
| Total | 217 (56.1%) | 170 (43.9%) |
Employment Characteristics in Centerville
Employment by Class of Employer in Centerville
Among the 11,958 employed individuals in Centerville, private company employees (7,264 | 60.8%), not-for-profit organizations (1,601 | 13.4%), and local government employees (1,102 | 9.2%) make up the most common classes of employment.
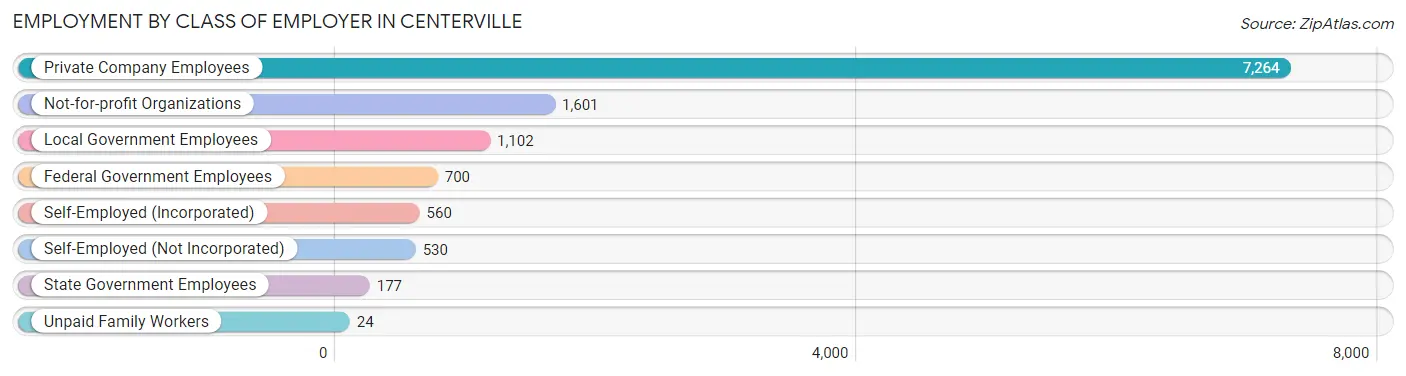
| Employer Class | # Employees | % Employees |
| Private Company Employees | 7,264 | 60.8% |
| Self-Employed (Incorporated) | 560 | 4.7% |
| Self-Employed (Not Incorporated) | 530 | 4.4% |
| Not-for-profit Organizations | 1,601 | 13.4% |
| Local Government Employees | 1,102 | 9.2% |
| State Government Employees | 177 | 1.5% |
| Federal Government Employees | 700 | 5.9% |
| Unpaid Family Workers | 24 | 0.2% |
| Total | 11,958 | 100.0% |
Employment Status by Age in Centerville
According to the labor force statistics for Centerville, out of the total population over 16 years of age (20,910), 61.1% or 12,776 individuals are in the labor force, with 3.2% or 409 of them unemployed. The age group with the highest labor force participation rate is 35 to 44 years, with 92.6% or 2,316 individuals in the labor force. Within the labor force, the 25 to 29 years age range has the highest percentage of unemployed individuals, with 10.9% or 158 of them being unemployed.
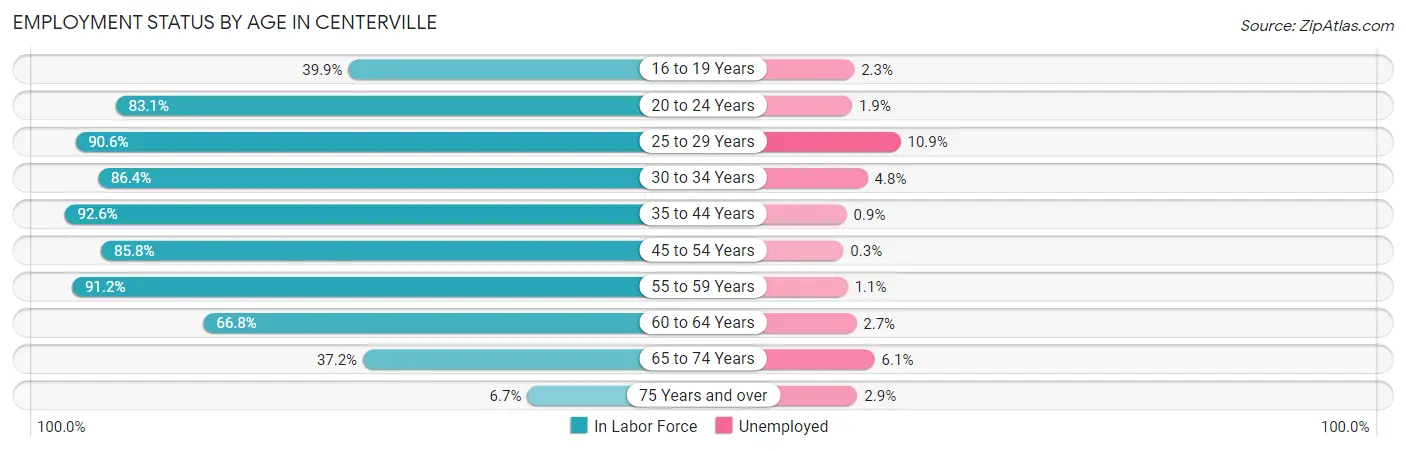
| Age Bracket | In Labor Force | Unemployed |
| 16 to 19 Years | 441 (39.9%) | 10 (2.3%) |
| 20 to 24 Years | 922 (83.1%) | 18 (1.9%) |
| 25 to 29 Years | 1,450 (90.6%) | 158 (10.9%) |
| 30 to 34 Years | 1,253 (86.4%) | 60 (4.8%) |
| 35 to 44 Years | 2,316 (92.6%) | 21 (0.9%) |
| 45 to 54 Years | 2,044 (85.8%) | 6 (0.3%) |
| 55 to 59 Years | 1,498 (91.2%) | 16 (1.1%) |
| 60 to 64 Years | 1,285 (66.8%) | 35 (2.7%) |
| 65 to 74 Years | 1,322 (37.2%) | 81 (6.1%) |
| 75 Years and over | 244 (6.7%) | 7 (2.9%) |
| Total | 12,776 (61.1%) | 409 (3.2%) |
Employment Status by Educational Attainment in Centerville
According to labor force statistics for Centerville, 85.6% of individuals (9,844) out of the total population between 25 and 64 years of age (11,500) are in the labor force, with 3.0% or 295 of them being unemployed. The group with the highest labor force participation rate are those with the educational attainment of bachelor's degree or higher, with 87.8% or 5,321 individuals in the labor force. Within the labor force, individuals with college / associate degree education have the highest percentage of unemployment, with 6.7% or 207 of them being unemployed.
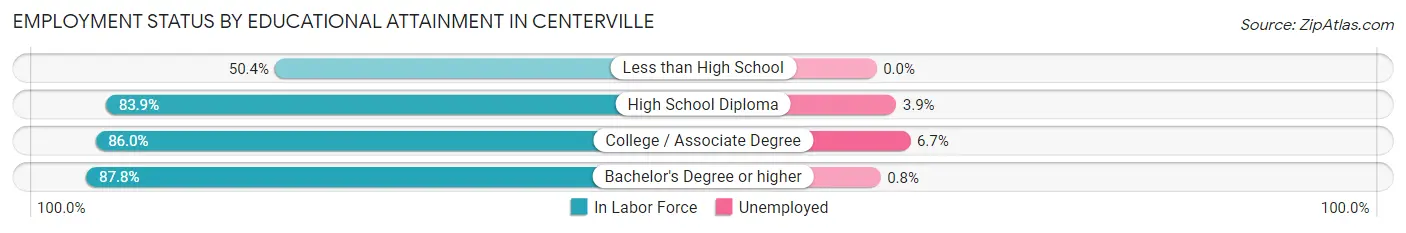
| Educational Attainment | In Labor Force | Unemployed |
| Less than High School | 174 (50.4%) | 0 (0.0%) |
| High School Diploma | 1,266 (83.9%) | 59 (3.9%) |
| College / Associate Degree | 3,084 (86.0%) | 240 (6.7%) |
| Bachelor's Degree or higher | 5,321 (87.8%) | 48 (0.8%) |
| Total | 9,844 (85.6%) | 345 (3.0%) |
Employment Occupations by Sex in Centerville
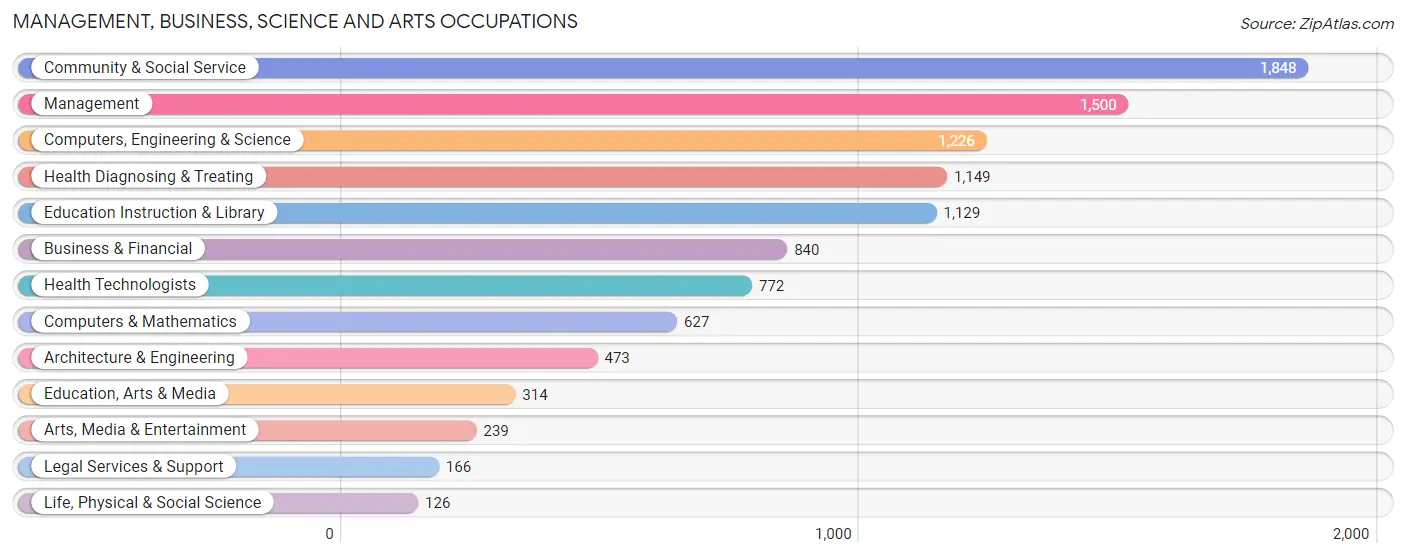
Management, Business, Science and Arts Occupations
The most common Management, Business, Science and Arts occupations in Centerville are Community & Social Service (1,848 | 15.1%), Management (1,500 | 12.3%), Computers, Engineering & Science (1,226 | 10.1%), Health Diagnosing & Treating (1,149 | 9.4%), and Education Instruction & Library (1,129 | 9.2%).
Management, Business, Science and Arts Occupations by Sex
Within the Management, Business, Science and Arts occupations in Centerville, the most male-oriented occupations are Architecture & Engineering (75.3%), Computers, Engineering & Science (74.9%), and Computers & Mathematics (74.6%), while the most female-oriented occupations are Education, Arts & Media (84.1%), Education Instruction & Library (75.2%), and Community & Social Service (71.5%).
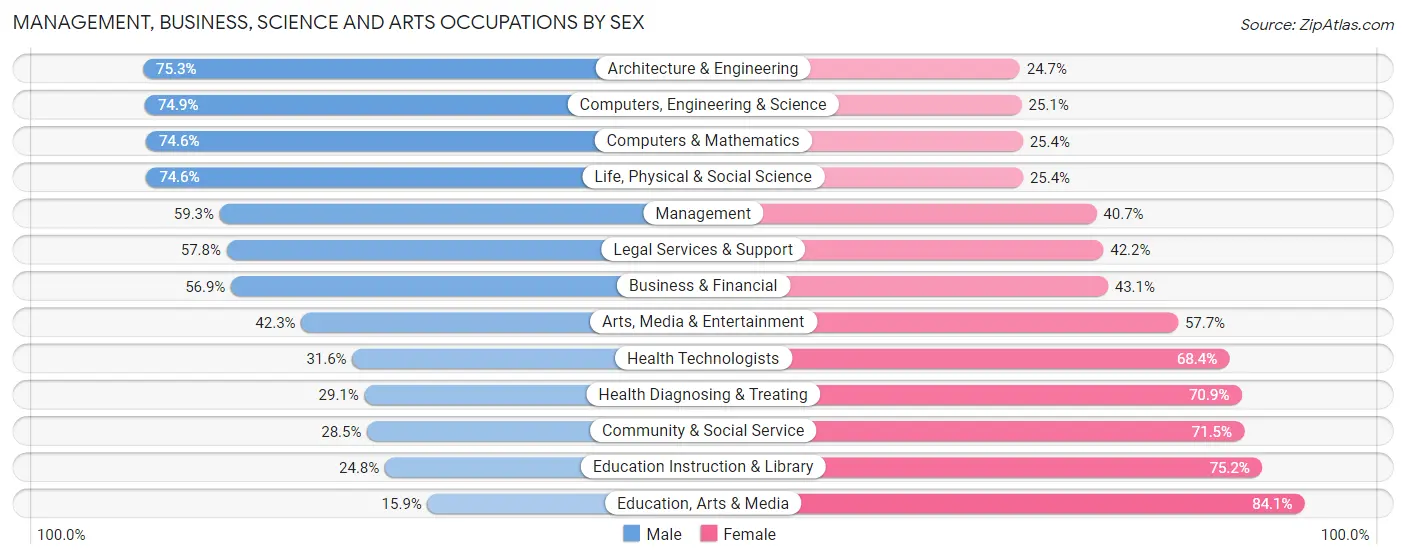
| Occupation | Male | Female |
| Management | 889 (59.3%) | 611 (40.7%) |
| Business & Financial | 478 (56.9%) | 362 (43.1%) |
| Computers, Engineering & Science | 918 (74.9%) | 308 (25.1%) |
| Computers & Mathematics | 468 (74.6%) | 159 (25.4%) |
| Architecture & Engineering | 356 (75.3%) | 117 (24.7%) |
| Life, Physical & Social Science | 94 (74.6%) | 32 (25.4%) |
| Community & Social Service | 527 (28.5%) | 1,321 (71.5%) |
| Education, Arts & Media | 50 (15.9%) | 264 (84.1%) |
| Legal Services & Support | 96 (57.8%) | 70 (42.2%) |
| Education Instruction & Library | 280 (24.8%) | 849 (75.2%) |
| Arts, Media & Entertainment | 101 (42.3%) | 138 (57.7%) |
| Health Diagnosing & Treating | 334 (29.1%) | 815 (70.9%) |
| Health Technologists | 244 (31.6%) | 528 (68.4%) |
| Total (Category) | 3,146 (47.9%) | 3,417 (52.1%) |
| Total (Overall) | 6,021 (49.3%) | 6,183 (50.7%) |
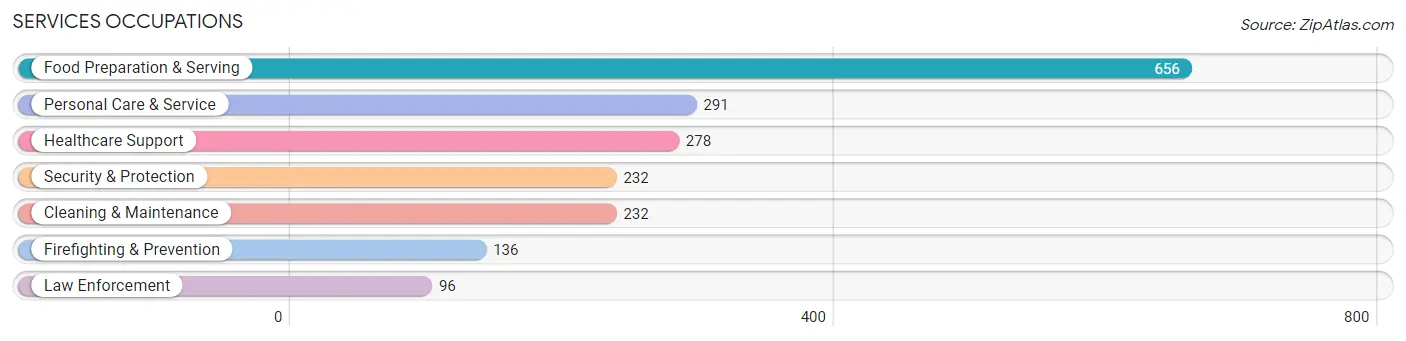
Services Occupations
The most common Services occupations in Centerville are Food Preparation & Serving (656 | 5.4%), Personal Care & Service (291 | 2.4%), Healthcare Support (278 | 2.3%), Security & Protection (232 | 1.9%), and Cleaning & Maintenance (232 | 1.9%).
Services Occupations by Sex
Within the Services occupations in Centerville, the most male-oriented occupations are Law Enforcement (100.0%), Security & Protection (85.3%), and Firefighting & Prevention (75.0%), while the most female-oriented occupations are Personal Care & Service (78.3%), Healthcare Support (69.8%), and Food Preparation & Serving (64.2%).
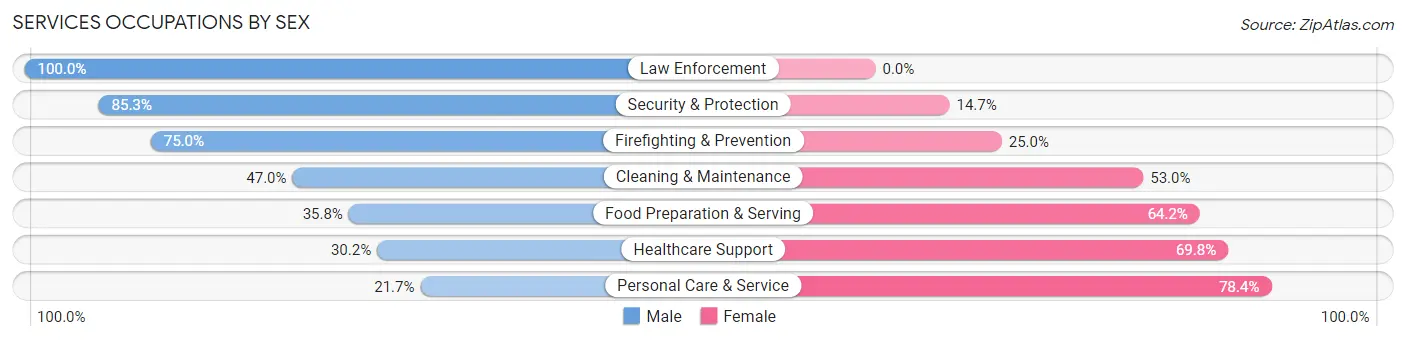
| Occupation | Male | Female |
| Healthcare Support | 84 (30.2%) | 194 (69.8%) |
| Security & Protection | 198 (85.3%) | 34 (14.7%) |
| Firefighting & Prevention | 102 (75.0%) | 34 (25.0%) |
| Law Enforcement | 96 (100.0%) | 0 (0.0%) |
| Food Preparation & Serving | 235 (35.8%) | 421 (64.2%) |
| Cleaning & Maintenance | 109 (47.0%) | 123 (53.0%) |
| Personal Care & Service | 63 (21.6%) | 228 (78.3%) |
| Total (Category) | 689 (40.8%) | 1,000 (59.2%) |
| Total (Overall) | 6,021 (49.3%) | 6,183 (50.7%) |
Sales and Office Occupations
The most common Sales and Office occupations in Centerville are Sales & Related (1,315 | 10.8%), and Office & Administration (1,258 | 10.3%).

Sales and Office Occupations by Sex

| Occupation | Male | Female |
| Sales & Related | 916 (69.7%) | 399 (30.3%) |
| Office & Administration | 224 (17.8%) | 1,034 (82.2%) |
| Total (Category) | 1,140 (44.3%) | 1,433 (55.7%) |
| Total (Overall) | 6,021 (49.3%) | 6,183 (50.7%) |
Natural Resources, Construction and Maintenance Occupations
The most common Natural Resources, Construction and Maintenance occupations in Centerville are Installation, Maintenance & Repair (196 | 1.6%), Construction & Extraction (132 | 1.1%), and Farming, Fishing & Forestry (12 | 0.1%).

Natural Resources, Construction and Maintenance Occupations by Sex

| Occupation | Male | Female |
| Farming, Fishing & Forestry | 12 (100.0%) | 0 (0.0%) |
| Construction & Extraction | 109 (82.6%) | 23 (17.4%) |
| Installation, Maintenance & Repair | 196 (100.0%) | 0 (0.0%) |
| Total (Category) | 317 (93.2%) | 23 (6.8%) |
| Total (Overall) | 6,021 (49.3%) | 6,183 (50.7%) |
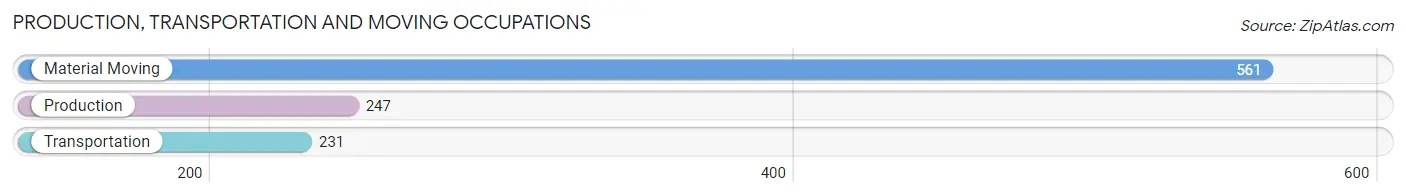
Production, Transportation and Moving Occupations
The most common Production, Transportation and Moving occupations in Centerville are Material Moving (561 | 4.6%), Production (247 | 2.0%), and Transportation (231 | 1.9%).
Production, Transportation and Moving Occupations by Sex

| Occupation | Male | Female |
| Production | 177 (71.7%) | 70 (28.3%) |
| Transportation | 188 (81.4%) | 43 (18.6%) |
| Material Moving | 364 (64.9%) | 197 (35.1%) |
| Total (Category) | 729 (70.2%) | 310 (29.8%) |
| Total (Overall) | 6,021 (49.3%) | 6,183 (50.7%) |
Employment Industries by Sex in Centerville
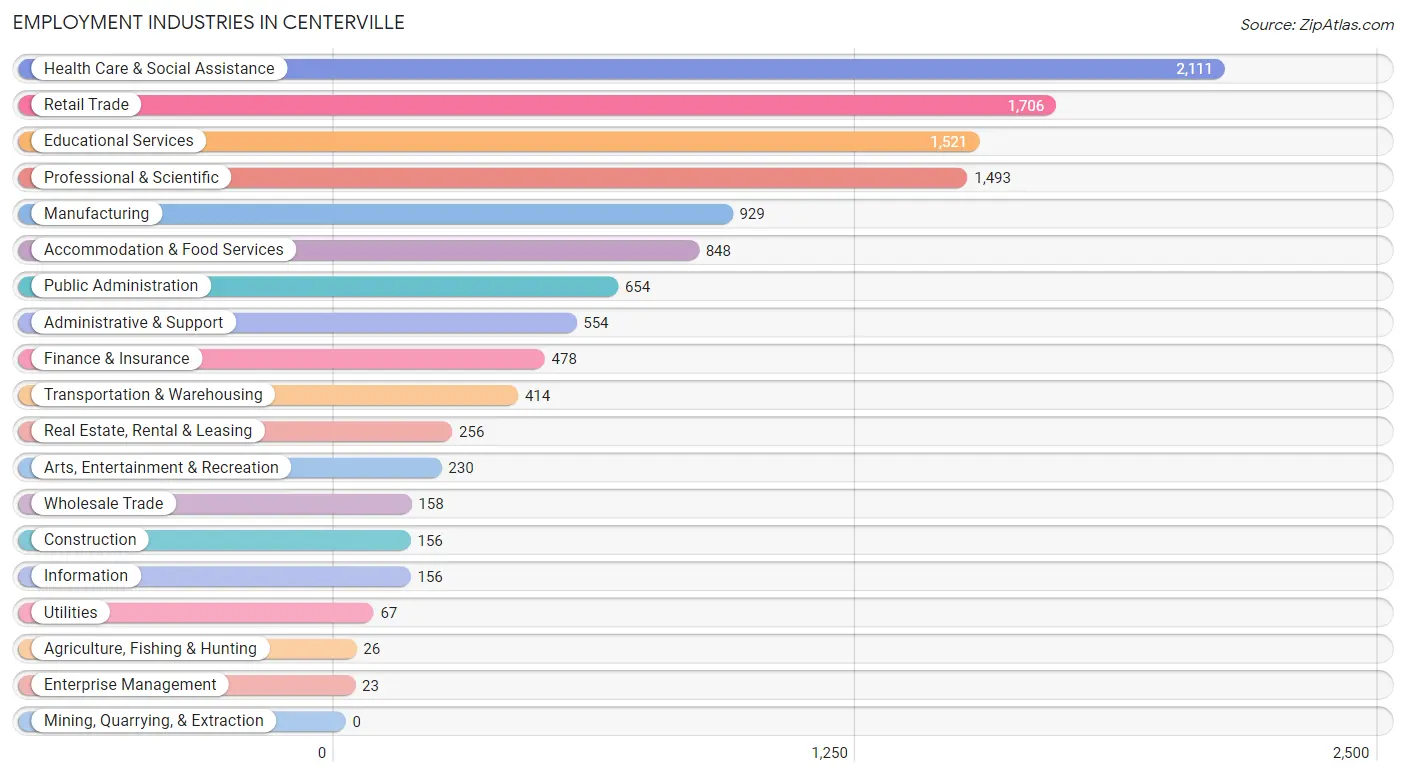
Employment Industries in Centerville
The major employment industries in Centerville include Health Care & Social Assistance (2,111 | 17.3%), Retail Trade (1,706 | 14.0%), Educational Services (1,521 | 12.5%), Professional & Scientific (1,493 | 12.2%), and Manufacturing (929 | 7.6%).
Employment Industries by Sex in Centerville
The Centerville industries that see more men than women are Agriculture, Fishing & Hunting (100.0%), Utilities (100.0%), and Transportation & Warehousing (86.2%), whereas the industries that tend to have a higher number of women are Enterprise Management (100.0%), Arts, Entertainment & Recreation (80.0%), and Health Care & Social Assistance (79.9%).
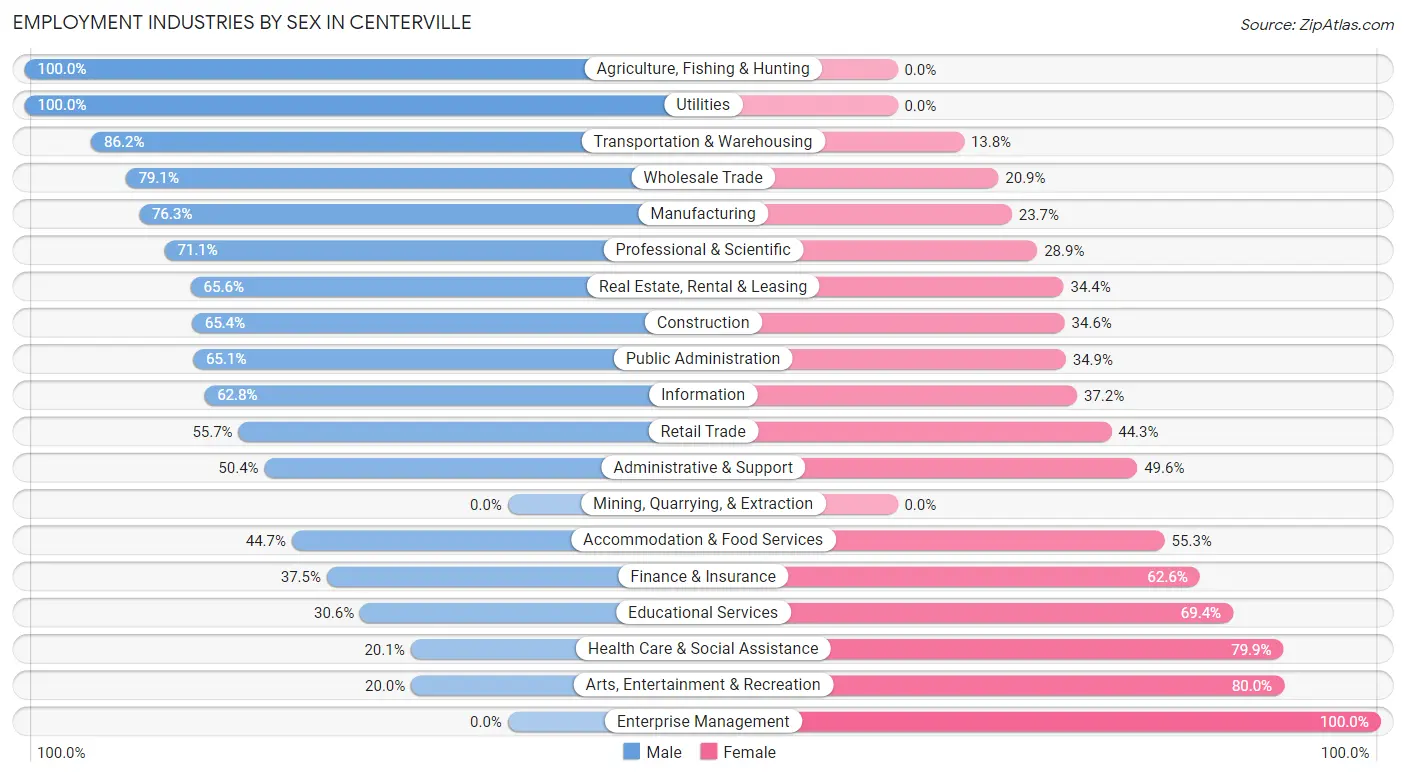
| Industry | Male | Female |
| Agriculture, Fishing & Hunting | 26 (100.0%) | 0 (0.0%) |
| Mining, Quarrying, & Extraction | 0 (0.0%) | 0 (0.0%) |
| Construction | 102 (65.4%) | 54 (34.6%) |
| Manufacturing | 709 (76.3%) | 220 (23.7%) |
| Wholesale Trade | 125 (79.1%) | 33 (20.9%) |
| Retail Trade | 951 (55.7%) | 755 (44.3%) |
| Transportation & Warehousing | 357 (86.2%) | 57 (13.8%) |
| Utilities | 67 (100.0%) | 0 (0.0%) |
| Information | 98 (62.8%) | 58 (37.2%) |
| Finance & Insurance | 179 (37.4%) | 299 (62.5%) |
| Real Estate, Rental & Leasing | 168 (65.6%) | 88 (34.4%) |
| Professional & Scientific | 1,061 (71.1%) | 432 (28.9%) |
| Enterprise Management | 0 (0.0%) | 23 (100.0%) |
| Administrative & Support | 279 (50.4%) | 275 (49.6%) |
| Educational Services | 465 (30.6%) | 1,056 (69.4%) |
| Health Care & Social Assistance | 425 (20.1%) | 1,686 (79.9%) |
| Arts, Entertainment & Recreation | 46 (20.0%) | 184 (80.0%) |
| Accommodation & Food Services | 379 (44.7%) | 469 (55.3%) |
| Public Administration | 426 (65.1%) | 228 (34.9%) |
| Total | 6,021 (49.3%) | 6,183 (50.7%) |
Education in Centerville
School Enrollment in Centerville
The most common levels of schooling among the 4,680 students in Centerville are high school (1,313 | 28.1%), middle school (782 | 16.7%), and college / undergraduate (770 | 16.5%).
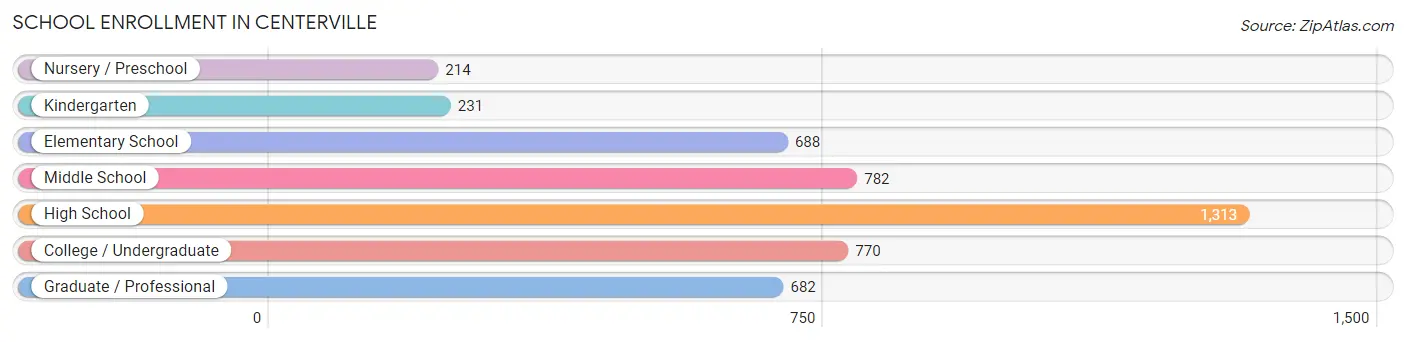
| School Level | # Students | % Students |
| Nursery / Preschool | 214 | 4.6% |
| Kindergarten | 231 | 4.9% |
| Elementary School | 688 | 14.7% |
| Middle School | 782 | 16.7% |
| High School | 1,313 | 28.1% |
| College / Undergraduate | 770 | 16.5% |
| Graduate / Professional | 682 | 14.6% |
| Total | 4,680 | 100.0% |
School Enrollment by Age by Funding Source in Centerville
Out of a total of 4,680 students who are enrolled in schools in Centerville, 735 (15.7%) attend a private institution, while the remaining 3,945 (84.3%) are enrolled in public schools. The age group of 3 to 4 year olds has the highest likelihood of being enrolled in private schools, with 164 (76.6% in the age bracket) enrolled. Conversely, the age group of 10 to 14 year olds has the lowest likelihood of being enrolled in a private school, with 894 (97.2% in the age bracket) attending a public institution.
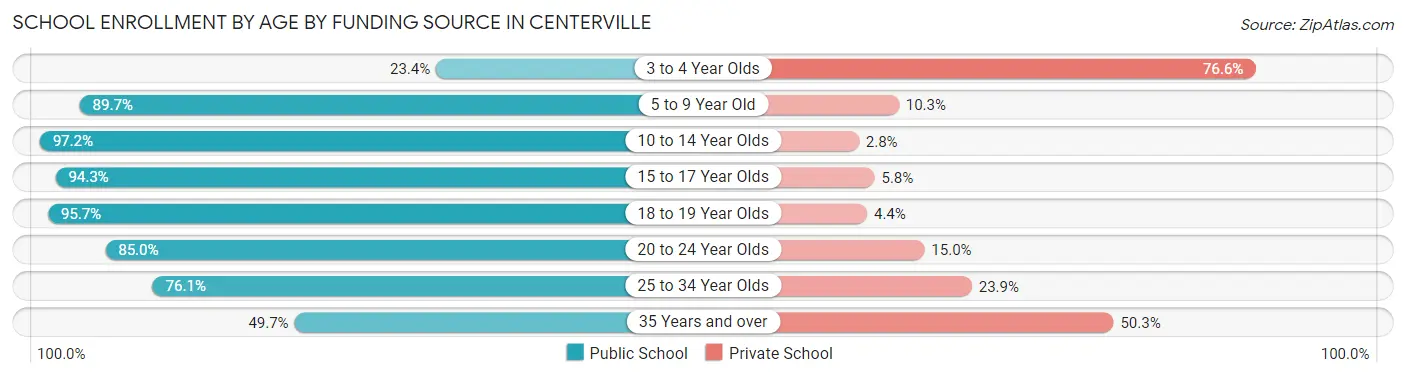
| Age Bracket | Public School | Private School |
| 3 to 4 Year Olds | 50 (23.4%) | 164 (76.6%) |
| 5 to 9 Year Old | 735 (89.7%) | 84 (10.3%) |
| 10 to 14 Year Olds | 894 (97.2%) | 26 (2.8%) |
| 15 to 17 Year Olds | 1,049 (94.3%) | 64 (5.8%) |
| 18 to 19 Year Olds | 264 (95.7%) | 12 (4.3%) |
| 20 to 24 Year Olds | 339 (85.0%) | 60 (15.0%) |
| 25 to 34 Year Olds | 418 (76.1%) | 131 (23.9%) |
| 35 Years and over | 194 (49.7%) | 196 (50.3%) |
| Total | 3,945 (84.3%) | 735 (15.7%) |
Educational Attainment by Field of Study in Centerville
Business (1,899 | 19.3%), education (1,681 | 17.1%), science & technology (1,277 | 13.0%), engineering (956 | 9.7%), and liberal arts & history (526 | 5.3%) are the most common fields of study among 9,826 individuals in Centerville who have obtained a bachelor's degree or higher.
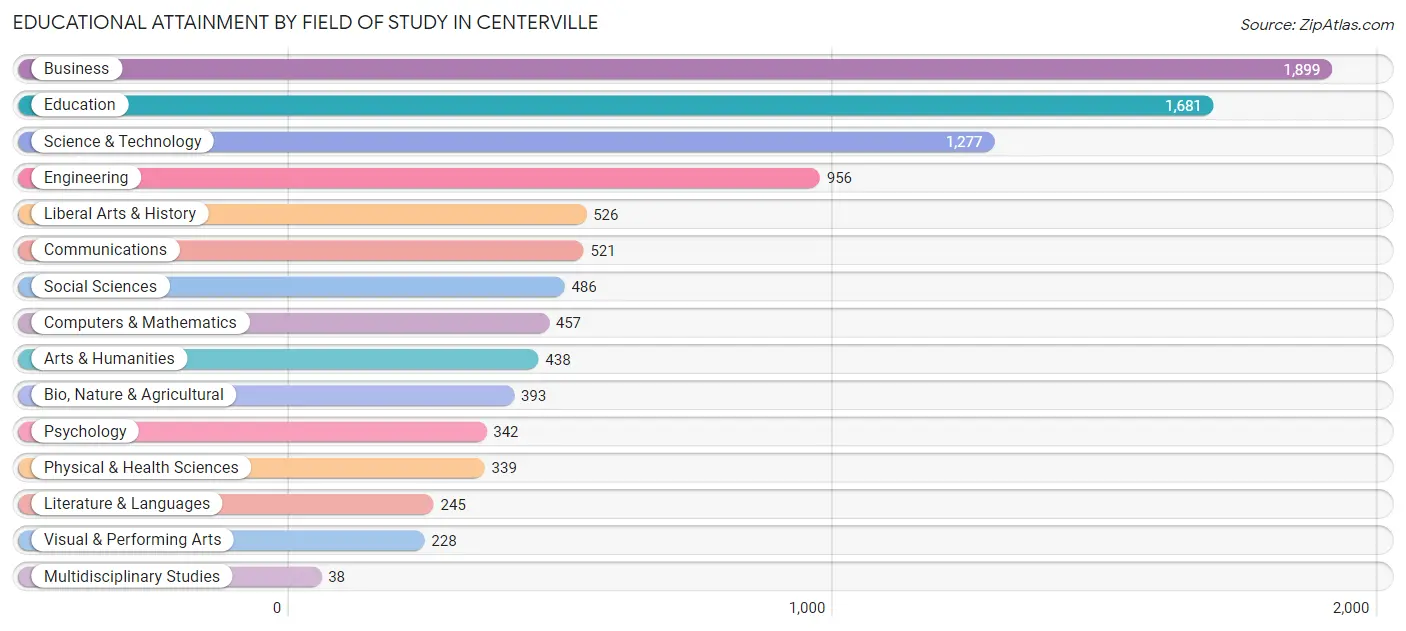
| Field of Study | # Graduates | % Graduates |
| Computers & Mathematics | 457 | 4.6% |
| Bio, Nature & Agricultural | 393 | 4.0% |
| Physical & Health Sciences | 339 | 3.5% |
| Psychology | 342 | 3.5% |
| Social Sciences | 486 | 5.0% |
| Engineering | 956 | 9.7% |
| Multidisciplinary Studies | 38 | 0.4% |
| Science & Technology | 1,277 | 13.0% |
| Business | 1,899 | 19.3% |
| Education | 1,681 | 17.1% |
| Literature & Languages | 245 | 2.5% |
| Liberal Arts & History | 526 | 5.3% |
| Visual & Performing Arts | 228 | 2.3% |
| Communications | 521 | 5.3% |
| Arts & Humanities | 438 | 4.5% |
| Total | 9,826 | 100.0% |
Transportation & Commute in Centerville
Vehicle Availability by Sex in Centerville
The most prevalent vehicle ownership categories in Centerville are males with 2 vehicles (3,499, accounting for 57.7%) and females with 2 vehicles (2,856, making up 59.4%).
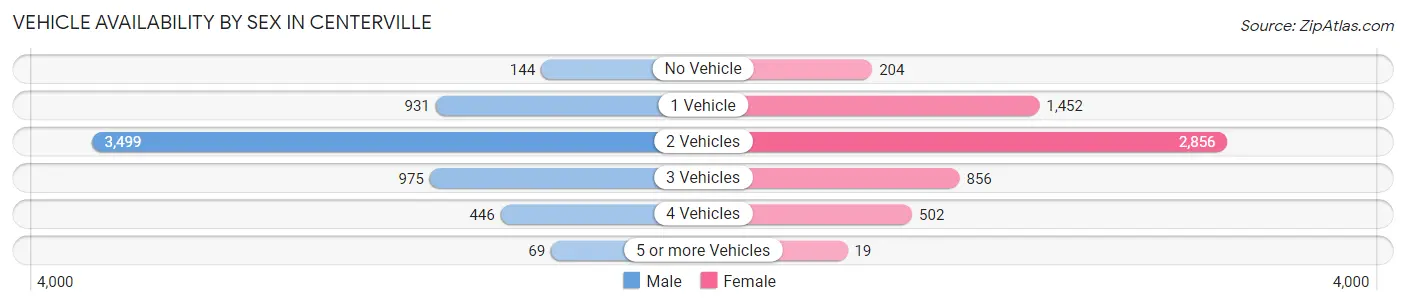
| Vehicles Available | Male | Female |
| No Vehicle | 144 (2.4%) | 204 (3.5%) |
| 1 Vehicle | 931 (15.3%) | 1,452 (24.7%) |
| 2 Vehicles | 3,499 (57.7%) | 2,856 (48.5%) |
| 3 Vehicles | 975 (16.1%) | 856 (14.5%) |
| 4 Vehicles | 446 (7.3%) | 502 (8.5%) |
| 5 or more Vehicles | 69 (1.1%) | 19 (0.3%) |
| Total | 6,064 (100.0%) | 5,889 (100.0%) |
Commute Time in Centerville
The most frequently occuring commute durations in Centerville are 20 to 24 minutes (2,118 commuters, 20.8%), 15 to 19 minutes (1,805 commuters, 17.7%), and 10 to 14 minutes (1,477 commuters, 14.5%).
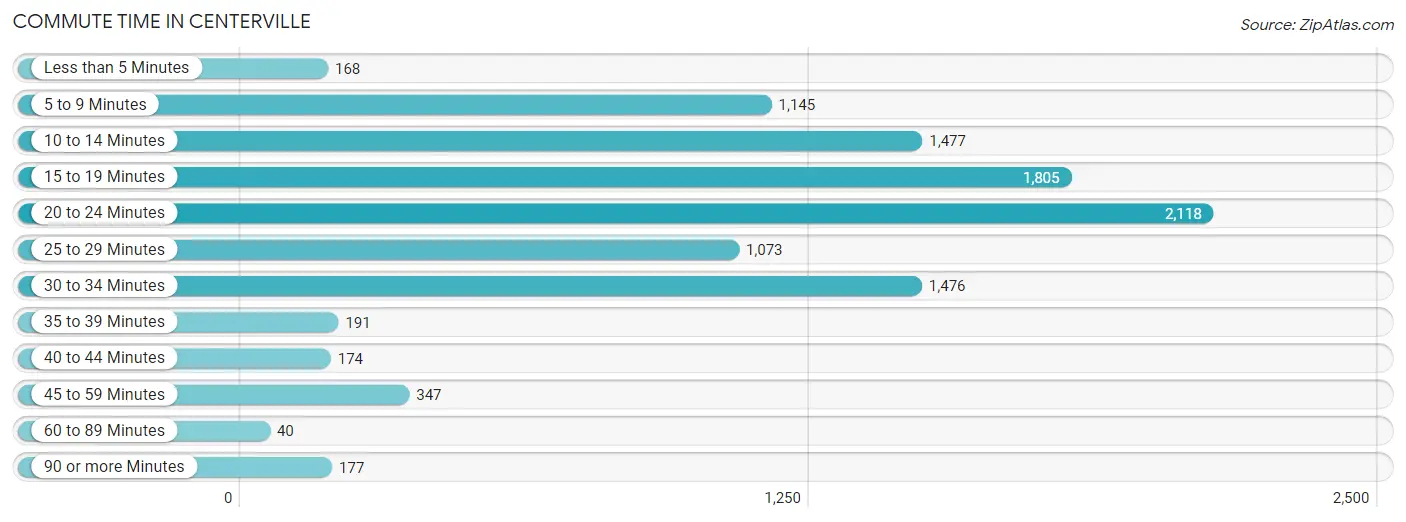
| Commute Time | # Commuters | % Commuters |
| Less than 5 Minutes | 168 | 1.7% |
| 5 to 9 Minutes | 1,145 | 11.2% |
| 10 to 14 Minutes | 1,477 | 14.5% |
| 15 to 19 Minutes | 1,805 | 17.7% |
| 20 to 24 Minutes | 2,118 | 20.8% |
| 25 to 29 Minutes | 1,073 | 10.5% |
| 30 to 34 Minutes | 1,476 | 14.5% |
| 35 to 39 Minutes | 191 | 1.9% |
| 40 to 44 Minutes | 174 | 1.7% |
| 45 to 59 Minutes | 347 | 3.4% |
| 60 to 89 Minutes | 40 | 0.4% |
| 90 or more Minutes | 177 | 1.7% |
Commute Time by Sex in Centerville
The most common commute times in Centerville are 20 to 24 minutes (1,211 commuters, 23.0%) for males and 15 to 19 minutes (957 commuters, 19.4%) for females.
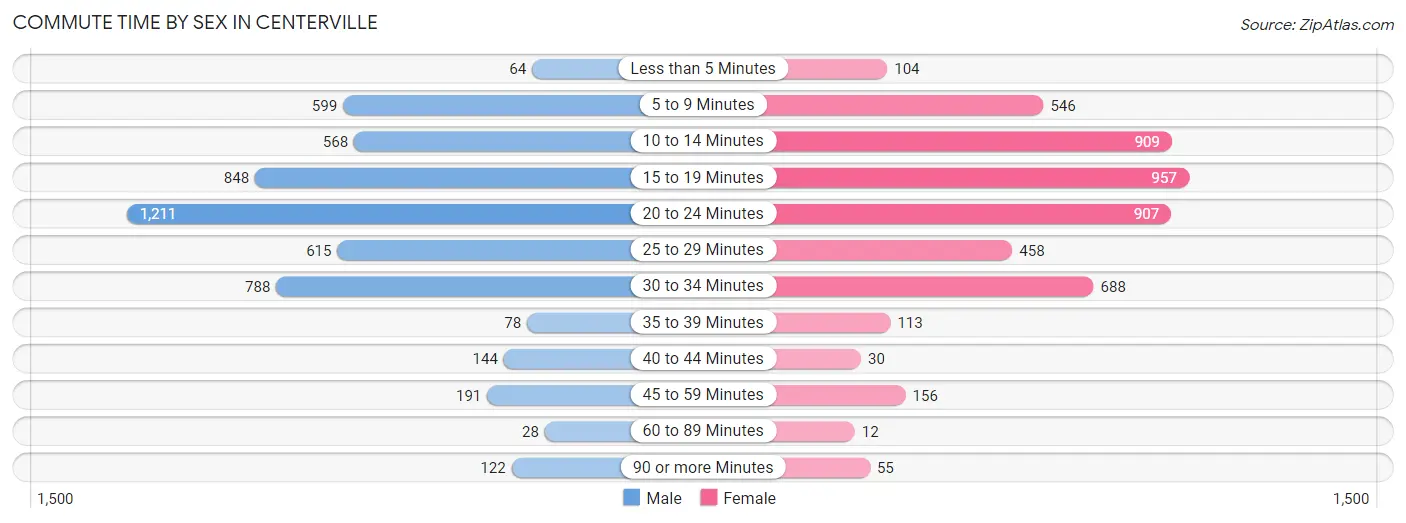
| Commute Time | Male | Female |
| Less than 5 Minutes | 64 (1.2%) | 104 (2.1%) |
| 5 to 9 Minutes | 599 (11.4%) | 546 (11.1%) |
| 10 to 14 Minutes | 568 (10.8%) | 909 (18.4%) |
| 15 to 19 Minutes | 848 (16.1%) | 957 (19.4%) |
| 20 to 24 Minutes | 1,211 (23.0%) | 907 (18.4%) |
| 25 to 29 Minutes | 615 (11.7%) | 458 (9.3%) |
| 30 to 34 Minutes | 788 (15.0%) | 688 (13.9%) |
| 35 to 39 Minutes | 78 (1.5%) | 113 (2.3%) |
| 40 to 44 Minutes | 144 (2.7%) | 30 (0.6%) |
| 45 to 59 Minutes | 191 (3.6%) | 156 (3.2%) |
| 60 to 89 Minutes | 28 (0.5%) | 12 (0.2%) |
| 90 or more Minutes | 122 (2.3%) | 55 (1.1%) |
Time of Departure to Work by Sex in Centerville
The most frequent times of departure to work in Centerville are 7:00 AM to 7:29 AM (866, 16.5%) for males and 7:00 AM to 7:29 AM (944, 19.1%) for females.
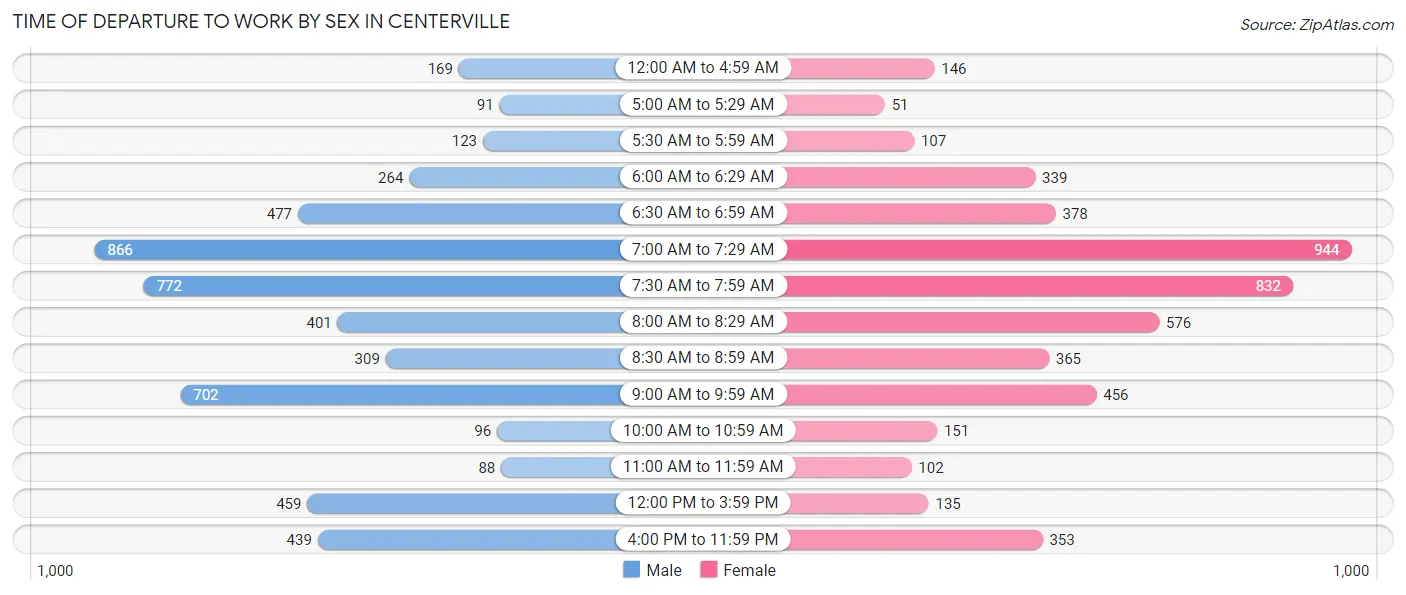
| Time of Departure | Male | Female |
| 12:00 AM to 4:59 AM | 169 (3.2%) | 146 (3.0%) |
| 5:00 AM to 5:29 AM | 91 (1.7%) | 51 (1.0%) |
| 5:30 AM to 5:59 AM | 123 (2.3%) | 107 (2.2%) |
| 6:00 AM to 6:29 AM | 264 (5.0%) | 339 (6.9%) |
| 6:30 AM to 6:59 AM | 477 (9.1%) | 378 (7.7%) |
| 7:00 AM to 7:29 AM | 866 (16.5%) | 944 (19.1%) |
| 7:30 AM to 7:59 AM | 772 (14.7%) | 832 (16.9%) |
| 8:00 AM to 8:29 AM | 401 (7.6%) | 576 (11.7%) |
| 8:30 AM to 8:59 AM | 309 (5.9%) | 365 (7.4%) |
| 9:00 AM to 9:59 AM | 702 (13.4%) | 456 (9.2%) |
| 10:00 AM to 10:59 AM | 96 (1.8%) | 151 (3.1%) |
| 11:00 AM to 11:59 AM | 88 (1.7%) | 102 (2.1%) |
| 12:00 PM to 3:59 PM | 459 (8.7%) | 135 (2.7%) |
| 4:00 PM to 11:59 PM | 439 (8.4%) | 353 (7.1%) |
| Total | 5,256 (100.0%) | 4,935 (100.0%) |
Housing Occupancy in Centerville
Occupancy by Ownership in Centerville
Of the total 11,489 dwellings in Centerville, owner-occupied units account for 7,982 (69.5%), while renter-occupied units make up 3,507 (30.5%).
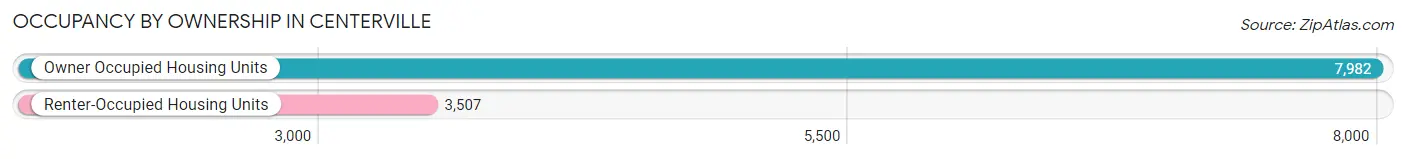
| Occupancy | # Housing Units | % Housing Units |
| Owner Occupied Housing Units | 7,982 | 69.5% |
| Renter-Occupied Housing Units | 3,507 | 30.5% |
| Total Occupied Housing Units | 11,489 | 100.0% |
Occupancy by Household Size in Centerville
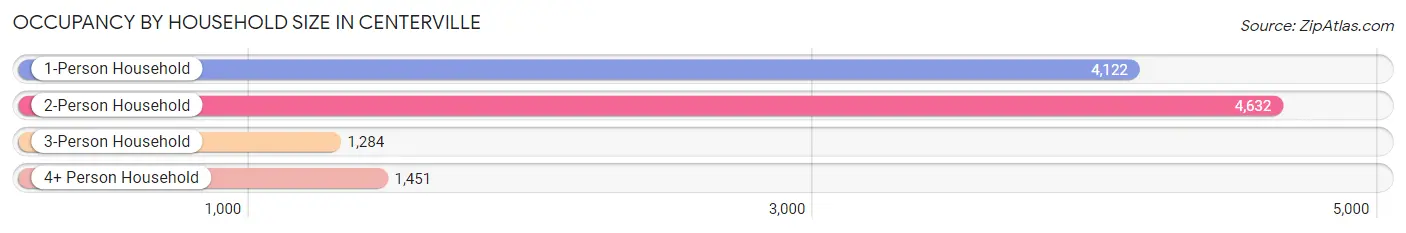
| Household Size | # Housing Units | % Housing Units |
| 1-Person Household | 4,122 | 35.9% |
| 2-Person Household | 4,632 | 40.3% |
| 3-Person Household | 1,284 | 11.2% |
| 4+ Person Household | 1,451 | 12.6% |
| Total Housing Units | 11,489 | 100.0% |
Occupancy by Ownership by Household Size in Centerville
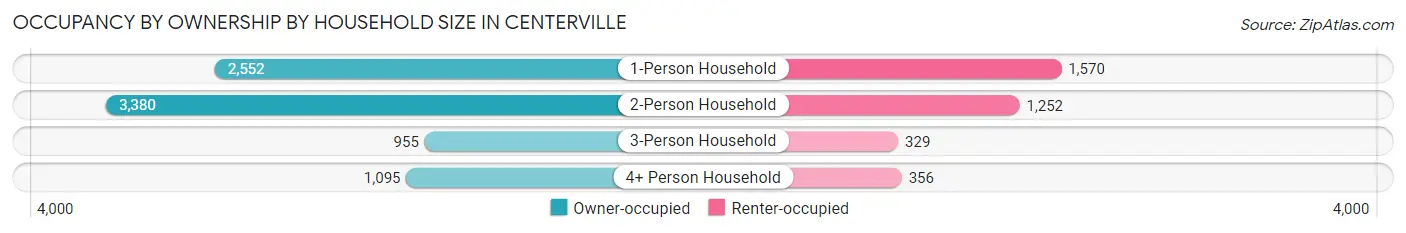
| Household Size | Owner-occupied | Renter-occupied |
| 1-Person Household | 2,552 (61.9%) | 1,570 (38.1%) |
| 2-Person Household | 3,380 (73.0%) | 1,252 (27.0%) |
| 3-Person Household | 955 (74.4%) | 329 (25.6%) |
| 4+ Person Household | 1,095 (75.5%) | 356 (24.5%) |
| Total Housing Units | 7,982 (69.5%) | 3,507 (30.5%) |
Occupancy by Educational Attainment in Centerville
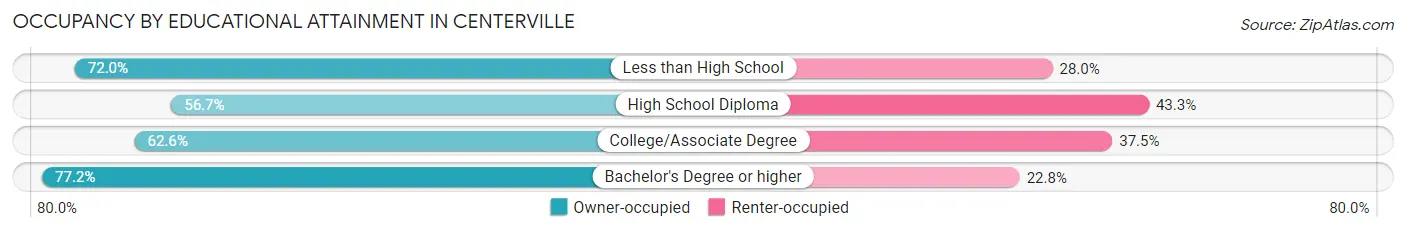
| Household Size | Owner-occupied | Renter-occupied |
| Less than High School | 157 (72.0%) | 61 (28.0%) |
| High School Diploma | 932 (56.7%) | 711 (43.3%) |
| College/Associate Degree | 2,312 (62.5%) | 1,384 (37.4%) |
| Bachelor's Degree or higher | 4,581 (77.2%) | 1,351 (22.8%) |
Occupancy by Age of Householder in Centerville
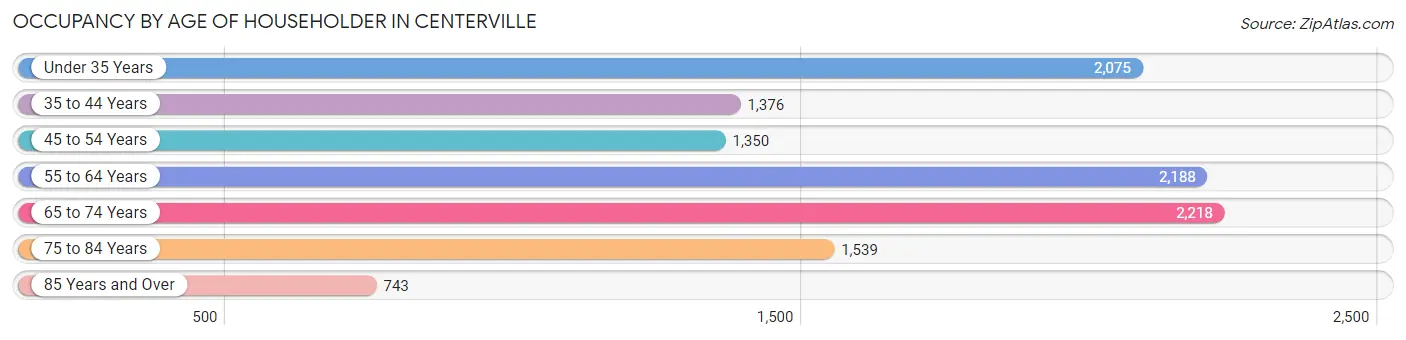
| Age Bracket | # Households | % Households |
| Under 35 Years | 2,075 | 18.1% |
| 35 to 44 Years | 1,376 | 12.0% |
| 45 to 54 Years | 1,350 | 11.7% |
| 55 to 64 Years | 2,188 | 19.0% |
| 65 to 74 Years | 2,218 | 19.3% |
| 75 to 84 Years | 1,539 | 13.4% |
| 85 Years and Over | 743 | 6.5% |
| Total | 11,489 | 100.0% |
Housing Finances in Centerville
Median Income by Occupancy in Centerville
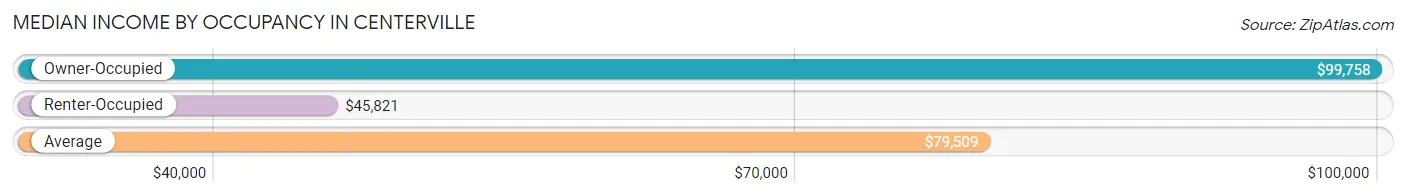
| Occupancy Type | # Households | Median Income |
| Owner-Occupied | 7,982 (69.5%) | $99,758 |
| Renter-Occupied | 3,507 (30.5%) | $45,821 |
| Average | 11,489 (100.0%) | $79,509 |
Occupancy by Householder Income Bracket in Centerville
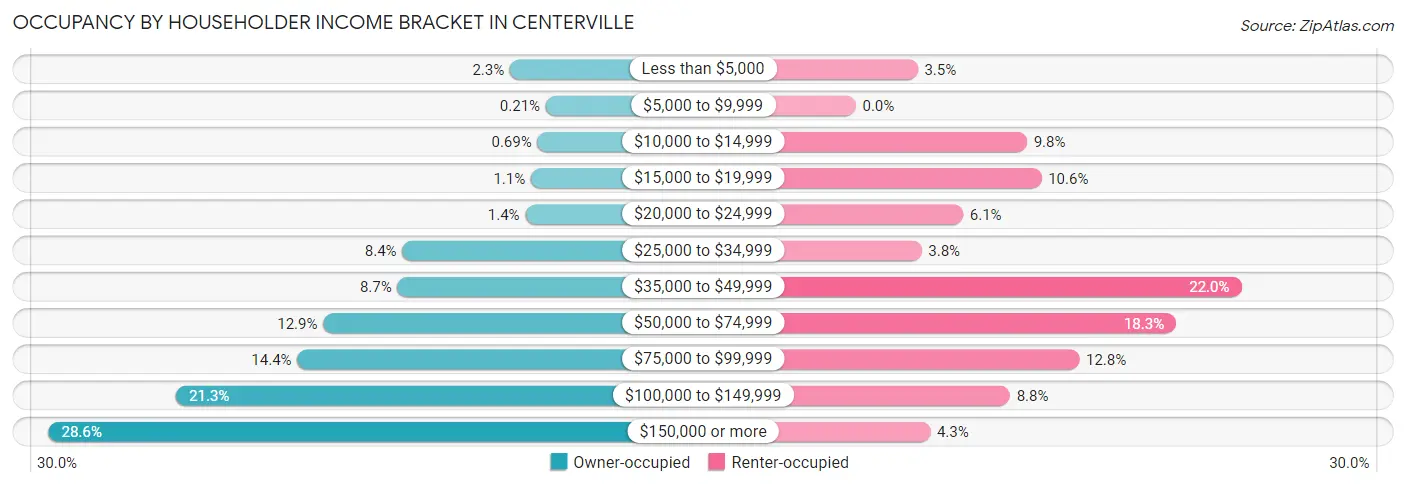
| Income Bracket | Owner-occupied | Renter-occupied |
| Less than $5,000 | 180 (2.3%) | 124 (3.5%) |
| $5,000 to $9,999 | 17 (0.2%) | 0 (0.0%) |
| $10,000 to $14,999 | 55 (0.7%) | 343 (9.8%) |
| $15,000 to $19,999 | 85 (1.1%) | 372 (10.6%) |
| $20,000 to $24,999 | 110 (1.4%) | 215 (6.1%) |
| $25,000 to $34,999 | 671 (8.4%) | 132 (3.8%) |
| $35,000 to $49,999 | 694 (8.7%) | 773 (22.0%) |
| $50,000 to $74,999 | 1,032 (12.9%) | 642 (18.3%) |
| $75,000 to $99,999 | 1,150 (14.4%) | 448 (12.8%) |
| $100,000 to $149,999 | 1,703 (21.3%) | 309 (8.8%) |
| $150,000 or more | 2,285 (28.6%) | 149 (4.3%) |
| Total | 7,982 (100.0%) | 3,507 (100.0%) |
Monthly Housing Cost Tiers in Centerville
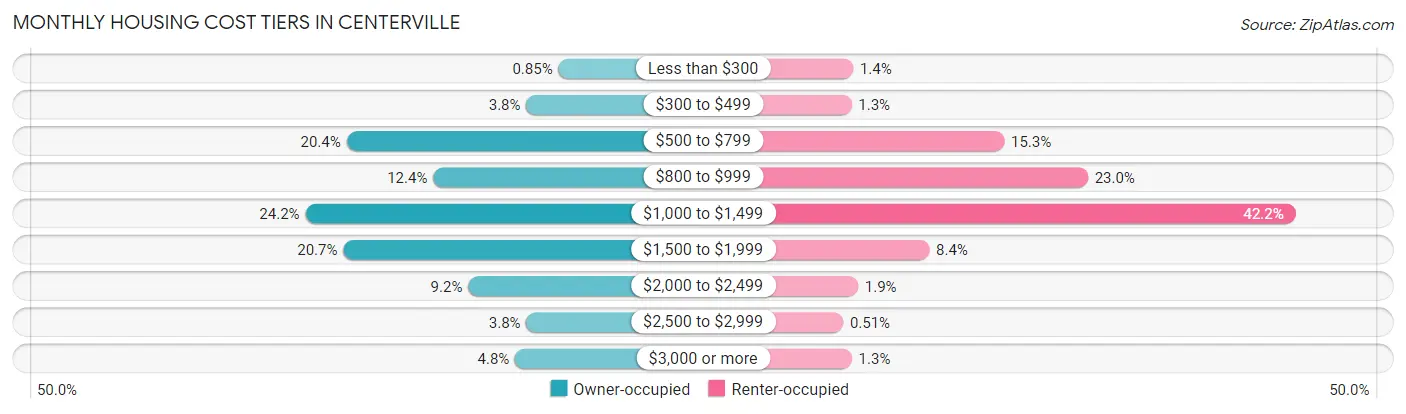
| Monthly Cost | Owner-occupied | Renter-occupied |
| Less than $300 | 68 (0.9%) | 50 (1.4%) |
| $300 to $499 | 304 (3.8%) | 45 (1.3%) |
| $500 to $799 | 1,625 (20.4%) | 538 (15.3%) |
| $800 to $999 | 988 (12.4%) | 808 (23.0%) |
| $1,000 to $1,499 | 1,928 (24.1%) | 1,479 (42.2%) |
| $1,500 to $1,999 | 1,649 (20.7%) | 296 (8.4%) |
| $2,000 to $2,499 | 731 (9.2%) | 66 (1.9%) |
| $2,500 to $2,999 | 303 (3.8%) | 18 (0.5%) |
| $3,000 or more | 386 (4.8%) | 46 (1.3%) |
| Total | 7,982 (100.0%) | 3,507 (100.0%) |
Physical Housing Characteristics in Centerville
Housing Structures in Centerville
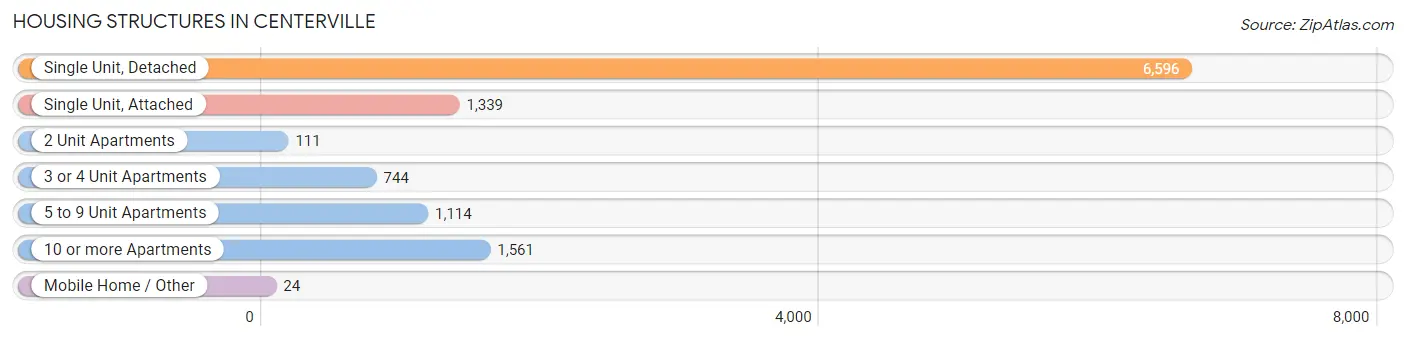
| Structure Type | # Housing Units | % Housing Units |
| Single Unit, Detached | 6,596 | 57.4% |
| Single Unit, Attached | 1,339 | 11.7% |
| 2 Unit Apartments | 111 | 1.0% |
| 3 or 4 Unit Apartments | 744 | 6.5% |
| 5 to 9 Unit Apartments | 1,114 | 9.7% |
| 10 or more Apartments | 1,561 | 13.6% |
| Mobile Home / Other | 24 | 0.2% |
| Total | 11,489 | 100.0% |
Housing Structures by Occupancy in Centerville
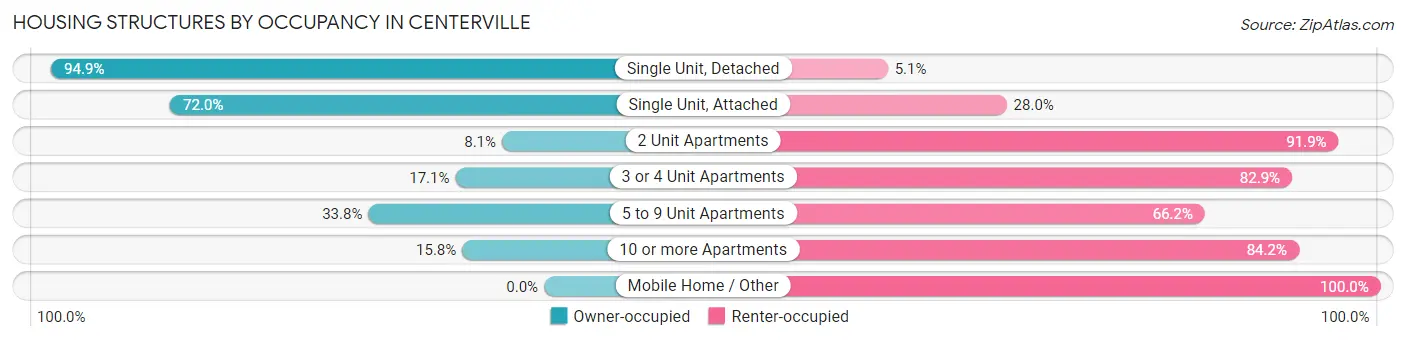
| Structure Type | Owner-occupied | Renter-occupied |
| Single Unit, Detached | 6,259 (94.9%) | 337 (5.1%) |
| Single Unit, Attached | 964 (72.0%) | 375 (28.0%) |
| 2 Unit Apartments | 9 (8.1%) | 102 (91.9%) |
| 3 or 4 Unit Apartments | 127 (17.1%) | 617 (82.9%) |
| 5 to 9 Unit Apartments | 377 (33.8%) | 737 (66.2%) |
| 10 or more Apartments | 246 (15.8%) | 1,315 (84.2%) |
| Mobile Home / Other | 0 (0.0%) | 24 (100.0%) |
| Total | 7,982 (69.5%) | 3,507 (30.5%) |
Housing Structures by Number of Rooms in Centerville
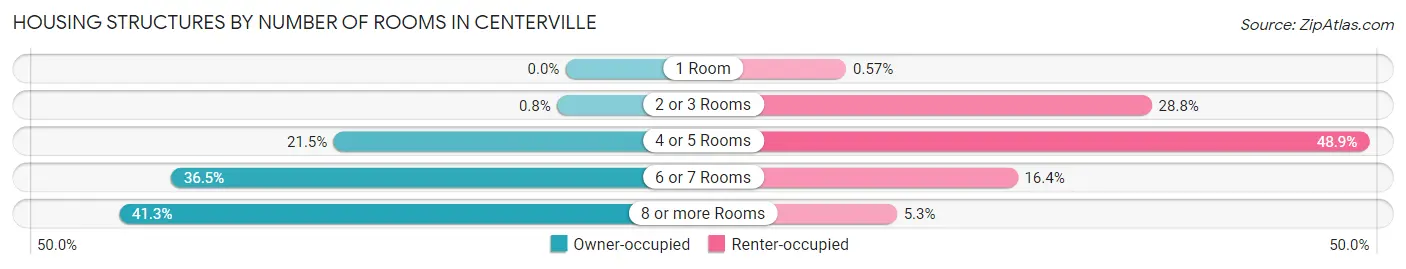
| Number of Rooms | Owner-occupied | Renter-occupied |
| 1 Room | 0 (0.0%) | 20 (0.6%) |
| 2 or 3 Rooms | 64 (0.8%) | 1,011 (28.8%) |
| 4 or 5 Rooms | 1,714 (21.5%) | 1,716 (48.9%) |
| 6 or 7 Rooms | 2,911 (36.5%) | 576 (16.4%) |
| 8 or more Rooms | 3,293 (41.3%) | 184 (5.2%) |
| Total | 7,982 (100.0%) | 3,507 (100.0%) |
Housing Structure by Heating Type in Centerville
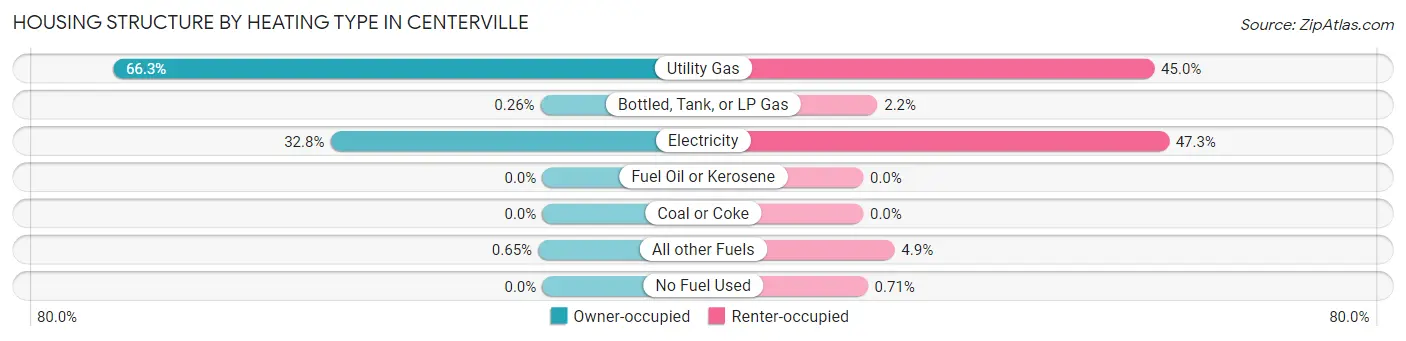
| Heating Type | Owner-occupied | Renter-occupied |
| Utility Gas | 5,295 (66.3%) | 1,578 (45.0%) |
| Bottled, Tank, or LP Gas | 21 (0.3%) | 77 (2.2%) |
| Electricity | 2,614 (32.8%) | 1,657 (47.2%) |
| Fuel Oil or Kerosene | 0 (0.0%) | 0 (0.0%) |
| Coal or Coke | 0 (0.0%) | 0 (0.0%) |
| All other Fuels | 52 (0.6%) | 170 (4.9%) |
| No Fuel Used | 0 (0.0%) | 25 (0.7%) |
| Total | 7,982 (100.0%) | 3,507 (100.0%) |
Household Vehicle Usage in Centerville
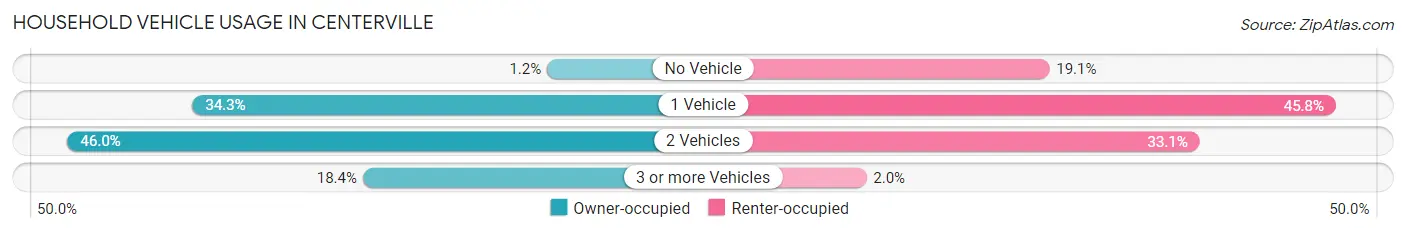
| Vehicles per Household | Owner-occupied | Renter-occupied |
| No Vehicle | 98 (1.2%) | 669 (19.1%) |
| 1 Vehicle | 2,741 (34.3%) | 1,607 (45.8%) |
| 2 Vehicles | 3,672 (46.0%) | 1,161 (33.1%) |
| 3 or more Vehicles | 1,471 (18.4%) | 70 (2.0%) |
| Total | 7,982 (100.0%) | 3,507 (100.0%) |
Real Estate & Mortgages in Centerville
Real Estate and Mortgage Overview in Centerville
| Characteristic | Without Mortgage | With Mortgage |
| Housing Units | 3,128 | 4,854 |
| Median Property Value | $230,600 | $243,700 |
| Median Household Income | $77,952 | $1,563 |
| Monthly Housing Costs | $765 | $377 |
| Real Estate Taxes | $4,709 | $31 |
Property Value by Mortgage Status in Centerville
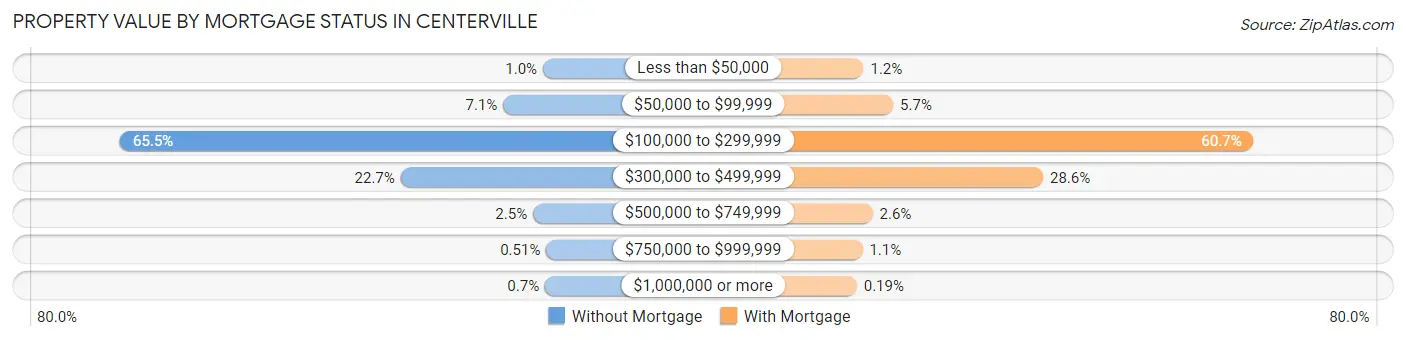
| Property Value | Without Mortgage | With Mortgage |
| Less than $50,000 | 32 (1.0%) | 59 (1.2%) |
| $50,000 to $99,999 | 221 (7.1%) | 278 (5.7%) |
| $100,000 to $299,999 | 2,048 (65.5%) | 2,944 (60.7%) |
| $300,000 to $499,999 | 710 (22.7%) | 1,387 (28.6%) |
| $500,000 to $749,999 | 79 (2.5%) | 126 (2.6%) |
| $750,000 to $999,999 | 16 (0.5%) | 51 (1.1%) |
| $1,000,000 or more | 22 (0.7%) | 9 (0.2%) |
| Total | 3,128 (100.0%) | 4,854 (100.0%) |
Household Income by Mortgage Status in Centerville
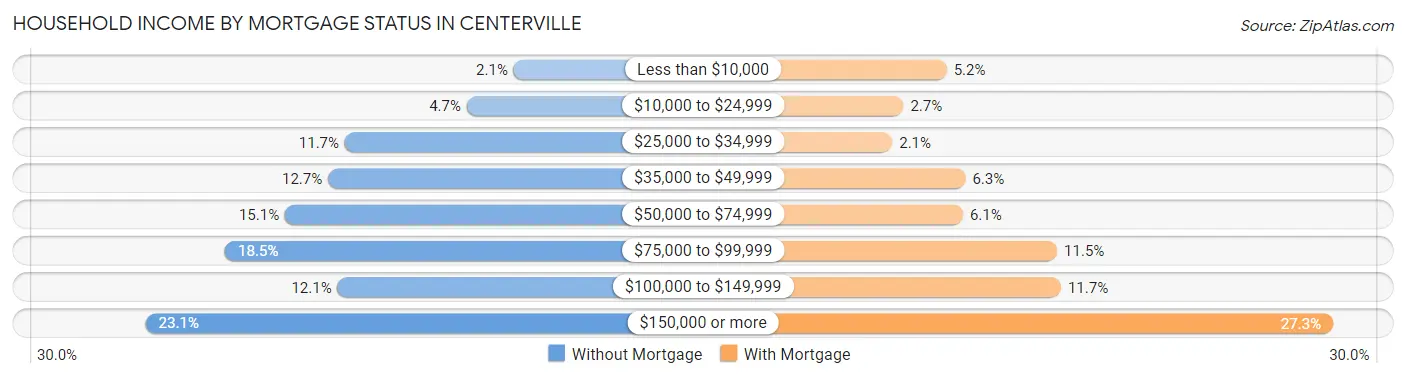
| Household Income | Without Mortgage | With Mortgage |
| Less than $10,000 | 64 (2.1%) | 253 (5.2%) |
| $10,000 to $24,999 | 148 (4.7%) | 133 (2.7%) |
| $25,000 to $34,999 | 366 (11.7%) | 102 (2.1%) |
| $35,000 to $49,999 | 396 (12.7%) | 305 (6.3%) |
| $50,000 to $74,999 | 473 (15.1%) | 298 (6.1%) |
| $75,000 to $99,999 | 580 (18.5%) | 559 (11.5%) |
| $100,000 to $149,999 | 379 (12.1%) | 570 (11.7%) |
| $150,000 or more | 722 (23.1%) | 1,324 (27.3%) |
| Total | 3,128 (100.0%) | 4,854 (100.0%) |
Property Value to Household Income Ratio in Centerville
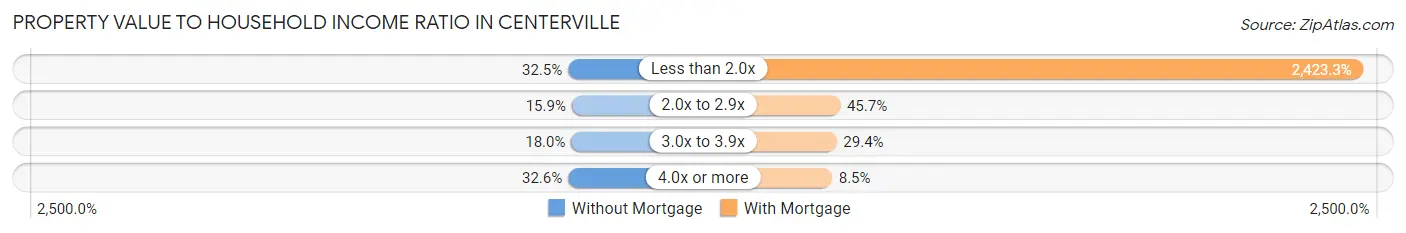
| Value-to-Income Ratio | Without Mortgage | With Mortgage |
| Less than 2.0x | 1,018 (32.5%) | 117,629 (2,423.3%) |
| 2.0x to 2.9x | 498 (15.9%) | 2,216 (45.7%) |
| 3.0x to 3.9x | 563 (18.0%) | 1,429 (29.4%) |
| 4.0x or more | 1,021 (32.6%) | 413 (8.5%) |
| Total | 3,128 (100.0%) | 4,854 (100.0%) |
Real Estate Taxes by Mortgage Status in Centerville

| Property Taxes | Without Mortgage | With Mortgage |
| Less than $800 | 52 (1.7%) | 0 (0.0%) |
| $800 to $1,499 | 128 (4.1%) | 72 (1.5%) |
| $800 to $1,499 | 2,883 (92.2%) | 221 (4.5%) |
| Total | 3,128 (100.0%) | 4,854 (100.0%) |
Health & Disability in Centerville
Health Insurance Coverage by Age in Centerville
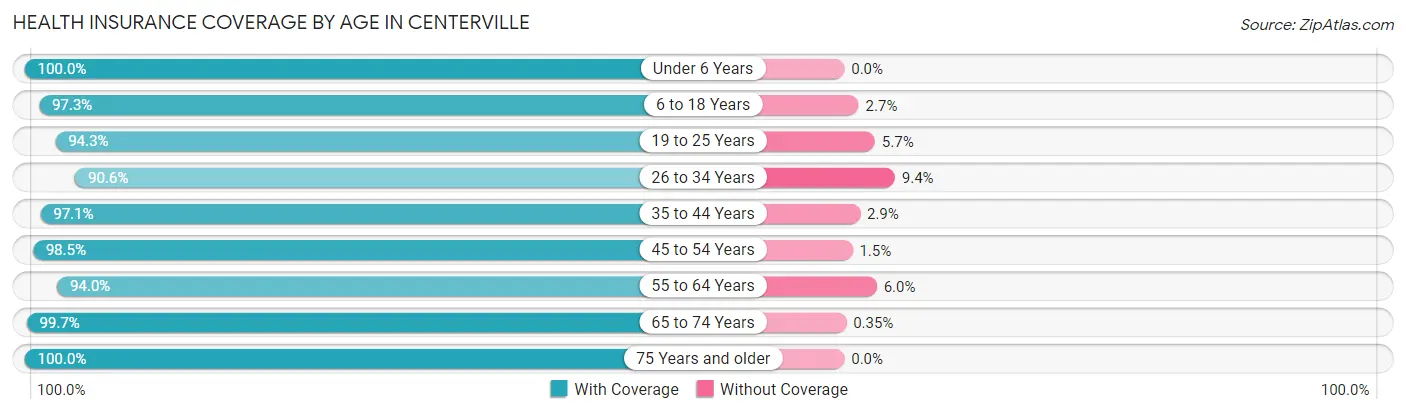
| Age Bracket | With Coverage | Without Coverage |
| Under 6 Years | 1,522 (100.0%) | 0 (0.0%) |
| 6 to 18 Years | 2,939 (97.3%) | 81 (2.7%) |
| 19 to 25 Years | 1,767 (94.3%) | 107 (5.7%) |
| 26 to 34 Years | 2,144 (90.6%) | 223 (9.4%) |
| 35 to 44 Years | 2,389 (97.1%) | 72 (2.9%) |
| 45 to 54 Years | 2,266 (98.5%) | 35 (1.5%) |
| 55 to 64 Years | 3,311 (94.0%) | 213 (6.0%) |
| 65 to 74 Years | 3,443 (99.7%) | 12 (0.4%) |
| 75 Years and older | 3,124 (100.0%) | 0 (0.0%) |
| Total | 22,905 (96.9%) | 743 (3.1%) |
Health Insurance Coverage by Citizenship Status in Centerville

| Citizenship Status | With Coverage | Without Coverage |
| Native Born | 1,522 (100.0%) | 0 (0.0%) |
| Foreign Born, Citizen | 2,939 (97.3%) | 81 (2.7%) |
| Foreign Born, not a Citizen | 1,767 (94.3%) | 107 (5.7%) |
Health Insurance Coverage by Household Income in Centerville

| Household Income | With Coverage | Without Coverage |
| Under $25,000 | 2,214 (93.4%) | 156 (6.6%) |
| $25,000 to $49,999 | 3,247 (95.4%) | 156 (4.6%) |
| $50,000 to $74,999 | 2,882 (94.9%) | 155 (5.1%) |
| $75,000 to $99,999 | 2,793 (94.9%) | 149 (5.1%) |
| $100,000 and over | 11,759 (98.9%) | 127 (1.1%) |
Public vs Private Health Insurance Coverage by Age in Centerville
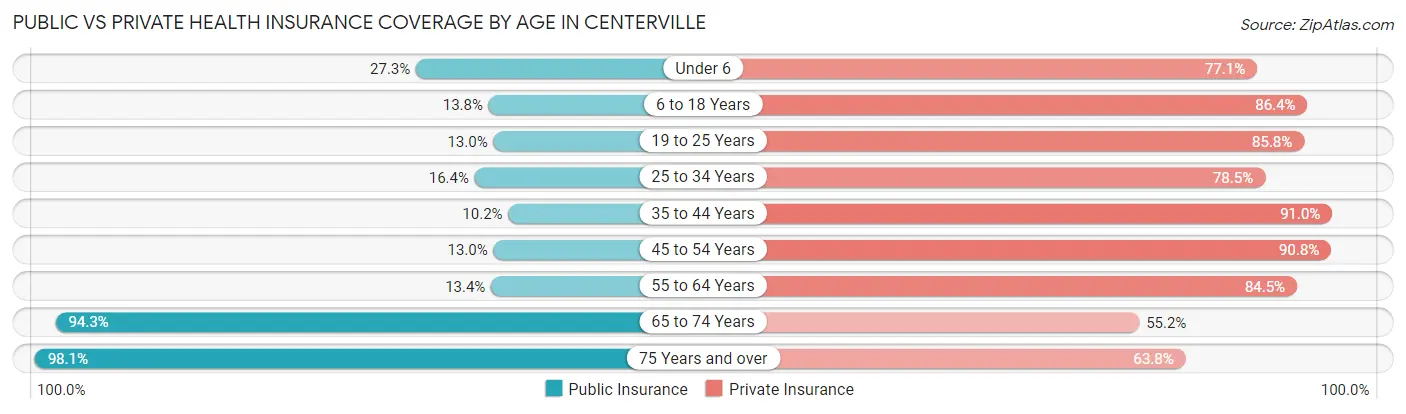
| Age Bracket | Public Insurance | Private Insurance |
| Under 6 | 416 (27.3%) | 1,173 (77.1%) |
| 6 to 18 Years | 418 (13.8%) | 2,610 (86.4%) |
| 19 to 25 Years | 243 (13.0%) | 1,608 (85.8%) |
| 25 to 34 Years | 389 (16.4%) | 1,859 (78.5%) |
| 35 to 44 Years | 251 (10.2%) | 2,240 (91.0%) |
| 45 to 54 Years | 298 (13.0%) | 2,090 (90.8%) |
| 55 to 64 Years | 472 (13.4%) | 2,977 (84.5%) |
| 65 to 74 Years | 3,257 (94.3%) | 1,907 (55.2%) |
| 75 Years and over | 3,065 (98.1%) | 1,993 (63.8%) |
| Total | 8,809 (37.2%) | 18,457 (78.0%) |
Disability Status by Sex by Age in Centerville
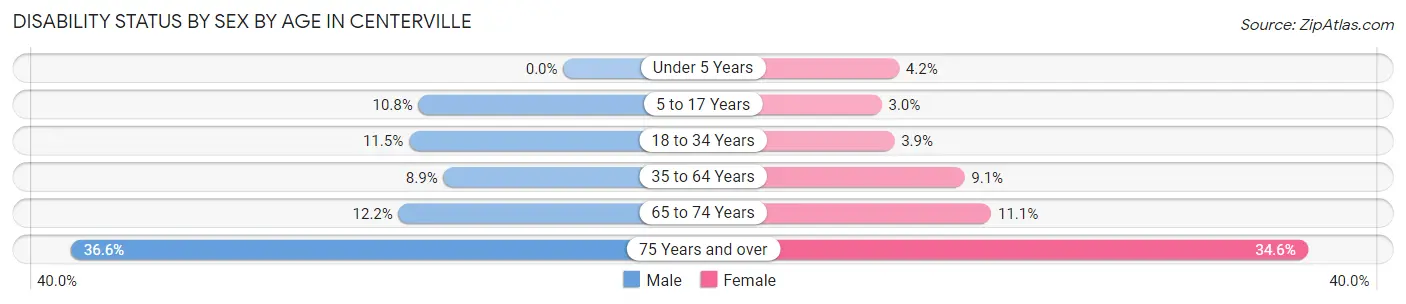
| Age Bracket | Male | Female |
| Under 5 Years | 0 (0.0%) | 28 (4.2%) |
| 5 to 17 Years | 170 (10.7%) | 40 (2.9%) |
| 18 to 34 Years | 274 (11.5%) | 80 (3.9%) |
| 35 to 64 Years | 342 (8.9%) | 404 (9.1%) |
| 65 to 74 Years | 161 (12.2%) | 237 (11.1%) |
| 75 Years and over | 419 (36.6%) | 684 (34.6%) |
Disability Class by Sex by Age in Centerville
Disability Class: Hearing Difficulty
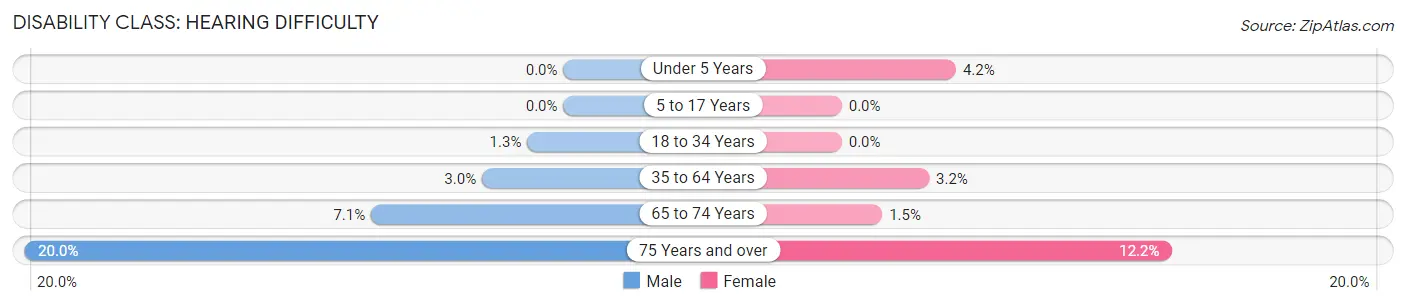
| Age Bracket | Male | Female |
| Under 5 Years | 0 (0.0%) | 28 (4.2%) |
| 5 to 17 Years | 0 (0.0%) | 0 (0.0%) |
| 18 to 34 Years | 32 (1.3%) | 0 (0.0%) |
| 35 to 64 Years | 116 (3.0%) | 144 (3.2%) |
| 65 to 74 Years | 94 (7.1%) | 32 (1.5%) |
| 75 Years and over | 229 (20.0%) | 242 (12.2%) |
Disability Class: Vision Difficulty
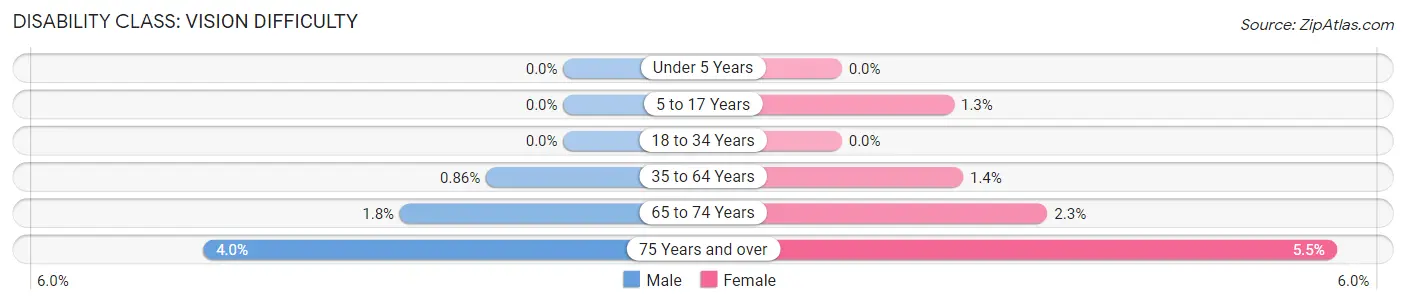
| Age Bracket | Male | Female |
| Under 5 Years | 0 (0.0%) | 0 (0.0%) |
| 5 to 17 Years | 0 (0.0%) | 17 (1.3%) |
| 18 to 34 Years | 0 (0.0%) | 0 (0.0%) |
| 35 to 64 Years | 33 (0.9%) | 60 (1.3%) |
| 65 to 74 Years | 24 (1.8%) | 49 (2.3%) |
| 75 Years and over | 46 (4.0%) | 109 (5.5%) |
Disability Class: Cognitive Difficulty
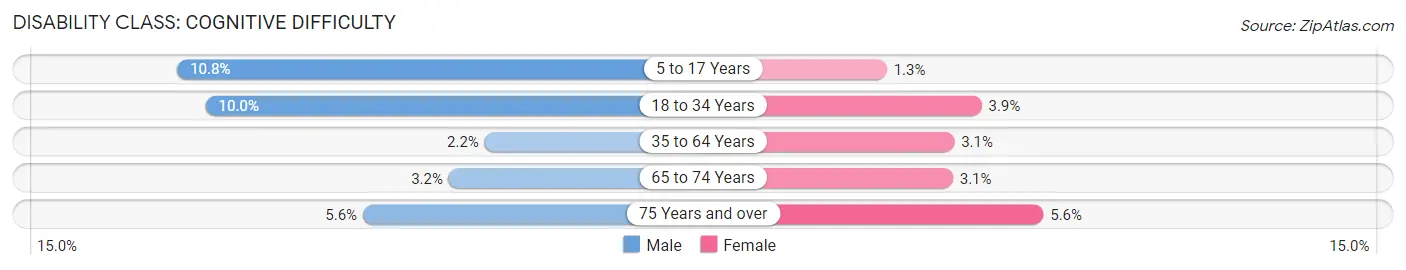
| Age Bracket | Male | Female |
| 5 to 17 Years | 170 (10.7%) | 17 (1.3%) |
| 18 to 34 Years | 238 (10.0%) | 80 (3.9%) |
| 35 to 64 Years | 84 (2.2%) | 139 (3.1%) |
| 65 to 74 Years | 42 (3.2%) | 66 (3.1%) |
| 75 Years and over | 64 (5.6%) | 111 (5.6%) |
Disability Class: Ambulatory Difficulty
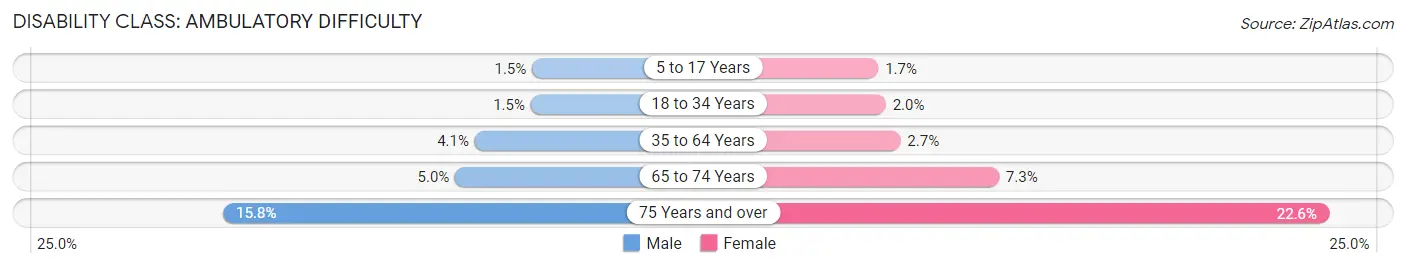
| Age Bracket | Male | Female |
| 5 to 17 Years | 23 (1.5%) | 23 (1.7%) |
| 18 to 34 Years | 36 (1.5%) | 42 (2.0%) |
| 35 to 64 Years | 158 (4.1%) | 121 (2.7%) |
| 65 to 74 Years | 66 (5.0%) | 156 (7.3%) |
| 75 Years and over | 181 (15.8%) | 447 (22.6%) |
Disability Class: Self-Care Difficulty
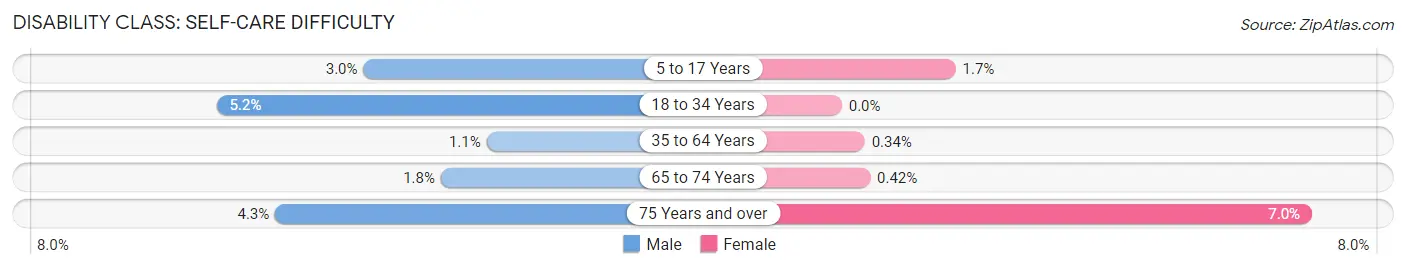
| Age Bracket | Male | Female |
| 5 to 17 Years | 47 (3.0%) | 23 (1.7%) |
| 18 to 34 Years | 123 (5.1%) | 0 (0.0%) |
| 35 to 64 Years | 44 (1.1%) | 15 (0.3%) |
| 65 to 74 Years | 24 (1.8%) | 9 (0.4%) |
| 75 Years and over | 49 (4.3%) | 138 (7.0%) |
Technology Access in Centerville
Computing Device Access in Centerville
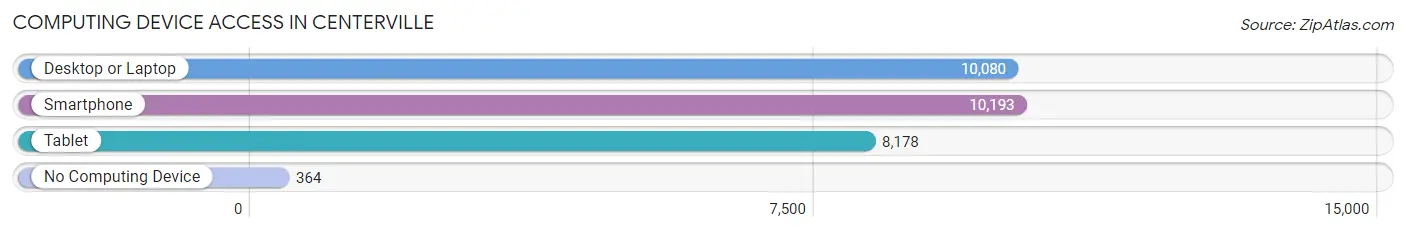
| Device Type | # Households | % Households |
| Desktop or Laptop | 10,080 | 87.7% |
| Smartphone | 10,193 | 88.7% |
| Tablet | 8,178 | 71.2% |
| No Computing Device | 364 | 3.2% |
| Total | 11,489 | 100.0% |
Internet Access in Centerville
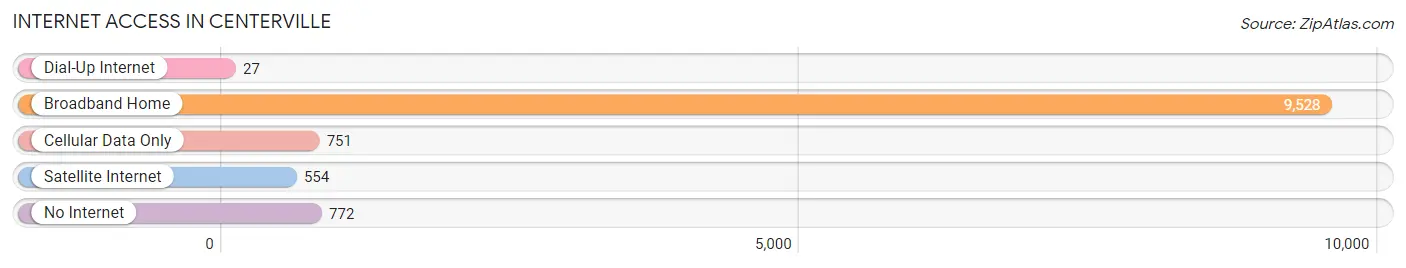
| Internet Type | # Households | % Households |
| Dial-Up Internet | 27 | 0.2% |
| Broadband Home | 9,528 | 82.9% |
| Cellular Data Only | 751 | 6.5% |
| Satellite Internet | 554 | 4.8% |
| No Internet | 772 | 6.7% |
| Total | 11,489 | 100.0% |
Centerville Summary
Centerville, Ohio is a city located in Montgomery and Greene counties in the state of Ohio. It is part of the Dayton metropolitan area and is located approximately 10 miles south of Dayton. The city has a population of 23,999 as of the 2010 census.
History
Centerville was founded in 1817 by William and Mary Ann Miller. The Millers had purchased the land from the government in 1815 and named the area Centerville due to its location at the center of Montgomery and Greene counties. The first post office was established in 1818 and the first school was built in 1820. The first church was built in 1821 and the first newspaper was established in 1822.
The city was incorporated in 1841 and the first mayor was elected in 1842. The city was a major stop on the Underground Railroad and was home to many abolitionists. The city was also home to the first public library in the state of Ohio, which was established in 1853.
Geography
Centerville is located at 39°37'N 84°9'W (39.619, -84.150). According to the United States Census Bureau, the city has a total area of 8.2 square miles, of which 8.1 square miles is land and 0.1 square miles is water.
Economy
Centerville’s economy is largely based on retail and services. The city is home to several large shopping centers, including the Centerville Mall, which is the largest shopping center in the city. The city is also home to several large employers, including the Dayton Power and Light Company, the Dayton International Airport, and the Dayton VA Medical Center.
Demographics
As of the 2010 census, there were 23,999 people, 9,845 households, and 6,717 families residing in the city. The population density was 2,964.3 people per square mile. The racial makeup of the city was 87.2% White, 6.3% African American, 0.3% Native American, 2.7% Asian, 0.1% Pacific Islander, 1.2% from other races, and 2.4% from two or more races. Hispanic or Latino of any race were 3.3% of the population.
The median income for a household in the city was $60,945, and the median income for a family was $76,945. The per capita income for the city was $30,945. About 3.2% of families and 4.7% of the population were below the poverty line, including 5.3% of those under age 18 and 4.2% of those age 65 or over.
Centerville is a diverse city with a rich history and a vibrant economy. The city is home to many businesses and employers, and is a great place to live and work. With its close proximity to Dayton, Centerville is a great place to call home.
Common Questions
What is Per Capita Income in Centerville?
Per Capita income in Centerville is $49,208.
What is the Median Family Income in Centerville?
Median Family Income in Centerville is $113,962.
What is the Median Household income in Centerville?
Median Household Income in Centerville is $79,509.
What is Income or Wage Gap in Centerville?
Income or Wage Gap in Centerville is 38.3%.
Women in Centerville earn 61.7 cents for every dollar earned by a man.
What is Inequality or Gini Index in Centerville?
Inequality or Gini Index in Centerville is 0.44.
What is the Total Population of Centerville?
Total Population of Centerville is 24,510.
What is the Total Male Population of Centerville?
Total Male Population of Centerville is 11,502.
What is the Total Female Population of Centerville?
Total Female Population of Centerville is 13,008.
What is the Ratio of Males per 100 Females in Centerville?
There are 88.42 Males per 100 Females in Centerville.
What is the Ratio of Females per 100 Males in Centerville?
There are 113.09 Females per 100 Males in Centerville.
What is the Median Population Age in Centerville?
Median Population Age in Centerville is 49.7 Years.
What is the Average Family Size in Centerville
Average Family Size in Centerville is 2.7 People.
What is the Average Household Size in Centerville
Average Household Size in Centerville is 2.1 People.
How Large is the Labor Force in Centerville?
There are 12,776 People in the Labor Forcein in Centerville.
What is the Percentage of People in the Labor Force in Centerville?
61.1% of People are in the Labor Force in Centerville.
What is the Unemployment Rate in Centerville?
Unemployment Rate in Centerville is 3.2%.