Laurel, NY Map & Demographics
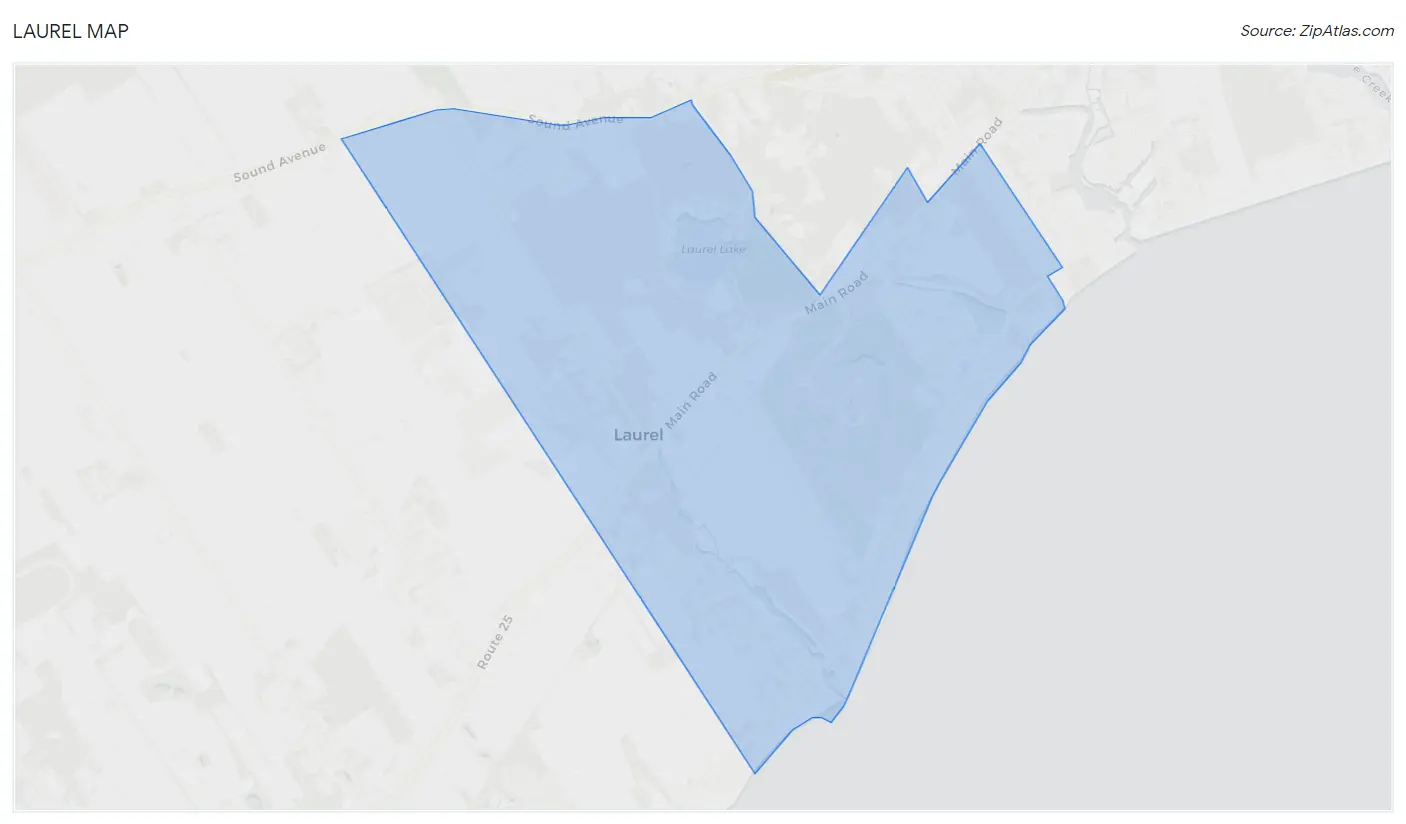
Laurel Map
Laurel Overview
$55,755
PER CAPITA INCOME
$97,435
AVG FAMILY INCOME
$116,208
AVG HOUSEHOLD INCOME
0.28
INEQUALITY / GINI INDEX
980
TOTAL POPULATION
576
MALE POPULATION
404
FEMALE POPULATION
142.57
MALES / 100 FEMALES
70.14
FEMALES / 100 MALES
51.4
MEDIAN AGE
2.4
AVG FAMILY SIZE
2.1
AVG HOUSEHOLD SIZE
604
LABOR FORCE [ PEOPLE ]
67.8%
PERCENT IN LABOR FORCE
Laurel Zip Codes
Laurel Area Codes
Income in Laurel
Income Overview in Laurel
Per Capita Income in Laurel is $55,755, while median incomes of families and households are $97,435 and $116,208 respectively.
| Characteristic | Number | Measure |
| Per Capita Income | 980 | $55,755 |
| Median Family Income | 263 | $97,435 |
| Mean Family Income | 263 | $118,849 |
| Median Household Income | 457 | $116,208 |
| Mean Household Income | 457 | $117,156 |
| Income Deficit | 263 | $0 |
| Wage / Income Gap (%) | 980 | 0.00% |
| Wage / Income Gap ($) | 980 | 100.00¢ per $1 |
| Gini / Inequality Index | 980 | 0.28 |
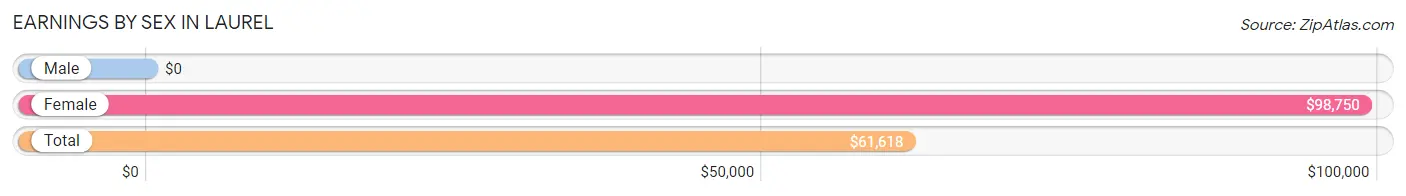
Earnings by Sex in Laurel
| Sex | Number | Average Earnings |
| Male | 384 (63.6%) | $0 |
| Female | 220 (36.4%) | $98,750 |
| Total | 604 (100.0%) | $61,618 |
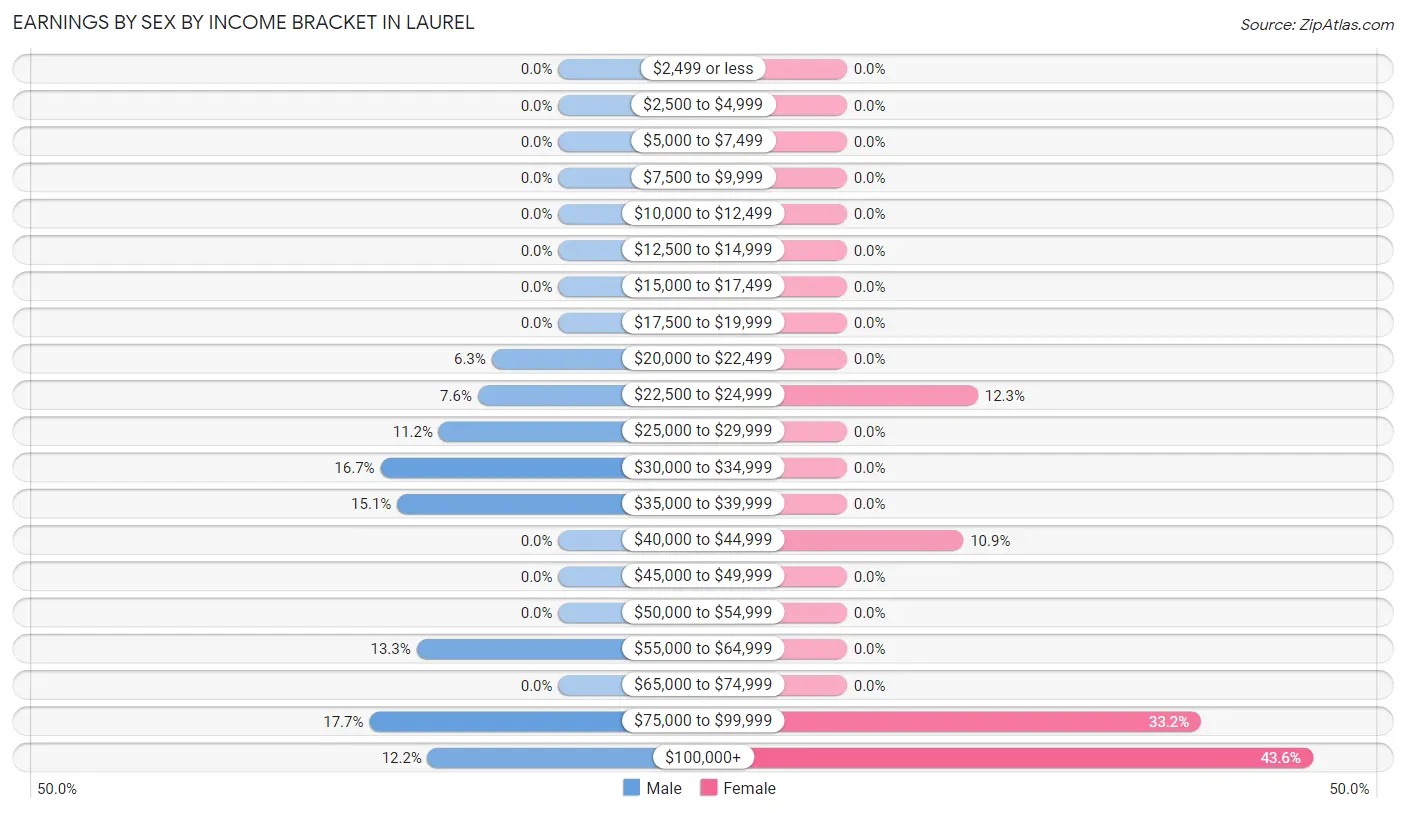
Earnings by Sex by Income Bracket in Laurel
The most common earnings brackets in Laurel are $75,000 to $99,999 for men (68 | 17.7%) and $100,000+ for women (96 | 43.6%).
| Income | Male | Female |
| $2,499 or less | 0 (0.0%) | 0 (0.0%) |
| $2,500 to $4,999 | 0 (0.0%) | 0 (0.0%) |
| $5,000 to $7,499 | 0 (0.0%) | 0 (0.0%) |
| $7,500 to $9,999 | 0 (0.0%) | 0 (0.0%) |
| $10,000 to $12,499 | 0 (0.0%) | 0 (0.0%) |
| $12,500 to $14,999 | 0 (0.0%) | 0 (0.0%) |
| $15,000 to $17,499 | 0 (0.0%) | 0 (0.0%) |
| $17,500 to $19,999 | 0 (0.0%) | 0 (0.0%) |
| $20,000 to $22,499 | 24 (6.2%) | 0 (0.0%) |
| $22,500 to $24,999 | 29 (7.5%) | 27 (12.3%) |
| $25,000 to $29,999 | 43 (11.2%) | 0 (0.0%) |
| $30,000 to $34,999 | 64 (16.7%) | 0 (0.0%) |
| $35,000 to $39,999 | 58 (15.1%) | 0 (0.0%) |
| $40,000 to $44,999 | 0 (0.0%) | 24 (10.9%) |
| $45,000 to $49,999 | 0 (0.0%) | 0 (0.0%) |
| $50,000 to $54,999 | 0 (0.0%) | 0 (0.0%) |
| $55,000 to $64,999 | 51 (13.3%) | 0 (0.0%) |
| $65,000 to $74,999 | 0 (0.0%) | 0 (0.0%) |
| $75,000 to $99,999 | 68 (17.7%) | 73 (33.2%) |
| $100,000+ | 47 (12.2%) | 96 (43.6%) |
| Total | 384 (100.0%) | 220 (100.0%) |
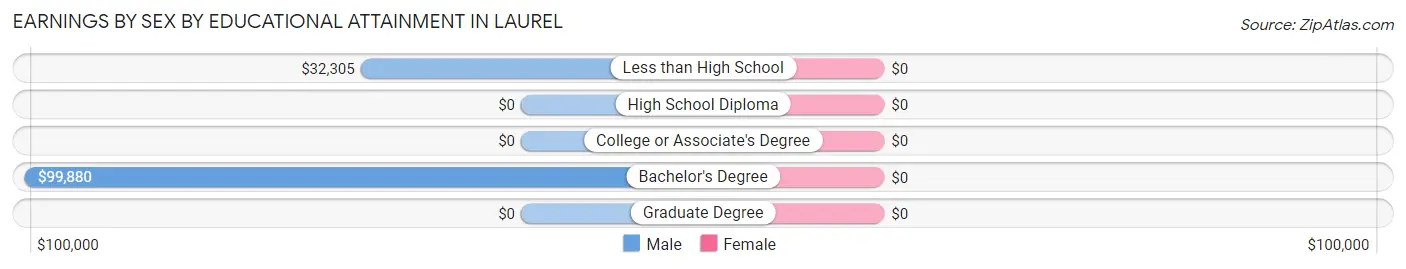
Earnings by Sex by Educational Attainment in Laurel
| Educational Attainment | Male Income | Female Income |
| Less than High School | $32,305 | $0 |
| High School Diploma | - | - |
| College or Associate's Degree | - | - |
| Bachelor's Degree | $99,880 | $0 |
| Graduate Degree | - | - |
| Total | - | - |
Family Income in Laurel
Family Income Brackets in Laurel
According to the Laurel family income data, there are 84 families falling into the $75,000 to $99,999 income range, which is the most common income bracket and makes up 31.9% of all families.
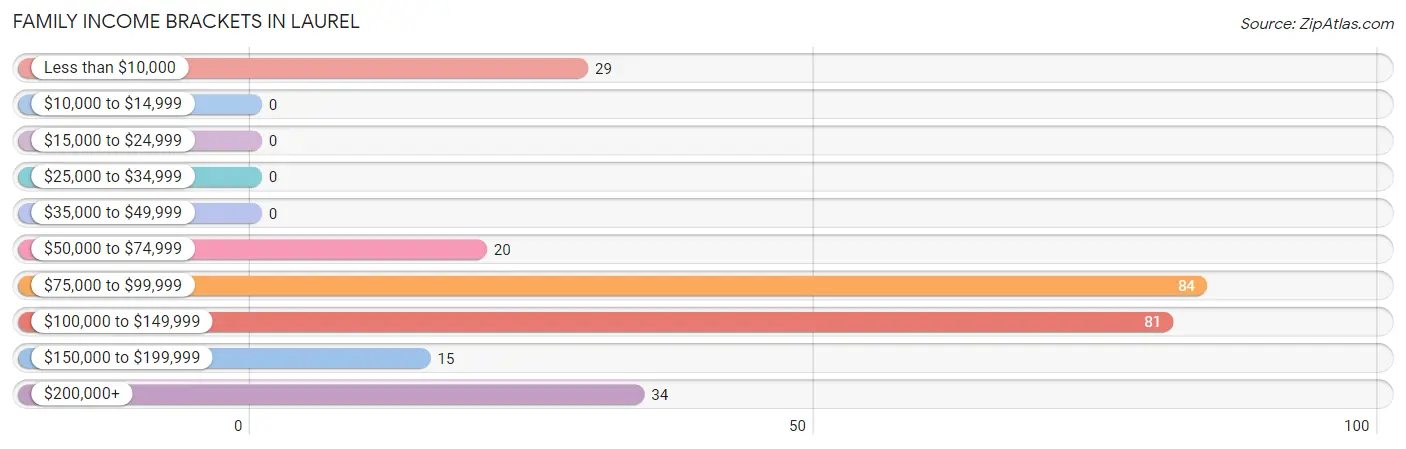
| Income Bracket | # Families | % Families |
| Less than $10,000 | 29 | 11.0% |
| $10,000 to $14,999 | 0 | 0.0% |
| $15,000 to $24,999 | 0 | 0.0% |
| $25,000 to $34,999 | 0 | 0.0% |
| $35,000 to $49,999 | 0 | 0.0% |
| $50,000 to $74,999 | 20 | 7.6% |
| $75,000 to $99,999 | 84 | 31.9% |
| $100,000 to $149,999 | 81 | 30.8% |
| $150,000 to $199,999 | 15 | 5.7% |
| $200,000+ | 34 | 12.9% |
Family Income by Famaliy Size in Laurel
2-person families (229 | 87.1%) account for the highest median family income in Laurel with $96,703 per family, while 2-person families (229 | 87.1%) have the highest median income of $48,352 per family member.
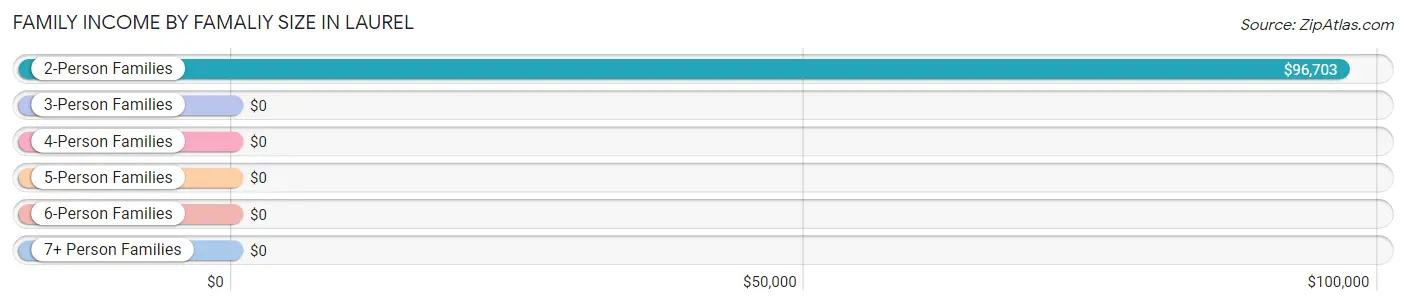
| Income Bracket | # Families | Median Income |
| 2-Person Families | 229 (87.1%) | $96,703 |
| 3-Person Families | 0 (0.0%) | $0 |
| 4-Person Families | 15 (5.7%) | $0 |
| 5-Person Families | 19 (7.2%) | $0 |
| 6-Person Families | 0 (0.0%) | $0 |
| 7+ Person Families | 0 (0.0%) | $0 |
| Total | 263 (100.0%) | $97,435 |
Family Income by Number of Earners in Laurel
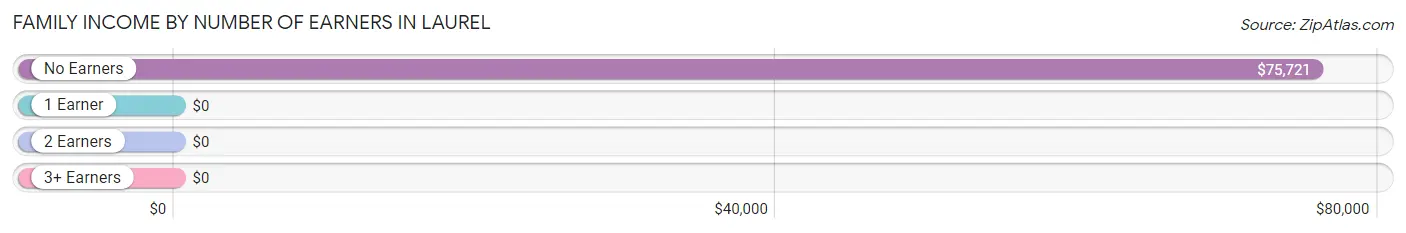
| Number of Earners | # Families | Median Income |
| No Earners | 113 (43.0%) | $75,721 |
| 1 Earner | 58 (22.1%) | $0 |
| 2 Earners | 73 (27.8%) | $0 |
| 3+ Earners | 19 (7.2%) | $0 |
| Total | 263 (100.0%) | $97,435 |
Household Income in Laurel
Household Income Brackets in Laurel
With 217 households falling in the category, the $100,000 to $149,999 income range is the most frequent in Laurel, accounting for 47.5% of all households.
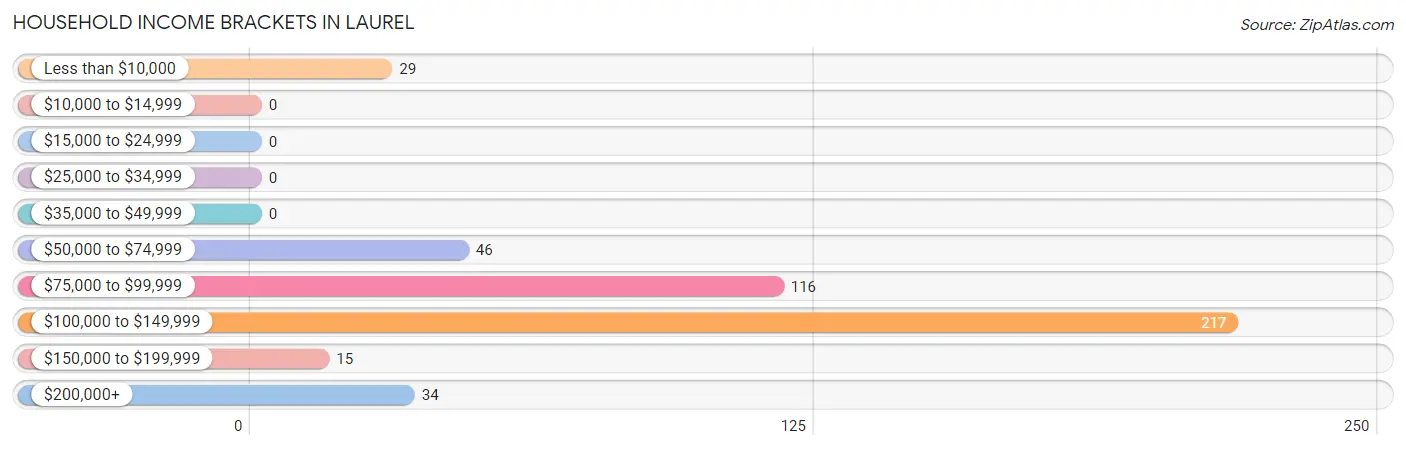
| Income Bracket | # Households | % Households |
| Less than $10,000 | 29 | 6.3% |
| $10,000 to $14,999 | 0 | 0.0% |
| $15,000 to $24,999 | 0 | 0.0% |
| $25,000 to $34,999 | 0 | 0.0% |
| $35,000 to $49,999 | 0 | 0.0% |
| $50,000 to $74,999 | 46 | 10.1% |
| $75,000 to $99,999 | 116 | 25.4% |
| $100,000 to $149,999 | 217 | 47.5% |
| $150,000 to $199,999 | 15 | 3.3% |
| $200,000+ | 34 | 7.4% |
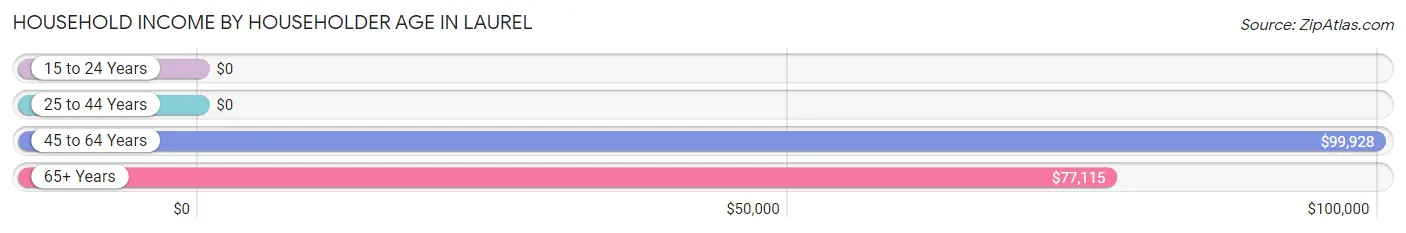
Household Income by Householder Age in Laurel
The median household income in Laurel is $116,208, with the highest median household income of $99,928 found in the 45 to 64 years age bracket for the primary householder. A total of 287 households (62.8%) fall into this category.
| Income Bracket | # Households | Median Income |
| 15 to 24 Years | 0 (0.0%) | $0 |
| 25 to 44 Years | 86 (18.8%) | $0 |
| 45 to 64 Years | 287 (62.8%) | $99,928 |
| 65+ Years | 84 (18.4%) | $77,115 |
| Total | 457 (100.0%) | $116,208 |
Poverty in Laurel
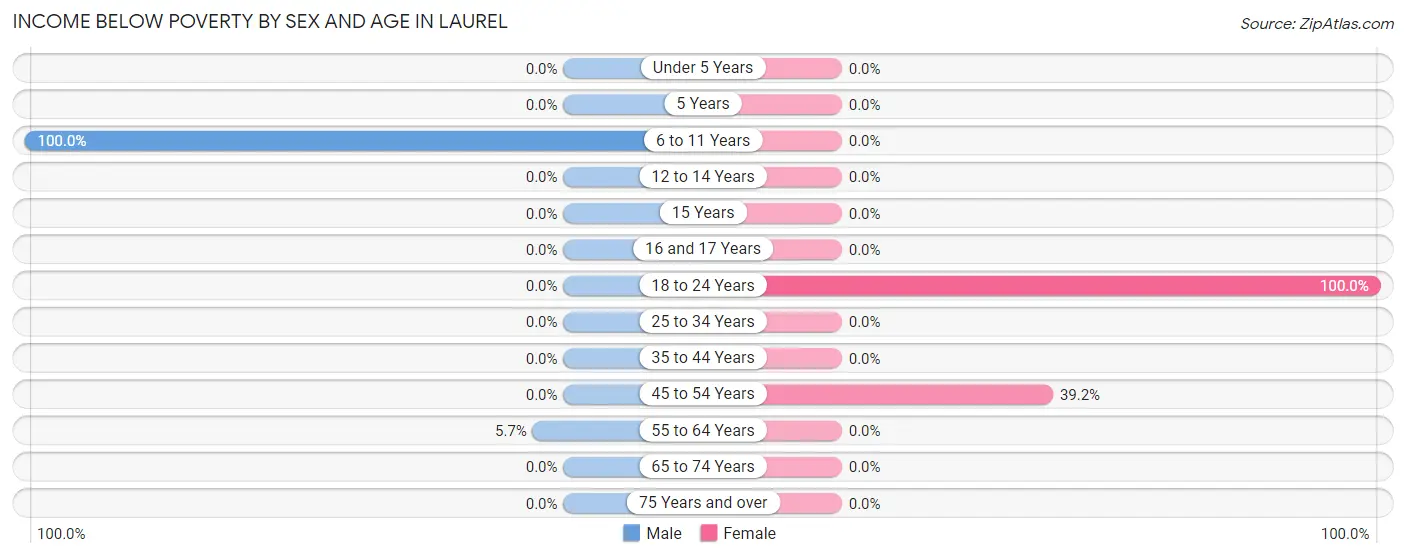
Income Below Poverty by Sex and Age in Laurel
With 6.1% poverty level for males and 8.9% for females among the residents of Laurel, 6 to 11 year old males and 18 to 24 year old females are the most vulnerable to poverty, with 28 males (100.0%) and 7 females (100.0%) in their respective age groups living below the poverty level.
| Age Bracket | Male | Female |
| Under 5 Years | 0 (0.0%) | 0 (0.0%) |
| 5 Years | 0 (0.0%) | 0 (0.0%) |
| 6 to 11 Years | 28 (100.0%) | 0 (0.0%) |
| 12 to 14 Years | 0 (0.0%) | 0 (0.0%) |
| 15 Years | 0 (0.0%) | 0 (0.0%) |
| 16 and 17 Years | 0 (0.0%) | 0 (0.0%) |
| 18 to 24 Years | 0 (0.0%) | 7 (100.0%) |
| 25 to 34 Years | 0 (0.0%) | 0 (0.0%) |
| 35 to 44 Years | 0 (0.0%) | 0 (0.0%) |
| 45 to 54 Years | 0 (0.0%) | 29 (39.2%) |
| 55 to 64 Years | 7 (5.7%) | 0 (0.0%) |
| 65 to 74 Years | 0 (0.0%) | 0 (0.0%) |
| 75 Years and over | 0 (0.0%) | 0 (0.0%) |
| Total | 35 (6.1%) | 36 (8.9%) |
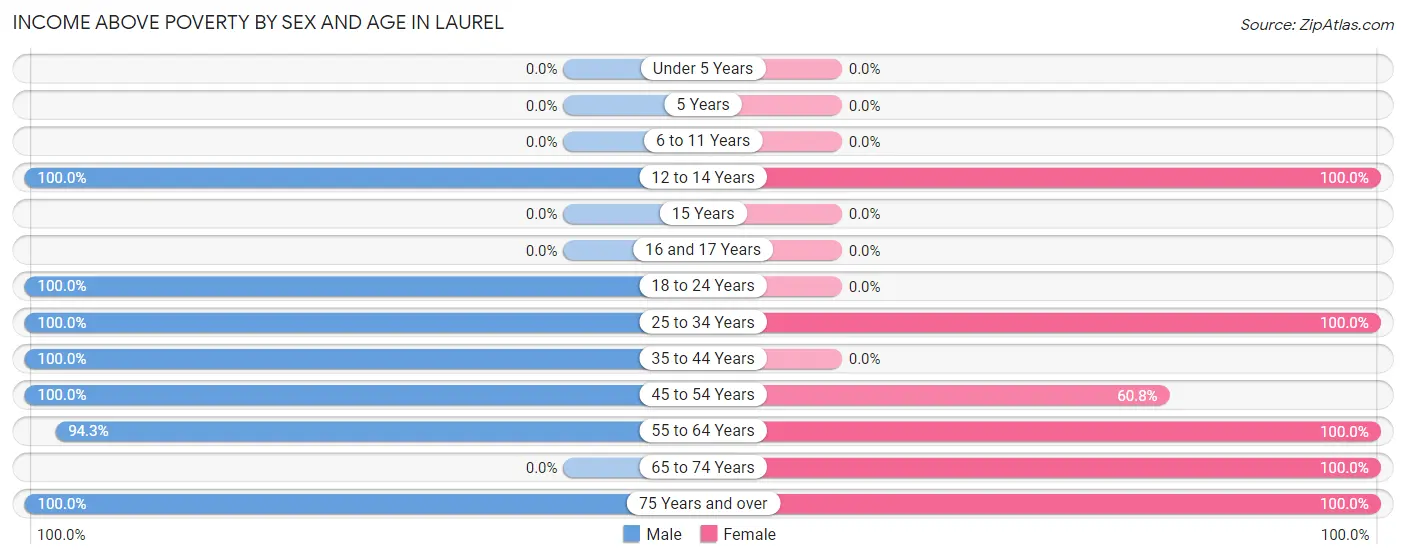
Income Above Poverty by Sex and Age in Laurel
According to the poverty statistics in Laurel, males aged 12 to 14 years and females aged 12 to 14 years are the age groups that are most secure financially, with 100.0% of males and 100.0% of females in these age groups living above the poverty line.
| Age Bracket | Male | Female |
| Under 5 Years | 0 (0.0%) | 0 (0.0%) |
| 5 Years | 0 (0.0%) | 0 (0.0%) |
| 6 to 11 Years | 0 (0.0%) | 0 (0.0%) |
| 12 to 14 Years | 45 (100.0%) | 16 (100.0%) |
| 15 Years | 0 (0.0%) | 0 (0.0%) |
| 16 and 17 Years | 0 (0.0%) | 0 (0.0%) |
| 18 to 24 Years | 100 (100.0%) | 0 (0.0%) |
| 25 to 34 Years | 29 (100.0%) | 59 (100.0%) |
| 35 to 44 Years | 126 (100.0%) | 0 (0.0%) |
| 45 to 54 Years | 68 (100.0%) | 45 (60.8%) |
| 55 to 64 Years | 116 (94.3%) | 134 (100.0%) |
| 65 to 74 Years | 0 (0.0%) | 26 (100.0%) |
| 75 Years and over | 57 (100.0%) | 88 (100.0%) |
| Total | 541 (93.9%) | 368 (91.1%) |
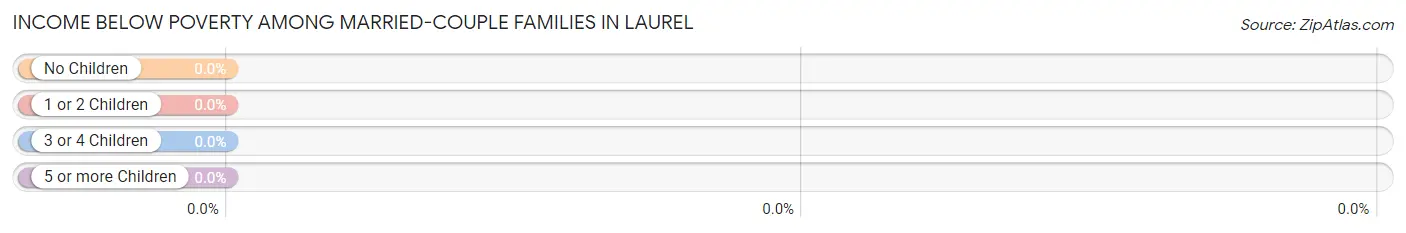
Income Below Poverty Among Married-Couple Families in Laurel
| Children | Above Poverty | Below Poverty |
| No Children | 105 (100.0%) | 0 (0.0%) |
| 1 or 2 Children | 15 (100.0%) | 0 (0.0%) |
| 3 or 4 Children | 0 (0.0%) | 0 (0.0%) |
| 5 or more Children | 0 (0.0%) | 0 (0.0%) |
| Total | 120 (100.0%) | 0 (0.0%) |
Income Below Poverty Among Single-Parent Households in Laurel
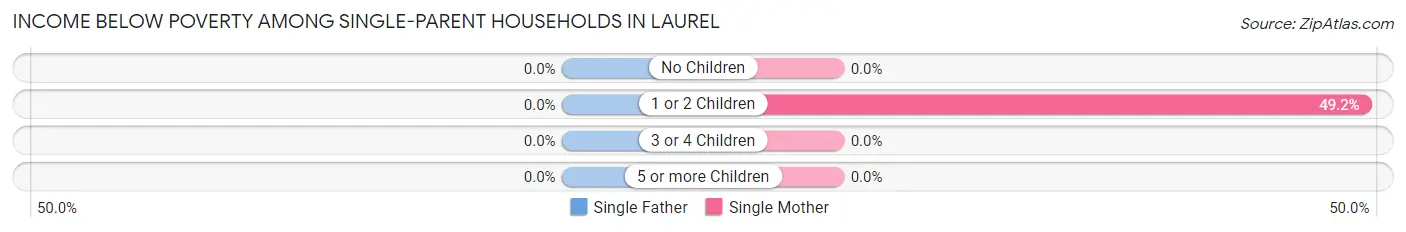
| Children | Single Father | Single Mother |
| No Children | 0 (0.0%) | 0 (0.0%) |
| 1 or 2 Children | 0 (0.0%) | 29 (49.1%) |
| 3 or 4 Children | 0 (0.0%) | 0 (0.0%) |
| 5 or more Children | 0 (0.0%) | 0 (0.0%) |
| Total | 0 (0.0%) | 29 (34.1%) |
Income Below Poverty Among Married-Couple vs Single-Parent Households in Laurel
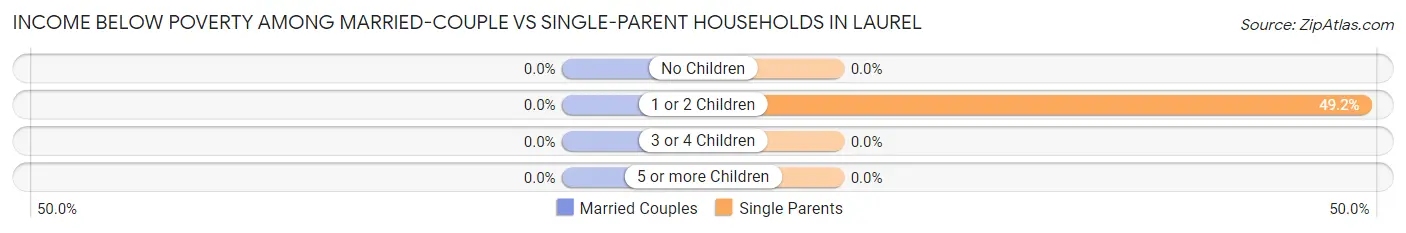
| Children | Married-Couple Families | Single-Parent Households |
| No Children | 0 (0.0%) | 0 (0.0%) |
| 1 or 2 Children | 0 (0.0%) | 29 (49.1%) |
| 3 or 4 Children | 0 (0.0%) | 0 (0.0%) |
| 5 or more Children | 0 (0.0%) | 0 (0.0%) |
| Total | 0 (0.0%) | 29 (20.3%) |
Race in Laurel
The most populous races in Laurel are White / Caucasian (796 | 81.2%), Hispanic or Latino (173 | 17.6%), and Some other Race (173 | 17.6%).
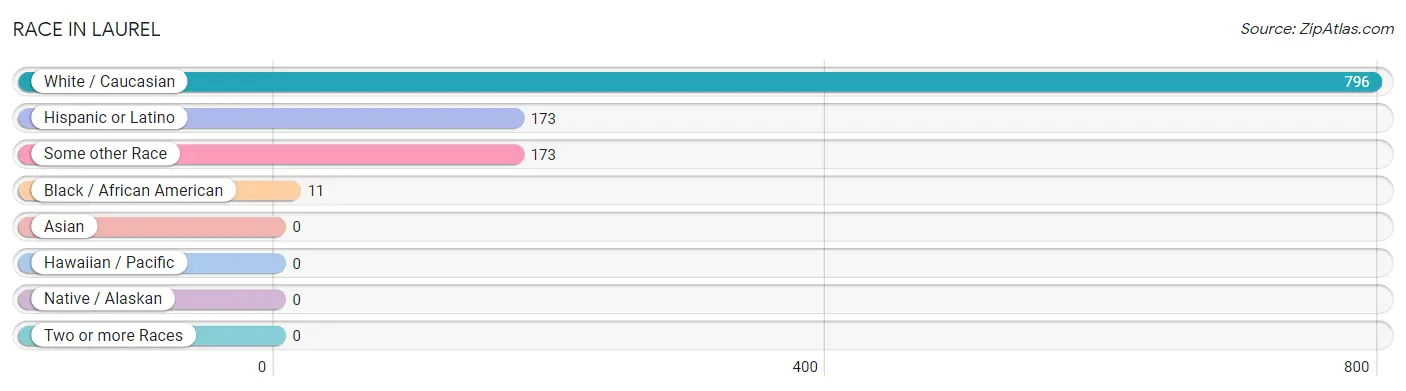
| Race | # Population | % Population |
| Asian | 0 | 0.0% |
| Black / African American | 11 | 1.1% |
| Hawaiian / Pacific | 0 | 0.0% |
| Hispanic or Latino | 173 | 17.6% |
| Native / Alaskan | 0 | 0.0% |
| White / Caucasian | 796 | 81.2% |
| Two or more Races | 0 | 0.0% |
| Some other Race | 173 | 17.6% |
| Total | 980 | 100.0% |
Ancestry in Laurel
The most populous ancestries reported in Laurel are Central American (173 | 17.6%), Guatemalan (173 | 17.6%), Italian (142 | 14.5%), Polish (121 | 12.3%), and German (114 | 11.6%), together accounting for 73.8% of all Laurel residents.
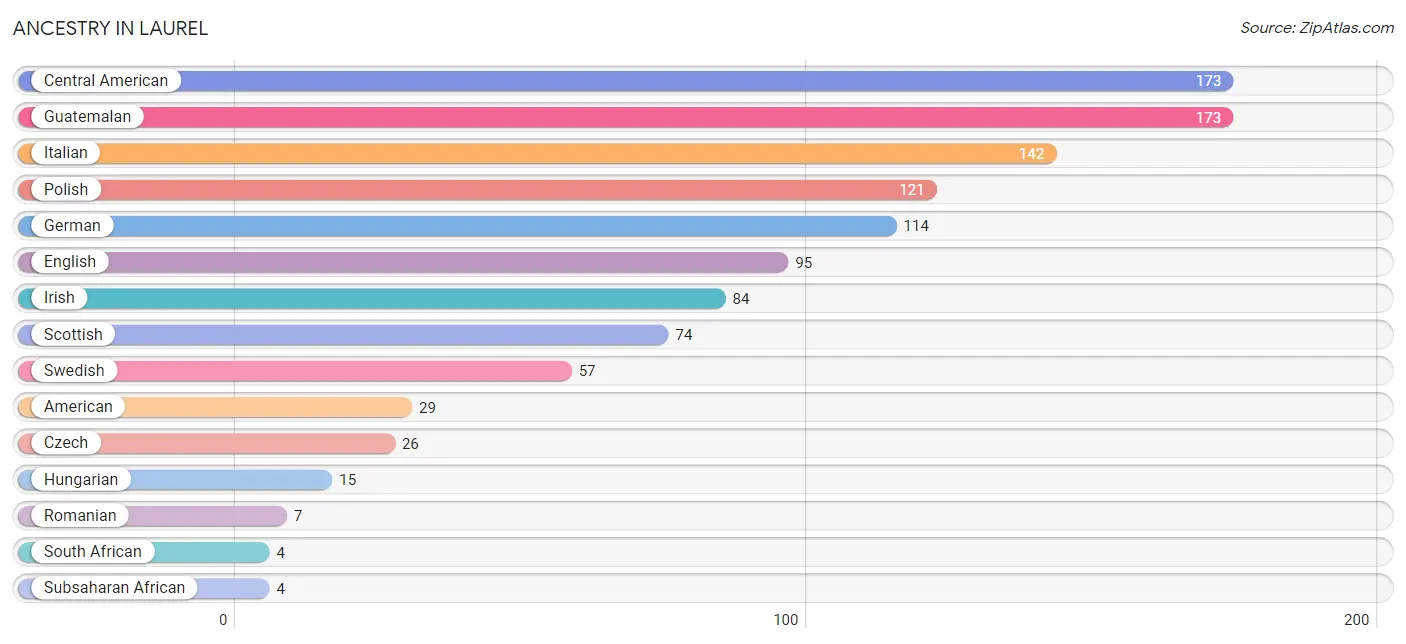
| Ancestry | # Population | % Population |
| American | 29 | 3.0% |
| Central American | 173 | 17.6% |
| Czech | 26 | 2.6% |
| English | 95 | 9.7% |
| German | 114 | 11.6% |
| Guatemalan | 173 | 17.6% |
| Hungarian | 15 | 1.5% |
| Irish | 84 | 8.6% |
| Italian | 142 | 14.5% |
| Polish | 121 | 12.3% |
| Romanian | 7 | 0.7% |
| Scottish | 74 | 7.5% |
| South African | 4 | 0.4% |
| Subsaharan African | 4 | 0.4% |
| Swedish | 57 | 5.8% | View All 15 Rows |
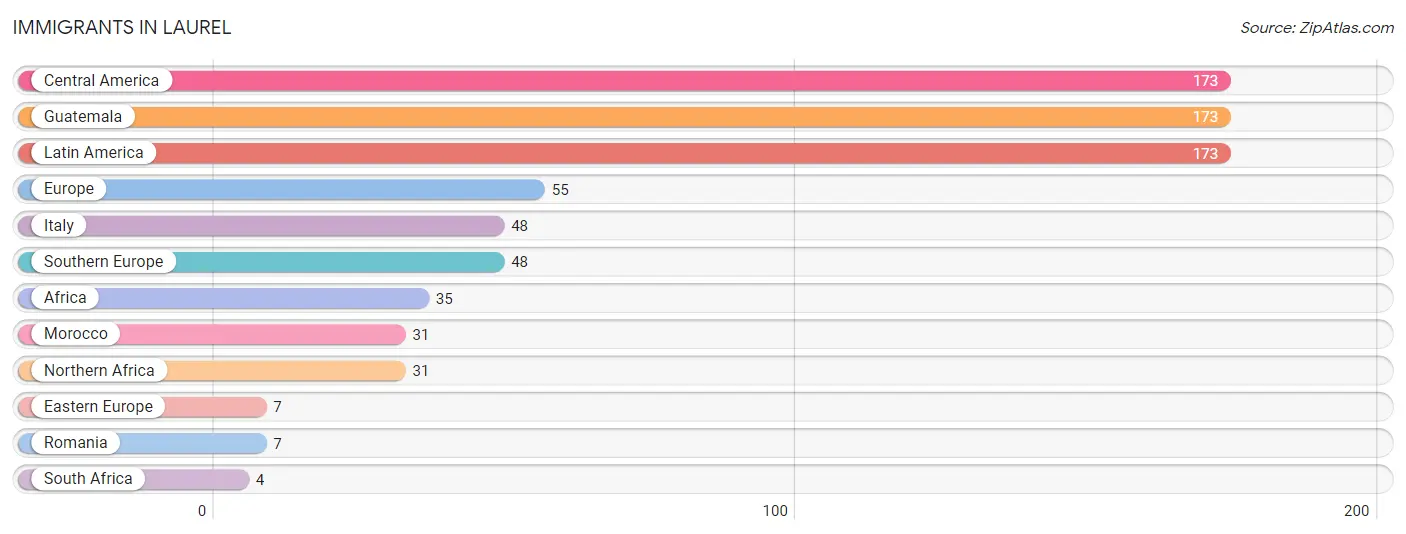
Immigrants in Laurel
The most numerous immigrant groups reported in Laurel came from Central America (173 | 17.6%), Guatemala (173 | 17.6%), Latin America (173 | 17.6%), Europe (55 | 5.6%), and Italy (48 | 4.9%), together accounting for 63.5% of all Laurel residents.
| Immigration Origin | # Population | % Population |
| Africa | 35 | 3.6% |
| Central America | 173 | 17.6% |
| Eastern Europe | 7 | 0.7% |
| Europe | 55 | 5.6% |
| Guatemala | 173 | 17.6% |
| Italy | 48 | 4.9% |
| Latin America | 173 | 17.6% |
| Morocco | 31 | 3.2% |
| Northern Africa | 31 | 3.2% |
| Romania | 7 | 0.7% |
| South Africa | 4 | 0.4% |
| Southern Europe | 48 | 4.9% | View All 12 Rows |
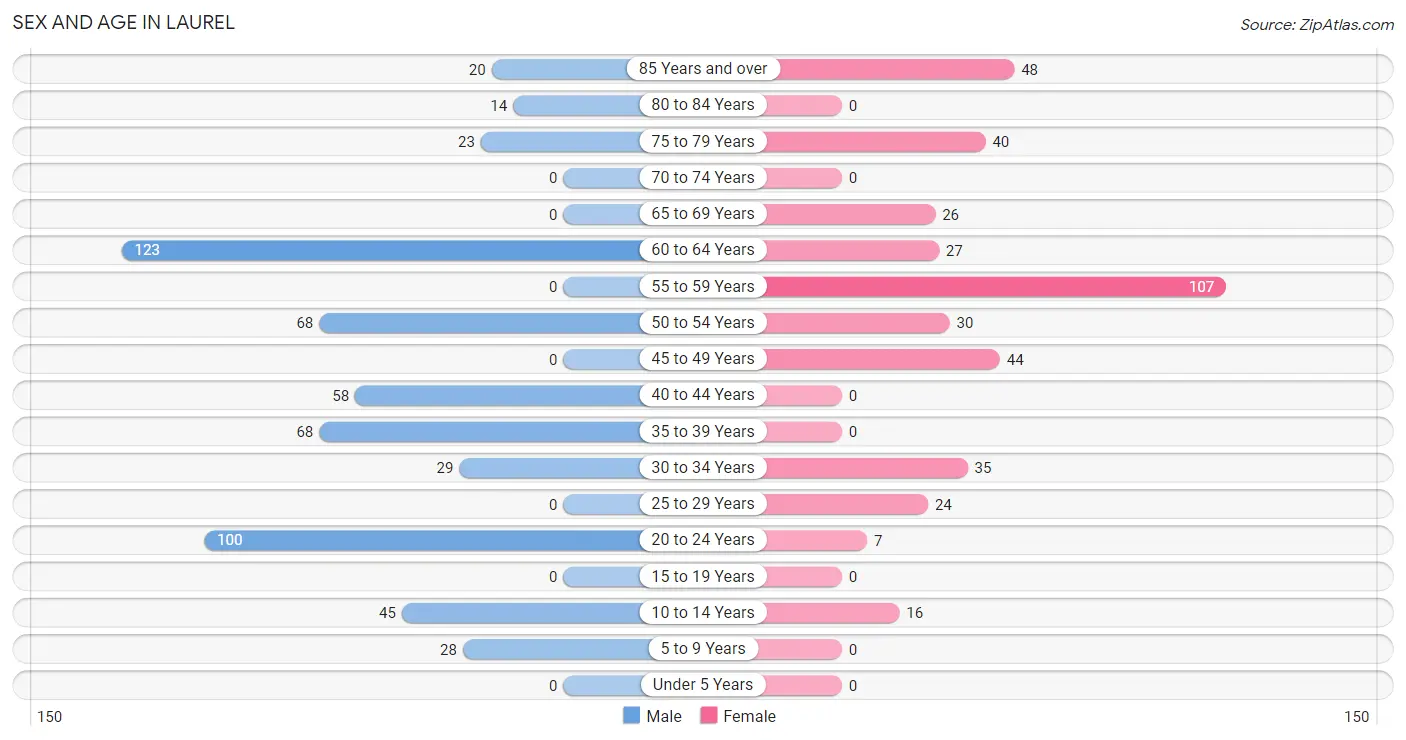
Sex and Age in Laurel
Sex and Age in Laurel
The most populous age groups in Laurel are 60 to 64 Years (123 | 21.3%) for men and 55 to 59 Years (107 | 26.5%) for women.
| Age Bracket | Male | Female |
| Under 5 Years | 0 (0.0%) | 0 (0.0%) |
| 5 to 9 Years | 28 (4.9%) | 0 (0.0%) |
| 10 to 14 Years | 45 (7.8%) | 16 (4.0%) |
| 15 to 19 Years | 0 (0.0%) | 0 (0.0%) |
| 20 to 24 Years | 100 (17.4%) | 7 (1.7%) |
| 25 to 29 Years | 0 (0.0%) | 24 (5.9%) |
| 30 to 34 Years | 29 (5.0%) | 35 (8.7%) |
| 35 to 39 Years | 68 (11.8%) | 0 (0.0%) |
| 40 to 44 Years | 58 (10.1%) | 0 (0.0%) |
| 45 to 49 Years | 0 (0.0%) | 44 (10.9%) |
| 50 to 54 Years | 68 (11.8%) | 30 (7.4%) |
| 55 to 59 Years | 0 (0.0%) | 107 (26.5%) |
| 60 to 64 Years | 123 (21.3%) | 27 (6.7%) |
| 65 to 69 Years | 0 (0.0%) | 26 (6.4%) |
| 70 to 74 Years | 0 (0.0%) | 0 (0.0%) |
| 75 to 79 Years | 23 (4.0%) | 40 (9.9%) |
| 80 to 84 Years | 14 (2.4%) | 0 (0.0%) |
| 85 Years and over | 20 (3.5%) | 48 (11.9%) |
| Total | 576 (100.0%) | 404 (100.0%) |
Families and Households in Laurel
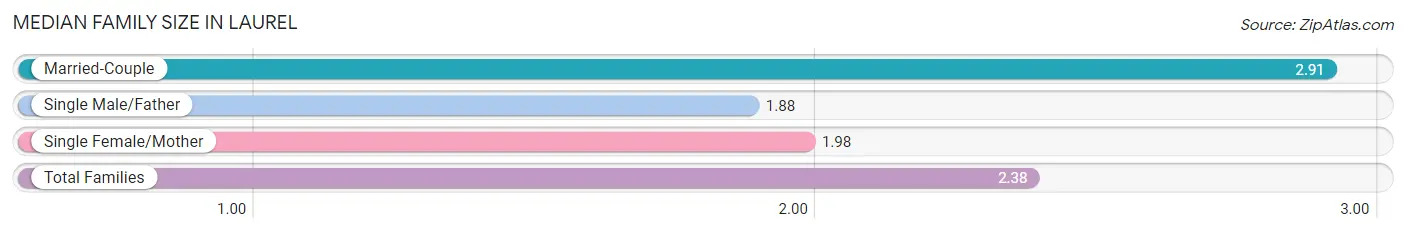
Median Family Size in Laurel
The median family size in Laurel is 2.38 persons per family, with married-couple families (120 | 45.6%) accounting for the largest median family size of 2.91 persons per family. On the other hand, single male/father families (58 | 22.1%) represent the smallest median family size with 1.88 persons per family.
| Family Type | # Families | Family Size |
| Married-Couple | 120 (45.6%) | 2.91 |
| Single Male/Father | 58 (22.1%) | 1.88 |
| Single Female/Mother | 85 (32.3%) | 1.98 |
| Total Families | 263 (100.0%) | 2.38 |
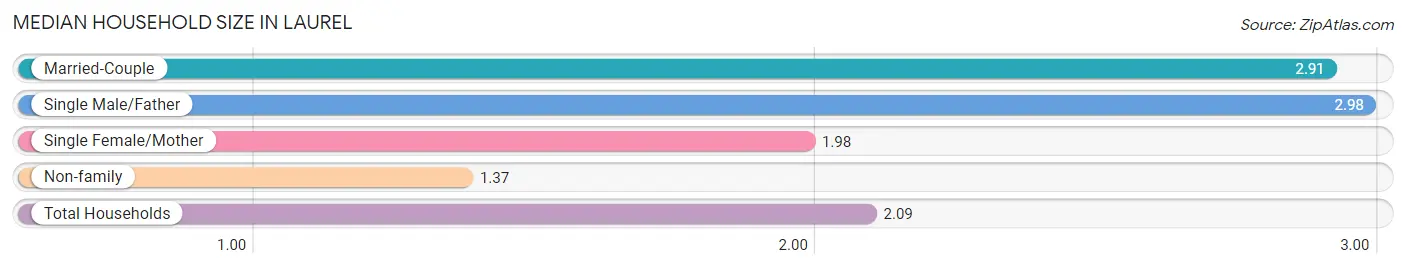
Median Household Size in Laurel
The median household size in Laurel is 2.09 persons per household, with single male/father households (58 | 12.7%) accounting for the largest median household size of 2.98 persons per household. non-family households (194 | 42.4%) represent the smallest median household size with 1.37 persons per household.
| Household Type | # Households | Household Size |
| Married-Couple | 120 (26.3%) | 2.91 |
| Single Male/Father | 58 (12.7%) | 2.98 |
| Single Female/Mother | 85 (18.6%) | 1.98 |
| Non-family | 194 (42.4%) | 1.37 |
| Total Households | 457 (100.0%) | 2.09 |
Household Size by Marriage Status in Laurel
Out of a total of 457 households in Laurel, 263 (57.6%) are family households, while 194 (42.4%) are nonfamily households. The most numerous type of family households are 2-person households, comprising 171, and the most common type of nonfamily households are 1-person households, comprising 116.
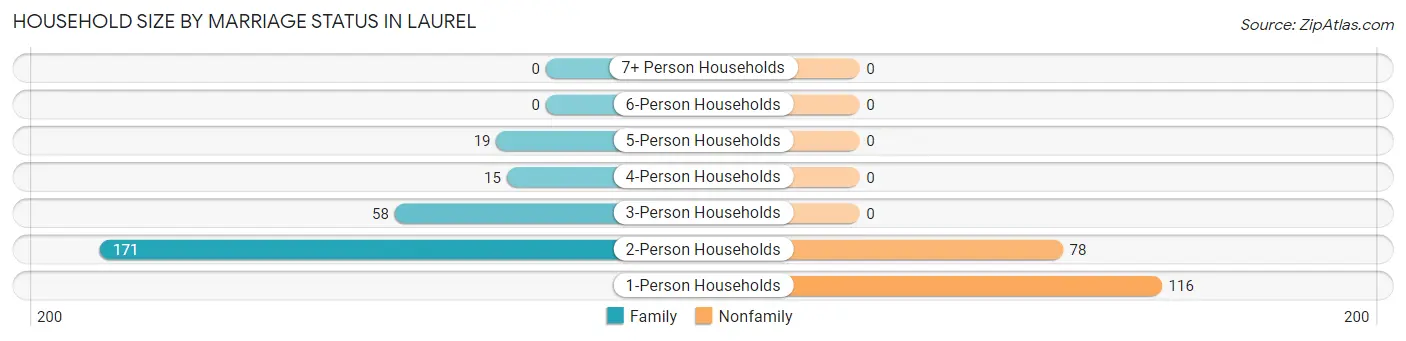
| Household Size | Family Households | Nonfamily Households |
| 1-Person Households | - | 116 (25.4%) |
| 2-Person Households | 171 (37.4%) | 78 (17.1%) |
| 3-Person Households | 58 (12.7%) | 0 (0.0%) |
| 4-Person Households | 15 (3.3%) | 0 (0.0%) |
| 5-Person Households | 19 (4.2%) | 0 (0.0%) |
| 6-Person Households | 0 (0.0%) | 0 (0.0%) |
| 7+ Person Households | 0 (0.0%) | 0 (0.0%) |
| Total | 263 (57.6%) | 194 (42.4%) |
Female Fertility in Laurel
Fertility by Age in Laurel
Average fertility rate in Laurel is 50.0 births per 1,000 women. Women in the age bracket of 20 to 34 years have the highest fertility rate with 106.0 births per 1,000 women. Women in the age bracket of 20 to 34 years acount for 100.0% of all women with births.
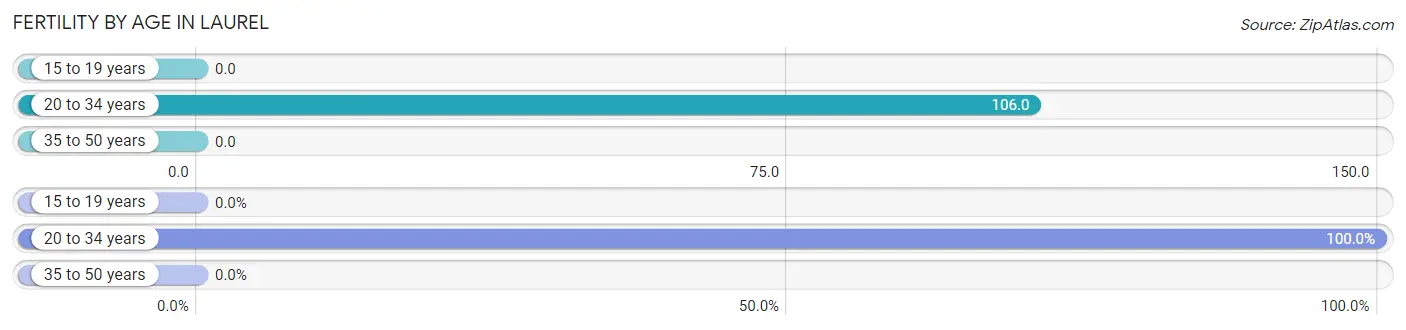
| Age Bracket | Women with Births | Births / 1,000 Women |
| 15 to 19 years | 0 (0.0%) | 0.0 |
| 20 to 34 years | 7 (100.0%) | 106.0 |
| 35 to 50 years | 0 (0.0%) | 0.0 |
| Total | 7 (100.0%) | 50.0 |
Fertility by Age by Marriage Status in Laurel
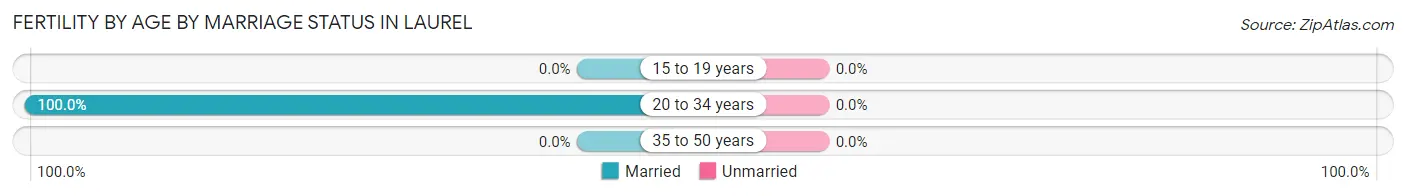
| Age Bracket | Married | Unmarried |
| 15 to 19 years | 0 (0.0%) | 0 (0.0%) |
| 20 to 34 years | 7 (100.0%) | 0 (0.0%) |
| 35 to 50 years | 0 (0.0%) | 0 (0.0%) |
| Total | 7 (100.0%) | 0 (0.0%) |
Fertility by Education in Laurel
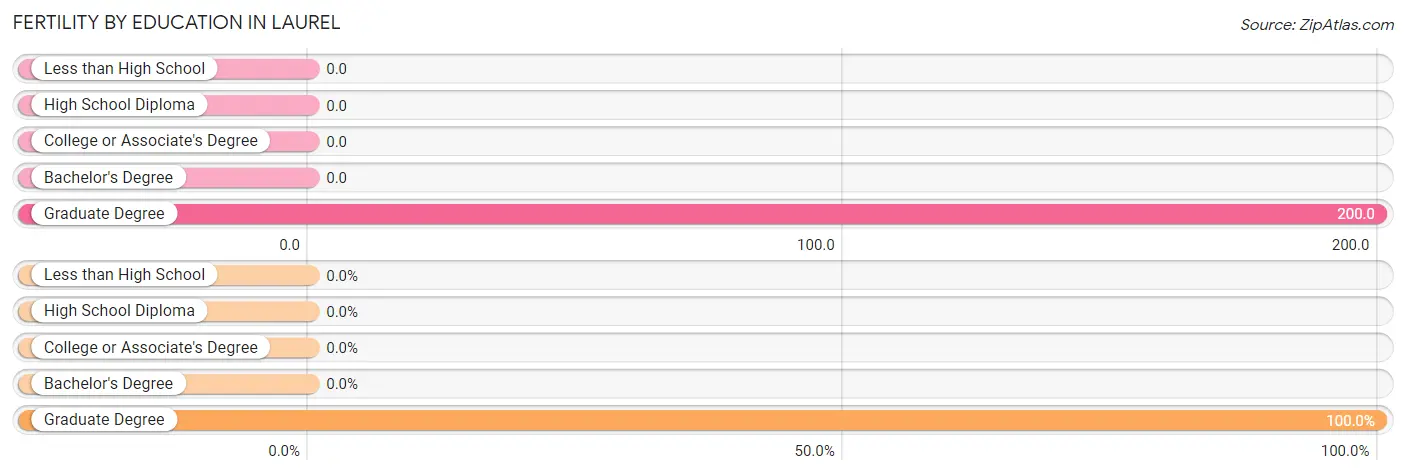
| Educational Attainment | Women with Births | Births / 1,000 Women |
| Less than High School | 0 (0.0%) | 0.0 |
| High School Diploma | 0 (0.0%) | 0.0 |
| College or Associate's Degree | 0 (0.0%) | 0.0 |
| Bachelor's Degree | 0 (0.0%) | 0.0 |
| Graduate Degree | 7 (100.0%) | 200.0 |
| Total | 7 (100.0%) | 50.0 |
Fertility by Education by Marriage Status in Laurel
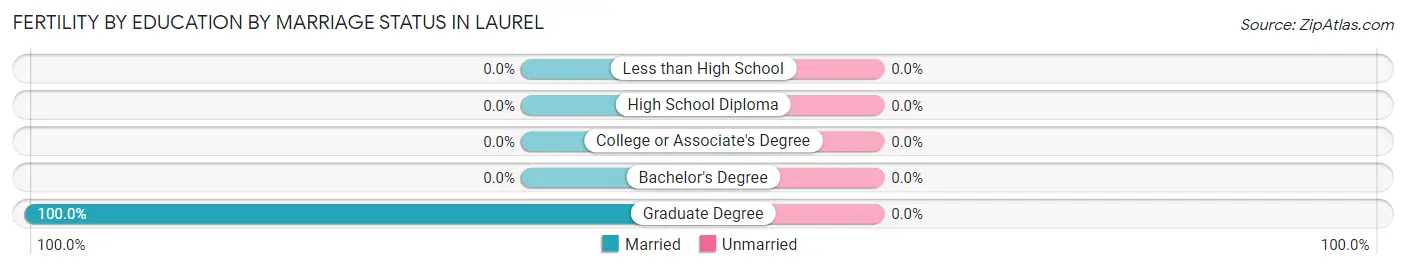
| Educational Attainment | Married | Unmarried |
| Less than High School | 0 (0.0%) | 0 (0.0%) |
| High School Diploma | 0 (0.0%) | 0 (0.0%) |
| College or Associate's Degree | 0 (0.0%) | 0 (0.0%) |
| Bachelor's Degree | 0 (0.0%) | 0 (0.0%) |
| Graduate Degree | 7 (100.0%) | 0 (0.0%) |
| Total | 7 (100.0%) | 0 (0.0%) |
Employment Characteristics in Laurel
Employment by Class of Employer in Laurel
Among the 482 employed individuals in Laurel, private company employees (243 | 50.4%), not-for-profit organizations (108 | 22.4%), and local government employees (80 | 16.6%) make up the most common classes of employment.
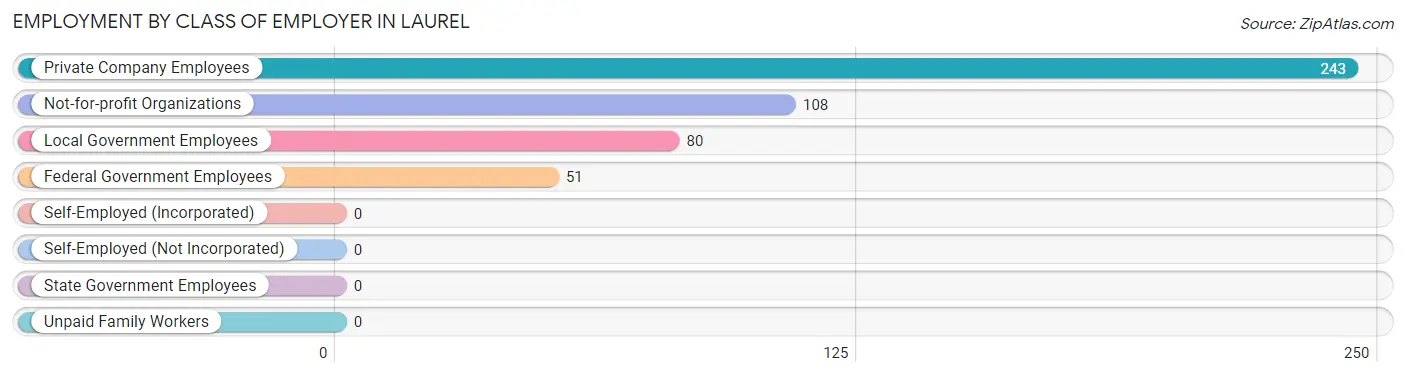
| Employer Class | # Employees | % Employees |
| Private Company Employees | 243 | 50.4% |
| Self-Employed (Incorporated) | 0 | 0.0% |
| Self-Employed (Not Incorporated) | 0 | 0.0% |
| Not-for-profit Organizations | 108 | 22.4% |
| Local Government Employees | 80 | 16.6% |
| State Government Employees | 0 | 0.0% |
| Federal Government Employees | 51 | 10.6% |
| Unpaid Family Workers | 0 | 0.0% |
| Total | 482 | 100.0% |
Employment Status by Age in Laurel
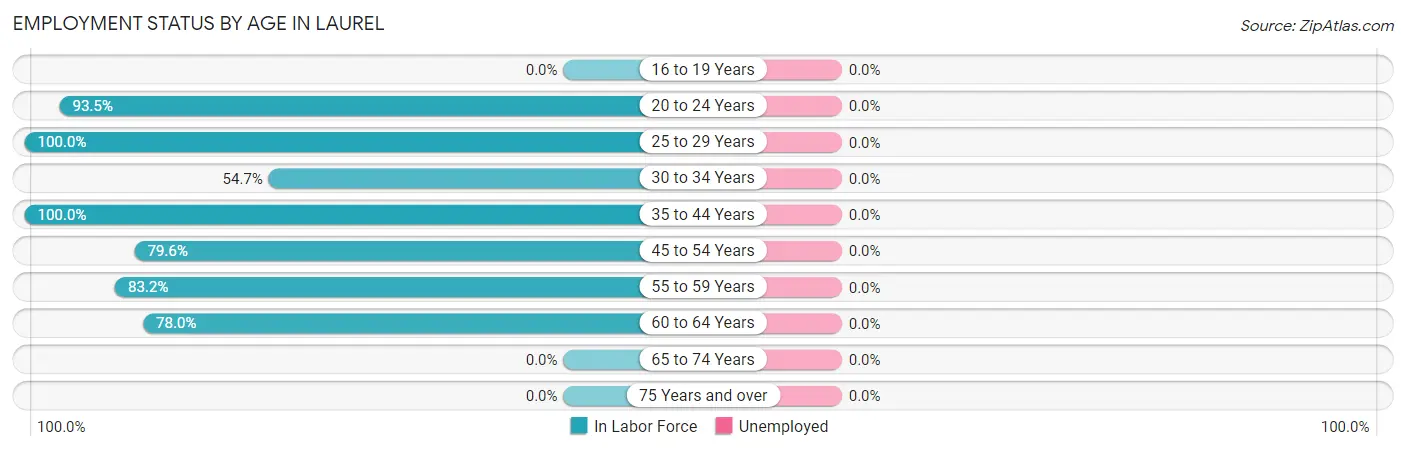
| Age Bracket | In Labor Force | Unemployed |
| 16 to 19 Years | 0 (0.0%) | 0 (0.0%) |
| 20 to 24 Years | 100 (93.5%) | 0 (0.0%) |
| 25 to 29 Years | 24 (100.0%) | 0 (0.0%) |
| 30 to 34 Years | 35 (54.7%) | 0 (0.0%) |
| 35 to 44 Years | 126 (100.0%) | 0 (0.0%) |
| 45 to 54 Years | 113 (79.6%) | 0 (0.0%) |
| 55 to 59 Years | 89 (83.2%) | 0 (0.0%) |
| 60 to 64 Years | 117 (78.0%) | 0 (0.0%) |
| 65 to 74 Years | 0 (0.0%) | 0 (0.0%) |
| 75 Years and over | 0 (0.0%) | 0 (0.0%) |
| Total | 604 (67.8%) | 0 (0.0%) |
Employment Status by Educational Attainment in Laurel
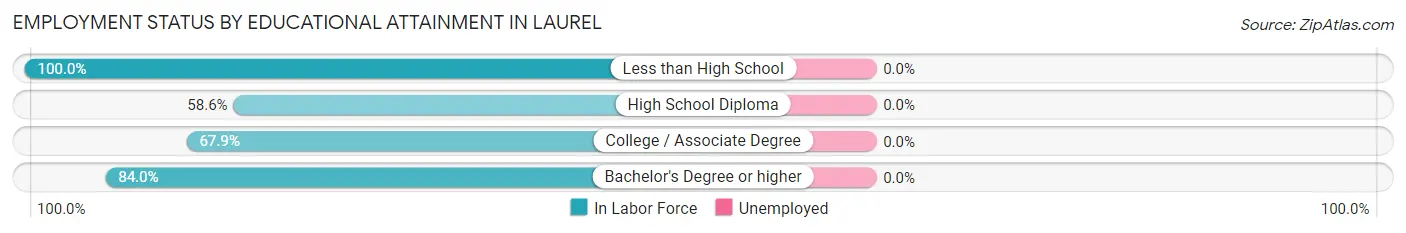
| Educational Attainment | In Labor Force | Unemployed |
| Less than High School | 126 (100.0%) | 0 (0.0%) |
| High School Diploma | 51 (58.6%) | 0 (0.0%) |
| College / Associate Degree | 38 (67.9%) | 0 (0.0%) |
| Bachelor's Degree or higher | 289 (84.0%) | 0 (0.0%) |
| Total | 504 (82.2%) | 0 (0.0%) |
Employment Occupations by Sex in Laurel
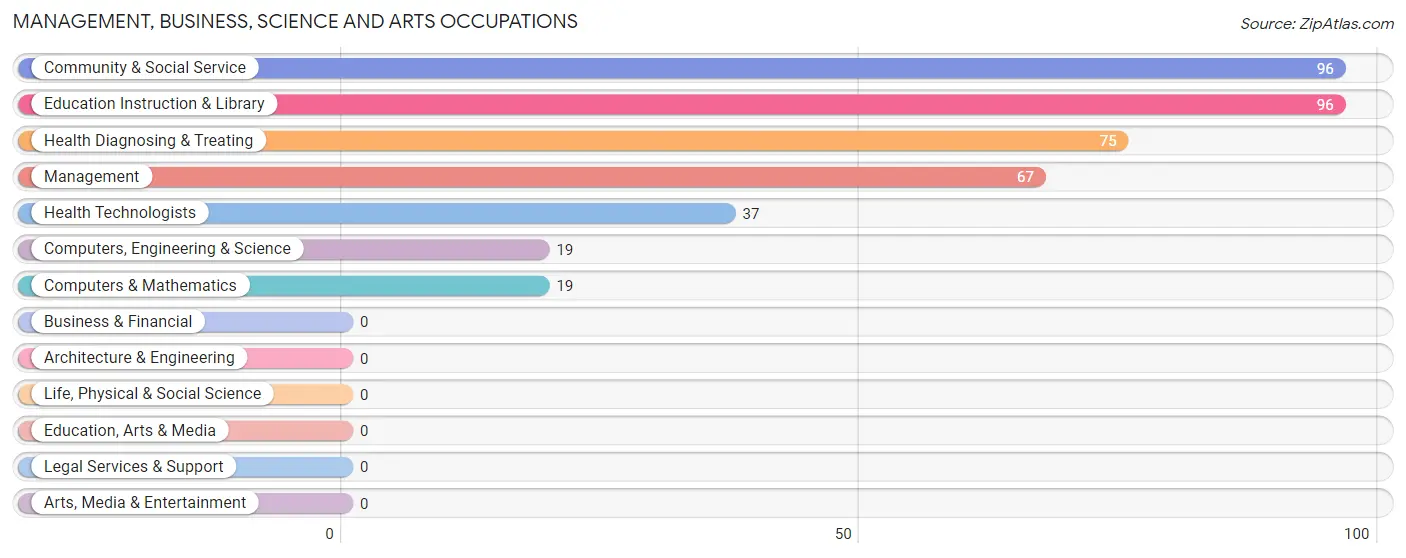
Management, Business, Science and Arts Occupations
The most common Management, Business, Science and Arts occupations in Laurel are Community & Social Service (96 | 15.9%), Education Instruction & Library (96 | 15.9%), Health Diagnosing & Treating (75 | 12.4%), Management (67 | 11.1%), and Health Technologists (37 | 6.1%).
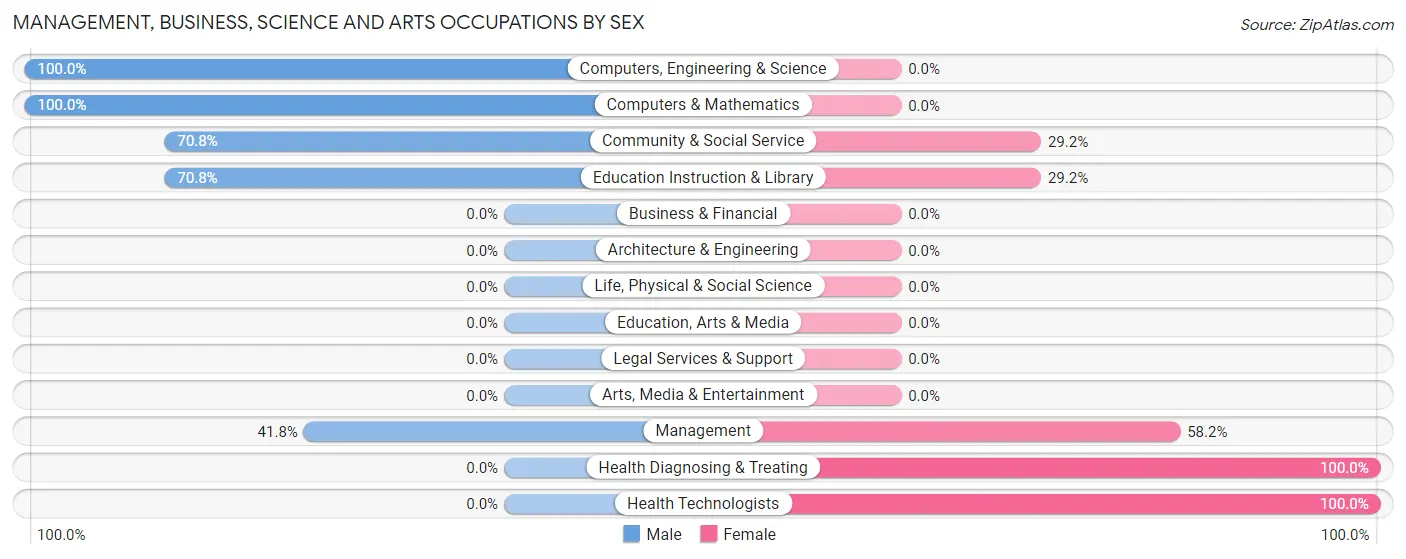
Management, Business, Science and Arts Occupations by Sex
Within the Management, Business, Science and Arts occupations in Laurel, the most male-oriented occupations are Computers, Engineering & Science (100.0%), Computers & Mathematics (100.0%), and Community & Social Service (70.8%), while the most female-oriented occupations are Health Diagnosing & Treating (100.0%), Health Technologists (100.0%), and Management (58.2%).
| Occupation | Male | Female |
| Management | 28 (41.8%) | 39 (58.2%) |
| Business & Financial | 0 (0.0%) | 0 (0.0%) |
| Computers, Engineering & Science | 19 (100.0%) | 0 (0.0%) |
| Computers & Mathematics | 19 (100.0%) | 0 (0.0%) |
| Architecture & Engineering | 0 (0.0%) | 0 (0.0%) |
| Life, Physical & Social Science | 0 (0.0%) | 0 (0.0%) |
| Community & Social Service | 68 (70.8%) | 28 (29.2%) |
| Education, Arts & Media | 0 (0.0%) | 0 (0.0%) |
| Legal Services & Support | 0 (0.0%) | 0 (0.0%) |
| Education Instruction & Library | 68 (70.8%) | 28 (29.2%) |
| Arts, Media & Entertainment | 0 (0.0%) | 0 (0.0%) |
| Health Diagnosing & Treating | 0 (0.0%) | 75 (100.0%) |
| Health Technologists | 0 (0.0%) | 37 (100.0%) |
| Total (Category) | 115 (44.8%) | 142 (55.2%) |
| Total (Overall) | 384 (63.6%) | 220 (36.4%) |
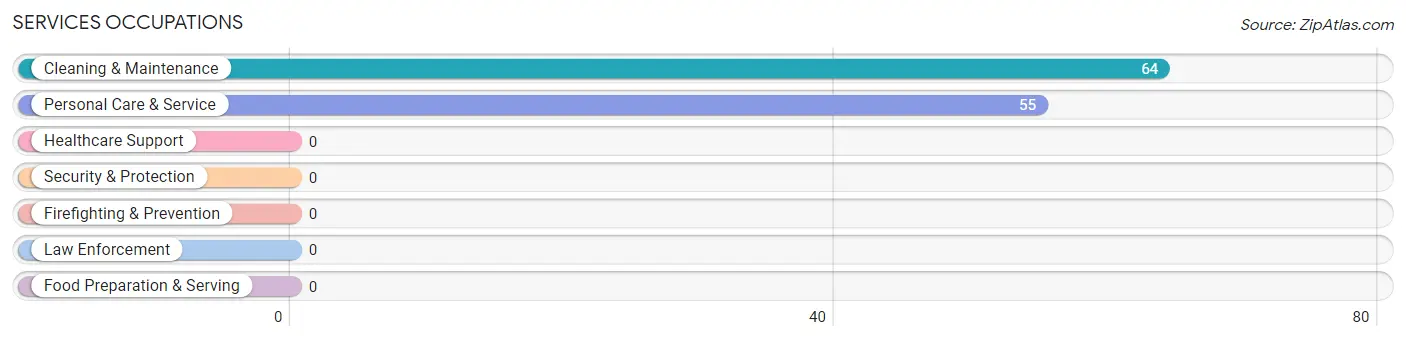
Services Occupations
The most common Services occupations in Laurel are Cleaning & Maintenance (64 | 10.6%), and Personal Care & Service (55 | 9.1%).
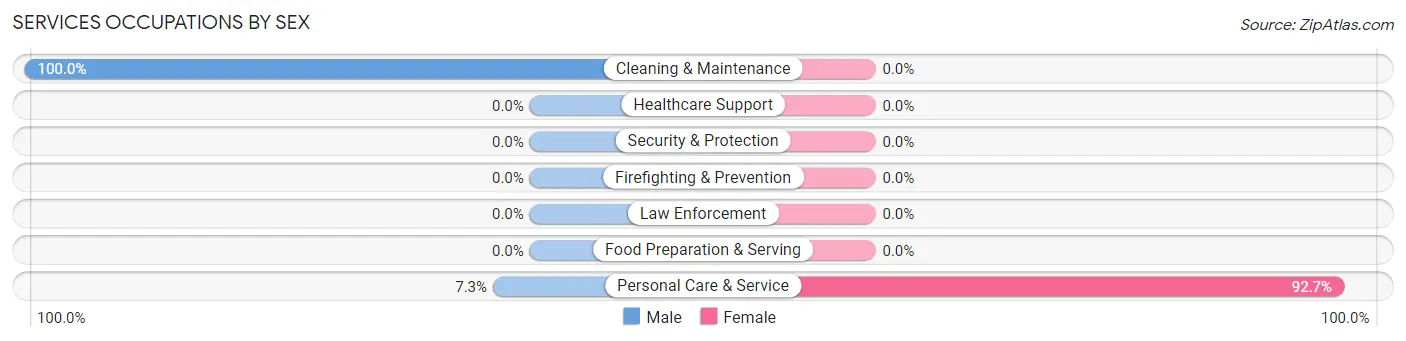
Services Occupations by Sex
| Occupation | Male | Female |
| Healthcare Support | 0 (0.0%) | 0 (0.0%) |
| Security & Protection | 0 (0.0%) | 0 (0.0%) |
| Firefighting & Prevention | 0 (0.0%) | 0 (0.0%) |
| Law Enforcement | 0 (0.0%) | 0 (0.0%) |
| Food Preparation & Serving | 0 (0.0%) | 0 (0.0%) |
| Cleaning & Maintenance | 64 (100.0%) | 0 (0.0%) |
| Personal Care & Service | 4 (7.3%) | 51 (92.7%) |
| Total (Category) | 68 (57.1%) | 51 (42.9%) |
| Total (Overall) | 384 (63.6%) | 220 (36.4%) |
Sales and Office Occupations
The most common Sales and Office occupations in Laurel are Office & Administration (52 | 8.6%), and Sales & Related (43 | 7.1%).

Sales and Office Occupations by Sex

| Occupation | Male | Female |
| Sales & Related | 43 (100.0%) | 0 (0.0%) |
| Office & Administration | 25 (48.1%) | 27 (51.9%) |
| Total (Category) | 68 (71.6%) | 27 (28.4%) |
| Total (Overall) | 384 (63.6%) | 220 (36.4%) |
Natural Resources, Construction and Maintenance Occupations
The most common Natural Resources, Construction and Maintenance occupations in Laurel are , and Installation, Maintenance & Repair (109 | 18.0%).
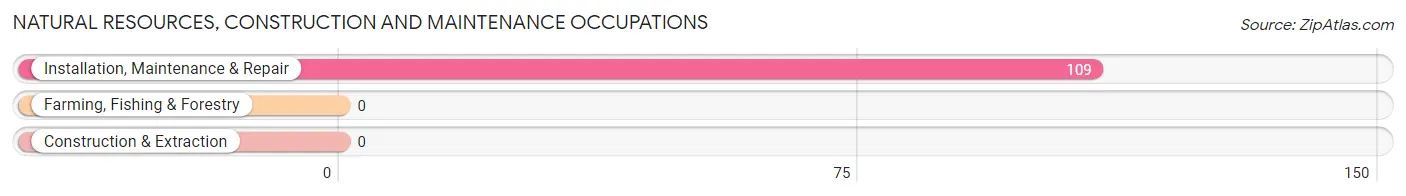
Natural Resources, Construction and Maintenance Occupations by Sex
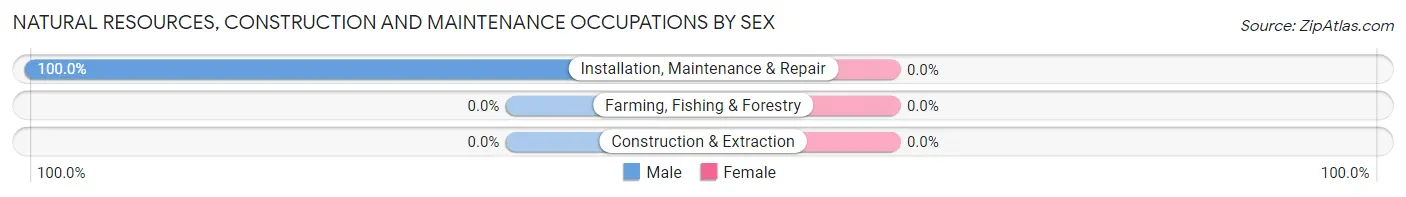
| Occupation | Male | Female |
| Farming, Fishing & Forestry | 0 (0.0%) | 0 (0.0%) |
| Construction & Extraction | 0 (0.0%) | 0 (0.0%) |
| Installation, Maintenance & Repair | 109 (100.0%) | 0 (0.0%) |
| Total (Category) | 109 (100.0%) | 0 (0.0%) |
| Total (Overall) | 384 (63.6%) | 220 (36.4%) |
Production, Transportation and Moving Occupations
The most common Production, Transportation and Moving occupations in Laurel are , and Material Moving (24 | 4.0%).
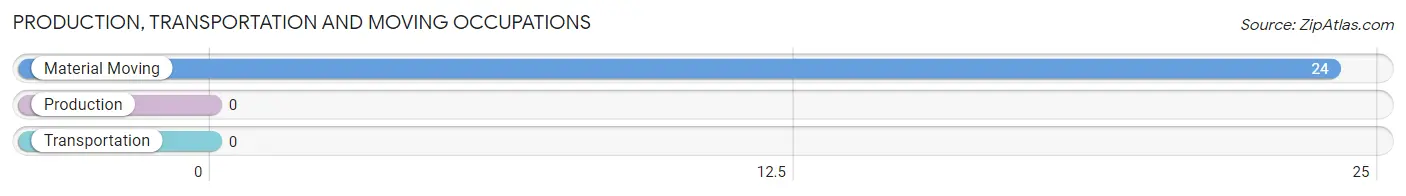
Production, Transportation and Moving Occupations by Sex
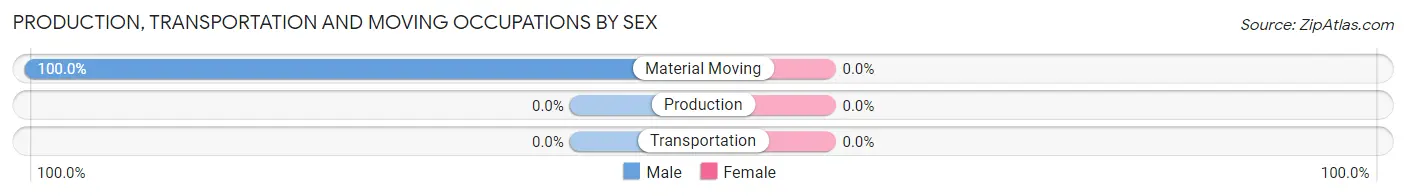
| Occupation | Male | Female |
| Production | 0 (0.0%) | 0 (0.0%) |
| Transportation | 0 (0.0%) | 0 (0.0%) |
| Material Moving | 24 (100.0%) | 0 (0.0%) |
| Total (Category) | 24 (100.0%) | 0 (0.0%) |
| Total (Overall) | 384 (63.6%) | 220 (36.4%) |
Employment Industries by Sex in Laurel
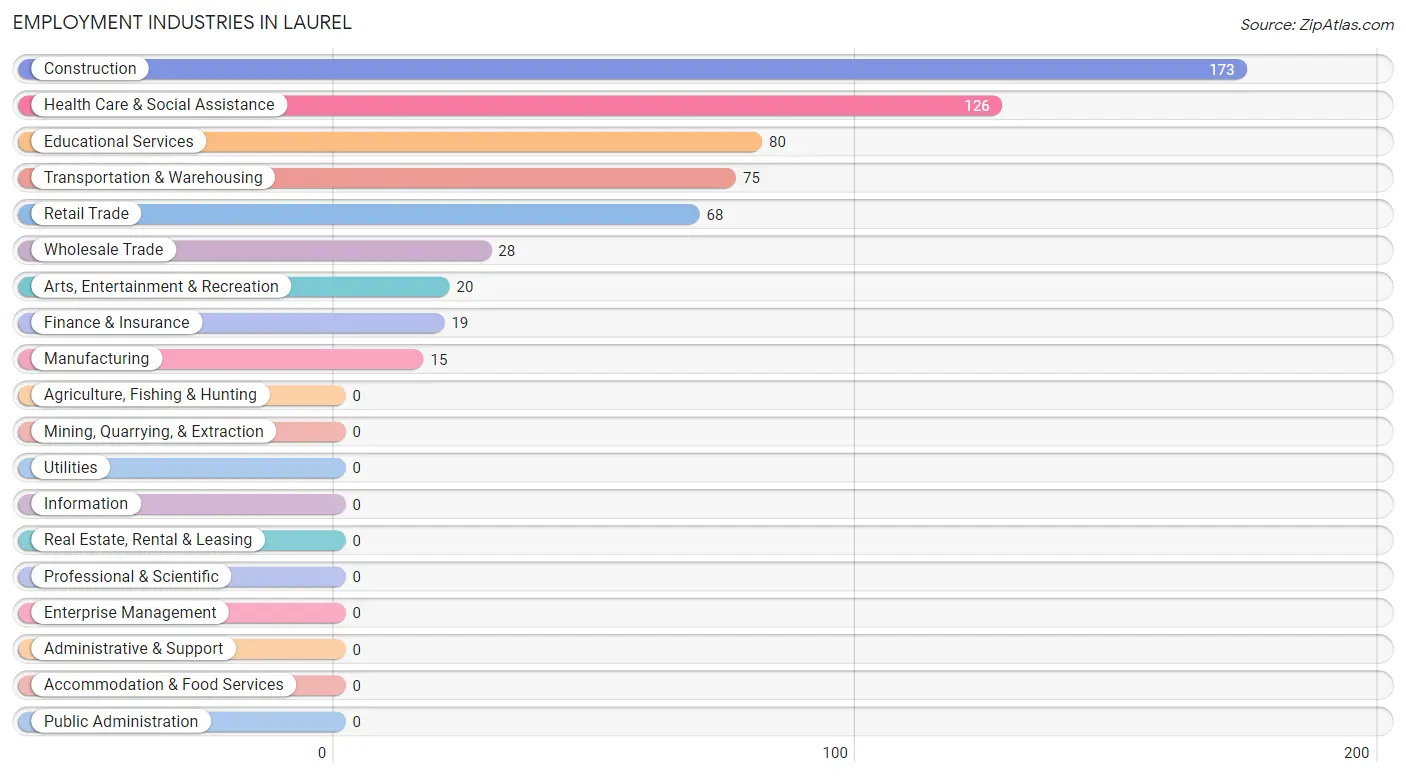
Employment Industries in Laurel
The major employment industries in Laurel include Construction (173 | 28.6%), Health Care & Social Assistance (126 | 20.9%), Educational Services (80 | 13.3%), Transportation & Warehousing (75 | 12.4%), and Retail Trade (68 | 11.3%).
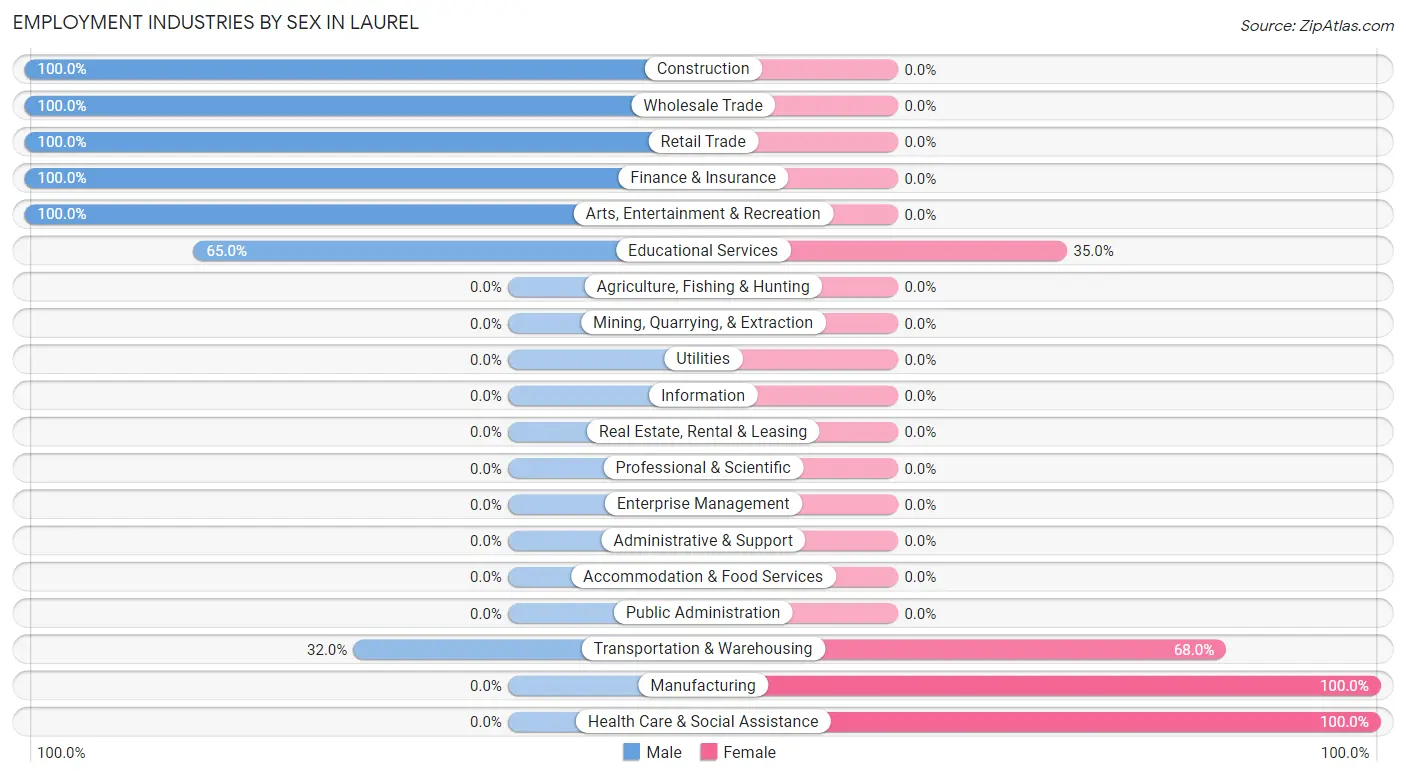
Employment Industries by Sex in Laurel
The Laurel industries that see more men than women are Construction (100.0%), Wholesale Trade (100.0%), and Retail Trade (100.0%), whereas the industries that tend to have a higher number of women are Manufacturing (100.0%), Health Care & Social Assistance (100.0%), and Transportation & Warehousing (68.0%).
| Industry | Male | Female |
| Agriculture, Fishing & Hunting | 0 (0.0%) | 0 (0.0%) |
| Mining, Quarrying, & Extraction | 0 (0.0%) | 0 (0.0%) |
| Construction | 173 (100.0%) | 0 (0.0%) |
| Manufacturing | 0 (0.0%) | 15 (100.0%) |
| Wholesale Trade | 28 (100.0%) | 0 (0.0%) |
| Retail Trade | 68 (100.0%) | 0 (0.0%) |
| Transportation & Warehousing | 24 (32.0%) | 51 (68.0%) |
| Utilities | 0 (0.0%) | 0 (0.0%) |
| Information | 0 (0.0%) | 0 (0.0%) |
| Finance & Insurance | 19 (100.0%) | 0 (0.0%) |
| Real Estate, Rental & Leasing | 0 (0.0%) | 0 (0.0%) |
| Professional & Scientific | 0 (0.0%) | 0 (0.0%) |
| Enterprise Management | 0 (0.0%) | 0 (0.0%) |
| Administrative & Support | 0 (0.0%) | 0 (0.0%) |
| Educational Services | 52 (65.0%) | 28 (35.0%) |
| Health Care & Social Assistance | 0 (0.0%) | 126 (100.0%) |
| Arts, Entertainment & Recreation | 20 (100.0%) | 0 (0.0%) |
| Accommodation & Food Services | 0 (0.0%) | 0 (0.0%) |
| Public Administration | 0 (0.0%) | 0 (0.0%) |
| Total | 384 (63.6%) | 220 (36.4%) |
Education in Laurel
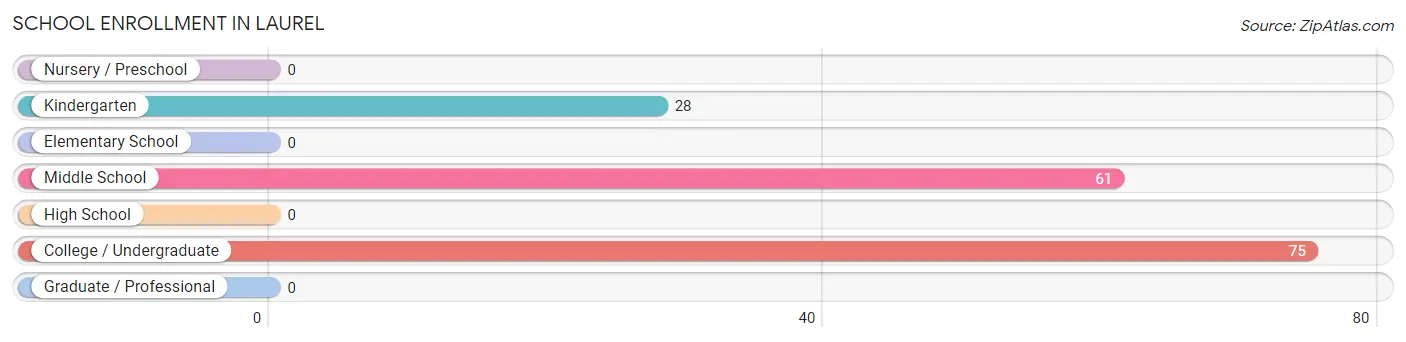
School Enrollment in Laurel
The most common levels of schooling among the 164 students in Laurel are college / undergraduate (75 | 45.7%), middle school (61 | 37.2%), and kindergarten (28 | 17.1%).
| School Level | # Students | % Students |
| Nursery / Preschool | 0 | 0.0% |
| Kindergarten | 28 | 17.1% |
| Elementary School | 0 | 0.0% |
| Middle School | 61 | 37.2% |
| High School | 0 | 0.0% |
| College / Undergraduate | 75 | 45.7% |
| Graduate / Professional | 0 | 0.0% |
| Total | 164 | 100.0% |
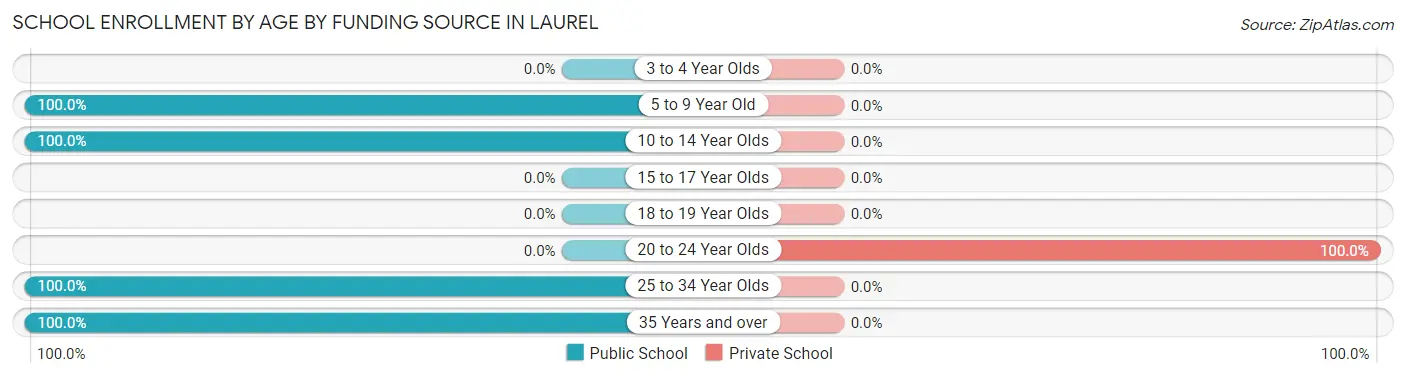
School Enrollment by Age by Funding Source in Laurel
Out of a total of 164 students who are enrolled in schools in Laurel, 25 (15.2%) attend a private institution, while the remaining 139 (84.8%) are enrolled in public schools. The age group of 20 to 24 year olds has the highest likelihood of being enrolled in private schools, with 25 (100.0% in the age bracket) enrolled. Conversely, the age group of 5 to 9 year old has the lowest likelihood of being enrolled in a private school, with 28 (100.0% in the age bracket) attending a public institution.
| Age Bracket | Public School | Private School |
| 3 to 4 Year Olds | 0 (0.0%) | 0 (0.0%) |
| 5 to 9 Year Old | 28 (100.0%) | 0 (0.0%) |
| 10 to 14 Year Olds | 61 (100.0%) | 0 (0.0%) |
| 15 to 17 Year Olds | 0 (0.0%) | 0 (0.0%) |
| 18 to 19 Year Olds | 0 (0.0%) | 0 (0.0%) |
| 20 to 24 Year Olds | 0 (0.0%) | 25 (100.0%) |
| 25 to 34 Year Olds | 24 (100.0%) | 0 (0.0%) |
| 35 Years and over | 26 (100.0%) | 0 (0.0%) |
| Total | 139 (84.8%) | 25 (15.2%) |
Educational Attainment by Field of Study in Laurel
Education (88 | 20.1%), business (79 | 18.0%), visual & performing arts (67 | 15.3%), science & technology (54 | 12.3%), and liberal arts & history (30 | 6.9%) are the most common fields of study among 438 individuals in Laurel who have obtained a bachelor's degree or higher.
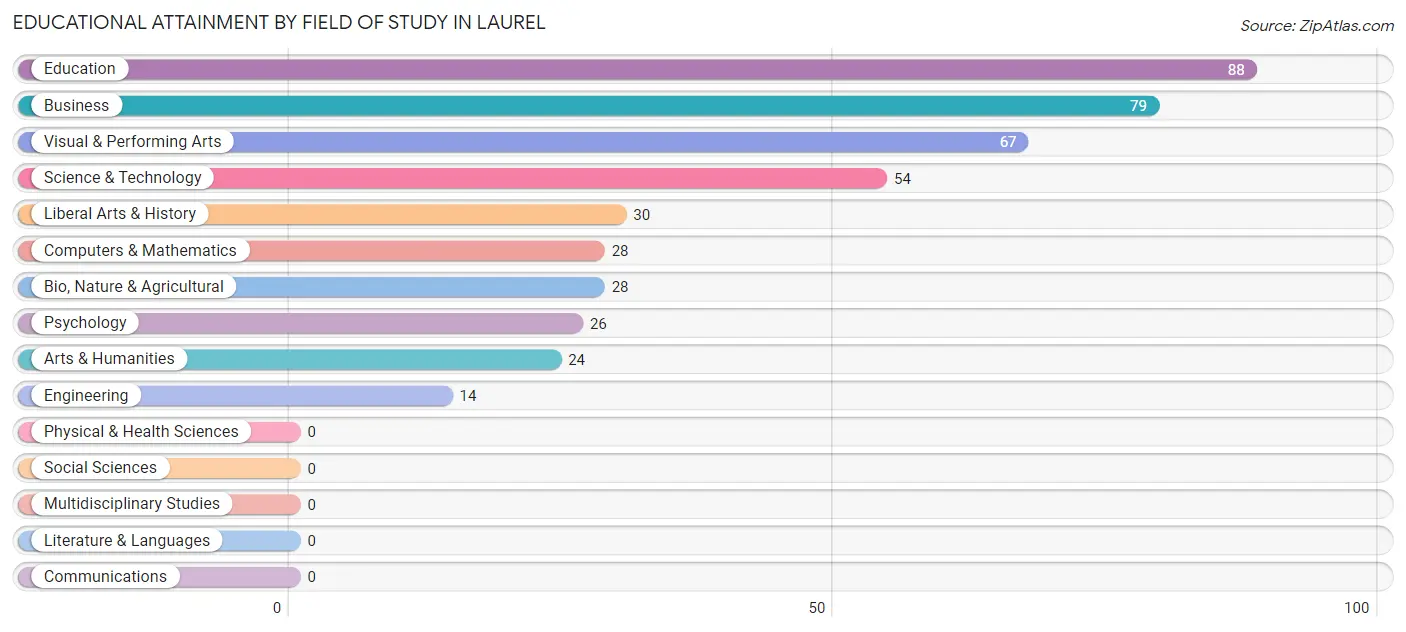
| Field of Study | # Graduates | % Graduates |
| Computers & Mathematics | 28 | 6.4% |
| Bio, Nature & Agricultural | 28 | 6.4% |
| Physical & Health Sciences | 0 | 0.0% |
| Psychology | 26 | 5.9% |
| Social Sciences | 0 | 0.0% |
| Engineering | 14 | 3.2% |
| Multidisciplinary Studies | 0 | 0.0% |
| Science & Technology | 54 | 12.3% |
| Business | 79 | 18.0% |
| Education | 88 | 20.1% |
| Literature & Languages | 0 | 0.0% |
| Liberal Arts & History | 30 | 6.9% |
| Visual & Performing Arts | 67 | 15.3% |
| Communications | 0 | 0.0% |
| Arts & Humanities | 24 | 5.5% |
| Total | 438 | 100.0% |
Transportation & Commute in Laurel
Vehicle Availability by Sex in Laurel
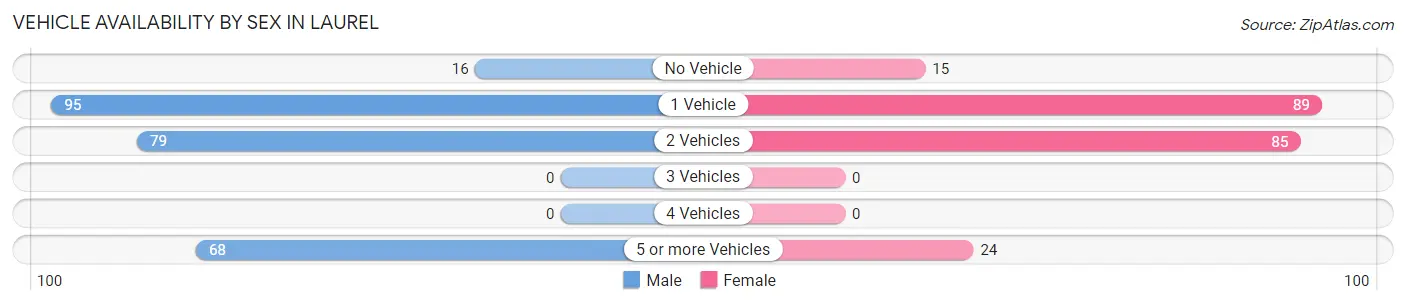
The most prevalent vehicle ownership categories in Laurel are males with 1 vehicle (95, accounting for 36.8%) and females with 1 vehicle (89, making up 44.6%).
| Vehicles Available | Male | Female |
| No Vehicle | 16 (6.2%) | 15 (7.0%) |
| 1 Vehicle | 95 (36.8%) | 89 (41.8%) |
| 2 Vehicles | 79 (30.6%) | 85 (39.9%) |
| 3 Vehicles | 0 (0.0%) | 0 (0.0%) |
| 4 Vehicles | 0 (0.0%) | 0 (0.0%) |
| 5 or more Vehicles | 68 (26.4%) | 24 (11.3%) |
| Total | 258 (100.0%) | 213 (100.0%) |
Commute Time in Laurel
The most frequently occuring commute durations in Laurel are 20 to 24 minutes (146 commuters, 39.3%), 40 to 44 minutes (77 commuters, 20.7%), and 60 to 89 minutes (56 commuters, 15.0%).
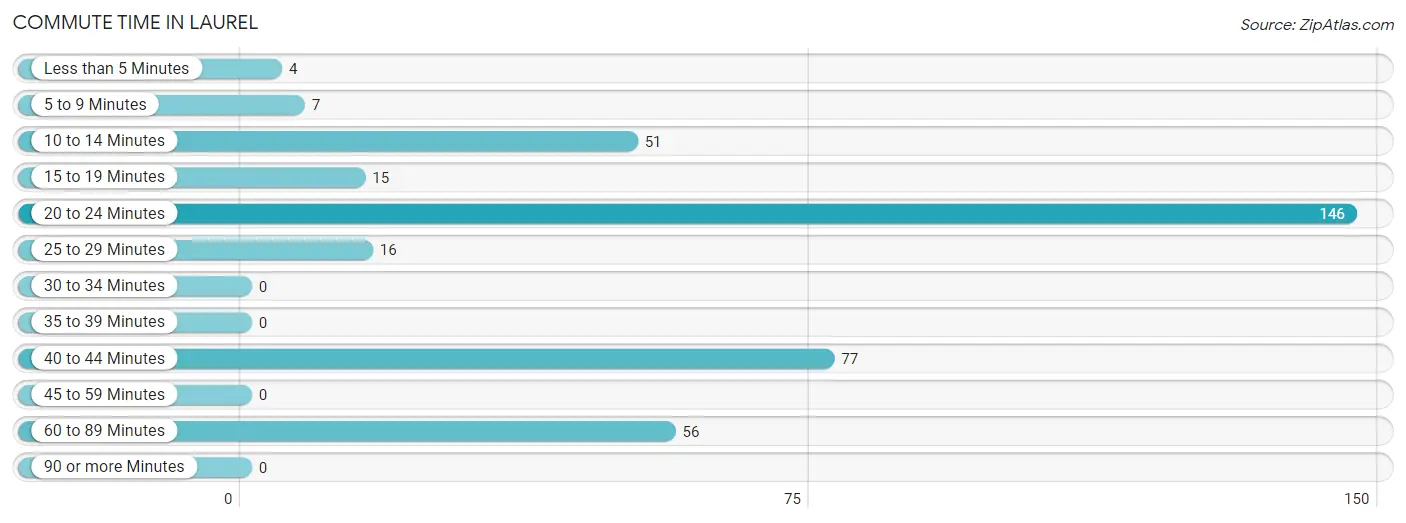
| Commute Time | # Commuters | % Commuters |
| Less than 5 Minutes | 4 | 1.1% |
| 5 to 9 Minutes | 7 | 1.9% |
| 10 to 14 Minutes | 51 | 13.7% |
| 15 to 19 Minutes | 15 | 4.0% |
| 20 to 24 Minutes | 146 | 39.3% |
| 25 to 29 Minutes | 16 | 4.3% |
| 30 to 34 Minutes | 0 | 0.0% |
| 35 to 39 Minutes | 0 | 0.0% |
| 40 to 44 Minutes | 77 | 20.7% |
| 45 to 59 Minutes | 0 | 0.0% |
| 60 to 89 Minutes | 56 | 15.0% |
| 90 or more Minutes | 0 | 0.0% |
Commute Time by Sex in Laurel
The most common commute times in Laurel are 40 to 44 minutes (77 commuters, 43.8%) for males and 20 to 24 minutes (146 commuters, 74.5%) for females.
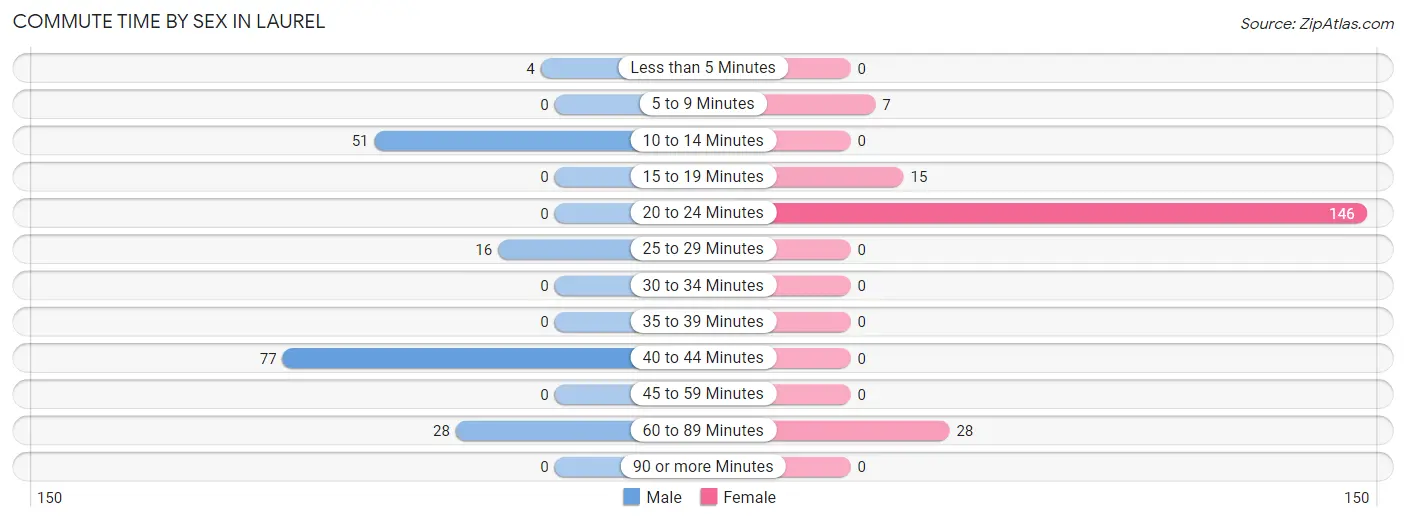
| Commute Time | Male | Female |
| Less than 5 Minutes | 4 (2.3%) | 0 (0.0%) |
| 5 to 9 Minutes | 0 (0.0%) | 7 (3.6%) |
| 10 to 14 Minutes | 51 (29.0%) | 0 (0.0%) |
| 15 to 19 Minutes | 0 (0.0%) | 15 (7.6%) |
| 20 to 24 Minutes | 0 (0.0%) | 146 (74.5%) |
| 25 to 29 Minutes | 16 (9.1%) | 0 (0.0%) |
| 30 to 34 Minutes | 0 (0.0%) | 0 (0.0%) |
| 35 to 39 Minutes | 0 (0.0%) | 0 (0.0%) |
| 40 to 44 Minutes | 77 (43.8%) | 0 (0.0%) |
| 45 to 59 Minutes | 0 (0.0%) | 0 (0.0%) |
| 60 to 89 Minutes | 28 (15.9%) | 28 (14.3%) |
| 90 or more Minutes | 0 (0.0%) | 0 (0.0%) |
Time of Departure to Work by Sex in Laurel
The most frequent times of departure to work in Laurel are 4:00 PM to 11:59 PM (68, 38.6%) for males and 5:30 AM to 5:59 AM (89, 45.4%) for females.
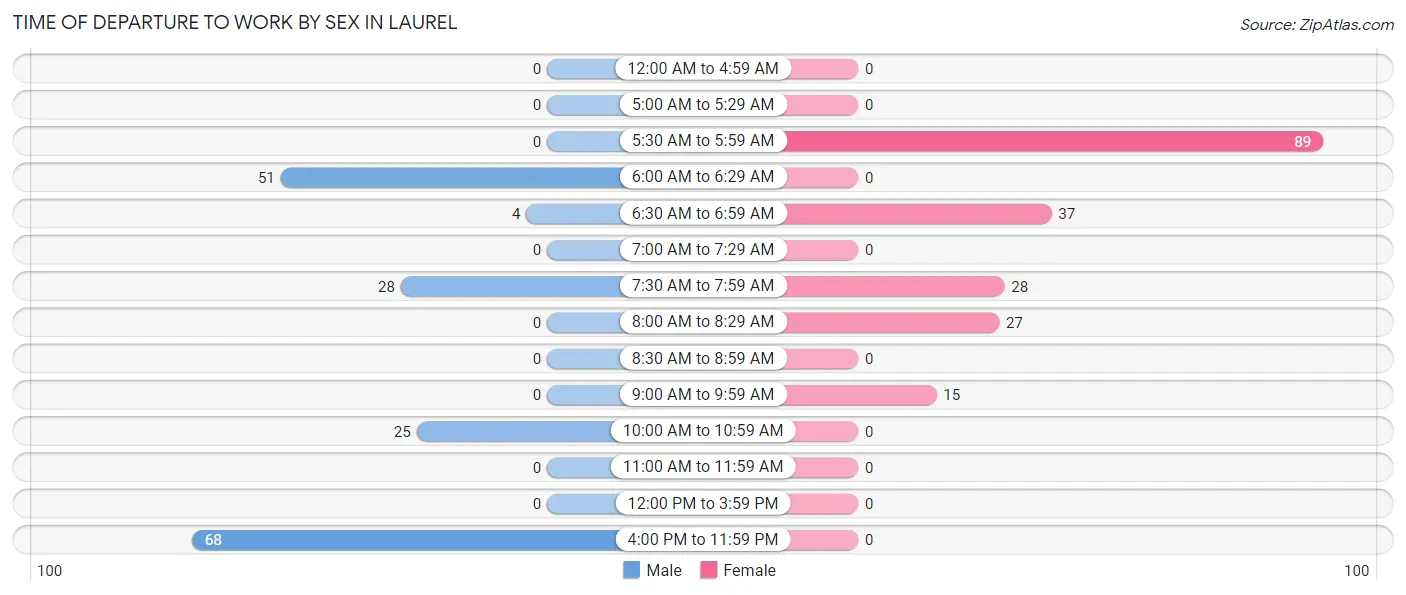
| Time of Departure | Male | Female |
| 12:00 AM to 4:59 AM | 0 (0.0%) | 0 (0.0%) |
| 5:00 AM to 5:29 AM | 0 (0.0%) | 0 (0.0%) |
| 5:30 AM to 5:59 AM | 0 (0.0%) | 89 (45.4%) |
| 6:00 AM to 6:29 AM | 51 (29.0%) | 0 (0.0%) |
| 6:30 AM to 6:59 AM | 4 (2.3%) | 37 (18.9%) |
| 7:00 AM to 7:29 AM | 0 (0.0%) | 0 (0.0%) |
| 7:30 AM to 7:59 AM | 28 (15.9%) | 28 (14.3%) |
| 8:00 AM to 8:29 AM | 0 (0.0%) | 27 (13.8%) |
| 8:30 AM to 8:59 AM | 0 (0.0%) | 0 (0.0%) |
| 9:00 AM to 9:59 AM | 0 (0.0%) | 15 (7.6%) |
| 10:00 AM to 10:59 AM | 25 (14.2%) | 0 (0.0%) |
| 11:00 AM to 11:59 AM | 0 (0.0%) | 0 (0.0%) |
| 12:00 PM to 3:59 PM | 0 (0.0%) | 0 (0.0%) |
| 4:00 PM to 11:59 PM | 68 (38.6%) | 0 (0.0%) |
| Total | 176 (100.0%) | 196 (100.0%) |
Housing Occupancy in Laurel
Occupancy by Ownership in Laurel
Of the total 457 dwellings in Laurel, owner-occupied units account for 399 (87.3%), while renter-occupied units make up 58 (12.7%).
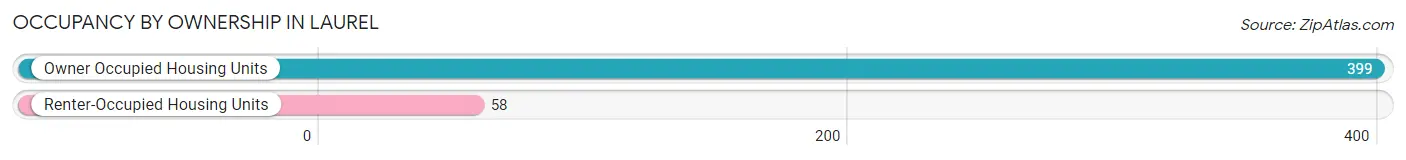
| Occupancy | # Housing Units | % Housing Units |
| Owner Occupied Housing Units | 399 | 87.3% |
| Renter-Occupied Housing Units | 58 | 12.7% |
| Total Occupied Housing Units | 457 | 100.0% |
Occupancy by Household Size in Laurel
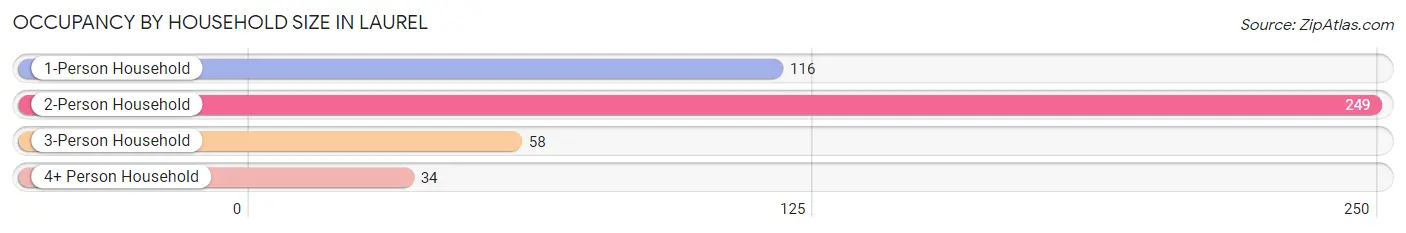
| Household Size | # Housing Units | % Housing Units |
| 1-Person Household | 116 | 25.4% |
| 2-Person Household | 249 | 54.5% |
| 3-Person Household | 58 | 12.7% |
| 4+ Person Household | 34 | 7.4% |
| Total Housing Units | 457 | 100.0% |
Occupancy by Ownership by Household Size in Laurel
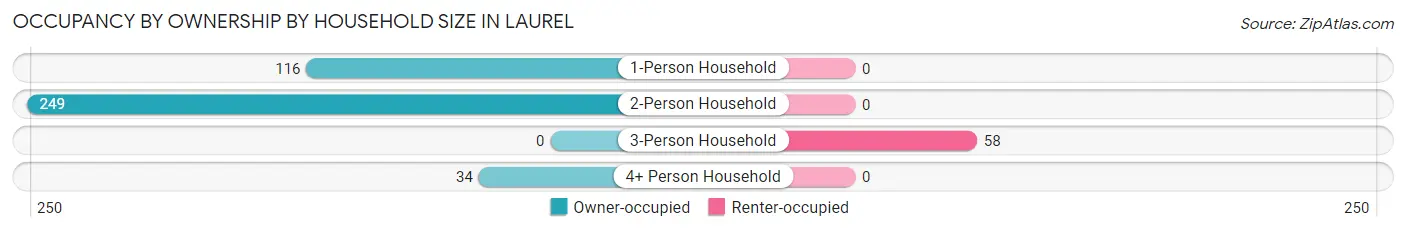
| Household Size | Owner-occupied | Renter-occupied |
| 1-Person Household | 116 (100.0%) | 0 (0.0%) |
| 2-Person Household | 249 (100.0%) | 0 (0.0%) |
| 3-Person Household | 0 (0.0%) | 58 (100.0%) |
| 4+ Person Household | 34 (100.0%) | 0 (0.0%) |
| Total Housing Units | 399 (87.3%) | 58 (12.7%) |
Occupancy by Educational Attainment in Laurel
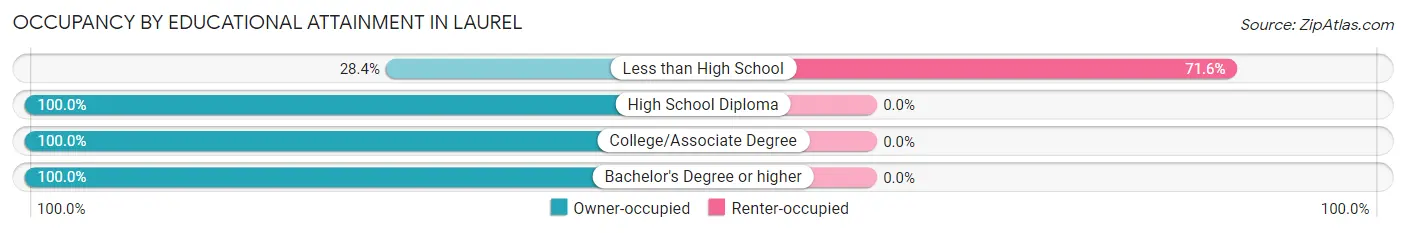
| Household Size | Owner-occupied | Renter-occupied |
| Less than High School | 23 (28.4%) | 58 (71.6%) |
| High School Diploma | 121 (100.0%) | 0 (0.0%) |
| College/Associate Degree | 58 (100.0%) | 0 (0.0%) |
| Bachelor's Degree or higher | 197 (100.0%) | 0 (0.0%) |
Occupancy by Age of Householder in Laurel
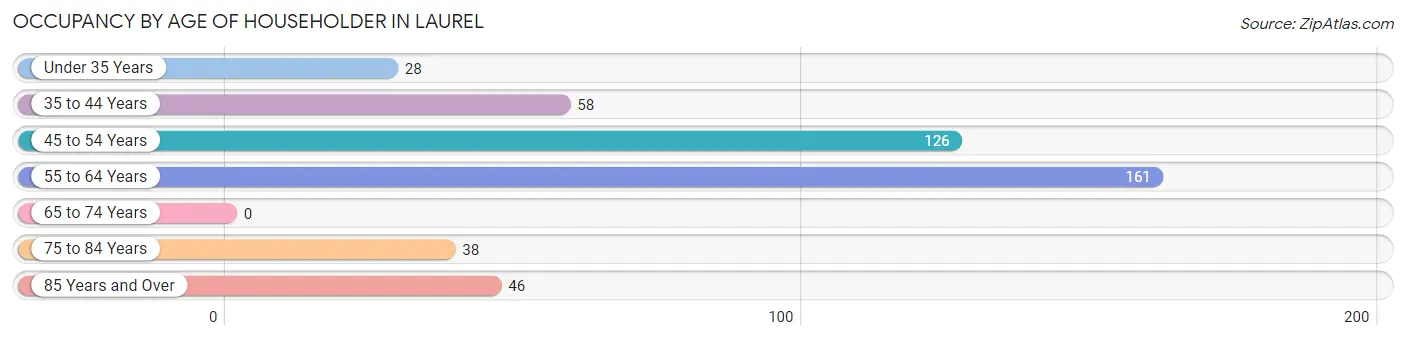
| Age Bracket | # Households | % Households |
| Under 35 Years | 28 | 6.1% |
| 35 to 44 Years | 58 | 12.7% |
| 45 to 54 Years | 126 | 27.6% |
| 55 to 64 Years | 161 | 35.2% |
| 65 to 74 Years | 0 | 0.0% |
| 75 to 84 Years | 38 | 8.3% |
| 85 Years and Over | 46 | 10.1% |
| Total | 457 | 100.0% |
Housing Finances in Laurel
Median Income by Occupancy in Laurel
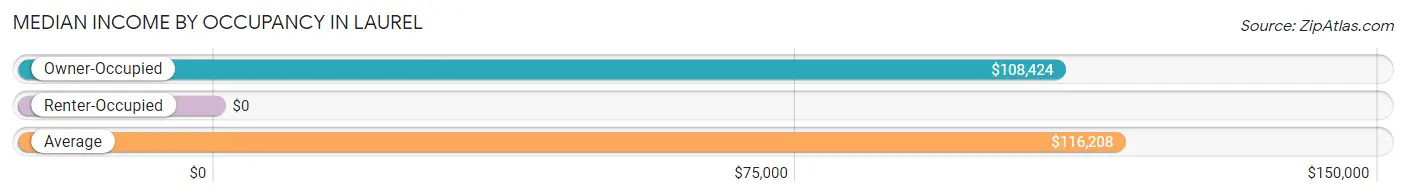
| Occupancy Type | # Households | Median Income |
| Owner-Occupied | 399 (87.3%) | $108,424 |
| Renter-Occupied | 58 (12.7%) | $0 |
| Average | 457 (100.0%) | $116,208 |
Occupancy by Householder Income Bracket in Laurel
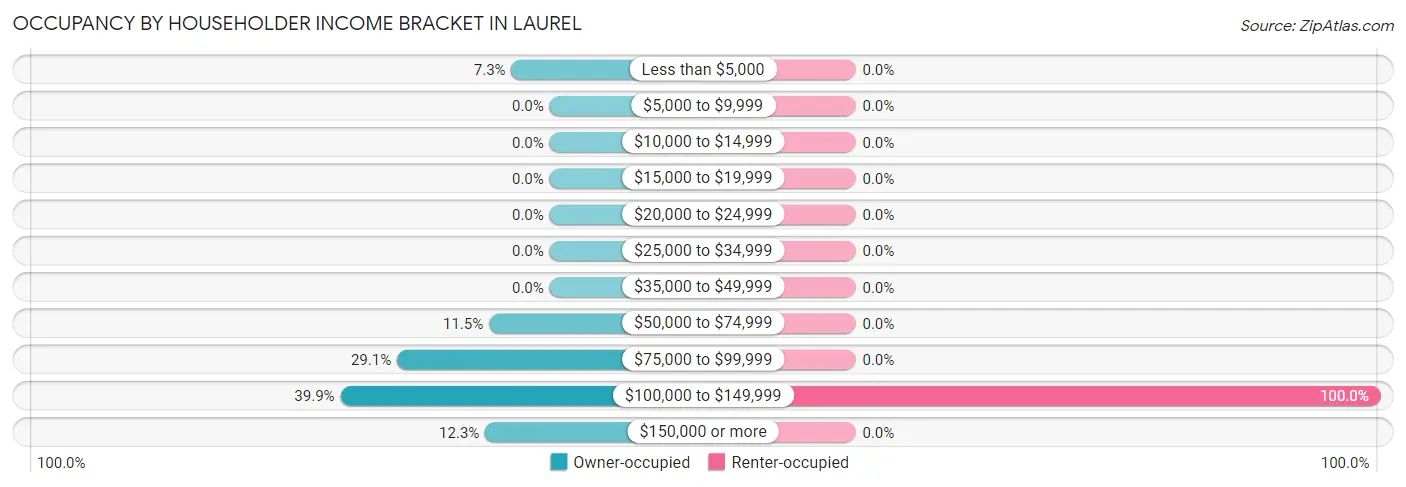
| Income Bracket | Owner-occupied | Renter-occupied |
| Less than $5,000 | 29 (7.3%) | 0 (0.0%) |
| $5,000 to $9,999 | 0 (0.0%) | 0 (0.0%) |
| $10,000 to $14,999 | 0 (0.0%) | 0 (0.0%) |
| $15,000 to $19,999 | 0 (0.0%) | 0 (0.0%) |
| $20,000 to $24,999 | 0 (0.0%) | 0 (0.0%) |
| $25,000 to $34,999 | 0 (0.0%) | 0 (0.0%) |
| $35,000 to $49,999 | 0 (0.0%) | 0 (0.0%) |
| $50,000 to $74,999 | 46 (11.5%) | 0 (0.0%) |
| $75,000 to $99,999 | 116 (29.1%) | 0 (0.0%) |
| $100,000 to $149,999 | 159 (39.9%) | 58 (100.0%) |
| $150,000 or more | 49 (12.3%) | 0 (0.0%) |
| Total | 399 (100.0%) | 58 (100.0%) |
Monthly Housing Cost Tiers in Laurel
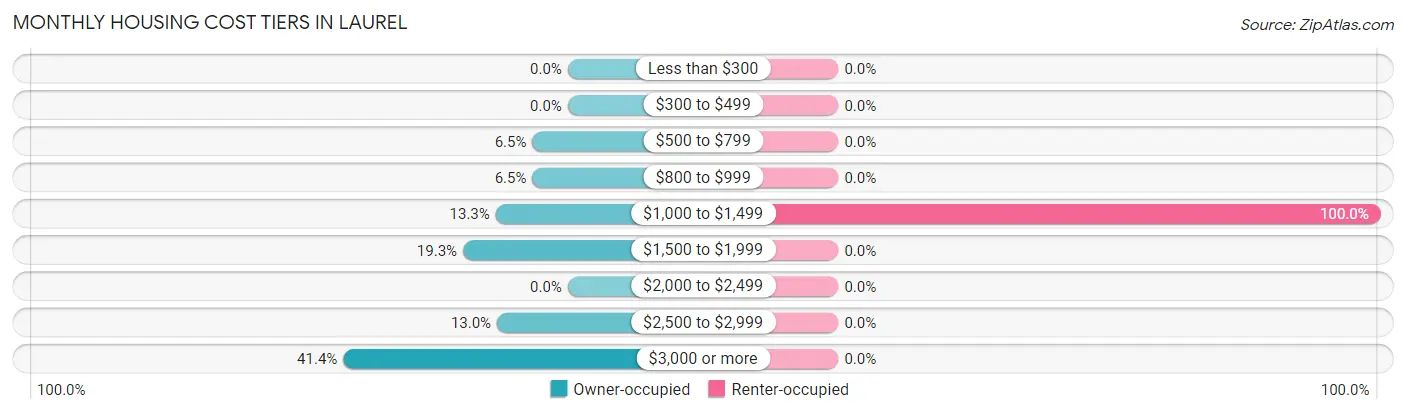
| Monthly Cost | Owner-occupied | Renter-occupied |
| Less than $300 | 0 (0.0%) | 0 (0.0%) |
| $300 to $499 | 0 (0.0%) | 0 (0.0%) |
| $500 to $799 | 26 (6.5%) | 0 (0.0%) |
| $800 to $999 | 26 (6.5%) | 0 (0.0%) |
| $1,000 to $1,499 | 53 (13.3%) | 58 (100.0%) |
| $1,500 to $1,999 | 77 (19.3%) | 0 (0.0%) |
| $2,000 to $2,499 | 0 (0.0%) | 0 (0.0%) |
| $2,500 to $2,999 | 52 (13.0%) | 0 (0.0%) |
| $3,000 or more | 165 (41.3%) | 0 (0.0%) |
| Total | 399 (100.0%) | 58 (100.0%) |
Physical Housing Characteristics in Laurel
Housing Structures in Laurel
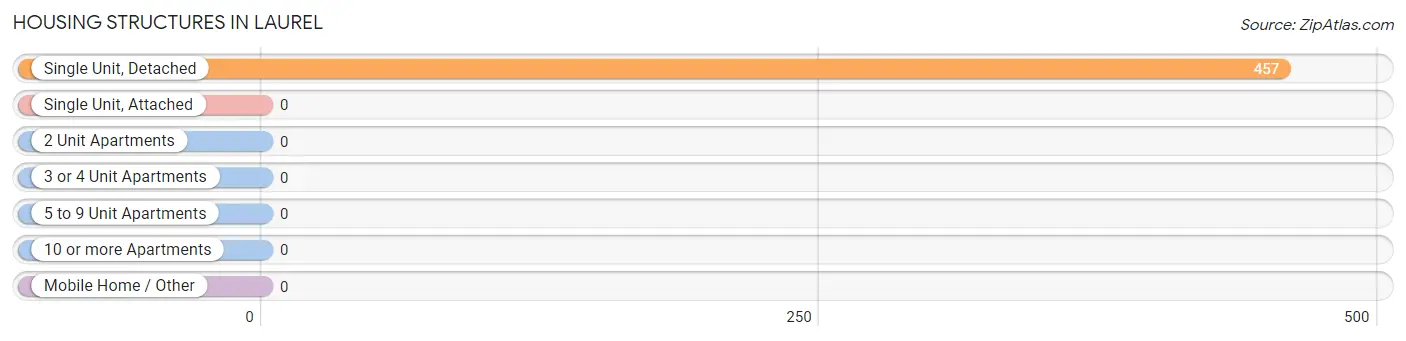
| Structure Type | # Housing Units | % Housing Units |
| Single Unit, Detached | 457 | 100.0% |
| Single Unit, Attached | 0 | 0.0% |
| 2 Unit Apartments | 0 | 0.0% |
| 3 or 4 Unit Apartments | 0 | 0.0% |
| 5 to 9 Unit Apartments | 0 | 0.0% |
| 10 or more Apartments | 0 | 0.0% |
| Mobile Home / Other | 0 | 0.0% |
| Total | 457 | 100.0% |
Housing Structures by Occupancy in Laurel
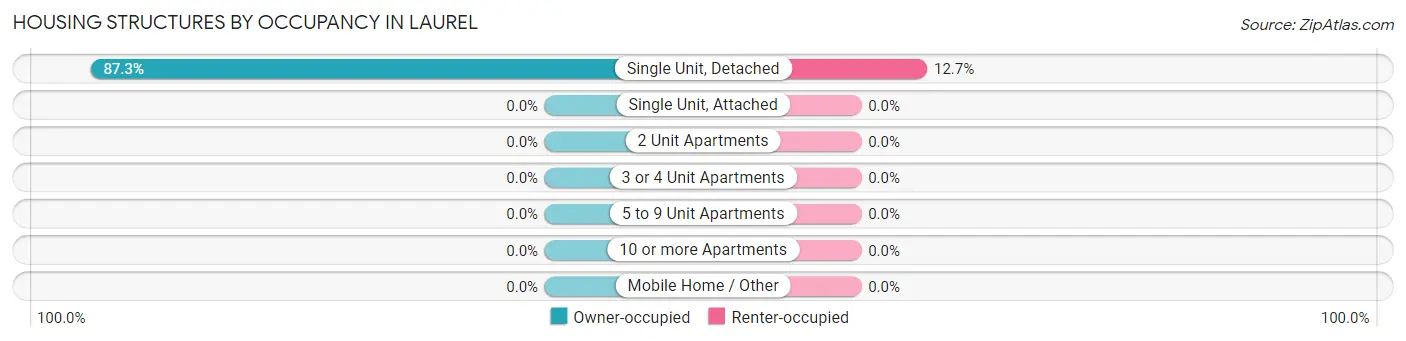
| Structure Type | Owner-occupied | Renter-occupied |
| Single Unit, Detached | 399 (87.3%) | 58 (12.7%) |
| Single Unit, Attached | 0 (0.0%) | 0 (0.0%) |
| 2 Unit Apartments | 0 (0.0%) | 0 (0.0%) |
| 3 or 4 Unit Apartments | 0 (0.0%) | 0 (0.0%) |
| 5 to 9 Unit Apartments | 0 (0.0%) | 0 (0.0%) |
| 10 or more Apartments | 0 (0.0%) | 0 (0.0%) |
| Mobile Home / Other | 0 (0.0%) | 0 (0.0%) |
| Total | 399 (87.3%) | 58 (12.7%) |
Housing Structures by Number of Rooms in Laurel
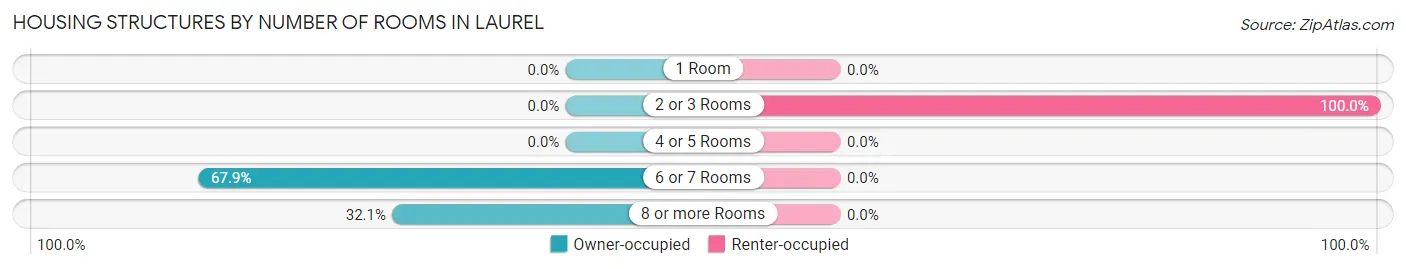
| Number of Rooms | Owner-occupied | Renter-occupied |
| 1 Room | 0 (0.0%) | 0 (0.0%) |
| 2 or 3 Rooms | 0 (0.0%) | 58 (100.0%) |
| 4 or 5 Rooms | 0 (0.0%) | 0 (0.0%) |
| 6 or 7 Rooms | 271 (67.9%) | 0 (0.0%) |
| 8 or more Rooms | 128 (32.1%) | 0 (0.0%) |
| Total | 399 (100.0%) | 58 (100.0%) |
Housing Structure by Heating Type in Laurel
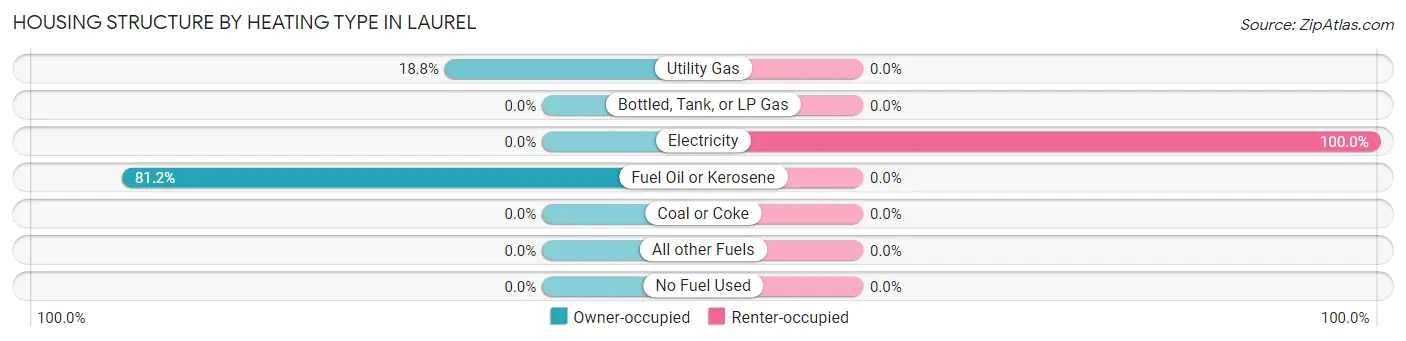
| Heating Type | Owner-occupied | Renter-occupied |
| Utility Gas | 75 (18.8%) | 0 (0.0%) |
| Bottled, Tank, or LP Gas | 0 (0.0%) | 0 (0.0%) |
| Electricity | 0 (0.0%) | 58 (100.0%) |
| Fuel Oil or Kerosene | 324 (81.2%) | 0 (0.0%) |
| Coal or Coke | 0 (0.0%) | 0 (0.0%) |
| All other Fuels | 0 (0.0%) | 0 (0.0%) |
| No Fuel Used | 0 (0.0%) | 0 (0.0%) |
| Total | 399 (100.0%) | 58 (100.0%) |
Household Vehicle Usage in Laurel
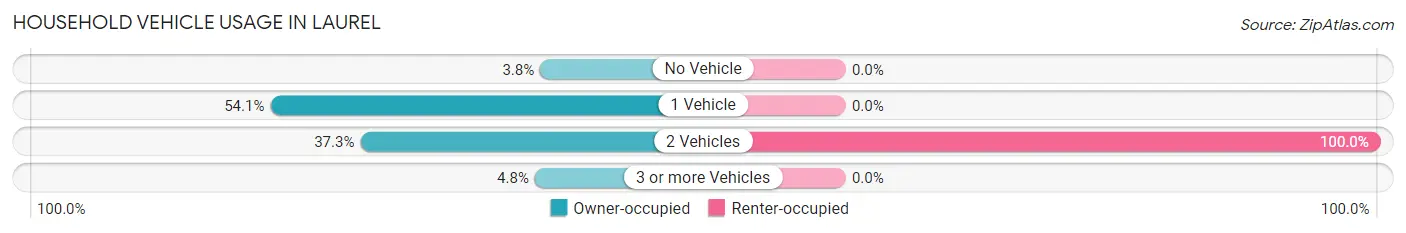
| Vehicles per Household | Owner-occupied | Renter-occupied |
| No Vehicle | 15 (3.8%) | 0 (0.0%) |
| 1 Vehicle | 216 (54.1%) | 0 (0.0%) |
| 2 Vehicles | 149 (37.3%) | 58 (100.0%) |
| 3 or more Vehicles | 19 (4.8%) | 0 (0.0%) |
| Total | 399 (100.0%) | 58 (100.0%) |
Real Estate & Mortgages in Laurel
Real Estate and Mortgage Overview in Laurel
| Characteristic | Without Mortgage | With Mortgage |
| Housing Units | 147 | 252 |
| Median Property Value | $820,700 | $670,800 |
| Median Household Income | $78,914 | $15 |
| Monthly Housing Costs | $1,057 | $165 |
| Real Estate Taxes | $8,079 | $0 |
Property Value by Mortgage Status in Laurel
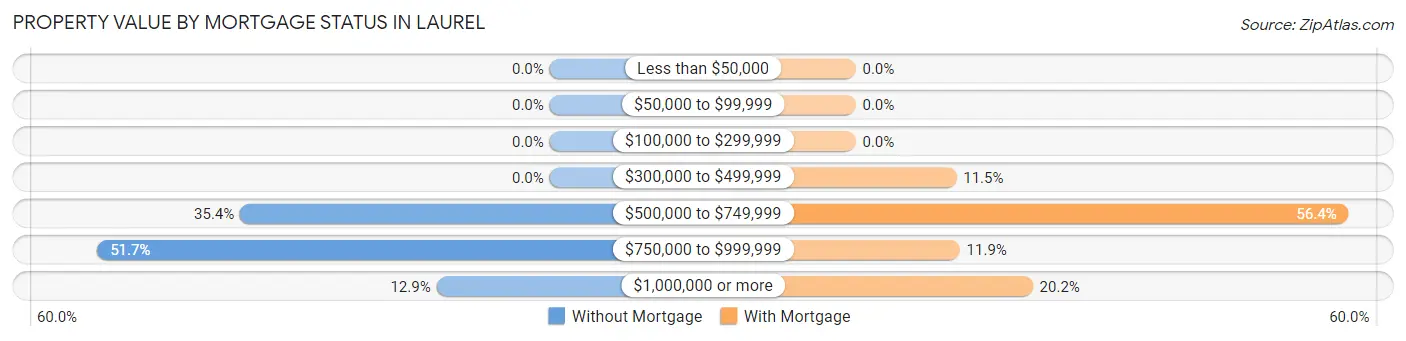
| Property Value | Without Mortgage | With Mortgage |
| Less than $50,000 | 0 (0.0%) | 0 (0.0%) |
| $50,000 to $99,999 | 0 (0.0%) | 0 (0.0%) |
| $100,000 to $299,999 | 0 (0.0%) | 0 (0.0%) |
| $300,000 to $499,999 | 0 (0.0%) | 29 (11.5%) |
| $500,000 to $749,999 | 52 (35.4%) | 142 (56.4%) |
| $750,000 to $999,999 | 76 (51.7%) | 30 (11.9%) |
| $1,000,000 or more | 19 (12.9%) | 51 (20.2%) |
| Total | 147 (100.0%) | 252 (100.0%) |
Household Income by Mortgage Status in Laurel
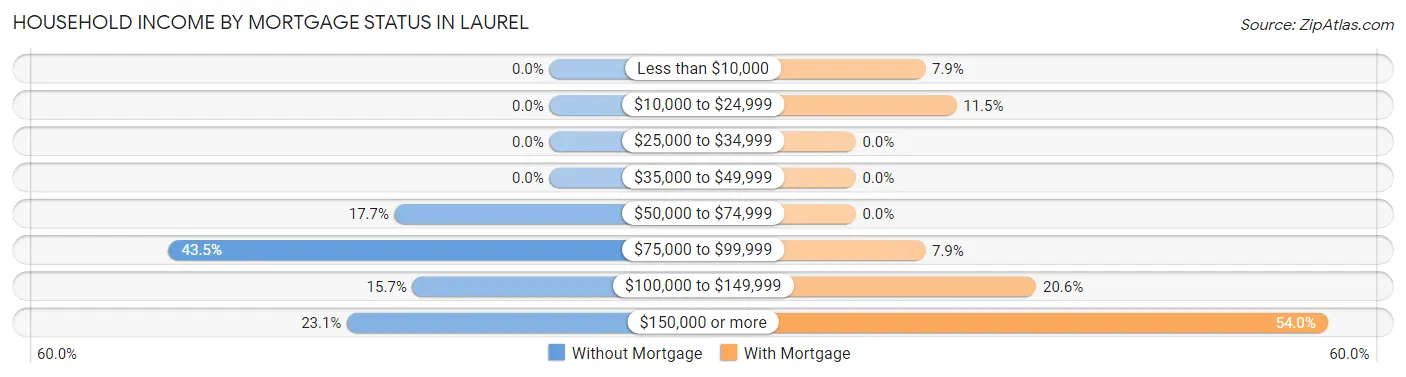
| Household Income | Without Mortgage | With Mortgage |
| Less than $10,000 | 0 (0.0%) | 20 (7.9%) |
| $10,000 to $24,999 | 0 (0.0%) | 29 (11.5%) |
| $25,000 to $34,999 | 0 (0.0%) | 0 (0.0%) |
| $35,000 to $49,999 | 0 (0.0%) | 0 (0.0%) |
| $50,000 to $74,999 | 26 (17.7%) | 0 (0.0%) |
| $75,000 to $99,999 | 64 (43.5%) | 20 (7.9%) |
| $100,000 to $149,999 | 23 (15.7%) | 52 (20.6%) |
| $150,000 or more | 34 (23.1%) | 136 (54.0%) |
| Total | 147 (100.0%) | 252 (100.0%) |
Property Value to Household Income Ratio in Laurel
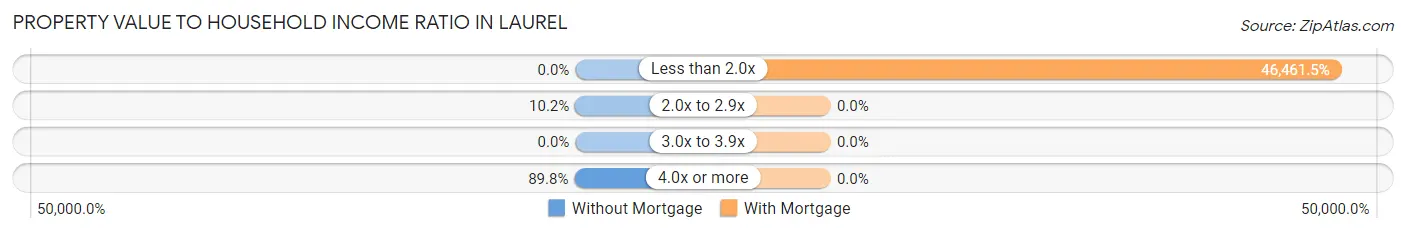
| Value-to-Income Ratio | Without Mortgage | With Mortgage |
| Less than 2.0x | 0 (0.0%) | 117,083 (46,461.5%) |
| 2.0x to 2.9x | 15 (10.2%) | 0 (0.0%) |
| 3.0x to 3.9x | 0 (0.0%) | 0 (0.0%) |
| 4.0x or more | 132 (89.8%) | 0 (0.0%) |
| Total | 147 (100.0%) | 252 (100.0%) |
Real Estate Taxes by Mortgage Status in Laurel
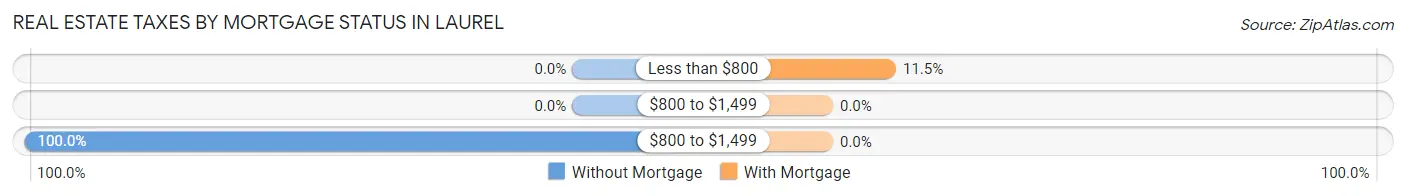
| Property Taxes | Without Mortgage | With Mortgage |
| Less than $800 | 0 (0.0%) | 29 (11.5%) |
| $800 to $1,499 | 0 (0.0%) | 0 (0.0%) |
| $800 to $1,499 | 147 (100.0%) | 0 (0.0%) |
| Total | 147 (100.0%) | 252 (100.0%) |
Health & Disability in Laurel
Health Insurance Coverage by Age in Laurel
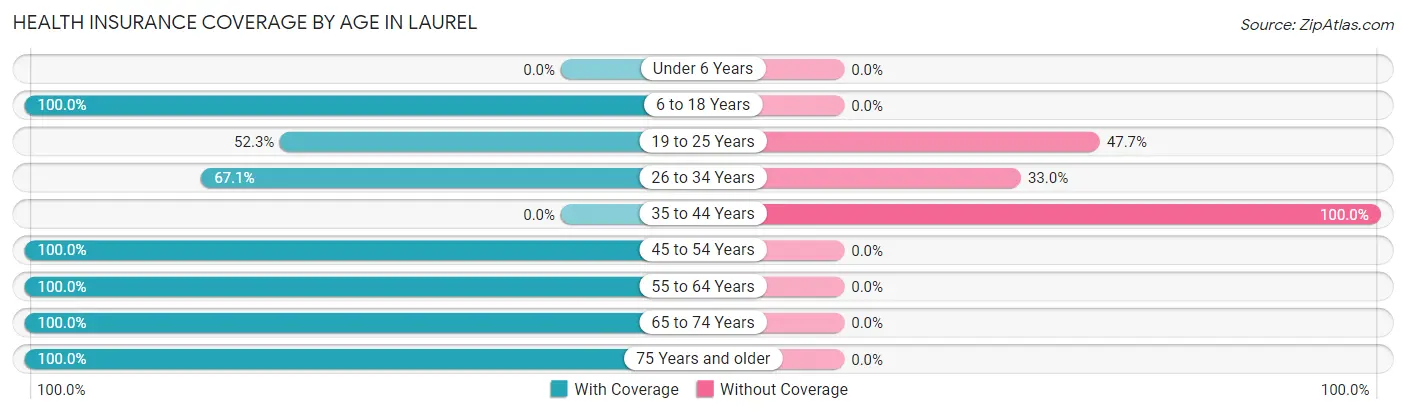
| Age Bracket | With Coverage | Without Coverage |
| Under 6 Years | 0 (0.0%) | 0 (0.0%) |
| 6 to 18 Years | 89 (100.0%) | 0 (0.0%) |
| 19 to 25 Years | 56 (52.3%) | 51 (47.7%) |
| 26 to 34 Years | 59 (67.0%) | 29 (33.0%) |
| 35 to 44 Years | 0 (0.0%) | 126 (100.0%) |
| 45 to 54 Years | 142 (100.0%) | 0 (0.0%) |
| 55 to 64 Years | 257 (100.0%) | 0 (0.0%) |
| 65 to 74 Years | 26 (100.0%) | 0 (0.0%) |
| 75 Years and older | 145 (100.0%) | 0 (0.0%) |
| Total | 774 (79.0%) | 206 (21.0%) |
Health Insurance Coverage by Citizenship Status in Laurel
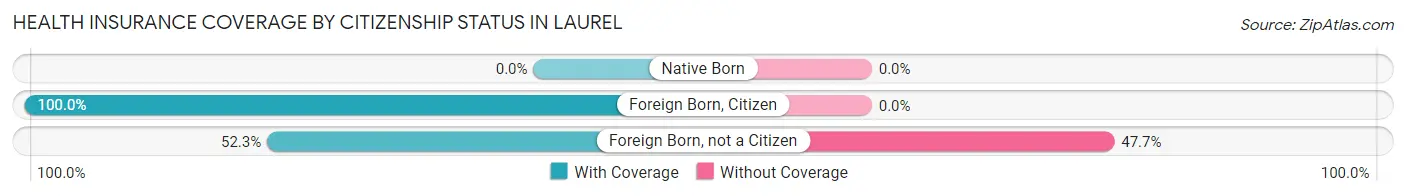
| Citizenship Status | With Coverage | Without Coverage |
| Native Born | 0 (0.0%) | 0 (0.0%) |
| Foreign Born, Citizen | 89 (100.0%) | 0 (0.0%) |
| Foreign Born, not a Citizen | 56 (52.3%) | 51 (47.7%) |
Health Insurance Coverage by Household Income in Laurel
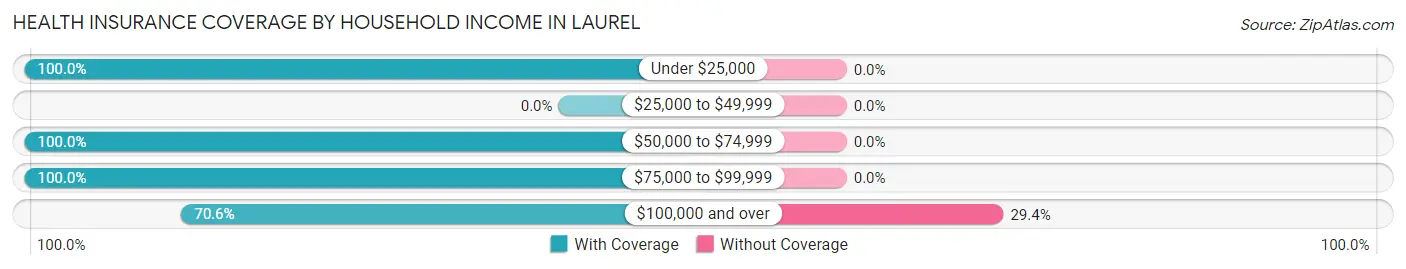
| Household Income | With Coverage | Without Coverage |
| Under $25,000 | 57 (100.0%) | 0 (0.0%) |
| $25,000 to $49,999 | 0 (0.0%) | 0 (0.0%) |
| $50,000 to $74,999 | 68 (100.0%) | 0 (0.0%) |
| $75,000 to $99,999 | 142 (100.0%) | 0 (0.0%) |
| $100,000 and over | 486 (70.6%) | 202 (29.4%) |
Public vs Private Health Insurance Coverage by Age in Laurel
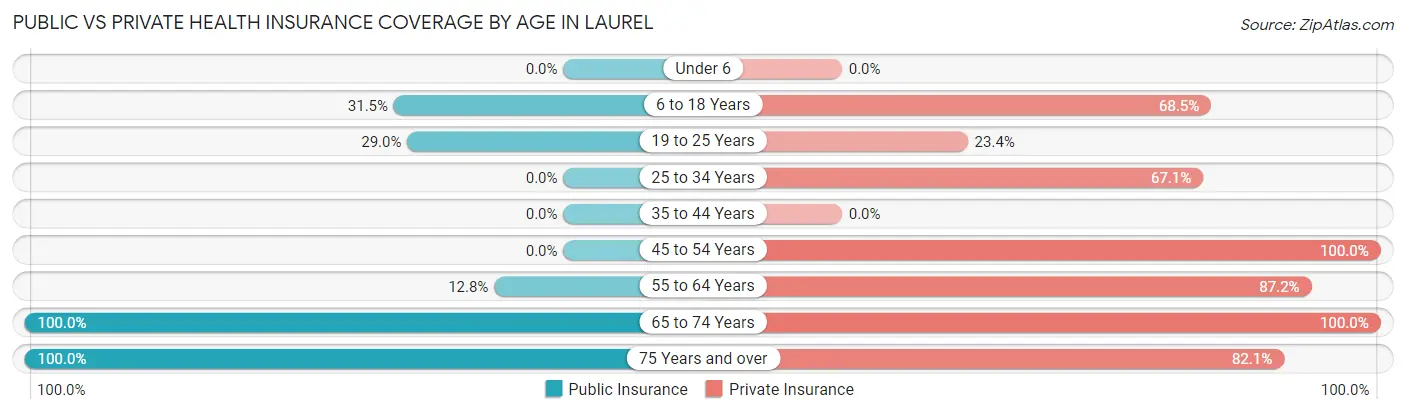
| Age Bracket | Public Insurance | Private Insurance |
| Under 6 | 0 (0.0%) | 0 (0.0%) |
| 6 to 18 Years | 28 (31.5%) | 61 (68.5%) |
| 19 to 25 Years | 31 (29.0%) | 25 (23.4%) |
| 25 to 34 Years | 0 (0.0%) | 59 (67.0%) |
| 35 to 44 Years | 0 (0.0%) | 0 (0.0%) |
| 45 to 54 Years | 0 (0.0%) | 142 (100.0%) |
| 55 to 64 Years | 33 (12.8%) | 224 (87.2%) |
| 65 to 74 Years | 26 (100.0%) | 26 (100.0%) |
| 75 Years and over | 145 (100.0%) | 119 (82.1%) |
| Total | 263 (26.8%) | 656 (66.9%) |
Disability Status by Sex by Age in Laurel
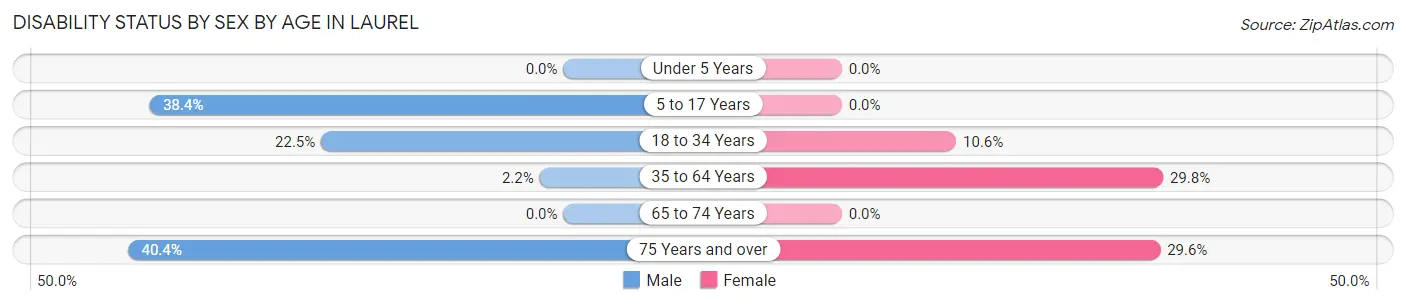
| Age Bracket | Male | Female |
| Under 5 Years | 0 (0.0%) | 0 (0.0%) |
| 5 to 17 Years | 28 (38.4%) | 0 (0.0%) |
| 18 to 34 Years | 29 (22.5%) | 7 (10.6%) |
| 35 to 64 Years | 7 (2.2%) | 62 (29.8%) |
| 65 to 74 Years | 0 (0.0%) | 0 (0.0%) |
| 75 Years and over | 23 (40.4%) | 26 (29.5%) |
Disability Class by Sex by Age in Laurel
Disability Class: Hearing Difficulty

| Age Bracket | Male | Female |
| Under 5 Years | 0 (0.0%) | 0 (0.0%) |
| 5 to 17 Years | 0 (0.0%) | 0 (0.0%) |
| 18 to 34 Years | 0 (0.0%) | 7 (10.6%) |
| 35 to 64 Years | 0 (0.0%) | 29 (13.9%) |
| 65 to 74 Years | 0 (0.0%) | 0 (0.0%) |
| 75 Years and over | 0 (0.0%) | 0 (0.0%) |
Disability Class: Vision Difficulty
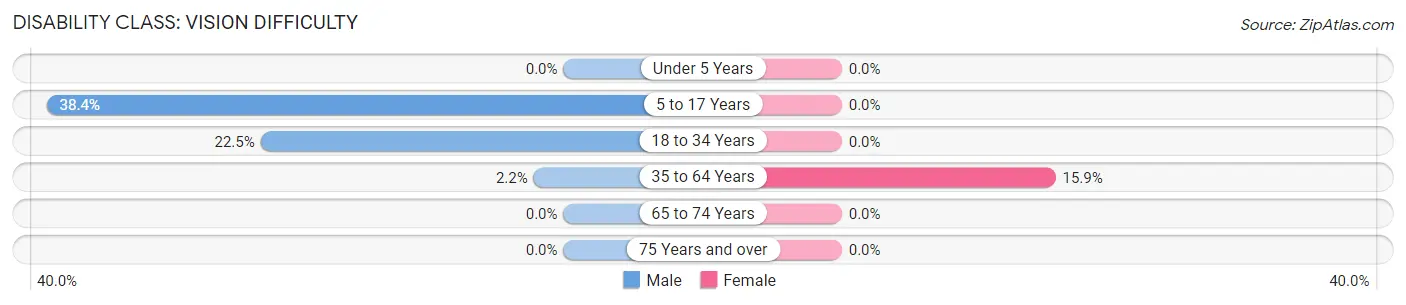
| Age Bracket | Male | Female |
| Under 5 Years | 0 (0.0%) | 0 (0.0%) |
| 5 to 17 Years | 28 (38.4%) | 0 (0.0%) |
| 18 to 34 Years | 29 (22.5%) | 0 (0.0%) |
| 35 to 64 Years | 7 (2.2%) | 33 (15.9%) |
| 65 to 74 Years | 0 (0.0%) | 0 (0.0%) |
| 75 Years and over | 0 (0.0%) | 0 (0.0%) |
Disability Class: Cognitive Difficulty
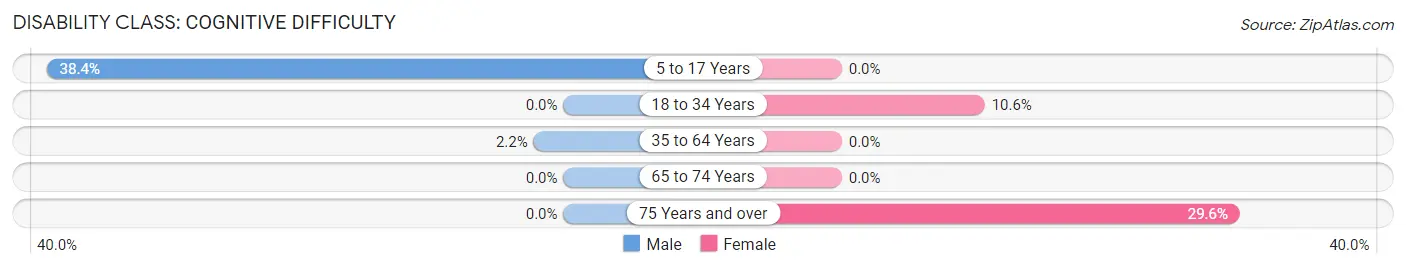
| Age Bracket | Male | Female |
| 5 to 17 Years | 28 (38.4%) | 0 (0.0%) |
| 18 to 34 Years | 0 (0.0%) | 7 (10.6%) |
| 35 to 64 Years | 7 (2.2%) | 0 (0.0%) |
| 65 to 74 Years | 0 (0.0%) | 0 (0.0%) |
| 75 Years and over | 0 (0.0%) | 26 (29.5%) |
Disability Class: Ambulatory Difficulty
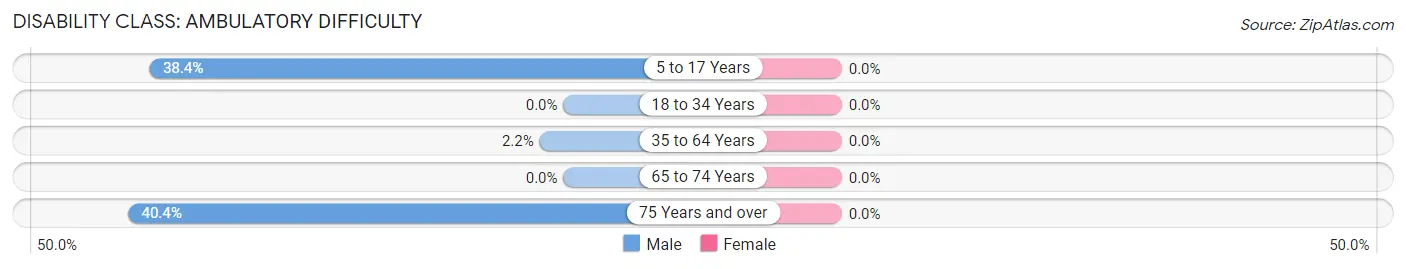
| Age Bracket | Male | Female |
| 5 to 17 Years | 28 (38.4%) | 0 (0.0%) |
| 18 to 34 Years | 0 (0.0%) | 0 (0.0%) |
| 35 to 64 Years | 7 (2.2%) | 0 (0.0%) |
| 65 to 74 Years | 0 (0.0%) | 0 (0.0%) |
| 75 Years and over | 23 (40.4%) | 0 (0.0%) |
Disability Class: Self-Care Difficulty
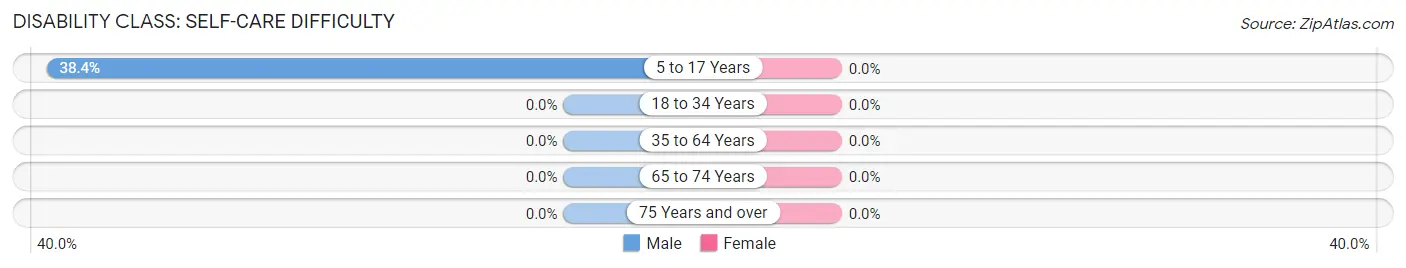
| Age Bracket | Male | Female |
| 5 to 17 Years | 28 (38.4%) | 0 (0.0%) |
| 18 to 34 Years | 0 (0.0%) | 0 (0.0%) |
| 35 to 64 Years | 0 (0.0%) | 0 (0.0%) |
| 65 to 74 Years | 0 (0.0%) | 0 (0.0%) |
| 75 Years and over | 0 (0.0%) | 0 (0.0%) |
Technology Access in Laurel
Computing Device Access in Laurel
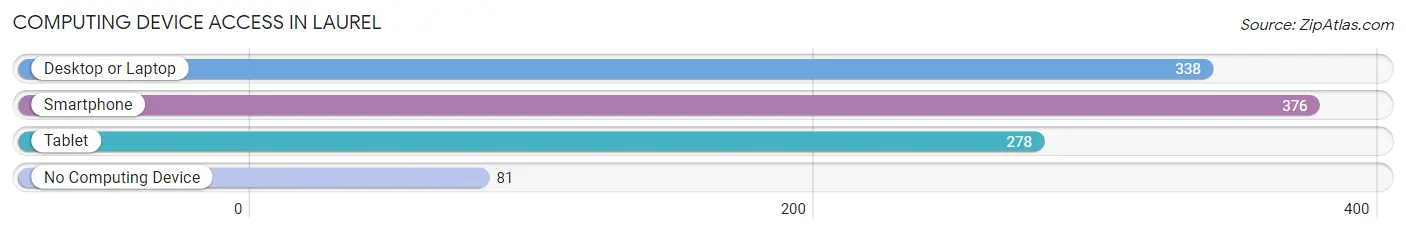
| Device Type | # Households | % Households |
| Desktop or Laptop | 338 | 74.0% |
| Smartphone | 376 | 82.3% |
| Tablet | 278 | 60.8% |
| No Computing Device | 81 | 17.7% |
| Total | 457 | 100.0% |
Internet Access in Laurel
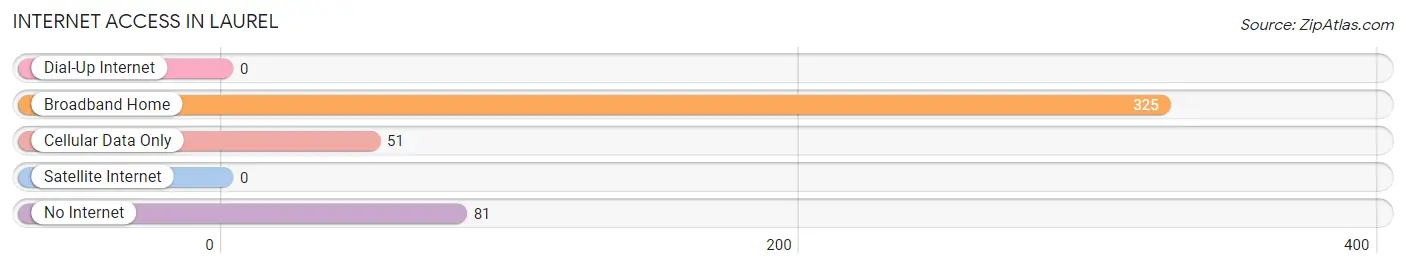
| Internet Type | # Households | % Households |
| Dial-Up Internet | 0 | 0.0% |
| Broadband Home | 325 | 71.1% |
| Cellular Data Only | 51 | 11.2% |
| Satellite Internet | 0 | 0.0% |
| No Internet | 81 | 17.7% |
| Total | 457 | 100.0% |
Laurel Summary
Laurel is a hamlet located in the Town of Brookhaven in Suffolk County, New York. It is situated on the north shore of Long Island, approximately 60 miles east of New York City. The hamlet is bordered by the hamlets of Middle Island to the west, Coram to the north, and East Patchogue to the east.
History
The area that is now Laurel was originally inhabited by the Setalcott Indians, a branch of the Algonquin tribe. The first European settlers arrived in the area in the late 1600s, and the hamlet was officially established in 1750. The hamlet was named after the laurel trees that grew in abundance in the area.
In the late 1800s, Laurel was a popular summer resort destination for wealthy New Yorkers. The area was known for its beautiful beaches, and many of the original summer homes still stand today.
In the early 1900s, Laurel began to experience a population boom as more and more people moved to the area. This growth was largely due to the development of the Long Island Rail Road, which made it easier for people to commute to New York City.
Geography
Laurel is located on the north shore of Long Island, approximately 60 miles east of New York City. The hamlet is bordered by the hamlets of Middle Island to the west, Coram to the north, and East Patchogue to the east.
The terrain of Laurel is mostly flat, with some rolling hills. The area is known for its beautiful beaches, which are popular with locals and tourists alike.
Economy
The economy of Laurel is largely based on tourism and retail. The hamlet is home to several popular restaurants, bars, and shops, as well as a few small businesses.
The area is also home to several large employers, including Brookhaven National Laboratory, Stony Brook University, and the Long Island Power Authority.
Demographics
As of the 2010 census, the population of Laurel was 8,845. The racial makeup of the hamlet was 79.3% White, 11.2% African American, 0.3% Native American, 2.2% Asian, and 6.9% from other races.
The median household income in Laurel was $68,945, and the median family income was $76,945. The per capita income was $30,945.
Conclusion
Laurel is a hamlet located in the Town of Brookhaven in Suffolk County, New York. It is situated on the north shore of Long Island, approximately 60 miles east of New York City. The hamlet was originally inhabited by the Setalcott Indians, and was officially established in 1750. In the late 1800s, Laurel was a popular summer resort destination for wealthy New Yorkers. The economy of Laurel is largely based on tourism and retail, and the area is also home to several large employers. As of the 2010 census, the population of Laurel was 8,845. The racial makeup of the hamlet was 79.3% White, 11.2% African American, 0.3% Native American, 2.2% Asian, and 6.9% from other races. The median household income in Laurel was $68,945, and the median family income was $76,945.
Common Questions
What is Per Capita Income in Laurel?
Per Capita income in Laurel is $55,755.
What is the Median Family Income in Laurel?
Median Family Income in Laurel is $97,435.
What is the Median Household income in Laurel?
Median Household Income in Laurel is $116,208.
What is Inequality or Gini Index in Laurel?
Inequality or Gini Index in Laurel is 0.28.
What is the Total Population of Laurel?
Total Population of Laurel is 980.
What is the Total Male Population of Laurel?
Total Male Population of Laurel is 576.
What is the Total Female Population of Laurel?
Total Female Population of Laurel is 404.
What is the Ratio of Males per 100 Females in Laurel?
There are 142.57 Males per 100 Females in Laurel.
What is the Ratio of Females per 100 Males in Laurel?
There are 70.14 Females per 100 Males in Laurel.
What is the Median Population Age in Laurel?
Median Population Age in Laurel is 51.4 Years.
What is the Average Family Size in Laurel
Average Family Size in Laurel is 2.4 People.
What is the Average Household Size in Laurel
Average Household Size in Laurel is 2.1 People.
How Large is the Labor Force in Laurel?
There are 604 People in the Labor Forcein in Laurel.
What is the Percentage of People in the Labor Force in Laurel?
67.8% of People are in the Labor Force in Laurel.