Remsenburg Speonk, NY Map & Demographics
Remsenburg Speonk Map
Remsenburg Speonk Overview
$97,991
PER CAPITA INCOME
$165,729
AVG FAMILY INCOME
$162,692
AVG HOUSEHOLD INCOME
60.9%
WAGE / INCOME GAP [ % ]
39.1¢/ $1
WAGE / INCOME GAP [ $ ]
0.53
INEQUALITY / GINI INDEX
1,732
TOTAL POPULATION
745
MALE POPULATION
987
FEMALE POPULATION
75.48
MALES / 100 FEMALES
132.48
FEMALES / 100 MALES
50.0
MEDIAN AGE
2.5
AVG FAMILY SIZE
2.2
AVG HOUSEHOLD SIZE
826
LABOR FORCE [ PEOPLE ]
55.1%
PERCENT IN LABOR FORCE
Income in Remsenburg Speonk
Income Overview in Remsenburg Speonk
Per Capita Income in Remsenburg Speonk is $97,991, while median incomes of families and households are $165,729 and $162,692 respectively.
| Characteristic | Number | Measure |
| Per Capita Income | 1,732 | $97,991 |
| Median Family Income | 567 | $165,729 |
| Mean Family Income | 567 | $192,642 |
| Median Household Income | 782 | $162,692 |
| Mean Household Income | 782 | $210,846 |
| Income Deficit | 567 | $0 |
| Wage / Income Gap (%) | 1,732 | 60.85% |
| Wage / Income Gap ($) | 1,732 | 39.15¢ per $1 |
| Gini / Inequality Index | 1,732 | 0.53 |
Earnings by Sex in Remsenburg Speonk
Average Earnings in Remsenburg Speonk are $76,250, $142,083 for men and $55,625 for women, a difference of 60.9%.
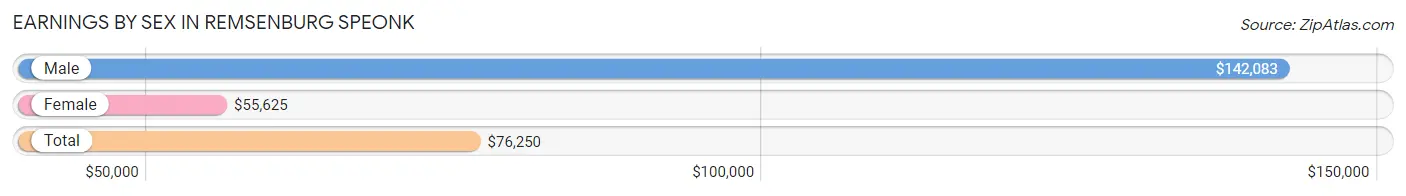
| Sex | Number | Average Earnings |
| Male | 436 (49.5%) | $142,083 |
| Female | 445 (50.5%) | $55,625 |
| Total | 881 (100.0%) | $76,250 |
Earnings by Sex by Income Bracket in Remsenburg Speonk
The most common earnings brackets in Remsenburg Speonk are $100,000+ for men (267 | 61.2%) and $100,000+ for women (141 | 31.7%).
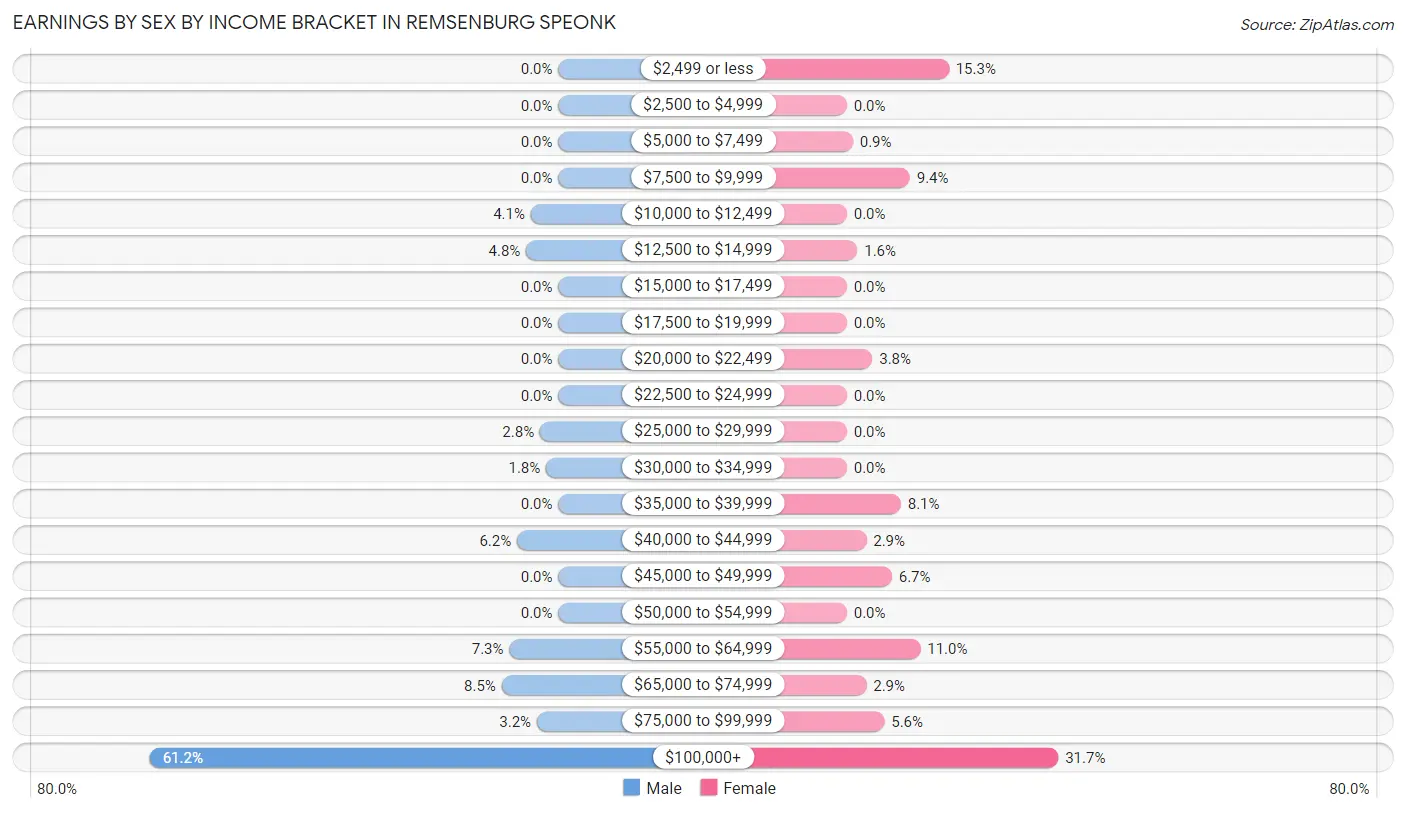
| Income | Male | Female |
| $2,499 or less | 0 (0.0%) | 68 (15.3%) |
| $2,500 to $4,999 | 0 (0.0%) | 0 (0.0%) |
| $5,000 to $7,499 | 0 (0.0%) | 4 (0.9%) |
| $7,500 to $9,999 | 0 (0.0%) | 42 (9.4%) |
| $10,000 to $12,499 | 18 (4.1%) | 0 (0.0%) |
| $12,500 to $14,999 | 21 (4.8%) | 7 (1.6%) |
| $15,000 to $17,499 | 0 (0.0%) | 0 (0.0%) |
| $17,500 to $19,999 | 0 (0.0%) | 0 (0.0%) |
| $20,000 to $22,499 | 0 (0.0%) | 17 (3.8%) |
| $22,500 to $24,999 | 0 (0.0%) | 0 (0.0%) |
| $25,000 to $29,999 | 12 (2.8%) | 0 (0.0%) |
| $30,000 to $34,999 | 8 (1.8%) | 0 (0.0%) |
| $35,000 to $39,999 | 0 (0.0%) | 36 (8.1%) |
| $40,000 to $44,999 | 27 (6.2%) | 13 (2.9%) |
| $45,000 to $49,999 | 0 (0.0%) | 30 (6.7%) |
| $50,000 to $54,999 | 0 (0.0%) | 0 (0.0%) |
| $55,000 to $64,999 | 32 (7.3%) | 49 (11.0%) |
| $65,000 to $74,999 | 37 (8.5%) | 13 (2.9%) |
| $75,000 to $99,999 | 14 (3.2%) | 25 (5.6%) |
| $100,000+ | 267 (61.2%) | 141 (31.7%) |
| Total | 436 (100.0%) | 445 (100.0%) |
Earnings by Sex by Educational Attainment in Remsenburg Speonk
Average earnings in Remsenburg Speonk are $153,846 for men and $56,705 for women, a difference of 63.1%. Men with an educational attainment of bachelor's degree enjoy the highest average annual earnings of $208,788, while those with graduate degree education earn the least with $154,615. Women with an educational attainment of graduate degree earn the most with the average annual earnings of $107,841, while those with bachelor's degree education have the smallest earnings of $43,750.
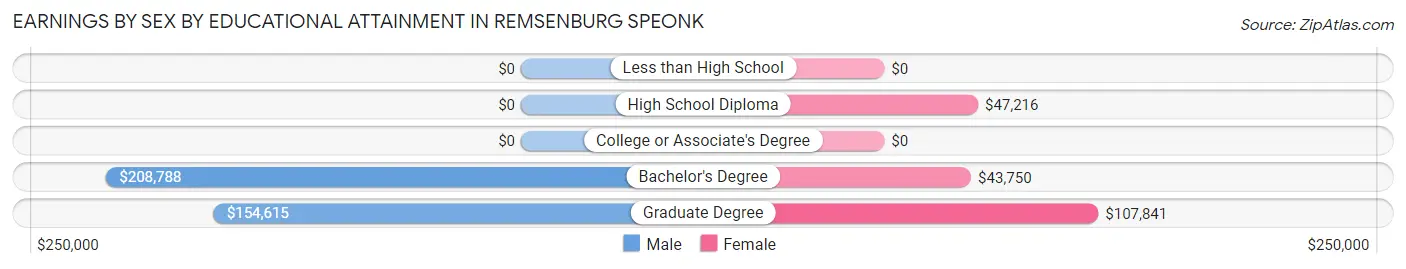
| Educational Attainment | Male Income | Female Income |
| Less than High School | - | - |
| High School Diploma | - | - |
| College or Associate's Degree | - | - |
| Bachelor's Degree | $208,788 | $43,750 |
| Graduate Degree | $154,615 | $107,841 |
| Total | $153,846 | $56,705 |
Family Income in Remsenburg Speonk
Family Income Brackets in Remsenburg Speonk
According to the Remsenburg Speonk family income data, there are 226 families falling into the $200,000+ income range, which is the most common income bracket and makes up 39.9% of all families.
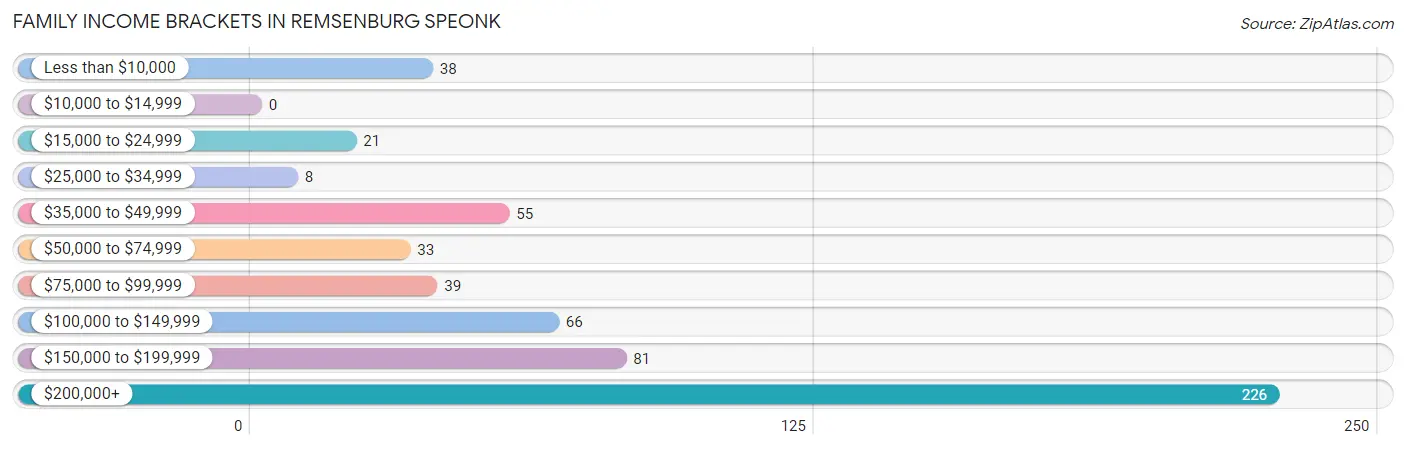
| Income Bracket | # Families | % Families |
| Less than $10,000 | 38 | 6.7% |
| $10,000 to $14,999 | 0 | 0.0% |
| $15,000 to $24,999 | 21 | 3.7% |
| $25,000 to $34,999 | 8 | 1.4% |
| $35,000 to $49,999 | 55 | 9.7% |
| $50,000 to $74,999 | 33 | 5.8% |
| $75,000 to $99,999 | 39 | 6.9% |
| $100,000 to $149,999 | 66 | 11.6% |
| $150,000 to $199,999 | 81 | 14.3% |
| $200,000+ | 226 | 39.9% |
Family Income by Famaliy Size in Remsenburg Speonk
3-person families (136 | 24.0%) account for the highest median family income in Remsenburg Speonk with $223,958 per family, while 3-person families (136 | 24.0%) have the highest median income of $74,653 per family member.
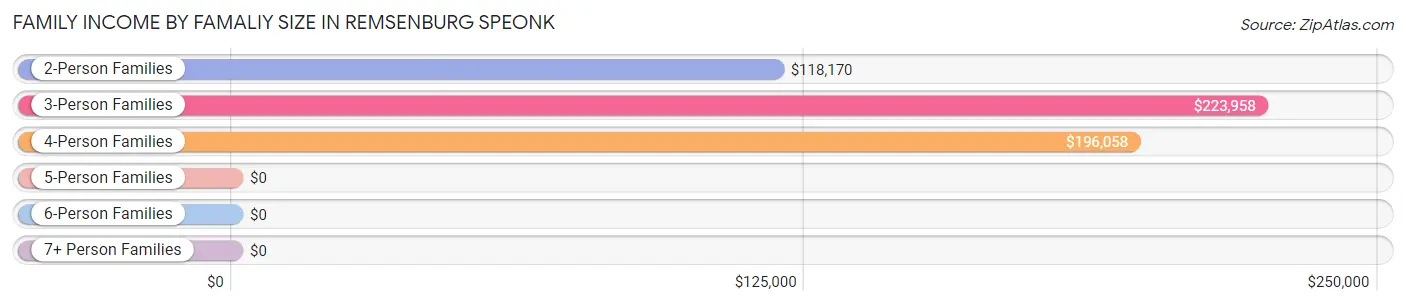
| Income Bracket | # Families | Median Income |
| 2-Person Families | 370 (65.3%) | $118,170 |
| 3-Person Families | 136 (24.0%) | $223,958 |
| 4-Person Families | 51 (9.0%) | $196,058 |
| 5-Person Families | 0 (0.0%) | $0 |
| 6-Person Families | 10 (1.8%) | $0 |
| 7+ Person Families | 0 (0.0%) | $0 |
| Total | 567 (100.0%) | $165,729 |
Family Income by Number of Earners in Remsenburg Speonk
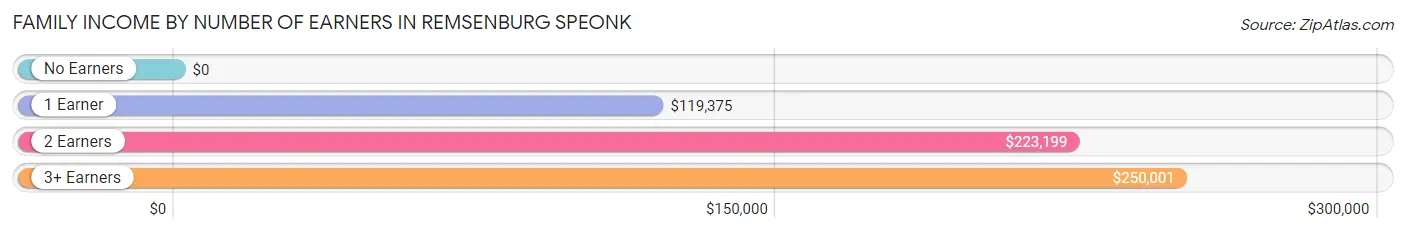
| Number of Earners | # Families | Median Income |
| No Earners | 159 (28.0%) | $0 |
| 1 Earner | 168 (29.6%) | $119,375 |
| 2 Earners | 209 (36.9%) | $223,199 |
| 3+ Earners | 31 (5.5%) | $250,001 |
| Total | 567 (100.0%) | $165,729 |
Household Income in Remsenburg Speonk
Household Income Brackets in Remsenburg Speonk
With 289 households falling in the category, the $200,000+ income range is the most frequent in Remsenburg Speonk, accounting for 37.0% of all households. In contrast, only 8 households (1.0%) fall into the $25,000 to $34,999 income bracket, making it the least populous group.
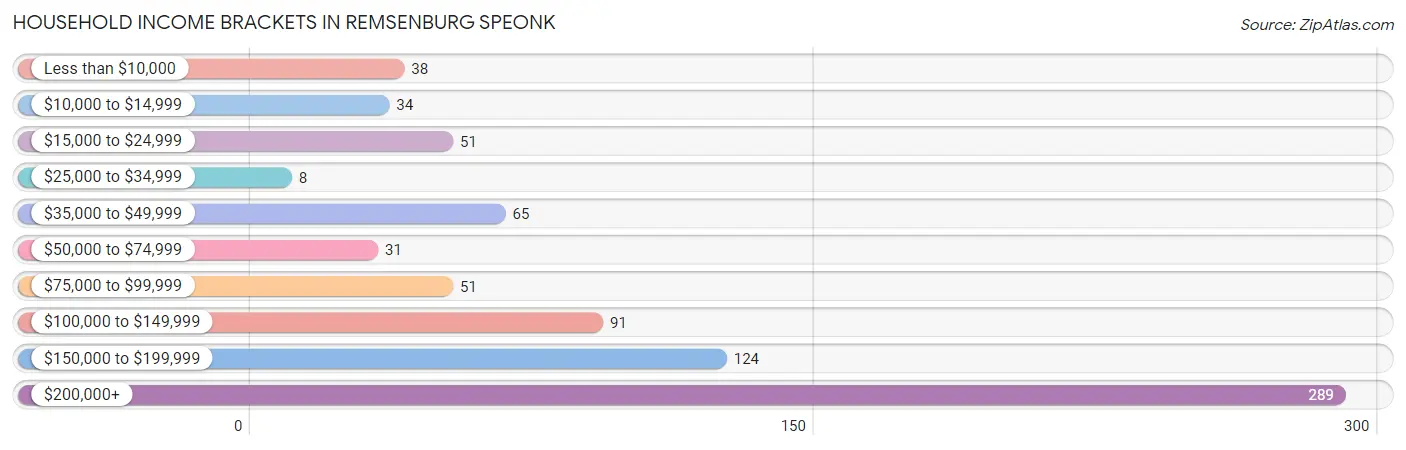
| Income Bracket | # Households | % Households |
| Less than $10,000 | 38 | 4.9% |
| $10,000 to $14,999 | 34 | 4.3% |
| $15,000 to $24,999 | 51 | 6.5% |
| $25,000 to $34,999 | 8 | 1.0% |
| $35,000 to $49,999 | 65 | 8.3% |
| $50,000 to $74,999 | 31 | 4.0% |
| $75,000 to $99,999 | 51 | 6.5% |
| $100,000 to $149,999 | 91 | 11.6% |
| $150,000 to $199,999 | 124 | 15.9% |
| $200,000+ | 289 | 37.0% |
Household Income by Householder Age in Remsenburg Speonk
The median household income in Remsenburg Speonk is $162,692, with the highest median household income of $196,983 found in the 25 to 44 years age bracket for the primary householder. A total of 160 households (20.5%) fall into this category. Meanwhile, the 15 to 24 years age bracket for the primary householder has the lowest median household income of $0, with 17 households (2.2%) in this group.
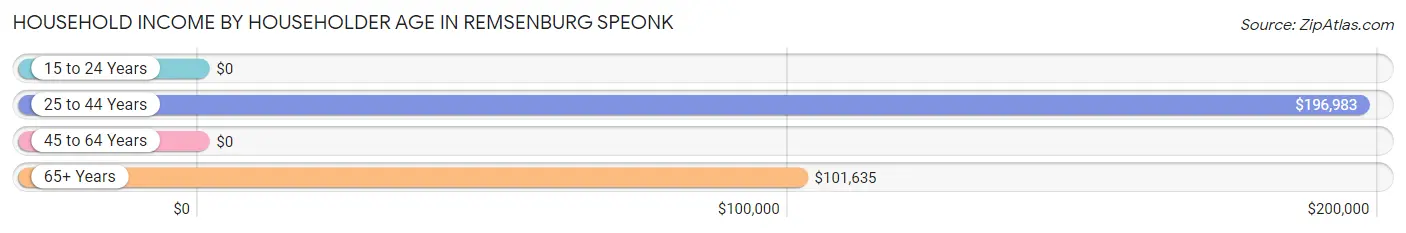
| Income Bracket | # Households | Median Income |
| 15 to 24 Years | 17 (2.2%) | $0 |
| 25 to 44 Years | 160 (20.5%) | $196,983 |
| 45 to 64 Years | 250 (32.0%) | $0 |
| 65+ Years | 355 (45.4%) | $101,635 |
| Total | 782 (100.0%) | $162,692 |
Poverty in Remsenburg Speonk
Income Below Poverty by Sex and Age in Remsenburg Speonk
With 3.1% poverty level for males and 11.6% for females among the residents of Remsenburg Speonk, 18 to 24 year old males and 16 and 17 year old females are the most vulnerable to poverty, with 18 males (29.5%) and 41 females (59.4%) in their respective age groups living below the poverty level.
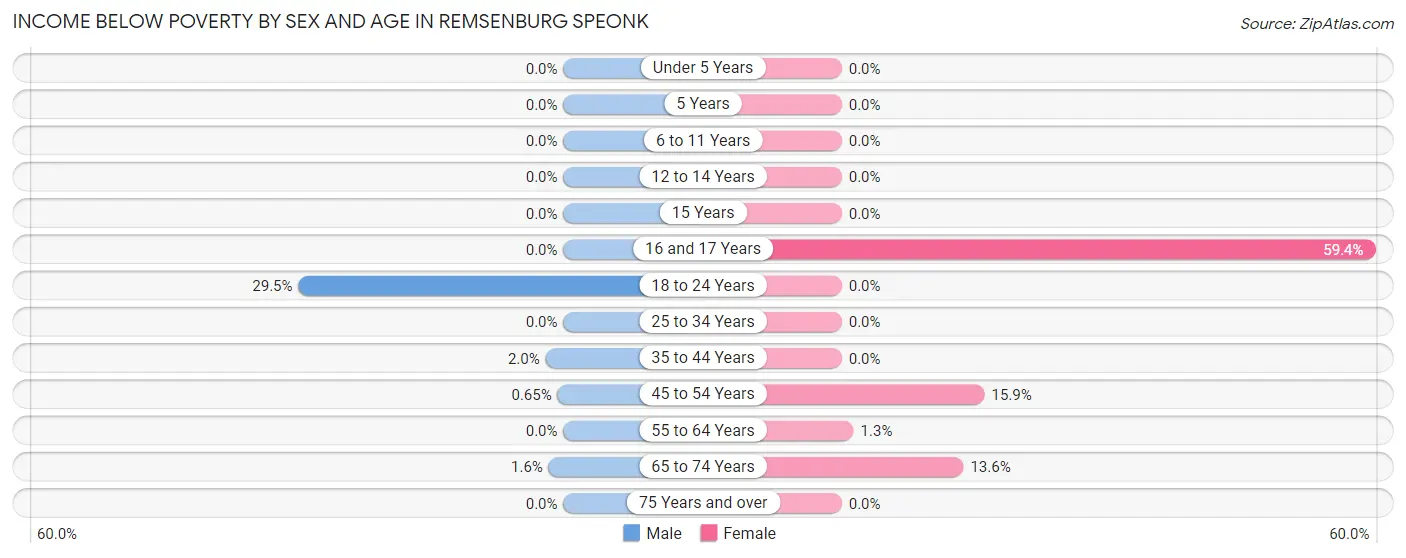
| Age Bracket | Male | Female |
| Under 5 Years | 0 (0.0%) | 0 (0.0%) |
| 5 Years | 0 (0.0%) | 0 (0.0%) |
| 6 to 11 Years | 0 (0.0%) | 0 (0.0%) |
| 12 to 14 Years | 0 (0.0%) | 0 (0.0%) |
| 15 Years | 0 (0.0%) | 0 (0.0%) |
| 16 and 17 Years | 0 (0.0%) | 41 (59.4%) |
| 18 to 24 Years | 18 (29.5%) | 0 (0.0%) |
| 25 to 34 Years | 0 (0.0%) | 0 (0.0%) |
| 35 to 44 Years | 2 (2.0%) | 0 (0.0%) |
| 45 to 54 Years | 1 (0.6%) | 38 (15.9%) |
| 55 to 64 Years | 0 (0.0%) | 1 (1.3%) |
| 65 to 74 Years | 2 (1.6%) | 34 (13.6%) |
| 75 Years and over | 0 (0.0%) | 0 (0.0%) |
| Total | 23 (3.1%) | 114 (11.6%) |
Income Above Poverty by Sex and Age in Remsenburg Speonk
According to the poverty statistics in Remsenburg Speonk, males aged under 5 years and females aged under 5 years are the age groups that are most secure financially, with 100.0% of males and 100.0% of females in these age groups living above the poverty line.
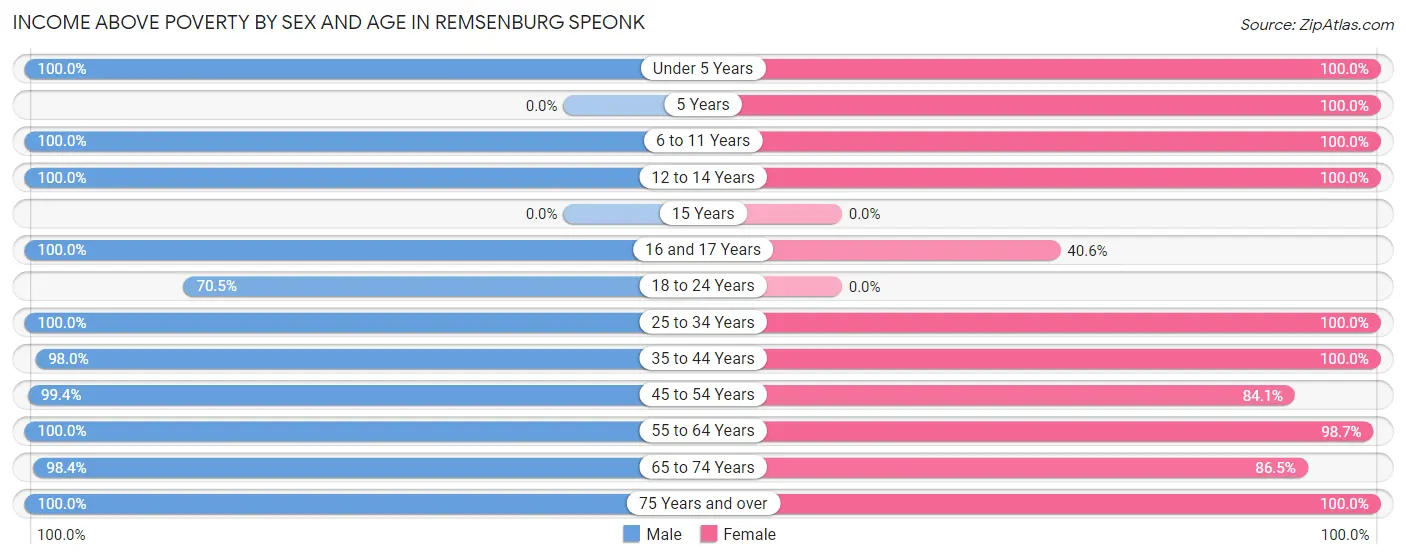
| Age Bracket | Male | Female |
| Under 5 Years | 9 (100.0%) | 38 (100.0%) |
| 5 Years | 0 (0.0%) | 14 (100.0%) |
| 6 to 11 Years | 16 (100.0%) | 86 (100.0%) |
| 12 to 14 Years | 28 (100.0%) | 42 (100.0%) |
| 15 Years | 0 (0.0%) | 0 (0.0%) |
| 16 and 17 Years | 14 (100.0%) | 28 (40.6%) |
| 18 to 24 Years | 43 (70.5%) | 0 (0.0%) |
| 25 to 34 Years | 72 (100.0%) | 41 (100.0%) |
| 35 to 44 Years | 99 (98.0%) | 78 (100.0%) |
| 45 to 54 Years | 152 (99.4%) | 201 (84.1%) |
| 55 to 64 Years | 60 (100.0%) | 75 (98.7%) |
| 65 to 74 Years | 121 (98.4%) | 217 (86.5%) |
| 75 Years and over | 108 (100.0%) | 53 (100.0%) |
| Total | 722 (96.9%) | 873 (88.4%) |
Income Below Poverty Among Married-Couple Families in Remsenburg Speonk
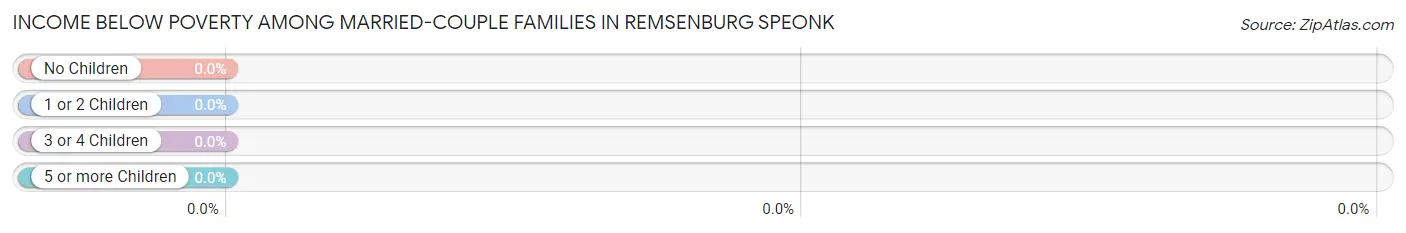
| Children | Above Poverty | Below Poverty |
| No Children | 299 (100.0%) | 0 (0.0%) |
| 1 or 2 Children | 124 (100.0%) | 0 (0.0%) |
| 3 or 4 Children | 10 (100.0%) | 0 (0.0%) |
| 5 or more Children | 0 (0.0%) | 0 (0.0%) |
| Total | 433 (100.0%) | 0 (0.0%) |
Income Below Poverty Among Single-Parent Households in Remsenburg Speonk
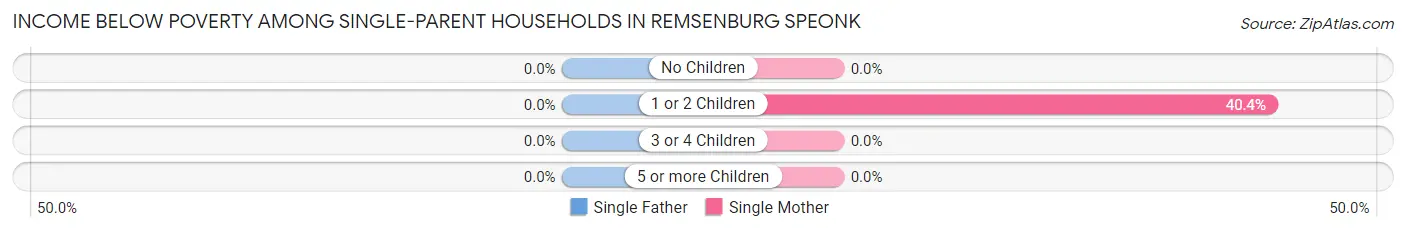
| Children | Single Father | Single Mother |
| No Children | 0 (0.0%) | 0 (0.0%) |
| 1 or 2 Children | 0 (0.0%) | 38 (40.4%) |
| 3 or 4 Children | 0 (0.0%) | 0 (0.0%) |
| 5 or more Children | 0 (0.0%) | 0 (0.0%) |
| Total | 0 (0.0%) | 38 (36.2%) |
Income Below Poverty Among Married-Couple vs Single-Parent Households in Remsenburg Speonk
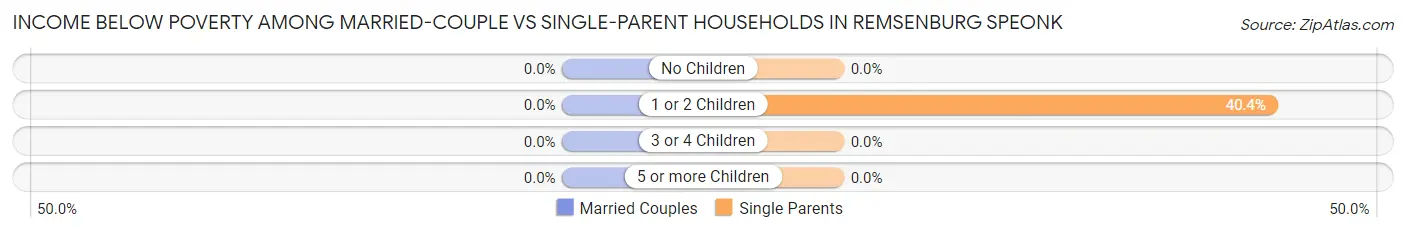
| Children | Married-Couple Families | Single-Parent Households |
| No Children | 0 (0.0%) | 0 (0.0%) |
| 1 or 2 Children | 0 (0.0%) | 38 (40.4%) |
| 3 or 4 Children | 0 (0.0%) | 0 (0.0%) |
| 5 or more Children | 0 (0.0%) | 0 (0.0%) |
| Total | 0 (0.0%) | 38 (28.4%) |
Race in Remsenburg Speonk
The most populous races in Remsenburg Speonk are White / Caucasian (1,716 | 99.1%), Hispanic or Latino (97 | 5.6%), and Two or more Races (14 | 0.8%).
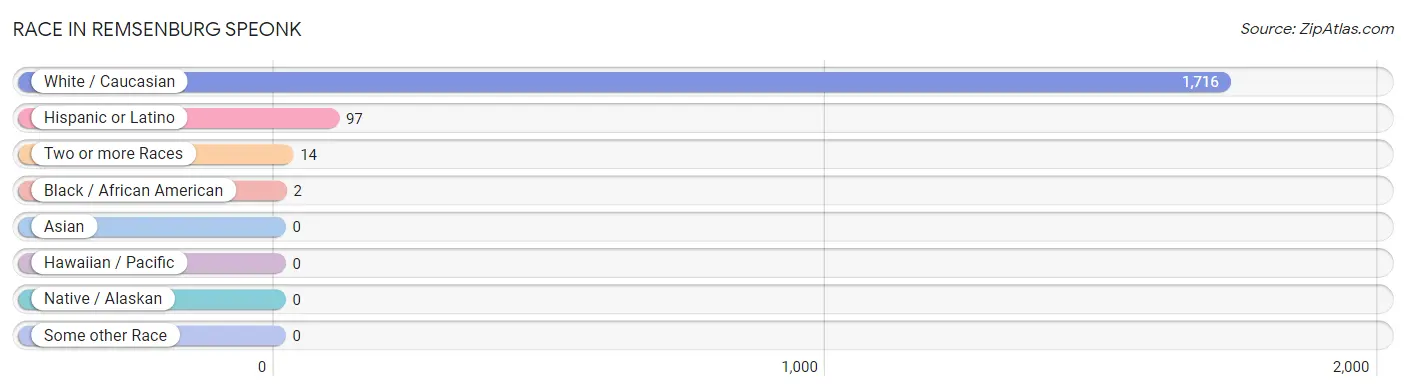
| Race | # Population | % Population |
| Asian | 0 | 0.0% |
| Black / African American | 2 | 0.1% |
| Hawaiian / Pacific | 0 | 0.0% |
| Hispanic or Latino | 97 | 5.6% |
| Native / Alaskan | 0 | 0.0% |
| White / Caucasian | 1,716 | 99.1% |
| Two or more Races | 14 | 0.8% |
| Some other Race | 0 | 0.0% |
| Total | 1,732 | 100.0% |
Ancestry in Remsenburg Speonk
The most populous ancestries reported in Remsenburg Speonk are Irish (527 | 30.4%), Italian (491 | 28.3%), German (257 | 14.8%), English (156 | 9.0%), and Polish (106 | 6.1%), together accounting for 88.7% of all Remsenburg Speonk residents.
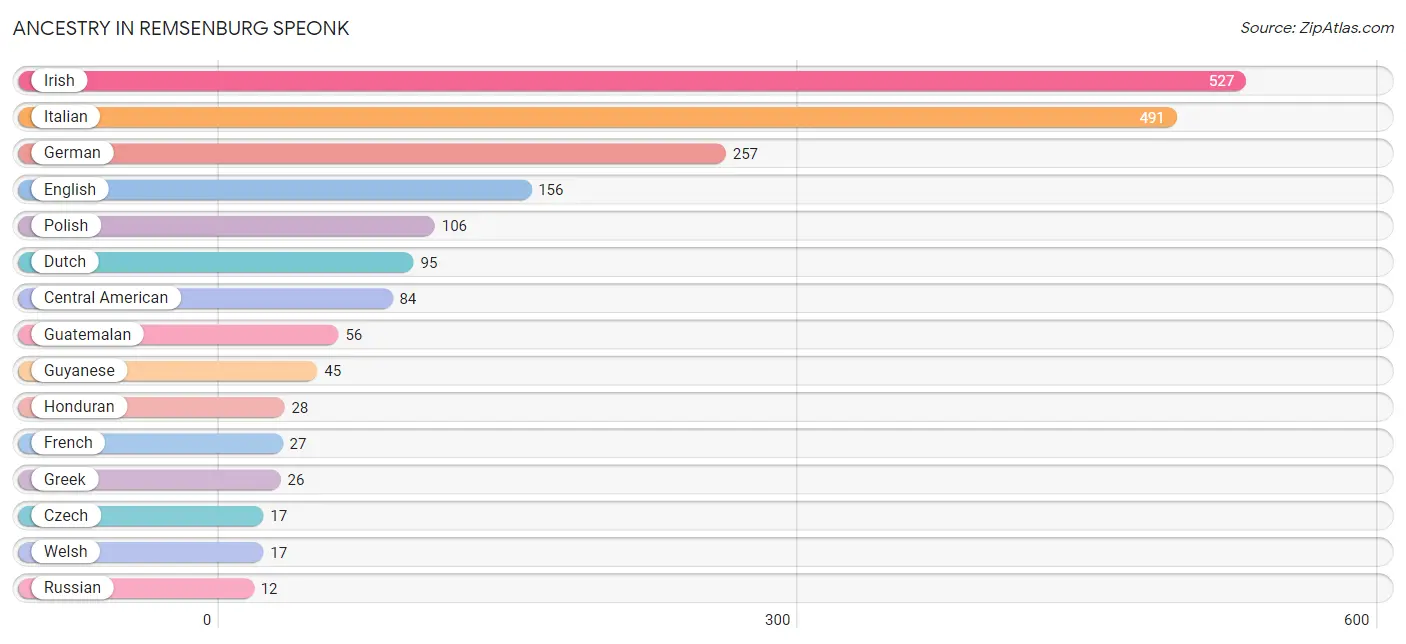
| Ancestry | # Population | % Population |
| American | 6 | 0.4% |
| British | 10 | 0.6% |
| Central American | 84 | 4.9% |
| Czech | 17 | 1.0% |
| Dutch | 95 | 5.5% |
| English | 156 | 9.0% |
| French | 27 | 1.6% |
| German | 257 | 14.8% |
| Greek | 26 | 1.5% |
| Guatemalan | 56 | 3.2% |
| Guyanese | 45 | 2.6% |
| Honduran | 28 | 1.6% |
| Irish | 527 | 30.4% |
| Italian | 491 | 28.3% |
| Mexican | 11 | 0.6% |
| Polish | 106 | 6.1% |
| Puerto Rican | 2 | 0.1% |
| Russian | 12 | 0.7% |
| Scotch-Irish | 9 | 0.5% |
| Welsh | 17 | 1.0% | View All 20 Rows |
Immigrants in Remsenburg Speonk
The most numerous immigrant groups reported in Remsenburg Speonk came from Latin America (72 | 4.2%), Guyana (45 | 2.6%), South America (45 | 2.6%), Europe (33 | 1.9%), and Central America (27 | 1.6%), together accounting for 12.8% of all Remsenburg Speonk residents.
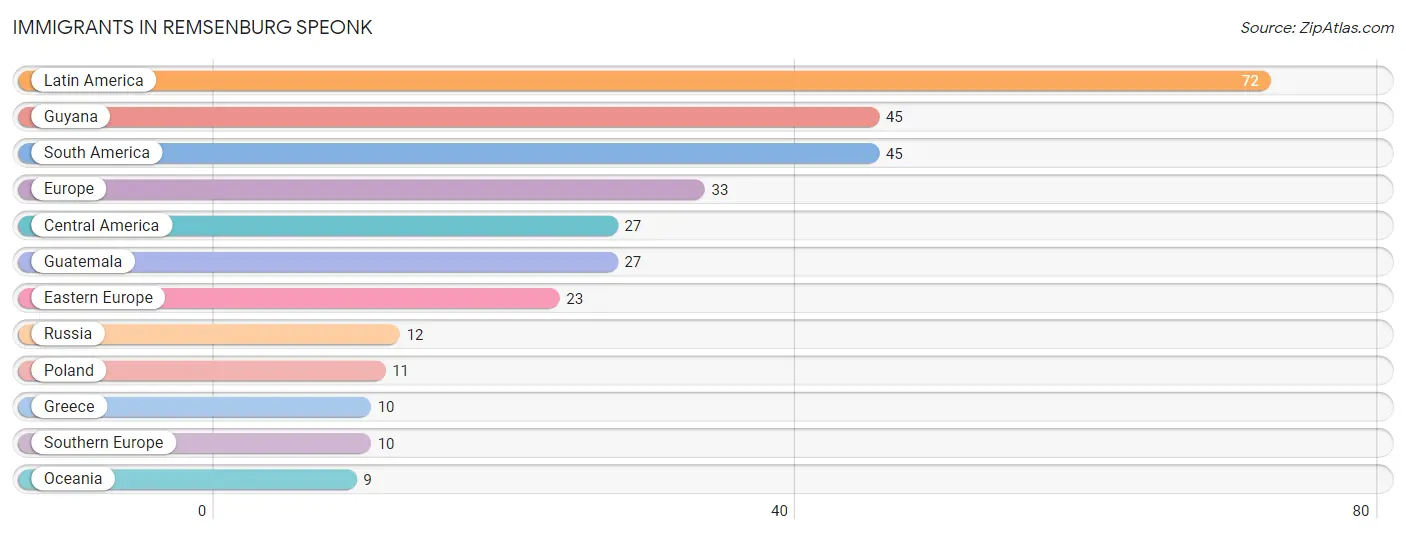
| Immigration Origin | # Population | % Population |
| Central America | 27 | 1.6% |
| Eastern Europe | 23 | 1.3% |
| Europe | 33 | 1.9% |
| Greece | 10 | 0.6% |
| Guatemala | 27 | 1.6% |
| Guyana | 45 | 2.6% |
| Latin America | 72 | 4.2% |
| Oceania | 9 | 0.5% |
| Poland | 11 | 0.6% |
| Russia | 12 | 0.7% |
| South America | 45 | 2.6% |
| Southern Europe | 10 | 0.6% | View All 12 Rows |
Sex and Age in Remsenburg Speonk
Sex and Age in Remsenburg Speonk
The most populous age groups in Remsenburg Speonk are 50 to 54 Years (88 | 11.8%) for men and 70 to 74 Years (168 | 17.0%) for women.
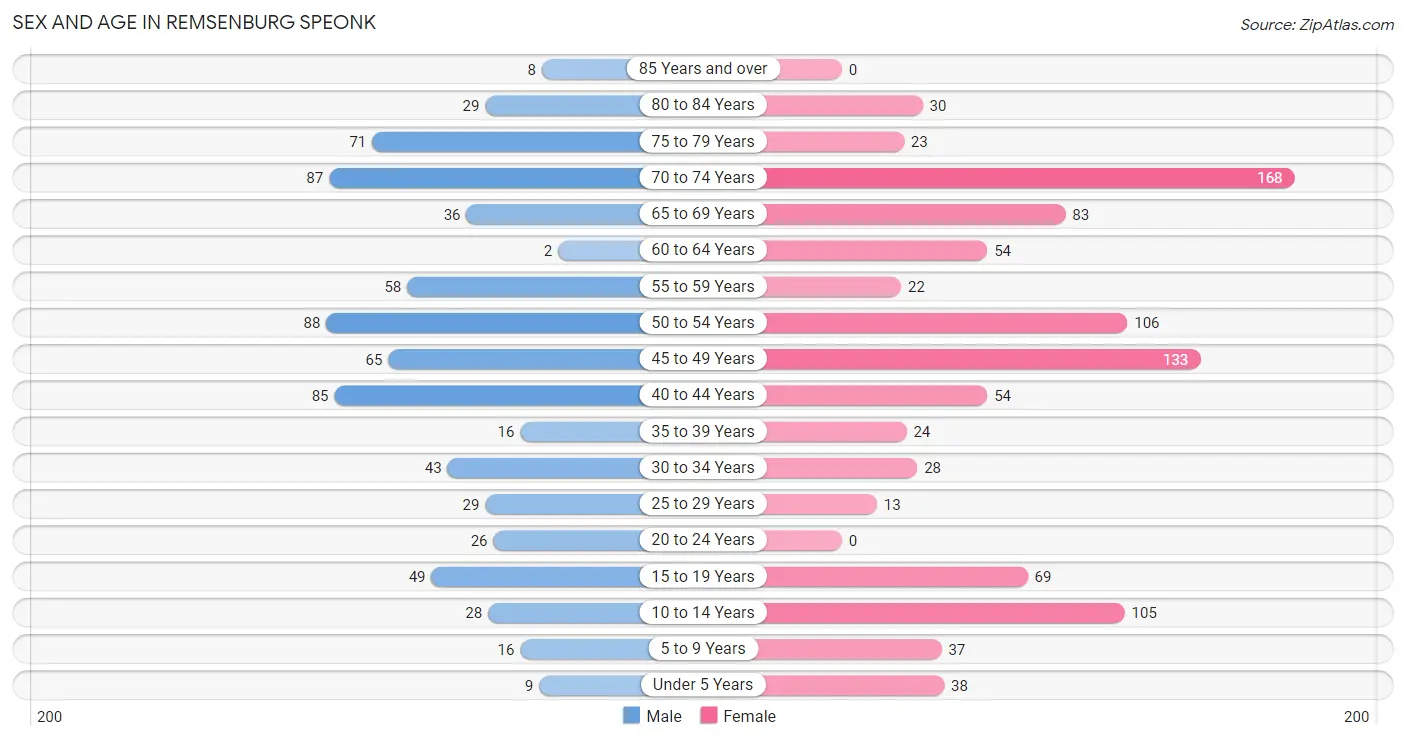
| Age Bracket | Male | Female |
| Under 5 Years | 9 (1.2%) | 38 (3.8%) |
| 5 to 9 Years | 16 (2.1%) | 37 (3.7%) |
| 10 to 14 Years | 28 (3.8%) | 105 (10.6%) |
| 15 to 19 Years | 49 (6.6%) | 69 (7.0%) |
| 20 to 24 Years | 26 (3.5%) | 0 (0.0%) |
| 25 to 29 Years | 29 (3.9%) | 13 (1.3%) |
| 30 to 34 Years | 43 (5.8%) | 28 (2.8%) |
| 35 to 39 Years | 16 (2.1%) | 24 (2.4%) |
| 40 to 44 Years | 85 (11.4%) | 54 (5.5%) |
| 45 to 49 Years | 65 (8.7%) | 133 (13.5%) |
| 50 to 54 Years | 88 (11.8%) | 106 (10.7%) |
| 55 to 59 Years | 58 (7.8%) | 22 (2.2%) |
| 60 to 64 Years | 2 (0.3%) | 54 (5.5%) |
| 65 to 69 Years | 36 (4.8%) | 83 (8.4%) |
| 70 to 74 Years | 87 (11.7%) | 168 (17.0%) |
| 75 to 79 Years | 71 (9.5%) | 23 (2.3%) |
| 80 to 84 Years | 29 (3.9%) | 30 (3.0%) |
| 85 Years and over | 8 (1.1%) | 0 (0.0%) |
| Total | 745 (100.0%) | 987 (100.0%) |
Families and Households in Remsenburg Speonk
Median Family Size in Remsenburg Speonk
The median family size in Remsenburg Speonk is 2.54 persons per family, with single female/mother families (105 | 18.5%) accounting for the largest median family size of 2.62 persons per family. On the other hand, married-couple families (433 | 76.4%) represent the smallest median family size with 2.52 persons per family.
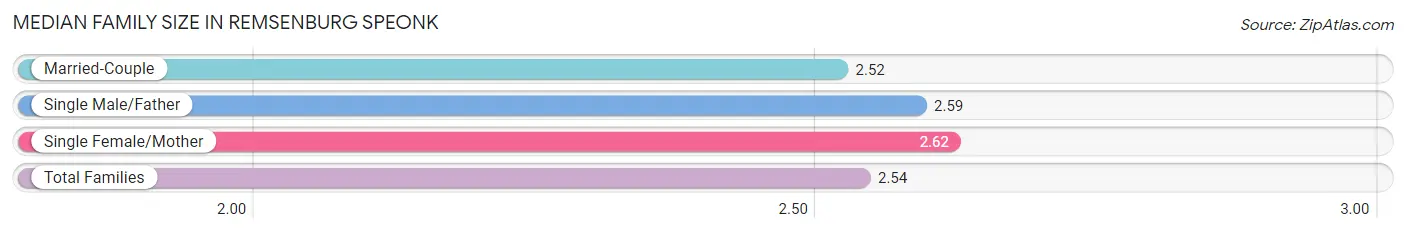
| Family Type | # Families | Family Size |
| Married-Couple | 433 (76.4%) | 2.52 |
| Single Male/Father | 29 (5.1%) | 2.59 |
| Single Female/Mother | 105 (18.5%) | 2.62 |
| Total Families | 567 (100.0%) | 2.54 |
Median Household Size in Remsenburg Speonk
The median household size in Remsenburg Speonk is 2.19 persons per household, with single female/mother households (105 | 13.4%) accounting for the largest median household size of 2.62 persons per household. non-family households (215 | 27.5%) represent the smallest median household size with 1.22 persons per household.
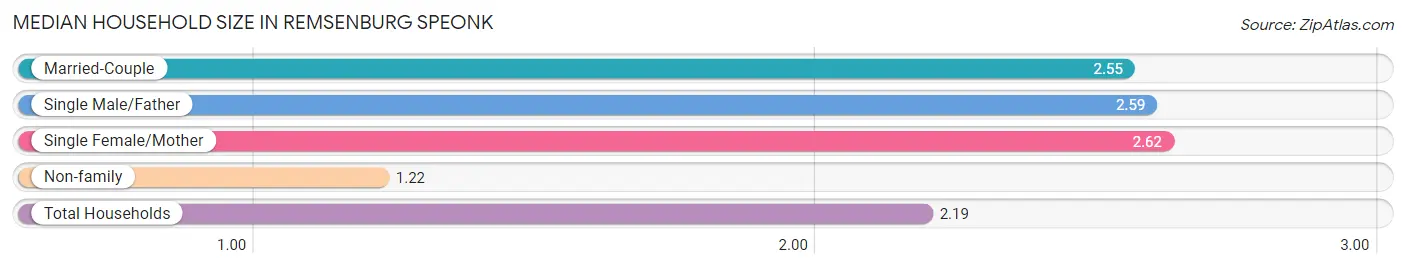
| Household Type | # Households | Household Size |
| Married-Couple | 433 (55.4%) | 2.55 |
| Single Male/Father | 29 (3.7%) | 2.59 |
| Single Female/Mother | 105 (13.4%) | 2.62 |
| Non-family | 215 (27.5%) | 1.22 |
| Total Households | 782 (100.0%) | 2.19 |
Household Size by Marriage Status in Remsenburg Speonk
Out of a total of 782 households in Remsenburg Speonk, 567 (72.5%) are family households, while 215 (27.5%) are nonfamily households. The most numerous type of family households are 2-person households, comprising 357, and the most common type of nonfamily households are 1-person households, comprising 185.
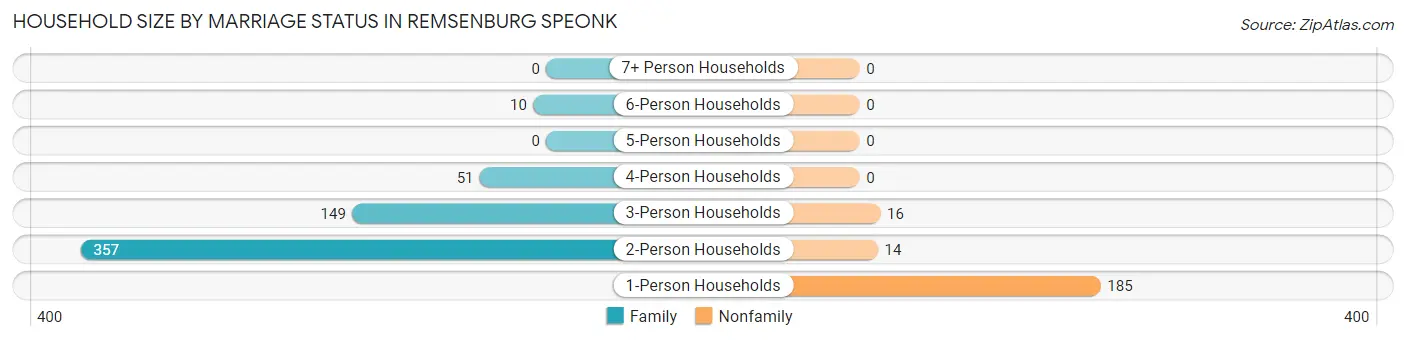
| Household Size | Family Households | Nonfamily Households |
| 1-Person Households | - | 185 (23.7%) |
| 2-Person Households | 357 (45.7%) | 14 (1.8%) |
| 3-Person Households | 149 (19.1%) | 16 (2.1%) |
| 4-Person Households | 51 (6.5%) | 0 (0.0%) |
| 5-Person Households | 0 (0.0%) | 0 (0.0%) |
| 6-Person Households | 10 (1.3%) | 0 (0.0%) |
| 7+ Person Households | 0 (0.0%) | 0 (0.0%) |
| Total | 567 (72.5%) | 215 (27.5%) |
Female Fertility in Remsenburg Speonk
Fertility by Age in Remsenburg Speonk
| Age Bracket | Women with Births | Births / 1,000 Women |
| 15 to 19 years | 0 (0.0%) | 0.0 |
| 20 to 34 years | 0 (0.0%) | 0.0 |
| 35 to 50 years | 0 (0.0%) | 0.0 |
| Total | 0 (0.0%) | 0.0 |
Fertility by Age by Marriage Status in Remsenburg Speonk
| Age Bracket | Married | Unmarried |
| 15 to 19 years | 0 (0.0%) | 0 (0.0%) |
| 20 to 34 years | 0 (0.0%) | 0 (0.0%) |
| 35 to 50 years | 0 (0.0%) | 0 (0.0%) |
| Total | 0 (0.0%) | 0 (0.0%) |
Fertility by Education in Remsenburg Speonk
| Educational Attainment | Women with Births | Births / 1,000 Women |
| Less than High School | 0 (0.0%) | 0.0 |
| High School Diploma | 0 (0.0%) | 0.0 |
| College or Associate's Degree | 0 (0.0%) | 0.0 |
| Bachelor's Degree | 0 (0.0%) | 0.0 |
| Graduate Degree | 0 (0.0%) | 0.0 |
| Total | 0 (0.0%) | 0.0 |
Fertility by Education by Marriage Status in Remsenburg Speonk
| Educational Attainment | Married | Unmarried |
| Less than High School | 0 (0.0%) | 0 (0.0%) |
| High School Diploma | 0 (0.0%) | 0 (0.0%) |
| College or Associate's Degree | 0 (0.0%) | 0 (0.0%) |
| Bachelor's Degree | 0 (0.0%) | 0 (0.0%) |
| Graduate Degree | 0 (0.0%) | 0 (0.0%) |
| Total | 0 (0.0%) | 0 (0.0%) |
Employment Characteristics in Remsenburg Speonk
Employment by Class of Employer in Remsenburg Speonk
Among the 809 employed individuals in Remsenburg Speonk, private company employees (541 | 66.9%), local government employees (110 | 13.6%), and self-employed (incorporated) (82 | 10.1%) make up the most common classes of employment.
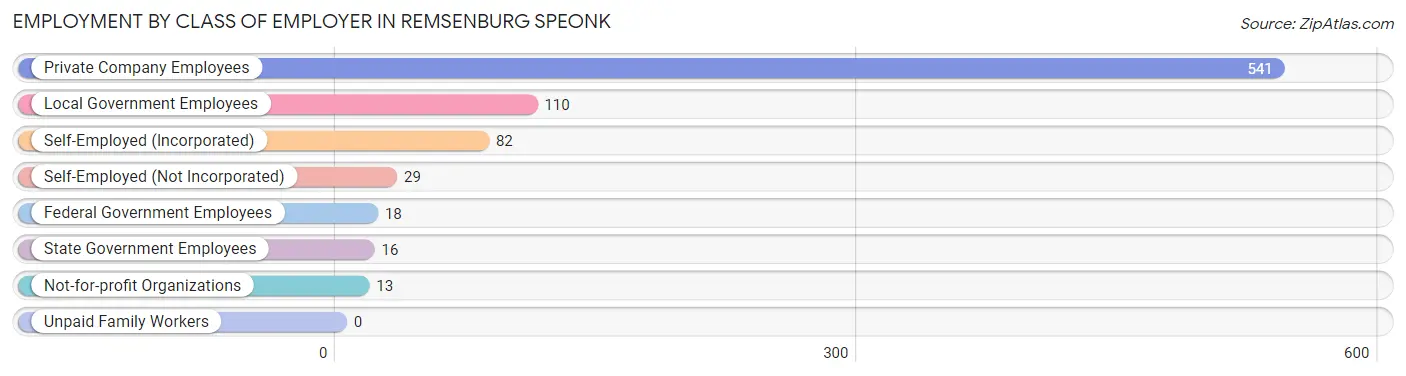
| Employer Class | # Employees | % Employees |
| Private Company Employees | 541 | 66.9% |
| Self-Employed (Incorporated) | 82 | 10.1% |
| Self-Employed (Not Incorporated) | 29 | 3.6% |
| Not-for-profit Organizations | 13 | 1.6% |
| Local Government Employees | 110 | 13.6% |
| State Government Employees | 16 | 2.0% |
| Federal Government Employees | 18 | 2.2% |
| Unpaid Family Workers | 0 | 0.0% |
| Total | 809 | 100.0% |
Employment Status by Age in Remsenburg Speonk
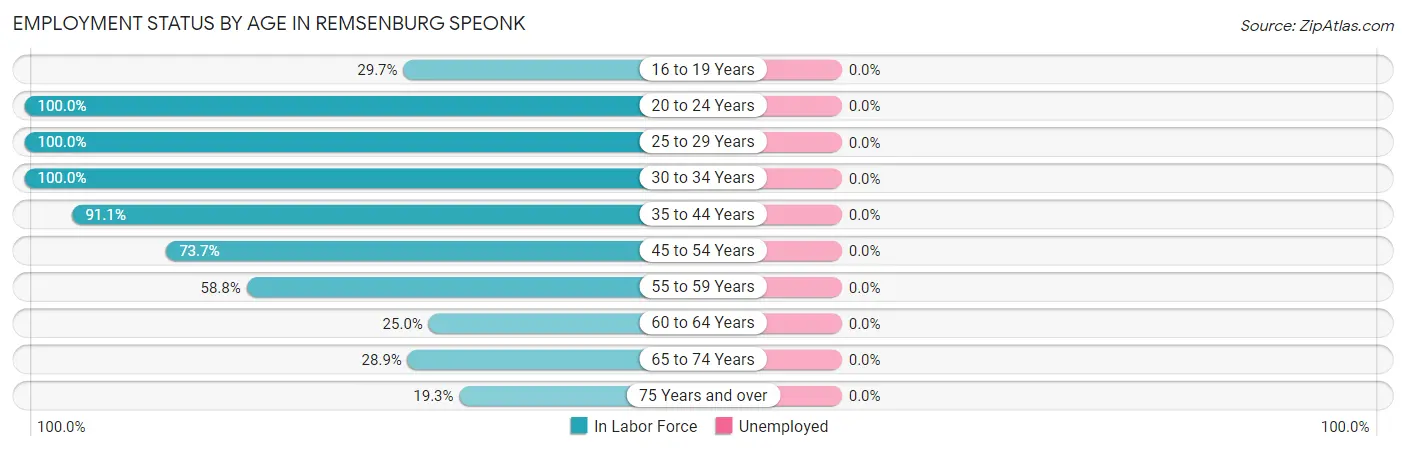
| Age Bracket | In Labor Force | Unemployed |
| 16 to 19 Years | 35 (29.7%) | 0 (0.0%) |
| 20 to 24 Years | 26 (100.0%) | 0 (0.0%) |
| 25 to 29 Years | 42 (100.0%) | 0 (0.0%) |
| 30 to 34 Years | 71 (100.0%) | 0 (0.0%) |
| 35 to 44 Years | 163 (91.1%) | 0 (0.0%) |
| 45 to 54 Years | 289 (73.7%) | 0 (0.0%) |
| 55 to 59 Years | 47 (58.8%) | 0 (0.0%) |
| 60 to 64 Years | 14 (25.0%) | 0 (0.0%) |
| 65 to 74 Years | 108 (28.9%) | 0 (0.0%) |
| 75 Years and over | 31 (19.3%) | 0 (0.0%) |
| Total | 826 (55.1%) | 0 (0.0%) |
Employment Status by Educational Attainment in Remsenburg Speonk
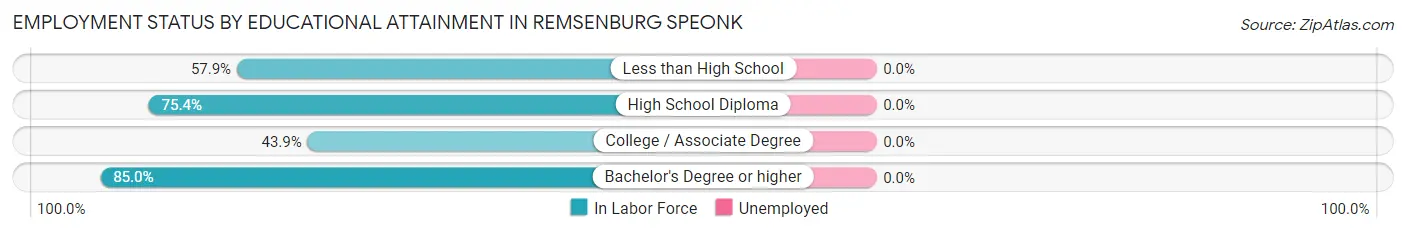
| Educational Attainment | In Labor Force | Unemployed |
| Less than High School | 11 (57.9%) | 0 (0.0%) |
| High School Diploma | 150 (75.4%) | 0 (0.0%) |
| College / Associate Degree | 50 (43.9%) | 0 (0.0%) |
| Bachelor's Degree or higher | 415 (85.0%) | 0 (0.0%) |
| Total | 626 (76.3%) | 0 (0.0%) |
Employment Occupations by Sex in Remsenburg Speonk
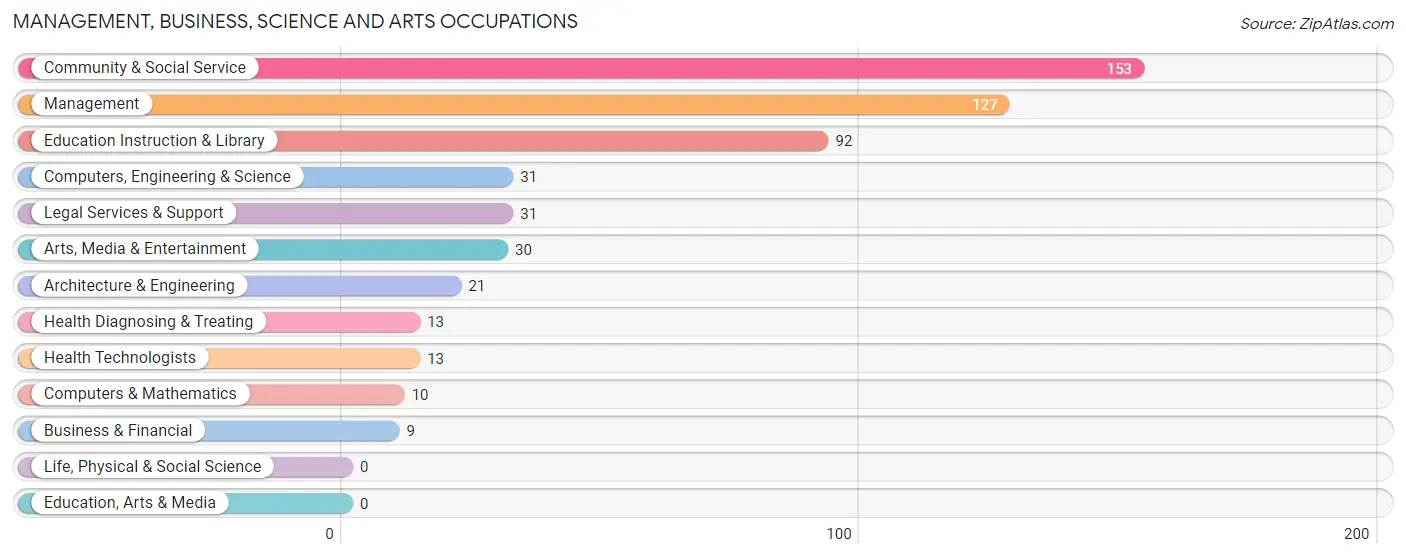
Management, Business, Science and Arts Occupations
The most common Management, Business, Science and Arts occupations in Remsenburg Speonk are Community & Social Service (153 | 18.5%), Management (127 | 15.4%), Education Instruction & Library (92 | 11.1%), Computers, Engineering & Science (31 | 3.7%), and Legal Services & Support (31 | 3.7%).
Management, Business, Science and Arts Occupations by Sex
Within the Management, Business, Science and Arts occupations in Remsenburg Speonk, the most male-oriented occupations are Legal Services & Support (100.0%), Management (79.5%), and Architecture & Engineering (42.9%), while the most female-oriented occupations are Business & Financial (100.0%), Computers & Mathematics (100.0%), and Arts, Media & Entertainment (100.0%).
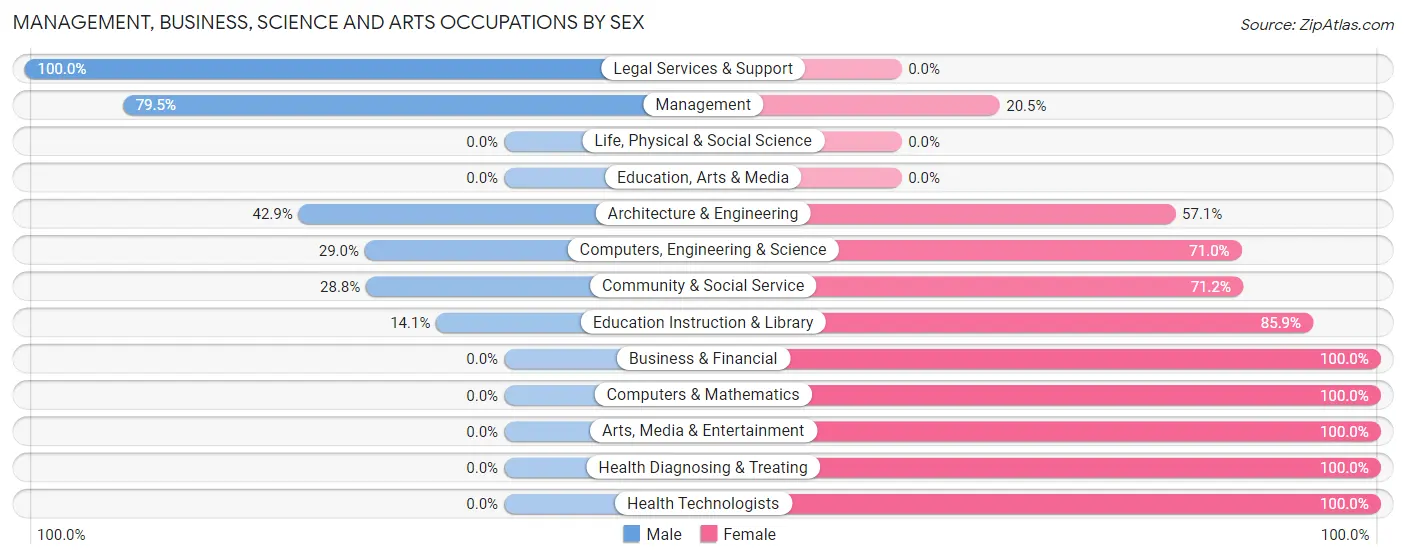
| Occupation | Male | Female |
| Management | 101 (79.5%) | 26 (20.5%) |
| Business & Financial | 0 (0.0%) | 9 (100.0%) |
| Computers, Engineering & Science | 9 (29.0%) | 22 (71.0%) |
| Computers & Mathematics | 0 (0.0%) | 10 (100.0%) |
| Architecture & Engineering | 9 (42.9%) | 12 (57.1%) |
| Life, Physical & Social Science | 0 (0.0%) | 0 (0.0%) |
| Community & Social Service | 44 (28.8%) | 109 (71.2%) |
| Education, Arts & Media | 0 (0.0%) | 0 (0.0%) |
| Legal Services & Support | 31 (100.0%) | 0 (0.0%) |
| Education Instruction & Library | 13 (14.1%) | 79 (85.9%) |
| Arts, Media & Entertainment | 0 (0.0%) | 30 (100.0%) |
| Health Diagnosing & Treating | 0 (0.0%) | 13 (100.0%) |
| Health Technologists | 0 (0.0%) | 13 (100.0%) |
| Total (Category) | 154 (46.3%) | 179 (53.7%) |
| Total (Overall) | 436 (52.8%) | 390 (47.2%) |
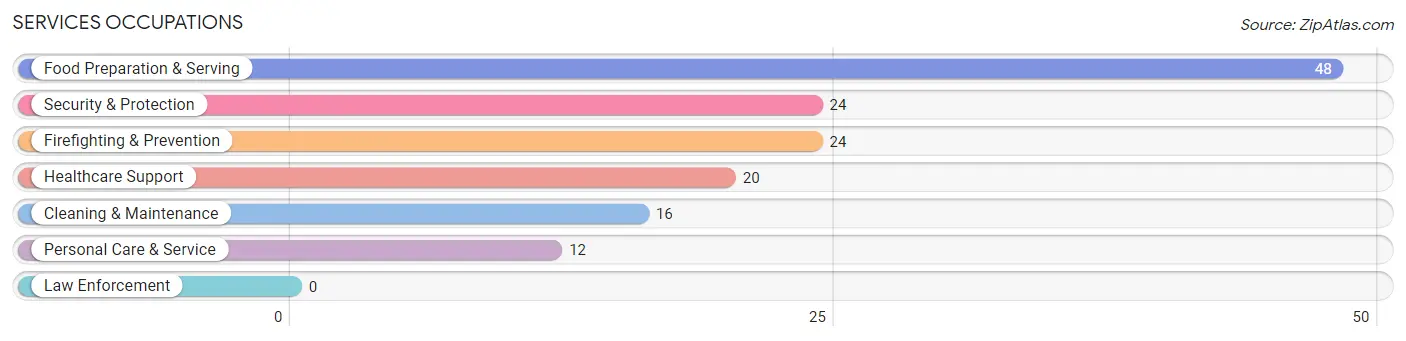
Services Occupations
The most common Services occupations in Remsenburg Speonk are Food Preparation & Serving (48 | 5.8%), Security & Protection (24 | 2.9%), Firefighting & Prevention (24 | 2.9%), Healthcare Support (20 | 2.4%), and Cleaning & Maintenance (16 | 1.9%).
Services Occupations by Sex
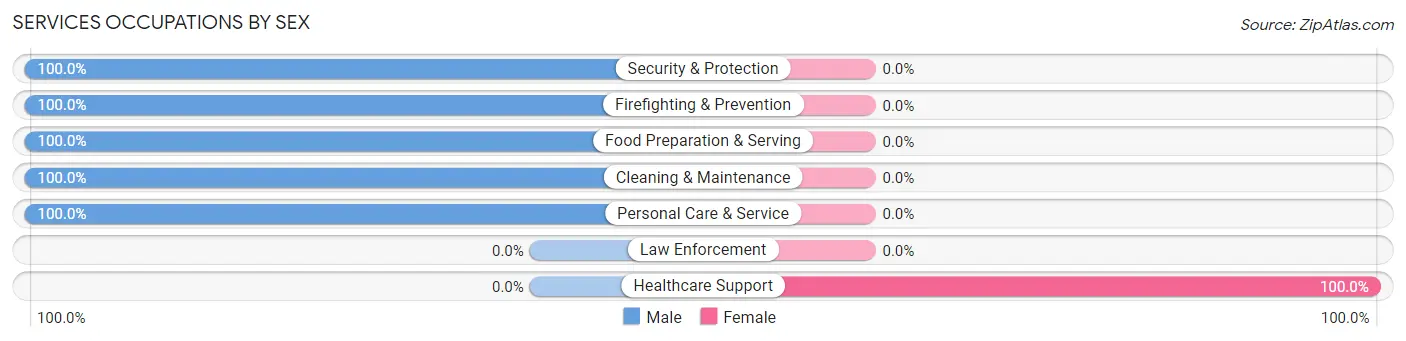
| Occupation | Male | Female |
| Healthcare Support | 0 (0.0%) | 20 (100.0%) |
| Security & Protection | 24 (100.0%) | 0 (0.0%) |
| Firefighting & Prevention | 24 (100.0%) | 0 (0.0%) |
| Law Enforcement | 0 (0.0%) | 0 (0.0%) |
| Food Preparation & Serving | 48 (100.0%) | 0 (0.0%) |
| Cleaning & Maintenance | 16 (100.0%) | 0 (0.0%) |
| Personal Care & Service | 12 (100.0%) | 0 (0.0%) |
| Total (Category) | 100 (83.3%) | 20 (16.7%) |
| Total (Overall) | 436 (52.8%) | 390 (47.2%) |
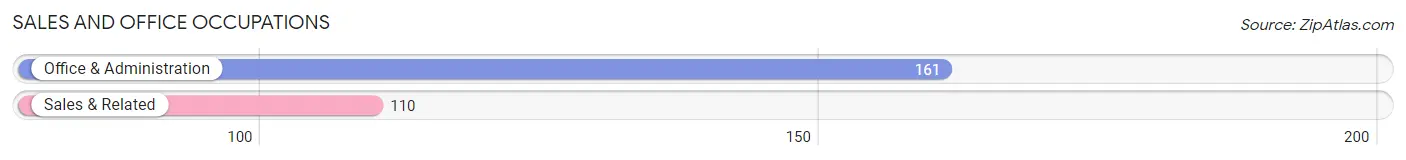
Sales and Office Occupations
The most common Sales and Office occupations in Remsenburg Speonk are Office & Administration (161 | 19.5%), and Sales & Related (110 | 13.3%).
Sales and Office Occupations by Sex
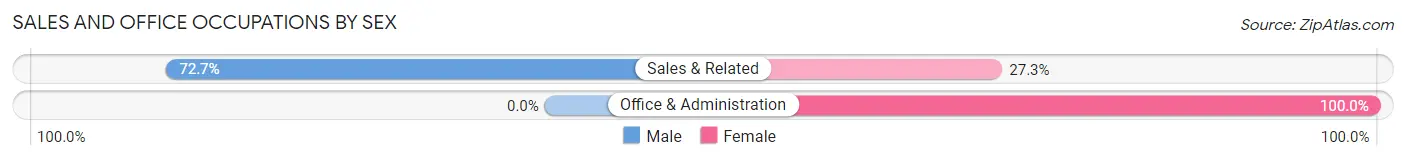
| Occupation | Male | Female |
| Sales & Related | 80 (72.7%) | 30 (27.3%) |
| Office & Administration | 0 (0.0%) | 161 (100.0%) |
| Total (Category) | 80 (29.5%) | 191 (70.5%) |
| Total (Overall) | 436 (52.8%) | 390 (47.2%) |
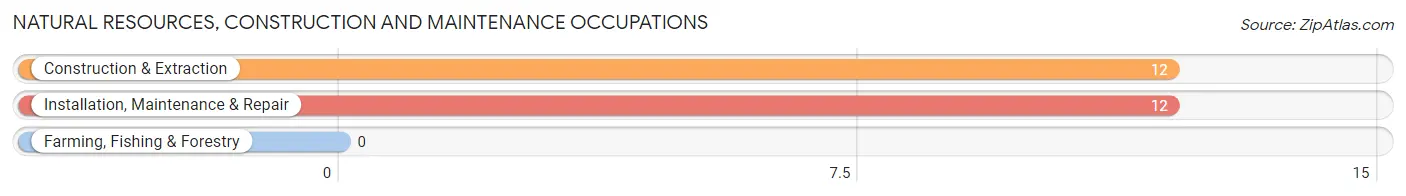
Natural Resources, Construction and Maintenance Occupations
The most common Natural Resources, Construction and Maintenance occupations in Remsenburg Speonk are Construction & Extraction (12 | 1.5%), and Installation, Maintenance & Repair (12 | 1.5%).
Natural Resources, Construction and Maintenance Occupations by Sex
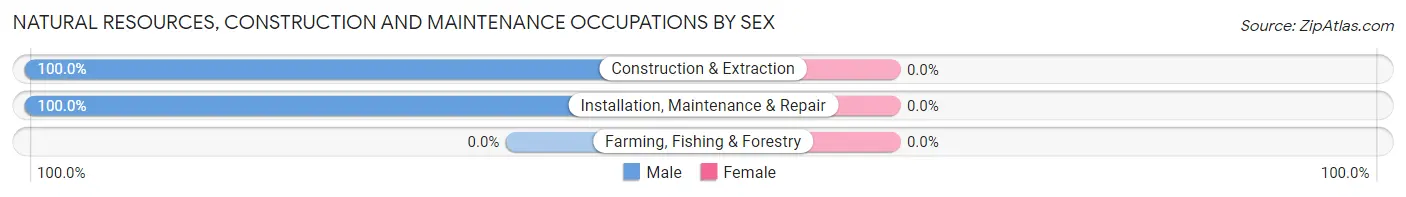
| Occupation | Male | Female |
| Farming, Fishing & Forestry | 0 (0.0%) | 0 (0.0%) |
| Construction & Extraction | 12 (100.0%) | 0 (0.0%) |
| Installation, Maintenance & Repair | 12 (100.0%) | 0 (0.0%) |
| Total (Category) | 24 (100.0%) | 0 (0.0%) |
| Total (Overall) | 436 (52.8%) | 390 (47.2%) |
Production, Transportation and Moving Occupations
The most common Production, Transportation and Moving occupations in Remsenburg Speonk are Transportation (39 | 4.7%), Production (26 | 3.2%), and Material Moving (13 | 1.6%).
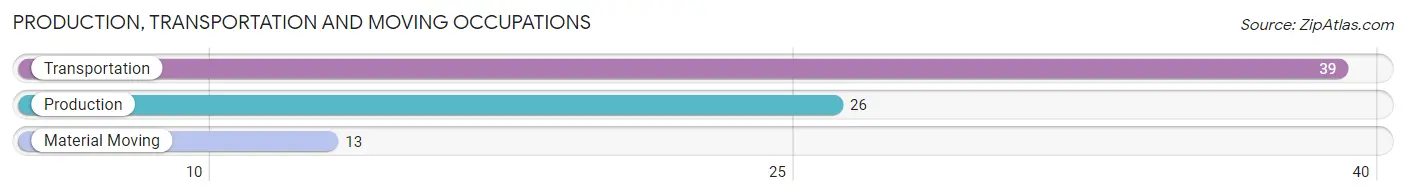
Production, Transportation and Moving Occupations by Sex
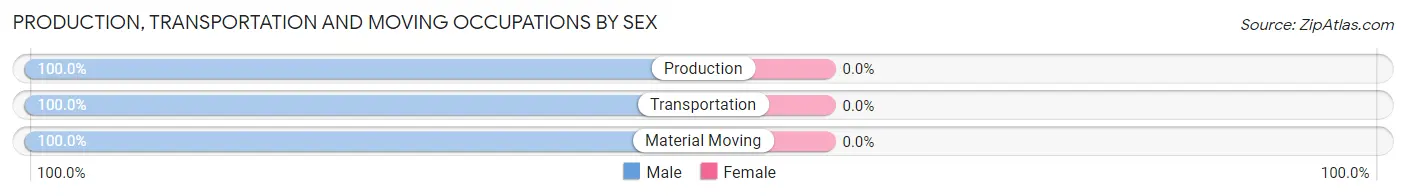
| Occupation | Male | Female |
| Production | 26 (100.0%) | 0 (0.0%) |
| Transportation | 39 (100.0%) | 0 (0.0%) |
| Material Moving | 13 (100.0%) | 0 (0.0%) |
| Total (Category) | 78 (100.0%) | 0 (0.0%) |
| Total (Overall) | 436 (52.8%) | 390 (47.2%) |
Employment Industries by Sex in Remsenburg Speonk
Employment Industries in Remsenburg Speonk
The major employment industries in Remsenburg Speonk include Professional & Scientific (125 | 15.1%), Finance & Insurance (124 | 15.0%), Educational Services (92 | 11.1%), Health Care & Social Assistance (89 | 10.8%), and Construction (59 | 7.1%).
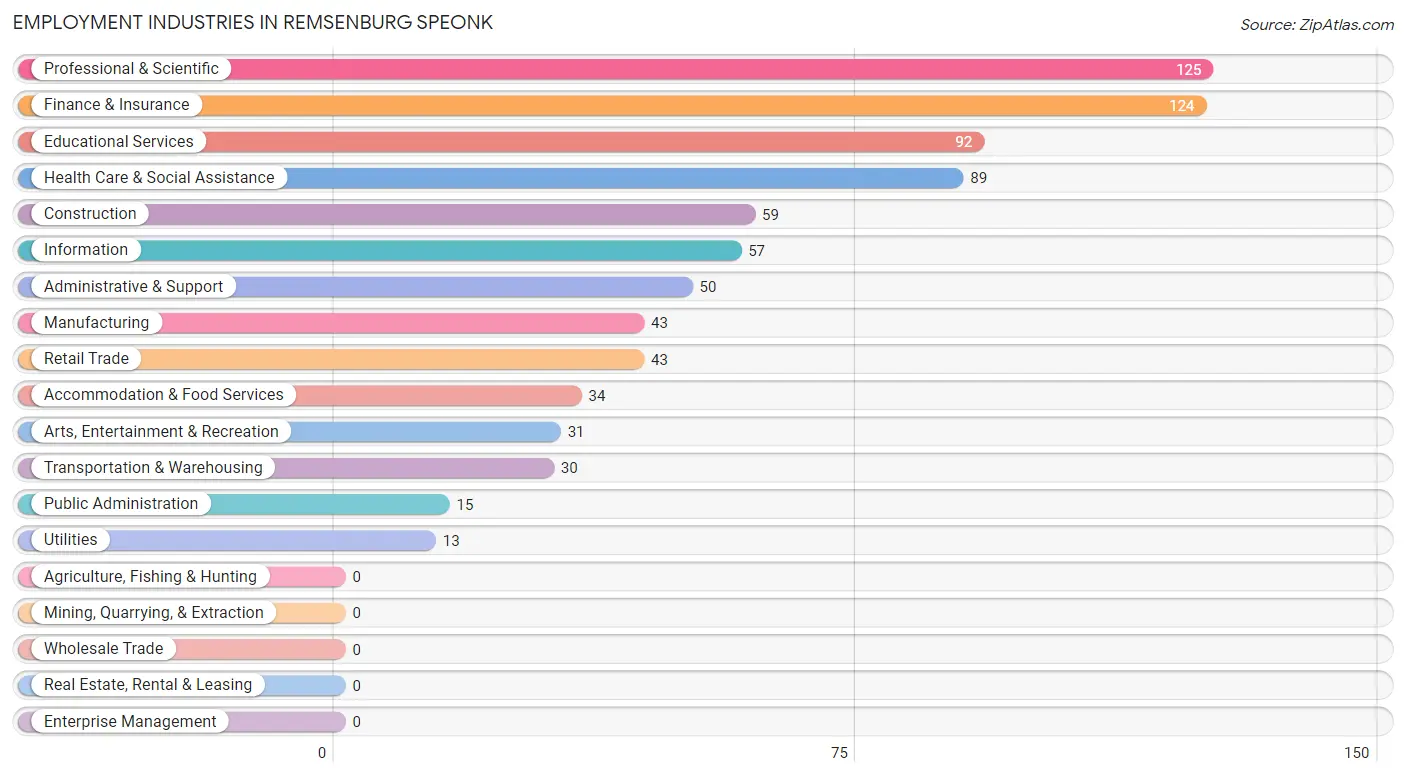
Employment Industries by Sex in Remsenburg Speonk
The Remsenburg Speonk industries that see more men than women are Manufacturing (100.0%), Transportation & Warehousing (100.0%), and Utilities (100.0%), whereas the industries that tend to have a higher number of women are Public Administration (100.0%), Educational Services (85.9%), and Health Care & Social Assistance (82.0%).
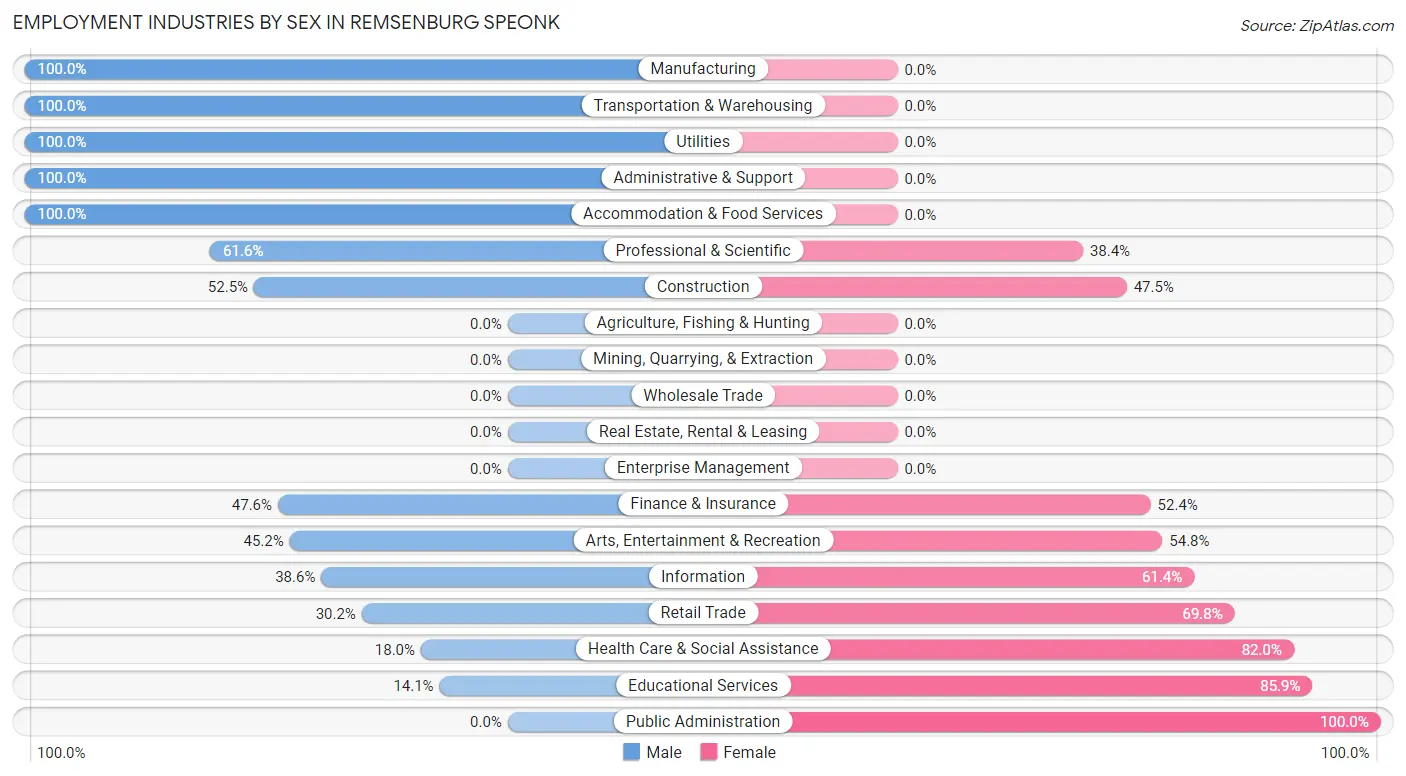
| Industry | Male | Female |
| Agriculture, Fishing & Hunting | 0 (0.0%) | 0 (0.0%) |
| Mining, Quarrying, & Extraction | 0 (0.0%) | 0 (0.0%) |
| Construction | 31 (52.5%) | 28 (47.5%) |
| Manufacturing | 43 (100.0%) | 0 (0.0%) |
| Wholesale Trade | 0 (0.0%) | 0 (0.0%) |
| Retail Trade | 13 (30.2%) | 30 (69.8%) |
| Transportation & Warehousing | 30 (100.0%) | 0 (0.0%) |
| Utilities | 13 (100.0%) | 0 (0.0%) |
| Information | 22 (38.6%) | 35 (61.4%) |
| Finance & Insurance | 59 (47.6%) | 65 (52.4%) |
| Real Estate, Rental & Leasing | 0 (0.0%) | 0 (0.0%) |
| Professional & Scientific | 77 (61.6%) | 48 (38.4%) |
| Enterprise Management | 0 (0.0%) | 0 (0.0%) |
| Administrative & Support | 50 (100.0%) | 0 (0.0%) |
| Educational Services | 13 (14.1%) | 79 (85.9%) |
| Health Care & Social Assistance | 16 (18.0%) | 73 (82.0%) |
| Arts, Entertainment & Recreation | 14 (45.2%) | 17 (54.8%) |
| Accommodation & Food Services | 34 (100.0%) | 0 (0.0%) |
| Public Administration | 0 (0.0%) | 15 (100.0%) |
| Total | 436 (52.8%) | 390 (47.2%) |
Education in Remsenburg Speonk
School Enrollment in Remsenburg Speonk
The most common levels of schooling among the 310 students in Remsenburg Speonk are high school (125 | 40.3%), middle school (109 | 35.2%), and elementary school (39 | 12.6%).
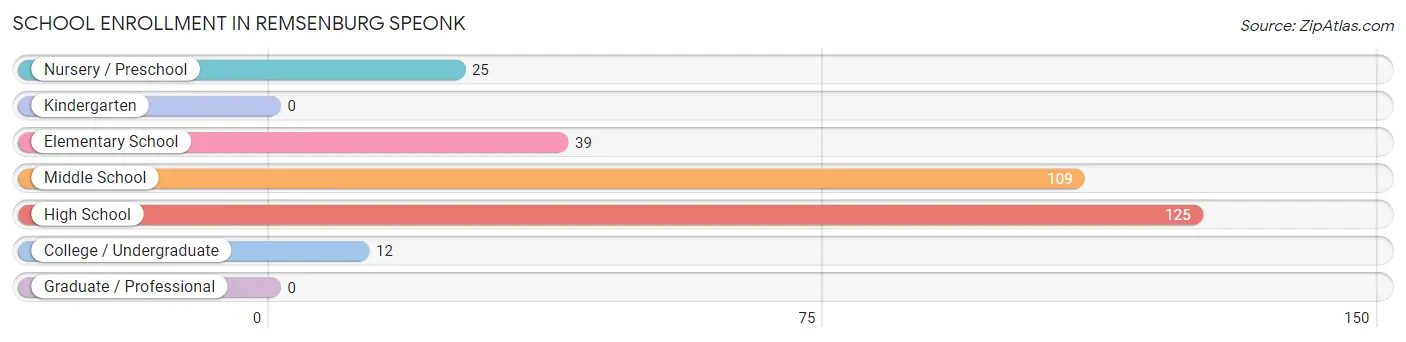
| School Level | # Students | % Students |
| Nursery / Preschool | 25 | 8.1% |
| Kindergarten | 0 | 0.0% |
| Elementary School | 39 | 12.6% |
| Middle School | 109 | 35.2% |
| High School | 125 | 40.3% |
| College / Undergraduate | 12 | 3.9% |
| Graduate / Professional | 0 | 0.0% |
| Total | 310 | 100.0% |
School Enrollment by Age by Funding Source in Remsenburg Speonk
Out of a total of 310 students who are enrolled in schools in Remsenburg Speonk, 11 (3.5%) attend a private institution, while the remaining 299 (96.5%) are enrolled in public schools. The age group of 3 to 4 year olds has the highest likelihood of being enrolled in private schools, with 11 (100.0% in the age bracket) enrolled. Conversely, the age group of 5 to 9 year old has the lowest likelihood of being enrolled in a private school, with 53 (100.0% in the age bracket) attending a public institution.
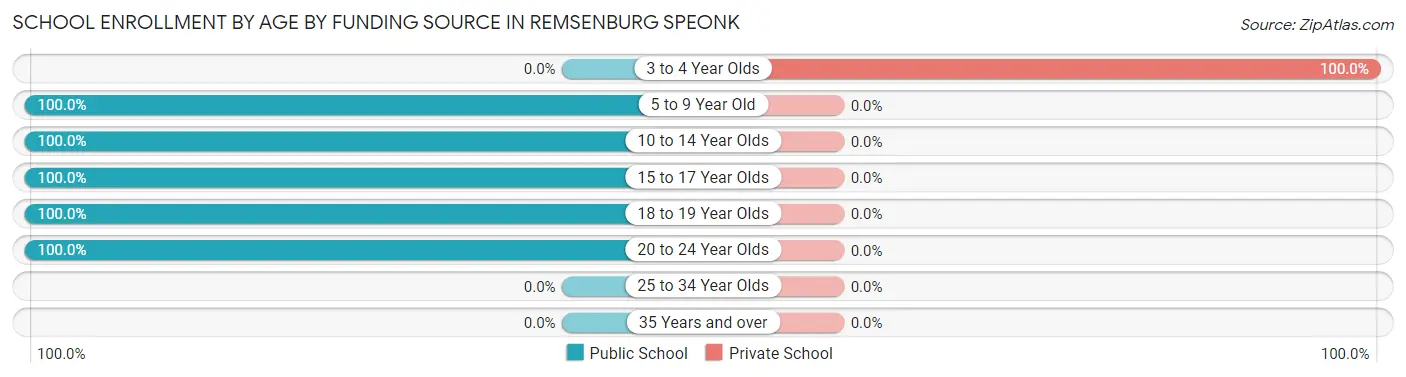
| Age Bracket | Public School | Private School |
| 3 to 4 Year Olds | 0 (0.0%) | 11 (100.0%) |
| 5 to 9 Year Old | 53 (100.0%) | 0 (0.0%) |
| 10 to 14 Year Olds | 133 (100.0%) | 0 (0.0%) |
| 15 to 17 Year Olds | 83 (100.0%) | 0 (0.0%) |
| 18 to 19 Year Olds | 18 (100.0%) | 0 (0.0%) |
| 20 to 24 Year Olds | 12 (100.0%) | 0 (0.0%) |
| 25 to 34 Year Olds | 0 (0.0%) | 0 (0.0%) |
| 35 Years and over | 0 (0.0%) | 0 (0.0%) |
| Total | 299 (96.5%) | 11 (3.5%) |
Educational Attainment by Field of Study in Remsenburg Speonk
Education (162 | 20.7%), social sciences (116 | 14.8%), business (115 | 14.7%), liberal arts & history (97 | 12.4%), and physical & health sciences (59 | 7.5%) are the most common fields of study among 783 individuals in Remsenburg Speonk who have obtained a bachelor's degree or higher.
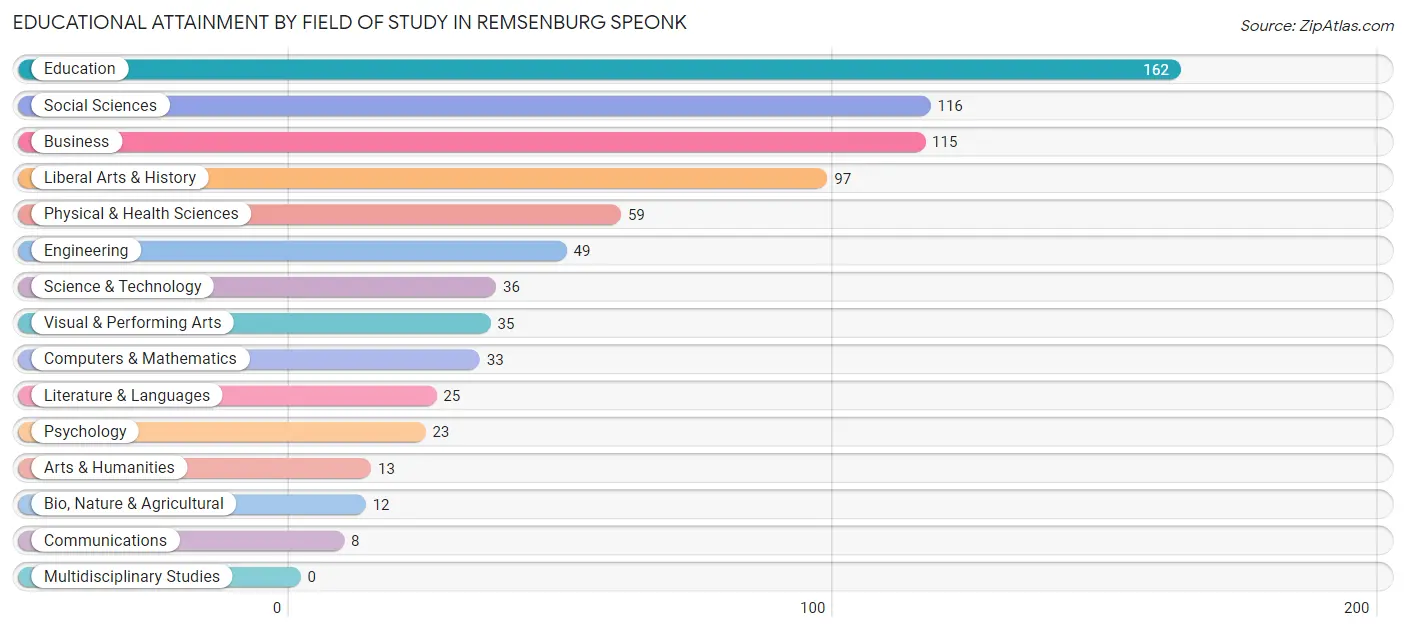
| Field of Study | # Graduates | % Graduates |
| Computers & Mathematics | 33 | 4.2% |
| Bio, Nature & Agricultural | 12 | 1.5% |
| Physical & Health Sciences | 59 | 7.5% |
| Psychology | 23 | 2.9% |
| Social Sciences | 116 | 14.8% |
| Engineering | 49 | 6.3% |
| Multidisciplinary Studies | 0 | 0.0% |
| Science & Technology | 36 | 4.6% |
| Business | 115 | 14.7% |
| Education | 162 | 20.7% |
| Literature & Languages | 25 | 3.2% |
| Liberal Arts & History | 97 | 12.4% |
| Visual & Performing Arts | 35 | 4.5% |
| Communications | 8 | 1.0% |
| Arts & Humanities | 13 | 1.7% |
| Total | 783 | 100.0% |
Transportation & Commute in Remsenburg Speonk
Vehicle Availability by Sex in Remsenburg Speonk
The most prevalent vehicle ownership categories in Remsenburg Speonk are males with 2 vehicles (293, accounting for 67.2%) and females with 2 vehicles (148, making up 78.5%).
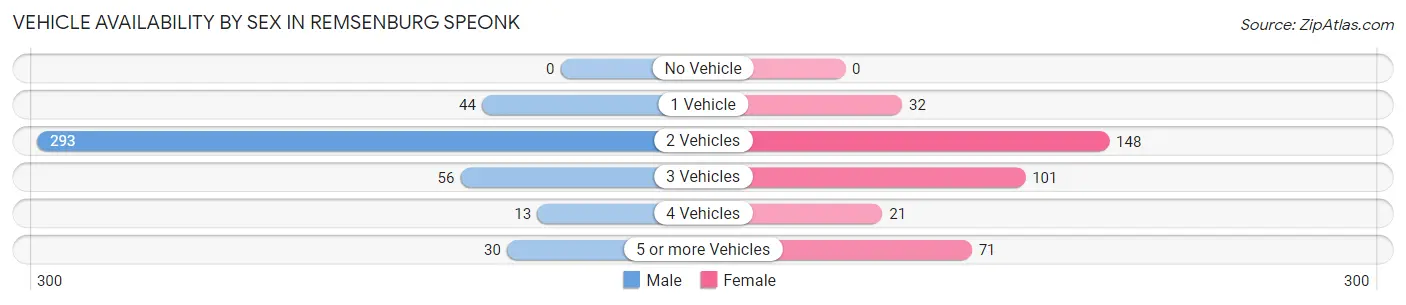
| Vehicles Available | Male | Female |
| No Vehicle | 0 (0.0%) | 0 (0.0%) |
| 1 Vehicle | 44 (10.1%) | 32 (8.6%) |
| 2 Vehicles | 293 (67.2%) | 148 (39.7%) |
| 3 Vehicles | 56 (12.8%) | 101 (27.1%) |
| 4 Vehicles | 13 (3.0%) | 21 (5.6%) |
| 5 or more Vehicles | 30 (6.9%) | 71 (19.0%) |
| Total | 436 (100.0%) | 373 (100.0%) |
Commute Time in Remsenburg Speonk
The most frequently occuring commute durations in Remsenburg Speonk are 30 to 34 minutes (132 commuters, 19.7%), 45 to 59 minutes (109 commuters, 16.3%), and 15 to 19 minutes (99 commuters, 14.8%).
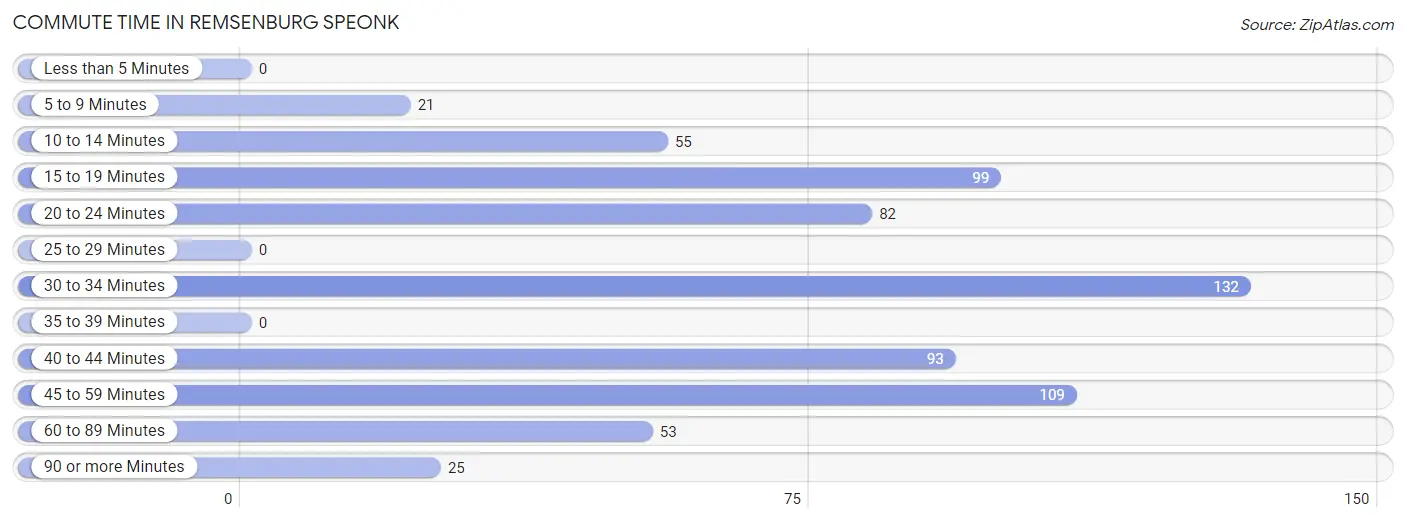
| Commute Time | # Commuters | % Commuters |
| Less than 5 Minutes | 0 | 0.0% |
| 5 to 9 Minutes | 21 | 3.1% |
| 10 to 14 Minutes | 55 | 8.2% |
| 15 to 19 Minutes | 99 | 14.8% |
| 20 to 24 Minutes | 82 | 12.3% |
| 25 to 29 Minutes | 0 | 0.0% |
| 30 to 34 Minutes | 132 | 19.7% |
| 35 to 39 Minutes | 0 | 0.0% |
| 40 to 44 Minutes | 93 | 13.9% |
| 45 to 59 Minutes | 109 | 16.3% |
| 60 to 89 Minutes | 53 | 7.9% |
| 90 or more Minutes | 25 | 3.7% |
Commute Time by Sex in Remsenburg Speonk
The most common commute times in Remsenburg Speonk are 45 to 59 minutes (81 commuters, 21.0%) for males and 30 to 34 minutes (66 commuters, 23.3%) for females.
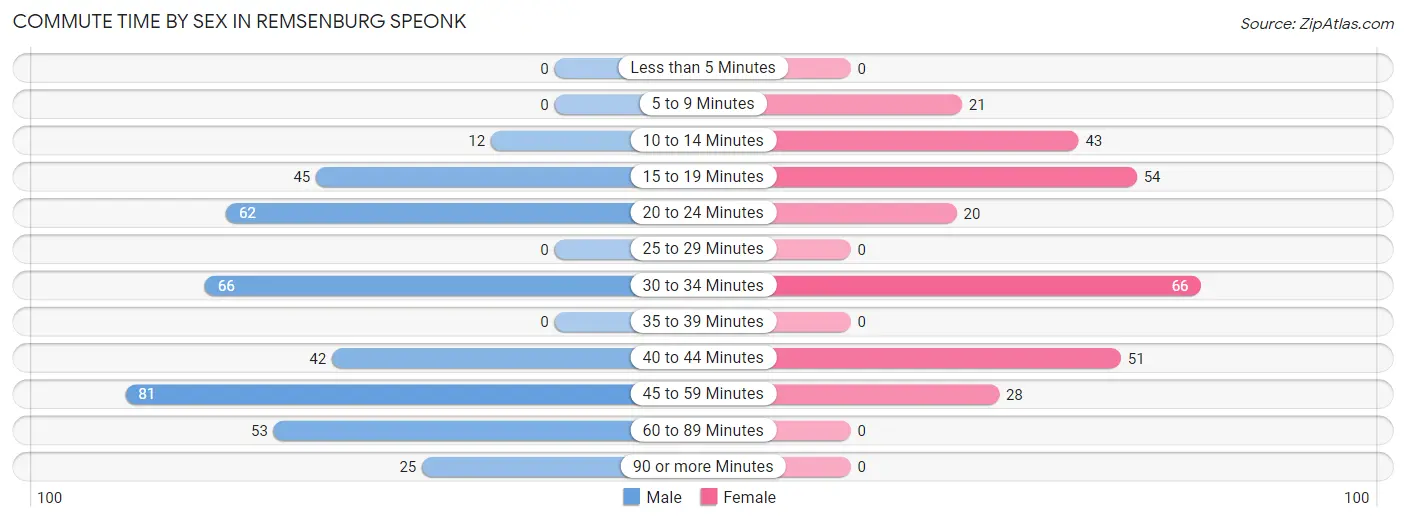
| Commute Time | Male | Female |
| Less than 5 Minutes | 0 (0.0%) | 0 (0.0%) |
| 5 to 9 Minutes | 0 (0.0%) | 21 (7.4%) |
| 10 to 14 Minutes | 12 (3.1%) | 43 (15.2%) |
| 15 to 19 Minutes | 45 (11.7%) | 54 (19.1%) |
| 20 to 24 Minutes | 62 (16.1%) | 20 (7.1%) |
| 25 to 29 Minutes | 0 (0.0%) | 0 (0.0%) |
| 30 to 34 Minutes | 66 (17.1%) | 66 (23.3%) |
| 35 to 39 Minutes | 0 (0.0%) | 0 (0.0%) |
| 40 to 44 Minutes | 42 (10.9%) | 51 (18.0%) |
| 45 to 59 Minutes | 81 (21.0%) | 28 (9.9%) |
| 60 to 89 Minutes | 53 (13.7%) | 0 (0.0%) |
| 90 or more Minutes | 25 (6.5%) | 0 (0.0%) |
Time of Departure to Work by Sex in Remsenburg Speonk
The most frequent times of departure to work in Remsenburg Speonk are 6:30 AM to 6:59 AM (77, 20.0%) for males and 7:30 AM to 7:59 AM (124, 43.8%) for females.
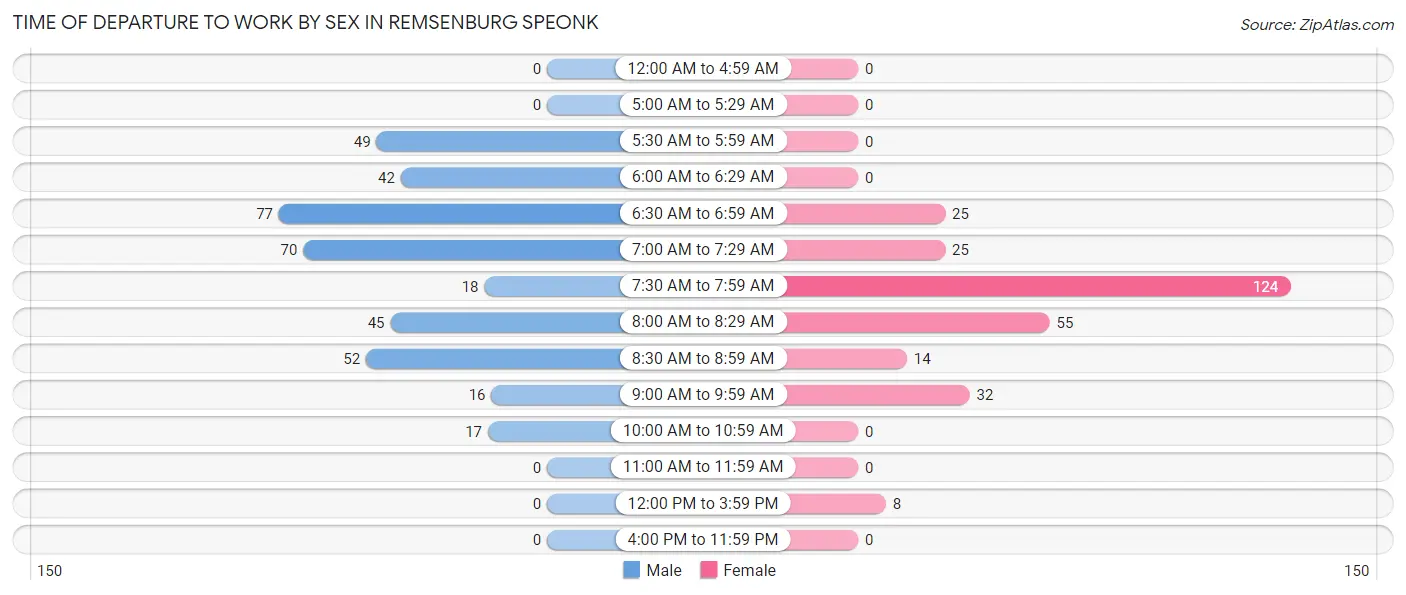
| Time of Departure | Male | Female |
| 12:00 AM to 4:59 AM | 0 (0.0%) | 0 (0.0%) |
| 5:00 AM to 5:29 AM | 0 (0.0%) | 0 (0.0%) |
| 5:30 AM to 5:59 AM | 49 (12.7%) | 0 (0.0%) |
| 6:00 AM to 6:29 AM | 42 (10.9%) | 0 (0.0%) |
| 6:30 AM to 6:59 AM | 77 (20.0%) | 25 (8.8%) |
| 7:00 AM to 7:29 AM | 70 (18.1%) | 25 (8.8%) |
| 7:30 AM to 7:59 AM | 18 (4.7%) | 124 (43.8%) |
| 8:00 AM to 8:29 AM | 45 (11.7%) | 55 (19.4%) |
| 8:30 AM to 8:59 AM | 52 (13.5%) | 14 (5.0%) |
| 9:00 AM to 9:59 AM | 16 (4.2%) | 32 (11.3%) |
| 10:00 AM to 10:59 AM | 17 (4.4%) | 0 (0.0%) |
| 11:00 AM to 11:59 AM | 0 (0.0%) | 0 (0.0%) |
| 12:00 PM to 3:59 PM | 0 (0.0%) | 8 (2.8%) |
| 4:00 PM to 11:59 PM | 0 (0.0%) | 0 (0.0%) |
| Total | 386 (100.0%) | 283 (100.0%) |
Housing Occupancy in Remsenburg Speonk
Occupancy by Ownership in Remsenburg Speonk
Of the total 782 dwellings in Remsenburg Speonk, owner-occupied units account for 644 (82.4%), while renter-occupied units make up 138 (17.6%).
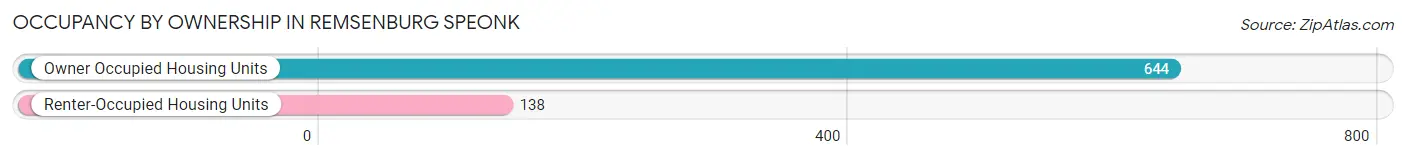
| Occupancy | # Housing Units | % Housing Units |
| Owner Occupied Housing Units | 644 | 82.4% |
| Renter-Occupied Housing Units | 138 | 17.6% |
| Total Occupied Housing Units | 782 | 100.0% |
Occupancy by Household Size in Remsenburg Speonk
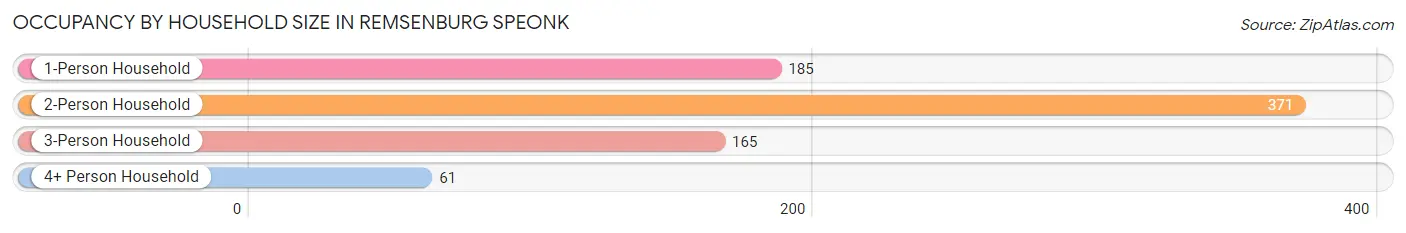
| Household Size | # Housing Units | % Housing Units |
| 1-Person Household | 185 | 23.7% |
| 2-Person Household | 371 | 47.4% |
| 3-Person Household | 165 | 21.1% |
| 4+ Person Household | 61 | 7.8% |
| Total Housing Units | 782 | 100.0% |
Occupancy by Ownership by Household Size in Remsenburg Speonk
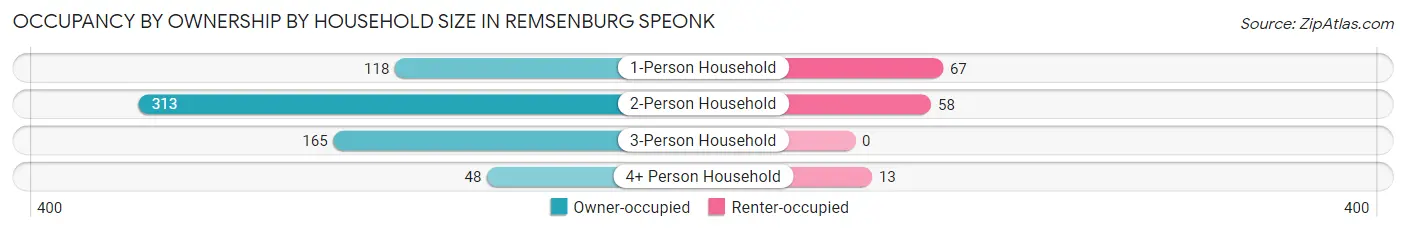
| Household Size | Owner-occupied | Renter-occupied |
| 1-Person Household | 118 (63.8%) | 67 (36.2%) |
| 2-Person Household | 313 (84.4%) | 58 (15.6%) |
| 3-Person Household | 165 (100.0%) | 0 (0.0%) |
| 4+ Person Household | 48 (78.7%) | 13 (21.3%) |
| Total Housing Units | 644 (82.4%) | 138 (17.6%) |
Occupancy by Educational Attainment in Remsenburg Speonk
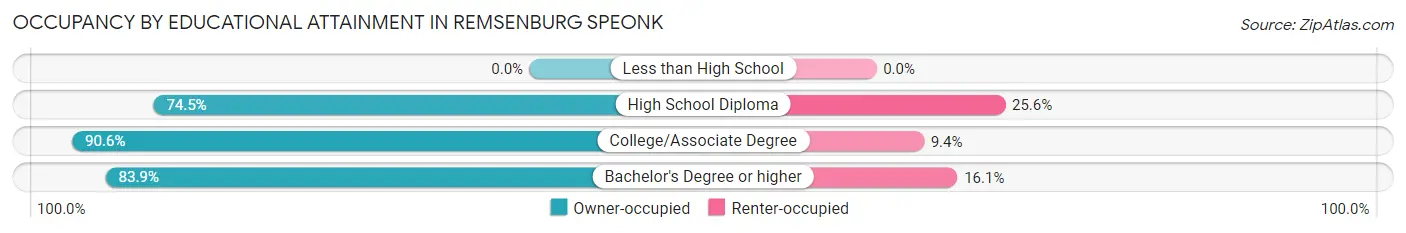
| Household Size | Owner-occupied | Renter-occupied |
| Less than High School | 0 (0.0%) | 0 (0.0%) |
| High School Diploma | 169 (74.5%) | 58 (25.6%) |
| College/Associate Degree | 125 (90.6%) | 13 (9.4%) |
| Bachelor's Degree or higher | 350 (83.9%) | 67 (16.1%) |
Occupancy by Age of Householder in Remsenburg Speonk
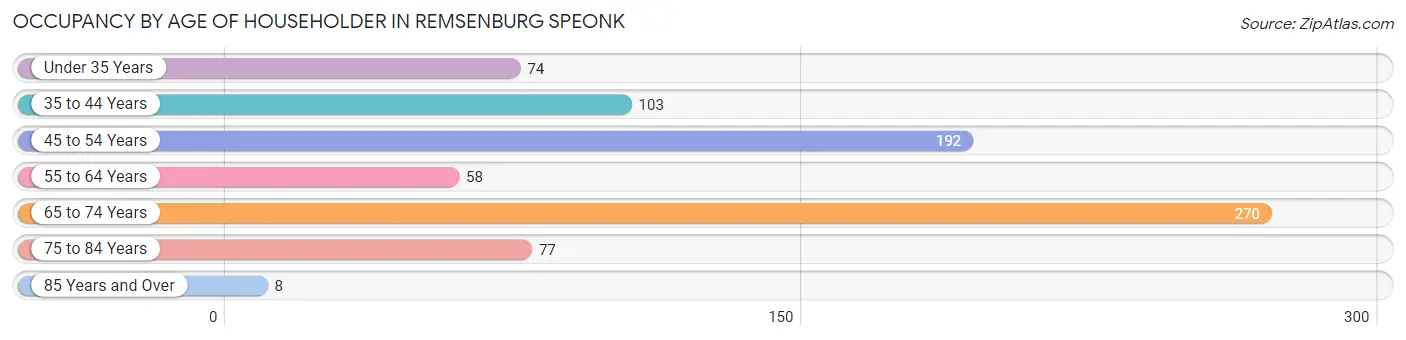
| Age Bracket | # Households | % Households |
| Under 35 Years | 74 | 9.5% |
| 35 to 44 Years | 103 | 13.2% |
| 45 to 54 Years | 192 | 24.5% |
| 55 to 64 Years | 58 | 7.4% |
| 65 to 74 Years | 270 | 34.5% |
| 75 to 84 Years | 77 | 9.9% |
| 85 Years and Over | 8 | 1.0% |
| Total | 782 | 100.0% |
Housing Finances in Remsenburg Speonk
Median Income by Occupancy in Remsenburg Speonk
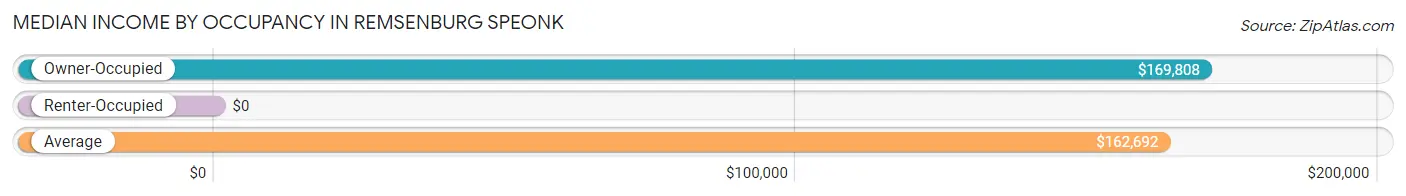
| Occupancy Type | # Households | Median Income |
| Owner-Occupied | 644 (82.4%) | $169,808 |
| Renter-Occupied | 138 (17.6%) | $0 |
| Average | 782 (100.0%) | $162,692 |
Occupancy by Householder Income Bracket in Remsenburg Speonk
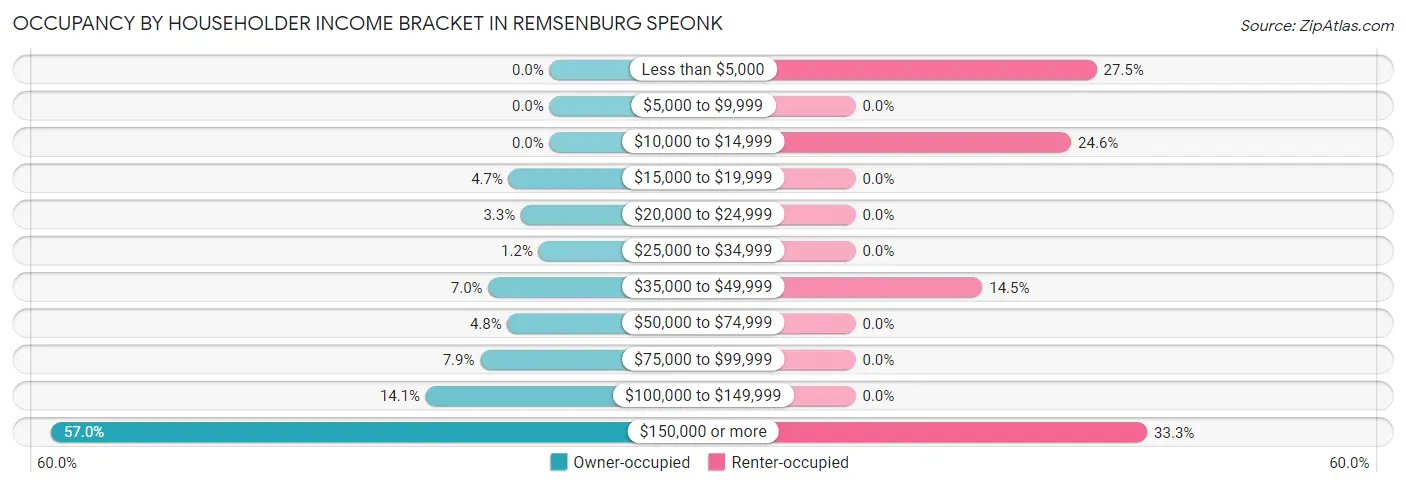
| Income Bracket | Owner-occupied | Renter-occupied |
| Less than $5,000 | 0 (0.0%) | 38 (27.5%) |
| $5,000 to $9,999 | 0 (0.0%) | 0 (0.0%) |
| $10,000 to $14,999 | 0 (0.0%) | 34 (24.6%) |
| $15,000 to $19,999 | 30 (4.7%) | 0 (0.0%) |
| $20,000 to $24,999 | 21 (3.3%) | 0 (0.0%) |
| $25,000 to $34,999 | 8 (1.2%) | 0 (0.0%) |
| $35,000 to $49,999 | 45 (7.0%) | 20 (14.5%) |
| $50,000 to $74,999 | 31 (4.8%) | 0 (0.0%) |
| $75,000 to $99,999 | 51 (7.9%) | 0 (0.0%) |
| $100,000 to $149,999 | 91 (14.1%) | 0 (0.0%) |
| $150,000 or more | 367 (57.0%) | 46 (33.3%) |
| Total | 644 (100.0%) | 138 (100.0%) |
Monthly Housing Cost Tiers in Remsenburg Speonk
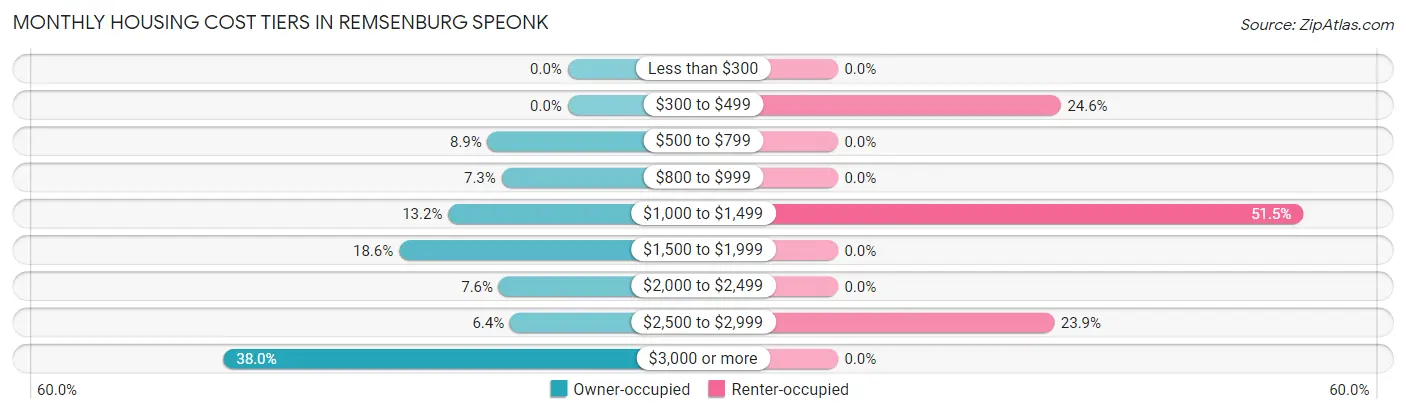
| Monthly Cost | Owner-occupied | Renter-occupied |
| Less than $300 | 0 (0.0%) | 0 (0.0%) |
| $300 to $499 | 0 (0.0%) | 34 (24.6%) |
| $500 to $799 | 57 (8.8%) | 0 (0.0%) |
| $800 to $999 | 47 (7.3%) | 0 (0.0%) |
| $1,000 to $1,499 | 85 (13.2%) | 71 (51.4%) |
| $1,500 to $1,999 | 120 (18.6%) | 0 (0.0%) |
| $2,000 to $2,499 | 49 (7.6%) | 0 (0.0%) |
| $2,500 to $2,999 | 41 (6.4%) | 33 (23.9%) |
| $3,000 or more | 245 (38.0%) | 0 (0.0%) |
| Total | 644 (100.0%) | 138 (100.0%) |
Physical Housing Characteristics in Remsenburg Speonk
Housing Structures in Remsenburg Speonk
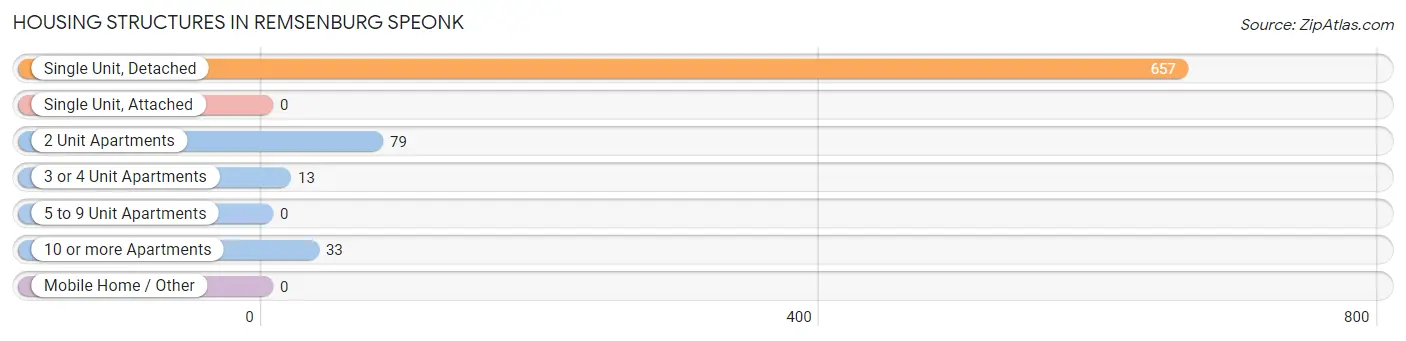
| Structure Type | # Housing Units | % Housing Units |
| Single Unit, Detached | 657 | 84.0% |
| Single Unit, Attached | 0 | 0.0% |
| 2 Unit Apartments | 79 | 10.1% |
| 3 or 4 Unit Apartments | 13 | 1.7% |
| 5 to 9 Unit Apartments | 0 | 0.0% |
| 10 or more Apartments | 33 | 4.2% |
| Mobile Home / Other | 0 | 0.0% |
| Total | 782 | 100.0% |
Housing Structures by Occupancy in Remsenburg Speonk
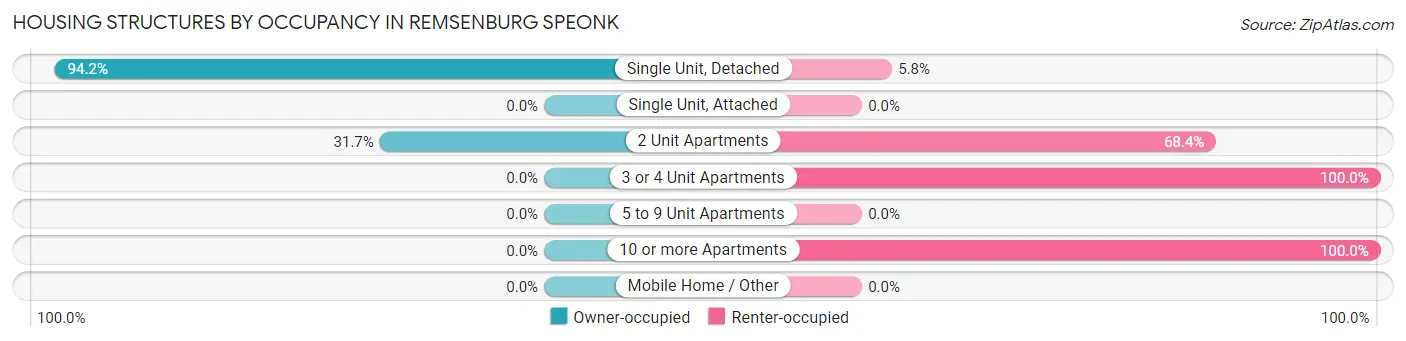
| Structure Type | Owner-occupied | Renter-occupied |
| Single Unit, Detached | 619 (94.2%) | 38 (5.8%) |
| Single Unit, Attached | 0 (0.0%) | 0 (0.0%) |
| 2 Unit Apartments | 25 (31.7%) | 54 (68.3%) |
| 3 or 4 Unit Apartments | 0 (0.0%) | 13 (100.0%) |
| 5 to 9 Unit Apartments | 0 (0.0%) | 0 (0.0%) |
| 10 or more Apartments | 0 (0.0%) | 33 (100.0%) |
| Mobile Home / Other | 0 (0.0%) | 0 (0.0%) |
| Total | 644 (82.4%) | 138 (17.6%) |
Housing Structures by Number of Rooms in Remsenburg Speonk
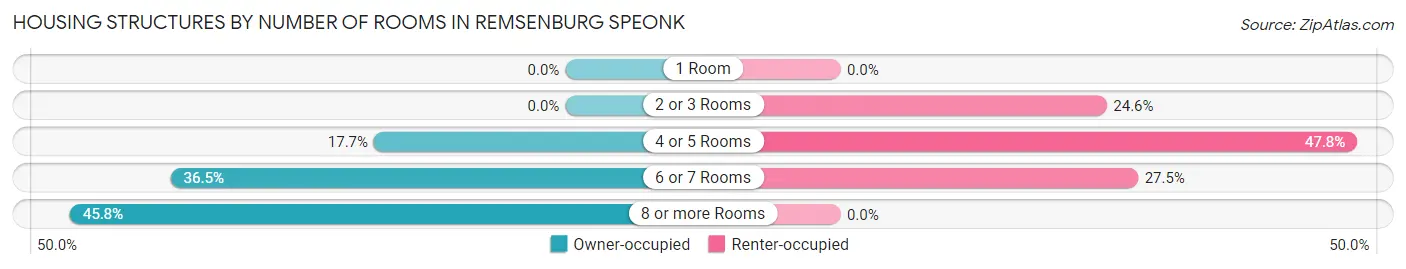
| Number of Rooms | Owner-occupied | Renter-occupied |
| 1 Room | 0 (0.0%) | 0 (0.0%) |
| 2 or 3 Rooms | 0 (0.0%) | 34 (24.6%) |
| 4 or 5 Rooms | 114 (17.7%) | 66 (47.8%) |
| 6 or 7 Rooms | 235 (36.5%) | 38 (27.5%) |
| 8 or more Rooms | 295 (45.8%) | 0 (0.0%) |
| Total | 644 (100.0%) | 138 (100.0%) |
Housing Structure by Heating Type in Remsenburg Speonk
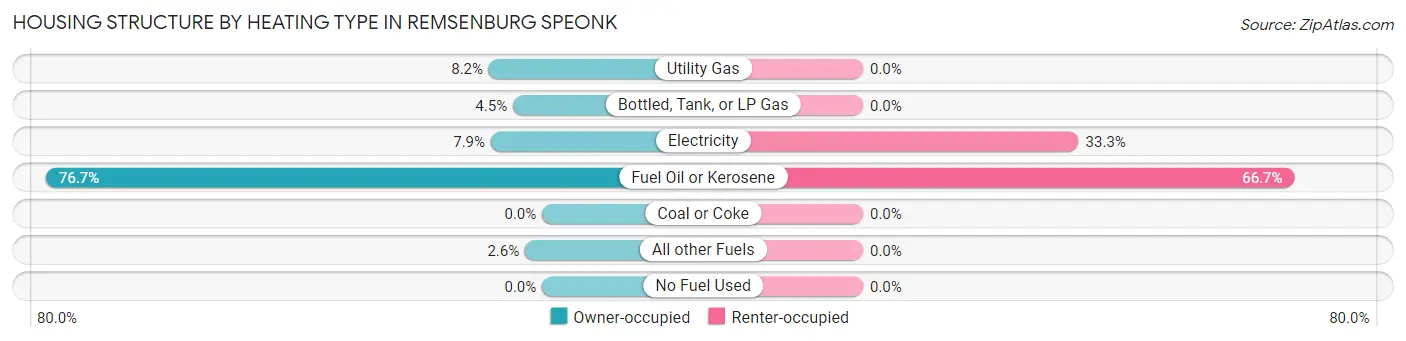
| Heating Type | Owner-occupied | Renter-occupied |
| Utility Gas | 53 (8.2%) | 0 (0.0%) |
| Bottled, Tank, or LP Gas | 29 (4.5%) | 0 (0.0%) |
| Electricity | 51 (7.9%) | 46 (33.3%) |
| Fuel Oil or Kerosene | 494 (76.7%) | 92 (66.7%) |
| Coal or Coke | 0 (0.0%) | 0 (0.0%) |
| All other Fuels | 17 (2.6%) | 0 (0.0%) |
| No Fuel Used | 0 (0.0%) | 0 (0.0%) |
| Total | 644 (100.0%) | 138 (100.0%) |
Household Vehicle Usage in Remsenburg Speonk
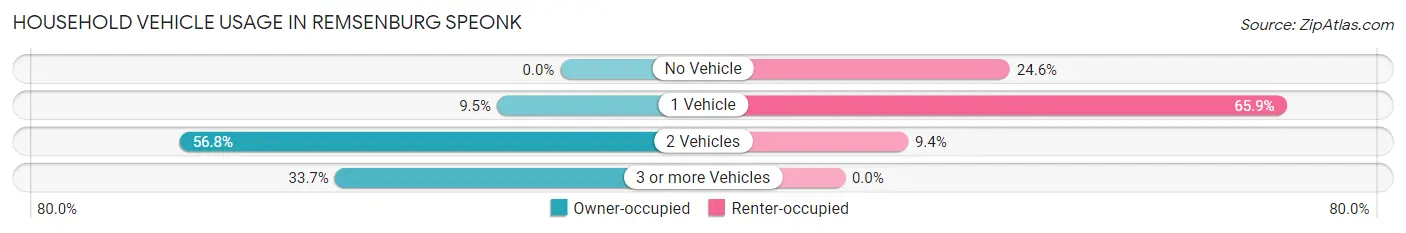
| Vehicles per Household | Owner-occupied | Renter-occupied |
| No Vehicle | 0 (0.0%) | 34 (24.6%) |
| 1 Vehicle | 61 (9.5%) | 91 (65.9%) |
| 2 Vehicles | 366 (56.8%) | 13 (9.4%) |
| 3 or more Vehicles | 217 (33.7%) | 0 (0.0%) |
| Total | 644 (100.0%) | 138 (100.0%) |
Real Estate & Mortgages in Remsenburg Speonk
Real Estate and Mortgage Overview in Remsenburg Speonk
| Characteristic | Without Mortgage | With Mortgage |
| Housing Units | 305 | 339 |
| Median Property Value | $877,700 | $862,600 |
| Median Household Income | $118,523 | $231 |
| Monthly Housing Costs | $1,353 | $245 |
| Real Estate Taxes | $9,160 | $0 |
Property Value by Mortgage Status in Remsenburg Speonk
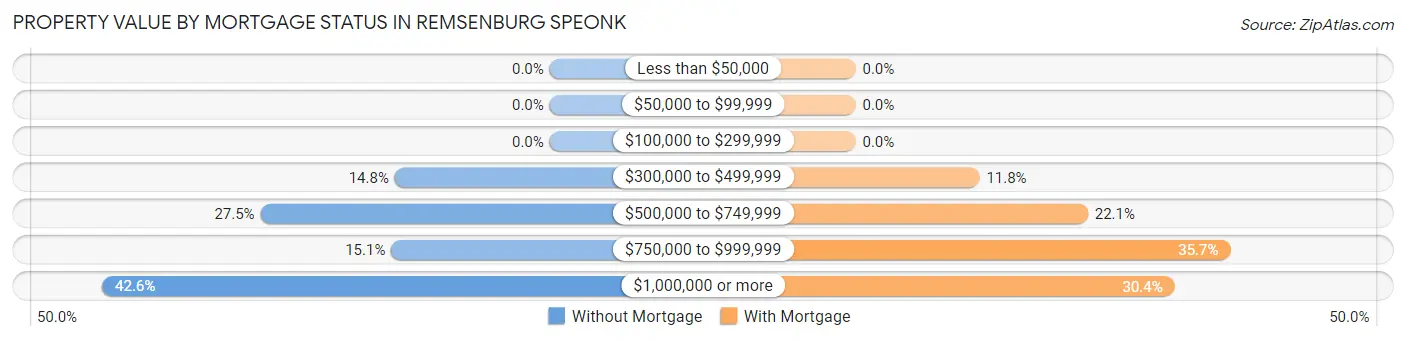
| Property Value | Without Mortgage | With Mortgage |
| Less than $50,000 | 0 (0.0%) | 0 (0.0%) |
| $50,000 to $99,999 | 0 (0.0%) | 0 (0.0%) |
| $100,000 to $299,999 | 0 (0.0%) | 0 (0.0%) |
| $300,000 to $499,999 | 45 (14.7%) | 40 (11.8%) |
| $500,000 to $749,999 | 84 (27.5%) | 75 (22.1%) |
| $750,000 to $999,999 | 46 (15.1%) | 121 (35.7%) |
| $1,000,000 or more | 130 (42.6%) | 103 (30.4%) |
| Total | 305 (100.0%) | 339 (100.0%) |
Household Income by Mortgage Status in Remsenburg Speonk
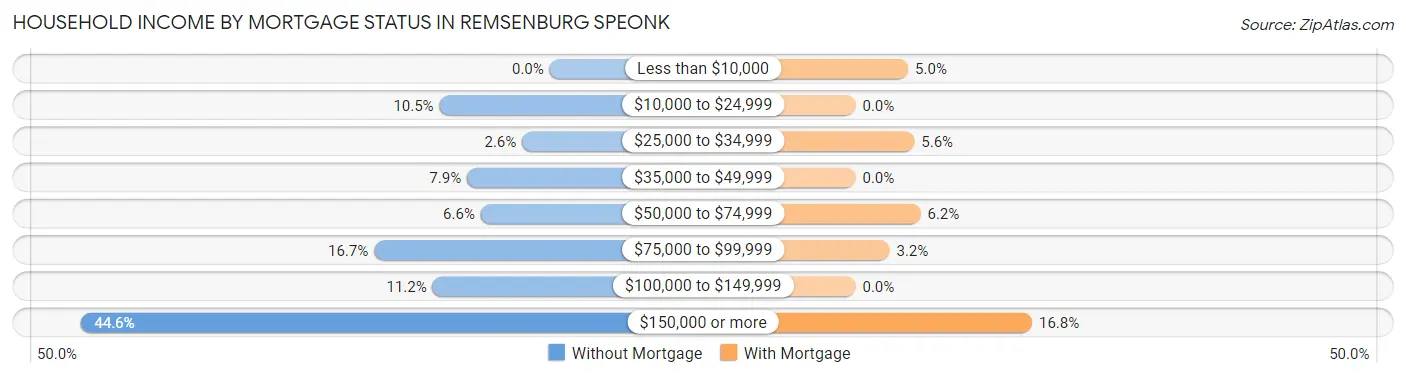
| Household Income | Without Mortgage | With Mortgage |
| Less than $10,000 | 0 (0.0%) | 17 (5.0%) |
| $10,000 to $24,999 | 32 (10.5%) | 0 (0.0%) |
| $25,000 to $34,999 | 8 (2.6%) | 19 (5.6%) |
| $35,000 to $49,999 | 24 (7.9%) | 0 (0.0%) |
| $50,000 to $74,999 | 20 (6.6%) | 21 (6.2%) |
| $75,000 to $99,999 | 51 (16.7%) | 11 (3.2%) |
| $100,000 to $149,999 | 34 (11.2%) | 0 (0.0%) |
| $150,000 or more | 136 (44.6%) | 57 (16.8%) |
| Total | 305 (100.0%) | 339 (100.0%) |
Property Value to Household Income Ratio in Remsenburg Speonk
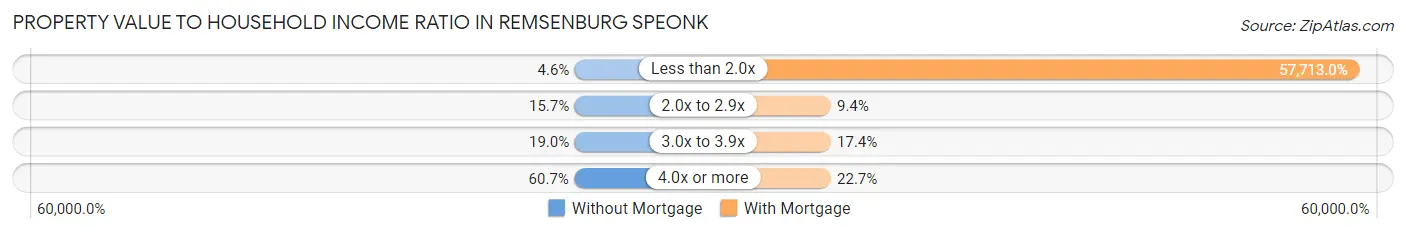
| Value-to-Income Ratio | Without Mortgage | With Mortgage |
| Less than 2.0x | 14 (4.6%) | 195,647 (57,713.0%) |
| 2.0x to 2.9x | 48 (15.7%) | 32 (9.4%) |
| 3.0x to 3.9x | 58 (19.0%) | 59 (17.4%) |
| 4.0x or more | 185 (60.7%) | 77 (22.7%) |
| Total | 305 (100.0%) | 339 (100.0%) |
Real Estate Taxes by Mortgage Status in Remsenburg Speonk
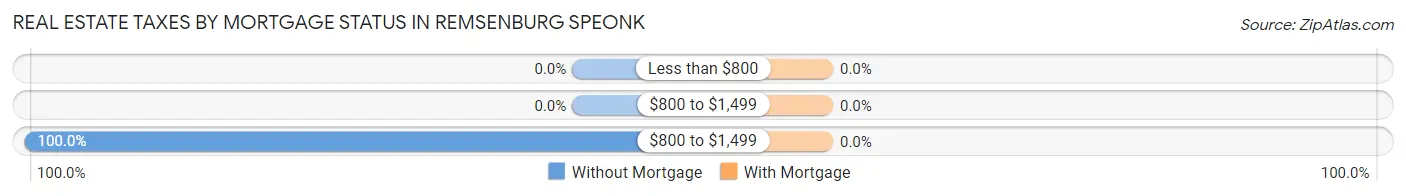
| Property Taxes | Without Mortgage | With Mortgage |
| Less than $800 | 0 (0.0%) | 0 (0.0%) |
| $800 to $1,499 | 0 (0.0%) | 0 (0.0%) |
| $800 to $1,499 | 305 (100.0%) | 0 (0.0%) |
| Total | 305 (100.0%) | 339 (100.0%) |
Health & Disability in Remsenburg Speonk
Health Insurance Coverage by Age in Remsenburg Speonk
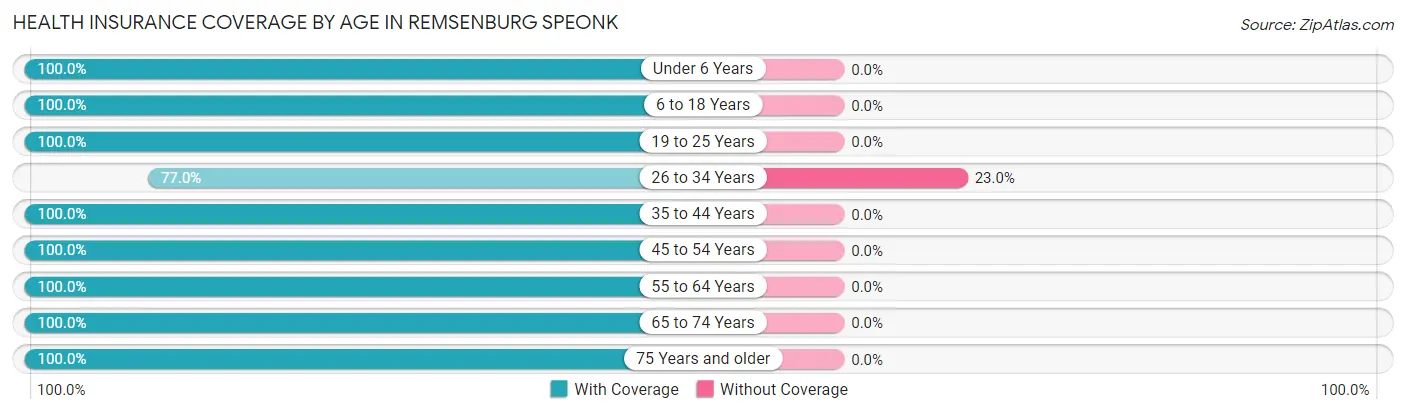
| Age Bracket | With Coverage | Without Coverage |
| Under 6 Years | 61 (100.0%) | 0 (0.0%) |
| 6 to 18 Years | 290 (100.0%) | 0 (0.0%) |
| 19 to 25 Years | 26 (100.0%) | 0 (0.0%) |
| 26 to 34 Years | 87 (77.0%) | 26 (23.0%) |
| 35 to 44 Years | 179 (100.0%) | 0 (0.0%) |
| 45 to 54 Years | 392 (100.0%) | 0 (0.0%) |
| 55 to 64 Years | 136 (100.0%) | 0 (0.0%) |
| 65 to 74 Years | 374 (100.0%) | 0 (0.0%) |
| 75 Years and older | 161 (100.0%) | 0 (0.0%) |
| Total | 1,706 (98.5%) | 26 (1.5%) |
Health Insurance Coverage by Citizenship Status in Remsenburg Speonk
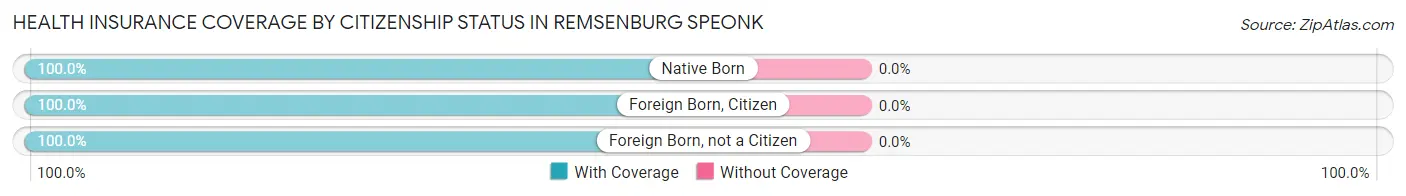
| Citizenship Status | With Coverage | Without Coverage |
| Native Born | 61 (100.0%) | 0 (0.0%) |
| Foreign Born, Citizen | 290 (100.0%) | 0 (0.0%) |
| Foreign Born, not a Citizen | 26 (100.0%) | 0 (0.0%) |
Health Insurance Coverage by Household Income in Remsenburg Speonk
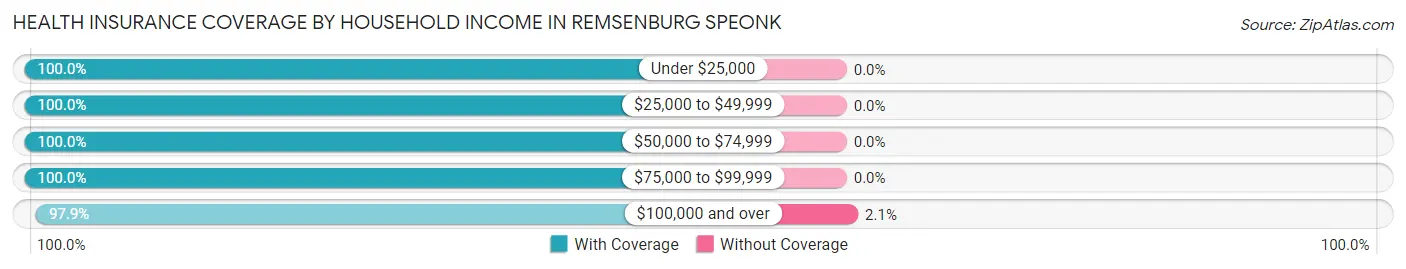
| Household Income | With Coverage | Without Coverage |
| Under $25,000 | 184 (100.0%) | 0 (0.0%) |
| $25,000 to $49,999 | 137 (100.0%) | 0 (0.0%) |
| $50,000 to $74,999 | 68 (100.0%) | 0 (0.0%) |
| $75,000 to $99,999 | 104 (100.0%) | 0 (0.0%) |
| $100,000 and over | 1,196 (97.9%) | 26 (2.1%) |
Public vs Private Health Insurance Coverage by Age in Remsenburg Speonk
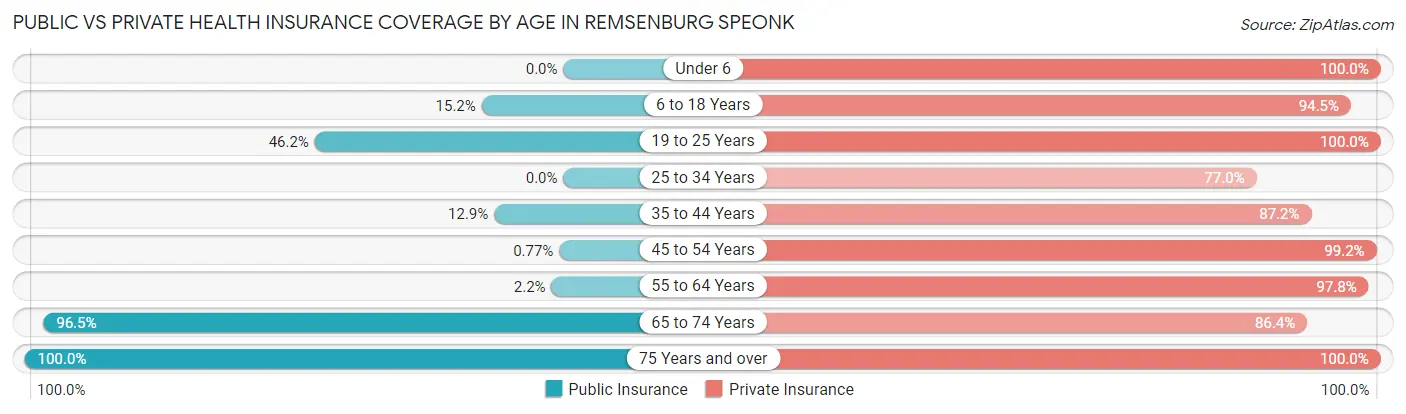
| Age Bracket | Public Insurance | Private Insurance |
| Under 6 | 0 (0.0%) | 61 (100.0%) |
| 6 to 18 Years | 44 (15.2%) | 274 (94.5%) |
| 19 to 25 Years | 12 (46.2%) | 26 (100.0%) |
| 25 to 34 Years | 0 (0.0%) | 87 (77.0%) |
| 35 to 44 Years | 23 (12.9%) | 156 (87.2%) |
| 45 to 54 Years | 3 (0.8%) | 389 (99.2%) |
| 55 to 64 Years | 3 (2.2%) | 133 (97.8%) |
| 65 to 74 Years | 361 (96.5%) | 323 (86.4%) |
| 75 Years and over | 161 (100.0%) | 161 (100.0%) |
| Total | 607 (35.0%) | 1,610 (93.0%) |
Disability Status by Sex by Age in Remsenburg Speonk
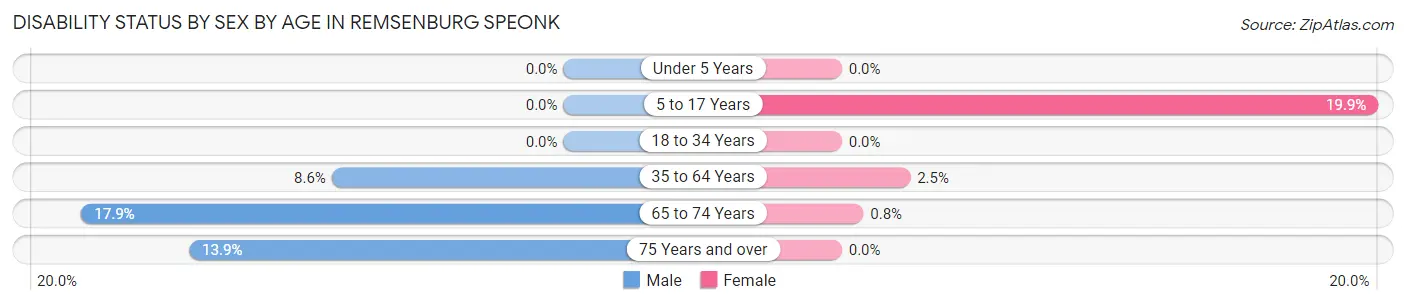
| Age Bracket | Male | Female |
| Under 5 Years | 0 (0.0%) | 0 (0.0%) |
| 5 to 17 Years | 0 (0.0%) | 42 (19.9%) |
| 18 to 34 Years | 0 (0.0%) | 0 (0.0%) |
| 35 to 64 Years | 27 (8.6%) | 10 (2.5%) |
| 65 to 74 Years | 22 (17.9%) | 2 (0.8%) |
| 75 Years and over | 15 (13.9%) | 0 (0.0%) |
Disability Class by Sex by Age in Remsenburg Speonk
Disability Class: Hearing Difficulty

| Age Bracket | Male | Female |
| Under 5 Years | 0 (0.0%) | 0 (0.0%) |
| 5 to 17 Years | 0 (0.0%) | 0 (0.0%) |
| 18 to 34 Years | 0 (0.0%) | 0 (0.0%) |
| 35 to 64 Years | 1 (0.3%) | 0 (0.0%) |
| 65 to 74 Years | 22 (17.9%) | 0 (0.0%) |
| 75 Years and over | 15 (13.9%) | 0 (0.0%) |
Disability Class: Vision Difficulty
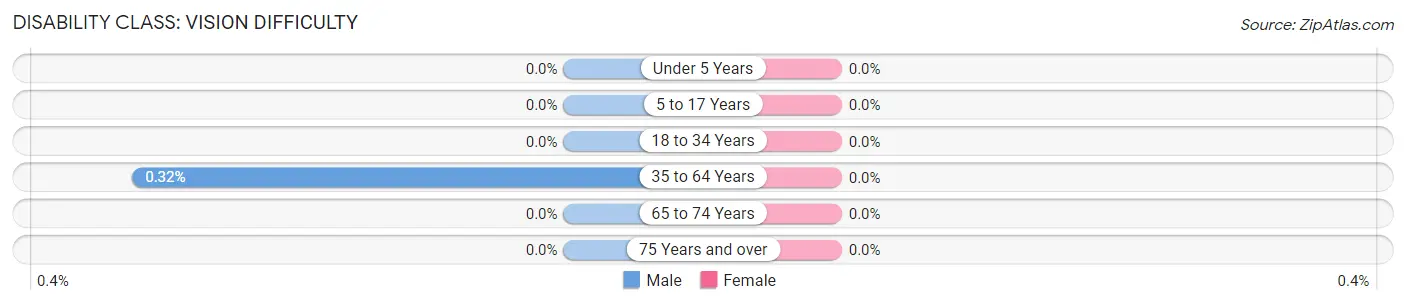
| Age Bracket | Male | Female |
| Under 5 Years | 0 (0.0%) | 0 (0.0%) |
| 5 to 17 Years | 0 (0.0%) | 0 (0.0%) |
| 18 to 34 Years | 0 (0.0%) | 0 (0.0%) |
| 35 to 64 Years | 1 (0.3%) | 0 (0.0%) |
| 65 to 74 Years | 0 (0.0%) | 0 (0.0%) |
| 75 Years and over | 0 (0.0%) | 0 (0.0%) |
Disability Class: Cognitive Difficulty
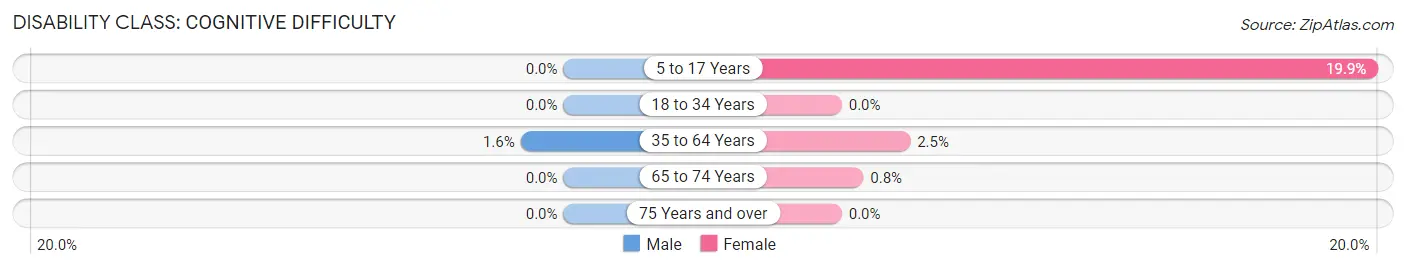
| Age Bracket | Male | Female |
| 5 to 17 Years | 0 (0.0%) | 42 (19.9%) |
| 18 to 34 Years | 0 (0.0%) | 0 (0.0%) |
| 35 to 64 Years | 5 (1.6%) | 10 (2.5%) |
| 65 to 74 Years | 0 (0.0%) | 2 (0.8%) |
| 75 Years and over | 0 (0.0%) | 0 (0.0%) |
Disability Class: Ambulatory Difficulty
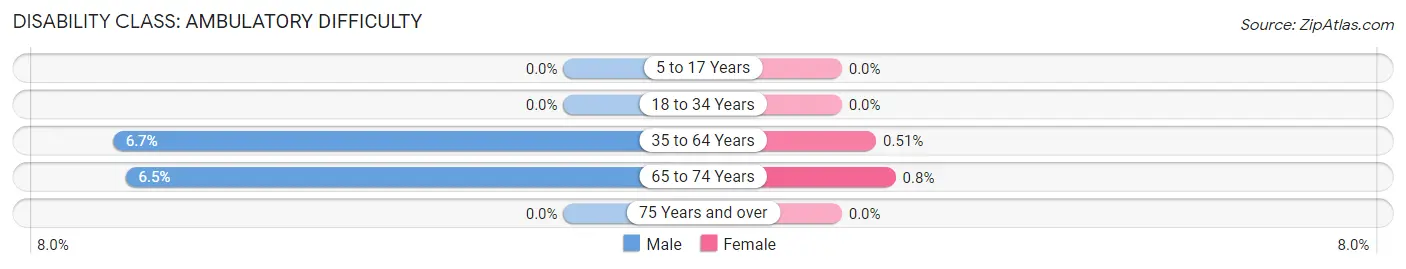
| Age Bracket | Male | Female |
| 5 to 17 Years | 0 (0.0%) | 0 (0.0%) |
| 18 to 34 Years | 0 (0.0%) | 0 (0.0%) |
| 35 to 64 Years | 21 (6.7%) | 2 (0.5%) |
| 65 to 74 Years | 8 (6.5%) | 2 (0.8%) |
| 75 Years and over | 0 (0.0%) | 0 (0.0%) |
Disability Class: Self-Care Difficulty
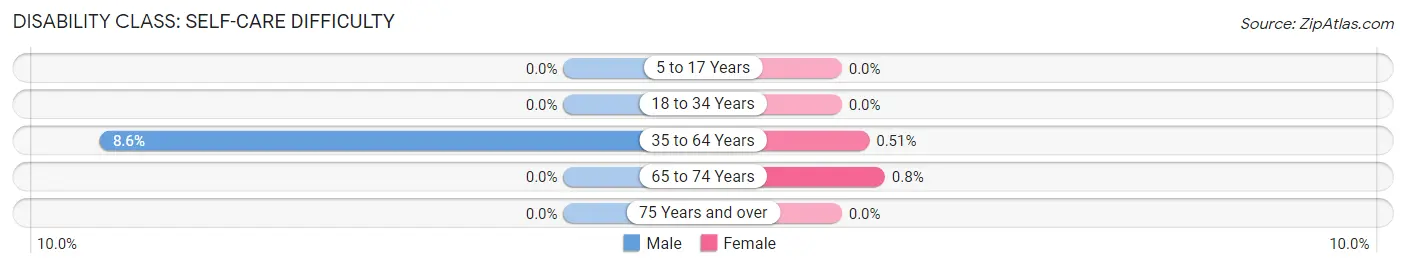
| Age Bracket | Male | Female |
| 5 to 17 Years | 0 (0.0%) | 0 (0.0%) |
| 18 to 34 Years | 0 (0.0%) | 0 (0.0%) |
| 35 to 64 Years | 27 (8.6%) | 2 (0.5%) |
| 65 to 74 Years | 0 (0.0%) | 2 (0.8%) |
| 75 Years and over | 0 (0.0%) | 0 (0.0%) |
Technology Access in Remsenburg Speonk
Computing Device Access in Remsenburg Speonk
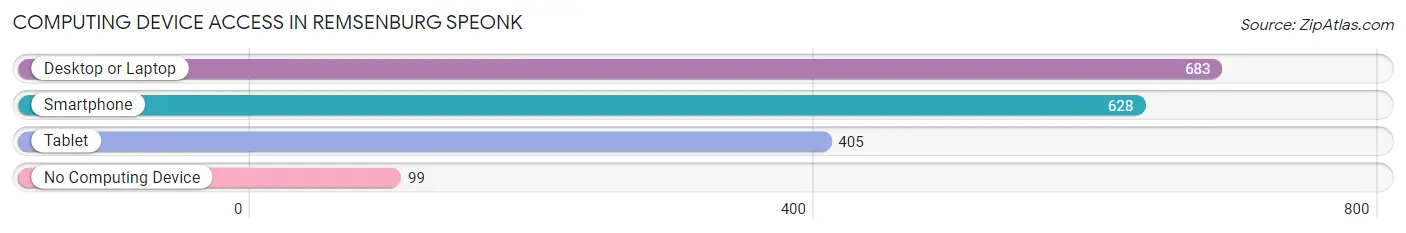
| Device Type | # Households | % Households |
| Desktop or Laptop | 683 | 87.3% |
| Smartphone | 628 | 80.3% |
| Tablet | 405 | 51.8% |
| No Computing Device | 99 | 12.7% |
| Total | 782 | 100.0% |
Internet Access in Remsenburg Speonk
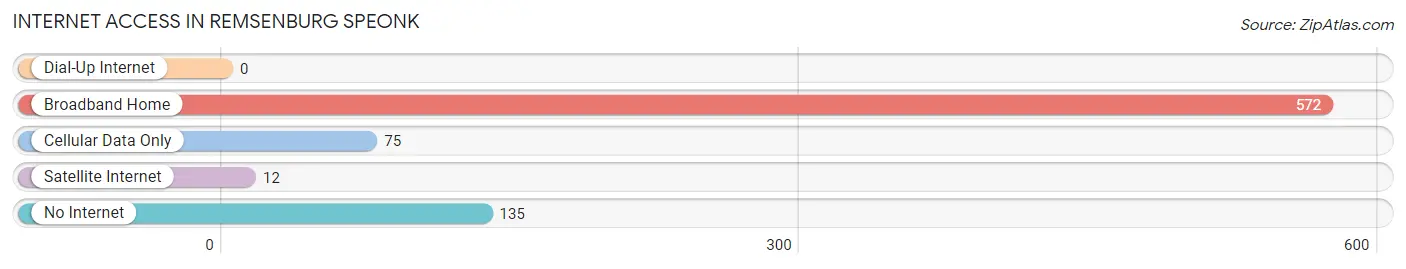
| Internet Type | # Households | % Households |
| Dial-Up Internet | 0 | 0.0% |
| Broadband Home | 572 | 73.2% |
| Cellular Data Only | 75 | 9.6% |
| Satellite Internet | 12 | 1.5% |
| No Internet | 135 | 17.3% |
| Total | 782 | 100.0% |
Remsenburg Speonk Summary
Remsenburg-Speonk is a hamlet located in the Town of Southampton in Suffolk County, New York. It is situated on the South Shore of Long Island, approximately 80 miles east of New York City. The hamlet is bordered by the hamlets of Westhampton Beach to the west, Eastport to the east, and East Quogue to the south.
History
Remsenburg-Speonk was originally inhabited by the Shinnecock Indians, who were part of the Algonquin Nation. The area was first settled by Europeans in the late 1600s, when English settlers began to arrive in the area. The hamlet was originally known as “Remsen’s Neck”, named after the Remsen family who were among the first settlers. The name was later changed to “Remsenburg”.
In the late 1800s, the hamlet was divided into two separate communities, Remsenburg and Speonk. The two communities were separated by a railroad line that ran through the area. The two communities were eventually combined into one hamlet, and the name was changed to Remsenburg-Speonk.
Geography
Remsenburg-Speonk is located on the South Shore of Long Island, approximately 80 miles east of New York City. The hamlet is bordered by the hamlets of Westhampton Beach to the west, Eastport to the east, and East Quogue to the south. The hamlet is situated on a peninsula, with the Atlantic Ocean to the south and the Great Peconic Bay to the north.
The hamlet is home to several parks and beaches, including the Remsenburg-Speonk Beach, which is located on the Atlantic Ocean. The beach is a popular destination for swimming, fishing, and other recreational activities.
Economy
Remsenburg-Speonk is a primarily residential community, with a small commercial district located in the center of the hamlet. The commercial district includes a variety of small businesses, including restaurants, shops, and services.
The hamlet is also home to several farms, which produce a variety of fruits and vegetables. The farms also provide employment opportunities for local residents.
Demographics
As of the 2010 census, the population of Remsenburg-Speonk was 2,845. The population is primarily white (94.3%), with a small percentage of African Americans (2.2%) and Hispanics (2.2%). The median household income is $87,917, and the median home value is $619,000.
Conclusion
Remsenburg-Speonk is a small hamlet located on the South Shore of Long Island, approximately 80 miles east of New York City. The hamlet is primarily residential, with a small commercial district located in the center of the hamlet. The hamlet is home to several parks and beaches, and is also home to several farms, which produce a variety of fruits and vegetables. The population of Remsenburg-Speonk is primarily white, with a small percentage of African Americans and Hispanics. The median household income is $87,917, and the median home value is $619,000.
Common Questions
What is Per Capita Income in Remsenburg Speonk?
Per Capita income in Remsenburg Speonk is $97,991.
What is the Median Family Income in Remsenburg Speonk?
Median Family Income in Remsenburg Speonk is $165,729.
What is the Median Household income in Remsenburg Speonk?
Median Household Income in Remsenburg Speonk is $162,692.
What is Income or Wage Gap in Remsenburg Speonk?
Income or Wage Gap in Remsenburg Speonk is 60.9%.
Women in Remsenburg Speonk earn 39.1 cents for every dollar earned by a man.
What is Inequality or Gini Index in Remsenburg Speonk?
Inequality or Gini Index in Remsenburg Speonk is 0.53.
What is the Total Population of Remsenburg Speonk?
Total Population of Remsenburg Speonk is 1,732.
What is the Total Male Population of Remsenburg Speonk?
Total Male Population of Remsenburg Speonk is 745.
What is the Total Female Population of Remsenburg Speonk?
Total Female Population of Remsenburg Speonk is 987.
What is the Ratio of Males per 100 Females in Remsenburg Speonk?
There are 75.48 Males per 100 Females in Remsenburg Speonk.
What is the Ratio of Females per 100 Males in Remsenburg Speonk?
There are 132.48 Females per 100 Males in Remsenburg Speonk.
What is the Median Population Age in Remsenburg Speonk?
Median Population Age in Remsenburg Speonk is 50.0 Years.
What is the Average Family Size in Remsenburg Speonk
Average Family Size in Remsenburg Speonk is 2.5 People.
What is the Average Household Size in Remsenburg Speonk
Average Household Size in Remsenburg Speonk is 2.2 People.
How Large is the Labor Force in Remsenburg Speonk?
There are 826 People in the Labor Forcein in Remsenburg Speonk.
What is the Percentage of People in the Labor Force in Remsenburg Speonk?
55.1% of People are in the Labor Force in Remsenburg Speonk.