Normal, IL Map & Demographics
Normal Map
Normal Overview
$34,466
PER CAPITA INCOME
$111,334
AVG FAMILY INCOME
$63,965
AVG HOUSEHOLD INCOME
32.2%
WAGE / INCOME GAP [ % ]
67.8¢/ $1
WAGE / INCOME GAP [ $ ]
$8,394
FAMILY INCOME DEFICIT
0.52
INEQUALITY / GINI INDEX
52,920
TOTAL POPULATION
25,061
MALE POPULATION
27,859
FEMALE POPULATION
89.96
MALES / 100 FEMALES
111.16
FEMALES / 100 MALES
25.2
MEDIAN AGE
3.1
AVG FAMILY SIZE
2.4
AVG HOUSEHOLD SIZE
27,805
LABOR FORCE [ PEOPLE ]
62.0%
PERCENT IN LABOR FORCE
3.9%
UNEMPLOYMENT RATE
Normal Zip Codes
Normal Area Codes
Income in Normal
Income Overview in Normal
Per Capita Income in Normal is $34,466, while median incomes of families and households are $111,334 and $63,965 respectively.
| Characteristic | Number | Measure |
| Per Capita Income | 52,920 | $34,466 |
| Median Family Income | 9,759 | $111,334 |
| Mean Family Income | 9,759 | $136,013 |
| Median Household Income | 19,658 | $63,965 |
| Mean Household Income | 19,658 | $90,242 |
| Income Deficit | 9,759 | $8,394 |
| Wage / Income Gap (%) | 52,920 | 32.16% |
| Wage / Income Gap ($) | 52,920 | 67.84¢ per $1 |
| Gini / Inequality Index | 52,920 | 0.52 |
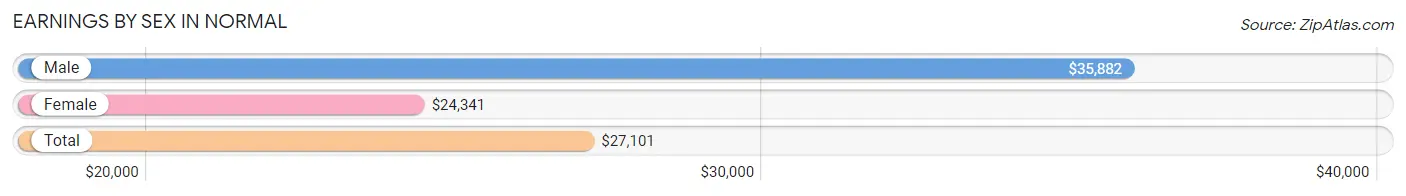
Earnings by Sex in Normal
Average Earnings in Normal are $27,101, $35,882 for men and $24,341 for women, a difference of 32.2%.
| Sex | Number | Average Earnings |
| Male | 14,759 (47.3%) | $35,882 |
| Female | 16,433 (52.7%) | $24,341 |
| Total | 31,192 (100.0%) | $27,101 |
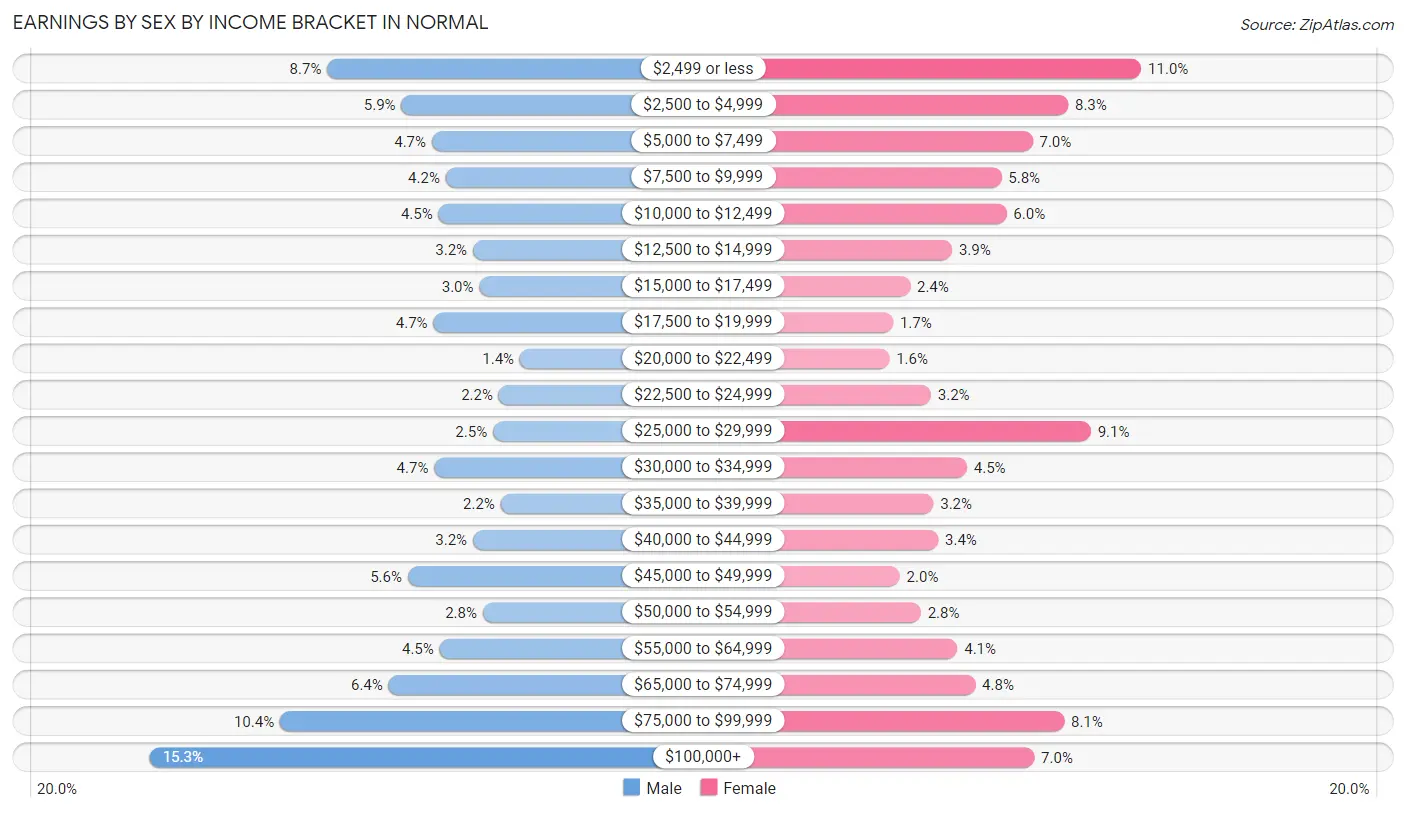
Earnings by Sex by Income Bracket in Normal
The most common earnings brackets in Normal are $100,000+ for men (2,259 | 15.3%) and $2,499 or less for women (1,813 | 11.0%).
| Income | Male | Female |
| $2,499 or less | 1,278 (8.7%) | 1,813 (11.0%) |
| $2,500 to $4,999 | 868 (5.9%) | 1,363 (8.3%) |
| $5,000 to $7,499 | 699 (4.7%) | 1,144 (7.0%) |
| $7,500 to $9,999 | 623 (4.2%) | 951 (5.8%) |
| $10,000 to $12,499 | 663 (4.5%) | 982 (6.0%) |
| $12,500 to $14,999 | 473 (3.2%) | 647 (3.9%) |
| $15,000 to $17,499 | 437 (3.0%) | 390 (2.4%) |
| $17,500 to $19,999 | 690 (4.7%) | 284 (1.7%) |
| $20,000 to $22,499 | 213 (1.4%) | 261 (1.6%) |
| $22,500 to $24,999 | 329 (2.2%) | 518 (3.2%) |
| $25,000 to $29,999 | 362 (2.5%) | 1,502 (9.1%) |
| $30,000 to $34,999 | 687 (4.6%) | 740 (4.5%) |
| $35,000 to $39,999 | 319 (2.2%) | 533 (3.2%) |
| $40,000 to $44,999 | 473 (3.2%) | 562 (3.4%) |
| $45,000 to $49,999 | 833 (5.6%) | 325 (2.0%) |
| $50,000 to $54,999 | 418 (2.8%) | 456 (2.8%) |
| $55,000 to $64,999 | 657 (4.4%) | 681 (4.1%) |
| $65,000 to $74,999 | 939 (6.4%) | 790 (4.8%) |
| $75,000 to $99,999 | 1,539 (10.4%) | 1,338 (8.1%) |
| $100,000+ | 2,259 (15.3%) | 1,153 (7.0%) |
| Total | 14,759 (100.0%) | 16,433 (100.0%) |
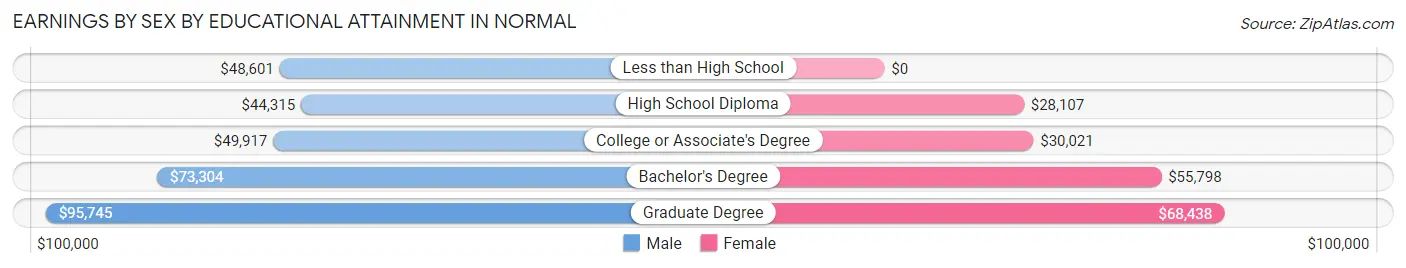
Earnings by Sex by Educational Attainment in Normal
Average earnings in Normal are $65,389 for men and $44,994 for women, a difference of 31.2%. Men with an educational attainment of graduate degree enjoy the highest average annual earnings of $95,745, while those with high school diploma education earn the least with $44,315. Women with an educational attainment of graduate degree earn the most with the average annual earnings of $68,438, while those with high school diploma education have the smallest earnings of $28,107.
| Educational Attainment | Male Income | Female Income |
| Less than High School | $48,601 | $0 |
| High School Diploma | $44,315 | $28,107 |
| College or Associate's Degree | $49,917 | $30,021 |
| Bachelor's Degree | $73,304 | $55,798 |
| Graduate Degree | $95,745 | $68,438 |
| Total | $65,389 | $44,994 |
Family Income in Normal
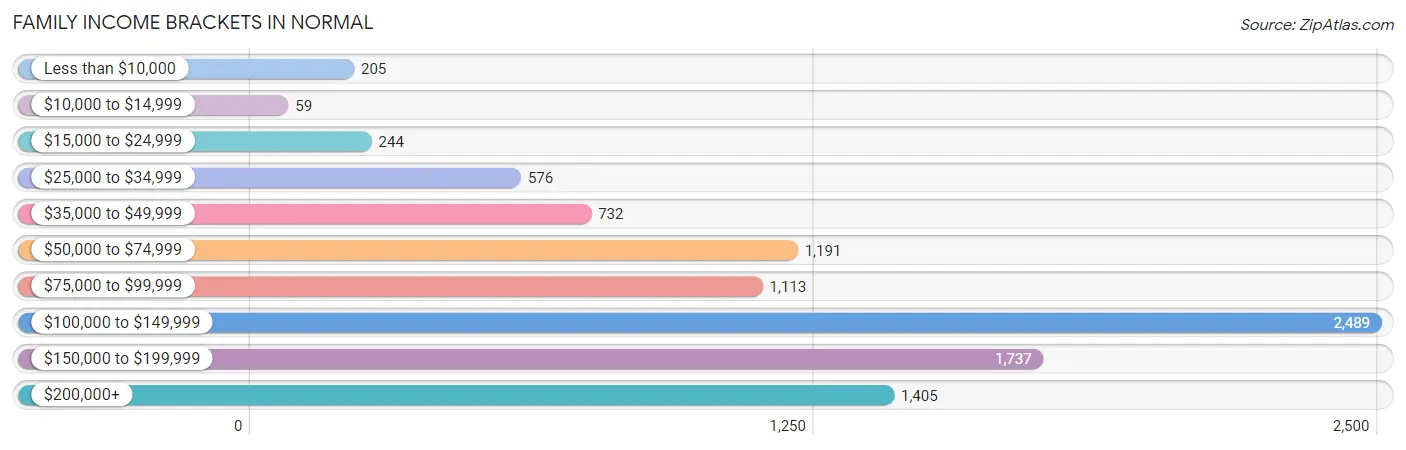
Family Income Brackets in Normal
According to the Normal family income data, there are 2,489 families falling into the $100,000 to $149,999 income range, which is the most common income bracket and makes up 25.5% of all families. Conversely, the $10,000 to $14,999 income bracket is the least frequent group with only 59 families (0.6%) belonging to this category.
| Income Bracket | # Families | % Families |
| Less than $10,000 | 205 | 2.1% |
| $10,000 to $14,999 | 59 | 0.6% |
| $15,000 to $24,999 | 244 | 2.5% |
| $25,000 to $34,999 | 576 | 5.9% |
| $35,000 to $49,999 | 732 | 7.5% |
| $50,000 to $74,999 | 1,191 | 12.2% |
| $75,000 to $99,999 | 1,113 | 11.4% |
| $100,000 to $149,999 | 2,489 | 25.5% |
| $150,000 to $199,999 | 1,737 | 17.8% |
| $200,000+ | 1,405 | 14.4% |
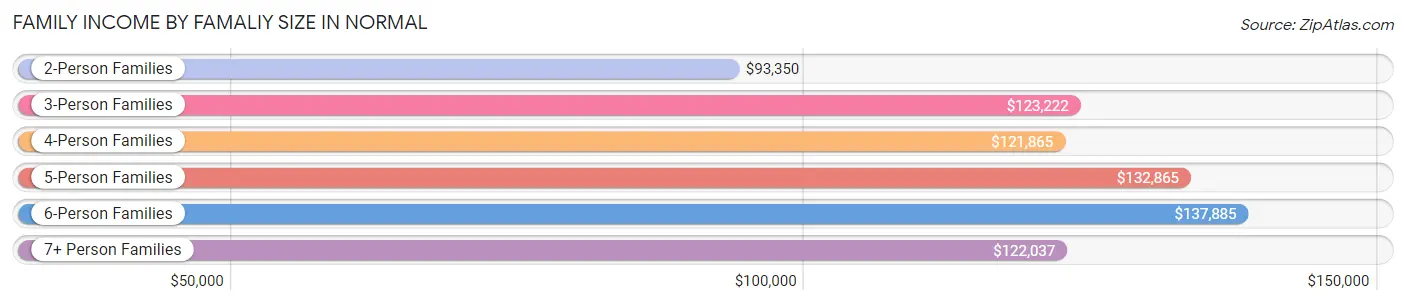
Family Income by Famaliy Size in Normal
6-person families (304 | 3.1%) account for the highest median family income in Normal with $137,885 per family, while 2-person families (4,678 | 47.9%) have the highest median income of $46,675 per family member.
| Income Bracket | # Families | Median Income |
| 2-Person Families | 4,678 (47.9%) | $93,350 |
| 3-Person Families | 2,101 (21.5%) | $123,222 |
| 4-Person Families | 1,891 (19.4%) | $121,865 |
| 5-Person Families | 641 (6.6%) | $132,865 |
| 6-Person Families | 304 (3.1%) | $137,885 |
| 7+ Person Families | 144 (1.5%) | $122,037 |
| Total | 9,759 (100.0%) | $111,334 |
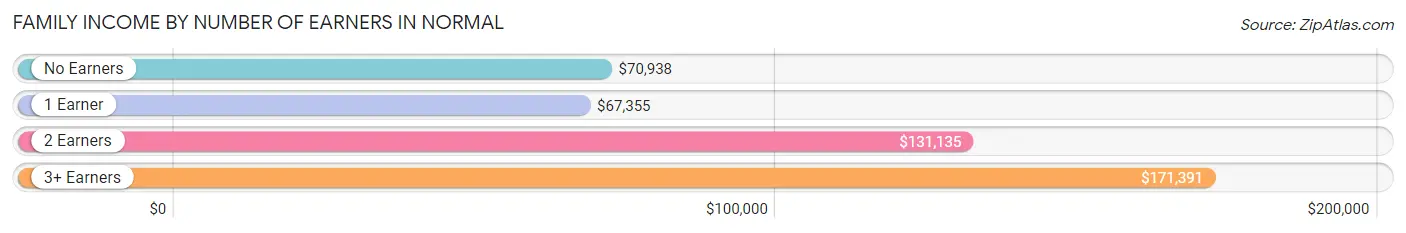
Family Income by Number of Earners in Normal
The median family income in Normal is $111,334, with families comprising 3+ earners (931) having the highest median family income of $171,391, while families with 1 earner (2,911) have the lowest median family income of $67,355, accounting for 9.5% and 29.8% of families, respectively.
| Number of Earners | # Families | Median Income |
| No Earners | 1,285 (13.2%) | $70,938 |
| 1 Earner | 2,911 (29.8%) | $67,355 |
| 2 Earners | 4,632 (47.5%) | $131,135 |
| 3+ Earners | 931 (9.5%) | $171,391 |
| Total | 9,759 (100.0%) | $111,334 |
Household Income in Normal
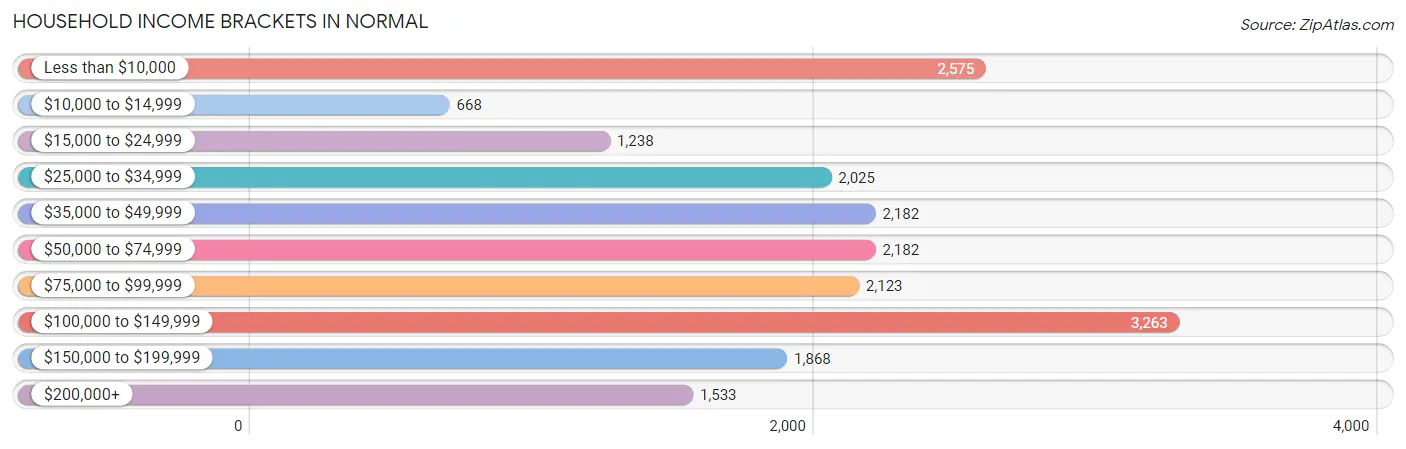
Household Income Brackets in Normal
With 3,263 households falling in the category, the $100,000 to $149,999 income range is the most frequent in Normal, accounting for 16.6% of all households. In contrast, only 668 households (3.4%) fall into the $10,000 to $14,999 income bracket, making it the least populous group.
| Income Bracket | # Households | % Households |
| Less than $10,000 | 2,575 | 13.1% |
| $10,000 to $14,999 | 668 | 3.4% |
| $15,000 to $24,999 | 1,238 | 6.3% |
| $25,000 to $34,999 | 2,025 | 10.3% |
| $35,000 to $49,999 | 2,182 | 11.1% |
| $50,000 to $74,999 | 2,182 | 11.1% |
| $75,000 to $99,999 | 2,123 | 10.8% |
| $100,000 to $149,999 | 3,263 | 16.6% |
| $150,000 to $199,999 | 1,868 | 9.5% |
| $200,000+ | 1,533 | 7.8% |
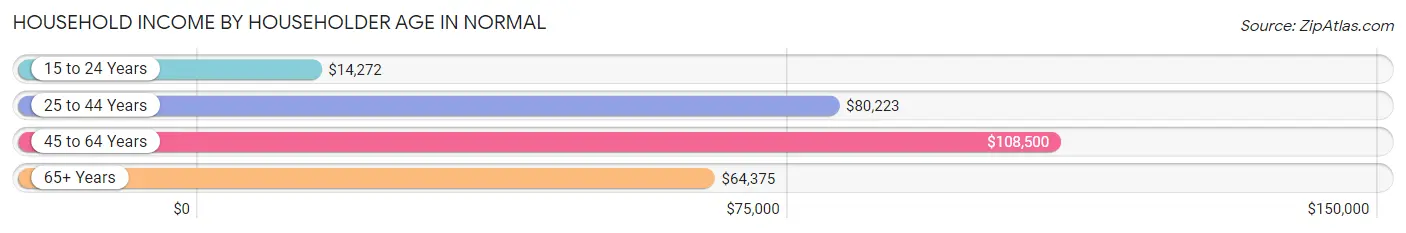
Household Income by Householder Age in Normal
The median household income in Normal is $63,965, with the highest median household income of $108,500 found in the 45 to 64 years age bracket for the primary householder. A total of 5,432 households (27.6%) fall into this category. Meanwhile, the 15 to 24 years age bracket for the primary householder has the lowest median household income of $14,272, with 4,372 households (22.2%) in this group.
| Income Bracket | # Households | Median Income |
| 15 to 24 Years | 4,372 (22.2%) | $14,272 |
| 25 to 44 Years | 5,964 (30.3%) | $80,223 |
| 45 to 64 Years | 5,432 (27.6%) | $108,500 |
| 65+ Years | 3,890 (19.8%) | $64,375 |
| Total | 19,658 (100.0%) | $63,965 |
Poverty in Normal
Income Below Poverty by Sex and Age in Normal
With 19.6% poverty level for males and 26.9% for females among the residents of Normal, 18 to 24 year old males and 18 to 24 year old females are the most vulnerable to poverty, with 2,776 males (53.9%) and 4,458 females (72.0%) in their respective age groups living below the poverty level.
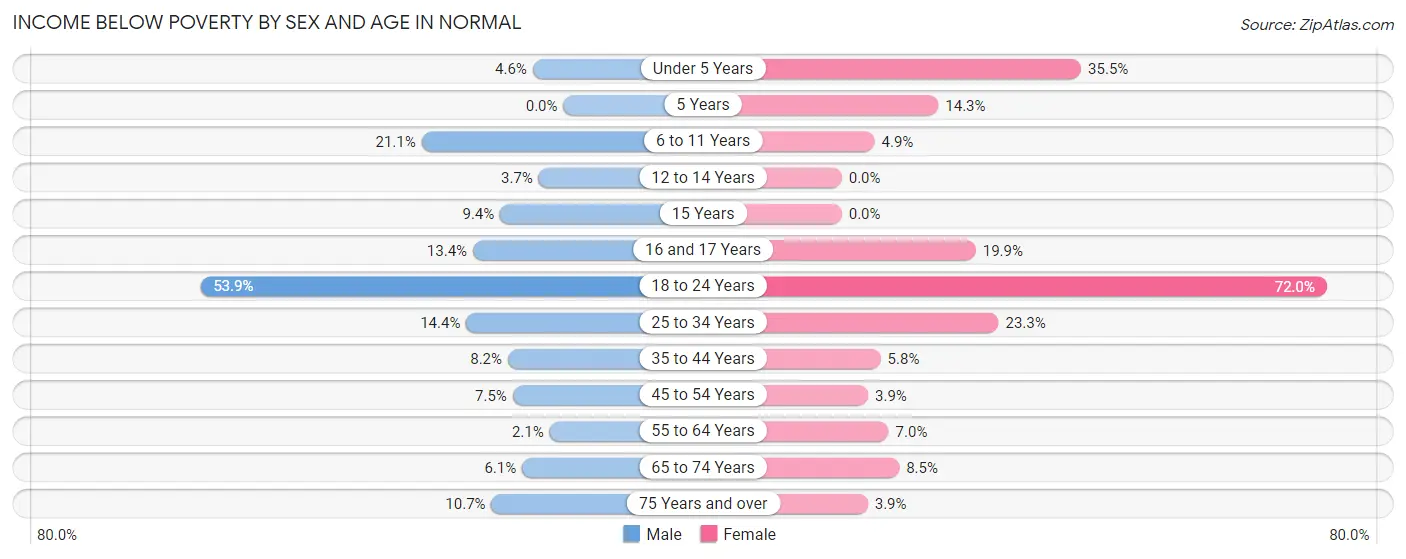
| Age Bracket | Male | Female |
| Under 5 Years | 44 (4.5%) | 489 (35.5%) |
| 5 Years | 0 (0.0%) | 35 (14.3%) |
| 6 to 11 Years | 384 (21.1%) | 60 (4.9%) |
| 12 to 14 Years | 30 (3.7%) | 0 (0.0%) |
| 15 Years | 31 (9.4%) | 0 (0.0%) |
| 16 and 17 Years | 76 (13.4%) | 81 (19.9%) |
| 18 to 24 Years | 2,776 (53.9%) | 4,458 (72.0%) |
| 25 to 34 Years | 408 (14.4%) | 739 (23.3%) |
| 35 to 44 Years | 211 (8.2%) | 161 (5.8%) |
| 45 to 54 Years | 187 (7.5%) | 91 (3.9%) |
| 55 to 64 Years | 43 (2.1%) | 155 (7.0%) |
| 65 to 74 Years | 97 (6.1%) | 147 (8.5%) |
| 75 Years and over | 105 (10.7%) | 57 (3.9%) |
| Total | 4,392 (19.6%) | 6,473 (26.9%) |
Income Above Poverty by Sex and Age in Normal
According to the poverty statistics in Normal, males aged 5 years and females aged 12 to 14 years are the age groups that are most secure financially, with 100.0% of males and 100.0% of females in these age groups living above the poverty line.
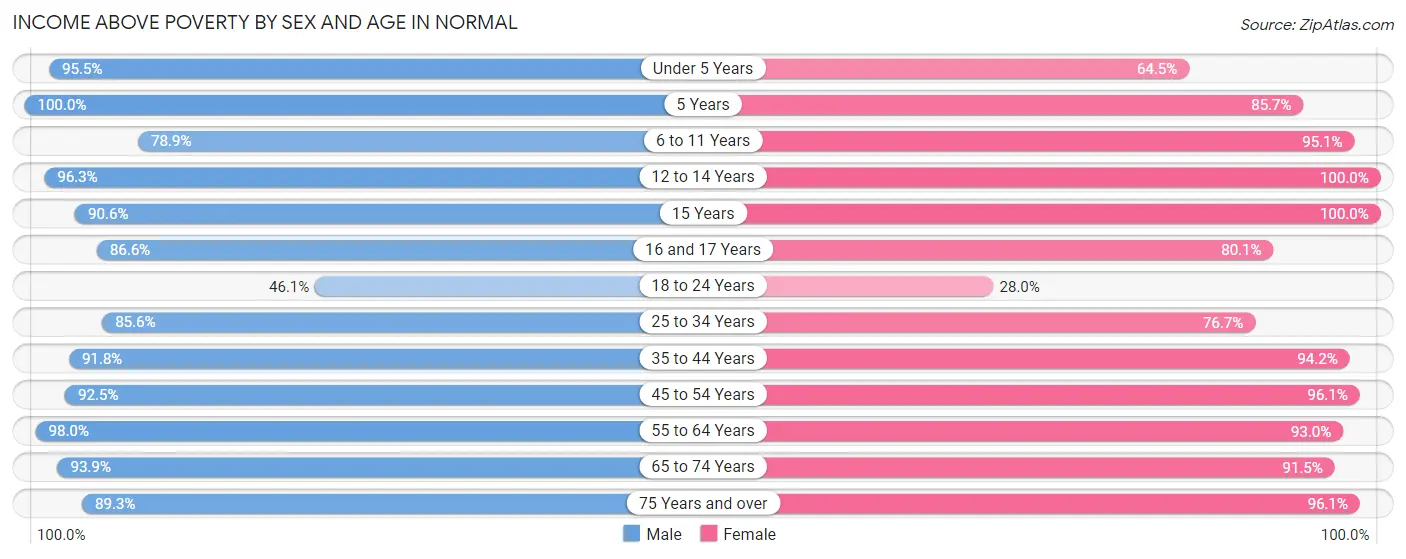
| Age Bracket | Male | Female |
| Under 5 Years | 922 (95.5%) | 887 (64.5%) |
| 5 Years | 202 (100.0%) | 209 (85.7%) |
| 6 to 11 Years | 1,439 (78.9%) | 1,173 (95.1%) |
| 12 to 14 Years | 790 (96.3%) | 641 (100.0%) |
| 15 Years | 299 (90.6%) | 296 (100.0%) |
| 16 and 17 Years | 490 (86.6%) | 326 (80.1%) |
| 18 to 24 Years | 2,372 (46.1%) | 1,733 (28.0%) |
| 25 to 34 Years | 2,421 (85.6%) | 2,435 (76.7%) |
| 35 to 44 Years | 2,350 (91.8%) | 2,628 (94.2%) |
| 45 to 54 Years | 2,299 (92.5%) | 2,238 (96.1%) |
| 55 to 64 Years | 2,059 (98.0%) | 2,072 (93.0%) |
| 65 to 74 Years | 1,485 (93.9%) | 1,576 (91.5%) |
| 75 Years and over | 878 (89.3%) | 1,421 (96.1%) |
| Total | 18,006 (80.4%) | 17,635 (73.2%) |
Income Below Poverty Among Married-Couple Families in Normal
The poverty statistics for married-couple families in Normal show that 1.9% or 141 of the total 7,468 families live below the poverty line. Families with 3 or 4 children have the highest poverty rate of 7.3%, comprising of 52 families. On the other hand, families with 5 or more children have the lowest poverty rate of 0.0%, which includes 0 families.
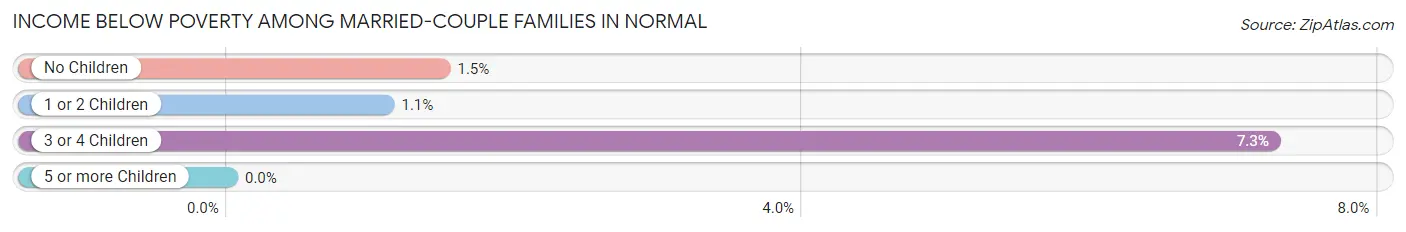
| Children | Above Poverty | Below Poverty |
| No Children | 4,067 (98.5%) | 61 (1.5%) |
| 1 or 2 Children | 2,535 (98.9%) | 28 (1.1%) |
| 3 or 4 Children | 664 (92.7%) | 52 (7.3%) |
| 5 or more Children | 61 (100.0%) | 0 (0.0%) |
| Total | 7,327 (98.1%) | 141 (1.9%) |
Income Below Poverty Among Single-Parent Households in Normal
According to the poverty data in Normal, 8.8% or 43 single-father households and 31.6% or 569 single-mother households are living below the poverty line. Among single-father households, those with no children have the highest poverty rate, with 43 households (12.1%) experiencing poverty. Likewise, among single-mother households, those with 3 or 4 children have the highest poverty rate, with 310 households (87.6%) falling below the poverty line.
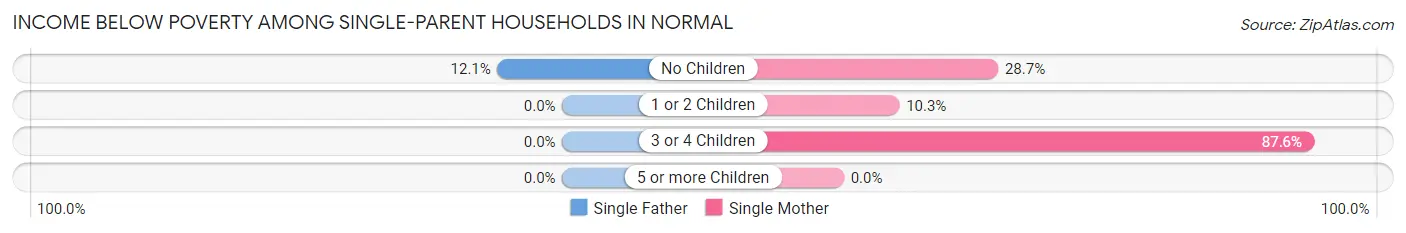
| Children | Single Father | Single Mother |
| No Children | 43 (12.1%) | 171 (28.7%) |
| 1 or 2 Children | 0 (0.0%) | 88 (10.3%) |
| 3 or 4 Children | 0 (0.0%) | 310 (87.6%) |
| 5 or more Children | 0 (0.0%) | 0 (0.0%) |
| Total | 43 (8.8%) | 569 (31.6%) |
Income Below Poverty Among Married-Couple vs Single-Parent Households in Normal
The poverty data for Normal shows that 141 of the married-couple family households (1.9%) and 612 of the single-parent households (26.7%) are living below the poverty level. Within the married-couple family households, those with 3 or 4 children have the highest poverty rate, with 52 households (7.3%) falling below the poverty line. Among the single-parent households, those with 3 or 4 children have the highest poverty rate, with 310 household (85.2%) living below poverty.
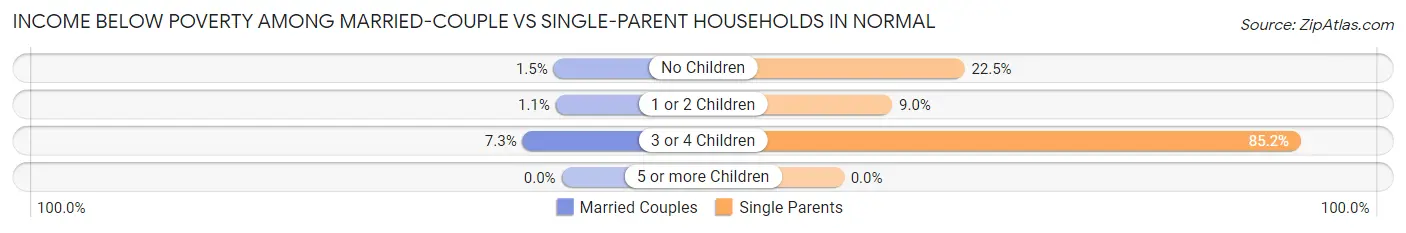
| Children | Married-Couple Families | Single-Parent Households |
| No Children | 61 (1.5%) | 214 (22.5%) |
| 1 or 2 Children | 28 (1.1%) | 88 (9.0%) |
| 3 or 4 Children | 52 (7.3%) | 310 (85.2%) |
| 5 or more Children | 0 (0.0%) | 0 (0.0%) |
| Total | 141 (1.9%) | 612 (26.7%) |
Race in Normal
The most populous races in Normal are White / Caucasian (41,617 | 78.6%), Black / African American (6,712 | 12.7%), and Hispanic or Latino (3,190 | 6.0%).
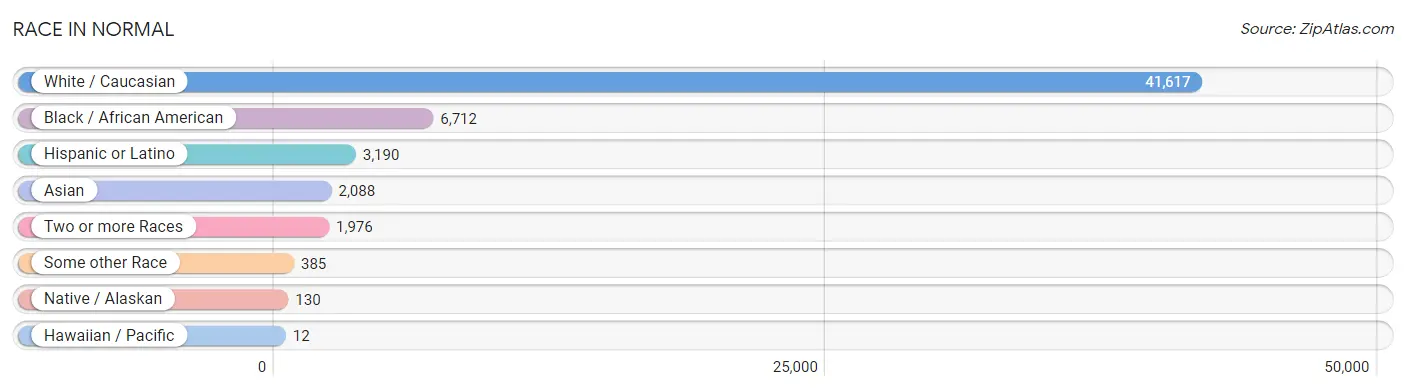
| Race | # Population | % Population |
| Asian | 2,088 | 4.0% |
| Black / African American | 6,712 | 12.7% |
| Hawaiian / Pacific | 12 | 0.0% |
| Hispanic or Latino | 3,190 | 6.0% |
| Native / Alaskan | 130 | 0.3% |
| White / Caucasian | 41,617 | 78.6% |
| Two or more Races | 1,976 | 3.7% |
| Some other Race | 385 | 0.7% |
| Total | 52,920 | 100.0% |
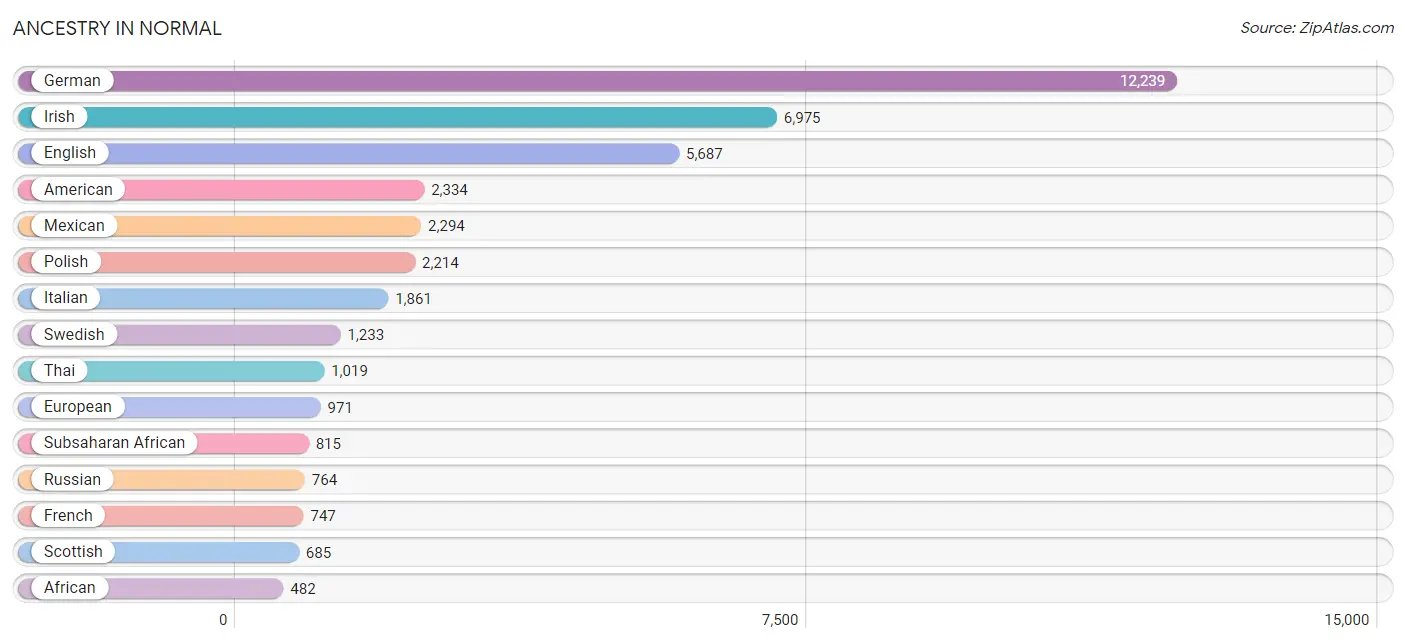
Ancestry in Normal
The most populous ancestries reported in Normal are German (12,239 | 23.1%), Irish (6,975 | 13.2%), English (5,687 | 10.7%), American (2,334 | 4.4%), and Mexican (2,294 | 4.3%), together accounting for 55.8% of all Normal residents.
| Ancestry | # Population | % Population |
| African | 482 | 0.9% |
| Alsatian | 8 | 0.0% |
| American | 2,334 | 4.4% |
| Arab | 258 | 0.5% |
| Arapaho | 12 | 0.0% |
| Australian | 12 | 0.0% |
| Austrian | 83 | 0.2% |
| Basque | 7 | 0.0% |
| Belgian | 216 | 0.4% |
| Belizean | 12 | 0.0% |
| Bhutanese | 73 | 0.1% |
| Bolivian | 41 | 0.1% |
| Brazilian | 13 | 0.0% |
| British | 162 | 0.3% |
| Burmese | 350 | 0.7% |
| Canadian | 38 | 0.1% |
| Central American | 167 | 0.3% |
| Central American Indian | 34 | 0.1% |
| Cherokee | 42 | 0.1% |
| Colombian | 99 | 0.2% |
| Croatian | 123 | 0.2% |
| Cuban | 42 | 0.1% |
| Cypriot | 7 | 0.0% |
| Czech | 202 | 0.4% |
| Czechoslovakian | 69 | 0.1% |
| Danish | 340 | 0.6% |
| Dominican | 27 | 0.1% |
| Dutch | 377 | 0.7% |
| Dutch West Indian | 7 | 0.0% |
| Eastern European | 24 | 0.1% |
| English | 5,687 | 10.7% |
| Ethiopian | 81 | 0.2% |
| European | 971 | 1.8% |
| Finnish | 16 | 0.0% |
| French | 747 | 1.4% |
| French Canadian | 154 | 0.3% |
| German | 12,239 | 23.1% |
| German Russian | 24 | 0.1% |
| Greek | 147 | 0.3% |
| Guatemalan | 97 | 0.2% |
| Haitian | 13 | 0.0% |
| Honduran | 7 | 0.0% |
| Hungarian | 65 | 0.1% |
| Icelander | 2 | 0.0% |
| Indian (Asian) | 353 | 0.7% |
| Iranian | 8 | 0.0% |
| Irish | 6,975 | 13.2% |
| Iroquois | 4 | 0.0% |
| Israeli | 1 | 0.0% |
| Italian | 1,861 | 3.5% |
| Jamaican | 82 | 0.2% |
| Jordanian | 7 | 0.0% |
| Kenyan | 22 | 0.0% |
| Korean | 313 | 0.6% |
| Laotian | 4 | 0.0% |
| Latvian | 20 | 0.0% |
| Lebanese | 46 | 0.1% |
| Lithuanian | 51 | 0.1% |
| Macedonian | 20 | 0.0% |
| Mexican | 2,294 | 4.3% |
| Mexican American Indian | 37 | 0.1% |
| Moroccan | 45 | 0.1% |
| Native Hawaiian | 24 | 0.1% |
| Nicaraguan | 4 | 0.0% |
| Nigerian | 83 | 0.2% |
| Northern European | 97 | 0.2% |
| Norwegian | 402 | 0.8% |
| Pakistani | 25 | 0.1% |
| Palestinian | 119 | 0.2% |
| Pennsylvania German | 45 | 0.1% |
| Peruvian | 20 | 0.0% |
| Polish | 2,214 | 4.2% |
| Puerto Rican | 233 | 0.4% |
| Romanian | 45 | 0.1% |
| Russian | 764 | 1.4% |
| Salvadoran | 59 | 0.1% |
| Scandinavian | 75 | 0.1% |
| Scotch-Irish | 299 | 0.6% |
| Scottish | 685 | 1.3% |
| Serbian | 56 | 0.1% |
| Sioux | 10 | 0.0% |
| Slavic | 62 | 0.1% |
| Slovak | 91 | 0.2% |
| Slovene | 88 | 0.2% |
| South African | 11 | 0.0% |
| South American | 160 | 0.3% |
| Spaniard | 32 | 0.1% |
| Spanish | 115 | 0.2% |
| Sri Lankan | 232 | 0.4% |
| Subsaharan African | 815 | 1.5% |
| Swedish | 1,233 | 2.3% |
| Swiss | 233 | 0.4% |
| Thai | 1,019 | 1.9% |
| Turkish | 46 | 0.1% |
| Ukrainian | 52 | 0.1% |
| Welsh | 420 | 0.8% |
| Yugoslavian | 16 | 0.0% | View All 97 Rows |
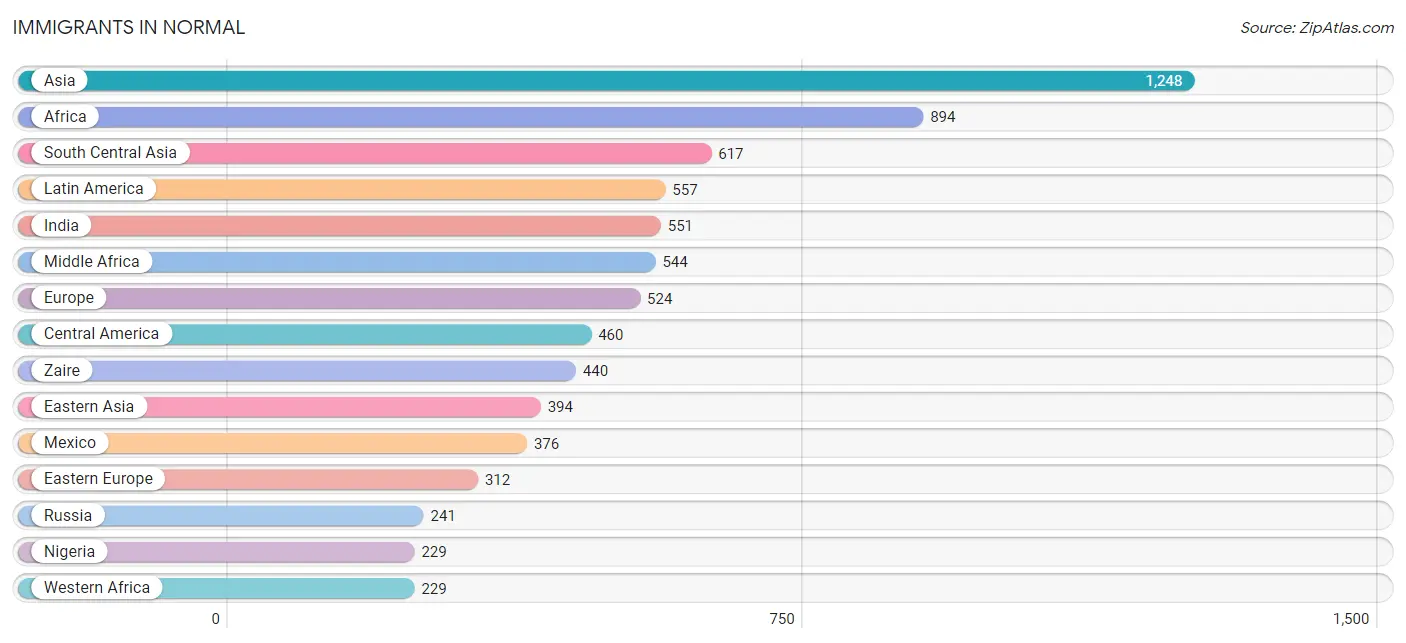
Immigrants in Normal
The most numerous immigrant groups reported in Normal came from Asia (1,248 | 2.4%), Africa (894 | 1.7%), South Central Asia (617 | 1.2%), Latin America (557 | 1.1%), and India (551 | 1.0%), together accounting for 7.3% of all Normal residents.
| Immigration Origin | # Population | % Population |
| Africa | 894 | 1.7% |
| Asia | 1,248 | 2.4% |
| Austria | 11 | 0.0% |
| Bangladesh | 14 | 0.0% |
| Belize | 18 | 0.0% |
| Brazil | 6 | 0.0% |
| Canada | 93 | 0.2% |
| Caribbean | 28 | 0.1% |
| Central America | 460 | 0.9% |
| China | 202 | 0.4% |
| Colombia | 63 | 0.1% |
| Congo | 104 | 0.2% |
| Dominican Republic | 27 | 0.1% |
| Eastern Africa | 102 | 0.2% |
| Eastern Asia | 394 | 0.7% |
| Eastern Europe | 312 | 0.6% |
| England | 33 | 0.1% |
| Ethiopia | 60 | 0.1% |
| Europe | 524 | 1.0% |
| Germany | 137 | 0.3% |
| Guatemala | 66 | 0.1% |
| Haiti | 1 | 0.0% |
| Hong Kong | 10 | 0.0% |
| India | 551 | 1.0% |
| Ireland | 8 | 0.0% |
| Japan | 26 | 0.1% |
| Kazakhstan | 29 | 0.1% |
| Kenya | 32 | 0.1% |
| Korea | 166 | 0.3% |
| Latin America | 557 | 1.1% |
| Mexico | 376 | 0.7% |
| Middle Africa | 544 | 1.0% |
| Morocco | 19 | 0.0% |
| Nigeria | 229 | 0.4% |
| Northern Africa | 19 | 0.0% |
| Northern Europe | 51 | 0.1% |
| Philippines | 93 | 0.2% |
| Poland | 13 | 0.0% |
| Russia | 241 | 0.5% |
| South America | 69 | 0.1% |
| South Central Asia | 617 | 1.2% |
| South Eastern Asia | 204 | 0.4% |
| Sri Lanka | 23 | 0.0% |
| Switzerland | 13 | 0.0% |
| Taiwan | 54 | 0.1% |
| Turkey | 33 | 0.1% |
| Vietnam | 111 | 0.2% |
| Western Africa | 229 | 0.4% |
| Western Asia | 33 | 0.1% |
| Western Europe | 161 | 0.3% |
| Zaire | 440 | 0.8% | View All 51 Rows |
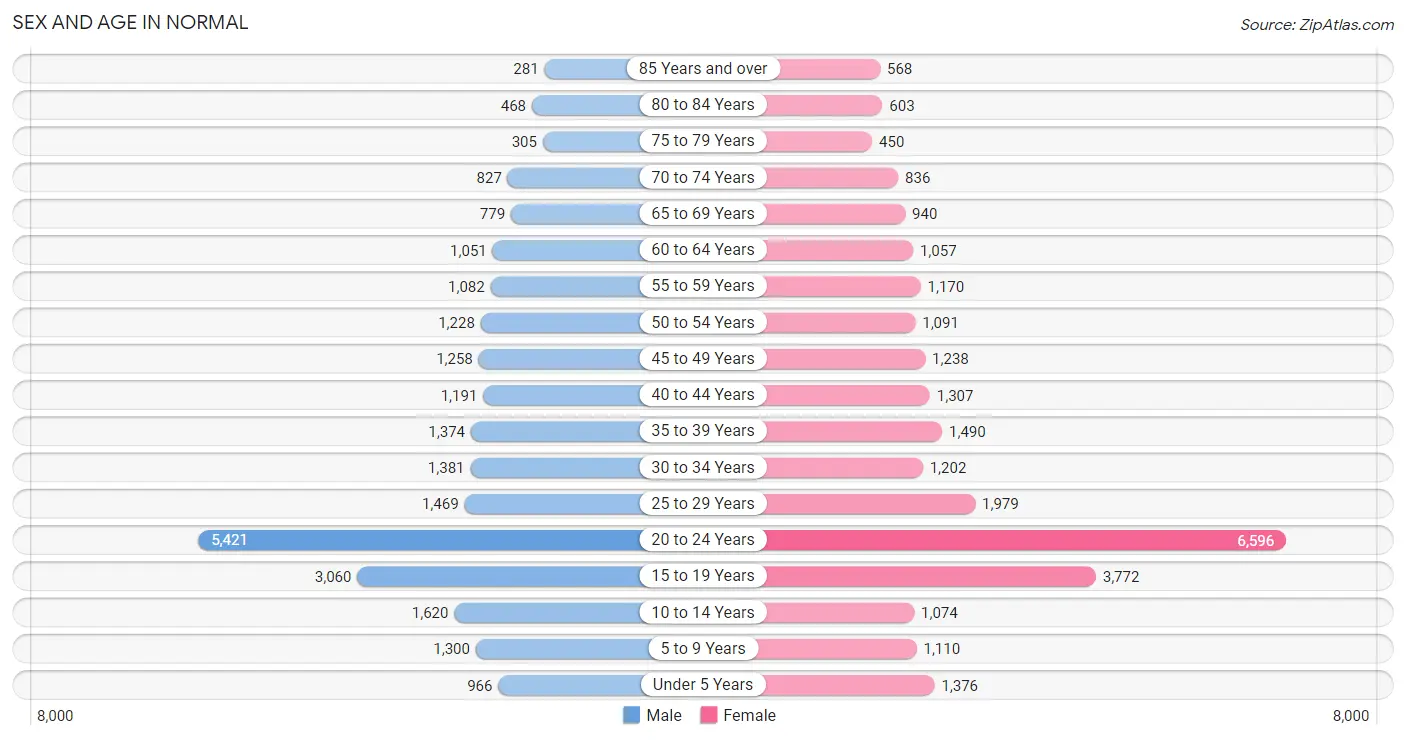
Sex and Age in Normal
Sex and Age in Normal
The most populous age groups in Normal are 20 to 24 Years (5,421 | 21.6%) for men and 20 to 24 Years (6,596 | 23.7%) for women.
| Age Bracket | Male | Female |
| Under 5 Years | 966 (3.8%) | 1,376 (4.9%) |
| 5 to 9 Years | 1,300 (5.2%) | 1,110 (4.0%) |
| 10 to 14 Years | 1,620 (6.5%) | 1,074 (3.9%) |
| 15 to 19 Years | 3,060 (12.2%) | 3,772 (13.5%) |
| 20 to 24 Years | 5,421 (21.6%) | 6,596 (23.7%) |
| 25 to 29 Years | 1,469 (5.9%) | 1,979 (7.1%) |
| 30 to 34 Years | 1,381 (5.5%) | 1,202 (4.3%) |
| 35 to 39 Years | 1,374 (5.5%) | 1,490 (5.3%) |
| 40 to 44 Years | 1,191 (4.8%) | 1,307 (4.7%) |
| 45 to 49 Years | 1,258 (5.0%) | 1,238 (4.4%) |
| 50 to 54 Years | 1,228 (4.9%) | 1,091 (3.9%) |
| 55 to 59 Years | 1,082 (4.3%) | 1,170 (4.2%) |
| 60 to 64 Years | 1,051 (4.2%) | 1,057 (3.8%) |
| 65 to 69 Years | 779 (3.1%) | 940 (3.4%) |
| 70 to 74 Years | 827 (3.3%) | 836 (3.0%) |
| 75 to 79 Years | 305 (1.2%) | 450 (1.6%) |
| 80 to 84 Years | 468 (1.9%) | 603 (2.2%) |
| 85 Years and over | 281 (1.1%) | 568 (2.0%) |
| Total | 25,061 (100.0%) | 27,859 (100.0%) |
Families and Households in Normal
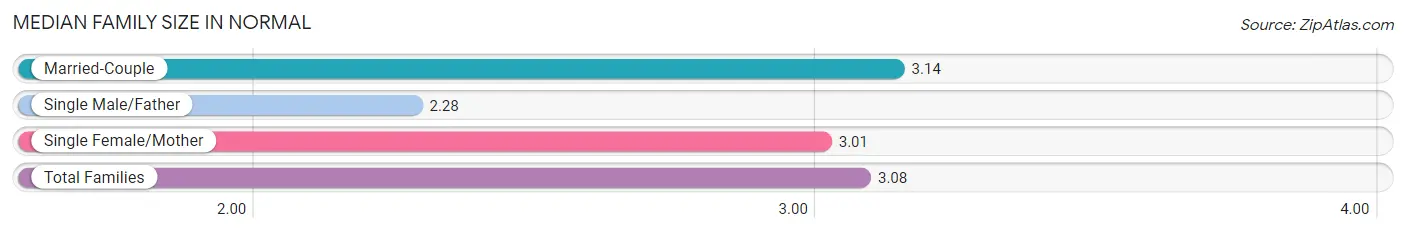
Median Family Size in Normal
The median family size in Normal is 3.08 persons per family, with married-couple families (7,468 | 76.5%) accounting for the largest median family size of 3.14 persons per family. On the other hand, single male/father families (491 | 5.0%) represent the smallest median family size with 2.28 persons per family.
| Family Type | # Families | Family Size |
| Married-Couple | 7,468 (76.5%) | 3.14 |
| Single Male/Father | 491 (5.0%) | 2.28 |
| Single Female/Mother | 1,800 (18.4%) | 3.01 |
| Total Families | 9,759 (100.0%) | 3.08 |
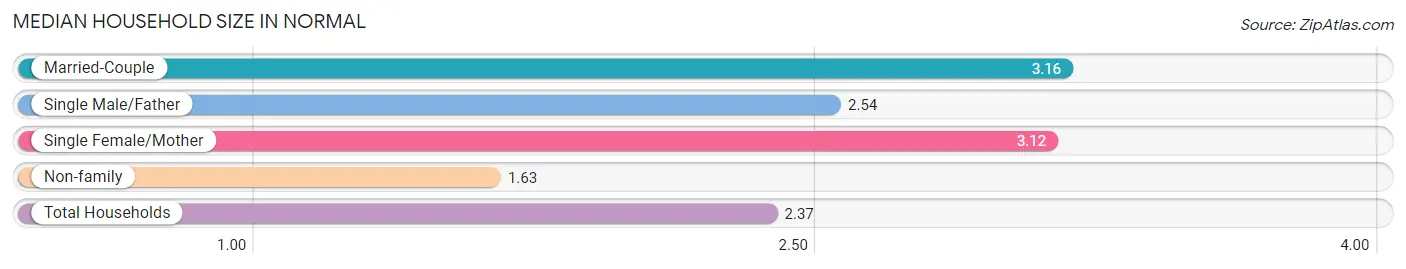
Median Household Size in Normal
The median household size in Normal is 2.37 persons per household, with married-couple households (7,468 | 38.0%) accounting for the largest median household size of 3.16 persons per household. non-family households (9,899 | 50.4%) represent the smallest median household size with 1.63 persons per household.
| Household Type | # Households | Household Size |
| Married-Couple | 7,468 (38.0%) | 3.16 |
| Single Male/Father | 491 (2.5%) | 2.54 |
| Single Female/Mother | 1,800 (9.2%) | 3.12 |
| Non-family | 9,899 (50.4%) | 1.63 |
| Total Households | 19,658 (100.0%) | 2.37 |
Household Size by Marriage Status in Normal
Out of a total of 19,658 households in Normal, 9,759 (49.6%) are family households, while 9,899 (50.4%) are nonfamily households. The most numerous type of family households are 2-person households, comprising 4,431, and the most common type of nonfamily households are 1-person households, comprising 6,282.
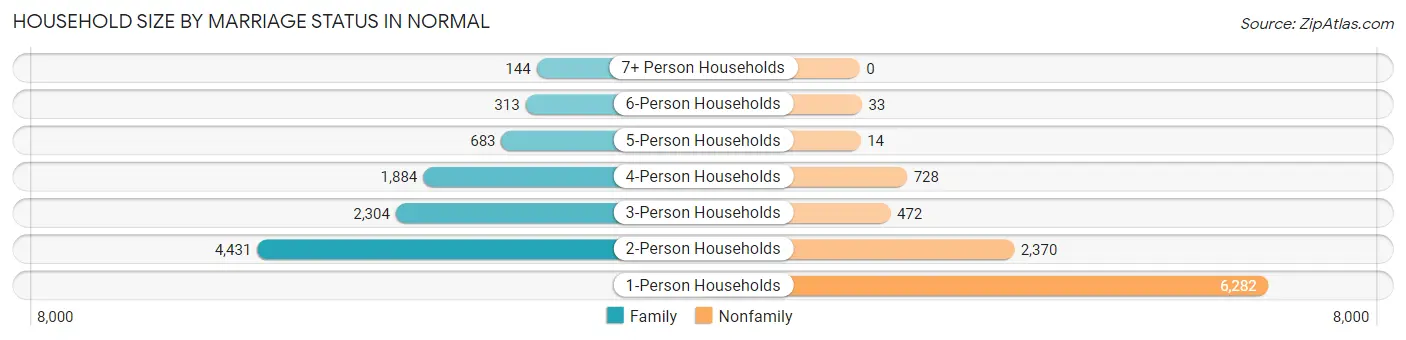
| Household Size | Family Households | Nonfamily Households |
| 1-Person Households | - | 6,282 (32.0%) |
| 2-Person Households | 4,431 (22.5%) | 2,370 (12.1%) |
| 3-Person Households | 2,304 (11.7%) | 472 (2.4%) |
| 4-Person Households | 1,884 (9.6%) | 728 (3.7%) |
| 5-Person Households | 683 (3.5%) | 14 (0.1%) |
| 6-Person Households | 313 (1.6%) | 33 (0.2%) |
| 7+ Person Households | 144 (0.7%) | 0 (0.0%) |
| Total | 9,759 (49.6%) | 9,899 (50.4%) |
Female Fertility in Normal
Fertility by Age in Normal
Average fertility rate in Normal is 40.0 births per 1,000 women. Women in the age bracket of 20 to 34 years have the highest fertility rate with 52.0 births per 1,000 women. Women in the age bracket of 20 to 34 years acount for 70.2% of all women with births.
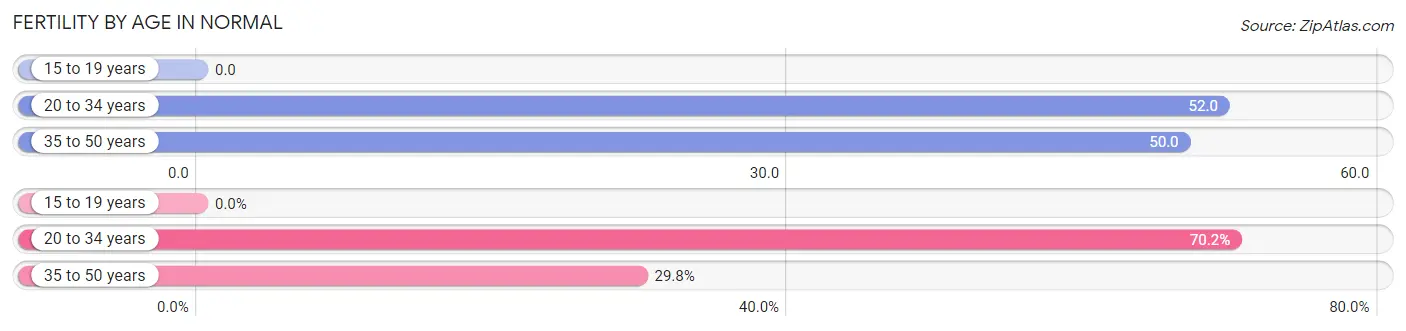
| Age Bracket | Women with Births | Births / 1,000 Women |
| 15 to 19 years | 0 (0.0%) | 0.0 |
| 20 to 34 years | 508 (70.2%) | 52.0 |
| 35 to 50 years | 216 (29.8%) | 50.0 |
| Total | 724 (100.0%) | 40.0 |
Fertility by Age by Marriage Status in Normal
54.8% of women with births (724) in Normal are married. The highest percentage of unmarried women with births falls into 20 to 34 years age bracket with 64.4% of them unmarried at the time of birth, while the lowest percentage of unmarried women with births belong to 35 to 50 years age bracket with 0.0% of them unmarried.
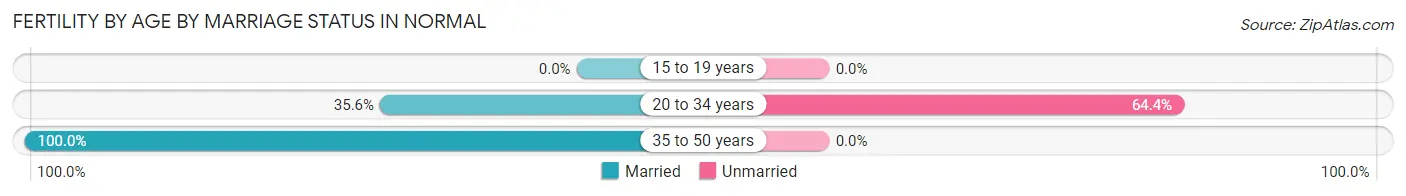
| Age Bracket | Married | Unmarried |
| 15 to 19 years | 0 (0.0%) | 0 (0.0%) |
| 20 to 34 years | 181 (35.6%) | 327 (64.4%) |
| 35 to 50 years | 216 (100.0%) | 0 (0.0%) |
| Total | 397 (54.8%) | 327 (45.2%) |
Fertility by Education in Normal
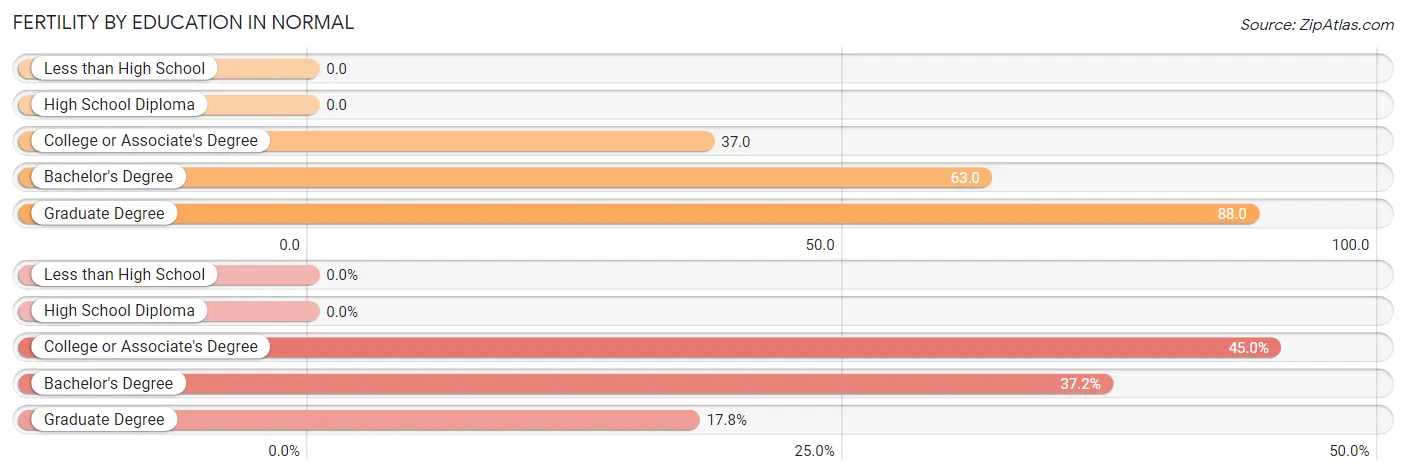
| Educational Attainment | Women with Births | Births / 1,000 Women |
| Less than High School | 0 (0.0%) | 0.0 |
| High School Diploma | 0 (0.0%) | 0.0 |
| College or Associate's Degree | 326 (45.0%) | 37.0 |
| Bachelor's Degree | 269 (37.1%) | 63.0 |
| Graduate Degree | 129 (17.8%) | 88.0 |
| Total | 724 (100.0%) | 40.0 |
Fertility by Education by Marriage Status in Normal
45.2% of women with births in Normal are unmarried. Women with the educational attainment of graduate degree are most likely to be married with 100.0% of them married at childbirth, while women with the educational attainment of college or associate's degree are least likely to be married with 95.1% of them unmarried at childbirth.
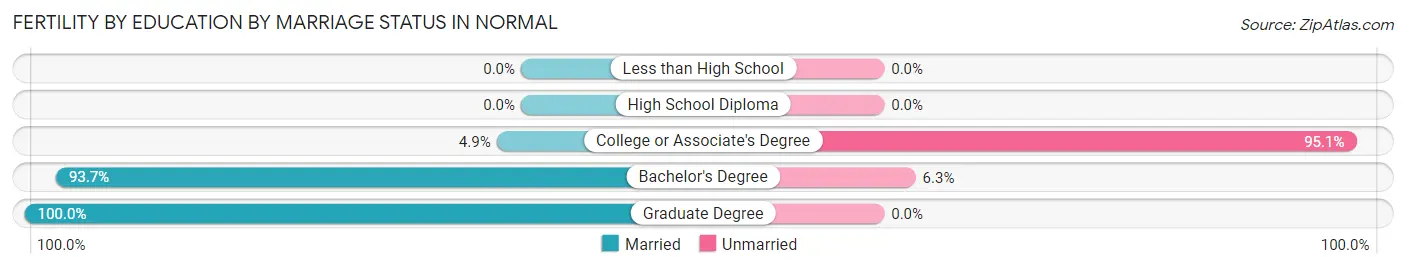
| Educational Attainment | Married | Unmarried |
| Less than High School | 0 (0.0%) | 0 (0.0%) |
| High School Diploma | 0 (0.0%) | 0 (0.0%) |
| College or Associate's Degree | 16 (4.9%) | 310 (95.1%) |
| Bachelor's Degree | 252 (93.7%) | 17 (6.3%) |
| Graduate Degree | 129 (100.0%) | 0 (0.0%) |
| Total | 397 (54.8%) | 327 (45.2%) |
Employment Characteristics in Normal
Employment by Class of Employer in Normal
Among the 25,975 employed individuals in Normal, private company employees (16,395 | 63.1%), state government employees (3,046 | 11.7%), and not-for-profit organizations (2,969 | 11.4%) make up the most common classes of employment.
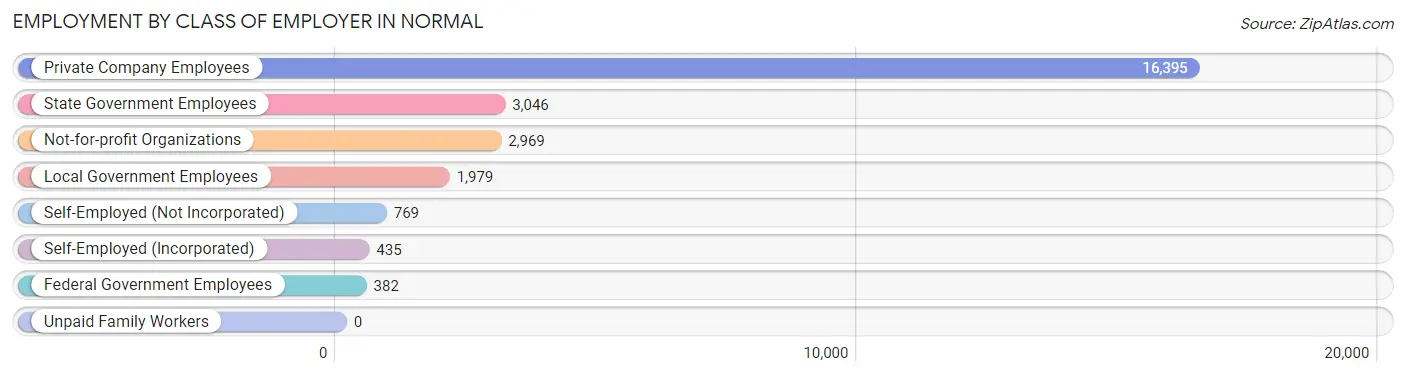
| Employer Class | # Employees | % Employees |
| Private Company Employees | 16,395 | 63.1% |
| Self-Employed (Incorporated) | 435 | 1.7% |
| Self-Employed (Not Incorporated) | 769 | 3.0% |
| Not-for-profit Organizations | 2,969 | 11.4% |
| Local Government Employees | 1,979 | 7.6% |
| State Government Employees | 3,046 | 11.7% |
| Federal Government Employees | 382 | 1.5% |
| Unpaid Family Workers | 0 | 0.0% |
| Total | 25,975 | 100.0% |
Employment Status by Age in Normal
According to the labor force statistics for Normal, out of the total population over 16 years of age (44,846), 62.0% or 27,805 individuals are in the labor force, with 3.9% or 1,084 of them unemployed. The age group with the highest labor force participation rate is 35 to 44 years, with 92.2% or 4,944 individuals in the labor force. Within the labor force, the 75 years and over age range has the highest percentage of unemployed individuals, with 9.2% or 20 of them being unemployed.
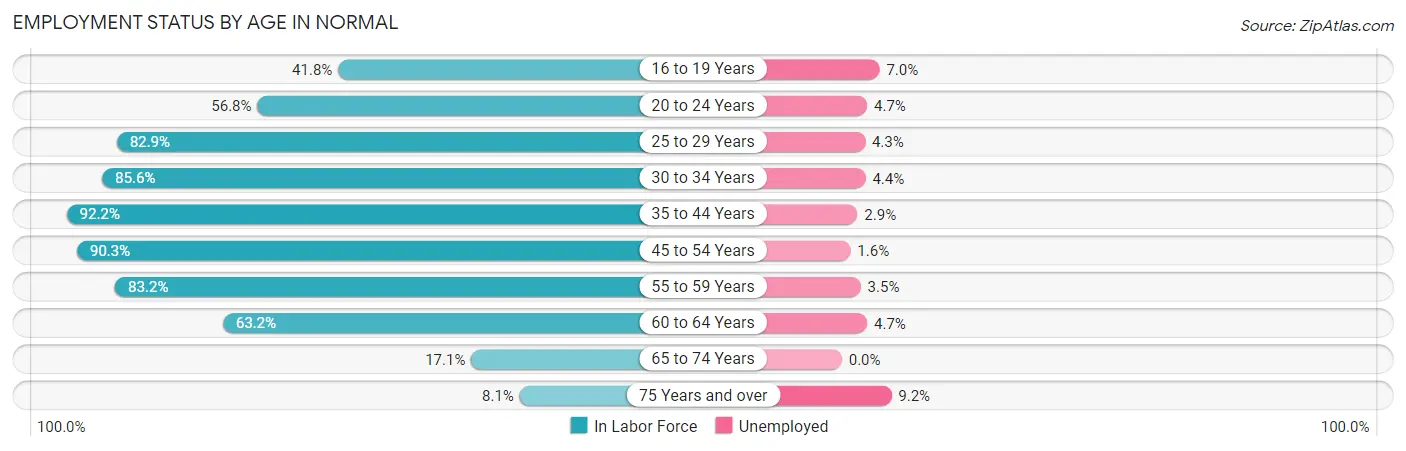
| Age Bracket | In Labor Force | Unemployed |
| 16 to 19 Years | 2,593 (41.8%) | 182 (7.0%) |
| 20 to 24 Years | 6,826 (56.8%) | 321 (4.7%) |
| 25 to 29 Years | 2,858 (82.9%) | 123 (4.3%) |
| 30 to 34 Years | 2,211 (85.6%) | 97 (4.4%) |
| 35 to 44 Years | 4,944 (92.2%) | 143 (2.9%) |
| 45 to 54 Years | 4,348 (90.3%) | 70 (1.6%) |
| 55 to 59 Years | 1,874 (83.2%) | 66 (3.5%) |
| 60 to 64 Years | 1,332 (63.2%) | 63 (4.7%) |
| 65 to 74 Years | 578 (17.1%) | 0 (0.0%) |
| 75 Years and over | 217 (8.1%) | 20 (9.2%) |
| Total | 27,805 (62.0%) | 1,084 (3.9%) |
Employment Status by Educational Attainment in Normal
According to labor force statistics for Normal, 85.4% of individuals (17,565) out of the total population between 25 and 64 years of age (20,568) are in the labor force, with 3.2% or 562 of them being unemployed. The group with the highest labor force participation rate are those with the educational attainment of bachelor's degree or higher, with 89.1% or 10,541 individuals in the labor force. Within the labor force, individuals with less than high school education have the highest percentage of unemployment, with 6.0% or 17 of them being unemployed.
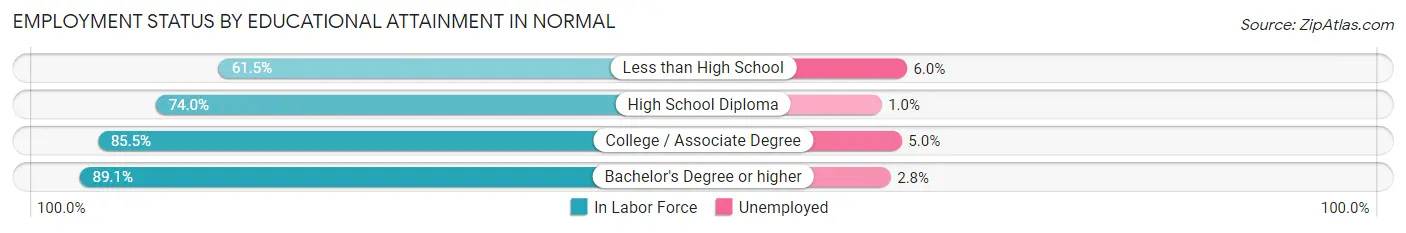
| Educational Attainment | In Labor Force | Unemployed |
| Less than High School | 281 (61.5%) | 27 (6.0%) |
| High School Diploma | 2,165 (74.0%) | 29 (1.0%) |
| College / Associate Degree | 4,578 (85.5%) | 268 (5.0%) |
| Bachelor's Degree or higher | 10,541 (89.1%) | 331 (2.8%) |
| Total | 17,565 (85.4%) | 658 (3.2%) |
Employment Occupations by Sex in Normal
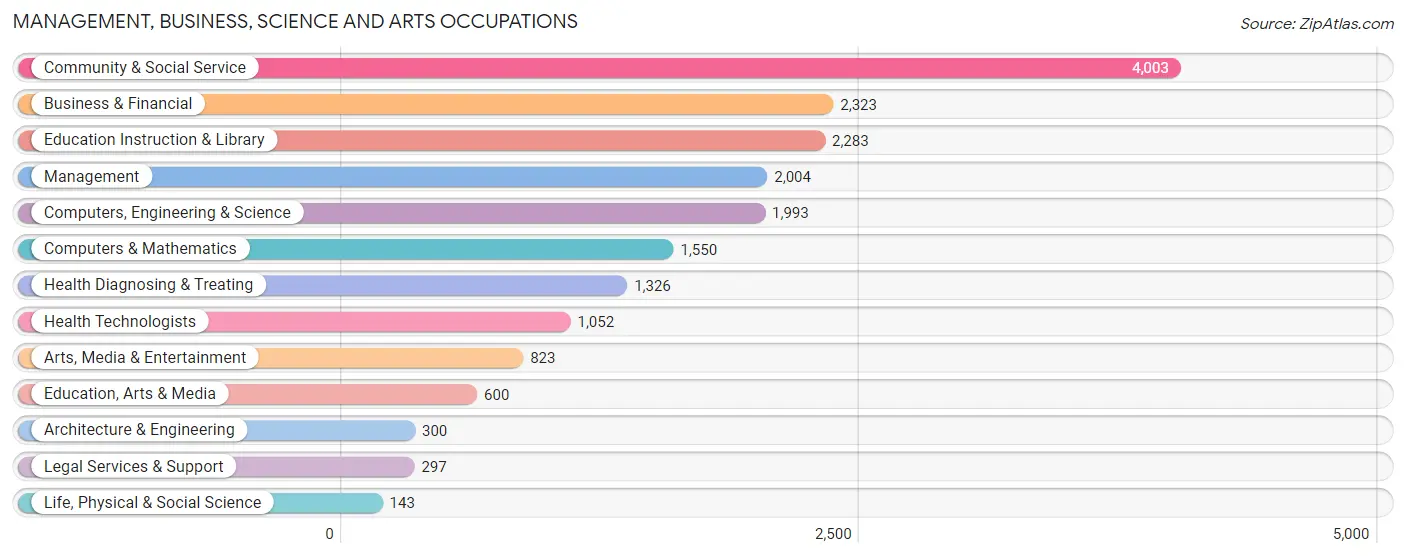
Management, Business, Science and Arts Occupations
The most common Management, Business, Science and Arts occupations in Normal are Community & Social Service (4,003 | 15.0%), Business & Financial (2,323 | 8.7%), Education Instruction & Library (2,283 | 8.6%), Management (2,004 | 7.5%), and Computers, Engineering & Science (1,993 | 7.5%).
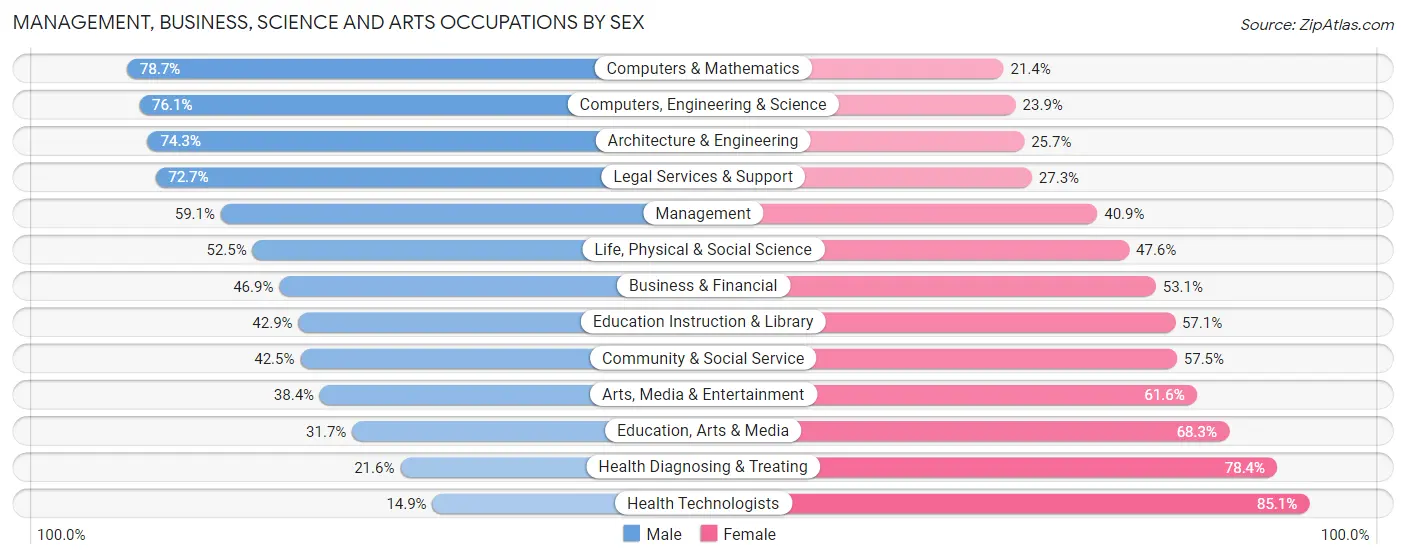
Management, Business, Science and Arts Occupations by Sex
Within the Management, Business, Science and Arts occupations in Normal, the most male-oriented occupations are Computers & Mathematics (78.6%), Computers, Engineering & Science (76.1%), and Architecture & Engineering (74.3%), while the most female-oriented occupations are Health Technologists (85.1%), Health Diagnosing & Treating (78.4%), and Education, Arts & Media (68.3%).
| Occupation | Male | Female |
| Management | 1,184 (59.1%) | 820 (40.9%) |
| Business & Financial | 1,089 (46.9%) | 1,234 (53.1%) |
| Computers, Engineering & Science | 1,517 (76.1%) | 476 (23.9%) |
| Computers & Mathematics | 1,219 (78.6%) | 331 (21.3%) |
| Architecture & Engineering | 223 (74.3%) | 77 (25.7%) |
| Life, Physical & Social Science | 75 (52.4%) | 68 (47.5%) |
| Community & Social Service | 1,701 (42.5%) | 2,302 (57.5%) |
| Education, Arts & Media | 190 (31.7%) | 410 (68.3%) |
| Legal Services & Support | 216 (72.7%) | 81 (27.3%) |
| Education Instruction & Library | 979 (42.9%) | 1,304 (57.1%) |
| Arts, Media & Entertainment | 316 (38.4%) | 507 (61.6%) |
| Health Diagnosing & Treating | 287 (21.6%) | 1,039 (78.4%) |
| Health Technologists | 157 (14.9%) | 895 (85.1%) |
| Total (Category) | 5,778 (49.6%) | 5,871 (50.4%) |
| Total (Overall) | 12,828 (48.1%) | 13,854 (51.9%) |
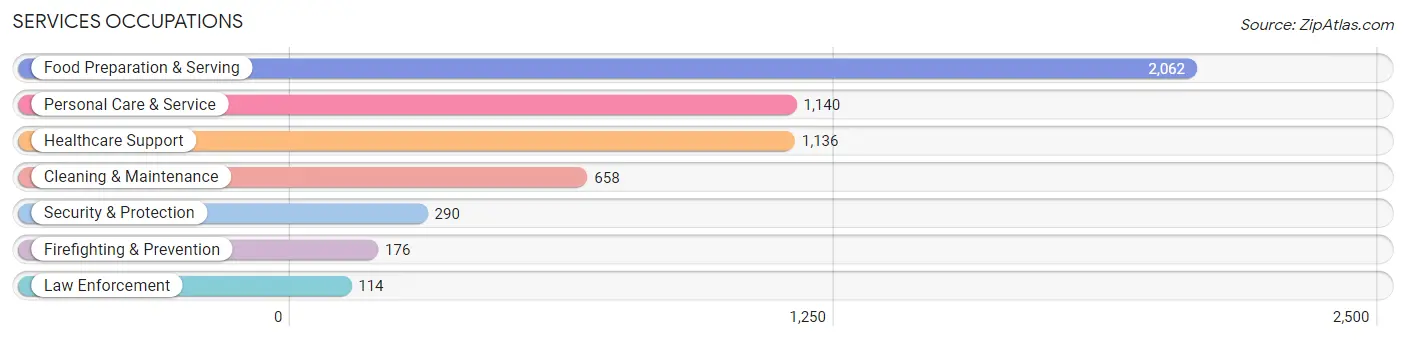
Services Occupations
The most common Services occupations in Normal are Food Preparation & Serving (2,062 | 7.7%), Personal Care & Service (1,140 | 4.3%), Healthcare Support (1,136 | 4.3%), Cleaning & Maintenance (658 | 2.5%), and Security & Protection (290 | 1.1%).
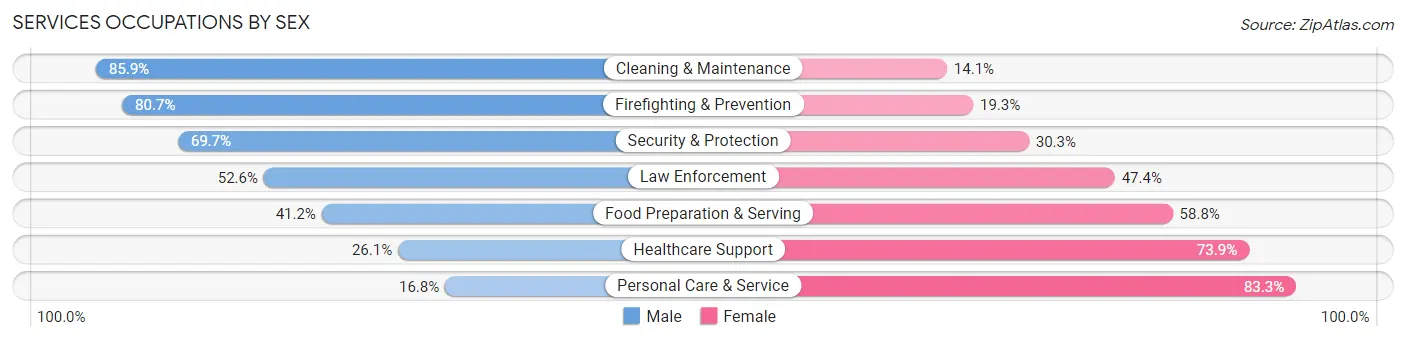
Services Occupations by Sex
Within the Services occupations in Normal, the most male-oriented occupations are Cleaning & Maintenance (85.9%), Firefighting & Prevention (80.7%), and Security & Protection (69.7%), while the most female-oriented occupations are Personal Care & Service (83.3%), Healthcare Support (73.9%), and Food Preparation & Serving (58.8%).
| Occupation | Male | Female |
| Healthcare Support | 296 (26.1%) | 840 (73.9%) |
| Security & Protection | 202 (69.7%) | 88 (30.3%) |
| Firefighting & Prevention | 142 (80.7%) | 34 (19.3%) |
| Law Enforcement | 60 (52.6%) | 54 (47.4%) |
| Food Preparation & Serving | 849 (41.2%) | 1,213 (58.8%) |
| Cleaning & Maintenance | 565 (85.9%) | 93 (14.1%) |
| Personal Care & Service | 191 (16.8%) | 949 (83.3%) |
| Total (Category) | 2,103 (39.8%) | 3,183 (60.2%) |
| Total (Overall) | 12,828 (48.1%) | 13,854 (51.9%) |
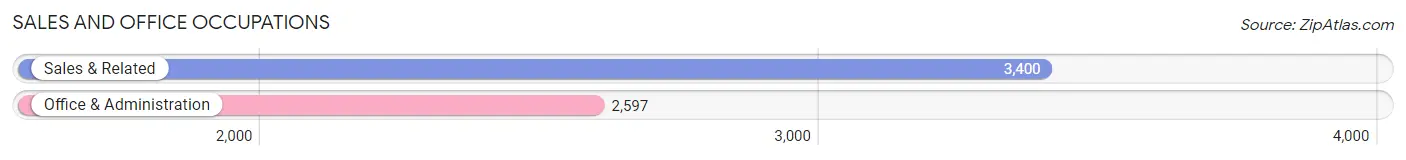
Sales and Office Occupations
The most common Sales and Office occupations in Normal are Sales & Related (3,400 | 12.7%), and Office & Administration (2,597 | 9.7%).
Sales and Office Occupations by Sex
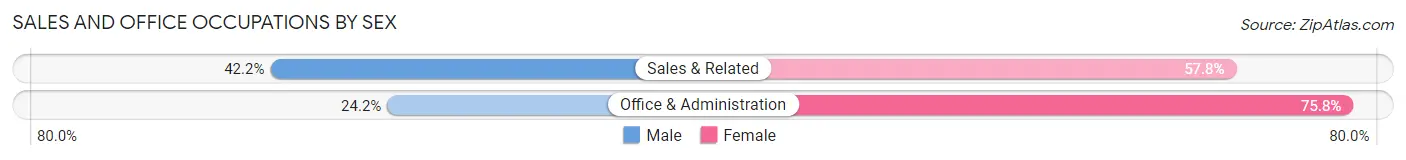
| Occupation | Male | Female |
| Sales & Related | 1,435 (42.2%) | 1,965 (57.8%) |
| Office & Administration | 629 (24.2%) | 1,968 (75.8%) |
| Total (Category) | 2,064 (34.4%) | 3,933 (65.6%) |
| Total (Overall) | 12,828 (48.1%) | 13,854 (51.9%) |
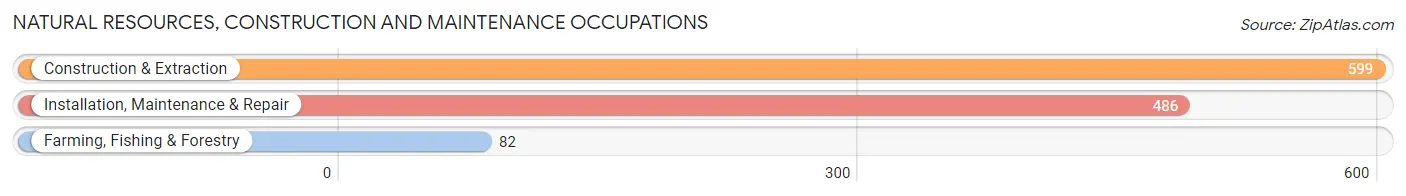
Natural Resources, Construction and Maintenance Occupations
The most common Natural Resources, Construction and Maintenance occupations in Normal are Construction & Extraction (599 | 2.2%), Installation, Maintenance & Repair (486 | 1.8%), and Farming, Fishing & Forestry (82 | 0.3%).
Natural Resources, Construction and Maintenance Occupations by Sex
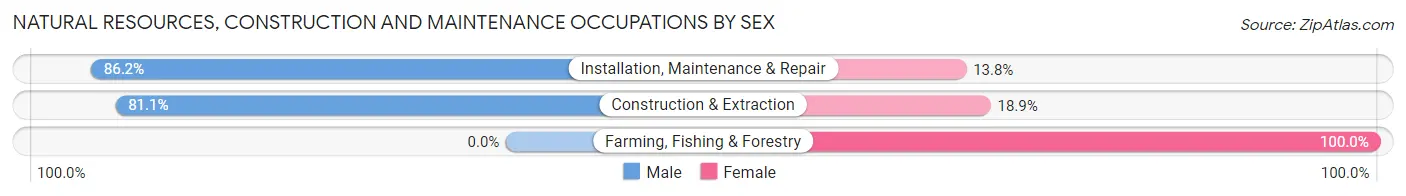
| Occupation | Male | Female |
| Farming, Fishing & Forestry | 0 (0.0%) | 82 (100.0%) |
| Construction & Extraction | 486 (81.1%) | 113 (18.9%) |
| Installation, Maintenance & Repair | 419 (86.2%) | 67 (13.8%) |
| Total (Category) | 905 (77.5%) | 262 (22.5%) |
| Total (Overall) | 12,828 (48.1%) | 13,854 (51.9%) |
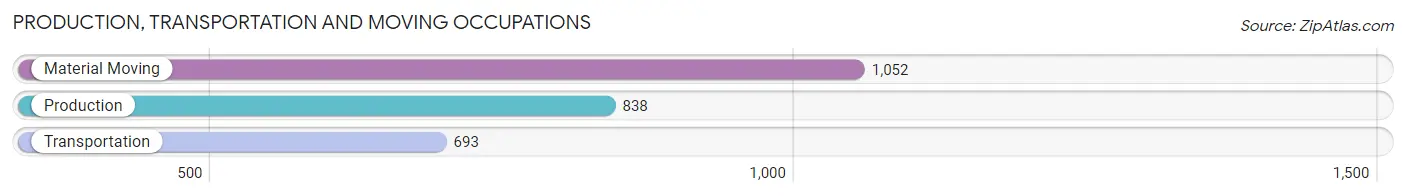
Production, Transportation and Moving Occupations
The most common Production, Transportation and Moving occupations in Normal are Material Moving (1,052 | 3.9%), Production (838 | 3.1%), and Transportation (693 | 2.6%).
Production, Transportation and Moving Occupations by Sex
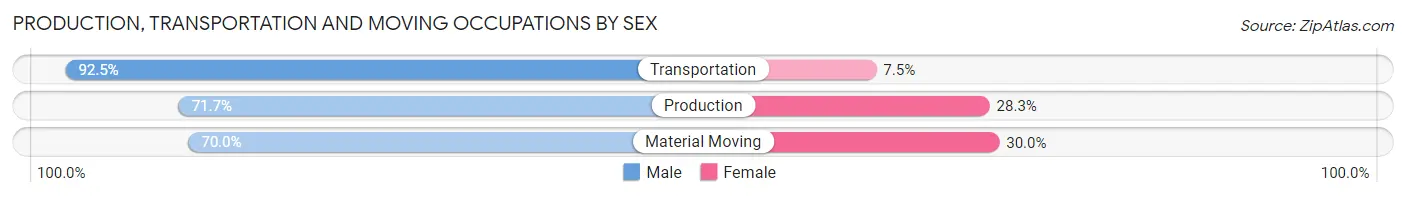
| Occupation | Male | Female |
| Production | 601 (71.7%) | 237 (28.3%) |
| Transportation | 641 (92.5%) | 52 (7.5%) |
| Material Moving | 736 (70.0%) | 316 (30.0%) |
| Total (Category) | 1,978 (76.6%) | 605 (23.4%) |
| Total (Overall) | 12,828 (48.1%) | 13,854 (51.9%) |
Employment Industries by Sex in Normal
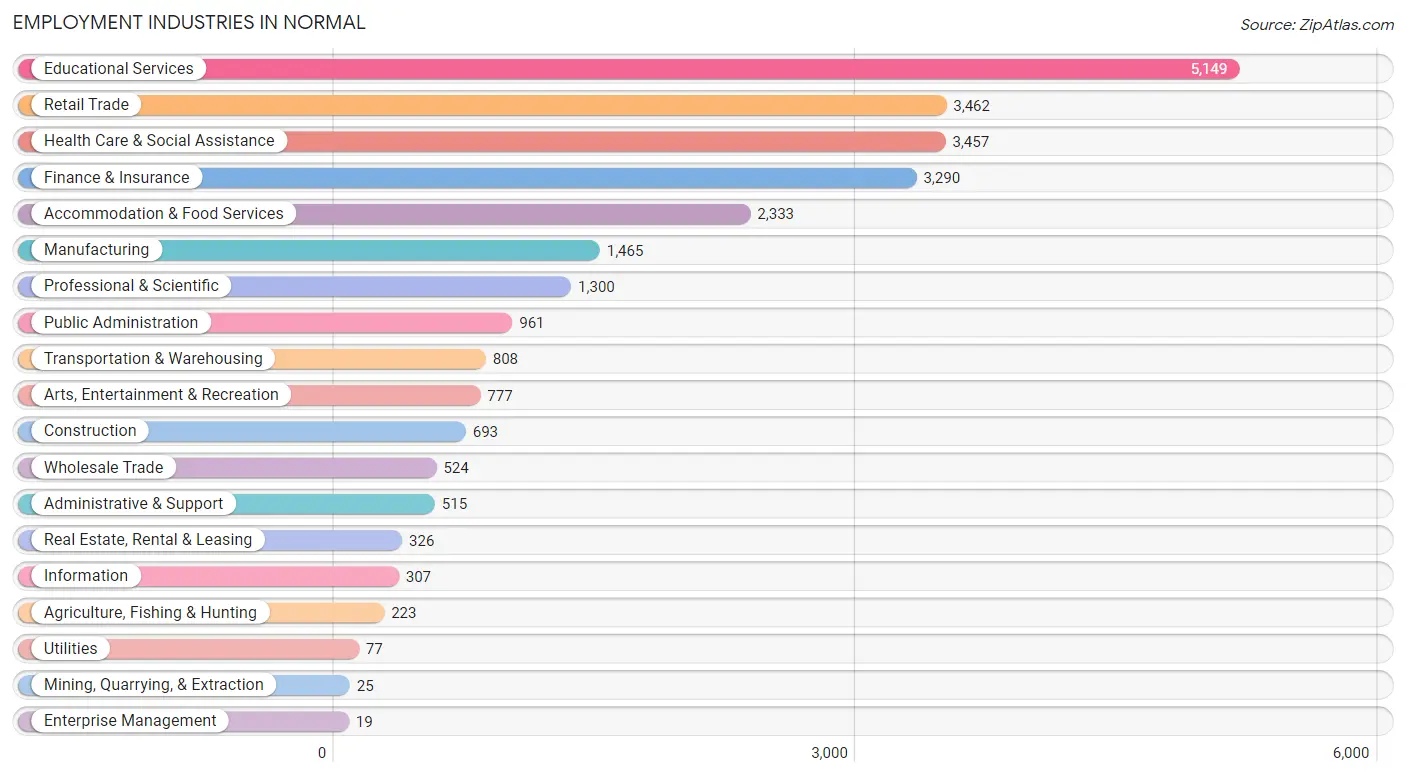
Employment Industries in Normal
The major employment industries in Normal include Educational Services (5,149 | 19.3%), Retail Trade (3,462 | 13.0%), Health Care & Social Assistance (3,457 | 13.0%), Finance & Insurance (3,290 | 12.3%), and Accommodation & Food Services (2,333 | 8.7%).
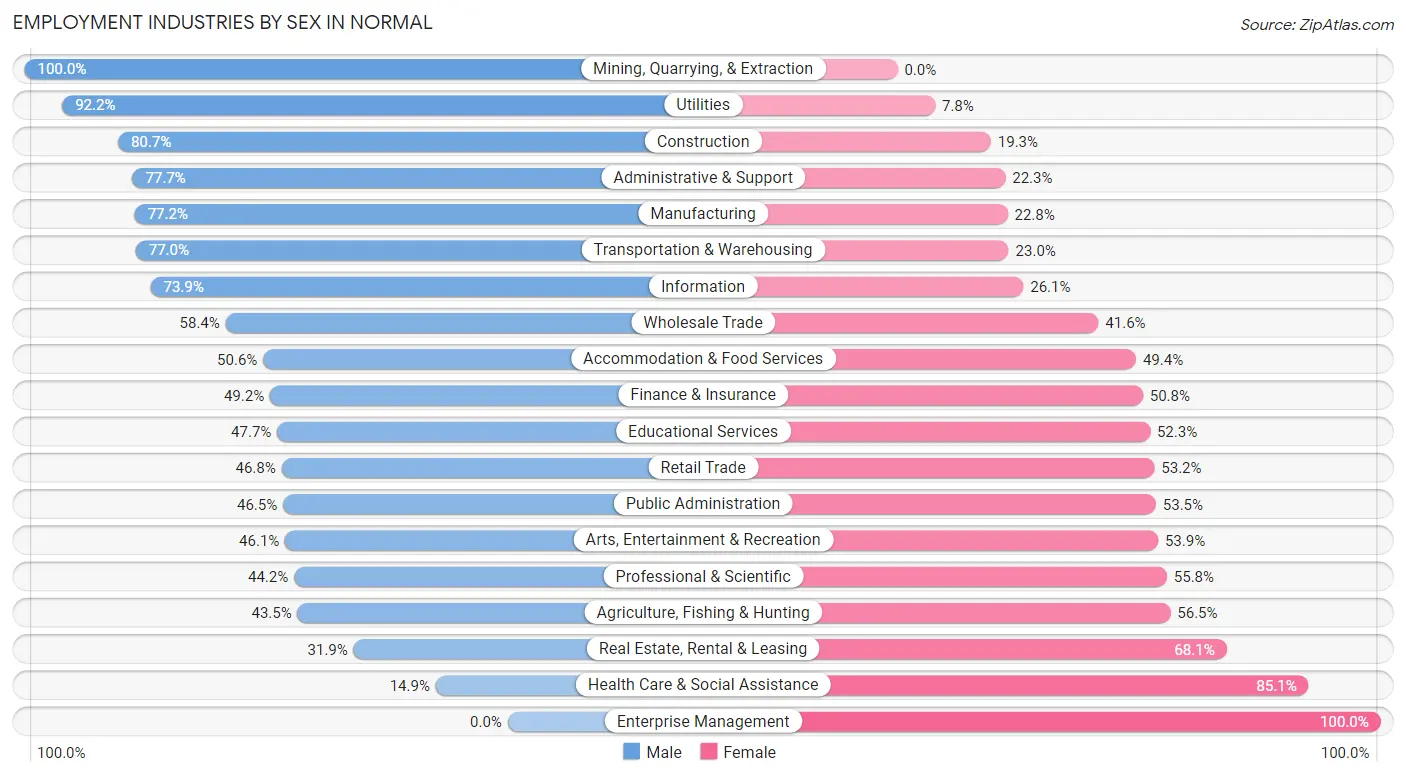
Employment Industries by Sex in Normal
The Normal industries that see more men than women are Mining, Quarrying, & Extraction (100.0%), Utilities (92.2%), and Construction (80.7%), whereas the industries that tend to have a higher number of women are Enterprise Management (100.0%), Health Care & Social Assistance (85.1%), and Real Estate, Rental & Leasing (68.1%).
| Industry | Male | Female |
| Agriculture, Fishing & Hunting | 97 (43.5%) | 126 (56.5%) |
| Mining, Quarrying, & Extraction | 25 (100.0%) | 0 (0.0%) |
| Construction | 559 (80.7%) | 134 (19.3%) |
| Manufacturing | 1,131 (77.2%) | 334 (22.8%) |
| Wholesale Trade | 306 (58.4%) | 218 (41.6%) |
| Retail Trade | 1,621 (46.8%) | 1,841 (53.2%) |
| Transportation & Warehousing | 622 (77.0%) | 186 (23.0%) |
| Utilities | 71 (92.2%) | 6 (7.8%) |
| Information | 227 (73.9%) | 80 (26.1%) |
| Finance & Insurance | 1,619 (49.2%) | 1,671 (50.8%) |
| Real Estate, Rental & Leasing | 104 (31.9%) | 222 (68.1%) |
| Professional & Scientific | 575 (44.2%) | 725 (55.8%) |
| Enterprise Management | 0 (0.0%) | 19 (100.0%) |
| Administrative & Support | 400 (77.7%) | 115 (22.3%) |
| Educational Services | 2,457 (47.7%) | 2,692 (52.3%) |
| Health Care & Social Assistance | 515 (14.9%) | 2,942 (85.1%) |
| Arts, Entertainment & Recreation | 358 (46.1%) | 419 (53.9%) |
| Accommodation & Food Services | 1,181 (50.6%) | 1,152 (49.4%) |
| Public Administration | 447 (46.5%) | 514 (53.5%) |
| Total | 12,828 (48.1%) | 13,854 (51.9%) |
Education in Normal
School Enrollment in Normal
The most common levels of schooling among the 24,224 students in Normal are college / undergraduate (15,357 | 63.4%), middle school (2,322 | 9.6%), and elementary school (2,068 | 8.5%).
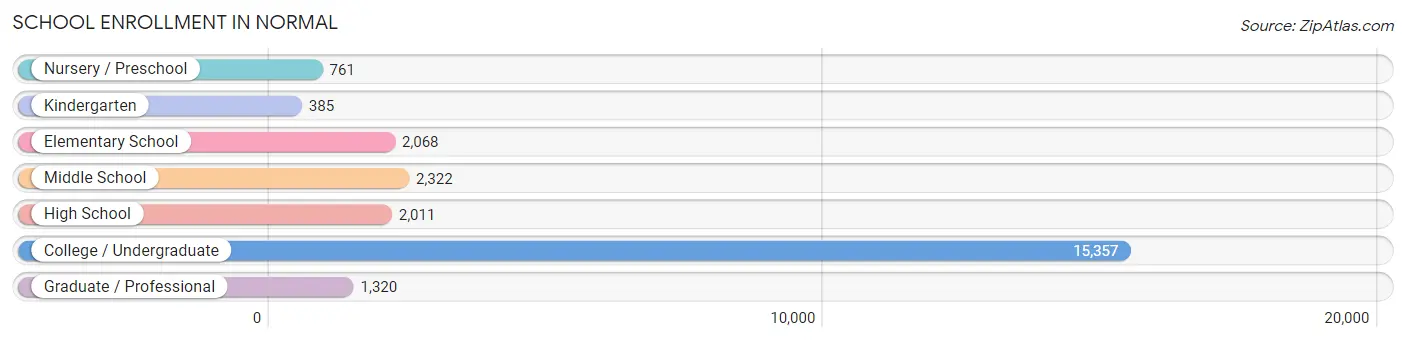
| School Level | # Students | % Students |
| Nursery / Preschool | 761 | 3.1% |
| Kindergarten | 385 | 1.6% |
| Elementary School | 2,068 | 8.5% |
| Middle School | 2,322 | 9.6% |
| High School | 2,011 | 8.3% |
| College / Undergraduate | 15,357 | 63.4% |
| Graduate / Professional | 1,320 | 5.4% |
| Total | 24,224 | 100.0% |
School Enrollment by Age by Funding Source in Normal
Out of a total of 24,224 students who are enrolled in schools in Normal, 2,083 (8.6%) attend a private institution, while the remaining 22,141 (91.4%) are enrolled in public schools. The age group of 3 to 4 year olds has the highest likelihood of being enrolled in private schools, with 362 (65.0% in the age bracket) enrolled. Conversely, the age group of 20 to 24 year olds has the lowest likelihood of being enrolled in a private school, with 9,538 (96.4% in the age bracket) attending a public institution.
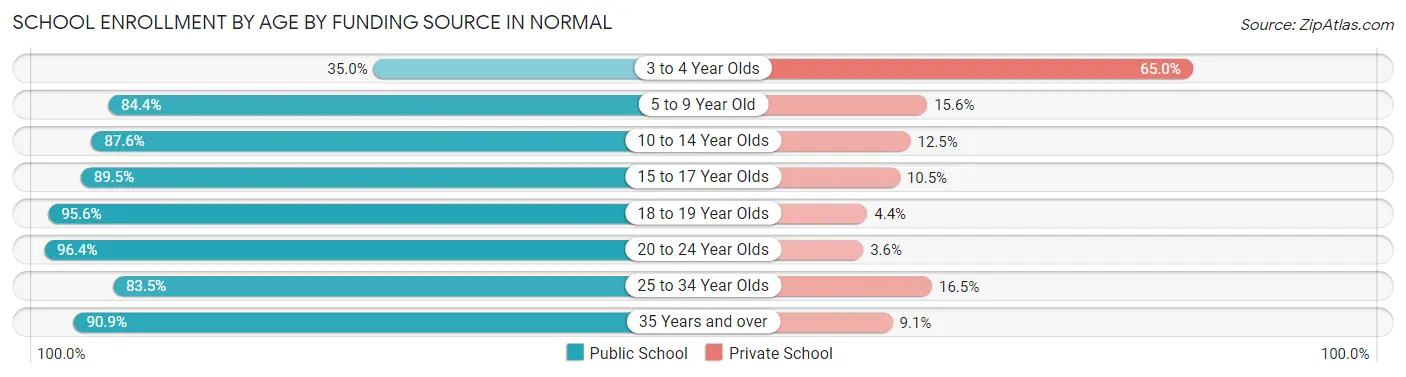
| Age Bracket | Public School | Private School |
| 3 to 4 Year Olds | 195 (35.0%) | 362 (65.0%) |
| 5 to 9 Year Old | 2,024 (84.4%) | 373 (15.6%) |
| 10 to 14 Year Olds | 2,327 (87.5%) | 331 (12.4%) |
| 15 to 17 Year Olds | 1,443 (89.5%) | 169 (10.5%) |
| 18 to 19 Year Olds | 4,794 (95.6%) | 221 (4.4%) |
| 20 to 24 Year Olds | 9,538 (96.4%) | 360 (3.6%) |
| 25 to 34 Year Olds | 1,010 (83.5%) | 199 (16.5%) |
| 35 Years and over | 798 (90.9%) | 80 (9.1%) |
| Total | 22,141 (91.4%) | 2,083 (8.6%) |
Educational Attainment by Field of Study in Normal
Business (2,595 | 16.9%), education (2,148 | 14.0%), science & technology (1,529 | 10.0%), bio, nature & agricultural (1,224 | 8.0%), and social sciences (1,188 | 7.7%) are the most common fields of study among 15,345 individuals in Normal who have obtained a bachelor's degree or higher.
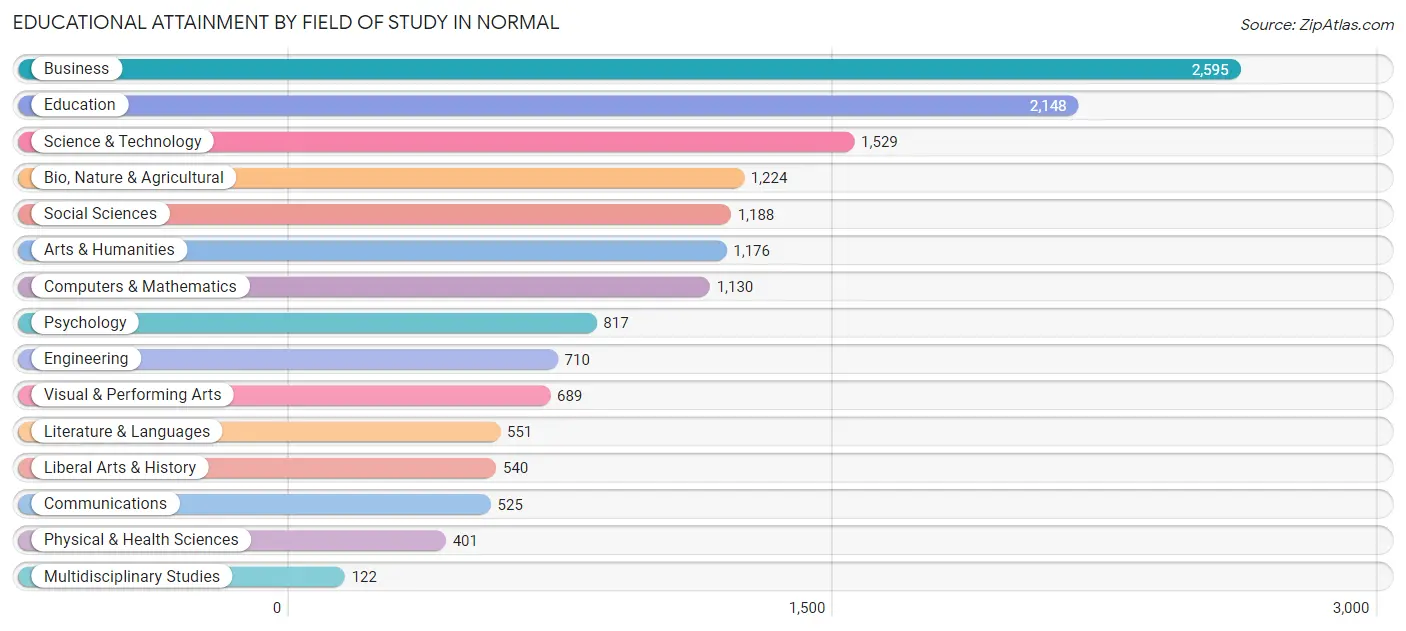
| Field of Study | # Graduates | % Graduates |
| Computers & Mathematics | 1,130 | 7.4% |
| Bio, Nature & Agricultural | 1,224 | 8.0% |
| Physical & Health Sciences | 401 | 2.6% |
| Psychology | 817 | 5.3% |
| Social Sciences | 1,188 | 7.7% |
| Engineering | 710 | 4.6% |
| Multidisciplinary Studies | 122 | 0.8% |
| Science & Technology | 1,529 | 10.0% |
| Business | 2,595 | 16.9% |
| Education | 2,148 | 14.0% |
| Literature & Languages | 551 | 3.6% |
| Liberal Arts & History | 540 | 3.5% |
| Visual & Performing Arts | 689 | 4.5% |
| Communications | 525 | 3.4% |
| Arts & Humanities | 1,176 | 7.7% |
| Total | 15,345 | 100.0% |
Transportation & Commute in Normal
Vehicle Availability by Sex in Normal
The most prevalent vehicle ownership categories in Normal are males with 2 vehicles (6,685, accounting for 57.7%) and females with 2 vehicles (5,922, making up 55.9%).
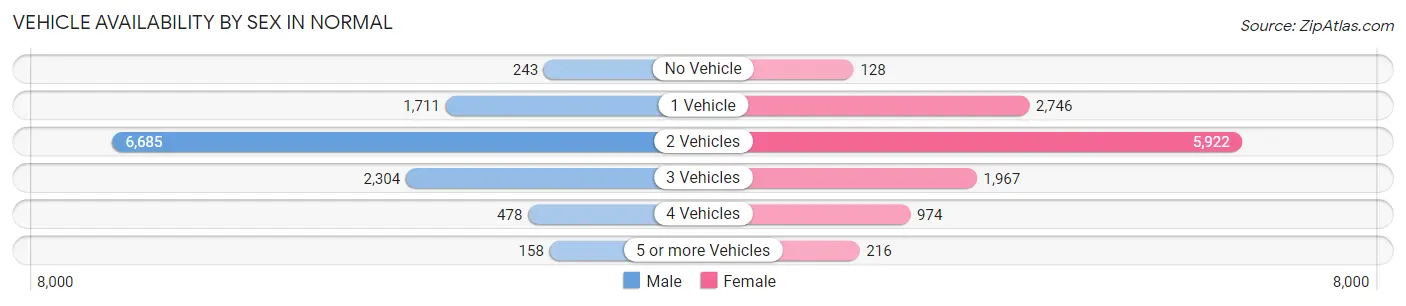
| Vehicles Available | Male | Female |
| No Vehicle | 243 (2.1%) | 128 (1.1%) |
| 1 Vehicle | 1,711 (14.8%) | 2,746 (23.0%) |
| 2 Vehicles | 6,685 (57.7%) | 5,922 (49.5%) |
| 3 Vehicles | 2,304 (19.9%) | 1,967 (16.5%) |
| 4 Vehicles | 478 (4.1%) | 974 (8.2%) |
| 5 or more Vehicles | 158 (1.4%) | 216 (1.8%) |
| Total | 11,579 (100.0%) | 11,953 (100.0%) |
Commute Time in Normal
The most frequently occuring commute durations in Normal are 10 to 14 minutes (6,094 commuters, 26.5%), 15 to 19 minutes (5,548 commuters, 24.1%), and 5 to 9 minutes (4,946 commuters, 21.5%).
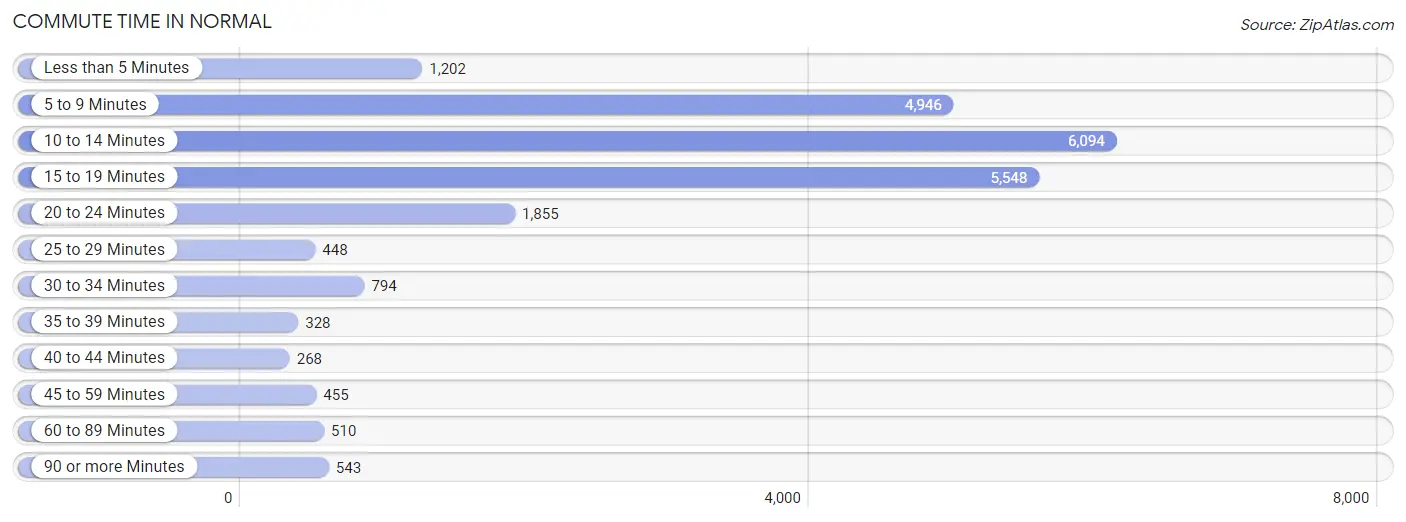
| Commute Time | # Commuters | % Commuters |
| Less than 5 Minutes | 1,202 | 5.2% |
| 5 to 9 Minutes | 4,946 | 21.5% |
| 10 to 14 Minutes | 6,094 | 26.5% |
| 15 to 19 Minutes | 5,548 | 24.1% |
| 20 to 24 Minutes | 1,855 | 8.1% |
| 25 to 29 Minutes | 448 | 1.9% |
| 30 to 34 Minutes | 794 | 3.5% |
| 35 to 39 Minutes | 328 | 1.4% |
| 40 to 44 Minutes | 268 | 1.2% |
| 45 to 59 Minutes | 455 | 2.0% |
| 60 to 89 Minutes | 510 | 2.2% |
| 90 or more Minutes | 543 | 2.4% |
Commute Time by Sex in Normal
The most common commute times in Normal are 15 to 19 minutes (2,804 commuters, 25.1%) for males and 10 to 14 minutes (3,320 commuters, 28.1%) for females.
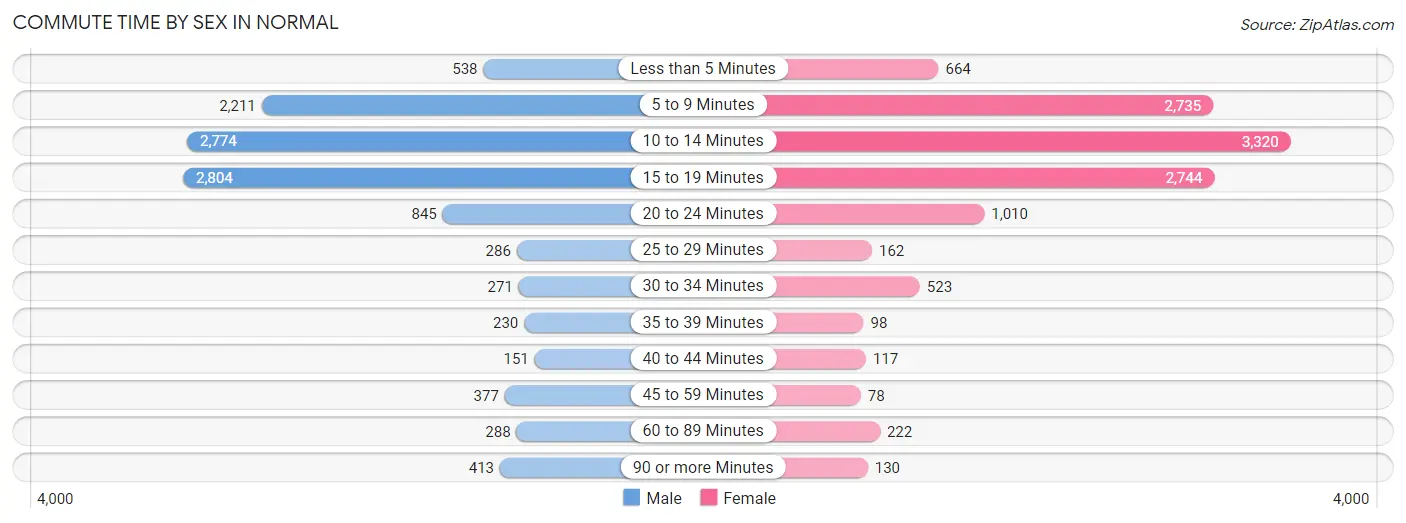
| Commute Time | Male | Female |
| Less than 5 Minutes | 538 (4.8%) | 664 (5.6%) |
| 5 to 9 Minutes | 2,211 (19.8%) | 2,735 (23.2%) |
| 10 to 14 Minutes | 2,774 (24.8%) | 3,320 (28.1%) |
| 15 to 19 Minutes | 2,804 (25.1%) | 2,744 (23.3%) |
| 20 to 24 Minutes | 845 (7.5%) | 1,010 (8.6%) |
| 25 to 29 Minutes | 286 (2.6%) | 162 (1.4%) |
| 30 to 34 Minutes | 271 (2.4%) | 523 (4.4%) |
| 35 to 39 Minutes | 230 (2.1%) | 98 (0.8%) |
| 40 to 44 Minutes | 151 (1.3%) | 117 (1.0%) |
| 45 to 59 Minutes | 377 (3.4%) | 78 (0.7%) |
| 60 to 89 Minutes | 288 (2.6%) | 222 (1.9%) |
| 90 or more Minutes | 413 (3.7%) | 130 (1.1%) |
Time of Departure to Work by Sex in Normal
The most frequent times of departure to work in Normal are 7:30 AM to 7:59 AM (1,982, 17.7%) for males and 7:30 AM to 7:59 AM (1,780, 15.1%) for females.
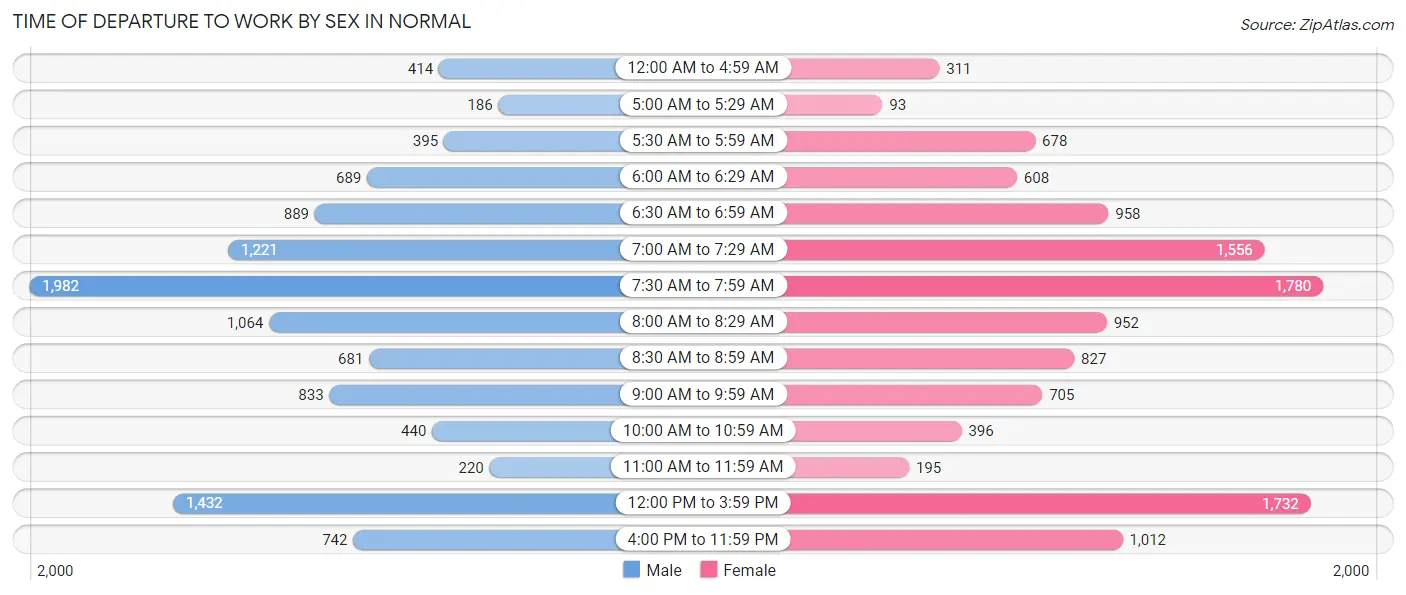
| Time of Departure | Male | Female |
| 12:00 AM to 4:59 AM | 414 (3.7%) | 311 (2.6%) |
| 5:00 AM to 5:29 AM | 186 (1.7%) | 93 (0.8%) |
| 5:30 AM to 5:59 AM | 395 (3.5%) | 678 (5.7%) |
| 6:00 AM to 6:29 AM | 689 (6.2%) | 608 (5.1%) |
| 6:30 AM to 6:59 AM | 889 (8.0%) | 958 (8.1%) |
| 7:00 AM to 7:29 AM | 1,221 (10.9%) | 1,556 (13.2%) |
| 7:30 AM to 7:59 AM | 1,982 (17.7%) | 1,780 (15.1%) |
| 8:00 AM to 8:29 AM | 1,064 (9.5%) | 952 (8.1%) |
| 8:30 AM to 8:59 AM | 681 (6.1%) | 827 (7.0%) |
| 9:00 AM to 9:59 AM | 833 (7.4%) | 705 (6.0%) |
| 10:00 AM to 10:59 AM | 440 (3.9%) | 396 (3.4%) |
| 11:00 AM to 11:59 AM | 220 (2.0%) | 195 (1.7%) |
| 12:00 PM to 3:59 PM | 1,432 (12.8%) | 1,732 (14.7%) |
| 4:00 PM to 11:59 PM | 742 (6.6%) | 1,012 (8.6%) |
| Total | 11,188 (100.0%) | 11,803 (100.0%) |
Housing Occupancy in Normal
Occupancy by Ownership in Normal
Of the total 19,658 dwellings in Normal, owner-occupied units account for 10,968 (55.8%), while renter-occupied units make up 8,690 (44.2%).
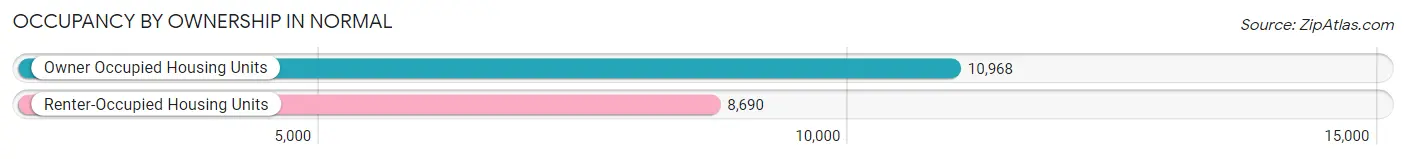
| Occupancy | # Housing Units | % Housing Units |
| Owner Occupied Housing Units | 10,968 | 55.8% |
| Renter-Occupied Housing Units | 8,690 | 44.2% |
| Total Occupied Housing Units | 19,658 | 100.0% |
Occupancy by Household Size in Normal
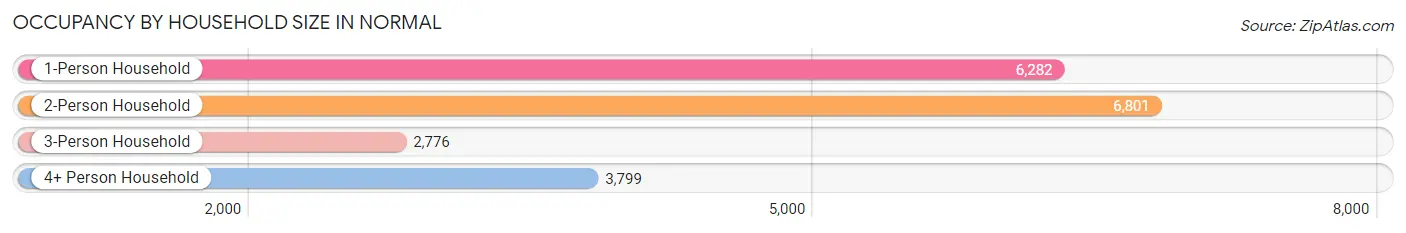
| Household Size | # Housing Units | % Housing Units |
| 1-Person Household | 6,282 | 32.0% |
| 2-Person Household | 6,801 | 34.6% |
| 3-Person Household | 2,776 | 14.1% |
| 4+ Person Household | 3,799 | 19.3% |
| Total Housing Units | 19,658 | 100.0% |
Occupancy by Ownership by Household Size in Normal
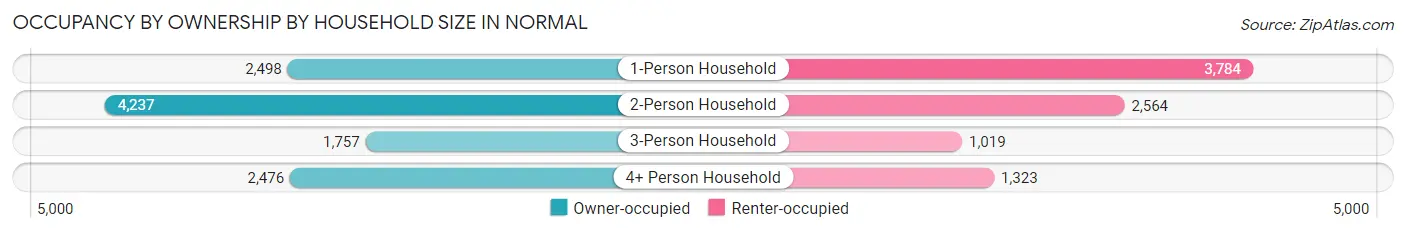
| Household Size | Owner-occupied | Renter-occupied |
| 1-Person Household | 2,498 (39.8%) | 3,784 (60.2%) |
| 2-Person Household | 4,237 (62.3%) | 2,564 (37.7%) |
| 3-Person Household | 1,757 (63.3%) | 1,019 (36.7%) |
| 4+ Person Household | 2,476 (65.2%) | 1,323 (34.8%) |
| Total Housing Units | 10,968 (55.8%) | 8,690 (44.2%) |
Occupancy by Educational Attainment in Normal
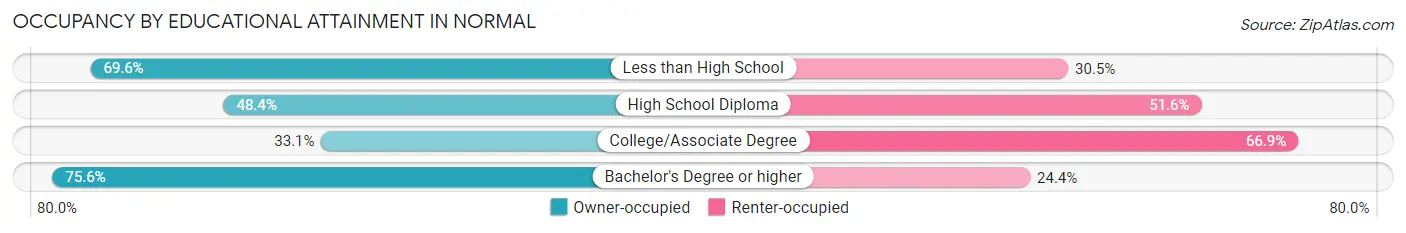
| Household Size | Owner-occupied | Renter-occupied |
| Less than High School | 217 (69.6%) | 95 (30.4%) |
| High School Diploma | 1,308 (48.4%) | 1,392 (51.6%) |
| College/Associate Degree | 2,444 (33.1%) | 4,942 (66.9%) |
| Bachelor's Degree or higher | 6,999 (75.6%) | 2,261 (24.4%) |
Occupancy by Age of Householder in Normal
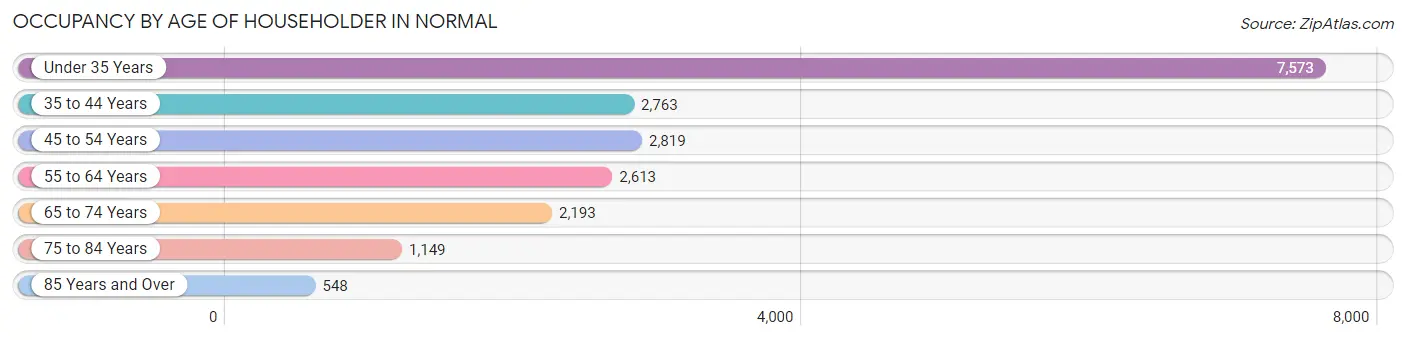
| Age Bracket | # Households | % Households |
| Under 35 Years | 7,573 | 38.5% |
| 35 to 44 Years | 2,763 | 14.1% |
| 45 to 54 Years | 2,819 | 14.3% |
| 55 to 64 Years | 2,613 | 13.3% |
| 65 to 74 Years | 2,193 | 11.2% |
| 75 to 84 Years | 1,149 | 5.8% |
| 85 Years and Over | 548 | 2.8% |
| Total | 19,658 | 100.0% |
Housing Finances in Normal
Median Income by Occupancy in Normal
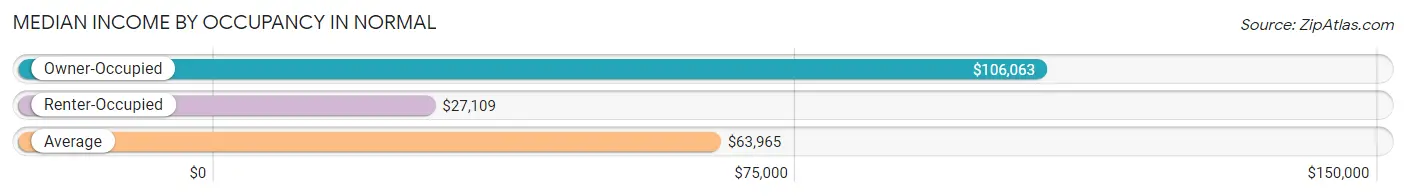
| Occupancy Type | # Households | Median Income |
| Owner-Occupied | 10,968 (55.8%) | $106,063 |
| Renter-Occupied | 8,690 (44.2%) | $27,109 |
| Average | 19,658 (100.0%) | $63,965 |
Occupancy by Householder Income Bracket in Normal
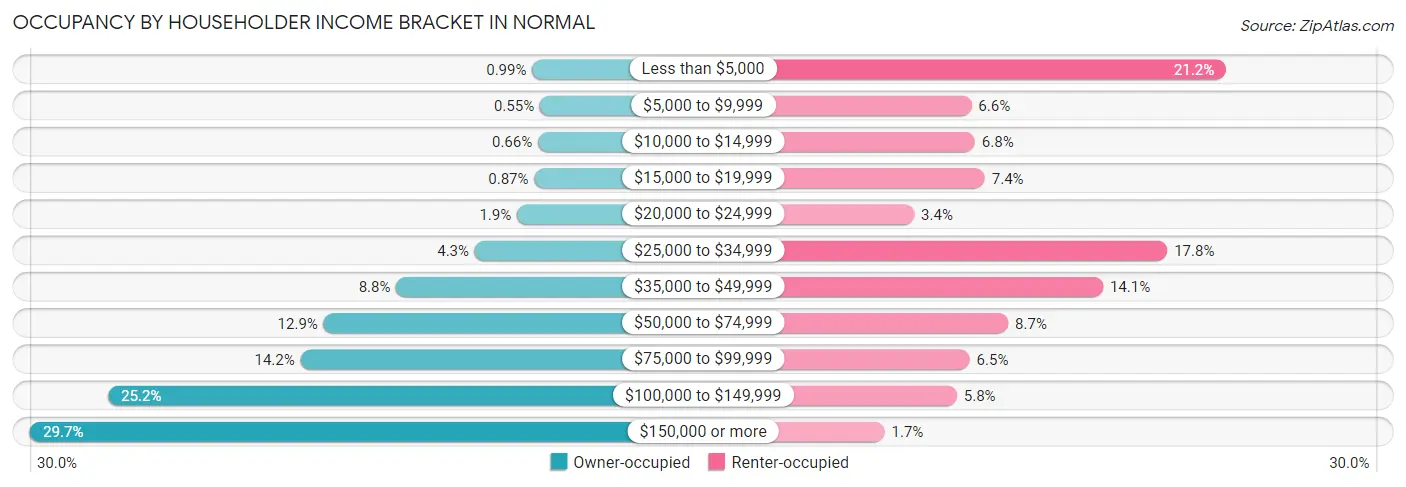
| Income Bracket | Owner-occupied | Renter-occupied |
| Less than $5,000 | 109 (1.0%) | 1,840 (21.2%) |
| $5,000 to $9,999 | 60 (0.5%) | 575 (6.6%) |
| $10,000 to $14,999 | 72 (0.7%) | 593 (6.8%) |
| $15,000 to $19,999 | 95 (0.9%) | 642 (7.4%) |
| $20,000 to $24,999 | 204 (1.9%) | 291 (3.4%) |
| $25,000 to $34,999 | 468 (4.3%) | 1,548 (17.8%) |
| $35,000 to $49,999 | 961 (8.8%) | 1,229 (14.1%) |
| $50,000 to $74,999 | 1,416 (12.9%) | 758 (8.7%) |
| $75,000 to $99,999 | 1,561 (14.2%) | 567 (6.5%) |
| $100,000 to $149,999 | 2,767 (25.2%) | 503 (5.8%) |
| $150,000 or more | 3,255 (29.7%) | 144 (1.7%) |
| Total | 10,968 (100.0%) | 8,690 (100.0%) |
Monthly Housing Cost Tiers in Normal
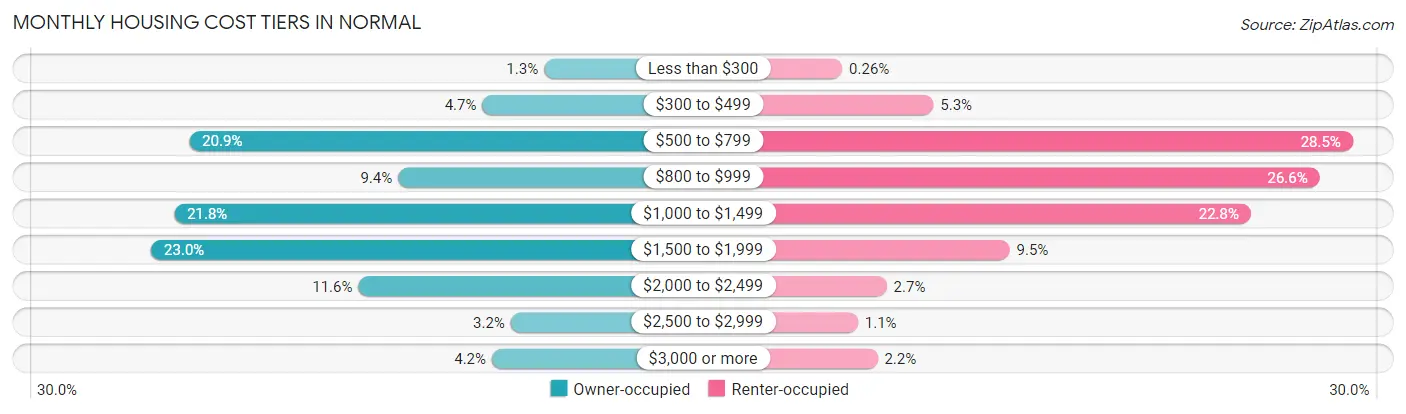
| Monthly Cost | Owner-occupied | Renter-occupied |
| Less than $300 | 144 (1.3%) | 23 (0.3%) |
| $300 to $499 | 518 (4.7%) | 461 (5.3%) |
| $500 to $799 | 2,293 (20.9%) | 2,473 (28.5%) |
| $800 to $999 | 1,028 (9.4%) | 2,314 (26.6%) |
| $1,000 to $1,499 | 2,385 (21.7%) | 1,984 (22.8%) |
| $1,500 to $1,999 | 2,525 (23.0%) | 826 (9.5%) |
| $2,000 to $2,499 | 1,269 (11.6%) | 236 (2.7%) |
| $2,500 to $2,999 | 346 (3.2%) | 98 (1.1%) |
| $3,000 or more | 460 (4.2%) | 192 (2.2%) |
| Total | 10,968 (100.0%) | 8,690 (100.0%) |
Physical Housing Characteristics in Normal
Housing Structures in Normal
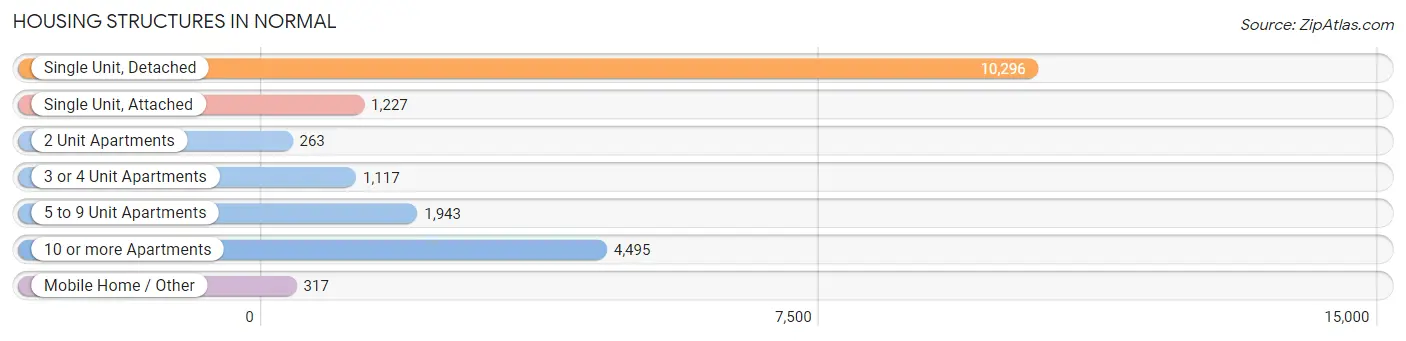
| Structure Type | # Housing Units | % Housing Units |
| Single Unit, Detached | 10,296 | 52.4% |
| Single Unit, Attached | 1,227 | 6.2% |
| 2 Unit Apartments | 263 | 1.3% |
| 3 or 4 Unit Apartments | 1,117 | 5.7% |
| 5 to 9 Unit Apartments | 1,943 | 9.9% |
| 10 or more Apartments | 4,495 | 22.9% |
| Mobile Home / Other | 317 | 1.6% |
| Total | 19,658 | 100.0% |
Housing Structures by Occupancy in Normal
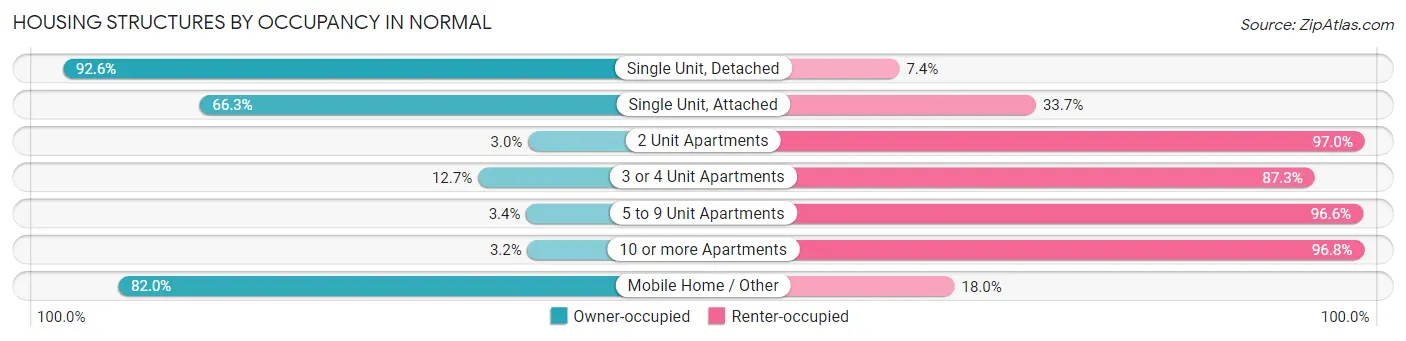
| Structure Type | Owner-occupied | Renter-occupied |
| Single Unit, Detached | 9,536 (92.6%) | 760 (7.4%) |
| Single Unit, Attached | 814 (66.3%) | 413 (33.7%) |
| 2 Unit Apartments | 8 (3.0%) | 255 (97.0%) |
| 3 or 4 Unit Apartments | 142 (12.7%) | 975 (87.3%) |
| 5 to 9 Unit Apartments | 66 (3.4%) | 1,877 (96.6%) |
| 10 or more Apartments | 142 (3.2%) | 4,353 (96.8%) |
| Mobile Home / Other | 260 (82.0%) | 57 (18.0%) |
| Total | 10,968 (55.8%) | 8,690 (44.2%) |
Housing Structures by Number of Rooms in Normal
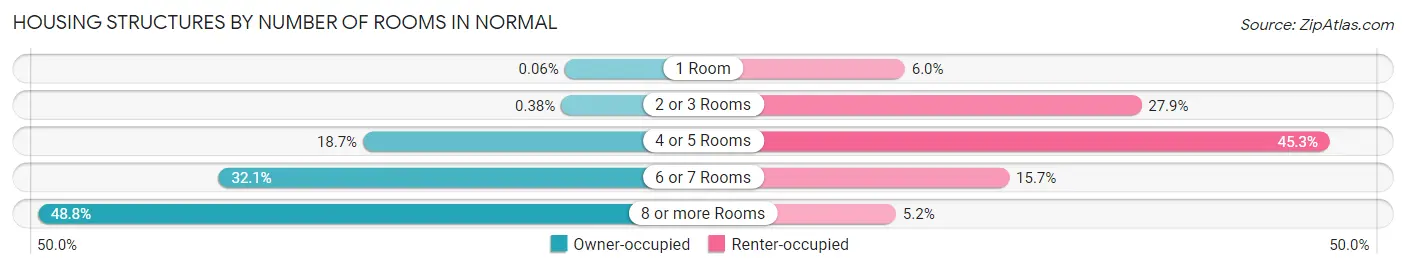
| Number of Rooms | Owner-occupied | Renter-occupied |
| 1 Room | 7 (0.1%) | 521 (6.0%) |
| 2 or 3 Rooms | 42 (0.4%) | 2,422 (27.9%) |
| 4 or 5 Rooms | 2,052 (18.7%) | 3,937 (45.3%) |
| 6 or 7 Rooms | 3,517 (32.1%) | 1,360 (15.7%) |
| 8 or more Rooms | 5,350 (48.8%) | 450 (5.2%) |
| Total | 10,968 (100.0%) | 8,690 (100.0%) |
Housing Structure by Heating Type in Normal
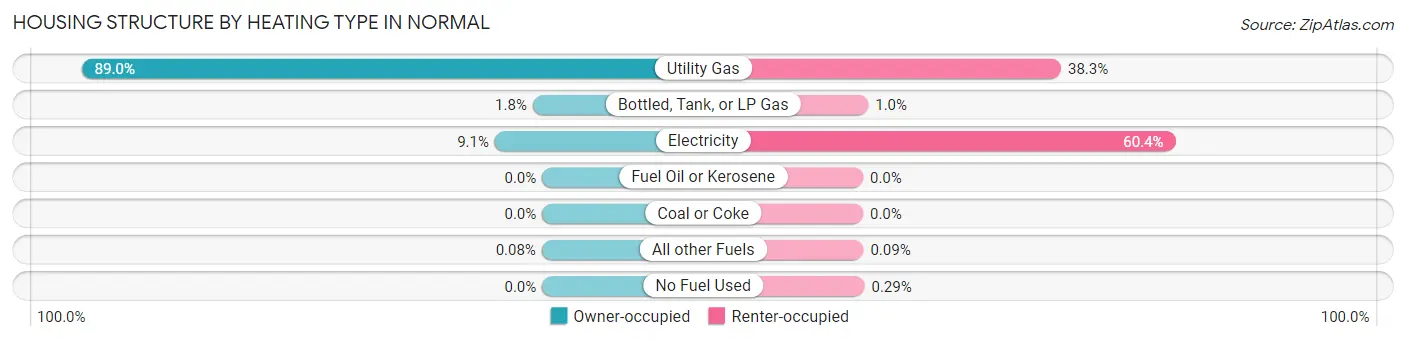
| Heating Type | Owner-occupied | Renter-occupied |
| Utility Gas | 9,759 (89.0%) | 3,325 (38.3%) |
| Bottled, Tank, or LP Gas | 198 (1.8%) | 88 (1.0%) |
| Electricity | 1,002 (9.1%) | 5,244 (60.4%) |
| Fuel Oil or Kerosene | 0 (0.0%) | 0 (0.0%) |
| Coal or Coke | 0 (0.0%) | 0 (0.0%) |
| All other Fuels | 9 (0.1%) | 8 (0.1%) |
| No Fuel Used | 0 (0.0%) | 25 (0.3%) |
| Total | 10,968 (100.0%) | 8,690 (100.0%) |
Household Vehicle Usage in Normal
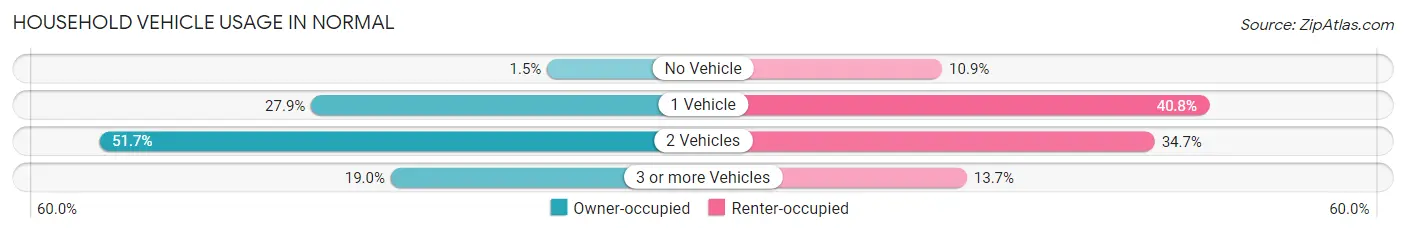
| Vehicles per Household | Owner-occupied | Renter-occupied |
| No Vehicle | 160 (1.5%) | 946 (10.9%) |
| 1 Vehicle | 3,060 (27.9%) | 3,542 (40.8%) |
| 2 Vehicles | 5,666 (51.7%) | 3,015 (34.7%) |
| 3 or more Vehicles | 2,082 (19.0%) | 1,187 (13.7%) |
| Total | 10,968 (100.0%) | 8,690 (100.0%) |
Real Estate & Mortgages in Normal
Real Estate and Mortgage Overview in Normal
| Characteristic | Without Mortgage | With Mortgage |
| Housing Units | 3,737 | 7,231 |
| Median Property Value | $177,300 | $203,300 |
| Median Household Income | $80,313 | $2,398 |
| Monthly Housing Costs | $689 | $449 |
| Real Estate Taxes | $4,307 | $116 |
Property Value by Mortgage Status in Normal
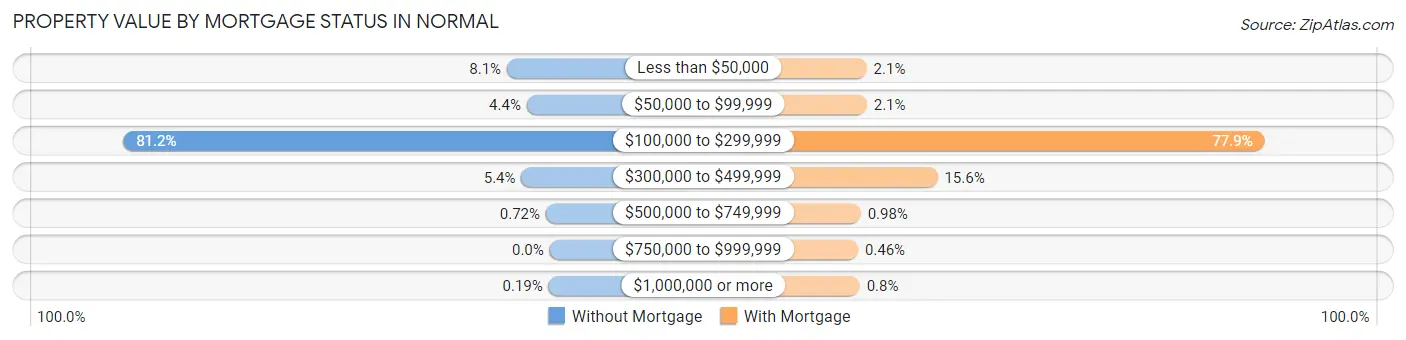
| Property Value | Without Mortgage | With Mortgage |
| Less than $50,000 | 304 (8.1%) | 153 (2.1%) |
| $50,000 to $99,999 | 163 (4.4%) | 155 (2.1%) |
| $100,000 to $299,999 | 3,035 (81.2%) | 5,632 (77.9%) |
| $300,000 to $499,999 | 201 (5.4%) | 1,129 (15.6%) |
| $500,000 to $749,999 | 27 (0.7%) | 71 (1.0%) |
| $750,000 to $999,999 | 0 (0.0%) | 33 (0.5%) |
| $1,000,000 or more | 7 (0.2%) | 58 (0.8%) |
| Total | 3,737 (100.0%) | 7,231 (100.0%) |
Household Income by Mortgage Status in Normal
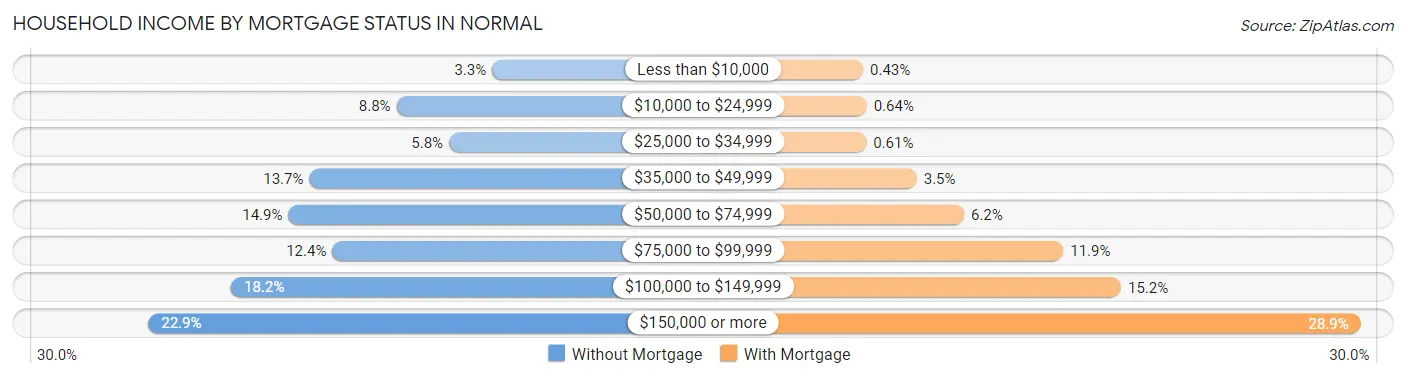
| Household Income | Without Mortgage | With Mortgage |
| Less than $10,000 | 123 (3.3%) | 31 (0.4%) |
| $10,000 to $24,999 | 327 (8.7%) | 46 (0.6%) |
| $25,000 to $34,999 | 215 (5.8%) | 44 (0.6%) |
| $35,000 to $49,999 | 513 (13.7%) | 253 (3.5%) |
| $50,000 to $74,999 | 558 (14.9%) | 448 (6.2%) |
| $75,000 to $99,999 | 464 (12.4%) | 858 (11.9%) |
| $100,000 to $149,999 | 680 (18.2%) | 1,097 (15.2%) |
| $150,000 or more | 857 (22.9%) | 2,087 (28.9%) |
| Total | 3,737 (100.0%) | 7,231 (100.0%) |
Property Value to Household Income Ratio in Normal
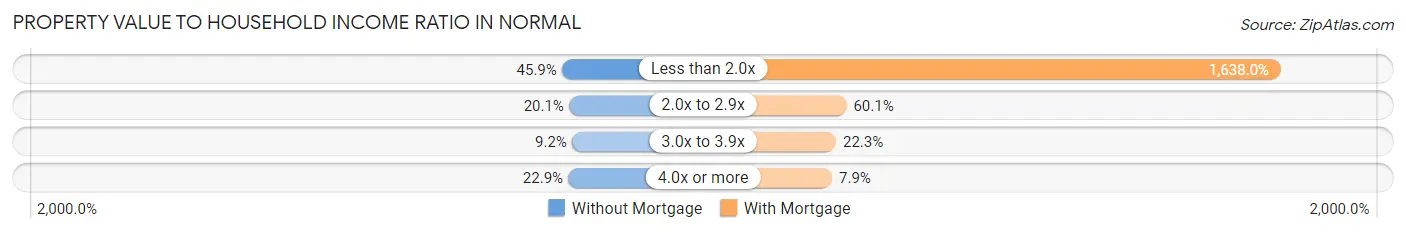
| Value-to-Income Ratio | Without Mortgage | With Mortgage |
| Less than 2.0x | 1,714 (45.9%) | 118,440 (1,638.0%) |
| 2.0x to 2.9x | 751 (20.1%) | 4,348 (60.1%) |
| 3.0x to 3.9x | 344 (9.2%) | 1,615 (22.3%) |
| 4.0x or more | 854 (22.9%) | 571 (7.9%) |
| Total | 3,737 (100.0%) | 7,231 (100.0%) |
Real Estate Taxes by Mortgage Status in Normal
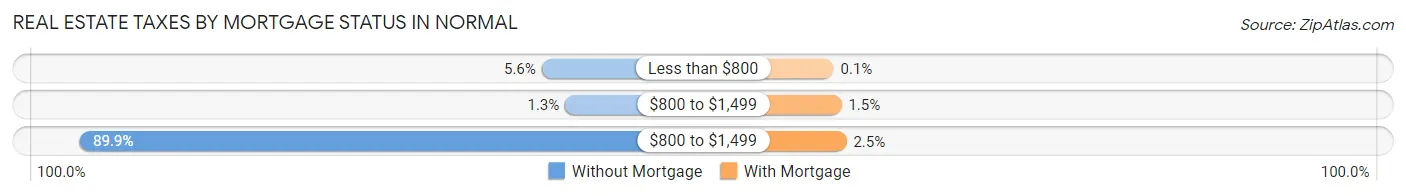
| Property Taxes | Without Mortgage | With Mortgage |
| Less than $800 | 208 (5.6%) | 7 (0.1%) |
| $800 to $1,499 | 48 (1.3%) | 111 (1.5%) |
| $800 to $1,499 | 3,358 (89.9%) | 177 (2.5%) |
| Total | 3,737 (100.0%) | 7,231 (100.0%) |
Health & Disability in Normal
Health Insurance Coverage by Age in Normal
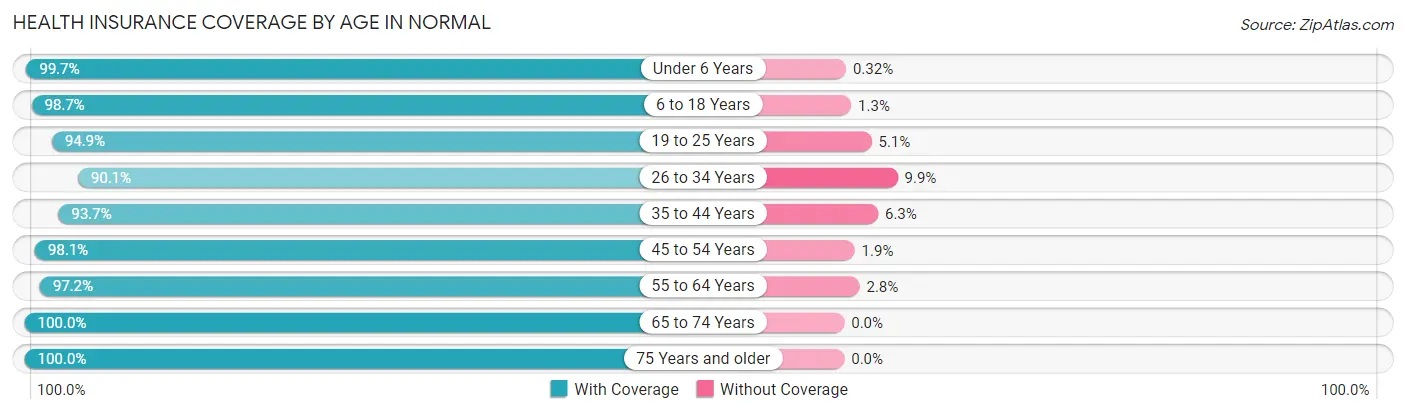
| Age Bracket | With Coverage | Without Coverage |
| Under 6 Years | 2,779 (99.7%) | 9 (0.3%) |
| 6 to 18 Years | 8,433 (98.7%) | 109 (1.3%) |
| 19 to 25 Years | 15,038 (94.9%) | 804 (5.1%) |
| 26 to 34 Years | 4,612 (90.1%) | 509 (9.9%) |
| 35 to 44 Years | 5,021 (93.7%) | 337 (6.3%) |
| 45 to 54 Years | 4,718 (98.1%) | 93 (1.9%) |
| 55 to 64 Years | 4,206 (97.2%) | 123 (2.8%) |
| 65 to 74 Years | 3,305 (100.0%) | 0 (0.0%) |
| 75 Years and older | 2,461 (100.0%) | 0 (0.0%) |
| Total | 50,573 (96.2%) | 1,984 (3.8%) |
Health Insurance Coverage by Citizenship Status in Normal
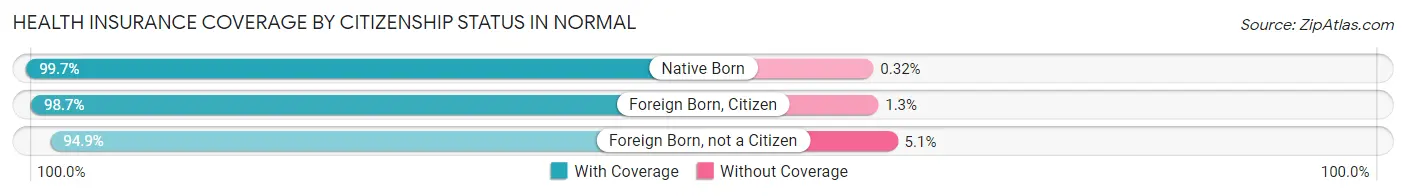
| Citizenship Status | With Coverage | Without Coverage |
| Native Born | 2,779 (99.7%) | 9 (0.3%) |
| Foreign Born, Citizen | 8,433 (98.7%) | 109 (1.3%) |
| Foreign Born, not a Citizen | 15,038 (94.9%) | 804 (5.1%) |
Health Insurance Coverage by Household Income in Normal
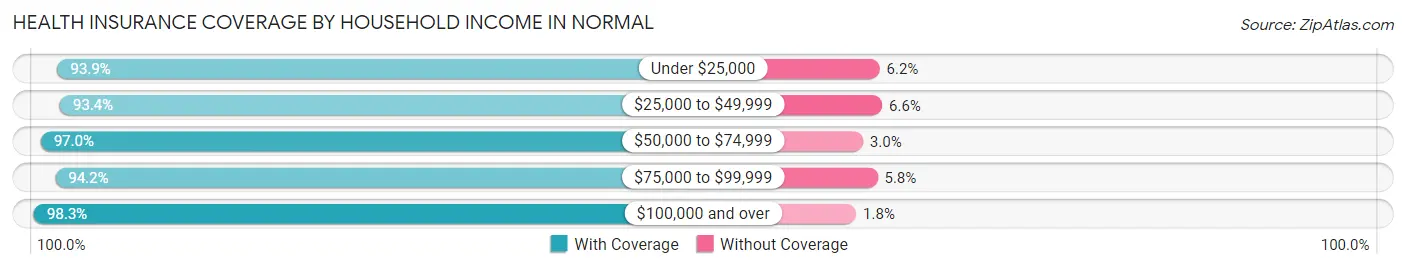
| Household Income | With Coverage | Without Coverage |
| Under $25,000 | 7,763 (93.9%) | 509 (6.1%) |
| $25,000 to $49,999 | 7,663 (93.4%) | 542 (6.6%) |
| $50,000 to $74,999 | 4,779 (97.0%) | 149 (3.0%) |
| $75,000 to $99,999 | 4,468 (94.2%) | 273 (5.8%) |
| $100,000 and over | 20,077 (98.3%) | 358 (1.8%) |
Public vs Private Health Insurance Coverage by Age in Normal
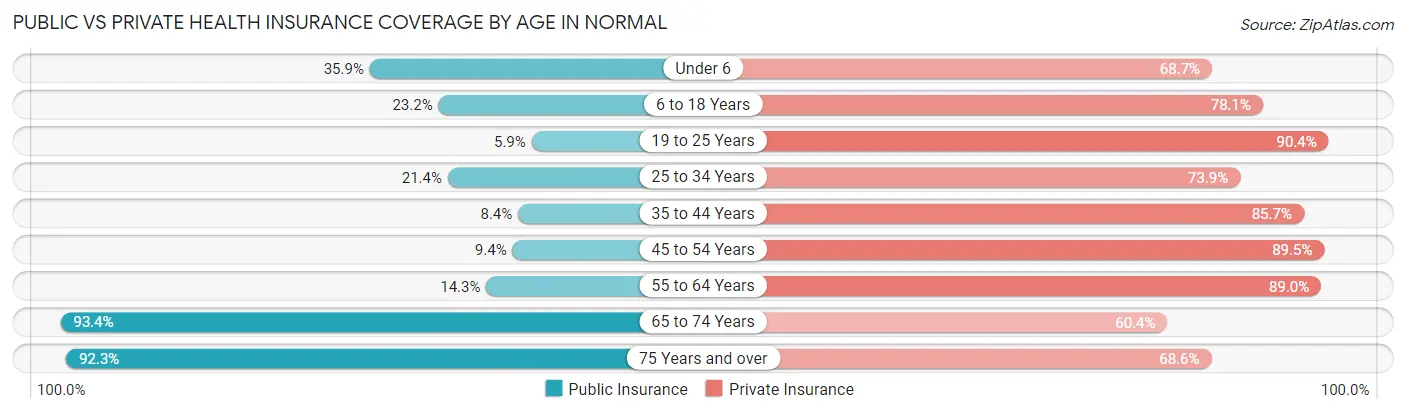
| Age Bracket | Public Insurance | Private Insurance |
| Under 6 | 1,002 (35.9%) | 1,915 (68.7%) |
| 6 to 18 Years | 1,980 (23.2%) | 6,675 (78.1%) |
| 19 to 25 Years | 933 (5.9%) | 14,313 (90.3%) |
| 25 to 34 Years | 1,098 (21.4%) | 3,786 (73.9%) |
| 35 to 44 Years | 450 (8.4%) | 4,594 (85.7%) |
| 45 to 54 Years | 454 (9.4%) | 4,308 (89.5%) |
| 55 to 64 Years | 619 (14.3%) | 3,851 (89.0%) |
| 65 to 74 Years | 3,086 (93.4%) | 1,997 (60.4%) |
| 75 Years and over | 2,272 (92.3%) | 1,688 (68.6%) |
| Total | 11,894 (22.6%) | 43,127 (82.1%) |
Disability Status by Sex by Age in Normal
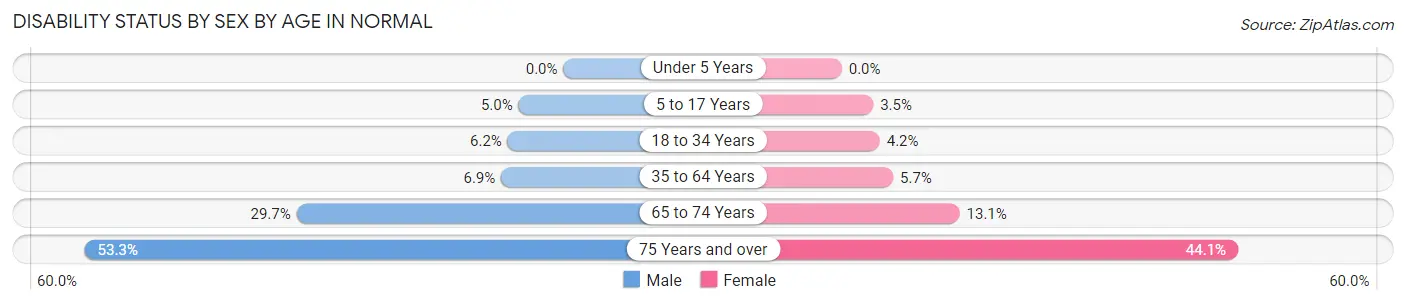
| Age Bracket | Male | Female |
| Under 5 Years | 0 (0.0%) | 0 (0.0%) |
| 5 to 17 Years | 192 (5.0%) | 101 (3.5%) |
| 18 to 34 Years | 643 (6.2%) | 543 (4.2%) |
| 35 to 64 Years | 495 (6.9%) | 420 (5.7%) |
| 65 to 74 Years | 470 (29.7%) | 226 (13.1%) |
| 75 Years and over | 524 (53.3%) | 652 (44.1%) |
Disability Class by Sex by Age in Normal
Disability Class: Hearing Difficulty
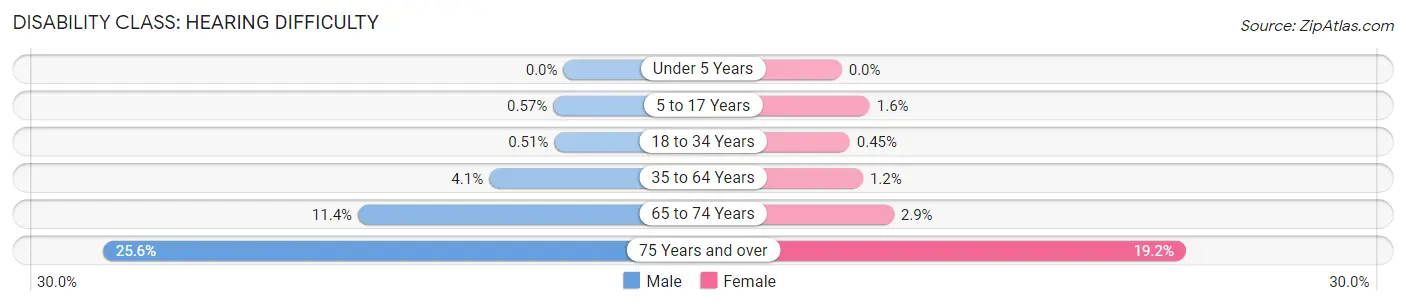
| Age Bracket | Male | Female |
| Under 5 Years | 0 (0.0%) | 0 (0.0%) |
| 5 to 17 Years | 22 (0.6%) | 45 (1.6%) |
| 18 to 34 Years | 53 (0.5%) | 58 (0.4%) |
| 35 to 64 Years | 296 (4.1%) | 87 (1.2%) |
| 65 to 74 Years | 181 (11.4%) | 50 (2.9%) |
| 75 Years and over | 252 (25.6%) | 283 (19.2%) |
Disability Class: Vision Difficulty
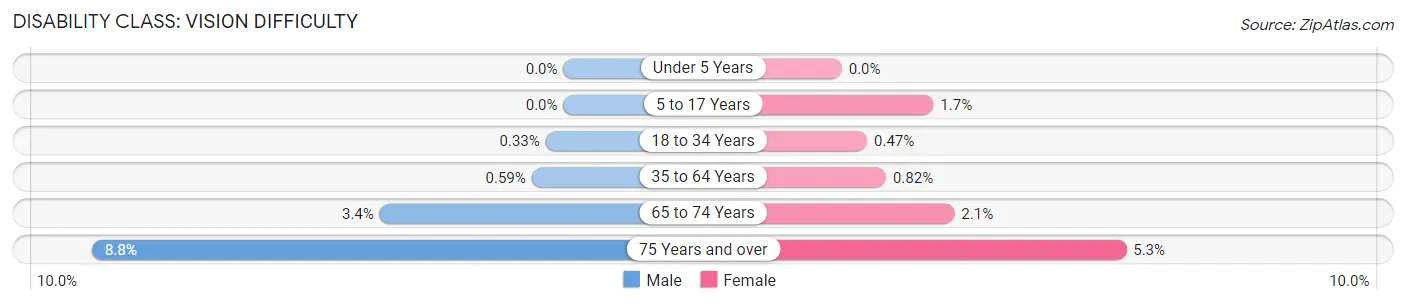
| Age Bracket | Male | Female |
| Under 5 Years | 0 (0.0%) | 0 (0.0%) |
| 5 to 17 Years | 0 (0.0%) | 49 (1.7%) |
| 18 to 34 Years | 34 (0.3%) | 60 (0.5%) |
| 35 to 64 Years | 42 (0.6%) | 60 (0.8%) |
| 65 to 74 Years | 54 (3.4%) | 36 (2.1%) |
| 75 Years and over | 86 (8.7%) | 78 (5.3%) |
Disability Class: Cognitive Difficulty
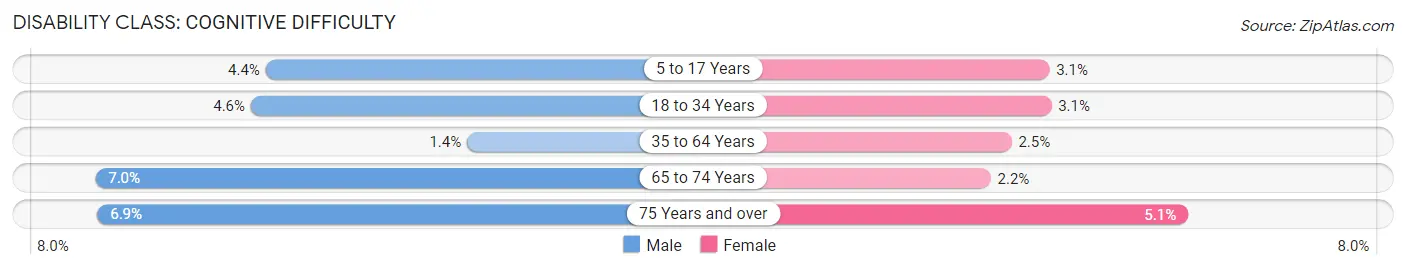
| Age Bracket | Male | Female |
| 5 to 17 Years | 170 (4.4%) | 89 (3.1%) |
| 18 to 34 Years | 481 (4.6%) | 400 (3.1%) |
| 35 to 64 Years | 102 (1.4%) | 185 (2.5%) |
| 65 to 74 Years | 110 (7.0%) | 38 (2.2%) |
| 75 Years and over | 68 (6.9%) | 76 (5.1%) |
Disability Class: Ambulatory Difficulty
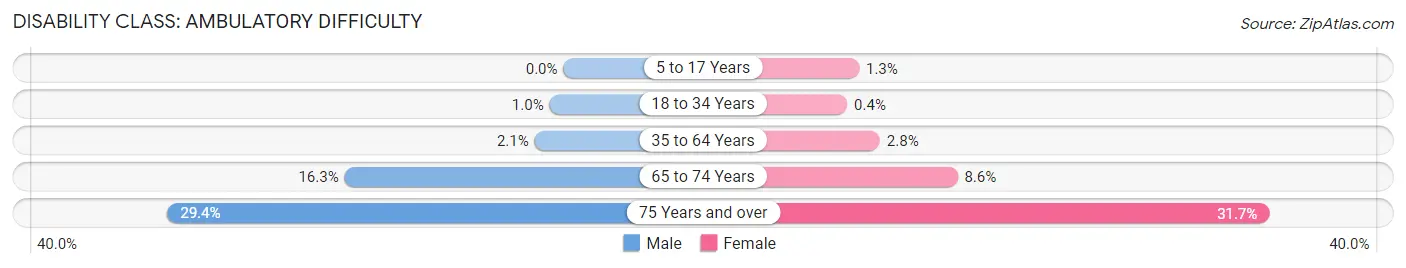
| Age Bracket | Male | Female |
| 5 to 17 Years | 0 (0.0%) | 37 (1.3%) |
| 18 to 34 Years | 107 (1.0%) | 51 (0.4%) |
| 35 to 64 Years | 153 (2.1%) | 208 (2.8%) |
| 65 to 74 Years | 257 (16.3%) | 148 (8.6%) |
| 75 Years and over | 289 (29.4%) | 469 (31.7%) |
Disability Class: Self-Care Difficulty
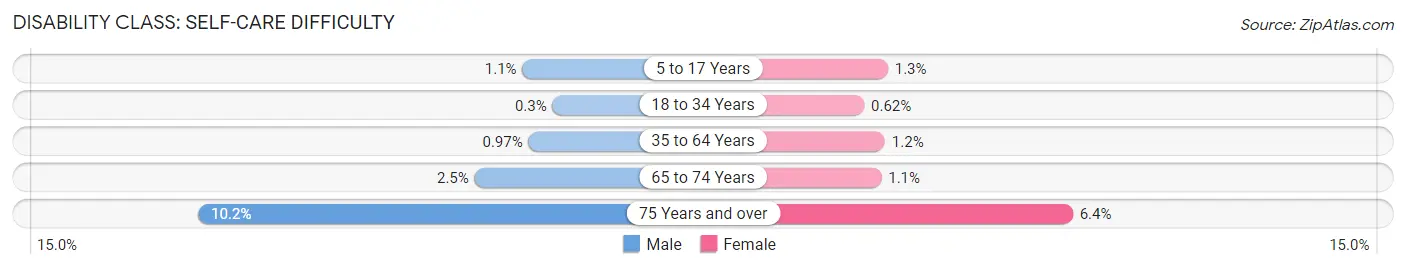
| Age Bracket | Male | Female |
| 5 to 17 Years | 44 (1.1%) | 37 (1.3%) |
| 18 to 34 Years | 31 (0.3%) | 79 (0.6%) |
| 35 to 64 Years | 69 (1.0%) | 88 (1.2%) |
| 65 to 74 Years | 39 (2.5%) | 19 (1.1%) |
| 75 Years and over | 100 (10.2%) | 95 (6.4%) |
Technology Access in Normal
Computing Device Access in Normal
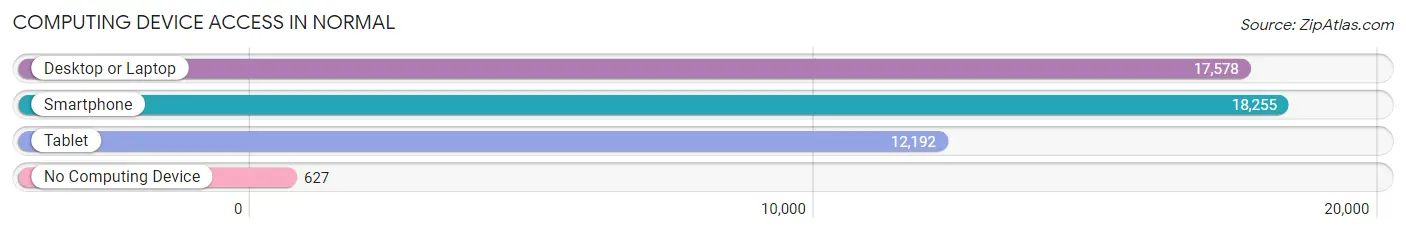
| Device Type | # Households | % Households |
| Desktop or Laptop | 17,578 | 89.4% |
| Smartphone | 18,255 | 92.9% |
| Tablet | 12,192 | 62.0% |
| No Computing Device | 627 | 3.2% |
| Total | 19,658 | 100.0% |
Internet Access in Normal
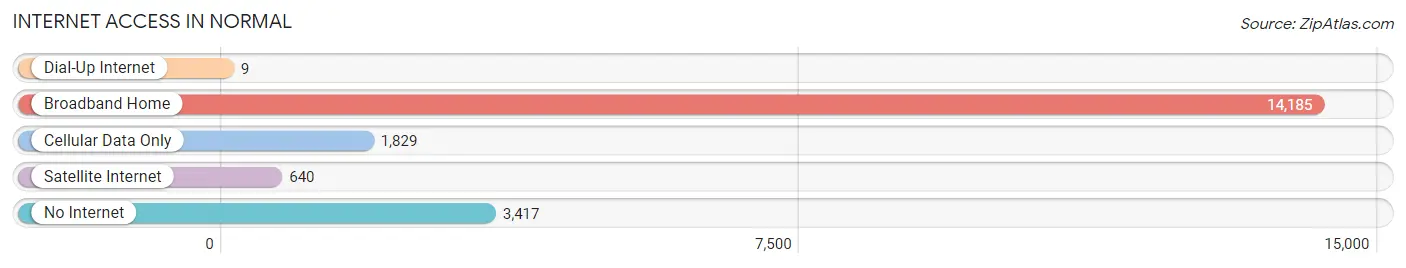
| Internet Type | # Households | % Households |
| Dial-Up Internet | 9 | 0.1% |
| Broadband Home | 14,185 | 72.2% |
| Cellular Data Only | 1,829 | 9.3% |
| Satellite Internet | 640 | 3.3% |
| No Internet | 3,417 | 17.4% |
| Total | 19,658 | 100.0% |
Normal Summary
IL History
Illinois is a state located in the Midwestern United States. It is the sixth most populous state in the country and the 25th largest state by area. The state was admitted to the Union on December 3, 1818, becoming the 21st state. The state was named after the Illinois Native American tribe, which was a part of the Algonquian language family.
The first Europeans to explore the area were French explorers Jacques Marquette and Louis Jolliet in 1673. They were followed by the French fur traders and missionaries who established trading posts and settlements in the area. The French were eventually replaced by the British, who took control of the area in 1763. The British were in turn replaced by the Americans after the Revolutionary War.
The state of Illinois was formed in 1818, when the Illinois Territory was admitted to the Union. The state was initially divided into two parts, the northern part being known as the "Free State" and the southern part being known as the "Slave State". The state was a major battleground during the Civil War, with the Union and Confederate forces fighting for control of the state.
After the Civil War, the state experienced a period of rapid growth and industrialization. The population of the state grew from 1.7 million in 1860 to 5.3 million in 1900. During this period, the state also experienced a period of political and social reform, with the passage of the Illinois Constitution of 1870, which granted African Americans the right to vote.
The state also experienced a period of economic growth during the early 20th century, with the development of the steel industry in the Chicago area. The state also experienced a period of political turmoil during the Great Depression, with the election of Governor Henry Horner in 1932.
Geography
Illinois is located in the Midwestern United States, bordered by Wisconsin to the north, Iowa to the east, Missouri to the south, and Kentucky to the west. The state is divided into four distinct geographic regions: the Central Plains, the Great Lakes Region, the Mississippi River Valley, and the Ozark Plateau.
The Central Plains region is located in the northern part of the state and is characterized by flat, rolling terrain. The Great Lakes region is located in the northeastern part of the state and is characterized by large lakes, including Lake Michigan, Lake Superior, and Lake Huron. The Mississippi River Valley is located in the western part of the state and is characterized by the Mississippi River and its tributaries. The Ozark Plateau is located in the southern part of the state and is characterized by rugged hills and valleys.
Economy
Illinois has a diverse economy, with a variety of industries contributing to its overall economic output. The state is a major producer of agricultural products, including corn, soybeans, wheat, and hogs. The state is also a major producer of industrial products, including steel, machinery, and chemicals.
The state is also a major center for finance and insurance, with Chicago being home to the Chicago Board of Trade and the Chicago Mercantile Exchange. The state is also home to several major corporations, including Boeing, Caterpillar, and Motorola.
Demographics
As of the 2010 census, the population of Illinois was 12,830,632. The state is home to a diverse population, with the largest ethnic groups being White (68.5%), African American (14.5%), Hispanic or Latino (12.9%), and Asian (5.1%).
The state has a median household income of $60,196 and a poverty rate of 12.4%. The state also has a high rate of educational attainment, with 91.2% of adults over the age of 25 having at least a high school diploma and 33.2% having a bachelor's degree or higher.
Common Questions
What is Per Capita Income in Normal?
Per Capita income in Normal is $34,466.
What is the Median Family Income in Normal?
Median Family Income in Normal is $111,334.
What is the Median Household income in Normal?
Median Household Income in Normal is $63,965.
What is Income or Wage Gap in Normal?
Income or Wage Gap in Normal is 32.2%.
Women in Normal earn 67.8 cents for every dollar earned by a man.
What is Family Income Deficit in Normal?
Family Income Deficit in Normal is $8,394.
Families that are below poverty line in Normal earn $8,394 less on average than the poverty threshold level.
What is Inequality or Gini Index in Normal?
Inequality or Gini Index in Normal is 0.52.
What is the Total Population of Normal?
Total Population of Normal is 52,920.
What is the Total Male Population of Normal?
Total Male Population of Normal is 25,061.
What is the Total Female Population of Normal?
Total Female Population of Normal is 27,859.
What is the Ratio of Males per 100 Females in Normal?
There are 89.96 Males per 100 Females in Normal.
What is the Ratio of Females per 100 Males in Normal?
There are 111.16 Females per 100 Males in Normal.
What is the Median Population Age in Normal?
Median Population Age in Normal is 25.2 Years.
What is the Average Family Size in Normal
Average Family Size in Normal is 3.1 People.
What is the Average Household Size in Normal
Average Household Size in Normal is 2.4 People.
How Large is the Labor Force in Normal?
There are 27,805 People in the Labor Forcein in Normal.
What is the Percentage of People in the Labor Force in Normal?
62.0% of People are in the Labor Force in Normal.
What is the Unemployment Rate in Normal?
Unemployment Rate in Normal is 3.9%.