Bethany borough, PA Map & Demographics
Bethany borough Overview
$37,675
PER CAPITA INCOME
$93,897
AVG FAMILY INCOME
$92,647
AVG HOUSEHOLD INCOME
43.6%
WAGE / INCOME GAP [ % ]
56.4¢/ $1
WAGE / INCOME GAP [ $ ]
0.30
INEQUALITY / GINI INDEX
235
TOTAL POPULATION
122
MALE POPULATION
113
FEMALE POPULATION
107.96
MALES / 100 FEMALES
92.62
FEMALES / 100 MALES
55.1
MEDIAN AGE
2.7
AVG FAMILY SIZE
2.4
AVG HOUSEHOLD SIZE
108
LABOR FORCE [ PEOPLE ]
54.8%
PERCENT IN LABOR FORCE
8.3%
UNEMPLOYMENT RATE
Income in Bethany borough
Income Overview in Bethany borough
Per Capita Income in Bethany borough is $37,675, while median incomes of families and households are $93,897 and $92,647 respectively.
| Characteristic | Number | Measure |
| Per Capita Income | 235 | $37,675 |
| Median Family Income | 77 | $93,897 |
| Mean Family Income | 77 | $96,573 |
| Median Household Income | 100 | $92,647 |
| Mean Household Income | 100 | $88,320 |
| Income Deficit | 77 | $0 |
| Wage / Income Gap (%) | 235 | 43.59% |
| Wage / Income Gap ($) | 235 | 56.41¢ per $1 |
| Gini / Inequality Index | 235 | 0.30 |
Earnings by Sex in Bethany borough
Average Earnings in Bethany borough are $39,000, $48,750 for men and $27,500 for women, a difference of 43.6%.
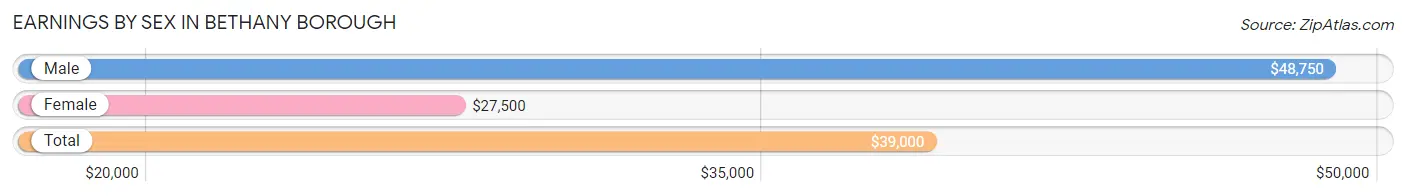
| Sex | Number | Average Earnings |
| Male | 66 (55.9%) | $48,750 |
| Female | 52 (44.1%) | $27,500 |
| Total | 118 (100.0%) | $39,000 |
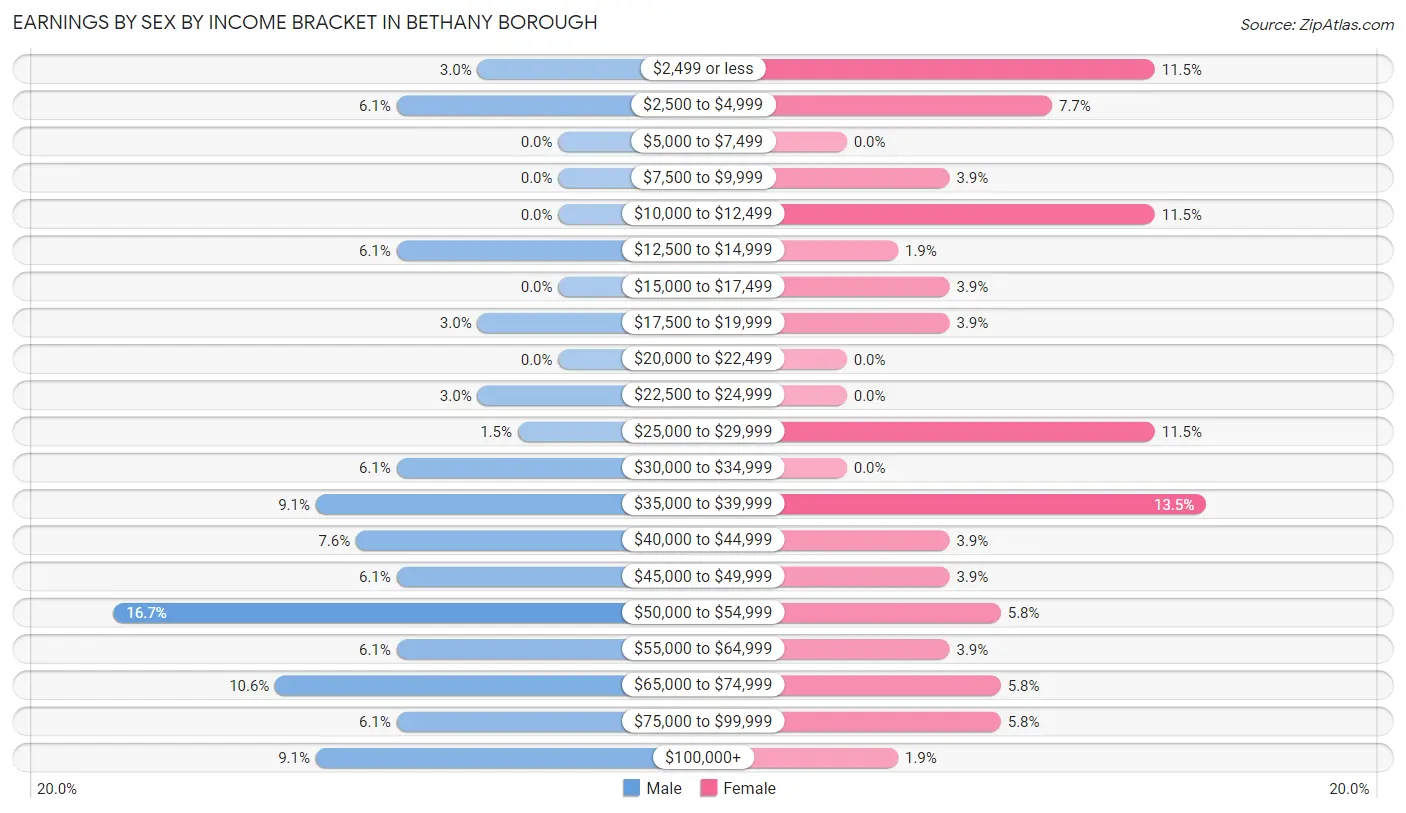
Earnings by Sex by Income Bracket in Bethany borough
The most common earnings brackets in Bethany borough are $50,000 to $54,999 for men (11 | 16.7%) and $35,000 to $39,999 for women (7 | 13.5%).
| Income | Male | Female |
| $2,499 or less | 2 (3.0%) | 6 (11.5%) |
| $2,500 to $4,999 | 4 (6.1%) | 4 (7.7%) |
| $5,000 to $7,499 | 0 (0.0%) | 0 (0.0%) |
| $7,500 to $9,999 | 0 (0.0%) | 2 (3.8%) |
| $10,000 to $12,499 | 0 (0.0%) | 6 (11.5%) |
| $12,500 to $14,999 | 4 (6.1%) | 1 (1.9%) |
| $15,000 to $17,499 | 0 (0.0%) | 2 (3.8%) |
| $17,500 to $19,999 | 2 (3.0%) | 2 (3.8%) |
| $20,000 to $22,499 | 0 (0.0%) | 0 (0.0%) |
| $22,500 to $24,999 | 2 (3.0%) | 0 (0.0%) |
| $25,000 to $29,999 | 1 (1.5%) | 6 (11.5%) |
| $30,000 to $34,999 | 4 (6.1%) | 0 (0.0%) |
| $35,000 to $39,999 | 6 (9.1%) | 7 (13.5%) |
| $40,000 to $44,999 | 5 (7.6%) | 2 (3.8%) |
| $45,000 to $49,999 | 4 (6.1%) | 2 (3.8%) |
| $50,000 to $54,999 | 11 (16.7%) | 3 (5.8%) |
| $55,000 to $64,999 | 4 (6.1%) | 2 (3.8%) |
| $65,000 to $74,999 | 7 (10.6%) | 3 (5.8%) |
| $75,000 to $99,999 | 4 (6.1%) | 3 (5.8%) |
| $100,000+ | 6 (9.1%) | 1 (1.9%) |
| Total | 66 (100.0%) | 52 (100.0%) |
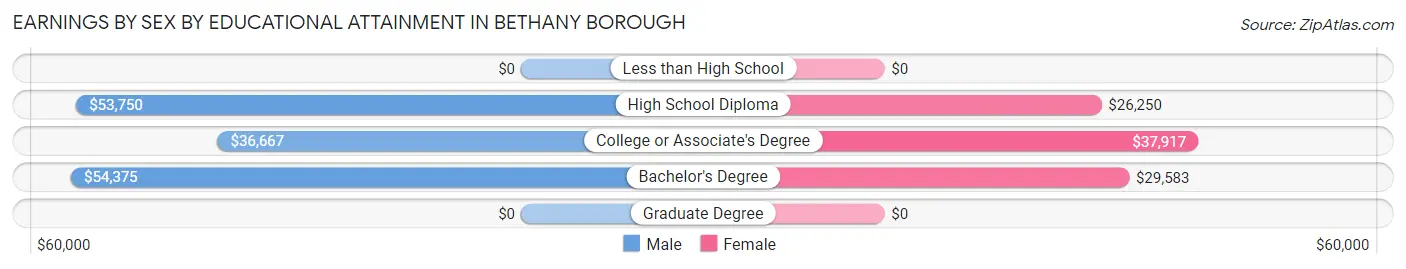
Earnings by Sex by Educational Attainment in Bethany borough
Average earnings in Bethany borough are $50,500 for men and $32,500 for women, a difference of 35.6%. Men with an educational attainment of bachelor's degree enjoy the highest average annual earnings of $54,375, while those with college or associate's degree education earn the least with $36,667. Women with an educational attainment of college or associate's degree earn the most with the average annual earnings of $37,917, while those with high school diploma education have the smallest earnings of $26,250.
| Educational Attainment | Male Income | Female Income |
| Less than High School | - | - |
| High School Diploma | $53,750 | $26,250 |
| College or Associate's Degree | $36,667 | $37,917 |
| Bachelor's Degree | $54,375 | $29,583 |
| Graduate Degree | - | - |
| Total | $50,500 | $32,500 |
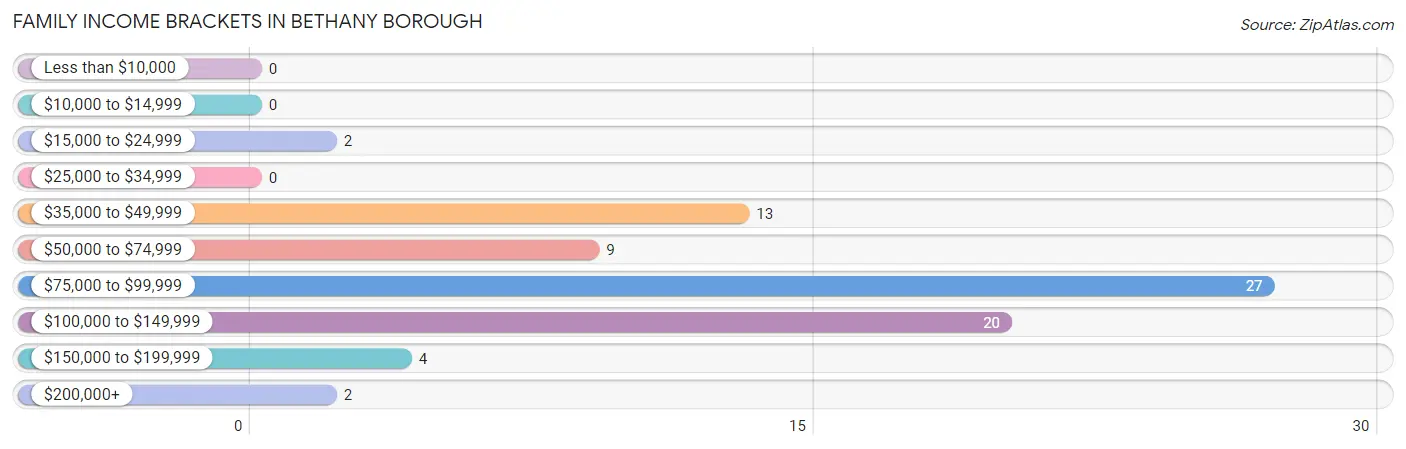
Family Income in Bethany borough
Family Income Brackets in Bethany borough
According to the Bethany borough family income data, there are 27 families falling into the $75,000 to $99,999 income range, which is the most common income bracket and makes up 35.1% of all families.
| Income Bracket | # Families | % Families |
| Less than $10,000 | 0 | 0.0% |
| $10,000 to $14,999 | 0 | 0.0% |
| $15,000 to $24,999 | 2 | 2.6% |
| $25,000 to $34,999 | 0 | 0.0% |
| $35,000 to $49,999 | 13 | 16.9% |
| $50,000 to $74,999 | 9 | 11.7% |
| $75,000 to $99,999 | 27 | 35.1% |
| $100,000 to $149,999 | 20 | 26.0% |
| $150,000 to $199,999 | 4 | 5.2% |
| $200,000+ | 2 | 2.6% |
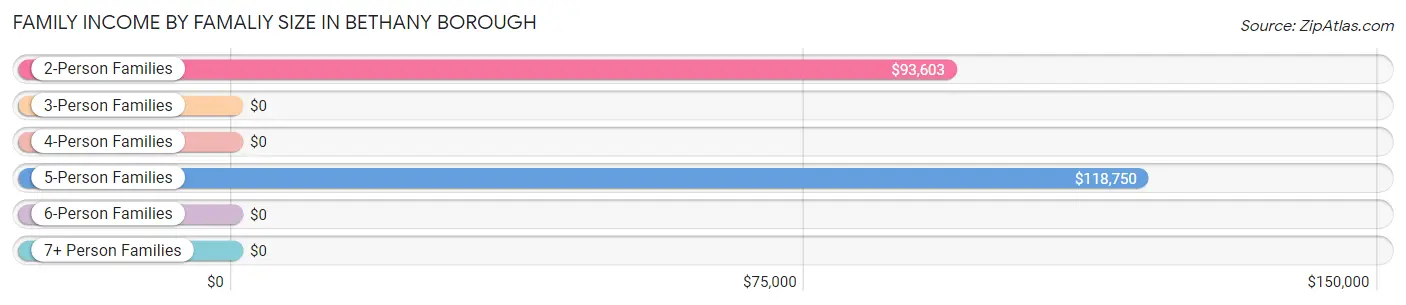
Family Income by Famaliy Size in Bethany borough
5-person families (8 | 10.4%) account for the highest median family income in Bethany borough with $118,750 per family, while 2-person families (55 | 71.4%) have the highest median income of $46,802 per family member.
| Income Bracket | # Families | Median Income |
| 2-Person Families | 55 (71.4%) | $93,603 |
| 3-Person Families | 7 (9.1%) | $0 |
| 4-Person Families | 7 (9.1%) | $0 |
| 5-Person Families | 8 (10.4%) | $118,750 |
| 6-Person Families | 0 (0.0%) | $0 |
| 7+ Person Families | 0 (0.0%) | $0 |
| Total | 77 (100.0%) | $93,897 |
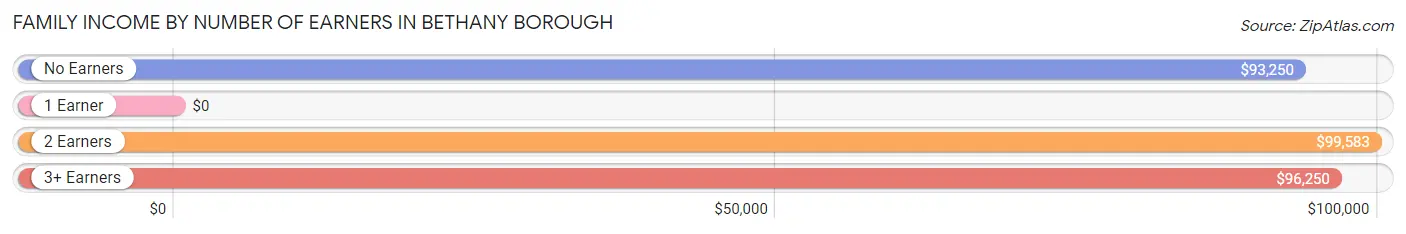
Family Income by Number of Earners in Bethany borough
| Number of Earners | # Families | Median Income |
| No Earners | 25 (32.5%) | $93,250 |
| 1 Earner | 11 (14.3%) | $0 |
| 2 Earners | 35 (45.5%) | $99,583 |
| 3+ Earners | 6 (7.8%) | $96,250 |
| Total | 77 (100.0%) | $93,897 |
Household Income in Bethany borough
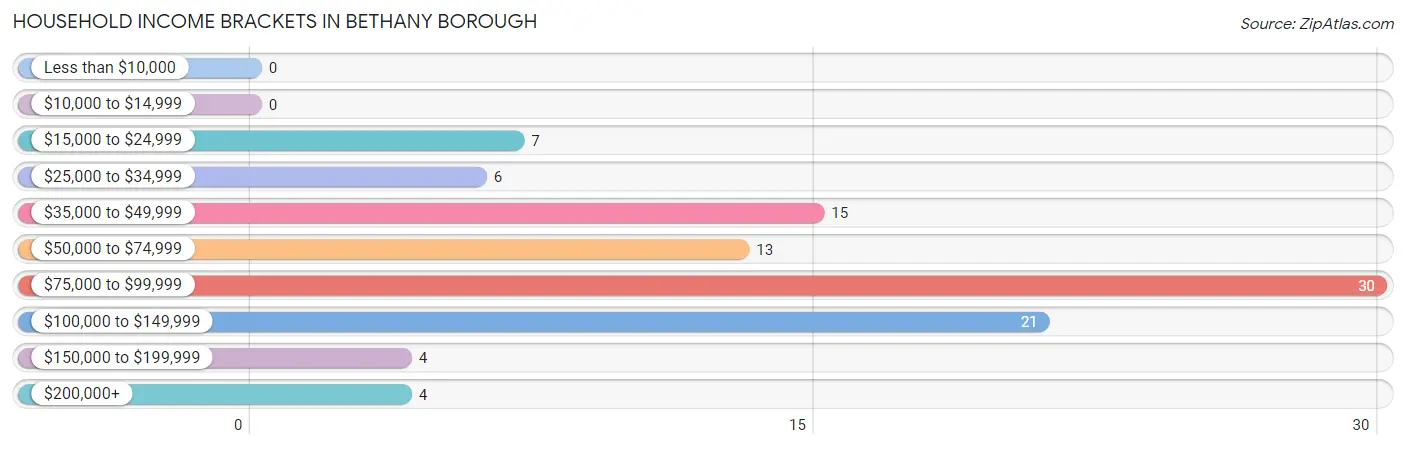
Household Income Brackets in Bethany borough
With 30 households falling in the category, the $75,000 to $99,999 income range is the most frequent in Bethany borough, accounting for 30.0% of all households.
| Income Bracket | # Households | % Households |
| Less than $10,000 | 0 | 0.0% |
| $10,000 to $14,999 | 0 | 0.0% |
| $15,000 to $24,999 | 7 | 7.0% |
| $25,000 to $34,999 | 6 | 6.0% |
| $35,000 to $49,999 | 15 | 15.0% |
| $50,000 to $74,999 | 13 | 13.0% |
| $75,000 to $99,999 | 30 | 30.0% |
| $100,000 to $149,999 | 21 | 21.0% |
| $150,000 to $199,999 | 4 | 4.0% |
| $200,000+ | 4 | 4.0% |
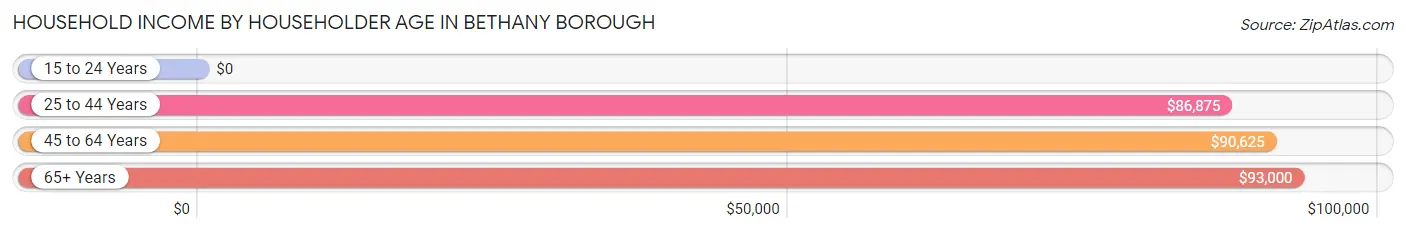
Household Income by Householder Age in Bethany borough
The median household income in Bethany borough is $92,647, with the highest median household income of $93,000 found in the 65+ years age bracket for the primary householder. A total of 46 households (46.0%) fall into this category.
| Income Bracket | # Households | Median Income |
| 15 to 24 Years | 0 (0.0%) | $0 |
| 25 to 44 Years | 23 (23.0%) | $86,875 |
| 45 to 64 Years | 31 (31.0%) | $90,625 |
| 65+ Years | 46 (46.0%) | $93,000 |
| Total | 100 (100.0%) | $92,647 |
Poverty in Bethany borough
Income Below Poverty by Sex and Age in Bethany borough
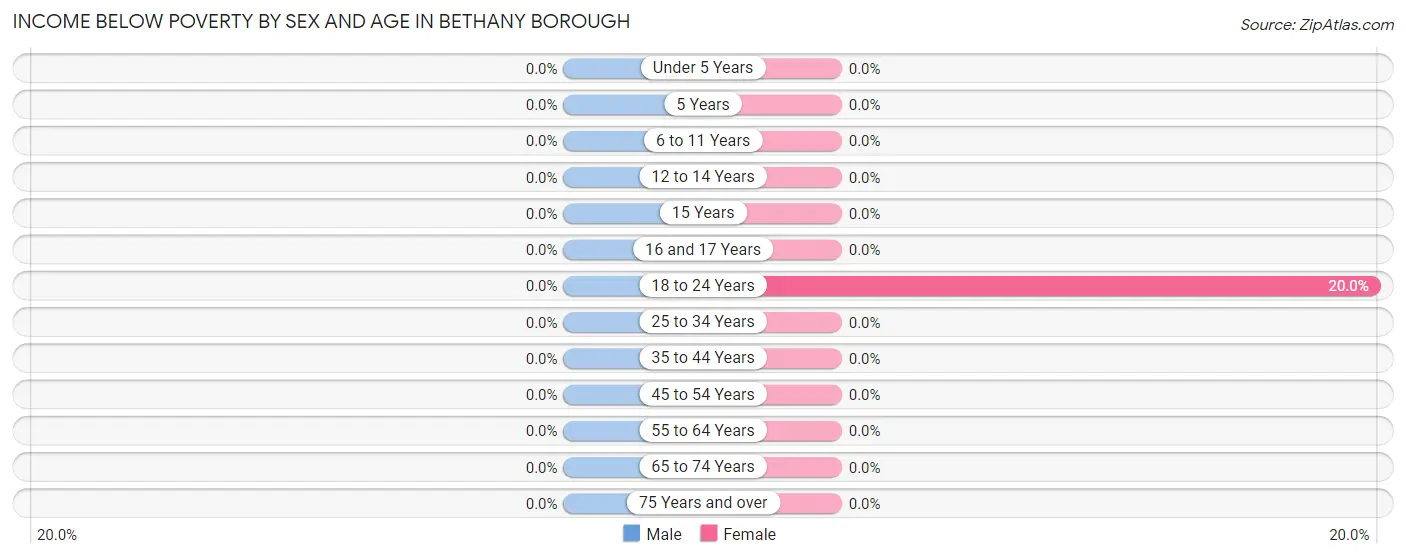
| Age Bracket | Male | Female |
| Under 5 Years | 0 (0.0%) | 0 (0.0%) |
| 5 Years | 0 (0.0%) | 0 (0.0%) |
| 6 to 11 Years | 0 (0.0%) | 0 (0.0%) |
| 12 to 14 Years | 0 (0.0%) | 0 (0.0%) |
| 15 Years | 0 (0.0%) | 0 (0.0%) |
| 16 and 17 Years | 0 (0.0%) | 0 (0.0%) |
| 18 to 24 Years | 0 (0.0%) | 1 (20.0%) |
| 25 to 34 Years | 0 (0.0%) | 0 (0.0%) |
| 35 to 44 Years | 0 (0.0%) | 0 (0.0%) |
| 45 to 54 Years | 0 (0.0%) | 0 (0.0%) |
| 55 to 64 Years | 0 (0.0%) | 0 (0.0%) |
| 65 to 74 Years | 0 (0.0%) | 0 (0.0%) |
| 75 Years and over | 0 (0.0%) | 0 (0.0%) |
| Total | 0 (0.0%) | 1 (0.9%) |
Income Above Poverty by Sex and Age in Bethany borough
According to the poverty statistics in Bethany borough, males aged under 5 years and females aged under 5 years are the age groups that are most secure financially, with 100.0% of males and 100.0% of females in these age groups living above the poverty line.
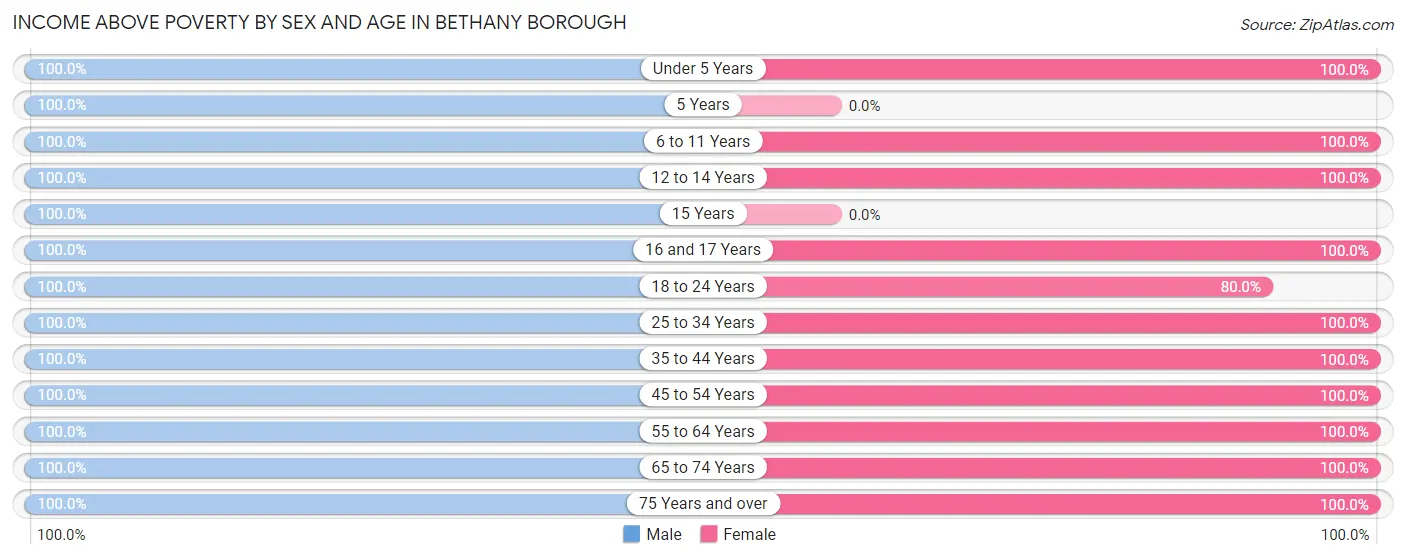
| Age Bracket | Male | Female |
| Under 5 Years | 3 (100.0%) | 9 (100.0%) |
| 5 Years | 1 (100.0%) | 0 (0.0%) |
| 6 to 11 Years | 8 (100.0%) | 5 (100.0%) |
| 12 to 14 Years | 6 (100.0%) | 4 (100.0%) |
| 15 Years | 2 (100.0%) | 0 (0.0%) |
| 16 and 17 Years | 2 (100.0%) | 2 (100.0%) |
| 18 to 24 Years | 3 (100.0%) | 4 (80.0%) |
| 25 to 34 Years | 9 (100.0%) | 14 (100.0%) |
| 35 to 44 Years | 16 (100.0%) | 6 (100.0%) |
| 45 to 54 Years | 16 (100.0%) | 6 (100.0%) |
| 55 to 64 Years | 20 (100.0%) | 14 (100.0%) |
| 65 to 74 Years | 28 (100.0%) | 25 (100.0%) |
| 75 Years and over | 8 (100.0%) | 23 (100.0%) |
| Total | 122 (100.0%) | 112 (99.1%) |
Income Below Poverty Among Married-Couple Families in Bethany borough
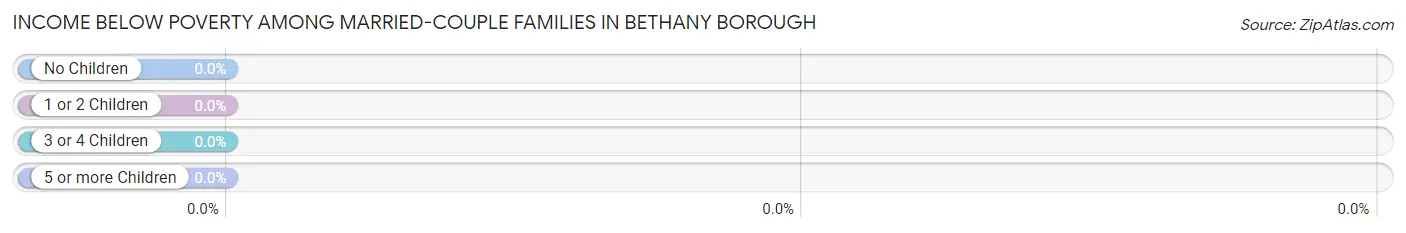
| Children | Above Poverty | Below Poverty |
| No Children | 53 (100.0%) | 0 (0.0%) |
| 1 or 2 Children | 9 (100.0%) | 0 (0.0%) |
| 3 or 4 Children | 6 (100.0%) | 0 (0.0%) |
| 5 or more Children | 0 (0.0%) | 0 (0.0%) |
| Total | 68 (100.0%) | 0 (0.0%) |
Income Below Poverty Among Single-Parent Households in Bethany borough
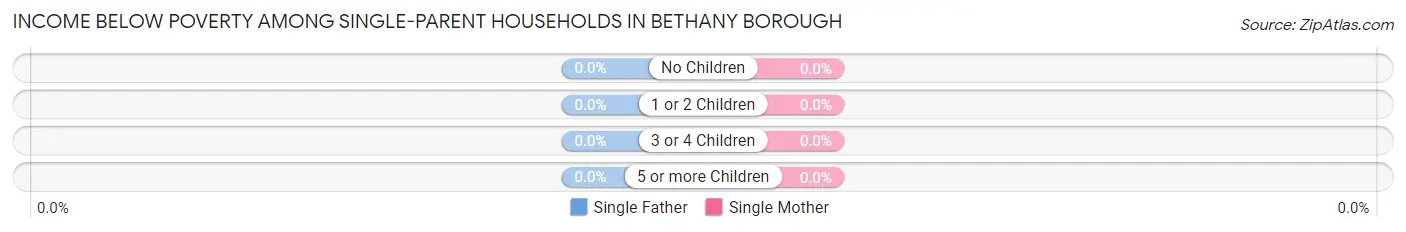
| Children | Single Father | Single Mother |
| No Children | 0 (0.0%) | 0 (0.0%) |
| 1 or 2 Children | 0 (0.0%) | 0 (0.0%) |
| 3 or 4 Children | 0 (0.0%) | 0 (0.0%) |
| 5 or more Children | 0 (0.0%) | 0 (0.0%) |
| Total | 0 (0.0%) | 0 (0.0%) |
Income Below Poverty Among Married-Couple vs Single-Parent Households in Bethany borough
| Children | Married-Couple Families | Single-Parent Households |
| No Children | 0 (0.0%) | 0 (0.0%) |
| 1 or 2 Children | 0 (0.0%) | 0 (0.0%) |
| 3 or 4 Children | 0 (0.0%) | 0 (0.0%) |
| 5 or more Children | 0 (0.0%) | 0 (0.0%) |
| Total | 0 (0.0%) | 0 (0.0%) |
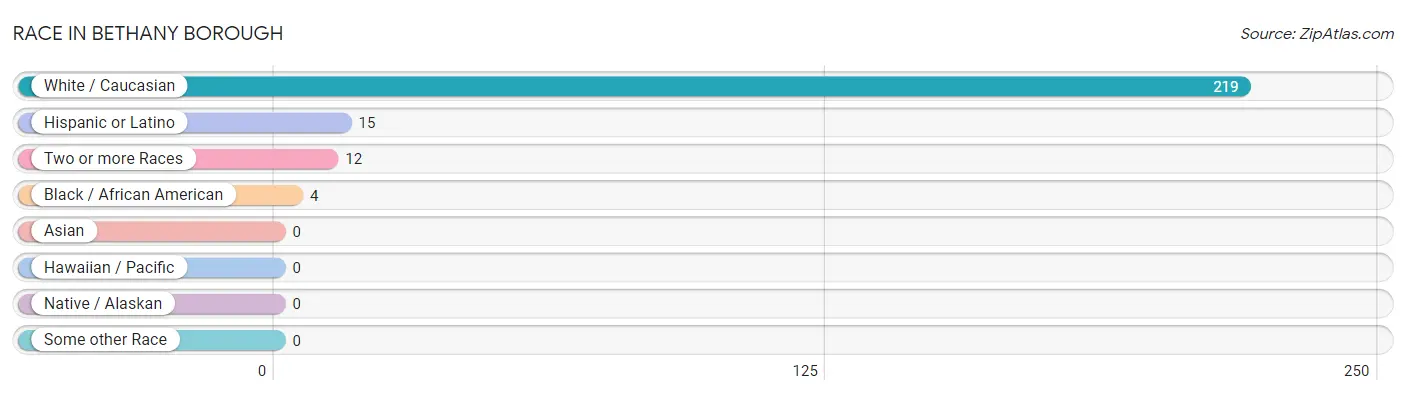
Race in Bethany borough
The most populous races in Bethany borough are White / Caucasian (219 | 93.2%), Hispanic or Latino (15 | 6.4%), and Two or more Races (12 | 5.1%).
| Race | # Population | % Population |
| Asian | 0 | 0.0% |
| Black / African American | 4 | 1.7% |
| Hawaiian / Pacific | 0 | 0.0% |
| Hispanic or Latino | 15 | 6.4% |
| Native / Alaskan | 0 | 0.0% |
| White / Caucasian | 219 | 93.2% |
| Two or more Races | 12 | 5.1% |
| Some other Race | 0 | 0.0% |
| Total | 235 | 100.0% |
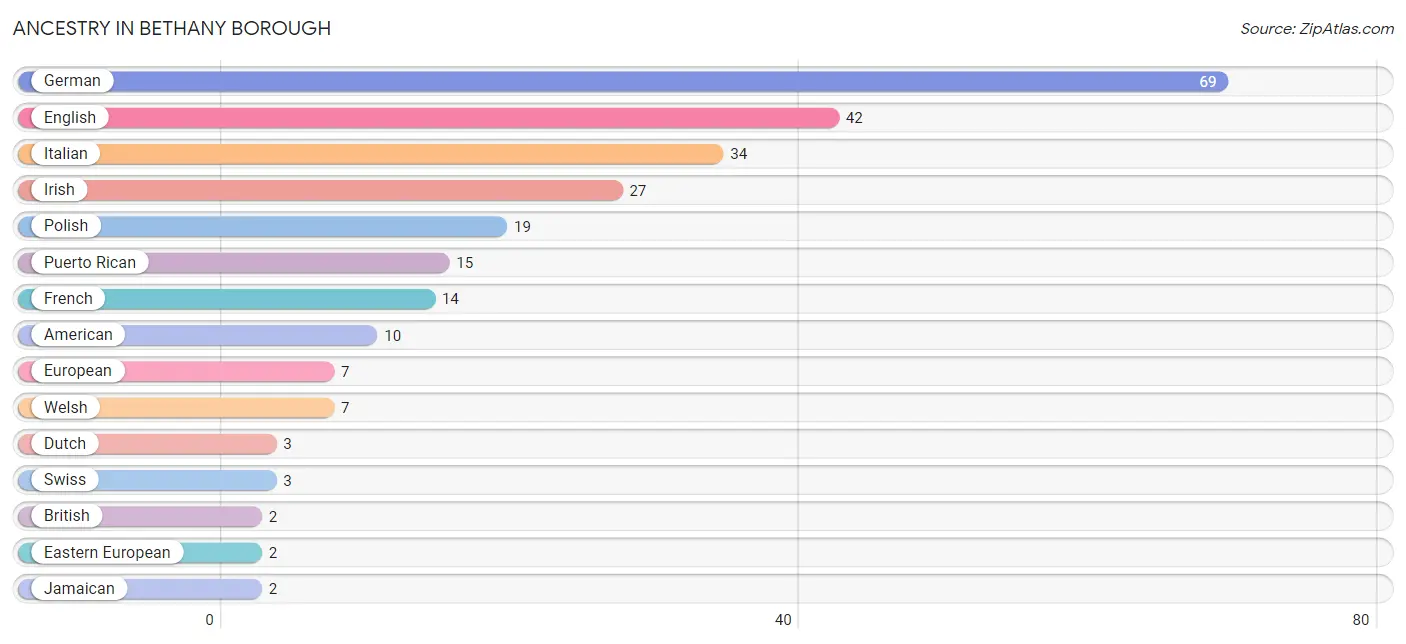
Ancestry in Bethany borough
The most populous ancestries reported in Bethany borough are German (69 | 29.4%), English (42 | 17.9%), Italian (34 | 14.5%), Irish (27 | 11.5%), and Polish (19 | 8.1%), together accounting for 81.3% of all Bethany borough residents.
| Ancestry | # Population | % Population |
| American | 10 | 4.3% |
| British | 2 | 0.9% |
| Czechoslovakian | 1 | 0.4% |
| Dutch | 3 | 1.3% |
| Eastern European | 2 | 0.9% |
| English | 42 | 17.9% |
| European | 7 | 3.0% |
| French | 14 | 6.0% |
| French Canadian | 1 | 0.4% |
| German | 69 | 29.4% |
| Irish | 27 | 11.5% |
| Italian | 34 | 14.5% |
| Jamaican | 2 | 0.9% |
| Lithuanian | 2 | 0.9% |
| Pennsylvania German | 1 | 0.4% |
| Polish | 19 | 8.1% |
| Puerto Rican | 15 | 6.4% |
| Russian | 1 | 0.4% |
| Scottish | 2 | 0.9% |
| Slovak | 2 | 0.9% |
| Slovene | 1 | 0.4% |
| Swedish | 1 | 0.4% |
| Swiss | 3 | 1.3% |
| Ukrainian | 1 | 0.4% |
| Welsh | 7 | 3.0% | View All 25 Rows |
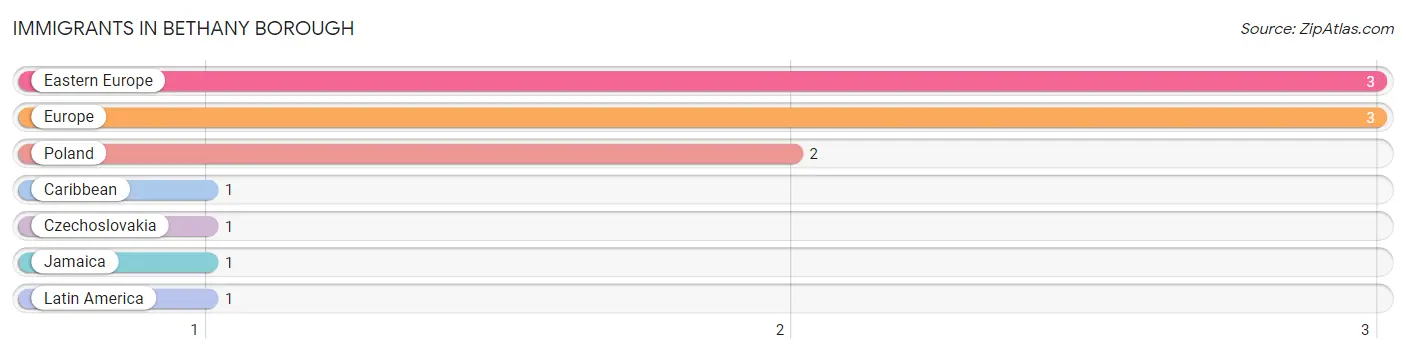
Immigrants in Bethany borough
The most numerous immigrant groups reported in Bethany borough came from Eastern Europe (3 | 1.3%), Europe (3 | 1.3%), Poland (2 | 0.9%), Caribbean (1 | 0.4%), and Czechoslovakia (1 | 0.4%), together accounting for 4.3% of all Bethany borough residents.
| Immigration Origin | # Population | % Population |
| Caribbean | 1 | 0.4% |
| Czechoslovakia | 1 | 0.4% |
| Eastern Europe | 3 | 1.3% |
| Europe | 3 | 1.3% |
| Jamaica | 1 | 0.4% |
| Latin America | 1 | 0.4% |
| Poland | 2 | 0.9% | View All 7 Rows |
Sex and Age in Bethany borough
Sex and Age in Bethany borough
The most populous age groups in Bethany borough are 65 to 69 Years (17 | 13.9%) for men and 65 to 69 Years (23 | 20.3%) for women.
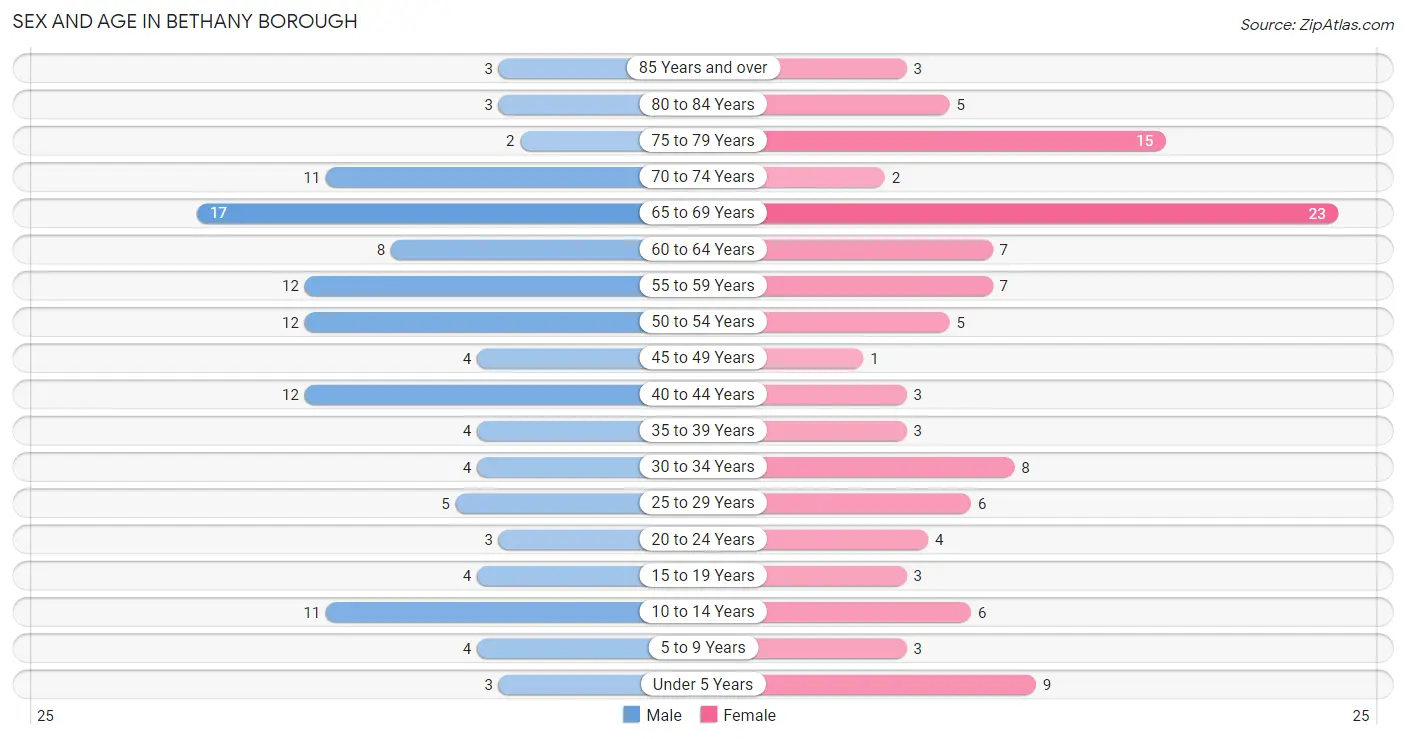
| Age Bracket | Male | Female |
| Under 5 Years | 3 (2.5%) | 9 (8.0%) |
| 5 to 9 Years | 4 (3.3%) | 3 (2.6%) |
| 10 to 14 Years | 11 (9.0%) | 6 (5.3%) |
| 15 to 19 Years | 4 (3.3%) | 3 (2.6%) |
| 20 to 24 Years | 3 (2.5%) | 4 (3.5%) |
| 25 to 29 Years | 5 (4.1%) | 6 (5.3%) |
| 30 to 34 Years | 4 (3.3%) | 8 (7.1%) |
| 35 to 39 Years | 4 (3.3%) | 3 (2.6%) |
| 40 to 44 Years | 12 (9.8%) | 3 (2.6%) |
| 45 to 49 Years | 4 (3.3%) | 1 (0.9%) |
| 50 to 54 Years | 12 (9.8%) | 5 (4.4%) |
| 55 to 59 Years | 12 (9.8%) | 7 (6.2%) |
| 60 to 64 Years | 8 (6.6%) | 7 (6.2%) |
| 65 to 69 Years | 17 (13.9%) | 23 (20.3%) |
| 70 to 74 Years | 11 (9.0%) | 2 (1.8%) |
| 75 to 79 Years | 2 (1.6%) | 15 (13.3%) |
| 80 to 84 Years | 3 (2.5%) | 5 (4.4%) |
| 85 Years and over | 3 (2.5%) | 3 (2.6%) |
| Total | 122 (100.0%) | 113 (100.0%) |
Families and Households in Bethany borough
Median Family Size in Bethany borough
The median family size in Bethany borough is 2.69 persons per family, with married-couple families (68 | 88.3%) accounting for the largest median family size of 2.72 persons per family. On the other hand, single female/mother families (5 | 6.5%) represent the smallest median family size with 2.40 persons per family.
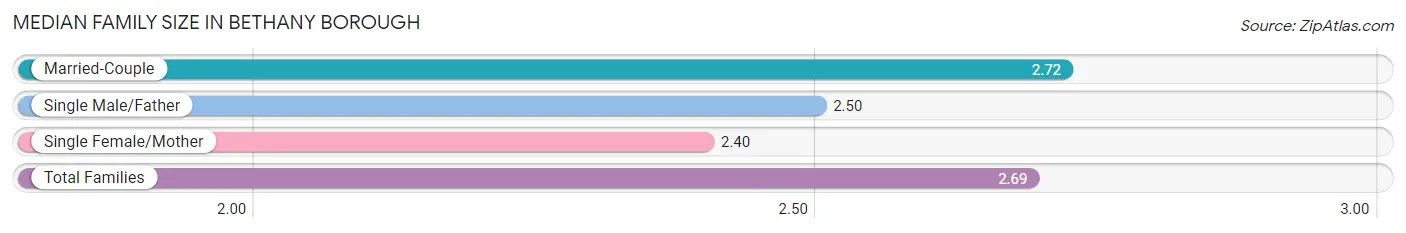
| Family Type | # Families | Family Size |
| Married-Couple | 68 (88.3%) | 2.72 |
| Single Male/Father | 4 (5.2%) | 2.50 |
| Single Female/Mother | 5 (6.5%) | 2.40 |
| Total Families | 77 (100.0%) | 2.69 |
Median Household Size in Bethany borough
The median household size in Bethany borough is 2.35 persons per household, with single female/mother households (5 | 5.0%) accounting for the largest median household size of 2.8 persons per household. non-family households (23 | 23.0%) represent the smallest median household size with 1.13 persons per household.
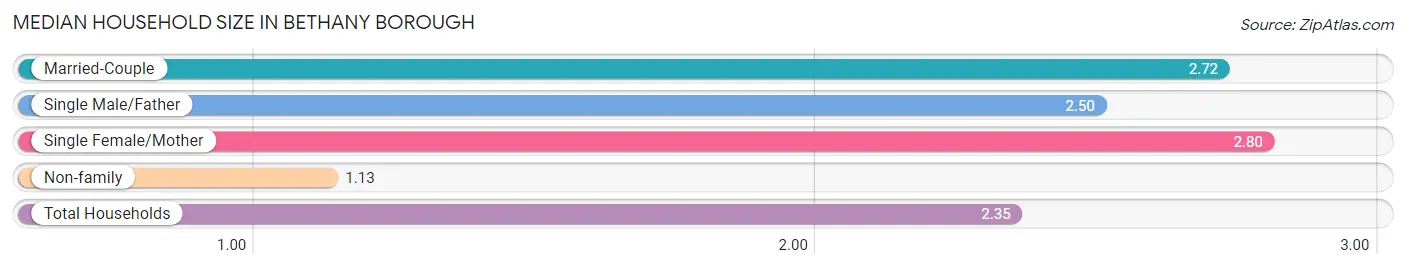
| Household Type | # Households | Household Size |
| Married-Couple | 68 (68.0%) | 2.72 |
| Single Male/Father | 4 (4.0%) | 2.50 |
| Single Female/Mother | 5 (5.0%) | 2.80 |
| Non-family | 23 (23.0%) | 1.13 |
| Total Households | 100 (100.0%) | 2.35 |
Household Size by Marriage Status in Bethany borough
Out of a total of 100 households in Bethany borough, 77 (77.0%) are family households, while 23 (23.0%) are nonfamily households. The most numerous type of family households are 2-person households, comprising 55, and the most common type of nonfamily households are 1-person households, comprising 20.
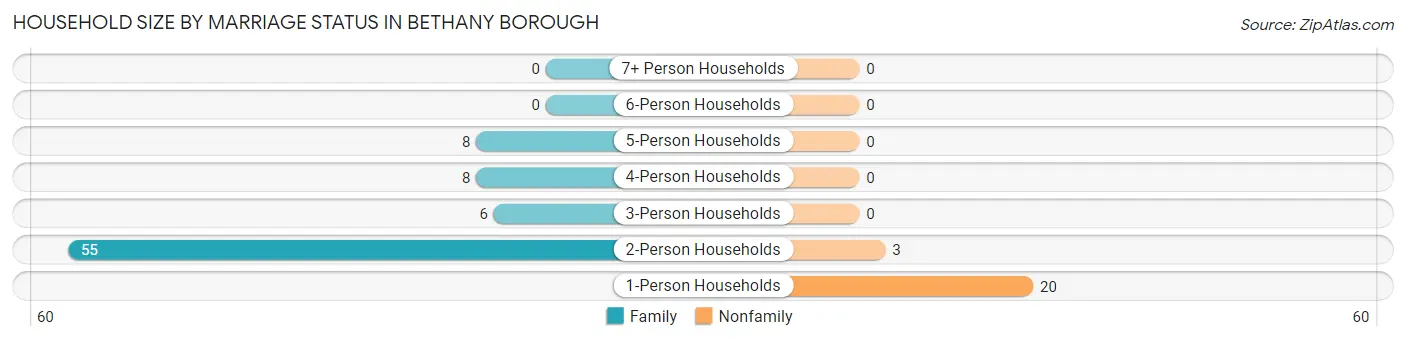
| Household Size | Family Households | Nonfamily Households |
| 1-Person Households | - | 20 (20.0%) |
| 2-Person Households | 55 (55.0%) | 3 (3.0%) |
| 3-Person Households | 6 (6.0%) | 0 (0.0%) |
| 4-Person Households | 8 (8.0%) | 0 (0.0%) |
| 5-Person Households | 8 (8.0%) | 0 (0.0%) |
| 6-Person Households | 0 (0.0%) | 0 (0.0%) |
| 7+ Person Households | 0 (0.0%) | 0 (0.0%) |
| Total | 77 (77.0%) | 23 (23.0%) |
Female Fertility in Bethany borough
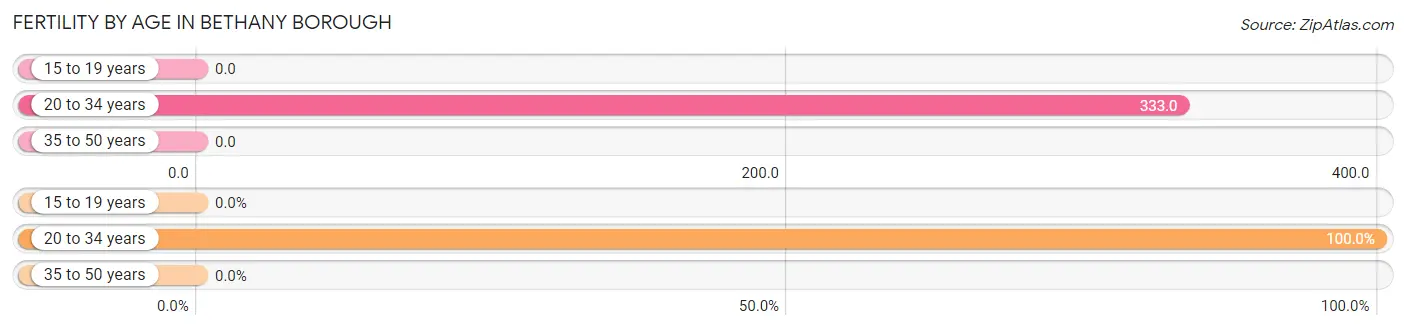
Fertility by Age in Bethany borough
Average fertility rate in Bethany borough is 194.0 births per 1,000 women. Women in the age bracket of 20 to 34 years have the highest fertility rate with 333.0 births per 1,000 women. Women in the age bracket of 20 to 34 years acount for 100.0% of all women with births.
| Age Bracket | Women with Births | Births / 1,000 Women |
| 15 to 19 years | 0 (0.0%) | 0.0 |
| 20 to 34 years | 6 (100.0%) | 333.0 |
| 35 to 50 years | 0 (0.0%) | 0.0 |
| Total | 6 (100.0%) | 194.0 |
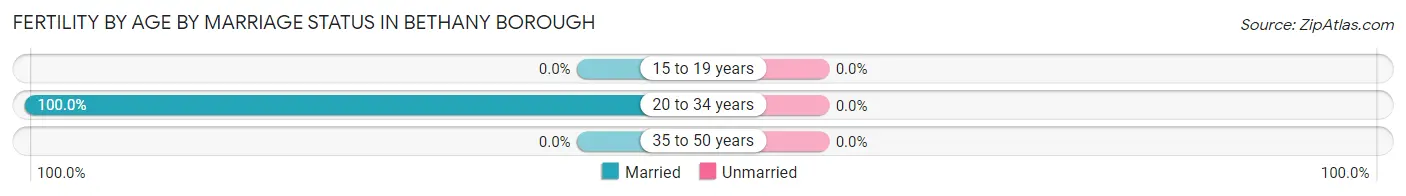
Fertility by Age by Marriage Status in Bethany borough
| Age Bracket | Married | Unmarried |
| 15 to 19 years | 0 (0.0%) | 0 (0.0%) |
| 20 to 34 years | 6 (100.0%) | 0 (0.0%) |
| 35 to 50 years | 0 (0.0%) | 0 (0.0%) |
| Total | 6 (100.0%) | 0 (0.0%) |
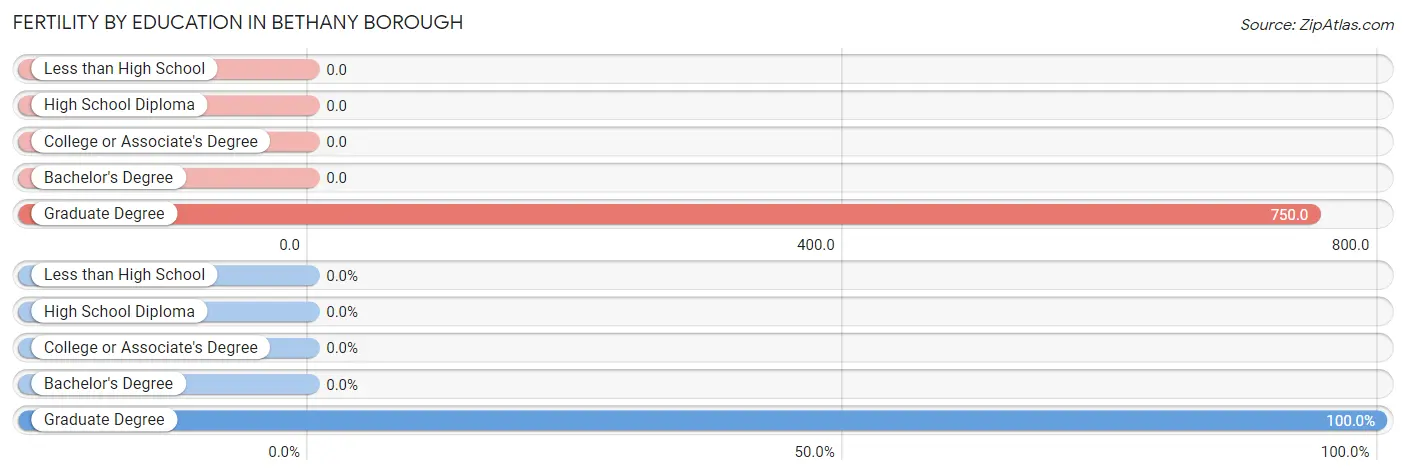
Fertility by Education in Bethany borough
| Educational Attainment | Women with Births | Births / 1,000 Women |
| Less than High School | 0 (0.0%) | 0.0 |
| High School Diploma | 0 (0.0%) | 0.0 |
| College or Associate's Degree | 0 (0.0%) | 0.0 |
| Bachelor's Degree | 0 (0.0%) | 0.0 |
| Graduate Degree | 6 (100.0%) | 750.0 |
| Total | 6 (100.0%) | 194.0 |
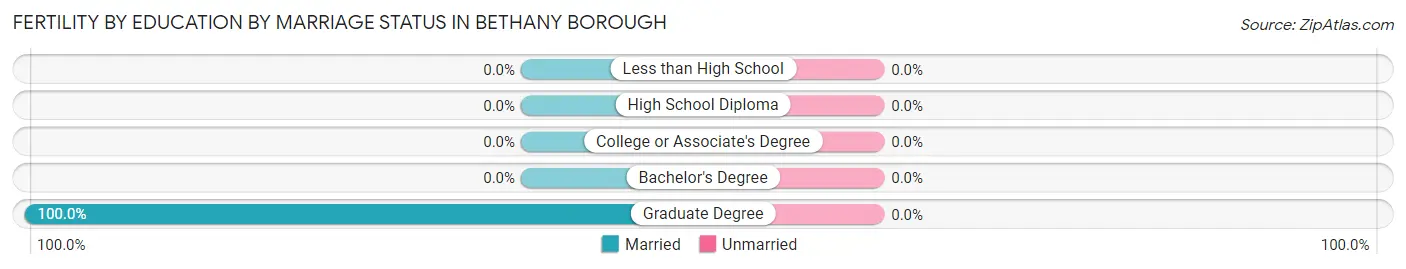
Fertility by Education by Marriage Status in Bethany borough
| Educational Attainment | Married | Unmarried |
| Less than High School | 0 (0.0%) | 0 (0.0%) |
| High School Diploma | 0 (0.0%) | 0 (0.0%) |
| College or Associate's Degree | 0 (0.0%) | 0 (0.0%) |
| Bachelor's Degree | 0 (0.0%) | 0 (0.0%) |
| Graduate Degree | 6 (100.0%) | 0 (0.0%) |
| Total | 6 (100.0%) | 0 (0.0%) |
Employment Characteristics in Bethany borough
Employment by Class of Employer in Bethany borough
Among the 97 employed individuals in Bethany borough, private company employees (49 | 50.5%), local government employees (18 | 18.6%), and not-for-profit organizations (12 | 12.4%) make up the most common classes of employment.
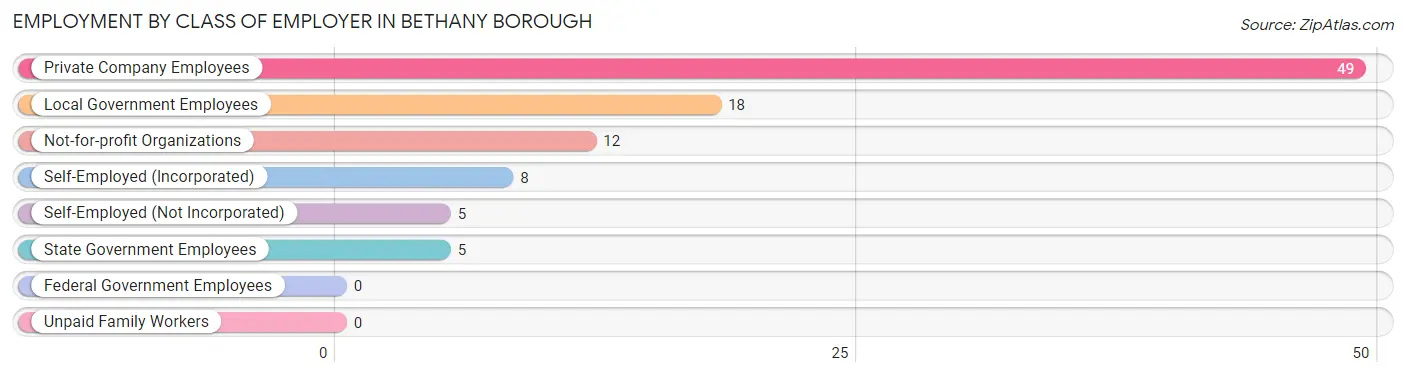
| Employer Class | # Employees | % Employees |
| Private Company Employees | 49 | 50.5% |
| Self-Employed (Incorporated) | 8 | 8.3% |
| Self-Employed (Not Incorporated) | 5 | 5.1% |
| Not-for-profit Organizations | 12 | 12.4% |
| Local Government Employees | 18 | 18.6% |
| State Government Employees | 5 | 5.1% |
| Federal Government Employees | 0 | 0.0% |
| Unpaid Family Workers | 0 | 0.0% |
| Total | 97 | 100.0% |
Employment Status by Age in Bethany borough
According to the labor force statistics for Bethany borough, out of the total population over 16 years of age (197), 54.8% or 108 individuals are in the labor force, with 8.3% or 9 of them unemployed. The age group with the highest labor force participation rate is 20 to 24 years, with 100.0% or 7 individuals in the labor force. Within the labor force, the 20 to 24 years age range has the highest percentage of unemployed individuals, with 42.9% or 3 of them being unemployed.
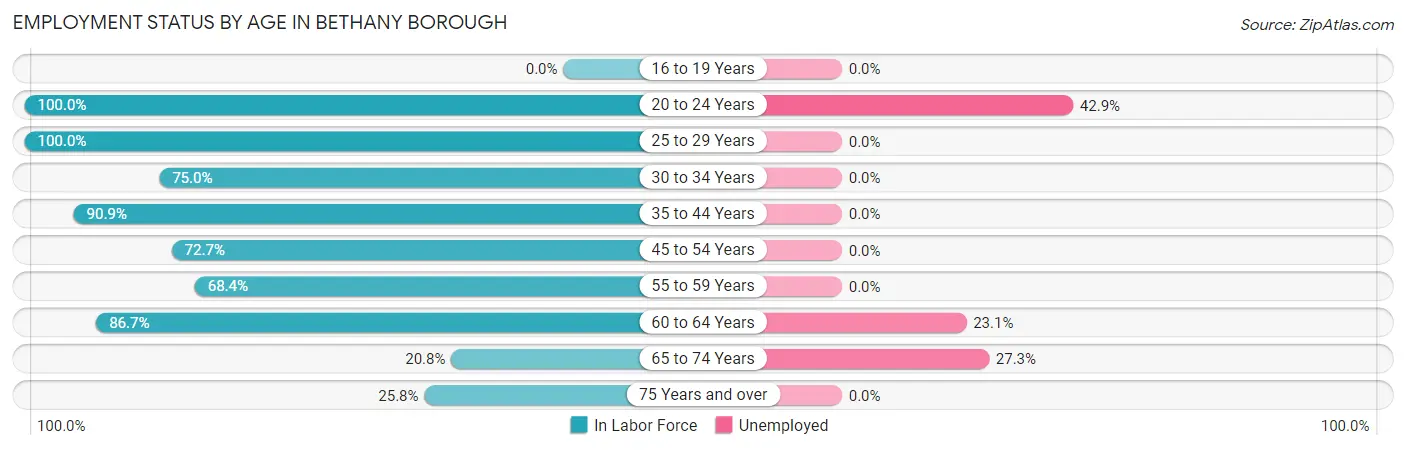
| Age Bracket | In Labor Force | Unemployed |
| 16 to 19 Years | 0 (0.0%) | 0 (0.0%) |
| 20 to 24 Years | 7 (100.0%) | 3 (42.9%) |
| 25 to 29 Years | 11 (100.0%) | 0 (0.0%) |
| 30 to 34 Years | 9 (75.0%) | 0 (0.0%) |
| 35 to 44 Years | 20 (90.9%) | 0 (0.0%) |
| 45 to 54 Years | 16 (72.7%) | 0 (0.0%) |
| 55 to 59 Years | 13 (68.4%) | 0 (0.0%) |
| 60 to 64 Years | 13 (86.7%) | 3 (23.1%) |
| 65 to 74 Years | 11 (20.8%) | 3 (27.3%) |
| 75 Years and over | 8 (25.8%) | 0 (0.0%) |
| Total | 108 (54.8%) | 9 (8.3%) |
Employment Status by Educational Attainment in Bethany borough
According to labor force statistics for Bethany borough, 81.2% of individuals (82) out of the total population between 25 and 64 years of age (101) are in the labor force, with 3.7% or 3 of them being unemployed. The group with the highest labor force participation rate are those with the educational attainment of college / associate degree, with 92.6% or 25 individuals in the labor force. Within the labor force, individuals with less than high school education have the highest percentage of unemployment, with 100.0% or 3 of them being unemployed.
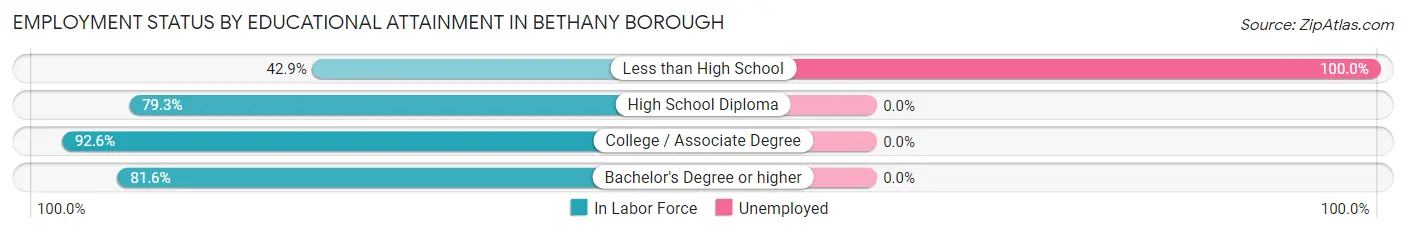
| Educational Attainment | In Labor Force | Unemployed |
| Less than High School | 3 (42.9%) | 7 (100.0%) |
| High School Diploma | 23 (79.3%) | 0 (0.0%) |
| College / Associate Degree | 25 (92.6%) | 0 (0.0%) |
| Bachelor's Degree or higher | 31 (81.6%) | 0 (0.0%) |
| Total | 82 (81.2%) | 4 (3.7%) |
Employment Occupations by Sex in Bethany borough
Management, Business, Science and Arts Occupations
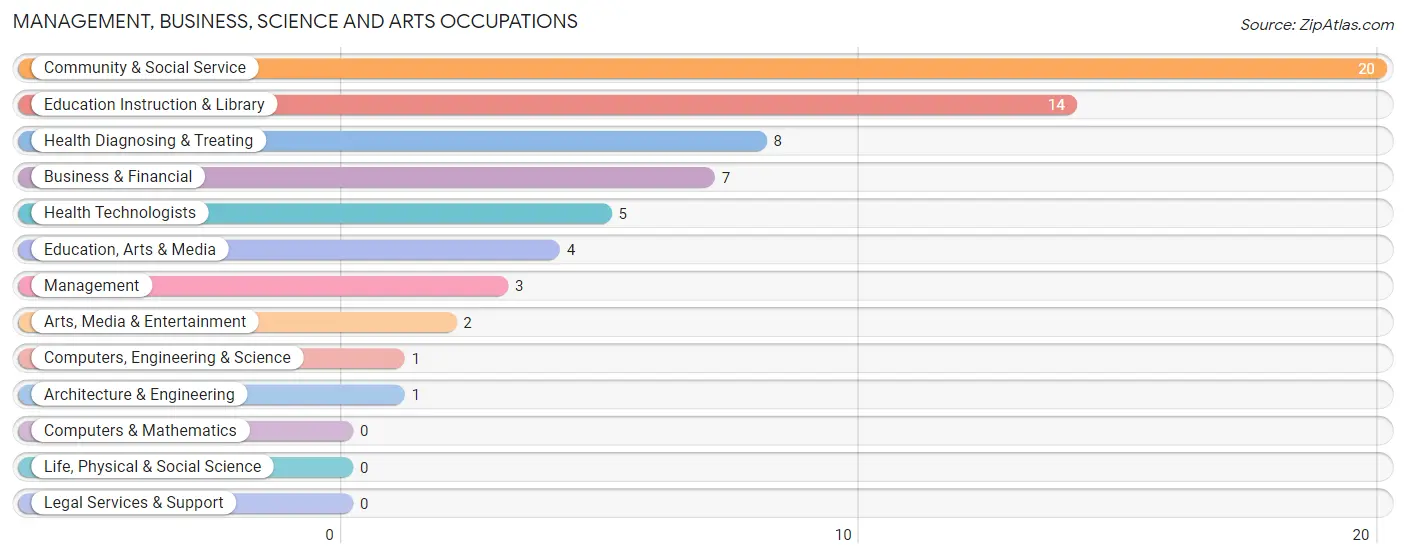
The most common Management, Business, Science and Arts occupations in Bethany borough are Community & Social Service (20 | 20.2%), Education Instruction & Library (14 | 14.1%), Health Diagnosing & Treating (8 | 8.1%), Business & Financial (7 | 7.1%), and Health Technologists (5 | 5.1%).
Management, Business, Science and Arts Occupations by Sex
Within the Management, Business, Science and Arts occupations in Bethany borough, the most male-oriented occupations are Computers, Engineering & Science (100.0%), Architecture & Engineering (100.0%), and Education, Arts & Media (100.0%), while the most female-oriented occupations are Management (100.0%), Health Diagnosing & Treating (100.0%), and Health Technologists (100.0%).
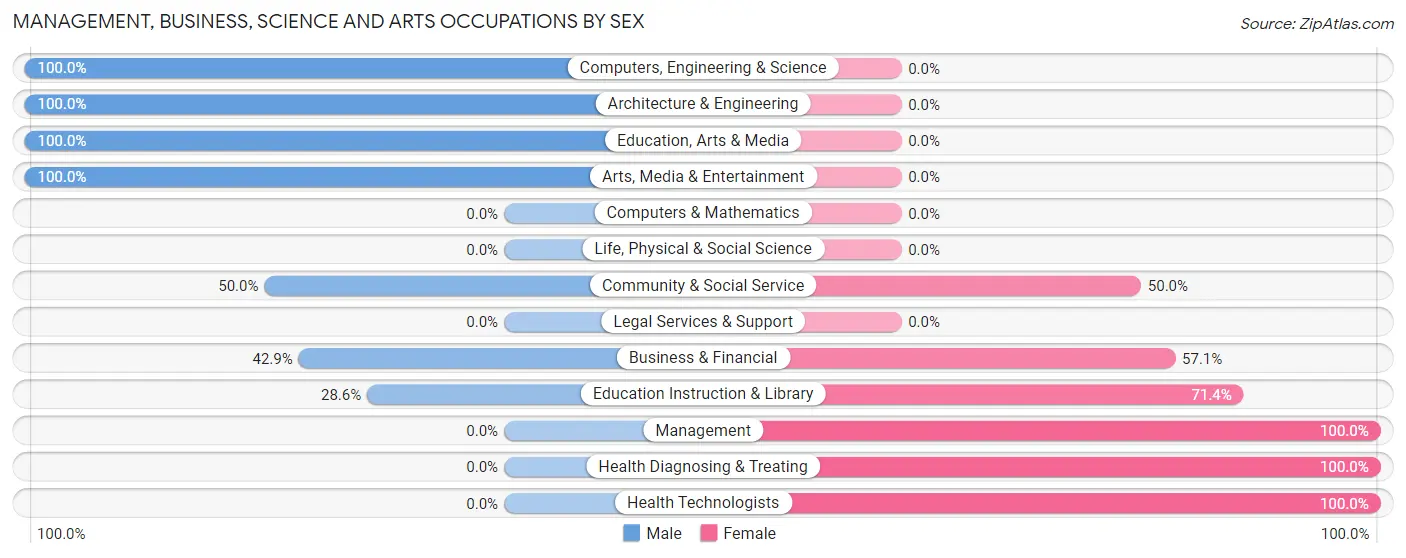
| Occupation | Male | Female |
| Management | 0 (0.0%) | 3 (100.0%) |
| Business & Financial | 3 (42.9%) | 4 (57.1%) |
| Computers, Engineering & Science | 1 (100.0%) | 0 (0.0%) |
| Computers & Mathematics | 0 (0.0%) | 0 (0.0%) |
| Architecture & Engineering | 1 (100.0%) | 0 (0.0%) |
| Life, Physical & Social Science | 0 (0.0%) | 0 (0.0%) |
| Community & Social Service | 10 (50.0%) | 10 (50.0%) |
| Education, Arts & Media | 4 (100.0%) | 0 (0.0%) |
| Legal Services & Support | 0 (0.0%) | 0 (0.0%) |
| Education Instruction & Library | 4 (28.6%) | 10 (71.4%) |
| Arts, Media & Entertainment | 2 (100.0%) | 0 (0.0%) |
| Health Diagnosing & Treating | 0 (0.0%) | 8 (100.0%) |
| Health Technologists | 0 (0.0%) | 5 (100.0%) |
| Total (Category) | 14 (35.9%) | 25 (64.1%) |
| Total (Overall) | 55 (55.6%) | 44 (44.4%) |
Services Occupations
The most common Services occupations in Bethany borough are Cleaning & Maintenance (6 | 6.1%), Personal Care & Service (6 | 6.1%), Healthcare Support (3 | 3.0%), Security & Protection (3 | 3.0%), and Firefighting & Prevention (2 | 2.0%).
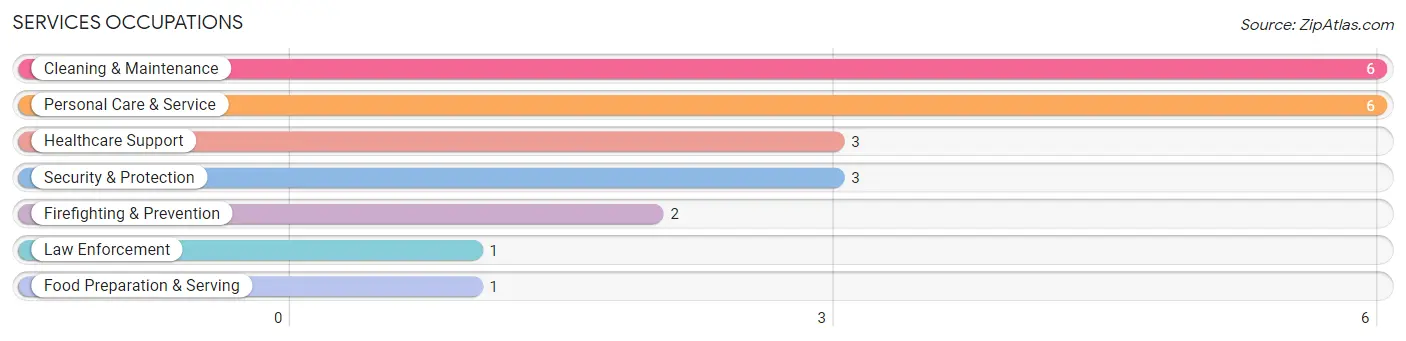
Services Occupations by Sex
Within the Services occupations in Bethany borough, the most male-oriented occupations are Healthcare Support (100.0%), Security & Protection (100.0%), and Firefighting & Prevention (100.0%), while the most female-oriented occupations are Food Preparation & Serving (100.0%), and Personal Care & Service (66.7%).
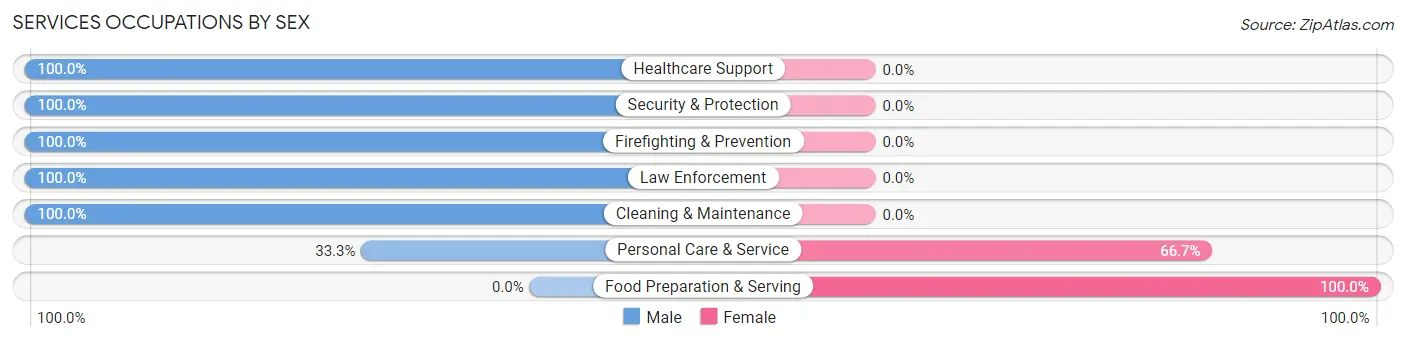
| Occupation | Male | Female |
| Healthcare Support | 3 (100.0%) | 0 (0.0%) |
| Security & Protection | 3 (100.0%) | 0 (0.0%) |
| Firefighting & Prevention | 2 (100.0%) | 0 (0.0%) |
| Law Enforcement | 1 (100.0%) | 0 (0.0%) |
| Food Preparation & Serving | 0 (0.0%) | 1 (100.0%) |
| Cleaning & Maintenance | 6 (100.0%) | 0 (0.0%) |
| Personal Care & Service | 2 (33.3%) | 4 (66.7%) |
| Total (Category) | 14 (73.7%) | 5 (26.3%) |
| Total (Overall) | 55 (55.6%) | 44 (44.4%) |
Sales and Office Occupations
The most common Sales and Office occupations in Bethany borough are Sales & Related (7 | 7.1%), and Office & Administration (4 | 4.0%).
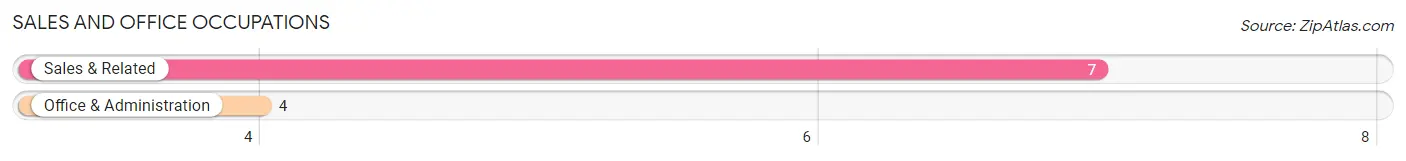
Sales and Office Occupations by Sex
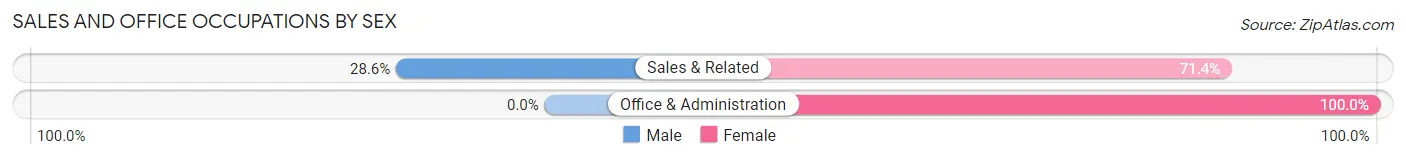
| Occupation | Male | Female |
| Sales & Related | 2 (28.6%) | 5 (71.4%) |
| Office & Administration | 0 (0.0%) | 4 (100.0%) |
| Total (Category) | 2 (18.2%) | 9 (81.8%) |
| Total (Overall) | 55 (55.6%) | 44 (44.4%) |
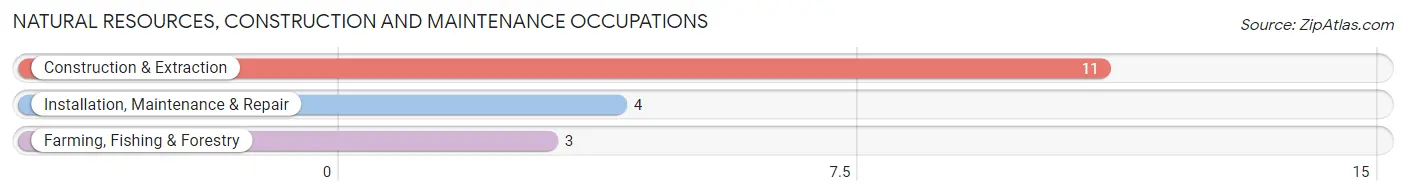
Natural Resources, Construction and Maintenance Occupations
The most common Natural Resources, Construction and Maintenance occupations in Bethany borough are Construction & Extraction (11 | 11.1%), Installation, Maintenance & Repair (4 | 4.0%), and Farming, Fishing & Forestry (3 | 3.0%).
Natural Resources, Construction and Maintenance Occupations by Sex
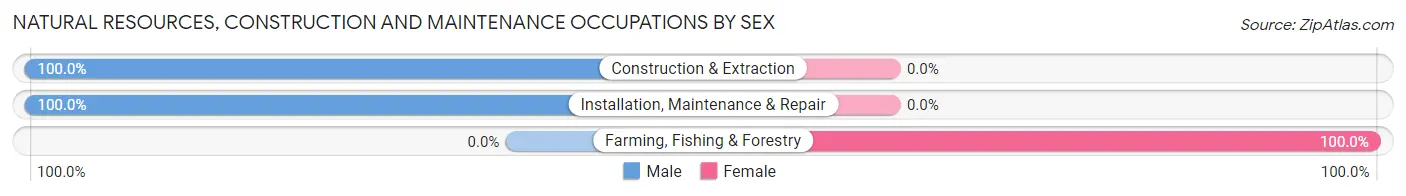
| Occupation | Male | Female |
| Farming, Fishing & Forestry | 0 (0.0%) | 3 (100.0%) |
| Construction & Extraction | 11 (100.0%) | 0 (0.0%) |
| Installation, Maintenance & Repair | 4 (100.0%) | 0 (0.0%) |
| Total (Category) | 15 (83.3%) | 3 (16.7%) |
| Total (Overall) | 55 (55.6%) | 44 (44.4%) |
Production, Transportation and Moving Occupations
The most common Production, Transportation and Moving occupations in Bethany borough are Material Moving (7 | 7.1%), and Transportation (5 | 5.1%).
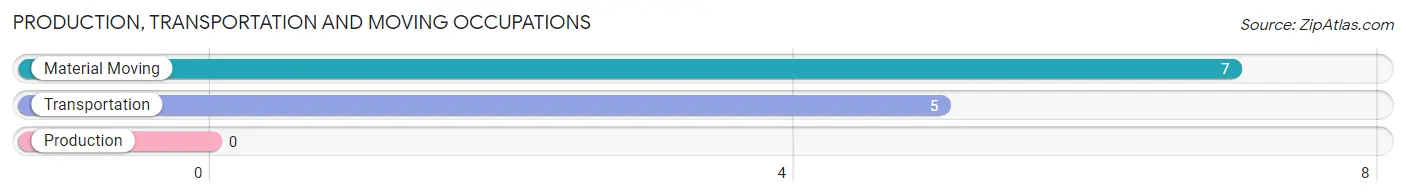
Production, Transportation and Moving Occupations by Sex
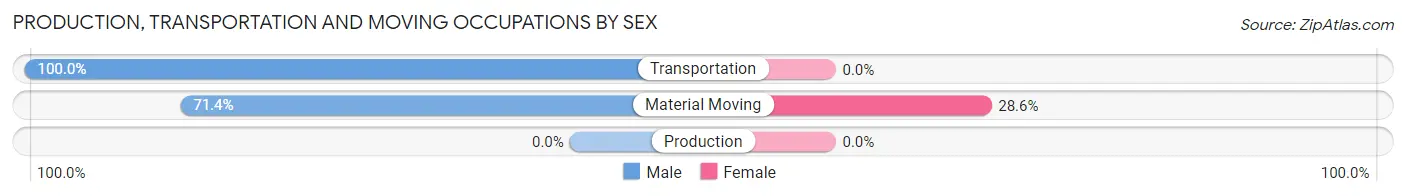
| Occupation | Male | Female |
| Production | 0 (0.0%) | 0 (0.0%) |
| Transportation | 5 (100.0%) | 0 (0.0%) |
| Material Moving | 5 (71.4%) | 2 (28.6%) |
| Total (Category) | 10 (83.3%) | 2 (16.7%) |
| Total (Overall) | 55 (55.6%) | 44 (44.4%) |
Employment Industries by Sex in Bethany borough
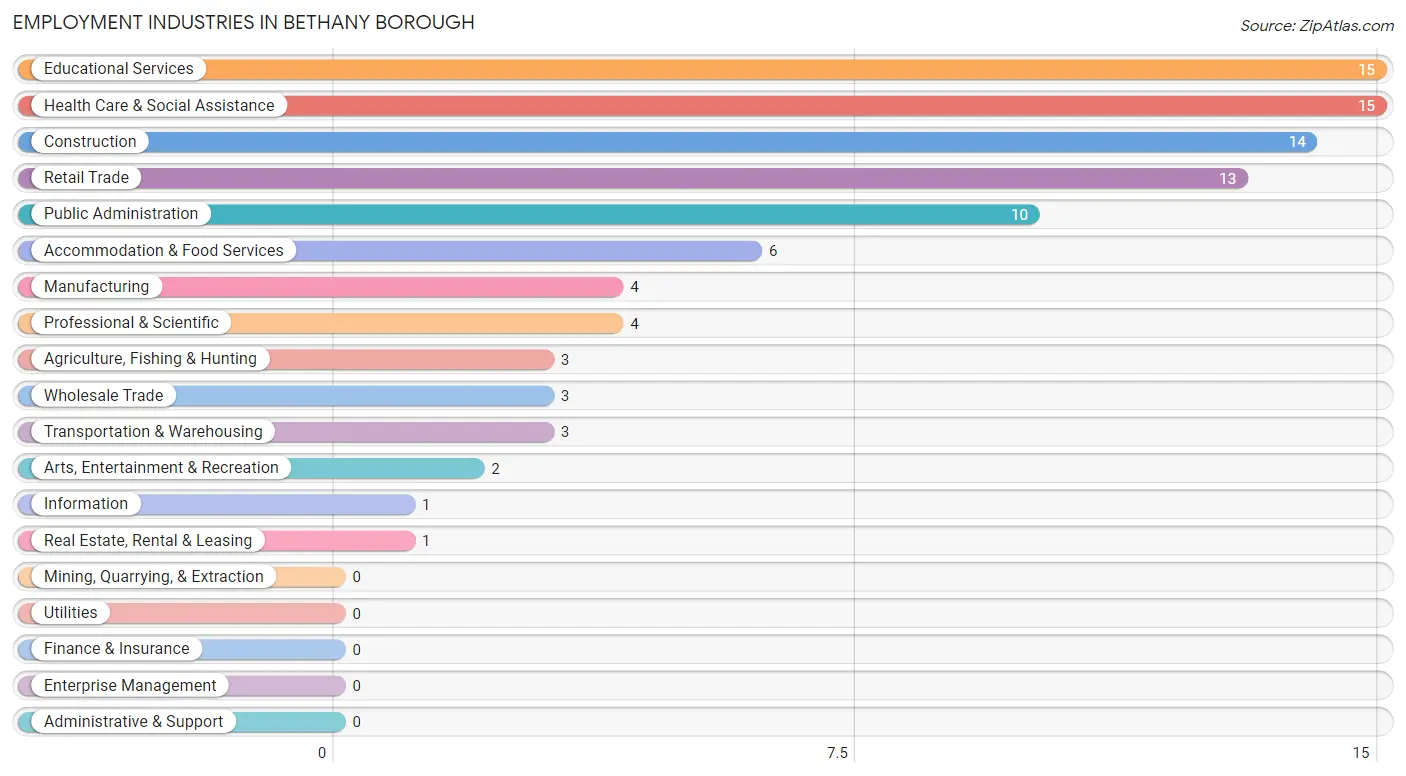
Employment Industries in Bethany borough
The major employment industries in Bethany borough include Educational Services (15 | 15.1%), Health Care & Social Assistance (15 | 15.1%), Construction (14 | 14.1%), Retail Trade (13 | 13.1%), and Public Administration (10 | 10.1%).
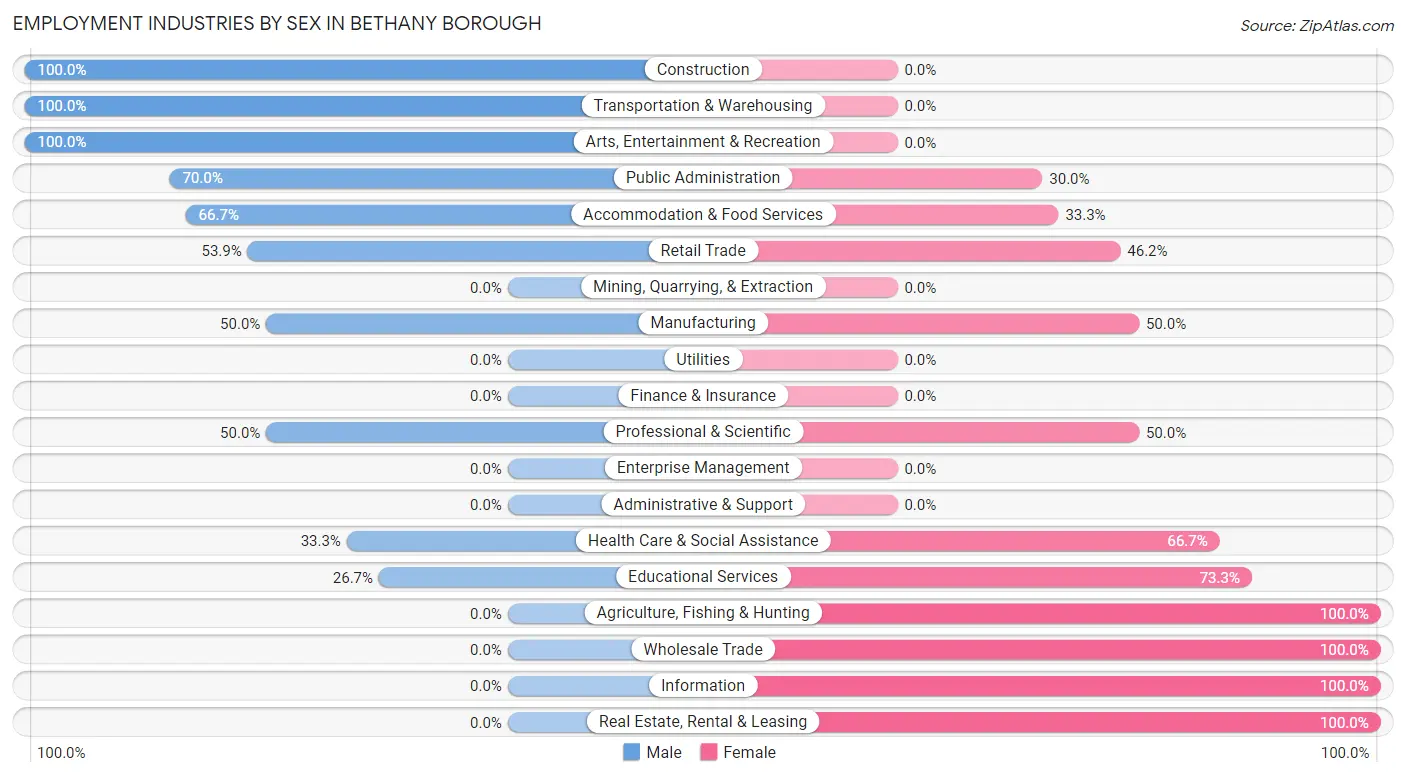
Employment Industries by Sex in Bethany borough
The Bethany borough industries that see more men than women are Construction (100.0%), Transportation & Warehousing (100.0%), and Arts, Entertainment & Recreation (100.0%), whereas the industries that tend to have a higher number of women are Agriculture, Fishing & Hunting (100.0%), Wholesale Trade (100.0%), and Information (100.0%).
| Industry | Male | Female |
| Agriculture, Fishing & Hunting | 0 (0.0%) | 3 (100.0%) |
| Mining, Quarrying, & Extraction | 0 (0.0%) | 0 (0.0%) |
| Construction | 14 (100.0%) | 0 (0.0%) |
| Manufacturing | 2 (50.0%) | 2 (50.0%) |
| Wholesale Trade | 0 (0.0%) | 3 (100.0%) |
| Retail Trade | 7 (53.8%) | 6 (46.2%) |
| Transportation & Warehousing | 3 (100.0%) | 0 (0.0%) |
| Utilities | 0 (0.0%) | 0 (0.0%) |
| Information | 0 (0.0%) | 1 (100.0%) |
| Finance & Insurance | 0 (0.0%) | 0 (0.0%) |
| Real Estate, Rental & Leasing | 0 (0.0%) | 1 (100.0%) |
| Professional & Scientific | 2 (50.0%) | 2 (50.0%) |
| Enterprise Management | 0 (0.0%) | 0 (0.0%) |
| Administrative & Support | 0 (0.0%) | 0 (0.0%) |
| Educational Services | 4 (26.7%) | 11 (73.3%) |
| Health Care & Social Assistance | 5 (33.3%) | 10 (66.7%) |
| Arts, Entertainment & Recreation | 2 (100.0%) | 0 (0.0%) |
| Accommodation & Food Services | 4 (66.7%) | 2 (33.3%) |
| Public Administration | 7 (70.0%) | 3 (30.0%) |
| Total | 55 (55.6%) | 44 (44.4%) |
Education in Bethany borough
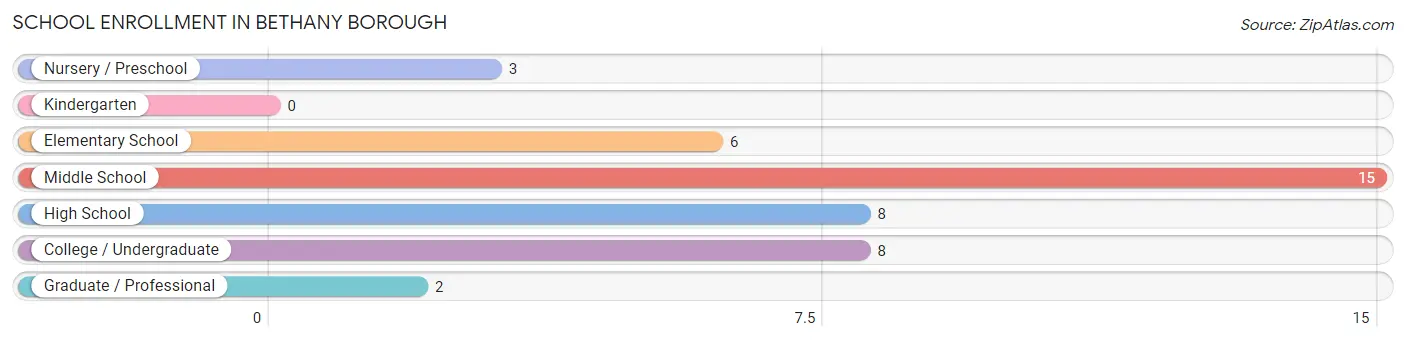
School Enrollment in Bethany borough
The most common levels of schooling among the 42 students in Bethany borough are middle school (15 | 35.7%), high school (8 | 19.1%), and college / undergraduate (8 | 19.1%).
| School Level | # Students | % Students |
| Nursery / Preschool | 3 | 7.1% |
| Kindergarten | 0 | 0.0% |
| Elementary School | 6 | 14.3% |
| Middle School | 15 | 35.7% |
| High School | 8 | 19.1% |
| College / Undergraduate | 8 | 19.1% |
| Graduate / Professional | 2 | 4.8% |
| Total | 42 | 100.0% |
School Enrollment by Age by Funding Source in Bethany borough
Out of a total of 42 students who are enrolled in schools in Bethany borough, 7 (16.7%) attend a private institution, while the remaining 35 (83.3%) are enrolled in public schools. The age group of 20 to 24 year olds has the highest likelihood of being enrolled in private schools, with 3 (50.0% in the age bracket) enrolled. Conversely, the age group of 3 to 4 year olds has the lowest likelihood of being enrolled in a private school, with 2 (100.0% in the age bracket) attending a public institution.
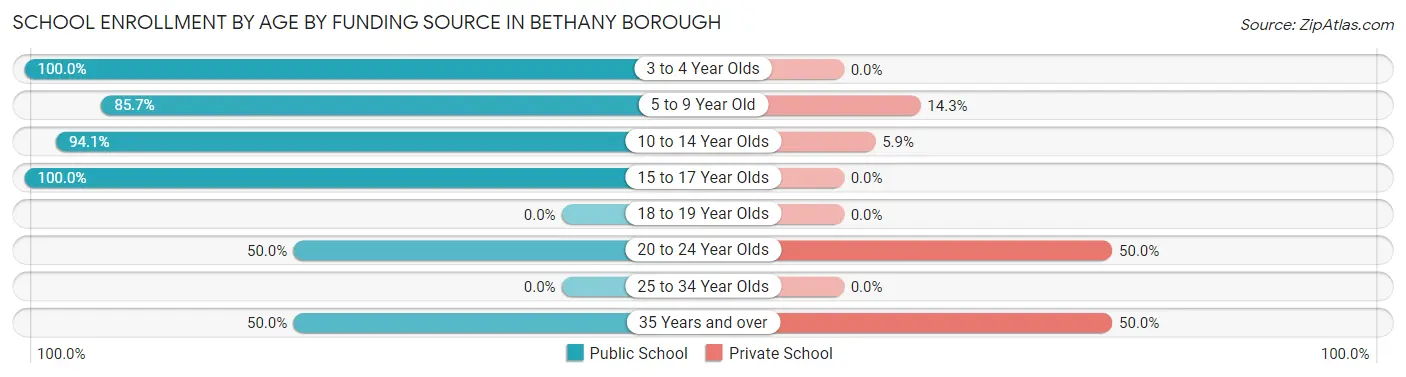
| Age Bracket | Public School | Private School |
| 3 to 4 Year Olds | 2 (100.0%) | 0 (0.0%) |
| 5 to 9 Year Old | 6 (85.7%) | 1 (14.3%) |
| 10 to 14 Year Olds | 16 (94.1%) | 1 (5.9%) |
| 15 to 17 Year Olds | 6 (100.0%) | 0 (0.0%) |
| 18 to 19 Year Olds | 0 (0.0%) | 0 (0.0%) |
| 20 to 24 Year Olds | 3 (50.0%) | 3 (50.0%) |
| 25 to 34 Year Olds | 0 (0.0%) | 0 (0.0%) |
| 35 Years and over | 2 (50.0%) | 2 (50.0%) |
| Total | 35 (83.3%) | 7 (16.7%) |
Educational Attainment by Field of Study in Bethany borough
Education (46 | 52.9%), science & technology (9 | 10.3%), arts & humanities (9 | 10.3%), business (6 | 6.9%), and liberal arts & history (5 | 5.8%) are the most common fields of study among 87 individuals in Bethany borough who have obtained a bachelor's degree or higher.
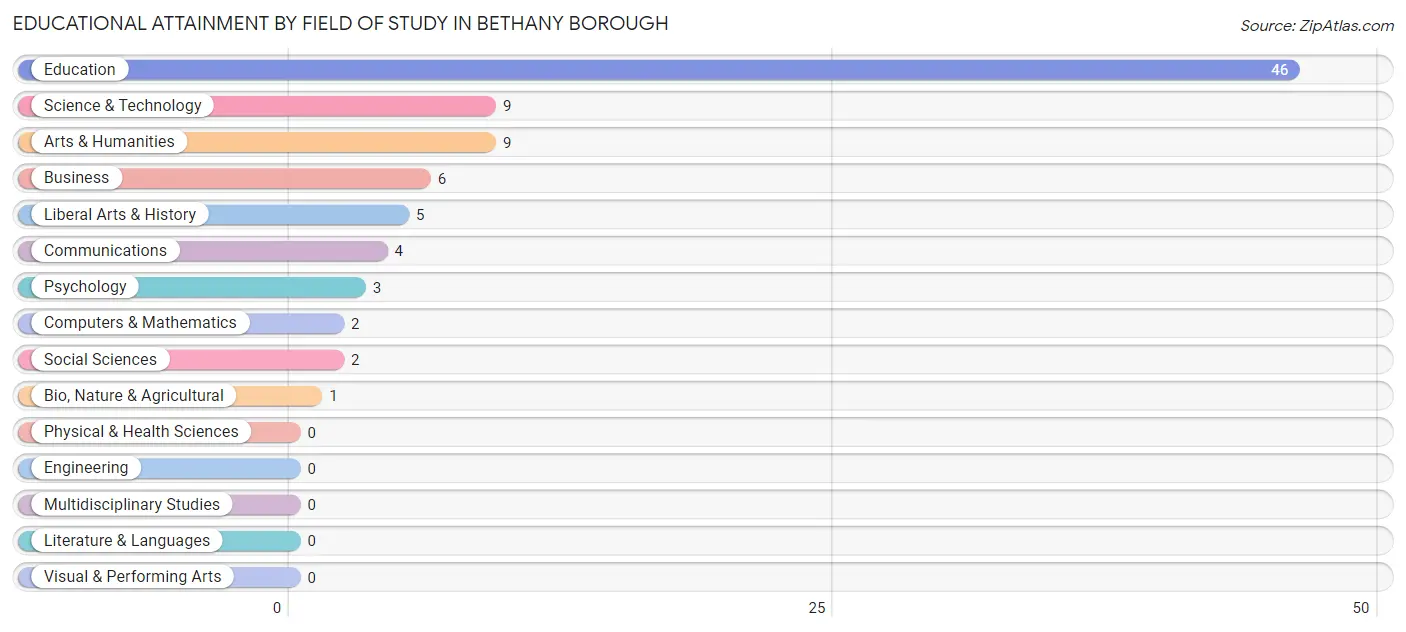
| Field of Study | # Graduates | % Graduates |
| Computers & Mathematics | 2 | 2.3% |
| Bio, Nature & Agricultural | 1 | 1.1% |
| Physical & Health Sciences | 0 | 0.0% |
| Psychology | 3 | 3.5% |
| Social Sciences | 2 | 2.3% |
| Engineering | 0 | 0.0% |
| Multidisciplinary Studies | 0 | 0.0% |
| Science & Technology | 9 | 10.3% |
| Business | 6 | 6.9% |
| Education | 46 | 52.9% |
| Literature & Languages | 0 | 0.0% |
| Liberal Arts & History | 5 | 5.8% |
| Visual & Performing Arts | 0 | 0.0% |
| Communications | 4 | 4.6% |
| Arts & Humanities | 9 | 10.3% |
| Total | 87 | 100.0% |
Transportation & Commute in Bethany borough
Vehicle Availability by Sex in Bethany borough
The most prevalent vehicle ownership categories in Bethany borough are males with 2 vehicles (28, accounting for 52.8%) and females with 2 vehicles (22, making up 63.6%).
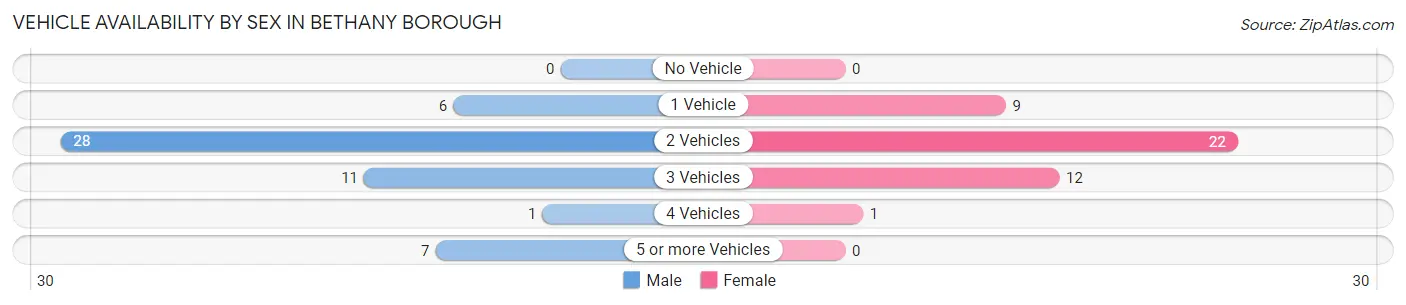
| Vehicles Available | Male | Female |
| No Vehicle | 0 (0.0%) | 0 (0.0%) |
| 1 Vehicle | 6 (11.3%) | 9 (20.4%) |
| 2 Vehicles | 28 (52.8%) | 22 (50.0%) |
| 3 Vehicles | 11 (20.7%) | 12 (27.3%) |
| 4 Vehicles | 1 (1.9%) | 1 (2.3%) |
| 5 or more Vehicles | 7 (13.2%) | 0 (0.0%) |
| Total | 53 (100.0%) | 44 (100.0%) |
Commute Time in Bethany borough
The most frequently occuring commute durations in Bethany borough are 10 to 14 minutes (27 commuters, 31.8%), 15 to 19 minutes (16 commuters, 18.8%), and 25 to 29 minutes (11 commuters, 12.9%).
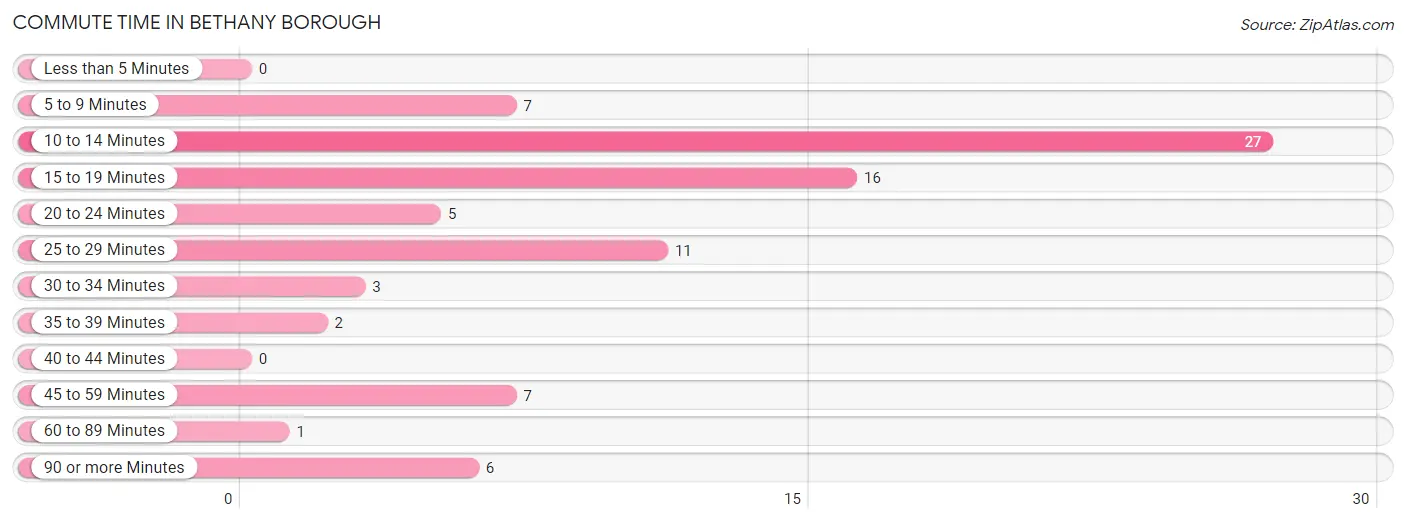
| Commute Time | # Commuters | % Commuters |
| Less than 5 Minutes | 0 | 0.0% |
| 5 to 9 Minutes | 7 | 8.2% |
| 10 to 14 Minutes | 27 | 31.8% |
| 15 to 19 Minutes | 16 | 18.8% |
| 20 to 24 Minutes | 5 | 5.9% |
| 25 to 29 Minutes | 11 | 12.9% |
| 30 to 34 Minutes | 3 | 3.5% |
| 35 to 39 Minutes | 2 | 2.4% |
| 40 to 44 Minutes | 0 | 0.0% |
| 45 to 59 Minutes | 7 | 8.2% |
| 60 to 89 Minutes | 1 | 1.2% |
| 90 or more Minutes | 6 | 7.1% |
Commute Time by Sex in Bethany borough
The most common commute times in Bethany borough are 10 to 14 minutes (18 commuters, 39.1%) for males and 15 to 19 minutes (10 commuters, 25.6%) for females.
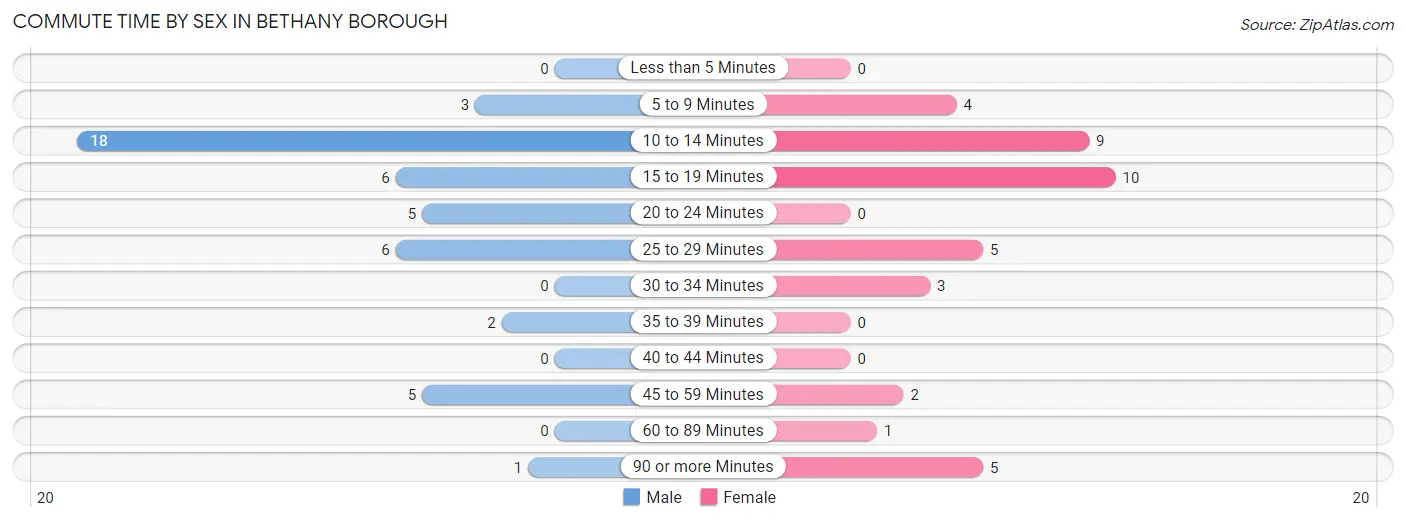
| Commute Time | Male | Female |
| Less than 5 Minutes | 0 (0.0%) | 0 (0.0%) |
| 5 to 9 Minutes | 3 (6.5%) | 4 (10.3%) |
| 10 to 14 Minutes | 18 (39.1%) | 9 (23.1%) |
| 15 to 19 Minutes | 6 (13.0%) | 10 (25.6%) |
| 20 to 24 Minutes | 5 (10.9%) | 0 (0.0%) |
| 25 to 29 Minutes | 6 (13.0%) | 5 (12.8%) |
| 30 to 34 Minutes | 0 (0.0%) | 3 (7.7%) |
| 35 to 39 Minutes | 2 (4.3%) | 0 (0.0%) |
| 40 to 44 Minutes | 0 (0.0%) | 0 (0.0%) |
| 45 to 59 Minutes | 5 (10.9%) | 2 (5.1%) |
| 60 to 89 Minutes | 0 (0.0%) | 1 (2.6%) |
| 90 or more Minutes | 1 (2.2%) | 5 (12.8%) |
Time of Departure to Work by Sex in Bethany borough
The most frequent times of departure to work in Bethany borough are 7:30 AM to 7:59 AM (12, 26.1%) for males and 7:00 AM to 7:29 AM (8, 20.5%) for females.
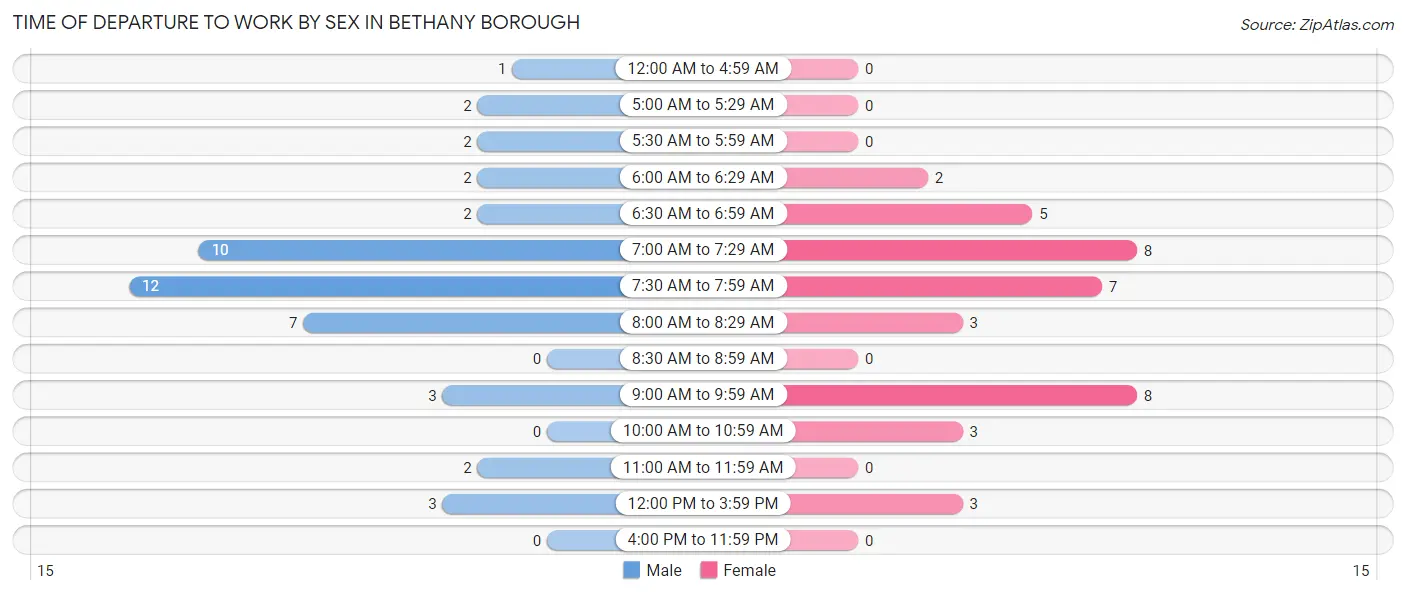
| Time of Departure | Male | Female |
| 12:00 AM to 4:59 AM | 1 (2.2%) | 0 (0.0%) |
| 5:00 AM to 5:29 AM | 2 (4.3%) | 0 (0.0%) |
| 5:30 AM to 5:59 AM | 2 (4.3%) | 0 (0.0%) |
| 6:00 AM to 6:29 AM | 2 (4.3%) | 2 (5.1%) |
| 6:30 AM to 6:59 AM | 2 (4.3%) | 5 (12.8%) |
| 7:00 AM to 7:29 AM | 10 (21.7%) | 8 (20.5%) |
| 7:30 AM to 7:59 AM | 12 (26.1%) | 7 (17.9%) |
| 8:00 AM to 8:29 AM | 7 (15.2%) | 3 (7.7%) |
| 8:30 AM to 8:59 AM | 0 (0.0%) | 0 (0.0%) |
| 9:00 AM to 9:59 AM | 3 (6.5%) | 8 (20.5%) |
| 10:00 AM to 10:59 AM | 0 (0.0%) | 3 (7.7%) |
| 11:00 AM to 11:59 AM | 2 (4.3%) | 0 (0.0%) |
| 12:00 PM to 3:59 PM | 3 (6.5%) | 3 (7.7%) |
| 4:00 PM to 11:59 PM | 0 (0.0%) | 0 (0.0%) |
| Total | 46 (100.0%) | 39 (100.0%) |
Housing Occupancy in Bethany borough
Occupancy by Ownership in Bethany borough
Of the total 100 dwellings in Bethany borough, owner-occupied units account for 83 (83.0%), while renter-occupied units make up 17 (17.0%).
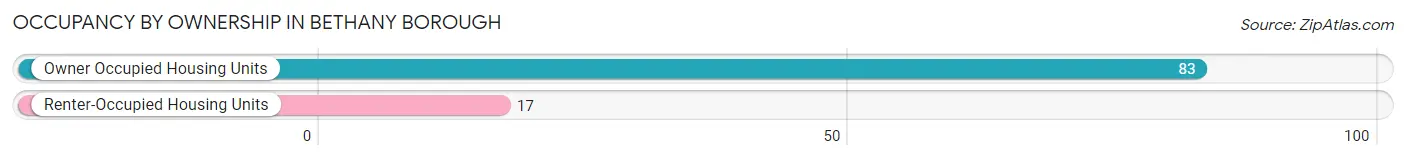
| Occupancy | # Housing Units | % Housing Units |
| Owner Occupied Housing Units | 83 | 83.0% |
| Renter-Occupied Housing Units | 17 | 17.0% |
| Total Occupied Housing Units | 100 | 100.0% |
Occupancy by Household Size in Bethany borough

| Household Size | # Housing Units | % Housing Units |
| 1-Person Household | 20 | 20.0% |
| 2-Person Household | 58 | 58.0% |
| 3-Person Household | 6 | 6.0% |
| 4+ Person Household | 16 | 16.0% |
| Total Housing Units | 100 | 100.0% |
Occupancy by Ownership by Household Size in Bethany borough
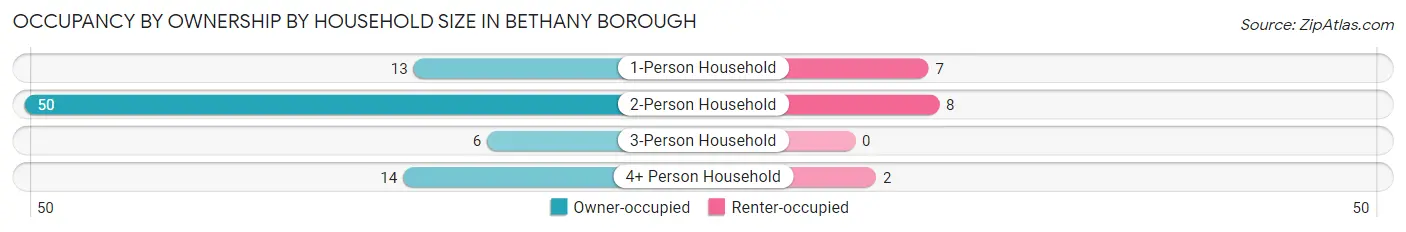
| Household Size | Owner-occupied | Renter-occupied |
| 1-Person Household | 13 (65.0%) | 7 (35.0%) |
| 2-Person Household | 50 (86.2%) | 8 (13.8%) |
| 3-Person Household | 6 (100.0%) | 0 (0.0%) |
| 4+ Person Household | 14 (87.5%) | 2 (12.5%) |
| Total Housing Units | 83 (83.0%) | 17 (17.0%) |
Occupancy by Educational Attainment in Bethany borough
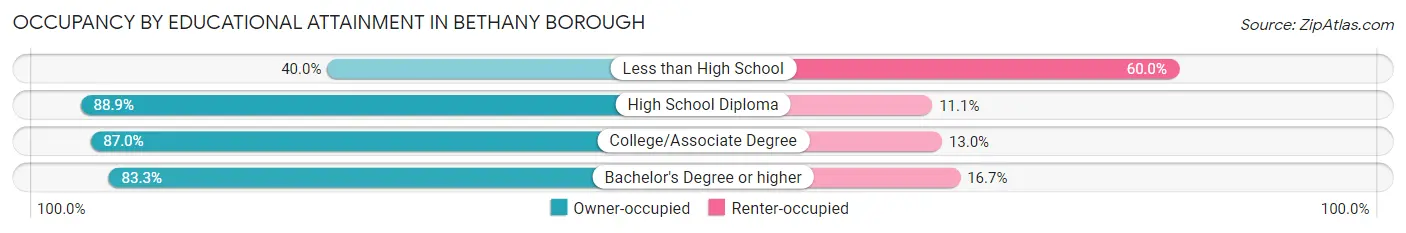
| Household Size | Owner-occupied | Renter-occupied |
| Less than High School | 2 (40.0%) | 3 (60.0%) |
| High School Diploma | 16 (88.9%) | 2 (11.1%) |
| College/Associate Degree | 20 (87.0%) | 3 (13.0%) |
| Bachelor's Degree or higher | 45 (83.3%) | 9 (16.7%) |
Occupancy by Age of Householder in Bethany borough
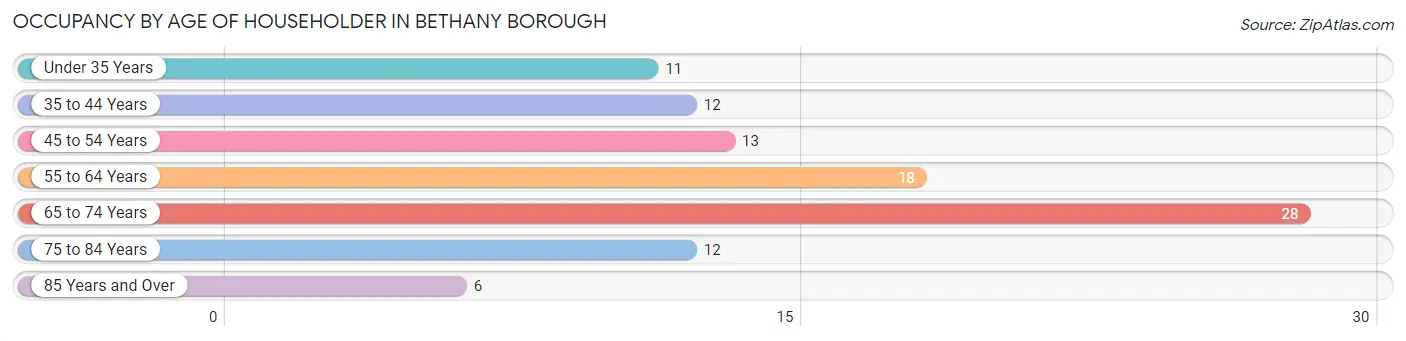
| Age Bracket | # Households | % Households |
| Under 35 Years | 11 | 11.0% |
| 35 to 44 Years | 12 | 12.0% |
| 45 to 54 Years | 13 | 13.0% |
| 55 to 64 Years | 18 | 18.0% |
| 65 to 74 Years | 28 | 28.0% |
| 75 to 84 Years | 12 | 12.0% |
| 85 Years and Over | 6 | 6.0% |
| Total | 100 | 100.0% |
Housing Finances in Bethany borough
Median Income by Occupancy in Bethany borough
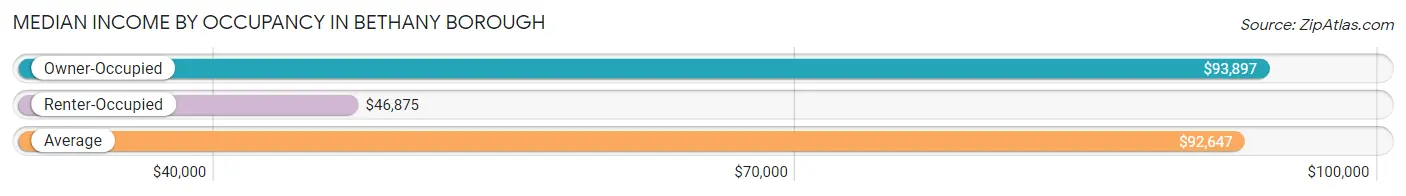
| Occupancy Type | # Households | Median Income |
| Owner-Occupied | 83 (83.0%) | $93,897 |
| Renter-Occupied | 17 (17.0%) | $46,875 |
| Average | 100 (100.0%) | $92,647 |
Occupancy by Householder Income Bracket in Bethany borough
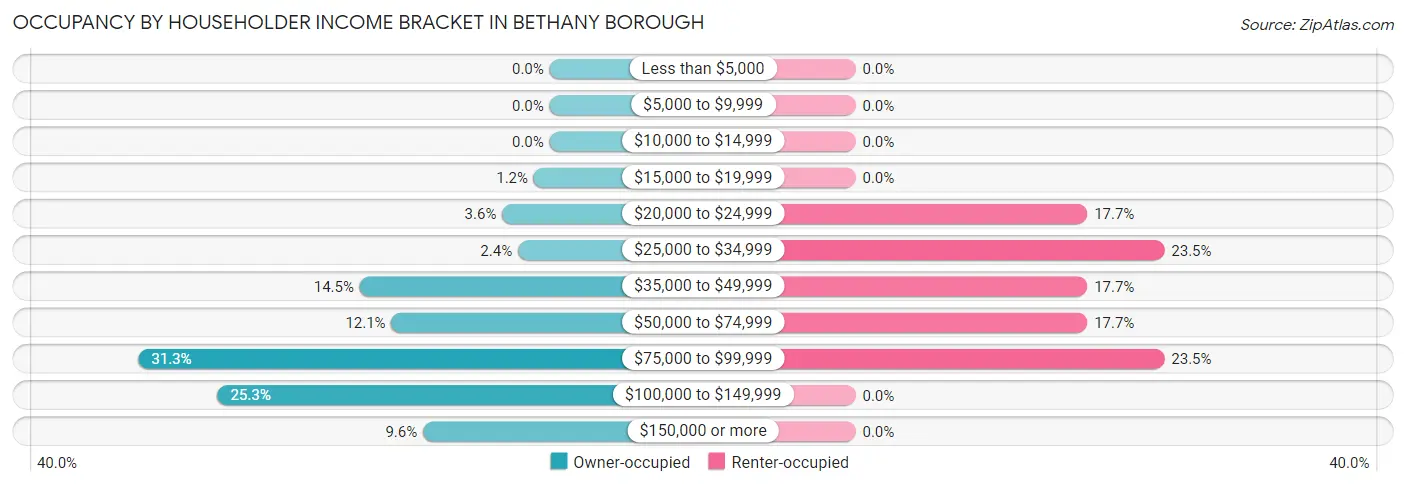
| Income Bracket | Owner-occupied | Renter-occupied |
| Less than $5,000 | 0 (0.0%) | 0 (0.0%) |
| $5,000 to $9,999 | 0 (0.0%) | 0 (0.0%) |
| $10,000 to $14,999 | 0 (0.0%) | 0 (0.0%) |
| $15,000 to $19,999 | 1 (1.2%) | 0 (0.0%) |
| $20,000 to $24,999 | 3 (3.6%) | 3 (17.6%) |
| $25,000 to $34,999 | 2 (2.4%) | 4 (23.5%) |
| $35,000 to $49,999 | 12 (14.5%) | 3 (17.6%) |
| $50,000 to $74,999 | 10 (12.0%) | 3 (17.6%) |
| $75,000 to $99,999 | 26 (31.3%) | 4 (23.5%) |
| $100,000 to $149,999 | 21 (25.3%) | 0 (0.0%) |
| $150,000 or more | 8 (9.6%) | 0 (0.0%) |
| Total | 83 (100.0%) | 17 (100.0%) |
Monthly Housing Cost Tiers in Bethany borough
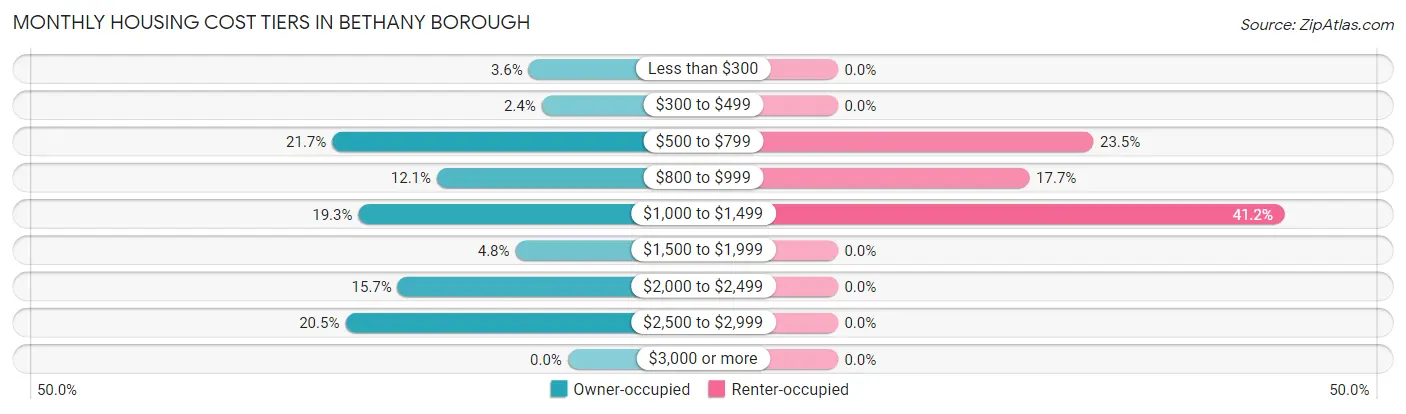
| Monthly Cost | Owner-occupied | Renter-occupied |
| Less than $300 | 3 (3.6%) | 0 (0.0%) |
| $300 to $499 | 2 (2.4%) | 0 (0.0%) |
| $500 to $799 | 18 (21.7%) | 4 (23.5%) |
| $800 to $999 | 10 (12.0%) | 3 (17.6%) |
| $1,000 to $1,499 | 16 (19.3%) | 7 (41.2%) |
| $1,500 to $1,999 | 4 (4.8%) | 0 (0.0%) |
| $2,000 to $2,499 | 13 (15.7%) | 0 (0.0%) |
| $2,500 to $2,999 | 17 (20.5%) | 0 (0.0%) |
| $3,000 or more | 0 (0.0%) | 0 (0.0%) |
| Total | 83 (100.0%) | 17 (100.0%) |
Physical Housing Characteristics in Bethany borough
Housing Structures in Bethany borough
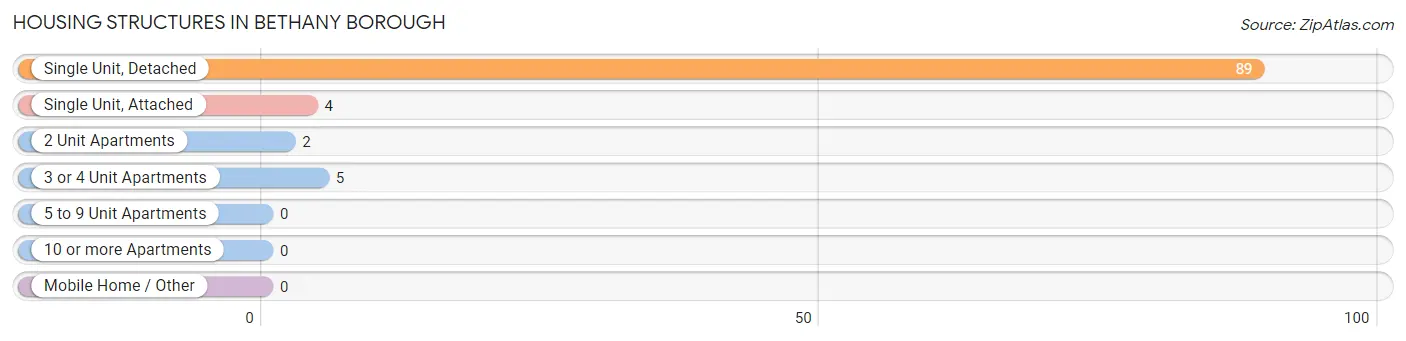
| Structure Type | # Housing Units | % Housing Units |
| Single Unit, Detached | 89 | 89.0% |
| Single Unit, Attached | 4 | 4.0% |
| 2 Unit Apartments | 2 | 2.0% |
| 3 or 4 Unit Apartments | 5 | 5.0% |
| 5 to 9 Unit Apartments | 0 | 0.0% |
| 10 or more Apartments | 0 | 0.0% |
| Mobile Home / Other | 0 | 0.0% |
| Total | 100 | 100.0% |
Housing Structures by Occupancy in Bethany borough
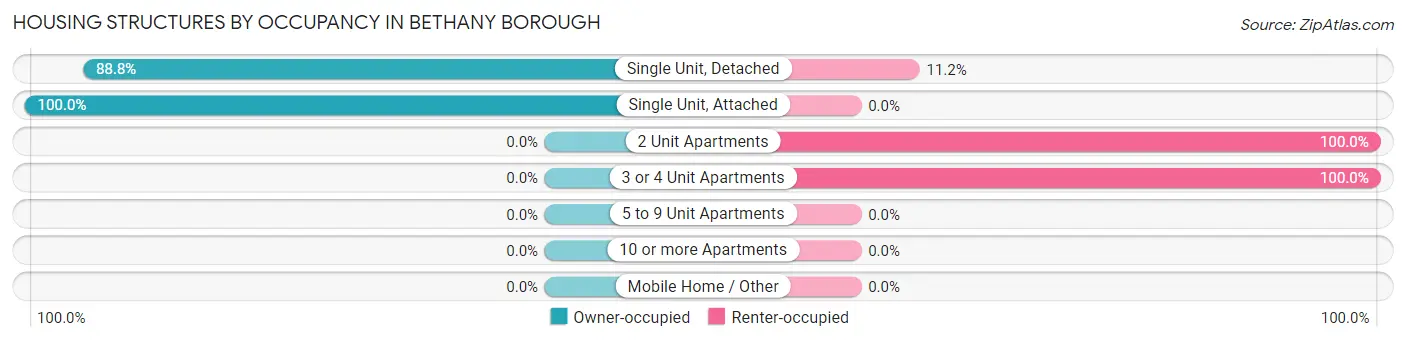
| Structure Type | Owner-occupied | Renter-occupied |
| Single Unit, Detached | 79 (88.8%) | 10 (11.2%) |
| Single Unit, Attached | 4 (100.0%) | 0 (0.0%) |
| 2 Unit Apartments | 0 (0.0%) | 2 (100.0%) |
| 3 or 4 Unit Apartments | 0 (0.0%) | 5 (100.0%) |
| 5 to 9 Unit Apartments | 0 (0.0%) | 0 (0.0%) |
| 10 or more Apartments | 0 (0.0%) | 0 (0.0%) |
| Mobile Home / Other | 0 (0.0%) | 0 (0.0%) |
| Total | 83 (83.0%) | 17 (17.0%) |
Housing Structures by Number of Rooms in Bethany borough
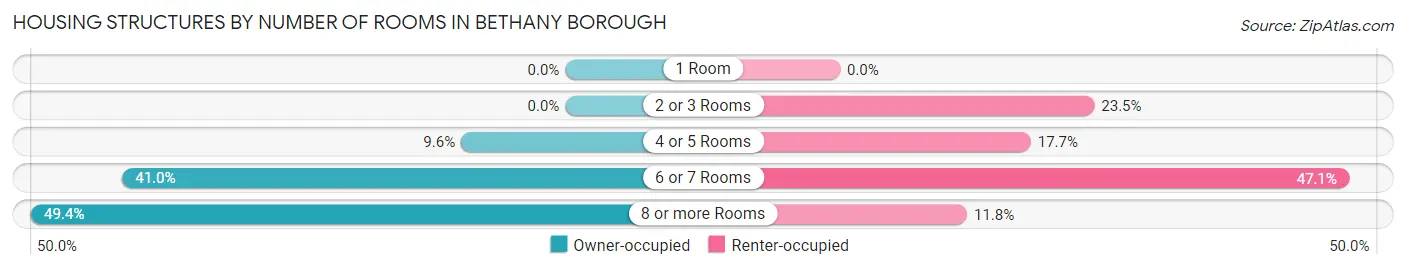
| Number of Rooms | Owner-occupied | Renter-occupied |
| 1 Room | 0 (0.0%) | 0 (0.0%) |
| 2 or 3 Rooms | 0 (0.0%) | 4 (23.5%) |
| 4 or 5 Rooms | 8 (9.6%) | 3 (17.6%) |
| 6 or 7 Rooms | 34 (41.0%) | 8 (47.1%) |
| 8 or more Rooms | 41 (49.4%) | 2 (11.8%) |
| Total | 83 (100.0%) | 17 (100.0%) |
Housing Structure by Heating Type in Bethany borough
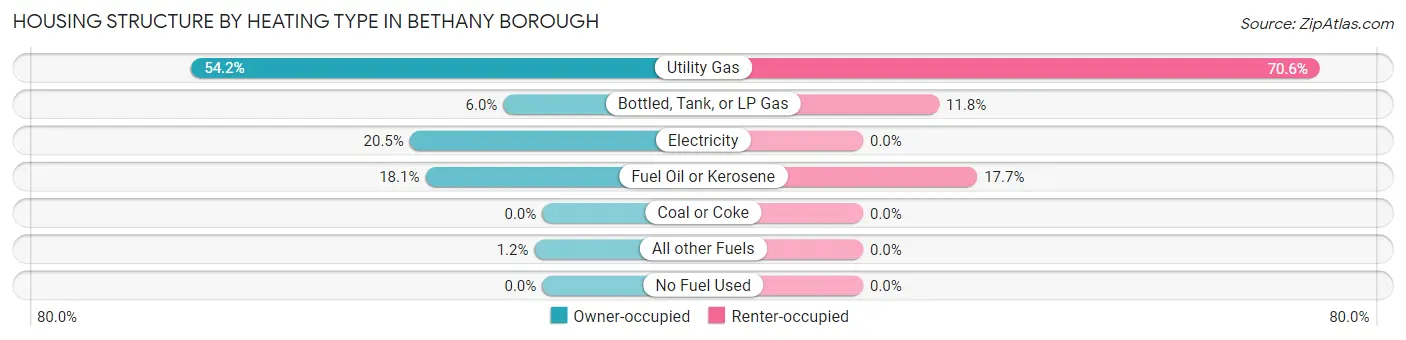
| Heating Type | Owner-occupied | Renter-occupied |
| Utility Gas | 45 (54.2%) | 12 (70.6%) |
| Bottled, Tank, or LP Gas | 5 (6.0%) | 2 (11.8%) |
| Electricity | 17 (20.5%) | 0 (0.0%) |
| Fuel Oil or Kerosene | 15 (18.1%) | 3 (17.6%) |
| Coal or Coke | 0 (0.0%) | 0 (0.0%) |
| All other Fuels | 1 (1.2%) | 0 (0.0%) |
| No Fuel Used | 0 (0.0%) | 0 (0.0%) |
| Total | 83 (100.0%) | 17 (100.0%) |
Household Vehicle Usage in Bethany borough
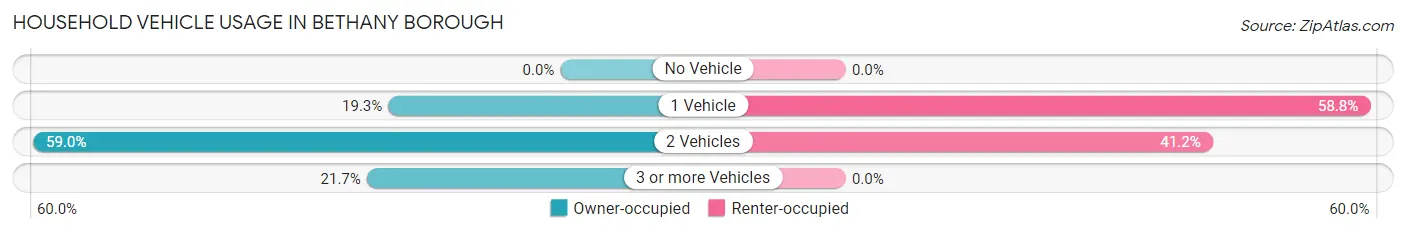
| Vehicles per Household | Owner-occupied | Renter-occupied |
| No Vehicle | 0 (0.0%) | 0 (0.0%) |
| 1 Vehicle | 16 (19.3%) | 10 (58.8%) |
| 2 Vehicles | 49 (59.0%) | 7 (41.2%) |
| 3 or more Vehicles | 18 (21.7%) | 0 (0.0%) |
| Total | 83 (100.0%) | 17 (100.0%) |
Real Estate & Mortgages in Bethany borough
Real Estate and Mortgage Overview in Bethany borough
| Characteristic | Without Mortgage | With Mortgage |
| Housing Units | 27 | 56 |
| Median Property Value | $196,900 | $300,000 |
| Median Household Income | $53,125 | $6 |
| Monthly Housing Costs | $586 | $0 |
| Real Estate Taxes | $3,143 | $0 |
Property Value by Mortgage Status in Bethany borough
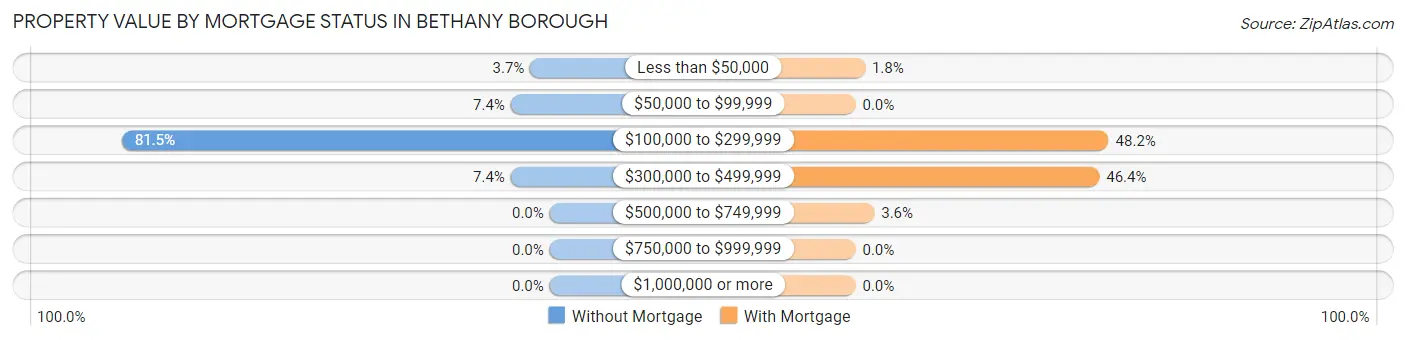
| Property Value | Without Mortgage | With Mortgage |
| Less than $50,000 | 1 (3.7%) | 1 (1.8%) |
| $50,000 to $99,999 | 2 (7.4%) | 0 (0.0%) |
| $100,000 to $299,999 | 22 (81.5%) | 27 (48.2%) |
| $300,000 to $499,999 | 2 (7.4%) | 26 (46.4%) |
| $500,000 to $749,999 | 0 (0.0%) | 2 (3.6%) |
| $750,000 to $999,999 | 0 (0.0%) | 0 (0.0%) |
| $1,000,000 or more | 0 (0.0%) | 0 (0.0%) |
| Total | 27 (100.0%) | 56 (100.0%) |
Household Income by Mortgage Status in Bethany borough
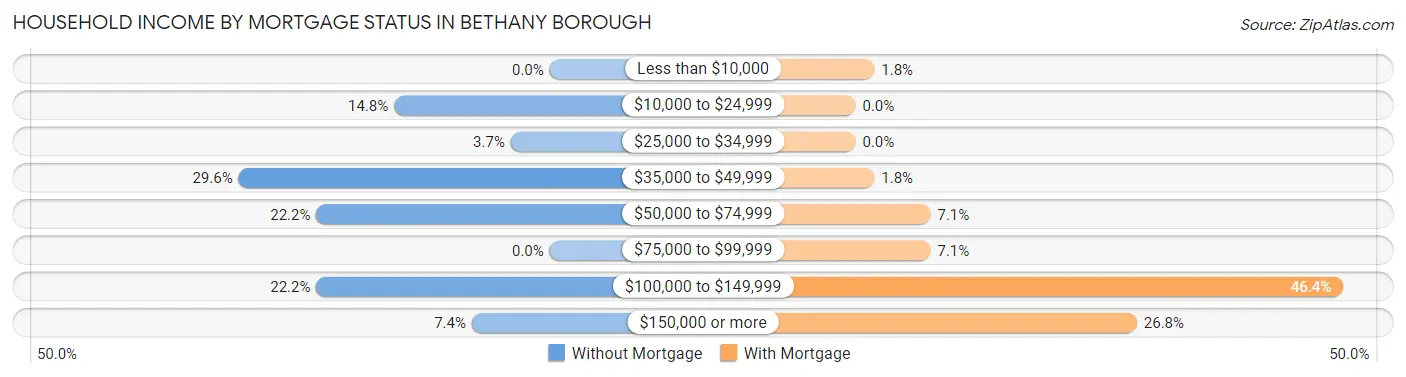
| Household Income | Without Mortgage | With Mortgage |
| Less than $10,000 | 0 (0.0%) | 1 (1.8%) |
| $10,000 to $24,999 | 4 (14.8%) | 0 (0.0%) |
| $25,000 to $34,999 | 1 (3.7%) | 0 (0.0%) |
| $35,000 to $49,999 | 8 (29.6%) | 1 (1.8%) |
| $50,000 to $74,999 | 6 (22.2%) | 4 (7.1%) |
| $75,000 to $99,999 | 0 (0.0%) | 4 (7.1%) |
| $100,000 to $149,999 | 6 (22.2%) | 26 (46.4%) |
| $150,000 or more | 2 (7.4%) | 15 (26.8%) |
| Total | 27 (100.0%) | 56 (100.0%) |
Property Value to Household Income Ratio in Bethany borough
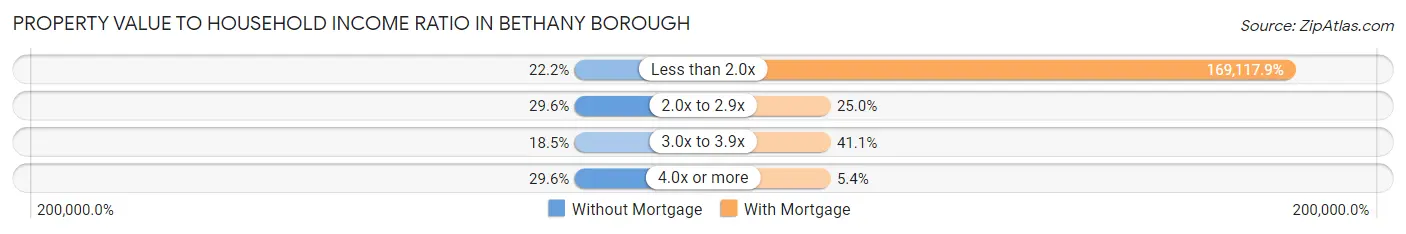
| Value-to-Income Ratio | Without Mortgage | With Mortgage |
| Less than 2.0x | 6 (22.2%) | 94,706 (169,117.9%) |
| 2.0x to 2.9x | 8 (29.6%) | 14 (25.0%) |
| 3.0x to 3.9x | 5 (18.5%) | 23 (41.1%) |
| 4.0x or more | 8 (29.6%) | 3 (5.4%) |
| Total | 27 (100.0%) | 56 (100.0%) |
Real Estate Taxes by Mortgage Status in Bethany borough
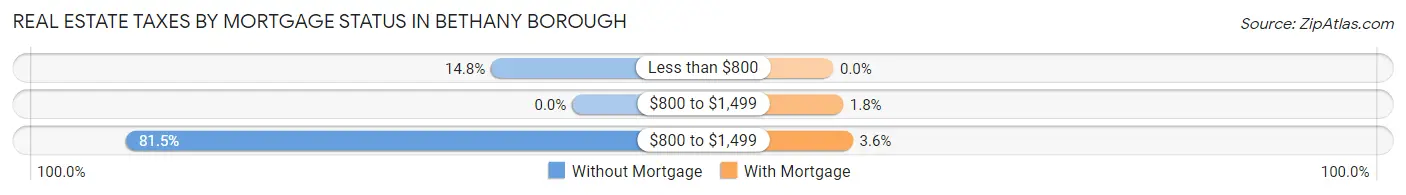
| Property Taxes | Without Mortgage | With Mortgage |
| Less than $800 | 4 (14.8%) | 0 (0.0%) |
| $800 to $1,499 | 0 (0.0%) | 1 (1.8%) |
| $800 to $1,499 | 22 (81.5%) | 2 (3.6%) |
| Total | 27 (100.0%) | 56 (100.0%) |
Health & Disability in Bethany borough
Health Insurance Coverage by Age in Bethany borough
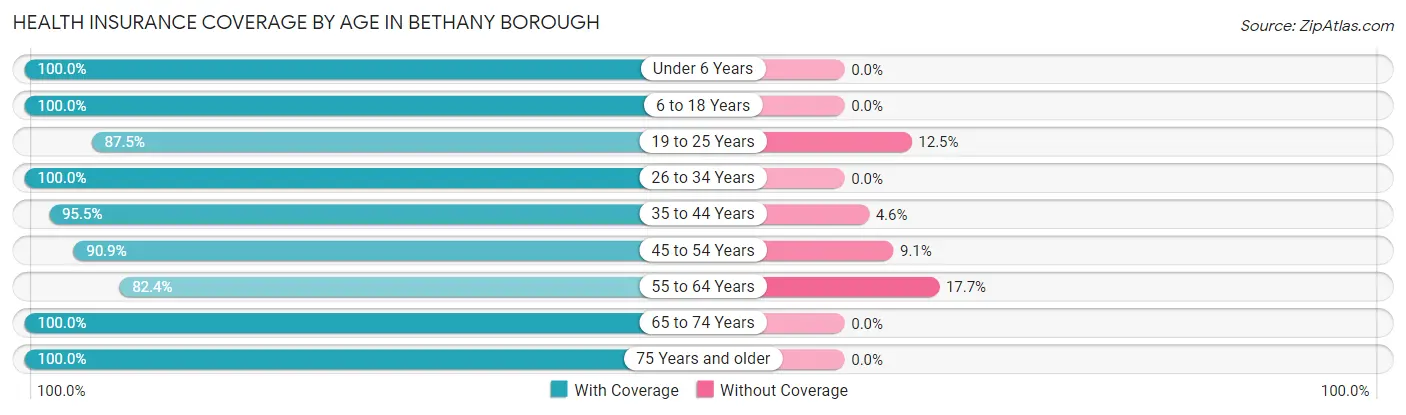
| Age Bracket | With Coverage | Without Coverage |
| Under 6 Years | 13 (100.0%) | 0 (0.0%) |
| 6 to 18 Years | 29 (100.0%) | 0 (0.0%) |
| 19 to 25 Years | 7 (87.5%) | 1 (12.5%) |
| 26 to 34 Years | 23 (100.0%) | 0 (0.0%) |
| 35 to 44 Years | 21 (95.5%) | 1 (4.5%) |
| 45 to 54 Years | 20 (90.9%) | 2 (9.1%) |
| 55 to 64 Years | 28 (82.4%) | 6 (17.6%) |
| 65 to 74 Years | 53 (100.0%) | 0 (0.0%) |
| 75 Years and older | 31 (100.0%) | 0 (0.0%) |
| Total | 225 (95.7%) | 10 (4.3%) |
Health Insurance Coverage by Citizenship Status in Bethany borough
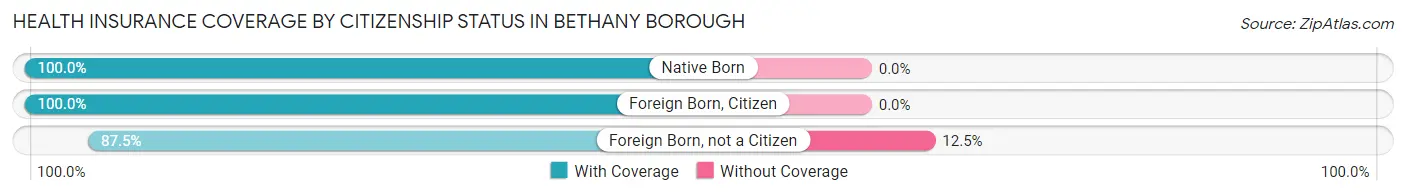
| Citizenship Status | With Coverage | Without Coverage |
| Native Born | 13 (100.0%) | 0 (0.0%) |
| Foreign Born, Citizen | 29 (100.0%) | 0 (0.0%) |
| Foreign Born, not a Citizen | 7 (87.5%) | 1 (12.5%) |
Health Insurance Coverage by Household Income in Bethany borough
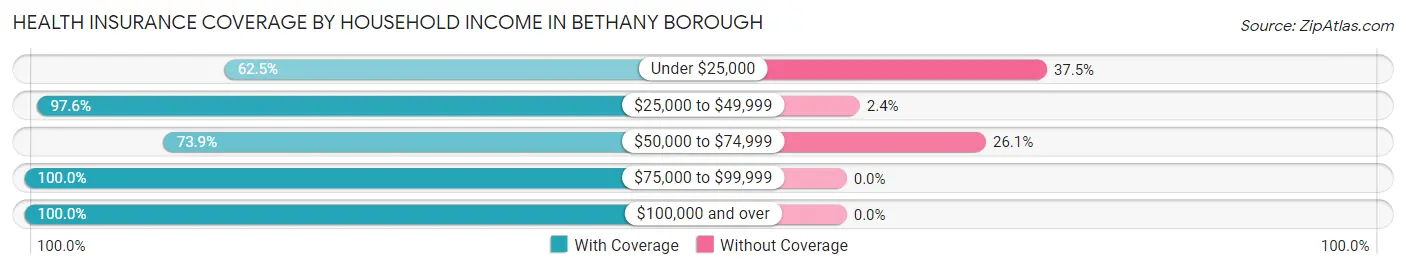
| Household Income | With Coverage | Without Coverage |
| Under $25,000 | 5 (62.5%) | 3 (37.5%) |
| $25,000 to $49,999 | 40 (97.6%) | 1 (2.4%) |
| $50,000 to $74,999 | 17 (73.9%) | 6 (26.1%) |
| $75,000 to $99,999 | 70 (100.0%) | 0 (0.0%) |
| $100,000 and over | 93 (100.0%) | 0 (0.0%) |
Public vs Private Health Insurance Coverage by Age in Bethany borough
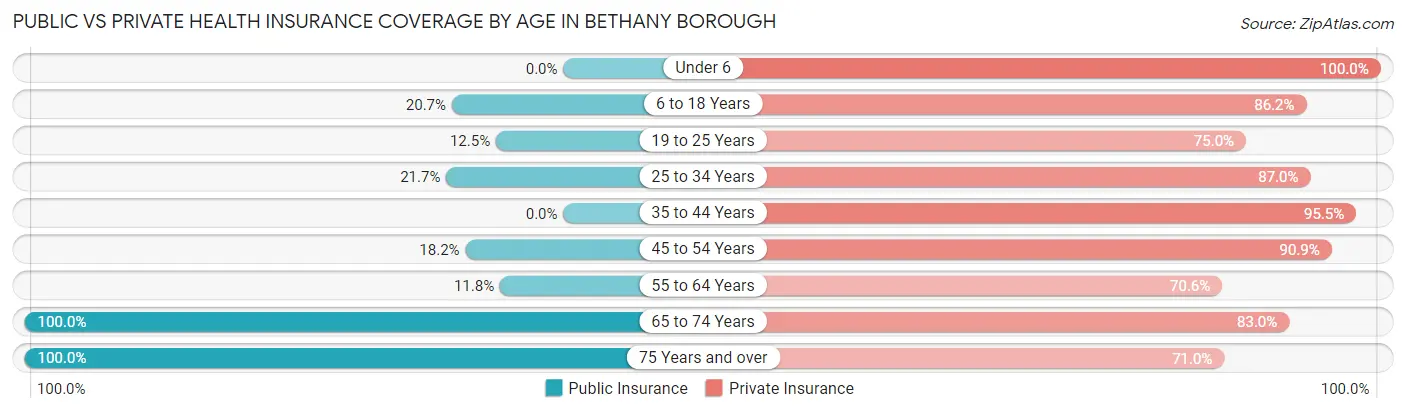
| Age Bracket | Public Insurance | Private Insurance |
| Under 6 | 0 (0.0%) | 13 (100.0%) |
| 6 to 18 Years | 6 (20.7%) | 25 (86.2%) |
| 19 to 25 Years | 1 (12.5%) | 6 (75.0%) |
| 25 to 34 Years | 5 (21.7%) | 20 (87.0%) |
| 35 to 44 Years | 0 (0.0%) | 21 (95.5%) |
| 45 to 54 Years | 4 (18.2%) | 20 (90.9%) |
| 55 to 64 Years | 4 (11.8%) | 24 (70.6%) |
| 65 to 74 Years | 53 (100.0%) | 44 (83.0%) |
| 75 Years and over | 31 (100.0%) | 22 (71.0%) |
| Total | 104 (44.3%) | 195 (83.0%) |
Disability Status by Sex by Age in Bethany borough
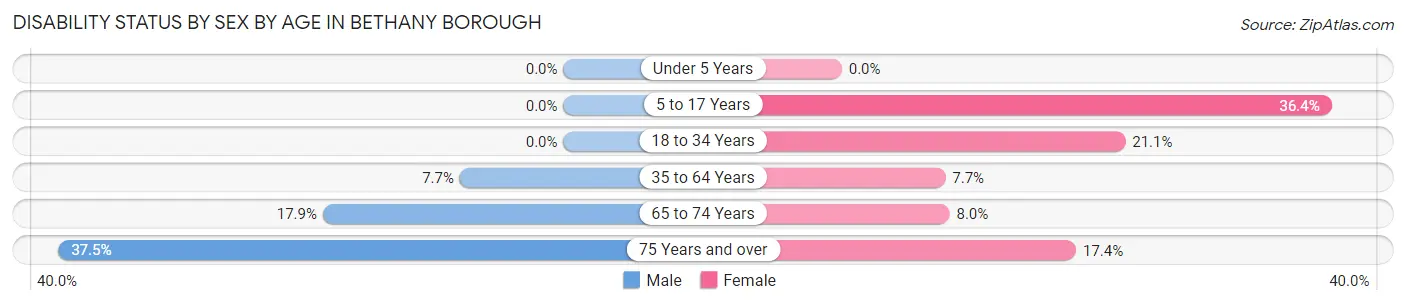
| Age Bracket | Male | Female |
| Under 5 Years | 0 (0.0%) | 0 (0.0%) |
| 5 to 17 Years | 0 (0.0%) | 4 (36.4%) |
| 18 to 34 Years | 0 (0.0%) | 4 (21.0%) |
| 35 to 64 Years | 4 (7.7%) | 2 (7.7%) |
| 65 to 74 Years | 5 (17.9%) | 2 (8.0%) |
| 75 Years and over | 3 (37.5%) | 4 (17.4%) |
Disability Class by Sex by Age in Bethany borough
Disability Class: Hearing Difficulty
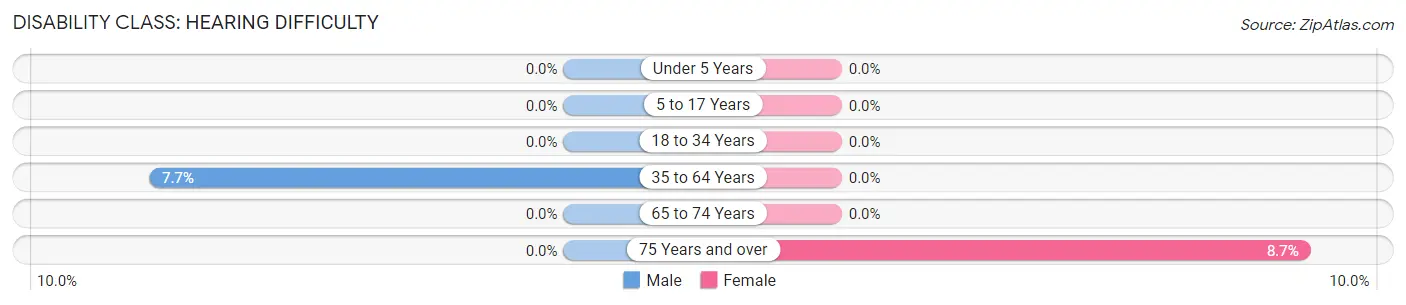
| Age Bracket | Male | Female |
| Under 5 Years | 0 (0.0%) | 0 (0.0%) |
| 5 to 17 Years | 0 (0.0%) | 0 (0.0%) |
| 18 to 34 Years | 0 (0.0%) | 0 (0.0%) |
| 35 to 64 Years | 4 (7.7%) | 0 (0.0%) |
| 65 to 74 Years | 0 (0.0%) | 0 (0.0%) |
| 75 Years and over | 0 (0.0%) | 2 (8.7%) |
Disability Class: Vision Difficulty
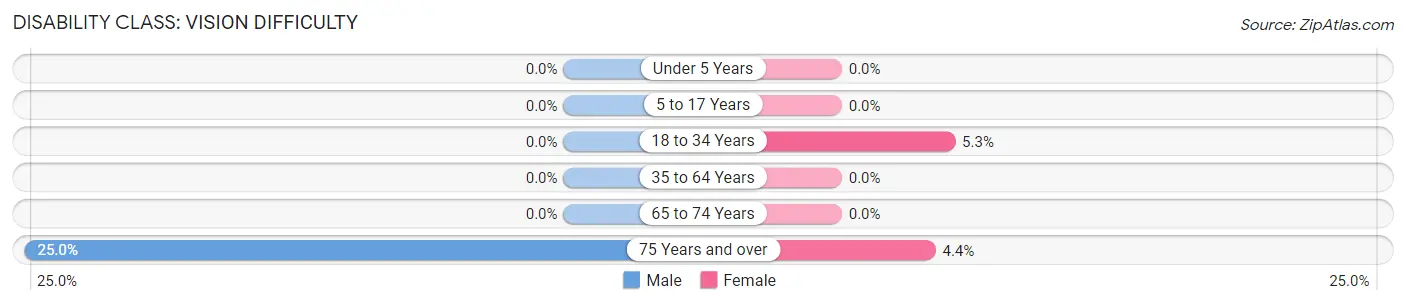
| Age Bracket | Male | Female |
| Under 5 Years | 0 (0.0%) | 0 (0.0%) |
| 5 to 17 Years | 0 (0.0%) | 0 (0.0%) |
| 18 to 34 Years | 0 (0.0%) | 1 (5.3%) |
| 35 to 64 Years | 0 (0.0%) | 0 (0.0%) |
| 65 to 74 Years | 0 (0.0%) | 0 (0.0%) |
| 75 Years and over | 2 (25.0%) | 1 (4.3%) |
Disability Class: Cognitive Difficulty
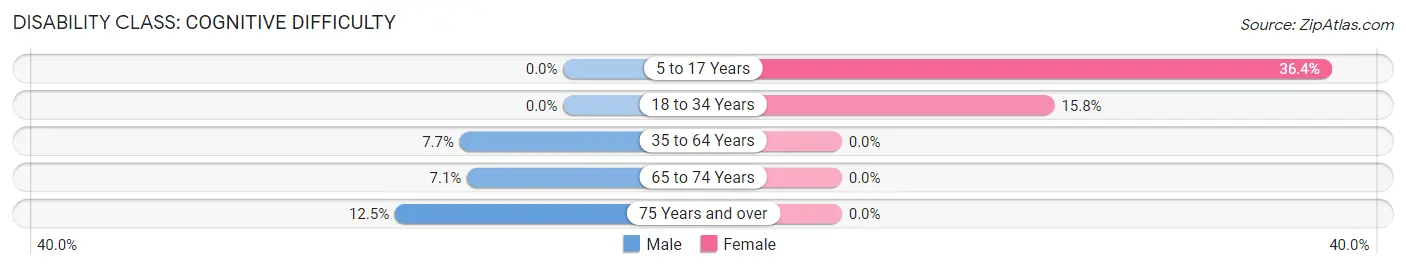
| Age Bracket | Male | Female |
| 5 to 17 Years | 0 (0.0%) | 4 (36.4%) |
| 18 to 34 Years | 0 (0.0%) | 3 (15.8%) |
| 35 to 64 Years | 4 (7.7%) | 0 (0.0%) |
| 65 to 74 Years | 2 (7.1%) | 0 (0.0%) |
| 75 Years and over | 1 (12.5%) | 0 (0.0%) |
Disability Class: Ambulatory Difficulty
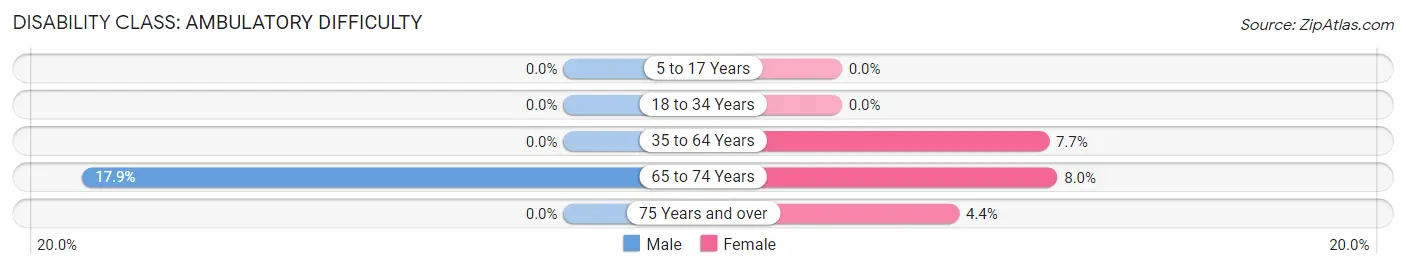
| Age Bracket | Male | Female |
| 5 to 17 Years | 0 (0.0%) | 0 (0.0%) |
| 18 to 34 Years | 0 (0.0%) | 0 (0.0%) |
| 35 to 64 Years | 0 (0.0%) | 2 (7.7%) |
| 65 to 74 Years | 5 (17.9%) | 2 (8.0%) |
| 75 Years and over | 0 (0.0%) | 1 (4.3%) |
Disability Class: Self-Care Difficulty
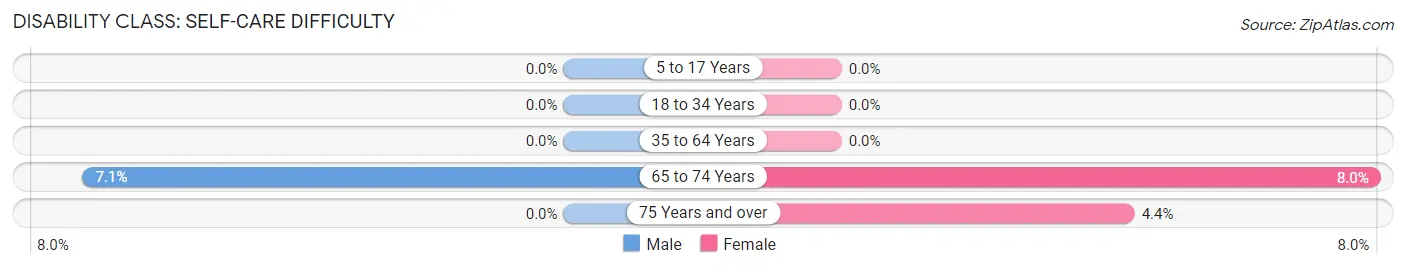
| Age Bracket | Male | Female |
| 5 to 17 Years | 0 (0.0%) | 0 (0.0%) |
| 18 to 34 Years | 0 (0.0%) | 0 (0.0%) |
| 35 to 64 Years | 0 (0.0%) | 0 (0.0%) |
| 65 to 74 Years | 2 (7.1%) | 2 (8.0%) |
| 75 Years and over | 0 (0.0%) | 1 (4.3%) |
Technology Access in Bethany borough
Computing Device Access in Bethany borough
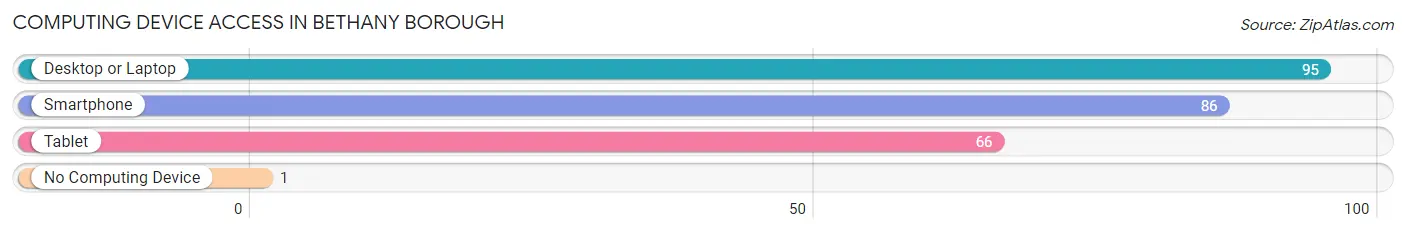
| Device Type | # Households | % Households |
| Desktop or Laptop | 95 | 95.0% |
| Smartphone | 86 | 86.0% |
| Tablet | 66 | 66.0% |
| No Computing Device | 1 | 1.0% |
| Total | 100 | 100.0% |
Internet Access in Bethany borough
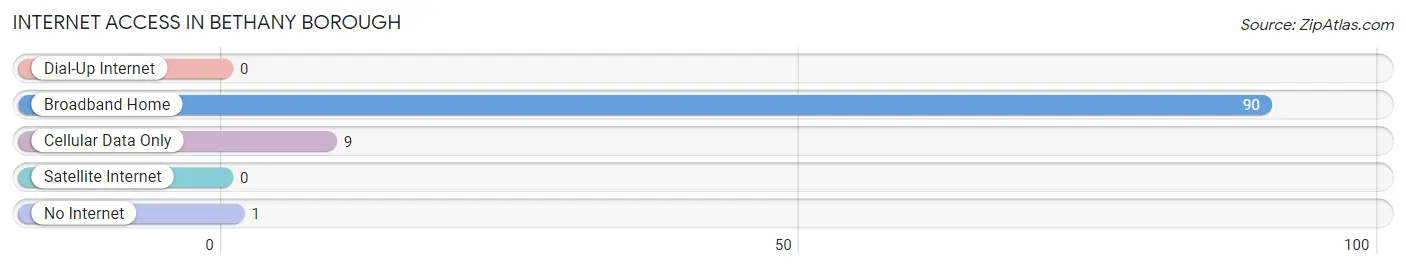
| Internet Type | # Households | % Households |
| Dial-Up Internet | 0 | 0.0% |
| Broadband Home | 90 | 90.0% |
| Cellular Data Only | 9 | 9.0% |
| Satellite Internet | 0 | 0.0% |
| No Internet | 1 | 1.0% |
| Total | 100 | 100.0% |
Bethany borough Summary
Bethany Borough is a small borough located in the state of Pennsylvania. It is situated in the southwestern corner of the state, in the county of Westmoreland. The borough is located approximately 25 miles southeast of Pittsburgh and is part of the Pittsburgh Metropolitan Statistical Area. As of the 2010 census, the population of Bethany Borough was 1,845.
History
Bethany Borough was founded in 1845 by a group of settlers from the nearby town of Greensburg. The settlers were looking for a place to build a new community and chose the area that is now Bethany Borough. The town was named after the biblical town of Bethany, which was the home of Mary, Martha, and Lazarus. The first settlers of Bethany were mostly farmers and the town quickly grew to become a thriving agricultural community.
In the late 19th century, the town began to expand and develop. The first post office was established in 1876 and the first school was built in 1877. The town also had a number of churches, stores, and other businesses. By the early 20th century, Bethany had become a popular destination for tourists and vacationers.
Geography
Bethany Borough is located in the southwestern corner of Pennsylvania, in the county of Westmoreland. The borough is situated in the Laurel Highlands region of the state and is surrounded by the towns of Greensburg, Jeannette, and Irwin. The borough is located approximately 25 miles southeast of Pittsburgh and is part of the Pittsburgh Metropolitan Statistical Area.
The borough covers an area of 1.2 square miles and is located at an elevation of 1,068 feet. The terrain of the borough is mostly flat with some rolling hills. The borough is located in a humid continental climate zone and experiences four distinct seasons.
Economy
The economy of Bethany Borough is largely based on agriculture and tourism. The borough is home to a number of farms and agricultural businesses, including dairy farms, fruit farms, and vegetable farms. The borough also has a number of small businesses, including restaurants, retail stores, and service providers.
The borough is also a popular destination for tourists and vacationers. The borough is home to a number of attractions, including the Bethany Historical Society Museum, the Bethany Community Park, and the Bethany Community Center. The borough also hosts a number of annual events, including the Bethany Fall Festival and the Bethany Summer Festival.
Demographics
As of the 2010 census, the population of Bethany Borough was 1,845. The racial makeup of the borough was 97.3% White, 0.9% African American, 0.2% Native American, 0.3% Asian, and 1.3% from other races. The median household income in the borough was $45,938 and the median family income was $54,844. The per capita income in the borough was $21,945.
Conclusion
Bethany Borough is a small borough located in the southwestern corner of Pennsylvania. The borough was founded in 1845 by a group of settlers from the nearby town of Greensburg and has since grown to become a thriving agricultural community. The borough is home to a number of farms and agricultural businesses, as well as a number of small businesses and attractions. The population of Bethany Borough was 1,845 as of the 2010 census and the median household income was $45,938.
Common Questions
What is Per Capita Income in Bethany borough?
Per Capita income in Bethany borough is $37,675.
What is the Median Family Income in Bethany borough?
Median Family Income in Bethany borough is $93,897.
What is the Median Household income in Bethany borough?
Median Household Income in Bethany borough is $92,647.
What is Income or Wage Gap in Bethany borough?
Income or Wage Gap in Bethany borough is 43.6%.
Women in Bethany borough earn 56.4 cents for every dollar earned by a man.
What is Inequality or Gini Index in Bethany borough?
Inequality or Gini Index in Bethany borough is 0.30.
What is the Total Population of Bethany borough?
Total Population of Bethany borough is 235.
What is the Total Male Population of Bethany borough?
Total Male Population of Bethany borough is 122.
What is the Total Female Population of Bethany borough?
Total Female Population of Bethany borough is 113.
What is the Ratio of Males per 100 Females in Bethany borough?
There are 107.96 Males per 100 Females in Bethany borough.
What is the Ratio of Females per 100 Males in Bethany borough?
There are 92.62 Females per 100 Males in Bethany borough.
What is the Median Population Age in Bethany borough?
Median Population Age in Bethany borough is 55.1 Years.
What is the Average Family Size in Bethany borough
Average Family Size in Bethany borough is 2.7 People.
What is the Average Household Size in Bethany borough
Average Household Size in Bethany borough is 2.4 People.
How Large is the Labor Force in Bethany borough?
There are 108 People in the Labor Forcein in Bethany borough.
What is the Percentage of People in the Labor Force in Bethany borough?
54.8% of People are in the Labor Force in Bethany borough.
What is the Unemployment Rate in Bethany borough?
Unemployment Rate in Bethany borough is 8.3%.