Zip Codes with the Highest Percentage of Population with a Degree in Education in Pennsylvania
RELATED REPORTS & OPTIONS
Education
Pennsylvania
Compare Zip Codes
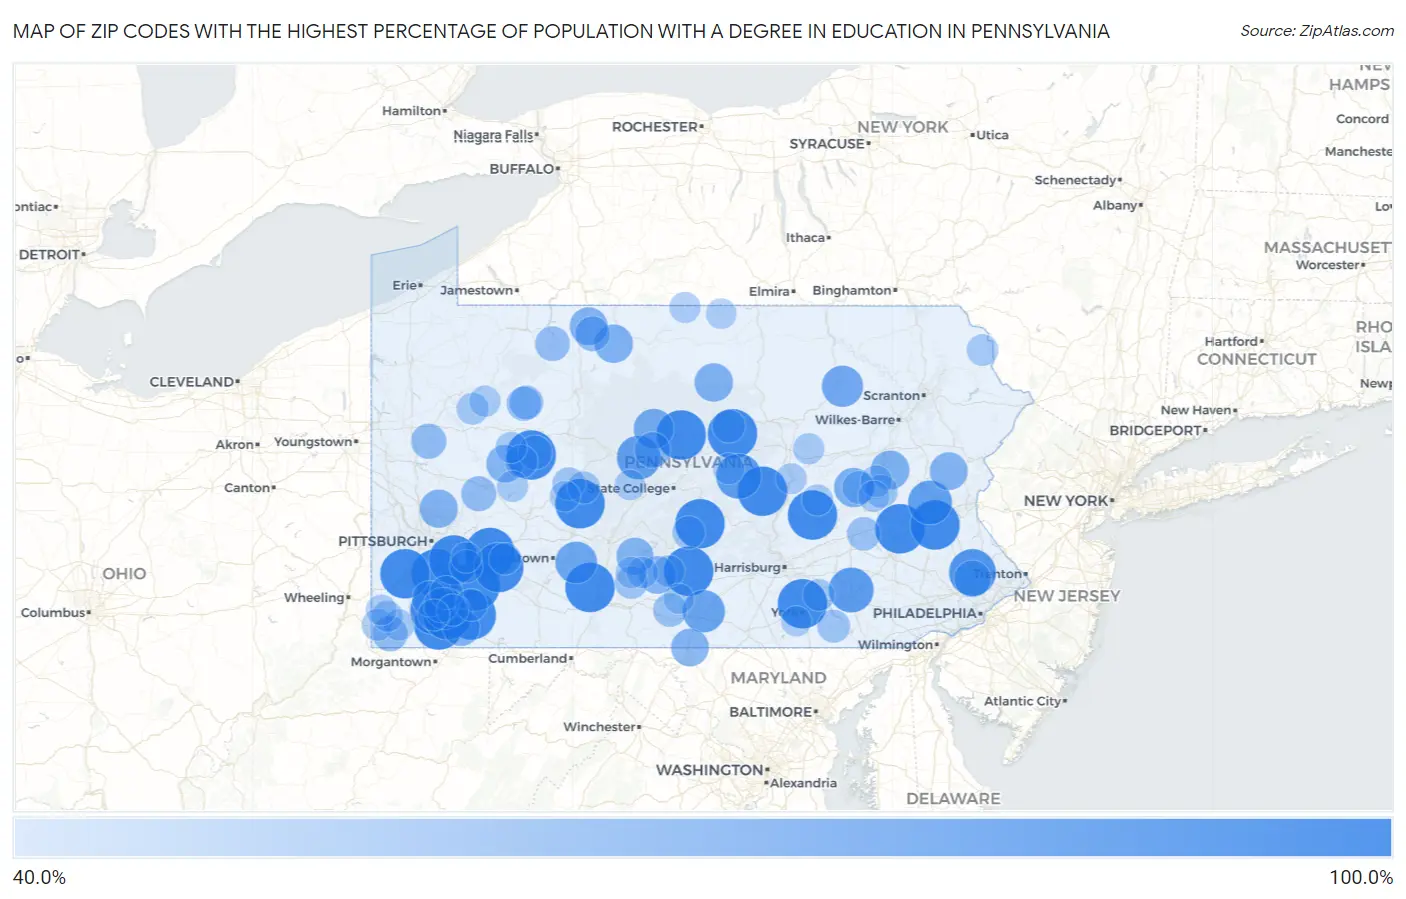
Map of Zip Codes with the Highest Percentage of Population with a Degree in Education in Pennsylvania
40.0%
100.0%
Zip Codes with the Highest Percentage of Population with a Degree in Education in Pennsylvania
| Zip Code | % Graduates | vs State | vs National | |
| 1. | 15351 | 100.0% | 13.1%(+86.9)#1 | 11.1%(+88.9)#21 |
| 2. | 17978 | 100.0% | 13.1%(+86.9)#2 | 11.1%(+88.9)#30 |
| 3. | 15433 | 100.0% | 13.1%(+86.9)#3 | 11.1%(+88.9)#33 |
| 4. | 15020 | 100.0% | 13.1%(+86.9)#4 | 11.1%(+88.9)#54 |
| 5. | 15624 | 100.0% | 13.1%(+86.9)#5 | 11.1%(+88.9)#79 |
| 6. | 15465 | 100.0% | 13.1%(+86.9)#6 | 11.1%(+88.9)#81 |
| 7. | 15612 | 100.0% | 13.1%(+86.9)#7 | 11.1%(+88.9)#87 |
| 8. | 17318 | 100.0% | 13.1%(+86.9)#8 | 11.1%(+88.9)#101 |
| 9. | 17029 | 100.0% | 13.1%(+86.9)#9 | 11.1%(+88.9)#115 |
| 10. | 15539 | 100.0% | 13.1%(+86.9)#10 | 11.1%(+88.9)#147 |
| 11. | 15047 | 100.0% | 13.1%(+86.9)#11 | 11.1%(+88.9)#156 |
| 12. | 15420 | 100.0% | 13.1%(+86.9)#12 | 11.1%(+88.9)#157 |
| 13. | 17748 | 100.0% | 13.1%(+86.9)#13 | 11.1%(+88.9)#174 |
| 14. | 19564 | 100.0% | 13.1%(+86.9)#14 | 11.1%(+88.9)#179 |
| 15. | 18046 | 100.0% | 13.1%(+86.9)#15 | 11.1%(+88.9)#182 |
| 16. | 17217 | 100.0% | 13.1%(+86.9)#16 | 11.1%(+88.9)#186 |
| 17. | 17861 | 100.0% | 13.1%(+86.9)#17 | 11.1%(+88.9)#192 |
| 18. | 15435 | 100.0% | 13.1%(+86.9)#18 | 11.1%(+88.9)#206 |
| 19. | 15347 | 100.0% | 13.1%(+86.9)#19 | 11.1%(+88.9)#217 |
| 20. | 16675 | 100.0% | 13.1%(+86.9)#20 | 11.1%(+88.9)#219 |
| 21. | 16864 | 100.0% | 13.1%(+86.9)#21 | 11.1%(+88.9)#224 |
| 22. | 15638 | 100.0% | 13.1%(+86.9)#22 | 11.1%(+88.9)#253 |
| 23. | 15776 | 100.0% | 13.1%(+86.9)#23 | 11.1%(+88.9)#287 |
| 24. | 18936 | 91.7% | 13.1%(+78.6)#24 | 11.1%(+80.7)#318 |
| 25. | 17885 | 86.7% | 13.1%(+73.6)#25 | 11.1%(+75.6)#345 |
| 26. | 17606 | 85.8% | 13.1%(+72.7)#26 | 11.1%(+74.8)#351 |
| 27. | 18065 | 83.3% | 13.1%(+70.2)#27 | 11.1%(+72.3)#365 |
| 28. | 16847 | 82.4% | 13.1%(+69.2)#28 | 11.1%(+71.3)#373 |
| 29. | 17254 | 78.3% | 13.1%(+65.2)#29 | 11.1%(+67.2)#409 |
| 30. | 15930 | 76.6% | 13.1%(+63.5)#30 | 11.1%(+65.6)#432 |
| 31. | 15413 | 75.4% | 13.1%(+62.3)#31 | 11.1%(+64.4)#444 |
| 32. | 18632 | 75.0% | 13.1%(+61.9)#32 | 11.1%(+63.9)#446 |
| 33. | 16871 | 71.4% | 13.1%(+58.3)#33 | 11.1%(+60.4)#496 |
| 34. | 17935 | 69.1% | 13.1%(+56.0)#34 | 11.1%(+58.1)#523 |
| 35. | 18254 | 67.9% | 13.1%(+54.8)#35 | 11.1%(+56.9)#541 |
| 36. | 16724 | 66.7% | 13.1%(+53.6)#36 | 11.1%(+55.6)#574 |
| 37. | 17769 | 66.7% | 13.1%(+53.6)#37 | 11.1%(+55.6)#579 |
| 38. | 15007 | 66.0% | 13.1%(+52.9)#38 | 11.1%(+54.9)#587 |
| 39. | 16732 | 65.2% | 13.1%(+52.1)#39 | 11.1%(+54.2)#606 |
| 40. | 18331 | 64.8% | 13.1%(+51.7)#40 | 11.1%(+53.8)#612 |
| 41. | 17263 | 64.5% | 13.1%(+51.4)#41 | 11.1%(+53.4)#623 |
| 42. | 17253 | 64.0% | 13.1%(+50.9)#42 | 11.1%(+52.9)#642 |
| 43. | 16253 | 63.6% | 13.1%(+50.5)#43 | 11.1%(+52.6)#651 |
| 44. | 16638 | 63.0% | 13.1%(+49.9)#44 | 11.1%(+51.9)#664 |
| 45. | 15416 | 62.4% | 13.1%(+49.3)#45 | 11.1%(+51.3)#683 |
| 46. | 19477 | 61.4% | 13.1%(+48.3)#46 | 11.1%(+50.3)#706 |
| 47. | 15358 | 58.4% | 13.1%(+45.3)#47 | 11.1%(+47.3)#799 |
| 48. | 16859 | 58.3% | 13.1%(+45.2)#48 | 11.1%(+47.3)#802 |
| 49. | 15341 | 57.1% | 13.1%(+44.0)#49 | 11.1%(+46.1)#836 |
| 50. | 16035 | 57.1% | 13.1%(+44.0)#50 | 11.1%(+46.1)#846 |
| 51. | 16212 | 56.4% | 13.1%(+43.3)#51 | 11.1%(+45.4)#872 |
| 52. | 16726 | 55.8% | 13.1%(+42.7)#52 | 11.1%(+44.8)#892 |
| 53. | 16333 | 55.6% | 13.1%(+42.4)#53 | 11.1%(+44.5)#900 |
| 54. | 15444 | 55.1% | 13.1%(+42.0)#54 | 11.1%(+44.0)#917 |
| 55. | 16217 | 53.8% | 13.1%(+40.7)#55 | 11.1%(+42.8)#972 |
| 56. | 15730 | 53.7% | 13.1%(+40.5)#56 | 11.1%(+42.6)#981 |
| 57. | 15828 | 53.1% | 13.1%(+40.0)#57 | 11.1%(+42.1)#1,003 |
| 58. | 17224 | 52.4% | 13.1%(+39.3)#58 | 11.1%(+41.4)#1,036 |
| 59. | 19559 | 52.4% | 13.1%(+39.3)#59 | 11.1%(+41.3)#1,039 |
| 60. | 15412 | 51.5% | 13.1%(+38.4)#60 | 11.1%(+40.5)#1,076 |
| 61. | 17309 | 50.4% | 13.1%(+37.3)#61 | 11.1%(+39.3)#1,128 |
| 62. | 17982 | 50.0% | 13.1%(+36.9)#62 | 11.1%(+38.9)#1,175 |
| 63. | 16633 | 50.0% | 13.1%(+36.9)#63 | 11.1%(+38.9)#1,178 |
| 64. | 15778 | 50.0% | 13.1%(+36.9)#64 | 11.1%(+38.9)#1,184 |
| 65. | 17054 | 50.0% | 13.1%(+36.9)#65 | 11.1%(+38.9)#1,189 |
| 66. | 15721 | 50.0% | 13.1%(+36.9)#66 | 11.1%(+38.9)#1,215 |
| 67. | 17949 | 50.0% | 13.1%(+36.9)#67 | 11.1%(+38.9)#1,220 |
| 68. | 17779 | 50.0% | 13.1%(+36.9)#68 | 11.1%(+38.9)#1,221 |
| 69. | 15625 | 50.0% | 13.1%(+36.9)#69 | 11.1%(+38.9)#1,235 |
| 70. | 15753 | 48.4% | 13.1%(+35.3)#70 | 11.1%(+37.3)#1,312 |
| 71. | 15455 | 48.1% | 13.1%(+35.0)#71 | 11.1%(+37.1)#1,328 |
| 72. | 17249 | 47.4% | 13.1%(+34.3)#72 | 11.1%(+36.3)#1,371 |
| 73. | 15620 | 47.2% | 13.1%(+34.1)#73 | 11.1%(+36.2)#1,381 |
| 74. | 16319 | 47.1% | 13.1%(+34.0)#74 | 11.1%(+36.1)#1,388 |
| 75. | 17550 | 46.9% | 13.1%(+33.8)#75 | 11.1%(+35.8)#1,401 |
| 76. | 15422 | 46.7% | 13.1%(+33.6)#76 | 11.1%(+35.6)#1,417 |
| 77. | 18220 | 46.7% | 13.1%(+33.6)#77 | 11.1%(+35.6)#1,420 |
| 78. | 15380 | 46.3% | 13.1%(+33.2)#78 | 11.1%(+35.3)#1,452 |
| 79. | 18469 | 46.3% | 13.1%(+33.2)#79 | 11.1%(+35.2)#1,459 |
| 80. | 16621 | 45.9% | 13.1%(+32.8)#80 | 11.1%(+34.9)#1,482 |
| 81. | 16224 | 45.9% | 13.1%(+32.8)#81 | 11.1%(+34.8)#1,488 |
| 82. | 15325 | 45.8% | 13.1%(+32.7)#82 | 11.1%(+34.8)#1,490 |
| 83. | 16820 | 45.5% | 13.1%(+32.3)#83 | 11.1%(+34.4)#1,514 |
| 84. | 16244 | 45.5% | 13.1%(+32.3)#84 | 11.1%(+34.4)#1,519 |
| 85. | 15359 | 45.5% | 13.1%(+32.3)#85 | 11.1%(+34.4)#1,522 |
| 86. | 16678 | 45.4% | 13.1%(+32.2)#86 | 11.1%(+34.3)#1,536 |
| 87. | 17953 | 45.2% | 13.1%(+32.1)#87 | 11.1%(+34.1)#1,552 |
| 88. | 17836 | 45.0% | 13.1%(+31.9)#88 | 11.1%(+33.9)#1,567 |
| 89. | 17884 | 45.0% | 13.1%(+31.9)#89 | 11.1%(+33.9)#1,569 |
| 90. | 16364 | 44.9% | 13.1%(+31.8)#90 | 11.1%(+33.9)#1,577 |
| 91. | 15337 | 44.8% | 13.1%(+31.7)#91 | 11.1%(+33.8)#1,581 |
| 92. | 16941 | 44.4% | 13.1%(+31.3)#92 | 11.1%(+33.4)#1,624 |
| 93. | 17876 | 44.0% | 13.1%(+30.9)#93 | 11.1%(+33.0)#1,660 |
| 94. | 15377 | 44.0% | 13.1%(+30.8)#94 | 11.1%(+32.9)#1,671 |
| 95. | 16677 | 43.5% | 13.1%(+30.4)#95 | 11.1%(+32.4)#1,711 |
| 96. | 15724 | 43.4% | 13.1%(+30.3)#96 | 11.1%(+32.4)#1,714 |
| 97. | 15692 | 43.4% | 13.1%(+30.3)#97 | 11.1%(+32.3)#1,715 |
| 98. | 16928 | 43.3% | 13.1%(+30.2)#98 | 11.1%(+32.3)#1,727 |
| 99. | 17221 | 42.9% | 13.1%(+29.7)#99 | 11.1%(+31.8)#1,769 |
| 100. | 17371 | 42.9% | 13.1%(+29.7)#100 | 11.1%(+31.8)#1,774 |
Common Questions
What are the Top 10 Zip Codes with the Highest Percentage of Population with a Degree in Education in Pennsylvania?
Top 10 Zip Codes with the Highest Percentage of Population with a Degree in Education in Pennsylvania are:
What zip code has the Highest Percentage of Population with a Degree in Education in Pennsylvania?
15351 has the Highest Percentage of Population with a Degree in Education in Pennsylvania with 100.0%.
What is the Percentage of Population with a Degree in Education in the State of Pennsylvania?
Percentage of Population with a Degree in Education in Pennsylvania is 13.1%.
What is the Percentage of Population with a Degree in Education in the United States?
Percentage of Population with a Degree in Education in the United States is 11.1%.