Saltillo borough, PA Map & Demographics
Saltillo borough Overview
$24,763
PER CAPITA INCOME
$71,071
AVG FAMILY INCOME
$70,114
AVG HOUSEHOLD INCOME
52.3%
WAGE / INCOME GAP [ % ]
47.7¢/ $1
WAGE / INCOME GAP [ $ ]
0.26
INEQUALITY / GINI INDEX
459
TOTAL POPULATION
251
MALE POPULATION
208
FEMALE POPULATION
120.67
MALES / 100 FEMALES
82.87
FEMALES / 100 MALES
28.7
MEDIAN AGE
3.7
AVG FAMILY SIZE
2.9
AVG HOUSEHOLD SIZE
229
LABOR FORCE [ PEOPLE ]
66.6%
PERCENT IN LABOR FORCE
0.4%
UNEMPLOYMENT RATE
Income in Saltillo borough
Income Overview in Saltillo borough
Per Capita Income in Saltillo borough is $24,763, while median incomes of families and households are $71,071 and $70,114 respectively.
| Characteristic | Number | Measure |
| Per Capita Income | 459 | $24,763 |
| Median Family Income | 112 | $71,071 |
| Mean Family Income | 112 | $79,036 |
| Median Household Income | 156 | $70,114 |
| Mean Household Income | 156 | $71,478 |
| Income Deficit | 112 | $0 |
| Wage / Income Gap (%) | 459 | 52.25% |
| Wage / Income Gap ($) | 459 | 47.75¢ per $1 |
| Gini / Inequality Index | 459 | 0.26 |
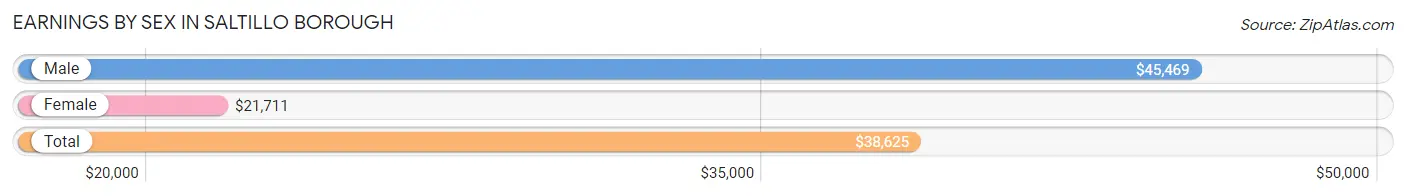
Earnings by Sex in Saltillo borough
Average Earnings in Saltillo borough are $38,625, $45,469 for men and $21,711 for women, a difference of 52.2%.
| Sex | Number | Average Earnings |
| Male | 129 (54.9%) | $45,469 |
| Female | 106 (45.1%) | $21,711 |
| Total | 235 (100.0%) | $38,625 |
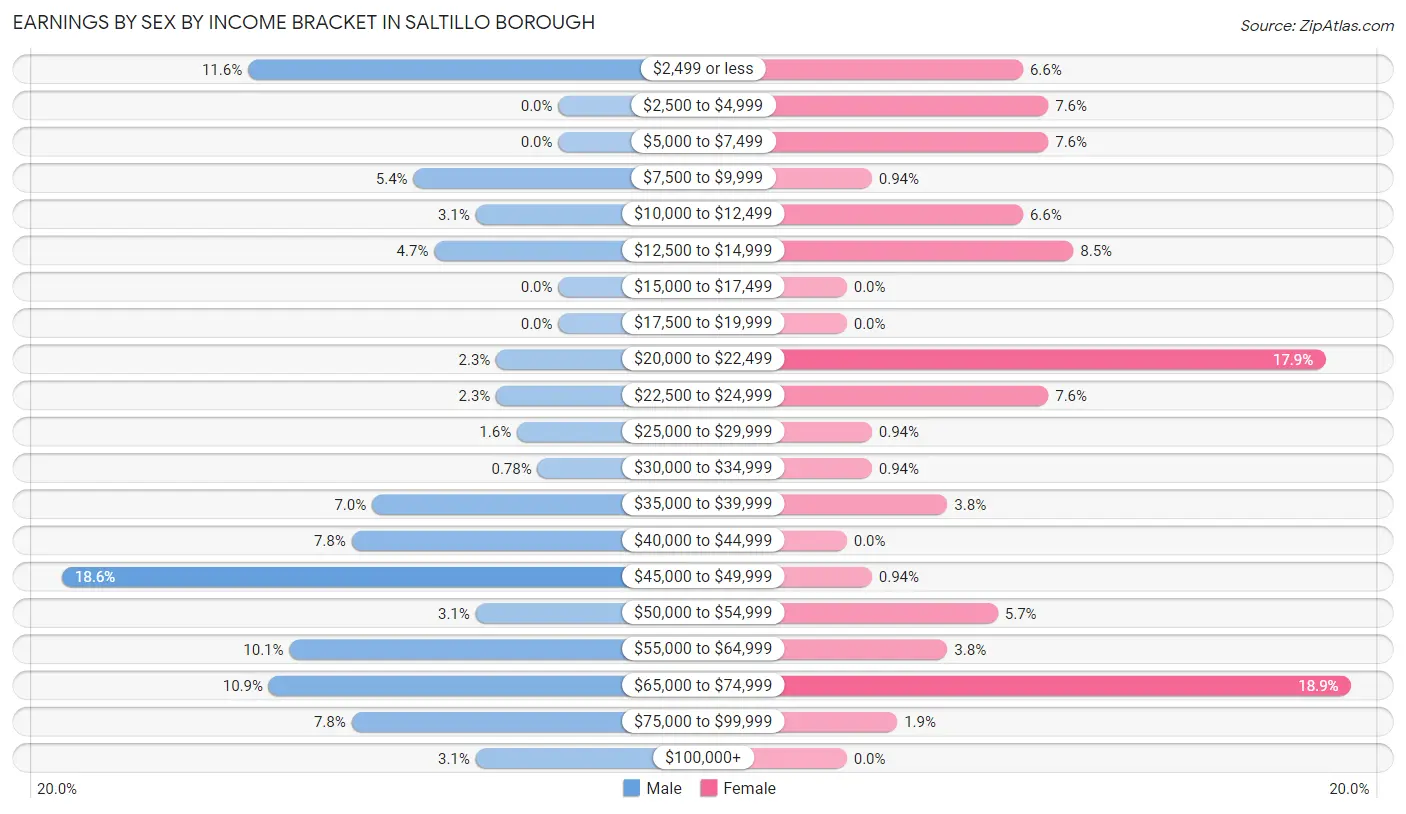
Earnings by Sex by Income Bracket in Saltillo borough
The most common earnings brackets in Saltillo borough are $45,000 to $49,999 for men (24 | 18.6%) and $65,000 to $74,999 for women (20 | 18.9%).
| Income | Male | Female |
| $2,499 or less | 15 (11.6%) | 7 (6.6%) |
| $2,500 to $4,999 | 0 (0.0%) | 8 (7.5%) |
| $5,000 to $7,499 | 0 (0.0%) | 8 (7.5%) |
| $7,500 to $9,999 | 7 (5.4%) | 1 (0.9%) |
| $10,000 to $12,499 | 4 (3.1%) | 7 (6.6%) |
| $12,500 to $14,999 | 6 (4.6%) | 9 (8.5%) |
| $15,000 to $17,499 | 0 (0.0%) | 0 (0.0%) |
| $17,500 to $19,999 | 0 (0.0%) | 0 (0.0%) |
| $20,000 to $22,499 | 3 (2.3%) | 19 (17.9%) |
| $22,500 to $24,999 | 3 (2.3%) | 8 (7.5%) |
| $25,000 to $29,999 | 2 (1.5%) | 1 (0.9%) |
| $30,000 to $34,999 | 1 (0.8%) | 1 (0.9%) |
| $35,000 to $39,999 | 9 (7.0%) | 4 (3.8%) |
| $40,000 to $44,999 | 10 (7.7%) | 0 (0.0%) |
| $45,000 to $49,999 | 24 (18.6%) | 1 (0.9%) |
| $50,000 to $54,999 | 4 (3.1%) | 6 (5.7%) |
| $55,000 to $64,999 | 13 (10.1%) | 4 (3.8%) |
| $65,000 to $74,999 | 14 (10.8%) | 20 (18.9%) |
| $75,000 to $99,999 | 10 (7.7%) | 2 (1.9%) |
| $100,000+ | 4 (3.1%) | 0 (0.0%) |
| Total | 129 (100.0%) | 106 (100.0%) |
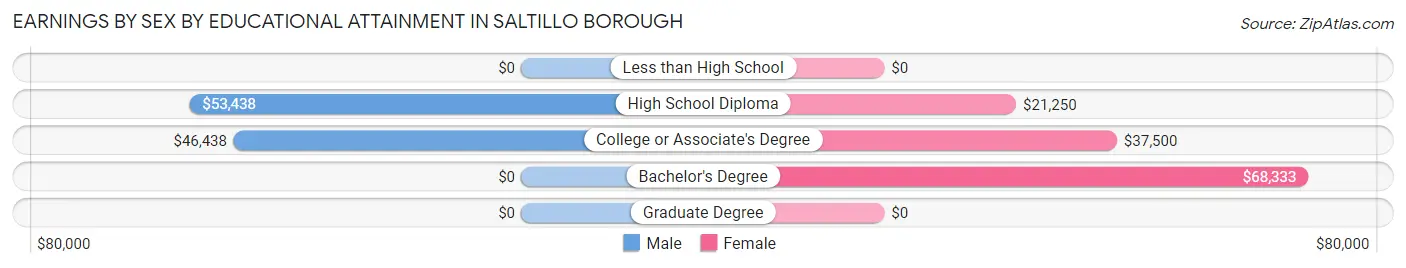
Earnings by Sex by Educational Attainment in Saltillo borough
| Educational Attainment | Male Income | Female Income |
| Less than High School | - | - |
| High School Diploma | $53,438 | $21,250 |
| College or Associate's Degree | $46,438 | $37,500 |
| Bachelor's Degree | - | - |
| Graduate Degree | - | - |
| Total | $46,429 | $0 |
Family Income in Saltillo borough
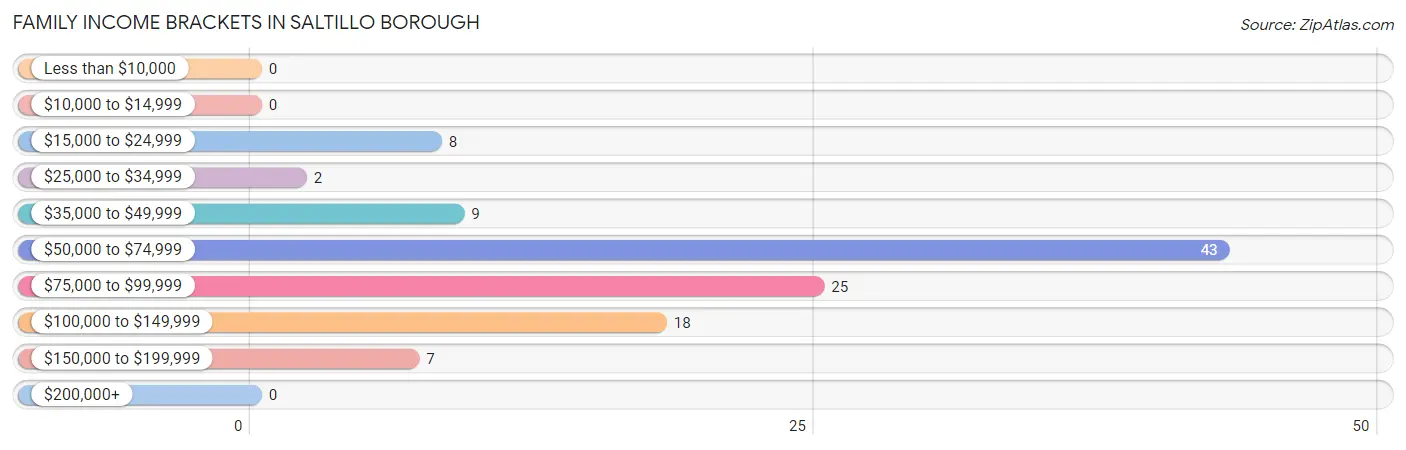
Family Income Brackets in Saltillo borough
According to the Saltillo borough family income data, there are 43 families falling into the $50,000 to $74,999 income range, which is the most common income bracket and makes up 38.4% of all families.
| Income Bracket | # Families | % Families |
| Less than $10,000 | 0 | 0.0% |
| $10,000 to $14,999 | 0 | 0.0% |
| $15,000 to $24,999 | 8 | 7.1% |
| $25,000 to $34,999 | 2 | 1.8% |
| $35,000 to $49,999 | 9 | 8.0% |
| $50,000 to $74,999 | 43 | 38.4% |
| $75,000 to $99,999 | 25 | 22.3% |
| $100,000 to $149,999 | 18 | 16.1% |
| $150,000 to $199,999 | 7 | 6.3% |
| $200,000+ | 0 | 0.0% |
Family Income by Famaliy Size in Saltillo borough
3-person families (15 | 13.4%) account for the highest median family income in Saltillo borough with $84,375 per family, while 2-person families (47 | 42.0%) have the highest median income of $35,625 per family member.
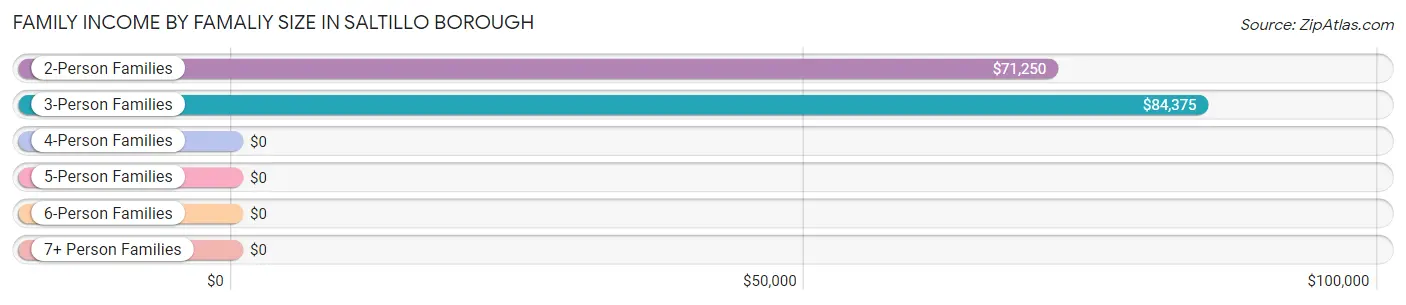
| Income Bracket | # Families | Median Income |
| 2-Person Families | 47 (42.0%) | $71,250 |
| 3-Person Families | 15 (13.4%) | $84,375 |
| 4-Person Families | 16 (14.3%) | $0 |
| 5-Person Families | 21 (18.8%) | $0 |
| 6-Person Families | 9 (8.0%) | $0 |
| 7+ Person Families | 4 (3.6%) | $0 |
| Total | 112 (100.0%) | $71,071 |
Family Income by Number of Earners in Saltillo borough
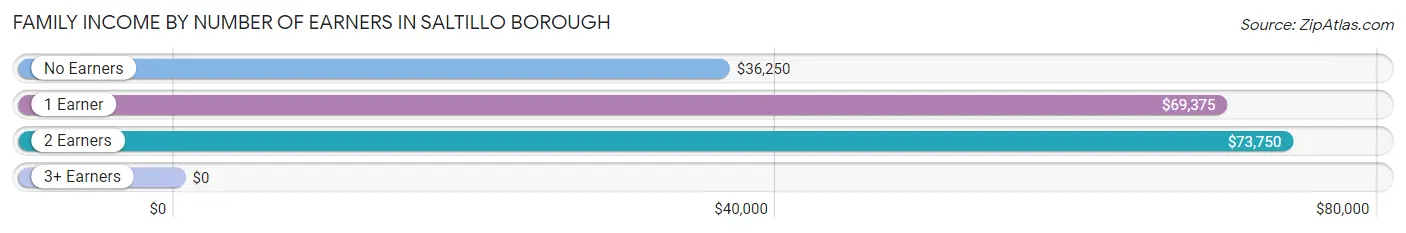
| Number of Earners | # Families | Median Income |
| No Earners | 20 (17.9%) | $36,250 |
| 1 Earner | 16 (14.3%) | $69,375 |
| 2 Earners | 66 (58.9%) | $73,750 |
| 3+ Earners | 10 (8.9%) | $0 |
| Total | 112 (100.0%) | $71,071 |
Household Income in Saltillo borough
Household Income Brackets in Saltillo borough
With 68 households falling in the category, the $50,000 to $74,999 income range is the most frequent in Saltillo borough, accounting for 43.6% of all households.
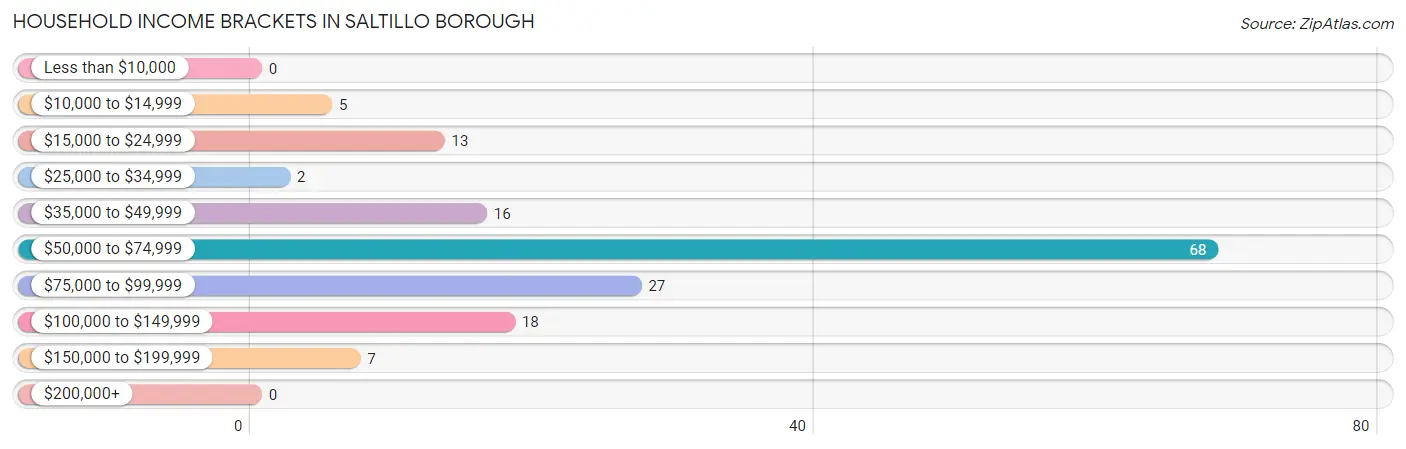
| Income Bracket | # Households | % Households |
| Less than $10,000 | 0 | 0.0% |
| $10,000 to $14,999 | 5 | 3.2% |
| $15,000 to $24,999 | 13 | 8.3% |
| $25,000 to $34,999 | 2 | 1.3% |
| $35,000 to $49,999 | 16 | 10.3% |
| $50,000 to $74,999 | 68 | 43.6% |
| $75,000 to $99,999 | 27 | 17.3% |
| $100,000 to $149,999 | 18 | 11.5% |
| $150,000 to $199,999 | 7 | 4.5% |
| $200,000+ | 0 | 0.0% |
Household Income by Householder Age in Saltillo borough
The median household income in Saltillo borough is $70,114, with the highest median household income of $73,500 found in the 45 to 64 years age bracket for the primary householder. A total of 76 households (48.7%) fall into this category. Meanwhile, the 15 to 24 years age bracket for the primary householder has the lowest median household income of $0, with 7 households (4.5%) in this group.
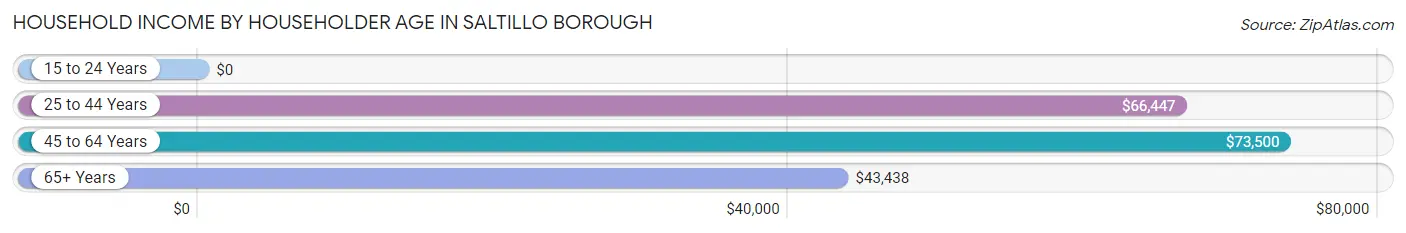
| Income Bracket | # Households | Median Income |
| 15 to 24 Years | 7 (4.5%) | $0 |
| 25 to 44 Years | 50 (32.1%) | $66,447 |
| 45 to 64 Years | 76 (48.7%) | $73,500 |
| 65+ Years | 23 (14.7%) | $43,438 |
| Total | 156 (100.0%) | $70,114 |
Poverty in Saltillo borough
Income Below Poverty by Sex and Age in Saltillo borough
With 11.2% poverty level for males and 11.1% for females among the residents of Saltillo borough, 25 to 34 year old males and under 5 year old females are the most vulnerable to poverty, with 28 males (47.5%) and 11 females (68.8%) in their respective age groups living below the poverty level.
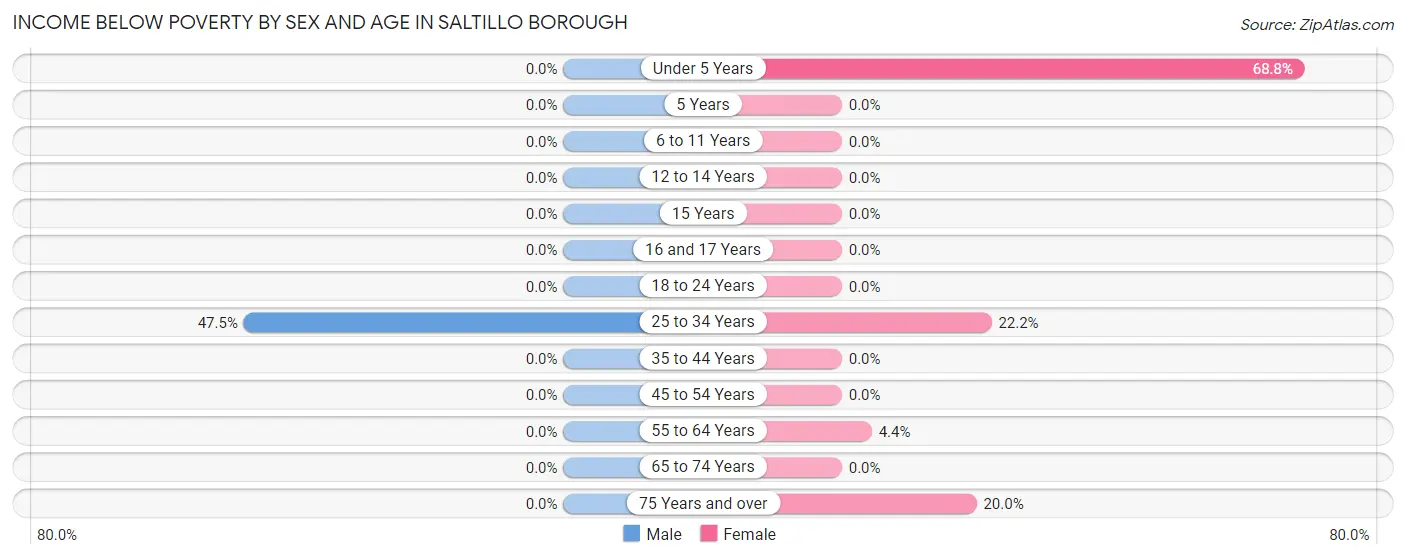
| Age Bracket | Male | Female |
| Under 5 Years | 0 (0.0%) | 11 (68.8%) |
| 5 Years | 0 (0.0%) | 0 (0.0%) |
| 6 to 11 Years | 0 (0.0%) | 0 (0.0%) |
| 12 to 14 Years | 0 (0.0%) | 0 (0.0%) |
| 15 Years | 0 (0.0%) | 0 (0.0%) |
| 16 and 17 Years | 0 (0.0%) | 0 (0.0%) |
| 18 to 24 Years | 0 (0.0%) | 0 (0.0%) |
| 25 to 34 Years | 28 (47.5%) | 8 (22.2%) |
| 35 to 44 Years | 0 (0.0%) | 0 (0.0%) |
| 45 to 54 Years | 0 (0.0%) | 0 (0.0%) |
| 55 to 64 Years | 0 (0.0%) | 2 (4.4%) |
| 65 to 74 Years | 0 (0.0%) | 0 (0.0%) |
| 75 Years and over | 0 (0.0%) | 2 (20.0%) |
| Total | 28 (11.2%) | 23 (11.1%) |
Income Above Poverty by Sex and Age in Saltillo borough
According to the poverty statistics in Saltillo borough, males aged under 5 years and females aged 6 to 11 years are the age groups that are most secure financially, with 100.0% of males and 100.0% of females in these age groups living above the poverty line.
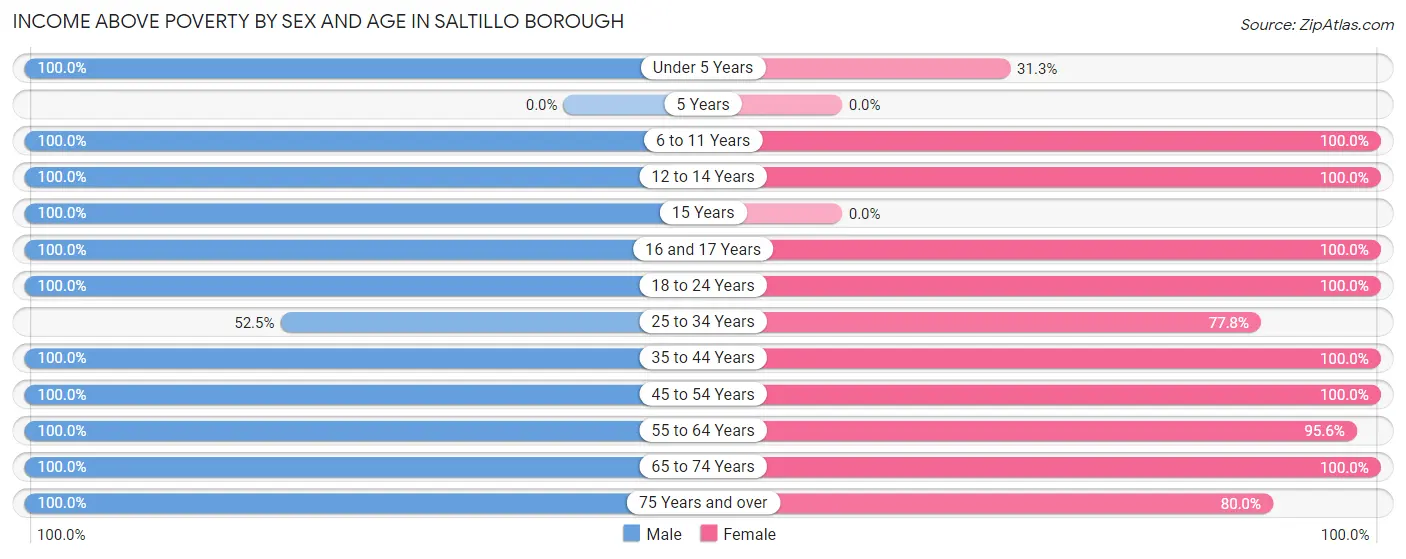
| Age Bracket | Male | Female |
| Under 5 Years | 48 (100.0%) | 5 (31.2%) |
| 5 Years | 0 (0.0%) | 0 (0.0%) |
| 6 to 11 Years | 6 (100.0%) | 32 (100.0%) |
| 12 to 14 Years | 7 (100.0%) | 3 (100.0%) |
| 15 Years | 3 (100.0%) | 0 (0.0%) |
| 16 and 17 Years | 7 (100.0%) | 13 (100.0%) |
| 18 to 24 Years | 26 (100.0%) | 17 (100.0%) |
| 25 to 34 Years | 31 (52.5%) | 28 (77.8%) |
| 35 to 44 Years | 12 (100.0%) | 12 (100.0%) |
| 45 to 54 Years | 31 (100.0%) | 14 (100.0%) |
| 55 to 64 Years | 30 (100.0%) | 43 (95.6%) |
| 65 to 74 Years | 14 (100.0%) | 10 (100.0%) |
| 75 Years and over | 8 (100.0%) | 8 (80.0%) |
| Total | 223 (88.8%) | 185 (88.9%) |
Income Below Poverty Among Married-Couple Families in Saltillo borough
The poverty statistics for married-couple families in Saltillo borough show that 8.3% or 8 of the total 97 families live below the poverty line. Families with 1 or 2 children have the highest poverty rate of 33.3%, comprising of 8 families. On the other hand, families with no children have the lowest poverty rate of 0.0%, which includes 0 families.
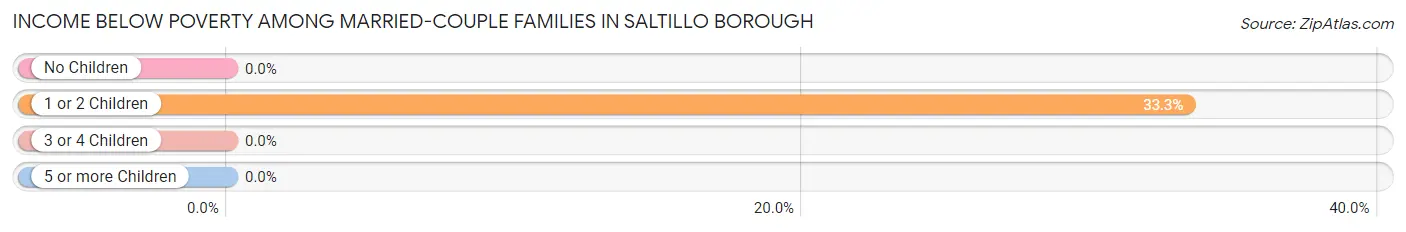
| Children | Above Poverty | Below Poverty |
| No Children | 42 (100.0%) | 0 (0.0%) |
| 1 or 2 Children | 16 (66.7%) | 8 (33.3%) |
| 3 or 4 Children | 31 (100.0%) | 0 (0.0%) |
| 5 or more Children | 0 (0.0%) | 0 (0.0%) |
| Total | 89 (91.7%) | 8 (8.3%) |
Income Below Poverty Among Single-Parent Households in Saltillo borough
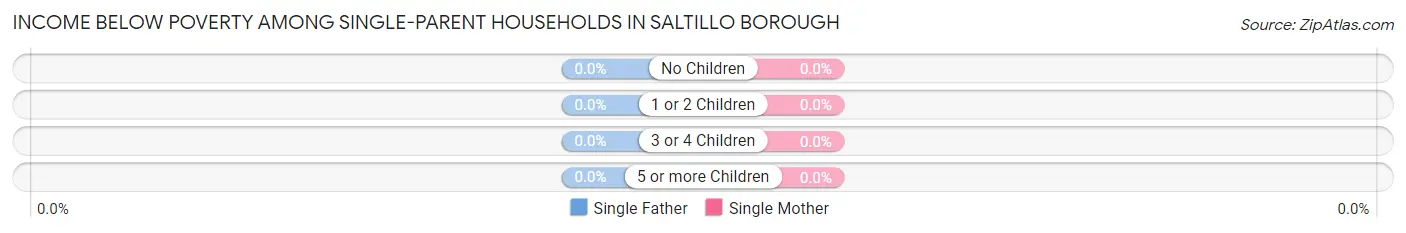
| Children | Single Father | Single Mother |
| No Children | 0 (0.0%) | 0 (0.0%) |
| 1 or 2 Children | 0 (0.0%) | 0 (0.0%) |
| 3 or 4 Children | 0 (0.0%) | 0 (0.0%) |
| 5 or more Children | 0 (0.0%) | 0 (0.0%) |
| Total | 0 (0.0%) | 0 (0.0%) |
Income Below Poverty Among Married-Couple vs Single-Parent Households in Saltillo borough
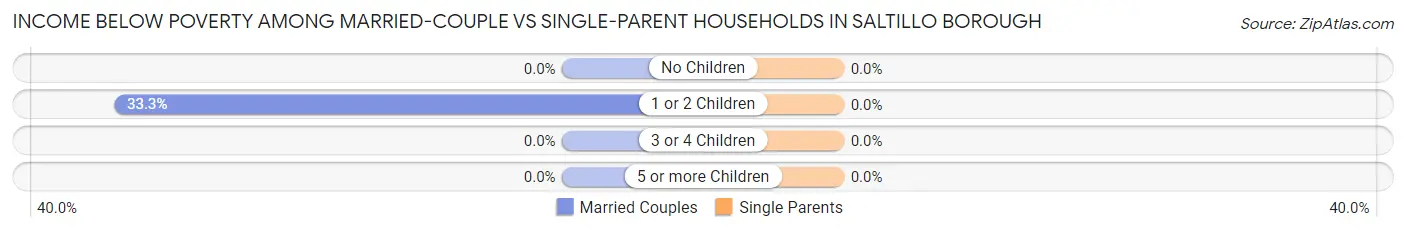
| Children | Married-Couple Families | Single-Parent Households |
| No Children | 0 (0.0%) | 0 (0.0%) |
| 1 or 2 Children | 8 (33.3%) | 0 (0.0%) |
| 3 or 4 Children | 0 (0.0%) | 0 (0.0%) |
| 5 or more Children | 0 (0.0%) | 0 (0.0%) |
| Total | 8 (8.3%) | 0 (0.0%) |
Race in Saltillo borough
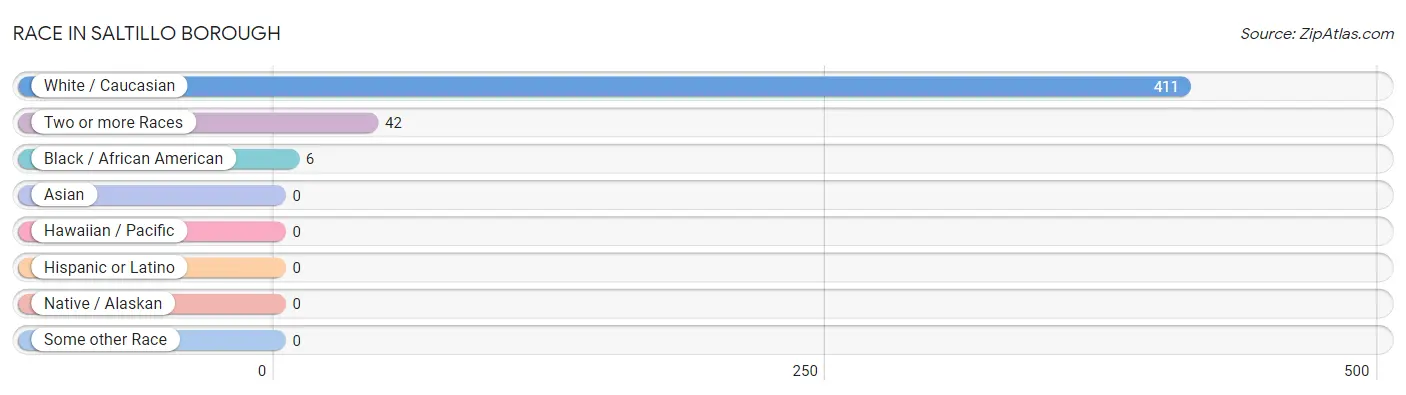
The most populous races in Saltillo borough are White / Caucasian (411 | 89.5%), Two or more Races (42 | 9.1%), and Black / African American (6 | 1.3%).
| Race | # Population | % Population |
| Asian | 0 | 0.0% |
| Black / African American | 6 | 1.3% |
| Hawaiian / Pacific | 0 | 0.0% |
| Hispanic or Latino | 0 | 0.0% |
| Native / Alaskan | 0 | 0.0% |
| White / Caucasian | 411 | 89.5% |
| Two or more Races | 42 | 9.1% |
| Some other Race | 0 | 0.0% |
| Total | 459 | 100.0% |
Ancestry in Saltillo borough
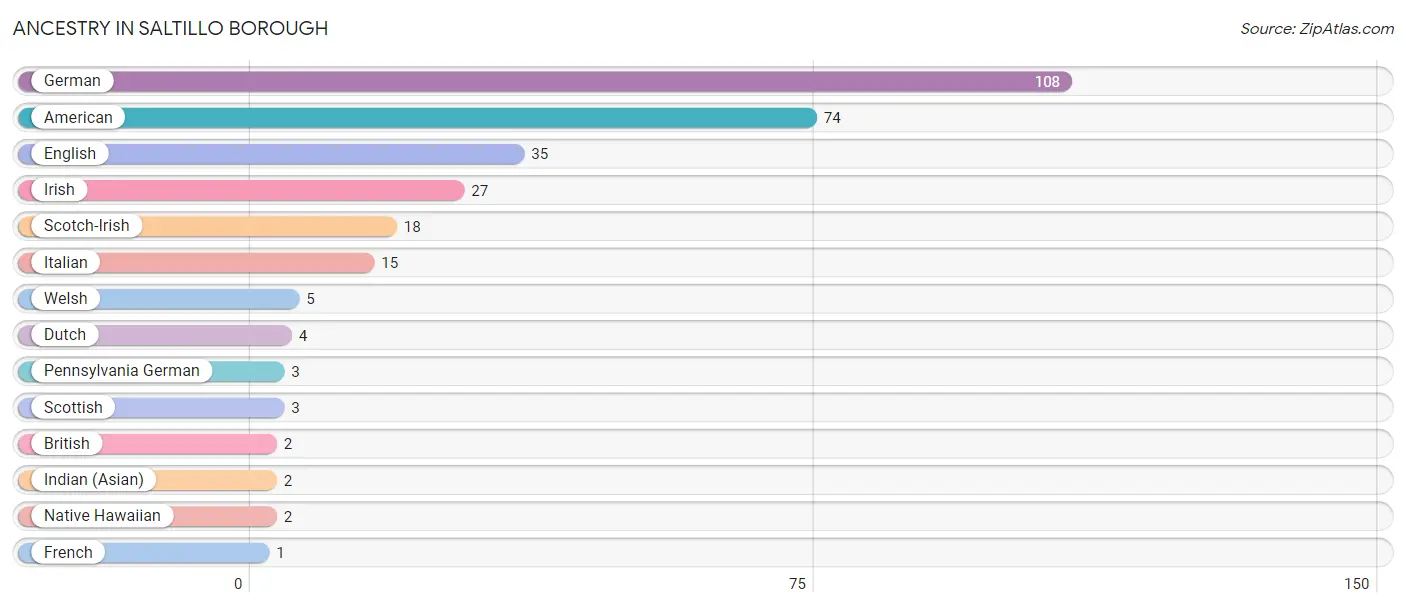
The most populous ancestries reported in Saltillo borough are German (108 | 23.5%), American (74 | 16.1%), English (35 | 7.6%), Irish (27 | 5.9%), and Scotch-Irish (18 | 3.9%), together accounting for 57.1% of all Saltillo borough residents.
| Ancestry | # Population | % Population |
| American | 74 | 16.1% |
| British | 2 | 0.4% |
| Dutch | 4 | 0.9% |
| English | 35 | 7.6% |
| French | 1 | 0.2% |
| German | 108 | 23.5% |
| Indian (Asian) | 2 | 0.4% |
| Irish | 27 | 5.9% |
| Italian | 15 | 3.3% |
| Native Hawaiian | 2 | 0.4% |
| Pennsylvania German | 3 | 0.6% |
| Scotch-Irish | 18 | 3.9% |
| Scottish | 3 | 0.6% |
| Welsh | 5 | 1.1% | View All 14 Rows |
Immigrants in Saltillo borough

| Immigration Origin | # Population | % Population | View All 0 Rows |
Sex and Age in Saltillo borough
Sex and Age in Saltillo borough
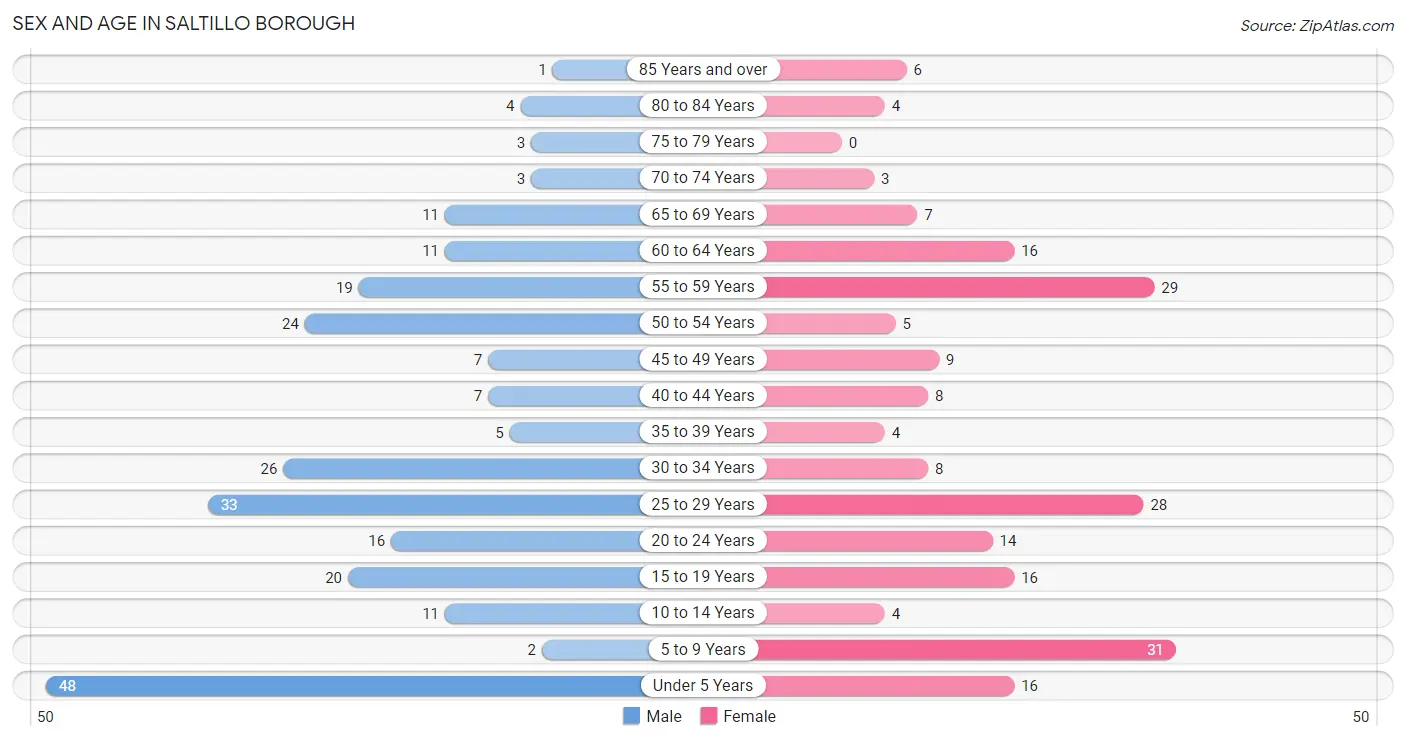
The most populous age groups in Saltillo borough are Under 5 Years (48 | 19.1%) for men and 5 to 9 Years (31 | 14.9%) for women.
| Age Bracket | Male | Female |
| Under 5 Years | 48 (19.1%) | 16 (7.7%) |
| 5 to 9 Years | 2 (0.8%) | 31 (14.9%) |
| 10 to 14 Years | 11 (4.4%) | 4 (1.9%) |
| 15 to 19 Years | 20 (8.0%) | 16 (7.7%) |
| 20 to 24 Years | 16 (6.4%) | 14 (6.7%) |
| 25 to 29 Years | 33 (13.2%) | 28 (13.5%) |
| 30 to 34 Years | 26 (10.4%) | 8 (3.8%) |
| 35 to 39 Years | 5 (2.0%) | 4 (1.9%) |
| 40 to 44 Years | 7 (2.8%) | 8 (3.8%) |
| 45 to 49 Years | 7 (2.8%) | 9 (4.3%) |
| 50 to 54 Years | 24 (9.6%) | 5 (2.4%) |
| 55 to 59 Years | 19 (7.6%) | 29 (13.9%) |
| 60 to 64 Years | 11 (4.4%) | 16 (7.7%) |
| 65 to 69 Years | 11 (4.4%) | 7 (3.4%) |
| 70 to 74 Years | 3 (1.2%) | 3 (1.4%) |
| 75 to 79 Years | 3 (1.2%) | 0 (0.0%) |
| 80 to 84 Years | 4 (1.6%) | 4 (1.9%) |
| 85 Years and over | 1 (0.4%) | 6 (2.9%) |
| Total | 251 (100.0%) | 208 (100.0%) |
Families and Households in Saltillo borough
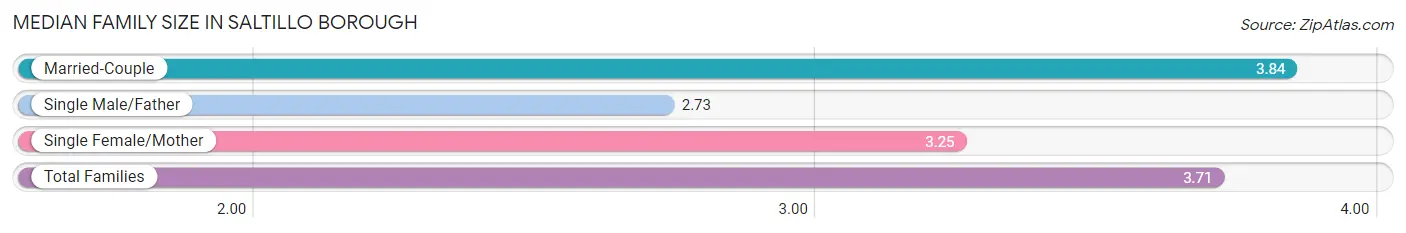
Median Family Size in Saltillo borough
The median family size in Saltillo borough is 3.71 persons per family, with married-couple families (97 | 86.6%) accounting for the largest median family size of 3.84 persons per family. On the other hand, single male/father families (11 | 9.8%) represent the smallest median family size with 2.73 persons per family.
| Family Type | # Families | Family Size |
| Married-Couple | 97 (86.6%) | 3.84 |
| Single Male/Father | 11 (9.8%) | 2.73 |
| Single Female/Mother | 4 (3.6%) | 3.25 |
| Total Families | 112 (100.0%) | 3.71 |
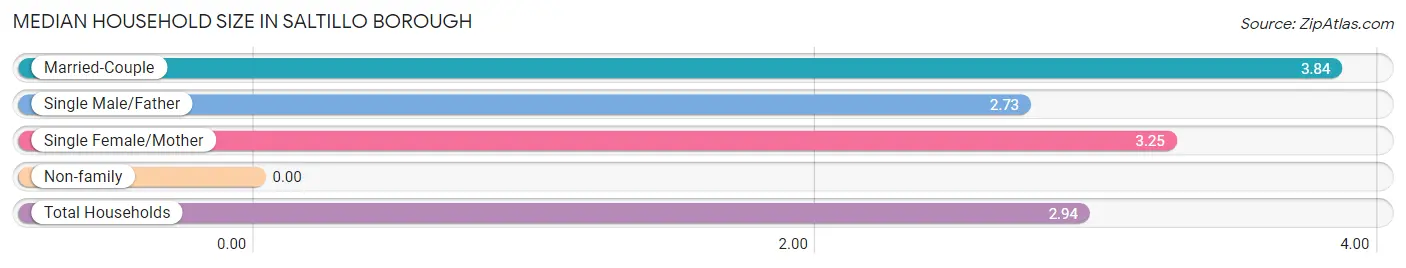
Median Household Size in Saltillo borough
| Household Type | # Households | Household Size |
| Married-Couple | 97 (62.2%) | 3.84 |
| Single Male/Father | 11 (7.0%) | 2.73 |
| Single Female/Mother | 4 (2.6%) | 3.25 |
| Non-family | 44 (28.2%) | - |
| Total Households | 156 (100.0%) | 2.94 |
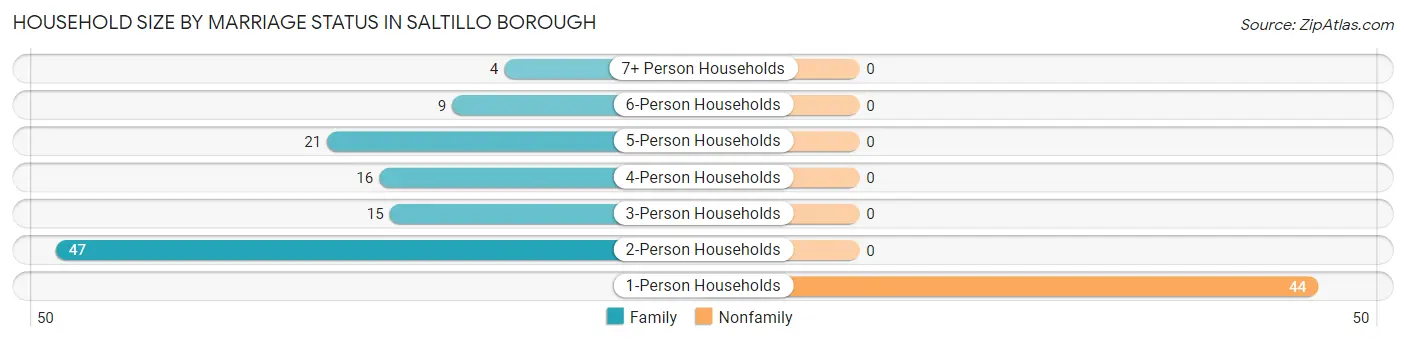
Household Size by Marriage Status in Saltillo borough
Out of a total of 156 households in Saltillo borough, 112 (71.8%) are family households, while 44 (28.2%) are nonfamily households. The most numerous type of family households are 2-person households, comprising 47, and the most common type of nonfamily households are 1-person households, comprising 44.
| Household Size | Family Households | Nonfamily Households |
| 1-Person Households | - | 44 (28.2%) |
| 2-Person Households | 47 (30.1%) | 0 (0.0%) |
| 3-Person Households | 15 (9.6%) | 0 (0.0%) |
| 4-Person Households | 16 (10.3%) | 0 (0.0%) |
| 5-Person Households | 21 (13.5%) | 0 (0.0%) |
| 6-Person Households | 9 (5.8%) | 0 (0.0%) |
| 7+ Person Households | 4 (2.6%) | 0 (0.0%) |
| Total | 112 (71.8%) | 44 (28.2%) |
Female Fertility in Saltillo borough
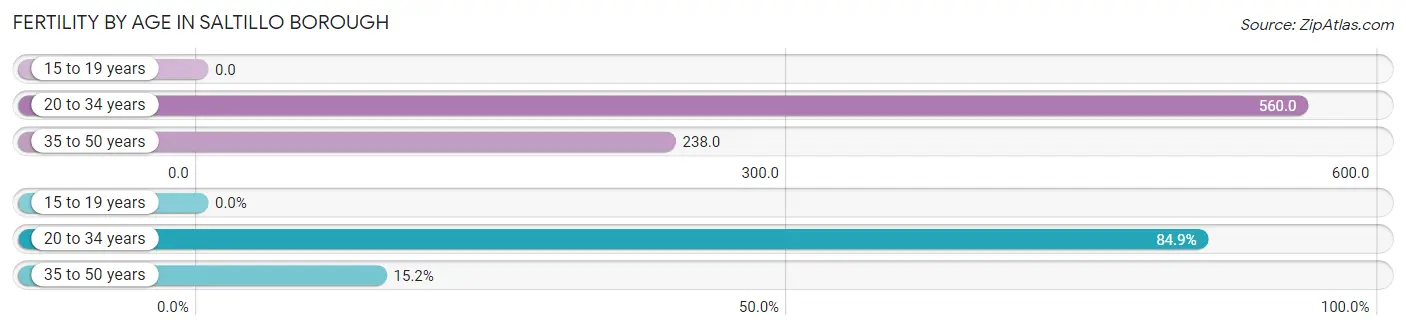
Fertility by Age in Saltillo borough
Average fertility rate in Saltillo borough is 379.0 births per 1,000 women. Women in the age bracket of 20 to 34 years have the highest fertility rate with 560.0 births per 1,000 women. Women in the age bracket of 20 to 34 years acount for 84.9% of all women with births.
| Age Bracket | Women with Births | Births / 1,000 Women |
| 15 to 19 years | 0 (0.0%) | 0.0 |
| 20 to 34 years | 28 (84.9%) | 560.0 |
| 35 to 50 years | 5 (15.1%) | 238.0 |
| Total | 33 (100.0%) | 379.0 |
Fertility by Age by Marriage Status in Saltillo borough
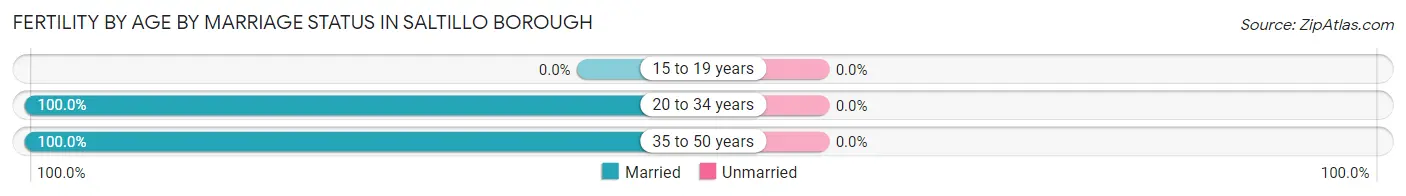
| Age Bracket | Married | Unmarried |
| 15 to 19 years | 0 (0.0%) | 0 (0.0%) |
| 20 to 34 years | 28 (100.0%) | 0 (0.0%) |
| 35 to 50 years | 5 (100.0%) | 0 (0.0%) |
| Total | 33 (100.0%) | 0 (0.0%) |
Fertility by Education in Saltillo borough
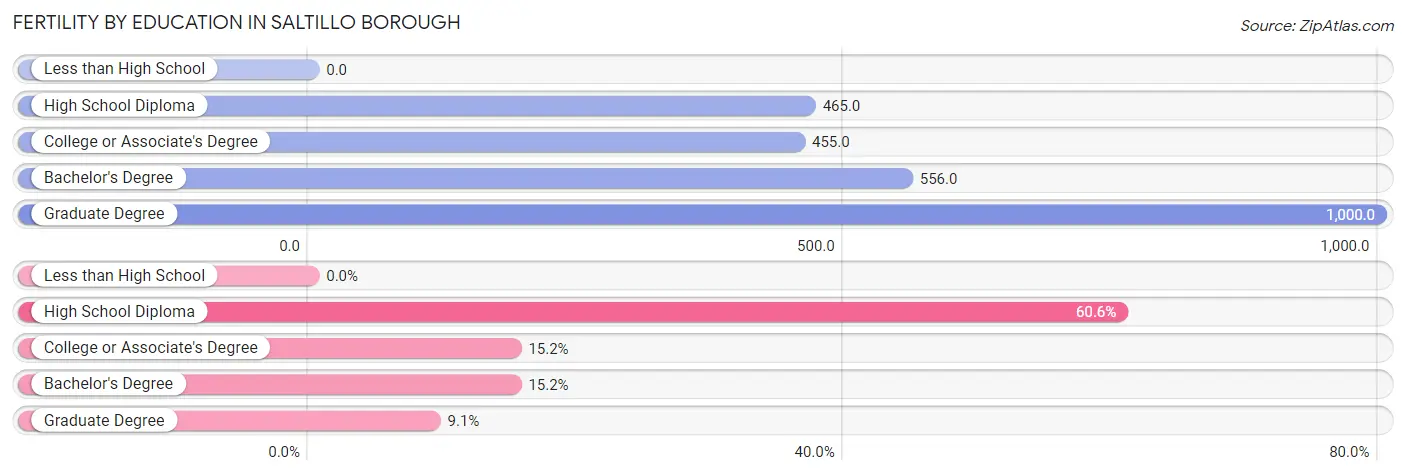
| Educational Attainment | Women with Births | Births / 1,000 Women |
| Less than High School | 0 (0.0%) | 0.0 |
| High School Diploma | 20 (60.6%) | 465.0 |
| College or Associate's Degree | 5 (15.1%) | 455.0 |
| Bachelor's Degree | 5 (15.1%) | 556.0 |
| Graduate Degree | 3 (9.1%) | 1,000.0 |
| Total | 33 (100.0%) | 379.0 |
Fertility by Education by Marriage Status in Saltillo borough
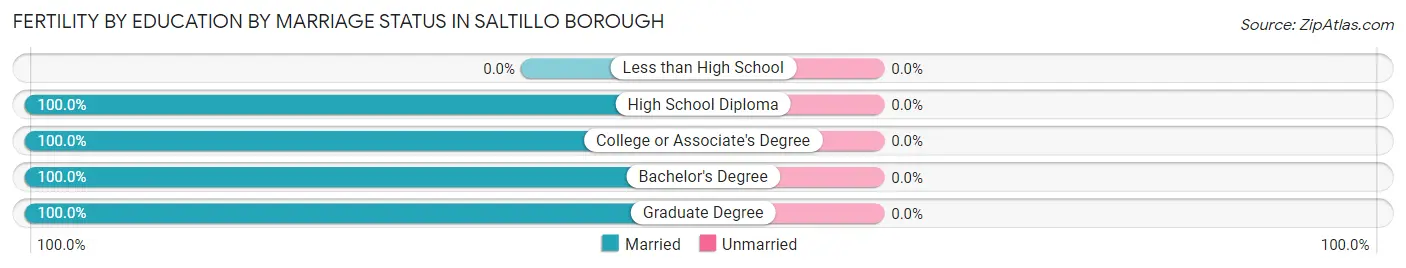
| Educational Attainment | Married | Unmarried |
| Less than High School | 0 (0.0%) | 0 (0.0%) |
| High School Diploma | 20 (100.0%) | 0 (0.0%) |
| College or Associate's Degree | 5 (100.0%) | 0 (0.0%) |
| Bachelor's Degree | 5 (100.0%) | 0 (0.0%) |
| Graduate Degree | 3 (100.0%) | 0 (0.0%) |
| Total | 33 (100.0%) | 0 (0.0%) |
Employment Characteristics in Saltillo borough
Employment by Class of Employer in Saltillo borough
Among the 223 employed individuals in Saltillo borough, private company employees (132 | 59.2%), local government employees (40 | 17.9%), and state government employees (24 | 10.8%) make up the most common classes of employment.
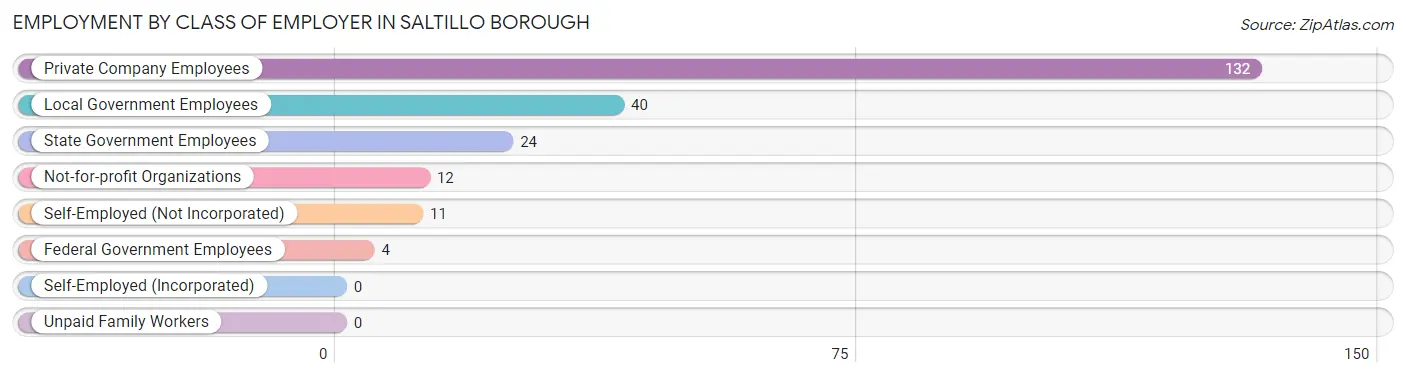
| Employer Class | # Employees | % Employees |
| Private Company Employees | 132 | 59.2% |
| Self-Employed (Incorporated) | 0 | 0.0% |
| Self-Employed (Not Incorporated) | 11 | 4.9% |
| Not-for-profit Organizations | 12 | 5.4% |
| Local Government Employees | 40 | 17.9% |
| State Government Employees | 24 | 10.8% |
| Federal Government Employees | 4 | 1.8% |
| Unpaid Family Workers | 0 | 0.0% |
| Total | 223 | 100.0% |
Employment Status by Age in Saltillo borough
According to the labor force statistics for Saltillo borough, out of the total population over 16 years of age (344), 66.6% or 229 individuals are in the labor force, with 0.4% or 1 of them unemployed. The age group with the highest labor force participation rate is 45 to 54 years, with 97.8% or 44 individuals in the labor force. Within the labor force, the 35 to 44 years age range has the highest percentage of unemployed individuals, with 5.9% or 1 of them being unemployed.
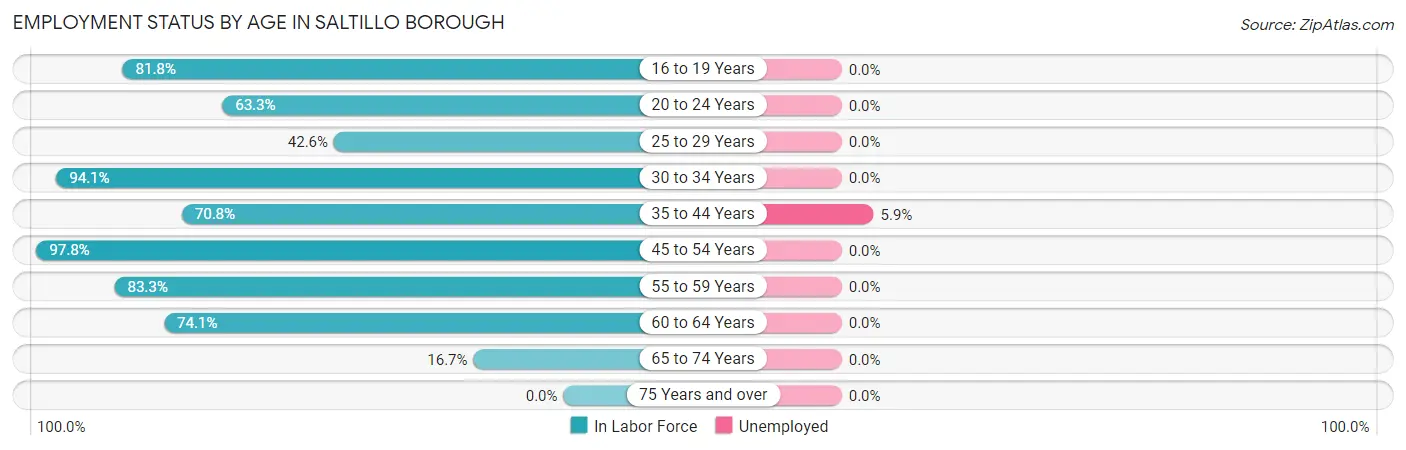
| Age Bracket | In Labor Force | Unemployed |
| 16 to 19 Years | 27 (81.8%) | 0 (0.0%) |
| 20 to 24 Years | 19 (63.3%) | 0 (0.0%) |
| 25 to 29 Years | 26 (42.6%) | 0 (0.0%) |
| 30 to 34 Years | 32 (94.1%) | 0 (0.0%) |
| 35 to 44 Years | 17 (70.8%) | 1 (5.9%) |
| 45 to 54 Years | 44 (97.8%) | 0 (0.0%) |
| 55 to 59 Years | 40 (83.3%) | 0 (0.0%) |
| 60 to 64 Years | 20 (74.1%) | 0 (0.0%) |
| 65 to 74 Years | 4 (16.7%) | 0 (0.0%) |
| 75 Years and over | 0 (0.0%) | 0 (0.0%) |
| Total | 229 (66.6%) | 1 (0.4%) |
Employment Status by Educational Attainment in Saltillo borough
According to labor force statistics for Saltillo borough, 74.9% of individuals (179) out of the total population between 25 and 64 years of age (239) are in the labor force, with 0.6% or 1 of them being unemployed. The group with the highest labor force participation rate are those with the educational attainment of bachelor's degree or higher, with 95.1% or 39 individuals in the labor force. Within the labor force, individuals with college / associate degree education have the highest percentage of unemployment, with 1.9% or 1 of them being unemployed.
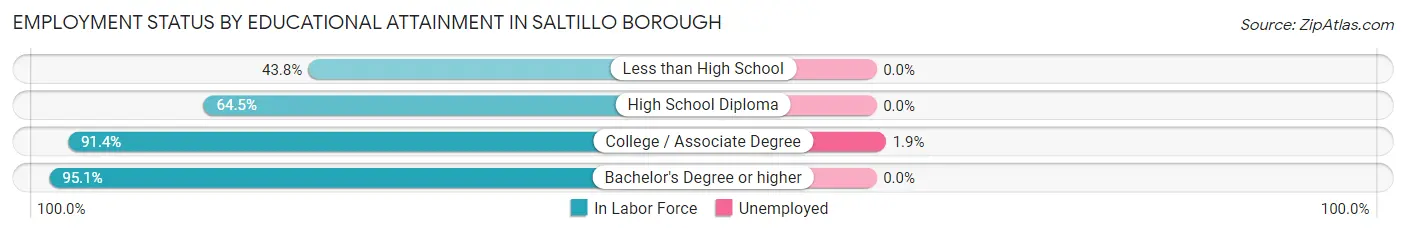
| Educational Attainment | In Labor Force | Unemployed |
| Less than High School | 7 (43.8%) | 0 (0.0%) |
| High School Diploma | 80 (64.5%) | 0 (0.0%) |
| College / Associate Degree | 53 (91.4%) | 1 (1.9%) |
| Bachelor's Degree or higher | 39 (95.1%) | 0 (0.0%) |
| Total | 179 (74.9%) | 1 (0.6%) |
Employment Occupations by Sex in Saltillo borough
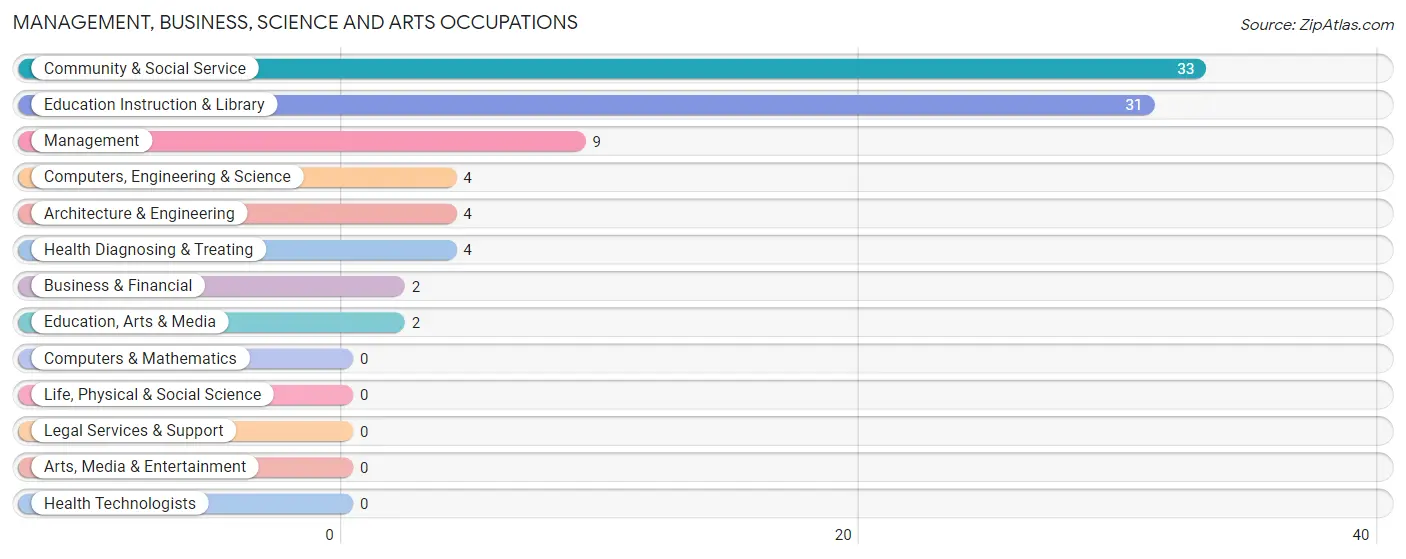
Management, Business, Science and Arts Occupations
The most common Management, Business, Science and Arts occupations in Saltillo borough are Community & Social Service (33 | 14.5%), Education Instruction & Library (31 | 13.6%), Management (9 | 4.0%), Computers, Engineering & Science (4 | 1.8%), and Architecture & Engineering (4 | 1.8%).
Management, Business, Science and Arts Occupations by Sex
Within the Management, Business, Science and Arts occupations in Saltillo borough, the most male-oriented occupations are Management (100.0%), Computers, Engineering & Science (100.0%), and Architecture & Engineering (100.0%), while the most female-oriented occupations are Business & Financial (100.0%), Health Diagnosing & Treating (100.0%), and Education Instruction & Library (71.0%).
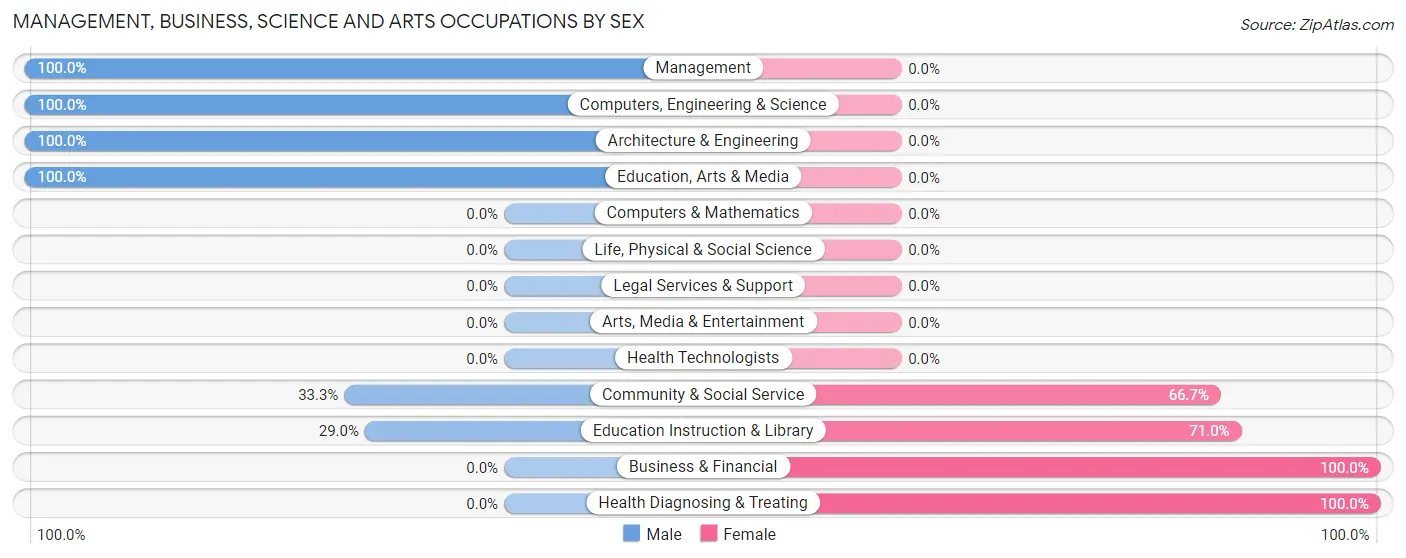
| Occupation | Male | Female |
| Management | 9 (100.0%) | 0 (0.0%) |
| Business & Financial | 0 (0.0%) | 2 (100.0%) |
| Computers, Engineering & Science | 4 (100.0%) | 0 (0.0%) |
| Computers & Mathematics | 0 (0.0%) | 0 (0.0%) |
| Architecture & Engineering | 4 (100.0%) | 0 (0.0%) |
| Life, Physical & Social Science | 0 (0.0%) | 0 (0.0%) |
| Community & Social Service | 11 (33.3%) | 22 (66.7%) |
| Education, Arts & Media | 2 (100.0%) | 0 (0.0%) |
| Legal Services & Support | 0 (0.0%) | 0 (0.0%) |
| Education Instruction & Library | 9 (29.0%) | 22 (71.0%) |
| Arts, Media & Entertainment | 0 (0.0%) | 0 (0.0%) |
| Health Diagnosing & Treating | 0 (0.0%) | 4 (100.0%) |
| Health Technologists | 0 (0.0%) | 0 (0.0%) |
| Total (Category) | 24 (46.2%) | 28 (53.8%) |
| Total (Overall) | 127 (55.7%) | 101 (44.3%) |
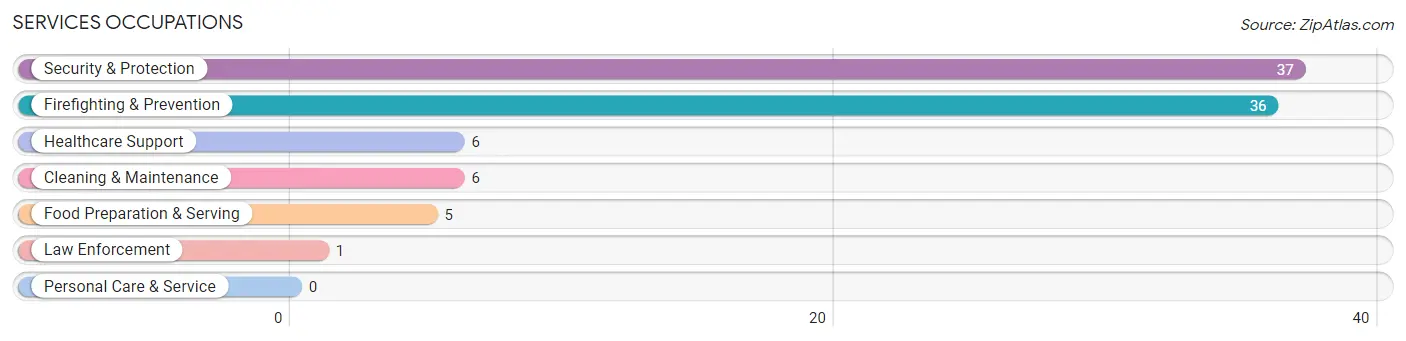
Services Occupations
The most common Services occupations in Saltillo borough are Security & Protection (37 | 16.2%), Firefighting & Prevention (36 | 15.8%), Healthcare Support (6 | 2.6%), Cleaning & Maintenance (6 | 2.6%), and Food Preparation & Serving (5 | 2.2%).
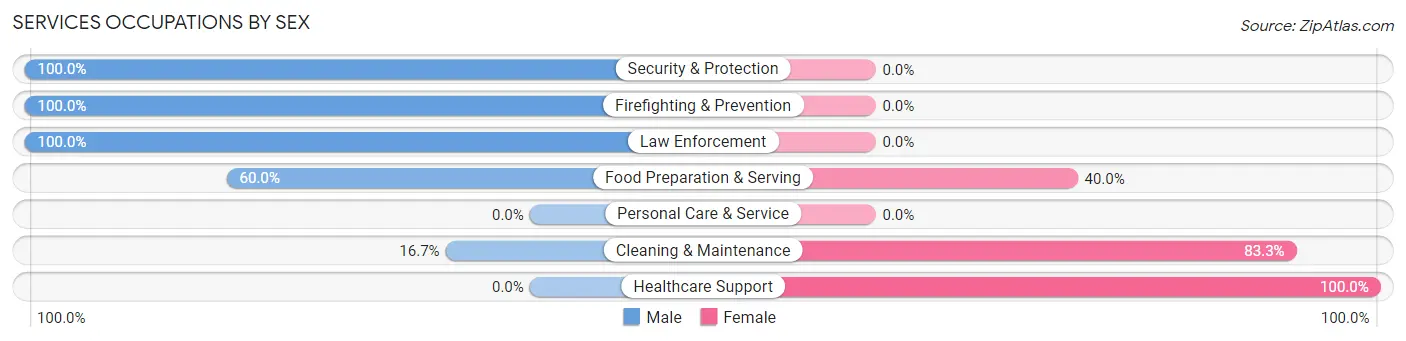
Services Occupations by Sex
Within the Services occupations in Saltillo borough, the most male-oriented occupations are Security & Protection (100.0%), Firefighting & Prevention (100.0%), and Law Enforcement (100.0%), while the most female-oriented occupations are Healthcare Support (100.0%), Cleaning & Maintenance (83.3%), and Food Preparation & Serving (40.0%).
| Occupation | Male | Female |
| Healthcare Support | 0 (0.0%) | 6 (100.0%) |
| Security & Protection | 37 (100.0%) | 0 (0.0%) |
| Firefighting & Prevention | 36 (100.0%) | 0 (0.0%) |
| Law Enforcement | 1 (100.0%) | 0 (0.0%) |
| Food Preparation & Serving | 3 (60.0%) | 2 (40.0%) |
| Cleaning & Maintenance | 1 (16.7%) | 5 (83.3%) |
| Personal Care & Service | 0 (0.0%) | 0 (0.0%) |
| Total (Category) | 41 (75.9%) | 13 (24.1%) |
| Total (Overall) | 127 (55.7%) | 101 (44.3%) |
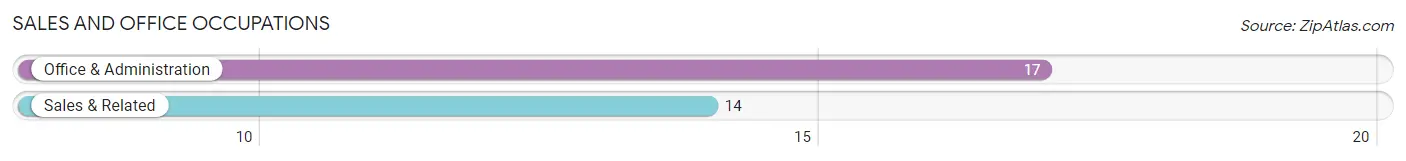
Sales and Office Occupations
The most common Sales and Office occupations in Saltillo borough are Office & Administration (17 | 7.5%), and Sales & Related (14 | 6.1%).
Sales and Office Occupations by Sex
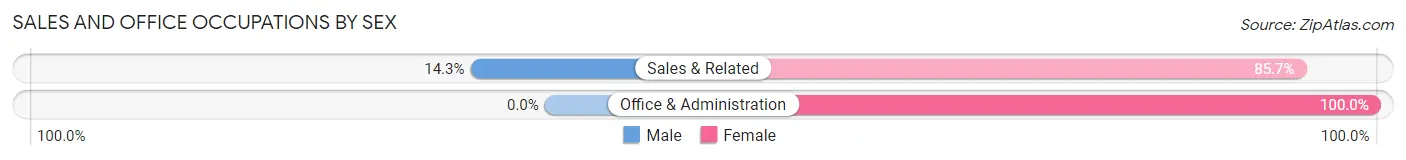
| Occupation | Male | Female |
| Sales & Related | 2 (14.3%) | 12 (85.7%) |
| Office & Administration | 0 (0.0%) | 17 (100.0%) |
| Total (Category) | 2 (6.5%) | 29 (93.5%) |
| Total (Overall) | 127 (55.7%) | 101 (44.3%) |
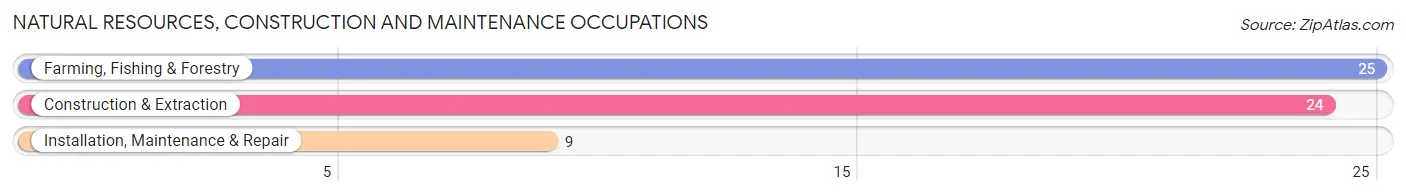
Natural Resources, Construction and Maintenance Occupations
The most common Natural Resources, Construction and Maintenance occupations in Saltillo borough are Farming, Fishing & Forestry (25 | 11.0%), Construction & Extraction (24 | 10.5%), and Installation, Maintenance & Repair (9 | 4.0%).
Natural Resources, Construction and Maintenance Occupations by Sex
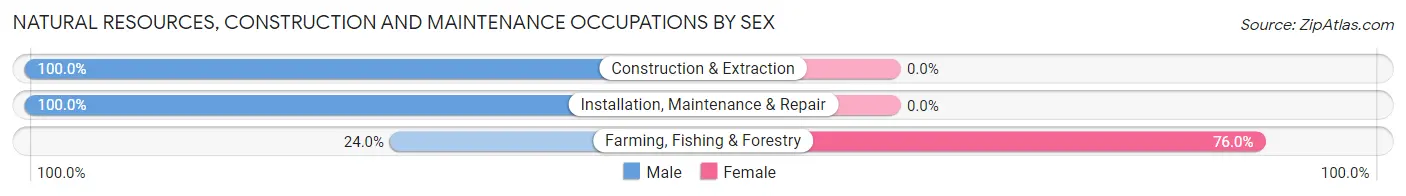
| Occupation | Male | Female |
| Farming, Fishing & Forestry | 6 (24.0%) | 19 (76.0%) |
| Construction & Extraction | 24 (100.0%) | 0 (0.0%) |
| Installation, Maintenance & Repair | 9 (100.0%) | 0 (0.0%) |
| Total (Category) | 39 (67.2%) | 19 (32.8%) |
| Total (Overall) | 127 (55.7%) | 101 (44.3%) |
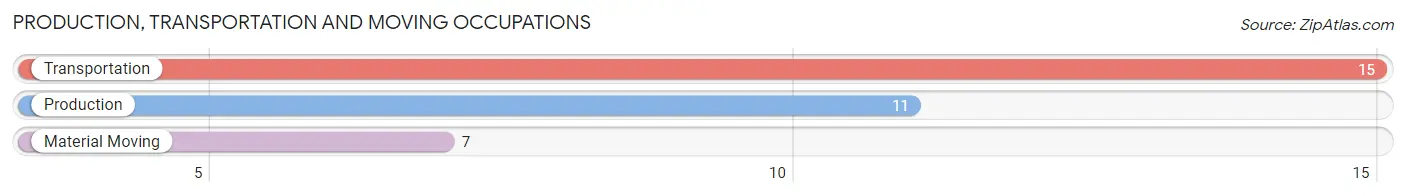
Production, Transportation and Moving Occupations
The most common Production, Transportation and Moving occupations in Saltillo borough are Transportation (15 | 6.6%), Production (11 | 4.8%), and Material Moving (7 | 3.1%).
Production, Transportation and Moving Occupations by Sex
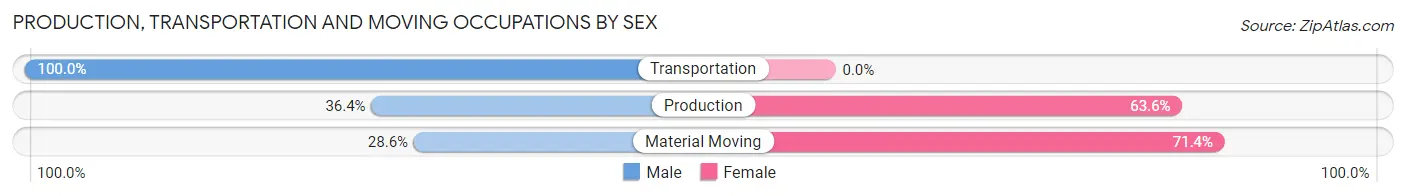
| Occupation | Male | Female |
| Production | 4 (36.4%) | 7 (63.6%) |
| Transportation | 15 (100.0%) | 0 (0.0%) |
| Material Moving | 2 (28.6%) | 5 (71.4%) |
| Total (Category) | 21 (63.6%) | 12 (36.4%) |
| Total (Overall) | 127 (55.7%) | 101 (44.3%) |
Employment Industries by Sex in Saltillo borough
Employment Industries in Saltillo borough
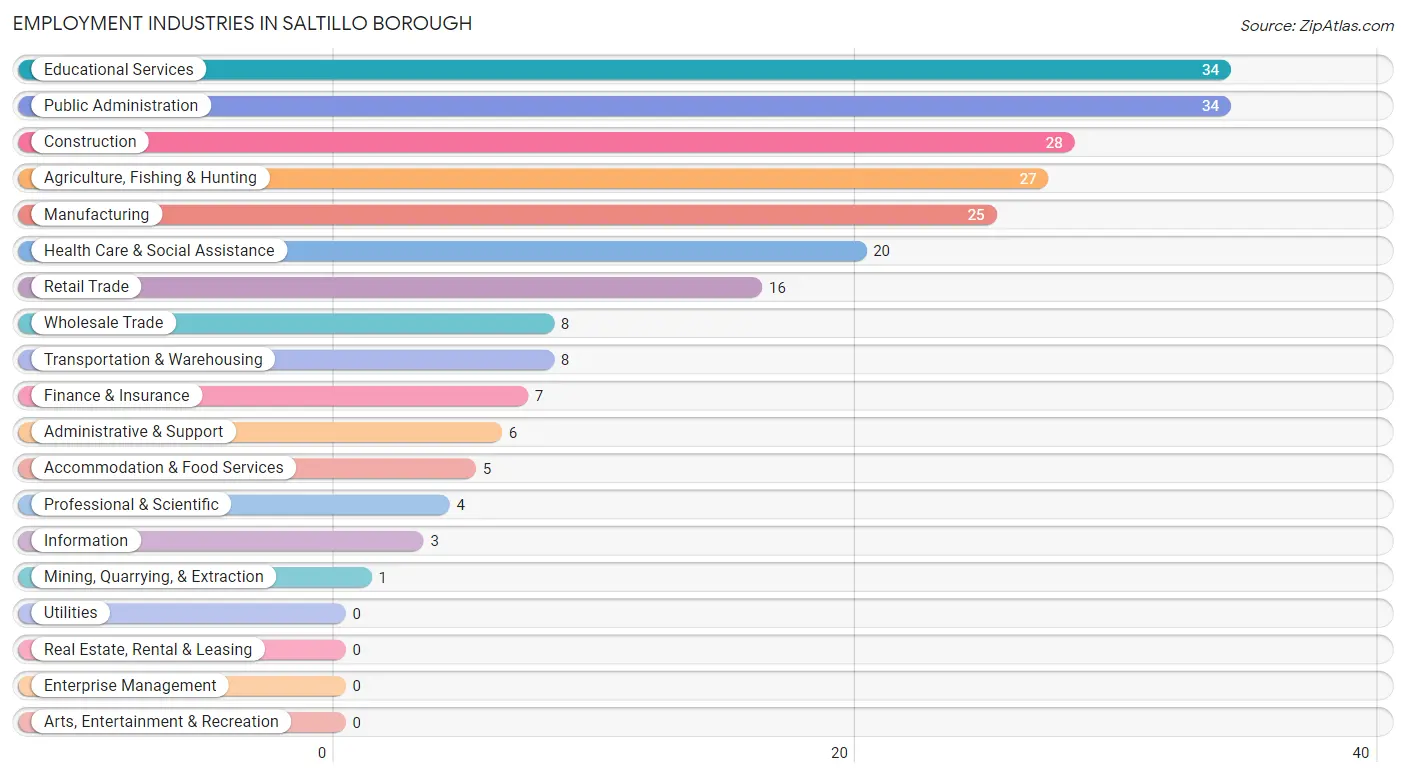
The major employment industries in Saltillo borough include Educational Services (34 | 14.9%), Public Administration (34 | 14.9%), Construction (28 | 12.3%), Agriculture, Fishing & Hunting (27 | 11.8%), and Manufacturing (25 | 11.0%).
Employment Industries by Sex in Saltillo borough
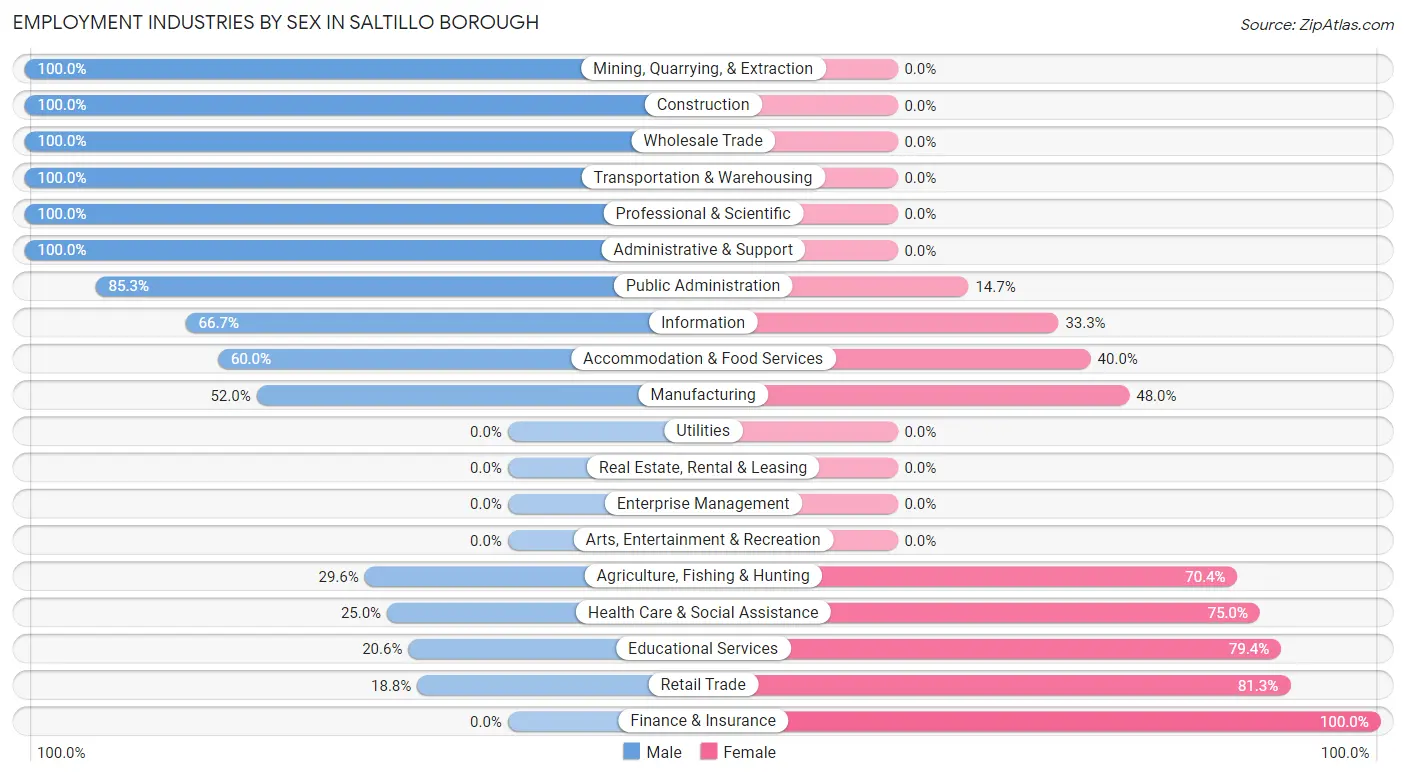
The Saltillo borough industries that see more men than women are Mining, Quarrying, & Extraction (100.0%), Construction (100.0%), and Wholesale Trade (100.0%), whereas the industries that tend to have a higher number of women are Finance & Insurance (100.0%), Retail Trade (81.2%), and Educational Services (79.4%).
| Industry | Male | Female |
| Agriculture, Fishing & Hunting | 8 (29.6%) | 19 (70.4%) |
| Mining, Quarrying, & Extraction | 1 (100.0%) | 0 (0.0%) |
| Construction | 28 (100.0%) | 0 (0.0%) |
| Manufacturing | 13 (52.0%) | 12 (48.0%) |
| Wholesale Trade | 8 (100.0%) | 0 (0.0%) |
| Retail Trade | 3 (18.8%) | 13 (81.2%) |
| Transportation & Warehousing | 8 (100.0%) | 0 (0.0%) |
| Utilities | 0 (0.0%) | 0 (0.0%) |
| Information | 2 (66.7%) | 1 (33.3%) |
| Finance & Insurance | 0 (0.0%) | 7 (100.0%) |
| Real Estate, Rental & Leasing | 0 (0.0%) | 0 (0.0%) |
| Professional & Scientific | 4 (100.0%) | 0 (0.0%) |
| Enterprise Management | 0 (0.0%) | 0 (0.0%) |
| Administrative & Support | 6 (100.0%) | 0 (0.0%) |
| Educational Services | 7 (20.6%) | 27 (79.4%) |
| Health Care & Social Assistance | 5 (25.0%) | 15 (75.0%) |
| Arts, Entertainment & Recreation | 0 (0.0%) | 0 (0.0%) |
| Accommodation & Food Services | 3 (60.0%) | 2 (40.0%) |
| Public Administration | 29 (85.3%) | 5 (14.7%) |
| Total | 127 (55.7%) | 101 (44.3%) |
Education in Saltillo borough
School Enrollment in Saltillo borough
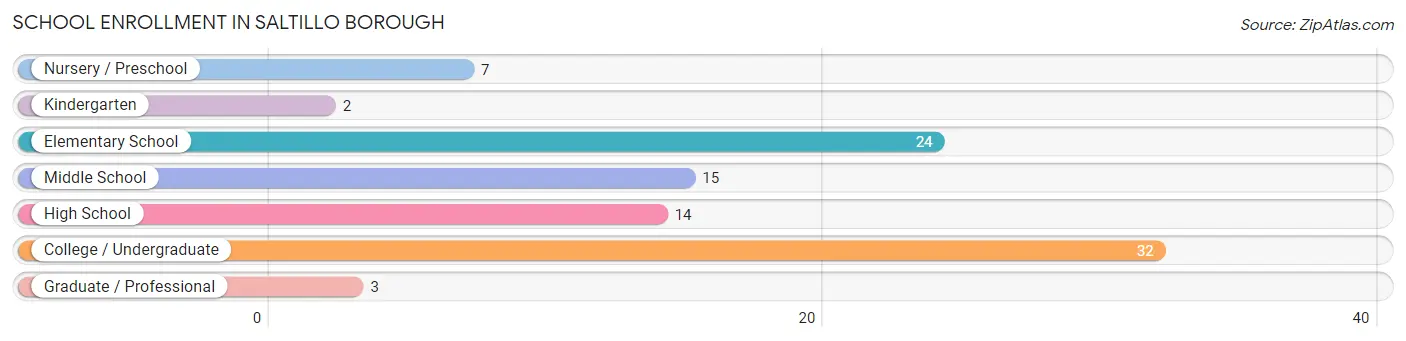
The most common levels of schooling among the 97 students in Saltillo borough are college / undergraduate (32 | 33.0%), elementary school (24 | 24.7%), and middle school (15 | 15.5%).
| School Level | # Students | % Students |
| Nursery / Preschool | 7 | 7.2% |
| Kindergarten | 2 | 2.1% |
| Elementary School | 24 | 24.7% |
| Middle School | 15 | 15.5% |
| High School | 14 | 14.4% |
| College / Undergraduate | 32 | 33.0% |
| Graduate / Professional | 3 | 3.1% |
| Total | 97 | 100.0% |
School Enrollment by Age by Funding Source in Saltillo borough
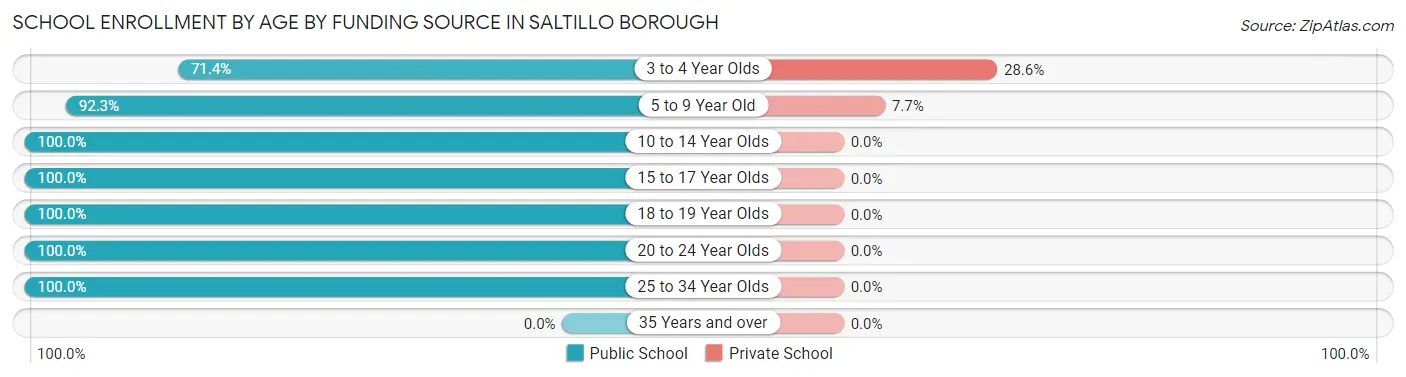
Out of a total of 97 students who are enrolled in schools in Saltillo borough, 4 (4.1%) attend a private institution, while the remaining 93 (95.9%) are enrolled in public schools. The age group of 3 to 4 year olds has the highest likelihood of being enrolled in private schools, with 2 (28.6% in the age bracket) enrolled. Conversely, the age group of 10 to 14 year olds has the lowest likelihood of being enrolled in a private school, with 15 (100.0% in the age bracket) attending a public institution.
| Age Bracket | Public School | Private School |
| 3 to 4 Year Olds | 5 (71.4%) | 2 (28.6%) |
| 5 to 9 Year Old | 24 (92.3%) | 2 (7.7%) |
| 10 to 14 Year Olds | 15 (100.0%) | 0 (0.0%) |
| 15 to 17 Year Olds | 14 (100.0%) | 0 (0.0%) |
| 18 to 19 Year Olds | 8 (100.0%) | 0 (0.0%) |
| 20 to 24 Year Olds | 5 (100.0%) | 0 (0.0%) |
| 25 to 34 Year Olds | 22 (100.0%) | 0 (0.0%) |
| 35 Years and over | 0 (0.0%) | 0 (0.0%) |
| Total | 93 (95.9%) | 4 (4.1%) |
Educational Attainment by Field of Study in Saltillo borough
Education (32 | 64.0%), business (7 | 14.0%), arts & humanities (5 | 10.0%), bio, nature & agricultural (2 | 4.0%), and science & technology (2 | 4.0%) are the most common fields of study among 50 individuals in Saltillo borough who have obtained a bachelor's degree or higher.
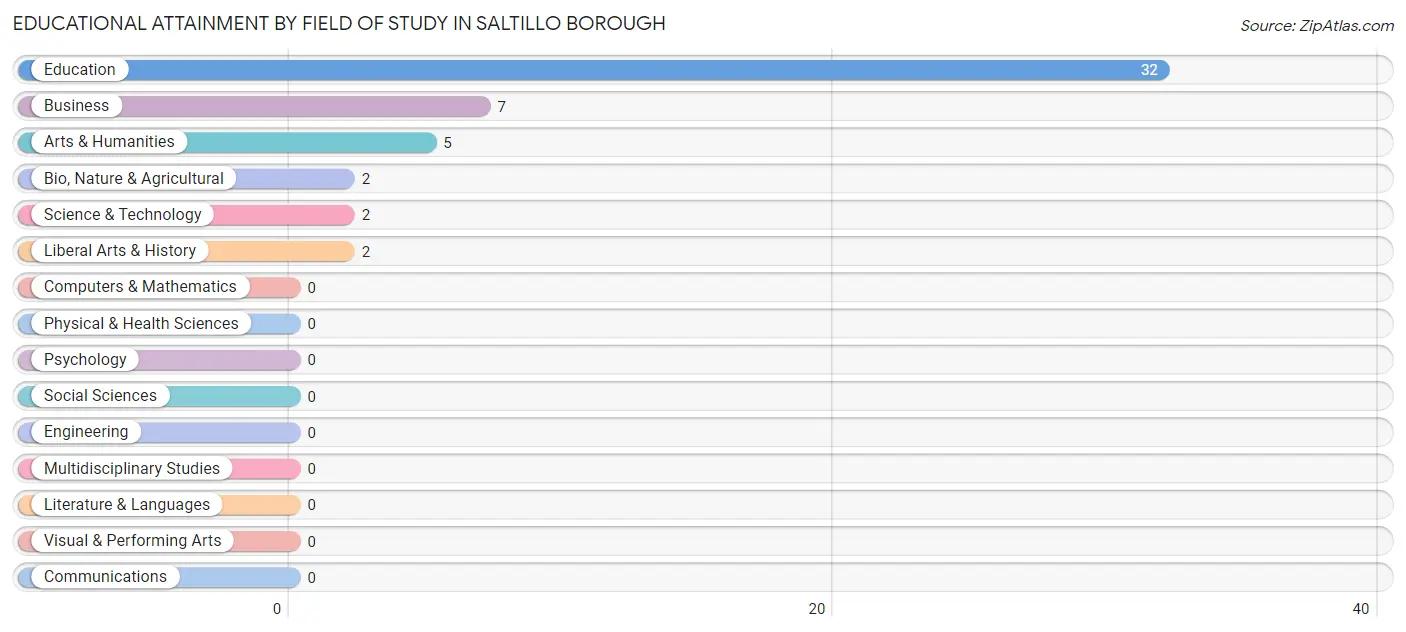
| Field of Study | # Graduates | % Graduates |
| Computers & Mathematics | 0 | 0.0% |
| Bio, Nature & Agricultural | 2 | 4.0% |
| Physical & Health Sciences | 0 | 0.0% |
| Psychology | 0 | 0.0% |
| Social Sciences | 0 | 0.0% |
| Engineering | 0 | 0.0% |
| Multidisciplinary Studies | 0 | 0.0% |
| Science & Technology | 2 | 4.0% |
| Business | 7 | 14.0% |
| Education | 32 | 64.0% |
| Literature & Languages | 0 | 0.0% |
| Liberal Arts & History | 2 | 4.0% |
| Visual & Performing Arts | 0 | 0.0% |
| Communications | 0 | 0.0% |
| Arts & Humanities | 5 | 10.0% |
| Total | 50 | 100.0% |
Transportation & Commute in Saltillo borough
Vehicle Availability by Sex in Saltillo borough
The most prevalent vehicle ownership categories in Saltillo borough are males with 2 vehicles (76, accounting for 59.8%) and females with 2 vehicles (42, making up 79.2%).
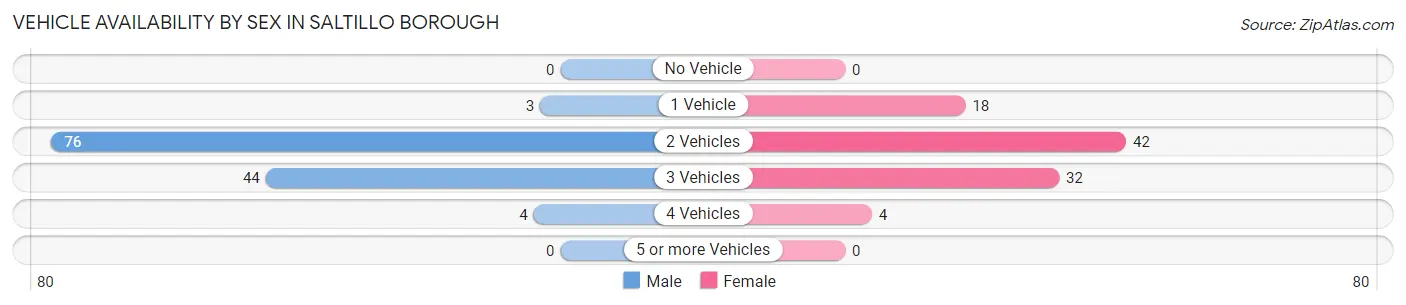
| Vehicles Available | Male | Female |
| No Vehicle | 0 (0.0%) | 0 (0.0%) |
| 1 Vehicle | 3 (2.4%) | 18 (18.8%) |
| 2 Vehicles | 76 (59.8%) | 42 (43.8%) |
| 3 Vehicles | 44 (34.6%) | 32 (33.3%) |
| 4 Vehicles | 4 (3.2%) | 4 (4.2%) |
| 5 or more Vehicles | 0 (0.0%) | 0 (0.0%) |
| Total | 127 (100.0%) | 96 (100.0%) |
Commute Time in Saltillo borough
The most frequently occuring commute durations in Saltillo borough are 90 or more minutes (61 commuters, 27.4%), 10 to 14 minutes (27 commuters, 12.1%), and 30 to 34 minutes (27 commuters, 12.1%).
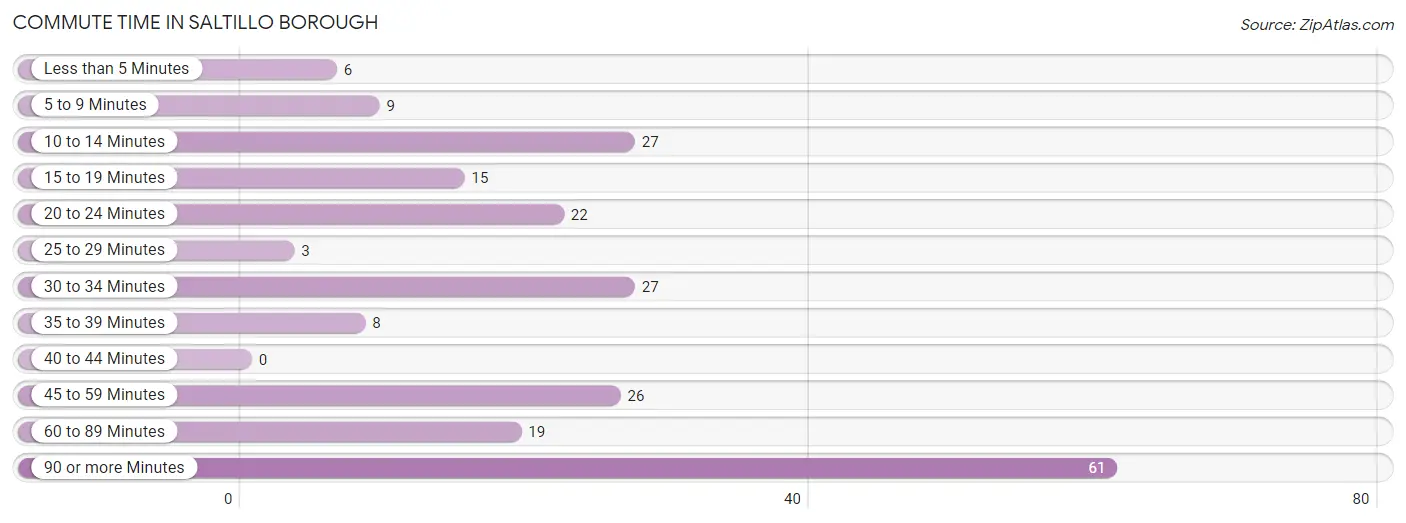
| Commute Time | # Commuters | % Commuters |
| Less than 5 Minutes | 6 | 2.7% |
| 5 to 9 Minutes | 9 | 4.0% |
| 10 to 14 Minutes | 27 | 12.1% |
| 15 to 19 Minutes | 15 | 6.7% |
| 20 to 24 Minutes | 22 | 9.9% |
| 25 to 29 Minutes | 3 | 1.3% |
| 30 to 34 Minutes | 27 | 12.1% |
| 35 to 39 Minutes | 8 | 3.6% |
| 40 to 44 Minutes | 0 | 0.0% |
| 45 to 59 Minutes | 26 | 11.7% |
| 60 to 89 Minutes | 19 | 8.5% |
| 90 or more Minutes | 61 | 27.4% |
Commute Time by Sex in Saltillo borough
The most common commute times in Saltillo borough are 90 or more minutes (54 commuters, 42.5%) for males and 10 to 14 minutes (27 commuters, 28.1%) for females.

| Commute Time | Male | Female |
| Less than 5 Minutes | 6 (4.7%) | 0 (0.0%) |
| 5 to 9 Minutes | 7 (5.5%) | 2 (2.1%) |
| 10 to 14 Minutes | 0 (0.0%) | 27 (28.1%) |
| 15 to 19 Minutes | 5 (3.9%) | 10 (10.4%) |
| 20 to 24 Minutes | 3 (2.4%) | 19 (19.8%) |
| 25 to 29 Minutes | 0 (0.0%) | 3 (3.1%) |
| 30 to 34 Minutes | 17 (13.4%) | 10 (10.4%) |
| 35 to 39 Minutes | 6 (4.7%) | 2 (2.1%) |
| 40 to 44 Minutes | 0 (0.0%) | 0 (0.0%) |
| 45 to 59 Minutes | 11 (8.7%) | 15 (15.6%) |
| 60 to 89 Minutes | 18 (14.2%) | 1 (1.0%) |
| 90 or more Minutes | 54 (42.5%) | 7 (7.3%) |
Time of Departure to Work by Sex in Saltillo borough
The most frequent times of departure to work in Saltillo borough are 12:00 AM to 4:59 AM (54, 42.5%) for males and 7:30 AM to 7:59 AM (29, 30.2%) for females.
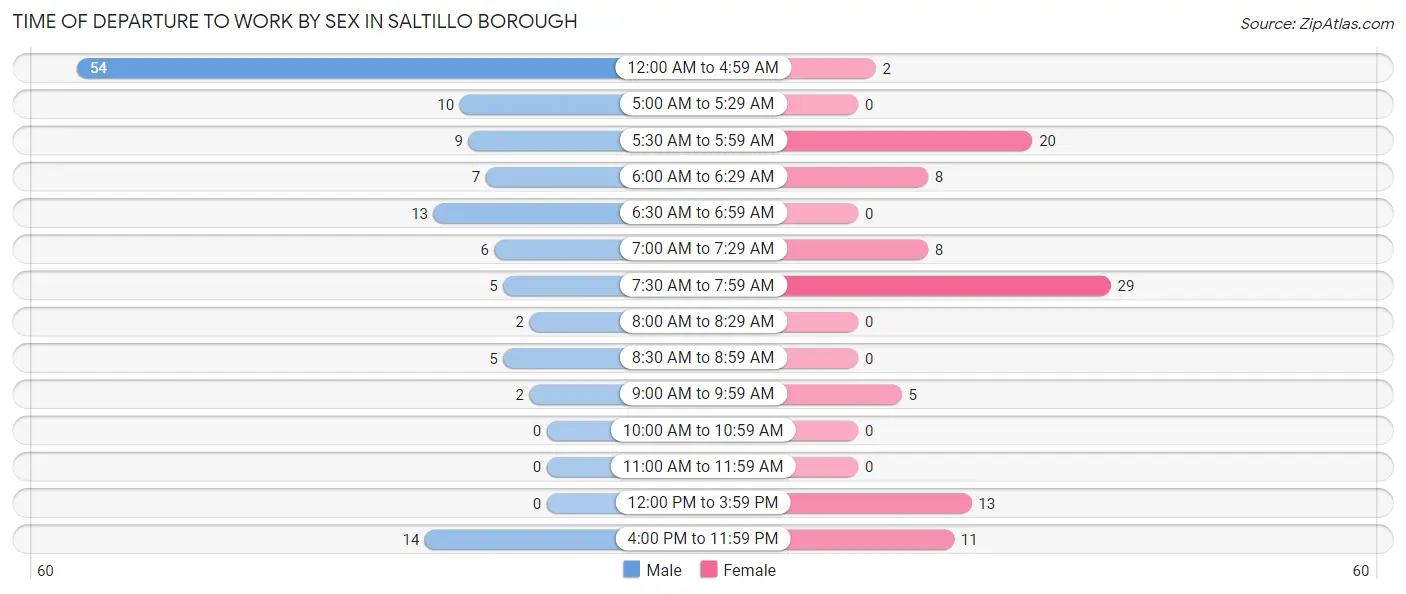
| Time of Departure | Male | Female |
| 12:00 AM to 4:59 AM | 54 (42.5%) | 2 (2.1%) |
| 5:00 AM to 5:29 AM | 10 (7.9%) | 0 (0.0%) |
| 5:30 AM to 5:59 AM | 9 (7.1%) | 20 (20.8%) |
| 6:00 AM to 6:29 AM | 7 (5.5%) | 8 (8.3%) |
| 6:30 AM to 6:59 AM | 13 (10.2%) | 0 (0.0%) |
| 7:00 AM to 7:29 AM | 6 (4.7%) | 8 (8.3%) |
| 7:30 AM to 7:59 AM | 5 (3.9%) | 29 (30.2%) |
| 8:00 AM to 8:29 AM | 2 (1.6%) | 0 (0.0%) |
| 8:30 AM to 8:59 AM | 5 (3.9%) | 0 (0.0%) |
| 9:00 AM to 9:59 AM | 2 (1.6%) | 5 (5.2%) |
| 10:00 AM to 10:59 AM | 0 (0.0%) | 0 (0.0%) |
| 11:00 AM to 11:59 AM | 0 (0.0%) | 0 (0.0%) |
| 12:00 PM to 3:59 PM | 0 (0.0%) | 13 (13.5%) |
| 4:00 PM to 11:59 PM | 14 (11.0%) | 11 (11.5%) |
| Total | 127 (100.0%) | 96 (100.0%) |
Housing Occupancy in Saltillo borough
Occupancy by Ownership in Saltillo borough
Of the total 156 dwellings in Saltillo borough, owner-occupied units account for 137 (87.8%), while renter-occupied units make up 19 (12.2%).
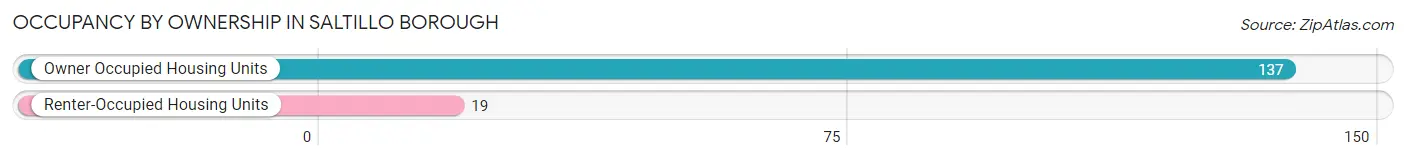
| Occupancy | # Housing Units | % Housing Units |
| Owner Occupied Housing Units | 137 | 87.8% |
| Renter-Occupied Housing Units | 19 | 12.2% |
| Total Occupied Housing Units | 156 | 100.0% |
Occupancy by Household Size in Saltillo borough
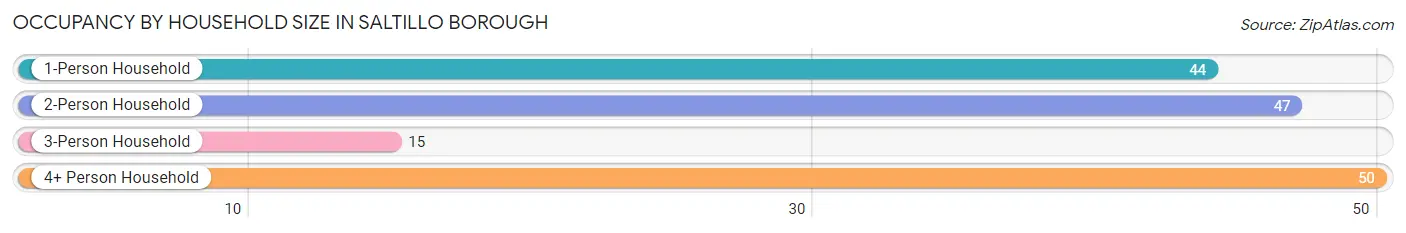
| Household Size | # Housing Units | % Housing Units |
| 1-Person Household | 44 | 28.2% |
| 2-Person Household | 47 | 30.1% |
| 3-Person Household | 15 | 9.6% |
| 4+ Person Household | 50 | 32.1% |
| Total Housing Units | 156 | 100.0% |
Occupancy by Ownership by Household Size in Saltillo borough
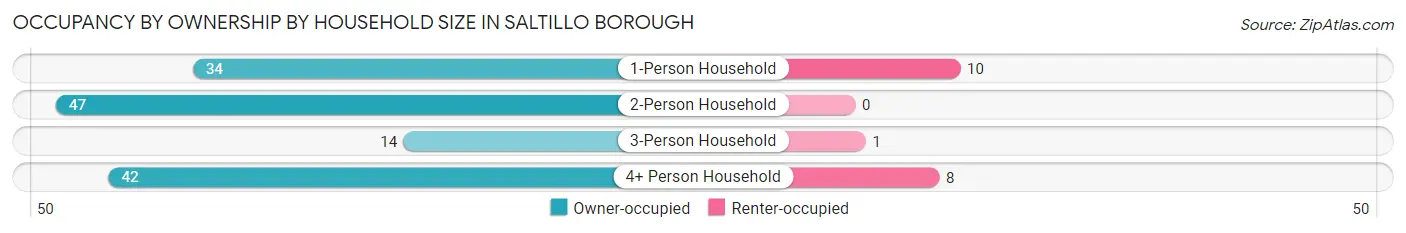
| Household Size | Owner-occupied | Renter-occupied |
| 1-Person Household | 34 (77.3%) | 10 (22.7%) |
| 2-Person Household | 47 (100.0%) | 0 (0.0%) |
| 3-Person Household | 14 (93.3%) | 1 (6.7%) |
| 4+ Person Household | 42 (84.0%) | 8 (16.0%) |
| Total Housing Units | 137 (87.8%) | 19 (12.2%) |
Occupancy by Educational Attainment in Saltillo borough
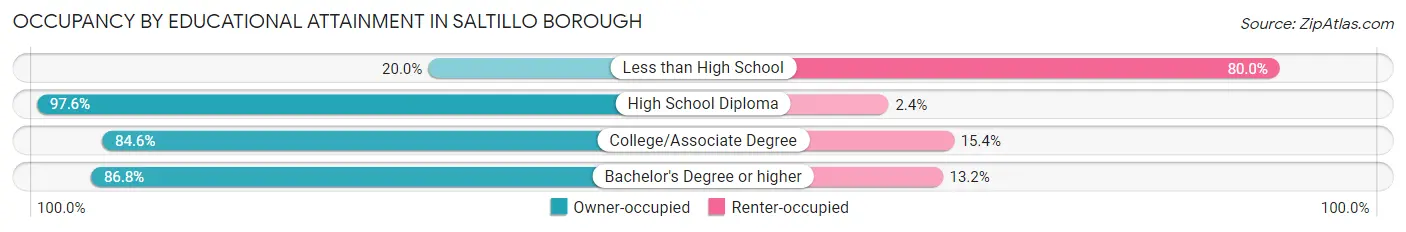
| Household Size | Owner-occupied | Renter-occupied |
| Less than High School | 2 (20.0%) | 8 (80.0%) |
| High School Diploma | 80 (97.6%) | 2 (2.4%) |
| College/Associate Degree | 22 (84.6%) | 4 (15.4%) |
| Bachelor's Degree or higher | 33 (86.8%) | 5 (13.2%) |
Occupancy by Age of Householder in Saltillo borough
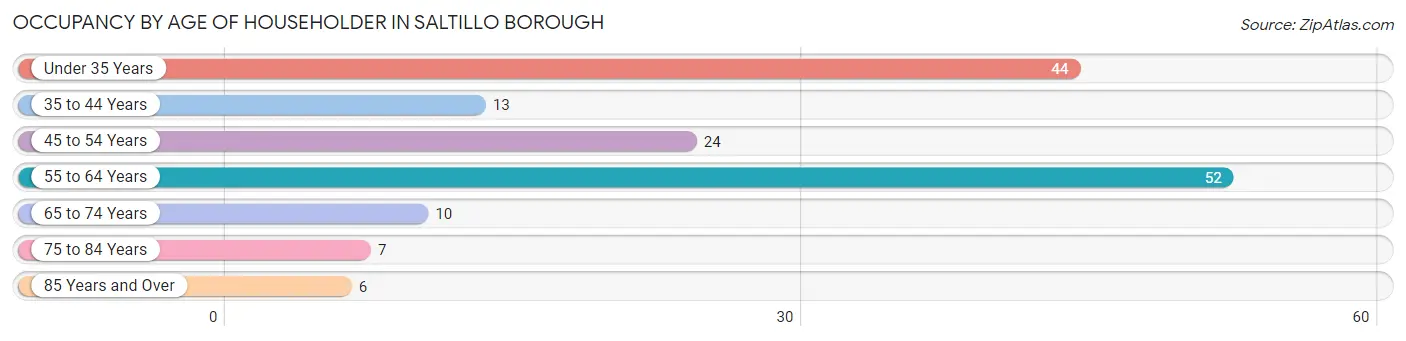
| Age Bracket | # Households | % Households |
| Under 35 Years | 44 | 28.2% |
| 35 to 44 Years | 13 | 8.3% |
| 45 to 54 Years | 24 | 15.4% |
| 55 to 64 Years | 52 | 33.3% |
| 65 to 74 Years | 10 | 6.4% |
| 75 to 84 Years | 7 | 4.5% |
| 85 Years and Over | 6 | 3.8% |
| Total | 156 | 100.0% |
Housing Finances in Saltillo borough
Median Income by Occupancy in Saltillo borough
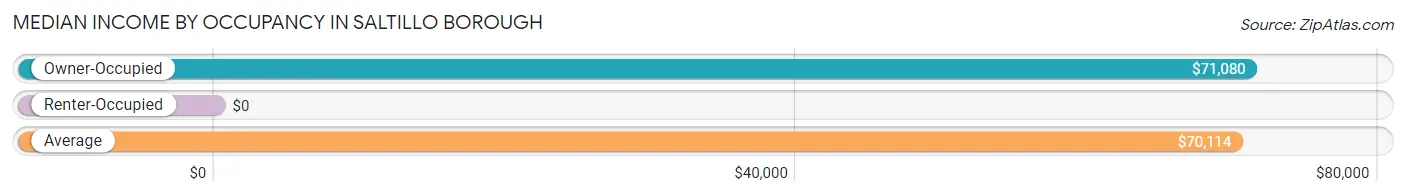
| Occupancy Type | # Households | Median Income |
| Owner-Occupied | 137 (87.8%) | $71,080 |
| Renter-Occupied | 19 (12.2%) | $0 |
| Average | 156 (100.0%) | $70,114 |
Occupancy by Householder Income Bracket in Saltillo borough
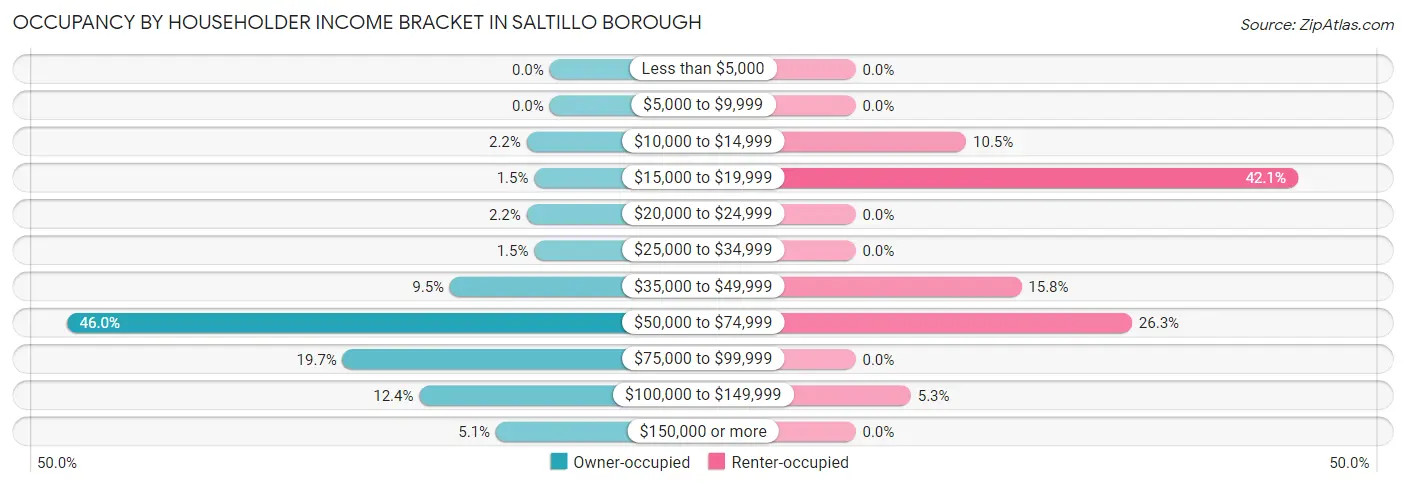
| Income Bracket | Owner-occupied | Renter-occupied |
| Less than $5,000 | 0 (0.0%) | 0 (0.0%) |
| $5,000 to $9,999 | 0 (0.0%) | 0 (0.0%) |
| $10,000 to $14,999 | 3 (2.2%) | 2 (10.5%) |
| $15,000 to $19,999 | 2 (1.5%) | 8 (42.1%) |
| $20,000 to $24,999 | 3 (2.2%) | 0 (0.0%) |
| $25,000 to $34,999 | 2 (1.5%) | 0 (0.0%) |
| $35,000 to $49,999 | 13 (9.5%) | 3 (15.8%) |
| $50,000 to $74,999 | 63 (46.0%) | 5 (26.3%) |
| $75,000 to $99,999 | 27 (19.7%) | 0 (0.0%) |
| $100,000 to $149,999 | 17 (12.4%) | 1 (5.3%) |
| $150,000 or more | 7 (5.1%) | 0 (0.0%) |
| Total | 137 (100.0%) | 19 (100.0%) |
Monthly Housing Cost Tiers in Saltillo borough
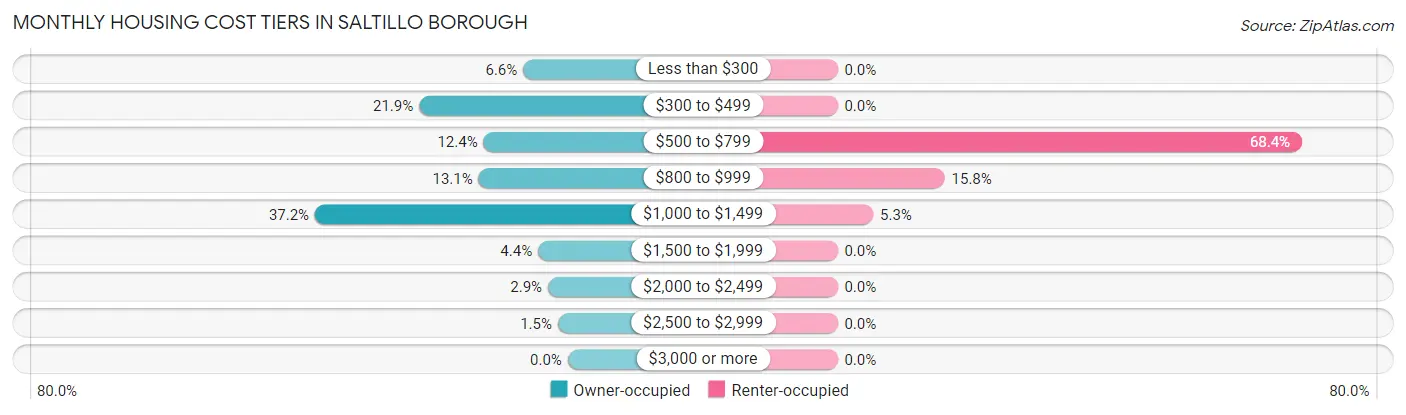
| Monthly Cost | Owner-occupied | Renter-occupied |
| Less than $300 | 9 (6.6%) | 0 (0.0%) |
| $300 to $499 | 30 (21.9%) | 0 (0.0%) |
| $500 to $799 | 17 (12.4%) | 13 (68.4%) |
| $800 to $999 | 18 (13.1%) | 3 (15.8%) |
| $1,000 to $1,499 | 51 (37.2%) | 1 (5.3%) |
| $1,500 to $1,999 | 6 (4.4%) | 0 (0.0%) |
| $2,000 to $2,499 | 4 (2.9%) | 0 (0.0%) |
| $2,500 to $2,999 | 2 (1.5%) | 0 (0.0%) |
| $3,000 or more | 0 (0.0%) | 0 (0.0%) |
| Total | 137 (100.0%) | 19 (100.0%) |
Physical Housing Characteristics in Saltillo borough
Housing Structures in Saltillo borough
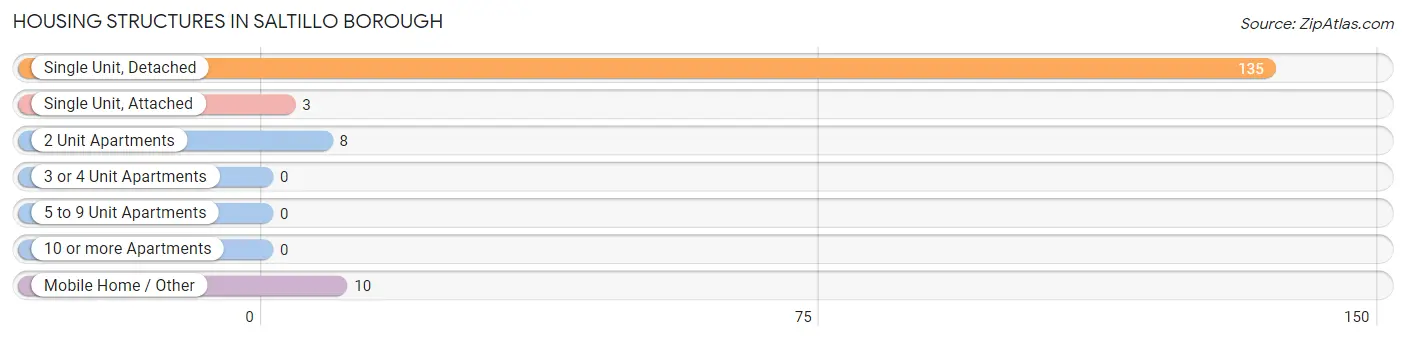
| Structure Type | # Housing Units | % Housing Units |
| Single Unit, Detached | 135 | 86.5% |
| Single Unit, Attached | 3 | 1.9% |
| 2 Unit Apartments | 8 | 5.1% |
| 3 or 4 Unit Apartments | 0 | 0.0% |
| 5 to 9 Unit Apartments | 0 | 0.0% |
| 10 or more Apartments | 0 | 0.0% |
| Mobile Home / Other | 10 | 6.4% |
| Total | 156 | 100.0% |
Housing Structures by Occupancy in Saltillo borough
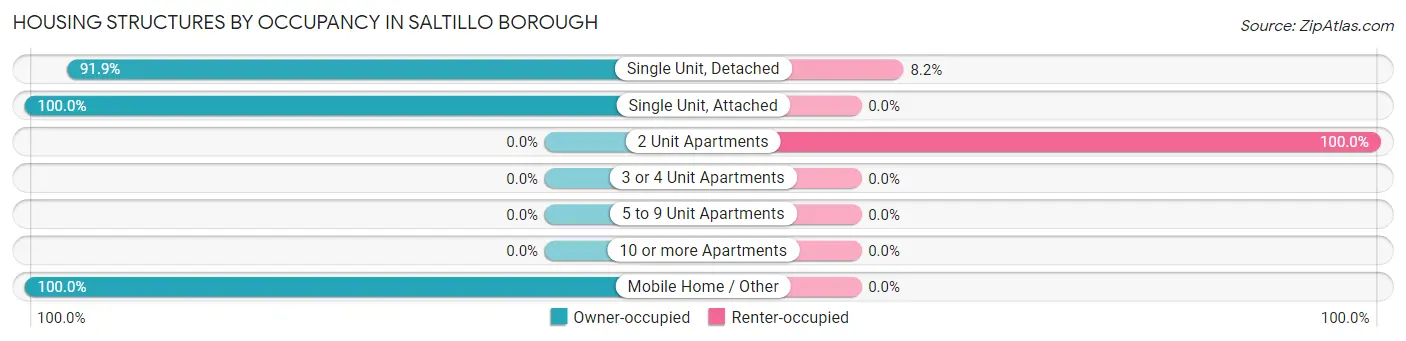
| Structure Type | Owner-occupied | Renter-occupied |
| Single Unit, Detached | 124 (91.8%) | 11 (8.2%) |
| Single Unit, Attached | 3 (100.0%) | 0 (0.0%) |
| 2 Unit Apartments | 0 (0.0%) | 8 (100.0%) |
| 3 or 4 Unit Apartments | 0 (0.0%) | 0 (0.0%) |
| 5 to 9 Unit Apartments | 0 (0.0%) | 0 (0.0%) |
| 10 or more Apartments | 0 (0.0%) | 0 (0.0%) |
| Mobile Home / Other | 10 (100.0%) | 0 (0.0%) |
| Total | 137 (87.8%) | 19 (12.2%) |
Housing Structures by Number of Rooms in Saltillo borough
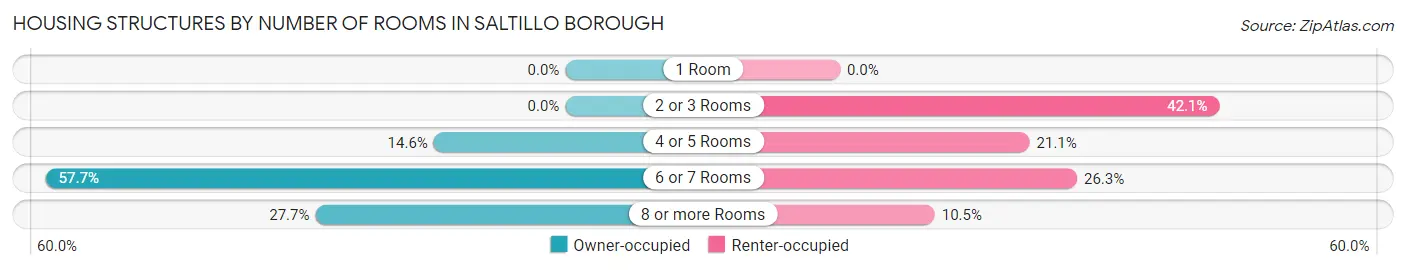
| Number of Rooms | Owner-occupied | Renter-occupied |
| 1 Room | 0 (0.0%) | 0 (0.0%) |
| 2 or 3 Rooms | 0 (0.0%) | 8 (42.1%) |
| 4 or 5 Rooms | 20 (14.6%) | 4 (21.0%) |
| 6 or 7 Rooms | 79 (57.7%) | 5 (26.3%) |
| 8 or more Rooms | 38 (27.7%) | 2 (10.5%) |
| Total | 137 (100.0%) | 19 (100.0%) |
Housing Structure by Heating Type in Saltillo borough
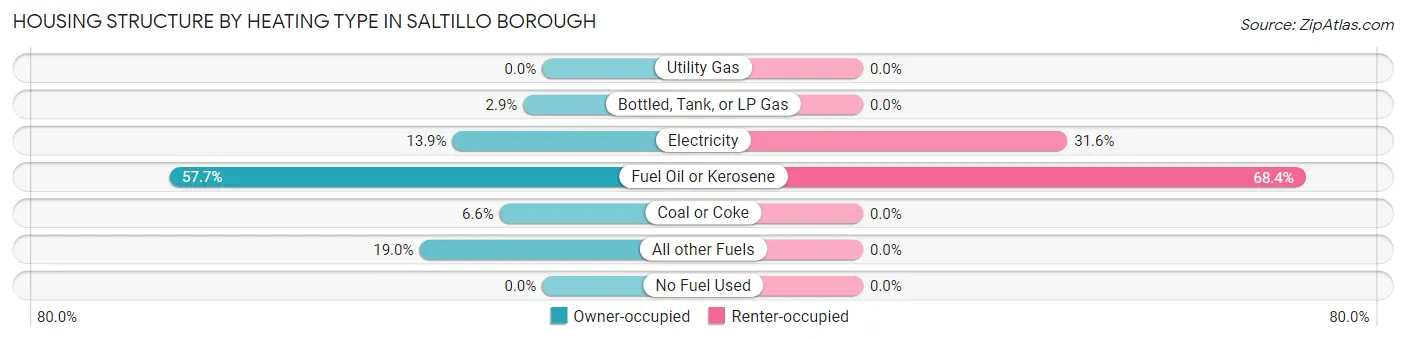
| Heating Type | Owner-occupied | Renter-occupied |
| Utility Gas | 0 (0.0%) | 0 (0.0%) |
| Bottled, Tank, or LP Gas | 4 (2.9%) | 0 (0.0%) |
| Electricity | 19 (13.9%) | 6 (31.6%) |
| Fuel Oil or Kerosene | 79 (57.7%) | 13 (68.4%) |
| Coal or Coke | 9 (6.6%) | 0 (0.0%) |
| All other Fuels | 26 (19.0%) | 0 (0.0%) |
| No Fuel Used | 0 (0.0%) | 0 (0.0%) |
| Total | 137 (100.0%) | 19 (100.0%) |
Household Vehicle Usage in Saltillo borough
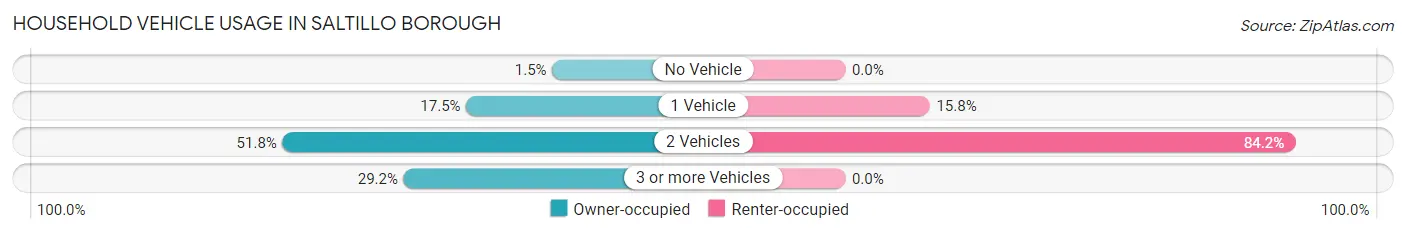
| Vehicles per Household | Owner-occupied | Renter-occupied |
| No Vehicle | 2 (1.5%) | 0 (0.0%) |
| 1 Vehicle | 24 (17.5%) | 3 (15.8%) |
| 2 Vehicles | 71 (51.8%) | 16 (84.2%) |
| 3 or more Vehicles | 40 (29.2%) | 0 (0.0%) |
| Total | 137 (100.0%) | 19 (100.0%) |
Real Estate & Mortgages in Saltillo borough
Real Estate and Mortgage Overview in Saltillo borough
| Characteristic | Without Mortgage | With Mortgage |
| Housing Units | 53 | 84 |
| Median Property Value | $102,600 | $146,400 |
| Median Household Income | $69,688 | $7 |
| Monthly Housing Costs | $446 | $0 |
| Real Estate Taxes | $895 | $20 |
Property Value by Mortgage Status in Saltillo borough
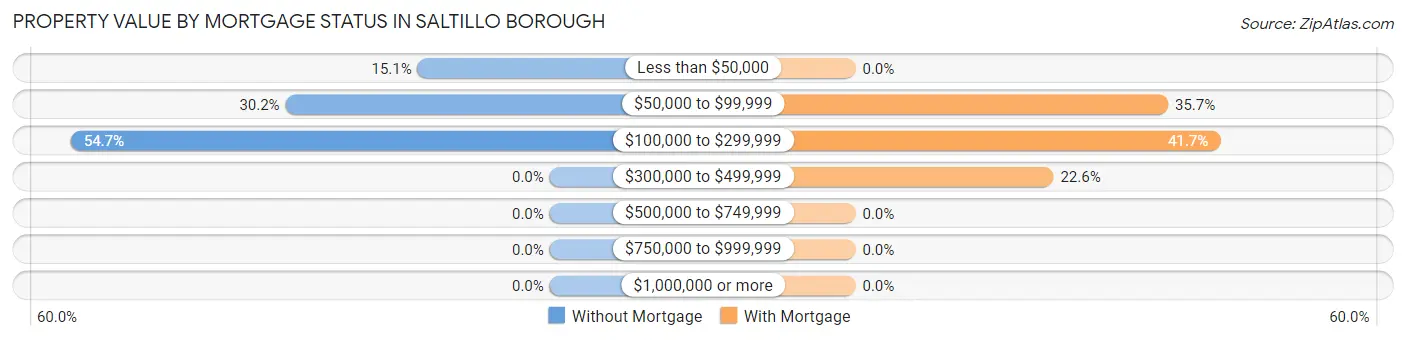
| Property Value | Without Mortgage | With Mortgage |
| Less than $50,000 | 8 (15.1%) | 0 (0.0%) |
| $50,000 to $99,999 | 16 (30.2%) | 30 (35.7%) |
| $100,000 to $299,999 | 29 (54.7%) | 35 (41.7%) |
| $300,000 to $499,999 | 0 (0.0%) | 19 (22.6%) |
| $500,000 to $749,999 | 0 (0.0%) | 0 (0.0%) |
| $750,000 to $999,999 | 0 (0.0%) | 0 (0.0%) |
| $1,000,000 or more | 0 (0.0%) | 0 (0.0%) |
| Total | 53 (100.0%) | 84 (100.0%) |
Household Income by Mortgage Status in Saltillo borough
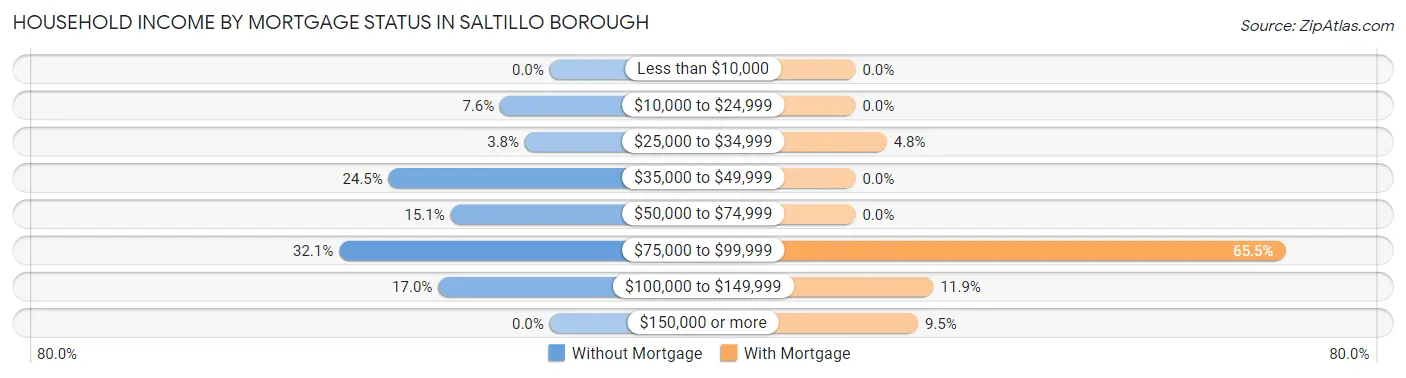
| Household Income | Without Mortgage | With Mortgage |
| Less than $10,000 | 0 (0.0%) | 0 (0.0%) |
| $10,000 to $24,999 | 4 (7.5%) | 0 (0.0%) |
| $25,000 to $34,999 | 2 (3.8%) | 4 (4.8%) |
| $35,000 to $49,999 | 13 (24.5%) | 0 (0.0%) |
| $50,000 to $74,999 | 8 (15.1%) | 0 (0.0%) |
| $75,000 to $99,999 | 17 (32.1%) | 55 (65.5%) |
| $100,000 to $149,999 | 9 (17.0%) | 10 (11.9%) |
| $150,000 or more | 0 (0.0%) | 8 (9.5%) |
| Total | 53 (100.0%) | 84 (100.0%) |
Property Value to Household Income Ratio in Saltillo borough
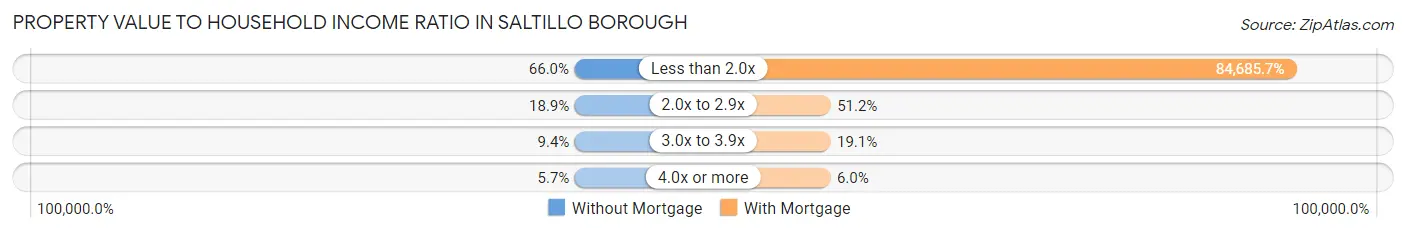
| Value-to-Income Ratio | Without Mortgage | With Mortgage |
| Less than 2.0x | 35 (66.0%) | 71,136 (84,685.7%) |
| 2.0x to 2.9x | 10 (18.9%) | 43 (51.2%) |
| 3.0x to 3.9x | 5 (9.4%) | 16 (19.1%) |
| 4.0x or more | 3 (5.7%) | 5 (5.9%) |
| Total | 53 (100.0%) | 84 (100.0%) |
Real Estate Taxes by Mortgage Status in Saltillo borough
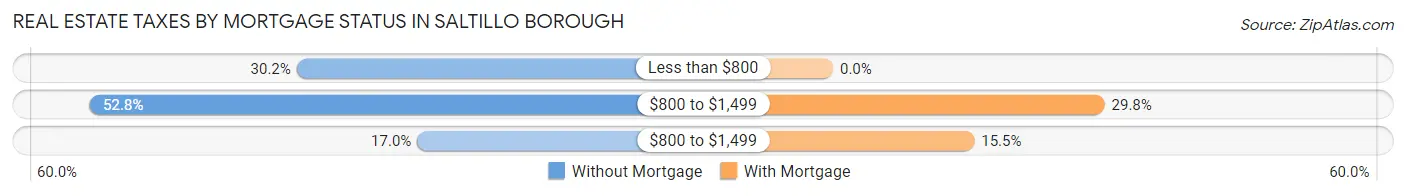
| Property Taxes | Without Mortgage | With Mortgage |
| Less than $800 | 16 (30.2%) | 0 (0.0%) |
| $800 to $1,499 | 28 (52.8%) | 25 (29.8%) |
| $800 to $1,499 | 9 (17.0%) | 13 (15.5%) |
| Total | 53 (100.0%) | 84 (100.0%) |
Health & Disability in Saltillo borough
Health Insurance Coverage by Age in Saltillo borough
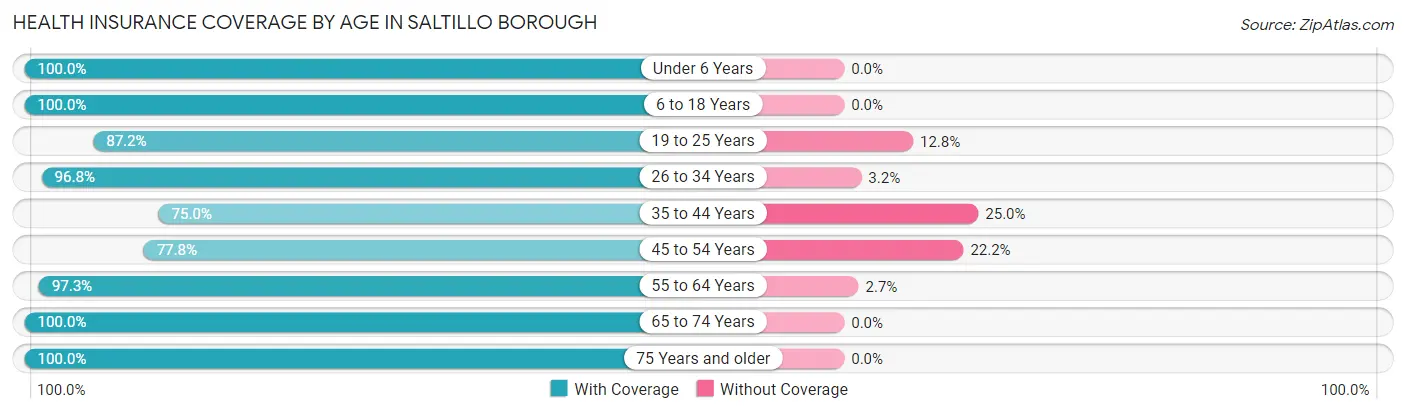
| Age Bracket | With Coverage | Without Coverage |
| Under 6 Years | 64 (100.0%) | 0 (0.0%) |
| 6 to 18 Years | 76 (100.0%) | 0 (0.0%) |
| 19 to 25 Years | 34 (87.2%) | 5 (12.8%) |
| 26 to 34 Years | 91 (96.8%) | 3 (3.2%) |
| 35 to 44 Years | 18 (75.0%) | 6 (25.0%) |
| 45 to 54 Years | 35 (77.8%) | 10 (22.2%) |
| 55 to 64 Years | 73 (97.3%) | 2 (2.7%) |
| 65 to 74 Years | 24 (100.0%) | 0 (0.0%) |
| 75 Years and older | 18 (100.0%) | 0 (0.0%) |
| Total | 433 (94.3%) | 26 (5.7%) |
Health Insurance Coverage by Citizenship Status in Saltillo borough
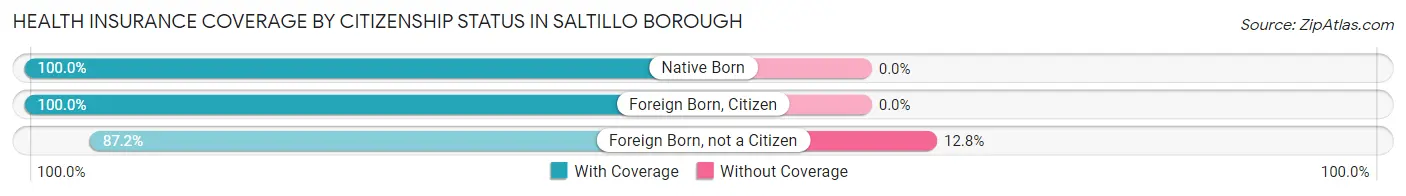
| Citizenship Status | With Coverage | Without Coverage |
| Native Born | 64 (100.0%) | 0 (0.0%) |
| Foreign Born, Citizen | 76 (100.0%) | 0 (0.0%) |
| Foreign Born, not a Citizen | 34 (87.2%) | 5 (12.8%) |
Health Insurance Coverage by Household Income in Saltillo borough
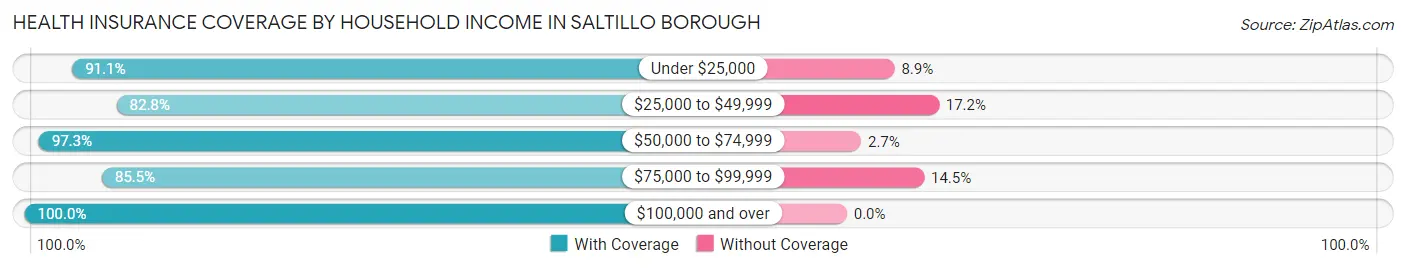
| Household Income | With Coverage | Without Coverage |
| Under $25,000 | 51 (91.1%) | 5 (8.9%) |
| $25,000 to $49,999 | 24 (82.8%) | 5 (17.2%) |
| $50,000 to $74,999 | 182 (97.3%) | 5 (2.7%) |
| $75,000 to $99,999 | 65 (85.5%) | 11 (14.5%) |
| $100,000 and over | 111 (100.0%) | 0 (0.0%) |
Public vs Private Health Insurance Coverage by Age in Saltillo borough
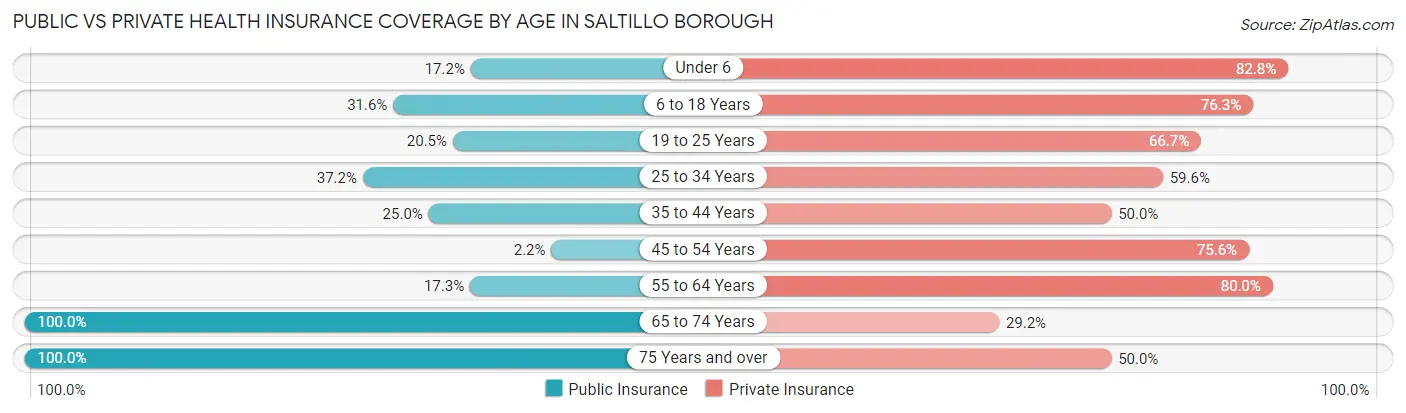
| Age Bracket | Public Insurance | Private Insurance |
| Under 6 | 11 (17.2%) | 53 (82.8%) |
| 6 to 18 Years | 24 (31.6%) | 58 (76.3%) |
| 19 to 25 Years | 8 (20.5%) | 26 (66.7%) |
| 25 to 34 Years | 35 (37.2%) | 56 (59.6%) |
| 35 to 44 Years | 6 (25.0%) | 12 (50.0%) |
| 45 to 54 Years | 1 (2.2%) | 34 (75.6%) |
| 55 to 64 Years | 13 (17.3%) | 60 (80.0%) |
| 65 to 74 Years | 24 (100.0%) | 7 (29.2%) |
| 75 Years and over | 18 (100.0%) | 9 (50.0%) |
| Total | 140 (30.5%) | 315 (68.6%) |
Disability Status by Sex by Age in Saltillo borough
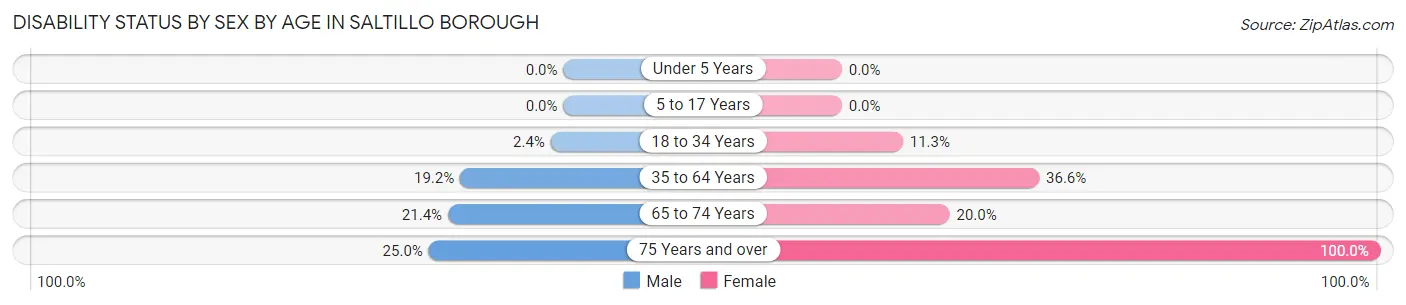
| Age Bracket | Male | Female |
| Under 5 Years | 0 (0.0%) | 0 (0.0%) |
| 5 to 17 Years | 0 (0.0%) | 0 (0.0%) |
| 18 to 34 Years | 2 (2.4%) | 6 (11.3%) |
| 35 to 64 Years | 14 (19.2%) | 26 (36.6%) |
| 65 to 74 Years | 3 (21.4%) | 2 (20.0%) |
| 75 Years and over | 2 (25.0%) | 10 (100.0%) |
Disability Class by Sex by Age in Saltillo borough
Disability Class: Hearing Difficulty
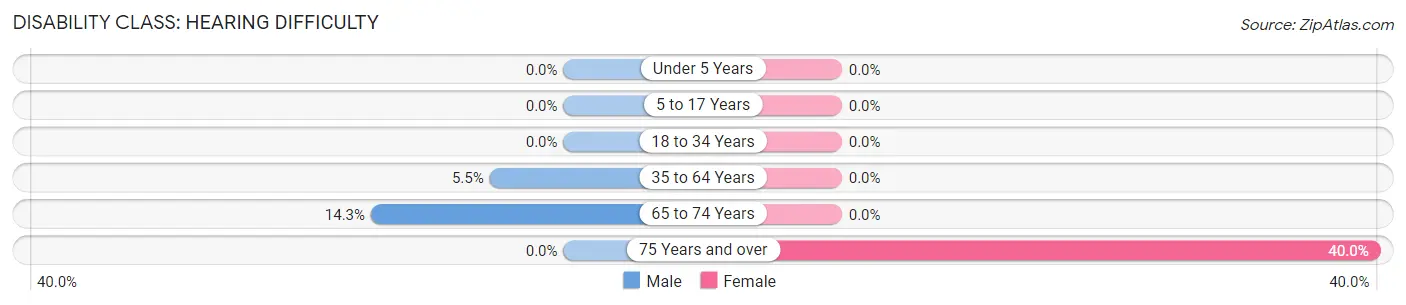
| Age Bracket | Male | Female |
| Under 5 Years | 0 (0.0%) | 0 (0.0%) |
| 5 to 17 Years | 0 (0.0%) | 0 (0.0%) |
| 18 to 34 Years | 0 (0.0%) | 0 (0.0%) |
| 35 to 64 Years | 4 (5.5%) | 0 (0.0%) |
| 65 to 74 Years | 2 (14.3%) | 0 (0.0%) |
| 75 Years and over | 0 (0.0%) | 4 (40.0%) |
Disability Class: Vision Difficulty
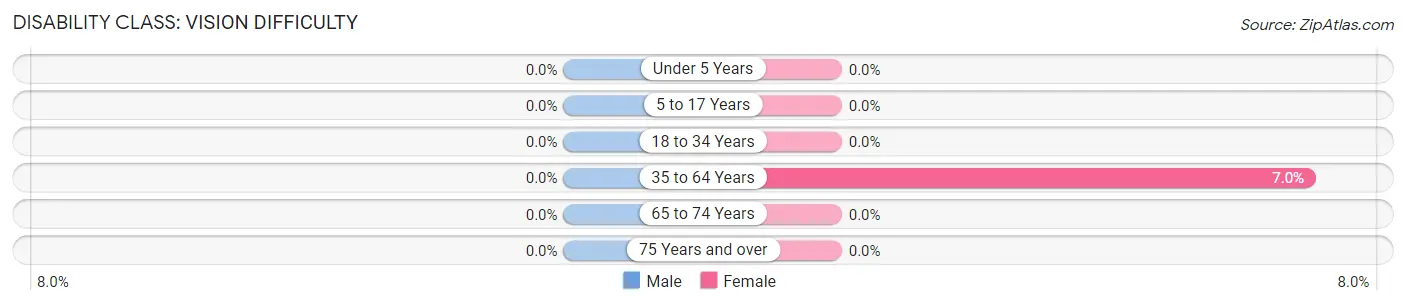
| Age Bracket | Male | Female |
| Under 5 Years | 0 (0.0%) | 0 (0.0%) |
| 5 to 17 Years | 0 (0.0%) | 0 (0.0%) |
| 18 to 34 Years | 0 (0.0%) | 0 (0.0%) |
| 35 to 64 Years | 0 (0.0%) | 5 (7.0%) |
| 65 to 74 Years | 0 (0.0%) | 0 (0.0%) |
| 75 Years and over | 0 (0.0%) | 0 (0.0%) |
Disability Class: Cognitive Difficulty
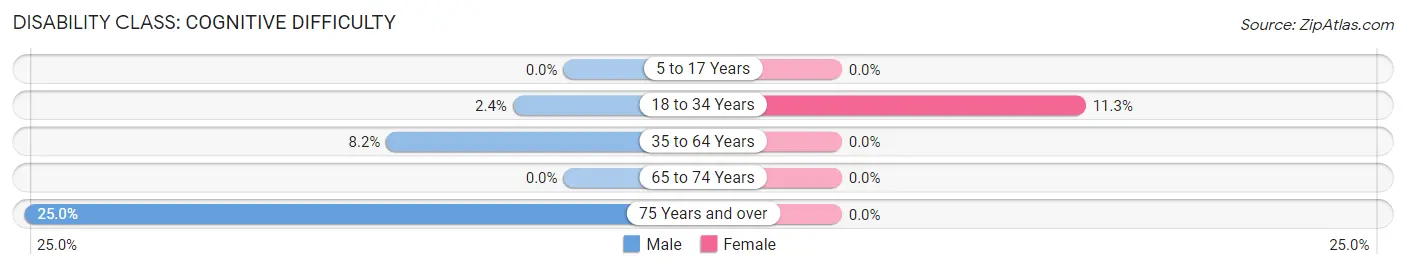
| Age Bracket | Male | Female |
| 5 to 17 Years | 0 (0.0%) | 0 (0.0%) |
| 18 to 34 Years | 2 (2.4%) | 6 (11.3%) |
| 35 to 64 Years | 6 (8.2%) | 0 (0.0%) |
| 65 to 74 Years | 0 (0.0%) | 0 (0.0%) |
| 75 Years and over | 2 (25.0%) | 0 (0.0%) |
Disability Class: Ambulatory Difficulty
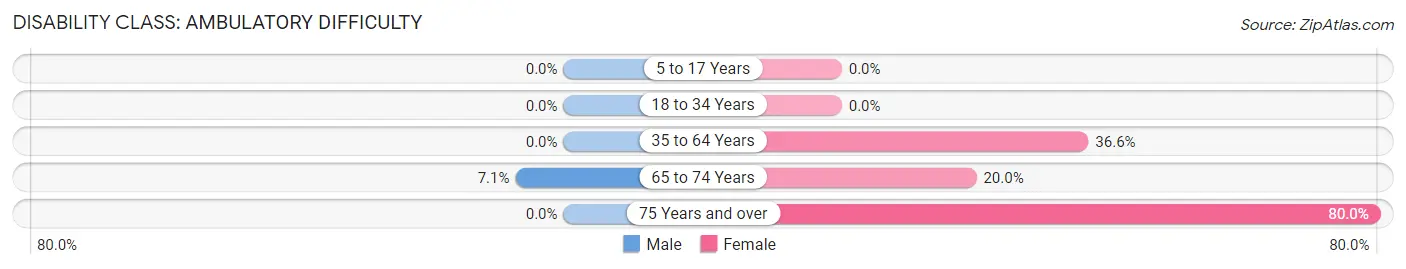
| Age Bracket | Male | Female |
| 5 to 17 Years | 0 (0.0%) | 0 (0.0%) |
| 18 to 34 Years | 0 (0.0%) | 0 (0.0%) |
| 35 to 64 Years | 0 (0.0%) | 26 (36.6%) |
| 65 to 74 Years | 1 (7.1%) | 2 (20.0%) |
| 75 Years and over | 0 (0.0%) | 8 (80.0%) |
Disability Class: Self-Care Difficulty
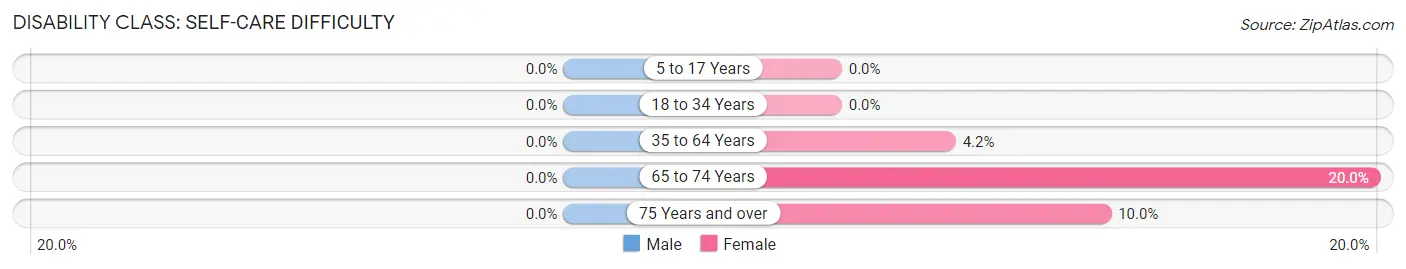
| Age Bracket | Male | Female |
| 5 to 17 Years | 0 (0.0%) | 0 (0.0%) |
| 18 to 34 Years | 0 (0.0%) | 0 (0.0%) |
| 35 to 64 Years | 0 (0.0%) | 3 (4.2%) |
| 65 to 74 Years | 0 (0.0%) | 2 (20.0%) |
| 75 Years and over | 0 (0.0%) | 1 (10.0%) |
Technology Access in Saltillo borough
Computing Device Access in Saltillo borough
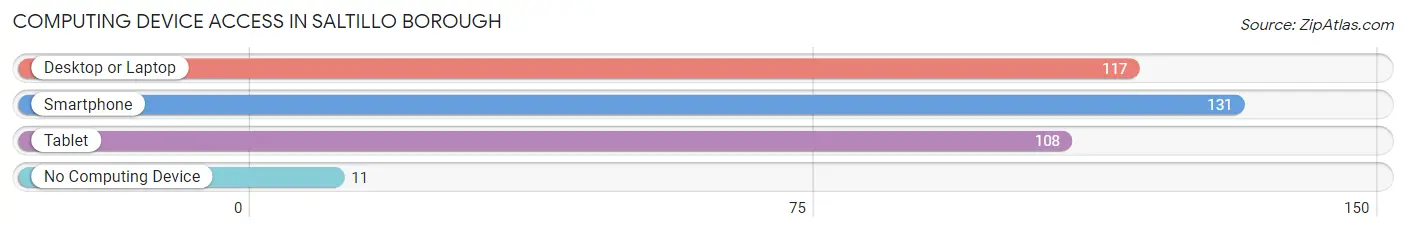
| Device Type | # Households | % Households |
| Desktop or Laptop | 117 | 75.0% |
| Smartphone | 131 | 84.0% |
| Tablet | 108 | 69.2% |
| No Computing Device | 11 | 7.0% |
| Total | 156 | 100.0% |
Internet Access in Saltillo borough
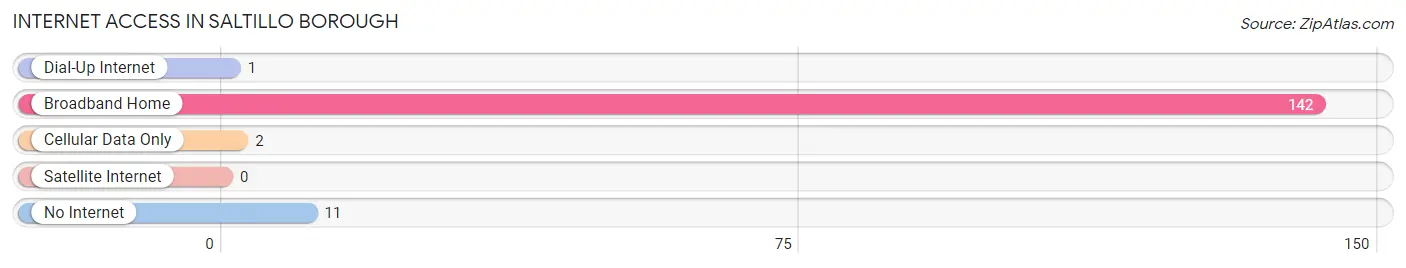
| Internet Type | # Households | % Households |
| Dial-Up Internet | 1 | 0.6% |
| Broadband Home | 142 | 91.0% |
| Cellular Data Only | 2 | 1.3% |
| Satellite Internet | 0 | 0.0% |
| No Internet | 11 | 7.0% |
| Total | 156 | 100.0% |
Saltillo borough Summary
SITUATION
Situated in the heart of Pennsylvania, the borough of Saltillo is a small rural community located in Juniata County. The borough is located in the Appalachian Mountains and is surrounded by rolling hills and lush forests. The population of Saltillo is approximately 1,000 people, with a median age of 44.7 years. The median household income is $37,917, and the median home value is $90,000. The borough is served by the Juniata County School District, which provides education to students from kindergarten through 12th grade.
HISTORY
Saltillo was founded in 1820 by a group of settlers from the nearby town of Mifflintown. The settlers named the town after the Mexican city of Saltillo, which was the birthplace of one of the settlers. The town was originally a farming community, and the settlers grew a variety of crops, including wheat, corn, and oats. The town was also home to a number of small businesses, including a blacksmith, a general store, and a sawmill.
In the late 19th century, the town began to experience a period of growth and prosperity. The railroad arrived in 1887, and the town was connected to the larger cities of Harrisburg and Philadelphia. This allowed the town to become a center for commerce and industry. The town also became a popular tourist destination, as it was located near several popular attractions, including the Pennsylvania Grand Canyon and the Appalachian Trail.
In the early 20th century, the town experienced a period of decline. The railroad was abandoned in the 1920s, and the town’s businesses began to close. The population of the town began to decline, and by the 1950s, the town had become a virtual ghost town.
In the late 20th century, the town began to experience a period of revitalization. The railroad was restored in the 1980s, and the town began to attract new businesses and residents. Today, the town is a vibrant community with a variety of businesses and attractions.
GEOGRAPHY
Saltillo is located in the Appalachian Mountains of Pennsylvania. The town is situated in a valley surrounded by rolling hills and lush forests. The town is located near several popular attractions, including the Pennsylvania Grand Canyon and the Appalachian Trail. The town is also located near the Juniata River, which provides a variety of recreational opportunities.
The climate in Saltillo is temperate, with warm summers and cold winters. The average temperature in the summer is around 75 degrees Fahrenheit, and the average temperature in the winter is around 30 degrees Fahrenheit. The town receives an average of 40 inches of precipitation per year.
ECONOMY
The economy of Saltillo is largely based on tourism and agriculture. The town is home to a variety of tourist attractions, including the Pennsylvania Grand Canyon and the Appalachian Trail. The town is also home to several farms, which produce a variety of crops, including wheat, corn, and oats.
The town is also home to a number of small businesses, including restaurants, shops, and a variety of services. The town is served by the Juniata County School District, which provides education to students from kindergarten through 12th grade.
DEMOGRAPHICS
The population of Saltillo is approximately 1,000 people, with a median age of 44.7 years. The median household income is $37,917, and the median home value is $90,000. The town is predominantly white, with a small minority population. The town is served by the Juniata County School District, which provides education to students from kindergarten through 12th grade.
Common Questions
What is Per Capita Income in Saltillo borough?
Per Capita income in Saltillo borough is $24,763.
What is the Median Family Income in Saltillo borough?
Median Family Income in Saltillo borough is $71,071.
What is the Median Household income in Saltillo borough?
Median Household Income in Saltillo borough is $70,114.
What is Income or Wage Gap in Saltillo borough?
Income or Wage Gap in Saltillo borough is 52.3%.
Women in Saltillo borough earn 47.7 cents for every dollar earned by a man.
What is Inequality or Gini Index in Saltillo borough?
Inequality or Gini Index in Saltillo borough is 0.26.
What is the Total Population of Saltillo borough?
Total Population of Saltillo borough is 459.
What is the Total Male Population of Saltillo borough?
Total Male Population of Saltillo borough is 251.
What is the Total Female Population of Saltillo borough?
Total Female Population of Saltillo borough is 208.
What is the Ratio of Males per 100 Females in Saltillo borough?
There are 120.67 Males per 100 Females in Saltillo borough.
What is the Ratio of Females per 100 Males in Saltillo borough?
There are 82.87 Females per 100 Males in Saltillo borough.
What is the Median Population Age in Saltillo borough?
Median Population Age in Saltillo borough is 28.7 Years.
What is the Average Family Size in Saltillo borough
Average Family Size in Saltillo borough is 3.7 People.
What is the Average Household Size in Saltillo borough
Average Household Size in Saltillo borough is 2.9 People.
How Large is the Labor Force in Saltillo borough?
There are 229 People in the Labor Forcein in Saltillo borough.
What is the Percentage of People in the Labor Force in Saltillo borough?
66.6% of People are in the Labor Force in Saltillo borough.
What is the Unemployment Rate in Saltillo borough?
Unemployment Rate in Saltillo borough is 0.4%.