Armagh borough, PA Map & Demographics
Armagh borough Overview
$38,132
PER CAPITA INCOME
$72,292
AVG FAMILY INCOME
$55,000
AVG HOUSEHOLD INCOME
19.6%
WAGE / INCOME GAP [ % ]
80.4¢/ $1
WAGE / INCOME GAP [ $ ]
0.39
INEQUALITY / GINI INDEX
88
TOTAL POPULATION
42
MALE POPULATION
46
FEMALE POPULATION
91.30
MALES / 100 FEMALES
109.52
FEMALES / 100 MALES
58.1
MEDIAN AGE
2.4
AVG FAMILY SIZE
1.9
AVG HOUSEHOLD SIZE
47
LABOR FORCE [ PEOPLE ]
56.6%
PERCENT IN LABOR FORCE
4.3%
UNEMPLOYMENT RATE
Income in Armagh borough
Income Overview in Armagh borough
Per Capita Income in Armagh borough is $38,132, while median incomes of families and households are $72,292 and $55,000 respectively.
| Characteristic | Number | Measure |
| Per Capita Income | 88 | $38,132 |
| Median Family Income | 31 | $72,292 |
| Mean Family Income | 31 | $87,965 |
| Median Household Income | 46 | $55,000 |
| Mean Household Income | 46 | $68,152 |
| Income Deficit | 31 | $0 |
| Wage / Income Gap (%) | 88 | 19.60% |
| Wage / Income Gap ($) | 88 | 80.40¢ per $1 |
| Gini / Inequality Index | 88 | 0.39 |
Earnings by Sex in Armagh borough
Average Earnings in Armagh borough are $49,063, $55,000 for men and $44,219 for women, a difference of 19.6%.
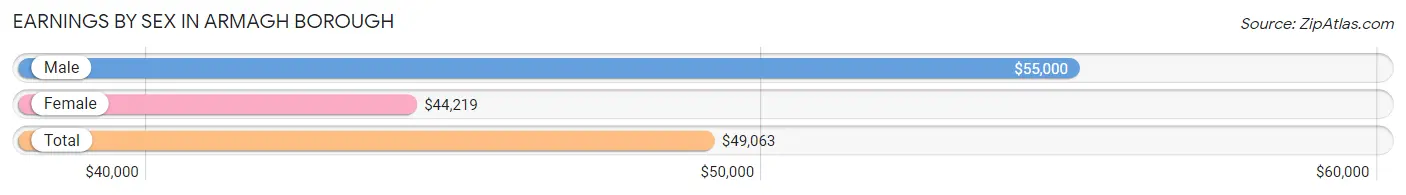
| Sex | Number | Average Earnings |
| Male | 20 (39.2%) | $55,000 |
| Female | 31 (60.8%) | $44,219 |
| Total | 51 (100.0%) | $49,063 |
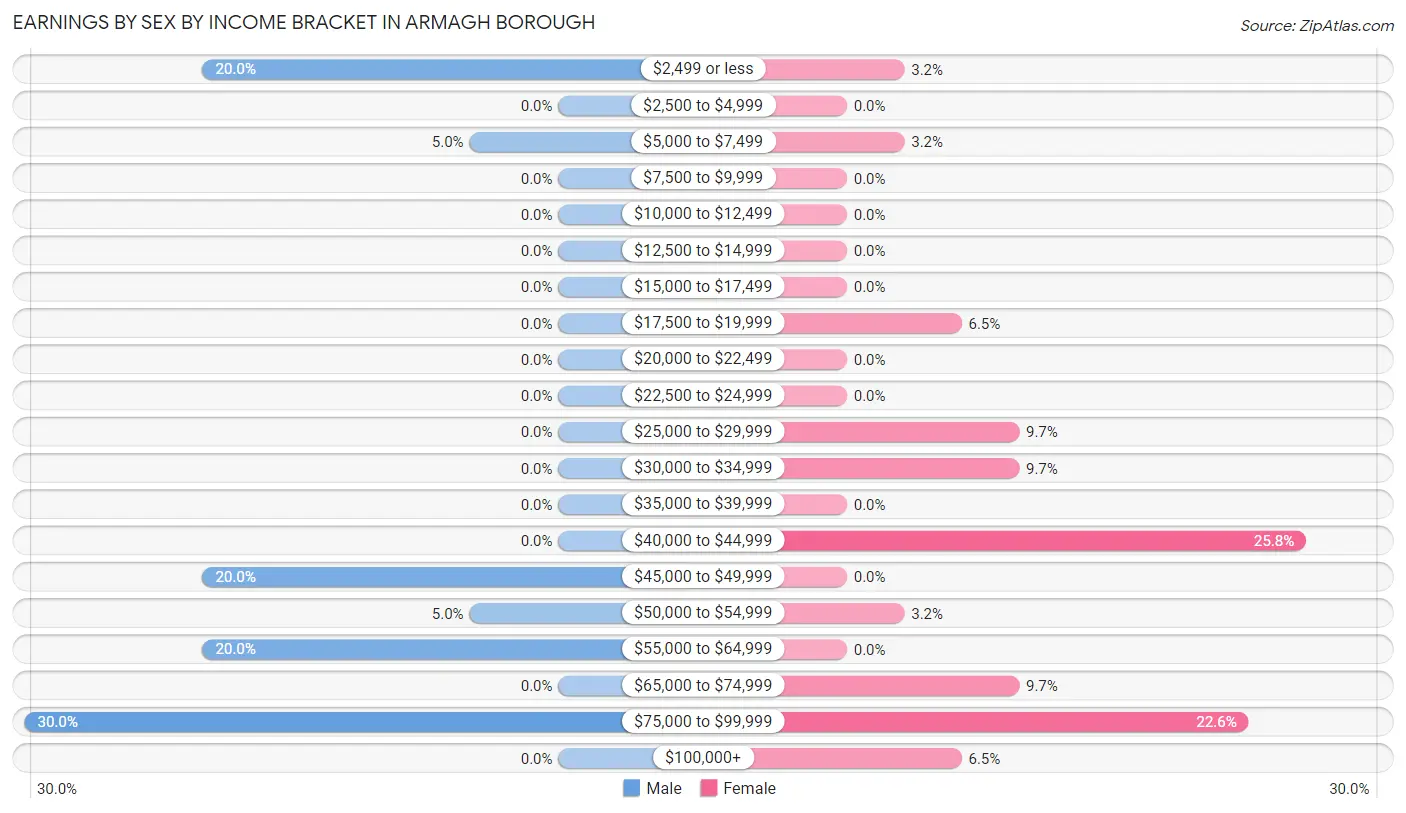
Earnings by Sex by Income Bracket in Armagh borough
The most common earnings brackets in Armagh borough are $75,000 to $99,999 for men (6 | 30.0%) and $40,000 to $44,999 for women (8 | 25.8%).
| Income | Male | Female |
| $2,499 or less | 4 (20.0%) | 1 (3.2%) |
| $2,500 to $4,999 | 0 (0.0%) | 0 (0.0%) |
| $5,000 to $7,499 | 1 (5.0%) | 1 (3.2%) |
| $7,500 to $9,999 | 0 (0.0%) | 0 (0.0%) |
| $10,000 to $12,499 | 0 (0.0%) | 0 (0.0%) |
| $12,500 to $14,999 | 0 (0.0%) | 0 (0.0%) |
| $15,000 to $17,499 | 0 (0.0%) | 0 (0.0%) |
| $17,500 to $19,999 | 0 (0.0%) | 2 (6.5%) |
| $20,000 to $22,499 | 0 (0.0%) | 0 (0.0%) |
| $22,500 to $24,999 | 0 (0.0%) | 0 (0.0%) |
| $25,000 to $29,999 | 0 (0.0%) | 3 (9.7%) |
| $30,000 to $34,999 | 0 (0.0%) | 3 (9.7%) |
| $35,000 to $39,999 | 0 (0.0%) | 0 (0.0%) |
| $40,000 to $44,999 | 0 (0.0%) | 8 (25.8%) |
| $45,000 to $49,999 | 4 (20.0%) | 0 (0.0%) |
| $50,000 to $54,999 | 1 (5.0%) | 1 (3.2%) |
| $55,000 to $64,999 | 4 (20.0%) | 0 (0.0%) |
| $65,000 to $74,999 | 0 (0.0%) | 3 (9.7%) |
| $75,000 to $99,999 | 6 (30.0%) | 7 (22.6%) |
| $100,000+ | 0 (0.0%) | 2 (6.5%) |
| Total | 20 (100.0%) | 31 (100.0%) |
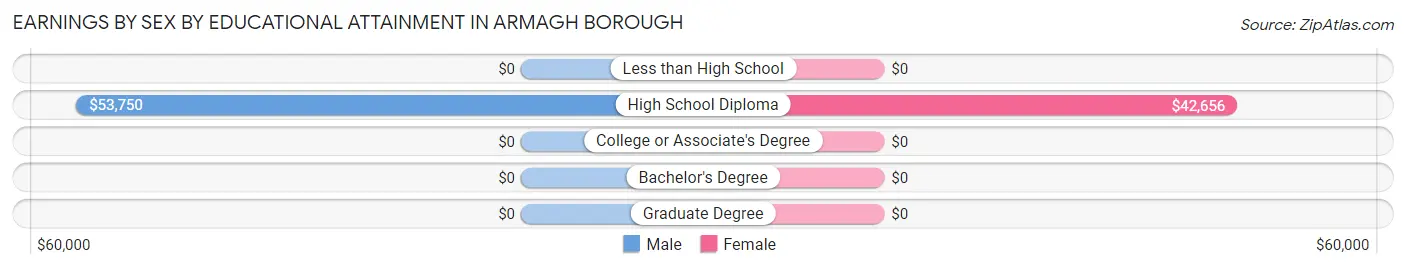
Earnings by Sex by Educational Attainment in Armagh borough
Average earnings in Armagh borough are $55,625 for men and $44,219 for women, a difference of 20.5%. Men with an educational attainment of high school diploma enjoy the highest average annual earnings of $53,750, while those with high school diploma education earn the least with $53,750. Women with an educational attainment of high school diploma earn the most with the average annual earnings of $42,656, while those with high school diploma education have the smallest earnings of $42,656.
| Educational Attainment | Male Income | Female Income |
| Less than High School | - | - |
| High School Diploma | $53,750 | $42,656 |
| College or Associate's Degree | - | - |
| Bachelor's Degree | - | - |
| Graduate Degree | - | - |
| Total | $55,625 | $44,219 |
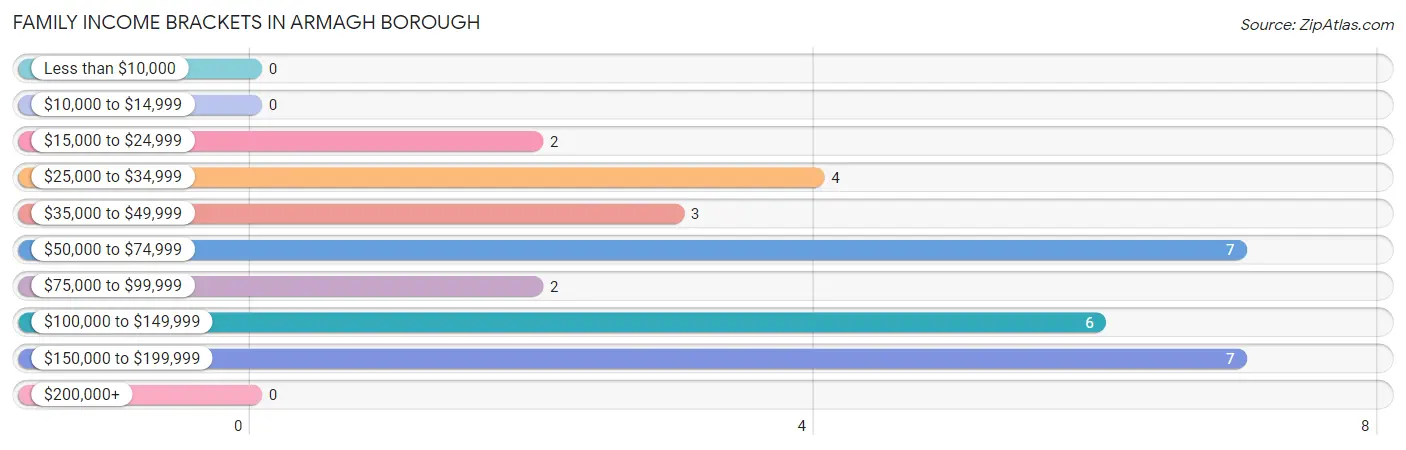
Family Income in Armagh borough
Family Income Brackets in Armagh borough
According to the Armagh borough family income data, there are 7 families falling into the $50,000 to $74,999 income range, which is the most common income bracket and makes up 22.6% of all families.
| Income Bracket | # Families | % Families |
| Less than $10,000 | 0 | 0.0% |
| $10,000 to $14,999 | 0 | 0.0% |
| $15,000 to $24,999 | 2 | 6.5% |
| $25,000 to $34,999 | 4 | 12.9% |
| $35,000 to $49,999 | 3 | 9.7% |
| $50,000 to $74,999 | 7 | 22.6% |
| $75,000 to $99,999 | 2 | 6.5% |
| $100,000 to $149,999 | 6 | 19.4% |
| $150,000 to $199,999 | 7 | 22.6% |
| $200,000+ | 0 | 0.0% |
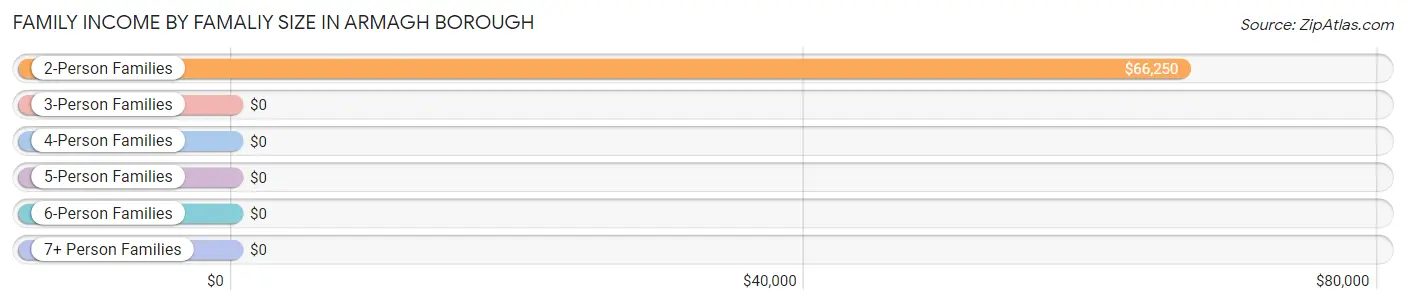
Family Income by Famaliy Size in Armagh borough
2-person families (20 | 64.5%) account for the highest median family income in Armagh borough with $66,250 per family, while 2-person families (20 | 64.5%) have the highest median income of $33,125 per family member.
| Income Bracket | # Families | Median Income |
| 2-Person Families | 20 (64.5%) | $66,250 |
| 3-Person Families | 11 (35.5%) | $0 |
| 4-Person Families | 0 (0.0%) | $0 |
| 5-Person Families | 0 (0.0%) | $0 |
| 6-Person Families | 0 (0.0%) | $0 |
| 7+ Person Families | 0 (0.0%) | $0 |
| Total | 31 (100.0%) | $72,292 |
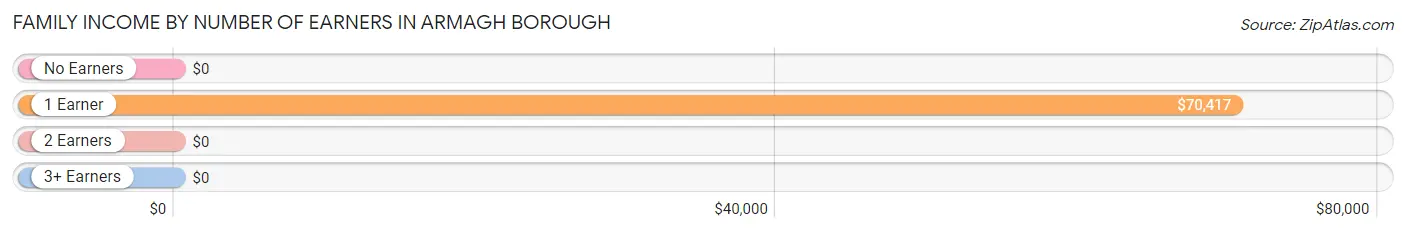
Family Income by Number of Earners in Armagh borough
| Number of Earners | # Families | Median Income |
| No Earners | 0 (0.0%) | $0 |
| 1 Earner | 16 (51.6%) | $70,417 |
| 2 Earners | 15 (48.4%) | $0 |
| 3+ Earners | 0 (0.0%) | $0 |
| Total | 31 (100.0%) | $72,292 |
Household Income in Armagh borough
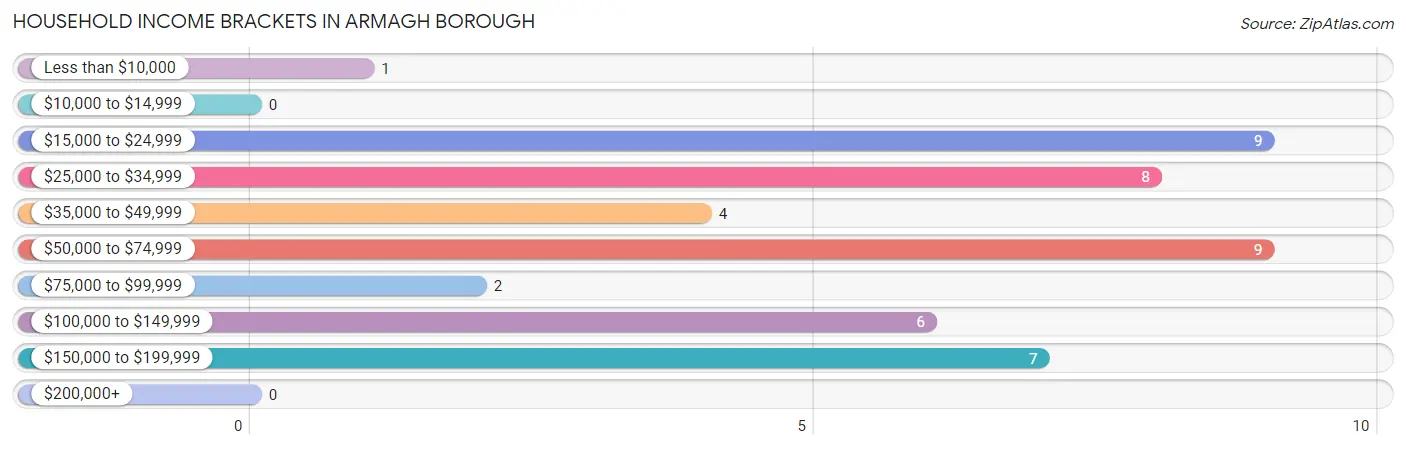
Household Income Brackets in Armagh borough
With 9 households falling in the category, the $15,000 to $24,999 income range is the most frequent in Armagh borough, accounting for 19.6% of all households.
| Income Bracket | # Households | % Households |
| Less than $10,000 | 1 | 2.2% |
| $10,000 to $14,999 | 0 | 0.0% |
| $15,000 to $24,999 | 9 | 19.6% |
| $25,000 to $34,999 | 8 | 17.4% |
| $35,000 to $49,999 | 4 | 8.7% |
| $50,000 to $74,999 | 9 | 19.6% |
| $75,000 to $99,999 | 2 | 4.3% |
| $100,000 to $149,999 | 6 | 13.0% |
| $150,000 to $199,999 | 7 | 15.2% |
| $200,000+ | 0 | 0.0% |
Household Income by Householder Age in Armagh borough
| Income Bracket | # Households | Median Income |
| 15 to 24 Years | 0 (0.0%) | $0 |
| 25 to 44 Years | 1 (2.2%) | $0 |
| 45 to 64 Years | 22 (47.8%) | $0 |
| 65+ Years | 23 (50.0%) | $0 |
| Total | 46 (100.0%) | $55,000 |
Poverty in Armagh borough
Income Below Poverty by Sex and Age in Armagh borough
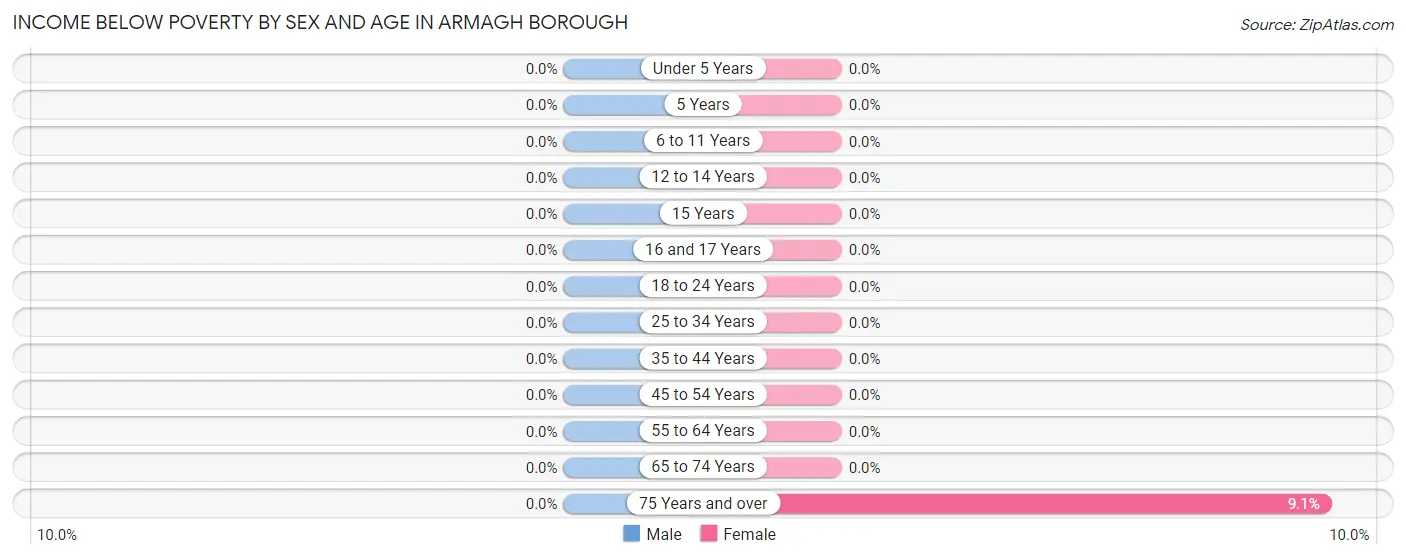
| Age Bracket | Male | Female |
| Under 5 Years | 0 (0.0%) | 0 (0.0%) |
| 5 Years | 0 (0.0%) | 0 (0.0%) |
| 6 to 11 Years | 0 (0.0%) | 0 (0.0%) |
| 12 to 14 Years | 0 (0.0%) | 0 (0.0%) |
| 15 Years | 0 (0.0%) | 0 (0.0%) |
| 16 and 17 Years | 0 (0.0%) | 0 (0.0%) |
| 18 to 24 Years | 0 (0.0%) | 0 (0.0%) |
| 25 to 34 Years | 0 (0.0%) | 0 (0.0%) |
| 35 to 44 Years | 0 (0.0%) | 0 (0.0%) |
| 45 to 54 Years | 0 (0.0%) | 0 (0.0%) |
| 55 to 64 Years | 0 (0.0%) | 0 (0.0%) |
| 65 to 74 Years | 0 (0.0%) | 0 (0.0%) |
| 75 Years and over | 0 (0.0%) | 1 (9.1%) |
| Total | 0 (0.0%) | 1 (2.2%) |
Income Above Poverty by Sex and Age in Armagh borough
According to the poverty statistics in Armagh borough, males aged 12 to 14 years and females aged 25 to 34 years are the age groups that are most secure financially, with 100.0% of males and 100.0% of females in these age groups living above the poverty line.
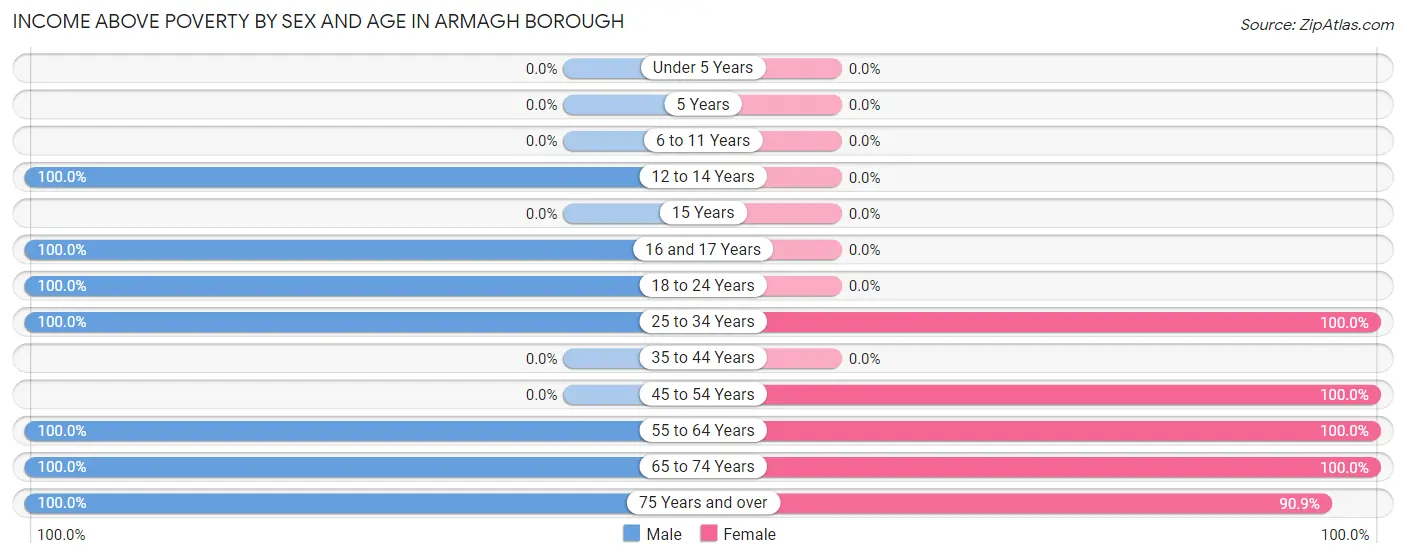
| Age Bracket | Male | Female |
| Under 5 Years | 0 (0.0%) | 0 (0.0%) |
| 5 Years | 0 (0.0%) | 0 (0.0%) |
| 6 to 11 Years | 0 (0.0%) | 0 (0.0%) |
| 12 to 14 Years | 5 (100.0%) | 0 (0.0%) |
| 15 Years | 0 (0.0%) | 0 (0.0%) |
| 16 and 17 Years | 4 (100.0%) | 0 (0.0%) |
| 18 to 24 Years | 3 (100.0%) | 0 (0.0%) |
| 25 to 34 Years | 4 (100.0%) | 1 (100.0%) |
| 35 to 44 Years | 0 (0.0%) | 0 (0.0%) |
| 45 to 54 Years | 0 (0.0%) | 16 (100.0%) |
| 55 to 64 Years | 11 (100.0%) | 16 (100.0%) |
| 65 to 74 Years | 10 (100.0%) | 2 (100.0%) |
| 75 Years and over | 5 (100.0%) | 10 (90.9%) |
| Total | 42 (100.0%) | 45 (97.8%) |
Income Below Poverty Among Married-Couple Families in Armagh borough
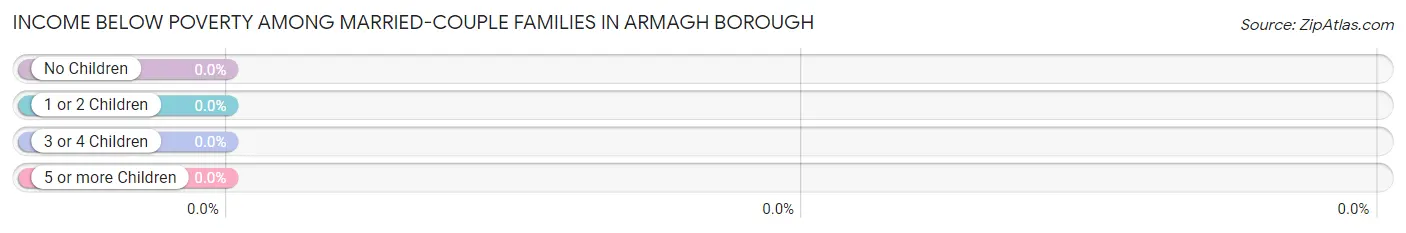
| Children | Above Poverty | Below Poverty |
| No Children | 15 (100.0%) | 0 (0.0%) |
| 1 or 2 Children | 7 (100.0%) | 0 (0.0%) |
| 3 or 4 Children | 0 (0.0%) | 0 (0.0%) |
| 5 or more Children | 0 (0.0%) | 0 (0.0%) |
| Total | 22 (100.0%) | 0 (0.0%) |
Income Below Poverty Among Single-Parent Households in Armagh borough
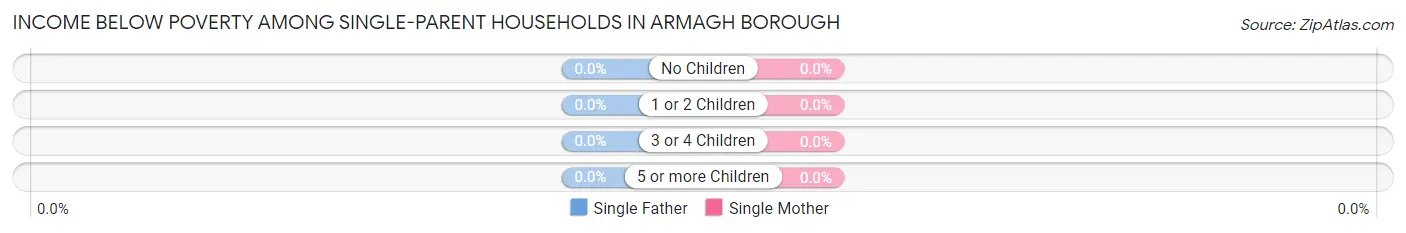
| Children | Single Father | Single Mother |
| No Children | 0 (0.0%) | 0 (0.0%) |
| 1 or 2 Children | 0 (0.0%) | 0 (0.0%) |
| 3 or 4 Children | 0 (0.0%) | 0 (0.0%) |
| 5 or more Children | 0 (0.0%) | 0 (0.0%) |
| Total | 0 (0.0%) | 0 (0.0%) |
Income Below Poverty Among Married-Couple vs Single-Parent Households in Armagh borough
| Children | Married-Couple Families | Single-Parent Households |
| No Children | 0 (0.0%) | 0 (0.0%) |
| 1 or 2 Children | 0 (0.0%) | 0 (0.0%) |
| 3 or 4 Children | 0 (0.0%) | 0 (0.0%) |
| 5 or more Children | 0 (0.0%) | 0 (0.0%) |
| Total | 0 (0.0%) | 0 (0.0%) |
Race in Armagh borough
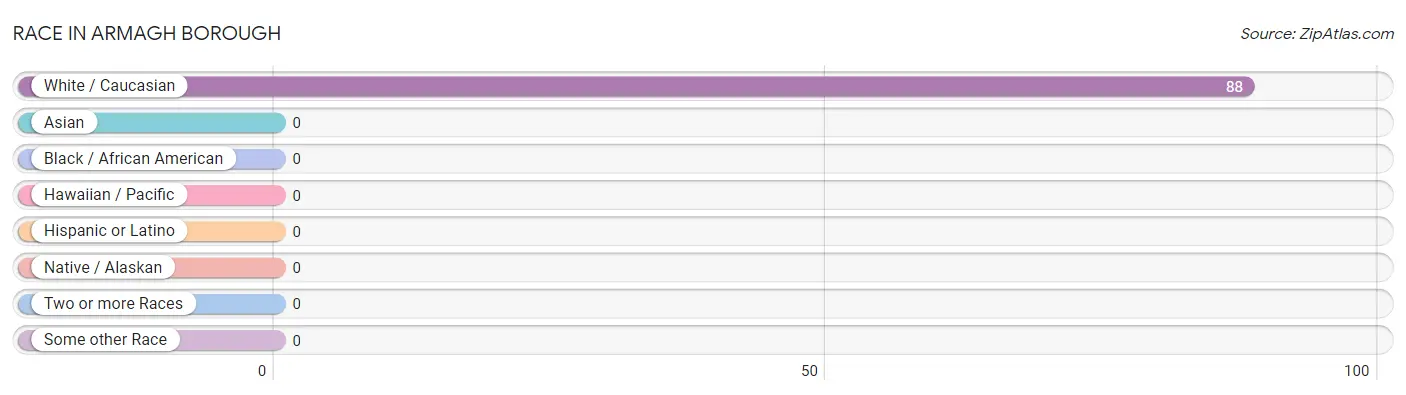
The most populous races in Armagh borough are , and White / Caucasian (88 | 100.0%).
| Race | # Population | % Population |
| Asian | 0 | 0.0% |
| Black / African American | 0 | 0.0% |
| Hawaiian / Pacific | 0 | 0.0% |
| Hispanic or Latino | 0 | 0.0% |
| Native / Alaskan | 0 | 0.0% |
| White / Caucasian | 88 | 100.0% |
| Two or more Races | 0 | 0.0% |
| Some other Race | 0 | 0.0% |
| Total | 88 | 100.0% |
Ancestry in Armagh borough
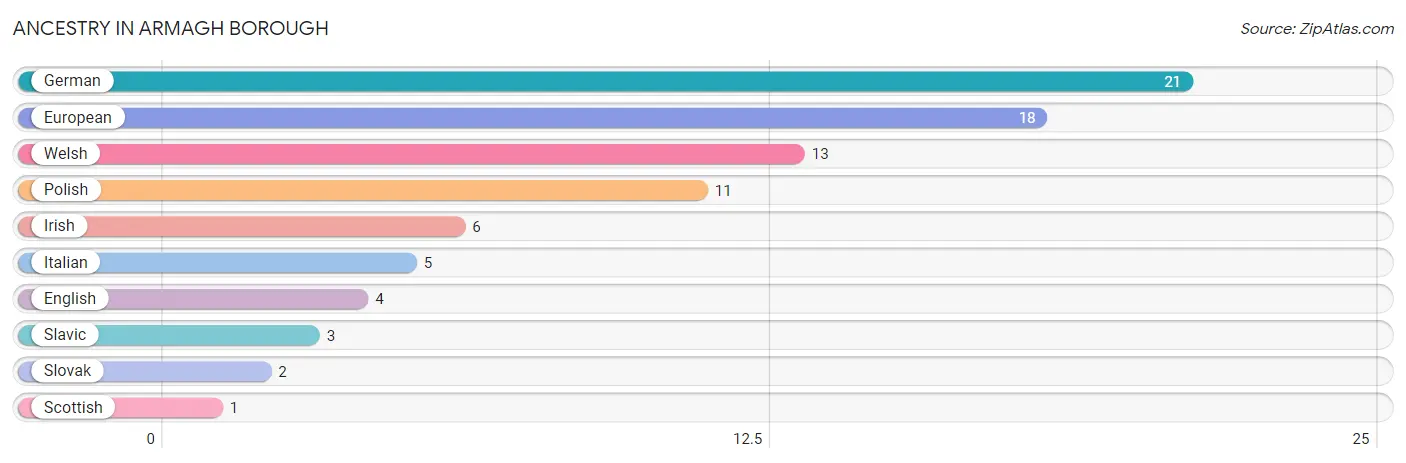
The most populous ancestries reported in Armagh borough are German (21 | 23.9%), European (18 | 20.4%), Welsh (13 | 14.8%), Polish (11 | 12.5%), and Irish (6 | 6.8%), together accounting for 78.4% of all Armagh borough residents.
| Ancestry | # Population | % Population |
| English | 4 | 4.5% |
| European | 18 | 20.4% |
| German | 21 | 23.9% |
| Irish | 6 | 6.8% |
| Italian | 5 | 5.7% |
| Polish | 11 | 12.5% |
| Scottish | 1 | 1.1% |
| Slavic | 3 | 3.4% |
| Slovak | 2 | 2.3% |
| Welsh | 13 | 14.8% | View All 10 Rows |
Immigrants in Armagh borough

| Immigration Origin | # Population | % Population | View All 0 Rows |
Sex and Age in Armagh borough
Sex and Age in Armagh borough
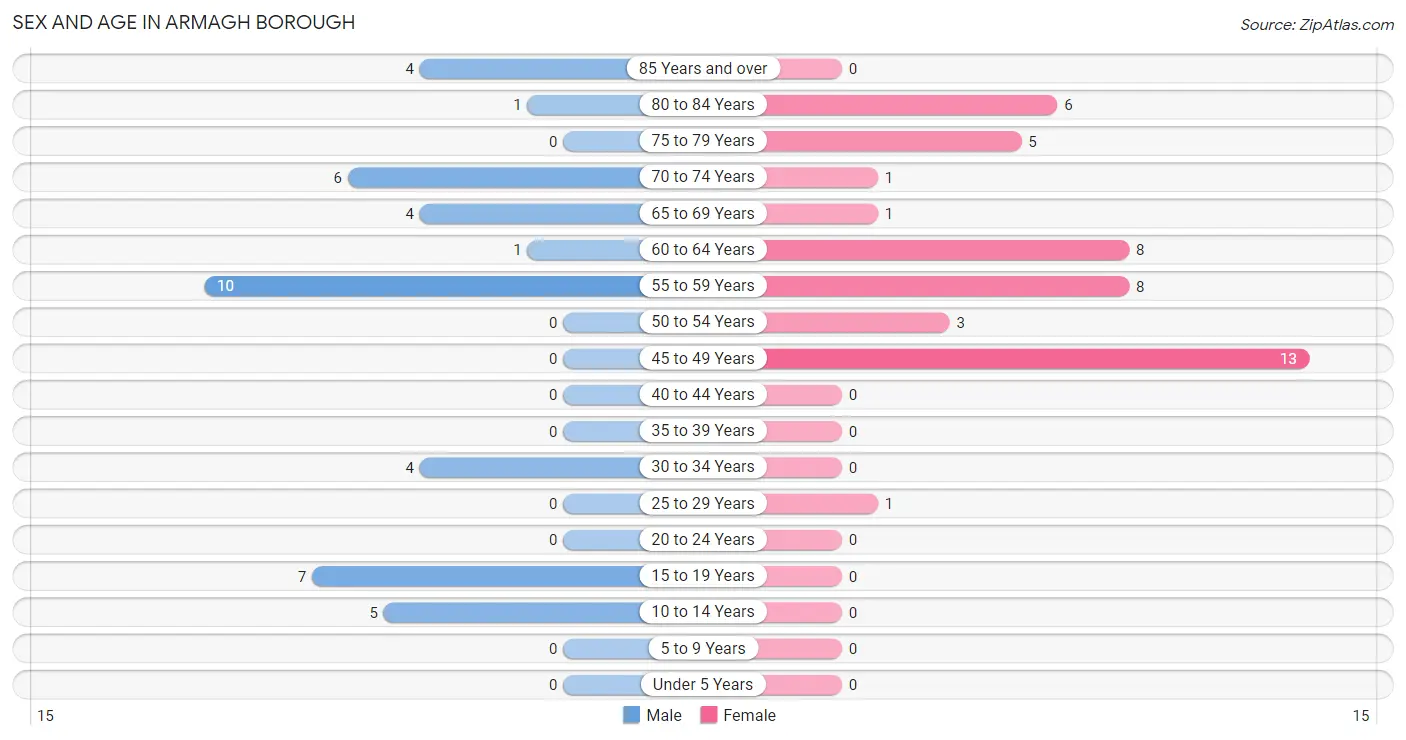
The most populous age groups in Armagh borough are 55 to 59 Years (10 | 23.8%) for men and 45 to 49 Years (13 | 28.3%) for women.
| Age Bracket | Male | Female |
| Under 5 Years | 0 (0.0%) | 0 (0.0%) |
| 5 to 9 Years | 0 (0.0%) | 0 (0.0%) |
| 10 to 14 Years | 5 (11.9%) | 0 (0.0%) |
| 15 to 19 Years | 7 (16.7%) | 0 (0.0%) |
| 20 to 24 Years | 0 (0.0%) | 0 (0.0%) |
| 25 to 29 Years | 0 (0.0%) | 1 (2.2%) |
| 30 to 34 Years | 4 (9.5%) | 0 (0.0%) |
| 35 to 39 Years | 0 (0.0%) | 0 (0.0%) |
| 40 to 44 Years | 0 (0.0%) | 0 (0.0%) |
| 45 to 49 Years | 0 (0.0%) | 13 (28.3%) |
| 50 to 54 Years | 0 (0.0%) | 3 (6.5%) |
| 55 to 59 Years | 10 (23.8%) | 8 (17.4%) |
| 60 to 64 Years | 1 (2.4%) | 8 (17.4%) |
| 65 to 69 Years | 4 (9.5%) | 1 (2.2%) |
| 70 to 74 Years | 6 (14.3%) | 1 (2.2%) |
| 75 to 79 Years | 0 (0.0%) | 5 (10.9%) |
| 80 to 84 Years | 1 (2.4%) | 6 (13.0%) |
| 85 Years and over | 4 (9.5%) | 0 (0.0%) |
| Total | 42 (100.0%) | 46 (100.0%) |
Families and Households in Armagh borough
Median Family Size in Armagh borough
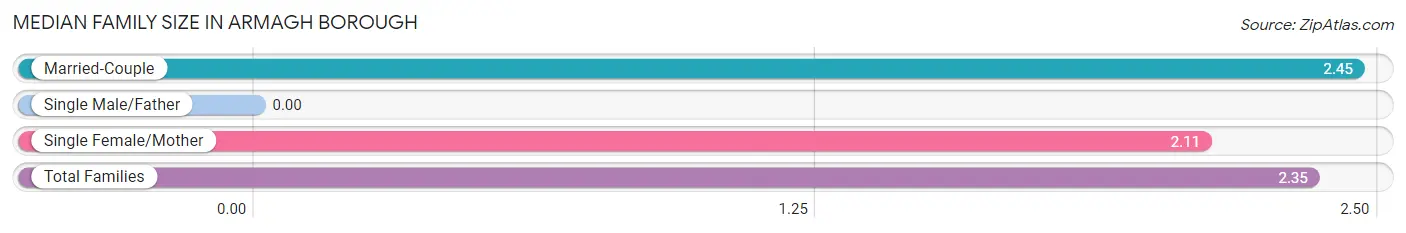
| Family Type | # Families | Family Size |
| Married-Couple | 22 (71.0%) | 2.45 |
| Single Male/Father | 0 (0.0%) | - |
| Single Female/Mother | 9 (29.0%) | 2.11 |
| Total Families | 31 (100.0%) | 2.35 |
Median Household Size in Armagh borough
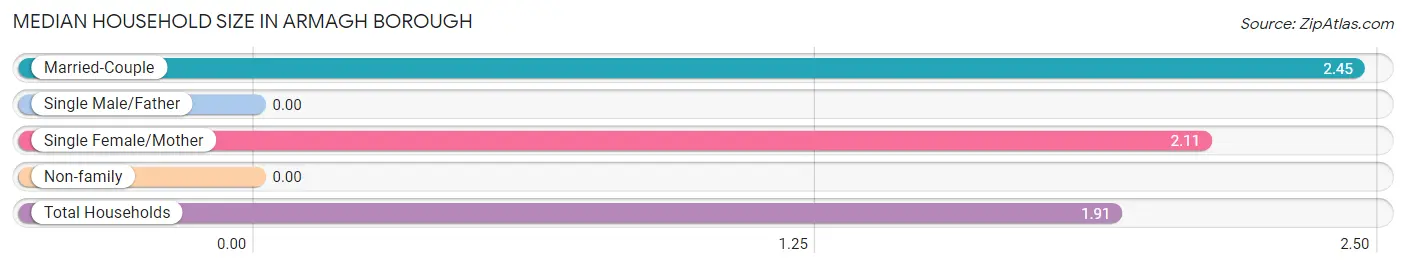
| Household Type | # Households | Household Size |
| Married-Couple | 22 (47.8%) | 2.45 |
| Single Male/Father | 0 (0.0%) | - |
| Single Female/Mother | 9 (19.6%) | 2.11 |
| Non-family | 15 (32.6%) | - |
| Total Households | 46 (100.0%) | 1.91 |
Household Size by Marriage Status in Armagh borough
Out of a total of 46 households in Armagh borough, 31 (67.4%) are family households, while 15 (32.6%) are nonfamily households. The most numerous type of family households are 2-person households, comprising 20, and the most common type of nonfamily households are 1-person households, comprising 15.
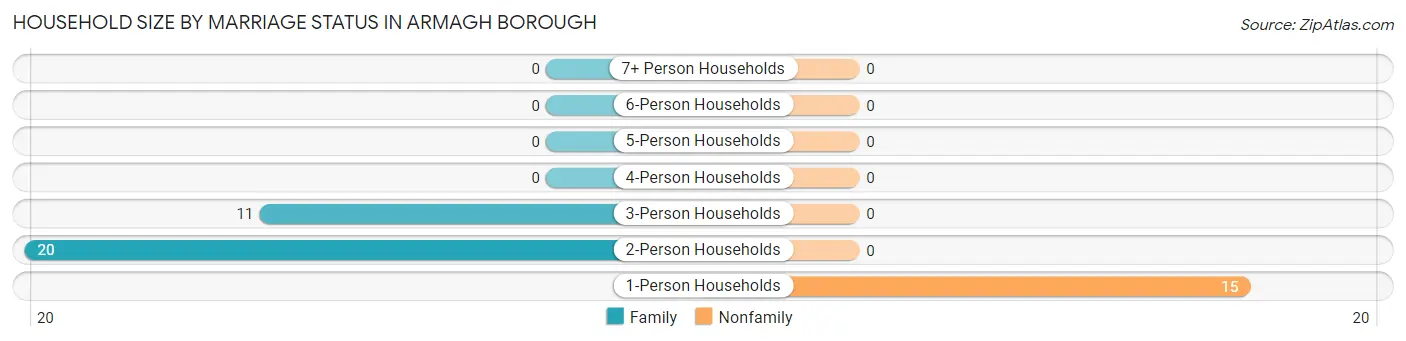
| Household Size | Family Households | Nonfamily Households |
| 1-Person Households | - | 15 (32.6%) |
| 2-Person Households | 20 (43.5%) | 0 (0.0%) |
| 3-Person Households | 11 (23.9%) | 0 (0.0%) |
| 4-Person Households | 0 (0.0%) | 0 (0.0%) |
| 5-Person Households | 0 (0.0%) | 0 (0.0%) |
| 6-Person Households | 0 (0.0%) | 0 (0.0%) |
| 7+ Person Households | 0 (0.0%) | 0 (0.0%) |
| Total | 31 (67.4%) | 15 (32.6%) |
Female Fertility in Armagh borough
Fertility by Age in Armagh borough
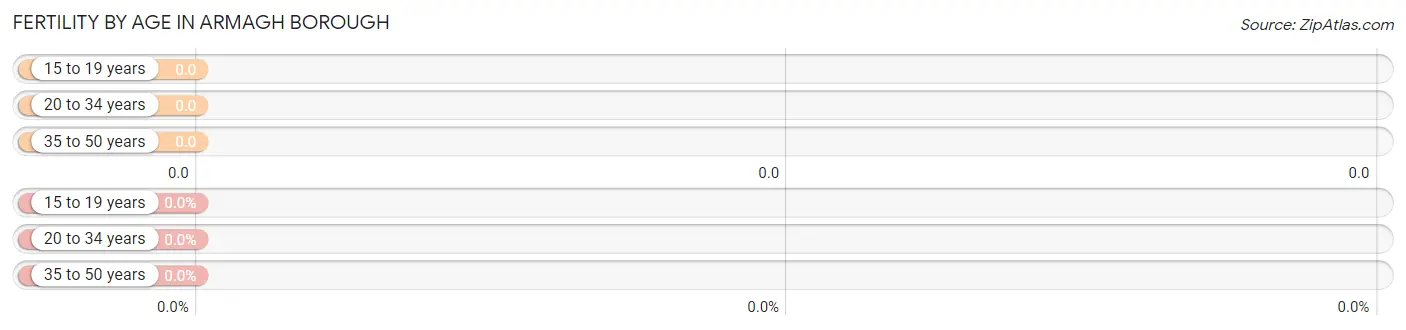
| Age Bracket | Women with Births | Births / 1,000 Women |
| 15 to 19 years | 0 (0.0%) | 0.0 |
| 20 to 34 years | 0 (0.0%) | 0.0 |
| 35 to 50 years | 0 (0.0%) | 0.0 |
| Total | 0 (0.0%) | 0.0 |
Fertility by Age by Marriage Status in Armagh borough
| Age Bracket | Married | Unmarried |
| 15 to 19 years | 0 (0.0%) | 0 (0.0%) |
| 20 to 34 years | 0 (0.0%) | 0 (0.0%) |
| 35 to 50 years | 0 (0.0%) | 0 (0.0%) |
| Total | 0 (0.0%) | 0 (0.0%) |
Fertility by Education in Armagh borough
| Educational Attainment | Women with Births | Births / 1,000 Women |
| Less than High School | 0 (0.0%) | 0.0 |
| High School Diploma | 0 (0.0%) | 0.0 |
| College or Associate's Degree | 0 (0.0%) | 0.0 |
| Bachelor's Degree | 0 (0.0%) | 0.0 |
| Graduate Degree | 0 (0.0%) | 0.0 |
| Total | 0 (0.0%) | 0.0 |
Fertility by Education by Marriage Status in Armagh borough
| Educational Attainment | Married | Unmarried |
| Less than High School | 0 (0.0%) | 0 (0.0%) |
| High School Diploma | 0 (0.0%) | 0 (0.0%) |
| College or Associate's Degree | 0 (0.0%) | 0 (0.0%) |
| Bachelor's Degree | 0 (0.0%) | 0 (0.0%) |
| Graduate Degree | 0 (0.0%) | 0 (0.0%) |
| Total | 0 (0.0%) | 0 (0.0%) |
Employment Characteristics in Armagh borough
Employment by Class of Employer in Armagh borough
Among the 45 employed individuals in Armagh borough, private company employees (22 | 48.9%), state government employees (13 | 28.9%), and local government employees (6 | 13.3%) make up the most common classes of employment.
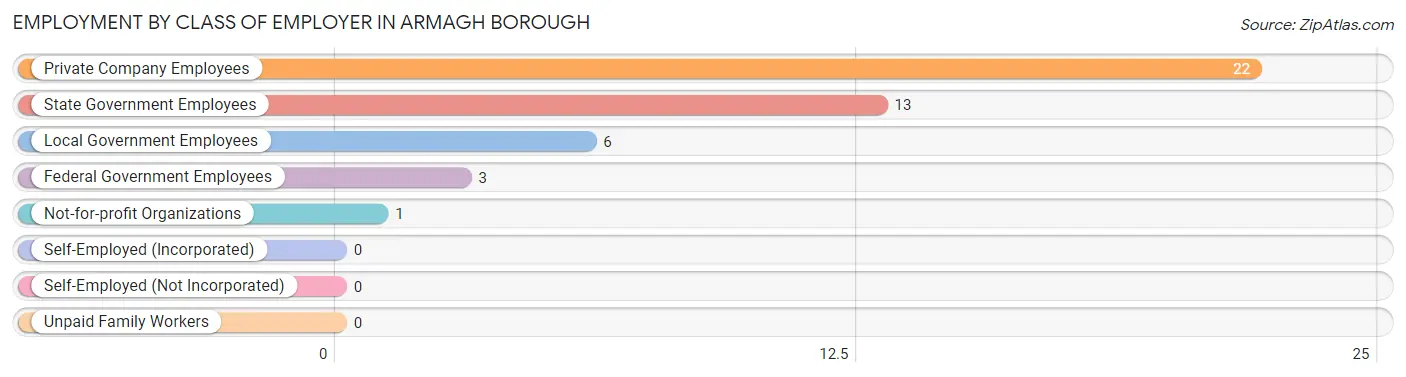
| Employer Class | # Employees | % Employees |
| Private Company Employees | 22 | 48.9% |
| Self-Employed (Incorporated) | 0 | 0.0% |
| Self-Employed (Not Incorporated) | 0 | 0.0% |
| Not-for-profit Organizations | 1 | 2.2% |
| Local Government Employees | 6 | 13.3% |
| State Government Employees | 13 | 28.9% |
| Federal Government Employees | 3 | 6.7% |
| Unpaid Family Workers | 0 | 0.0% |
| Total | 45 | 100.0% |
Employment Status by Age in Armagh borough
According to the labor force statistics for Armagh borough, out of the total population over 16 years of age (83), 56.6% or 47 individuals are in the labor force, with 4.3% or 2 of them unemployed. The age group with the highest labor force participation rate is 25 to 29 years, with 100.0% or 1 individuals in the labor force. Within the labor force, the 16 to 19 years age range has the highest percentage of unemployed individuals, with 100.0% or 2 of them being unemployed.
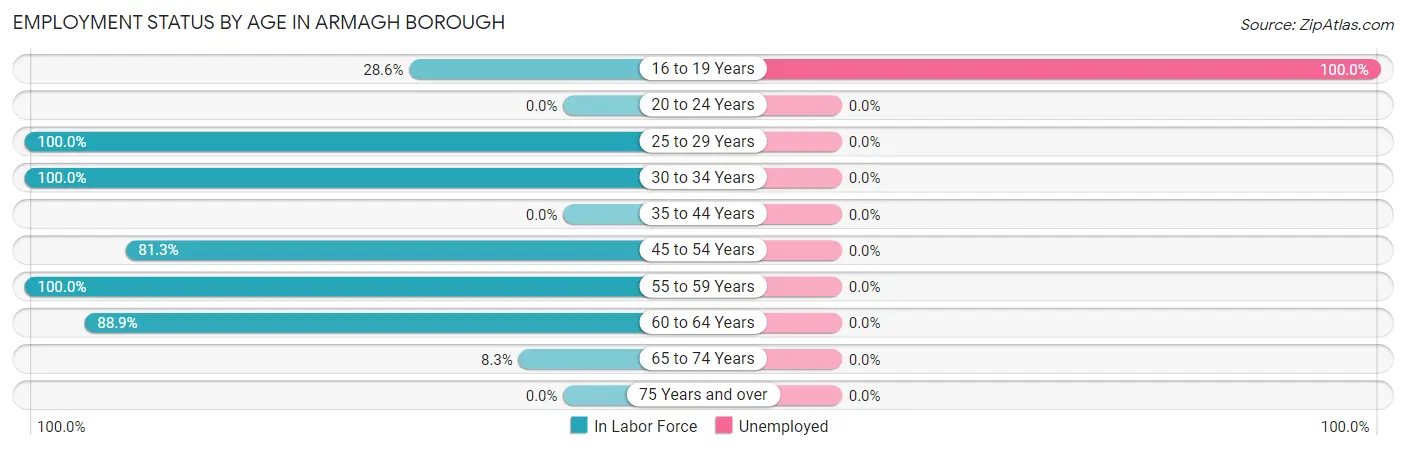
| Age Bracket | In Labor Force | Unemployed |
| 16 to 19 Years | 2 (28.6%) | 2 (100.0%) |
| 20 to 24 Years | 0 (0.0%) | 0 (0.0%) |
| 25 to 29 Years | 1 (100.0%) | 0 (0.0%) |
| 30 to 34 Years | 4 (100.0%) | 0 (0.0%) |
| 35 to 44 Years | 0 (0.0%) | 0 (0.0%) |
| 45 to 54 Years | 13 (81.3%) | 0 (0.0%) |
| 55 to 59 Years | 18 (100.0%) | 0 (0.0%) |
| 60 to 64 Years | 8 (88.9%) | 0 (0.0%) |
| 65 to 74 Years | 1 (8.3%) | 0 (0.0%) |
| 75 Years and over | 0 (0.0%) | 0 (0.0%) |
| Total | 47 (56.6%) | 2 (4.3%) |
Employment Status by Educational Attainment in Armagh borough
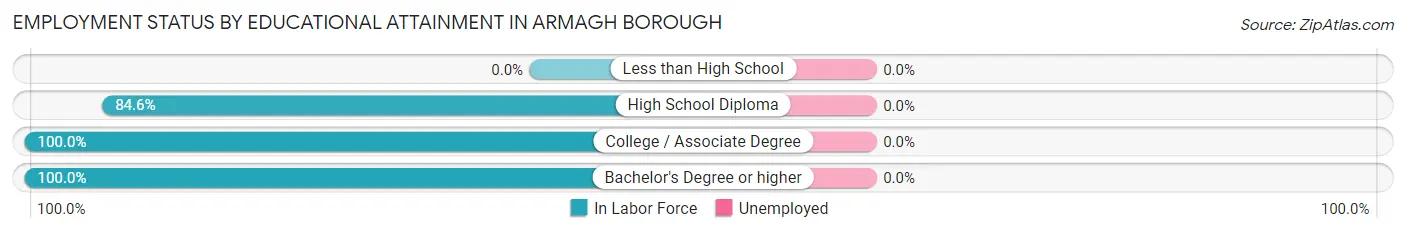
| Educational Attainment | In Labor Force | Unemployed |
| Less than High School | 0 (0.0%) | 0 (0.0%) |
| High School Diploma | 22 (84.6%) | 0 (0.0%) |
| College / Associate Degree | 2 (100.0%) | 0 (0.0%) |
| Bachelor's Degree or higher | 20 (100.0%) | 0 (0.0%) |
| Total | 44 (91.7%) | 0 (0.0%) |
Employment Occupations by Sex in Armagh borough
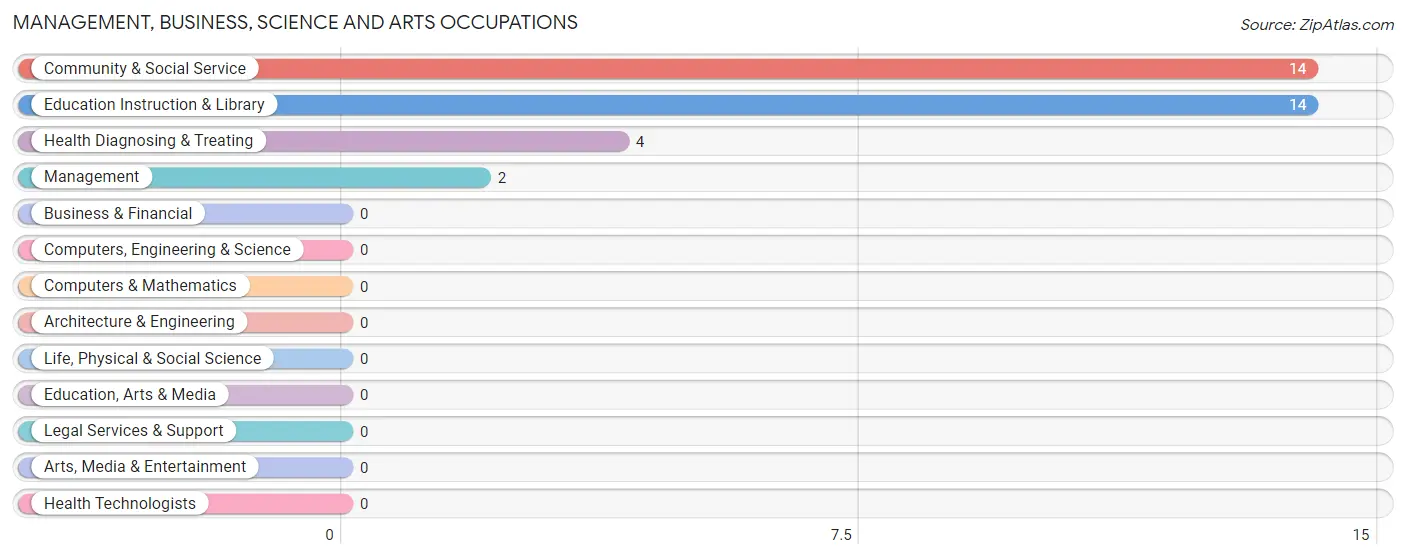
Management, Business, Science and Arts Occupations
The most common Management, Business, Science and Arts occupations in Armagh borough are Community & Social Service (14 | 31.1%), Education Instruction & Library (14 | 31.1%), Health Diagnosing & Treating (4 | 8.9%), and Management (2 | 4.4%).
Management, Business, Science and Arts Occupations by Sex
Within the Management, Business, Science and Arts occupations in Armagh borough, the most male-oriented occupations are Health Diagnosing & Treating (100.0%), Community & Social Service (42.9%), and Education Instruction & Library (42.9%), while the most female-oriented occupations are Management (100.0%), Community & Social Service (57.1%), and Education Instruction & Library (57.1%).
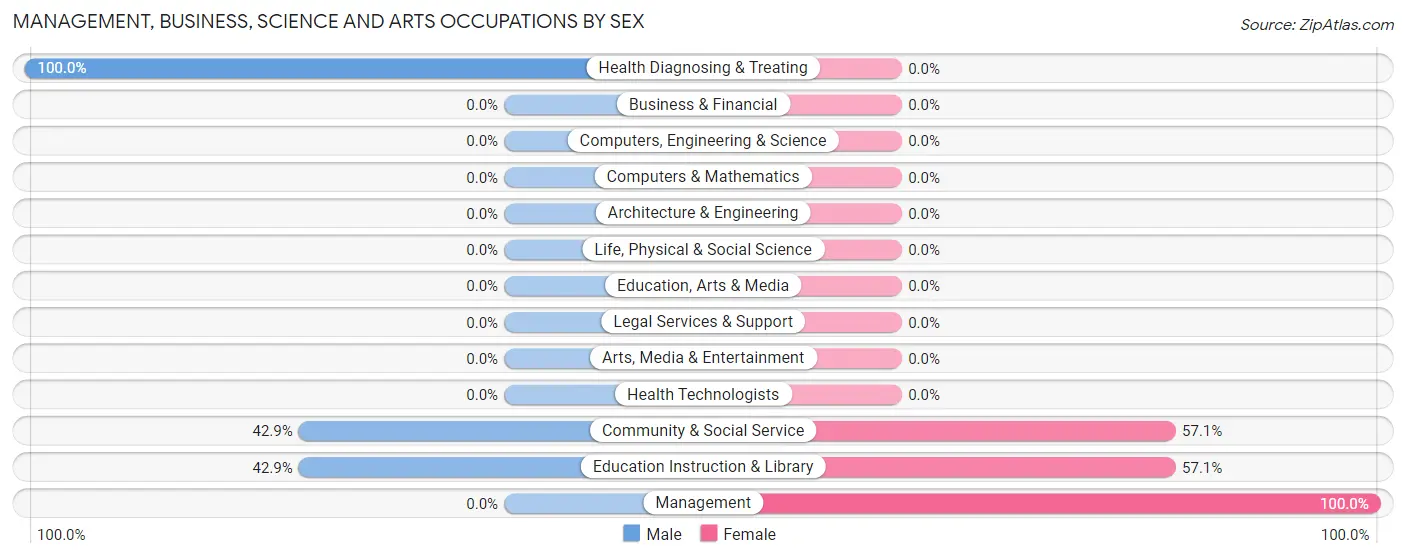
| Occupation | Male | Female |
| Management | 0 (0.0%) | 2 (100.0%) |
| Business & Financial | 0 (0.0%) | 0 (0.0%) |
| Computers, Engineering & Science | 0 (0.0%) | 0 (0.0%) |
| Computers & Mathematics | 0 (0.0%) | 0 (0.0%) |
| Architecture & Engineering | 0 (0.0%) | 0 (0.0%) |
| Life, Physical & Social Science | 0 (0.0%) | 0 (0.0%) |
| Community & Social Service | 6 (42.9%) | 8 (57.1%) |
| Education, Arts & Media | 0 (0.0%) | 0 (0.0%) |
| Legal Services & Support | 0 (0.0%) | 0 (0.0%) |
| Education Instruction & Library | 6 (42.9%) | 8 (57.1%) |
| Arts, Media & Entertainment | 0 (0.0%) | 0 (0.0%) |
| Health Diagnosing & Treating | 4 (100.0%) | 0 (0.0%) |
| Health Technologists | 0 (0.0%) | 0 (0.0%) |
| Total (Category) | 10 (50.0%) | 10 (50.0%) |
| Total (Overall) | 15 (33.3%) | 30 (66.7%) |
Services Occupations
The most common Services occupations in Armagh borough are Healthcare Support (3 | 6.7%), Food Preparation & Serving (2 | 4.4%), and Cleaning & Maintenance (1 | 2.2%).
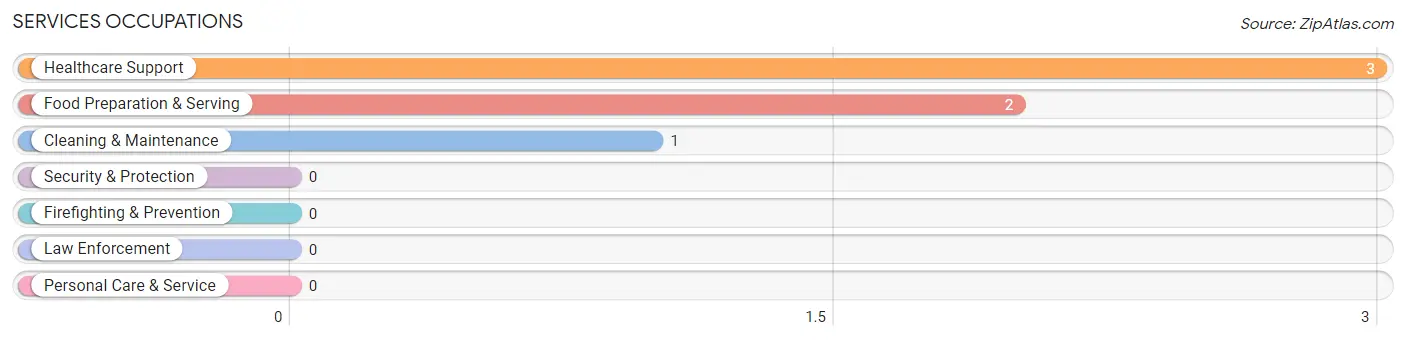
Services Occupations by Sex
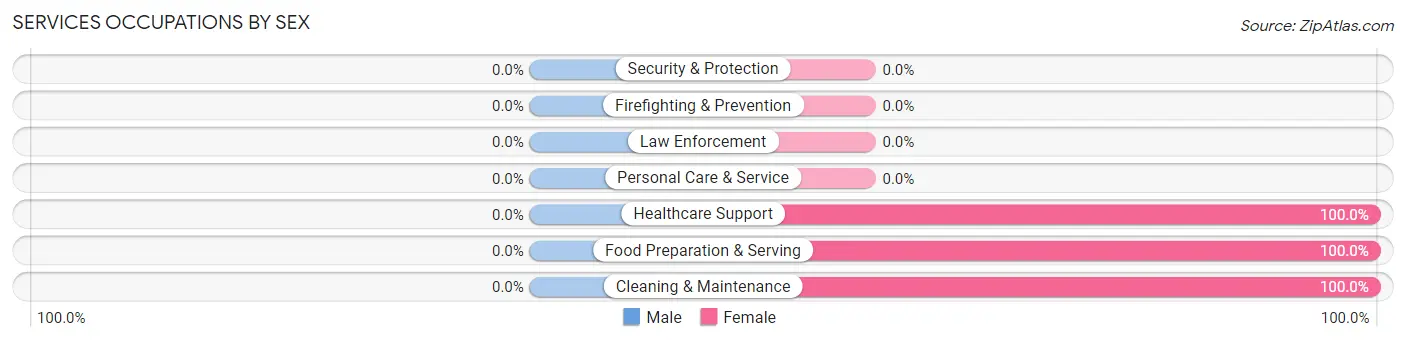
| Occupation | Male | Female |
| Healthcare Support | 0 (0.0%) | 3 (100.0%) |
| Security & Protection | 0 (0.0%) | 0 (0.0%) |
| Firefighting & Prevention | 0 (0.0%) | 0 (0.0%) |
| Law Enforcement | 0 (0.0%) | 0 (0.0%) |
| Food Preparation & Serving | 0 (0.0%) | 2 (100.0%) |
| Cleaning & Maintenance | 0 (0.0%) | 1 (100.0%) |
| Personal Care & Service | 0 (0.0%) | 0 (0.0%) |
| Total (Category) | 0 (0.0%) | 6 (100.0%) |
| Total (Overall) | 15 (33.3%) | 30 (66.7%) |
Sales and Office Occupations
The most common Sales and Office occupations in Armagh borough are , and Office & Administration (14 | 31.1%).
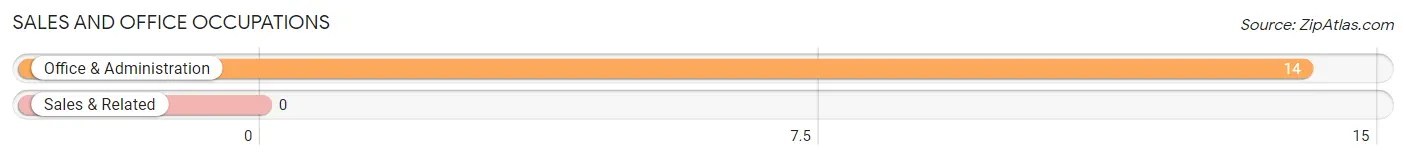
Sales and Office Occupations by Sex
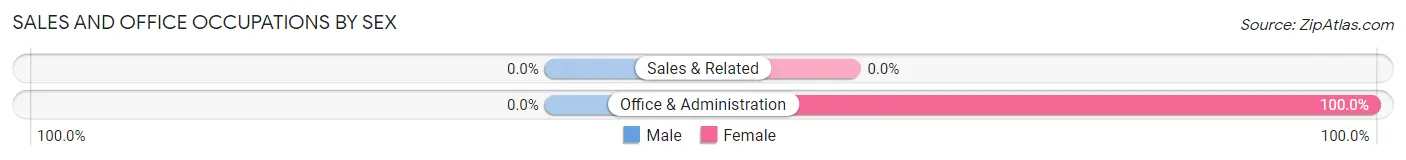
| Occupation | Male | Female |
| Sales & Related | 0 (0.0%) | 0 (0.0%) |
| Office & Administration | 0 (0.0%) | 14 (100.0%) |
| Total (Category) | 0 (0.0%) | 14 (100.0%) |
| Total (Overall) | 15 (33.3%) | 30 (66.7%) |
Natural Resources, Construction and Maintenance Occupations
Natural Resources, Construction and Maintenance Occupations by Sex
| Occupation | Male | Female |
| Farming, Fishing & Forestry | 0 (0.0%) | 0 (0.0%) |
| Construction & Extraction | 0 (0.0%) | 0 (0.0%) |
| Installation, Maintenance & Repair | 0 (0.0%) | 0 (0.0%) |
| Total (Category) | 0 (0.0%) | 0 (0.0%) |
| Total (Overall) | 15 (33.3%) | 30 (66.7%) |
Production, Transportation and Moving Occupations
The most common Production, Transportation and Moving occupations in Armagh borough are , and Transportation (5 | 11.1%).
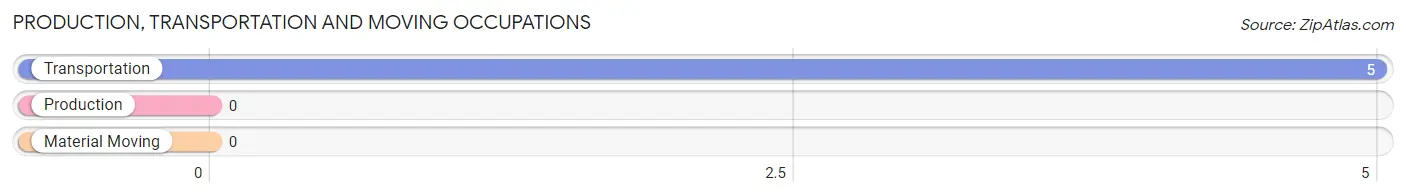
Production, Transportation and Moving Occupations by Sex
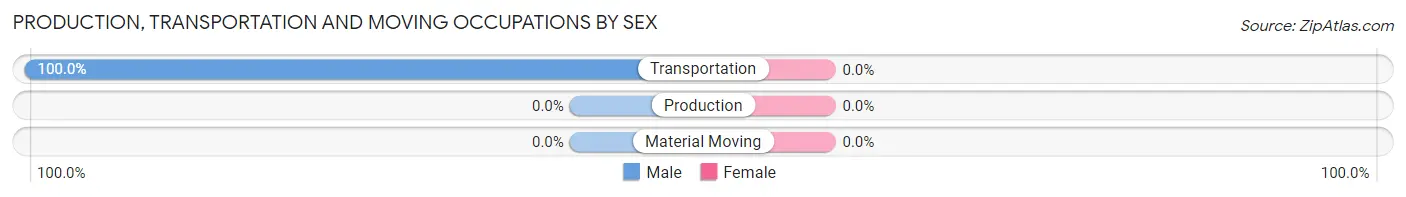
| Occupation | Male | Female |
| Production | 0 (0.0%) | 0 (0.0%) |
| Transportation | 5 (100.0%) | 0 (0.0%) |
| Material Moving | 0 (0.0%) | 0 (0.0%) |
| Total (Category) | 5 (100.0%) | 0 (0.0%) |
| Total (Overall) | 15 (33.3%) | 30 (66.7%) |
Employment Industries by Sex in Armagh borough
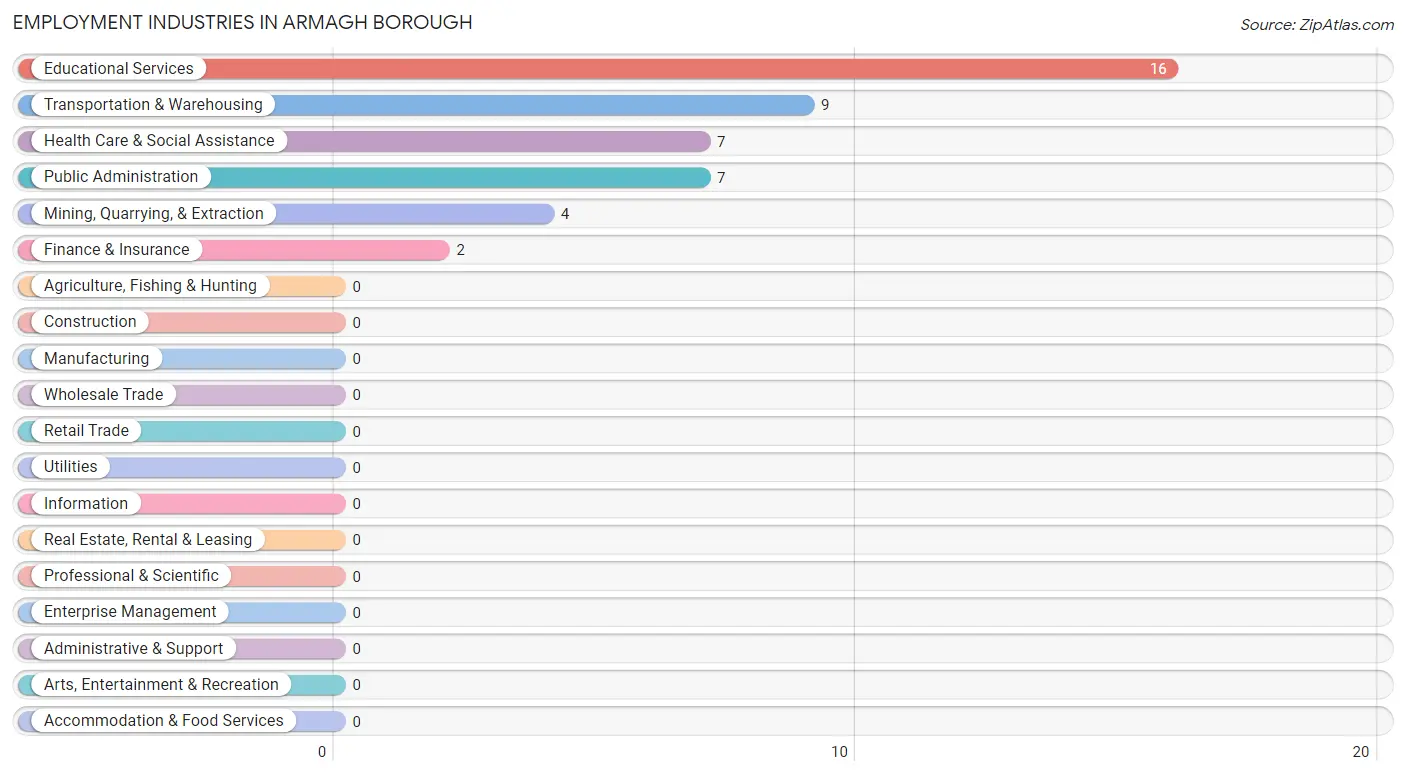
Employment Industries in Armagh borough
The major employment industries in Armagh borough include Educational Services (16 | 35.6%), Transportation & Warehousing (9 | 20.0%), Health Care & Social Assistance (7 | 15.6%), Public Administration (7 | 15.6%), and Mining, Quarrying, & Extraction (4 | 8.9%).
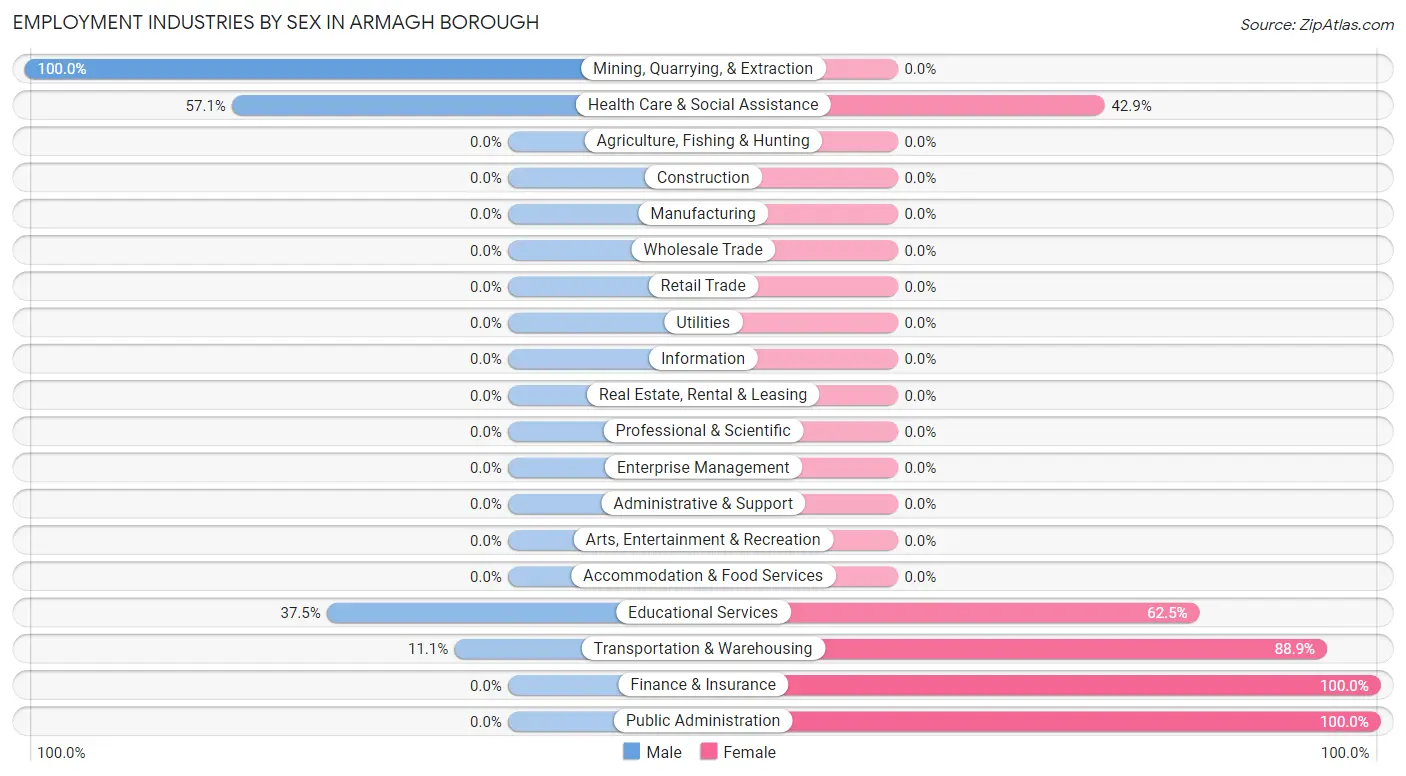
Employment Industries by Sex in Armagh borough
The Armagh borough industries that see more men than women are Mining, Quarrying, & Extraction (100.0%), Health Care & Social Assistance (57.1%), and Educational Services (37.5%), whereas the industries that tend to have a higher number of women are Finance & Insurance (100.0%), Public Administration (100.0%), and Transportation & Warehousing (88.9%).
| Industry | Male | Female |
| Agriculture, Fishing & Hunting | 0 (0.0%) | 0 (0.0%) |
| Mining, Quarrying, & Extraction | 4 (100.0%) | 0 (0.0%) |
| Construction | 0 (0.0%) | 0 (0.0%) |
| Manufacturing | 0 (0.0%) | 0 (0.0%) |
| Wholesale Trade | 0 (0.0%) | 0 (0.0%) |
| Retail Trade | 0 (0.0%) | 0 (0.0%) |
| Transportation & Warehousing | 1 (11.1%) | 8 (88.9%) |
| Utilities | 0 (0.0%) | 0 (0.0%) |
| Information | 0 (0.0%) | 0 (0.0%) |
| Finance & Insurance | 0 (0.0%) | 2 (100.0%) |
| Real Estate, Rental & Leasing | 0 (0.0%) | 0 (0.0%) |
| Professional & Scientific | 0 (0.0%) | 0 (0.0%) |
| Enterprise Management | 0 (0.0%) | 0 (0.0%) |
| Administrative & Support | 0 (0.0%) | 0 (0.0%) |
| Educational Services | 6 (37.5%) | 10 (62.5%) |
| Health Care & Social Assistance | 4 (57.1%) | 3 (42.9%) |
| Arts, Entertainment & Recreation | 0 (0.0%) | 0 (0.0%) |
| Accommodation & Food Services | 0 (0.0%) | 0 (0.0%) |
| Public Administration | 0 (0.0%) | 7 (100.0%) |
| Total | 15 (33.3%) | 30 (66.7%) |
Education in Armagh borough
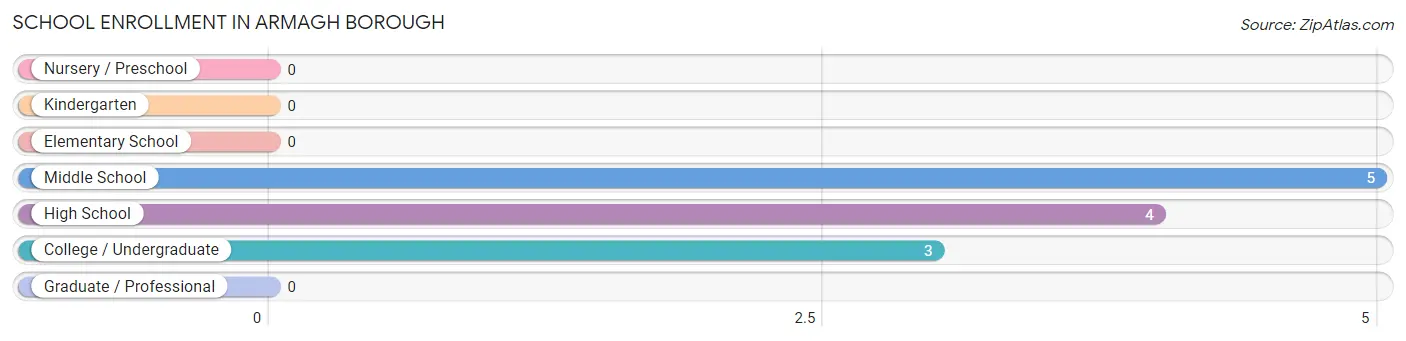
School Enrollment in Armagh borough
The most common levels of schooling among the 12 students in Armagh borough are middle school (5 | 41.7%), high school (4 | 33.3%), and college / undergraduate (3 | 25.0%).
| School Level | # Students | % Students |
| Nursery / Preschool | 0 | 0.0% |
| Kindergarten | 0 | 0.0% |
| Elementary School | 0 | 0.0% |
| Middle School | 5 | 41.7% |
| High School | 4 | 33.3% |
| College / Undergraduate | 3 | 25.0% |
| Graduate / Professional | 0 | 0.0% |
| Total | 12 | 100.0% |
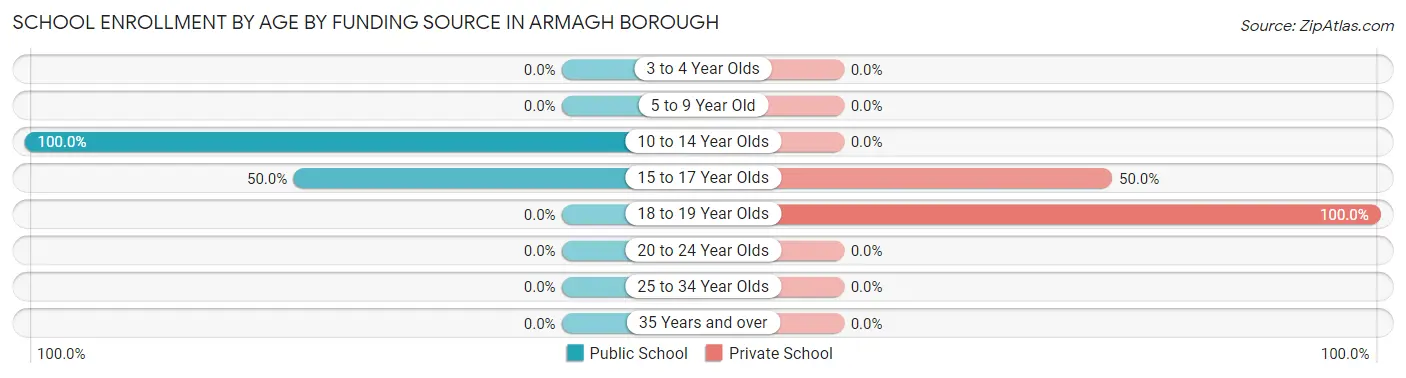
School Enrollment by Age by Funding Source in Armagh borough
Out of a total of 12 students who are enrolled in schools in Armagh borough, 5 (41.7%) attend a private institution, while the remaining 7 (58.3%) are enrolled in public schools. The age group of 18 to 19 year olds has the highest likelihood of being enrolled in private schools, with 3 (100.0% in the age bracket) enrolled. Conversely, the age group of 10 to 14 year olds has the lowest likelihood of being enrolled in a private school, with 5 (100.0% in the age bracket) attending a public institution.
| Age Bracket | Public School | Private School |
| 3 to 4 Year Olds | 0 (0.0%) | 0 (0.0%) |
| 5 to 9 Year Old | 0 (0.0%) | 0 (0.0%) |
| 10 to 14 Year Olds | 5 (100.0%) | 0 (0.0%) |
| 15 to 17 Year Olds | 2 (50.0%) | 2 (50.0%) |
| 18 to 19 Year Olds | 0 (0.0%) | 3 (100.0%) |
| 20 to 24 Year Olds | 0 (0.0%) | 0 (0.0%) |
| 25 to 34 Year Olds | 0 (0.0%) | 0 (0.0%) |
| 35 Years and over | 0 (0.0%) | 0 (0.0%) |
| Total | 7 (58.3%) | 5 (41.7%) |
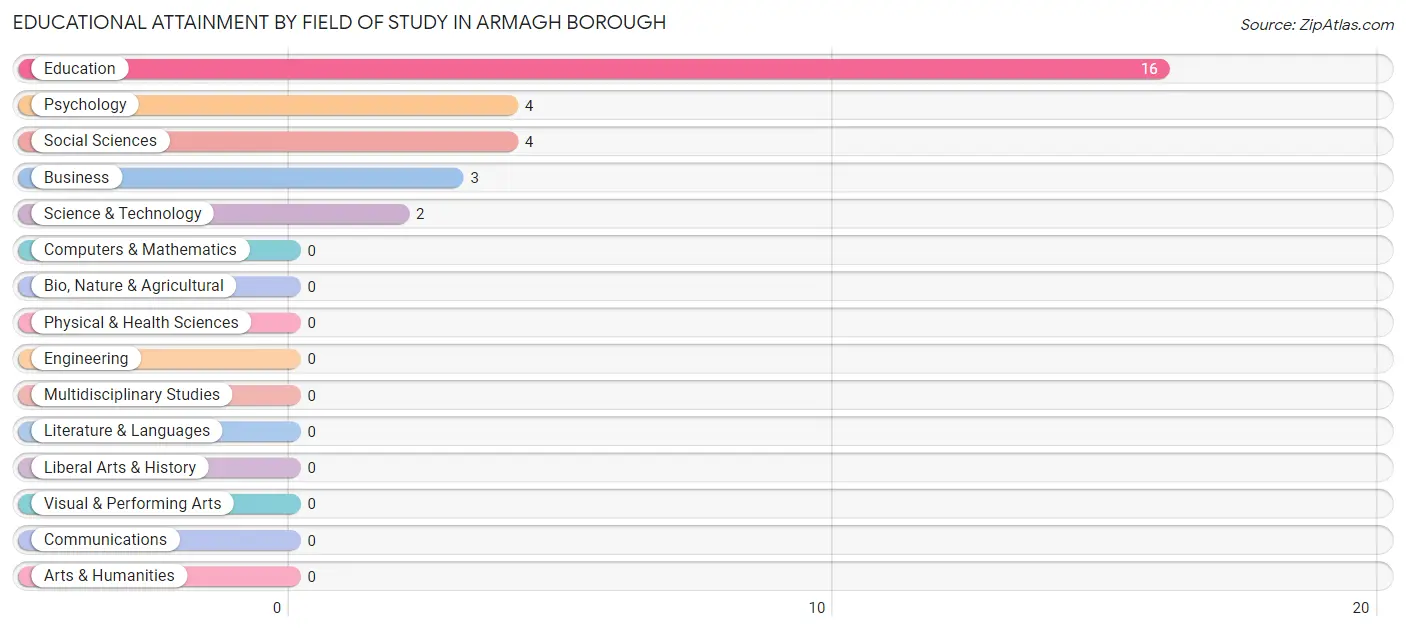
Educational Attainment by Field of Study in Armagh borough
Education (16 | 55.2%), psychology (4 | 13.8%), social sciences (4 | 13.8%), business (3 | 10.3%), and science & technology (2 | 6.9%) are the most common fields of study among 29 individuals in Armagh borough who have obtained a bachelor's degree or higher.
| Field of Study | # Graduates | % Graduates |
| Computers & Mathematics | 0 | 0.0% |
| Bio, Nature & Agricultural | 0 | 0.0% |
| Physical & Health Sciences | 0 | 0.0% |
| Psychology | 4 | 13.8% |
| Social Sciences | 4 | 13.8% |
| Engineering | 0 | 0.0% |
| Multidisciplinary Studies | 0 | 0.0% |
| Science & Technology | 2 | 6.9% |
| Business | 3 | 10.3% |
| Education | 16 | 55.2% |
| Literature & Languages | 0 | 0.0% |
| Liberal Arts & History | 0 | 0.0% |
| Visual & Performing Arts | 0 | 0.0% |
| Communications | 0 | 0.0% |
| Arts & Humanities | 0 | 0.0% |
| Total | 29 | 100.0% |
Transportation & Commute in Armagh borough
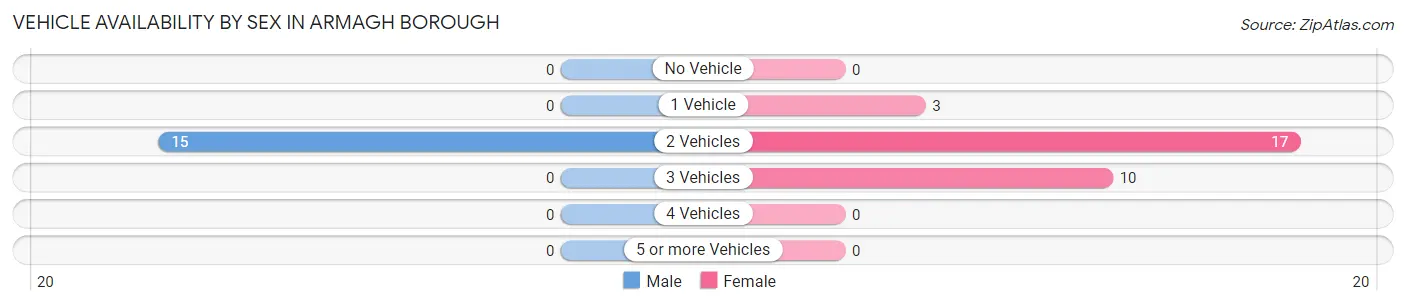
Vehicle Availability by Sex in Armagh borough
The most prevalent vehicle ownership categories in Armagh borough are males with 2 vehicles (15, accounting for 100.0%) and females with 2 vehicles (17, making up 50.0%).
| Vehicles Available | Male | Female |
| No Vehicle | 0 (0.0%) | 0 (0.0%) |
| 1 Vehicle | 0 (0.0%) | 3 (10.0%) |
| 2 Vehicles | 15 (100.0%) | 17 (56.7%) |
| 3 Vehicles | 0 (0.0%) | 10 (33.3%) |
| 4 Vehicles | 0 (0.0%) | 0 (0.0%) |
| 5 or more Vehicles | 0 (0.0%) | 0 (0.0%) |
| Total | 15 (100.0%) | 30 (100.0%) |
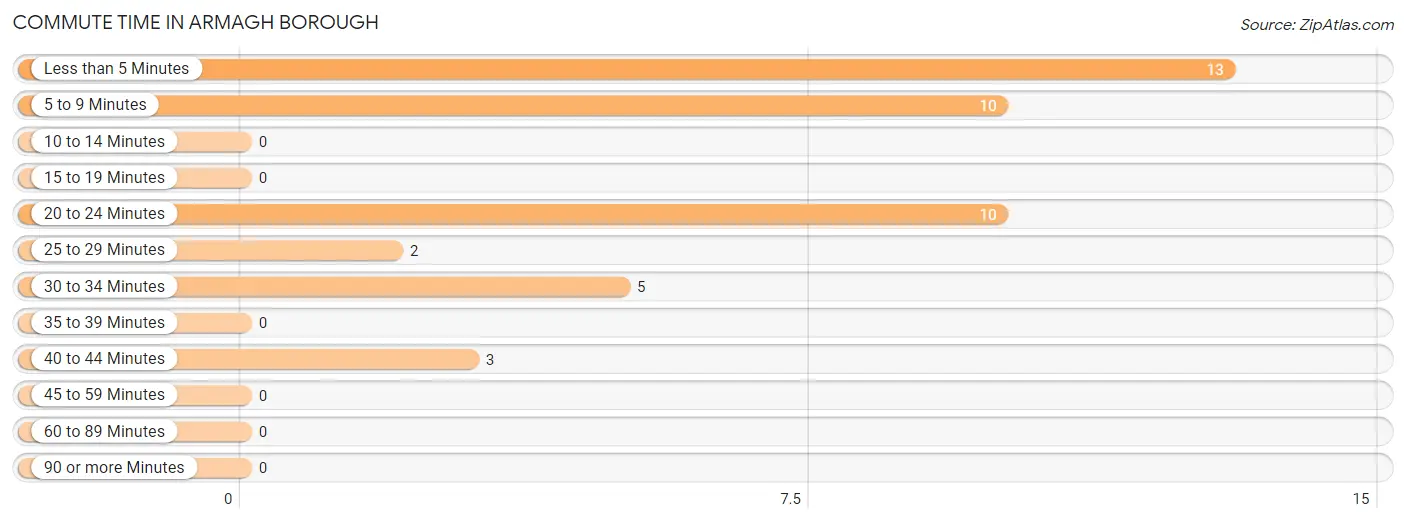
Commute Time in Armagh borough
The most frequently occuring commute durations in Armagh borough are less than 5 minutes (13 commuters, 30.2%), 5 to 9 minutes (10 commuters, 23.3%), and 20 to 24 minutes (10 commuters, 23.3%).
| Commute Time | # Commuters | % Commuters |
| Less than 5 Minutes | 13 | 30.2% |
| 5 to 9 Minutes | 10 | 23.3% |
| 10 to 14 Minutes | 0 | 0.0% |
| 15 to 19 Minutes | 0 | 0.0% |
| 20 to 24 Minutes | 10 | 23.3% |
| 25 to 29 Minutes | 2 | 4.6% |
| 30 to 34 Minutes | 5 | 11.6% |
| 35 to 39 Minutes | 0 | 0.0% |
| 40 to 44 Minutes | 3 | 7.0% |
| 45 to 59 Minutes | 0 | 0.0% |
| 60 to 89 Minutes | 0 | 0.0% |
| 90 or more Minutes | 0 | 0.0% |
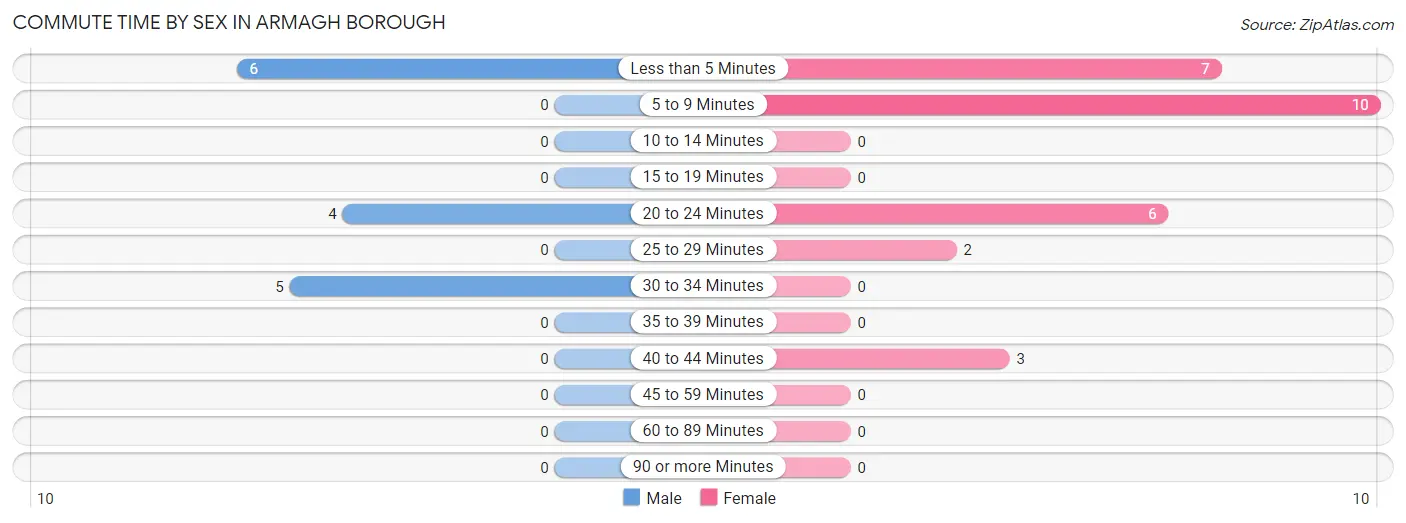
Commute Time by Sex in Armagh borough
The most common commute times in Armagh borough are less than 5 minutes (6 commuters, 40.0%) for males and 5 to 9 minutes (10 commuters, 35.7%) for females.
| Commute Time | Male | Female |
| Less than 5 Minutes | 6 (40.0%) | 7 (25.0%) |
| 5 to 9 Minutes | 0 (0.0%) | 10 (35.7%) |
| 10 to 14 Minutes | 0 (0.0%) | 0 (0.0%) |
| 15 to 19 Minutes | 0 (0.0%) | 0 (0.0%) |
| 20 to 24 Minutes | 4 (26.7%) | 6 (21.4%) |
| 25 to 29 Minutes | 0 (0.0%) | 2 (7.1%) |
| 30 to 34 Minutes | 5 (33.3%) | 0 (0.0%) |
| 35 to 39 Minutes | 0 (0.0%) | 0 (0.0%) |
| 40 to 44 Minutes | 0 (0.0%) | 3 (10.7%) |
| 45 to 59 Minutes | 0 (0.0%) | 0 (0.0%) |
| 60 to 89 Minutes | 0 (0.0%) | 0 (0.0%) |
| 90 or more Minutes | 0 (0.0%) | 0 (0.0%) |
Time of Departure to Work by Sex in Armagh borough
The most frequent times of departure to work in Armagh borough are 7:00 AM to 7:29 AM (8, 53.3%) for males and 8:00 AM to 8:29 AM (9, 32.1%) for females.
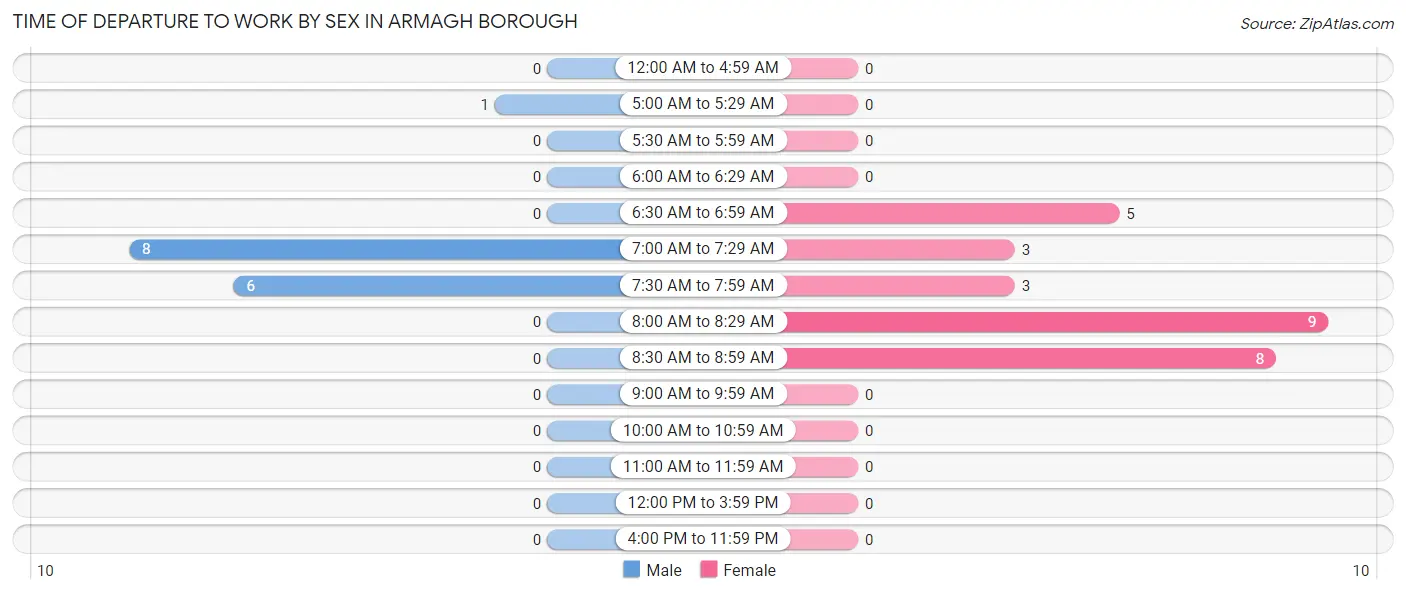
| Time of Departure | Male | Female |
| 12:00 AM to 4:59 AM | 0 (0.0%) | 0 (0.0%) |
| 5:00 AM to 5:29 AM | 1 (6.7%) | 0 (0.0%) |
| 5:30 AM to 5:59 AM | 0 (0.0%) | 0 (0.0%) |
| 6:00 AM to 6:29 AM | 0 (0.0%) | 0 (0.0%) |
| 6:30 AM to 6:59 AM | 0 (0.0%) | 5 (17.9%) |
| 7:00 AM to 7:29 AM | 8 (53.3%) | 3 (10.7%) |
| 7:30 AM to 7:59 AM | 6 (40.0%) | 3 (10.7%) |
| 8:00 AM to 8:29 AM | 0 (0.0%) | 9 (32.1%) |
| 8:30 AM to 8:59 AM | 0 (0.0%) | 8 (28.6%) |
| 9:00 AM to 9:59 AM | 0 (0.0%) | 0 (0.0%) |
| 10:00 AM to 10:59 AM | 0 (0.0%) | 0 (0.0%) |
| 11:00 AM to 11:59 AM | 0 (0.0%) | 0 (0.0%) |
| 12:00 PM to 3:59 PM | 0 (0.0%) | 0 (0.0%) |
| 4:00 PM to 11:59 PM | 0 (0.0%) | 0 (0.0%) |
| Total | 15 (100.0%) | 28 (100.0%) |
Housing Occupancy in Armagh borough
Occupancy by Ownership in Armagh borough
Of the total 46 dwellings in Armagh borough, owner-occupied units account for 31 (67.4%), while renter-occupied units make up 15 (32.6%).
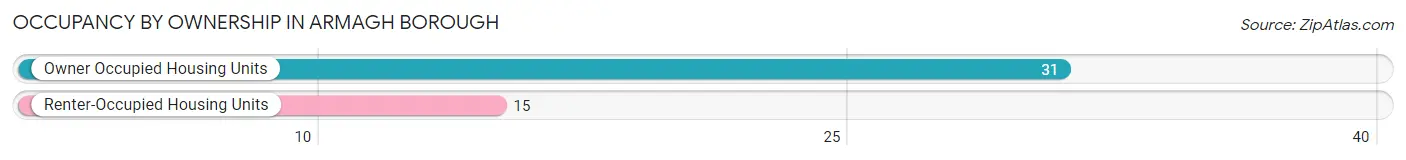
| Occupancy | # Housing Units | % Housing Units |
| Owner Occupied Housing Units | 31 | 67.4% |
| Renter-Occupied Housing Units | 15 | 32.6% |
| Total Occupied Housing Units | 46 | 100.0% |
Occupancy by Household Size in Armagh borough
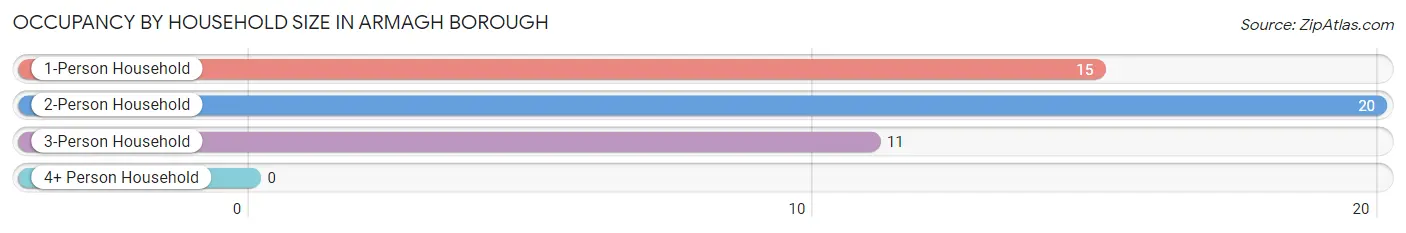
| Household Size | # Housing Units | % Housing Units |
| 1-Person Household | 15 | 32.6% |
| 2-Person Household | 20 | 43.5% |
| 3-Person Household | 11 | 23.9% |
| 4+ Person Household | 0 | 0.0% |
| Total Housing Units | 46 | 100.0% |
Occupancy by Ownership by Household Size in Armagh borough
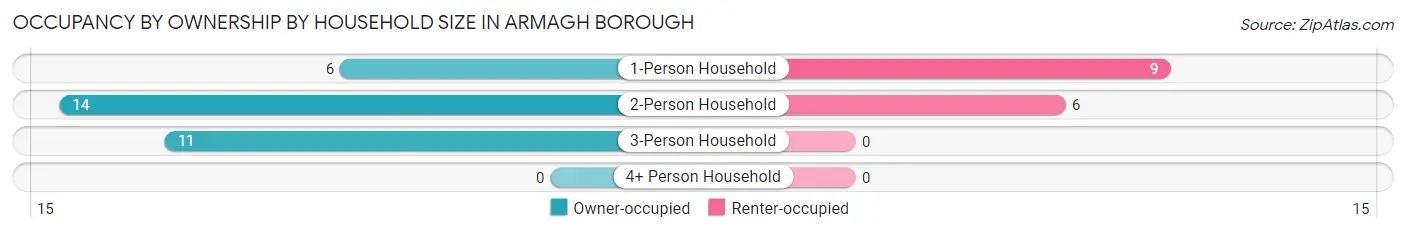
| Household Size | Owner-occupied | Renter-occupied |
| 1-Person Household | 6 (40.0%) | 9 (60.0%) |
| 2-Person Household | 14 (70.0%) | 6 (30.0%) |
| 3-Person Household | 11 (100.0%) | 0 (0.0%) |
| 4+ Person Household | 0 (0.0%) | 0 (0.0%) |
| Total Housing Units | 31 (67.4%) | 15 (32.6%) |
Occupancy by Educational Attainment in Armagh borough
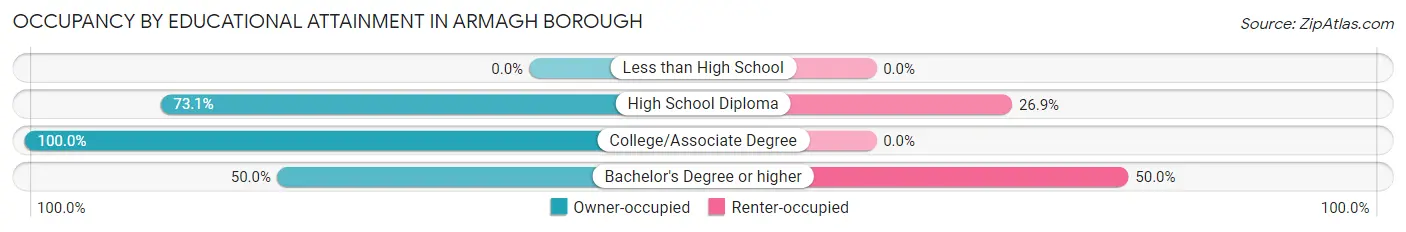
| Household Size | Owner-occupied | Renter-occupied |
| Less than High School | 0 (0.0%) | 0 (0.0%) |
| High School Diploma | 19 (73.1%) | 7 (26.9%) |
| College/Associate Degree | 4 (100.0%) | 0 (0.0%) |
| Bachelor's Degree or higher | 8 (50.0%) | 8 (50.0%) |
Occupancy by Age of Householder in Armagh borough
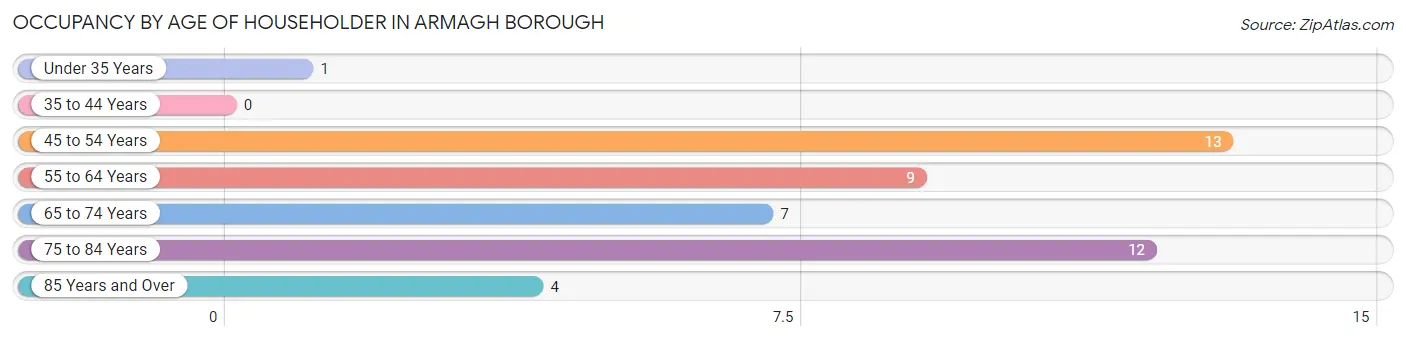
| Age Bracket | # Households | % Households |
| Under 35 Years | 1 | 2.2% |
| 35 to 44 Years | 0 | 0.0% |
| 45 to 54 Years | 13 | 28.3% |
| 55 to 64 Years | 9 | 19.6% |
| 65 to 74 Years | 7 | 15.2% |
| 75 to 84 Years | 12 | 26.1% |
| 85 Years and Over | 4 | 8.7% |
| Total | 46 | 100.0% |
Housing Finances in Armagh borough
Median Income by Occupancy in Armagh borough
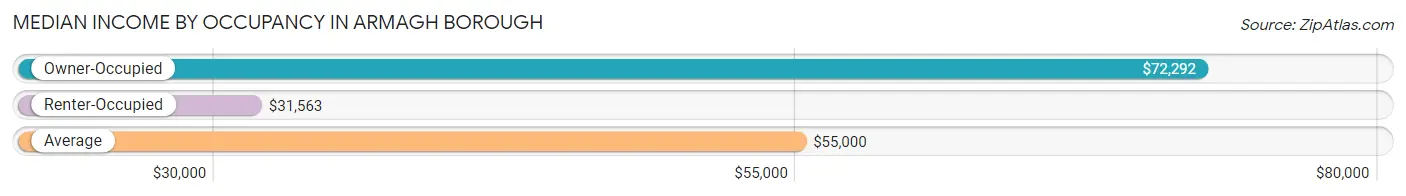
| Occupancy Type | # Households | Median Income |
| Owner-Occupied | 31 (67.4%) | $72,292 |
| Renter-Occupied | 15 (32.6%) | $31,563 |
| Average | 46 (100.0%) | $55,000 |
Occupancy by Householder Income Bracket in Armagh borough
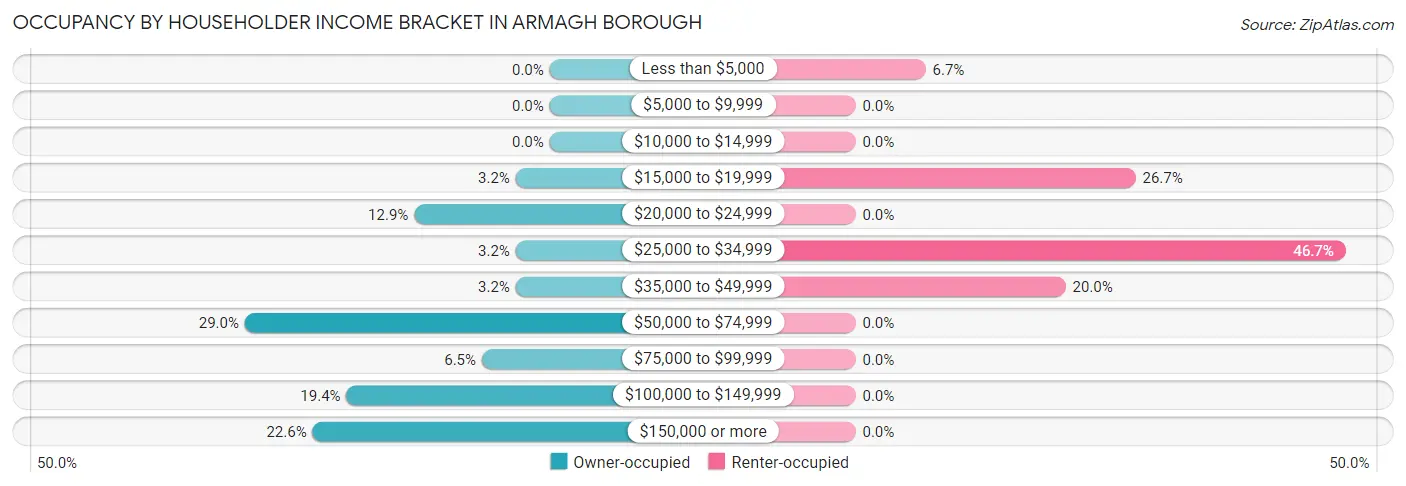
| Income Bracket | Owner-occupied | Renter-occupied |
| Less than $5,000 | 0 (0.0%) | 1 (6.7%) |
| $5,000 to $9,999 | 0 (0.0%) | 0 (0.0%) |
| $10,000 to $14,999 | 0 (0.0%) | 0 (0.0%) |
| $15,000 to $19,999 | 1 (3.2%) | 4 (26.7%) |
| $20,000 to $24,999 | 4 (12.9%) | 0 (0.0%) |
| $25,000 to $34,999 | 1 (3.2%) | 7 (46.7%) |
| $35,000 to $49,999 | 1 (3.2%) | 3 (20.0%) |
| $50,000 to $74,999 | 9 (29.0%) | 0 (0.0%) |
| $75,000 to $99,999 | 2 (6.5%) | 0 (0.0%) |
| $100,000 to $149,999 | 6 (19.4%) | 0 (0.0%) |
| $150,000 or more | 7 (22.6%) | 0 (0.0%) |
| Total | 31 (100.0%) | 15 (100.0%) |
Monthly Housing Cost Tiers in Armagh borough
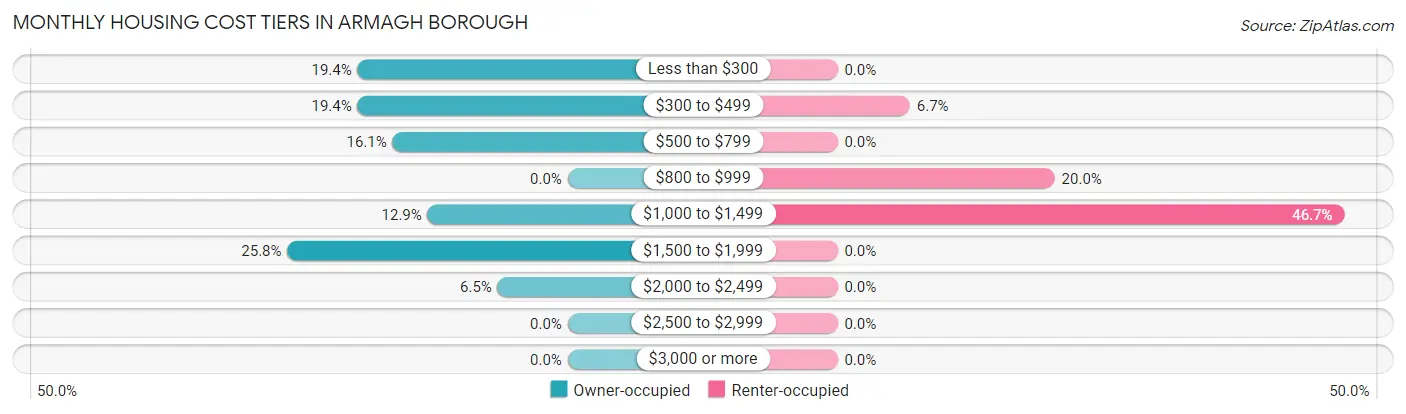
| Monthly Cost | Owner-occupied | Renter-occupied |
| Less than $300 | 6 (19.4%) | 0 (0.0%) |
| $300 to $499 | 6 (19.4%) | 1 (6.7%) |
| $500 to $799 | 5 (16.1%) | 0 (0.0%) |
| $800 to $999 | 0 (0.0%) | 3 (20.0%) |
| $1,000 to $1,499 | 4 (12.9%) | 7 (46.7%) |
| $1,500 to $1,999 | 8 (25.8%) | 0 (0.0%) |
| $2,000 to $2,499 | 2 (6.5%) | 0 (0.0%) |
| $2,500 to $2,999 | 0 (0.0%) | 0 (0.0%) |
| $3,000 or more | 0 (0.0%) | 0 (0.0%) |
| Total | 31 (100.0%) | 15 (100.0%) |
Physical Housing Characteristics in Armagh borough
Housing Structures in Armagh borough
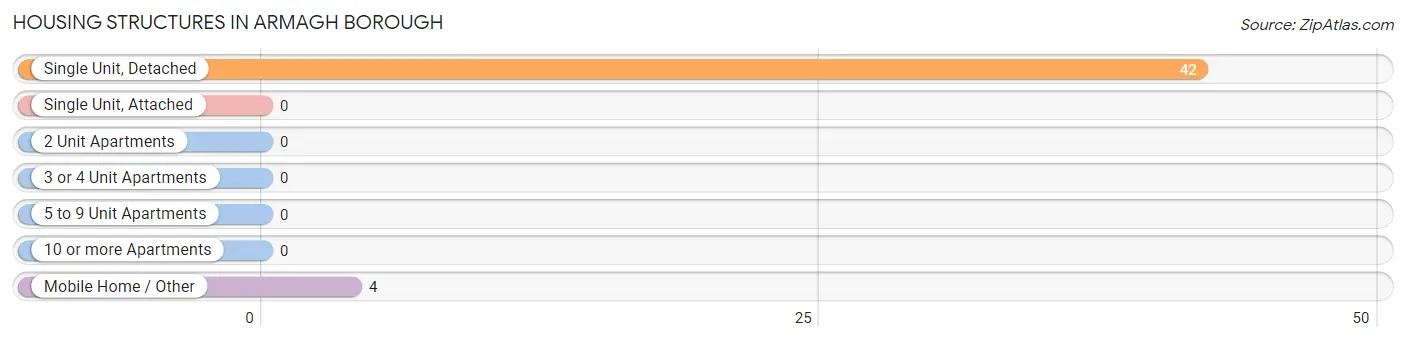
| Structure Type | # Housing Units | % Housing Units |
| Single Unit, Detached | 42 | 91.3% |
| Single Unit, Attached | 0 | 0.0% |
| 2 Unit Apartments | 0 | 0.0% |
| 3 or 4 Unit Apartments | 0 | 0.0% |
| 5 to 9 Unit Apartments | 0 | 0.0% |
| 10 or more Apartments | 0 | 0.0% |
| Mobile Home / Other | 4 | 8.7% |
| Total | 46 | 100.0% |
Housing Structures by Occupancy in Armagh borough
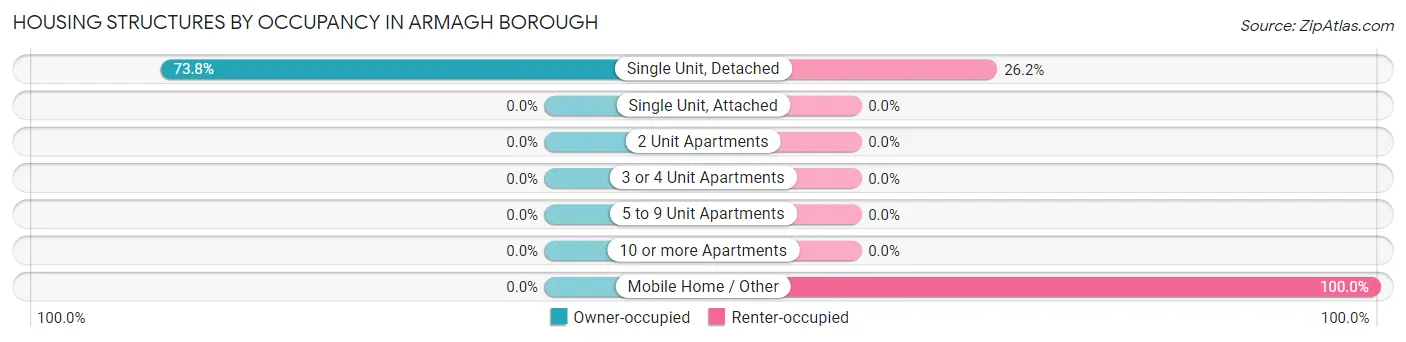
| Structure Type | Owner-occupied | Renter-occupied |
| Single Unit, Detached | 31 (73.8%) | 11 (26.2%) |
| Single Unit, Attached | 0 (0.0%) | 0 (0.0%) |
| 2 Unit Apartments | 0 (0.0%) | 0 (0.0%) |
| 3 or 4 Unit Apartments | 0 (0.0%) | 0 (0.0%) |
| 5 to 9 Unit Apartments | 0 (0.0%) | 0 (0.0%) |
| 10 or more Apartments | 0 (0.0%) | 0 (0.0%) |
| Mobile Home / Other | 0 (0.0%) | 4 (100.0%) |
| Total | 31 (67.4%) | 15 (32.6%) |
Housing Structures by Number of Rooms in Armagh borough
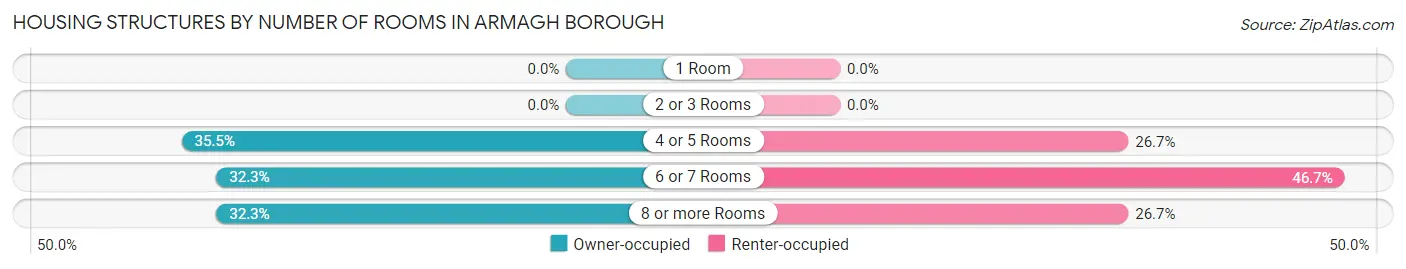
| Number of Rooms | Owner-occupied | Renter-occupied |
| 1 Room | 0 (0.0%) | 0 (0.0%) |
| 2 or 3 Rooms | 0 (0.0%) | 0 (0.0%) |
| 4 or 5 Rooms | 11 (35.5%) | 4 (26.7%) |
| 6 or 7 Rooms | 10 (32.3%) | 7 (46.7%) |
| 8 or more Rooms | 10 (32.3%) | 4 (26.7%) |
| Total | 31 (100.0%) | 15 (100.0%) |
Housing Structure by Heating Type in Armagh borough
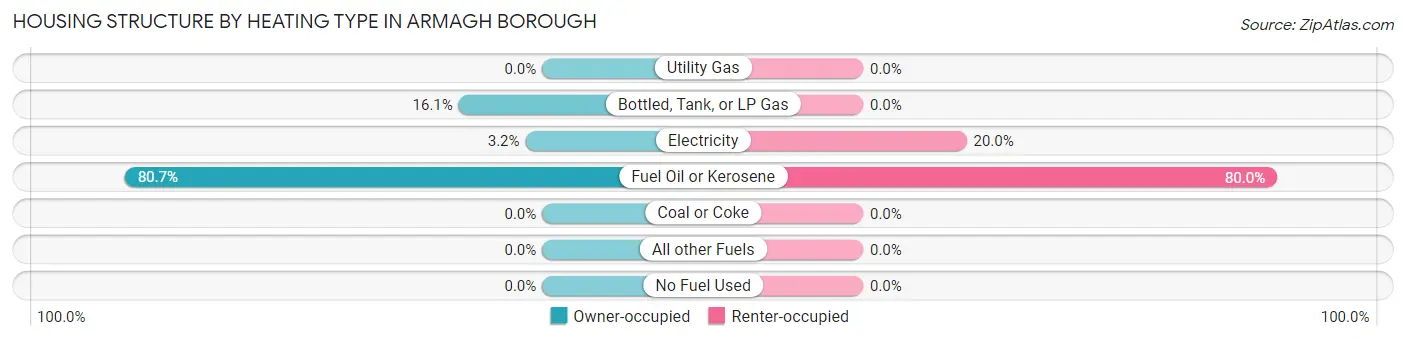
| Heating Type | Owner-occupied | Renter-occupied |
| Utility Gas | 0 (0.0%) | 0 (0.0%) |
| Bottled, Tank, or LP Gas | 5 (16.1%) | 0 (0.0%) |
| Electricity | 1 (3.2%) | 3 (20.0%) |
| Fuel Oil or Kerosene | 25 (80.6%) | 12 (80.0%) |
| Coal or Coke | 0 (0.0%) | 0 (0.0%) |
| All other Fuels | 0 (0.0%) | 0 (0.0%) |
| No Fuel Used | 0 (0.0%) | 0 (0.0%) |
| Total | 31 (100.0%) | 15 (100.0%) |
Household Vehicle Usage in Armagh borough
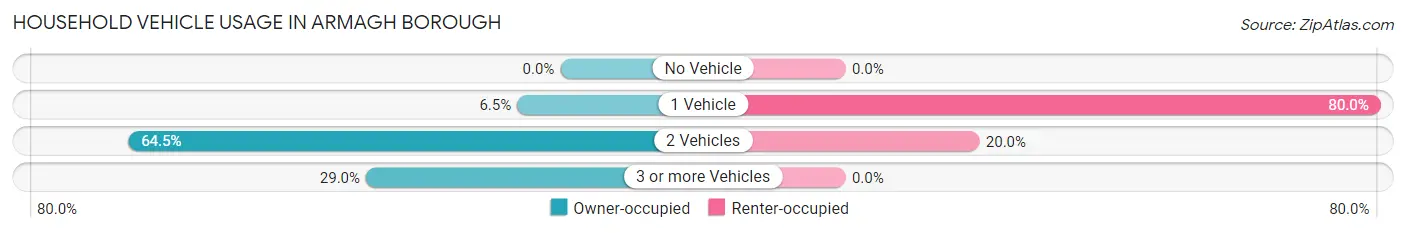
| Vehicles per Household | Owner-occupied | Renter-occupied |
| No Vehicle | 0 (0.0%) | 0 (0.0%) |
| 1 Vehicle | 2 (6.5%) | 12 (80.0%) |
| 2 Vehicles | 20 (64.5%) | 3 (20.0%) |
| 3 or more Vehicles | 9 (29.0%) | 0 (0.0%) |
| Total | 31 (100.0%) | 15 (100.0%) |
Real Estate & Mortgages in Armagh borough
Real Estate and Mortgage Overview in Armagh borough
| Characteristic | Without Mortgage | With Mortgage |
| Housing Units | 19 | 12 |
| Median Property Value | $102,500 | $110,700 |
| Median Household Income | $71,042 | $7 |
| Monthly Housing Costs | $438 | $0 |
| Real Estate Taxes | $1,821 | $0 |
Property Value by Mortgage Status in Armagh borough
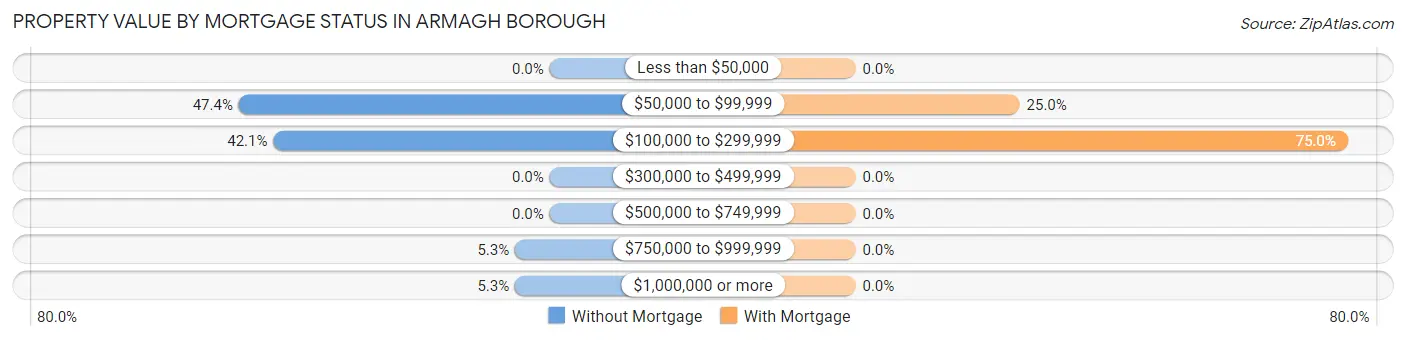
| Property Value | Without Mortgage | With Mortgage |
| Less than $50,000 | 0 (0.0%) | 0 (0.0%) |
| $50,000 to $99,999 | 9 (47.4%) | 3 (25.0%) |
| $100,000 to $299,999 | 8 (42.1%) | 9 (75.0%) |
| $300,000 to $499,999 | 0 (0.0%) | 0 (0.0%) |
| $500,000 to $749,999 | 0 (0.0%) | 0 (0.0%) |
| $750,000 to $999,999 | 1 (5.3%) | 0 (0.0%) |
| $1,000,000 or more | 1 (5.3%) | 0 (0.0%) |
| Total | 19 (100.0%) | 12 (100.0%) |
Household Income by Mortgage Status in Armagh borough
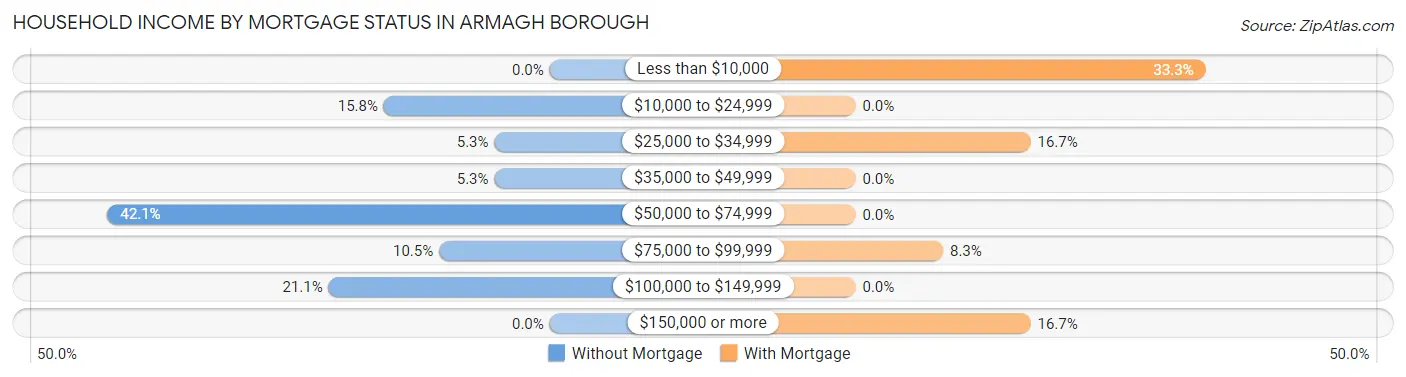
| Household Income | Without Mortgage | With Mortgage |
| Less than $10,000 | 0 (0.0%) | 4 (33.3%) |
| $10,000 to $24,999 | 3 (15.8%) | 0 (0.0%) |
| $25,000 to $34,999 | 1 (5.3%) | 2 (16.7%) |
| $35,000 to $49,999 | 1 (5.3%) | 0 (0.0%) |
| $50,000 to $74,999 | 8 (42.1%) | 0 (0.0%) |
| $75,000 to $99,999 | 2 (10.5%) | 1 (8.3%) |
| $100,000 to $149,999 | 4 (21.0%) | 0 (0.0%) |
| $150,000 or more | 0 (0.0%) | 2 (16.7%) |
| Total | 19 (100.0%) | 12 (100.0%) |
Property Value to Household Income Ratio in Armagh borough
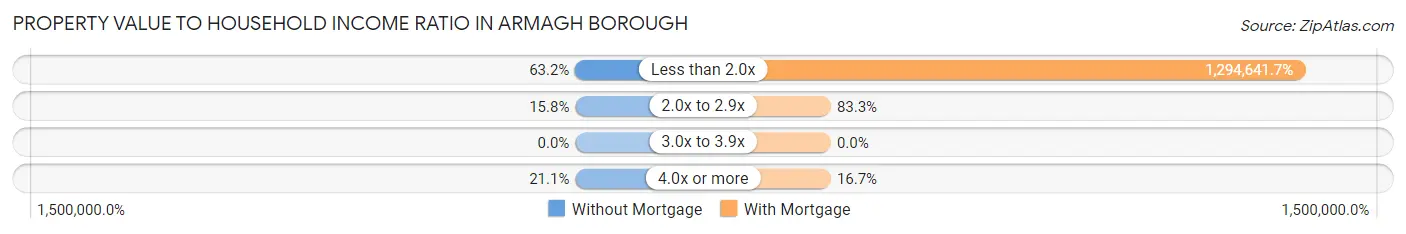
| Value-to-Income Ratio | Without Mortgage | With Mortgage |
| Less than 2.0x | 12 (63.2%) | 155,357 (1,294,641.7%) |
| 2.0x to 2.9x | 3 (15.8%) | 10 (83.3%) |
| 3.0x to 3.9x | 0 (0.0%) | 0 (0.0%) |
| 4.0x or more | 4 (21.0%) | 2 (16.7%) |
| Total | 19 (100.0%) | 12 (100.0%) |
Real Estate Taxes by Mortgage Status in Armagh borough
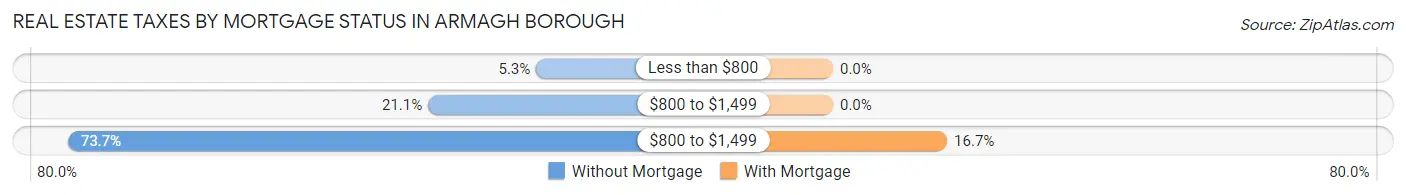
| Property Taxes | Without Mortgage | With Mortgage |
| Less than $800 | 1 (5.3%) | 0 (0.0%) |
| $800 to $1,499 | 4 (21.0%) | 0 (0.0%) |
| $800 to $1,499 | 14 (73.7%) | 2 (16.7%) |
| Total | 19 (100.0%) | 12 (100.0%) |
Health & Disability in Armagh borough
Health Insurance Coverage by Age in Armagh borough
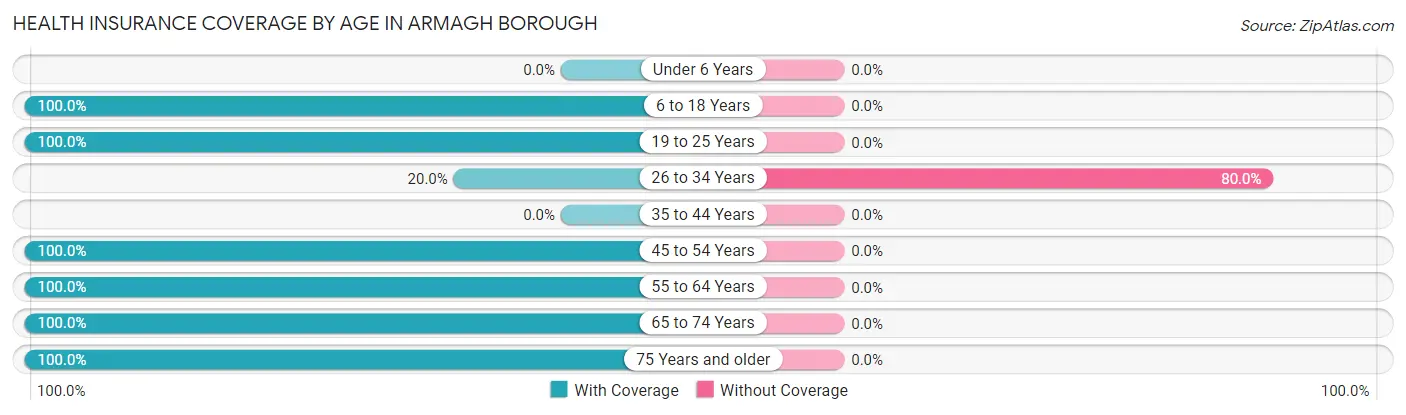
| Age Bracket | With Coverage | Without Coverage |
| Under 6 Years | 0 (0.0%) | 0 (0.0%) |
| 6 to 18 Years | 9 (100.0%) | 0 (0.0%) |
| 19 to 25 Years | 3 (100.0%) | 0 (0.0%) |
| 26 to 34 Years | 1 (20.0%) | 4 (80.0%) |
| 35 to 44 Years | 0 (0.0%) | 0 (0.0%) |
| 45 to 54 Years | 16 (100.0%) | 0 (0.0%) |
| 55 to 64 Years | 27 (100.0%) | 0 (0.0%) |
| 65 to 74 Years | 12 (100.0%) | 0 (0.0%) |
| 75 Years and older | 16 (100.0%) | 0 (0.0%) |
| Total | 84 (95.5%) | 4 (4.5%) |
Health Insurance Coverage by Citizenship Status in Armagh borough
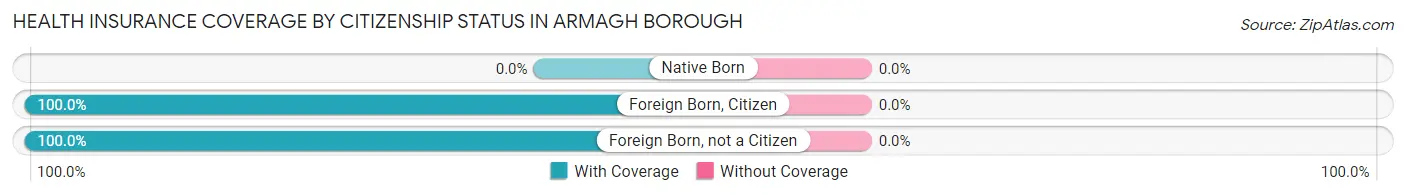
| Citizenship Status | With Coverage | Without Coverage |
| Native Born | 0 (0.0%) | 0 (0.0%) |
| Foreign Born, Citizen | 9 (100.0%) | 0 (0.0%) |
| Foreign Born, not a Citizen | 3 (100.0%) | 0 (0.0%) |
Health Insurance Coverage by Household Income in Armagh borough
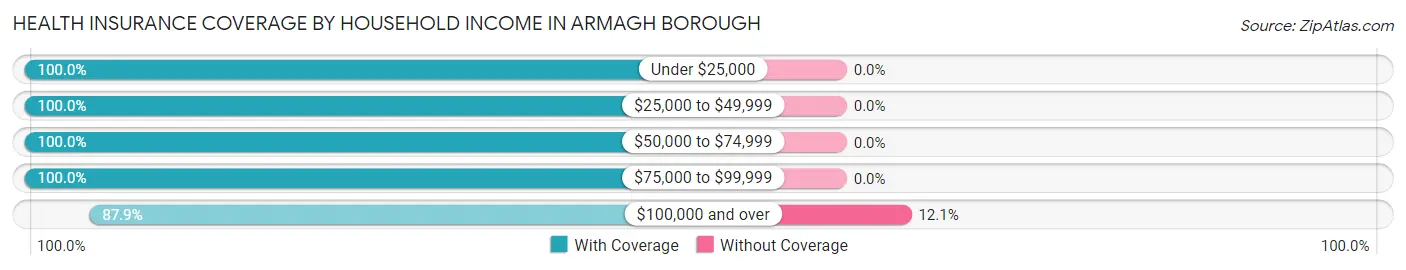
| Household Income | With Coverage | Without Coverage |
| Under $25,000 | 12 (100.0%) | 0 (0.0%) |
| $25,000 to $49,999 | 18 (100.0%) | 0 (0.0%) |
| $50,000 to $74,999 | 18 (100.0%) | 0 (0.0%) |
| $75,000 to $99,999 | 7 (100.0%) | 0 (0.0%) |
| $100,000 and over | 29 (87.9%) | 4 (12.1%) |
Public vs Private Health Insurance Coverage by Age in Armagh borough
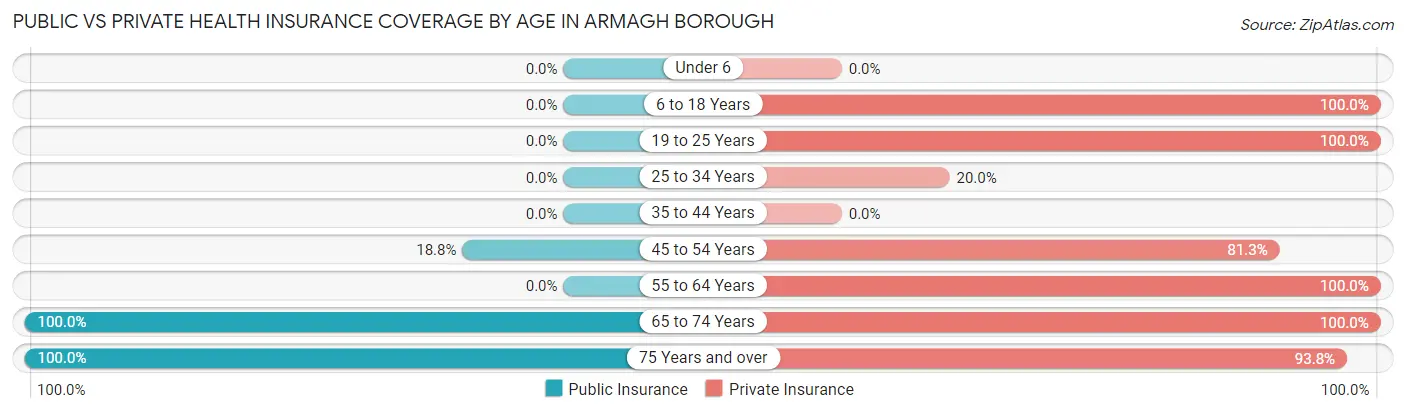
| Age Bracket | Public Insurance | Private Insurance |
| Under 6 | 0 (0.0%) | 0 (0.0%) |
| 6 to 18 Years | 0 (0.0%) | 9 (100.0%) |
| 19 to 25 Years | 0 (0.0%) | 3 (100.0%) |
| 25 to 34 Years | 0 (0.0%) | 1 (20.0%) |
| 35 to 44 Years | 0 (0.0%) | 0 (0.0%) |
| 45 to 54 Years | 3 (18.8%) | 13 (81.2%) |
| 55 to 64 Years | 0 (0.0%) | 27 (100.0%) |
| 65 to 74 Years | 12 (100.0%) | 12 (100.0%) |
| 75 Years and over | 16 (100.0%) | 15 (93.8%) |
| Total | 31 (35.2%) | 80 (90.9%) |
Disability Status by Sex by Age in Armagh borough
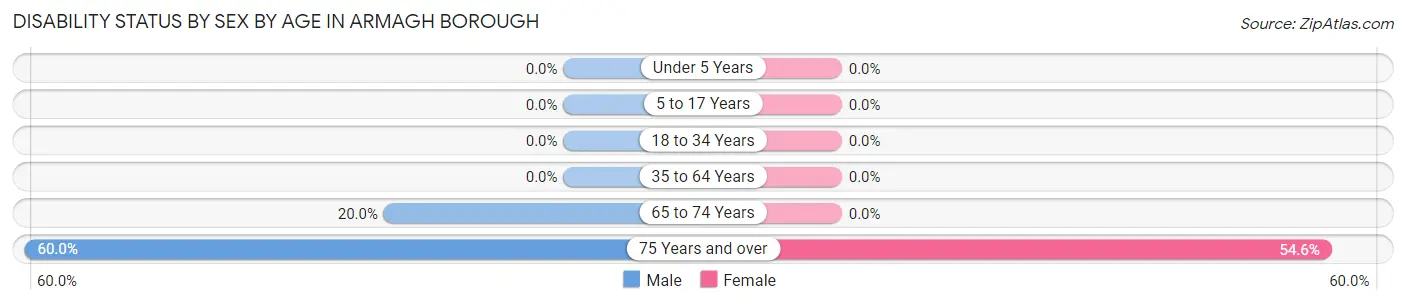
| Age Bracket | Male | Female |
| Under 5 Years | 0 (0.0%) | 0 (0.0%) |
| 5 to 17 Years | 0 (0.0%) | 0 (0.0%) |
| 18 to 34 Years | 0 (0.0%) | 0 (0.0%) |
| 35 to 64 Years | 0 (0.0%) | 0 (0.0%) |
| 65 to 74 Years | 2 (20.0%) | 0 (0.0%) |
| 75 Years and over | 3 (60.0%) | 6 (54.5%) |
Disability Class by Sex by Age in Armagh borough
Disability Class: Hearing Difficulty
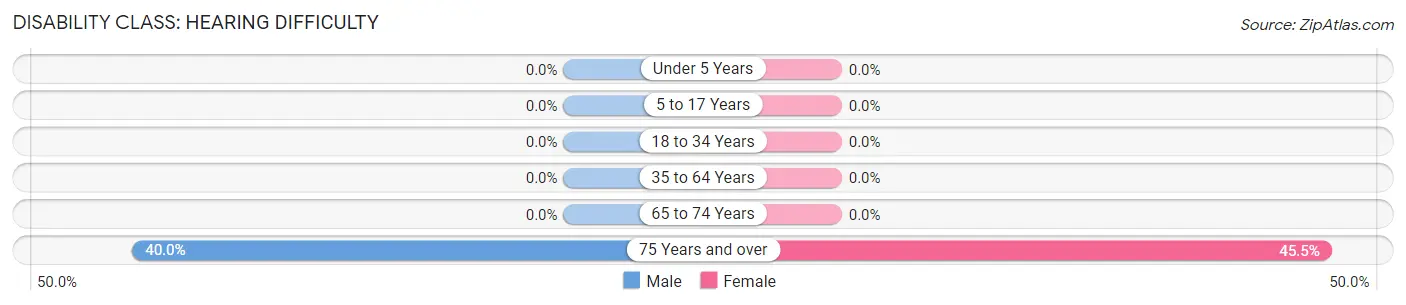
| Age Bracket | Male | Female |
| Under 5 Years | 0 (0.0%) | 0 (0.0%) |
| 5 to 17 Years | 0 (0.0%) | 0 (0.0%) |
| 18 to 34 Years | 0 (0.0%) | 0 (0.0%) |
| 35 to 64 Years | 0 (0.0%) | 0 (0.0%) |
| 65 to 74 Years | 0 (0.0%) | 0 (0.0%) |
| 75 Years and over | 2 (40.0%) | 5 (45.5%) |
Disability Class: Vision Difficulty
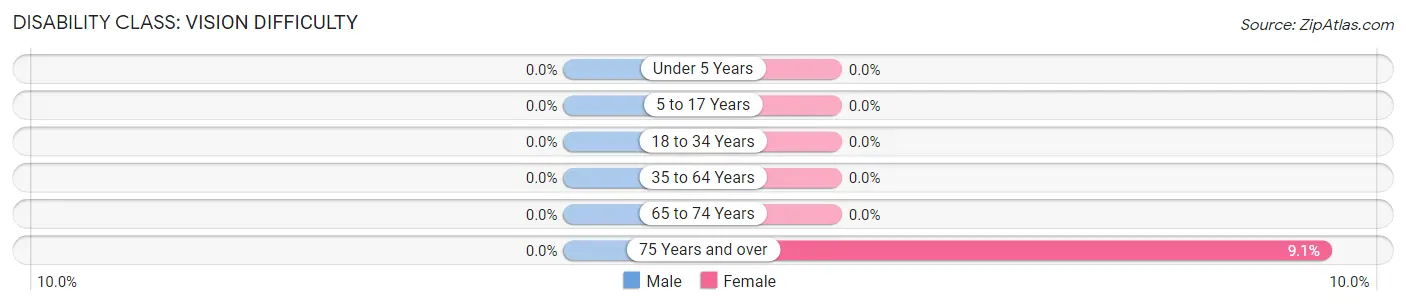
| Age Bracket | Male | Female |
| Under 5 Years | 0 (0.0%) | 0 (0.0%) |
| 5 to 17 Years | 0 (0.0%) | 0 (0.0%) |
| 18 to 34 Years | 0 (0.0%) | 0 (0.0%) |
| 35 to 64 Years | 0 (0.0%) | 0 (0.0%) |
| 65 to 74 Years | 0 (0.0%) | 0 (0.0%) |
| 75 Years and over | 0 (0.0%) | 1 (9.1%) |
Disability Class: Cognitive Difficulty
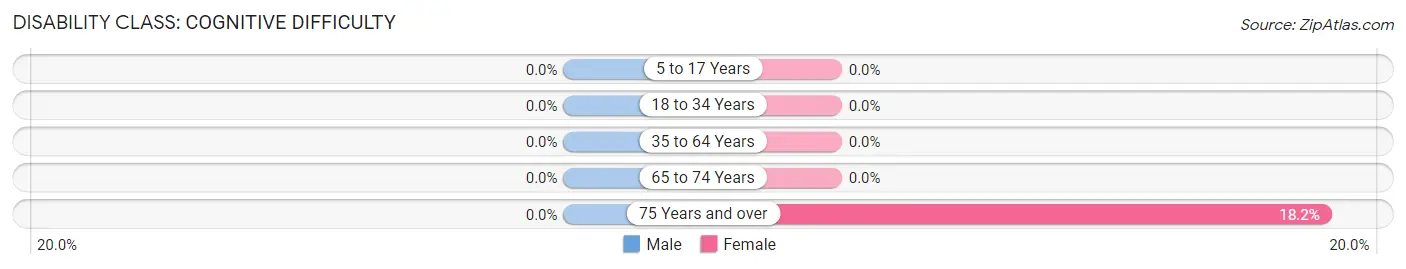
| Age Bracket | Male | Female |
| 5 to 17 Years | 0 (0.0%) | 0 (0.0%) |
| 18 to 34 Years | 0 (0.0%) | 0 (0.0%) |
| 35 to 64 Years | 0 (0.0%) | 0 (0.0%) |
| 65 to 74 Years | 0 (0.0%) | 0 (0.0%) |
| 75 Years and over | 0 (0.0%) | 2 (18.2%) |
Disability Class: Ambulatory Difficulty
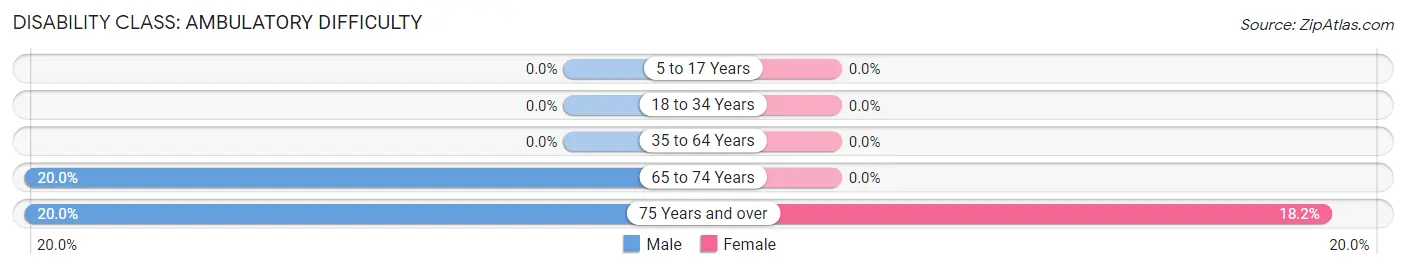
| Age Bracket | Male | Female |
| 5 to 17 Years | 0 (0.0%) | 0 (0.0%) |
| 18 to 34 Years | 0 (0.0%) | 0 (0.0%) |
| 35 to 64 Years | 0 (0.0%) | 0 (0.0%) |
| 65 to 74 Years | 2 (20.0%) | 0 (0.0%) |
| 75 Years and over | 1 (20.0%) | 2 (18.2%) |
Disability Class: Self-Care Difficulty
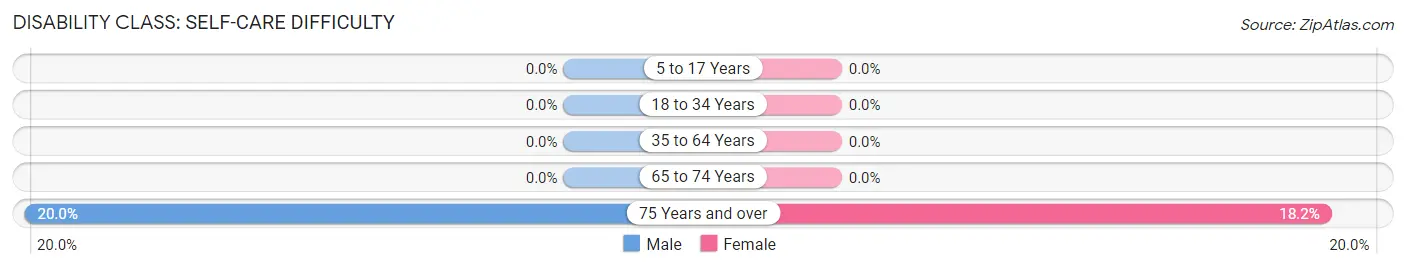
| Age Bracket | Male | Female |
| 5 to 17 Years | 0 (0.0%) | 0 (0.0%) |
| 18 to 34 Years | 0 (0.0%) | 0 (0.0%) |
| 35 to 64 Years | 0 (0.0%) | 0 (0.0%) |
| 65 to 74 Years | 0 (0.0%) | 0 (0.0%) |
| 75 Years and over | 1 (20.0%) | 2 (18.2%) |
Technology Access in Armagh borough
Computing Device Access in Armagh borough
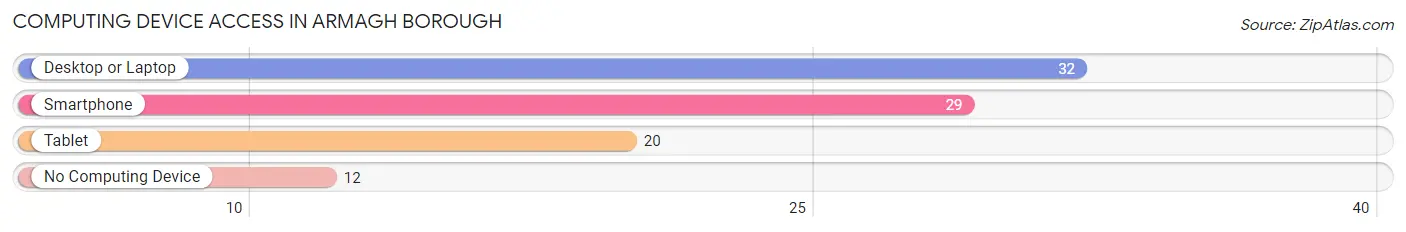
| Device Type | # Households | % Households |
| Desktop or Laptop | 32 | 69.6% |
| Smartphone | 29 | 63.0% |
| Tablet | 20 | 43.5% |
| No Computing Device | 12 | 26.1% |
| Total | 46 | 100.0% |
Internet Access in Armagh borough
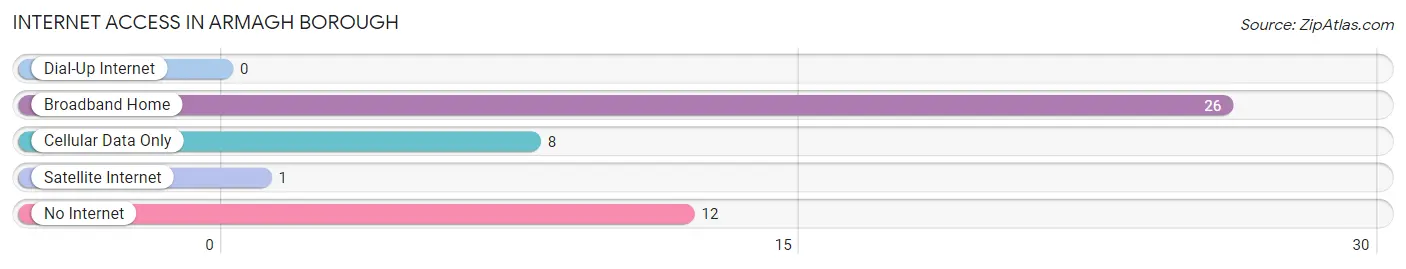
| Internet Type | # Households | % Households |
| Dial-Up Internet | 0 | 0.0% |
| Broadband Home | 26 | 56.5% |
| Cellular Data Only | 8 | 17.4% |
| Satellite Internet | 1 | 2.2% |
| No Internet | 12 | 26.1% |
| Total | 46 | 100.0% |
Armagh borough Summary
Armagh Borough is a borough in the county of Armagh, Northern Ireland. It is located in the south-east of the county, and is bordered by the counties of Tyrone, Fermanagh, and Monaghan. The borough has a population of approximately 8,000 people, and is the administrative centre of the county.
Geography
Armagh Borough is located in the south-east of the county of Armagh, and is bordered by the counties of Tyrone, Fermanagh, and Monaghan. The borough is situated on the River Blackwater, and is surrounded by rolling hills and lush green countryside. The borough is approximately 30 miles from Belfast, and is easily accessible by road and rail.
The borough is divided into two distinct areas; the city of Armagh, and the surrounding rural area. The city of Armagh is the administrative centre of the county, and is home to a number of important historical sites, including the Cathedral of St Patrick, the Navan Fort, and the Armagh Observatory. The surrounding rural area is home to a number of small villages and hamlets, and is a popular destination for tourists and outdoor enthusiasts.
History
Armagh Borough has a long and rich history, dating back to the Iron Age. The area was originally inhabited by the Celts, and was later conquered by the Romans. The area was then settled by the Normans in the 12th century, and the city of Armagh was established in 1189.
The city of Armagh was an important centre of learning and culture during the Middle Ages, and was home to a number of important monasteries and abbeys. The city was also the seat of the Church of Ireland, and was the centre of the Protestant Reformation in Ireland.
The city of Armagh was also an important centre of industry during the Industrial Revolution, and was home to a number of factories and mills. The city was also an important centre of commerce, and was home to a number of banks and financial institutions.
Economy
The economy of Armagh Borough is largely based on agriculture and tourism. The area is home to a number of small farms, and is a popular destination for tourists and outdoor enthusiasts. The city of Armagh is also an important centre of commerce, and is home to a number of banks and financial institutions.
The area is also home to a number of light industries, including food processing, engineering, and printing. The area is also home to a number of technology companies, and is a popular destination for IT professionals.
Demographics
The population of Armagh Borough is approximately 8,000 people. The majority of the population is of Irish descent, and the area is predominantly Catholic. The area is also home to a number of other ethnic groups, including Polish, Lithuanian, and Chinese.
The area is also home to a number of immigrants, and the population is growing at a steady rate. The area is also home to a number of refugees, and the population is becoming increasingly diverse.
Conclusion
Armagh Borough is a borough in the county of Armagh, Northern Ireland. It is located in the south-east of the county, and is bordered by the counties of Tyrone, Fermanagh, and Monaghan. The borough has a population of approximately 8,000 people, and is the administrative centre of the county. The economy of the area is largely based on agriculture and tourism, and the area is home to a number of small farms and light industries. The area is also home to a number of immigrants, and the population is becoming increasingly diverse.
Common Questions
What is Per Capita Income in Armagh borough?
Per Capita income in Armagh borough is $38,132.
What is the Median Family Income in Armagh borough?
Median Family Income in Armagh borough is $72,292.
What is the Median Household income in Armagh borough?
Median Household Income in Armagh borough is $55,000.
What is Income or Wage Gap in Armagh borough?
Income or Wage Gap in Armagh borough is 19.6%.
Women in Armagh borough earn 80.4 cents for every dollar earned by a man.
What is Inequality or Gini Index in Armagh borough?
Inequality or Gini Index in Armagh borough is 0.39.
What is the Total Population of Armagh borough?
Total Population of Armagh borough is 88.
What is the Total Male Population of Armagh borough?
Total Male Population of Armagh borough is 42.
What is the Total Female Population of Armagh borough?
Total Female Population of Armagh borough is 46.
What is the Ratio of Males per 100 Females in Armagh borough?
There are 91.30 Males per 100 Females in Armagh borough.
What is the Ratio of Females per 100 Males in Armagh borough?
There are 109.52 Females per 100 Males in Armagh borough.
What is the Median Population Age in Armagh borough?
Median Population Age in Armagh borough is 58.1 Years.
What is the Average Family Size in Armagh borough
Average Family Size in Armagh borough is 2.4 People.
What is the Average Household Size in Armagh borough
Average Household Size in Armagh borough is 1.9 People.
How Large is the Labor Force in Armagh borough?
There are 47 People in the Labor Forcein in Armagh borough.
What is the Percentage of People in the Labor Force in Armagh borough?
56.6% of People are in the Labor Force in Armagh borough.
What is the Unemployment Rate in Armagh borough?
Unemployment Rate in Armagh borough is 4.3%.