Salisbury borough, PA Map & Demographics
Salisbury borough Overview
$30,451
PER CAPITA INCOME
$83,500
AVG FAMILY INCOME
$70,278
AVG HOUSEHOLD INCOME
38.5%
WAGE / INCOME GAP [ % ]
61.5¢/ $1
WAGE / INCOME GAP [ $ ]
0.38
INEQUALITY / GINI INDEX
619
TOTAL POPULATION
257
MALE POPULATION
362
FEMALE POPULATION
70.99
MALES / 100 FEMALES
140.86
FEMALES / 100 MALES
39.3
MEDIAN AGE
3.0
AVG FAMILY SIZE
2.5
AVG HOUSEHOLD SIZE
354
LABOR FORCE [ PEOPLE ]
73.1%
PERCENT IN LABOR FORCE
11.9%
UNEMPLOYMENT RATE
Income in Salisbury borough
Income Overview in Salisbury borough
Per Capita Income in Salisbury borough is $30,451, while median incomes of families and households are $83,500 and $70,278 respectively.
| Characteristic | Number | Measure |
| Per Capita Income | 619 | $30,451 |
| Median Family Income | 174 | $83,500 |
| Mean Family Income | 174 | $89,309 |
| Median Household Income | 252 | $70,278 |
| Mean Household Income | 252 | $74,548 |
| Income Deficit | 174 | $0 |
| Wage / Income Gap (%) | 619 | 38.45% |
| Wage / Income Gap ($) | 619 | 61.55¢ per $1 |
| Gini / Inequality Index | 619 | 0.38 |
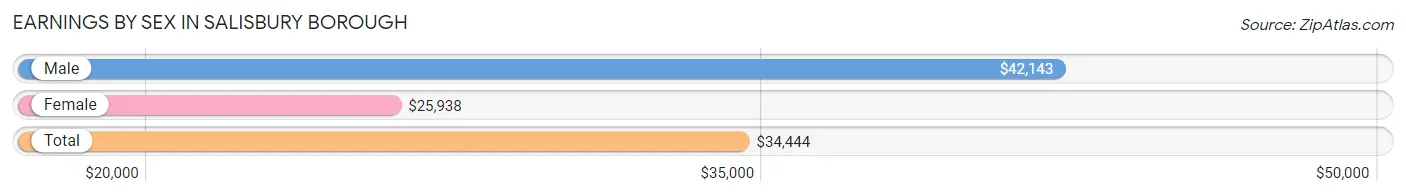
Earnings by Sex in Salisbury borough
Average Earnings in Salisbury borough are $34,444, $42,143 for men and $25,938 for women, a difference of 38.5%.
| Sex | Number | Average Earnings |
| Male | 192 (53.3%) | $42,143 |
| Female | 168 (46.7%) | $25,938 |
| Total | 360 (100.0%) | $34,444 |
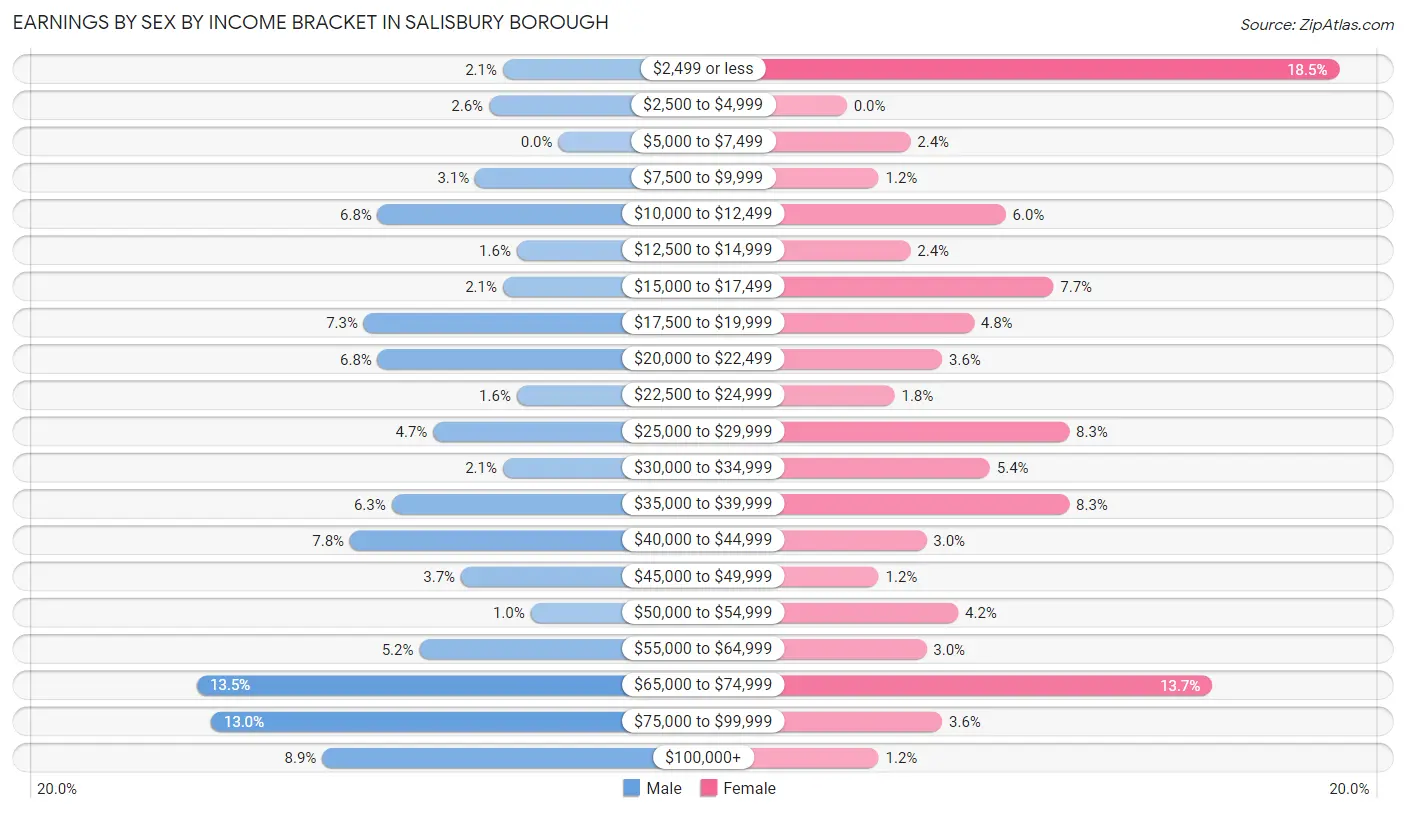
Earnings by Sex by Income Bracket in Salisbury borough
The most common earnings brackets in Salisbury borough are $65,000 to $74,999 for men (26 | 13.5%) and $2,499 or less for women (31 | 18.4%).
| Income | Male | Female |
| $2,499 or less | 4 (2.1%) | 31 (18.4%) |
| $2,500 to $4,999 | 5 (2.6%) | 0 (0.0%) |
| $5,000 to $7,499 | 0 (0.0%) | 4 (2.4%) |
| $7,500 to $9,999 | 6 (3.1%) | 2 (1.2%) |
| $10,000 to $12,499 | 13 (6.8%) | 10 (5.9%) |
| $12,500 to $14,999 | 3 (1.6%) | 4 (2.4%) |
| $15,000 to $17,499 | 4 (2.1%) | 13 (7.7%) |
| $17,500 to $19,999 | 14 (7.3%) | 8 (4.8%) |
| $20,000 to $22,499 | 13 (6.8%) | 6 (3.6%) |
| $22,500 to $24,999 | 3 (1.6%) | 3 (1.8%) |
| $25,000 to $29,999 | 9 (4.7%) | 14 (8.3%) |
| $30,000 to $34,999 | 4 (2.1%) | 9 (5.4%) |
| $35,000 to $39,999 | 12 (6.2%) | 14 (8.3%) |
| $40,000 to $44,999 | 15 (7.8%) | 5 (3.0%) |
| $45,000 to $49,999 | 7 (3.6%) | 2 (1.2%) |
| $50,000 to $54,999 | 2 (1.0%) | 7 (4.2%) |
| $55,000 to $64,999 | 10 (5.2%) | 5 (3.0%) |
| $65,000 to $74,999 | 26 (13.5%) | 23 (13.7%) |
| $75,000 to $99,999 | 25 (13.0%) | 6 (3.6%) |
| $100,000+ | 17 (8.8%) | 2 (1.2%) |
| Total | 192 (100.0%) | 168 (100.0%) |
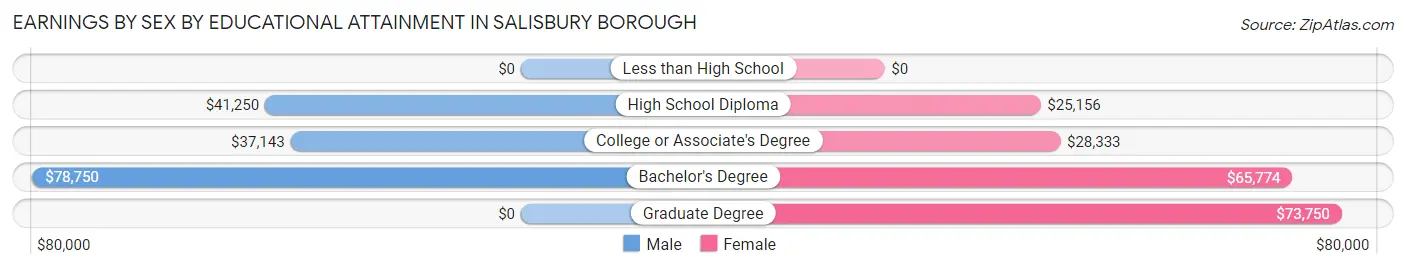
Earnings by Sex by Educational Attainment in Salisbury borough
Average earnings in Salisbury borough are $51,250 for men and $34,643 for women, a difference of 32.4%. Men with an educational attainment of bachelor's degree enjoy the highest average annual earnings of $78,750, while those with college or associate's degree education earn the least with $37,143. Women with an educational attainment of graduate degree earn the most with the average annual earnings of $73,750, while those with high school diploma education have the smallest earnings of $25,156.
| Educational Attainment | Male Income | Female Income |
| Less than High School | - | - |
| High School Diploma | $41,250 | $25,156 |
| College or Associate's Degree | $37,143 | $28,333 |
| Bachelor's Degree | $78,750 | $65,774 |
| Graduate Degree | - | - |
| Total | $51,250 | $34,643 |
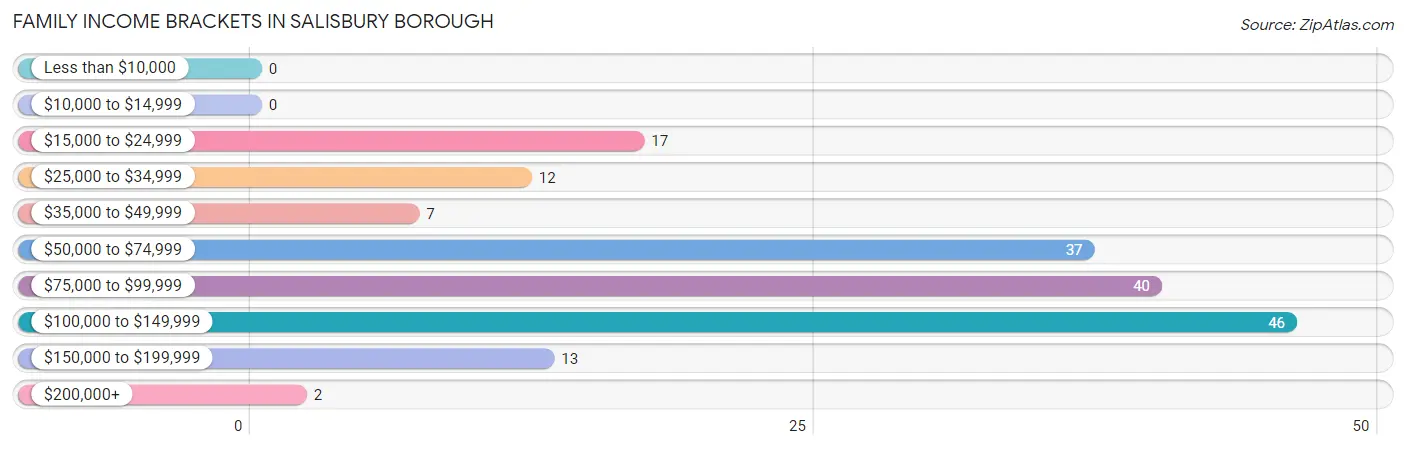
Family Income in Salisbury borough
Family Income Brackets in Salisbury borough
According to the Salisbury borough family income data, there are 46 families falling into the $100,000 to $149,999 income range, which is the most common income bracket and makes up 26.4% of all families.
| Income Bracket | # Families | % Families |
| Less than $10,000 | 0 | 0.0% |
| $10,000 to $14,999 | 0 | 0.0% |
| $15,000 to $24,999 | 17 | 9.8% |
| $25,000 to $34,999 | 12 | 6.9% |
| $35,000 to $49,999 | 7 | 4.0% |
| $50,000 to $74,999 | 37 | 21.3% |
| $75,000 to $99,999 | 40 | 23.0% |
| $100,000 to $149,999 | 46 | 26.4% |
| $150,000 to $199,999 | 13 | 7.5% |
| $200,000+ | 2 | 1.1% |
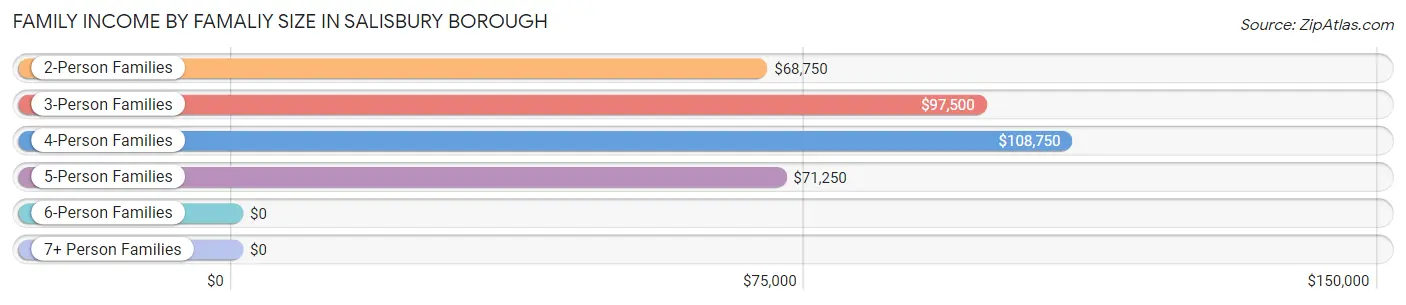
Family Income by Famaliy Size in Salisbury borough
4-person families (18 | 10.3%) account for the highest median family income in Salisbury borough with $108,750 per family, while 2-person families (78 | 44.8%) have the highest median income of $34,375 per family member.
| Income Bracket | # Families | Median Income |
| 2-Person Families | 78 (44.8%) | $68,750 |
| 3-Person Families | 48 (27.6%) | $97,500 |
| 4-Person Families | 18 (10.3%) | $108,750 |
| 5-Person Families | 7 (4.0%) | $71,250 |
| 6-Person Families | 21 (12.1%) | $0 |
| 7+ Person Families | 2 (1.1%) | $0 |
| Total | 174 (100.0%) | $83,500 |
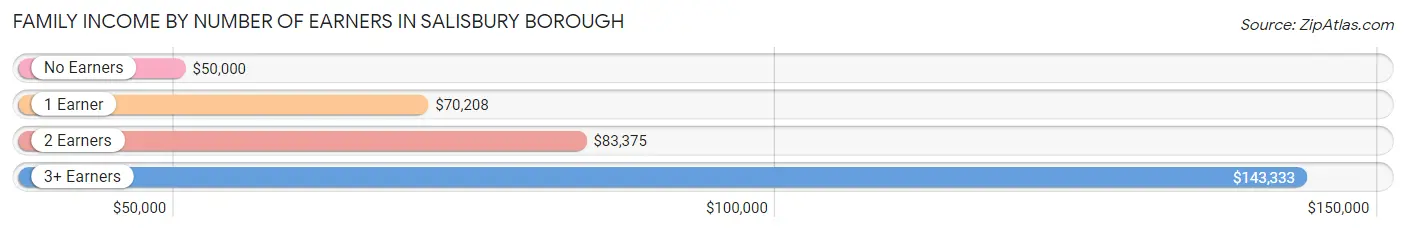
Family Income by Number of Earners in Salisbury borough
The median family income in Salisbury borough is $83,500, with families comprising 3+ earners (48) having the highest median family income of $143,333, while families with no earners (16) have the lowest median family income of $50,000, accounting for 27.6% and 9.2% of families, respectively.
| Number of Earners | # Families | Median Income |
| No Earners | 16 (9.2%) | $50,000 |
| 1 Earner | 49 (28.2%) | $70,208 |
| 2 Earners | 61 (35.1%) | $83,375 |
| 3+ Earners | 48 (27.6%) | $143,333 |
| Total | 174 (100.0%) | $83,500 |
Household Income in Salisbury borough
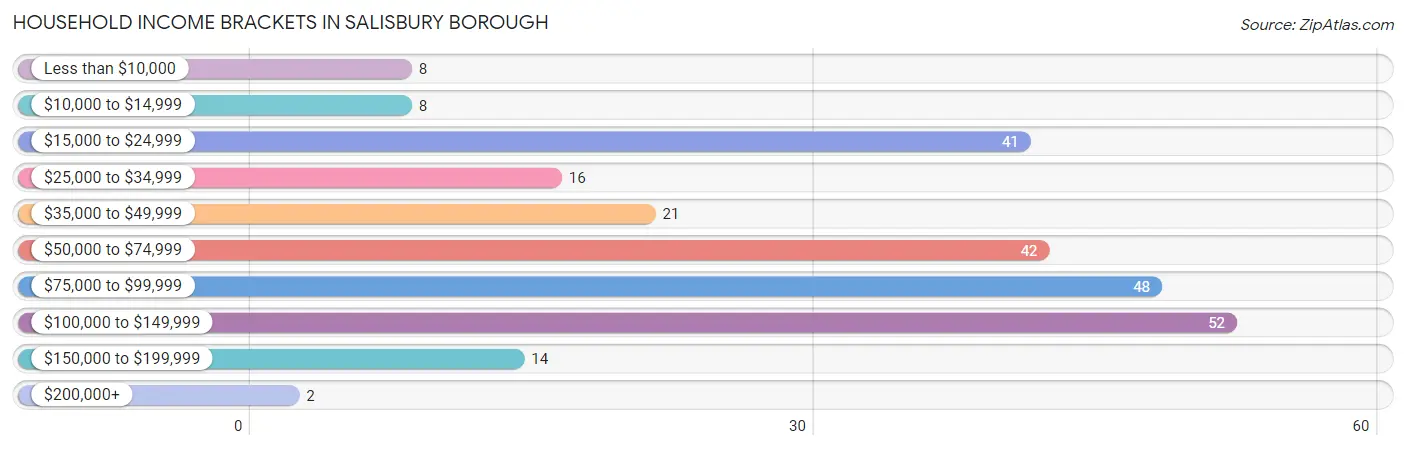
Household Income Brackets in Salisbury borough
With 52 households falling in the category, the $100,000 to $149,999 income range is the most frequent in Salisbury borough, accounting for 20.6% of all households. In contrast, only 2 households (0.8%) fall into the $200,000+ income bracket, making it the least populous group.
| Income Bracket | # Households | % Households |
| Less than $10,000 | 8 | 3.2% |
| $10,000 to $14,999 | 8 | 3.2% |
| $15,000 to $24,999 | 41 | 16.3% |
| $25,000 to $34,999 | 16 | 6.3% |
| $35,000 to $49,999 | 21 | 8.3% |
| $50,000 to $74,999 | 42 | 16.7% |
| $75,000 to $99,999 | 48 | 19.0% |
| $100,000 to $149,999 | 52 | 20.6% |
| $150,000 to $199,999 | 14 | 5.6% |
| $200,000+ | 2 | 0.8% |
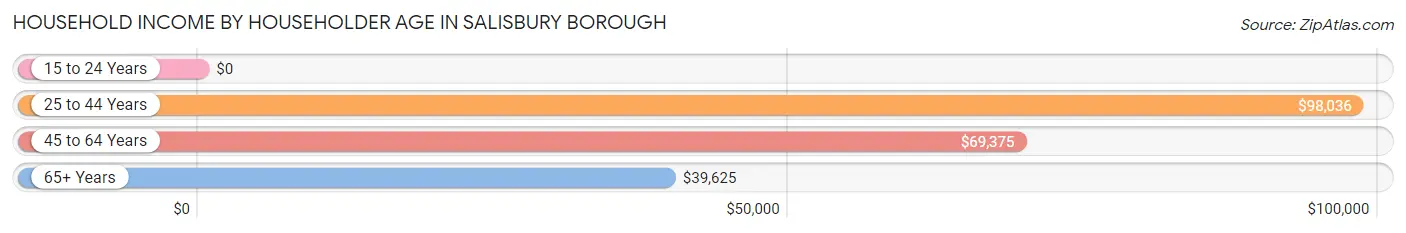
Household Income by Householder Age in Salisbury borough
The median household income in Salisbury borough is $70,278, with the highest median household income of $98,036 found in the 25 to 44 years age bracket for the primary householder. A total of 83 households (32.9%) fall into this category. Meanwhile, the 15 to 24 years age bracket for the primary householder has the lowest median household income of $0, with 5 households (2.0%) in this group.
| Income Bracket | # Households | Median Income |
| 15 to 24 Years | 5 (2.0%) | $0 |
| 25 to 44 Years | 83 (32.9%) | $98,036 |
| 45 to 64 Years | 85 (33.7%) | $69,375 |
| 65+ Years | 79 (31.4%) | $39,625 |
| Total | 252 (100.0%) | $70,278 |
Poverty in Salisbury borough
Income Below Poverty by Sex and Age in Salisbury borough
With 3.9% poverty level for males and 13.0% for females among the residents of Salisbury borough, 12 to 14 year old males and 35 to 44 year old females are the most vulnerable to poverty, with 2 males (50.0%) and 15 females (41.7%) in their respective age groups living below the poverty level.
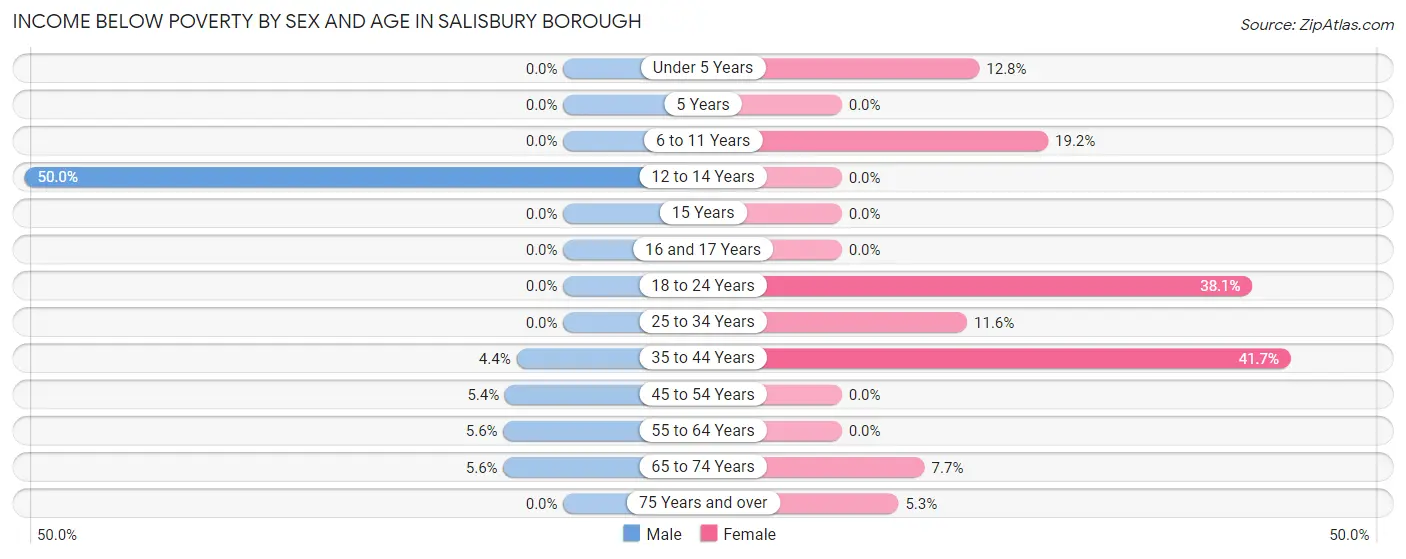
| Age Bracket | Male | Female |
| Under 5 Years | 0 (0.0%) | 6 (12.8%) |
| 5 Years | 0 (0.0%) | 0 (0.0%) |
| 6 to 11 Years | 0 (0.0%) | 9 (19.2%) |
| 12 to 14 Years | 2 (50.0%) | 0 (0.0%) |
| 15 Years | 0 (0.0%) | 0 (0.0%) |
| 16 and 17 Years | 0 (0.0%) | 0 (0.0%) |
| 18 to 24 Years | 0 (0.0%) | 8 (38.1%) |
| 25 to 34 Years | 0 (0.0%) | 5 (11.6%) |
| 35 to 44 Years | 2 (4.3%) | 15 (41.7%) |
| 45 to 54 Years | 2 (5.4%) | 0 (0.0%) |
| 55 to 64 Years | 2 (5.6%) | 0 (0.0%) |
| 65 to 74 Years | 2 (5.6%) | 2 (7.7%) |
| 75 Years and over | 0 (0.0%) | 2 (5.3%) |
| Total | 10 (3.9%) | 47 (13.0%) |
Income Above Poverty by Sex and Age in Salisbury borough
According to the poverty statistics in Salisbury borough, males aged under 5 years and females aged 12 to 14 years are the age groups that are most secure financially, with 100.0% of males and 100.0% of females in these age groups living above the poverty line.
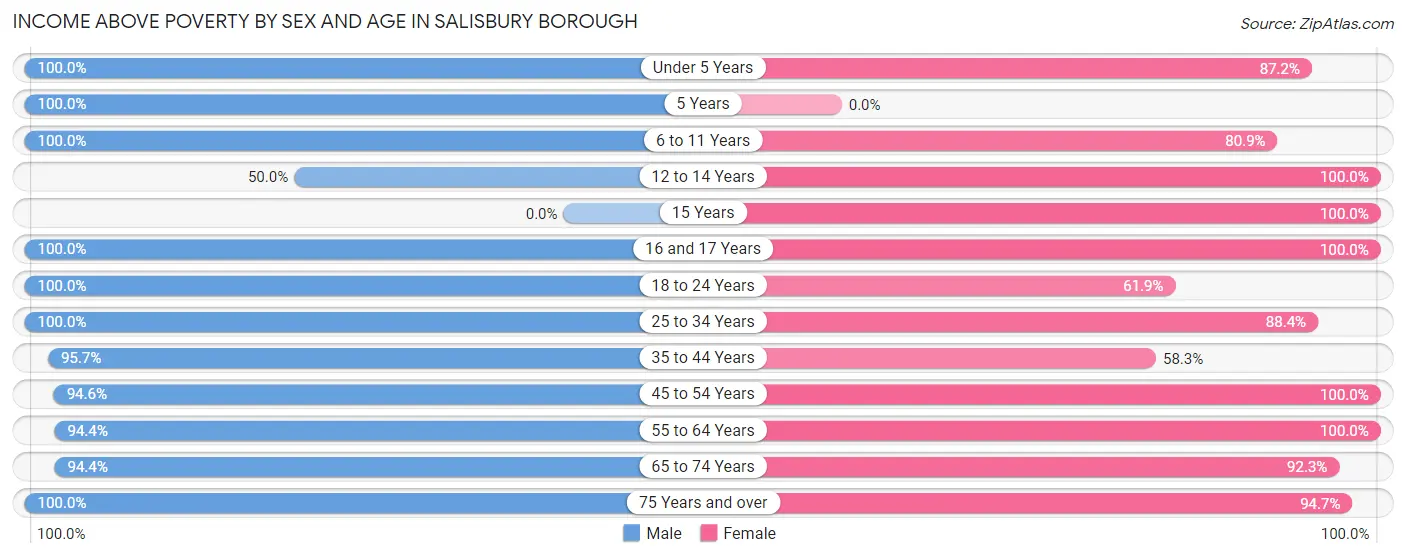
| Age Bracket | Male | Female |
| Under 5 Years | 5 (100.0%) | 41 (87.2%) |
| 5 Years | 10 (100.0%) | 0 (0.0%) |
| 6 to 11 Years | 12 (100.0%) | 38 (80.8%) |
| 12 to 14 Years | 2 (50.0%) | 8 (100.0%) |
| 15 Years | 0 (0.0%) | 2 (100.0%) |
| 16 and 17 Years | 3 (100.0%) | 19 (100.0%) |
| 18 to 24 Years | 29 (100.0%) | 13 (61.9%) |
| 25 to 34 Years | 30 (100.0%) | 38 (88.4%) |
| 35 to 44 Years | 44 (95.7%) | 21 (58.3%) |
| 45 to 54 Years | 35 (94.6%) | 32 (100.0%) |
| 55 to 64 Years | 34 (94.4%) | 43 (100.0%) |
| 65 to 74 Years | 34 (94.4%) | 24 (92.3%) |
| 75 Years and over | 9 (100.0%) | 36 (94.7%) |
| Total | 247 (96.1%) | 315 (87.0%) |
Income Below Poverty Among Married-Couple Families in Salisbury borough
The poverty statistics for married-couple families in Salisbury borough show that 1.4% or 2 of the total 143 families live below the poverty line. Families with 3 or 4 children have the highest poverty rate of 8.0%, comprising of 2 families. On the other hand, families with no children have the lowest poverty rate of 0.0%, which includes 0 families.
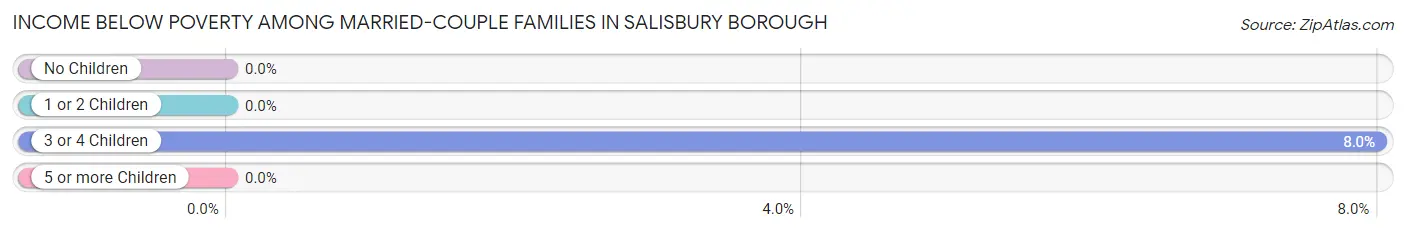
| Children | Above Poverty | Below Poverty |
| No Children | 87 (100.0%) | 0 (0.0%) |
| 1 or 2 Children | 29 (100.0%) | 0 (0.0%) |
| 3 or 4 Children | 23 (92.0%) | 2 (8.0%) |
| 5 or more Children | 2 (100.0%) | 0 (0.0%) |
| Total | 141 (98.6%) | 2 (1.4%) |
Income Below Poverty Among Single-Parent Households in Salisbury borough
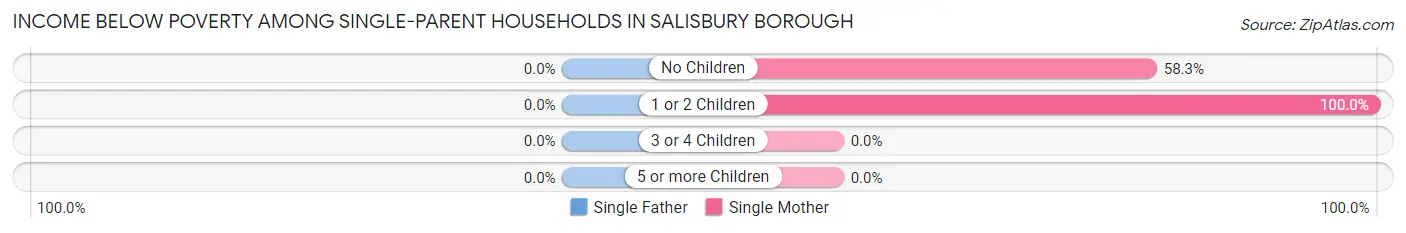
| Children | Single Father | Single Mother |
| No Children | 0 (0.0%) | 7 (58.3%) |
| 1 or 2 Children | 0 (0.0%) | 5 (100.0%) |
| 3 or 4 Children | 0 (0.0%) | 0 (0.0%) |
| 5 or more Children | 0 (0.0%) | 0 (0.0%) |
| Total | 0 (0.0%) | 12 (70.6%) |
Income Below Poverty Among Married-Couple vs Single-Parent Households in Salisbury borough
The poverty data for Salisbury borough shows that 2 of the married-couple family households (1.4%) and 12 of the single-parent households (38.7%) are living below the poverty level. Within the married-couple family households, those with 3 or 4 children have the highest poverty rate, with 2 households (8.0%) falling below the poverty line. Among the single-parent households, those with no children have the highest poverty rate, with 7 household (43.8%) living below poverty.
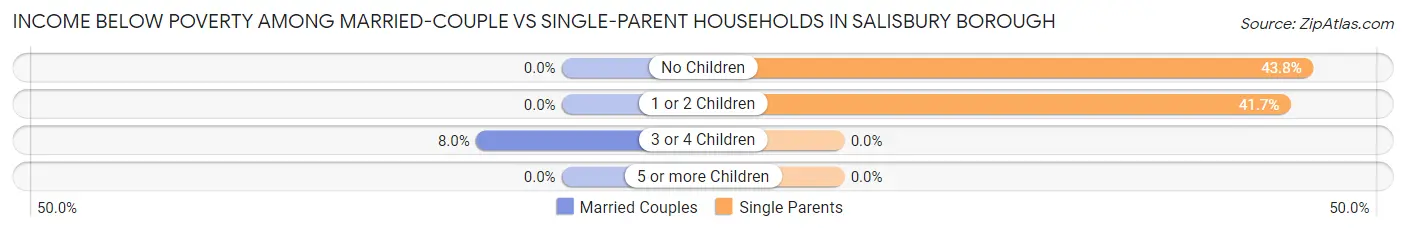
| Children | Married-Couple Families | Single-Parent Households |
| No Children | 0 (0.0%) | 7 (43.8%) |
| 1 or 2 Children | 0 (0.0%) | 5 (41.7%) |
| 3 or 4 Children | 2 (8.0%) | 0 (0.0%) |
| 5 or more Children | 0 (0.0%) | 0 (0.0%) |
| Total | 2 (1.4%) | 12 (38.7%) |
Race in Salisbury borough
The most populous races in Salisbury borough are White / Caucasian (597 | 96.5%), Two or more Races (17 | 2.8%), and Hispanic or Latino (11 | 1.8%).
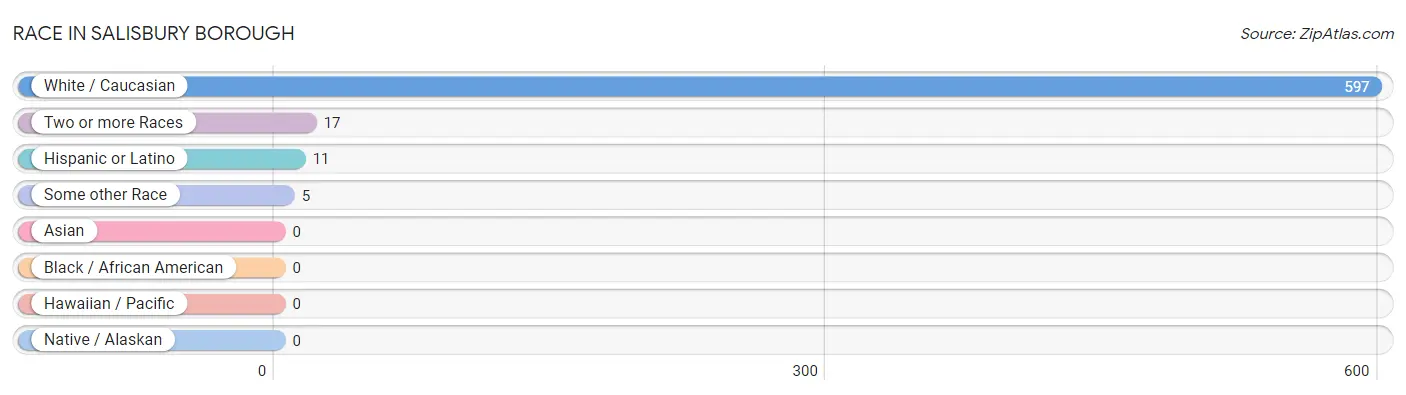
| Race | # Population | % Population |
| Asian | 0 | 0.0% |
| Black / African American | 0 | 0.0% |
| Hawaiian / Pacific | 0 | 0.0% |
| Hispanic or Latino | 11 | 1.8% |
| Native / Alaskan | 0 | 0.0% |
| White / Caucasian | 597 | 96.5% |
| Two or more Races | 17 | 2.8% |
| Some other Race | 5 | 0.8% |
| Total | 619 | 100.0% |
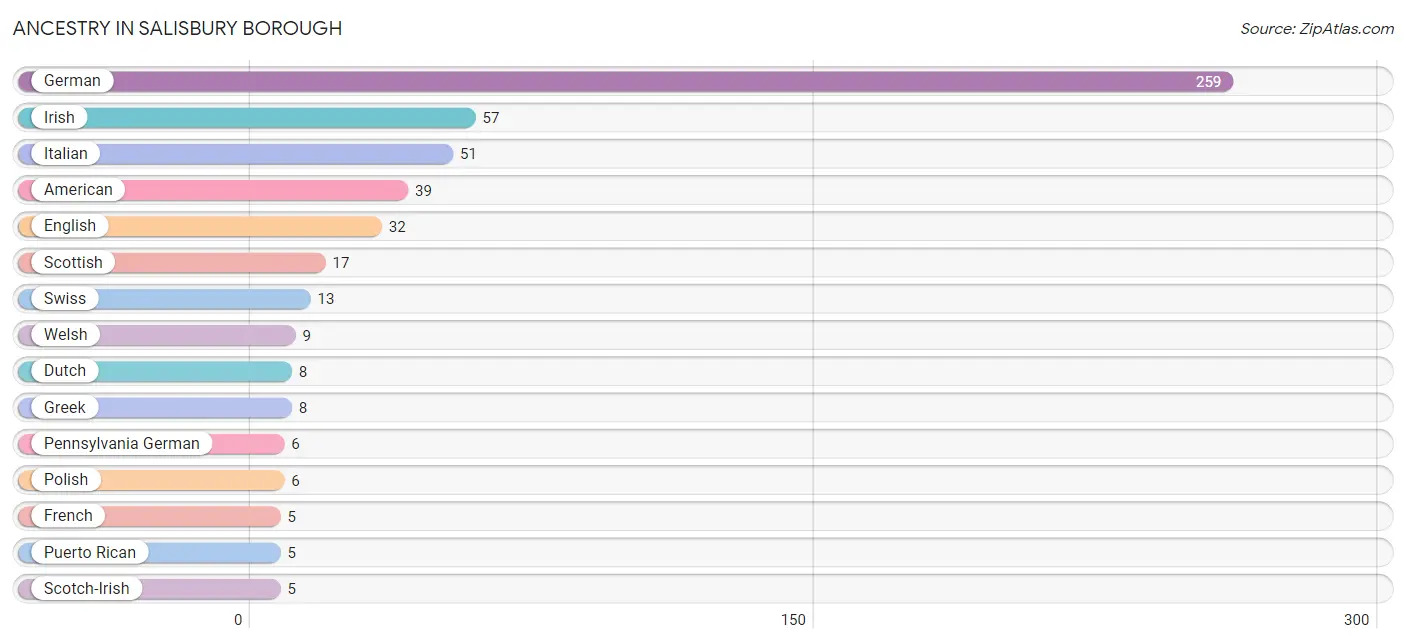
Ancestry in Salisbury borough
The most populous ancestries reported in Salisbury borough are German (259 | 41.8%), Irish (57 | 9.2%), Italian (51 | 8.2%), American (39 | 6.3%), and English (32 | 5.2%), together accounting for 70.8% of all Salisbury borough residents.
| Ancestry | # Population | % Population |
| American | 39 | 6.3% |
| Arab | 2 | 0.3% |
| Dutch | 8 | 1.3% |
| English | 32 | 5.2% |
| French | 5 | 0.8% |
| German | 259 | 41.8% |
| Greek | 8 | 1.3% |
| Irish | 57 | 9.2% |
| Italian | 51 | 8.2% |
| Lebanese | 2 | 0.3% |
| Navajo | 1 | 0.2% |
| Pennsylvania German | 6 | 1.0% |
| Polish | 6 | 1.0% |
| Portuguese | 1 | 0.2% |
| Puerto Rican | 5 | 0.8% |
| Scotch-Irish | 5 | 0.8% |
| Scottish | 17 | 2.8% |
| Slovak | 2 | 0.3% |
| Swiss | 13 | 2.1% |
| Welsh | 9 | 1.5% | View All 20 Rows |
Immigrants in Salisbury borough
The most numerous immigrant groups reported in Salisbury borough came from Brazil (1 | 0.2%), Latin America (1 | 0.2%), and South America (1 | 0.2%), together accounting for 0.5% of all Salisbury borough residents.
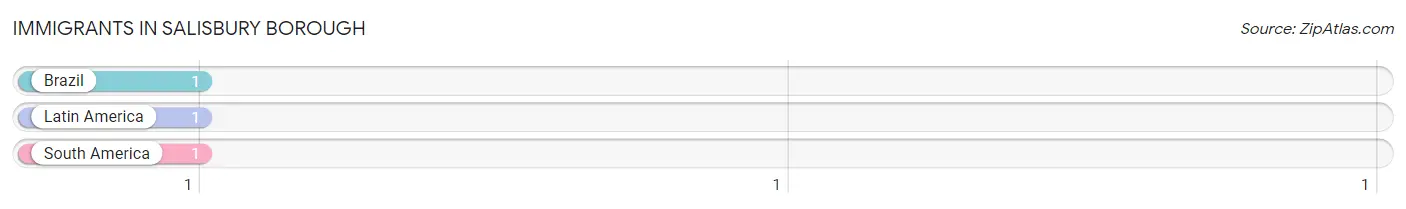
| Immigration Origin | # Population | % Population |
| Brazil | 1 | 0.2% |
| Latin America | 1 | 0.2% |
| South America | 1 | 0.2% | View All 3 Rows |
Sex and Age in Salisbury borough
Sex and Age in Salisbury borough
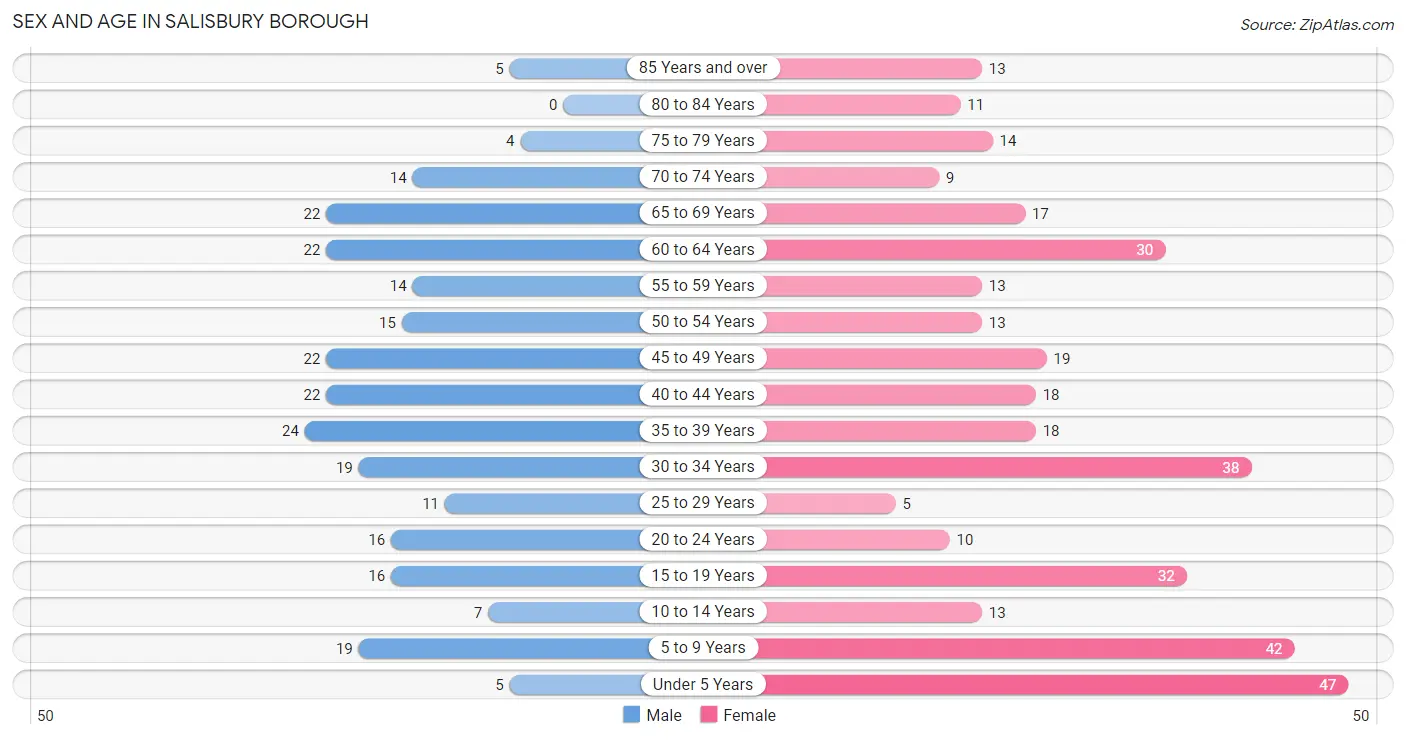
The most populous age groups in Salisbury borough are 35 to 39 Years (24 | 9.3%) for men and Under 5 Years (47 | 13.0%) for women.
| Age Bracket | Male | Female |
| Under 5 Years | 5 (1.9%) | 47 (13.0%) |
| 5 to 9 Years | 19 (7.4%) | 42 (11.6%) |
| 10 to 14 Years | 7 (2.7%) | 13 (3.6%) |
| 15 to 19 Years | 16 (6.2%) | 32 (8.8%) |
| 20 to 24 Years | 16 (6.2%) | 10 (2.8%) |
| 25 to 29 Years | 11 (4.3%) | 5 (1.4%) |
| 30 to 34 Years | 19 (7.4%) | 38 (10.5%) |
| 35 to 39 Years | 24 (9.3%) | 18 (5.0%) |
| 40 to 44 Years | 22 (8.6%) | 18 (5.0%) |
| 45 to 49 Years | 22 (8.6%) | 19 (5.2%) |
| 50 to 54 Years | 15 (5.8%) | 13 (3.6%) |
| 55 to 59 Years | 14 (5.4%) | 13 (3.6%) |
| 60 to 64 Years | 22 (8.6%) | 30 (8.3%) |
| 65 to 69 Years | 22 (8.6%) | 17 (4.7%) |
| 70 to 74 Years | 14 (5.4%) | 9 (2.5%) |
| 75 to 79 Years | 4 (1.6%) | 14 (3.9%) |
| 80 to 84 Years | 0 (0.0%) | 11 (3.0%) |
| 85 Years and over | 5 (1.9%) | 13 (3.6%) |
| Total | 257 (100.0%) | 362 (100.0%) |
Families and Households in Salisbury borough
Median Family Size in Salisbury borough
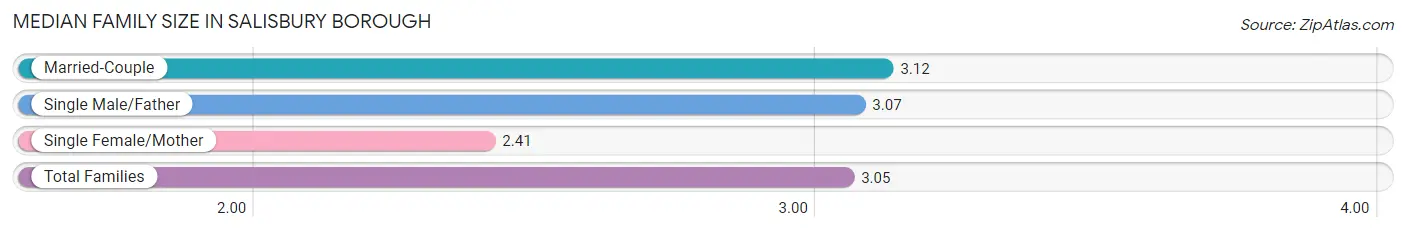
The median family size in Salisbury borough is 3.05 persons per family, with married-couple families (143 | 82.2%) accounting for the largest median family size of 3.12 persons per family. On the other hand, single female/mother families (17 | 9.8%) represent the smallest median family size with 2.41 persons per family.
| Family Type | # Families | Family Size |
| Married-Couple | 143 (82.2%) | 3.12 |
| Single Male/Father | 14 (8.1%) | 3.07 |
| Single Female/Mother | 17 (9.8%) | 2.41 |
| Total Families | 174 (100.0%) | 3.05 |
Median Household Size in Salisbury borough
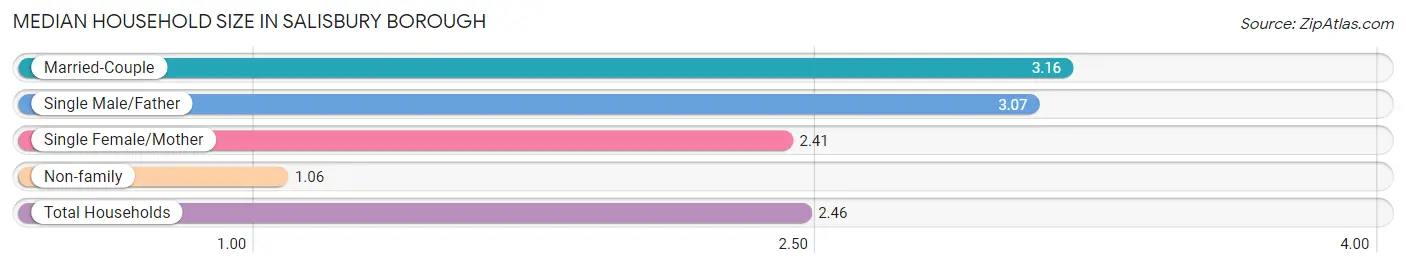
The median household size in Salisbury borough is 2.46 persons per household, with married-couple households (143 | 56.8%) accounting for the largest median household size of 3.16 persons per household. non-family households (78 | 30.9%) represent the smallest median household size with 1.06 persons per household.
| Household Type | # Households | Household Size |
| Married-Couple | 143 (56.8%) | 3.16 |
| Single Male/Father | 14 (5.6%) | 3.07 |
| Single Female/Mother | 17 (6.8%) | 2.41 |
| Non-family | 78 (30.9%) | 1.06 |
| Total Households | 252 (100.0%) | 2.46 |
Household Size by Marriage Status in Salisbury borough
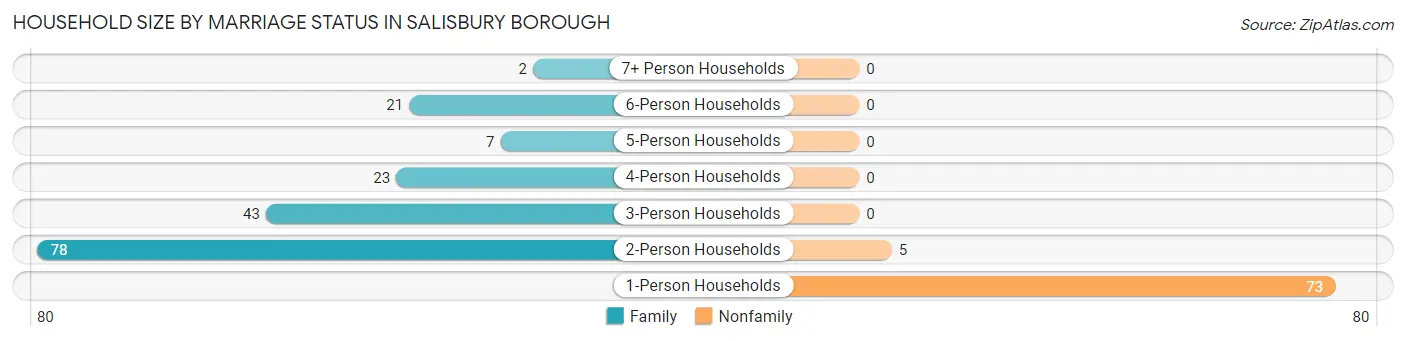
Out of a total of 252 households in Salisbury borough, 174 (69.1%) are family households, while 78 (30.9%) are nonfamily households. The most numerous type of family households are 2-person households, comprising 78, and the most common type of nonfamily households are 1-person households, comprising 73.
| Household Size | Family Households | Nonfamily Households |
| 1-Person Households | - | 73 (29.0%) |
| 2-Person Households | 78 (30.9%) | 5 (2.0%) |
| 3-Person Households | 43 (17.1%) | 0 (0.0%) |
| 4-Person Households | 23 (9.1%) | 0 (0.0%) |
| 5-Person Households | 7 (2.8%) | 0 (0.0%) |
| 6-Person Households | 21 (8.3%) | 0 (0.0%) |
| 7+ Person Households | 2 (0.8%) | 0 (0.0%) |
| Total | 174 (69.1%) | 78 (30.9%) |
Female Fertility in Salisbury borough
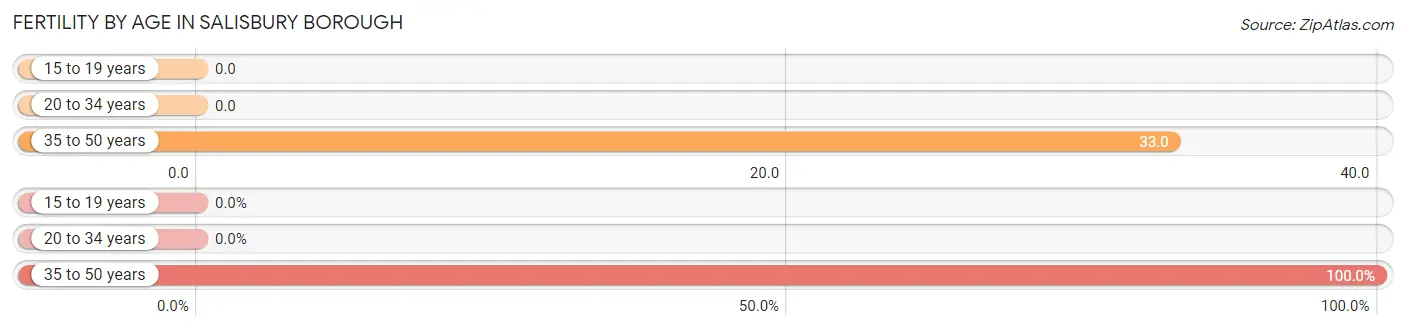
Fertility by Age in Salisbury borough
Average fertility rate in Salisbury borough is 14.0 births per 1,000 women. Women in the age bracket of 35 to 50 years have the highest fertility rate with 33.0 births per 1,000 women. Women in the age bracket of 35 to 50 years acount for 100.0% of all women with births.
| Age Bracket | Women with Births | Births / 1,000 Women |
| 15 to 19 years | 0 (0.0%) | 0.0 |
| 20 to 34 years | 0 (0.0%) | 0.0 |
| 35 to 50 years | 2 (100.0%) | 33.0 |
| Total | 2 (100.0%) | 14.0 |
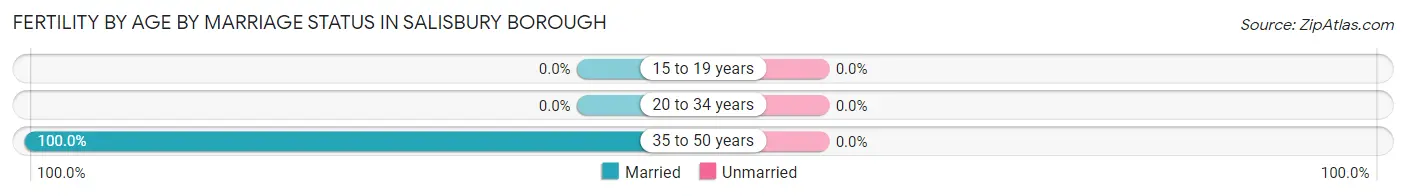
Fertility by Age by Marriage Status in Salisbury borough
| Age Bracket | Married | Unmarried |
| 15 to 19 years | 0 (0.0%) | 0 (0.0%) |
| 20 to 34 years | 0 (0.0%) | 0 (0.0%) |
| 35 to 50 years | 2 (100.0%) | 0 (0.0%) |
| Total | 2 (100.0%) | 0 (0.0%) |
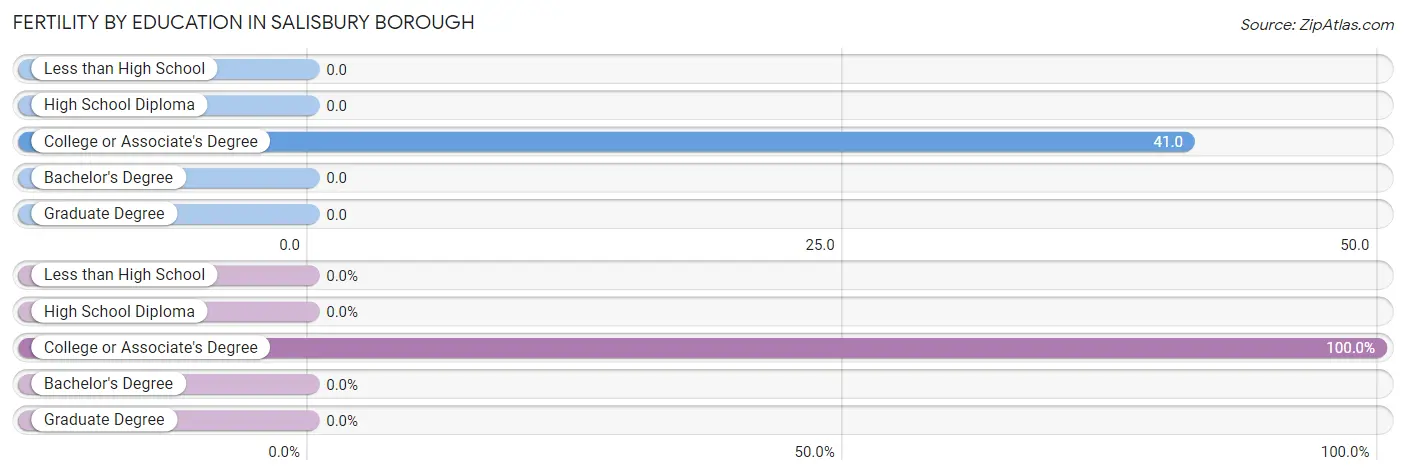
Fertility by Education in Salisbury borough
| Educational Attainment | Women with Births | Births / 1,000 Women |
| Less than High School | 0 (0.0%) | 0.0 |
| High School Diploma | 0 (0.0%) | 0.0 |
| College or Associate's Degree | 2 (100.0%) | 41.0 |
| Bachelor's Degree | 0 (0.0%) | 0.0 |
| Graduate Degree | 0 (0.0%) | 0.0 |
| Total | 2 (100.0%) | 14.0 |
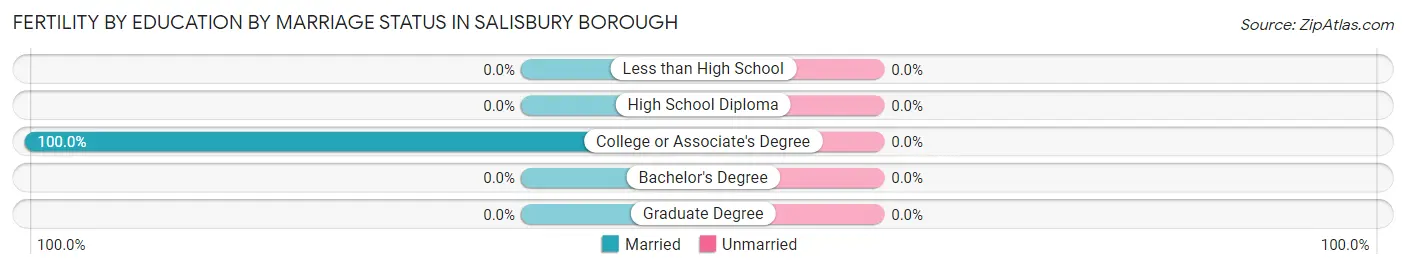
Fertility by Education by Marriage Status in Salisbury borough
| Educational Attainment | Married | Unmarried |
| Less than High School | 0 (0.0%) | 0 (0.0%) |
| High School Diploma | 0 (0.0%) | 0 (0.0%) |
| College or Associate's Degree | 2 (100.0%) | 0 (0.0%) |
| Bachelor's Degree | 0 (0.0%) | 0 (0.0%) |
| Graduate Degree | 0 (0.0%) | 0 (0.0%) |
| Total | 2 (100.0%) | 0 (0.0%) |
Employment Characteristics in Salisbury borough
Employment by Class of Employer in Salisbury borough
Among the 307 employed individuals in Salisbury borough, private company employees (193 | 62.9%), local government employees (39 | 12.7%), and self-employed (incorporated) (26 | 8.5%) make up the most common classes of employment.
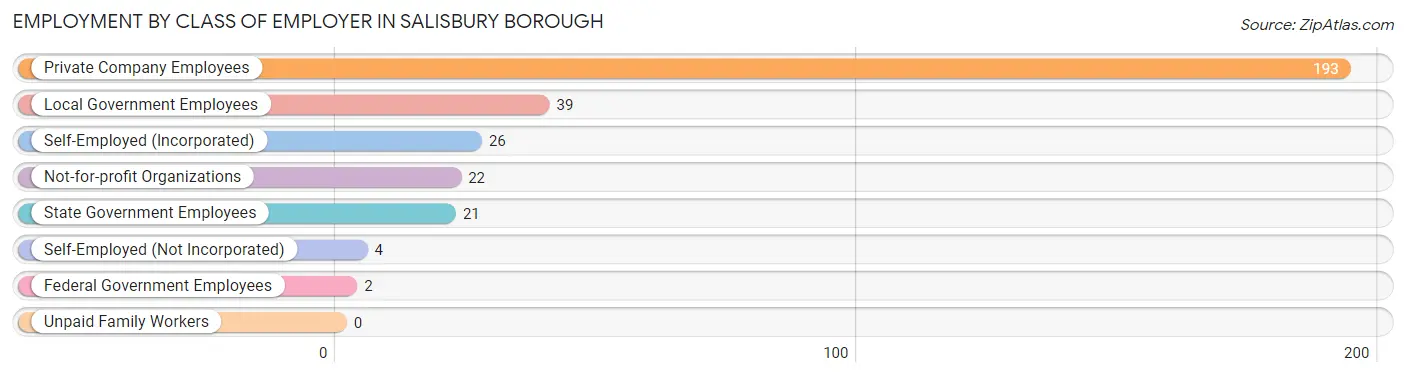
| Employer Class | # Employees | % Employees |
| Private Company Employees | 193 | 62.9% |
| Self-Employed (Incorporated) | 26 | 8.5% |
| Self-Employed (Not Incorporated) | 4 | 1.3% |
| Not-for-profit Organizations | 22 | 7.2% |
| Local Government Employees | 39 | 12.7% |
| State Government Employees | 21 | 6.8% |
| Federal Government Employees | 2 | 0.6% |
| Unpaid Family Workers | 0 | 0.0% |
| Total | 307 | 100.0% |
Employment Status by Age in Salisbury borough
According to the labor force statistics for Salisbury borough, out of the total population over 16 years of age (484), 73.1% or 354 individuals are in the labor force, with 11.9% or 42 of them unemployed. The age group with the highest labor force participation rate is 20 to 24 years, with 100.0% or 26 individuals in the labor force. Within the labor force, the 16 to 19 years age range has the highest percentage of unemployed individuals, with 45.5% or 16 of them being unemployed.
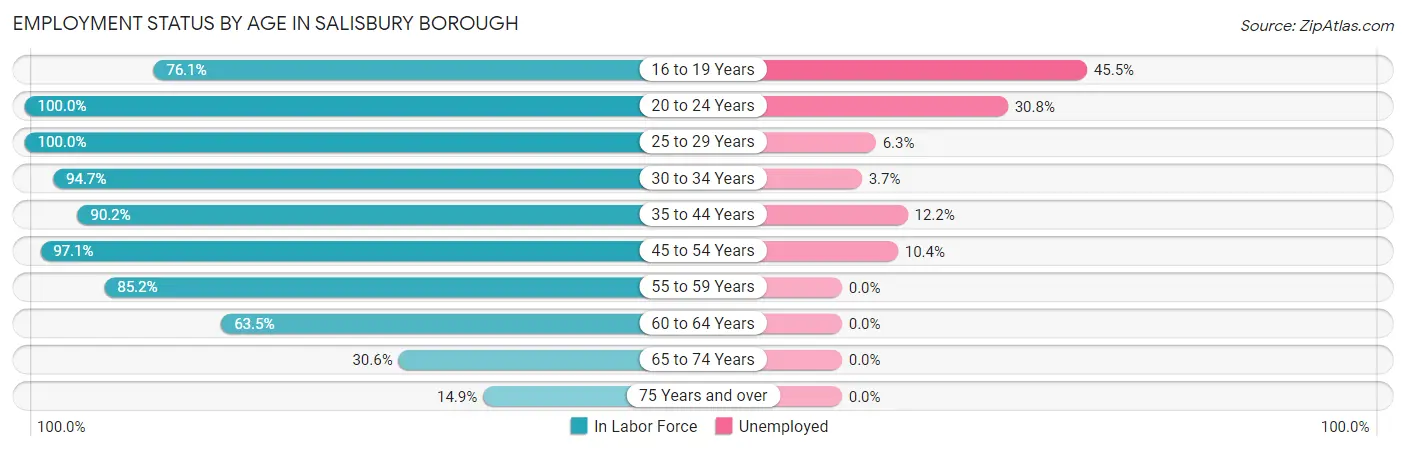
| Age Bracket | In Labor Force | Unemployed |
| 16 to 19 Years | 35 (76.1%) | 16 (45.5%) |
| 20 to 24 Years | 26 (100.0%) | 8 (30.8%) |
| 25 to 29 Years | 16 (100.0%) | 1 (6.3%) |
| 30 to 34 Years | 54 (94.7%) | 2 (3.7%) |
| 35 to 44 Years | 74 (90.2%) | 9 (12.2%) |
| 45 to 54 Years | 67 (97.1%) | 7 (10.4%) |
| 55 to 59 Years | 23 (85.2%) | 0 (0.0%) |
| 60 to 64 Years | 33 (63.5%) | 0 (0.0%) |
| 65 to 74 Years | 19 (30.6%) | 0 (0.0%) |
| 75 Years and over | 7 (14.9%) | 0 (0.0%) |
| Total | 354 (73.1%) | 42 (11.9%) |
Employment Status by Educational Attainment in Salisbury borough
According to labor force statistics for Salisbury borough, 88.1% of individuals (267) out of the total population between 25 and 64 years of age (303) are in the labor force, with 7.1% or 19 of them being unemployed. The group with the highest labor force participation rate are those with the educational attainment of bachelor's degree or higher, with 92.9% or 65 individuals in the labor force. Within the labor force, individuals with college / associate degree education have the highest percentage of unemployment, with 10.8% or 7 of them being unemployed.
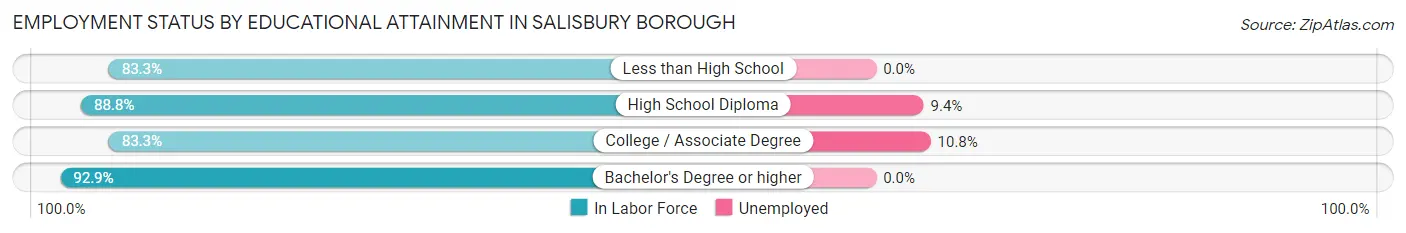
| Educational Attainment | In Labor Force | Unemployed |
| Less than High School | 10 (83.3%) | 0 (0.0%) |
| High School Diploma | 127 (88.8%) | 13 (9.4%) |
| College / Associate Degree | 65 (83.3%) | 8 (10.8%) |
| Bachelor's Degree or higher | 65 (92.9%) | 0 (0.0%) |
| Total | 267 (88.1%) | 22 (7.1%) |
Employment Occupations by Sex in Salisbury borough
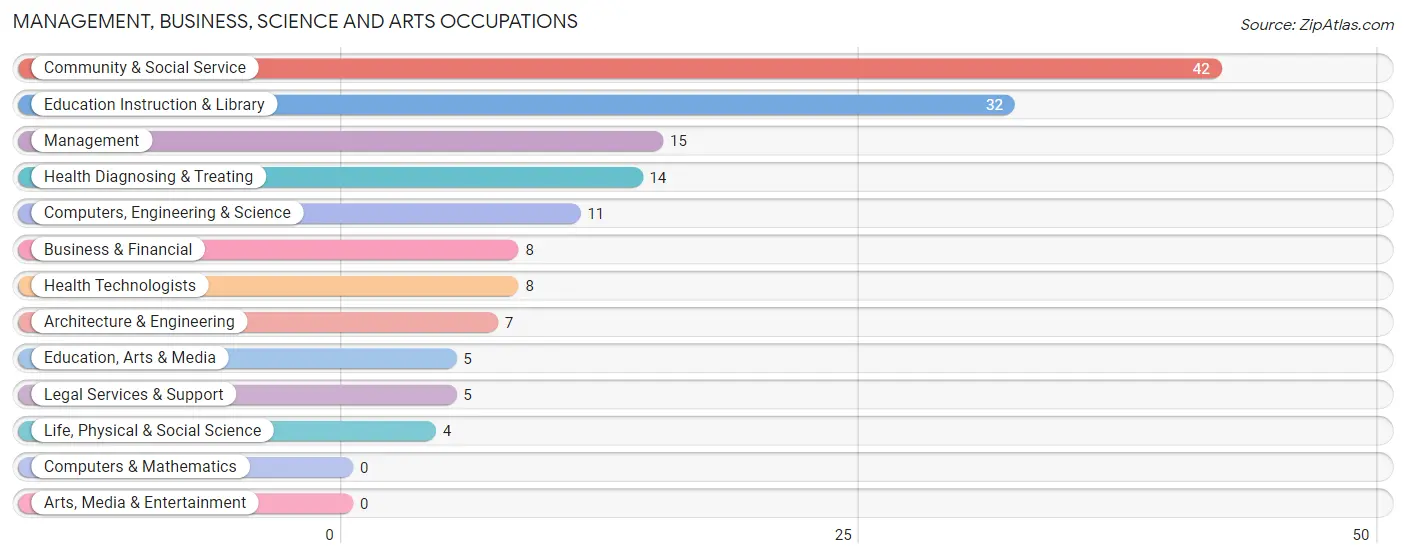
Management, Business, Science and Arts Occupations
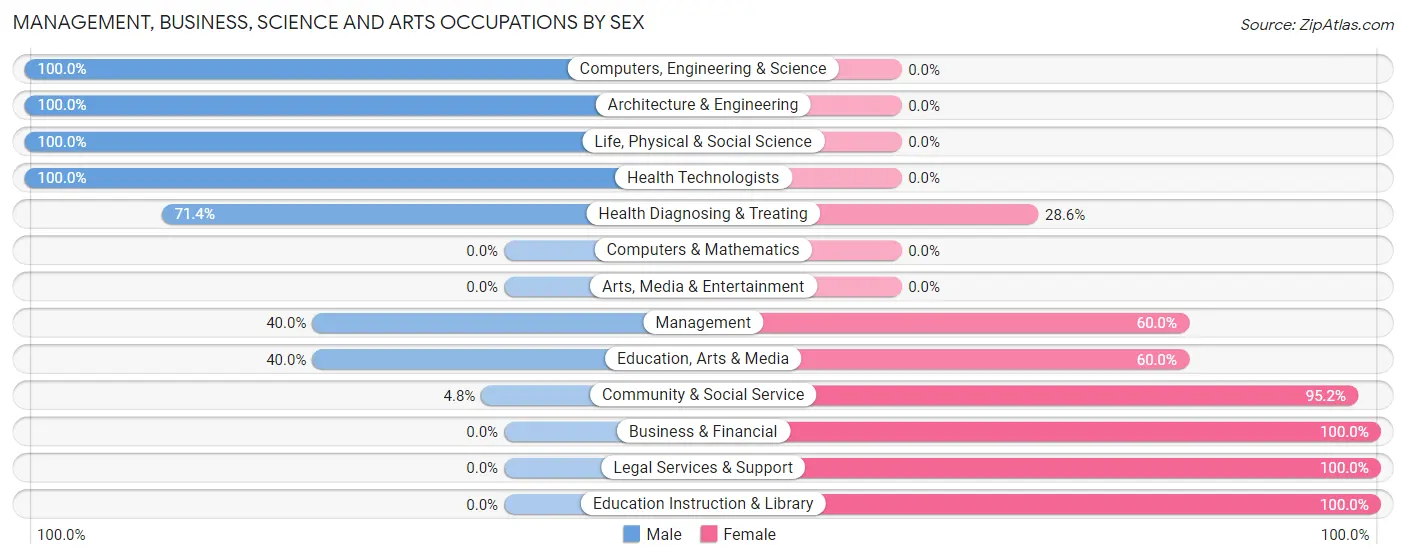
The most common Management, Business, Science and Arts occupations in Salisbury borough are Community & Social Service (42 | 13.6%), Education Instruction & Library (32 | 10.3%), Management (15 | 4.8%), Health Diagnosing & Treating (14 | 4.5%), and Computers, Engineering & Science (11 | 3.5%).
Management, Business, Science and Arts Occupations by Sex
Within the Management, Business, Science and Arts occupations in Salisbury borough, the most male-oriented occupations are Computers, Engineering & Science (100.0%), Architecture & Engineering (100.0%), and Life, Physical & Social Science (100.0%), while the most female-oriented occupations are Business & Financial (100.0%), Legal Services & Support (100.0%), and Education Instruction & Library (100.0%).
| Occupation | Male | Female |
| Management | 6 (40.0%) | 9 (60.0%) |
| Business & Financial | 0 (0.0%) | 8 (100.0%) |
| Computers, Engineering & Science | 11 (100.0%) | 0 (0.0%) |
| Computers & Mathematics | 0 (0.0%) | 0 (0.0%) |
| Architecture & Engineering | 7 (100.0%) | 0 (0.0%) |
| Life, Physical & Social Science | 4 (100.0%) | 0 (0.0%) |
| Community & Social Service | 2 (4.8%) | 40 (95.2%) |
| Education, Arts & Media | 2 (40.0%) | 3 (60.0%) |
| Legal Services & Support | 0 (0.0%) | 5 (100.0%) |
| Education Instruction & Library | 0 (0.0%) | 32 (100.0%) |
| Arts, Media & Entertainment | 0 (0.0%) | 0 (0.0%) |
| Health Diagnosing & Treating | 10 (71.4%) | 4 (28.6%) |
| Health Technologists | 8 (100.0%) | 0 (0.0%) |
| Total (Category) | 29 (32.2%) | 61 (67.8%) |
| Total (Overall) | 172 (55.5%) | 138 (44.5%) |
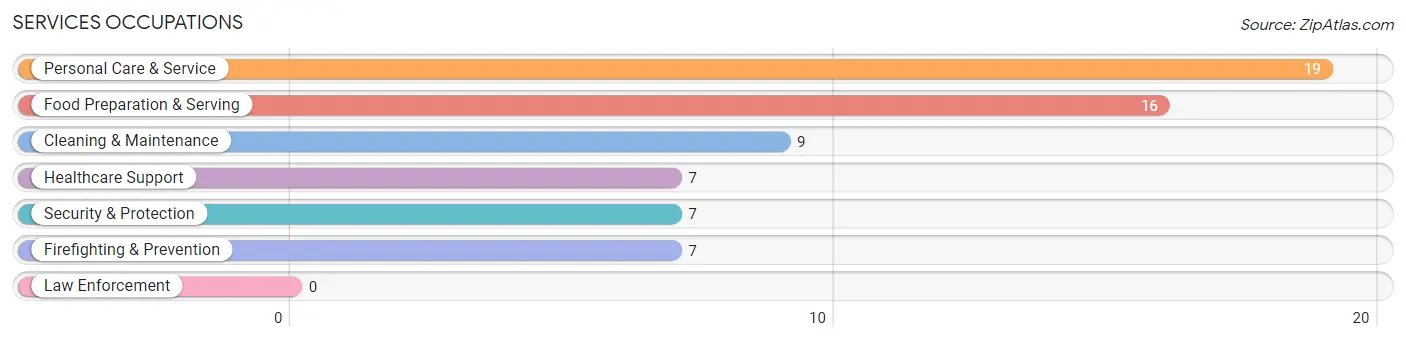
Services Occupations
The most common Services occupations in Salisbury borough are Personal Care & Service (19 | 6.1%), Food Preparation & Serving (16 | 5.2%), Cleaning & Maintenance (9 | 2.9%), Healthcare Support (7 | 2.3%), and Security & Protection (7 | 2.3%).
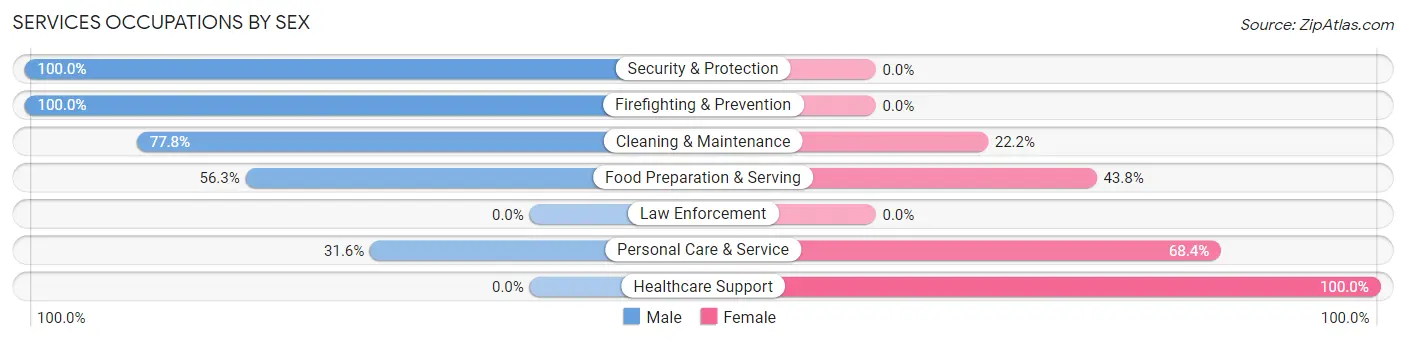
Services Occupations by Sex
Within the Services occupations in Salisbury borough, the most male-oriented occupations are Security & Protection (100.0%), Firefighting & Prevention (100.0%), and Cleaning & Maintenance (77.8%), while the most female-oriented occupations are Healthcare Support (100.0%), Personal Care & Service (68.4%), and Food Preparation & Serving (43.8%).
| Occupation | Male | Female |
| Healthcare Support | 0 (0.0%) | 7 (100.0%) |
| Security & Protection | 7 (100.0%) | 0 (0.0%) |
| Firefighting & Prevention | 7 (100.0%) | 0 (0.0%) |
| Law Enforcement | 0 (0.0%) | 0 (0.0%) |
| Food Preparation & Serving | 9 (56.2%) | 7 (43.8%) |
| Cleaning & Maintenance | 7 (77.8%) | 2 (22.2%) |
| Personal Care & Service | 6 (31.6%) | 13 (68.4%) |
| Total (Category) | 29 (50.0%) | 29 (50.0%) |
| Total (Overall) | 172 (55.5%) | 138 (44.5%) |
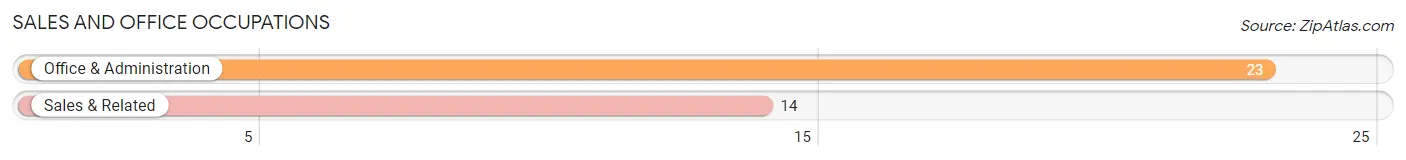
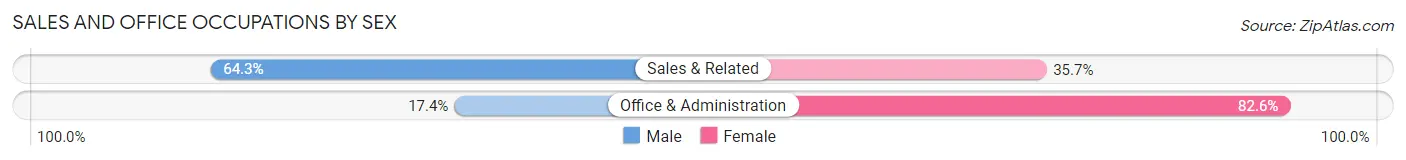
Sales and Office Occupations
The most common Sales and Office occupations in Salisbury borough are Office & Administration (23 | 7.4%), and Sales & Related (14 | 4.5%).
Sales and Office Occupations by Sex
| Occupation | Male | Female |
| Sales & Related | 9 (64.3%) | 5 (35.7%) |
| Office & Administration | 4 (17.4%) | 19 (82.6%) |
| Total (Category) | 13 (35.1%) | 24 (64.9%) |
| Total (Overall) | 172 (55.5%) | 138 (44.5%) |
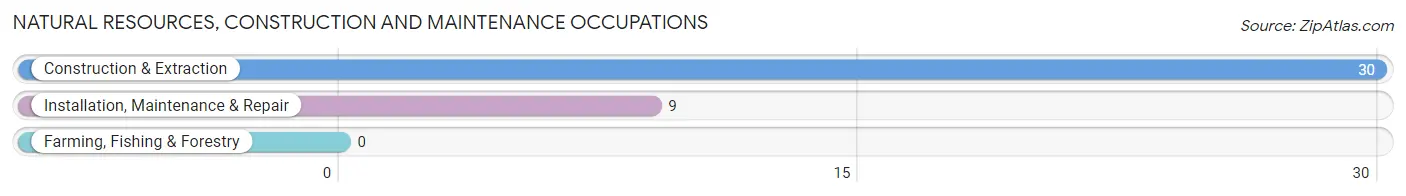
Natural Resources, Construction and Maintenance Occupations
The most common Natural Resources, Construction and Maintenance occupations in Salisbury borough are Construction & Extraction (30 | 9.7%), and Installation, Maintenance & Repair (9 | 2.9%).
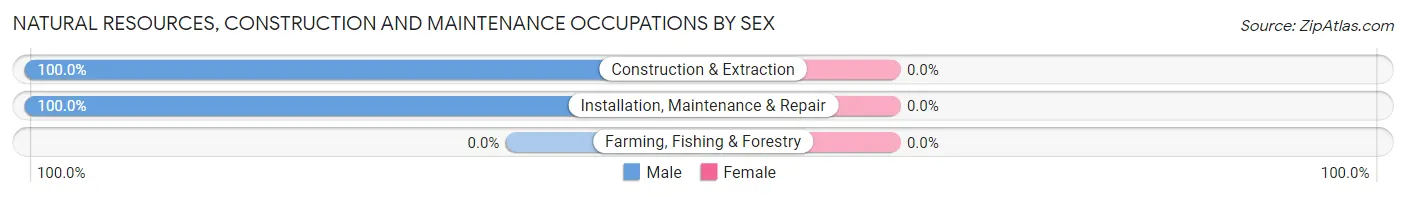
Natural Resources, Construction and Maintenance Occupations by Sex
| Occupation | Male | Female |
| Farming, Fishing & Forestry | 0 (0.0%) | 0 (0.0%) |
| Construction & Extraction | 30 (100.0%) | 0 (0.0%) |
| Installation, Maintenance & Repair | 9 (100.0%) | 0 (0.0%) |
| Total (Category) | 39 (100.0%) | 0 (0.0%) |
| Total (Overall) | 172 (55.5%) | 138 (44.5%) |
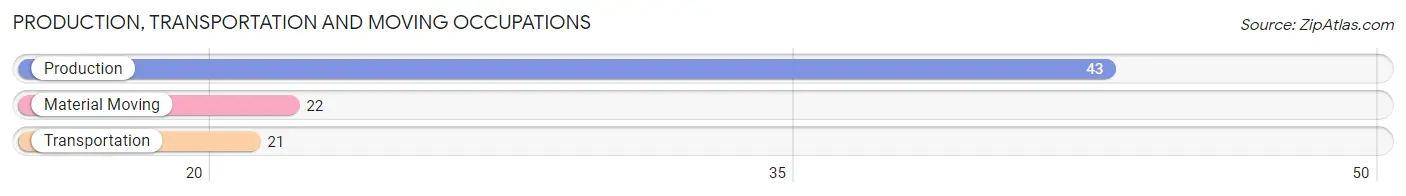
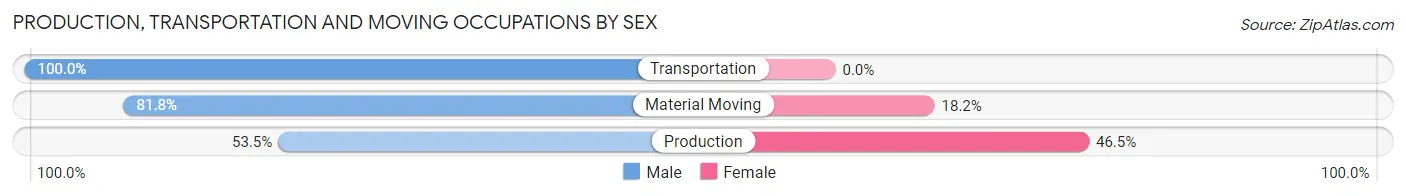
Production, Transportation and Moving Occupations
The most common Production, Transportation and Moving occupations in Salisbury borough are Production (43 | 13.9%), Material Moving (22 | 7.1%), and Transportation (21 | 6.8%).
Production, Transportation and Moving Occupations by Sex
| Occupation | Male | Female |
| Production | 23 (53.5%) | 20 (46.5%) |
| Transportation | 21 (100.0%) | 0 (0.0%) |
| Material Moving | 18 (81.8%) | 4 (18.2%) |
| Total (Category) | 62 (72.1%) | 24 (27.9%) |
| Total (Overall) | 172 (55.5%) | 138 (44.5%) |
Employment Industries by Sex in Salisbury borough
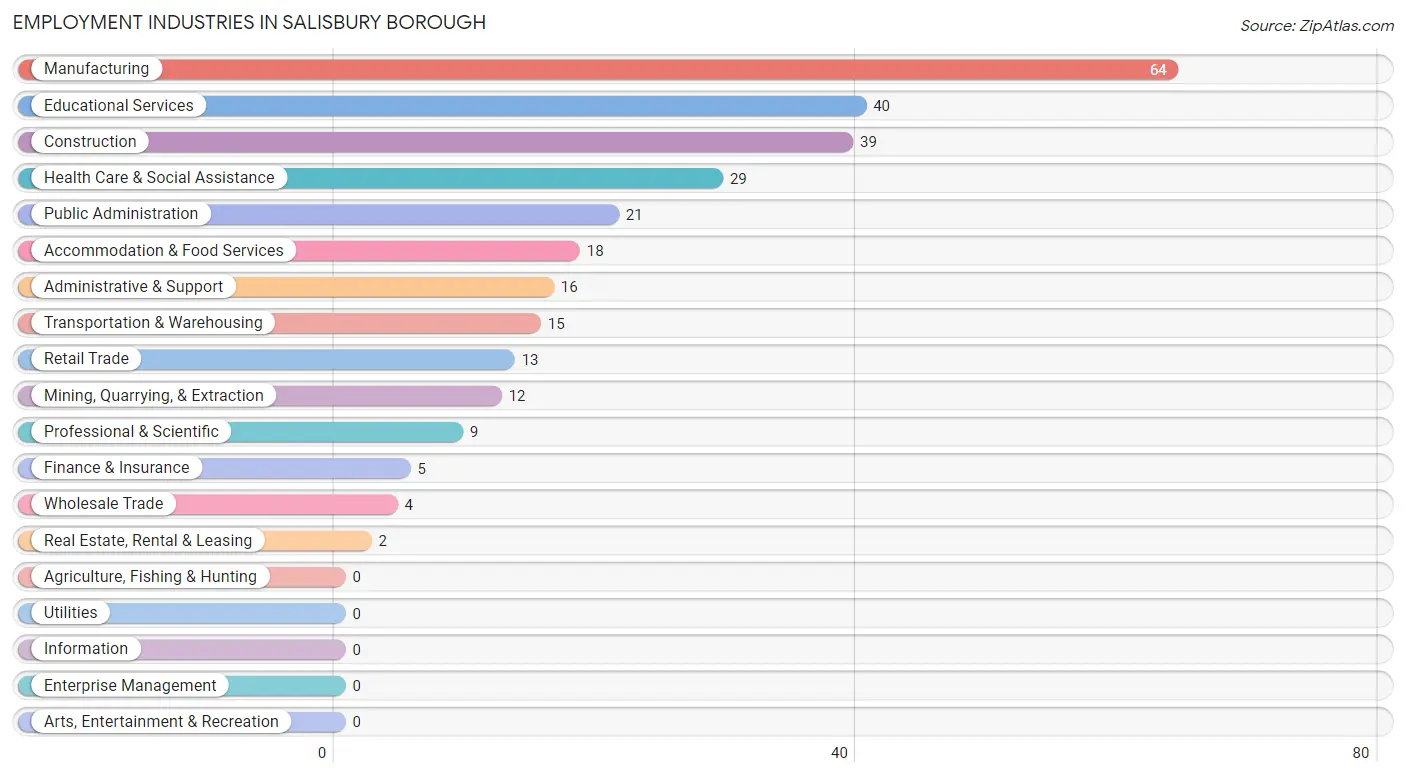
Employment Industries in Salisbury borough
The major employment industries in Salisbury borough include Manufacturing (64 | 20.6%), Educational Services (40 | 12.9%), Construction (39 | 12.6%), Health Care & Social Assistance (29 | 9.3%), and Public Administration (21 | 6.8%).
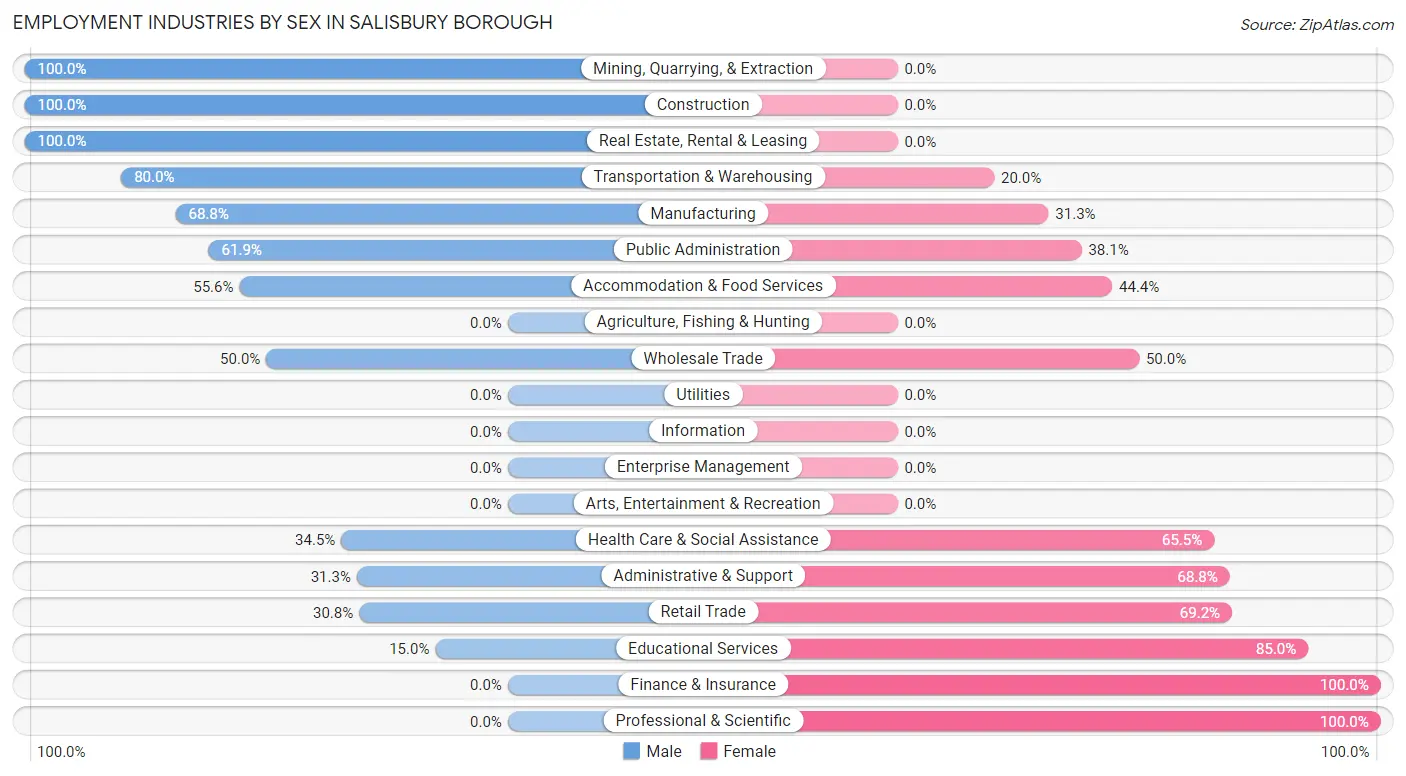
Employment Industries by Sex in Salisbury borough
The Salisbury borough industries that see more men than women are Mining, Quarrying, & Extraction (100.0%), Construction (100.0%), and Real Estate, Rental & Leasing (100.0%), whereas the industries that tend to have a higher number of women are Finance & Insurance (100.0%), Professional & Scientific (100.0%), and Educational Services (85.0%).
| Industry | Male | Female |
| Agriculture, Fishing & Hunting | 0 (0.0%) | 0 (0.0%) |
| Mining, Quarrying, & Extraction | 12 (100.0%) | 0 (0.0%) |
| Construction | 39 (100.0%) | 0 (0.0%) |
| Manufacturing | 44 (68.8%) | 20 (31.2%) |
| Wholesale Trade | 2 (50.0%) | 2 (50.0%) |
| Retail Trade | 4 (30.8%) | 9 (69.2%) |
| Transportation & Warehousing | 12 (80.0%) | 3 (20.0%) |
| Utilities | 0 (0.0%) | 0 (0.0%) |
| Information | 0 (0.0%) | 0 (0.0%) |
| Finance & Insurance | 0 (0.0%) | 5 (100.0%) |
| Real Estate, Rental & Leasing | 2 (100.0%) | 0 (0.0%) |
| Professional & Scientific | 0 (0.0%) | 9 (100.0%) |
| Enterprise Management | 0 (0.0%) | 0 (0.0%) |
| Administrative & Support | 5 (31.2%) | 11 (68.8%) |
| Educational Services | 6 (15.0%) | 34 (85.0%) |
| Health Care & Social Assistance | 10 (34.5%) | 19 (65.5%) |
| Arts, Entertainment & Recreation | 0 (0.0%) | 0 (0.0%) |
| Accommodation & Food Services | 10 (55.6%) | 8 (44.4%) |
| Public Administration | 13 (61.9%) | 8 (38.1%) |
| Total | 172 (55.5%) | 138 (44.5%) |
Education in Salisbury borough
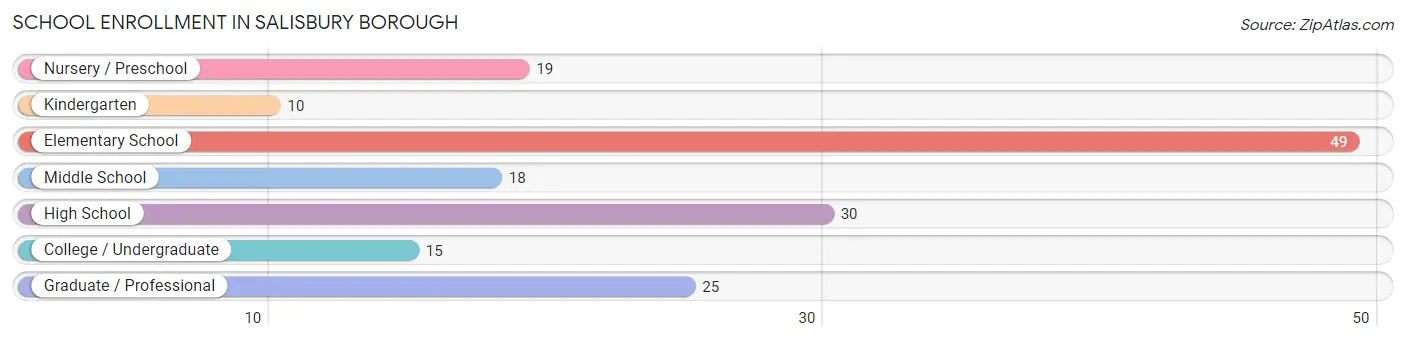
School Enrollment in Salisbury borough
The most common levels of schooling among the 166 students in Salisbury borough are elementary school (49 | 29.5%), high school (30 | 18.1%), and graduate / professional (25 | 15.1%).
| School Level | # Students | % Students |
| Nursery / Preschool | 19 | 11.5% |
| Kindergarten | 10 | 6.0% |
| Elementary School | 49 | 29.5% |
| Middle School | 18 | 10.8% |
| High School | 30 | 18.1% |
| College / Undergraduate | 15 | 9.0% |
| Graduate / Professional | 25 | 15.1% |
| Total | 166 | 100.0% |
School Enrollment by Age by Funding Source in Salisbury borough
Out of a total of 166 students who are enrolled in schools in Salisbury borough, 13 (7.8%) attend a private institution, while the remaining 153 (92.2%) are enrolled in public schools. The age group of 3 to 4 year olds has the highest likelihood of being enrolled in private schools, with 2 (11.8% in the age bracket) enrolled. Conversely, the age group of 10 to 14 year olds has the lowest likelihood of being enrolled in a private school, with 20 (100.0% in the age bracket) attending a public institution.
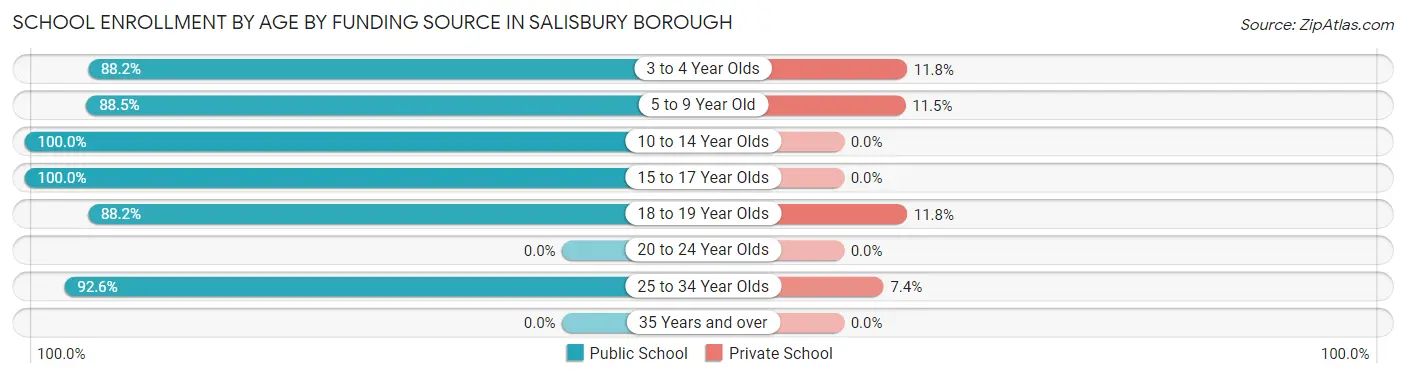
| Age Bracket | Public School | Private School |
| 3 to 4 Year Olds | 15 (88.2%) | 2 (11.8%) |
| 5 to 9 Year Old | 54 (88.5%) | 7 (11.5%) |
| 10 to 14 Year Olds | 20 (100.0%) | 0 (0.0%) |
| 15 to 17 Year Olds | 24 (100.0%) | 0 (0.0%) |
| 18 to 19 Year Olds | 15 (88.2%) | 2 (11.8%) |
| 20 to 24 Year Olds | 0 (0.0%) | 0 (0.0%) |
| 25 to 34 Year Olds | 25 (92.6%) | 2 (7.4%) |
| 35 Years and over | 0 (0.0%) | 0 (0.0%) |
| Total | 153 (92.2%) | 13 (7.8%) |
Educational Attainment by Field of Study in Salisbury borough
Education (41 | 51.2%), science & technology (14 | 17.5%), bio, nature & agricultural (7 | 8.7%), arts & humanities (5 | 6.2%), and engineering (4 | 5.0%) are the most common fields of study among 80 individuals in Salisbury borough who have obtained a bachelor's degree or higher.
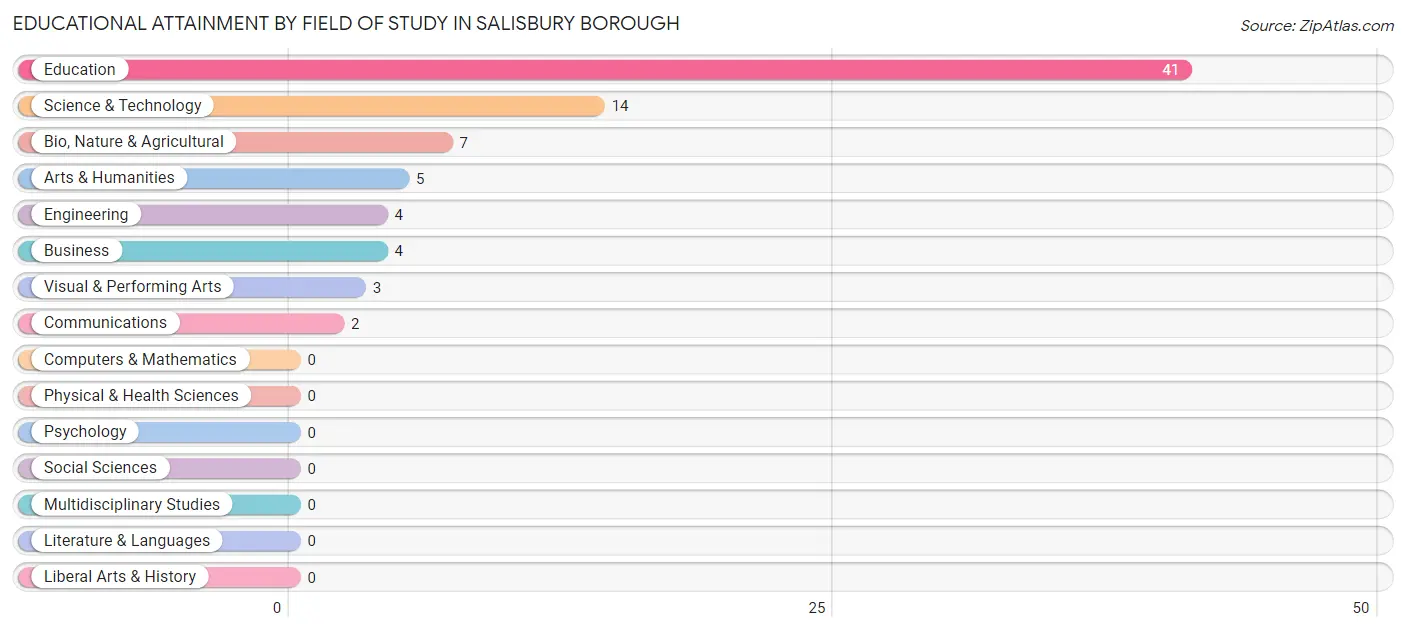
| Field of Study | # Graduates | % Graduates |
| Computers & Mathematics | 0 | 0.0% |
| Bio, Nature & Agricultural | 7 | 8.7% |
| Physical & Health Sciences | 0 | 0.0% |
| Psychology | 0 | 0.0% |
| Social Sciences | 0 | 0.0% |
| Engineering | 4 | 5.0% |
| Multidisciplinary Studies | 0 | 0.0% |
| Science & Technology | 14 | 17.5% |
| Business | 4 | 5.0% |
| Education | 41 | 51.2% |
| Literature & Languages | 0 | 0.0% |
| Liberal Arts & History | 0 | 0.0% |
| Visual & Performing Arts | 3 | 3.7% |
| Communications | 2 | 2.5% |
| Arts & Humanities | 5 | 6.2% |
| Total | 80 | 100.0% |
Transportation & Commute in Salisbury borough
Vehicle Availability by Sex in Salisbury borough
The most prevalent vehicle ownership categories in Salisbury borough are males with 2 vehicles (76, accounting for 43.7%) and females with 2 vehicles (68, making up 57.1%).
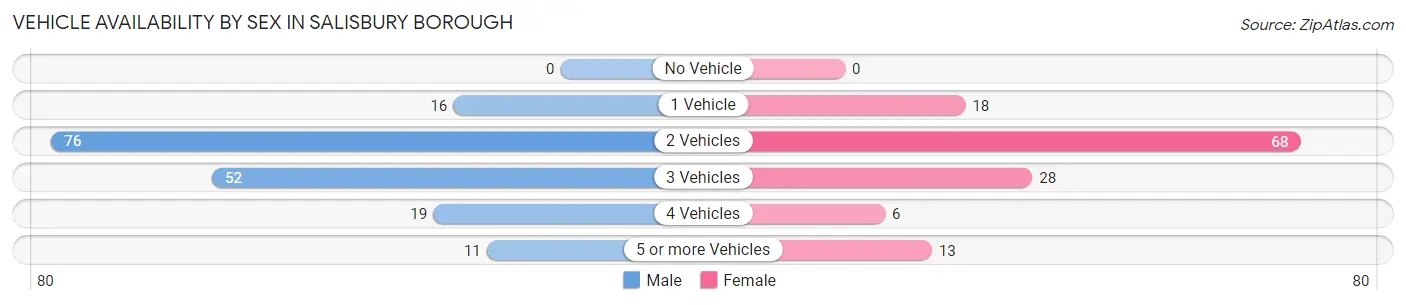
| Vehicles Available | Male | Female |
| No Vehicle | 0 (0.0%) | 0 (0.0%) |
| 1 Vehicle | 16 (9.2%) | 18 (13.5%) |
| 2 Vehicles | 76 (43.7%) | 68 (51.1%) |
| 3 Vehicles | 52 (29.9%) | 28 (21.0%) |
| 4 Vehicles | 19 (10.9%) | 6 (4.5%) |
| 5 or more Vehicles | 11 (6.3%) | 13 (9.8%) |
| Total | 174 (100.0%) | 133 (100.0%) |
Commute Time in Salisbury borough
The most frequently occuring commute durations in Salisbury borough are 15 to 19 minutes (66 commuters, 24.5%), 10 to 14 minutes (39 commuters, 14.5%), and 30 to 34 minutes (37 commuters, 13.8%).
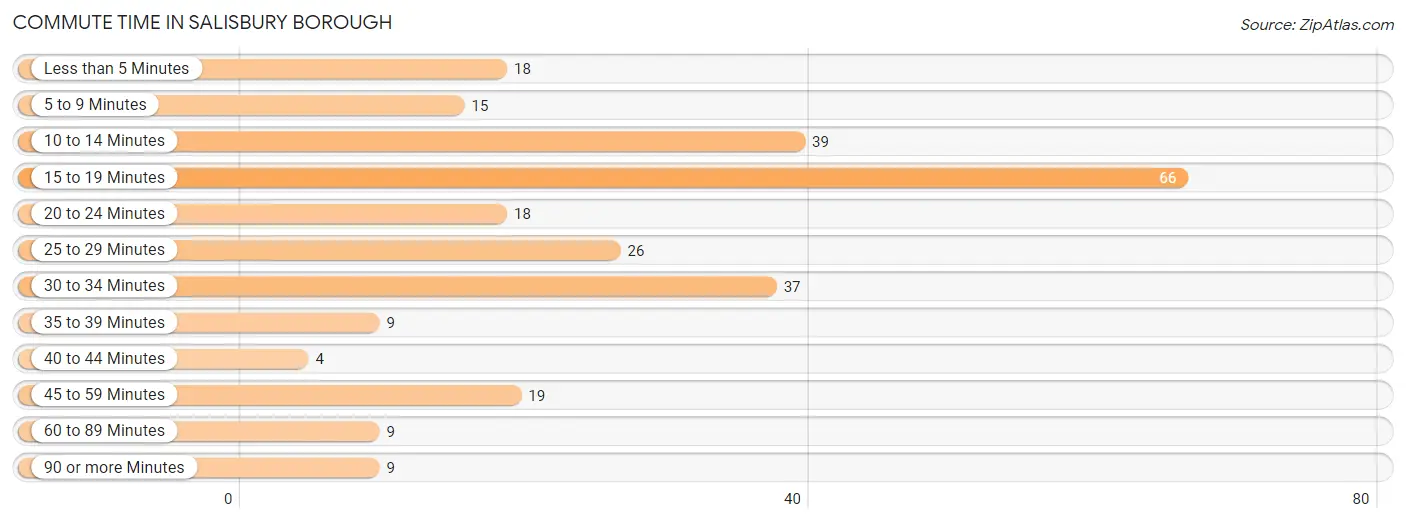
| Commute Time | # Commuters | % Commuters |
| Less than 5 Minutes | 18 | 6.7% |
| 5 to 9 Minutes | 15 | 5.6% |
| 10 to 14 Minutes | 39 | 14.5% |
| 15 to 19 Minutes | 66 | 24.5% |
| 20 to 24 Minutes | 18 | 6.7% |
| 25 to 29 Minutes | 26 | 9.7% |
| 30 to 34 Minutes | 37 | 13.8% |
| 35 to 39 Minutes | 9 | 3.4% |
| 40 to 44 Minutes | 4 | 1.5% |
| 45 to 59 Minutes | 19 | 7.1% |
| 60 to 89 Minutes | 9 | 3.4% |
| 90 or more Minutes | 9 | 3.4% |
Commute Time by Sex in Salisbury borough
The most common commute times in Salisbury borough are 15 to 19 minutes (48 commuters, 28.4%) for males and 10 to 14 minutes (18 commuters, 18.0%) for females.
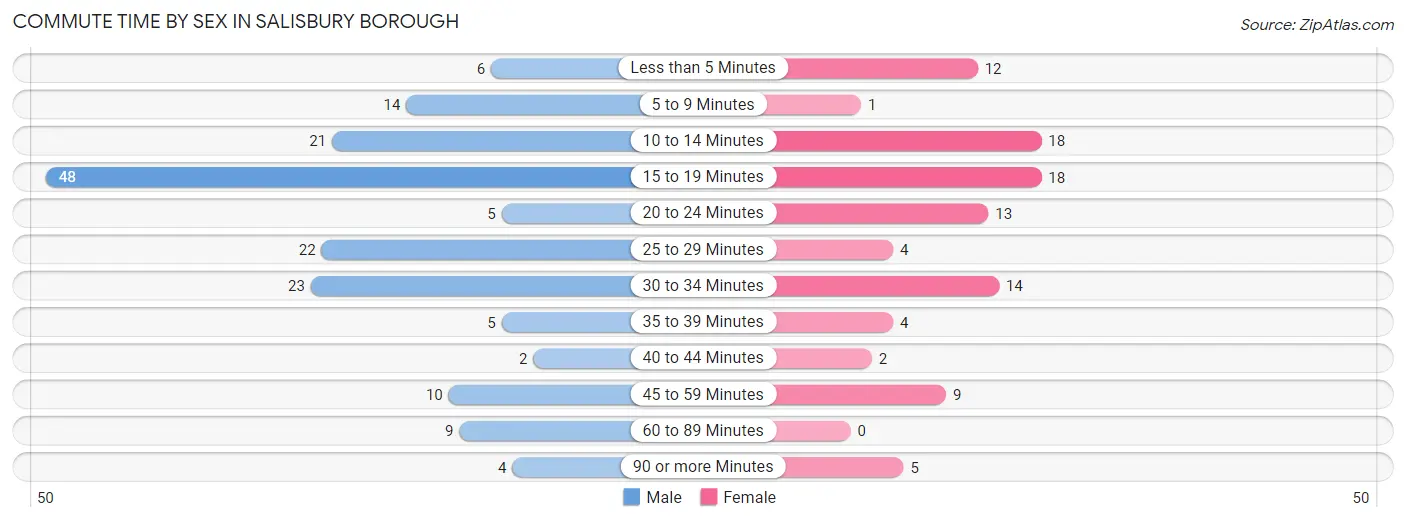
| Commute Time | Male | Female |
| Less than 5 Minutes | 6 (3.5%) | 12 (12.0%) |
| 5 to 9 Minutes | 14 (8.3%) | 1 (1.0%) |
| 10 to 14 Minutes | 21 (12.4%) | 18 (18.0%) |
| 15 to 19 Minutes | 48 (28.4%) | 18 (18.0%) |
| 20 to 24 Minutes | 5 (3.0%) | 13 (13.0%) |
| 25 to 29 Minutes | 22 (13.0%) | 4 (4.0%) |
| 30 to 34 Minutes | 23 (13.6%) | 14 (14.0%) |
| 35 to 39 Minutes | 5 (3.0%) | 4 (4.0%) |
| 40 to 44 Minutes | 2 (1.2%) | 2 (2.0%) |
| 45 to 59 Minutes | 10 (5.9%) | 9 (9.0%) |
| 60 to 89 Minutes | 9 (5.3%) | 0 (0.0%) |
| 90 or more Minutes | 4 (2.4%) | 5 (5.0%) |
Time of Departure to Work by Sex in Salisbury borough
The most frequent times of departure to work in Salisbury borough are 7:00 AM to 7:29 AM (30, 17.7%) for males and 7:00 AM to 7:29 AM (18, 18.0%) for females.
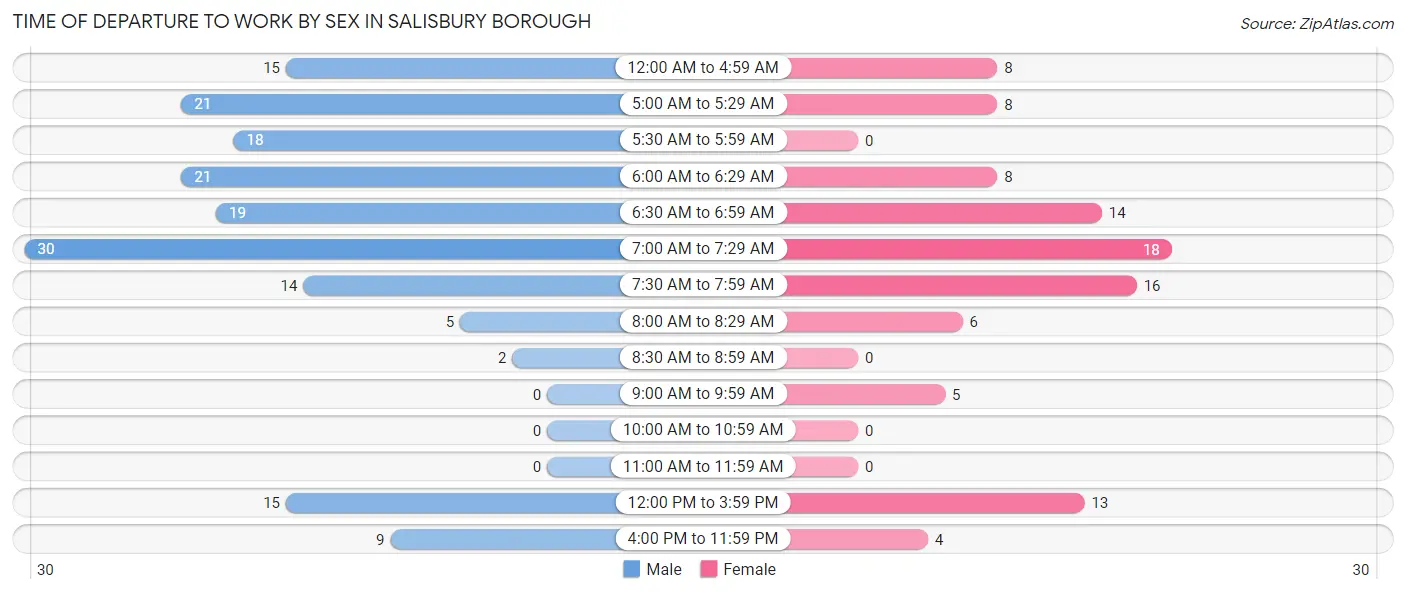
| Time of Departure | Male | Female |
| 12:00 AM to 4:59 AM | 15 (8.9%) | 8 (8.0%) |
| 5:00 AM to 5:29 AM | 21 (12.4%) | 8 (8.0%) |
| 5:30 AM to 5:59 AM | 18 (10.6%) | 0 (0.0%) |
| 6:00 AM to 6:29 AM | 21 (12.4%) | 8 (8.0%) |
| 6:30 AM to 6:59 AM | 19 (11.2%) | 14 (14.0%) |
| 7:00 AM to 7:29 AM | 30 (17.7%) | 18 (18.0%) |
| 7:30 AM to 7:59 AM | 14 (8.3%) | 16 (16.0%) |
| 8:00 AM to 8:29 AM | 5 (3.0%) | 6 (6.0%) |
| 8:30 AM to 8:59 AM | 2 (1.2%) | 0 (0.0%) |
| 9:00 AM to 9:59 AM | 0 (0.0%) | 5 (5.0%) |
| 10:00 AM to 10:59 AM | 0 (0.0%) | 0 (0.0%) |
| 11:00 AM to 11:59 AM | 0 (0.0%) | 0 (0.0%) |
| 12:00 PM to 3:59 PM | 15 (8.9%) | 13 (13.0%) |
| 4:00 PM to 11:59 PM | 9 (5.3%) | 4 (4.0%) |
| Total | 169 (100.0%) | 100 (100.0%) |
Housing Occupancy in Salisbury borough
Occupancy by Ownership in Salisbury borough
Of the total 252 dwellings in Salisbury borough, owner-occupied units account for 211 (83.7%), while renter-occupied units make up 41 (16.3%).
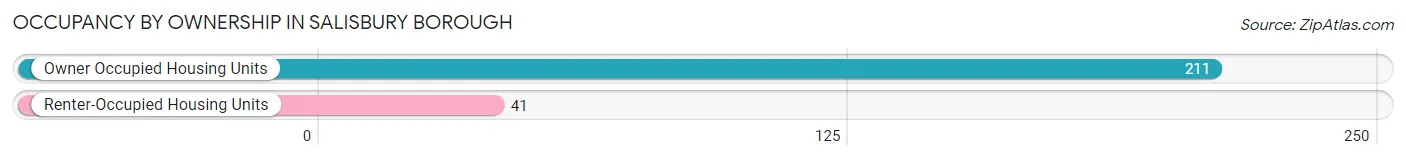
| Occupancy | # Housing Units | % Housing Units |
| Owner Occupied Housing Units | 211 | 83.7% |
| Renter-Occupied Housing Units | 41 | 16.3% |
| Total Occupied Housing Units | 252 | 100.0% |
Occupancy by Household Size in Salisbury borough
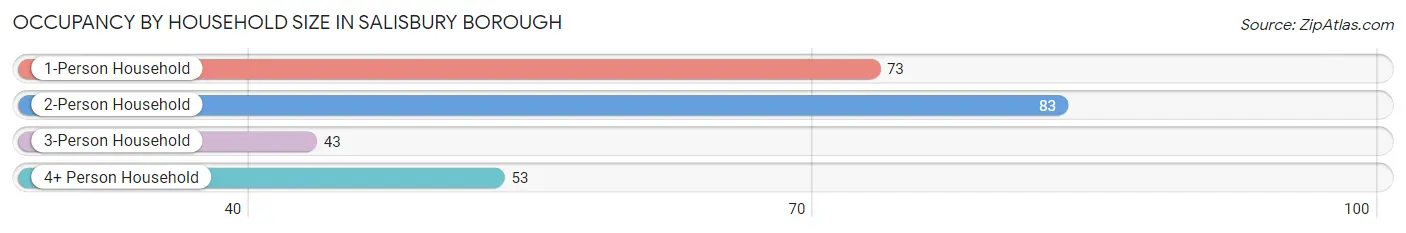
| Household Size | # Housing Units | % Housing Units |
| 1-Person Household | 73 | 29.0% |
| 2-Person Household | 83 | 32.9% |
| 3-Person Household | 43 | 17.1% |
| 4+ Person Household | 53 | 21.0% |
| Total Housing Units | 252 | 100.0% |
Occupancy by Ownership by Household Size in Salisbury borough
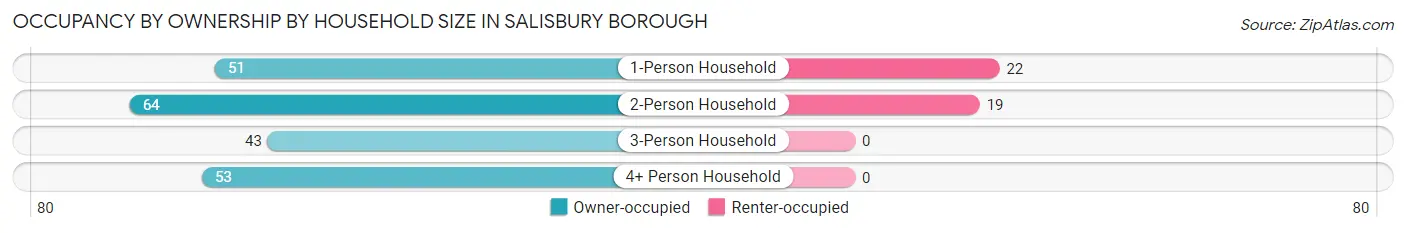
| Household Size | Owner-occupied | Renter-occupied |
| 1-Person Household | 51 (69.9%) | 22 (30.1%) |
| 2-Person Household | 64 (77.1%) | 19 (22.9%) |
| 3-Person Household | 43 (100.0%) | 0 (0.0%) |
| 4+ Person Household | 53 (100.0%) | 0 (0.0%) |
| Total Housing Units | 211 (83.7%) | 41 (16.3%) |
Occupancy by Educational Attainment in Salisbury borough
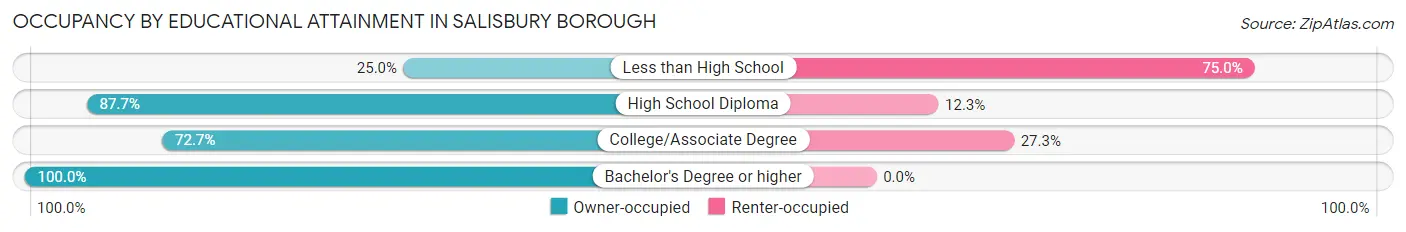
| Household Size | Owner-occupied | Renter-occupied |
| Less than High School | 2 (25.0%) | 6 (75.0%) |
| High School Diploma | 100 (87.7%) | 14 (12.3%) |
| College/Associate Degree | 56 (72.7%) | 21 (27.3%) |
| Bachelor's Degree or higher | 53 (100.0%) | 0 (0.0%) |
Occupancy by Age of Householder in Salisbury borough
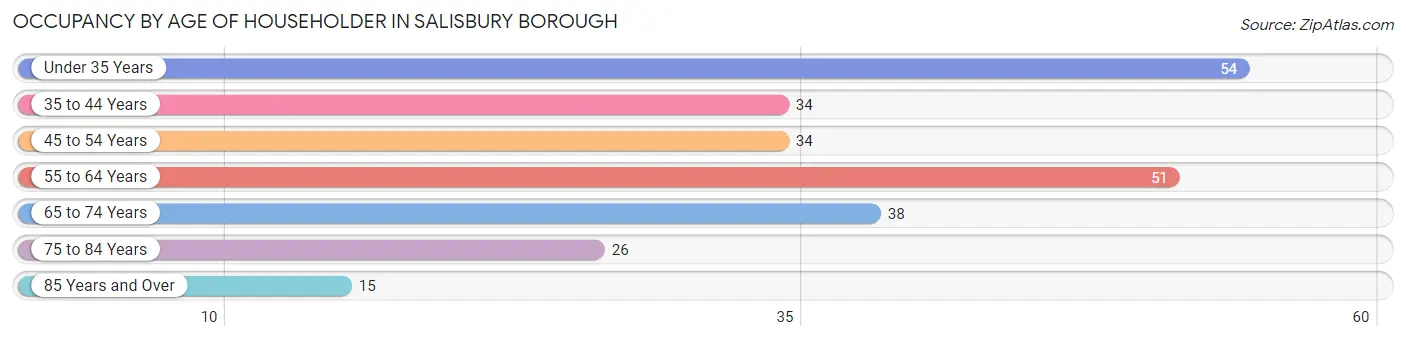
| Age Bracket | # Households | % Households |
| Under 35 Years | 54 | 21.4% |
| 35 to 44 Years | 34 | 13.5% |
| 45 to 54 Years | 34 | 13.5% |
| 55 to 64 Years | 51 | 20.2% |
| 65 to 74 Years | 38 | 15.1% |
| 75 to 84 Years | 26 | 10.3% |
| 85 Years and Over | 15 | 5.9% |
| Total | 252 | 100.0% |
Housing Finances in Salisbury borough
Median Income by Occupancy in Salisbury borough
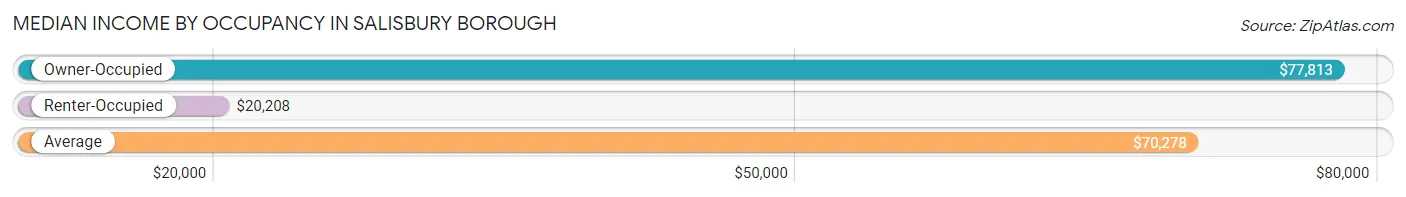
| Occupancy Type | # Households | Median Income |
| Owner-Occupied | 211 (83.7%) | $77,813 |
| Renter-Occupied | 41 (16.3%) | $20,208 |
| Average | 252 (100.0%) | $70,278 |
Occupancy by Householder Income Bracket in Salisbury borough
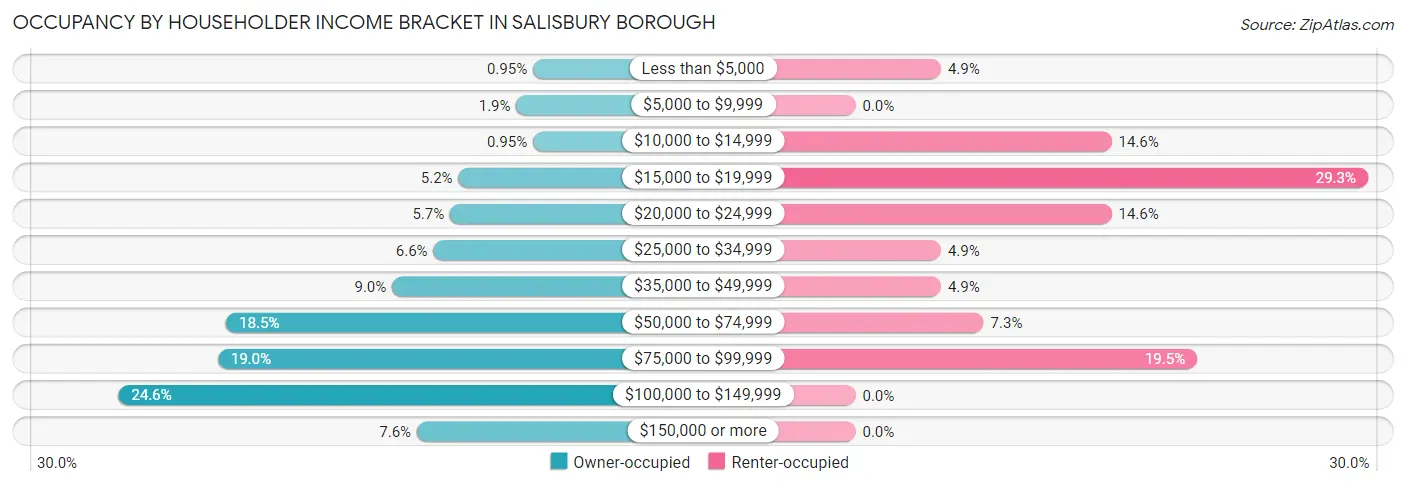
| Income Bracket | Owner-occupied | Renter-occupied |
| Less than $5,000 | 2 (0.9%) | 2 (4.9%) |
| $5,000 to $9,999 | 4 (1.9%) | 0 (0.0%) |
| $10,000 to $14,999 | 2 (0.9%) | 6 (14.6%) |
| $15,000 to $19,999 | 11 (5.2%) | 12 (29.3%) |
| $20,000 to $24,999 | 12 (5.7%) | 6 (14.6%) |
| $25,000 to $34,999 | 14 (6.6%) | 2 (4.9%) |
| $35,000 to $49,999 | 19 (9.0%) | 2 (4.9%) |
| $50,000 to $74,999 | 39 (18.5%) | 3 (7.3%) |
| $75,000 to $99,999 | 40 (19.0%) | 8 (19.5%) |
| $100,000 to $149,999 | 52 (24.6%) | 0 (0.0%) |
| $150,000 or more | 16 (7.6%) | 0 (0.0%) |
| Total | 211 (100.0%) | 41 (100.0%) |
Monthly Housing Cost Tiers in Salisbury borough
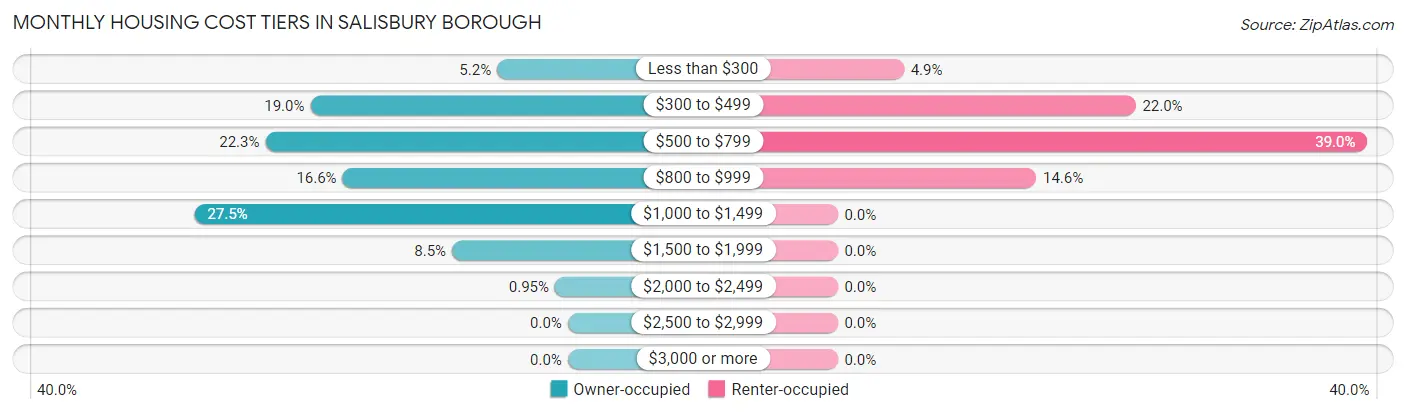
| Monthly Cost | Owner-occupied | Renter-occupied |
| Less than $300 | 11 (5.2%) | 2 (4.9%) |
| $300 to $499 | 40 (19.0%) | 9 (22.0%) |
| $500 to $799 | 47 (22.3%) | 16 (39.0%) |
| $800 to $999 | 35 (16.6%) | 6 (14.6%) |
| $1,000 to $1,499 | 58 (27.5%) | 0 (0.0%) |
| $1,500 to $1,999 | 18 (8.5%) | 0 (0.0%) |
| $2,000 to $2,499 | 2 (0.9%) | 0 (0.0%) |
| $2,500 to $2,999 | 0 (0.0%) | 0 (0.0%) |
| $3,000 or more | 0 (0.0%) | 0 (0.0%) |
| Total | 211 (100.0%) | 41 (100.0%) |
Physical Housing Characteristics in Salisbury borough
Housing Structures in Salisbury borough
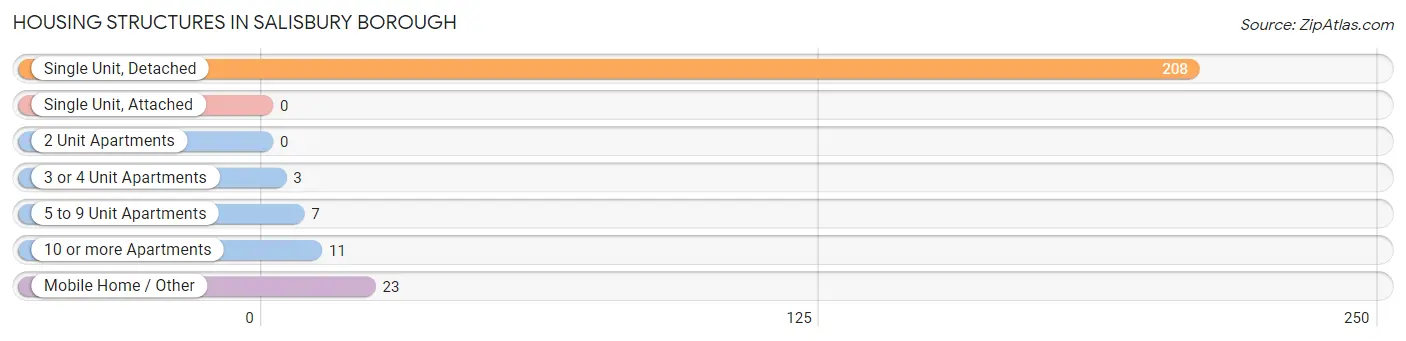
| Structure Type | # Housing Units | % Housing Units |
| Single Unit, Detached | 208 | 82.5% |
| Single Unit, Attached | 0 | 0.0% |
| 2 Unit Apartments | 0 | 0.0% |
| 3 or 4 Unit Apartments | 3 | 1.2% |
| 5 to 9 Unit Apartments | 7 | 2.8% |
| 10 or more Apartments | 11 | 4.4% |
| Mobile Home / Other | 23 | 9.1% |
| Total | 252 | 100.0% |
Housing Structures by Occupancy in Salisbury borough
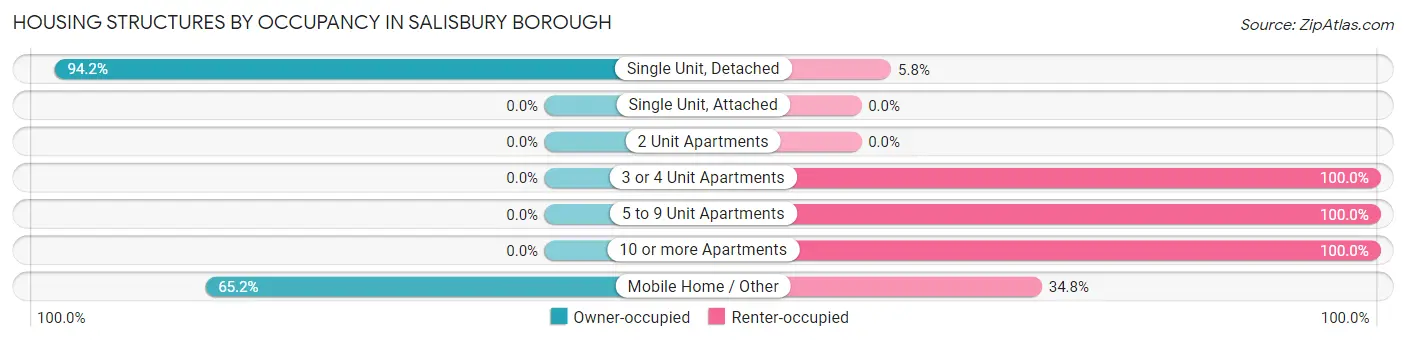
| Structure Type | Owner-occupied | Renter-occupied |
| Single Unit, Detached | 196 (94.2%) | 12 (5.8%) |
| Single Unit, Attached | 0 (0.0%) | 0 (0.0%) |
| 2 Unit Apartments | 0 (0.0%) | 0 (0.0%) |
| 3 or 4 Unit Apartments | 0 (0.0%) | 3 (100.0%) |
| 5 to 9 Unit Apartments | 0 (0.0%) | 7 (100.0%) |
| 10 or more Apartments | 0 (0.0%) | 11 (100.0%) |
| Mobile Home / Other | 15 (65.2%) | 8 (34.8%) |
| Total | 211 (83.7%) | 41 (16.3%) |
Housing Structures by Number of Rooms in Salisbury borough
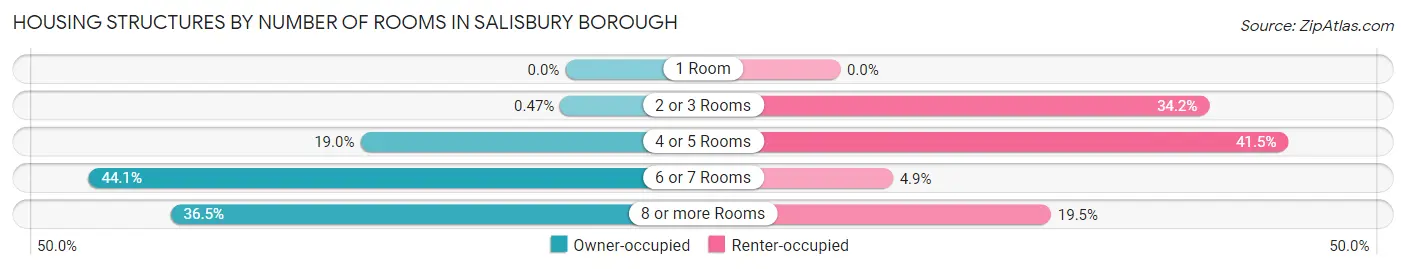
| Number of Rooms | Owner-occupied | Renter-occupied |
| 1 Room | 0 (0.0%) | 0 (0.0%) |
| 2 or 3 Rooms | 1 (0.5%) | 14 (34.2%) |
| 4 or 5 Rooms | 40 (19.0%) | 17 (41.5%) |
| 6 or 7 Rooms | 93 (44.1%) | 2 (4.9%) |
| 8 or more Rooms | 77 (36.5%) | 8 (19.5%) |
| Total | 211 (100.0%) | 41 (100.0%) |
Housing Structure by Heating Type in Salisbury borough
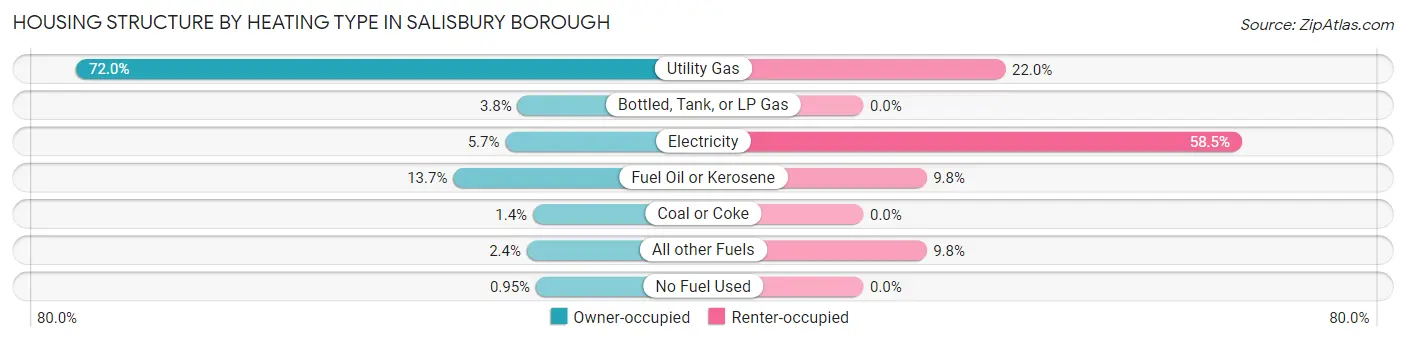
| Heating Type | Owner-occupied | Renter-occupied |
| Utility Gas | 152 (72.0%) | 9 (22.0%) |
| Bottled, Tank, or LP Gas | 8 (3.8%) | 0 (0.0%) |
| Electricity | 12 (5.7%) | 24 (58.5%) |
| Fuel Oil or Kerosene | 29 (13.7%) | 4 (9.8%) |
| Coal or Coke | 3 (1.4%) | 0 (0.0%) |
| All other Fuels | 5 (2.4%) | 4 (9.8%) |
| No Fuel Used | 2 (0.9%) | 0 (0.0%) |
| Total | 211 (100.0%) | 41 (100.0%) |
Household Vehicle Usage in Salisbury borough
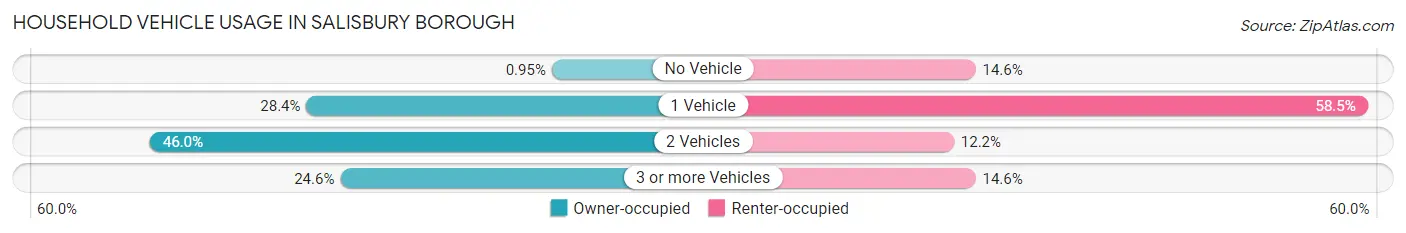
| Vehicles per Household | Owner-occupied | Renter-occupied |
| No Vehicle | 2 (0.9%) | 6 (14.6%) |
| 1 Vehicle | 60 (28.4%) | 24 (58.5%) |
| 2 Vehicles | 97 (46.0%) | 5 (12.2%) |
| 3 or more Vehicles | 52 (24.6%) | 6 (14.6%) |
| Total | 211 (100.0%) | 41 (100.0%) |
Real Estate & Mortgages in Salisbury borough
Real Estate and Mortgage Overview in Salisbury borough
| Characteristic | Without Mortgage | With Mortgage |
| Housing Units | 90 | 121 |
| Median Property Value | $121,400 | $164,800 |
| Median Household Income | $58,750 | $7 |
| Monthly Housing Costs | $457 | $0 |
| Real Estate Taxes | $1,089 | $0 |
Property Value by Mortgage Status in Salisbury borough
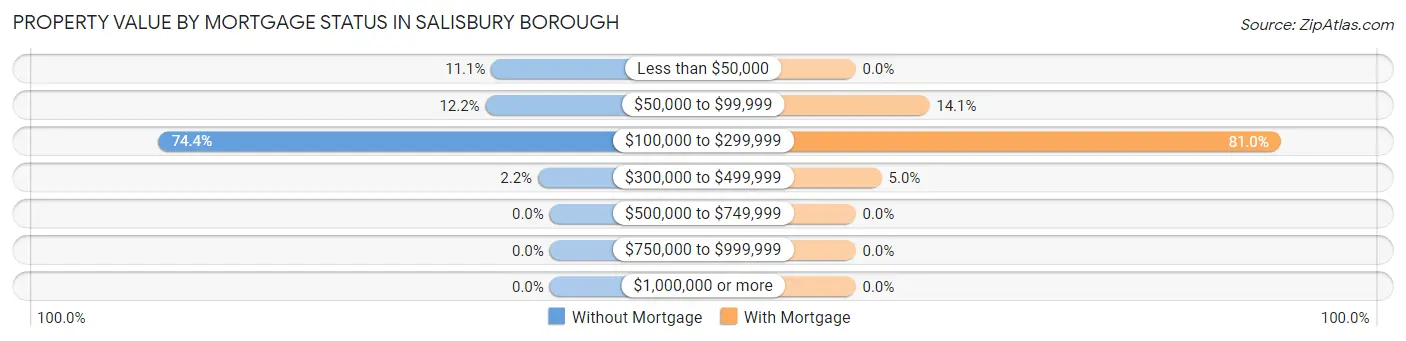
| Property Value | Without Mortgage | With Mortgage |
| Less than $50,000 | 10 (11.1%) | 0 (0.0%) |
| $50,000 to $99,999 | 11 (12.2%) | 17 (14.1%) |
| $100,000 to $299,999 | 67 (74.4%) | 98 (81.0%) |
| $300,000 to $499,999 | 2 (2.2%) | 6 (5.0%) |
| $500,000 to $749,999 | 0 (0.0%) | 0 (0.0%) |
| $750,000 to $999,999 | 0 (0.0%) | 0 (0.0%) |
| $1,000,000 or more | 0 (0.0%) | 0 (0.0%) |
| Total | 90 (100.0%) | 121 (100.0%) |
Household Income by Mortgage Status in Salisbury borough
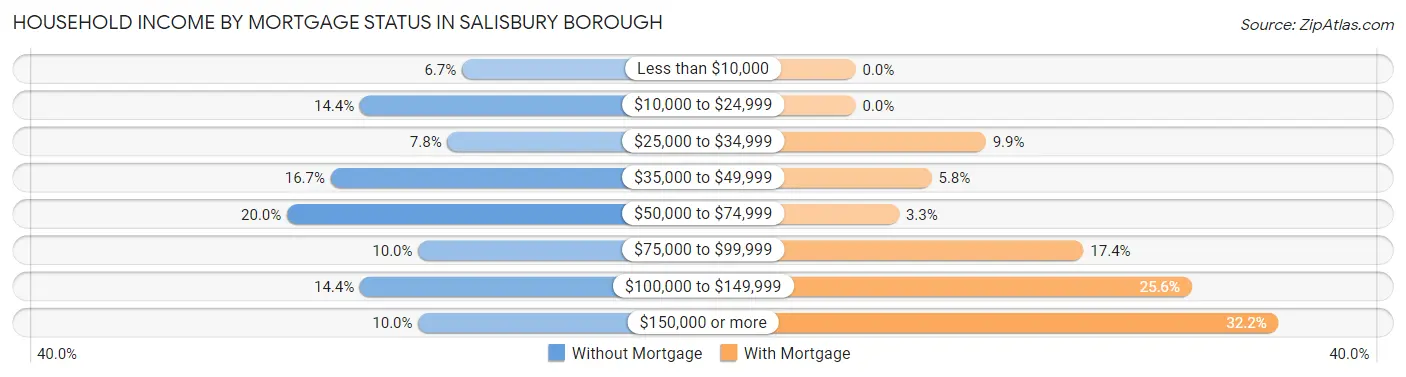
| Household Income | Without Mortgage | With Mortgage |
| Less than $10,000 | 6 (6.7%) | 0 (0.0%) |
| $10,000 to $24,999 | 13 (14.4%) | 0 (0.0%) |
| $25,000 to $34,999 | 7 (7.8%) | 12 (9.9%) |
| $35,000 to $49,999 | 15 (16.7%) | 7 (5.8%) |
| $50,000 to $74,999 | 18 (20.0%) | 4 (3.3%) |
| $75,000 to $99,999 | 9 (10.0%) | 21 (17.4%) |
| $100,000 to $149,999 | 13 (14.4%) | 31 (25.6%) |
| $150,000 or more | 9 (10.0%) | 39 (32.2%) |
| Total | 90 (100.0%) | 121 (100.0%) |
Property Value to Household Income Ratio in Salisbury borough
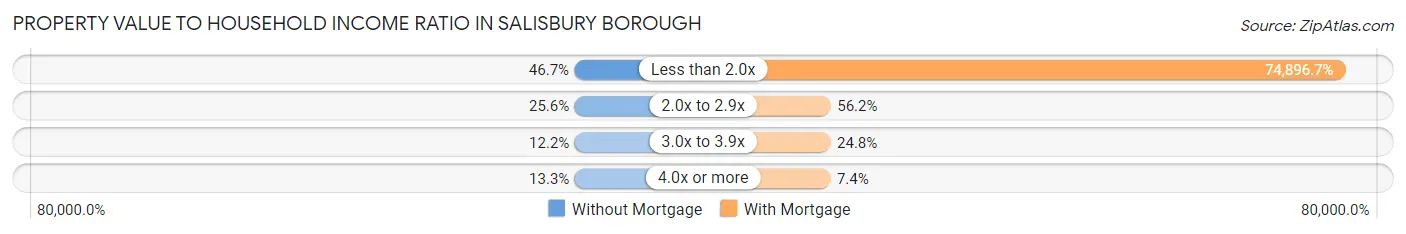
| Value-to-Income Ratio | Without Mortgage | With Mortgage |
| Less than 2.0x | 42 (46.7%) | 90,625 (74,896.7%) |
| 2.0x to 2.9x | 23 (25.6%) | 68 (56.2%) |
| 3.0x to 3.9x | 11 (12.2%) | 30 (24.8%) |
| 4.0x or more | 12 (13.3%) | 9 (7.4%) |
| Total | 90 (100.0%) | 121 (100.0%) |
Real Estate Taxes by Mortgage Status in Salisbury borough
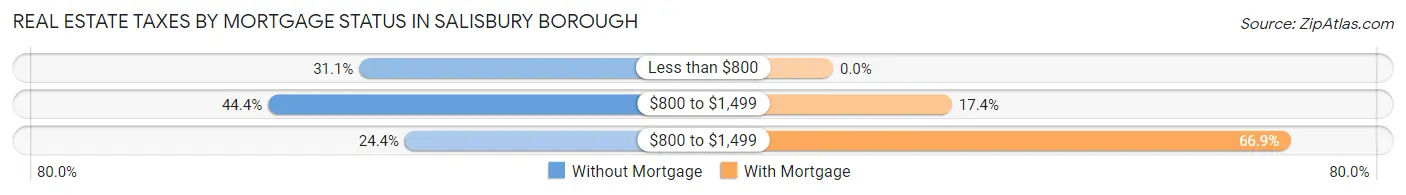
| Property Taxes | Without Mortgage | With Mortgage |
| Less than $800 | 28 (31.1%) | 0 (0.0%) |
| $800 to $1,499 | 40 (44.4%) | 21 (17.4%) |
| $800 to $1,499 | 22 (24.4%) | 81 (66.9%) |
| Total | 90 (100.0%) | 121 (100.0%) |
Health & Disability in Salisbury borough
Health Insurance Coverage by Age in Salisbury borough
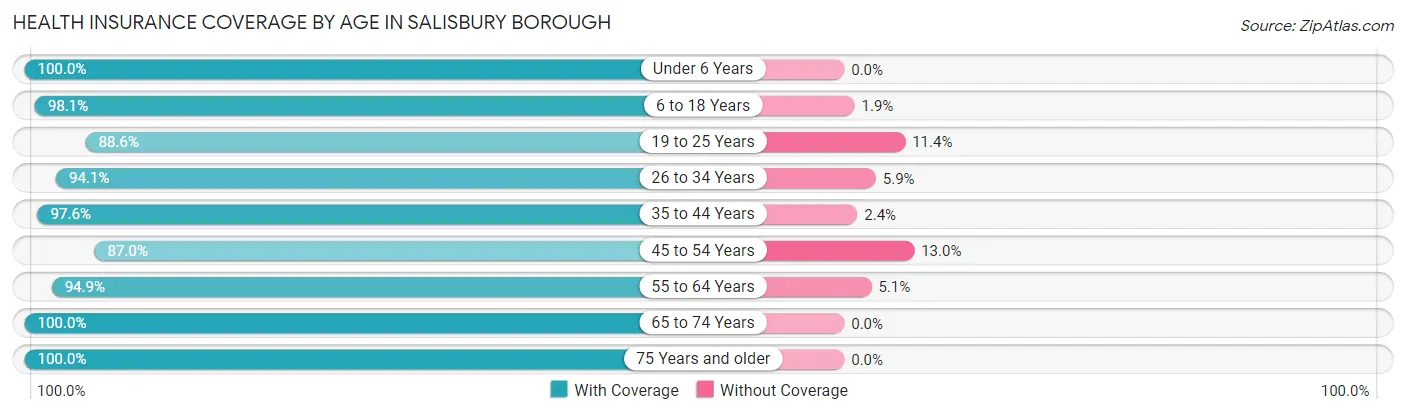
| Age Bracket | With Coverage | Without Coverage |
| Under 6 Years | 62 (100.0%) | 0 (0.0%) |
| 6 to 18 Years | 102 (98.1%) | 2 (1.9%) |
| 19 to 25 Years | 39 (88.6%) | 5 (11.4%) |
| 26 to 34 Years | 64 (94.1%) | 4 (5.9%) |
| 35 to 44 Years | 80 (97.6%) | 2 (2.4%) |
| 45 to 54 Years | 60 (87.0%) | 9 (13.0%) |
| 55 to 64 Years | 75 (94.9%) | 4 (5.1%) |
| 65 to 74 Years | 62 (100.0%) | 0 (0.0%) |
| 75 Years and older | 47 (100.0%) | 0 (0.0%) |
| Total | 591 (95.8%) | 26 (4.2%) |
Health Insurance Coverage by Citizenship Status in Salisbury borough
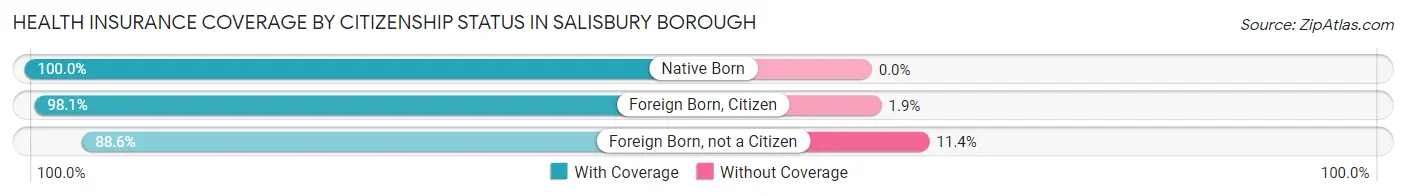
| Citizenship Status | With Coverage | Without Coverage |
| Native Born | 62 (100.0%) | 0 (0.0%) |
| Foreign Born, Citizen | 102 (98.1%) | 2 (1.9%) |
| Foreign Born, not a Citizen | 39 (88.6%) | 5 (11.4%) |
Health Insurance Coverage by Household Income in Salisbury borough
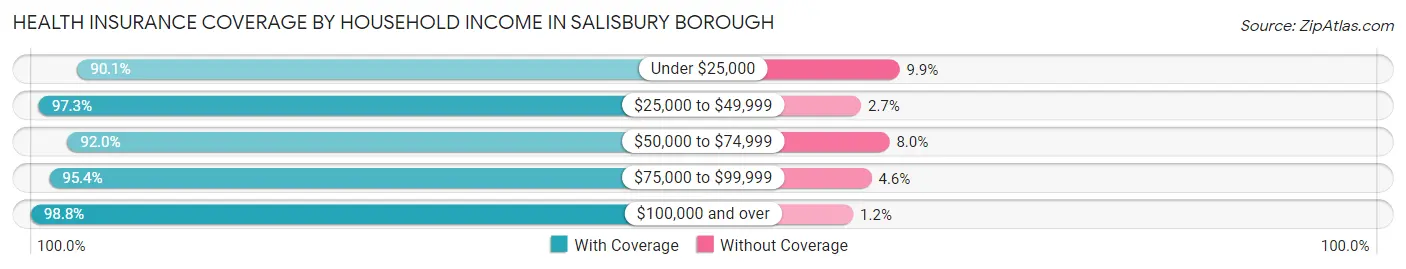
| Household Income | With Coverage | Without Coverage |
| Under $25,000 | 73 (90.1%) | 8 (9.9%) |
| $25,000 to $49,999 | 73 (97.3%) | 2 (2.7%) |
| $50,000 to $74,999 | 92 (92.0%) | 8 (8.0%) |
| $75,000 to $99,999 | 103 (95.4%) | 5 (4.6%) |
| $100,000 and over | 250 (98.8%) | 3 (1.2%) |
Public vs Private Health Insurance Coverage by Age in Salisbury borough
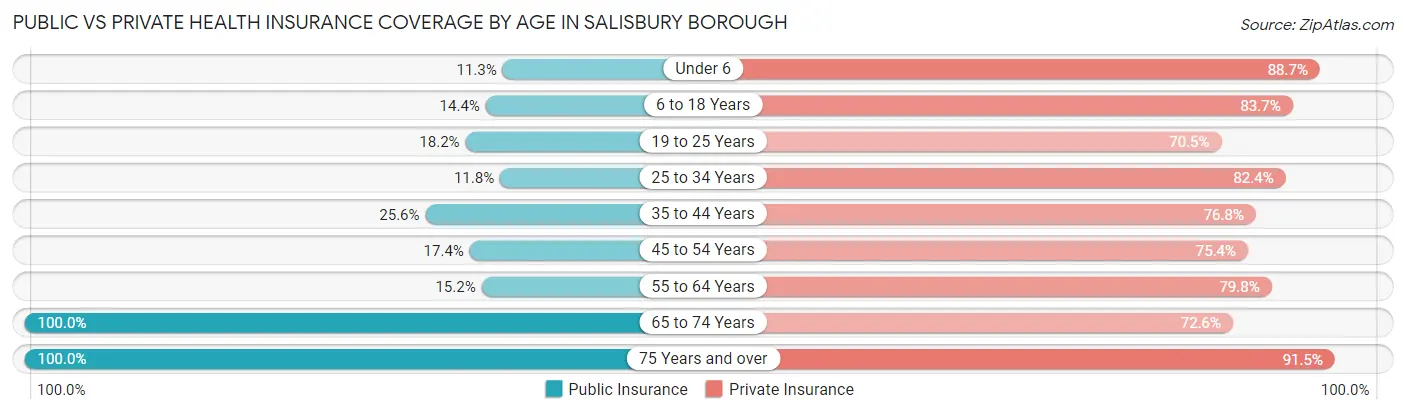
| Age Bracket | Public Insurance | Private Insurance |
| Under 6 | 7 (11.3%) | 55 (88.7%) |
| 6 to 18 Years | 15 (14.4%) | 87 (83.7%) |
| 19 to 25 Years | 8 (18.2%) | 31 (70.5%) |
| 25 to 34 Years | 8 (11.8%) | 56 (82.4%) |
| 35 to 44 Years | 21 (25.6%) | 63 (76.8%) |
| 45 to 54 Years | 12 (17.4%) | 52 (75.4%) |
| 55 to 64 Years | 12 (15.2%) | 63 (79.7%) |
| 65 to 74 Years | 62 (100.0%) | 45 (72.6%) |
| 75 Years and over | 47 (100.0%) | 43 (91.5%) |
| Total | 192 (31.1%) | 495 (80.2%) |
Disability Status by Sex by Age in Salisbury borough
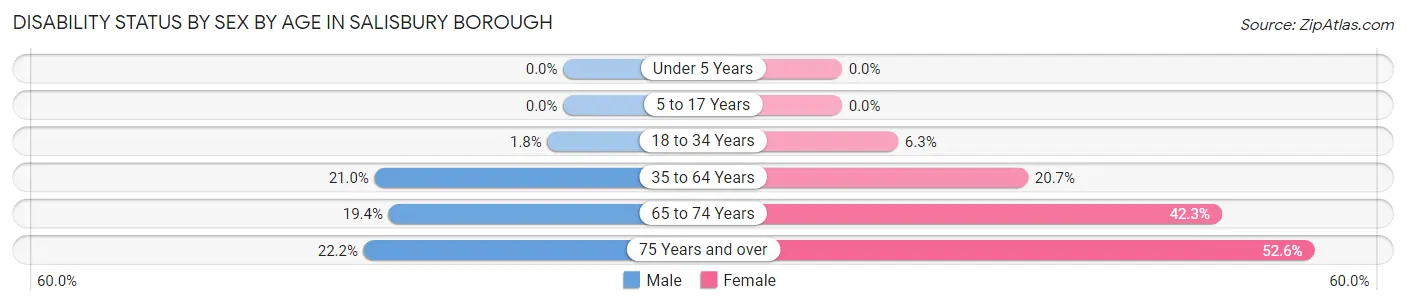
| Age Bracket | Male | Female |
| Under 5 Years | 0 (0.0%) | 0 (0.0%) |
| 5 to 17 Years | 0 (0.0%) | 0 (0.0%) |
| 18 to 34 Years | 1 (1.8%) | 4 (6.2%) |
| 35 to 64 Years | 25 (21.0%) | 23 (20.7%) |
| 65 to 74 Years | 7 (19.4%) | 11 (42.3%) |
| 75 Years and over | 2 (22.2%) | 20 (52.6%) |
Disability Class by Sex by Age in Salisbury borough
Disability Class: Hearing Difficulty
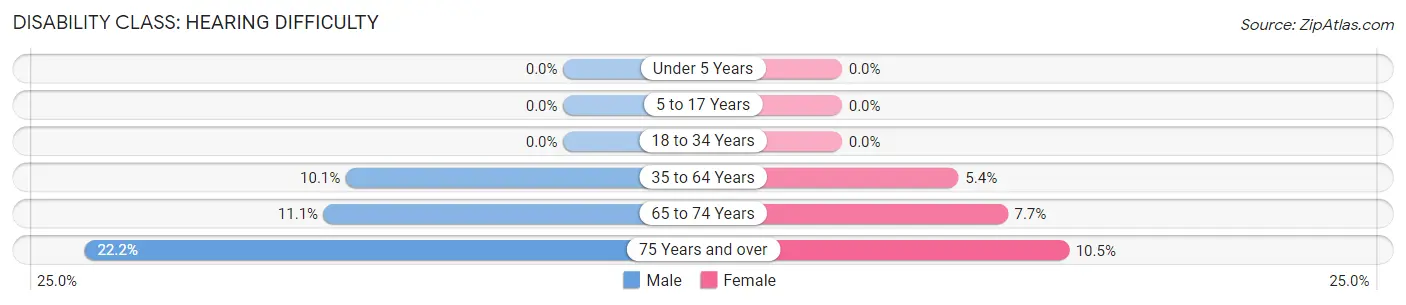
| Age Bracket | Male | Female |
| Under 5 Years | 0 (0.0%) | 0 (0.0%) |
| 5 to 17 Years | 0 (0.0%) | 0 (0.0%) |
| 18 to 34 Years | 0 (0.0%) | 0 (0.0%) |
| 35 to 64 Years | 12 (10.1%) | 6 (5.4%) |
| 65 to 74 Years | 4 (11.1%) | 2 (7.7%) |
| 75 Years and over | 2 (22.2%) | 4 (10.5%) |
Disability Class: Vision Difficulty
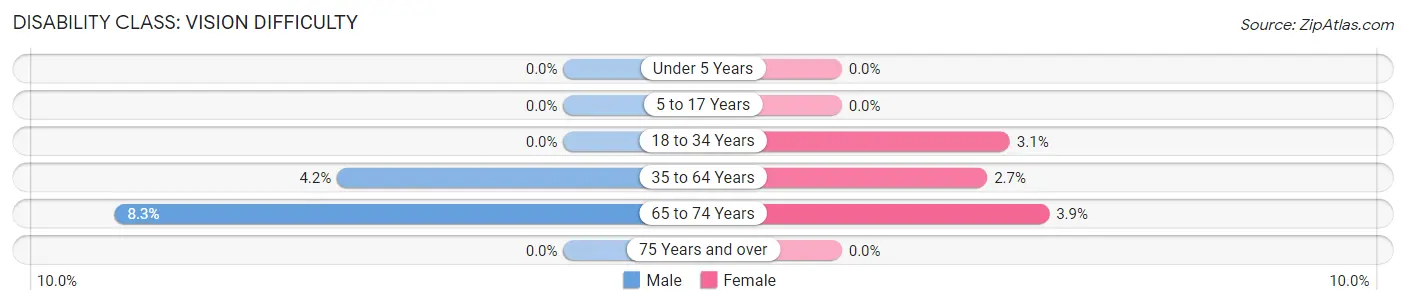
| Age Bracket | Male | Female |
| Under 5 Years | 0 (0.0%) | 0 (0.0%) |
| 5 to 17 Years | 0 (0.0%) | 0 (0.0%) |
| 18 to 34 Years | 0 (0.0%) | 2 (3.1%) |
| 35 to 64 Years | 5 (4.2%) | 3 (2.7%) |
| 65 to 74 Years | 3 (8.3%) | 1 (3.8%) |
| 75 Years and over | 0 (0.0%) | 0 (0.0%) |
Disability Class: Cognitive Difficulty
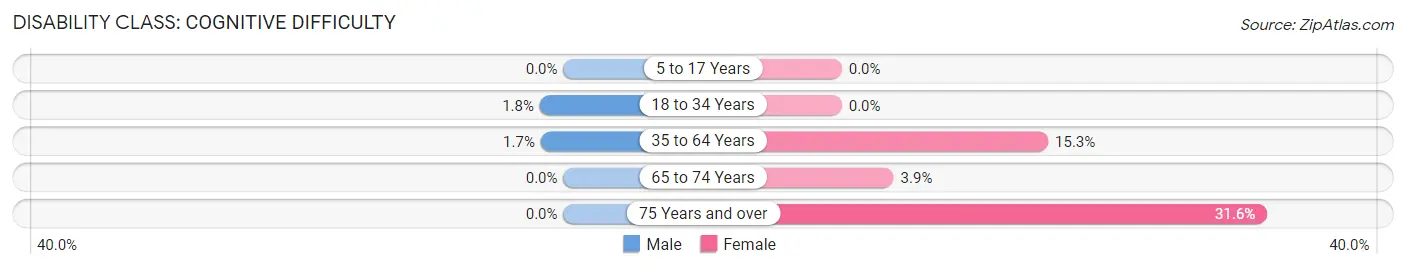
| Age Bracket | Male | Female |
| 5 to 17 Years | 0 (0.0%) | 0 (0.0%) |
| 18 to 34 Years | 1 (1.8%) | 0 (0.0%) |
| 35 to 64 Years | 2 (1.7%) | 17 (15.3%) |
| 65 to 74 Years | 0 (0.0%) | 1 (3.8%) |
| 75 Years and over | 0 (0.0%) | 12 (31.6%) |
Disability Class: Ambulatory Difficulty
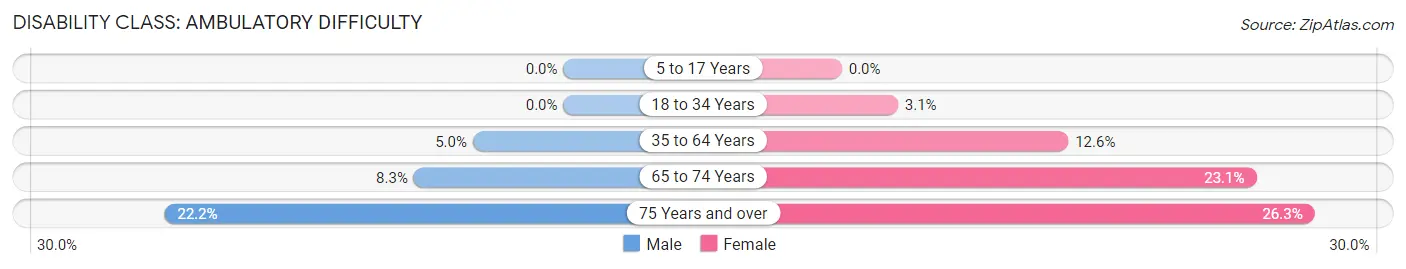
| Age Bracket | Male | Female |
| 5 to 17 Years | 0 (0.0%) | 0 (0.0%) |
| 18 to 34 Years | 0 (0.0%) | 2 (3.1%) |
| 35 to 64 Years | 6 (5.0%) | 14 (12.6%) |
| 65 to 74 Years | 3 (8.3%) | 6 (23.1%) |
| 75 Years and over | 2 (22.2%) | 10 (26.3%) |
Disability Class: Self-Care Difficulty
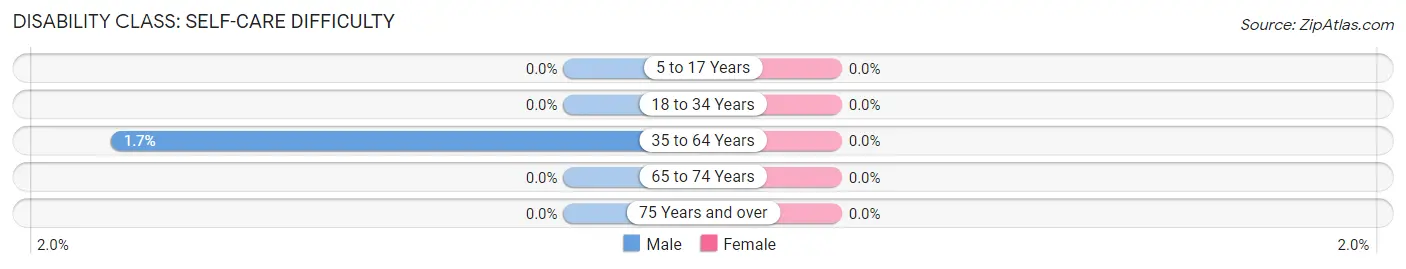
| Age Bracket | Male | Female |
| 5 to 17 Years | 0 (0.0%) | 0 (0.0%) |
| 18 to 34 Years | 0 (0.0%) | 0 (0.0%) |
| 35 to 64 Years | 2 (1.7%) | 0 (0.0%) |
| 65 to 74 Years | 0 (0.0%) | 0 (0.0%) |
| 75 Years and over | 0 (0.0%) | 0 (0.0%) |
Technology Access in Salisbury borough
Computing Device Access in Salisbury borough
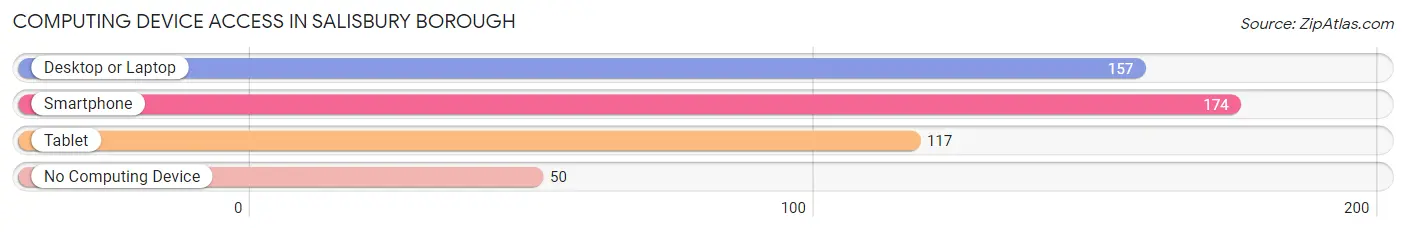
| Device Type | # Households | % Households |
| Desktop or Laptop | 157 | 62.3% |
| Smartphone | 174 | 69.1% |
| Tablet | 117 | 46.4% |
| No Computing Device | 50 | 19.8% |
| Total | 252 | 100.0% |
Internet Access in Salisbury borough
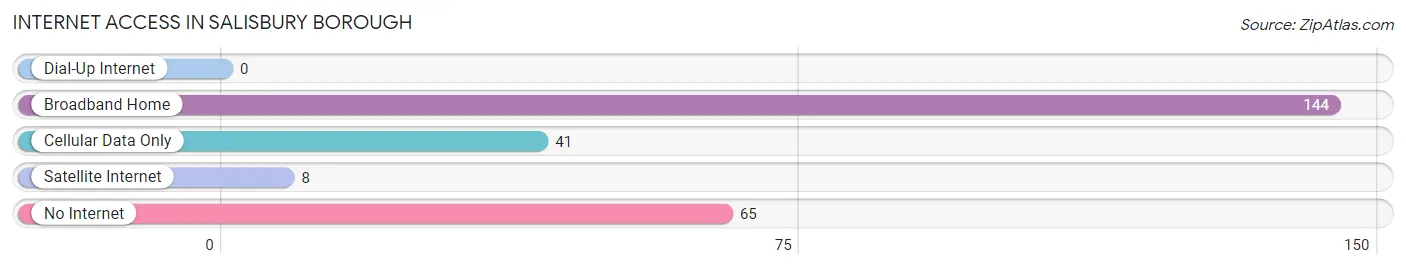
| Internet Type | # Households | % Households |
| Dial-Up Internet | 0 | 0.0% |
| Broadband Home | 144 | 57.1% |
| Cellular Data Only | 41 | 16.3% |
| Satellite Internet | 8 | 3.2% |
| No Internet | 65 | 25.8% |
| Total | 252 | 100.0% |
Salisbury borough Summary
Salisbury Borough is a small borough located in the center of Northampton County, Pennsylvania. It is situated in the Lehigh Valley region of the state, and is part of the Allentown-Bethlehem-Easton metropolitan area. The borough is home to a population of approximately 1,400 people, and is known for its historic architecture and quaint atmosphere.
Geography
Salisbury Borough is located in the center of Northampton County, Pennsylvania. It is situated in the Lehigh Valley region of the state, and is part of the Allentown-Bethlehem-Easton metropolitan area. The borough is bordered by the townships of Lower Saucon, Upper Saucon, and Hanover. The borough is situated on the banks of the Lehigh River, and is surrounded by rolling hills and lush farmland. The borough is located approximately 20 miles north of Allentown, and is easily accessible via Interstate 78 and Route 22.
History
Salisbury Borough was founded in 1752 by a group of German settlers. The settlers named the borough after Salisbury, England, and the area quickly grew into a thriving agricultural community. The borough was incorporated in 1867, and the population grew steadily throughout the 19th century. During this time, the borough became known for its historic architecture and quaint atmosphere.
In the early 20th century, Salisbury Borough experienced a period of rapid growth and development. The borough was home to several factories and businesses, and the population increased significantly. The borough also became a popular tourist destination, and many visitors came to enjoy the borough’s historic architecture and scenic views.
Economy
Salisbury Borough’s economy is largely based on tourism and agriculture. The borough is home to several small businesses, including restaurants, shops, and galleries. The borough is also home to several farms, which produce a variety of fruits and vegetables. The borough is also home to several wineries, which produce a variety of wines.
Demographics
As of the 2010 census, Salisbury Borough had a population of 1,400 people. The racial makeup of the borough was 94.3% White, 2.4% African American, 0.3% Native American, 0.7% Asian, 0.1% Pacific Islander, and 1.2% from other races. Hispanic or Latino of any race were 2.3% of the population.
The median household income in Salisbury Borough was $45,000, and the median family income was $50,000. The per capita income for the borough was $20,000. About 8.3% of families and 10.3% of the population were below the poverty line, including 14.3% of those under age 18 and 6.3% of those age 65 or over.
Conclusion
Salisbury Borough is a small borough located in the center of Northampton County, Pennsylvania. It is situated in the Lehigh Valley region of the state, and is part of the Allentown-Bethlehem-Easton metropolitan area. The borough is home to a population of approximately 1,400 people, and is known for its historic architecture and quaint atmosphere. The borough’s economy is largely based on tourism and agriculture, and the population is largely white. Salisbury Borough is a charming and historic borough that is a great place to visit or live.
Common Questions
What is Per Capita Income in Salisbury borough?
Per Capita income in Salisbury borough is $30,451.
What is the Median Family Income in Salisbury borough?
Median Family Income in Salisbury borough is $83,500.
What is the Median Household income in Salisbury borough?
Median Household Income in Salisbury borough is $70,278.
What is Income or Wage Gap in Salisbury borough?
Income or Wage Gap in Salisbury borough is 38.5%.
Women in Salisbury borough earn 61.5 cents for every dollar earned by a man.
What is Inequality or Gini Index in Salisbury borough?
Inequality or Gini Index in Salisbury borough is 0.38.
What is the Total Population of Salisbury borough?
Total Population of Salisbury borough is 619.
What is the Total Male Population of Salisbury borough?
Total Male Population of Salisbury borough is 257.
What is the Total Female Population of Salisbury borough?
Total Female Population of Salisbury borough is 362.
What is the Ratio of Males per 100 Females in Salisbury borough?
There are 70.99 Males per 100 Females in Salisbury borough.
What is the Ratio of Females per 100 Males in Salisbury borough?
There are 140.86 Females per 100 Males in Salisbury borough.
What is the Median Population Age in Salisbury borough?
Median Population Age in Salisbury borough is 39.3 Years.
What is the Average Family Size in Salisbury borough
Average Family Size in Salisbury borough is 3.0 People.
What is the Average Household Size in Salisbury borough
Average Household Size in Salisbury borough is 2.5 People.
How Large is the Labor Force in Salisbury borough?
There are 354 People in the Labor Forcein in Salisbury borough.
What is the Percentage of People in the Labor Force in Salisbury borough?
73.1% of People are in the Labor Force in Salisbury borough.
What is the Unemployment Rate in Salisbury borough?
Unemployment Rate in Salisbury borough is 11.9%.