Westwood, PA Map & Demographics
Westwood Map
Westwood Overview
$26,253
PER CAPITA INCOME
$82,764
AVG FAMILY INCOME
$77,313
AVG HOUSEHOLD INCOME
13.0%
WAGE / INCOME GAP [ % ]
87.0¢/ $1
WAGE / INCOME GAP [ $ ]
0.20
INEQUALITY / GINI INDEX
1,559
TOTAL POPULATION
553
MALE POPULATION
1,006
FEMALE POPULATION
54.97
MALES / 100 FEMALES
181.92
FEMALES / 100 MALES
34.0
MEDIAN AGE
3.7
AVG FAMILY SIZE
3.5
AVG HOUSEHOLD SIZE
1,078
LABOR FORCE [ PEOPLE ]
96.3%
PERCENT IN LABOR FORCE
3.4%
UNEMPLOYMENT RATE
Income in Westwood
Income Overview in Westwood
Per Capita Income in Westwood is $26,253, while median incomes of families and households are $82,764 and $77,313 respectively.
| Characteristic | Number | Measure |
| Per Capita Income | 1,559 | $26,253 |
| Median Family Income | 399 | $82,764 |
| Mean Family Income | 399 | $90,972 |
| Median Household Income | 447 | $77,313 |
| Mean Household Income | 447 | $87,885 |
| Income Deficit | 399 | $0 |
| Wage / Income Gap (%) | 1,559 | 13.03% |
| Wage / Income Gap ($) | 1,559 | 86.97¢ per $1 |
| Gini / Inequality Index | 1,559 | 0.20 |
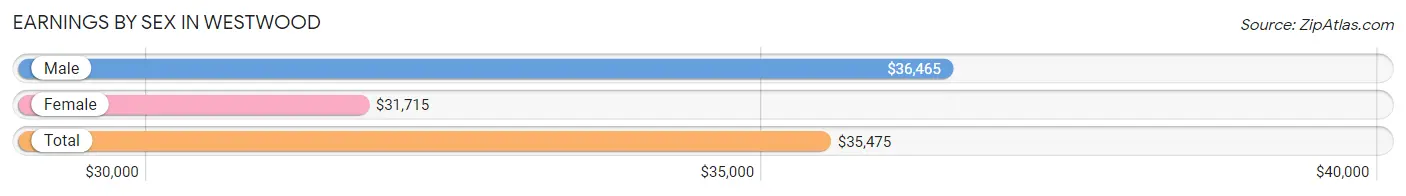
Earnings by Sex in Westwood
Average Earnings in Westwood are $35,475, $36,465 for men and $31,715 for women, a difference of 13.0%.
| Sex | Number | Average Earnings |
| Male | 381 (35.3%) | $36,465 |
| Female | 697 (64.7%) | $31,715 |
| Total | 1,078 (100.0%) | $35,475 |
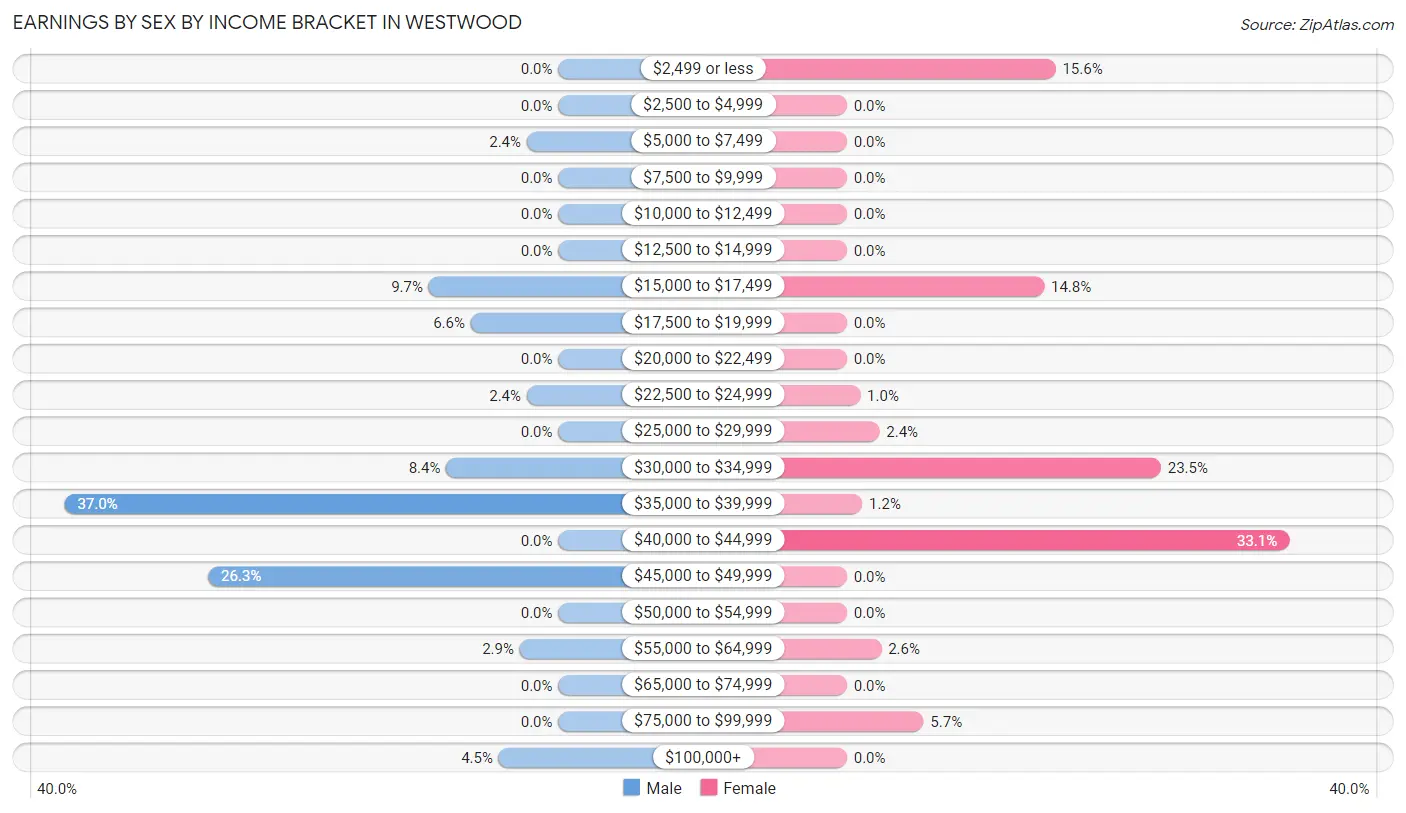
Earnings by Sex by Income Bracket in Westwood
The most common earnings brackets in Westwood are $35,000 to $39,999 for men (141 | 37.0%) and $40,000 to $44,999 for women (231 | 33.1%).
| Income | Male | Female |
| $2,499 or less | 0 (0.0%) | 109 (15.6%) |
| $2,500 to $4,999 | 0 (0.0%) | 0 (0.0%) |
| $5,000 to $7,499 | 9 (2.4%) | 0 (0.0%) |
| $7,500 to $9,999 | 0 (0.0%) | 0 (0.0%) |
| $10,000 to $12,499 | 0 (0.0%) | 0 (0.0%) |
| $12,500 to $14,999 | 0 (0.0%) | 0 (0.0%) |
| $15,000 to $17,499 | 37 (9.7%) | 103 (14.8%) |
| $17,500 to $19,999 | 25 (6.6%) | 0 (0.0%) |
| $20,000 to $22,499 | 0 (0.0%) | 0 (0.0%) |
| $22,500 to $24,999 | 9 (2.4%) | 7 (1.0%) |
| $25,000 to $29,999 | 0 (0.0%) | 17 (2.4%) |
| $30,000 to $34,999 | 32 (8.4%) | 164 (23.5%) |
| $35,000 to $39,999 | 141 (37.0%) | 8 (1.1%) |
| $40,000 to $44,999 | 0 (0.0%) | 231 (33.1%) |
| $45,000 to $49,999 | 100 (26.3%) | 0 (0.0%) |
| $50,000 to $54,999 | 0 (0.0%) | 0 (0.0%) |
| $55,000 to $64,999 | 11 (2.9%) | 18 (2.6%) |
| $65,000 to $74,999 | 0 (0.0%) | 0 (0.0%) |
| $75,000 to $99,999 | 0 (0.0%) | 40 (5.7%) |
| $100,000+ | 17 (4.5%) | 0 (0.0%) |
| Total | 381 (100.0%) | 697 (100.0%) |
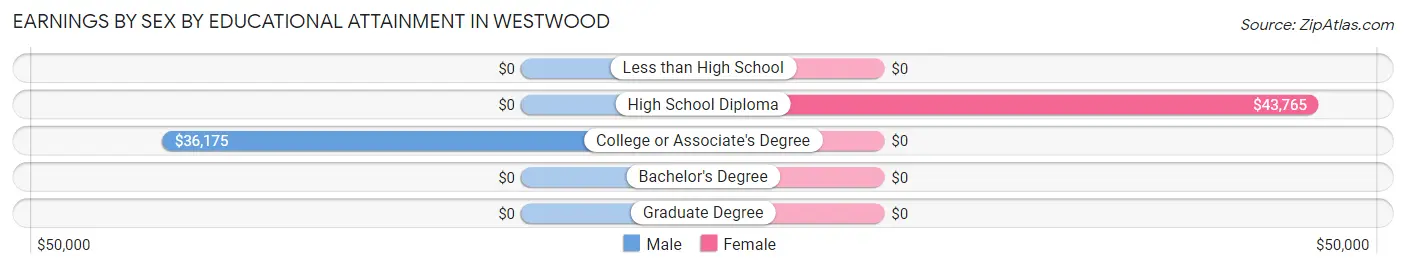
Earnings by Sex by Educational Attainment in Westwood
Average earnings in Westwood are $36,828 for men and $31,768 for women, a difference of 13.7%. Men with an educational attainment of college or associate's degree enjoy the highest average annual earnings of $36,175, while those with college or associate's degree education earn the least with $36,175. Women with an educational attainment of high school diploma earn the most with the average annual earnings of $43,765, while those with high school diploma education have the smallest earnings of $43,765.
| Educational Attainment | Male Income | Female Income |
| Less than High School | - | - |
| High School Diploma | - | - |
| College or Associate's Degree | $36,175 | $0 |
| Bachelor's Degree | - | - |
| Graduate Degree | - | - |
| Total | $36,828 | $31,768 |
Family Income in Westwood
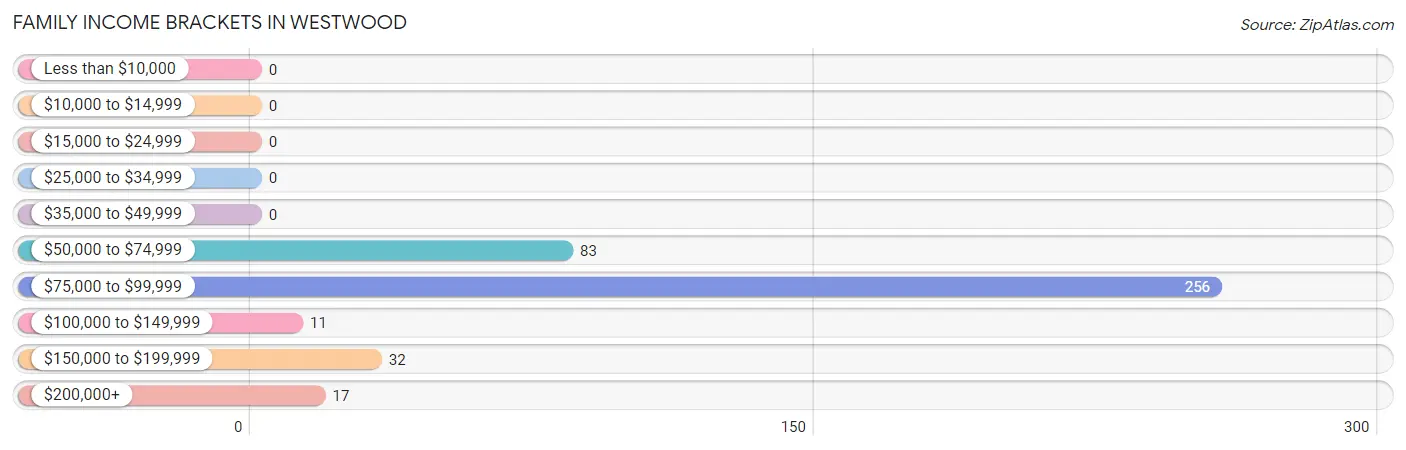
Family Income Brackets in Westwood
According to the Westwood family income data, there are 256 families falling into the $75,000 to $99,999 income range, which is the most common income bracket and makes up 64.2% of all families.
| Income Bracket | # Families | % Families |
| Less than $10,000 | 0 | 0.0% |
| $10,000 to $14,999 | 0 | 0.0% |
| $15,000 to $24,999 | 0 | 0.0% |
| $25,000 to $34,999 | 0 | 0.0% |
| $35,000 to $49,999 | 0 | 0.0% |
| $50,000 to $74,999 | 83 | 20.8% |
| $75,000 to $99,999 | 256 | 64.2% |
| $100,000 to $149,999 | 11 | 2.8% |
| $150,000 to $199,999 | 32 | 8.0% |
| $200,000+ | 17 | 4.3% |
Family Income by Famaliy Size in Westwood
| Income Bracket | # Families | Median Income |
| 2-Person Families | 91 (22.8%) | $0 |
| 3-Person Families | 180 (45.1%) | $0 |
| 4-Person Families | 0 (0.0%) | $0 |
| 5-Person Families | 28 (7.0%) | $0 |
| 6-Person Families | 100 (25.1%) | $0 |
| 7+ Person Families | 0 (0.0%) | $0 |
| Total | 399 (100.0%) | $82,764 |
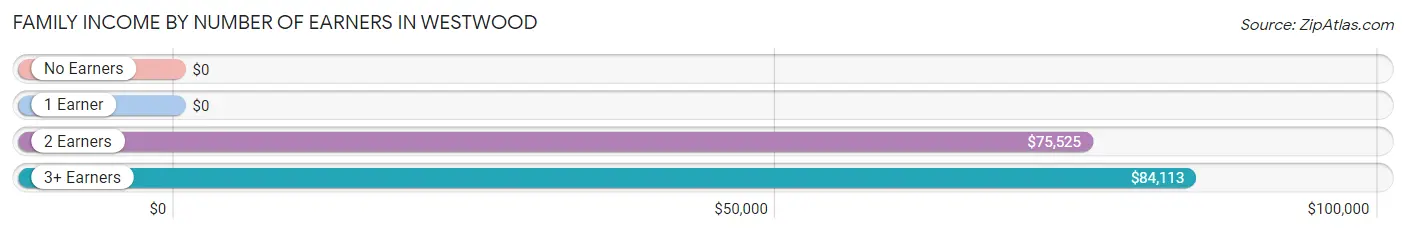
Family Income by Number of Earners in Westwood
| Number of Earners | # Families | Median Income |
| No Earners | 0 (0.0%) | $0 |
| 1 Earner | 0 (0.0%) | $0 |
| 2 Earners | 208 (52.1%) | $75,525 |
| 3+ Earners | 191 (47.9%) | $84,113 |
| Total | 399 (100.0%) | $82,764 |
Household Income in Westwood
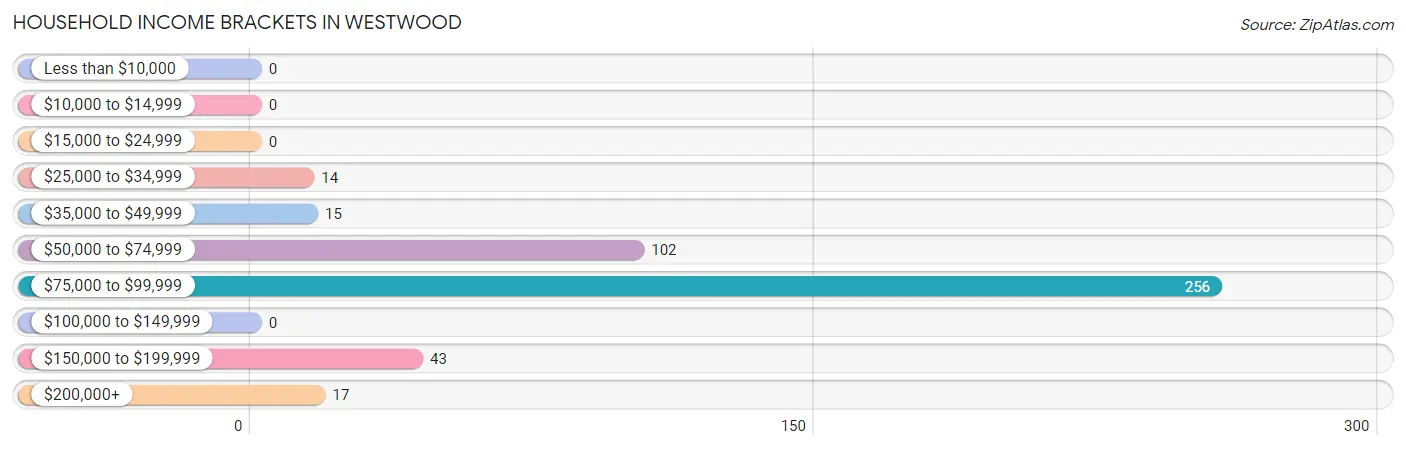
Household Income Brackets in Westwood
With 256 households falling in the category, the $75,000 to $99,999 income range is the most frequent in Westwood, accounting for 57.3% of all households.
| Income Bracket | # Households | % Households |
| Less than $10,000 | 0 | 0.0% |
| $10,000 to $14,999 | 0 | 0.0% |
| $15,000 to $24,999 | 0 | 0.0% |
| $25,000 to $34,999 | 14 | 3.1% |
| $35,000 to $49,999 | 15 | 3.4% |
| $50,000 to $74,999 | 102 | 22.8% |
| $75,000 to $99,999 | 256 | 57.3% |
| $100,000 to $149,999 | 0 | 0.0% |
| $150,000 to $199,999 | 43 | 9.6% |
| $200,000+ | 17 | 3.8% |
Household Income by Householder Age in Westwood
The median household income in Westwood is $77,313, with the highest median household income of $83,412 found in the 45 to 64 years age bracket for the primary householder. A total of 274 households (61.3%) fall into this category.
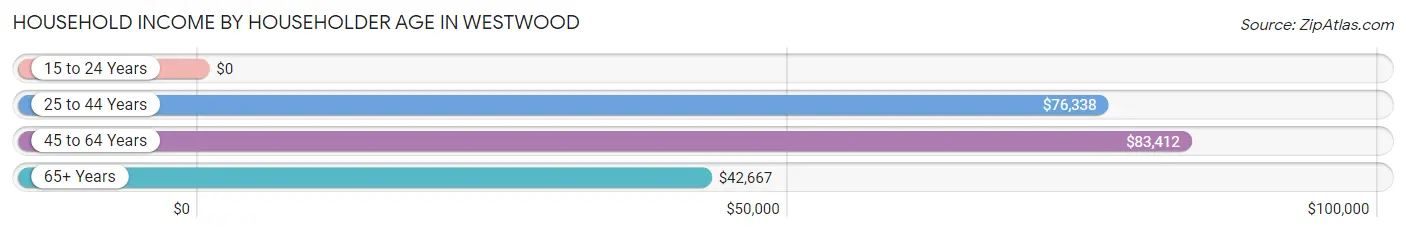
| Income Bracket | # Households | Median Income |
| 15 to 24 Years | 0 (0.0%) | $0 |
| 25 to 44 Years | 143 (32.0%) | $76,338 |
| 45 to 64 Years | 274 (61.3%) | $83,412 |
| 65+ Years | 30 (6.7%) | $42,667 |
| Total | 447 (100.0%) | $77,313 |
Poverty in Westwood
Income Below Poverty by Sex and Age in Westwood
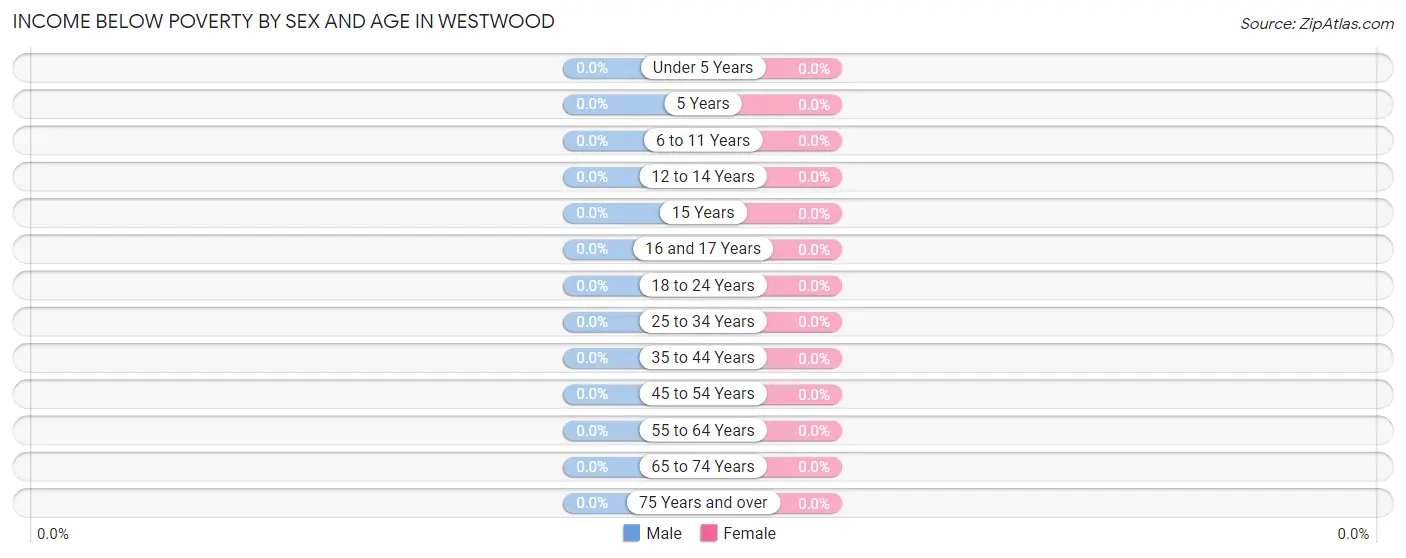
| Age Bracket | Male | Female |
| Under 5 Years | 0 (0.0%) | 0 (0.0%) |
| 5 Years | 0 (0.0%) | 0 (0.0%) |
| 6 to 11 Years | 0 (0.0%) | 0 (0.0%) |
| 12 to 14 Years | 0 (0.0%) | 0 (0.0%) |
| 15 Years | 0 (0.0%) | 0 (0.0%) |
| 16 and 17 Years | 0 (0.0%) | 0 (0.0%) |
| 18 to 24 Years | 0 (0.0%) | 0 (0.0%) |
| 25 to 34 Years | 0 (0.0%) | 0 (0.0%) |
| 35 to 44 Years | 0 (0.0%) | 0 (0.0%) |
| 45 to 54 Years | 0 (0.0%) | 0 (0.0%) |
| 55 to 64 Years | 0 (0.0%) | 0 (0.0%) |
| 65 to 74 Years | 0 (0.0%) | 0 (0.0%) |
| 75 Years and over | 0 (0.0%) | 0 (0.0%) |
| Total | 0 (0.0%) | 0 (0.0%) |
Income Above Poverty by Sex and Age in Westwood
According to the poverty statistics in Westwood, males aged 6 to 11 years and females aged under 5 years are the age groups that are most secure financially, with 100.0% of males and 100.0% of females in these age groups living above the poverty line.
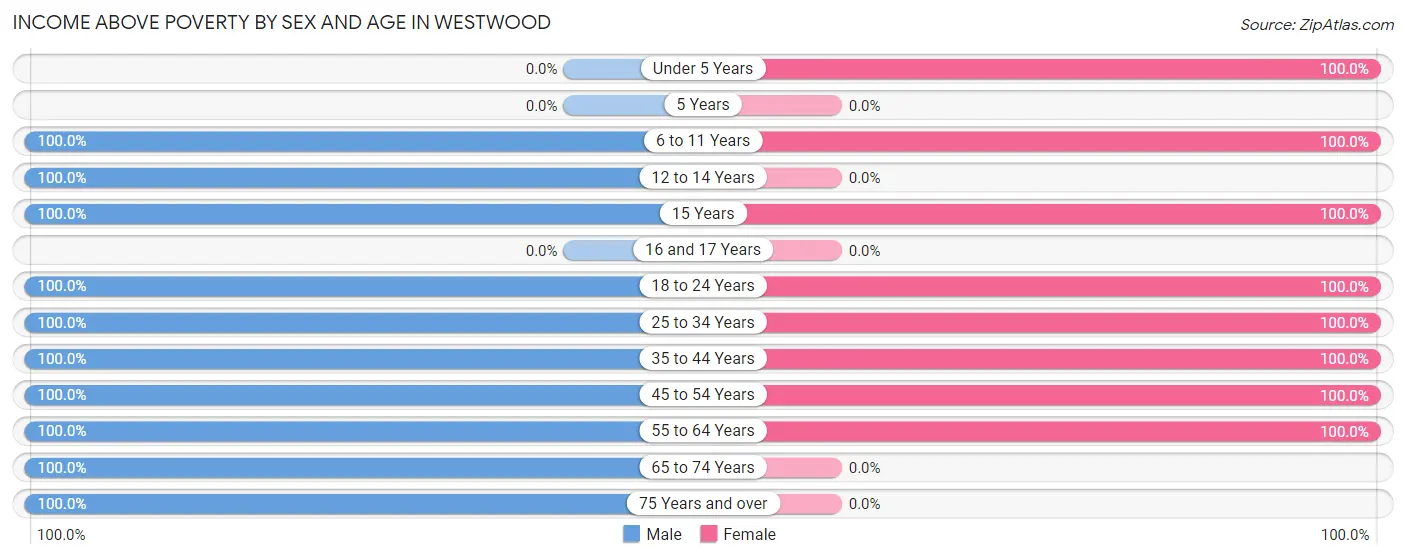
| Age Bracket | Male | Female |
| Under 5 Years | 0 (0.0%) | 14 (100.0%) |
| 5 Years | 0 (0.0%) | 0 (0.0%) |
| 6 to 11 Years | 17 (100.0%) | 204 (100.0%) |
| 12 to 14 Years | 108 (100.0%) | 0 (0.0%) |
| 15 Years | 17 (100.0%) | 80 (100.0%) |
| 16 and 17 Years | 0 (0.0%) | 0 (0.0%) |
| 18 to 24 Years | 53 (100.0%) | 18 (100.0%) |
| 25 to 34 Years | 143 (100.0%) | 144 (100.0%) |
| 35 to 44 Years | 142 (100.0%) | 275 (100.0%) |
| 45 to 54 Years | 11 (100.0%) | 40 (100.0%) |
| 55 to 64 Years | 32 (100.0%) | 231 (100.0%) |
| 65 to 74 Years | 16 (100.0%) | 0 (0.0%) |
| 75 Years and over | 14 (100.0%) | 0 (0.0%) |
| Total | 553 (100.0%) | 1,006 (100.0%) |
Income Below Poverty Among Married-Couple Families in Westwood
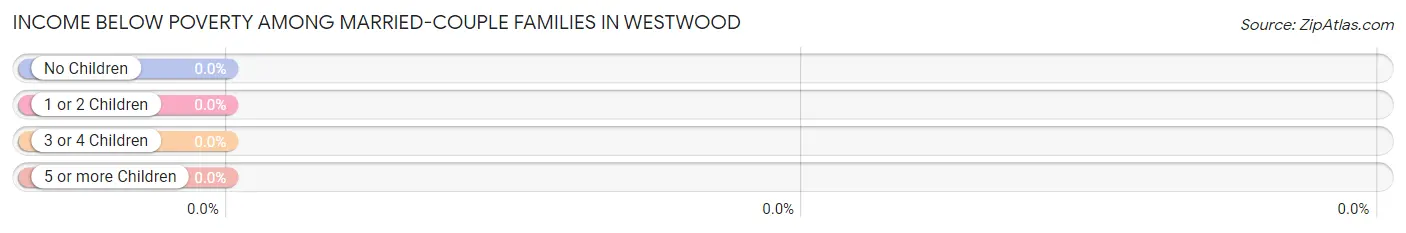
| Children | Above Poverty | Below Poverty |
| No Children | 32 (100.0%) | 0 (0.0%) |
| 1 or 2 Children | 11 (100.0%) | 0 (0.0%) |
| 3 or 4 Children | 117 (100.0%) | 0 (0.0%) |
| 5 or more Children | 0 (0.0%) | 0 (0.0%) |
| Total | 160 (100.0%) | 0 (0.0%) |
Income Below Poverty Among Single-Parent Households in Westwood
| Children | Single Father | Single Mother |
| No Children | 0 (0.0%) | 0 (0.0%) |
| 1 or 2 Children | 0 (0.0%) | 0 (0.0%) |
| 3 or 4 Children | 0 (0.0%) | 0 (0.0%) |
| 5 or more Children | 0 (0.0%) | 0 (0.0%) |
| Total | 0 (0.0%) | 0 (0.0%) |
Income Below Poverty Among Married-Couple vs Single-Parent Households in Westwood
| Children | Married-Couple Families | Single-Parent Households |
| No Children | 0 (0.0%) | 0 (0.0%) |
| 1 or 2 Children | 0 (0.0%) | 0 (0.0%) |
| 3 or 4 Children | 0 (0.0%) | 0 (0.0%) |
| 5 or more Children | 0 (0.0%) | 0 (0.0%) |
| Total | 0 (0.0%) | 0 (0.0%) |
Race in Westwood
The most populous races in Westwood are White / Caucasian (1,347 | 86.4%), Black / African American (186 | 11.9%), and Hispanic or Latino (76 | 4.9%).
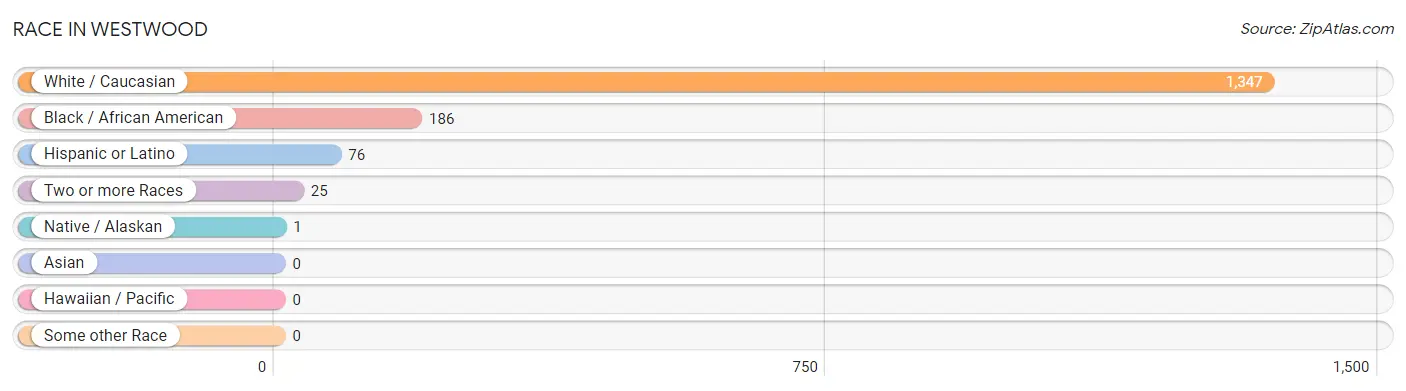
| Race | # Population | % Population |
| Asian | 0 | 0.0% |
| Black / African American | 186 | 11.9% |
| Hawaiian / Pacific | 0 | 0.0% |
| Hispanic or Latino | 76 | 4.9% |
| Native / Alaskan | 1 | 0.1% |
| White / Caucasian | 1,347 | 86.4% |
| Two or more Races | 25 | 1.6% |
| Some other Race | 0 | 0.0% |
| Total | 1,559 | 100.0% |
Ancestry in Westwood
The most populous ancestries reported in Westwood are Polish (391 | 25.1%), German (351 | 22.5%), Irish (339 | 21.7%), English (261 | 16.7%), and Scottish (172 | 11.0%), together accounting for 97.1% of all Westwood residents.
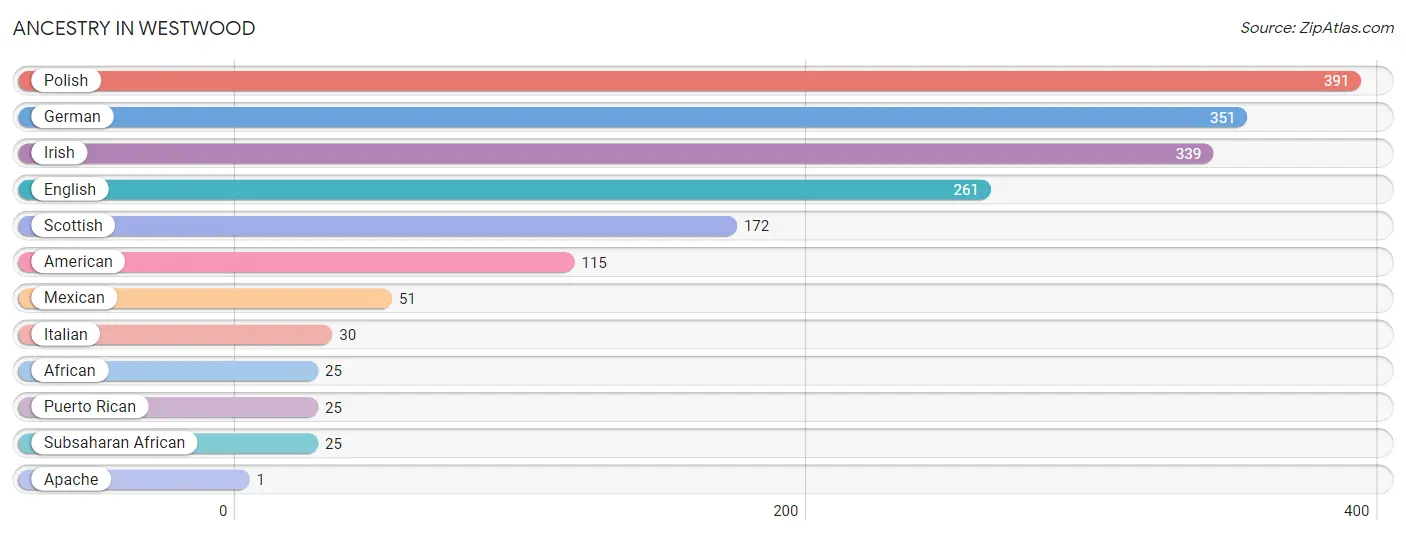
| Ancestry | # Population | % Population |
| African | 25 | 1.6% |
| American | 115 | 7.4% |
| Apache | 1 | 0.1% |
| English | 261 | 16.7% |
| German | 351 | 22.5% |
| Irish | 339 | 21.7% |
| Italian | 30 | 1.9% |
| Mexican | 51 | 3.3% |
| Polish | 391 | 25.1% |
| Puerto Rican | 25 | 1.6% |
| Scottish | 172 | 11.0% |
| Subsaharan African | 25 | 1.6% | View All 12 Rows |
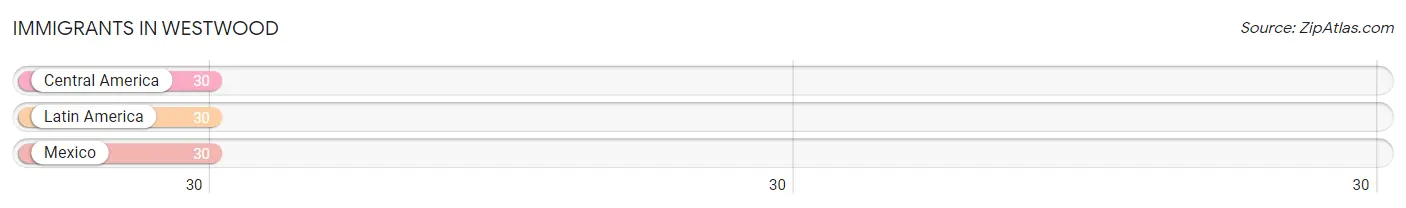
Immigrants in Westwood
The most numerous immigrant groups reported in Westwood came from Central America (30 | 1.9%), Latin America (30 | 1.9%), and Mexico (30 | 1.9%), together accounting for 5.8% of all Westwood residents.
| Immigration Origin | # Population | % Population |
| Central America | 30 | 1.9% |
| Latin America | 30 | 1.9% |
| Mexico | 30 | 1.9% | View All 3 Rows |
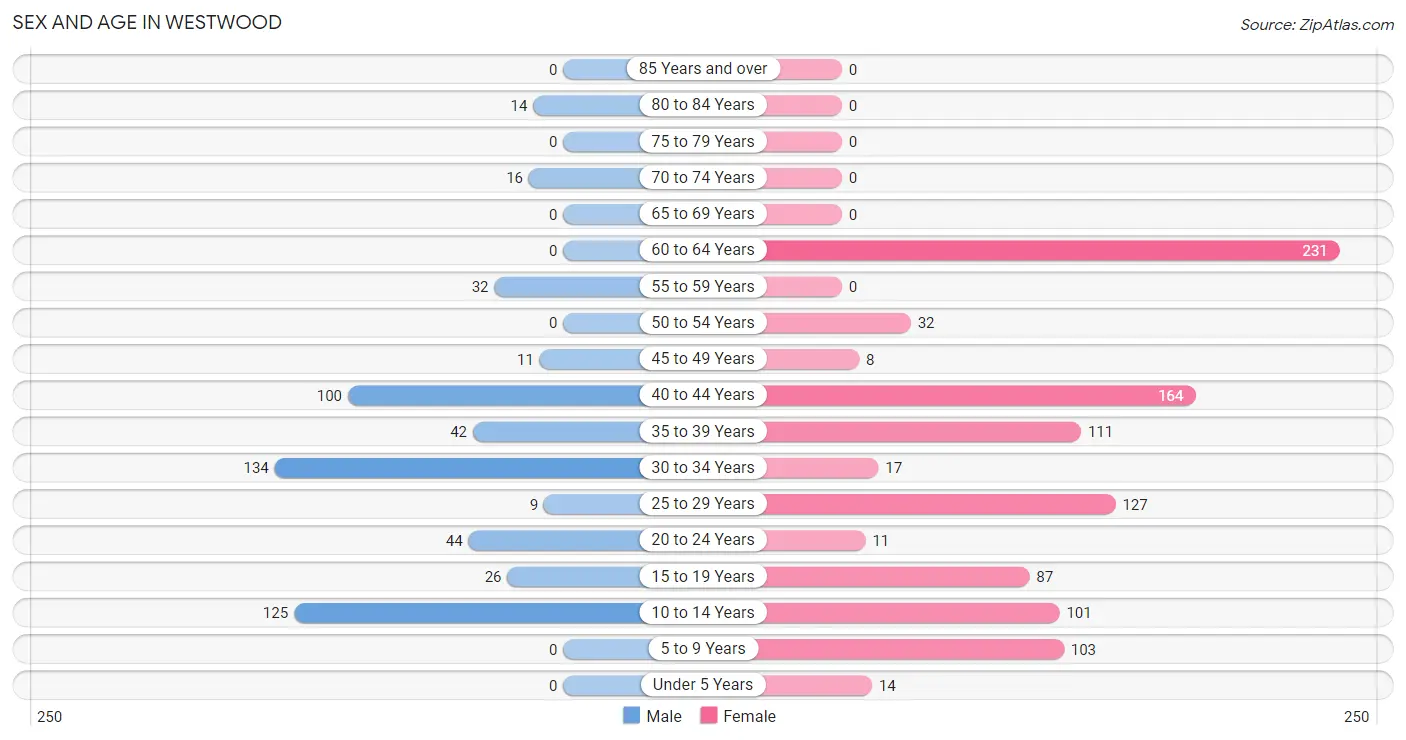
Sex and Age in Westwood
Sex and Age in Westwood
The most populous age groups in Westwood are 30 to 34 Years (134 | 24.2%) for men and 60 to 64 Years (231 | 23.0%) for women.
| Age Bracket | Male | Female |
| Under 5 Years | 0 (0.0%) | 14 (1.4%) |
| 5 to 9 Years | 0 (0.0%) | 103 (10.2%) |
| 10 to 14 Years | 125 (22.6%) | 101 (10.0%) |
| 15 to 19 Years | 26 (4.7%) | 87 (8.6%) |
| 20 to 24 Years | 44 (8.0%) | 11 (1.1%) |
| 25 to 29 Years | 9 (1.6%) | 127 (12.6%) |
| 30 to 34 Years | 134 (24.2%) | 17 (1.7%) |
| 35 to 39 Years | 42 (7.6%) | 111 (11.0%) |
| 40 to 44 Years | 100 (18.1%) | 164 (16.3%) |
| 45 to 49 Years | 11 (2.0%) | 8 (0.8%) |
| 50 to 54 Years | 0 (0.0%) | 32 (3.2%) |
| 55 to 59 Years | 32 (5.8%) | 0 (0.0%) |
| 60 to 64 Years | 0 (0.0%) | 231 (23.0%) |
| 65 to 69 Years | 0 (0.0%) | 0 (0.0%) |
| 70 to 74 Years | 16 (2.9%) | 0 (0.0%) |
| 75 to 79 Years | 0 (0.0%) | 0 (0.0%) |
| 80 to 84 Years | 14 (2.5%) | 0 (0.0%) |
| 85 Years and over | 0 (0.0%) | 0 (0.0%) |
| Total | 553 (100.0%) | 1,006 (100.0%) |
Families and Households in Westwood
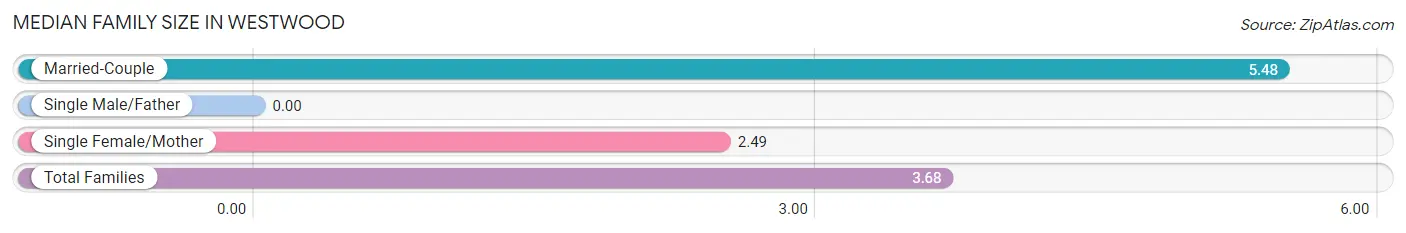
Median Family Size in Westwood
| Family Type | # Families | Family Size |
| Married-Couple | 160 (40.1%) | 5.48 |
| Single Male/Father | 0 (0.0%) | - |
| Single Female/Mother | 239 (59.9%) | 2.49 |
| Total Families | 399 (100.0%) | 3.68 |
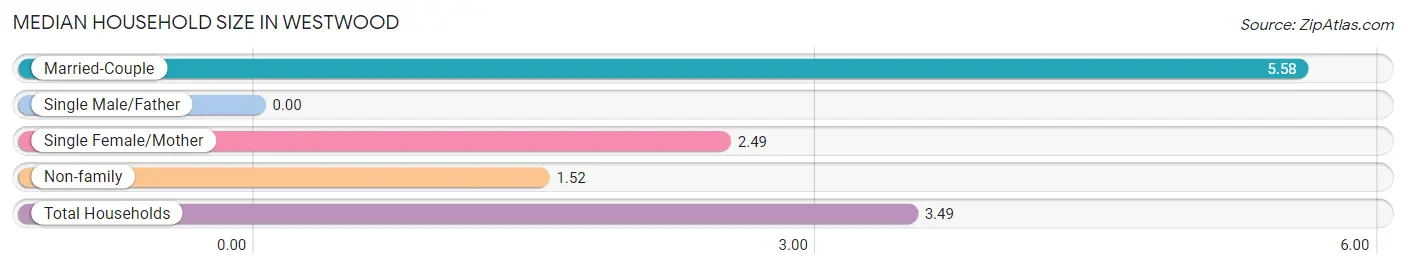
Median Household Size in Westwood
| Household Type | # Households | Household Size |
| Married-Couple | 160 (35.8%) | 5.58 |
| Single Male/Father | 0 (0.0%) | - |
| Single Female/Mother | 239 (53.5%) | 2.49 |
| Non-family | 48 (10.7%) | 1.52 |
| Total Households | 447 (100.0%) | 3.49 |
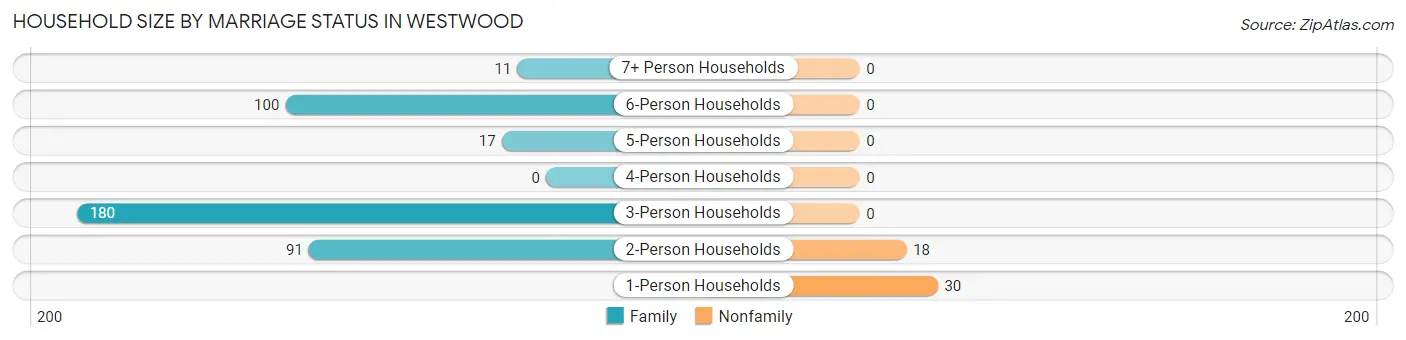
Household Size by Marriage Status in Westwood
Out of a total of 447 households in Westwood, 399 (89.3%) are family households, while 48 (10.7%) are nonfamily households. The most numerous type of family households are 3-person households, comprising 180, and the most common type of nonfamily households are 1-person households, comprising 30.
| Household Size | Family Households | Nonfamily Households |
| 1-Person Households | - | 30 (6.7%) |
| 2-Person Households | 91 (20.4%) | 18 (4.0%) |
| 3-Person Households | 180 (40.3%) | 0 (0.0%) |
| 4-Person Households | 0 (0.0%) | 0 (0.0%) |
| 5-Person Households | 17 (3.8%) | 0 (0.0%) |
| 6-Person Households | 100 (22.4%) | 0 (0.0%) |
| 7+ Person Households | 11 (2.5%) | 0 (0.0%) |
| Total | 399 (89.3%) | 48 (10.7%) |
Female Fertility in Westwood
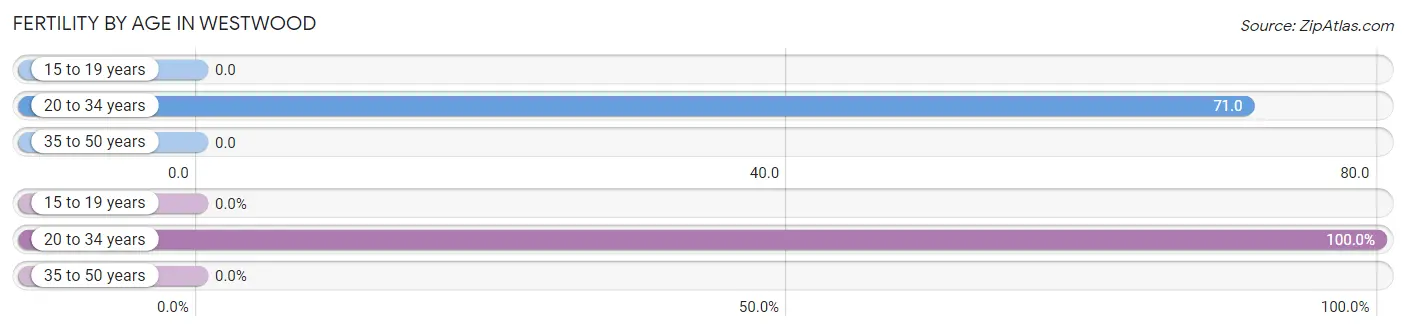
Fertility by Age in Westwood
Average fertility rate in Westwood is 21.0 births per 1,000 women. Women in the age bracket of 20 to 34 years have the highest fertility rate with 71.0 births per 1,000 women. Women in the age bracket of 20 to 34 years acount for 100.0% of all women with births.
| Age Bracket | Women with Births | Births / 1,000 Women |
| 15 to 19 years | 0 (0.0%) | 0.0 |
| 20 to 34 years | 11 (100.0%) | 71.0 |
| 35 to 50 years | 0 (0.0%) | 0.0 |
| Total | 11 (100.0%) | 21.0 |
Fertility by Age by Marriage Status in Westwood
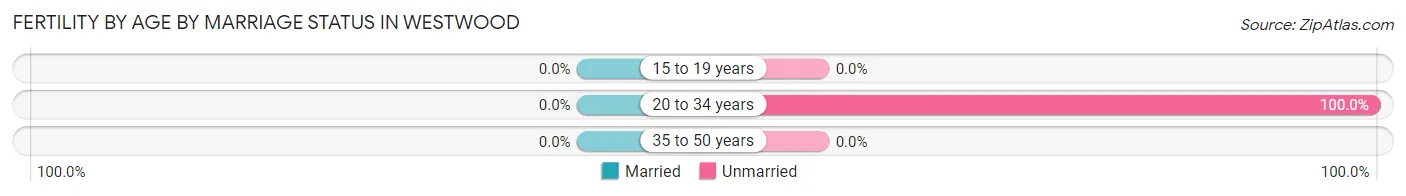
| Age Bracket | Married | Unmarried |
| 15 to 19 years | 0 (0.0%) | 0 (0.0%) |
| 20 to 34 years | 0 (0.0%) | 11 (100.0%) |
| 35 to 50 years | 0 (0.0%) | 0 (0.0%) |
| Total | 0 (0.0%) | 11 (100.0%) |
Fertility by Education in Westwood
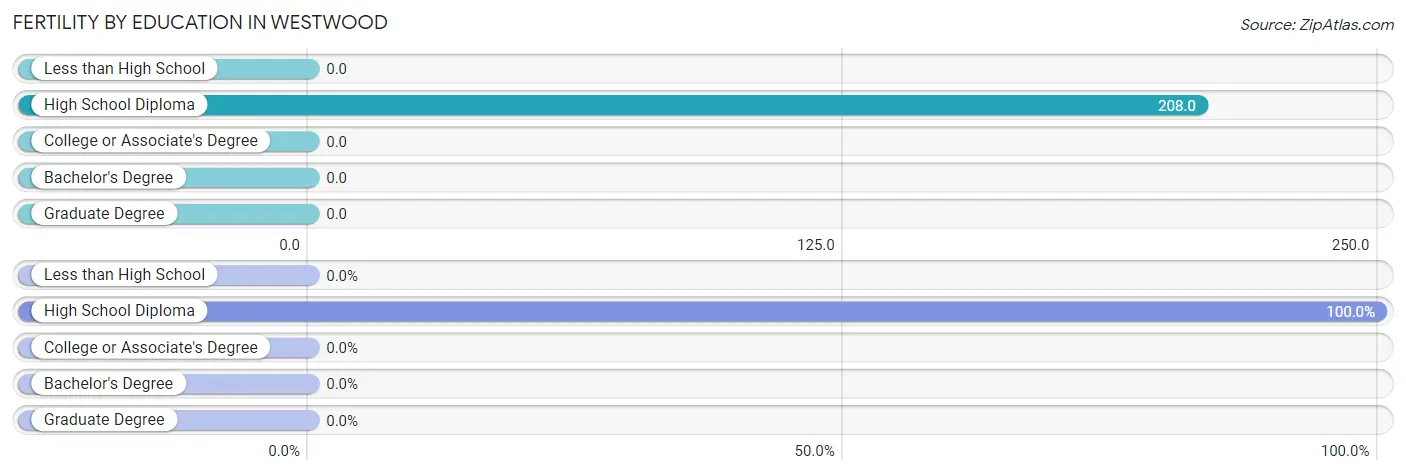
| Educational Attainment | Women with Births | Births / 1,000 Women |
| Less than High School | 0 (0.0%) | 0.0 |
| High School Diploma | 11 (100.0%) | 208.0 |
| College or Associate's Degree | 0 (0.0%) | 0.0 |
| Bachelor's Degree | 0 (0.0%) | 0.0 |
| Graduate Degree | 0 (0.0%) | 0.0 |
| Total | 11 (100.0%) | 21.0 |
Fertility by Education by Marriage Status in Westwood
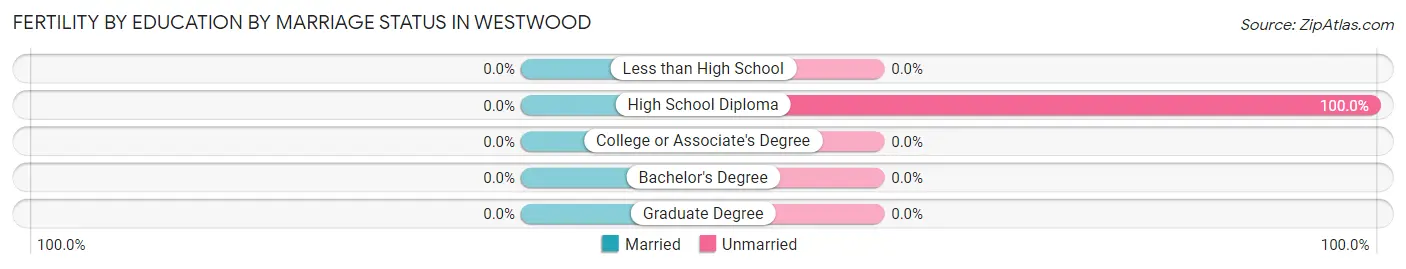
| Educational Attainment | Married | Unmarried |
| Less than High School | 0 (0.0%) | 0 (0.0%) |
| High School Diploma | 0 (0.0%) | 11 (100.0%) |
| College or Associate's Degree | 0 (0.0%) | 0 (0.0%) |
| Bachelor's Degree | 0 (0.0%) | 0 (0.0%) |
| Graduate Degree | 0 (0.0%) | 0 (0.0%) |
| Total | 0 (0.0%) | 11 (100.0%) |
Employment Characteristics in Westwood
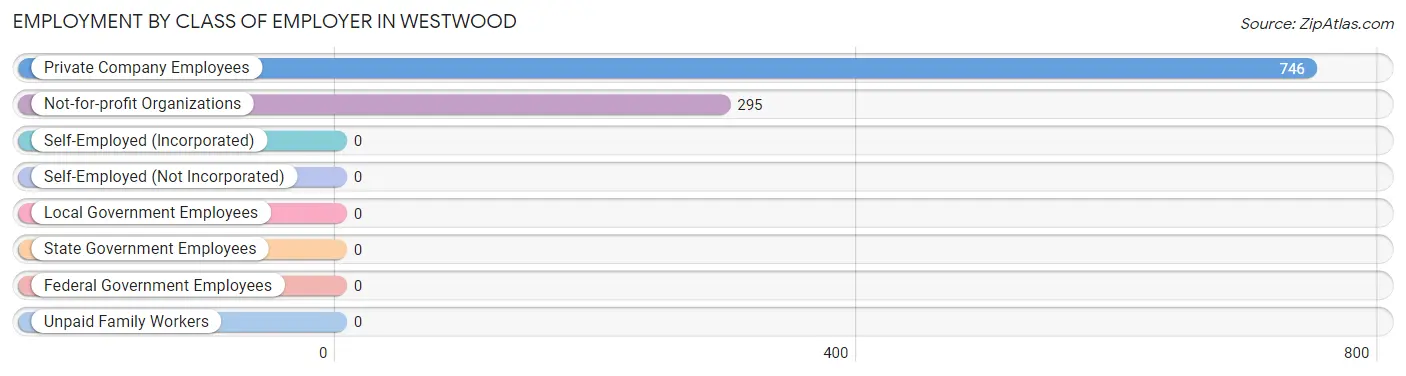
Employment by Class of Employer in Westwood
Among the 1,041 employed individuals in Westwood, private company employees (746 | 71.7%), and not-for-profit organizations (295 | 28.3%) make up the most common classes of employment.
| Employer Class | # Employees | % Employees |
| Private Company Employees | 746 | 71.7% |
| Self-Employed (Incorporated) | 0 | 0.0% |
| Self-Employed (Not Incorporated) | 0 | 0.0% |
| Not-for-profit Organizations | 295 | 28.3% |
| Local Government Employees | 0 | 0.0% |
| State Government Employees | 0 | 0.0% |
| Federal Government Employees | 0 | 0.0% |
| Unpaid Family Workers | 0 | 0.0% |
| Total | 1,041 | 100.0% |
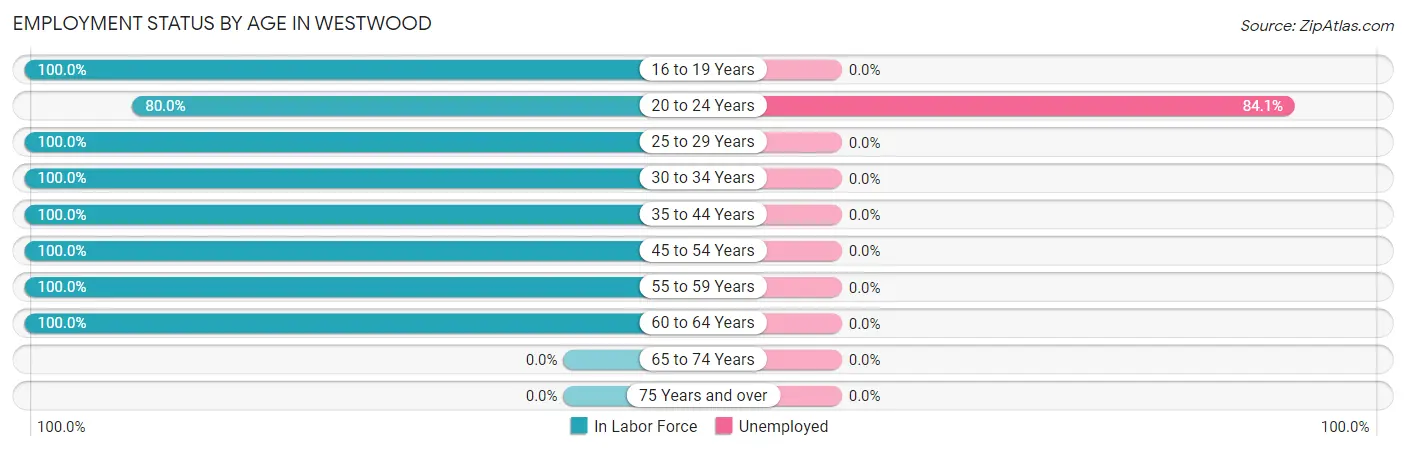
Employment Status by Age in Westwood
According to the labor force statistics for Westwood, out of the total population over 16 years of age (1,119), 96.3% or 1,078 individuals are in the labor force, with 3.4% or 37 of them unemployed. The age group with the highest labor force participation rate is 16 to 19 years, with 100.0% or 16 individuals in the labor force. Within the labor force, the 20 to 24 years age range has the highest percentage of unemployed individuals, with 84.1% or 37 of them being unemployed.
| Age Bracket | In Labor Force | Unemployed |
| 16 to 19 Years | 16 (100.0%) | 0 (0.0%) |
| 20 to 24 Years | 44 (80.0%) | 37 (84.1%) |
| 25 to 29 Years | 136 (100.0%) | 0 (0.0%) |
| 30 to 34 Years | 151 (100.0%) | 0 (0.0%) |
| 35 to 44 Years | 417 (100.0%) | 0 (0.0%) |
| 45 to 54 Years | 51 (100.0%) | 0 (0.0%) |
| 55 to 59 Years | 32 (100.0%) | 0 (0.0%) |
| 60 to 64 Years | 231 (100.0%) | 0 (0.0%) |
| 65 to 74 Years | 0 (0.0%) | 0 (0.0%) |
| 75 Years and over | 0 (0.0%) | 0 (0.0%) |
| Total | 1,078 (96.3%) | 37 (3.4%) |
Employment Status by Educational Attainment in Westwood
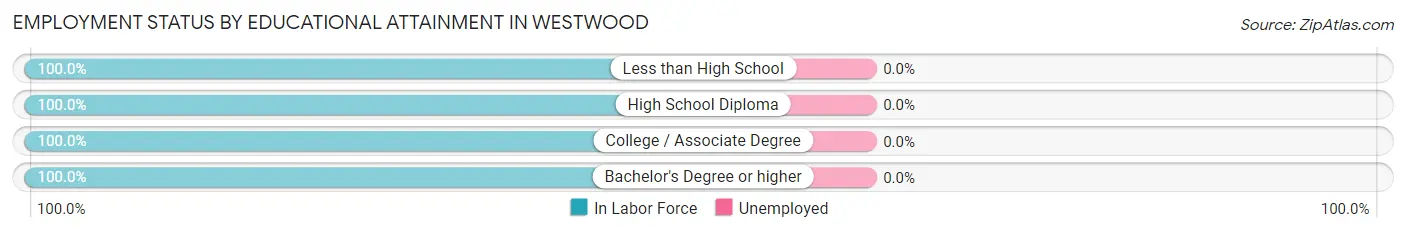
| Educational Attainment | In Labor Force | Unemployed |
| Less than High School | 19 (100.0%) | 0 (0.0%) |
| High School Diploma | 159 (100.0%) | 0 (0.0%) |
| College / Associate Degree | 560 (100.0%) | 0 (0.0%) |
| Bachelor's Degree or higher | 280 (100.0%) | 0 (0.0%) |
| Total | 1,018 (100.0%) | 0 (0.0%) |
Employment Occupations by Sex in Westwood
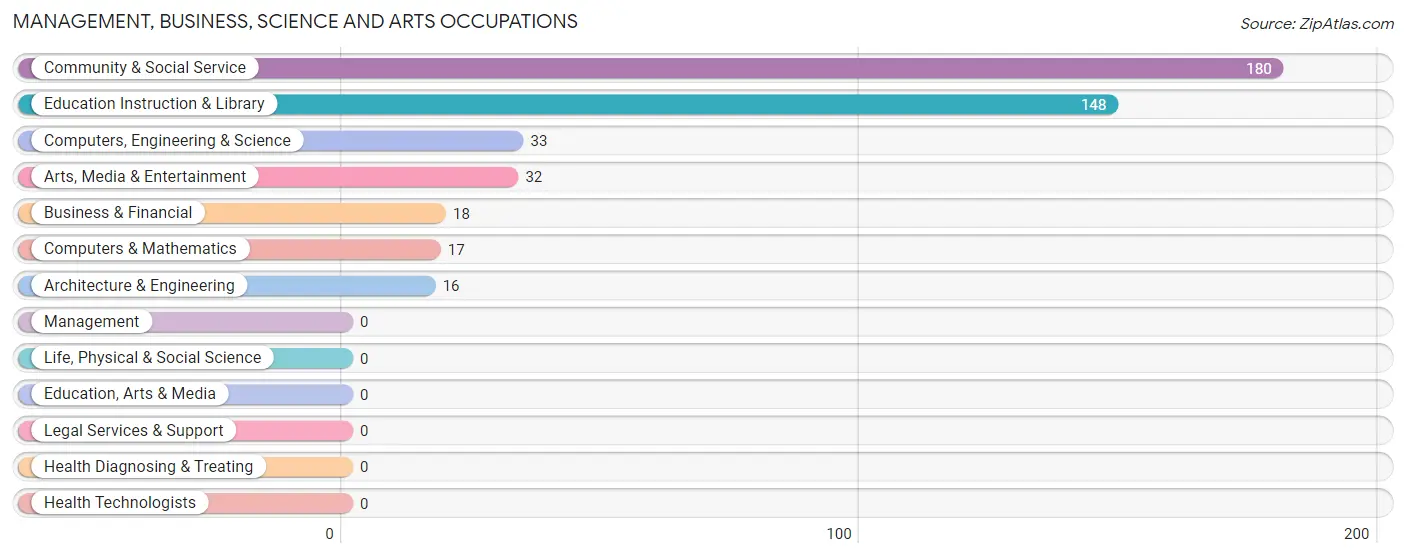
Management, Business, Science and Arts Occupations
The most common Management, Business, Science and Arts occupations in Westwood are Community & Social Service (180 | 17.3%), Education Instruction & Library (148 | 14.2%), Computers, Engineering & Science (33 | 3.2%), Arts, Media & Entertainment (32 | 3.1%), and Business & Financial (18 | 1.7%).
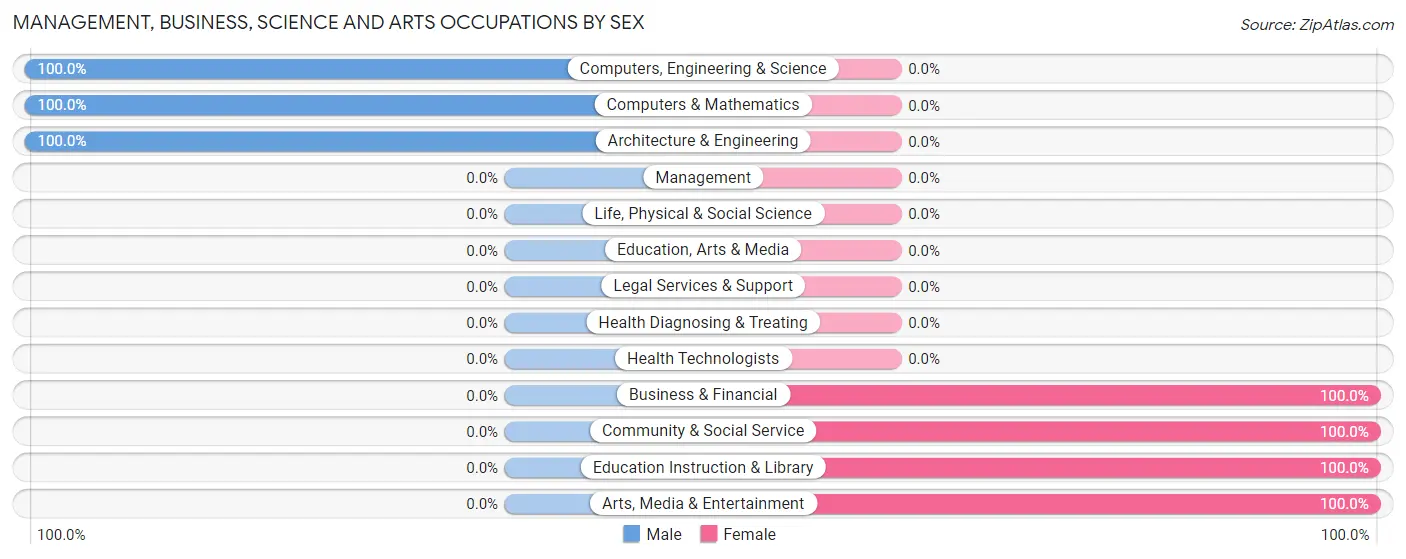
Management, Business, Science and Arts Occupations by Sex
Within the Management, Business, Science and Arts occupations in Westwood, the most male-oriented occupations are Computers, Engineering & Science (100.0%), Computers & Mathematics (100.0%), and Architecture & Engineering (100.0%), while the most female-oriented occupations are Business & Financial (100.0%), Community & Social Service (100.0%), and Education Instruction & Library (100.0%).
| Occupation | Male | Female |
| Management | 0 (0.0%) | 0 (0.0%) |
| Business & Financial | 0 (0.0%) | 18 (100.0%) |
| Computers, Engineering & Science | 33 (100.0%) | 0 (0.0%) |
| Computers & Mathematics | 17 (100.0%) | 0 (0.0%) |
| Architecture & Engineering | 16 (100.0%) | 0 (0.0%) |
| Life, Physical & Social Science | 0 (0.0%) | 0 (0.0%) |
| Community & Social Service | 0 (0.0%) | 180 (100.0%) |
| Education, Arts & Media | 0 (0.0%) | 0 (0.0%) |
| Legal Services & Support | 0 (0.0%) | 0 (0.0%) |
| Education Instruction & Library | 0 (0.0%) | 148 (100.0%) |
| Arts, Media & Entertainment | 0 (0.0%) | 32 (100.0%) |
| Health Diagnosing & Treating | 0 (0.0%) | 0 (0.0%) |
| Health Technologists | 0 (0.0%) | 0 (0.0%) |
| Total (Category) | 33 (14.3%) | 198 (85.7%) |
| Total (Overall) | 344 (33.1%) | 697 (66.9%) |
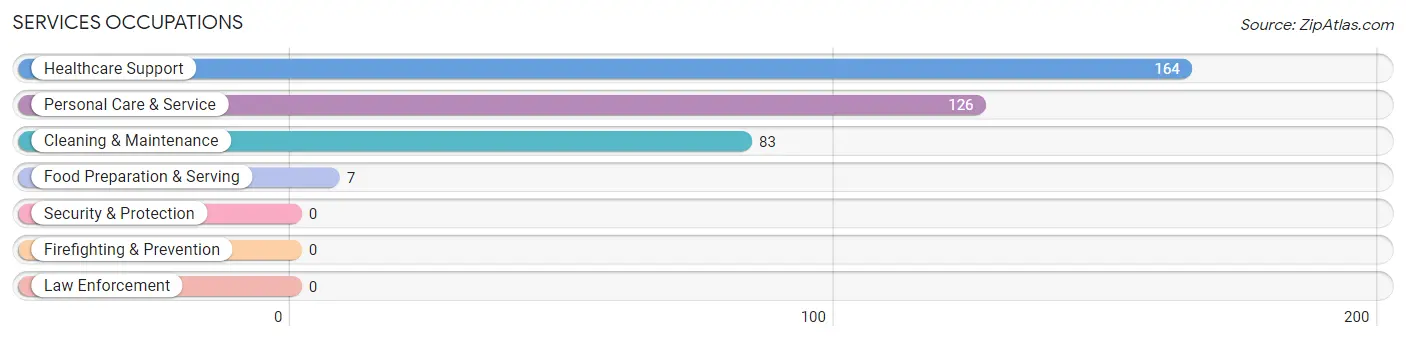
Services Occupations
The most common Services occupations in Westwood are Healthcare Support (164 | 15.8%), Personal Care & Service (126 | 12.1%), Cleaning & Maintenance (83 | 8.0%), and Food Preparation & Serving (7 | 0.7%).
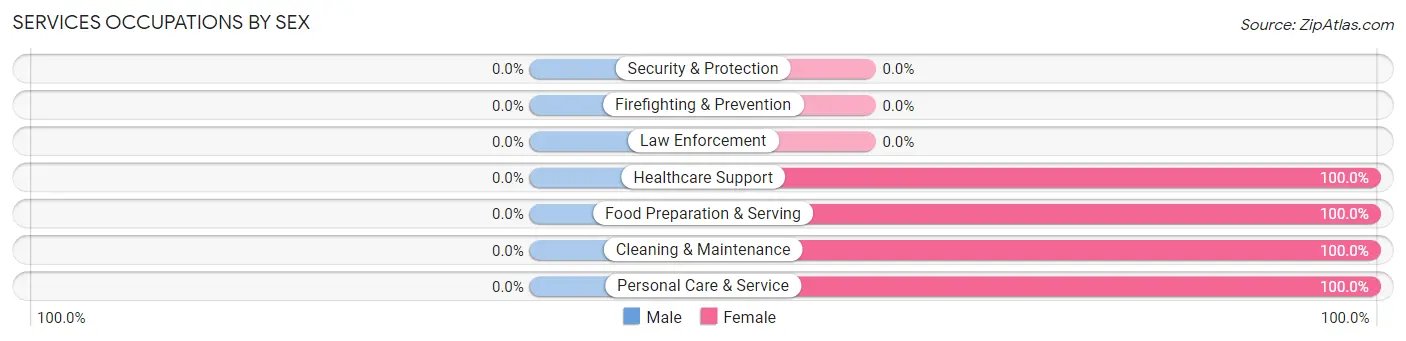
Services Occupations by Sex
| Occupation | Male | Female |
| Healthcare Support | 0 (0.0%) | 164 (100.0%) |
| Security & Protection | 0 (0.0%) | 0 (0.0%) |
| Firefighting & Prevention | 0 (0.0%) | 0 (0.0%) |
| Law Enforcement | 0 (0.0%) | 0 (0.0%) |
| Food Preparation & Serving | 0 (0.0%) | 7 (100.0%) |
| Cleaning & Maintenance | 0 (0.0%) | 83 (100.0%) |
| Personal Care & Service | 0 (0.0%) | 126 (100.0%) |
| Total (Category) | 0 (0.0%) | 380 (100.0%) |
| Total (Overall) | 344 (33.1%) | 697 (66.9%) |
Sales and Office Occupations
The most common Sales and Office occupations in Westwood are Office & Administration (167 | 16.0%), and Sales & Related (109 | 10.5%).
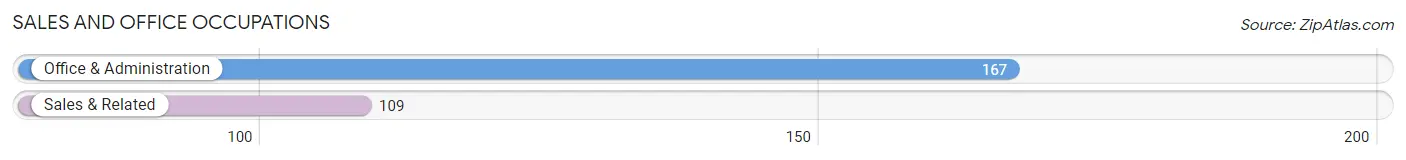
Sales and Office Occupations by Sex
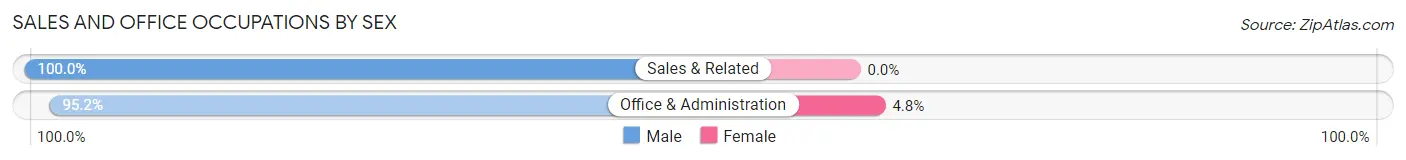
| Occupation | Male | Female |
| Sales & Related | 109 (100.0%) | 0 (0.0%) |
| Office & Administration | 159 (95.2%) | 8 (4.8%) |
| Total (Category) | 268 (97.1%) | 8 (2.9%) |
| Total (Overall) | 344 (33.1%) | 697 (66.9%) |
Natural Resources, Construction and Maintenance Occupations
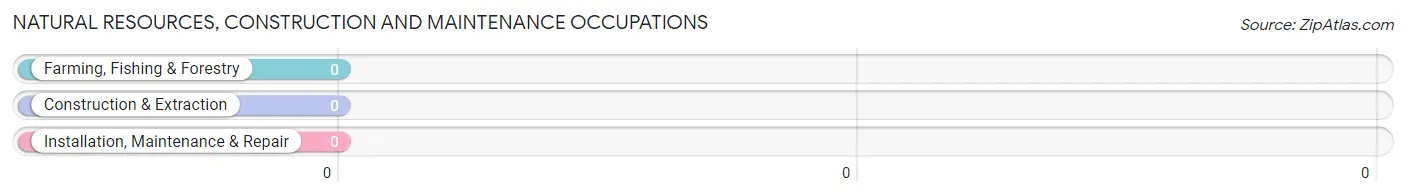
Natural Resources, Construction and Maintenance Occupations by Sex
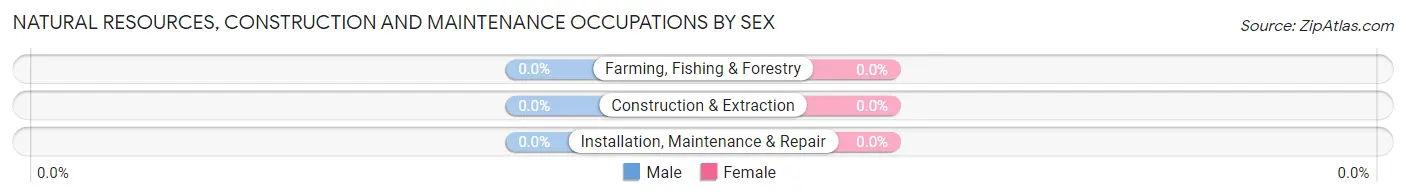
| Occupation | Male | Female |
| Farming, Fishing & Forestry | 0 (0.0%) | 0 (0.0%) |
| Construction & Extraction | 0 (0.0%) | 0 (0.0%) |
| Installation, Maintenance & Repair | 0 (0.0%) | 0 (0.0%) |
| Total (Category) | 0 (0.0%) | 0 (0.0%) |
| Total (Overall) | 344 (33.1%) | 697 (66.9%) |
Production, Transportation and Moving Occupations
The most common Production, Transportation and Moving occupations in Westwood are Transportation (103 | 9.9%), and Production (51 | 4.9%).
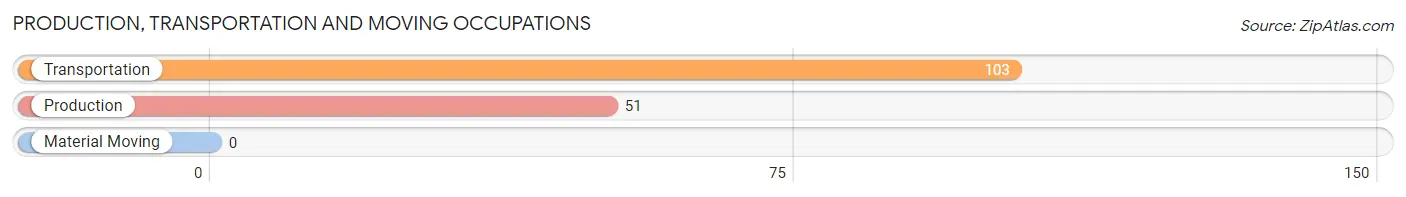
Production, Transportation and Moving Occupations by Sex
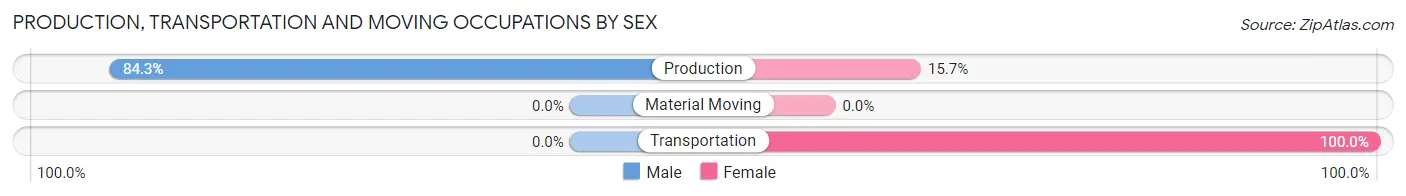
| Occupation | Male | Female |
| Production | 43 (84.3%) | 8 (15.7%) |
| Transportation | 0 (0.0%) | 103 (100.0%) |
| Material Moving | 0 (0.0%) | 0 (0.0%) |
| Total (Category) | 43 (27.9%) | 111 (72.1%) |
| Total (Overall) | 344 (33.1%) | 697 (66.9%) |
Employment Industries by Sex in Westwood
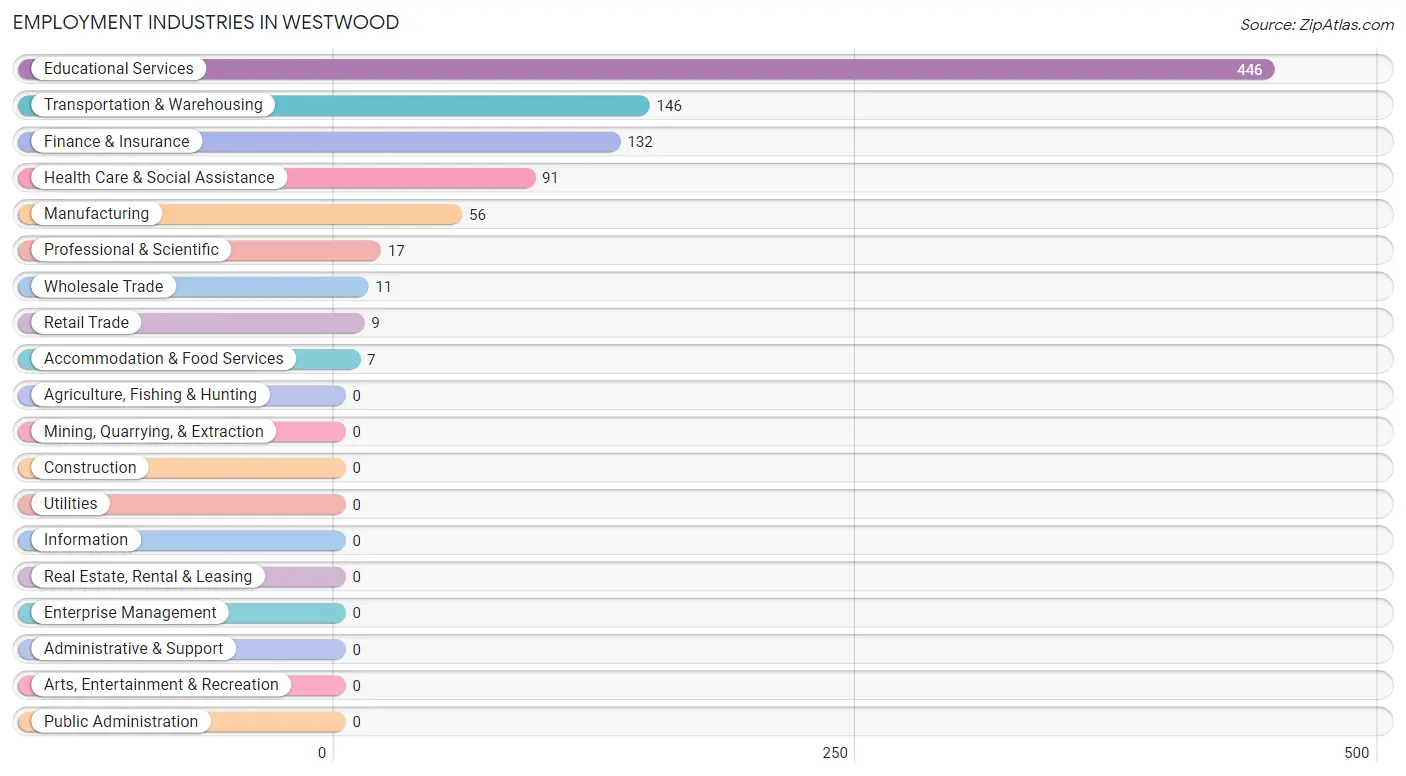
Employment Industries in Westwood
The major employment industries in Westwood include Educational Services (446 | 42.8%), Transportation & Warehousing (146 | 14.0%), Finance & Insurance (132 | 12.7%), Health Care & Social Assistance (91 | 8.7%), and Manufacturing (56 | 5.4%).
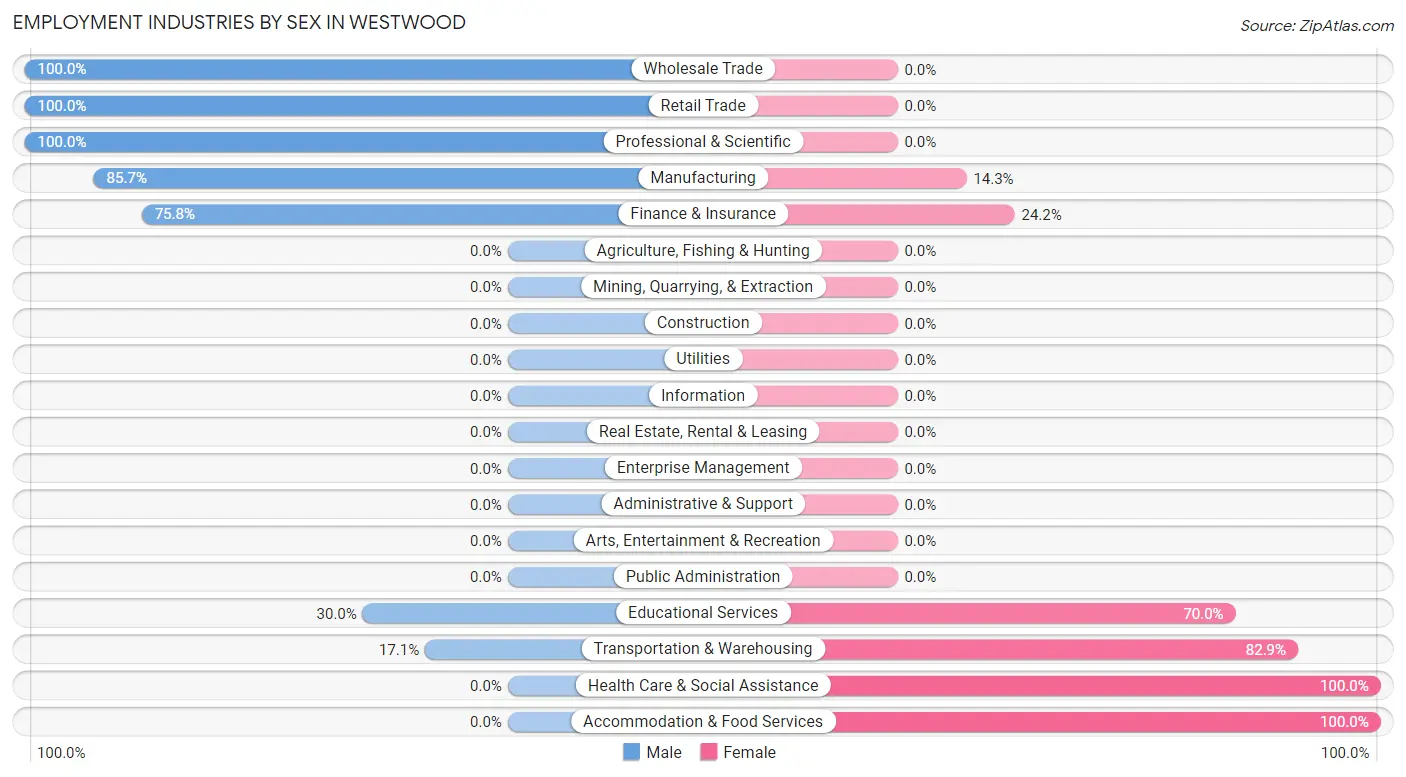
Employment Industries by Sex in Westwood
The Westwood industries that see more men than women are Wholesale Trade (100.0%), Retail Trade (100.0%), and Professional & Scientific (100.0%), whereas the industries that tend to have a higher number of women are Health Care & Social Assistance (100.0%), Accommodation & Food Services (100.0%), and Transportation & Warehousing (82.9%).
| Industry | Male | Female |
| Agriculture, Fishing & Hunting | 0 (0.0%) | 0 (0.0%) |
| Mining, Quarrying, & Extraction | 0 (0.0%) | 0 (0.0%) |
| Construction | 0 (0.0%) | 0 (0.0%) |
| Manufacturing | 48 (85.7%) | 8 (14.3%) |
| Wholesale Trade | 11 (100.0%) | 0 (0.0%) |
| Retail Trade | 9 (100.0%) | 0 (0.0%) |
| Transportation & Warehousing | 25 (17.1%) | 121 (82.9%) |
| Utilities | 0 (0.0%) | 0 (0.0%) |
| Information | 0 (0.0%) | 0 (0.0%) |
| Finance & Insurance | 100 (75.8%) | 32 (24.2%) |
| Real Estate, Rental & Leasing | 0 (0.0%) | 0 (0.0%) |
| Professional & Scientific | 17 (100.0%) | 0 (0.0%) |
| Enterprise Management | 0 (0.0%) | 0 (0.0%) |
| Administrative & Support | 0 (0.0%) | 0 (0.0%) |
| Educational Services | 134 (30.0%) | 312 (70.0%) |
| Health Care & Social Assistance | 0 (0.0%) | 91 (100.0%) |
| Arts, Entertainment & Recreation | 0 (0.0%) | 0 (0.0%) |
| Accommodation & Food Services | 0 (0.0%) | 7 (100.0%) |
| Public Administration | 0 (0.0%) | 0 (0.0%) |
| Total | 344 (33.1%) | 697 (66.9%) |
Education in Westwood
School Enrollment in Westwood
The most common levels of schooling among the 435 students in Westwood are middle school (209 | 48.0%), elementary school (120 | 27.6%), and high school (106 | 24.4%).

| School Level | # Students | % Students |
| Nursery / Preschool | 0 | 0.0% |
| Kindergarten | 0 | 0.0% |
| Elementary School | 120 | 27.6% |
| Middle School | 209 | 48.0% |
| High School | 106 | 24.4% |
| College / Undergraduate | 0 | 0.0% |
| Graduate / Professional | 0 | 0.0% |
| Total | 435 | 100.0% |
School Enrollment by Age by Funding Source in Westwood
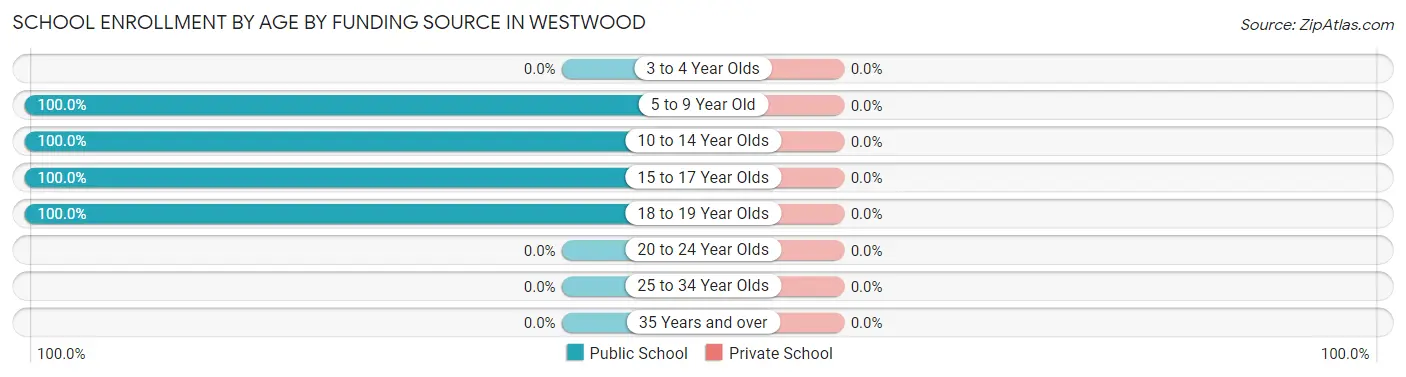
| Age Bracket | Public School | Private School |
| 3 to 4 Year Olds | 0 (0.0%) | 0 (0.0%) |
| 5 to 9 Year Old | 103 (100.0%) | 0 (0.0%) |
| 10 to 14 Year Olds | 226 (100.0%) | 0 (0.0%) |
| 15 to 17 Year Olds | 97 (100.0%) | 0 (0.0%) |
| 18 to 19 Year Olds | 9 (100.0%) | 0 (0.0%) |
| 20 to 24 Year Olds | 0 (0.0%) | 0 (0.0%) |
| 25 to 34 Year Olds | 0 (0.0%) | 0 (0.0%) |
| 35 Years and over | 0 (0.0%) | 0 (0.0%) |
| Total | 435 (100.0%) | 0 (0.0%) |
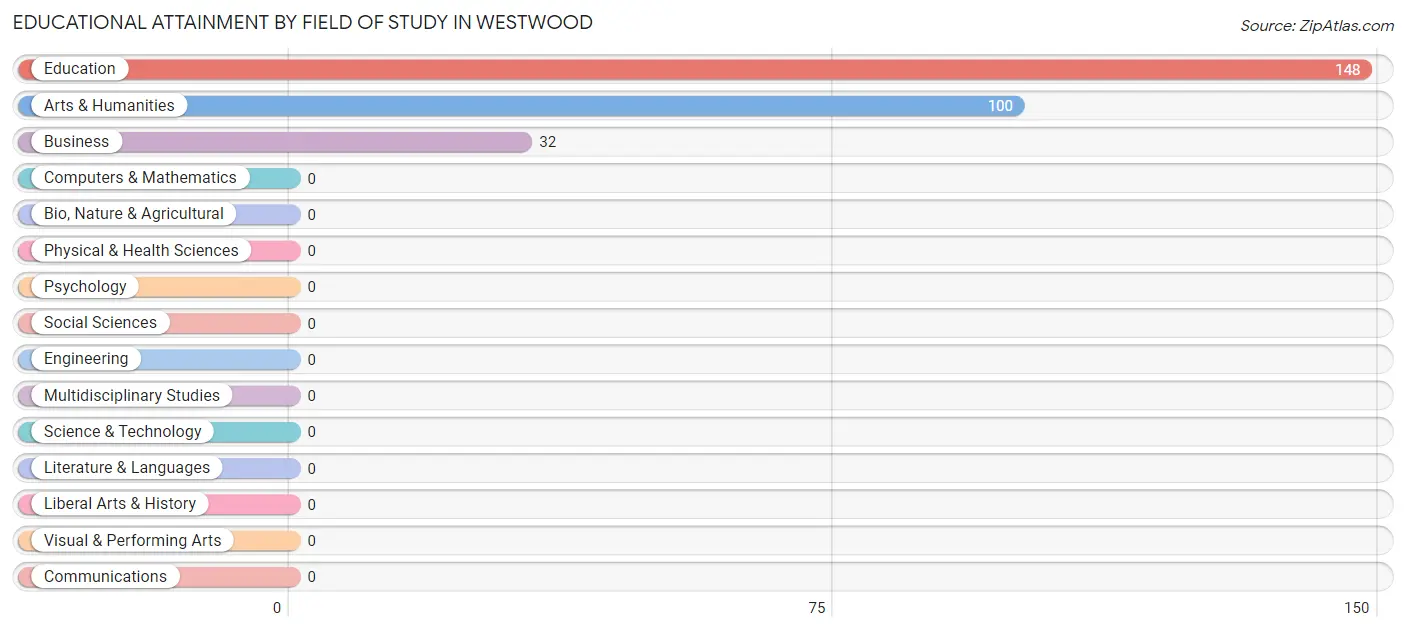
Educational Attainment by Field of Study in Westwood
Education (148 | 52.9%), arts & humanities (100 | 35.7%), and business (32 | 11.4%) are the most common fields of study among 280 individuals in Westwood who have obtained a bachelor's degree or higher.
| Field of Study | # Graduates | % Graduates |
| Computers & Mathematics | 0 | 0.0% |
| Bio, Nature & Agricultural | 0 | 0.0% |
| Physical & Health Sciences | 0 | 0.0% |
| Psychology | 0 | 0.0% |
| Social Sciences | 0 | 0.0% |
| Engineering | 0 | 0.0% |
| Multidisciplinary Studies | 0 | 0.0% |
| Science & Technology | 0 | 0.0% |
| Business | 32 | 11.4% |
| Education | 148 | 52.9% |
| Literature & Languages | 0 | 0.0% |
| Liberal Arts & History | 0 | 0.0% |
| Visual & Performing Arts | 0 | 0.0% |
| Communications | 0 | 0.0% |
| Arts & Humanities | 100 | 35.7% |
| Total | 280 | 100.0% |
Transportation & Commute in Westwood
Vehicle Availability by Sex in Westwood
The most prevalent vehicle ownership categories in Westwood are males with 3 vehicles (166, accounting for 48.3%) and females with 3 vehicles (289, making up 23.8%).
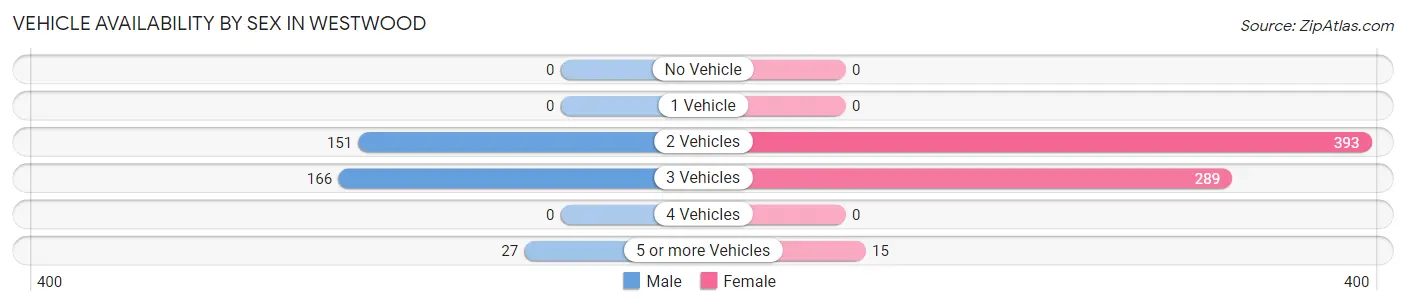
| Vehicles Available | Male | Female |
| No Vehicle | 0 (0.0%) | 0 (0.0%) |
| 1 Vehicle | 0 (0.0%) | 0 (0.0%) |
| 2 Vehicles | 151 (43.9%) | 393 (56.4%) |
| 3 Vehicles | 166 (48.3%) | 289 (41.5%) |
| 4 Vehicles | 0 (0.0%) | 0 (0.0%) |
| 5 or more Vehicles | 27 (7.9%) | 15 (2.1%) |
| Total | 344 (100.0%) | 697 (100.0%) |
Commute Time in Westwood
The most frequently occuring commute durations in Westwood are 30 to 34 minutes (496 commuters, 54.2%), 15 to 19 minutes (174 commuters, 19.0%), and 25 to 29 minutes (110 commuters, 12.0%).
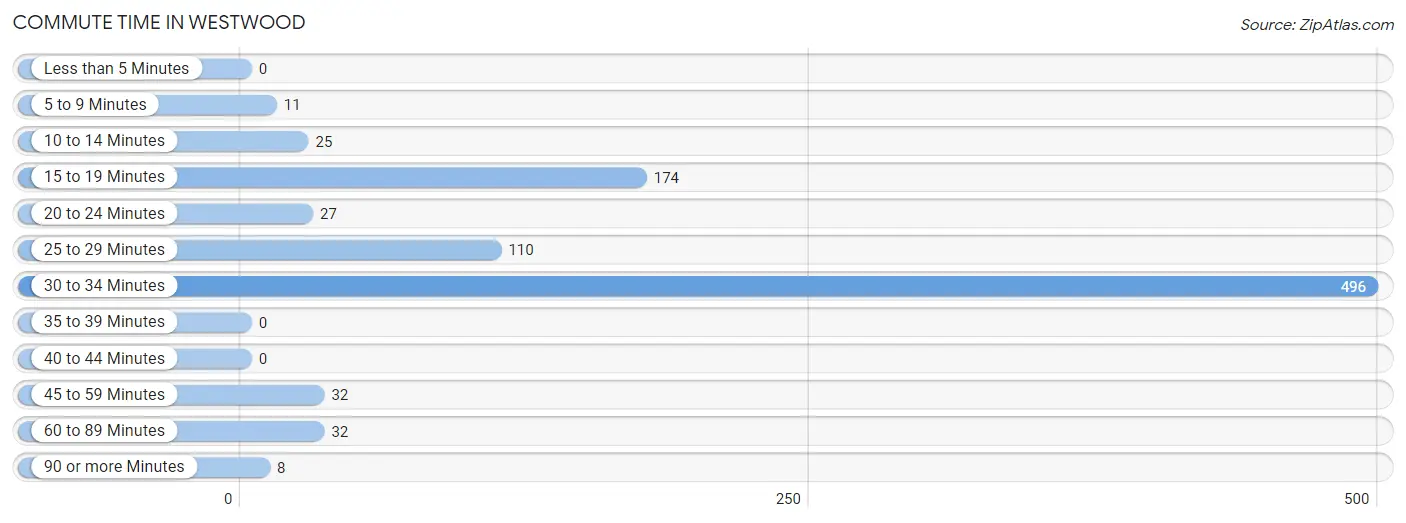
| Commute Time | # Commuters | % Commuters |
| Less than 5 Minutes | 0 | 0.0% |
| 5 to 9 Minutes | 11 | 1.2% |
| 10 to 14 Minutes | 25 | 2.7% |
| 15 to 19 Minutes | 174 | 19.0% |
| 20 to 24 Minutes | 27 | 2.9% |
| 25 to 29 Minutes | 110 | 12.0% |
| 30 to 34 Minutes | 496 | 54.2% |
| 35 to 39 Minutes | 0 | 0.0% |
| 40 to 44 Minutes | 0 | 0.0% |
| 45 to 59 Minutes | 32 | 3.5% |
| 60 to 89 Minutes | 32 | 3.5% |
| 90 or more Minutes | 8 | 0.9% |
Commute Time by Sex in Westwood
The most common commute times in Westwood are 30 to 34 minutes (241 commuters, 73.7%) for males and 30 to 34 minutes (255 commuters, 43.4%) for females.
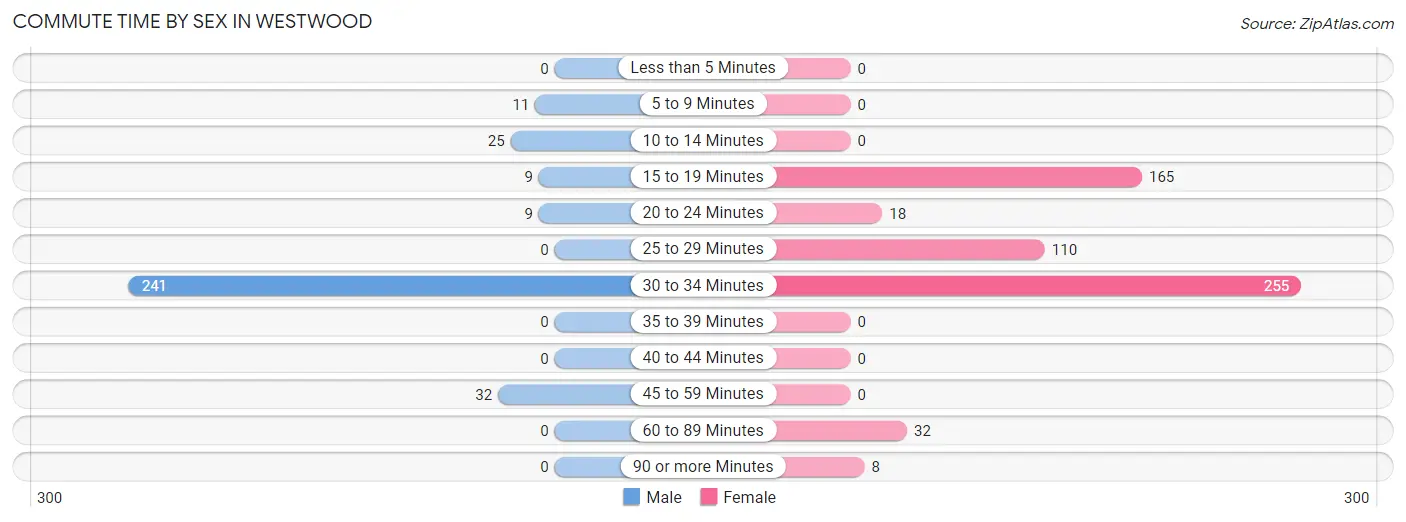
| Commute Time | Male | Female |
| Less than 5 Minutes | 0 (0.0%) | 0 (0.0%) |
| 5 to 9 Minutes | 11 (3.4%) | 0 (0.0%) |
| 10 to 14 Minutes | 25 (7.6%) | 0 (0.0%) |
| 15 to 19 Minutes | 9 (2.8%) | 165 (28.1%) |
| 20 to 24 Minutes | 9 (2.8%) | 18 (3.1%) |
| 25 to 29 Minutes | 0 (0.0%) | 110 (18.7%) |
| 30 to 34 Minutes | 241 (73.7%) | 255 (43.4%) |
| 35 to 39 Minutes | 0 (0.0%) | 0 (0.0%) |
| 40 to 44 Minutes | 0 (0.0%) | 0 (0.0%) |
| 45 to 59 Minutes | 32 (9.8%) | 0 (0.0%) |
| 60 to 89 Minutes | 0 (0.0%) | 32 (5.4%) |
| 90 or more Minutes | 0 (0.0%) | 8 (1.4%) |
Time of Departure to Work by Sex in Westwood
The most frequent times of departure to work in Westwood are 8:30 AM to 8:59 AM (234, 71.6%) for males and 5:30 AM to 5:59 AM (218, 37.1%) for females.
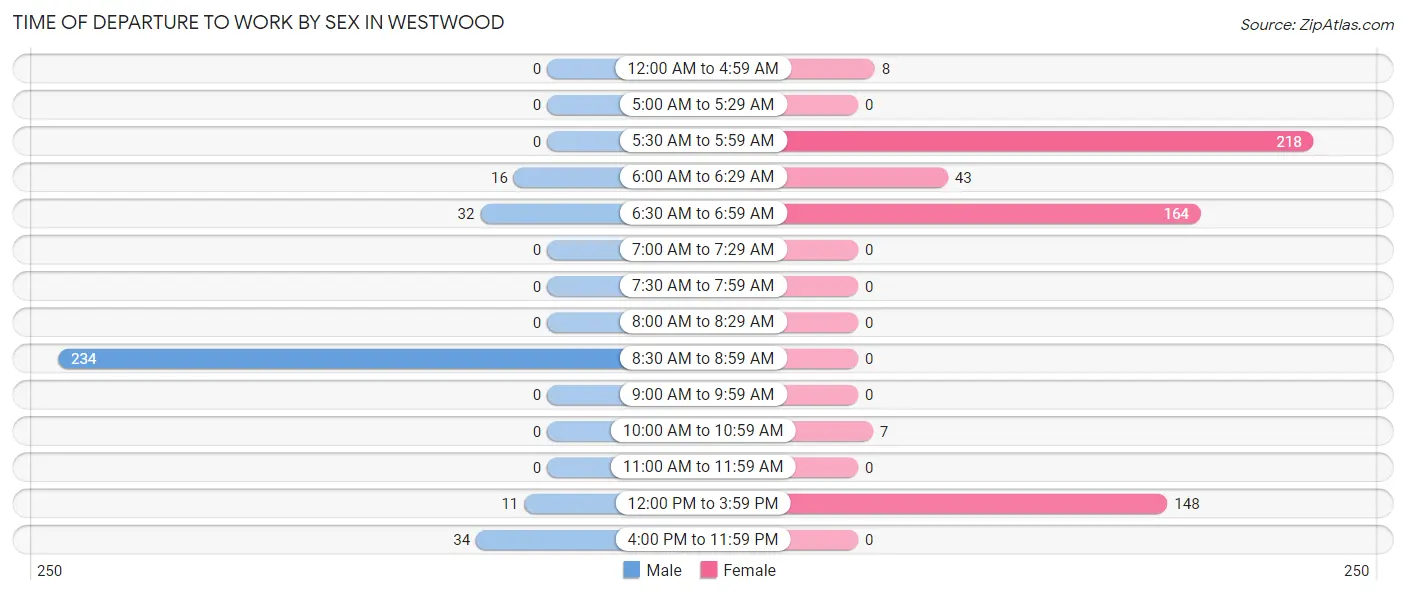
| Time of Departure | Male | Female |
| 12:00 AM to 4:59 AM | 0 (0.0%) | 8 (1.4%) |
| 5:00 AM to 5:29 AM | 0 (0.0%) | 0 (0.0%) |
| 5:30 AM to 5:59 AM | 0 (0.0%) | 218 (37.1%) |
| 6:00 AM to 6:29 AM | 16 (4.9%) | 43 (7.3%) |
| 6:30 AM to 6:59 AM | 32 (9.8%) | 164 (27.9%) |
| 7:00 AM to 7:29 AM | 0 (0.0%) | 0 (0.0%) |
| 7:30 AM to 7:59 AM | 0 (0.0%) | 0 (0.0%) |
| 8:00 AM to 8:29 AM | 0 (0.0%) | 0 (0.0%) |
| 8:30 AM to 8:59 AM | 234 (71.6%) | 0 (0.0%) |
| 9:00 AM to 9:59 AM | 0 (0.0%) | 0 (0.0%) |
| 10:00 AM to 10:59 AM | 0 (0.0%) | 7 (1.2%) |
| 11:00 AM to 11:59 AM | 0 (0.0%) | 0 (0.0%) |
| 12:00 PM to 3:59 PM | 11 (3.4%) | 148 (25.2%) |
| 4:00 PM to 11:59 PM | 34 (10.4%) | 0 (0.0%) |
| Total | 327 (100.0%) | 588 (100.0%) |
Housing Occupancy in Westwood
Occupancy by Ownership in Westwood
Of the total 447 dwellings in Westwood, owner-occupied units account for 428 (95.8%), while renter-occupied units make up 19 (4.3%).
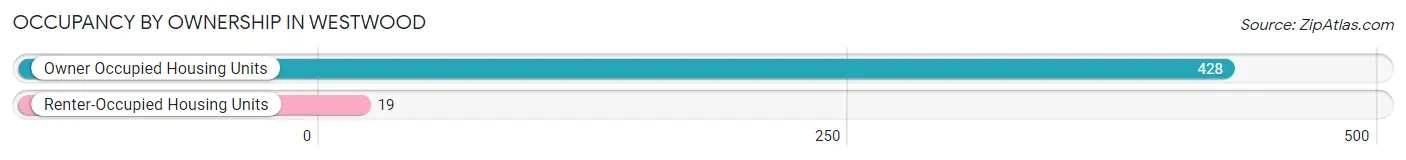
| Occupancy | # Housing Units | % Housing Units |
| Owner Occupied Housing Units | 428 | 95.8% |
| Renter-Occupied Housing Units | 19 | 4.3% |
| Total Occupied Housing Units | 447 | 100.0% |
Occupancy by Household Size in Westwood
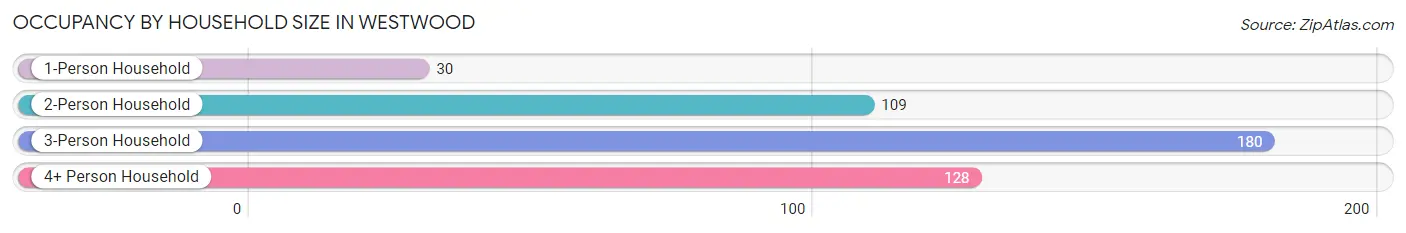
| Household Size | # Housing Units | % Housing Units |
| 1-Person Household | 30 | 6.7% |
| 2-Person Household | 109 | 24.4% |
| 3-Person Household | 180 | 40.3% |
| 4+ Person Household | 128 | 28.6% |
| Total Housing Units | 447 | 100.0% |
Occupancy by Ownership by Household Size in Westwood
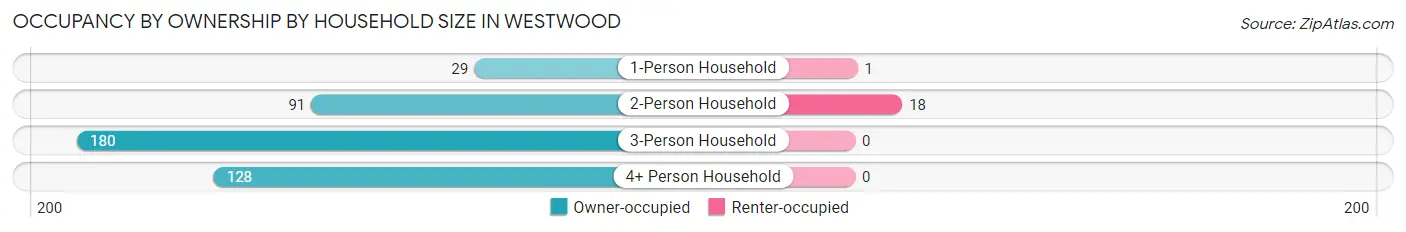
| Household Size | Owner-occupied | Renter-occupied |
| 1-Person Household | 29 (96.7%) | 1 (3.3%) |
| 2-Person Household | 91 (83.5%) | 18 (16.5%) |
| 3-Person Household | 180 (100.0%) | 0 (0.0%) |
| 4+ Person Household | 128 (100.0%) | 0 (0.0%) |
| Total Housing Units | 428 (95.8%) | 19 (4.3%) |
Occupancy by Educational Attainment in Westwood
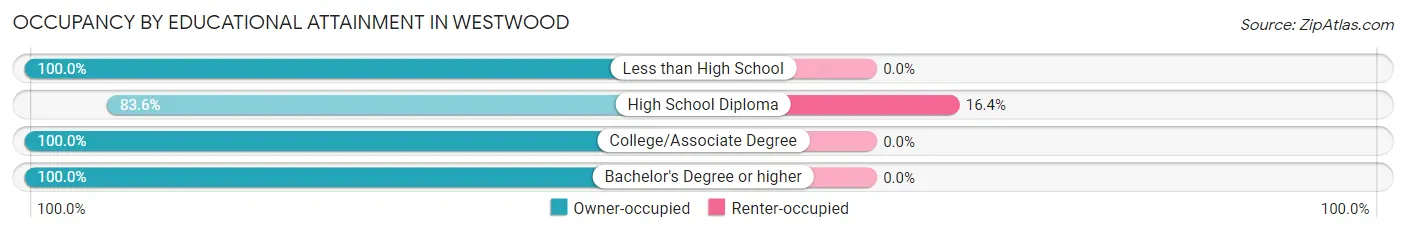
| Household Size | Owner-occupied | Renter-occupied |
| Less than High School | 11 (100.0%) | 0 (0.0%) |
| High School Diploma | 97 (83.6%) | 19 (16.4%) |
| College/Associate Degree | 40 (100.0%) | 0 (0.0%) |
| Bachelor's Degree or higher | 280 (100.0%) | 0 (0.0%) |
Occupancy by Age of Householder in Westwood
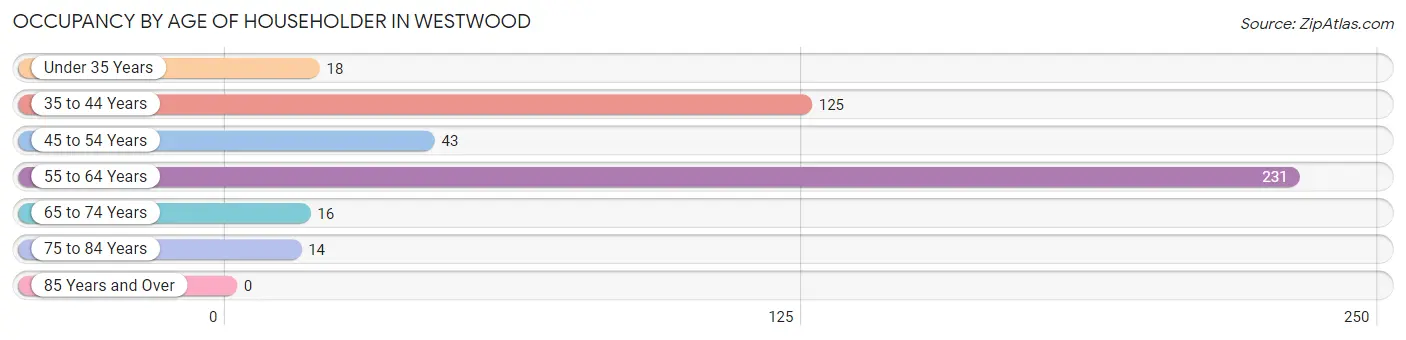
| Age Bracket | # Households | % Households |
| Under 35 Years | 18 | 4.0% |
| 35 to 44 Years | 125 | 28.0% |
| 45 to 54 Years | 43 | 9.6% |
| 55 to 64 Years | 231 | 51.7% |
| 65 to 74 Years | 16 | 3.6% |
| 75 to 84 Years | 14 | 3.1% |
| 85 Years and Over | 0 | 0.0% |
| Total | 447 | 100.0% |
Housing Finances in Westwood
Median Income by Occupancy in Westwood
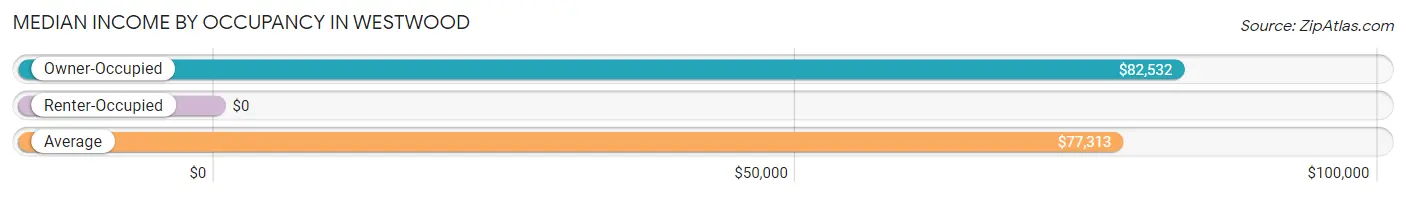
| Occupancy Type | # Households | Median Income |
| Owner-Occupied | 428 (95.8%) | $82,532 |
| Renter-Occupied | 19 (4.3%) | $0 |
| Average | 447 (100.0%) | $77,313 |
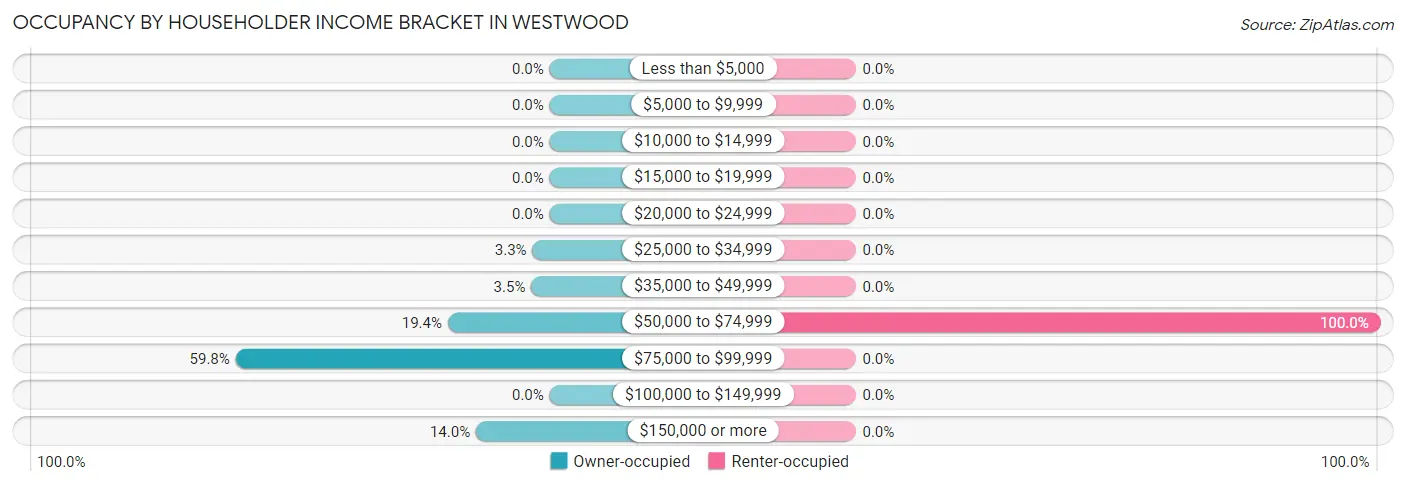
Occupancy by Householder Income Bracket in Westwood
| Income Bracket | Owner-occupied | Renter-occupied |
| Less than $5,000 | 0 (0.0%) | 0 (0.0%) |
| $5,000 to $9,999 | 0 (0.0%) | 0 (0.0%) |
| $10,000 to $14,999 | 0 (0.0%) | 0 (0.0%) |
| $15,000 to $19,999 | 0 (0.0%) | 0 (0.0%) |
| $20,000 to $24,999 | 0 (0.0%) | 0 (0.0%) |
| $25,000 to $34,999 | 14 (3.3%) | 0 (0.0%) |
| $35,000 to $49,999 | 15 (3.5%) | 0 (0.0%) |
| $50,000 to $74,999 | 83 (19.4%) | 19 (100.0%) |
| $75,000 to $99,999 | 256 (59.8%) | 0 (0.0%) |
| $100,000 to $149,999 | 0 (0.0%) | 0 (0.0%) |
| $150,000 or more | 60 (14.0%) | 0 (0.0%) |
| Total | 428 (100.0%) | 19 (100.0%) |
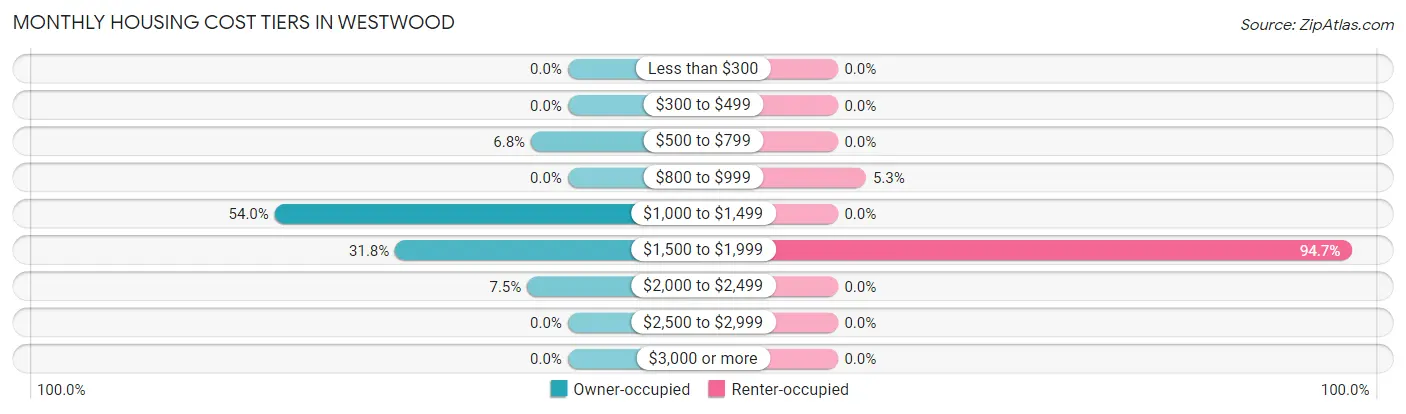
Monthly Housing Cost Tiers in Westwood
| Monthly Cost | Owner-occupied | Renter-occupied |
| Less than $300 | 0 (0.0%) | 0 (0.0%) |
| $300 to $499 | 0 (0.0%) | 0 (0.0%) |
| $500 to $799 | 29 (6.8%) | 0 (0.0%) |
| $800 to $999 | 0 (0.0%) | 1 (5.3%) |
| $1,000 to $1,499 | 231 (54.0%) | 0 (0.0%) |
| $1,500 to $1,999 | 136 (31.8%) | 18 (94.7%) |
| $2,000 to $2,499 | 32 (7.5%) | 0 (0.0%) |
| $2,500 to $2,999 | 0 (0.0%) | 0 (0.0%) |
| $3,000 or more | 0 (0.0%) | 0 (0.0%) |
| Total | 428 (100.0%) | 19 (100.0%) |
Physical Housing Characteristics in Westwood
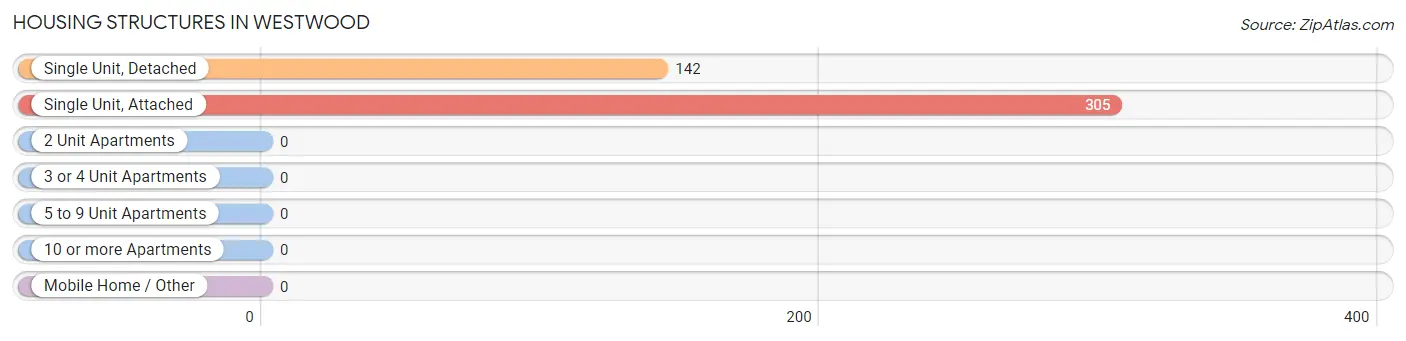
Housing Structures in Westwood
| Structure Type | # Housing Units | % Housing Units |
| Single Unit, Detached | 142 | 31.8% |
| Single Unit, Attached | 305 | 68.2% |
| 2 Unit Apartments | 0 | 0.0% |
| 3 or 4 Unit Apartments | 0 | 0.0% |
| 5 to 9 Unit Apartments | 0 | 0.0% |
| 10 or more Apartments | 0 | 0.0% |
| Mobile Home / Other | 0 | 0.0% |
| Total | 447 | 100.0% |
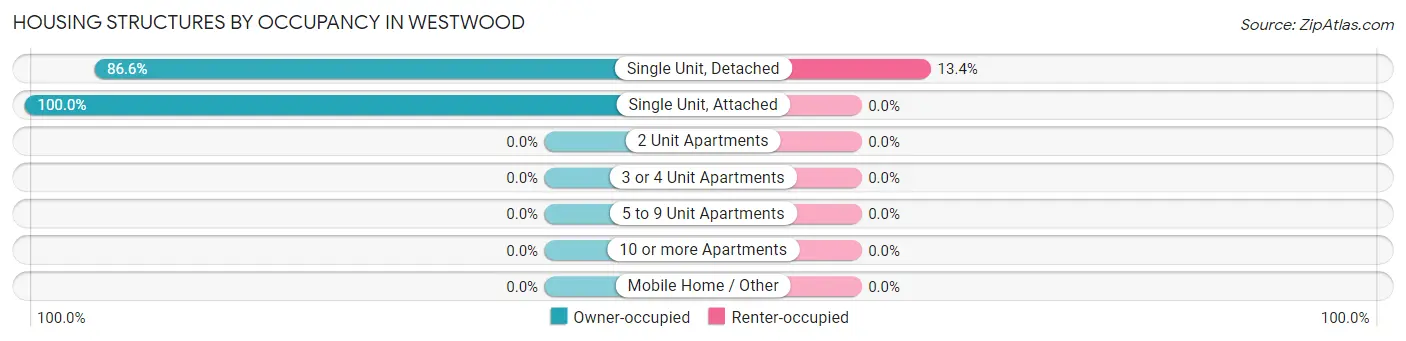
Housing Structures by Occupancy in Westwood
| Structure Type | Owner-occupied | Renter-occupied |
| Single Unit, Detached | 123 (86.6%) | 19 (13.4%) |
| Single Unit, Attached | 305 (100.0%) | 0 (0.0%) |
| 2 Unit Apartments | 0 (0.0%) | 0 (0.0%) |
| 3 or 4 Unit Apartments | 0 (0.0%) | 0 (0.0%) |
| 5 to 9 Unit Apartments | 0 (0.0%) | 0 (0.0%) |
| 10 or more Apartments | 0 (0.0%) | 0 (0.0%) |
| Mobile Home / Other | 0 (0.0%) | 0 (0.0%) |
| Total | 428 (95.8%) | 19 (4.3%) |
Housing Structures by Number of Rooms in Westwood
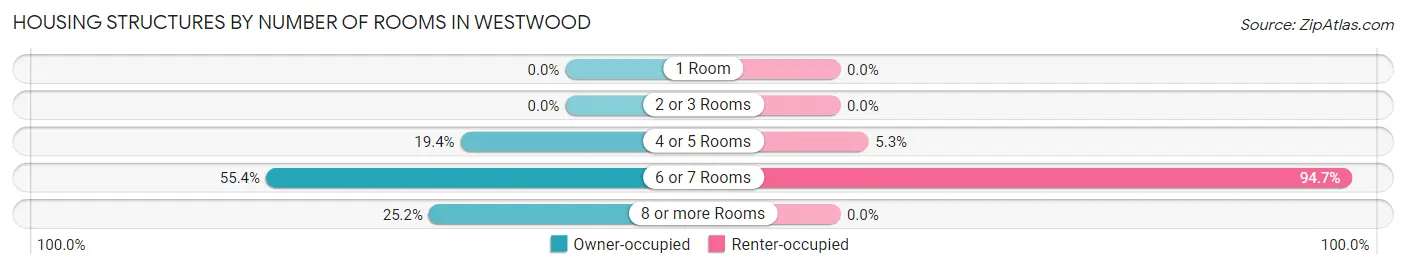
| Number of Rooms | Owner-occupied | Renter-occupied |
| 1 Room | 0 (0.0%) | 0 (0.0%) |
| 2 or 3 Rooms | 0 (0.0%) | 0 (0.0%) |
| 4 or 5 Rooms | 83 (19.4%) | 1 (5.3%) |
| 6 or 7 Rooms | 237 (55.4%) | 18 (94.7%) |
| 8 or more Rooms | 108 (25.2%) | 0 (0.0%) |
| Total | 428 (100.0%) | 19 (100.0%) |
Housing Structure by Heating Type in Westwood
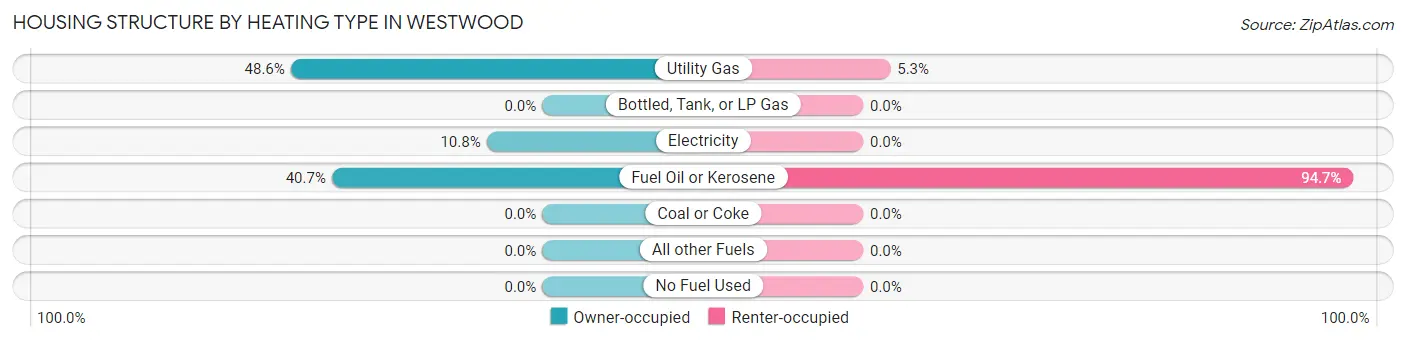
| Heating Type | Owner-occupied | Renter-occupied |
| Utility Gas | 208 (48.6%) | 1 (5.3%) |
| Bottled, Tank, or LP Gas | 0 (0.0%) | 0 (0.0%) |
| Electricity | 46 (10.7%) | 0 (0.0%) |
| Fuel Oil or Kerosene | 174 (40.6%) | 18 (94.7%) |
| Coal or Coke | 0 (0.0%) | 0 (0.0%) |
| All other Fuels | 0 (0.0%) | 0 (0.0%) |
| No Fuel Used | 0 (0.0%) | 0 (0.0%) |
| Total | 428 (100.0%) | 19 (100.0%) |
Household Vehicle Usage in Westwood
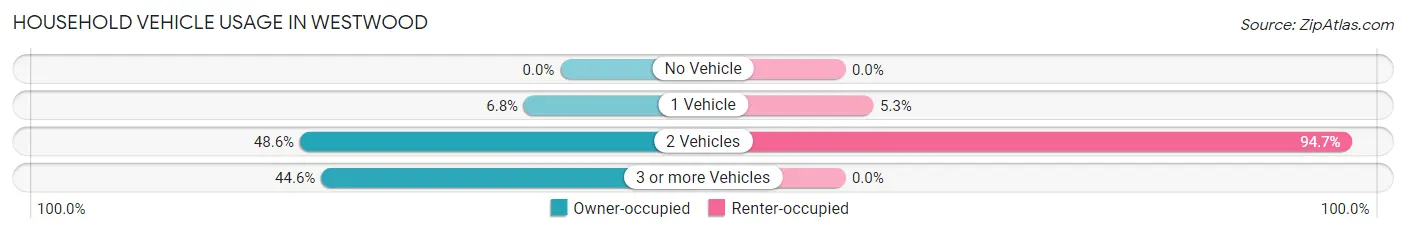
| Vehicles per Household | Owner-occupied | Renter-occupied |
| No Vehicle | 0 (0.0%) | 0 (0.0%) |
| 1 Vehicle | 29 (6.8%) | 1 (5.3%) |
| 2 Vehicles | 208 (48.6%) | 18 (94.7%) |
| 3 or more Vehicles | 191 (44.6%) | 0 (0.0%) |
| Total | 428 (100.0%) | 19 (100.0%) |
Real Estate & Mortgages in Westwood
Real Estate and Mortgage Overview in Westwood
| Characteristic | Without Mortgage | With Mortgage |
| Housing Units | 322 | 399 |
| Median Property Value | $85,600 | $115,500 |
| Median Household Income | $41,786 | $60 |
| Monthly Housing Costs | $387 | $0 |
| Real Estate Taxes | $941 | $117 |
Property Value by Mortgage Status in Westwood
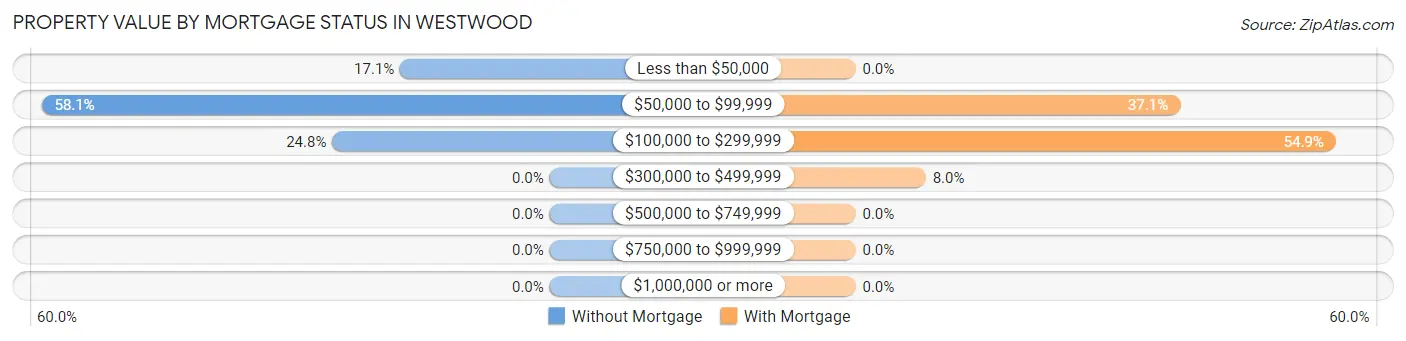
| Property Value | Without Mortgage | With Mortgage |
| Less than $50,000 | 55 (17.1%) | 0 (0.0%) |
| $50,000 to $99,999 | 187 (58.1%) | 148 (37.1%) |
| $100,000 to $299,999 | 80 (24.8%) | 219 (54.9%) |
| $300,000 to $499,999 | 0 (0.0%) | 32 (8.0%) |
| $500,000 to $749,999 | 0 (0.0%) | 0 (0.0%) |
| $750,000 to $999,999 | 0 (0.0%) | 0 (0.0%) |
| $1,000,000 or more | 0 (0.0%) | 0 (0.0%) |
| Total | 322 (100.0%) | 399 (100.0%) |
Household Income by Mortgage Status in Westwood
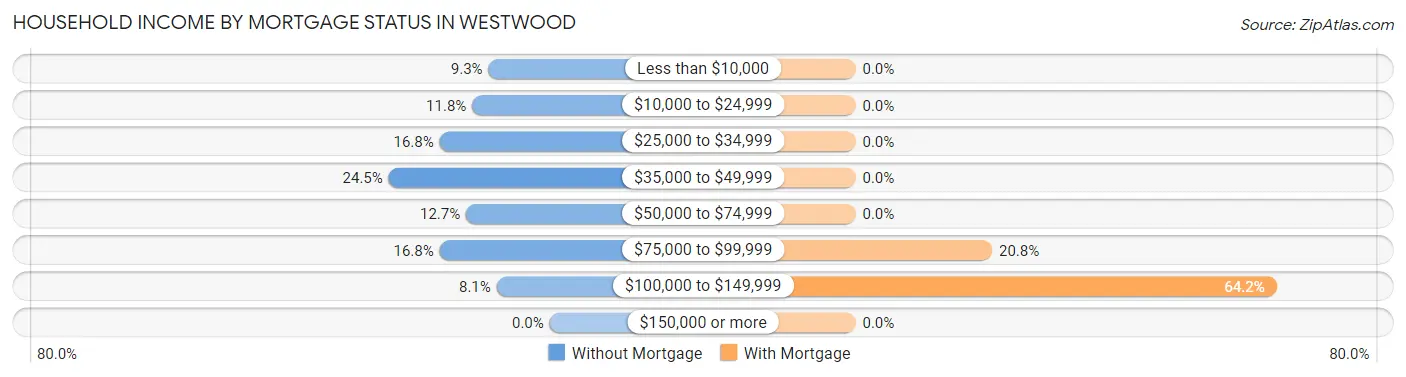
| Household Income | Without Mortgage | With Mortgage |
| Less than $10,000 | 30 (9.3%) | 0 (0.0%) |
| $10,000 to $24,999 | 38 (11.8%) | 0 (0.0%) |
| $25,000 to $34,999 | 54 (16.8%) | 0 (0.0%) |
| $35,000 to $49,999 | 79 (24.5%) | 0 (0.0%) |
| $50,000 to $74,999 | 41 (12.7%) | 0 (0.0%) |
| $75,000 to $99,999 | 54 (16.8%) | 83 (20.8%) |
| $100,000 to $149,999 | 26 (8.1%) | 256 (64.2%) |
| $150,000 or more | 0 (0.0%) | 0 (0.0%) |
| Total | 322 (100.0%) | 399 (100.0%) |
Property Value to Household Income Ratio in Westwood
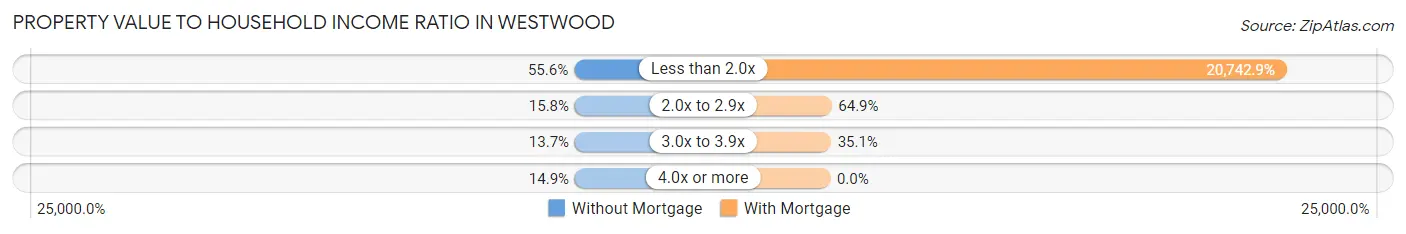
| Value-to-Income Ratio | Without Mortgage | With Mortgage |
| Less than 2.0x | 179 (55.6%) | 82,764 (20,742.9%) |
| 2.0x to 2.9x | 51 (15.8%) | 259 (64.9%) |
| 3.0x to 3.9x | 44 (13.7%) | 140 (35.1%) |
| 4.0x or more | 48 (14.9%) | 0 (0.0%) |
| Total | 322 (100.0%) | 399 (100.0%) |
Real Estate Taxes by Mortgage Status in Westwood
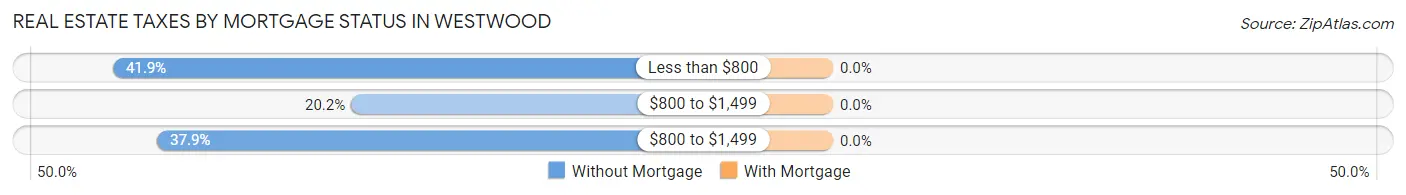
| Property Taxes | Without Mortgage | With Mortgage |
| Less than $800 | 135 (41.9%) | 0 (0.0%) |
| $800 to $1,499 | 65 (20.2%) | 0 (0.0%) |
| $800 to $1,499 | 122 (37.9%) | 0 (0.0%) |
| Total | 322 (100.0%) | 399 (100.0%) |
Health & Disability in Westwood
Health Insurance Coverage by Age in Westwood
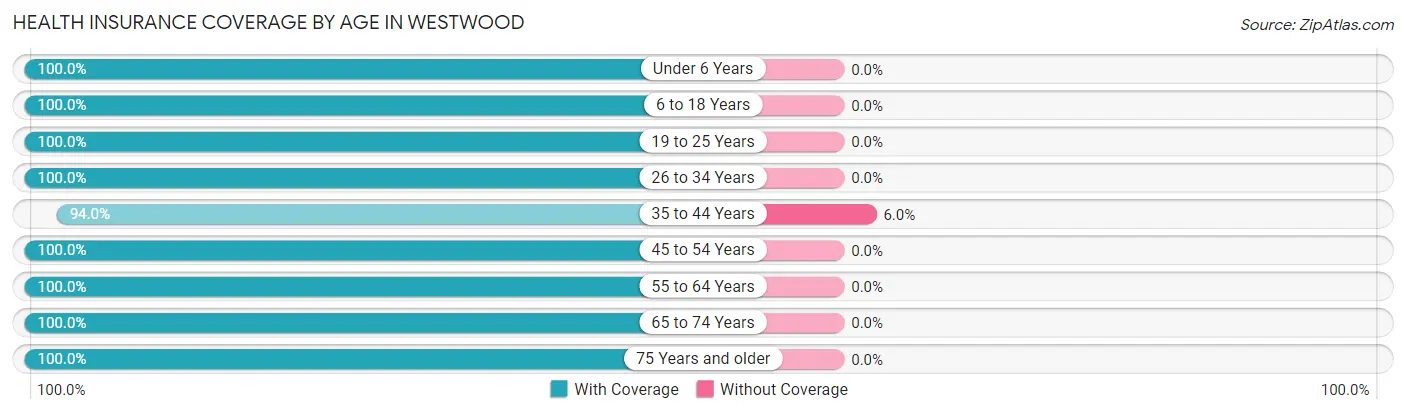
| Age Bracket | With Coverage | Without Coverage |
| Under 6 Years | 14 (100.0%) | 0 (0.0%) |
| 6 to 18 Years | 435 (100.0%) | 0 (0.0%) |
| 19 to 25 Years | 62 (100.0%) | 0 (0.0%) |
| 26 to 34 Years | 287 (100.0%) | 0 (0.0%) |
| 35 to 44 Years | 392 (94.0%) | 25 (6.0%) |
| 45 to 54 Years | 51 (100.0%) | 0 (0.0%) |
| 55 to 64 Years | 263 (100.0%) | 0 (0.0%) |
| 65 to 74 Years | 16 (100.0%) | 0 (0.0%) |
| 75 Years and older | 14 (100.0%) | 0 (0.0%) |
| Total | 1,534 (98.4%) | 25 (1.6%) |
Health Insurance Coverage by Citizenship Status in Westwood
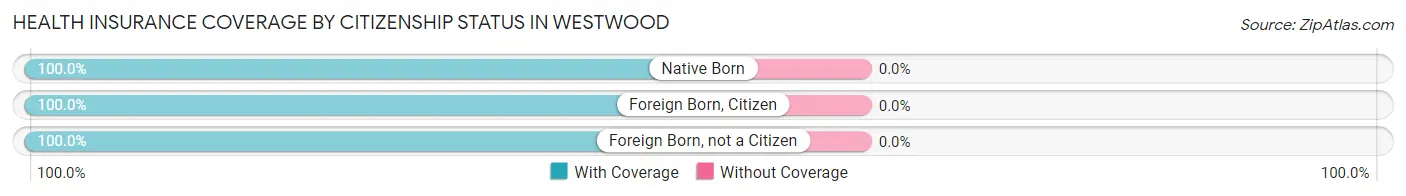
| Citizenship Status | With Coverage | Without Coverage |
| Native Born | 14 (100.0%) | 0 (0.0%) |
| Foreign Born, Citizen | 435 (100.0%) | 0 (0.0%) |
| Foreign Born, not a Citizen | 62 (100.0%) | 0 (0.0%) |
Health Insurance Coverage by Household Income in Westwood
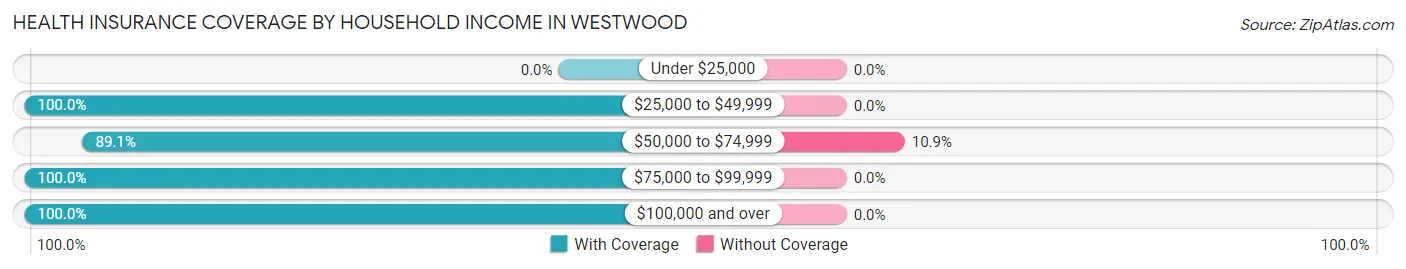
| Household Income | With Coverage | Without Coverage |
| Under $25,000 | 0 (0.0%) | 0 (0.0%) |
| $25,000 to $49,999 | 29 (100.0%) | 0 (0.0%) |
| $50,000 to $74,999 | 205 (89.1%) | 25 (10.9%) |
| $75,000 to $99,999 | 1,048 (100.0%) | 0 (0.0%) |
| $100,000 and over | 252 (100.0%) | 0 (0.0%) |
Public vs Private Health Insurance Coverage by Age in Westwood
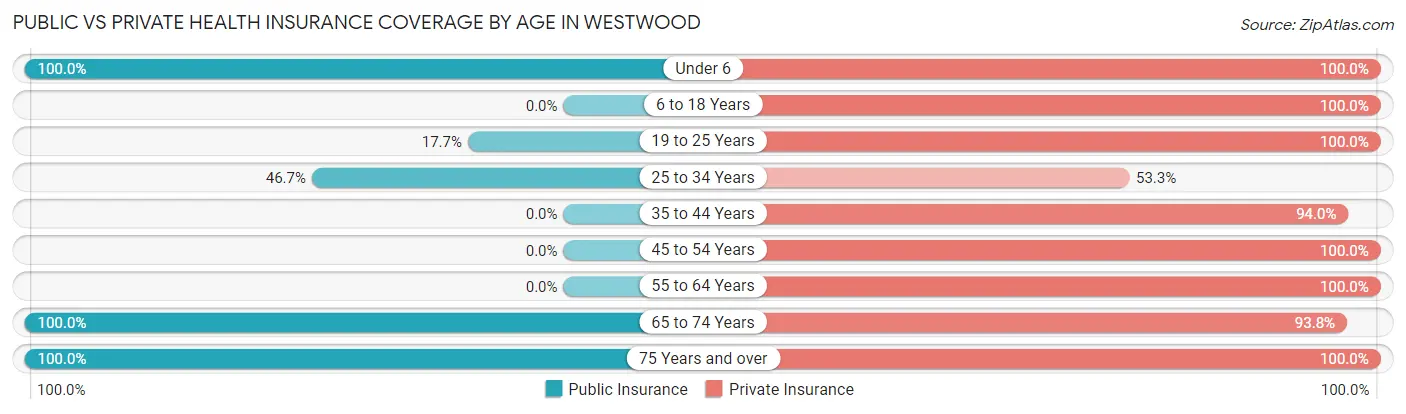
| Age Bracket | Public Insurance | Private Insurance |
| Under 6 | 14 (100.0%) | 14 (100.0%) |
| 6 to 18 Years | 0 (0.0%) | 435 (100.0%) |
| 19 to 25 Years | 11 (17.7%) | 62 (100.0%) |
| 25 to 34 Years | 134 (46.7%) | 153 (53.3%) |
| 35 to 44 Years | 0 (0.0%) | 392 (94.0%) |
| 45 to 54 Years | 0 (0.0%) | 51 (100.0%) |
| 55 to 64 Years | 0 (0.0%) | 263 (100.0%) |
| 65 to 74 Years | 16 (100.0%) | 15 (93.8%) |
| 75 Years and over | 14 (100.0%) | 14 (100.0%) |
| Total | 189 (12.1%) | 1,399 (89.7%) |
Disability Status by Sex by Age in Westwood
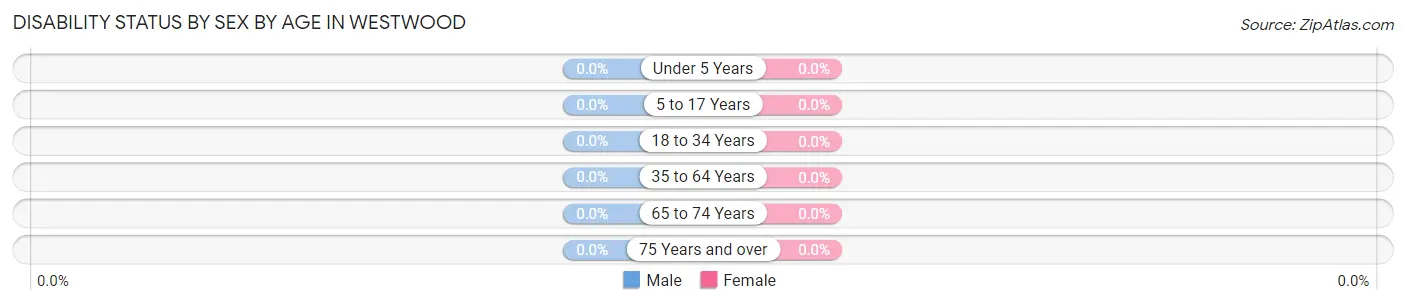
| Age Bracket | Male | Female |
| Under 5 Years | 0 (0.0%) | 0 (0.0%) |
| 5 to 17 Years | 0 (0.0%) | 0 (0.0%) |
| 18 to 34 Years | 0 (0.0%) | 0 (0.0%) |
| 35 to 64 Years | 0 (0.0%) | 0 (0.0%) |
| 65 to 74 Years | 0 (0.0%) | 0 (0.0%) |
| 75 Years and over | 0 (0.0%) | 0 (0.0%) |
Disability Class by Sex by Age in Westwood
Disability Class: Hearing Difficulty
| Age Bracket | Male | Female |
| Under 5 Years | 0 (0.0%) | 0 (0.0%) |
| 5 to 17 Years | 0 (0.0%) | 0 (0.0%) |
| 18 to 34 Years | 0 (0.0%) | 0 (0.0%) |
| 35 to 64 Years | 0 (0.0%) | 0 (0.0%) |
| 65 to 74 Years | 0 (0.0%) | 0 (0.0%) |
| 75 Years and over | 0 (0.0%) | 0 (0.0%) |
Disability Class: Vision Difficulty
| Age Bracket | Male | Female |
| Under 5 Years | 0 (0.0%) | 0 (0.0%) |
| 5 to 17 Years | 0 (0.0%) | 0 (0.0%) |
| 18 to 34 Years | 0 (0.0%) | 0 (0.0%) |
| 35 to 64 Years | 0 (0.0%) | 0 (0.0%) |
| 65 to 74 Years | 0 (0.0%) | 0 (0.0%) |
| 75 Years and over | 0 (0.0%) | 0 (0.0%) |
Disability Class: Cognitive Difficulty
| Age Bracket | Male | Female |
| 5 to 17 Years | 0 (0.0%) | 0 (0.0%) |
| 18 to 34 Years | 0 (0.0%) | 0 (0.0%) |
| 35 to 64 Years | 0 (0.0%) | 0 (0.0%) |
| 65 to 74 Years | 0 (0.0%) | 0 (0.0%) |
| 75 Years and over | 0 (0.0%) | 0 (0.0%) |
Disability Class: Ambulatory Difficulty
| Age Bracket | Male | Female |
| 5 to 17 Years | 0 (0.0%) | 0 (0.0%) |
| 18 to 34 Years | 0 (0.0%) | 0 (0.0%) |
| 35 to 64 Years | 0 (0.0%) | 0 (0.0%) |
| 65 to 74 Years | 0 (0.0%) | 0 (0.0%) |
| 75 Years and over | 0 (0.0%) | 0 (0.0%) |
Disability Class: Self-Care Difficulty

| Age Bracket | Male | Female |
| 5 to 17 Years | 0 (0.0%) | 0 (0.0%) |
| 18 to 34 Years | 0 (0.0%) | 0 (0.0%) |
| 35 to 64 Years | 0 (0.0%) | 0 (0.0%) |
| 65 to 74 Years | 0 (0.0%) | 0 (0.0%) |
| 75 Years and over | 0 (0.0%) | 0 (0.0%) |
Technology Access in Westwood
Computing Device Access in Westwood
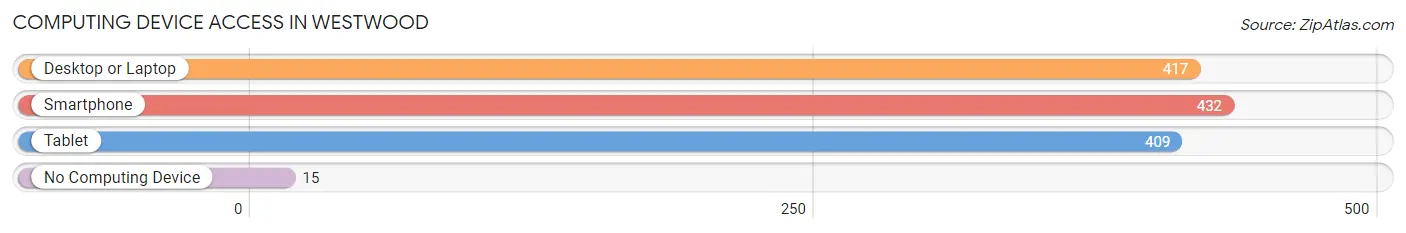
| Device Type | # Households | % Households |
| Desktop or Laptop | 417 | 93.3% |
| Smartphone | 432 | 96.6% |
| Tablet | 409 | 91.5% |
| No Computing Device | 15 | 3.4% |
| Total | 447 | 100.0% |
Internet Access in Westwood
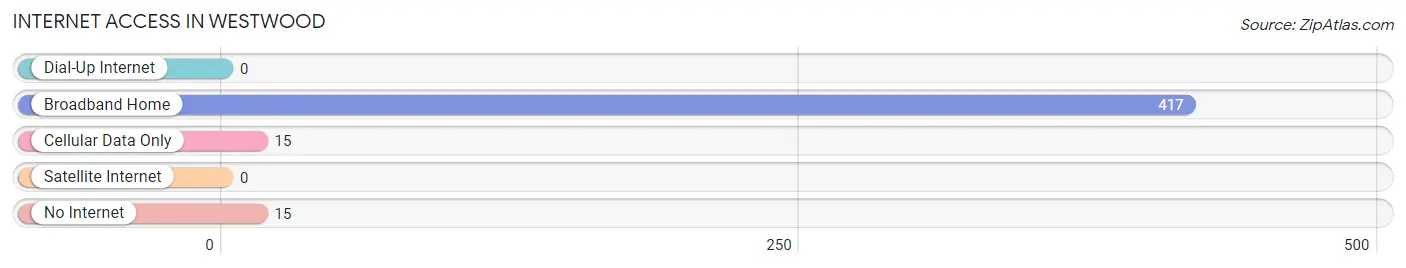
| Internet Type | # Households | % Households |
| Dial-Up Internet | 0 | 0.0% |
| Broadband Home | 417 | 93.3% |
| Cellular Data Only | 15 | 3.4% |
| Satellite Internet | 0 | 0.0% |
| No Internet | 15 | 3.4% |
| Total | 447 | 100.0% |
Westwood Summary
Westwood is a borough located in Allegheny County, Pennsylvania. It is a small community of approximately 1,500 people, located just outside of Pittsburgh. The borough was founded in 1876 and has a rich history of industry and culture.
Geography
Westwood is located in the southwestern corner of Allegheny County, Pennsylvania. It is bordered by the boroughs of Carnegie and Crafton to the north, and by the townships of Robinson and Scott to the east and south, respectively. The borough is situated on the banks of the Ohio River, and is approximately 10 miles from downtown Pittsburgh. The terrain of Westwood is mostly flat, with some rolling hills in the northern part of the borough.
Economy
Westwood’s economy is largely based on the service industry. The borough is home to a variety of small businesses, including restaurants, retail stores, and professional services. The borough also has a number of manufacturing and industrial businesses, including a steel mill and a paper mill. The borough is also home to a number of small farms, which produce a variety of fruits and vegetables.
Demographics
As of the 2010 census, Westwood had a population of 1,521 people. The racial makeup of the borough was 94.3% White, 2.2% African American, 0.2% Native American, 0.7% Asian, 0.1% Pacific Islander, and 2.5% from other races. The median household income in Westwood was $41,944, and the median family income was $50,938. The per capita income in Westwood was $20,845.
History
Westwood was founded in 1876 by a group of settlers from the nearby borough of Crafton. The settlers were looking for a place to build a new community, and chose the area along the Ohio River for its natural beauty and access to transportation. The borough was named after the nearby Westwood Hills, which were named after the Westwood family, who had settled in the area in the early 1800s.
The borough quickly grew, and by the early 1900s, Westwood was home to a variety of industries, including a steel mill, a paper mill, and a number of small businesses. The borough also had a thriving cultural scene, with a variety of churches, schools, and social clubs.
In the late 20th century, Westwood began to decline, as many of the industries that had once been the backbone of the borough’s economy began to close. The borough’s population also began to decline, as many of the residents moved away in search of better job opportunities.
Today, Westwood is a small, quiet borough, with a population of just over 1,500 people. The borough is still home to a number of small businesses, and is a popular destination for outdoor recreation, with a number of parks and trails located in the area.
Common Questions
What is Per Capita Income in Westwood?
Per Capita income in Westwood is $26,253.
What is the Median Family Income in Westwood?
Median Family Income in Westwood is $82,764.
What is the Median Household income in Westwood?
Median Household Income in Westwood is $77,313.
What is Income or Wage Gap in Westwood?
Income or Wage Gap in Westwood is 13.0%.
Women in Westwood earn 87.0 cents for every dollar earned by a man.
What is Inequality or Gini Index in Westwood?
Inequality or Gini Index in Westwood is 0.20.
What is the Total Population of Westwood?
Total Population of Westwood is 1,559.
What is the Total Male Population of Westwood?
Total Male Population of Westwood is 553.
What is the Total Female Population of Westwood?
Total Female Population of Westwood is 1,006.
What is the Ratio of Males per 100 Females in Westwood?
There are 54.97 Males per 100 Females in Westwood.
What is the Ratio of Females per 100 Males in Westwood?
There are 181.92 Females per 100 Males in Westwood.
What is the Median Population Age in Westwood?
Median Population Age in Westwood is 34.0 Years.
What is the Average Family Size in Westwood
Average Family Size in Westwood is 3.7 People.
What is the Average Household Size in Westwood
Average Household Size in Westwood is 3.5 People.
How Large is the Labor Force in Westwood?
There are 1,078 People in the Labor Forcein in Westwood.
What is the Percentage of People in the Labor Force in Westwood?
96.3% of People are in the Labor Force in Westwood.
What is the Unemployment Rate in Westwood?
Unemployment Rate in Westwood is 3.4%.