Boston, PA Map & Demographics
Boston Map
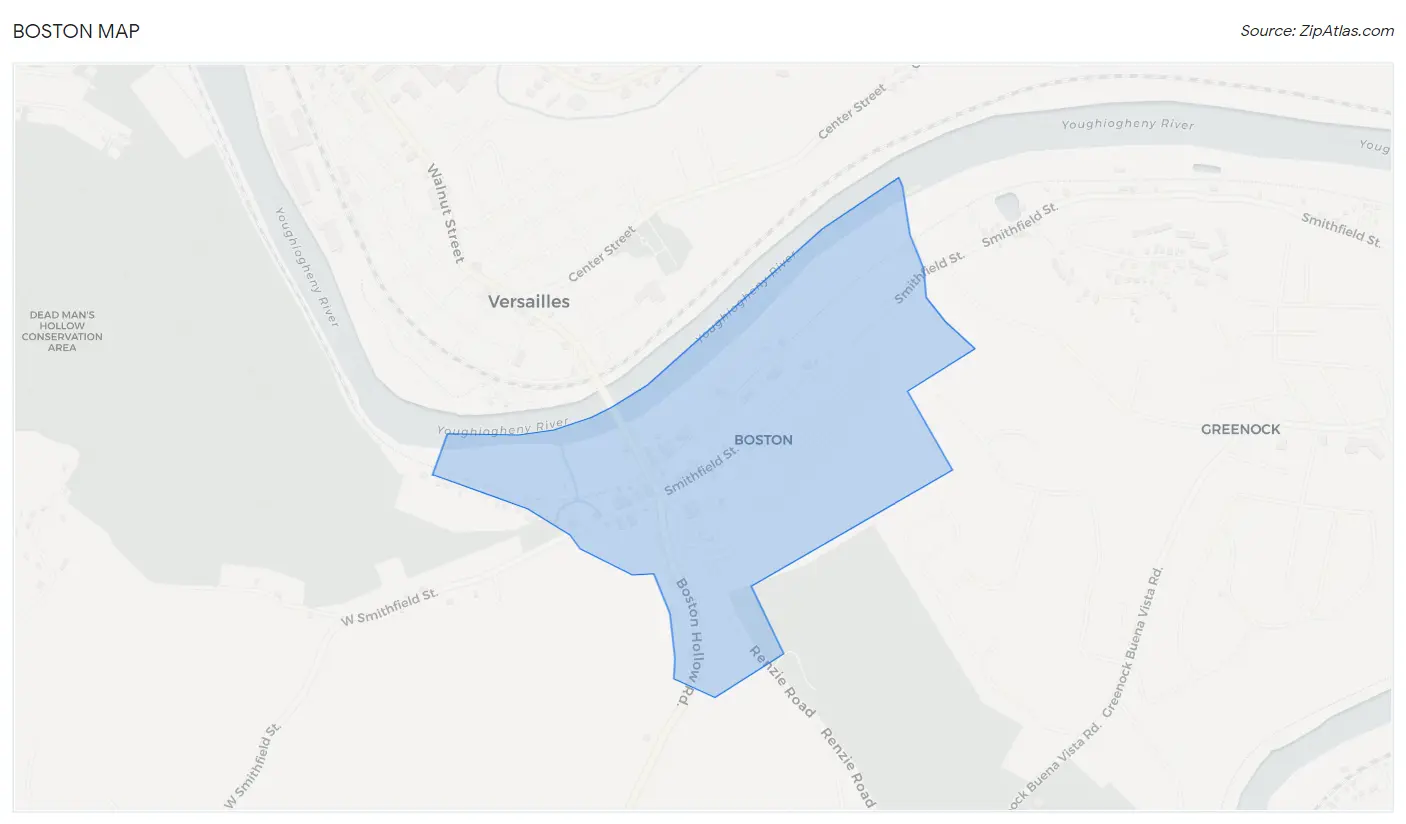
Boston Overview
$40,863
PER CAPITA INCOME
$61,719
AVG HOUSEHOLD INCOME
0.28
INEQUALITY / GINI INDEX
281
TOTAL POPULATION
188
MALE POPULATION
93
FEMALE POPULATION
202.15
MALES / 100 FEMALES
49.47
FEMALES / 100 MALES
58.5
MEDIAN AGE
2.4
AVG FAMILY SIZE
2.0
AVG HOUSEHOLD SIZE
105
LABOR FORCE [ PEOPLE ]
37.4%
PERCENT IN LABOR FORCE
Boston Area Codes
Income in Boston
Income Overview in Boston
| Characteristic | Number | Measure |
| Per Capita Income | 281 | $40,863 |
| Median Family Income | 103 | $0 |
| Mean Family Income | 103 | $87,045 |
| Median Household Income | 140 | $61,719 |
| Mean Household Income | 140 | $79,425 |
| Income Deficit | 103 | $0 |
| Wage / Income Gap (%) | 281 | 0.00% |
| Wage / Income Gap ($) | 281 | 100.00¢ per $1 |
| Gini / Inequality Index | 281 | 0.28 |
Earnings by Sex in Boston
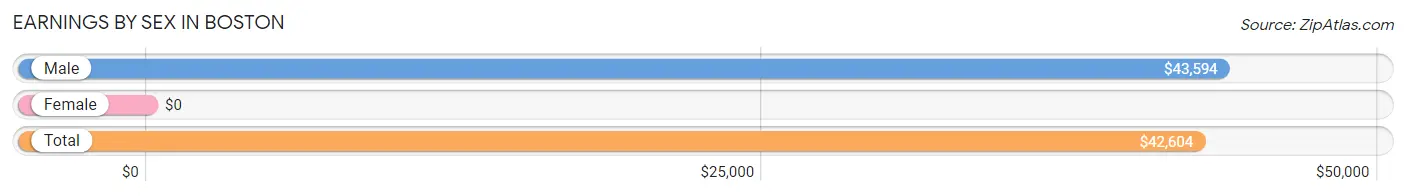
| Sex | Number | Average Earnings |
| Male | 92 (70.8%) | $43,594 |
| Female | 38 (29.2%) | $0 |
| Total | 130 (100.0%) | $42,604 |
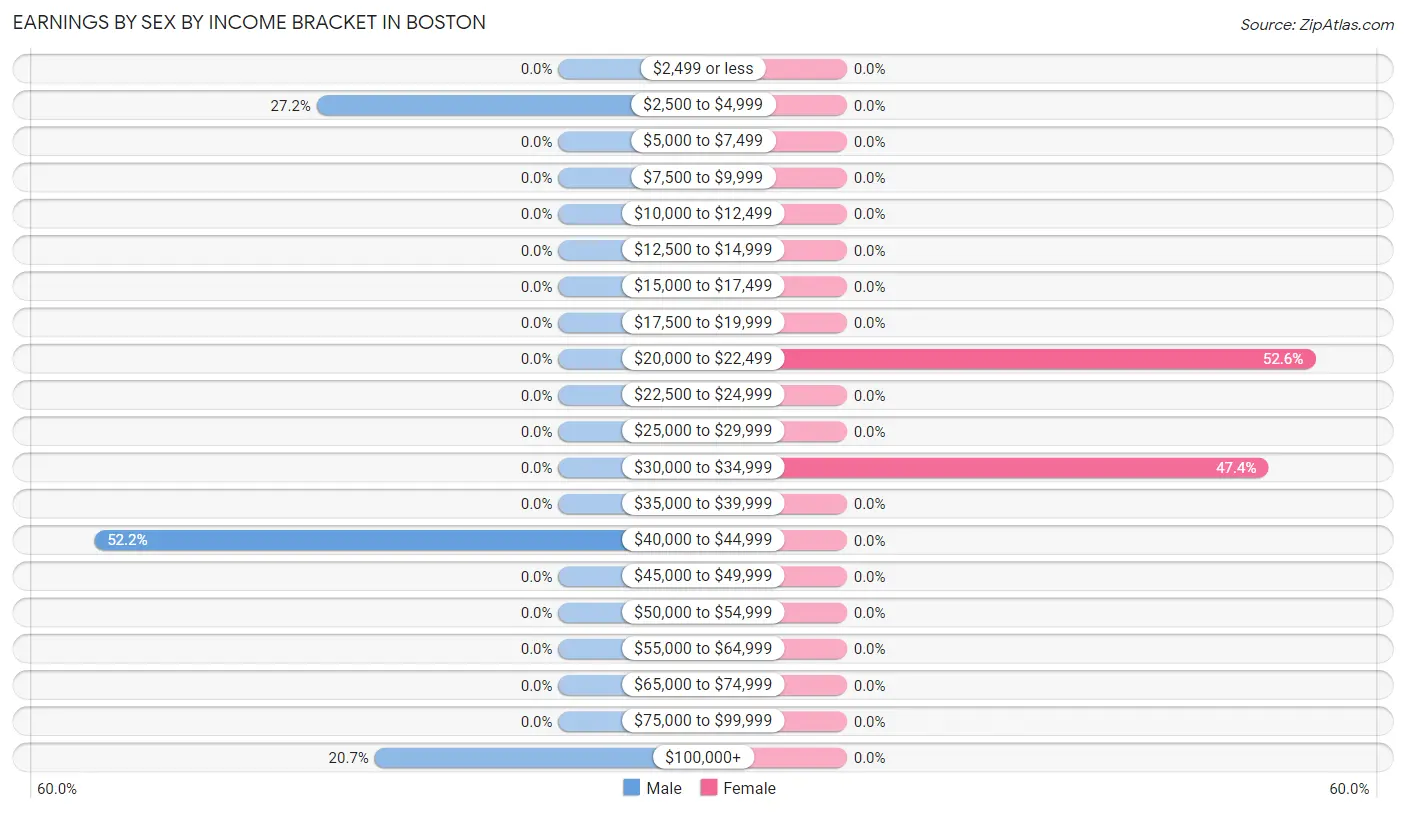
Earnings by Sex by Income Bracket in Boston
The most common earnings brackets in Boston are $40,000 to $44,999 for men (48 | 52.2%) and $20,000 to $22,499 for women (20 | 52.6%).
| Income | Male | Female |
| $2,499 or less | 0 (0.0%) | 0 (0.0%) |
| $2,500 to $4,999 | 25 (27.2%) | 0 (0.0%) |
| $5,000 to $7,499 | 0 (0.0%) | 0 (0.0%) |
| $7,500 to $9,999 | 0 (0.0%) | 0 (0.0%) |
| $10,000 to $12,499 | 0 (0.0%) | 0 (0.0%) |
| $12,500 to $14,999 | 0 (0.0%) | 0 (0.0%) |
| $15,000 to $17,499 | 0 (0.0%) | 0 (0.0%) |
| $17,500 to $19,999 | 0 (0.0%) | 0 (0.0%) |
| $20,000 to $22,499 | 0 (0.0%) | 20 (52.6%) |
| $22,500 to $24,999 | 0 (0.0%) | 0 (0.0%) |
| $25,000 to $29,999 | 0 (0.0%) | 0 (0.0%) |
| $30,000 to $34,999 | 0 (0.0%) | 18 (47.4%) |
| $35,000 to $39,999 | 0 (0.0%) | 0 (0.0%) |
| $40,000 to $44,999 | 48 (52.2%) | 0 (0.0%) |
| $45,000 to $49,999 | 0 (0.0%) | 0 (0.0%) |
| $50,000 to $54,999 | 0 (0.0%) | 0 (0.0%) |
| $55,000 to $64,999 | 0 (0.0%) | 0 (0.0%) |
| $65,000 to $74,999 | 0 (0.0%) | 0 (0.0%) |
| $75,000 to $99,999 | 0 (0.0%) | 0 (0.0%) |
| $100,000+ | 19 (20.6%) | 0 (0.0%) |
| Total | 92 (100.0%) | 38 (100.0%) |
Earnings by Sex by Educational Attainment in Boston
| Educational Attainment | Male Income | Female Income |
| Less than High School | - | - |
| High School Diploma | - | - |
| College or Associate's Degree | - | - |
| Bachelor's Degree | - | - |
| Graduate Degree | - | - |
| Total | - | - |
Family Income in Boston
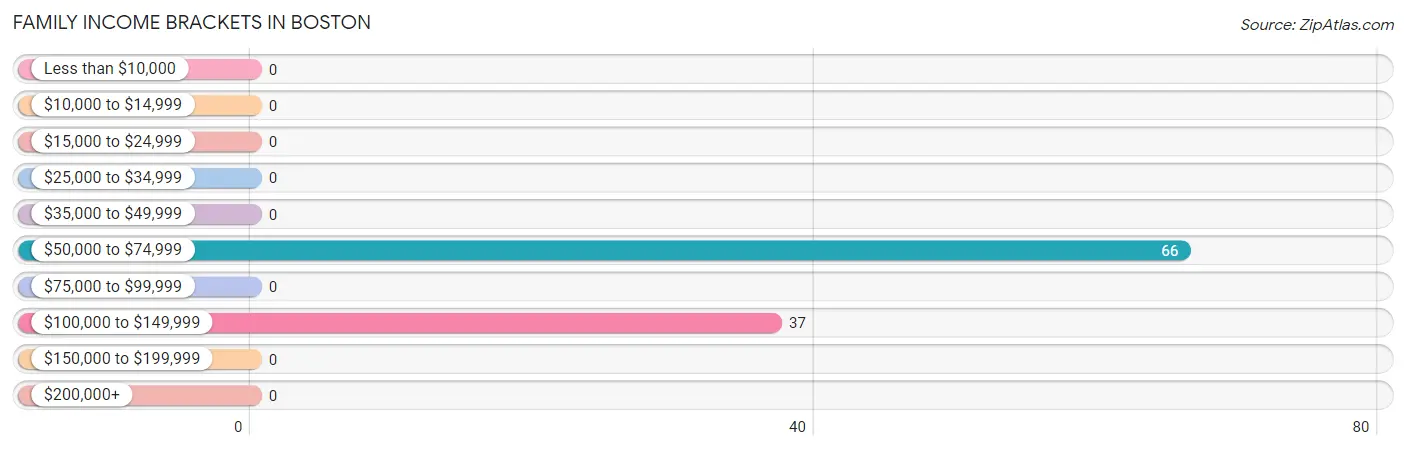
Family Income Brackets in Boston
According to the Boston family income data, there are 66 families falling into the $50,000 to $74,999 income range, which is the most common income bracket and makes up 64.1% of all families.
| Income Bracket | # Families | % Families |
| Less than $10,000 | 0 | 0.0% |
| $10,000 to $14,999 | 0 | 0.0% |
| $15,000 to $24,999 | 0 | 0.0% |
| $25,000 to $34,999 | 0 | 0.0% |
| $35,000 to $49,999 | 0 | 0.0% |
| $50,000 to $74,999 | 66 | 64.1% |
| $75,000 to $99,999 | 0 | 0.0% |
| $100,000 to $149,999 | 37 | 35.9% |
| $150,000 to $199,999 | 0 | 0.0% |
| $200,000+ | 0 | 0.0% |
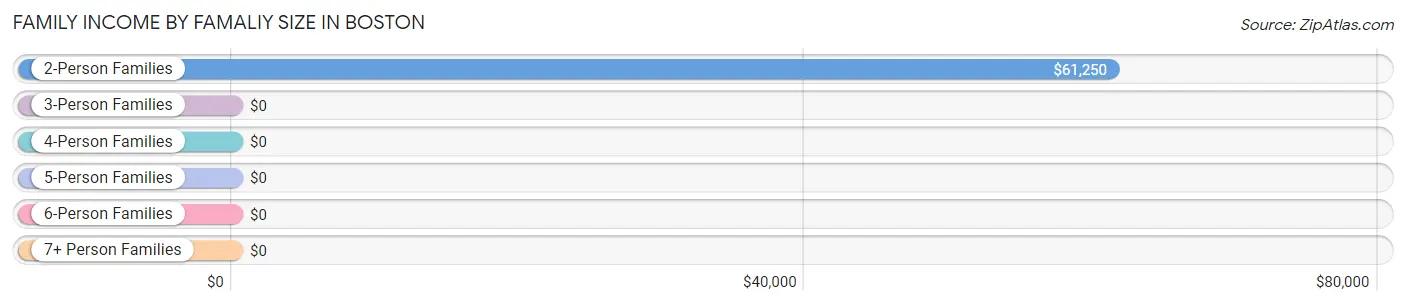
Family Income by Famaliy Size in Boston
2-person families (84 | 81.6%) account for the highest median family income in Boston with $61,250 per family, while 2-person families (84 | 81.6%) have the highest median income of $30,625 per family member.
| Income Bracket | # Families | Median Income |
| 2-Person Families | 84 (81.6%) | $61,250 |
| 3-Person Families | 19 (18.4%) | $0 |
| 4-Person Families | 0 (0.0%) | $0 |
| 5-Person Families | 0 (0.0%) | $0 |
| 6-Person Families | 0 (0.0%) | $0 |
| 7+ Person Families | 0 (0.0%) | $0 |
| Total | 103 (100.0%) | $0 |
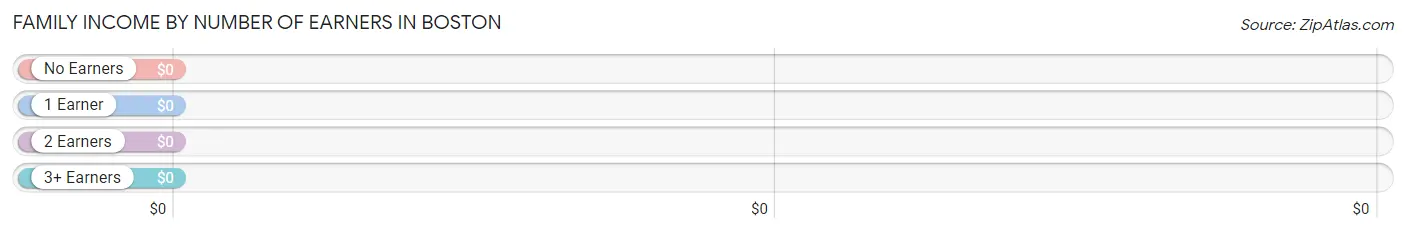
Family Income by Number of Earners in Boston
| Number of Earners | # Families | Median Income |
| No Earners | 18 (17.5%) | $0 |
| 1 Earner | 66 (64.1%) | $0 |
| 2 Earners | 0 (0.0%) | $0 |
| 3+ Earners | 19 (18.4%) | $0 |
| Total | 103 (100.0%) | $0 |
Household Income in Boston
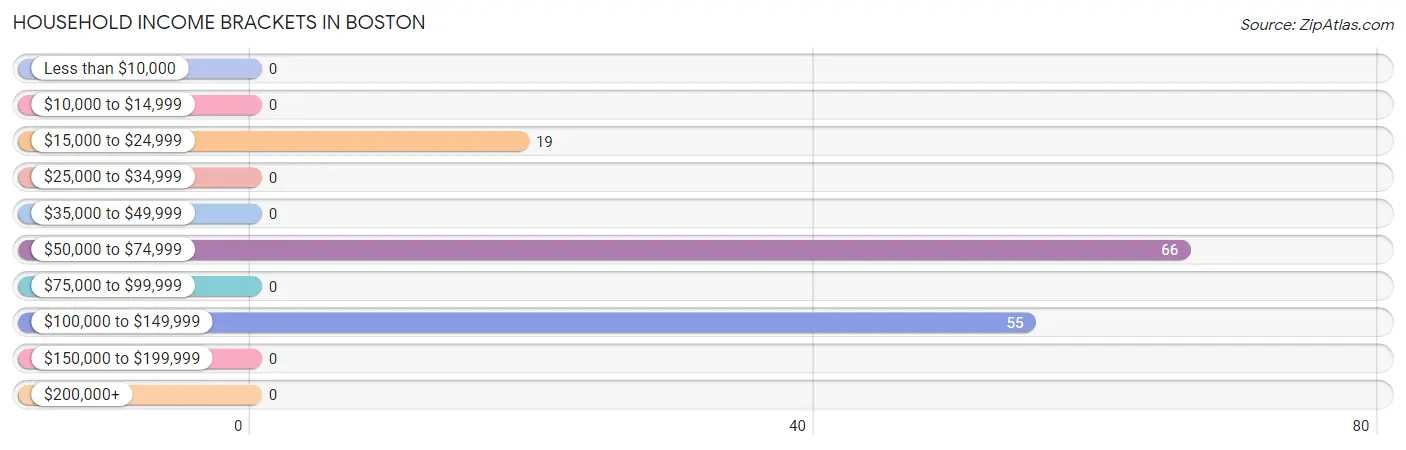
Household Income Brackets in Boston
With 66 households falling in the category, the $50,000 to $74,999 income range is the most frequent in Boston, accounting for 47.1% of all households.
| Income Bracket | # Households | % Households |
| Less than $10,000 | 0 | 0.0% |
| $10,000 to $14,999 | 0 | 0.0% |
| $15,000 to $24,999 | 19 | 13.6% |
| $25,000 to $34,999 | 0 | 0.0% |
| $35,000 to $49,999 | 0 | 0.0% |
| $50,000 to $74,999 | 66 | 47.1% |
| $75,000 to $99,999 | 0 | 0.0% |
| $100,000 to $149,999 | 55 | 39.3% |
| $150,000 to $199,999 | 0 | 0.0% |
| $200,000+ | 0 | 0.0% |
Household Income by Householder Age in Boston
| Income Bracket | # Households | Median Income |
| 15 to 24 Years | 0 (0.0%) | $0 |
| 25 to 44 Years | 0 (0.0%) | $0 |
| 45 to 64 Years | 85 (60.7%) | $0 |
| 65+ Years | 55 (39.3%) | $0 |
| Total | 140 (100.0%) | $61,719 |
Poverty in Boston
Income Below Poverty by Sex and Age in Boston
| Age Bracket | Male | Female |
| Under 5 Years | 0 (0.0%) | 0 (0.0%) |
| 5 Years | 0 (0.0%) | 0 (0.0%) |
| 6 to 11 Years | 0 (0.0%) | 0 (0.0%) |
| 12 to 14 Years | 0 (0.0%) | 0 (0.0%) |
| 15 Years | 0 (0.0%) | 0 (0.0%) |
| 16 and 17 Years | 0 (0.0%) | 0 (0.0%) |
| 18 to 24 Years | 0 (0.0%) | 0 (0.0%) |
| 25 to 34 Years | 0 (0.0%) | 0 (0.0%) |
| 35 to 44 Years | 0 (0.0%) | 0 (0.0%) |
| 45 to 54 Years | 0 (0.0%) | 0 (0.0%) |
| 55 to 64 Years | 0 (0.0%) | 0 (0.0%) |
| 65 to 74 Years | 0 (0.0%) | 0 (0.0%) |
| 75 Years and over | 0 (0.0%) | 0 (0.0%) |
| Total | 0 (0.0%) | 0 (0.0%) |
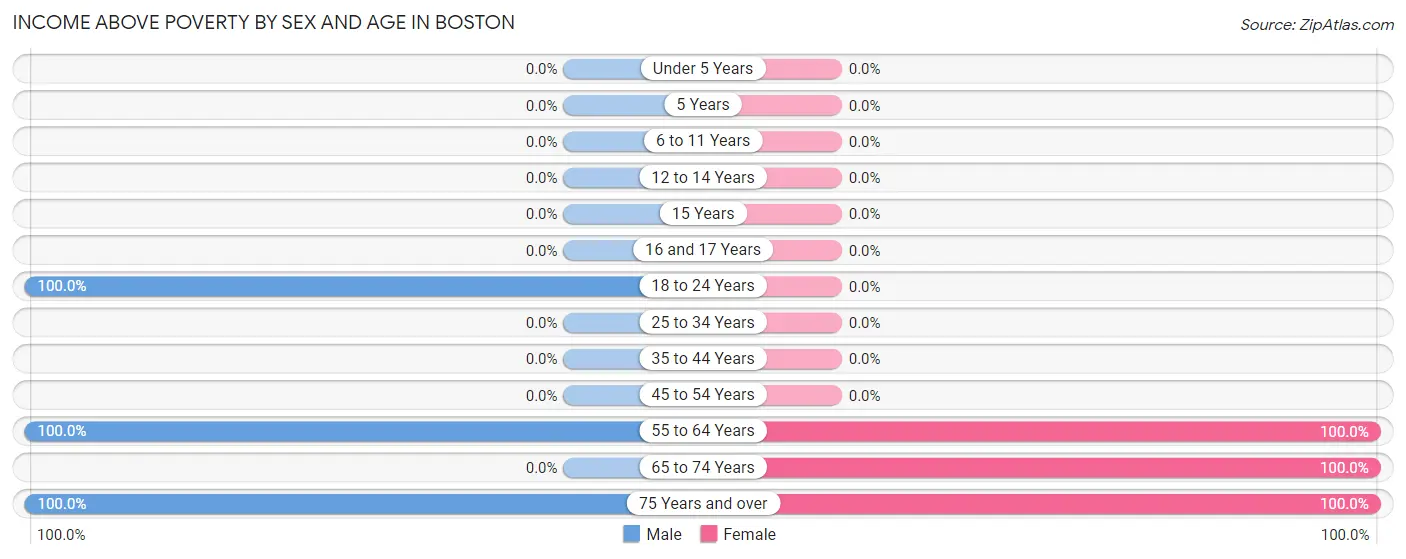
Income Above Poverty by Sex and Age in Boston
According to the poverty statistics in Boston, males aged 18 to 24 years and females aged 55 to 64 years are the age groups that are most secure financially, with 100.0% of males and 100.0% of females in these age groups living above the poverty line.
| Age Bracket | Male | Female |
| Under 5 Years | 0 (0.0%) | 0 (0.0%) |
| 5 Years | 0 (0.0%) | 0 (0.0%) |
| 6 to 11 Years | 0 (0.0%) | 0 (0.0%) |
| 12 to 14 Years | 0 (0.0%) | 0 (0.0%) |
| 15 Years | 0 (0.0%) | 0 (0.0%) |
| 16 and 17 Years | 0 (0.0%) | 0 (0.0%) |
| 18 to 24 Years | 25 (100.0%) | 0 (0.0%) |
| 25 to 34 Years | 0 (0.0%) | 0 (0.0%) |
| 35 to 44 Years | 0 (0.0%) | 0 (0.0%) |
| 45 to 54 Years | 0 (0.0%) | 0 (0.0%) |
| 55 to 64 Years | 144 (100.0%) | 38 (100.0%) |
| 65 to 74 Years | 0 (0.0%) | 18 (100.0%) |
| 75 Years and over | 19 (100.0%) | 37 (100.0%) |
| Total | 188 (100.0%) | 93 (100.0%) |
Income Below Poverty Among Married-Couple Families in Boston
| Children | Above Poverty | Below Poverty |
| No Children | 55 (100.0%) | 0 (0.0%) |
| 1 or 2 Children | 0 (0.0%) | 0 (0.0%) |
| 3 or 4 Children | 0 (0.0%) | 0 (0.0%) |
| 5 or more Children | 0 (0.0%) | 0 (0.0%) |
| Total | 55 (100.0%) | 0 (0.0%) |
Income Below Poverty Among Single-Parent Households in Boston
| Children | Single Father | Single Mother |
| No Children | 0 (0.0%) | 0 (0.0%) |
| 1 or 2 Children | 0 (0.0%) | 0 (0.0%) |
| 3 or 4 Children | 0 (0.0%) | 0 (0.0%) |
| 5 or more Children | 0 (0.0%) | 0 (0.0%) |
| Total | 0 (0.0%) | 0 (0.0%) |
Income Below Poverty Among Married-Couple vs Single-Parent Households in Boston
| Children | Married-Couple Families | Single-Parent Households |
| No Children | 0 (0.0%) | 0 (0.0%) |
| 1 or 2 Children | 0 (0.0%) | 0 (0.0%) |
| 3 or 4 Children | 0 (0.0%) | 0 (0.0%) |
| 5 or more Children | 0 (0.0%) | 0 (0.0%) |
| Total | 0 (0.0%) | 0 (0.0%) |
Race in Boston
The most populous races in Boston are , and White / Caucasian (281 | 100.0%).
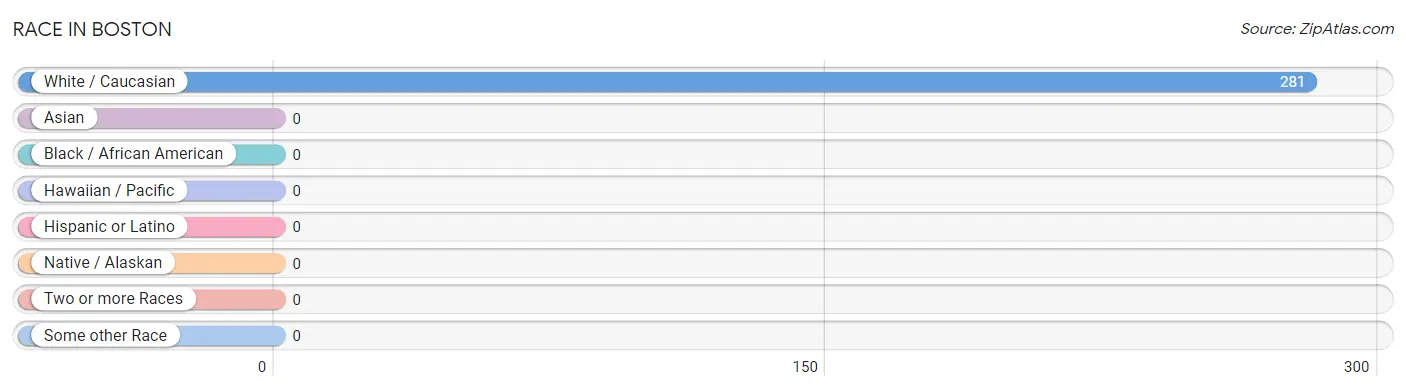
| Race | # Population | % Population |
| Asian | 0 | 0.0% |
| Black / African American | 0 | 0.0% |
| Hawaiian / Pacific | 0 | 0.0% |
| Hispanic or Latino | 0 | 0.0% |
| Native / Alaskan | 0 | 0.0% |
| White / Caucasian | 281 | 100.0% |
| Two or more Races | 0 | 0.0% |
| Some other Race | 0 | 0.0% |
| Total | 281 | 100.0% |
Ancestry in Boston
The most populous ancestries reported in Boston are German (83 | 29.5%), Slovak (82 | 29.2%), Italian (37 | 13.2%), Croatian (19 | 6.8%), and English (19 | 6.8%), together accounting for 85.4% of all Boston residents.
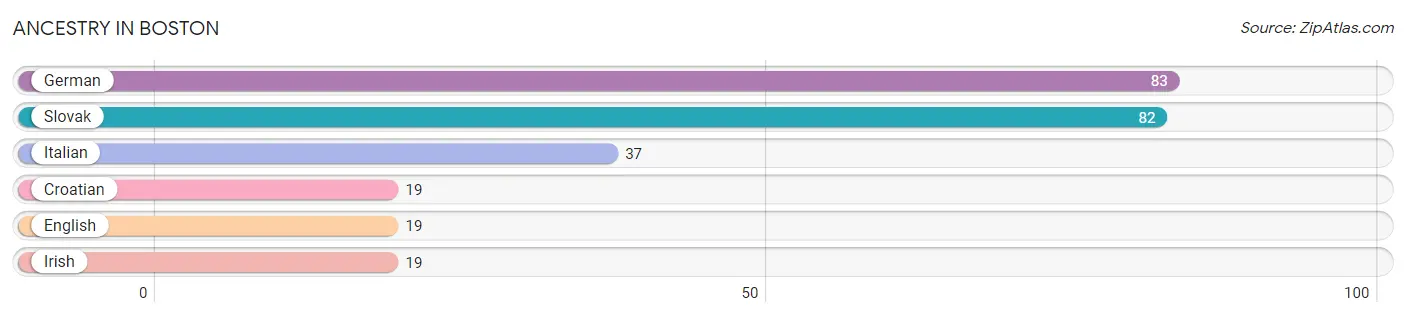
| Ancestry | # Population | % Population |
| Croatian | 19 | 6.8% |
| English | 19 | 6.8% |
| German | 83 | 29.5% |
| Irish | 19 | 6.8% |
| Italian | 37 | 13.2% |
| Slovak | 82 | 29.2% | View All 6 Rows |
Immigrants in Boston

| Immigration Origin | # Population | % Population | View All 0 Rows |
Sex and Age in Boston
Sex and Age in Boston
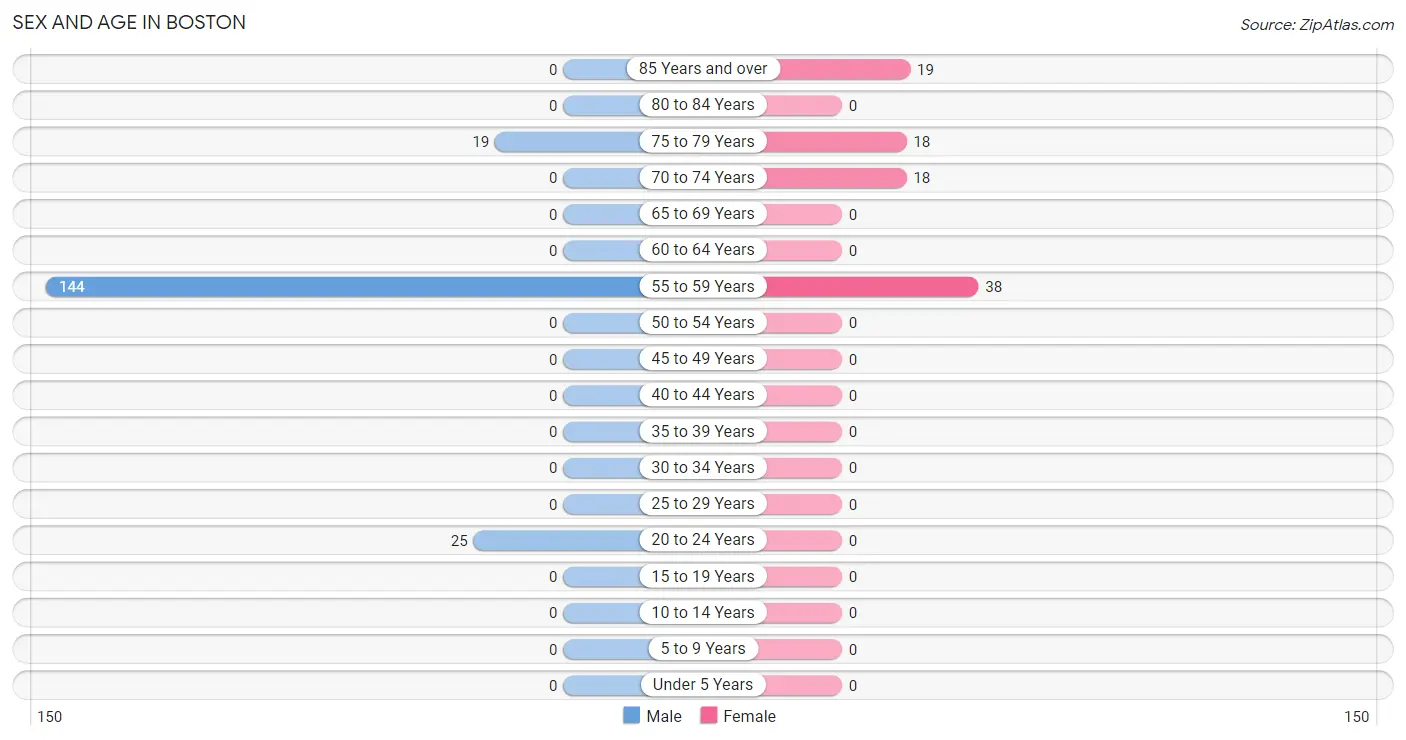
The most populous age groups in Boston are 55 to 59 Years (144 | 76.6%) for men and 55 to 59 Years (38 | 40.9%) for women.
| Age Bracket | Male | Female |
| Under 5 Years | 0 (0.0%) | 0 (0.0%) |
| 5 to 9 Years | 0 (0.0%) | 0 (0.0%) |
| 10 to 14 Years | 0 (0.0%) | 0 (0.0%) |
| 15 to 19 Years | 0 (0.0%) | 0 (0.0%) |
| 20 to 24 Years | 25 (13.3%) | 0 (0.0%) |
| 25 to 29 Years | 0 (0.0%) | 0 (0.0%) |
| 30 to 34 Years | 0 (0.0%) | 0 (0.0%) |
| 35 to 39 Years | 0 (0.0%) | 0 (0.0%) |
| 40 to 44 Years | 0 (0.0%) | 0 (0.0%) |
| 45 to 49 Years | 0 (0.0%) | 0 (0.0%) |
| 50 to 54 Years | 0 (0.0%) | 0 (0.0%) |
| 55 to 59 Years | 144 (76.6%) | 38 (40.9%) |
| 60 to 64 Years | 0 (0.0%) | 0 (0.0%) |
| 65 to 69 Years | 0 (0.0%) | 0 (0.0%) |
| 70 to 74 Years | 0 (0.0%) | 18 (19.4%) |
| 75 to 79 Years | 19 (10.1%) | 18 (19.4%) |
| 80 to 84 Years | 0 (0.0%) | 0 (0.0%) |
| 85 Years and over | 0 (0.0%) | 19 (20.4%) |
| Total | 188 (100.0%) | 93 (100.0%) |
Families and Households in Boston
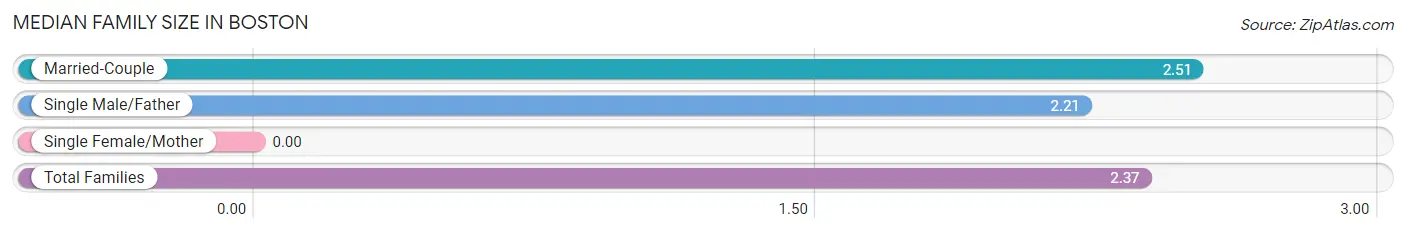
Median Family Size in Boston
| Family Type | # Families | Family Size |
| Married-Couple | 55 (53.4%) | 2.51 |
| Single Male/Father | 48 (46.6%) | 2.21 |
| Single Female/Mother | 0 (0.0%) | - |
| Total Families | 103 (100.0%) | 2.37 |
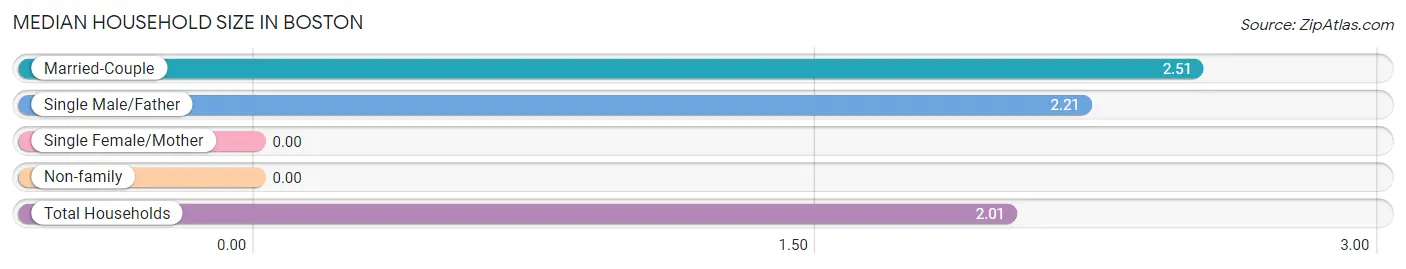
Median Household Size in Boston
| Household Type | # Households | Household Size |
| Married-Couple | 55 (39.3%) | 2.51 |
| Single Male/Father | 48 (34.3%) | 2.21 |
| Single Female/Mother | 0 (0.0%) | - |
| Non-family | 37 (26.4%) | - |
| Total Households | 140 (100.0%) | 2.01 |
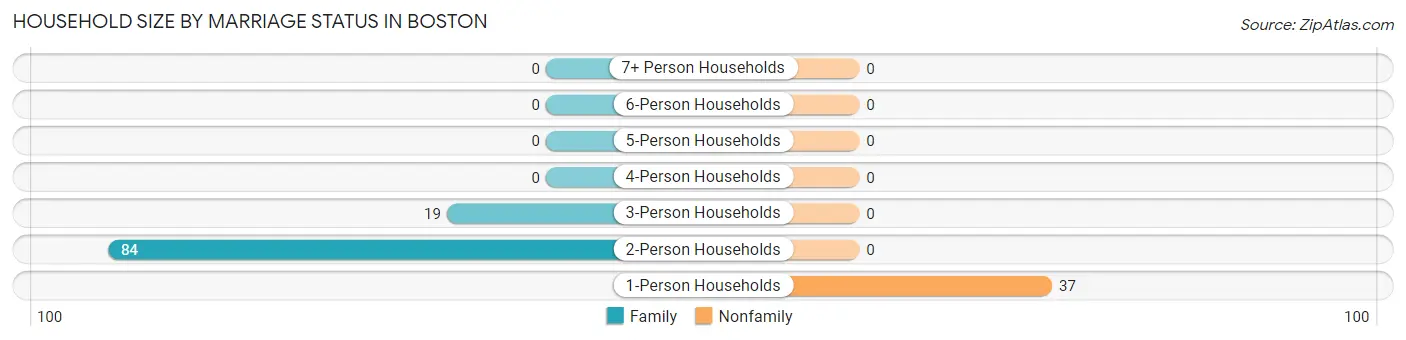
Household Size by Marriage Status in Boston
Out of a total of 140 households in Boston, 103 (73.6%) are family households, while 37 (26.4%) are nonfamily households. The most numerous type of family households are 2-person households, comprising 84, and the most common type of nonfamily households are 1-person households, comprising 37.
| Household Size | Family Households | Nonfamily Households |
| 1-Person Households | - | 37 (26.4%) |
| 2-Person Households | 84 (60.0%) | 0 (0.0%) |
| 3-Person Households | 19 (13.6%) | 0 (0.0%) |
| 4-Person Households | 0 (0.0%) | 0 (0.0%) |
| 5-Person Households | 0 (0.0%) | 0 (0.0%) |
| 6-Person Households | 0 (0.0%) | 0 (0.0%) |
| 7+ Person Households | 0 (0.0%) | 0 (0.0%) |
| Total | 103 (73.6%) | 37 (26.4%) |
Female Fertility in Boston
Fertility by Age in Boston
| Age Bracket | Women with Births | Births / 1,000 Women |
| 15 to 19 years | 0 (0.0%) | 0.0 |
| 20 to 34 years | 0 (0.0%) | 0.0 |
| 35 to 50 years | 0 (0.0%) | 0.0 |
| Total | 0 (0.0%) | 0.0 |
Fertility by Age by Marriage Status in Boston
| Age Bracket | Married | Unmarried |
| 15 to 19 years | 0 (0.0%) | 0 (0.0%) |
| 20 to 34 years | 0 (0.0%) | 0 (0.0%) |
| 35 to 50 years | 0 (0.0%) | 0 (0.0%) |
| Total | 0 (0.0%) | 0 (0.0%) |
Fertility by Education in Boston
| Educational Attainment | Women with Births | Births / 1,000 Women |
| Less than High School | 0 (0.0%) | 0.0 |
| High School Diploma | 0 (0.0%) | 0.0 |
| College or Associate's Degree | 0 (0.0%) | 0.0 |
| Bachelor's Degree | 0 (0.0%) | 0.0 |
| Graduate Degree | 0 (0.0%) | 0.0 |
| Total | 0 (0.0%) | 0.0 |
Fertility by Education by Marriage Status in Boston
| Educational Attainment | Married | Unmarried |
| Less than High School | 0 (0.0%) | 0 (0.0%) |
| High School Diploma | 0 (0.0%) | 0 (0.0%) |
| College or Associate's Degree | 0 (0.0%) | 0 (0.0%) |
| Bachelor's Degree | 0 (0.0%) | 0 (0.0%) |
| Graduate Degree | 0 (0.0%) | 0 (0.0%) |
| Total | 0 (0.0%) | 0 (0.0%) |
Employment Characteristics in Boston
Employment by Class of Employer in Boston
Among the 105 employed individuals in Boston, , and private company employees (105 | 100.0%) make up the most common classes of employment.
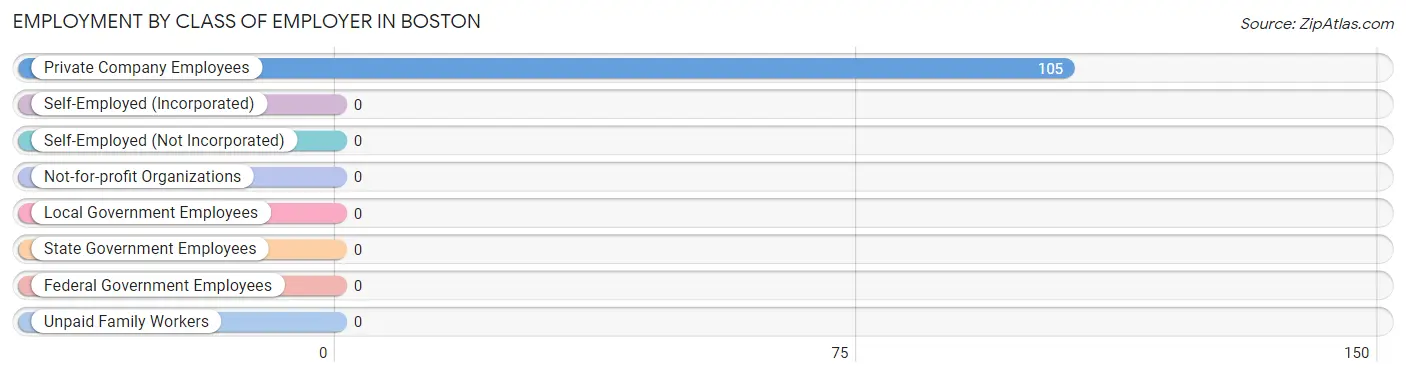
| Employer Class | # Employees | % Employees |
| Private Company Employees | 105 | 100.0% |
| Self-Employed (Incorporated) | 0 | 0.0% |
| Self-Employed (Not Incorporated) | 0 | 0.0% |
| Not-for-profit Organizations | 0 | 0.0% |
| Local Government Employees | 0 | 0.0% |
| State Government Employees | 0 | 0.0% |
| Federal Government Employees | 0 | 0.0% |
| Unpaid Family Workers | 0 | 0.0% |
| Total | 105 | 100.0% |
Employment Status by Age in Boston
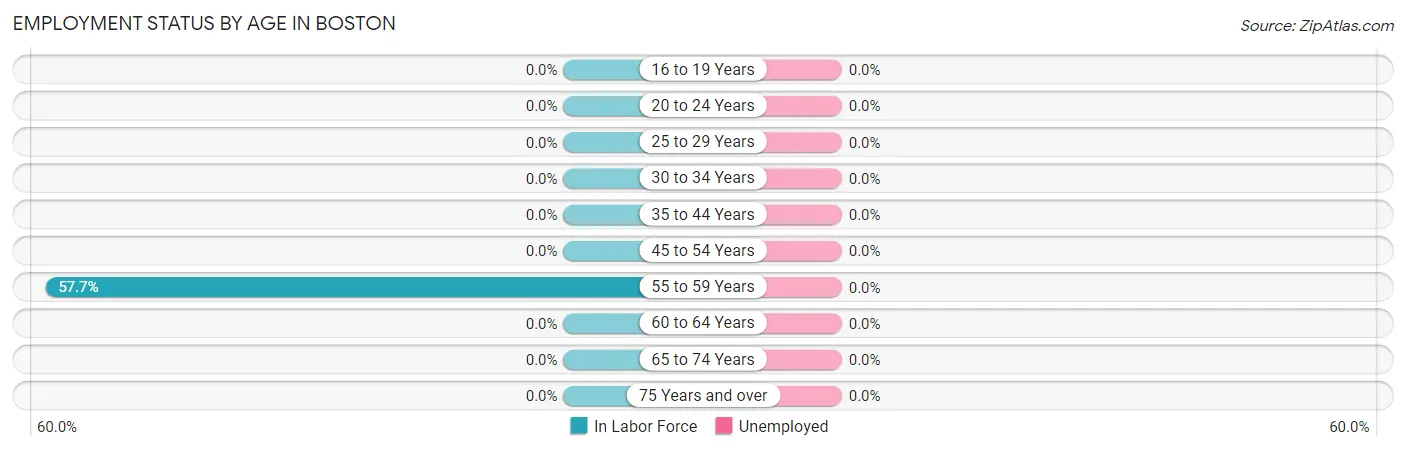
| Age Bracket | In Labor Force | Unemployed |
| 16 to 19 Years | 0 (0.0%) | 0 (0.0%) |
| 20 to 24 Years | 0 (0.0%) | 0 (0.0%) |
| 25 to 29 Years | 0 (0.0%) | 0 (0.0%) |
| 30 to 34 Years | 0 (0.0%) | 0 (0.0%) |
| 35 to 44 Years | 0 (0.0%) | 0 (0.0%) |
| 45 to 54 Years | 0 (0.0%) | 0 (0.0%) |
| 55 to 59 Years | 105 (57.7%) | 0 (0.0%) |
| 60 to 64 Years | 0 (0.0%) | 0 (0.0%) |
| 65 to 74 Years | 0 (0.0%) | 0 (0.0%) |
| 75 Years and over | 0 (0.0%) | 0 (0.0%) |
| Total | 105 (37.4%) | 0 (0.0%) |
Employment Status by Educational Attainment in Boston
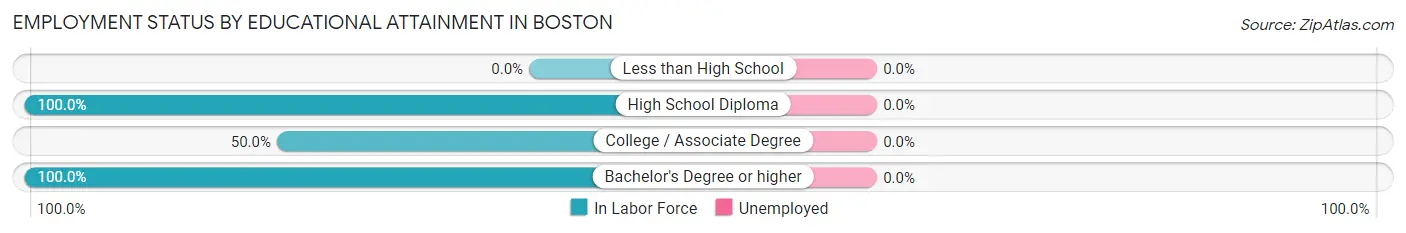
| Educational Attainment | In Labor Force | Unemployed |
| Less than High School | 0 (0.0%) | 0 (0.0%) |
| High School Diploma | 66 (100.0%) | 0 (0.0%) |
| College / Associate Degree | 19 (50.0%) | 0 (0.0%) |
| Bachelor's Degree or higher | 20 (100.0%) | 0 (0.0%) |
| Total | 105 (57.7%) | 0 (0.0%) |
Employment Occupations by Sex in Boston
Management, Business, Science and Arts Occupations
The most common Management, Business, Science and Arts occupations in Boston are , and Management (19 | 18.1%).
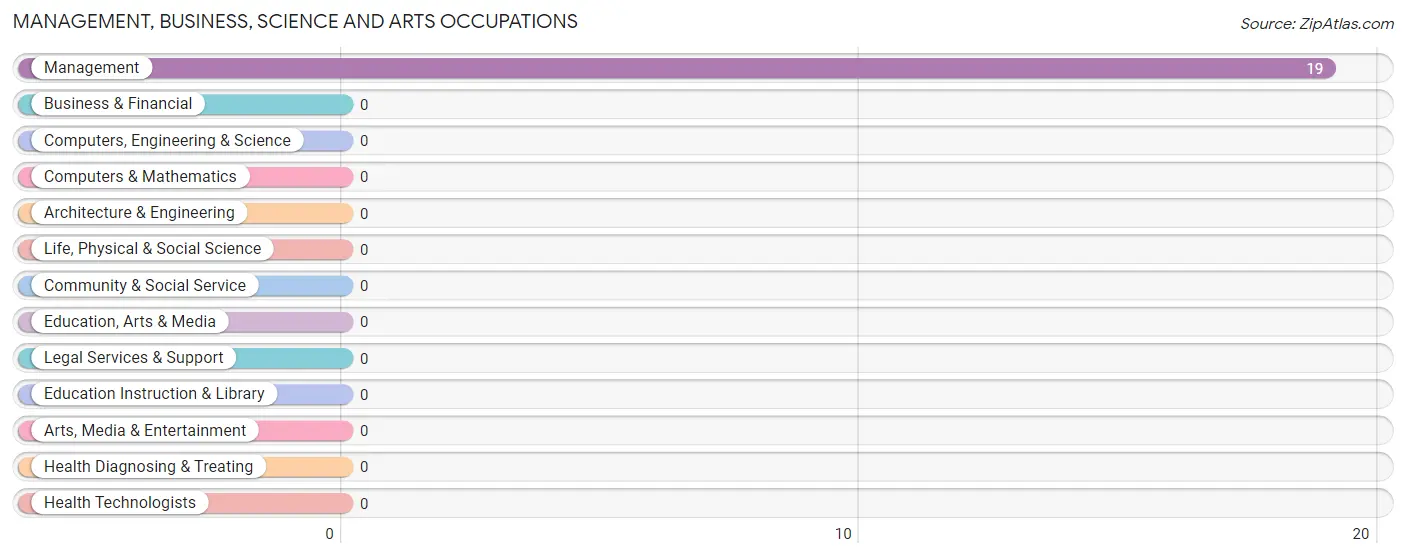
Management, Business, Science and Arts Occupations by Sex
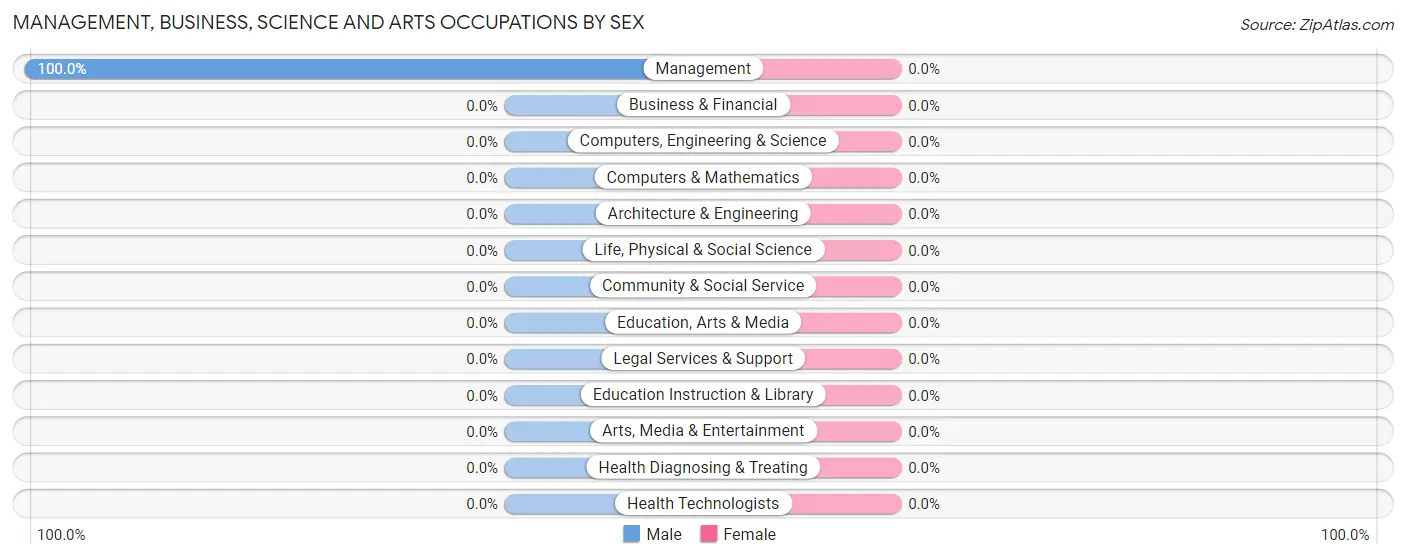
| Occupation | Male | Female |
| Management | 19 (100.0%) | 0 (0.0%) |
| Business & Financial | 0 (0.0%) | 0 (0.0%) |
| Computers, Engineering & Science | 0 (0.0%) | 0 (0.0%) |
| Computers & Mathematics | 0 (0.0%) | 0 (0.0%) |
| Architecture & Engineering | 0 (0.0%) | 0 (0.0%) |
| Life, Physical & Social Science | 0 (0.0%) | 0 (0.0%) |
| Community & Social Service | 0 (0.0%) | 0 (0.0%) |
| Education, Arts & Media | 0 (0.0%) | 0 (0.0%) |
| Legal Services & Support | 0 (0.0%) | 0 (0.0%) |
| Education Instruction & Library | 0 (0.0%) | 0 (0.0%) |
| Arts, Media & Entertainment | 0 (0.0%) | 0 (0.0%) |
| Health Diagnosing & Treating | 0 (0.0%) | 0 (0.0%) |
| Health Technologists | 0 (0.0%) | 0 (0.0%) |
| Total (Category) | 19 (100.0%) | 0 (0.0%) |
| Total (Overall) | 67 (63.8%) | 38 (36.2%) |
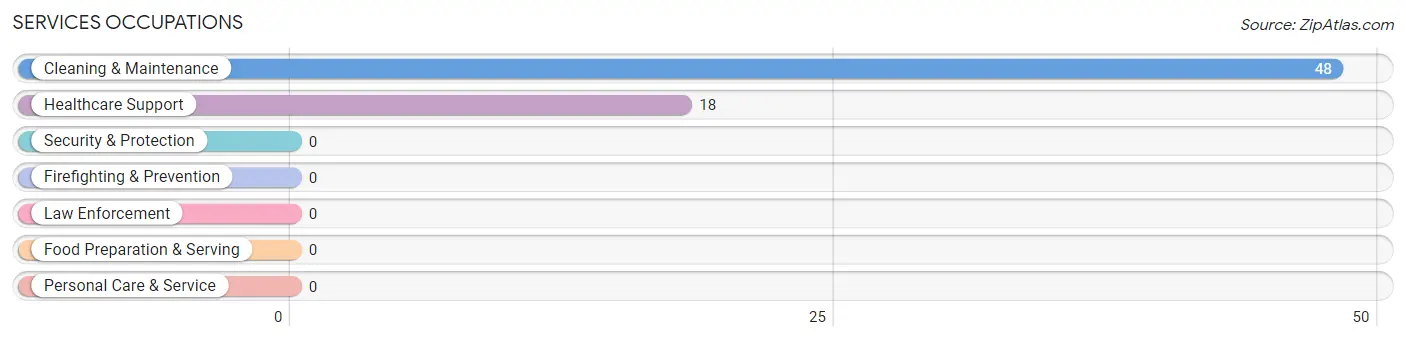
Services Occupations
The most common Services occupations in Boston are Cleaning & Maintenance (48 | 45.7%), and Healthcare Support (18 | 17.1%).
Services Occupations by Sex
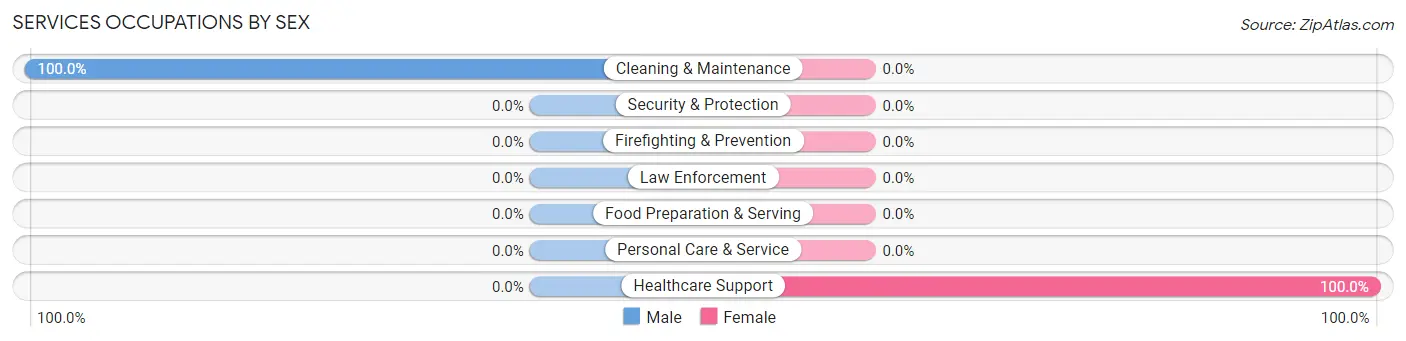
| Occupation | Male | Female |
| Healthcare Support | 0 (0.0%) | 18 (100.0%) |
| Security & Protection | 0 (0.0%) | 0 (0.0%) |
| Firefighting & Prevention | 0 (0.0%) | 0 (0.0%) |
| Law Enforcement | 0 (0.0%) | 0 (0.0%) |
| Food Preparation & Serving | 0 (0.0%) | 0 (0.0%) |
| Cleaning & Maintenance | 48 (100.0%) | 0 (0.0%) |
| Personal Care & Service | 0 (0.0%) | 0 (0.0%) |
| Total (Category) | 48 (72.7%) | 18 (27.3%) |
| Total (Overall) | 67 (63.8%) | 38 (36.2%) |
Sales and Office Occupations
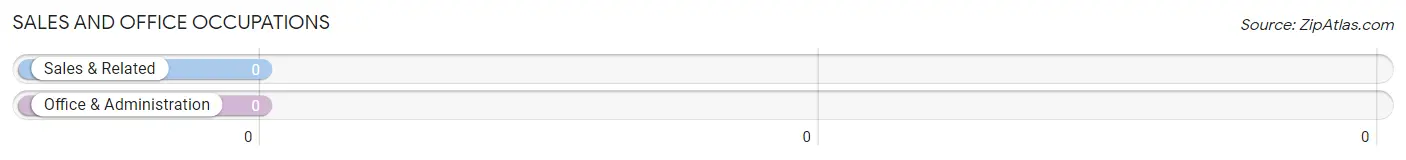
Sales and Office Occupations by Sex
| Occupation | Male | Female |
| Sales & Related | 0 (0.0%) | 0 (0.0%) |
| Office & Administration | 0 (0.0%) | 0 (0.0%) |
| Total (Category) | 0 (0.0%) | 0 (0.0%) |
| Total (Overall) | 67 (63.8%) | 38 (36.2%) |
Natural Resources, Construction and Maintenance Occupations
Natural Resources, Construction and Maintenance Occupations by Sex
| Occupation | Male | Female |
| Farming, Fishing & Forestry | 0 (0.0%) | 0 (0.0%) |
| Construction & Extraction | 0 (0.0%) | 0 (0.0%) |
| Installation, Maintenance & Repair | 0 (0.0%) | 0 (0.0%) |
| Total (Category) | 0 (0.0%) | 0 (0.0%) |
| Total (Overall) | 67 (63.8%) | 38 (36.2%) |
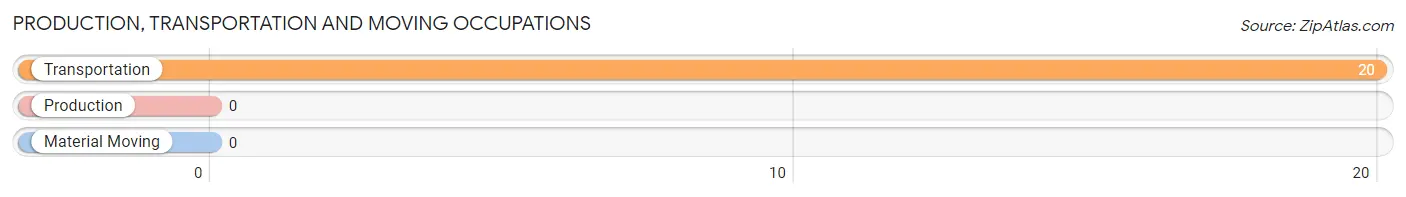
Production, Transportation and Moving Occupations
The most common Production, Transportation and Moving occupations in Boston are , and Transportation (20 | 19.1%).
Production, Transportation and Moving Occupations by Sex
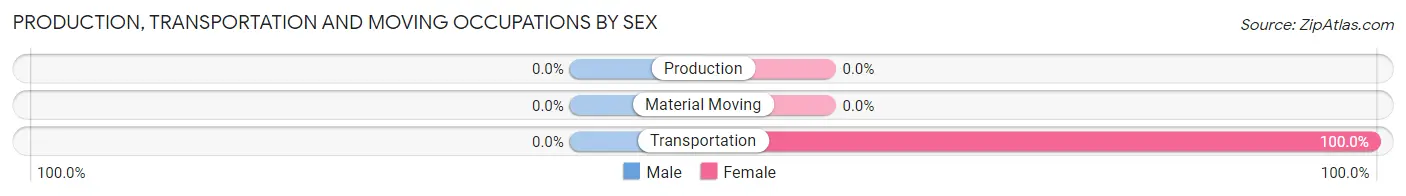
| Occupation | Male | Female |
| Production | 0 (0.0%) | 0 (0.0%) |
| Transportation | 0 (0.0%) | 20 (100.0%) |
| Material Moving | 0 (0.0%) | 0 (0.0%) |
| Total (Category) | 0 (0.0%) | 20 (100.0%) |
| Total (Overall) | 67 (63.8%) | 38 (36.2%) |
Employment Industries by Sex in Boston
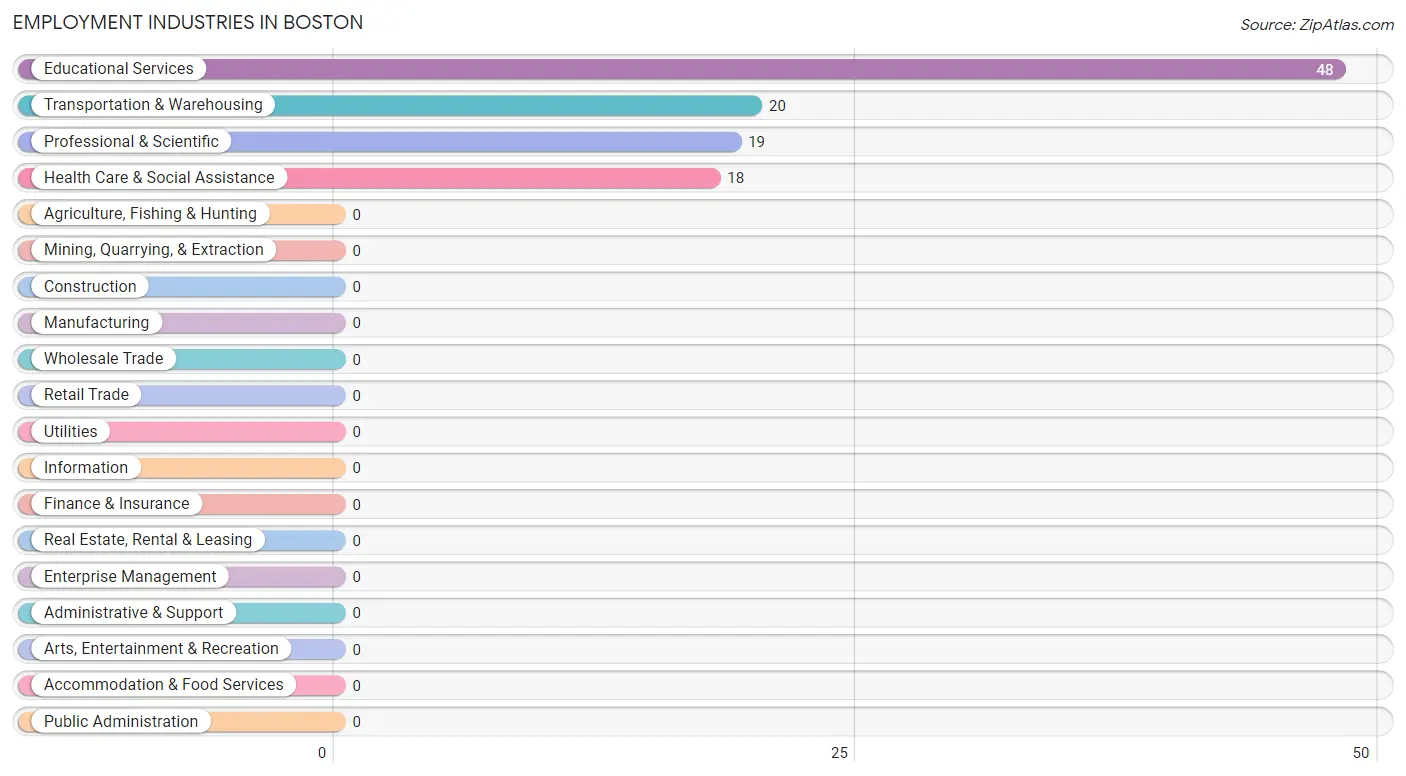
Employment Industries in Boston
The major employment industries in Boston include Educational Services (48 | 45.7%), Transportation & Warehousing (20 | 19.1%), Professional & Scientific (19 | 18.1%), and Health Care & Social Assistance (18 | 17.1%).
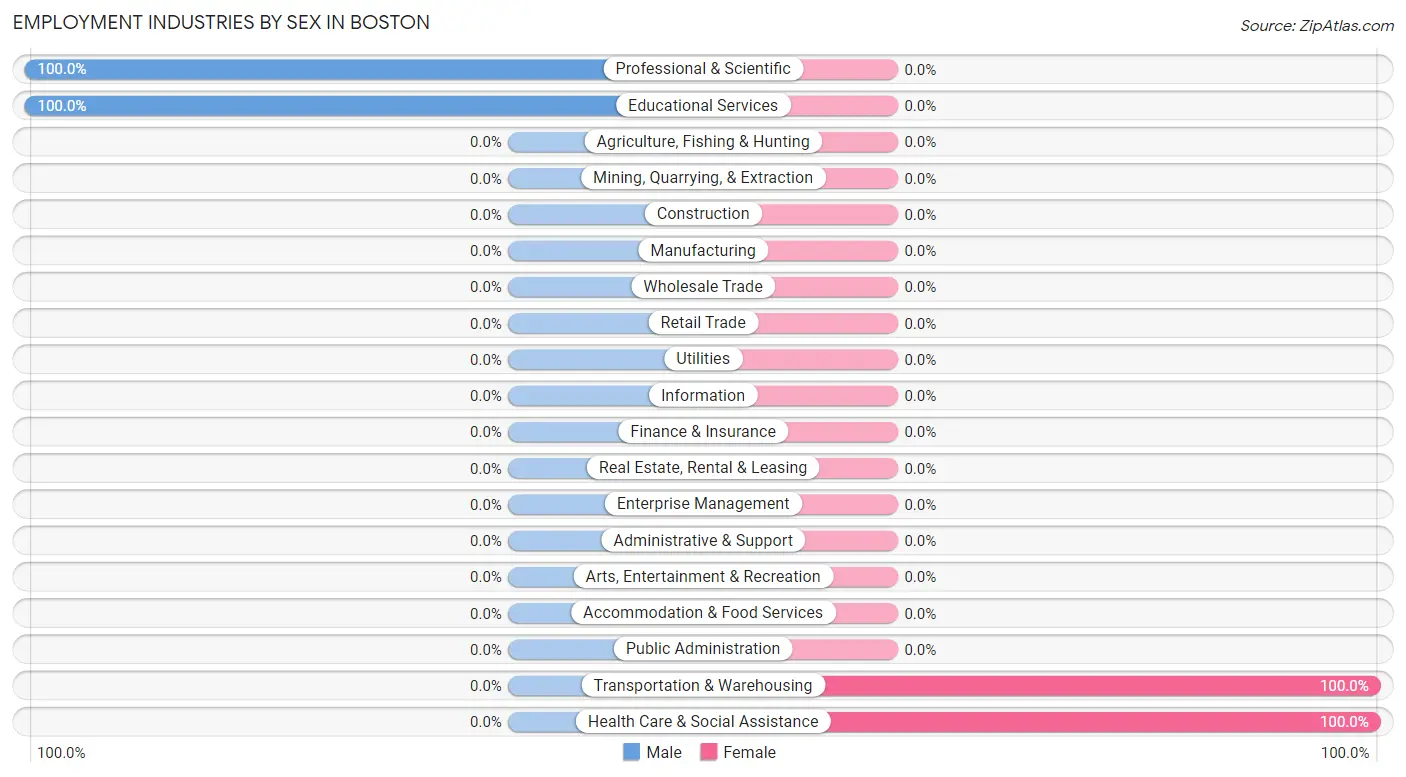
Employment Industries by Sex in Boston
The Boston industries that see more men than women are Professional & Scientific (100.0%), and Educational Services (100.0%), whereas the industries that tend to have a higher number of women are Transportation & Warehousing (100.0%), and Health Care & Social Assistance (100.0%).
| Industry | Male | Female |
| Agriculture, Fishing & Hunting | 0 (0.0%) | 0 (0.0%) |
| Mining, Quarrying, & Extraction | 0 (0.0%) | 0 (0.0%) |
| Construction | 0 (0.0%) | 0 (0.0%) |
| Manufacturing | 0 (0.0%) | 0 (0.0%) |
| Wholesale Trade | 0 (0.0%) | 0 (0.0%) |
| Retail Trade | 0 (0.0%) | 0 (0.0%) |
| Transportation & Warehousing | 0 (0.0%) | 20 (100.0%) |
| Utilities | 0 (0.0%) | 0 (0.0%) |
| Information | 0 (0.0%) | 0 (0.0%) |
| Finance & Insurance | 0 (0.0%) | 0 (0.0%) |
| Real Estate, Rental & Leasing | 0 (0.0%) | 0 (0.0%) |
| Professional & Scientific | 19 (100.0%) | 0 (0.0%) |
| Enterprise Management | 0 (0.0%) | 0 (0.0%) |
| Administrative & Support | 0 (0.0%) | 0 (0.0%) |
| Educational Services | 48 (100.0%) | 0 (0.0%) |
| Health Care & Social Assistance | 0 (0.0%) | 18 (100.0%) |
| Arts, Entertainment & Recreation | 0 (0.0%) | 0 (0.0%) |
| Accommodation & Food Services | 0 (0.0%) | 0 (0.0%) |
| Public Administration | 0 (0.0%) | 0 (0.0%) |
| Total | 67 (63.8%) | 38 (36.2%) |
Education in Boston
School Enrollment in Boston
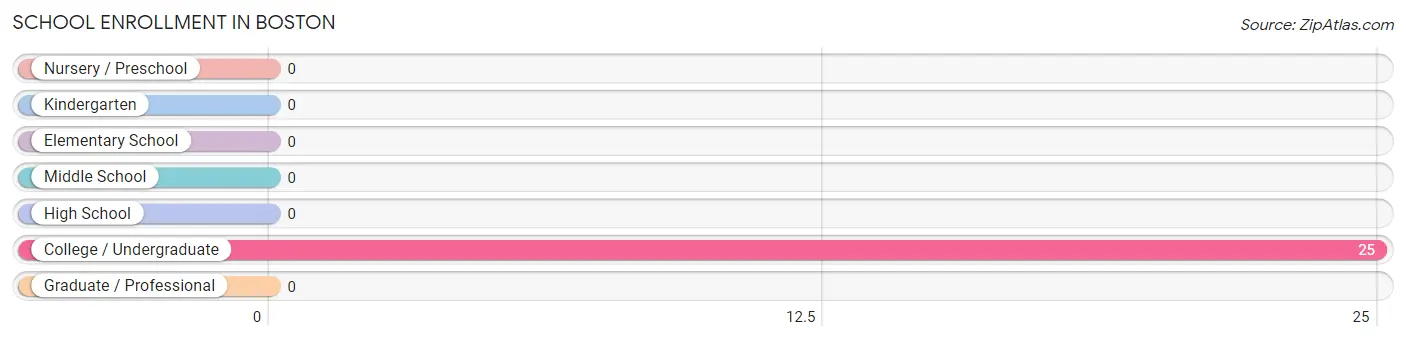
| School Level | # Students | % Students |
| Nursery / Preschool | 0 | 0.0% |
| Kindergarten | 0 | 0.0% |
| Elementary School | 0 | 0.0% |
| Middle School | 0 | 0.0% |
| High School | 0 | 0.0% |
| College / Undergraduate | 25 | 100.0% |
| Graduate / Professional | 0 | 0.0% |
| Total | 25 | 100.0% |
School Enrollment by Age by Funding Source in Boston
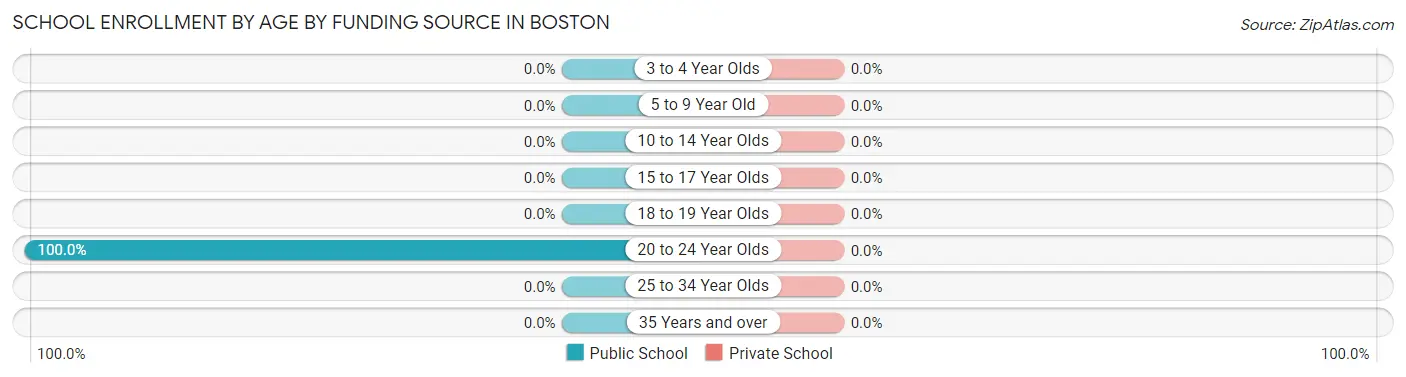
| Age Bracket | Public School | Private School |
| 3 to 4 Year Olds | 0 (0.0%) | 0 (0.0%) |
| 5 to 9 Year Old | 0 (0.0%) | 0 (0.0%) |
| 10 to 14 Year Olds | 0 (0.0%) | 0 (0.0%) |
| 15 to 17 Year Olds | 0 (0.0%) | 0 (0.0%) |
| 18 to 19 Year Olds | 0 (0.0%) | 0 (0.0%) |
| 20 to 24 Year Olds | 25 (100.0%) | 0 (0.0%) |
| 25 to 34 Year Olds | 0 (0.0%) | 0 (0.0%) |
| 35 Years and over | 0 (0.0%) | 0 (0.0%) |
| Total | 25 (100.0%) | 0 (0.0%) |
Educational Attainment by Field of Study in Boston
Business (20 | 52.6%), and education (18 | 47.4%) are the most common fields of study among 38 individuals in Boston who have obtained a bachelor's degree or higher.
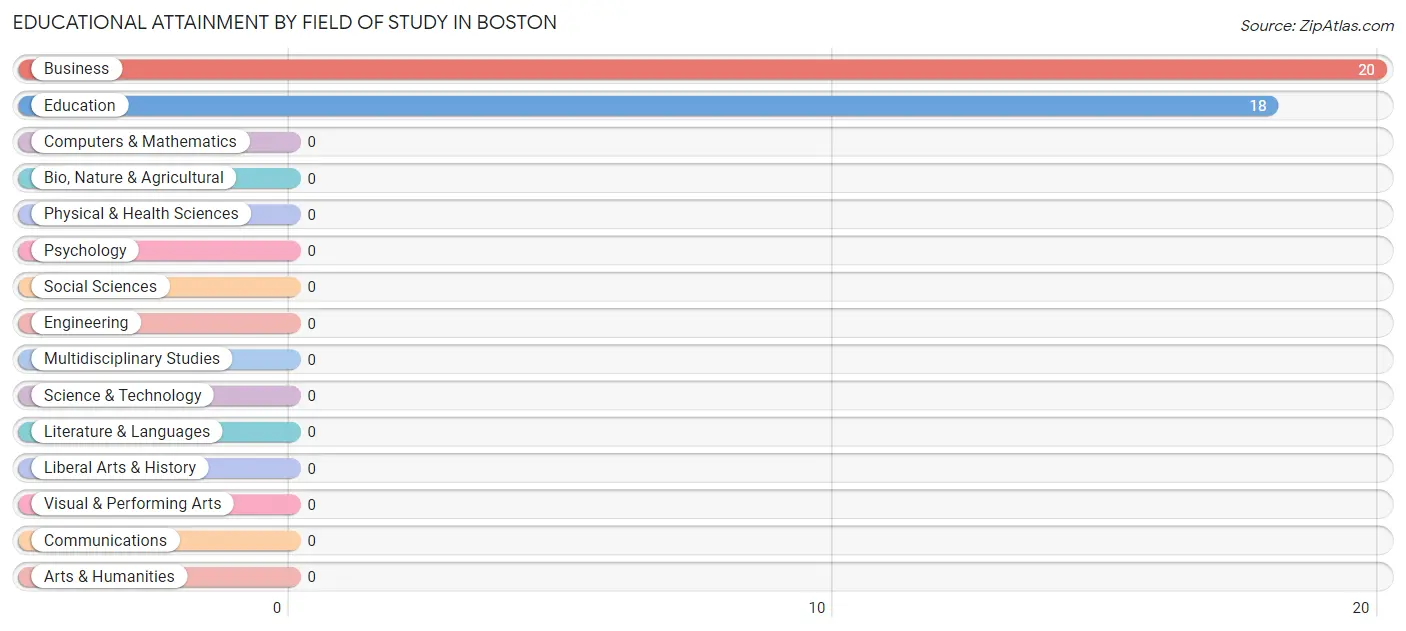
| Field of Study | # Graduates | % Graduates |
| Computers & Mathematics | 0 | 0.0% |
| Bio, Nature & Agricultural | 0 | 0.0% |
| Physical & Health Sciences | 0 | 0.0% |
| Psychology | 0 | 0.0% |
| Social Sciences | 0 | 0.0% |
| Engineering | 0 | 0.0% |
| Multidisciplinary Studies | 0 | 0.0% |
| Science & Technology | 0 | 0.0% |
| Business | 20 | 52.6% |
| Education | 18 | 47.4% |
| Literature & Languages | 0 | 0.0% |
| Liberal Arts & History | 0 | 0.0% |
| Visual & Performing Arts | 0 | 0.0% |
| Communications | 0 | 0.0% |
| Arts & Humanities | 0 | 0.0% |
| Total | 38 | 100.0% |
Transportation & Commute in Boston
Vehicle Availability by Sex in Boston
The most prevalent vehicle ownership categories in Boston are males with 2 vehicles (48, accounting for 71.6%) and females with 2 vehicles (18, making up 126.3%).
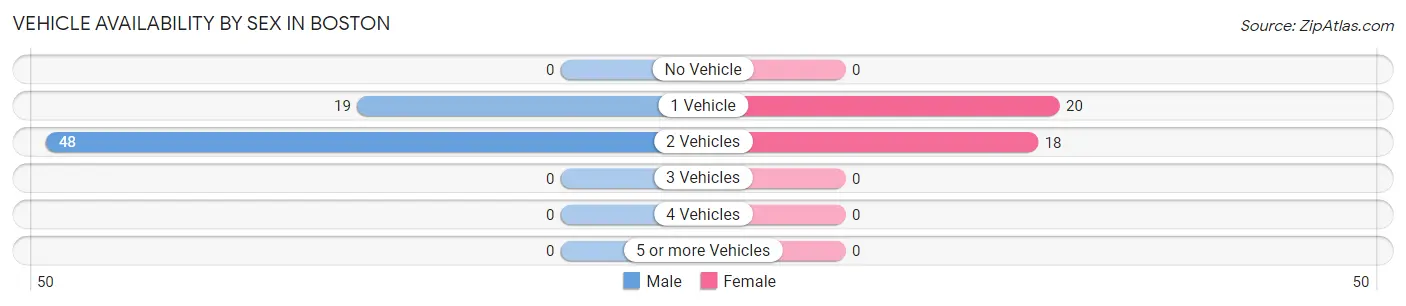
| Vehicles Available | Male | Female |
| No Vehicle | 0 (0.0%) | 0 (0.0%) |
| 1 Vehicle | 19 (28.4%) | 20 (52.6%) |
| 2 Vehicles | 48 (71.6%) | 18 (47.4%) |
| 3 Vehicles | 0 (0.0%) | 0 (0.0%) |
| 4 Vehicles | 0 (0.0%) | 0 (0.0%) |
| 5 or more Vehicles | 0 (0.0%) | 0 (0.0%) |
| Total | 67 (100.0%) | 38 (100.0%) |
Commute Time in Boston
The most frequently occuring commute durations in Boston are 60 to 89 minutes (48 commuters, 55.8%), 5 to 9 minutes (20 commuters, 23.3%), and 25 to 29 minutes (18 commuters, 20.9%).
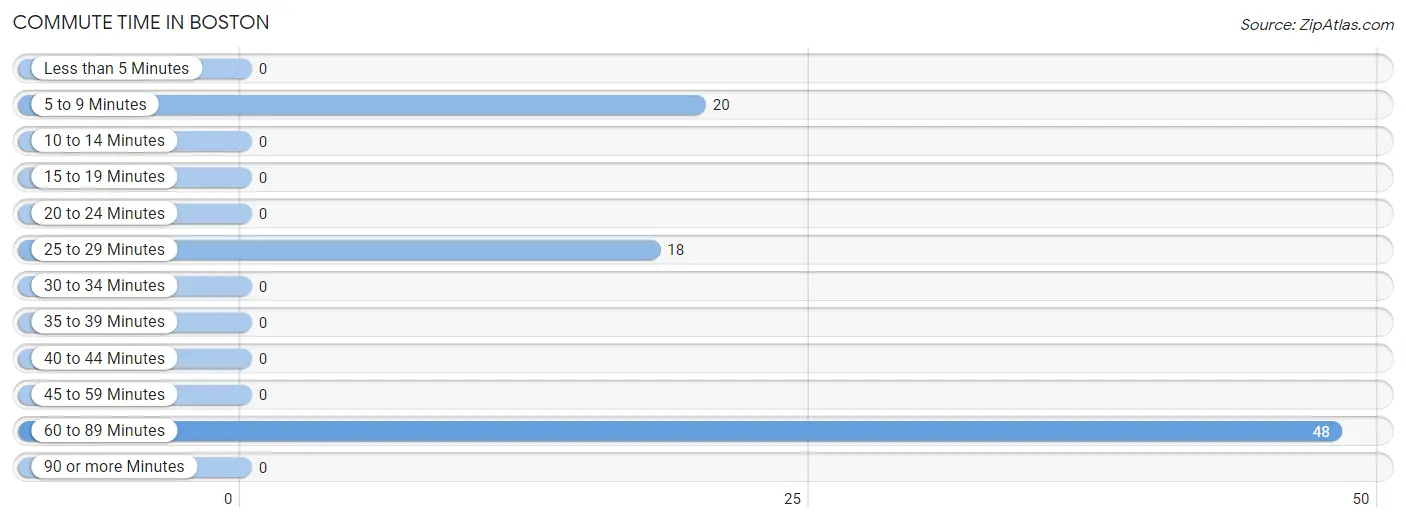
| Commute Time | # Commuters | % Commuters |
| Less than 5 Minutes | 0 | 0.0% |
| 5 to 9 Minutes | 20 | 23.3% |
| 10 to 14 Minutes | 0 | 0.0% |
| 15 to 19 Minutes | 0 | 0.0% |
| 20 to 24 Minutes | 0 | 0.0% |
| 25 to 29 Minutes | 18 | 20.9% |
| 30 to 34 Minutes | 0 | 0.0% |
| 35 to 39 Minutes | 0 | 0.0% |
| 40 to 44 Minutes | 0 | 0.0% |
| 45 to 59 Minutes | 0 | 0.0% |
| 60 to 89 Minutes | 48 | 55.8% |
| 90 or more Minutes | 0 | 0.0% |
Commute Time by Sex in Boston
The most common commute times in Boston are 60 to 89 minutes (48 commuters, 100.0%) for males and 5 to 9 minutes (20 commuters, 52.6%) for females.
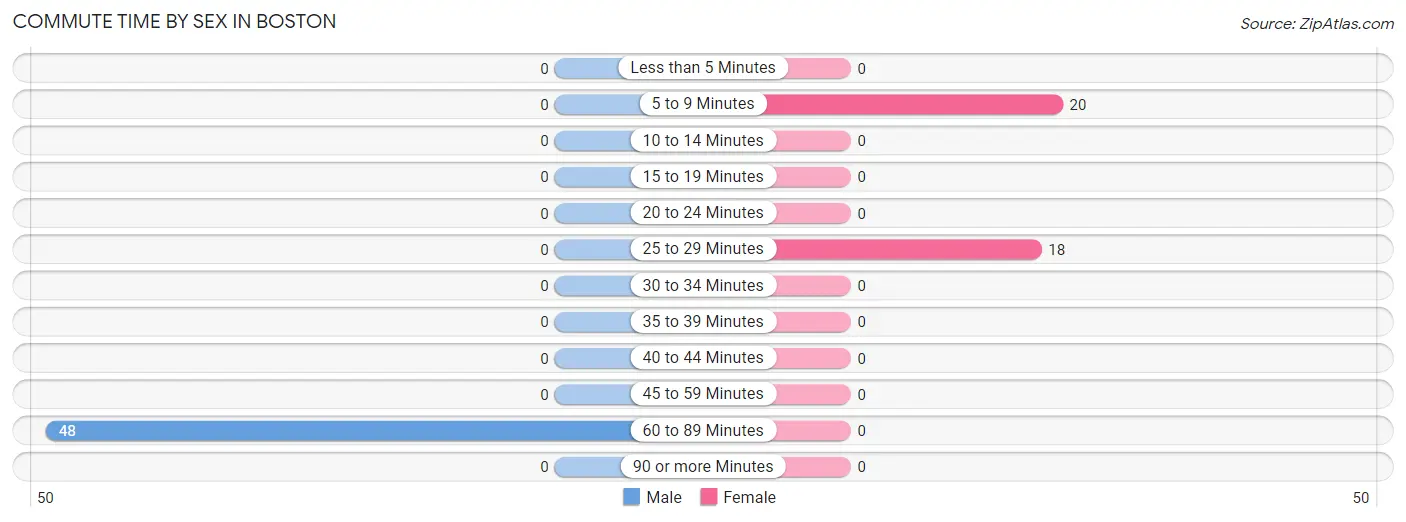
| Commute Time | Male | Female |
| Less than 5 Minutes | 0 (0.0%) | 0 (0.0%) |
| 5 to 9 Minutes | 0 (0.0%) | 20 (52.6%) |
| 10 to 14 Minutes | 0 (0.0%) | 0 (0.0%) |
| 15 to 19 Minutes | 0 (0.0%) | 0 (0.0%) |
| 20 to 24 Minutes | 0 (0.0%) | 0 (0.0%) |
| 25 to 29 Minutes | 0 (0.0%) | 18 (47.4%) |
| 30 to 34 Minutes | 0 (0.0%) | 0 (0.0%) |
| 35 to 39 Minutes | 0 (0.0%) | 0 (0.0%) |
| 40 to 44 Minutes | 0 (0.0%) | 0 (0.0%) |
| 45 to 59 Minutes | 0 (0.0%) | 0 (0.0%) |
| 60 to 89 Minutes | 48 (100.0%) | 0 (0.0%) |
| 90 or more Minutes | 0 (0.0%) | 0 (0.0%) |
Time of Departure to Work by Sex in Boston
The most frequent times of departure to work in Boston are 6:30 AM to 6:59 AM (48, 100.0%) for males and 8:30 AM to 8:59 AM (20, 52.6%) for females.
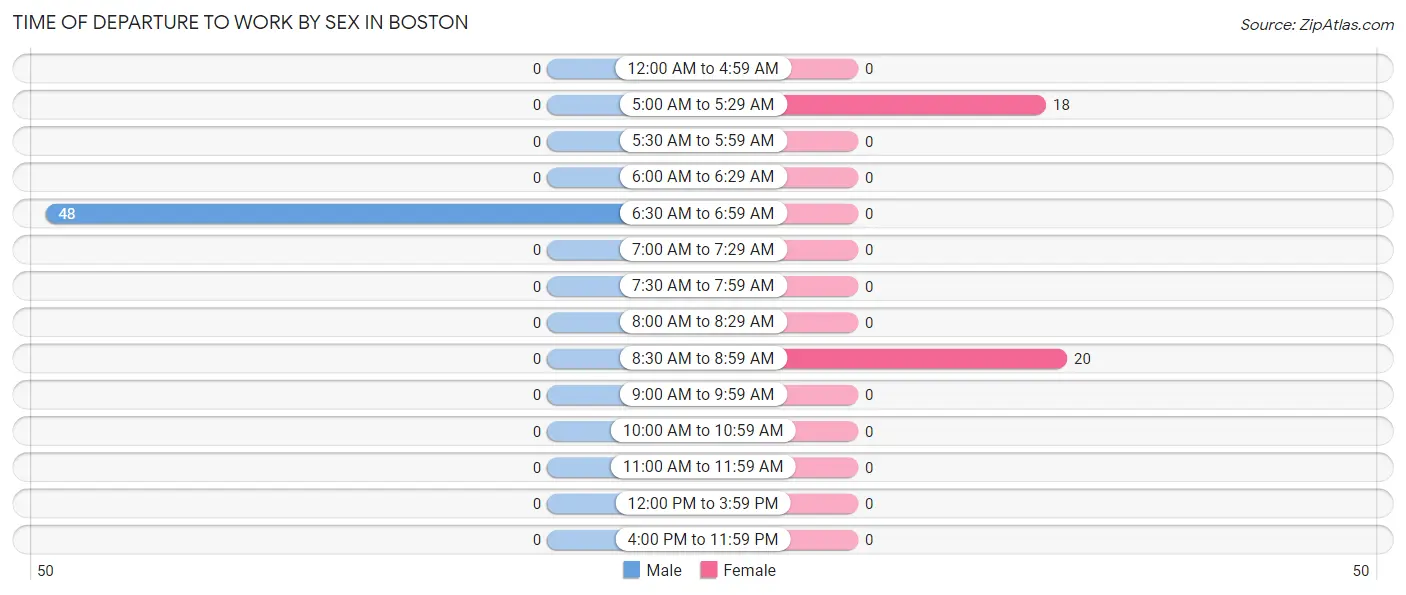
| Time of Departure | Male | Female |
| 12:00 AM to 4:59 AM | 0 (0.0%) | 0 (0.0%) |
| 5:00 AM to 5:29 AM | 0 (0.0%) | 18 (47.4%) |
| 5:30 AM to 5:59 AM | 0 (0.0%) | 0 (0.0%) |
| 6:00 AM to 6:29 AM | 0 (0.0%) | 0 (0.0%) |
| 6:30 AM to 6:59 AM | 48 (100.0%) | 0 (0.0%) |
| 7:00 AM to 7:29 AM | 0 (0.0%) | 0 (0.0%) |
| 7:30 AM to 7:59 AM | 0 (0.0%) | 0 (0.0%) |
| 8:00 AM to 8:29 AM | 0 (0.0%) | 0 (0.0%) |
| 8:30 AM to 8:59 AM | 0 (0.0%) | 20 (52.6%) |
| 9:00 AM to 9:59 AM | 0 (0.0%) | 0 (0.0%) |
| 10:00 AM to 10:59 AM | 0 (0.0%) | 0 (0.0%) |
| 11:00 AM to 11:59 AM | 0 (0.0%) | 0 (0.0%) |
| 12:00 PM to 3:59 PM | 0 (0.0%) | 0 (0.0%) |
| 4:00 PM to 11:59 PM | 0 (0.0%) | 0 (0.0%) |
| Total | 48 (100.0%) | 38 (100.0%) |
Housing Occupancy in Boston
Occupancy by Ownership in Boston
Of the total 140 dwellings in Boston, owner-occupied units account for 92 (65.7%), while renter-occupied units make up 48 (34.3%).
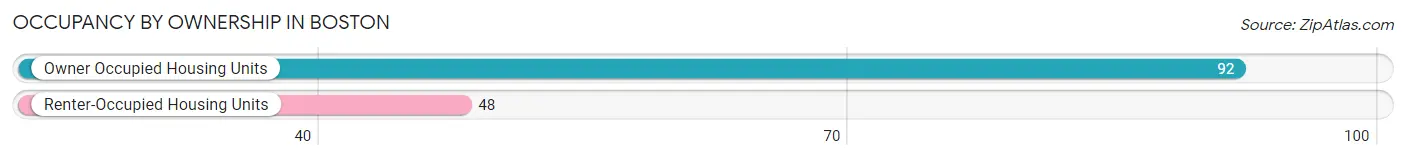
| Occupancy | # Housing Units | % Housing Units |
| Owner Occupied Housing Units | 92 | 65.7% |
| Renter-Occupied Housing Units | 48 | 34.3% |
| Total Occupied Housing Units | 140 | 100.0% |
Occupancy by Household Size in Boston
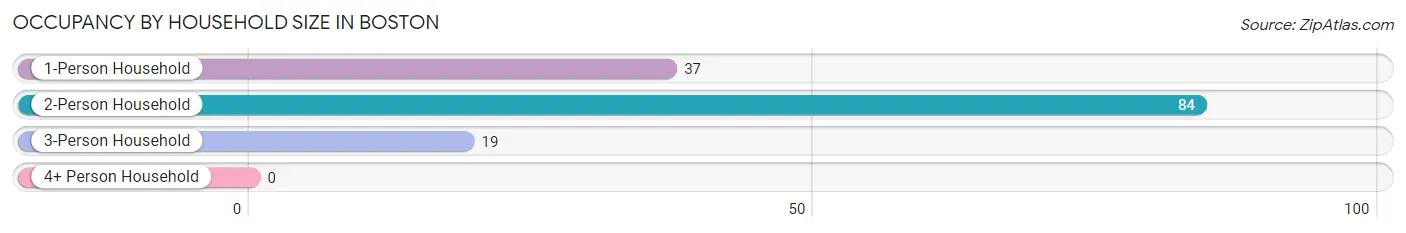
| Household Size | # Housing Units | % Housing Units |
| 1-Person Household | 37 | 26.4% |
| 2-Person Household | 84 | 60.0% |
| 3-Person Household | 19 | 13.6% |
| 4+ Person Household | 0 | 0.0% |
| Total Housing Units | 140 | 100.0% |
Occupancy by Ownership by Household Size in Boston
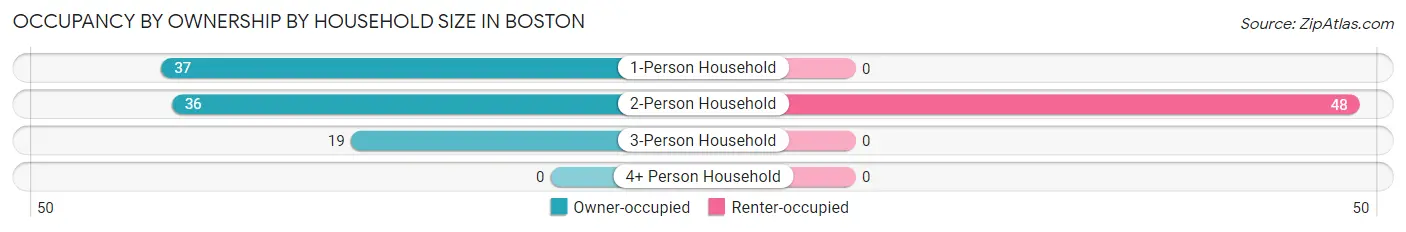
| Household Size | Owner-occupied | Renter-occupied |
| 1-Person Household | 37 (100.0%) | 0 (0.0%) |
| 2-Person Household | 36 (42.9%) | 48 (57.1%) |
| 3-Person Household | 19 (100.0%) | 0 (0.0%) |
| 4+ Person Household | 0 (0.0%) | 0 (0.0%) |
| Total Housing Units | 92 (65.7%) | 48 (34.3%) |
Occupancy by Educational Attainment in Boston
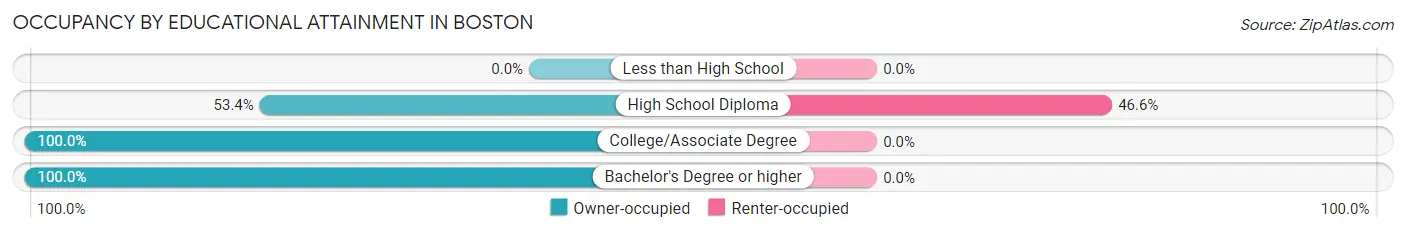
| Household Size | Owner-occupied | Renter-occupied |
| Less than High School | 0 (0.0%) | 0 (0.0%) |
| High School Diploma | 55 (53.4%) | 48 (46.6%) |
| College/Associate Degree | 19 (100.0%) | 0 (0.0%) |
| Bachelor's Degree or higher | 18 (100.0%) | 0 (0.0%) |
Occupancy by Age of Householder in Boston
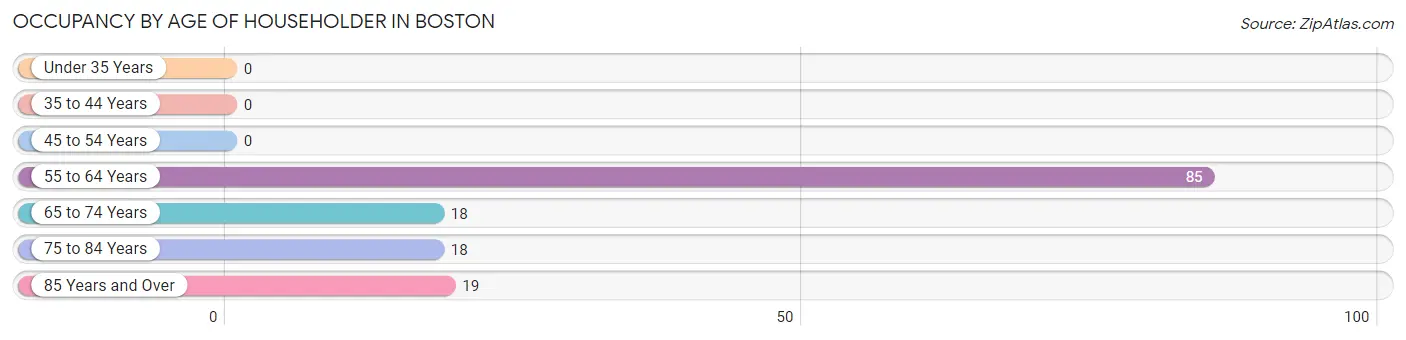
| Age Bracket | # Households | % Households |
| Under 35 Years | 0 | 0.0% |
| 35 to 44 Years | 0 | 0.0% |
| 45 to 54 Years | 0 | 0.0% |
| 55 to 64 Years | 85 | 60.7% |
| 65 to 74 Years | 18 | 12.9% |
| 75 to 84 Years | 18 | 12.9% |
| 85 Years and Over | 19 | 13.6% |
| Total | 140 | 100.0% |
Housing Finances in Boston
Median Income by Occupancy in Boston
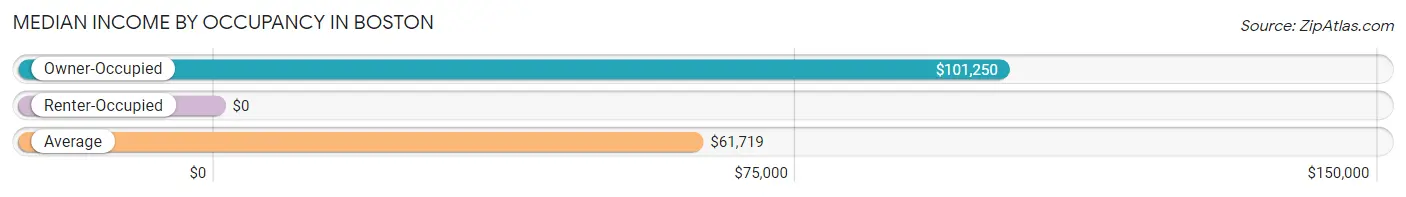
| Occupancy Type | # Households | Median Income |
| Owner-Occupied | 92 (65.7%) | $101,250 |
| Renter-Occupied | 48 (34.3%) | $0 |
| Average | 140 (100.0%) | $61,719 |
Occupancy by Householder Income Bracket in Boston
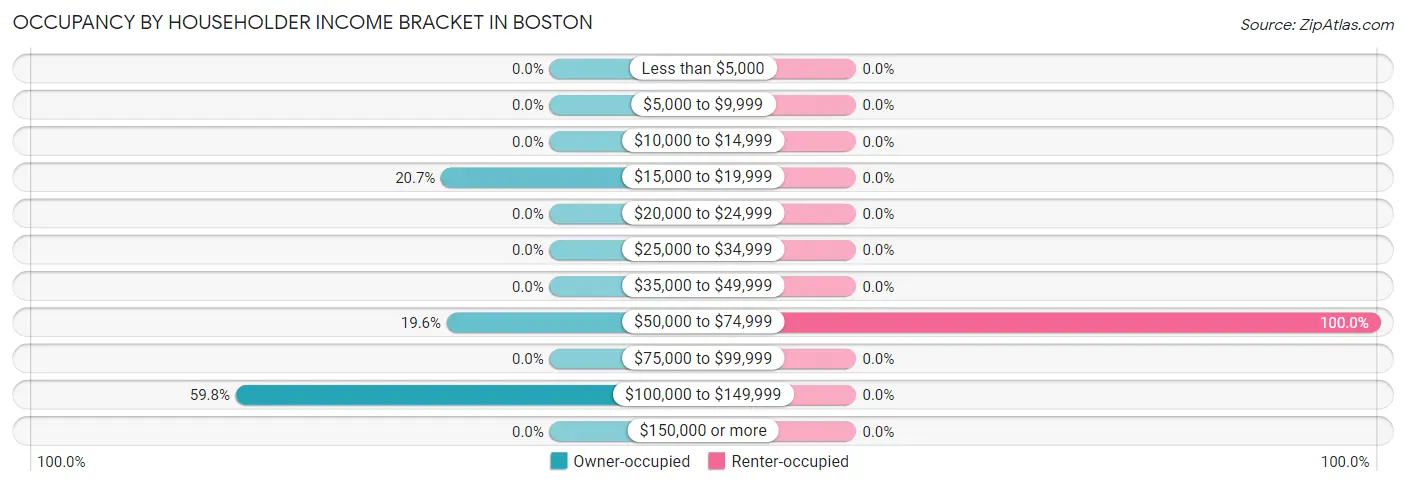
| Income Bracket | Owner-occupied | Renter-occupied |
| Less than $5,000 | 0 (0.0%) | 0 (0.0%) |
| $5,000 to $9,999 | 0 (0.0%) | 0 (0.0%) |
| $10,000 to $14,999 | 0 (0.0%) | 0 (0.0%) |
| $15,000 to $19,999 | 19 (20.6%) | 0 (0.0%) |
| $20,000 to $24,999 | 0 (0.0%) | 0 (0.0%) |
| $25,000 to $34,999 | 0 (0.0%) | 0 (0.0%) |
| $35,000 to $49,999 | 0 (0.0%) | 0 (0.0%) |
| $50,000 to $74,999 | 18 (19.6%) | 48 (100.0%) |
| $75,000 to $99,999 | 0 (0.0%) | 0 (0.0%) |
| $100,000 to $149,999 | 55 (59.8%) | 0 (0.0%) |
| $150,000 or more | 0 (0.0%) | 0 (0.0%) |
| Total | 92 (100.0%) | 48 (100.0%) |
Monthly Housing Cost Tiers in Boston
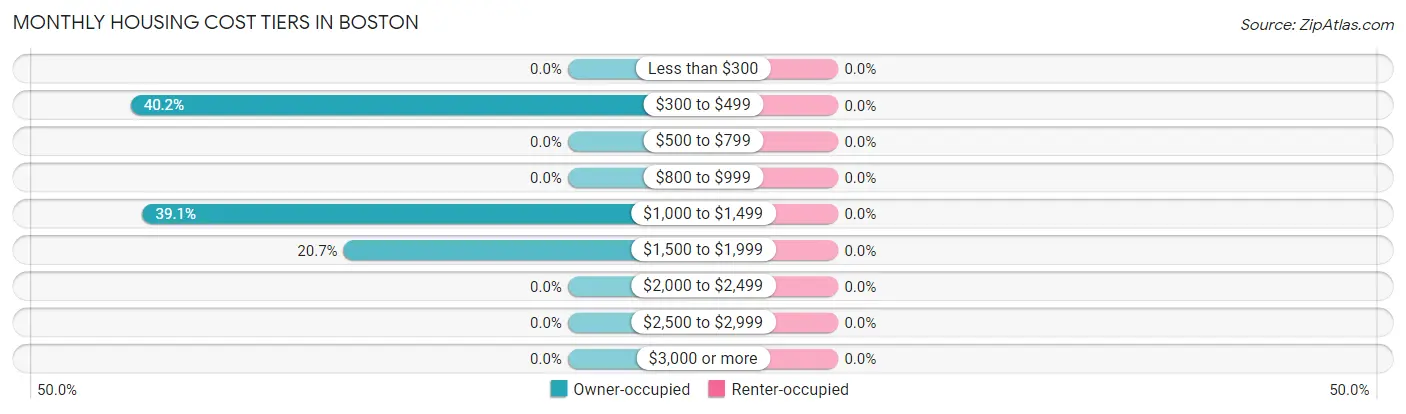
| Monthly Cost | Owner-occupied | Renter-occupied |
| Less than $300 | 0 (0.0%) | 0 (0.0%) |
| $300 to $499 | 37 (40.2%) | 0 (0.0%) |
| $500 to $799 | 0 (0.0%) | 0 (0.0%) |
| $800 to $999 | 0 (0.0%) | 0 (0.0%) |
| $1,000 to $1,499 | 36 (39.1%) | 0 (0.0%) |
| $1,500 to $1,999 | 19 (20.6%) | 0 (0.0%) |
| $2,000 to $2,499 | 0 (0.0%) | 0 (0.0%) |
| $2,500 to $2,999 | 0 (0.0%) | 0 (0.0%) |
| $3,000 or more | 0 (0.0%) | 0 (0.0%) |
| Total | 92 (100.0%) | 48 (100.0%) |
Physical Housing Characteristics in Boston
Housing Structures in Boston
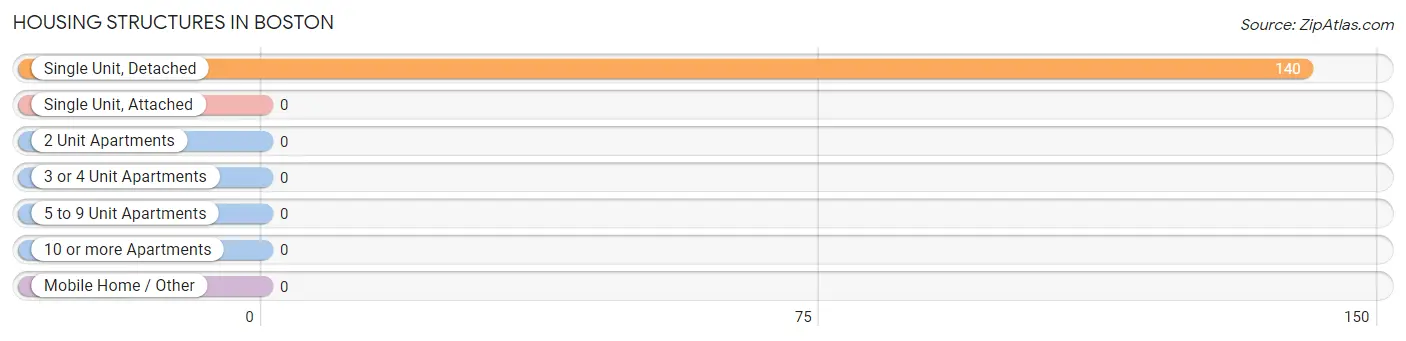
| Structure Type | # Housing Units | % Housing Units |
| Single Unit, Detached | 140 | 100.0% |
| Single Unit, Attached | 0 | 0.0% |
| 2 Unit Apartments | 0 | 0.0% |
| 3 or 4 Unit Apartments | 0 | 0.0% |
| 5 to 9 Unit Apartments | 0 | 0.0% |
| 10 or more Apartments | 0 | 0.0% |
| Mobile Home / Other | 0 | 0.0% |
| Total | 140 | 100.0% |
Housing Structures by Occupancy in Boston
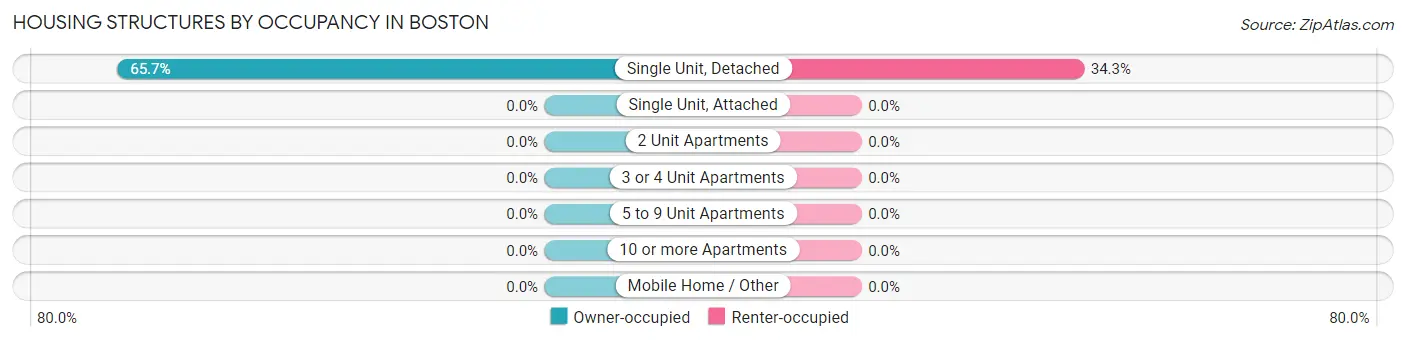
| Structure Type | Owner-occupied | Renter-occupied |
| Single Unit, Detached | 92 (65.7%) | 48 (34.3%) |
| Single Unit, Attached | 0 (0.0%) | 0 (0.0%) |
| 2 Unit Apartments | 0 (0.0%) | 0 (0.0%) |
| 3 or 4 Unit Apartments | 0 (0.0%) | 0 (0.0%) |
| 5 to 9 Unit Apartments | 0 (0.0%) | 0 (0.0%) |
| 10 or more Apartments | 0 (0.0%) | 0 (0.0%) |
| Mobile Home / Other | 0 (0.0%) | 0 (0.0%) |
| Total | 92 (65.7%) | 48 (34.3%) |
Housing Structures by Number of Rooms in Boston
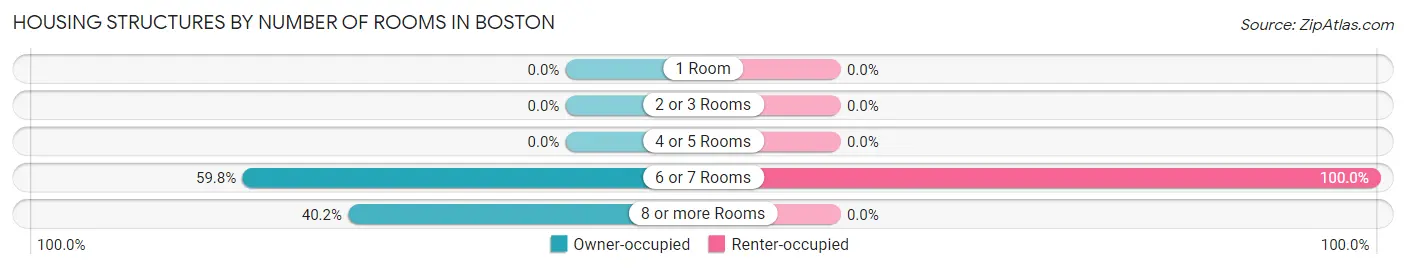
| Number of Rooms | Owner-occupied | Renter-occupied |
| 1 Room | 0 (0.0%) | 0 (0.0%) |
| 2 or 3 Rooms | 0 (0.0%) | 0 (0.0%) |
| 4 or 5 Rooms | 0 (0.0%) | 0 (0.0%) |
| 6 or 7 Rooms | 55 (59.8%) | 48 (100.0%) |
| 8 or more Rooms | 37 (40.2%) | 0 (0.0%) |
| Total | 92 (100.0%) | 48 (100.0%) |
Housing Structure by Heating Type in Boston
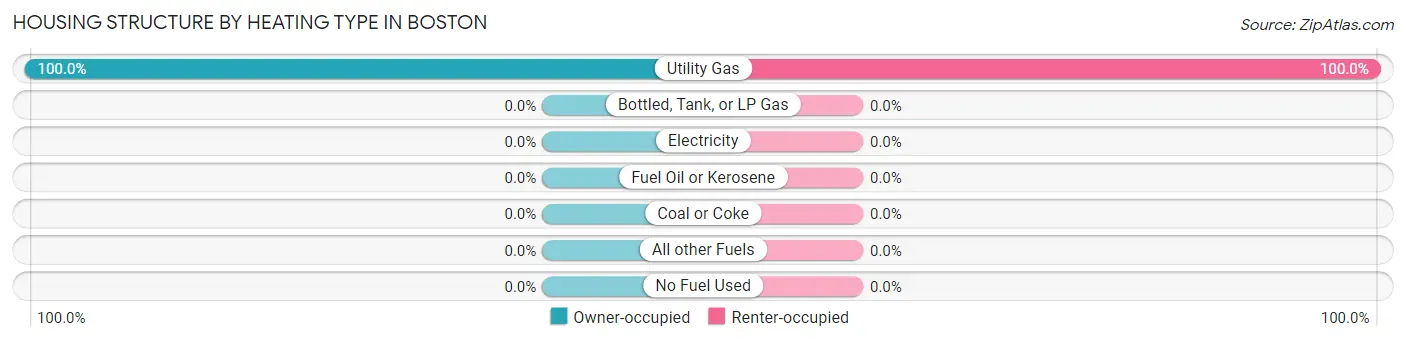
| Heating Type | Owner-occupied | Renter-occupied |
| Utility Gas | 92 (100.0%) | 48 (100.0%) |
| Bottled, Tank, or LP Gas | 0 (0.0%) | 0 (0.0%) |
| Electricity | 0 (0.0%) | 0 (0.0%) |
| Fuel Oil or Kerosene | 0 (0.0%) | 0 (0.0%) |
| Coal or Coke | 0 (0.0%) | 0 (0.0%) |
| All other Fuels | 0 (0.0%) | 0 (0.0%) |
| No Fuel Used | 0 (0.0%) | 0 (0.0%) |
| Total | 92 (100.0%) | 48 (100.0%) |
Household Vehicle Usage in Boston
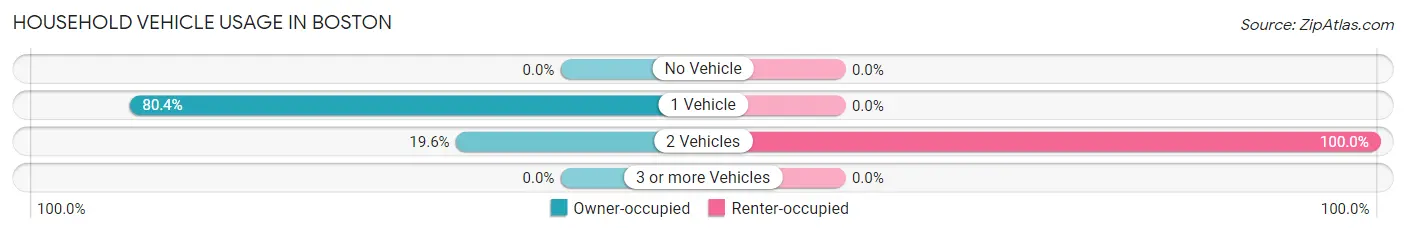
| Vehicles per Household | Owner-occupied | Renter-occupied |
| No Vehicle | 0 (0.0%) | 0 (0.0%) |
| 1 Vehicle | 74 (80.4%) | 0 (0.0%) |
| 2 Vehicles | 18 (19.6%) | 48 (100.0%) |
| 3 or more Vehicles | 0 (0.0%) | 0 (0.0%) |
| Total | 92 (100.0%) | 48 (100.0%) |
Real Estate & Mortgages in Boston
Real Estate and Mortgage Overview in Boston
| Characteristic | Without Mortgage | With Mortgage |
| Housing Units | 37 | 55 |
| Median Property Value | - | - |
| Median Household Income | - | - |
| Monthly Housing Costs | - | - |
| Real Estate Taxes | - | - |
Property Value by Mortgage Status in Boston
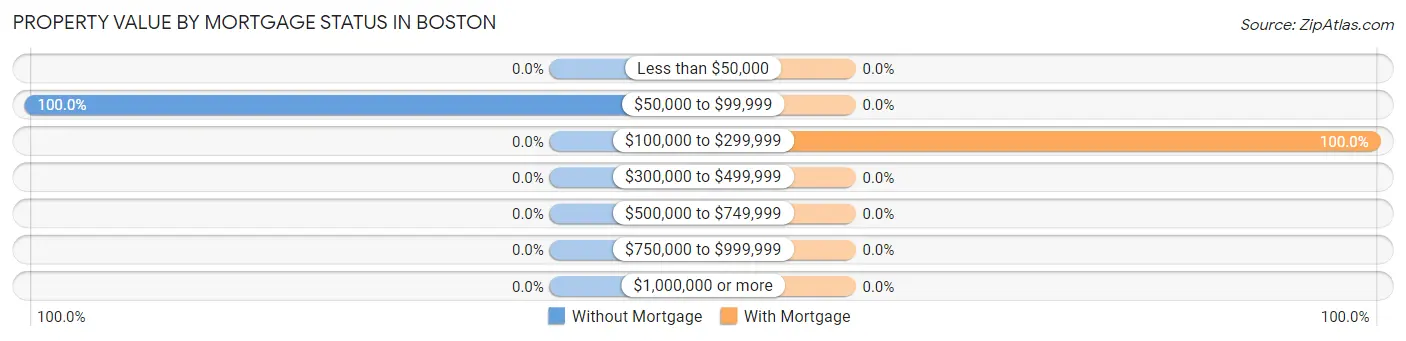
| Property Value | Without Mortgage | With Mortgage |
| Less than $50,000 | 0 (0.0%) | 0 (0.0%) |
| $50,000 to $99,999 | 37 (100.0%) | 0 (0.0%) |
| $100,000 to $299,999 | 0 (0.0%) | 55 (100.0%) |
| $300,000 to $499,999 | 0 (0.0%) | 0 (0.0%) |
| $500,000 to $749,999 | 0 (0.0%) | 0 (0.0%) |
| $750,000 to $999,999 | 0 (0.0%) | 0 (0.0%) |
| $1,000,000 or more | 0 (0.0%) | 0 (0.0%) |
| Total | 37 (100.0%) | 55 (100.0%) |
Household Income by Mortgage Status in Boston
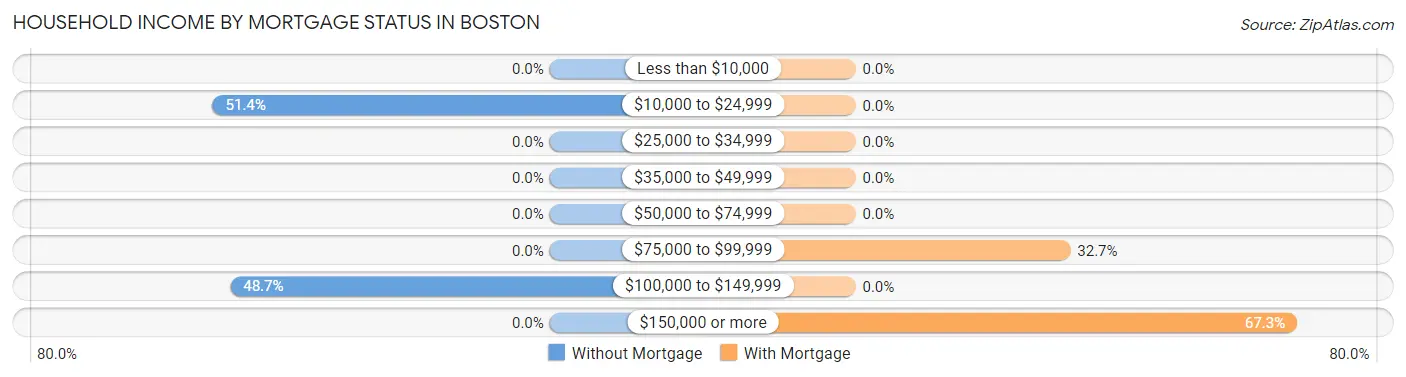
| Household Income | Without Mortgage | With Mortgage |
| Less than $10,000 | 0 (0.0%) | 0 (0.0%) |
| $10,000 to $24,999 | 19 (51.3%) | 0 (0.0%) |
| $25,000 to $34,999 | 0 (0.0%) | 0 (0.0%) |
| $35,000 to $49,999 | 0 (0.0%) | 0 (0.0%) |
| $50,000 to $74,999 | 0 (0.0%) | 0 (0.0%) |
| $75,000 to $99,999 | 0 (0.0%) | 18 (32.7%) |
| $100,000 to $149,999 | 18 (48.6%) | 0 (0.0%) |
| $150,000 or more | 0 (0.0%) | 37 (67.3%) |
| Total | 37 (100.0%) | 55 (100.0%) |
Property Value to Household Income Ratio in Boston
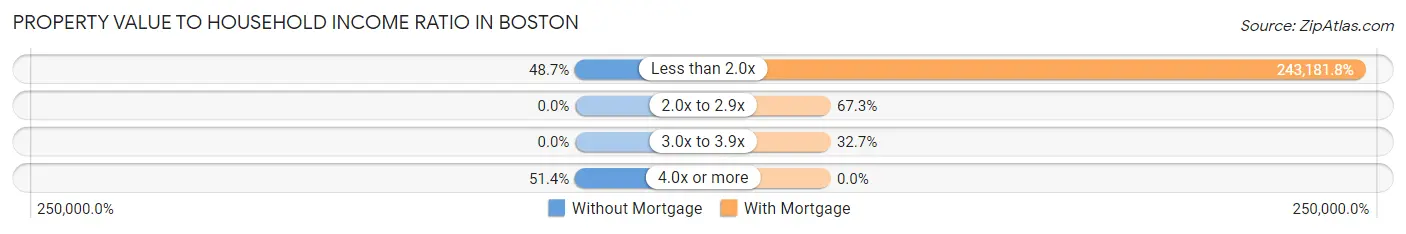
| Value-to-Income Ratio | Without Mortgage | With Mortgage |
| Less than 2.0x | 18 (48.6%) | 133,750 (243,181.8%) |
| 2.0x to 2.9x | 0 (0.0%) | 37 (67.3%) |
| 3.0x to 3.9x | 0 (0.0%) | 18 (32.7%) |
| 4.0x or more | 19 (51.3%) | 0 (0.0%) |
| Total | 37 (100.0%) | 55 (100.0%) |
Real Estate Taxes by Mortgage Status in Boston
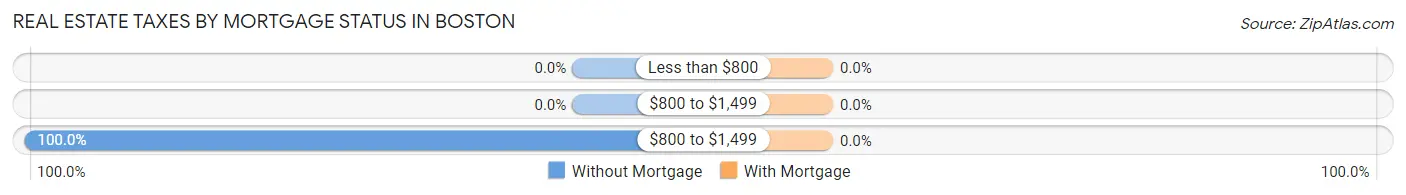
| Property Taxes | Without Mortgage | With Mortgage |
| Less than $800 | 0 (0.0%) | 0 (0.0%) |
| $800 to $1,499 | 0 (0.0%) | 0 (0.0%) |
| $800 to $1,499 | 37 (100.0%) | 0 (0.0%) |
| Total | 37 (100.0%) | 55 (100.0%) |
Health & Disability in Boston
Health Insurance Coverage by Age in Boston
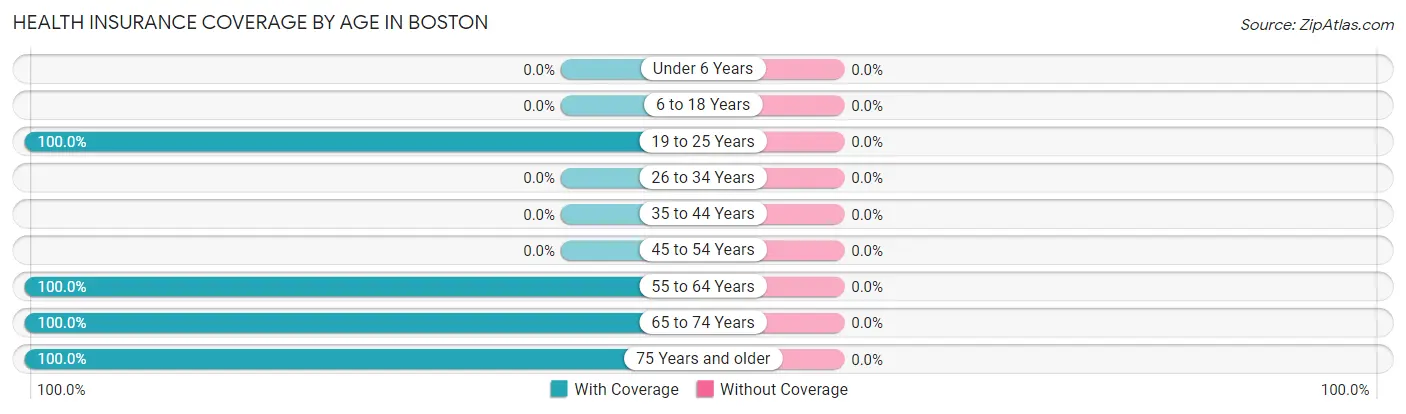
| Age Bracket | With Coverage | Without Coverage |
| Under 6 Years | 0 (0.0%) | 0 (0.0%) |
| 6 to 18 Years | 0 (0.0%) | 0 (0.0%) |
| 19 to 25 Years | 25 (100.0%) | 0 (0.0%) |
| 26 to 34 Years | 0 (0.0%) | 0 (0.0%) |
| 35 to 44 Years | 0 (0.0%) | 0 (0.0%) |
| 45 to 54 Years | 0 (0.0%) | 0 (0.0%) |
| 55 to 64 Years | 182 (100.0%) | 0 (0.0%) |
| 65 to 74 Years | 18 (100.0%) | 0 (0.0%) |
| 75 Years and older | 56 (100.0%) | 0 (0.0%) |
| Total | 281 (100.0%) | 0 (0.0%) |
Health Insurance Coverage by Citizenship Status in Boston
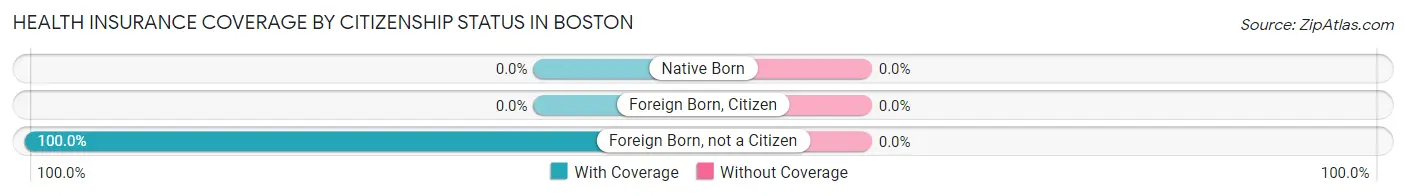
| Citizenship Status | With Coverage | Without Coverage |
| Native Born | 0 (0.0%) | 0 (0.0%) |
| Foreign Born, Citizen | 0 (0.0%) | 0 (0.0%) |
| Foreign Born, not a Citizen | 25 (100.0%) | 0 (0.0%) |
Health Insurance Coverage by Household Income in Boston
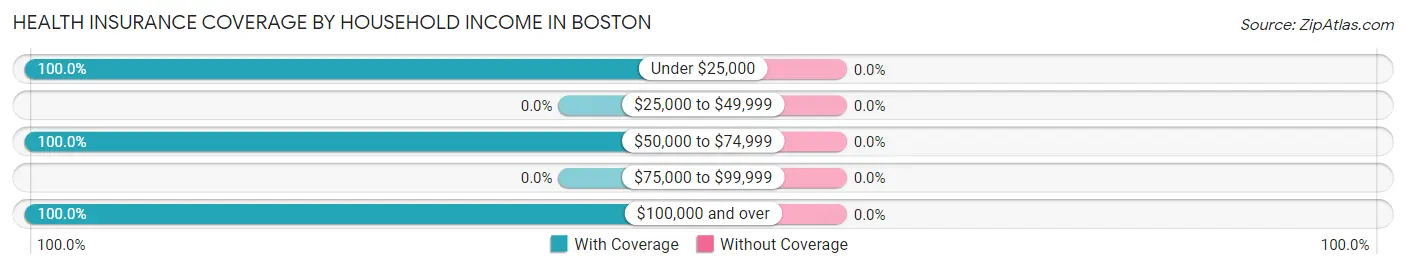
| Household Income | With Coverage | Without Coverage |
| Under $25,000 | 19 (100.0%) | 0 (0.0%) |
| $25,000 to $49,999 | 0 (0.0%) | 0 (0.0%) |
| $50,000 to $74,999 | 143 (100.0%) | 0 (0.0%) |
| $75,000 to $99,999 | 0 (0.0%) | 0 (0.0%) |
| $100,000 and over | 119 (100.0%) | 0 (0.0%) |
Public vs Private Health Insurance Coverage by Age in Boston
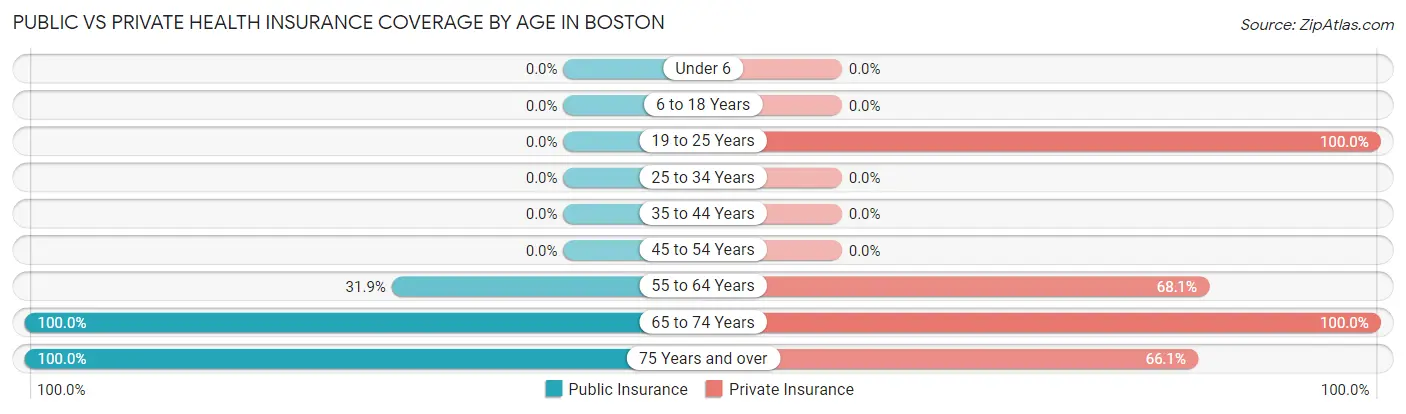
| Age Bracket | Public Insurance | Private Insurance |
| Under 6 | 0 (0.0%) | 0 (0.0%) |
| 6 to 18 Years | 0 (0.0%) | 0 (0.0%) |
| 19 to 25 Years | 0 (0.0%) | 25 (100.0%) |
| 25 to 34 Years | 0 (0.0%) | 0 (0.0%) |
| 35 to 44 Years | 0 (0.0%) | 0 (0.0%) |
| 45 to 54 Years | 0 (0.0%) | 0 (0.0%) |
| 55 to 64 Years | 58 (31.9%) | 124 (68.1%) |
| 65 to 74 Years | 18 (100.0%) | 18 (100.0%) |
| 75 Years and over | 56 (100.0%) | 37 (66.1%) |
| Total | 132 (47.0%) | 204 (72.6%) |
Disability Status by Sex by Age in Boston
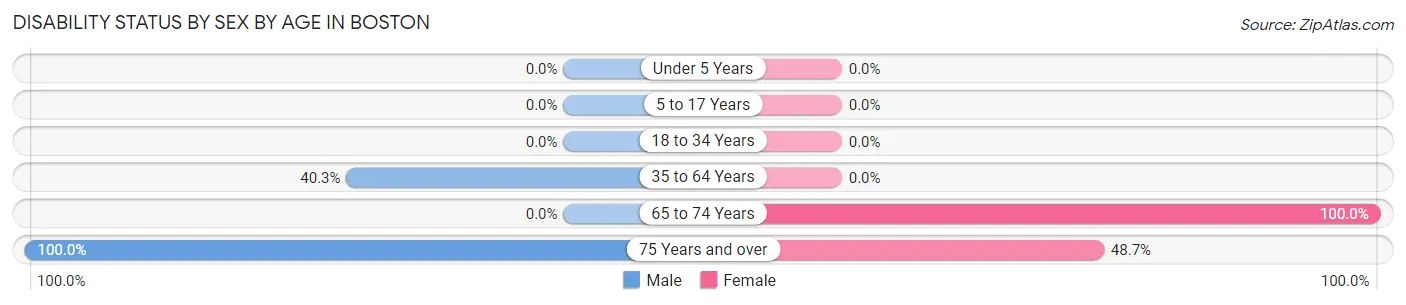
| Age Bracket | Male | Female |
| Under 5 Years | 0 (0.0%) | 0 (0.0%) |
| 5 to 17 Years | 0 (0.0%) | 0 (0.0%) |
| 18 to 34 Years | 0 (0.0%) | 0 (0.0%) |
| 35 to 64 Years | 58 (40.3%) | 0 (0.0%) |
| 65 to 74 Years | 0 (0.0%) | 18 (100.0%) |
| 75 Years and over | 19 (100.0%) | 18 (48.6%) |
Disability Class by Sex by Age in Boston
Disability Class: Hearing Difficulty
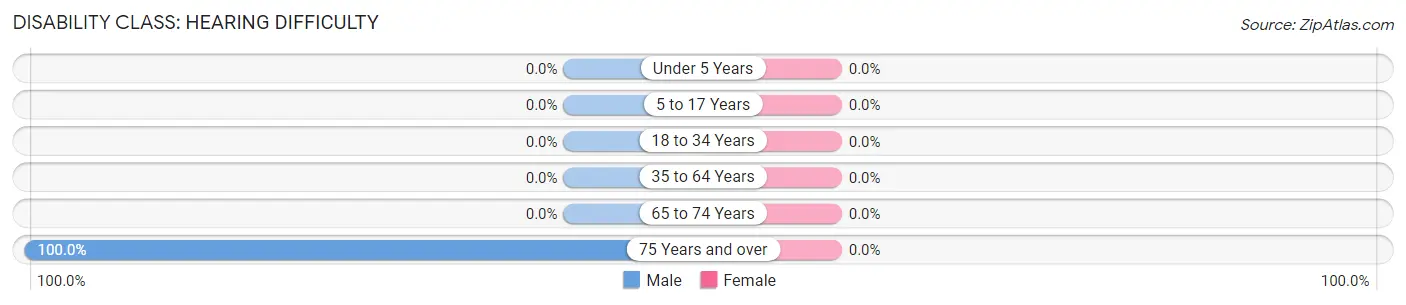
| Age Bracket | Male | Female |
| Under 5 Years | 0 (0.0%) | 0 (0.0%) |
| 5 to 17 Years | 0 (0.0%) | 0 (0.0%) |
| 18 to 34 Years | 0 (0.0%) | 0 (0.0%) |
| 35 to 64 Years | 0 (0.0%) | 0 (0.0%) |
| 65 to 74 Years | 0 (0.0%) | 0 (0.0%) |
| 75 Years and over | 19 (100.0%) | 0 (0.0%) |
Disability Class: Vision Difficulty
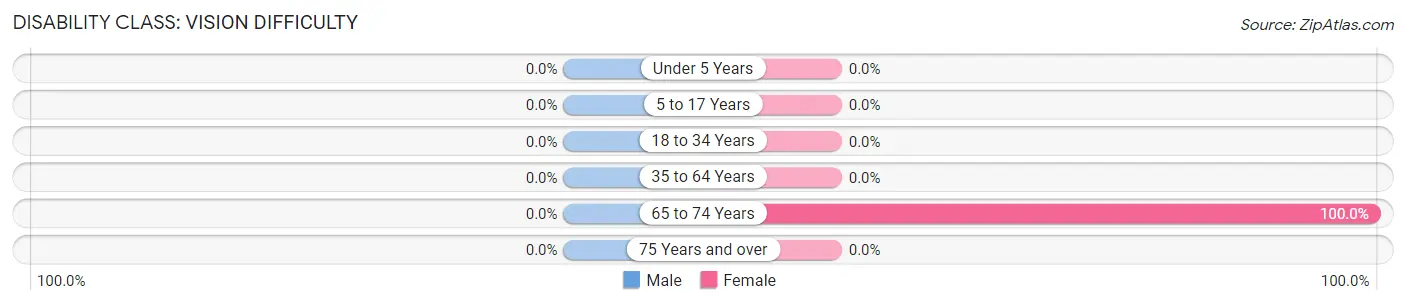
| Age Bracket | Male | Female |
| Under 5 Years | 0 (0.0%) | 0 (0.0%) |
| 5 to 17 Years | 0 (0.0%) | 0 (0.0%) |
| 18 to 34 Years | 0 (0.0%) | 0 (0.0%) |
| 35 to 64 Years | 0 (0.0%) | 0 (0.0%) |
| 65 to 74 Years | 0 (0.0%) | 18 (100.0%) |
| 75 Years and over | 0 (0.0%) | 0 (0.0%) |
Disability Class: Cognitive Difficulty
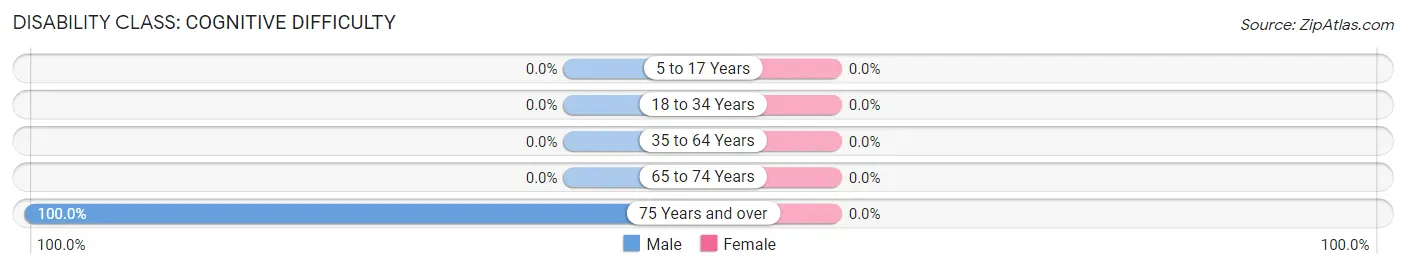
| Age Bracket | Male | Female |
| 5 to 17 Years | 0 (0.0%) | 0 (0.0%) |
| 18 to 34 Years | 0 (0.0%) | 0 (0.0%) |
| 35 to 64 Years | 0 (0.0%) | 0 (0.0%) |
| 65 to 74 Years | 0 (0.0%) | 0 (0.0%) |
| 75 Years and over | 19 (100.0%) | 0 (0.0%) |
Disability Class: Ambulatory Difficulty
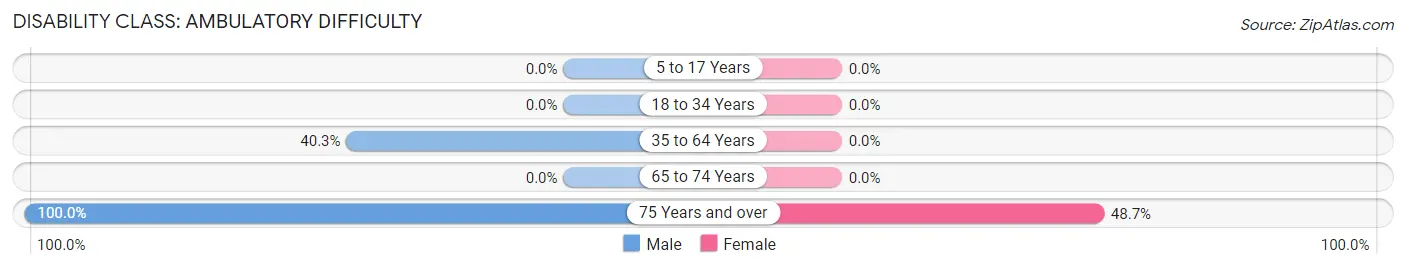
| Age Bracket | Male | Female |
| 5 to 17 Years | 0 (0.0%) | 0 (0.0%) |
| 18 to 34 Years | 0 (0.0%) | 0 (0.0%) |
| 35 to 64 Years | 58 (40.3%) | 0 (0.0%) |
| 65 to 74 Years | 0 (0.0%) | 0 (0.0%) |
| 75 Years and over | 19 (100.0%) | 18 (48.6%) |
Disability Class: Self-Care Difficulty
| Age Bracket | Male | Female |
| 5 to 17 Years | 0 (0.0%) | 0 (0.0%) |
| 18 to 34 Years | 0 (0.0%) | 0 (0.0%) |
| 35 to 64 Years | 0 (0.0%) | 0 (0.0%) |
| 65 to 74 Years | 0 (0.0%) | 0 (0.0%) |
| 75 Years and over | 0 (0.0%) | 0 (0.0%) |
Technology Access in Boston
Computing Device Access in Boston
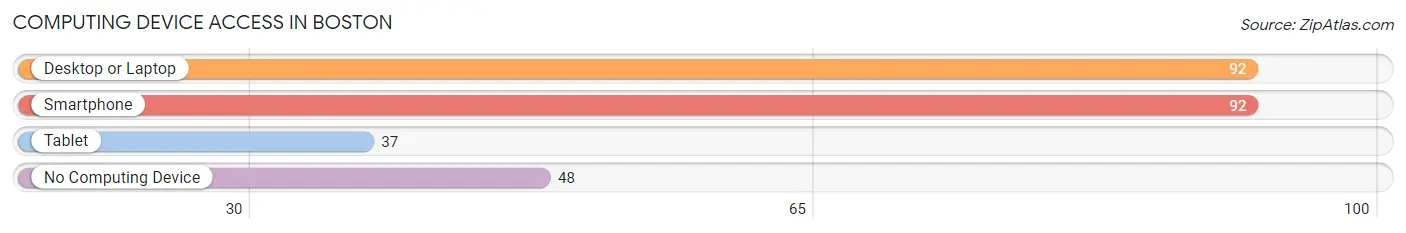
| Device Type | # Households | % Households |
| Desktop or Laptop | 92 | 65.7% |
| Smartphone | 92 | 65.7% |
| Tablet | 37 | 26.4% |
| No Computing Device | 48 | 34.3% |
| Total | 140 | 100.0% |
Internet Access in Boston
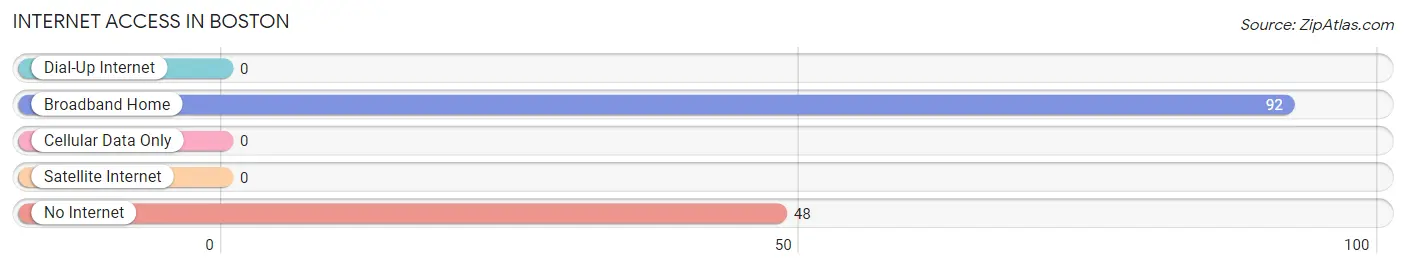
| Internet Type | # Households | % Households |
| Dial-Up Internet | 0 | 0.0% |
| Broadband Home | 92 | 65.7% |
| Cellular Data Only | 0 | 0.0% |
| Satellite Internet | 0 | 0.0% |
| No Internet | 48 | 34.3% |
| Total | 140 | 100.0% |
Boston Summary
Boston is the capital and most populous city of the Commonwealth of Massachusetts in the United States. It is also the largest city in New England, and the 21st most populous city in the United States. The city is the economic and cultural anchor of a substantially larger metropolitan area known as Greater Boston, a metropolitan statistical area (MSA) home to a census-estimated 4.8 million people in 2016 and ranking as the tenth-largest such area in the country. As a combined statistical area (CSA), this wider commuting region is home to some 8.2 million people, making it the sixth-largest in the United States.
History
Boston was founded in 1630 by Puritan colonists from England. It was the scene of several key events of the American Revolution, such as the Boston Massacre, the Boston Tea Party, the Battle of Bunker Hill, and the Siege of Boston. Upon American independence from Great Britain, the city continued to be an important port and manufacturing hub, as well as a center for education and culture. Through land reclamation and municipal annexation, Boston has expanded beyond the original peninsula. Its rich history attracts many tourists, with Faneuil Hall alone drawing more than 20 million visitors per year.
Geography
Boston is located at the center of Massachusetts' eastern coastline, approximately 48 miles (77 km) east of Worcester and 37 miles (60 km) northeast of Providence, Rhode Island. The city is the northernmost city in the United States with a population of over 500,000. The city is situated on the Shawmut Peninsula, which juts out into Massachusetts Bay and the Atlantic Ocean. The city is surrounded by the larger cities of Cambridge to the north, Somerville and Medford to the northwest, and Brookline and the long-separated city of Chelsea to the west. To the east lie the towns of Winthrop, Revere, and the city of Quincy. To the south lies the city of Newton and the town of Brookline.
Economy
Boston's economy is based on research, finance, and technology—principally biotechnology. The city is home to several major financial institutions such as Fidelity Investments, State Street Corporation, and Liberty Mutual Insurance Group. The city is also home to several universities and colleges, including Harvard University, the Massachusetts Institute of Technology, Boston University, Northeastern University, and Tufts University.
Demographics
As of the 2010 United States Census, there were 617,594 people, 270,491 households, and 139,169 families residing in the city. The population density was 12,166.2 people per square mile (4,689.2/km2). There were 294,717 housing units at an average density of 5,717.7 per square mile (2,214.2/km2). The racial makeup of the city was 63.2% White, 25.2% African American, 0.3% Native American, 6.8% Asian, 0.1% Pacific Islander, 2.5% from other races, and 2.0% from two or more races. Hispanic or Latino of any race were 8.9% of the population.
The median income for a household in the city was $53,018, and the median income for a family was $62,912. Males had a median income of $41,890 versus $35,811 for females. The per capita income for the city was $29,811. About 13.3% of families and 17.2% of the population were below the poverty line, including 25.9% of those under age 18 and 13.2% of those age 65 or over.
Common Questions
What is Per Capita Income in Boston?
Per Capita income in Boston is $40,863.
What is the Median Household income in Boston?
Median Household Income in Boston is $61,719.
What is Inequality or Gini Index in Boston?
Inequality or Gini Index in Boston is 0.28.
What is the Total Population of Boston?
Total Population of Boston is 281.
What is the Total Male Population of Boston?
Total Male Population of Boston is 188.
What is the Total Female Population of Boston?
Total Female Population of Boston is 93.
What is the Ratio of Males per 100 Females in Boston?
There are 202.15 Males per 100 Females in Boston.
What is the Ratio of Females per 100 Males in Boston?
There are 49.47 Females per 100 Males in Boston.
What is the Median Population Age in Boston?
Median Population Age in Boston is 58.5 Years.
What is the Average Family Size in Boston
Average Family Size in Boston is 2.4 People.
What is the Average Household Size in Boston
Average Household Size in Boston is 2.0 People.
How Large is the Labor Force in Boston?
There are 105 People in the Labor Forcein in Boston.
What is the Percentage of People in the Labor Force in Boston?
37.4% of People are in the Labor Force in Boston.