Northwood, PA Map & Demographics
Northwood Map
Northwood Overview
$25,256
PER CAPITA INCOME
0.33
INEQUALITY / GINI INDEX
147
TOTAL POPULATION
58
MALE POPULATION
89
FEMALE POPULATION
65.17
MALES / 100 FEMALES
153.45
FEMALES / 100 MALES
62.5
MEDIAN AGE
3.2
AVG FAMILY SIZE
2.0
AVG HOUSEHOLD SIZE
95
LABOR FORCE [ PEOPLE ]
71.4%
PERCENT IN LABOR FORCE
13.7%
UNEMPLOYMENT RATE
Income in Northwood
Income Overview in Northwood
| Characteristic | Number | Measure |
| Per Capita Income | 147 | $25,256 |
| Median Family Income | 25 | $0 |
| Mean Family Income | 25 | $53,856 |
| Median Household Income | 74 | $0 |
| Mean Household Income | 74 | $47,447 |
| Income Deficit | 25 | $0 |
| Wage / Income Gap (%) | 147 | 0.00% |
| Wage / Income Gap ($) | 147 | 100.00¢ per $1 |
| Gini / Inequality Index | 147 | 0.33 |
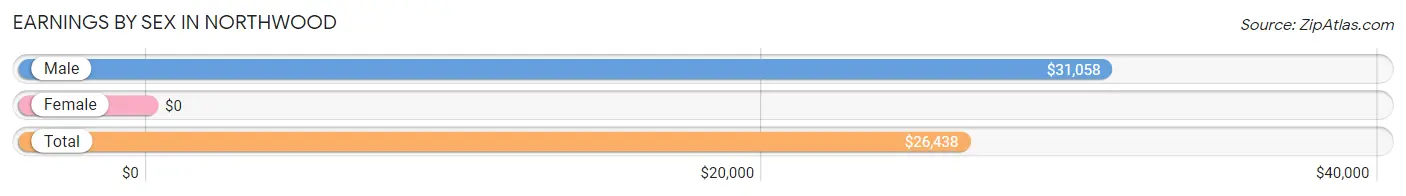
Earnings by Sex in Northwood
| Sex | Number | Average Earnings |
| Male | 37 (41.6%) | $31,058 |
| Female | 52 (58.4%) | $0 |
| Total | 89 (100.0%) | $26,438 |
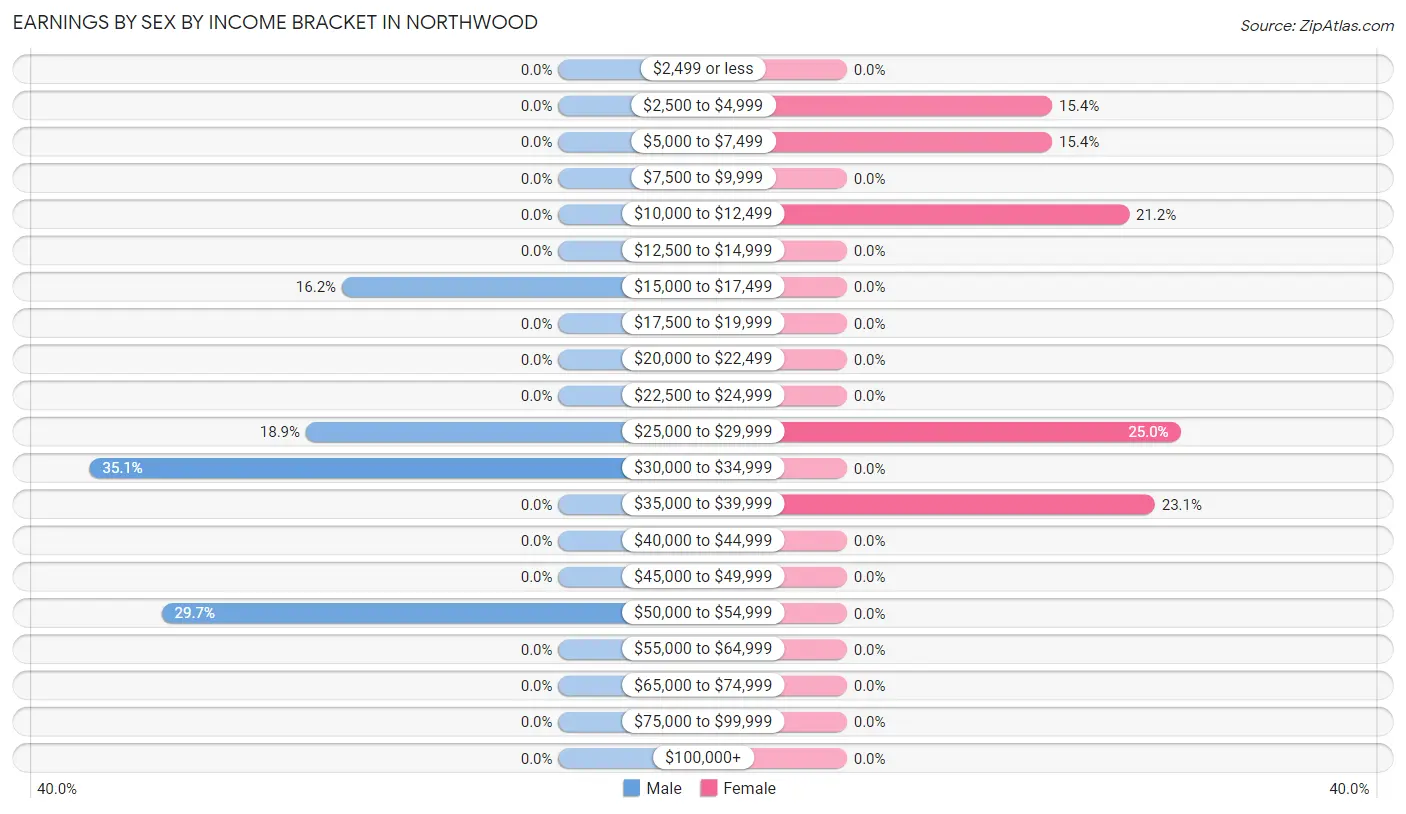
Earnings by Sex by Income Bracket in Northwood
The most common earnings brackets in Northwood are $30,000 to $34,999 for men (13 | 35.1%) and $25,000 to $29,999 for women (13 | 25.0%).
| Income | Male | Female |
| $2,499 or less | 0 (0.0%) | 0 (0.0%) |
| $2,500 to $4,999 | 0 (0.0%) | 8 (15.4%) |
| $5,000 to $7,499 | 0 (0.0%) | 8 (15.4%) |
| $7,500 to $9,999 | 0 (0.0%) | 0 (0.0%) |
| $10,000 to $12,499 | 0 (0.0%) | 11 (21.1%) |
| $12,500 to $14,999 | 0 (0.0%) | 0 (0.0%) |
| $15,000 to $17,499 | 6 (16.2%) | 0 (0.0%) |
| $17,500 to $19,999 | 0 (0.0%) | 0 (0.0%) |
| $20,000 to $22,499 | 0 (0.0%) | 0 (0.0%) |
| $22,500 to $24,999 | 0 (0.0%) | 0 (0.0%) |
| $25,000 to $29,999 | 7 (18.9%) | 13 (25.0%) |
| $30,000 to $34,999 | 13 (35.1%) | 0 (0.0%) |
| $35,000 to $39,999 | 0 (0.0%) | 12 (23.1%) |
| $40,000 to $44,999 | 0 (0.0%) | 0 (0.0%) |
| $45,000 to $49,999 | 0 (0.0%) | 0 (0.0%) |
| $50,000 to $54,999 | 11 (29.7%) | 0 (0.0%) |
| $55,000 to $64,999 | 0 (0.0%) | 0 (0.0%) |
| $65,000 to $74,999 | 0 (0.0%) | 0 (0.0%) |
| $75,000 to $99,999 | 0 (0.0%) | 0 (0.0%) |
| $100,000+ | 0 (0.0%) | 0 (0.0%) |
| Total | 37 (100.0%) | 52 (100.0%) |
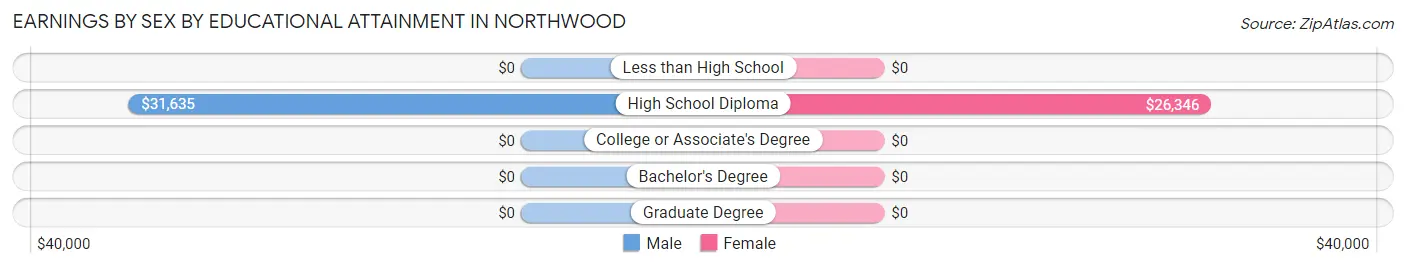
Earnings by Sex by Educational Attainment in Northwood
| Educational Attainment | Male Income | Female Income |
| Less than High School | - | - |
| High School Diploma | $31,635 | $26,346 |
| College or Associate's Degree | - | - |
| Bachelor's Degree | - | - |
| Graduate Degree | - | - |
| Total | $31,058 | $0 |
Family Income in Northwood
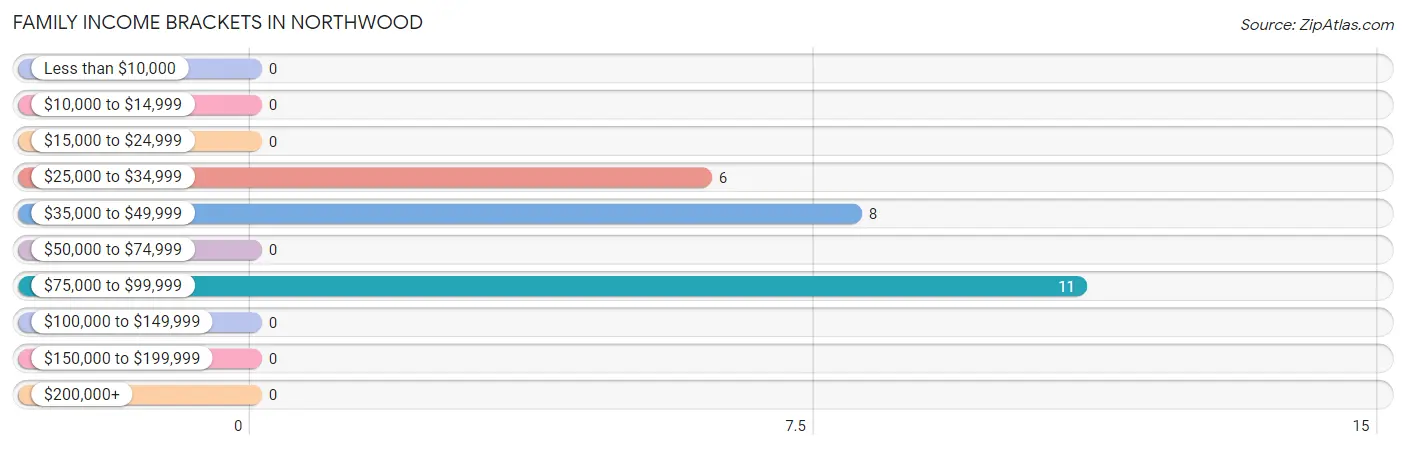
Family Income Brackets in Northwood
According to the Northwood family income data, there are 11 families falling into the $75,000 to $99,999 income range, which is the most common income bracket and makes up 44.0% of all families.
| Income Bracket | # Families | % Families |
| Less than $10,000 | 0 | 0.0% |
| $10,000 to $14,999 | 0 | 0.0% |
| $15,000 to $24,999 | 0 | 0.0% |
| $25,000 to $34,999 | 6 | 24.0% |
| $35,000 to $49,999 | 8 | 32.0% |
| $50,000 to $74,999 | 0 | 0.0% |
| $75,000 to $99,999 | 11 | 44.0% |
| $100,000 to $149,999 | 0 | 0.0% |
| $150,000 to $199,999 | 0 | 0.0% |
| $200,000+ | 0 | 0.0% |
Family Income by Famaliy Size in Northwood
| Income Bracket | # Families | Median Income |
| 2-Person Families | 6 (24.0%) | $0 |
| 3-Person Families | 11 (44.0%) | $0 |
| 4-Person Families | 8 (32.0%) | $0 |
| 5-Person Families | 0 (0.0%) | $0 |
| 6-Person Families | 0 (0.0%) | $0 |
| 7+ Person Families | 0 (0.0%) | $0 |
| Total | 25 (100.0%) | $0 |
Family Income by Number of Earners in Northwood
| Number of Earners | # Families | Median Income |
| No Earners | 6 (24.0%) | $0 |
| 1 Earner | 0 (0.0%) | $0 |
| 2 Earners | 8 (32.0%) | $0 |
| 3+ Earners | 11 (44.0%) | $0 |
| Total | 25 (100.0%) | $0 |
Household Income in Northwood
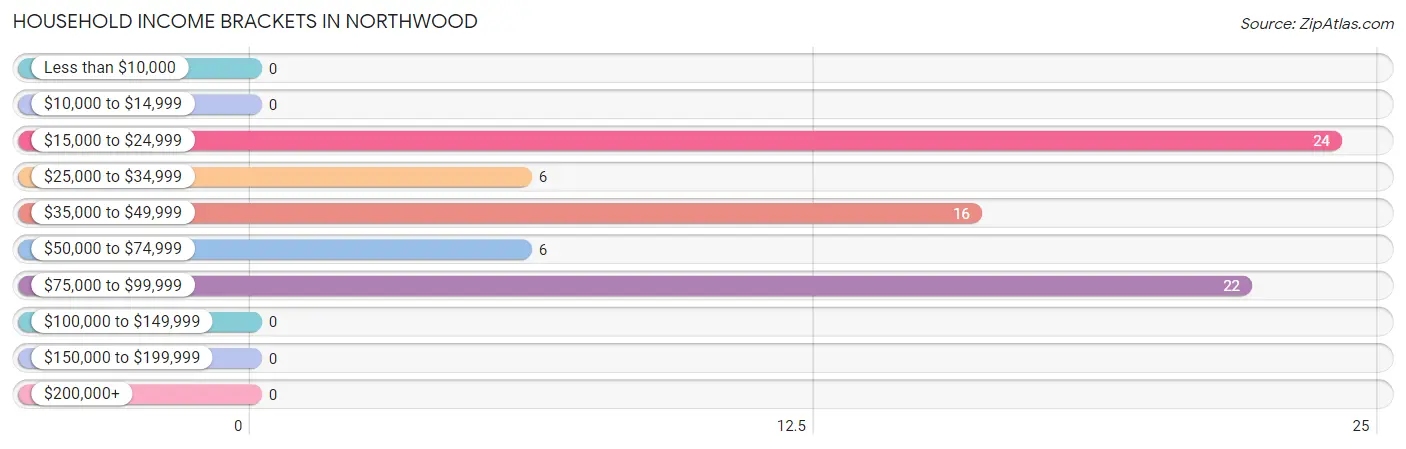
Household Income Brackets in Northwood
With 24 households falling in the category, the $15,000 to $24,999 income range is the most frequent in Northwood, accounting for 32.4% of all households.
| Income Bracket | # Households | % Households |
| Less than $10,000 | 0 | 0.0% |
| $10,000 to $14,999 | 0 | 0.0% |
| $15,000 to $24,999 | 24 | 32.4% |
| $25,000 to $34,999 | 6 | 8.1% |
| $35,000 to $49,999 | 16 | 21.6% |
| $50,000 to $74,999 | 6 | 8.1% |
| $75,000 to $99,999 | 22 | 29.7% |
| $100,000 to $149,999 | 0 | 0.0% |
| $150,000 to $199,999 | 0 | 0.0% |
| $200,000+ | 0 | 0.0% |
Household Income by Householder Age in Northwood
| Income Bracket | # Households | Median Income |
| 15 to 24 Years | 0 (0.0%) | $0 |
| 25 to 44 Years | 8 (10.8%) | $0 |
| 45 to 64 Years | 17 (23.0%) | $0 |
| 65+ Years | 49 (66.2%) | $0 |
| Total | 74 (100.0%) | $0 |
Poverty in Northwood
Income Below Poverty by Sex and Age in Northwood
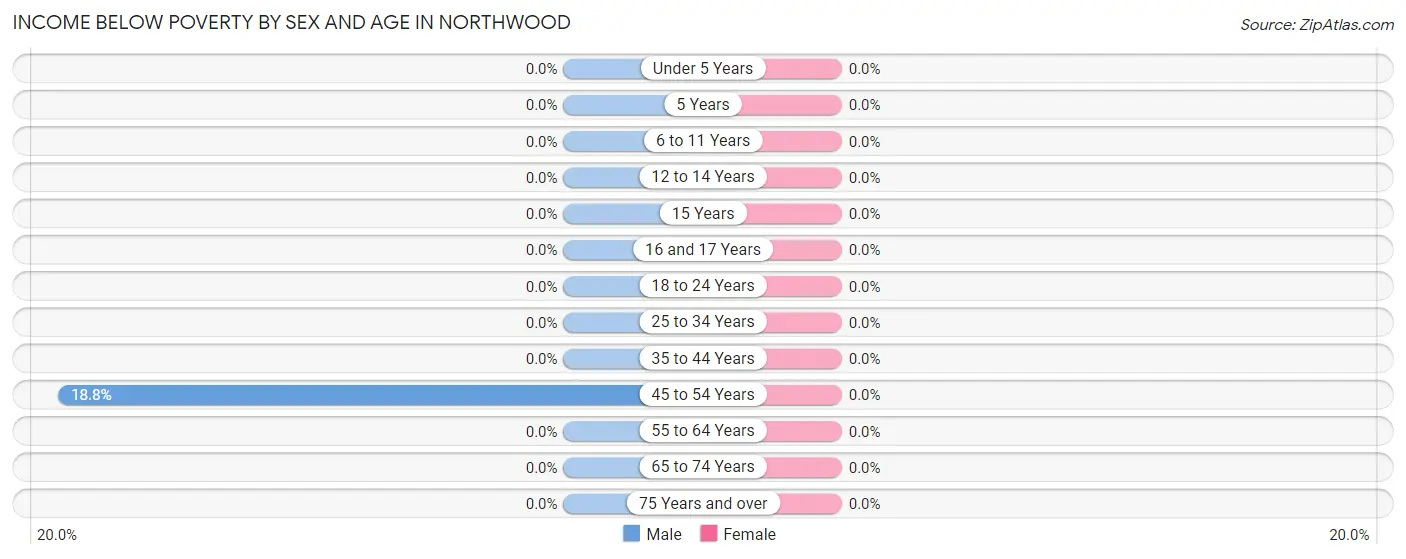
| Age Bracket | Male | Female |
| Under 5 Years | 0 (0.0%) | 0 (0.0%) |
| 5 Years | 0 (0.0%) | 0 (0.0%) |
| 6 to 11 Years | 0 (0.0%) | 0 (0.0%) |
| 12 to 14 Years | 0 (0.0%) | 0 (0.0%) |
| 15 Years | 0 (0.0%) | 0 (0.0%) |
| 16 and 17 Years | 0 (0.0%) | 0 (0.0%) |
| 18 to 24 Years | 0 (0.0%) | 0 (0.0%) |
| 25 to 34 Years | 0 (0.0%) | 0 (0.0%) |
| 35 to 44 Years | 0 (0.0%) | 0 (0.0%) |
| 45 to 54 Years | 6 (18.8%) | 0 (0.0%) |
| 55 to 64 Years | 0 (0.0%) | 0 (0.0%) |
| 65 to 74 Years | 0 (0.0%) | 0 (0.0%) |
| 75 Years and over | 0 (0.0%) | 0 (0.0%) |
| Total | 6 (10.3%) | 0 (0.0%) |
Income Above Poverty by Sex and Age in Northwood
According to the poverty statistics in Northwood, males aged 6 to 11 years and females aged 6 to 11 years are the age groups that are most secure financially, with 100.0% of males and 100.0% of females in these age groups living above the poverty line.
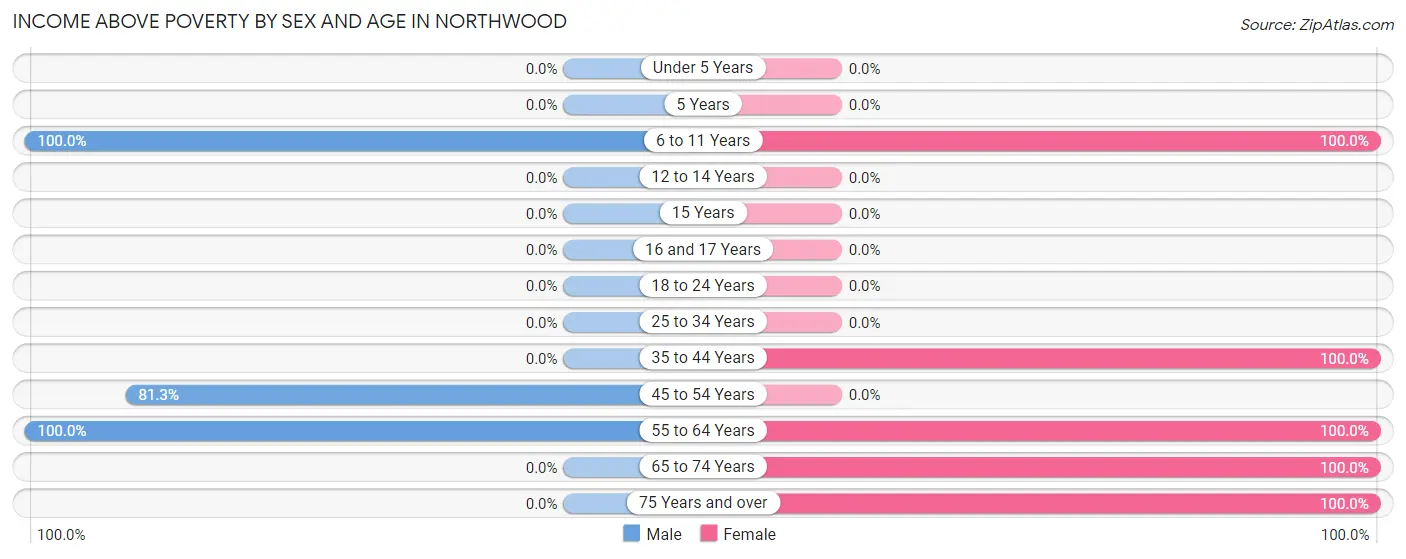
| Age Bracket | Male | Female |
| Under 5 Years | 0 (0.0%) | 0 (0.0%) |
| 5 Years | 0 (0.0%) | 0 (0.0%) |
| 6 to 11 Years | 7 (100.0%) | 7 (100.0%) |
| 12 to 14 Years | 0 (0.0%) | 0 (0.0%) |
| 15 Years | 0 (0.0%) | 0 (0.0%) |
| 16 and 17 Years | 0 (0.0%) | 0 (0.0%) |
| 18 to 24 Years | 0 (0.0%) | 0 (0.0%) |
| 25 to 34 Years | 0 (0.0%) | 0 (0.0%) |
| 35 to 44 Years | 0 (0.0%) | 8 (100.0%) |
| 45 to 54 Years | 26 (81.2%) | 0 (0.0%) |
| 55 to 64 Years | 19 (100.0%) | 25 (100.0%) |
| 65 to 74 Years | 0 (0.0%) | 19 (100.0%) |
| 75 Years and over | 0 (0.0%) | 30 (100.0%) |
| Total | 52 (89.7%) | 89 (100.0%) |
Income Below Poverty Among Married-Couple Families in Northwood
| Children | Above Poverty | Below Poverty |
| No Children | 0 (0.0%) | 0 (0.0%) |
| 1 or 2 Children | 8 (100.0%) | 0 (0.0%) |
| 3 or 4 Children | 0 (0.0%) | 0 (0.0%) |
| 5 or more Children | 0 (0.0%) | 0 (0.0%) |
| Total | 8 (100.0%) | 0 (0.0%) |
Income Below Poverty Among Single-Parent Households in Northwood
| Children | Single Father | Single Mother |
| No Children | 0 (0.0%) | 0 (0.0%) |
| 1 or 2 Children | 0 (0.0%) | 0 (0.0%) |
| 3 or 4 Children | 0 (0.0%) | 0 (0.0%) |
| 5 or more Children | 0 (0.0%) | 0 (0.0%) |
| Total | 0 (0.0%) | 0 (0.0%) |
Income Below Poverty Among Married-Couple vs Single-Parent Households in Northwood
| Children | Married-Couple Families | Single-Parent Households |
| No Children | 0 (0.0%) | 0 (0.0%) |
| 1 or 2 Children | 0 (0.0%) | 0 (0.0%) |
| 3 or 4 Children | 0 (0.0%) | 0 (0.0%) |
| 5 or more Children | 0 (0.0%) | 0 (0.0%) |
| Total | 0 (0.0%) | 0 (0.0%) |
Race in Northwood
The most populous races in Northwood are , and White / Caucasian (147 | 100.0%).
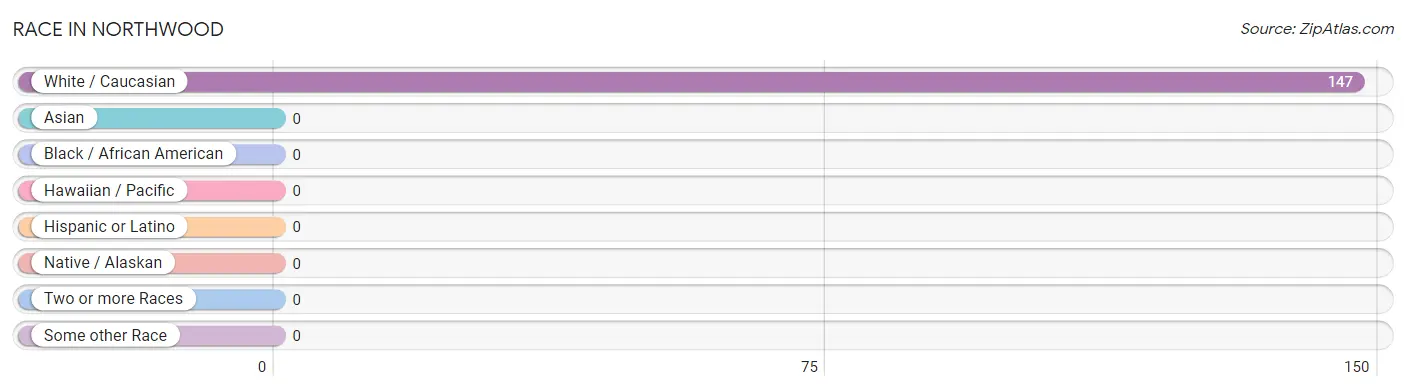
| Race | # Population | % Population |
| Asian | 0 | 0.0% |
| Black / African American | 0 | 0.0% |
| Hawaiian / Pacific | 0 | 0.0% |
| Hispanic or Latino | 0 | 0.0% |
| Native / Alaskan | 0 | 0.0% |
| White / Caucasian | 147 | 100.0% |
| Two or more Races | 0 | 0.0% |
| Some other Race | 0 | 0.0% |
| Total | 147 | 100.0% |
Ancestry in Northwood
The most populous ancestries reported in Northwood are German (44 | 29.9%), Irish (32 | 21.8%), American (31 | 21.1%), and English (24 | 16.3%), together accounting for 89.1% of all Northwood residents.
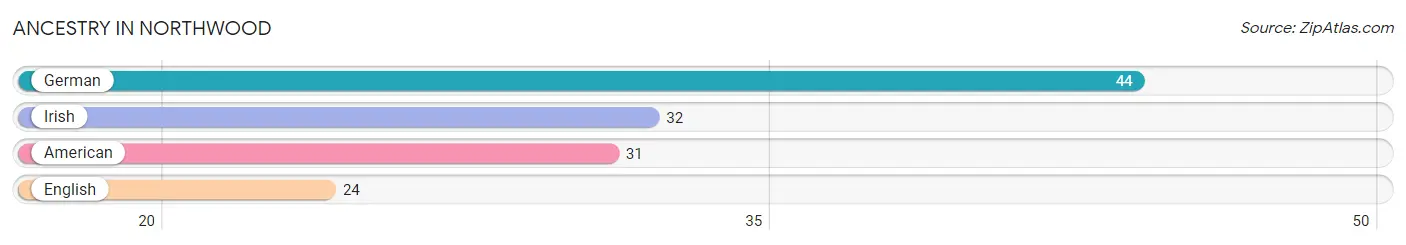
| Ancestry | # Population | % Population |
| American | 31 | 21.1% |
| English | 24 | 16.3% |
| German | 44 | 29.9% |
| Irish | 32 | 21.8% | View All 4 Rows |
Immigrants in Northwood

| Immigration Origin | # Population | % Population | View All 0 Rows |
Sex and Age in Northwood
Sex and Age in Northwood
The most populous age groups in Northwood are 45 to 49 Years (26 | 44.8%) for men and 80 to 84 Years (24 | 27.0%) for women.
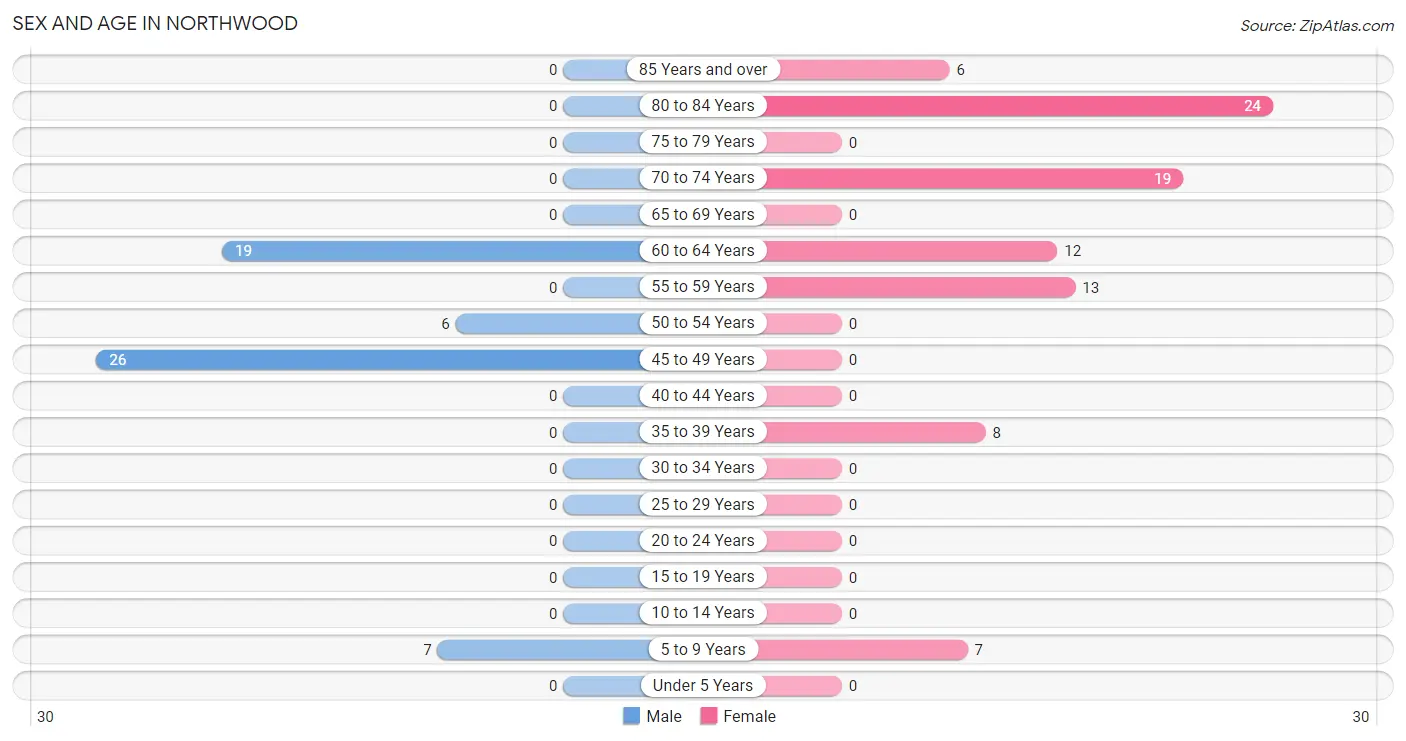
| Age Bracket | Male | Female |
| Under 5 Years | 0 (0.0%) | 0 (0.0%) |
| 5 to 9 Years | 7 (12.1%) | 7 (7.9%) |
| 10 to 14 Years | 0 (0.0%) | 0 (0.0%) |
| 15 to 19 Years | 0 (0.0%) | 0 (0.0%) |
| 20 to 24 Years | 0 (0.0%) | 0 (0.0%) |
| 25 to 29 Years | 0 (0.0%) | 0 (0.0%) |
| 30 to 34 Years | 0 (0.0%) | 0 (0.0%) |
| 35 to 39 Years | 0 (0.0%) | 8 (9.0%) |
| 40 to 44 Years | 0 (0.0%) | 0 (0.0%) |
| 45 to 49 Years | 26 (44.8%) | 0 (0.0%) |
| 50 to 54 Years | 6 (10.3%) | 0 (0.0%) |
| 55 to 59 Years | 0 (0.0%) | 13 (14.6%) |
| 60 to 64 Years | 19 (32.8%) | 12 (13.5%) |
| 65 to 69 Years | 0 (0.0%) | 0 (0.0%) |
| 70 to 74 Years | 0 (0.0%) | 19 (21.3%) |
| 75 to 79 Years | 0 (0.0%) | 0 (0.0%) |
| 80 to 84 Years | 0 (0.0%) | 24 (27.0%) |
| 85 Years and over | 0 (0.0%) | 6 (6.7%) |
| Total | 58 (100.0%) | 89 (100.0%) |
Families and Households in Northwood
Median Family Size in Northwood
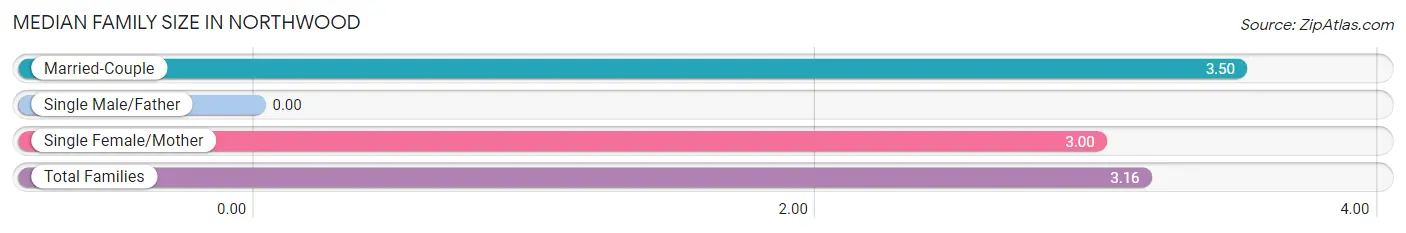
| Family Type | # Families | Family Size |
| Married-Couple | 8 (32.0%) | 3.50 |
| Single Male/Father | 0 (0.0%) | - |
| Single Female/Mother | 17 (68.0%) | 3.00 |
| Total Families | 25 (100.0%) | 3.16 |
Median Household Size in Northwood
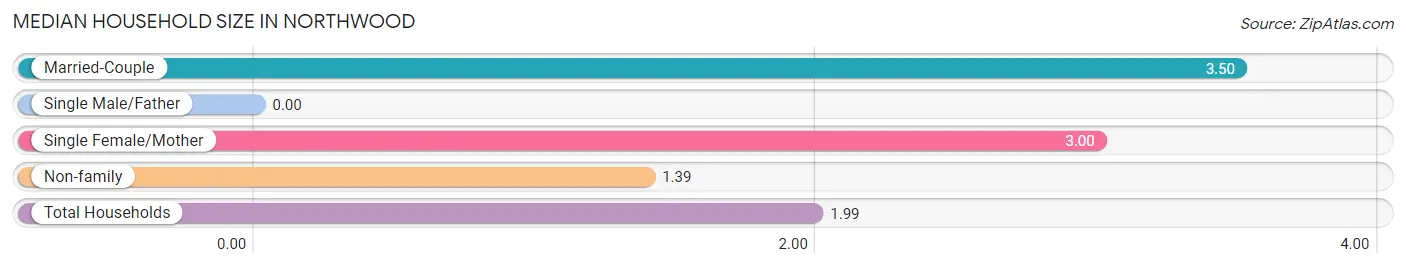
| Household Type | # Households | Household Size |
| Married-Couple | 8 (10.8%) | 3.50 |
| Single Male/Father | 0 (0.0%) | - |
| Single Female/Mother | 17 (23.0%) | 3.00 |
| Non-family | 49 (66.2%) | 1.39 |
| Total Households | 74 (100.0%) | 1.99 |
Household Size by Marriage Status in Northwood
Out of a total of 74 households in Northwood, 25 (33.8%) are family households, while 49 (66.2%) are nonfamily households. The most numerous type of family households are 3-person households, comprising 11, and the most common type of nonfamily households are 1-person households, comprising 32.
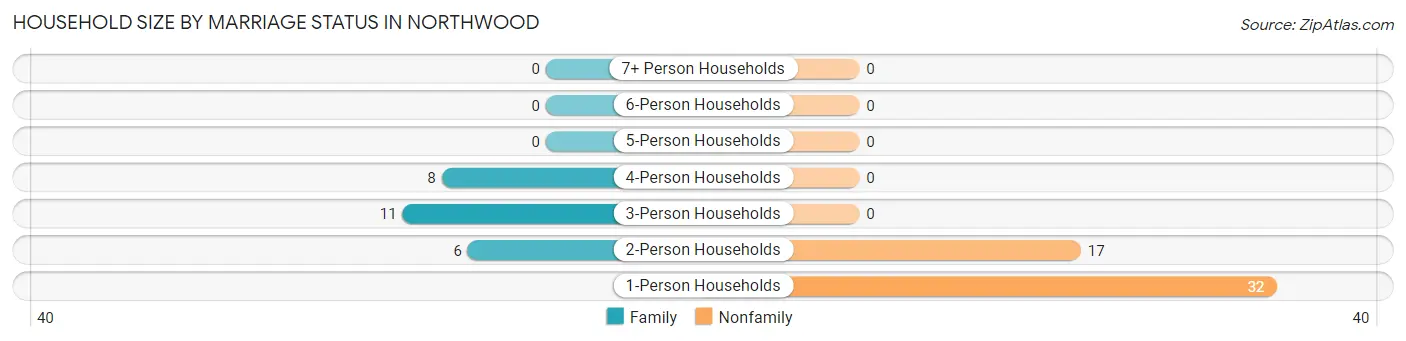
| Household Size | Family Households | Nonfamily Households |
| 1-Person Households | - | 32 (43.2%) |
| 2-Person Households | 6 (8.1%) | 17 (23.0%) |
| 3-Person Households | 11 (14.9%) | 0 (0.0%) |
| 4-Person Households | 8 (10.8%) | 0 (0.0%) |
| 5-Person Households | 0 (0.0%) | 0 (0.0%) |
| 6-Person Households | 0 (0.0%) | 0 (0.0%) |
| 7+ Person Households | 0 (0.0%) | 0 (0.0%) |
| Total | 25 (33.8%) | 49 (66.2%) |
Female Fertility in Northwood
Fertility by Age in Northwood
| Age Bracket | Women with Births | Births / 1,000 Women |
| 15 to 19 years | 0 (0.0%) | 0.0 |
| 20 to 34 years | 0 (0.0%) | 0.0 |
| 35 to 50 years | 0 (0.0%) | 0.0 |
| Total | 0 (0.0%) | 0.0 |
Fertility by Age by Marriage Status in Northwood
| Age Bracket | Married | Unmarried |
| 15 to 19 years | 0 (0.0%) | 0 (0.0%) |
| 20 to 34 years | 0 (0.0%) | 0 (0.0%) |
| 35 to 50 years | 0 (0.0%) | 0 (0.0%) |
| Total | 0 (0.0%) | 0 (0.0%) |
Fertility by Education in Northwood
| Educational Attainment | Women with Births | Births / 1,000 Women |
| Less than High School | 0 (0.0%) | 0.0 |
| High School Diploma | 0 (0.0%) | 0.0 |
| College or Associate's Degree | 0 (0.0%) | 0.0 |
| Bachelor's Degree | 0 (0.0%) | 0.0 |
| Graduate Degree | 0 (0.0%) | 0.0 |
| Total | 0 (0.0%) | 0.0 |
Fertility by Education by Marriage Status in Northwood
| Educational Attainment | Married | Unmarried |
| Less than High School | 0 (0.0%) | 0 (0.0%) |
| High School Diploma | 0 (0.0%) | 0 (0.0%) |
| College or Associate's Degree | 0 (0.0%) | 0 (0.0%) |
| Bachelor's Degree | 0 (0.0%) | 0 (0.0%) |
| Graduate Degree | 0 (0.0%) | 0 (0.0%) |
| Total | 0 (0.0%) | 0 (0.0%) |
Employment Characteristics in Northwood
Employment by Class of Employer in Northwood
Among the 82 employed individuals in Northwood, private company employees (63 | 76.8%), local government employees (11 | 13.4%), and not-for-profit organizations (8 | 9.8%) make up the most common classes of employment.
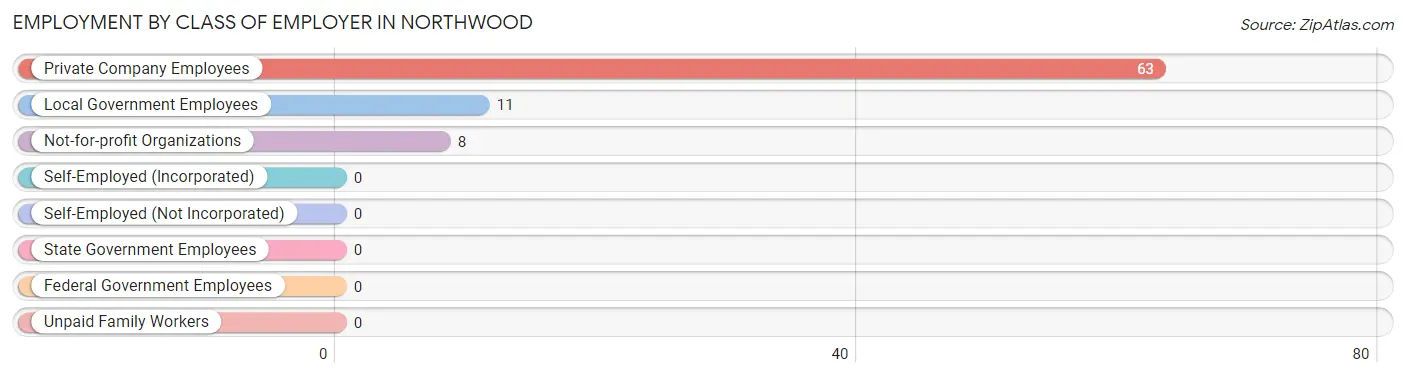
| Employer Class | # Employees | % Employees |
| Private Company Employees | 63 | 76.8% |
| Self-Employed (Incorporated) | 0 | 0.0% |
| Self-Employed (Not Incorporated) | 0 | 0.0% |
| Not-for-profit Organizations | 8 | 9.8% |
| Local Government Employees | 11 | 13.4% |
| State Government Employees | 0 | 0.0% |
| Federal Government Employees | 0 | 0.0% |
| Unpaid Family Workers | 0 | 0.0% |
| Total | 82 | 100.0% |
Employment Status by Age in Northwood
According to the labor force statistics for Northwood, out of the total population over 16 years of age (133), 71.4% or 95 individuals are in the labor force, with 13.7% or 13 of them unemployed. The age group with the highest labor force participation rate is 35 to 44 years, with 100.0% or 8 individuals in the labor force. Within the labor force, the 45 to 54 years age range has the highest percentage of unemployed individuals, with 40.6% or 13 of them being unemployed.
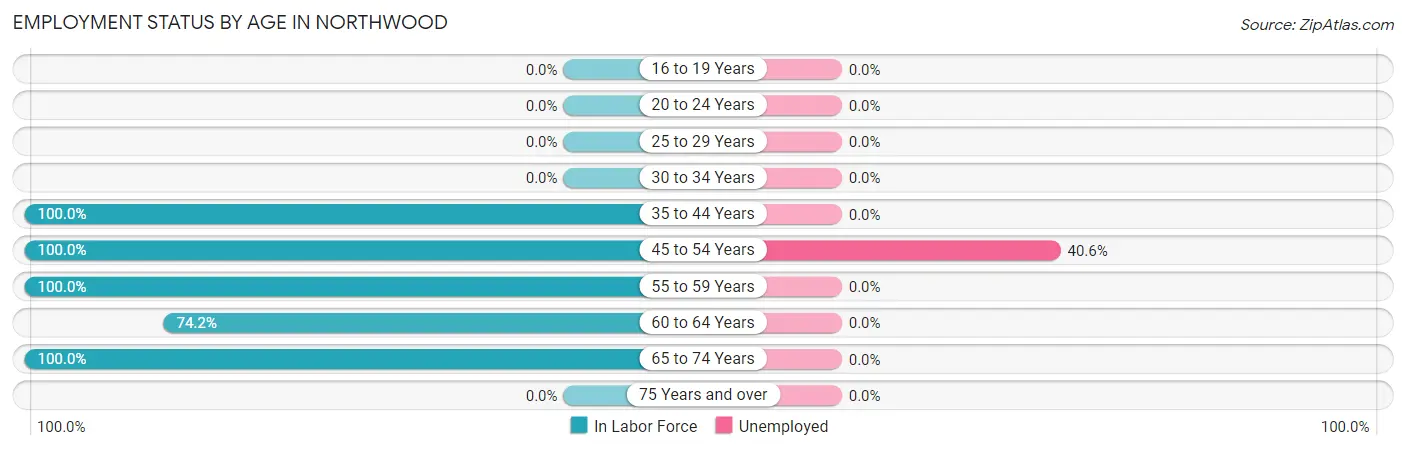
| Age Bracket | In Labor Force | Unemployed |
| 16 to 19 Years | 0 (0.0%) | 0 (0.0%) |
| 20 to 24 Years | 0 (0.0%) | 0 (0.0%) |
| 25 to 29 Years | 0 (0.0%) | 0 (0.0%) |
| 30 to 34 Years | 0 (0.0%) | 0 (0.0%) |
| 35 to 44 Years | 8 (100.0%) | 0 (0.0%) |
| 45 to 54 Years | 32 (100.0%) | 13 (40.6%) |
| 55 to 59 Years | 13 (100.0%) | 0 (0.0%) |
| 60 to 64 Years | 23 (74.2%) | 0 (0.0%) |
| 65 to 74 Years | 19 (100.0%) | 0 (0.0%) |
| 75 Years and over | 0 (0.0%) | 0 (0.0%) |
| Total | 95 (71.4%) | 13 (13.7%) |
Employment Status by Educational Attainment in Northwood
According to labor force statistics for Northwood, 90.5% of individuals (76) out of the total population between 25 and 64 years of age (84) are in the labor force, with 17.1% or 13 of them being unemployed. The group with the highest labor force participation rate are those with the educational attainment of college / associate degree, with 100.0% or 14 individuals in the labor force. Within the labor force, individuals with high school diploma education have the highest percentage of unemployment, with 21.0% or 13 of them being unemployed.
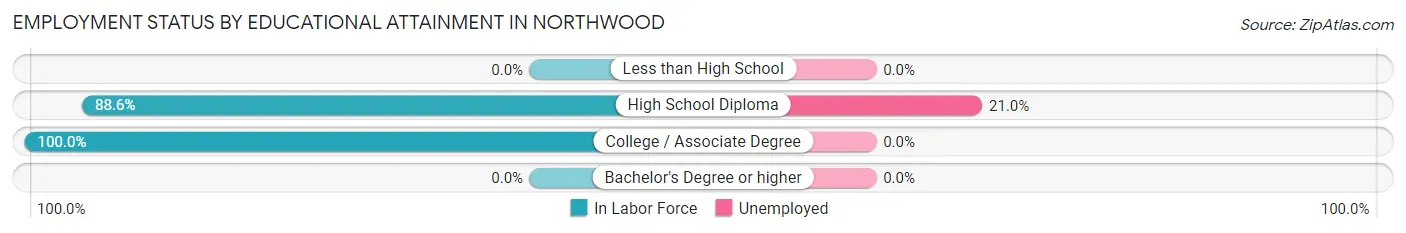
| Educational Attainment | In Labor Force | Unemployed |
| Less than High School | 0 (0.0%) | 0 (0.0%) |
| High School Diploma | 62 (88.6%) | 15 (21.0%) |
| College / Associate Degree | 14 (100.0%) | 0 (0.0%) |
| Bachelor's Degree or higher | 0 (0.0%) | 0 (0.0%) |
| Total | 76 (90.5%) | 14 (17.1%) |
Employment Occupations by Sex in Northwood
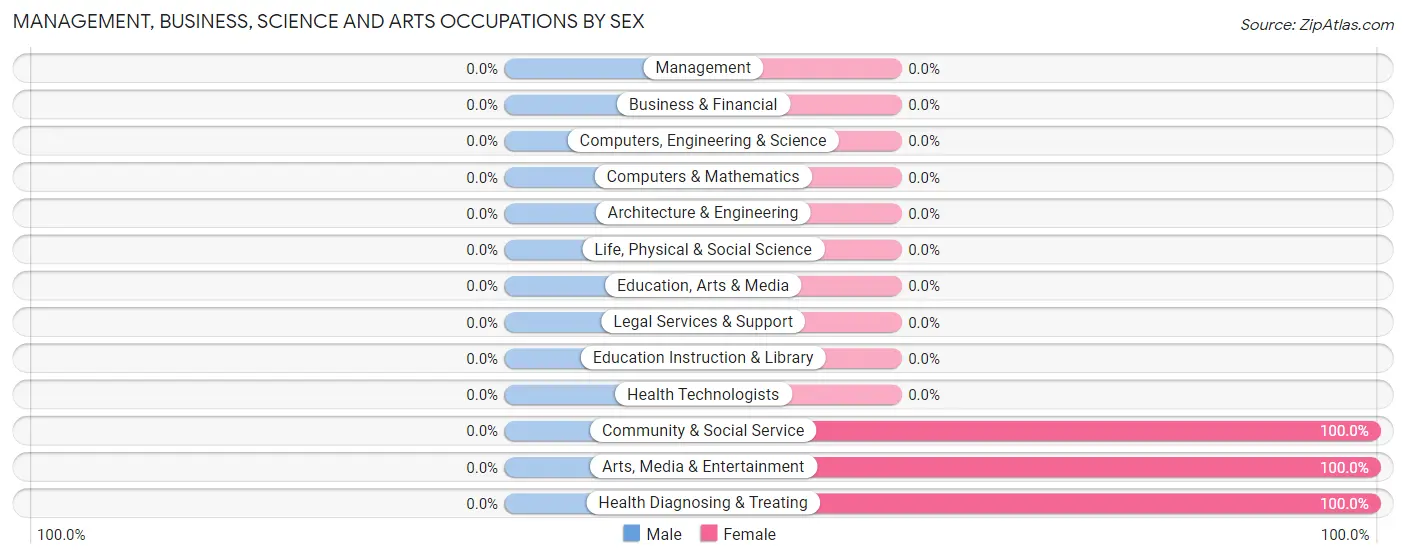
Management, Business, Science and Arts Occupations
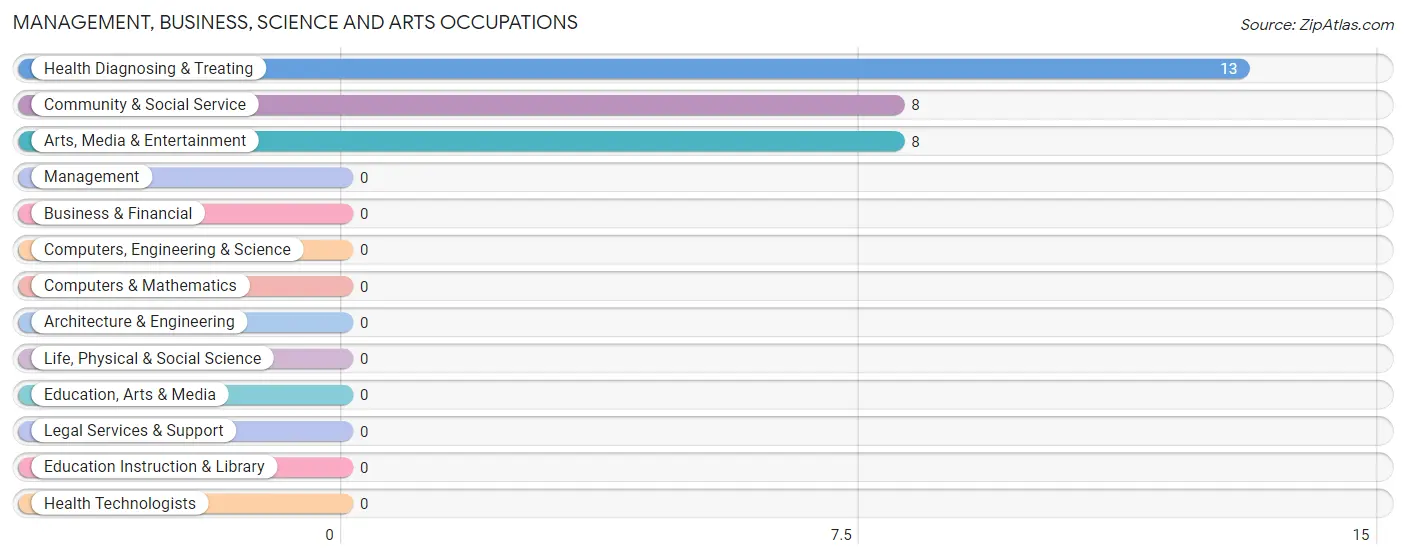
The most common Management, Business, Science and Arts occupations in Northwood are Health Diagnosing & Treating (13 | 15.9%), Community & Social Service (8 | 9.8%), and Arts, Media & Entertainment (8 | 9.8%).
Management, Business, Science and Arts Occupations by Sex
| Occupation | Male | Female |
| Management | 0 (0.0%) | 0 (0.0%) |
| Business & Financial | 0 (0.0%) | 0 (0.0%) |
| Computers, Engineering & Science | 0 (0.0%) | 0 (0.0%) |
| Computers & Mathematics | 0 (0.0%) | 0 (0.0%) |
| Architecture & Engineering | 0 (0.0%) | 0 (0.0%) |
| Life, Physical & Social Science | 0 (0.0%) | 0 (0.0%) |
| Community & Social Service | 0 (0.0%) | 8 (100.0%) |
| Education, Arts & Media | 0 (0.0%) | 0 (0.0%) |
| Legal Services & Support | 0 (0.0%) | 0 (0.0%) |
| Education Instruction & Library | 0 (0.0%) | 0 (0.0%) |
| Arts, Media & Entertainment | 0 (0.0%) | 8 (100.0%) |
| Health Diagnosing & Treating | 0 (0.0%) | 13 (100.0%) |
| Health Technologists | 0 (0.0%) | 0 (0.0%) |
| Total (Category) | 0 (0.0%) | 21 (100.0%) |
| Total (Overall) | 30 (36.6%) | 52 (63.4%) |
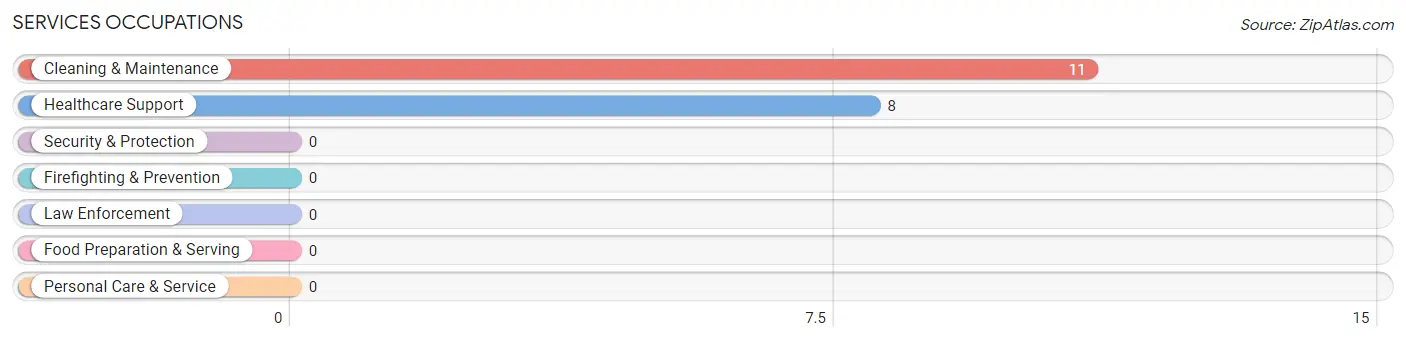
Services Occupations
The most common Services occupations in Northwood are Cleaning & Maintenance (11 | 13.4%), and Healthcare Support (8 | 9.8%).
Services Occupations by Sex
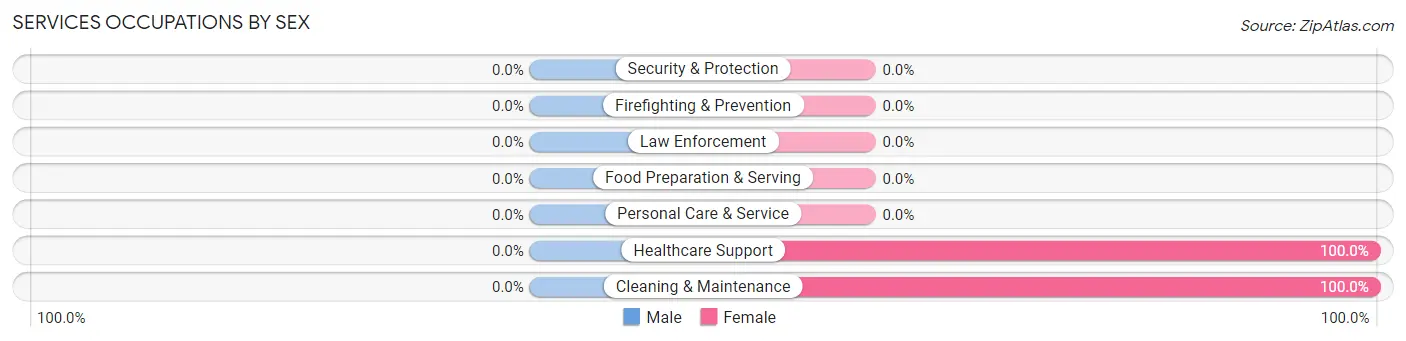
| Occupation | Male | Female |
| Healthcare Support | 0 (0.0%) | 8 (100.0%) |
| Security & Protection | 0 (0.0%) | 0 (0.0%) |
| Firefighting & Prevention | 0 (0.0%) | 0 (0.0%) |
| Law Enforcement | 0 (0.0%) | 0 (0.0%) |
| Food Preparation & Serving | 0 (0.0%) | 0 (0.0%) |
| Cleaning & Maintenance | 0 (0.0%) | 11 (100.0%) |
| Personal Care & Service | 0 (0.0%) | 0 (0.0%) |
| Total (Category) | 0 (0.0%) | 19 (100.0%) |
| Total (Overall) | 30 (36.6%) | 52 (63.4%) |
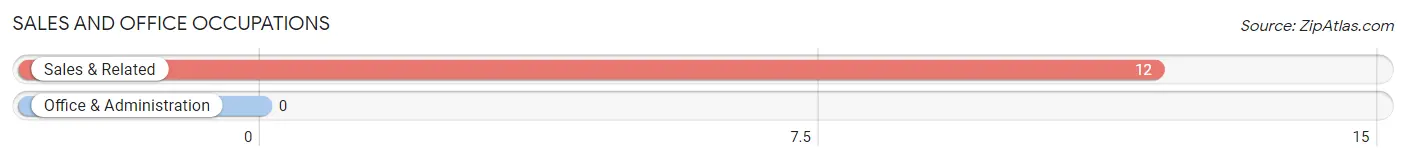
Sales and Office Occupations
The most common Sales and Office occupations in Northwood are , and Sales & Related (12 | 14.6%).
Sales and Office Occupations by Sex
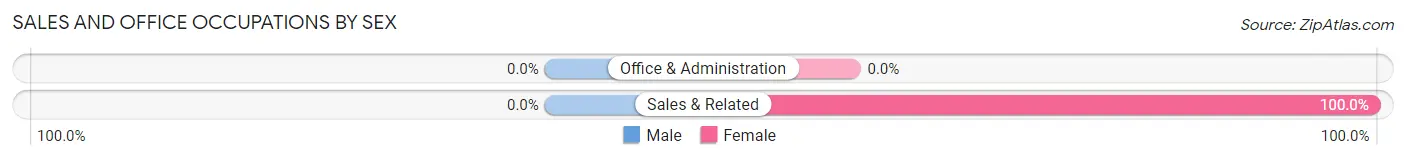
| Occupation | Male | Female |
| Sales & Related | 0 (0.0%) | 12 (100.0%) |
| Office & Administration | 0 (0.0%) | 0 (0.0%) |
| Total (Category) | 0 (0.0%) | 12 (100.0%) |
| Total (Overall) | 30 (36.6%) | 52 (63.4%) |
Natural Resources, Construction and Maintenance Occupations
The most common Natural Resources, Construction and Maintenance occupations in Northwood are , and Construction & Extraction (13 | 15.9%).
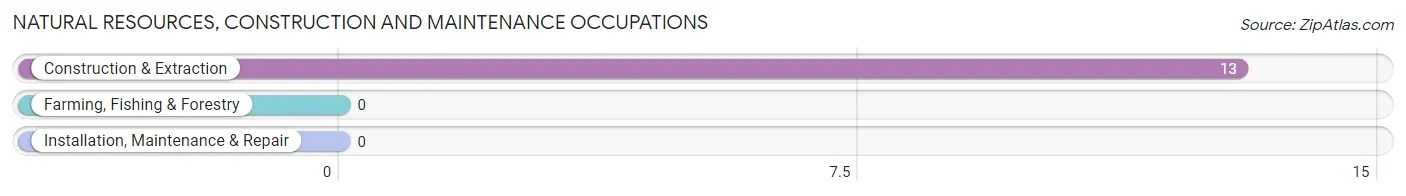
Natural Resources, Construction and Maintenance Occupations by Sex
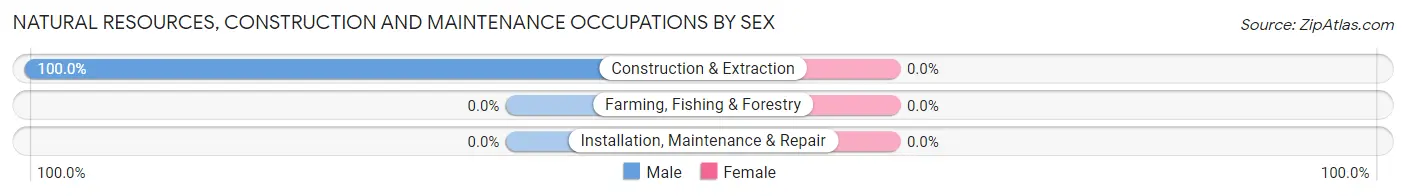
| Occupation | Male | Female |
| Farming, Fishing & Forestry | 0 (0.0%) | 0 (0.0%) |
| Construction & Extraction | 13 (100.0%) | 0 (0.0%) |
| Installation, Maintenance & Repair | 0 (0.0%) | 0 (0.0%) |
| Total (Category) | 13 (100.0%) | 0 (0.0%) |
| Total (Overall) | 30 (36.6%) | 52 (63.4%) |
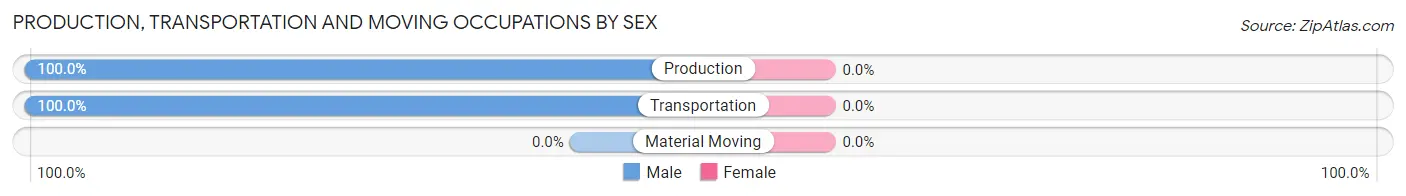
Production, Transportation and Moving Occupations
The most common Production, Transportation and Moving occupations in Northwood are Transportation (11 | 13.4%), and Production (6 | 7.3%).
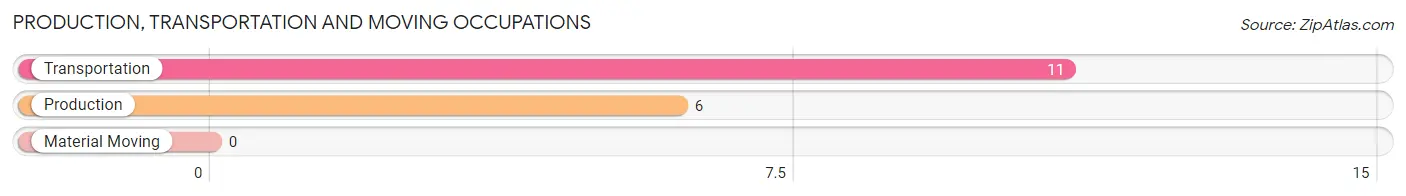
Production, Transportation and Moving Occupations by Sex
| Occupation | Male | Female |
| Production | 6 (100.0%) | 0 (0.0%) |
| Transportation | 11 (100.0%) | 0 (0.0%) |
| Material Moving | 0 (0.0%) | 0 (0.0%) |
| Total (Category) | 17 (100.0%) | 0 (0.0%) |
| Total (Overall) | 30 (36.6%) | 52 (63.4%) |
Employment Industries by Sex in Northwood
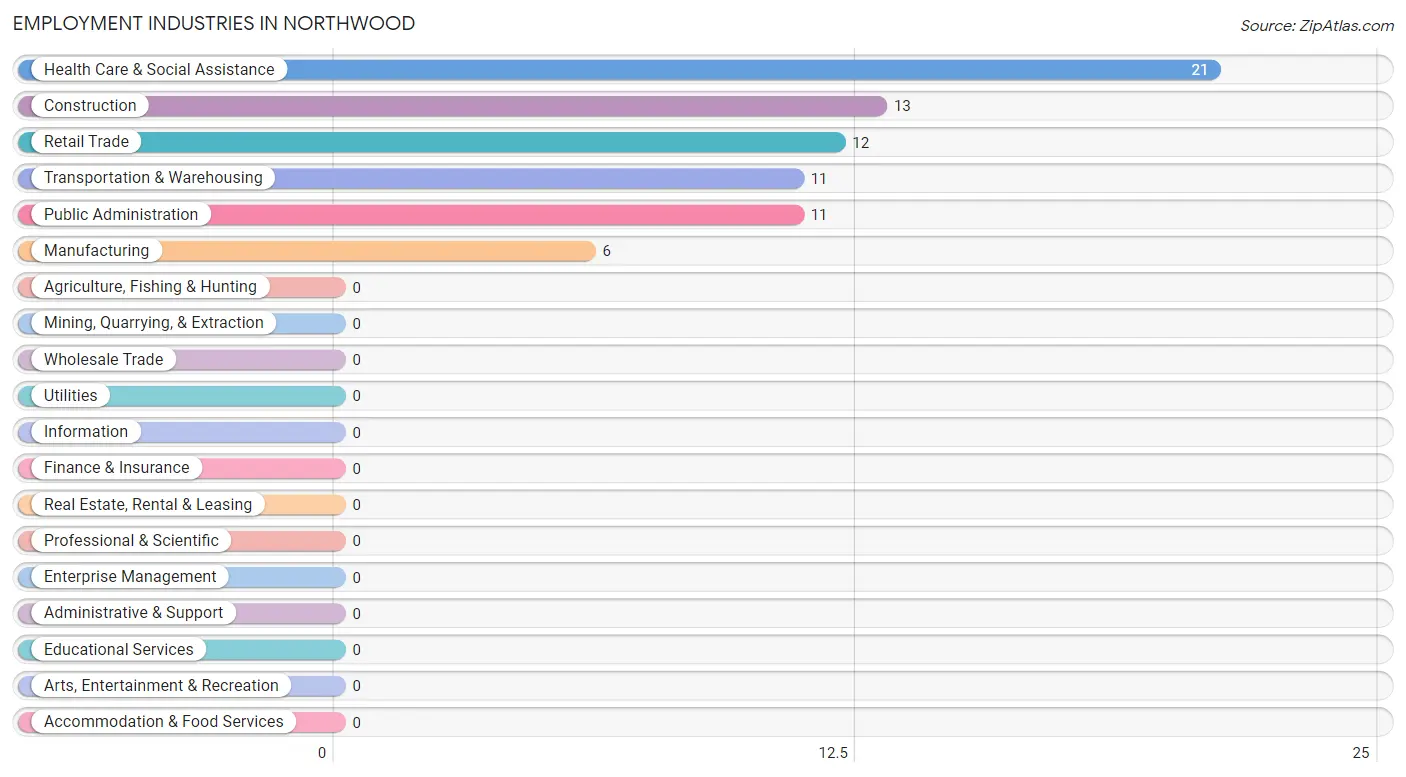
Employment Industries in Northwood
The major employment industries in Northwood include Health Care & Social Assistance (21 | 25.6%), Construction (13 | 15.9%), Retail Trade (12 | 14.6%), Transportation & Warehousing (11 | 13.4%), and Public Administration (11 | 13.4%).
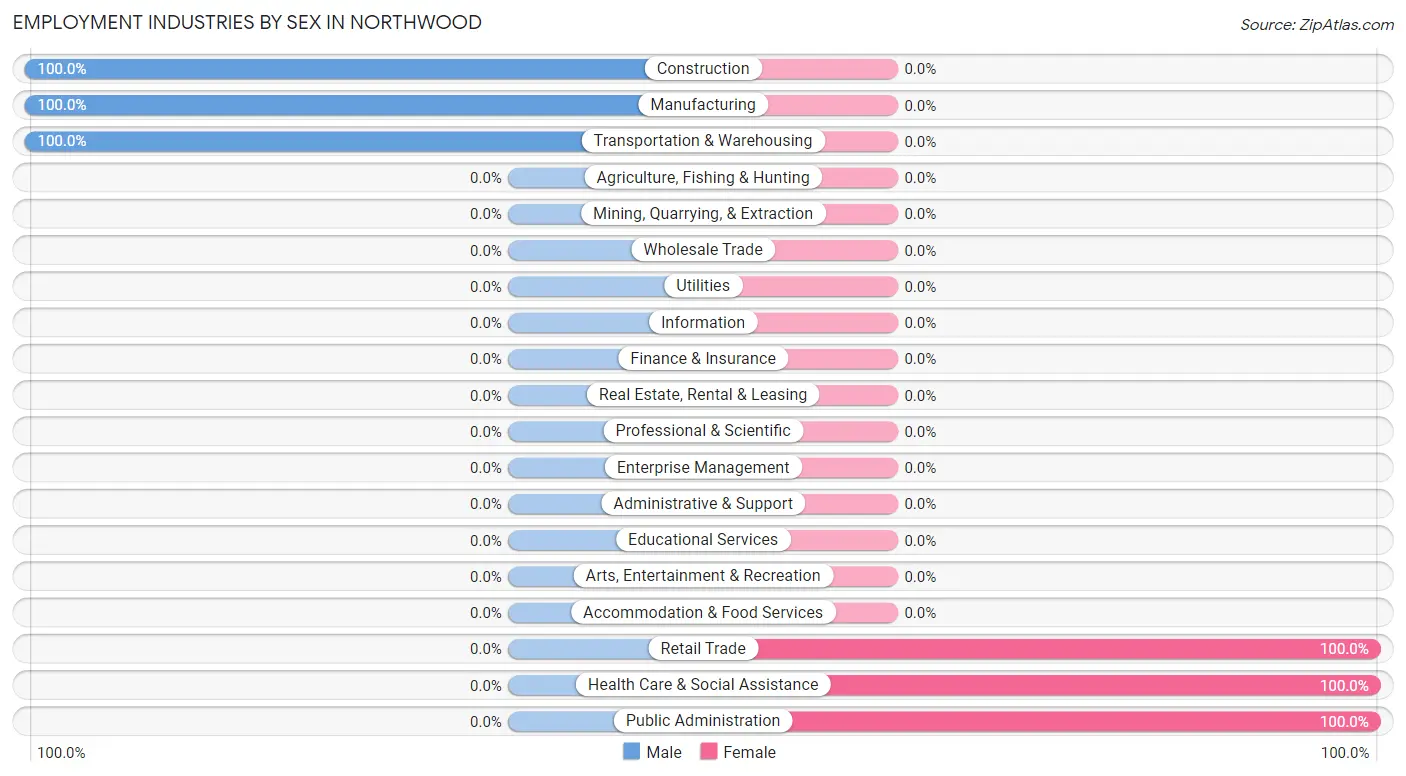
Employment Industries by Sex in Northwood
The Northwood industries that see more men than women are Construction (100.0%), Manufacturing (100.0%), and Transportation & Warehousing (100.0%), whereas the industries that tend to have a higher number of women are Retail Trade (100.0%), Health Care & Social Assistance (100.0%), and Public Administration (100.0%).
| Industry | Male | Female |
| Agriculture, Fishing & Hunting | 0 (0.0%) | 0 (0.0%) |
| Mining, Quarrying, & Extraction | 0 (0.0%) | 0 (0.0%) |
| Construction | 13 (100.0%) | 0 (0.0%) |
| Manufacturing | 6 (100.0%) | 0 (0.0%) |
| Wholesale Trade | 0 (0.0%) | 0 (0.0%) |
| Retail Trade | 0 (0.0%) | 12 (100.0%) |
| Transportation & Warehousing | 11 (100.0%) | 0 (0.0%) |
| Utilities | 0 (0.0%) | 0 (0.0%) |
| Information | 0 (0.0%) | 0 (0.0%) |
| Finance & Insurance | 0 (0.0%) | 0 (0.0%) |
| Real Estate, Rental & Leasing | 0 (0.0%) | 0 (0.0%) |
| Professional & Scientific | 0 (0.0%) | 0 (0.0%) |
| Enterprise Management | 0 (0.0%) | 0 (0.0%) |
| Administrative & Support | 0 (0.0%) | 0 (0.0%) |
| Educational Services | 0 (0.0%) | 0 (0.0%) |
| Health Care & Social Assistance | 0 (0.0%) | 21 (100.0%) |
| Arts, Entertainment & Recreation | 0 (0.0%) | 0 (0.0%) |
| Accommodation & Food Services | 0 (0.0%) | 0 (0.0%) |
| Public Administration | 0 (0.0%) | 11 (100.0%) |
| Total | 30 (36.6%) | 52 (63.4%) |
Education in Northwood
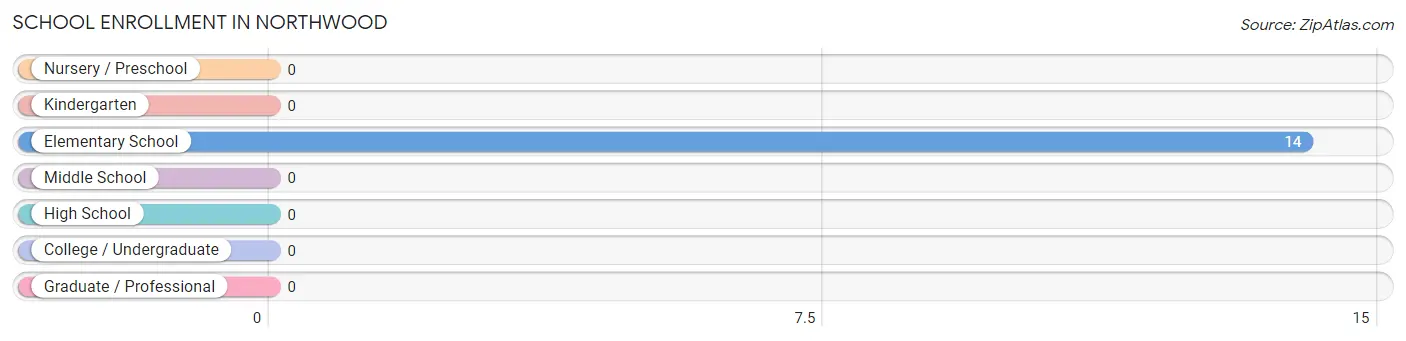
School Enrollment in Northwood
| School Level | # Students | % Students |
| Nursery / Preschool | 0 | 0.0% |
| Kindergarten | 0 | 0.0% |
| Elementary School | 14 | 100.0% |
| Middle School | 0 | 0.0% |
| High School | 0 | 0.0% |
| College / Undergraduate | 0 | 0.0% |
| Graduate / Professional | 0 | 0.0% |
| Total | 14 | 100.0% |
School Enrollment by Age by Funding Source in Northwood
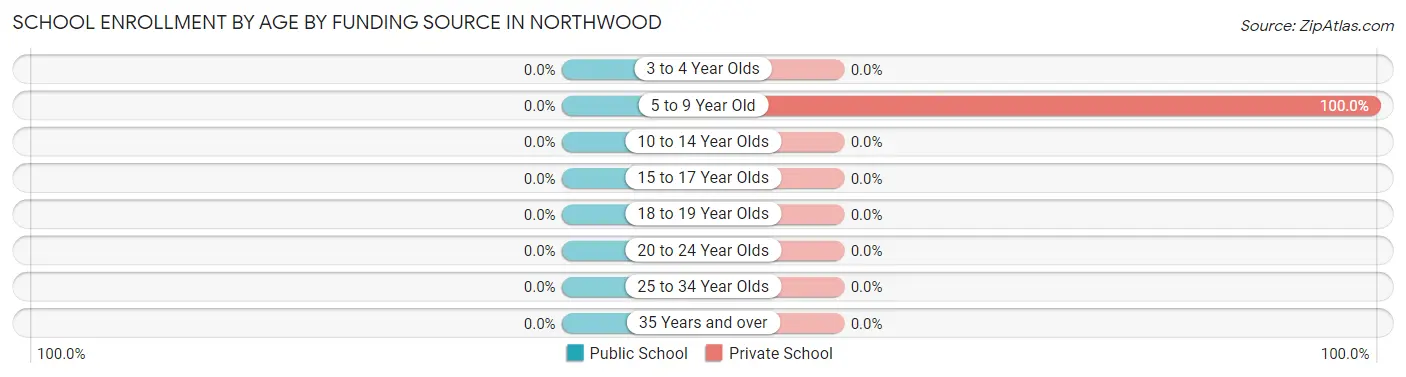
| Age Bracket | Public School | Private School |
| 3 to 4 Year Olds | 0 (0.0%) | 0 (0.0%) |
| 5 to 9 Year Old | 0 (0.0%) | 14 (100.0%) |
| 10 to 14 Year Olds | 0 (0.0%) | 0 (0.0%) |
| 15 to 17 Year Olds | 0 (0.0%) | 0 (0.0%) |
| 18 to 19 Year Olds | 0 (0.0%) | 0 (0.0%) |
| 20 to 24 Year Olds | 0 (0.0%) | 0 (0.0%) |
| 25 to 34 Year Olds | 0 (0.0%) | 0 (0.0%) |
| 35 Years and over | 0 (0.0%) | 0 (0.0%) |
| Total | 0 (0.0%) | 14 (100.0%) |
Educational Attainment by Field of Study in Northwood
, and education (8 | 100.0%) are the most common fields of study among 8 individuals in Northwood who have obtained a bachelor's degree or higher.
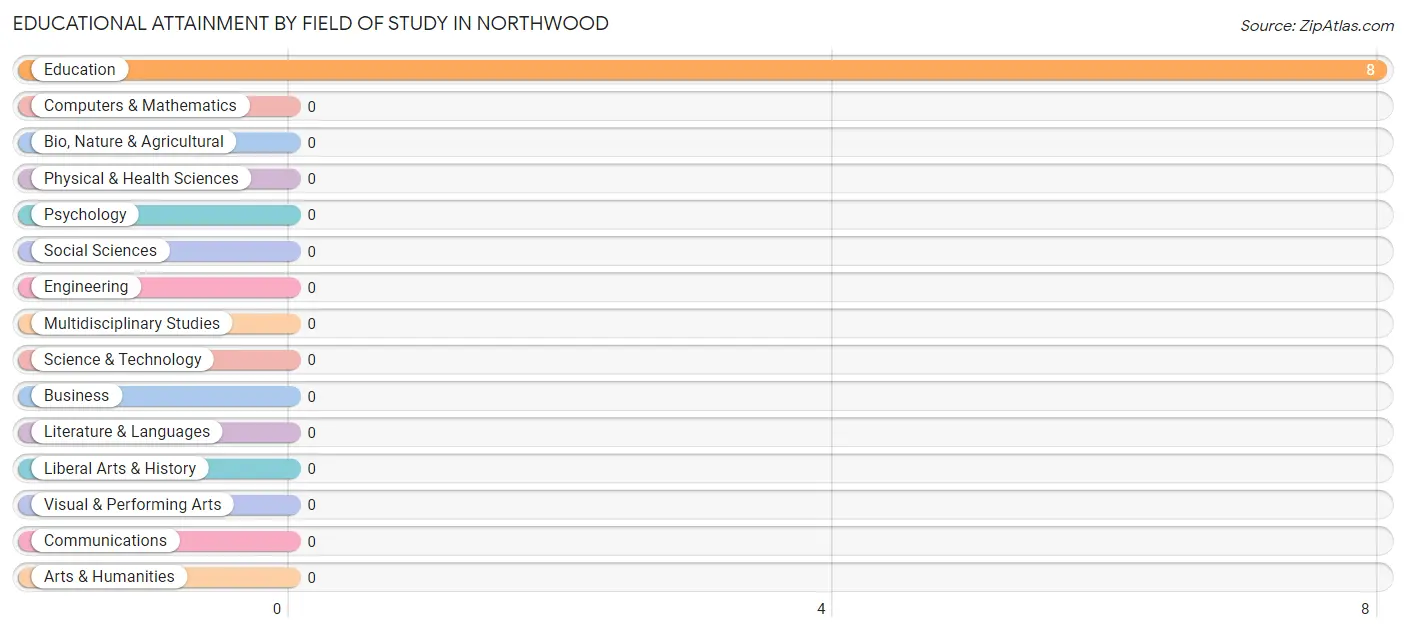
| Field of Study | # Graduates | % Graduates |
| Computers & Mathematics | 0 | 0.0% |
| Bio, Nature & Agricultural | 0 | 0.0% |
| Physical & Health Sciences | 0 | 0.0% |
| Psychology | 0 | 0.0% |
| Social Sciences | 0 | 0.0% |
| Engineering | 0 | 0.0% |
| Multidisciplinary Studies | 0 | 0.0% |
| Science & Technology | 0 | 0.0% |
| Business | 0 | 0.0% |
| Education | 8 | 100.0% |
| Literature & Languages | 0 | 0.0% |
| Liberal Arts & History | 0 | 0.0% |
| Visual & Performing Arts | 0 | 0.0% |
| Communications | 0 | 0.0% |
| Arts & Humanities | 0 | 0.0% |
| Total | 8 | 100.0% |
Transportation & Commute in Northwood
Vehicle Availability by Sex in Northwood
The most prevalent vehicle ownership categories in Northwood are males with 2 vehicles (17, accounting for 56.7%) and females with 2 vehicles (20, making up 32.7%).
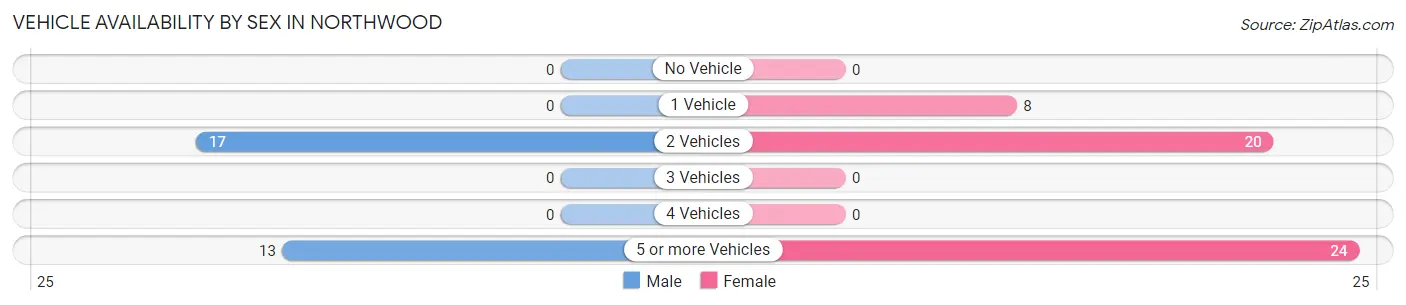
| Vehicles Available | Male | Female |
| No Vehicle | 0 (0.0%) | 0 (0.0%) |
| 1 Vehicle | 0 (0.0%) | 8 (15.4%) |
| 2 Vehicles | 17 (56.7%) | 20 (38.5%) |
| 3 Vehicles | 0 (0.0%) | 0 (0.0%) |
| 4 Vehicles | 0 (0.0%) | 0 (0.0%) |
| 5 or more Vehicles | 13 (43.3%) | 24 (46.2%) |
| Total | 30 (100.0%) | 52 (100.0%) |
Commute Time in Northwood
The most frequently occuring commute durations in Northwood are 40 to 44 minutes (27 commuters, 32.9%), 10 to 14 minutes (13 commuters, 15.9%), and 30 to 34 minutes (12 commuters, 14.6%).
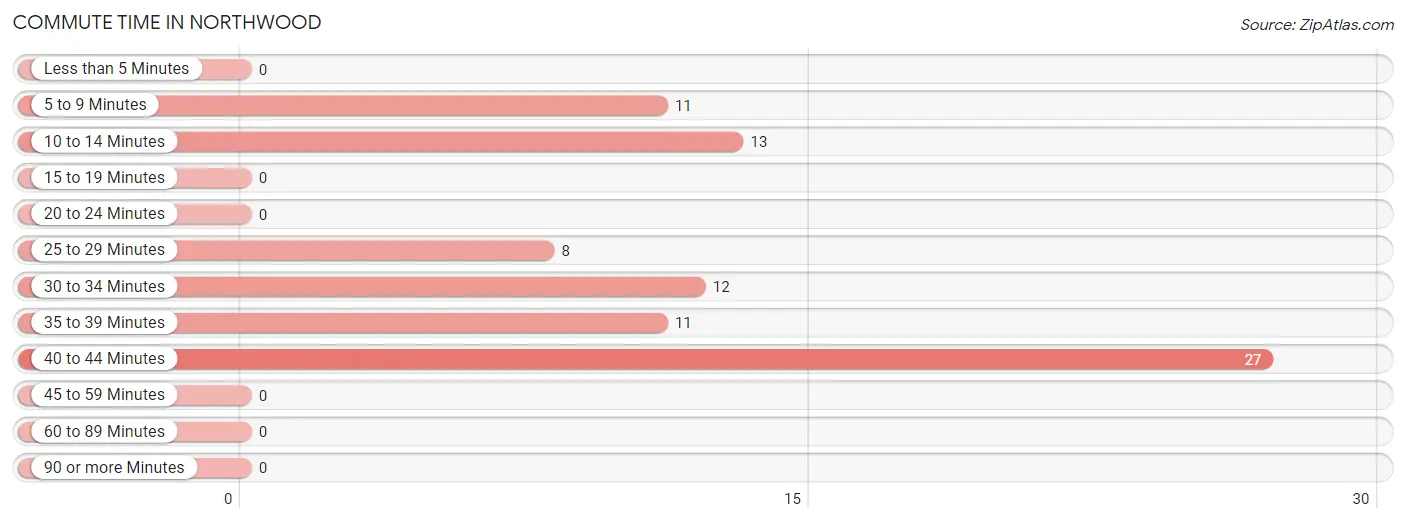
| Commute Time | # Commuters | % Commuters |
| Less than 5 Minutes | 0 | 0.0% |
| 5 to 9 Minutes | 11 | 13.4% |
| 10 to 14 Minutes | 13 | 15.9% |
| 15 to 19 Minutes | 0 | 0.0% |
| 20 to 24 Minutes | 0 | 0.0% |
| 25 to 29 Minutes | 8 | 9.8% |
| 30 to 34 Minutes | 12 | 14.6% |
| 35 to 39 Minutes | 11 | 13.4% |
| 40 to 44 Minutes | 27 | 32.9% |
| 45 to 59 Minutes | 0 | 0.0% |
| 60 to 89 Minutes | 0 | 0.0% |
| 90 or more Minutes | 0 | 0.0% |
Commute Time by Sex in Northwood
The most common commute times in Northwood are 10 to 14 minutes (13 commuters, 43.3%) for males and 40 to 44 minutes (21 commuters, 40.4%) for females.
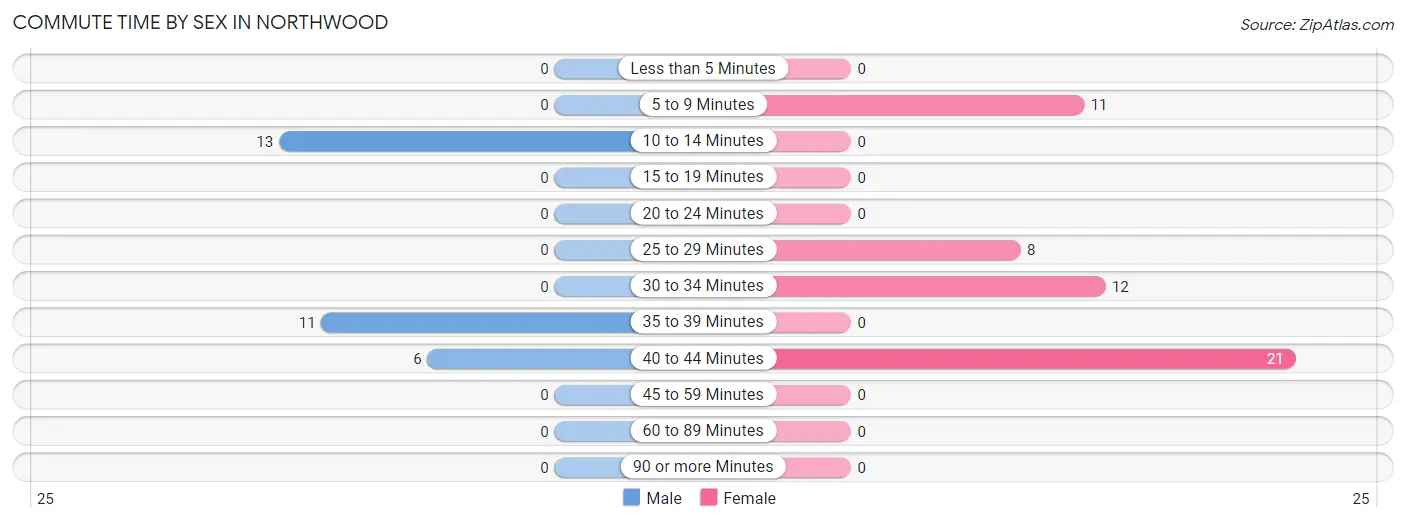
| Commute Time | Male | Female |
| Less than 5 Minutes | 0 (0.0%) | 0 (0.0%) |
| 5 to 9 Minutes | 0 (0.0%) | 11 (21.1%) |
| 10 to 14 Minutes | 13 (43.3%) | 0 (0.0%) |
| 15 to 19 Minutes | 0 (0.0%) | 0 (0.0%) |
| 20 to 24 Minutes | 0 (0.0%) | 0 (0.0%) |
| 25 to 29 Minutes | 0 (0.0%) | 8 (15.4%) |
| 30 to 34 Minutes | 0 (0.0%) | 12 (23.1%) |
| 35 to 39 Minutes | 11 (36.7%) | 0 (0.0%) |
| 40 to 44 Minutes | 6 (20.0%) | 21 (40.4%) |
| 45 to 59 Minutes | 0 (0.0%) | 0 (0.0%) |
| 60 to 89 Minutes | 0 (0.0%) | 0 (0.0%) |
| 90 or more Minutes | 0 (0.0%) | 0 (0.0%) |
Time of Departure to Work by Sex in Northwood
The most frequent times of departure to work in Northwood are 7:00 AM to 7:29 AM (13, 43.3%) for males and 5:30 AM to 5:59 AM (13, 25.0%) for females.
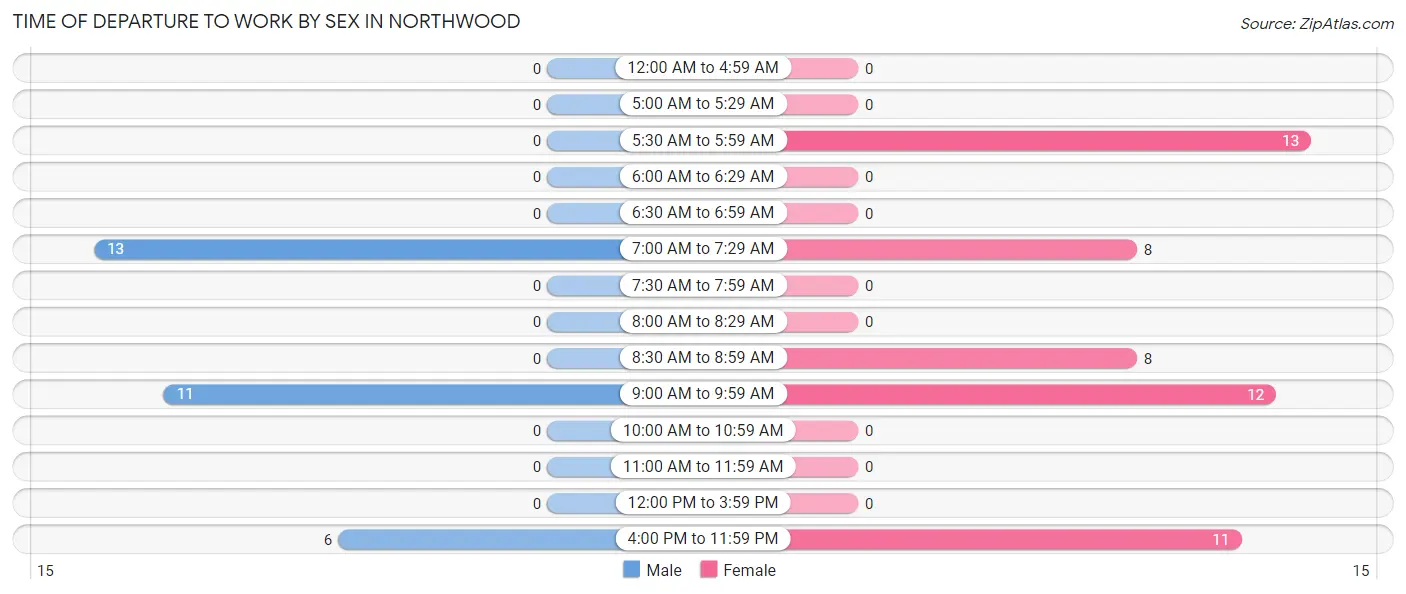
| Time of Departure | Male | Female |
| 12:00 AM to 4:59 AM | 0 (0.0%) | 0 (0.0%) |
| 5:00 AM to 5:29 AM | 0 (0.0%) | 0 (0.0%) |
| 5:30 AM to 5:59 AM | 0 (0.0%) | 13 (25.0%) |
| 6:00 AM to 6:29 AM | 0 (0.0%) | 0 (0.0%) |
| 6:30 AM to 6:59 AM | 0 (0.0%) | 0 (0.0%) |
| 7:00 AM to 7:29 AM | 13 (43.3%) | 8 (15.4%) |
| 7:30 AM to 7:59 AM | 0 (0.0%) | 0 (0.0%) |
| 8:00 AM to 8:29 AM | 0 (0.0%) | 0 (0.0%) |
| 8:30 AM to 8:59 AM | 0 (0.0%) | 8 (15.4%) |
| 9:00 AM to 9:59 AM | 11 (36.7%) | 12 (23.1%) |
| 10:00 AM to 10:59 AM | 0 (0.0%) | 0 (0.0%) |
| 11:00 AM to 11:59 AM | 0 (0.0%) | 0 (0.0%) |
| 12:00 PM to 3:59 PM | 0 (0.0%) | 0 (0.0%) |
| 4:00 PM to 11:59 PM | 6 (20.0%) | 11 (21.1%) |
| Total | 30 (100.0%) | 52 (100.0%) |
Housing Occupancy in Northwood
Occupancy by Ownership in Northwood
Of the total 74 dwellings in Northwood, owner-occupied units account for 63 (85.1%), while renter-occupied units make up 11 (14.9%).
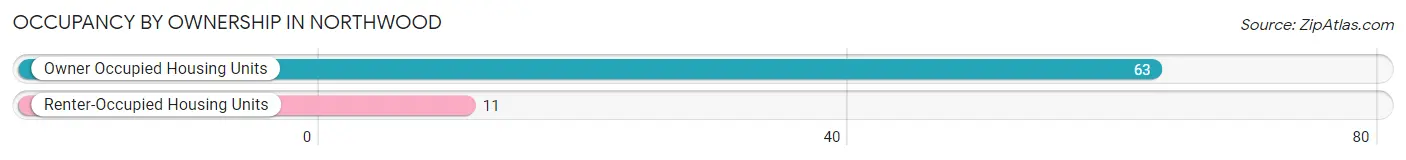
| Occupancy | # Housing Units | % Housing Units |
| Owner Occupied Housing Units | 63 | 85.1% |
| Renter-Occupied Housing Units | 11 | 14.9% |
| Total Occupied Housing Units | 74 | 100.0% |
Occupancy by Household Size in Northwood
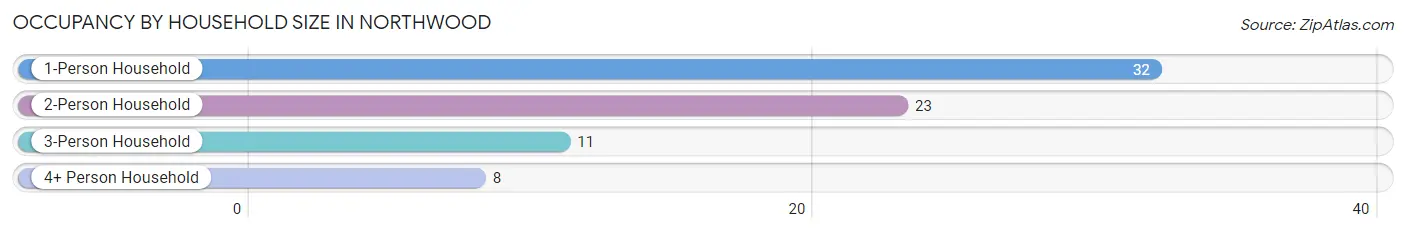
| Household Size | # Housing Units | % Housing Units |
| 1-Person Household | 32 | 43.2% |
| 2-Person Household | 23 | 31.1% |
| 3-Person Household | 11 | 14.9% |
| 4+ Person Household | 8 | 10.8% |
| Total Housing Units | 74 | 100.0% |
Occupancy by Ownership by Household Size in Northwood
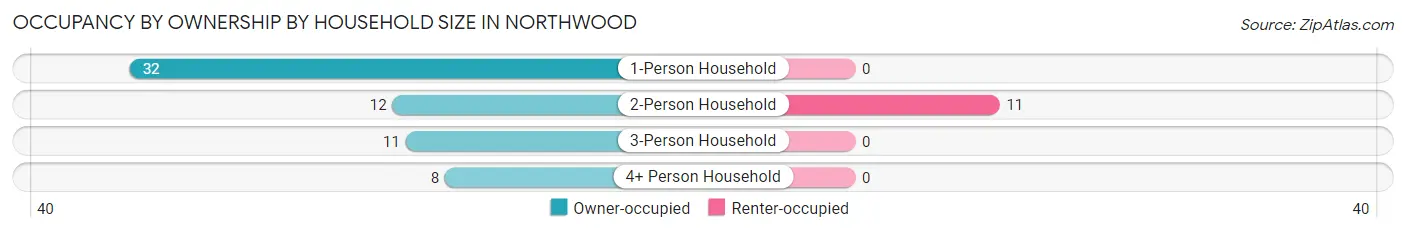
| Household Size | Owner-occupied | Renter-occupied |
| 1-Person Household | 32 (100.0%) | 0 (0.0%) |
| 2-Person Household | 12 (52.2%) | 11 (47.8%) |
| 3-Person Household | 11 (100.0%) | 0 (0.0%) |
| 4+ Person Household | 8 (100.0%) | 0 (0.0%) |
| Total Housing Units | 63 (85.1%) | 11 (14.9%) |
Occupancy by Educational Attainment in Northwood
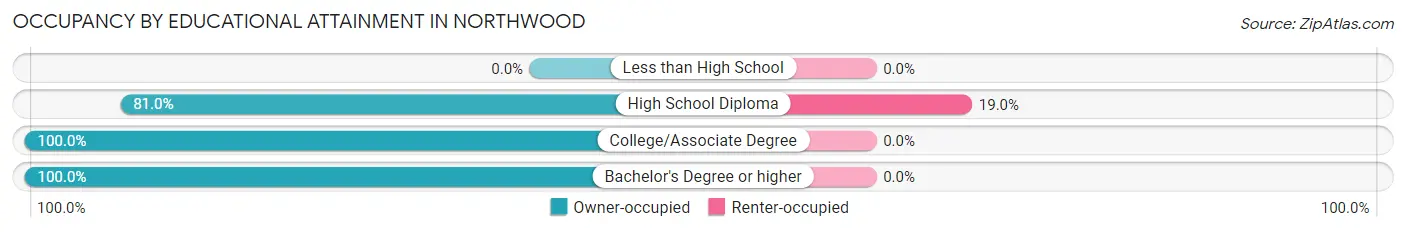
| Household Size | Owner-occupied | Renter-occupied |
| Less than High School | 0 (0.0%) | 0 (0.0%) |
| High School Diploma | 47 (81.0%) | 11 (19.0%) |
| College/Associate Degree | 8 (100.0%) | 0 (0.0%) |
| Bachelor's Degree or higher | 8 (100.0%) | 0 (0.0%) |
Occupancy by Age of Householder in Northwood
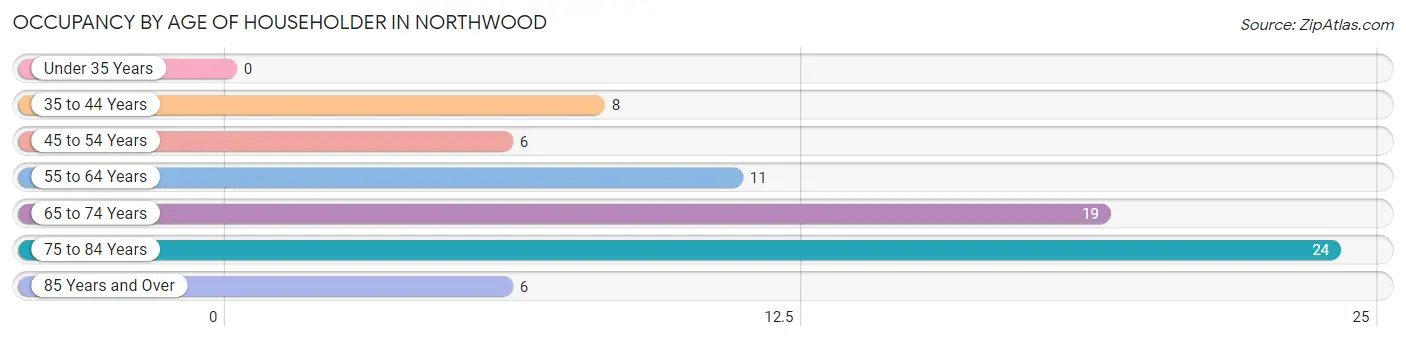
| Age Bracket | # Households | % Households |
| Under 35 Years | 0 | 0.0% |
| 35 to 44 Years | 8 | 10.8% |
| 45 to 54 Years | 6 | 8.1% |
| 55 to 64 Years | 11 | 14.9% |
| 65 to 74 Years | 19 | 25.7% |
| 75 to 84 Years | 24 | 32.4% |
| 85 Years and Over | 6 | 8.1% |
| Total | 74 | 100.0% |
Housing Finances in Northwood
Median Income by Occupancy in Northwood
| Occupancy Type | # Households | Median Income |
| Owner-Occupied | 63 (85.1%) | $0 |
| Renter-Occupied | 11 (14.9%) | $0 |
| Average | 74 (100.0%) | $0 |
Occupancy by Householder Income Bracket in Northwood
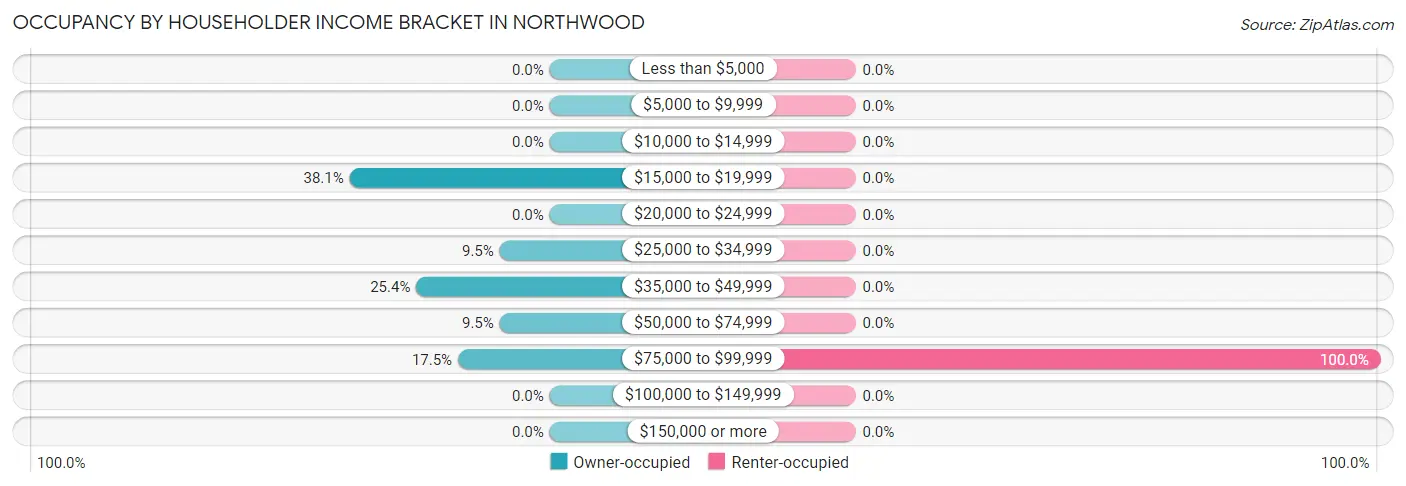
| Income Bracket | Owner-occupied | Renter-occupied |
| Less than $5,000 | 0 (0.0%) | 0 (0.0%) |
| $5,000 to $9,999 | 0 (0.0%) | 0 (0.0%) |
| $10,000 to $14,999 | 0 (0.0%) | 0 (0.0%) |
| $15,000 to $19,999 | 24 (38.1%) | 0 (0.0%) |
| $20,000 to $24,999 | 0 (0.0%) | 0 (0.0%) |
| $25,000 to $34,999 | 6 (9.5%) | 0 (0.0%) |
| $35,000 to $49,999 | 16 (25.4%) | 0 (0.0%) |
| $50,000 to $74,999 | 6 (9.5%) | 0 (0.0%) |
| $75,000 to $99,999 | 11 (17.5%) | 11 (100.0%) |
| $100,000 to $149,999 | 0 (0.0%) | 0 (0.0%) |
| $150,000 or more | 0 (0.0%) | 0 (0.0%) |
| Total | 63 (100.0%) | 11 (100.0%) |
Monthly Housing Cost Tiers in Northwood
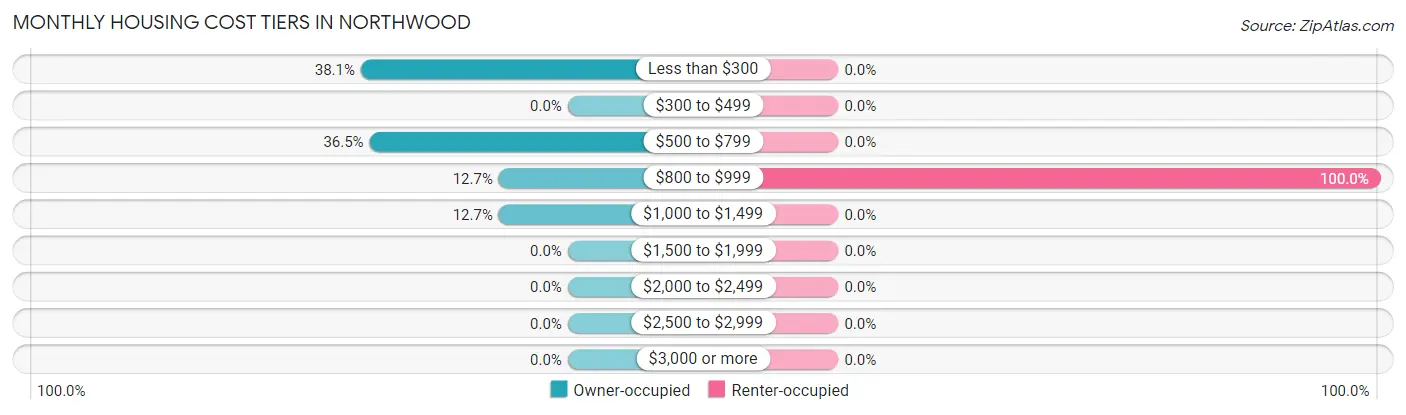
| Monthly Cost | Owner-occupied | Renter-occupied |
| Less than $300 | 24 (38.1%) | 0 (0.0%) |
| $300 to $499 | 0 (0.0%) | 0 (0.0%) |
| $500 to $799 | 23 (36.5%) | 0 (0.0%) |
| $800 to $999 | 8 (12.7%) | 11 (100.0%) |
| $1,000 to $1,499 | 8 (12.7%) | 0 (0.0%) |
| $1,500 to $1,999 | 0 (0.0%) | 0 (0.0%) |
| $2,000 to $2,499 | 0 (0.0%) | 0 (0.0%) |
| $2,500 to $2,999 | 0 (0.0%) | 0 (0.0%) |
| $3,000 or more | 0 (0.0%) | 0 (0.0%) |
| Total | 63 (100.0%) | 11 (100.0%) |
Physical Housing Characteristics in Northwood
Housing Structures in Northwood
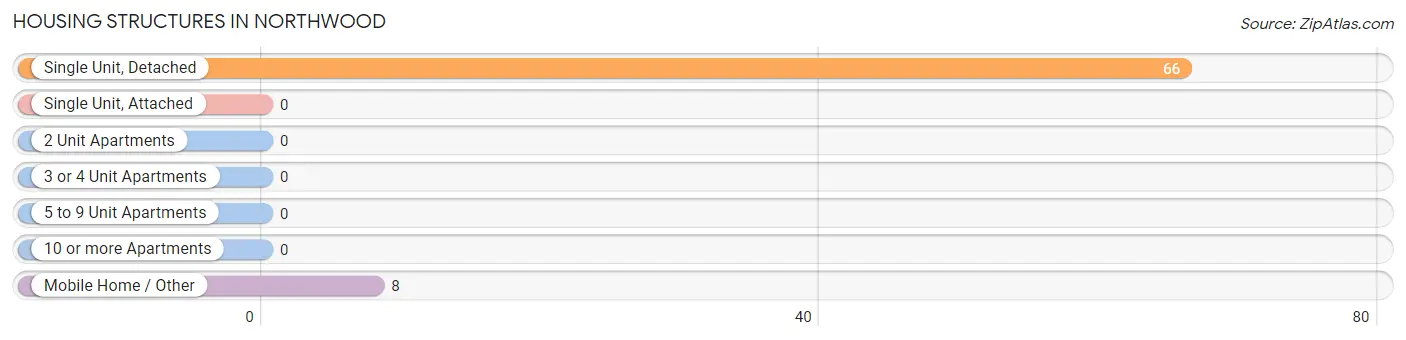
| Structure Type | # Housing Units | % Housing Units |
| Single Unit, Detached | 66 | 89.2% |
| Single Unit, Attached | 0 | 0.0% |
| 2 Unit Apartments | 0 | 0.0% |
| 3 or 4 Unit Apartments | 0 | 0.0% |
| 5 to 9 Unit Apartments | 0 | 0.0% |
| 10 or more Apartments | 0 | 0.0% |
| Mobile Home / Other | 8 | 10.8% |
| Total | 74 | 100.0% |
Housing Structures by Occupancy in Northwood
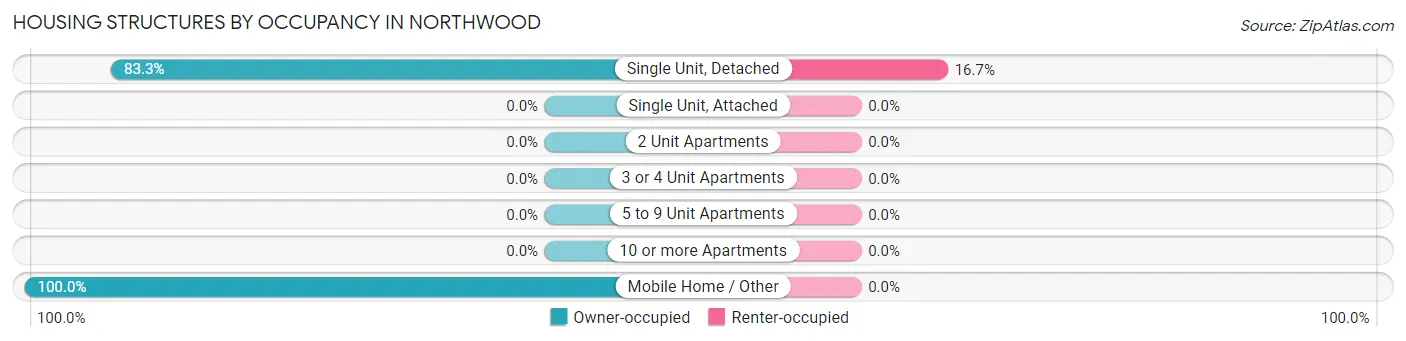
| Structure Type | Owner-occupied | Renter-occupied |
| Single Unit, Detached | 55 (83.3%) | 11 (16.7%) |
| Single Unit, Attached | 0 (0.0%) | 0 (0.0%) |
| 2 Unit Apartments | 0 (0.0%) | 0 (0.0%) |
| 3 or 4 Unit Apartments | 0 (0.0%) | 0 (0.0%) |
| 5 to 9 Unit Apartments | 0 (0.0%) | 0 (0.0%) |
| 10 or more Apartments | 0 (0.0%) | 0 (0.0%) |
| Mobile Home / Other | 8 (100.0%) | 0 (0.0%) |
| Total | 63 (85.1%) | 11 (14.9%) |
Housing Structures by Number of Rooms in Northwood
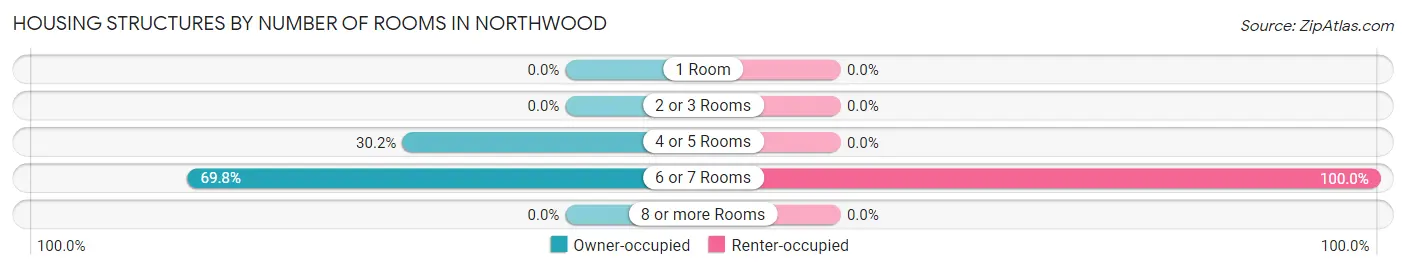
| Number of Rooms | Owner-occupied | Renter-occupied |
| 1 Room | 0 (0.0%) | 0 (0.0%) |
| 2 or 3 Rooms | 0 (0.0%) | 0 (0.0%) |
| 4 or 5 Rooms | 19 (30.2%) | 0 (0.0%) |
| 6 or 7 Rooms | 44 (69.8%) | 11 (100.0%) |
| 8 or more Rooms | 0 (0.0%) | 0 (0.0%) |
| Total | 63 (100.0%) | 11 (100.0%) |
Housing Structure by Heating Type in Northwood
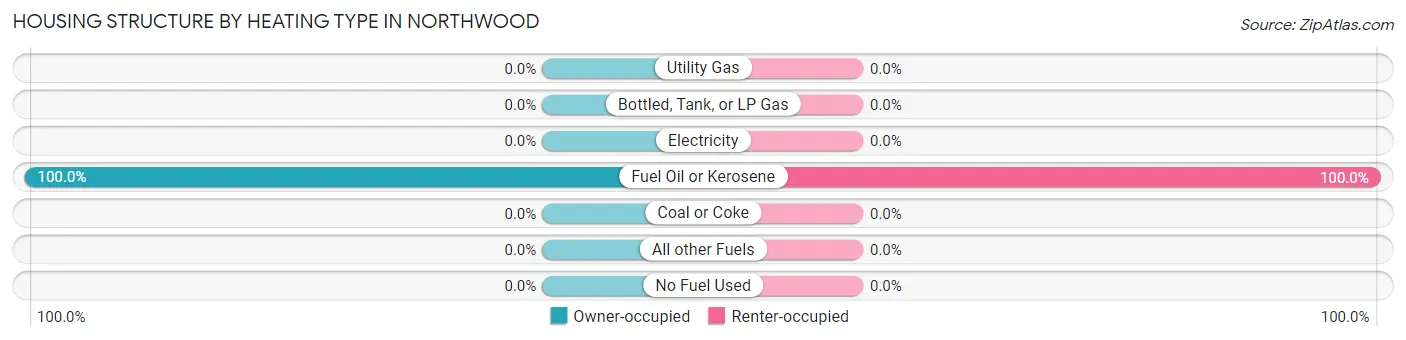
| Heating Type | Owner-occupied | Renter-occupied |
| Utility Gas | 0 (0.0%) | 0 (0.0%) |
| Bottled, Tank, or LP Gas | 0 (0.0%) | 0 (0.0%) |
| Electricity | 0 (0.0%) | 0 (0.0%) |
| Fuel Oil or Kerosene | 63 (100.0%) | 11 (100.0%) |
| Coal or Coke | 0 (0.0%) | 0 (0.0%) |
| All other Fuels | 0 (0.0%) | 0 (0.0%) |
| No Fuel Used | 0 (0.0%) | 0 (0.0%) |
| Total | 63 (100.0%) | 11 (100.0%) |
Household Vehicle Usage in Northwood
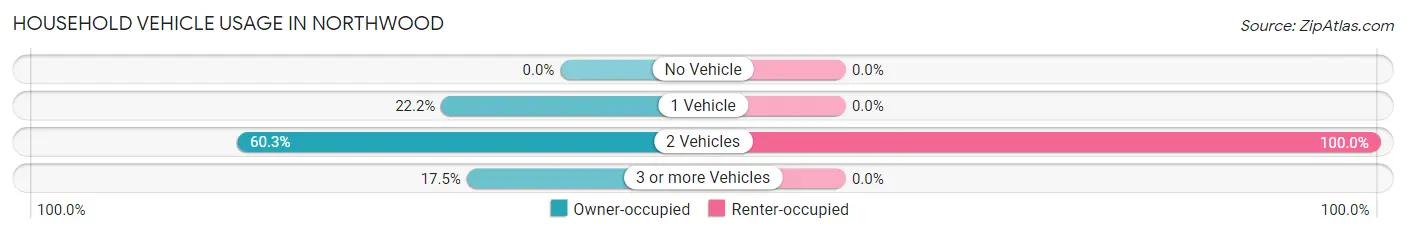
| Vehicles per Household | Owner-occupied | Renter-occupied |
| No Vehicle | 0 (0.0%) | 0 (0.0%) |
| 1 Vehicle | 14 (22.2%) | 0 (0.0%) |
| 2 Vehicles | 38 (60.3%) | 11 (100.0%) |
| 3 or more Vehicles | 11 (17.5%) | 0 (0.0%) |
| Total | 63 (100.0%) | 11 (100.0%) |
Real Estate & Mortgages in Northwood
Real Estate and Mortgage Overview in Northwood
| Characteristic | Without Mortgage | With Mortgage |
| Housing Units | 47 | 16 |
| Median Property Value | $150,500 | $0 |
| Median Household Income | - | - |
| Monthly Housing Costs | - | - |
| Real Estate Taxes | $1,010 | $0 |
Property Value by Mortgage Status in Northwood
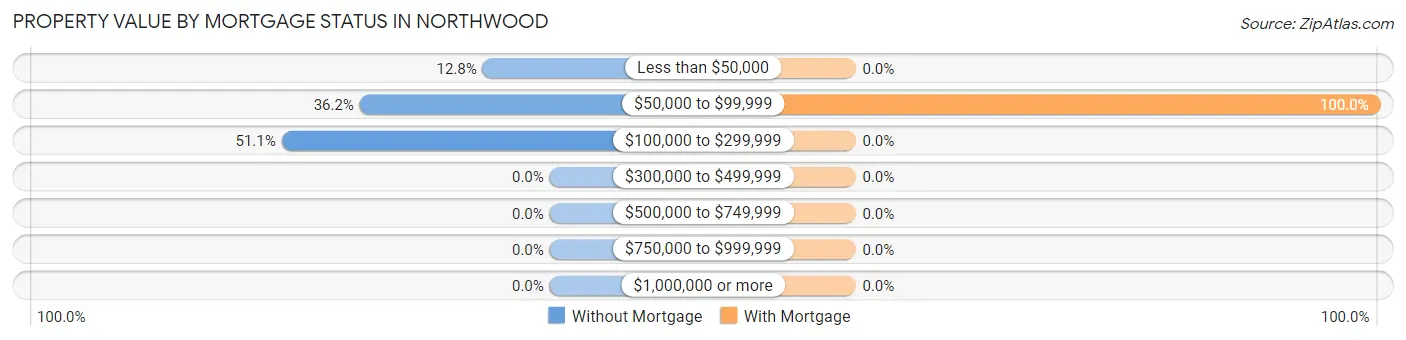
| Property Value | Without Mortgage | With Mortgage |
| Less than $50,000 | 6 (12.8%) | 0 (0.0%) |
| $50,000 to $99,999 | 17 (36.2%) | 16 (100.0%) |
| $100,000 to $299,999 | 24 (51.1%) | 0 (0.0%) |
| $300,000 to $499,999 | 0 (0.0%) | 0 (0.0%) |
| $500,000 to $749,999 | 0 (0.0%) | 0 (0.0%) |
| $750,000 to $999,999 | 0 (0.0%) | 0 (0.0%) |
| $1,000,000 or more | 0 (0.0%) | 0 (0.0%) |
| Total | 47 (100.0%) | 16 (100.0%) |
Household Income by Mortgage Status in Northwood
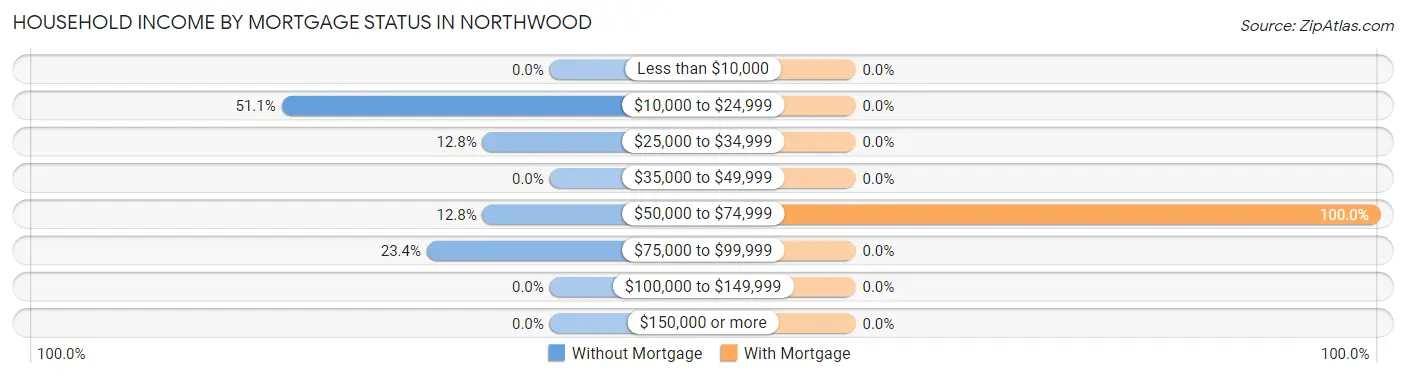
| Household Income | Without Mortgage | With Mortgage |
| Less than $10,000 | 0 (0.0%) | 0 (0.0%) |
| $10,000 to $24,999 | 24 (51.1%) | 0 (0.0%) |
| $25,000 to $34,999 | 6 (12.8%) | 0 (0.0%) |
| $35,000 to $49,999 | 0 (0.0%) | 0 (0.0%) |
| $50,000 to $74,999 | 6 (12.8%) | 16 (100.0%) |
| $75,000 to $99,999 | 11 (23.4%) | 0 (0.0%) |
| $100,000 to $149,999 | 0 (0.0%) | 0 (0.0%) |
| $150,000 or more | 0 (0.0%) | 0 (0.0%) |
| Total | 47 (100.0%) | 16 (100.0%) |
Property Value to Household Income Ratio in Northwood
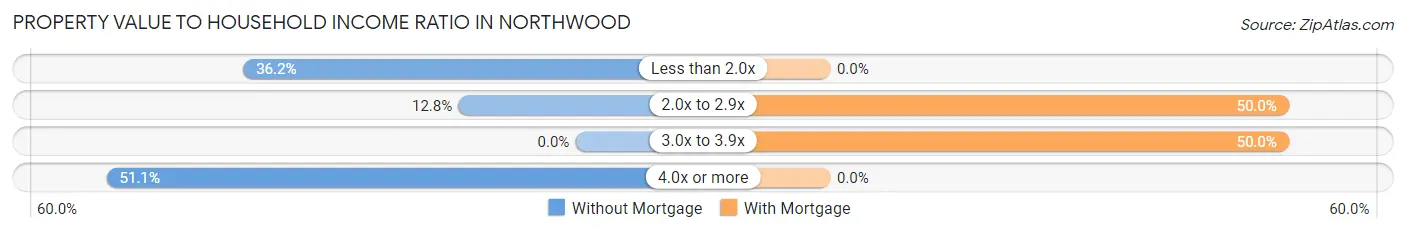
| Value-to-Income Ratio | Without Mortgage | With Mortgage |
| Less than 2.0x | 17 (36.2%) | 0 (0.0%) |
| 2.0x to 2.9x | 6 (12.8%) | 8 (50.0%) |
| 3.0x to 3.9x | 0 (0.0%) | 8 (50.0%) |
| 4.0x or more | 24 (51.1%) | 0 (0.0%) |
| Total | 47 (100.0%) | 16 (100.0%) |
Real Estate Taxes by Mortgage Status in Northwood
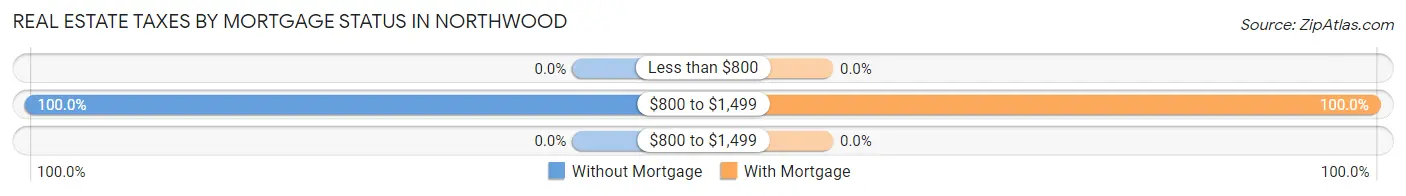
| Property Taxes | Without Mortgage | With Mortgage |
| Less than $800 | 0 (0.0%) | 0 (0.0%) |
| $800 to $1,499 | 47 (100.0%) | 16 (100.0%) |
| $800 to $1,499 | 0 (0.0%) | 0 (0.0%) |
| Total | 47 (100.0%) | 16 (100.0%) |
Health & Disability in Northwood
Health Insurance Coverage by Age in Northwood
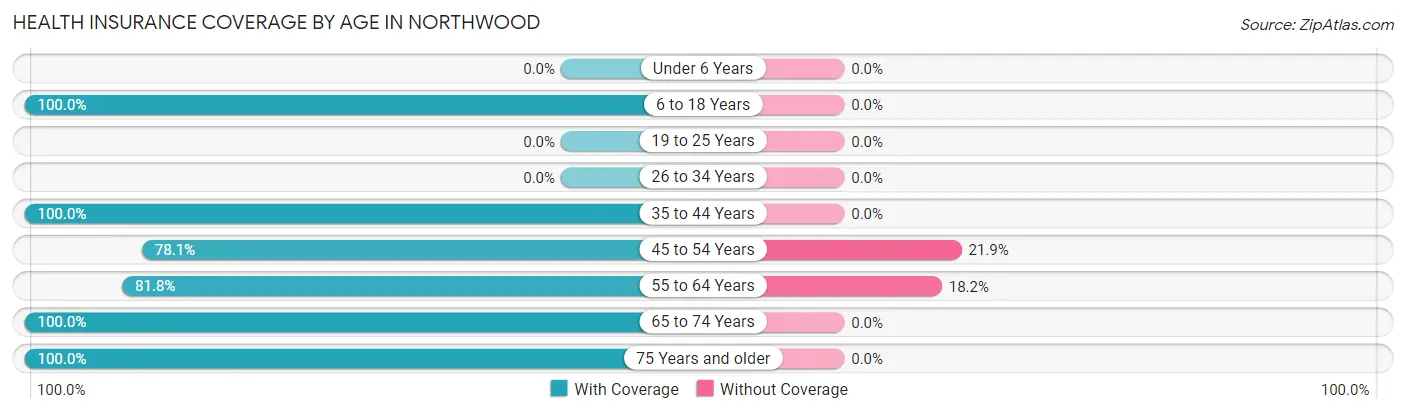
| Age Bracket | With Coverage | Without Coverage |
| Under 6 Years | 0 (0.0%) | 0 (0.0%) |
| 6 to 18 Years | 14 (100.0%) | 0 (0.0%) |
| 19 to 25 Years | 0 (0.0%) | 0 (0.0%) |
| 26 to 34 Years | 0 (0.0%) | 0 (0.0%) |
| 35 to 44 Years | 8 (100.0%) | 0 (0.0%) |
| 45 to 54 Years | 25 (78.1%) | 7 (21.9%) |
| 55 to 64 Years | 36 (81.8%) | 8 (18.2%) |
| 65 to 74 Years | 19 (100.0%) | 0 (0.0%) |
| 75 Years and older | 30 (100.0%) | 0 (0.0%) |
| Total | 132 (89.8%) | 15 (10.2%) |
Health Insurance Coverage by Citizenship Status in Northwood
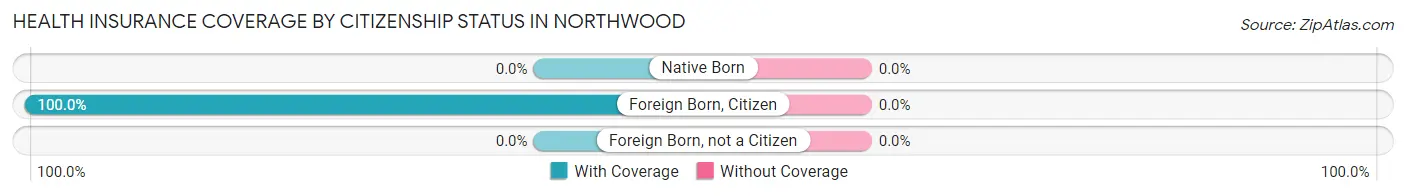
| Citizenship Status | With Coverage | Without Coverage |
| Native Born | 0 (0.0%) | 0 (0.0%) |
| Foreign Born, Citizen | 14 (100.0%) | 0 (0.0%) |
| Foreign Born, not a Citizen | 0 (0.0%) | 0 (0.0%) |
Health Insurance Coverage by Household Income in Northwood
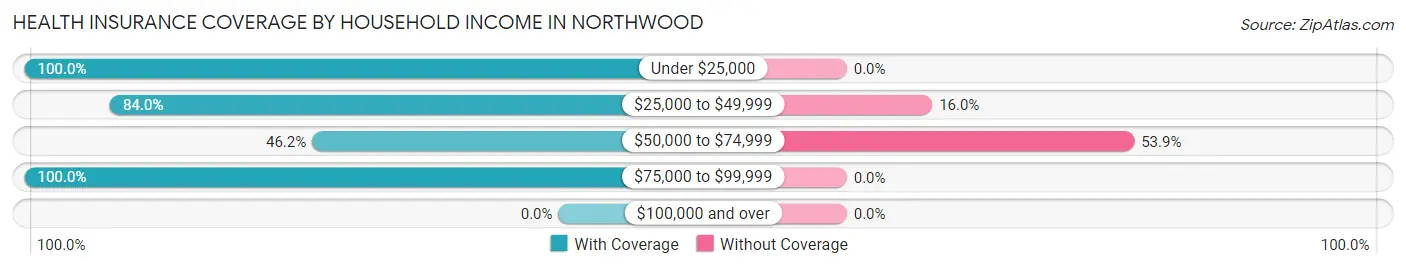
| Household Income | With Coverage | Without Coverage |
| Under $25,000 | 24 (100.0%) | 0 (0.0%) |
| $25,000 to $49,999 | 42 (84.0%) | 8 (16.0%) |
| $50,000 to $74,999 | 6 (46.2%) | 7 (53.8%) |
| $75,000 to $99,999 | 60 (100.0%) | 0 (0.0%) |
| $100,000 and over | 0 (0.0%) | 0 (0.0%) |
Public vs Private Health Insurance Coverage by Age in Northwood
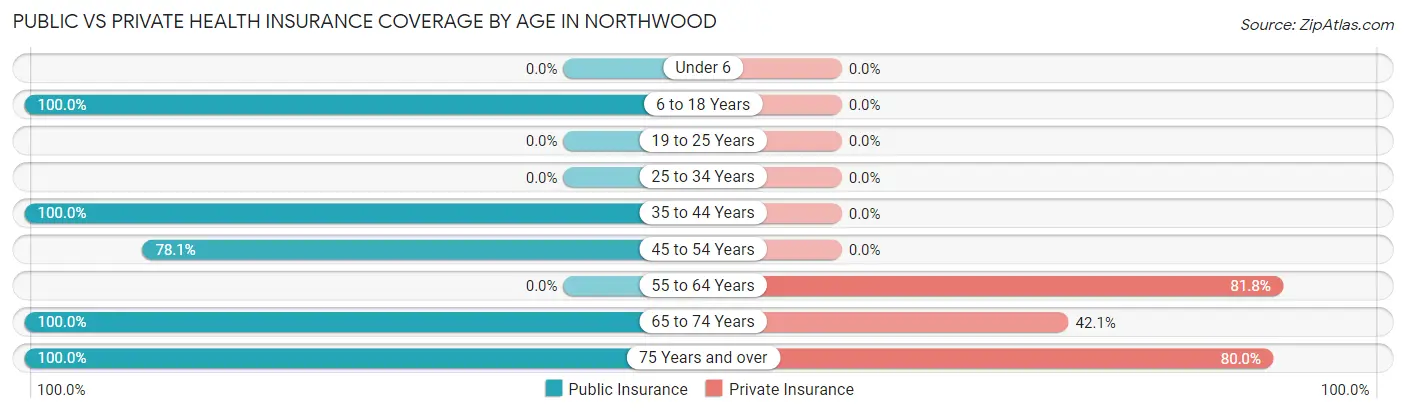
| Age Bracket | Public Insurance | Private Insurance |
| Under 6 | 0 (0.0%) | 0 (0.0%) |
| 6 to 18 Years | 14 (100.0%) | 0 (0.0%) |
| 19 to 25 Years | 0 (0.0%) | 0 (0.0%) |
| 25 to 34 Years | 0 (0.0%) | 0 (0.0%) |
| 35 to 44 Years | 8 (100.0%) | 0 (0.0%) |
| 45 to 54 Years | 25 (78.1%) | 0 (0.0%) |
| 55 to 64 Years | 0 (0.0%) | 36 (81.8%) |
| 65 to 74 Years | 19 (100.0%) | 8 (42.1%) |
| 75 Years and over | 30 (100.0%) | 24 (80.0%) |
| Total | 96 (65.3%) | 68 (46.3%) |
Disability Status by Sex by Age in Northwood
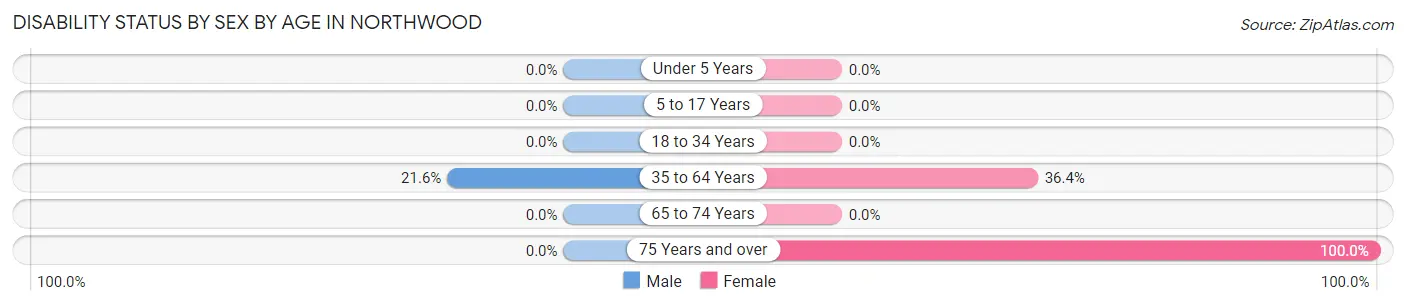
| Age Bracket | Male | Female |
| Under 5 Years | 0 (0.0%) | 0 (0.0%) |
| 5 to 17 Years | 0 (0.0%) | 0 (0.0%) |
| 18 to 34 Years | 0 (0.0%) | 0 (0.0%) |
| 35 to 64 Years | 11 (21.6%) | 12 (36.4%) |
| 65 to 74 Years | 0 (0.0%) | 0 (0.0%) |
| 75 Years and over | 0 (0.0%) | 30 (100.0%) |
Disability Class by Sex by Age in Northwood
Disability Class: Hearing Difficulty
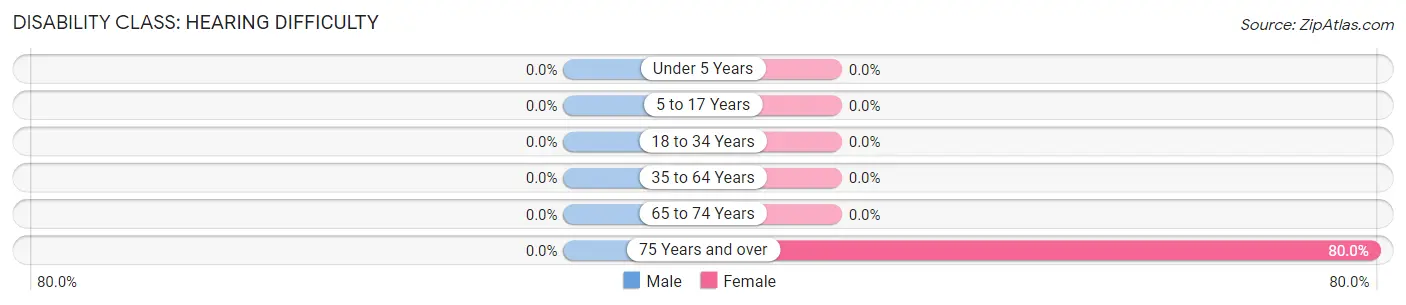
| Age Bracket | Male | Female |
| Under 5 Years | 0 (0.0%) | 0 (0.0%) |
| 5 to 17 Years | 0 (0.0%) | 0 (0.0%) |
| 18 to 34 Years | 0 (0.0%) | 0 (0.0%) |
| 35 to 64 Years | 0 (0.0%) | 0 (0.0%) |
| 65 to 74 Years | 0 (0.0%) | 0 (0.0%) |
| 75 Years and over | 0 (0.0%) | 24 (80.0%) |
Disability Class: Vision Difficulty
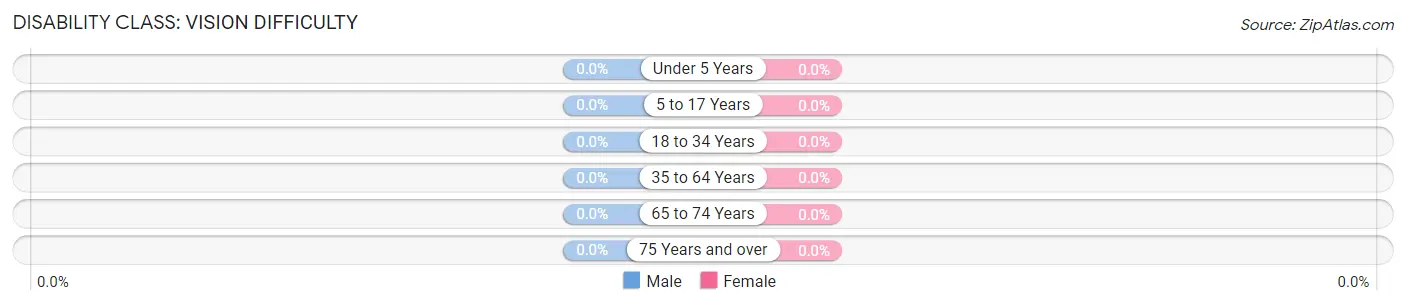
| Age Bracket | Male | Female |
| Under 5 Years | 0 (0.0%) | 0 (0.0%) |
| 5 to 17 Years | 0 (0.0%) | 0 (0.0%) |
| 18 to 34 Years | 0 (0.0%) | 0 (0.0%) |
| 35 to 64 Years | 0 (0.0%) | 0 (0.0%) |
| 65 to 74 Years | 0 (0.0%) | 0 (0.0%) |
| 75 Years and over | 0 (0.0%) | 0 (0.0%) |
Disability Class: Cognitive Difficulty
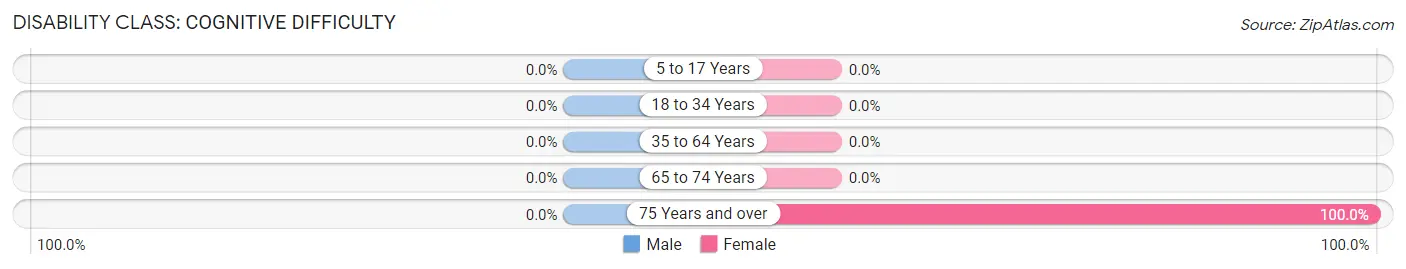
| Age Bracket | Male | Female |
| 5 to 17 Years | 0 (0.0%) | 0 (0.0%) |
| 18 to 34 Years | 0 (0.0%) | 0 (0.0%) |
| 35 to 64 Years | 0 (0.0%) | 0 (0.0%) |
| 65 to 74 Years | 0 (0.0%) | 0 (0.0%) |
| 75 Years and over | 0 (0.0%) | 30 (100.0%) |
Disability Class: Ambulatory Difficulty
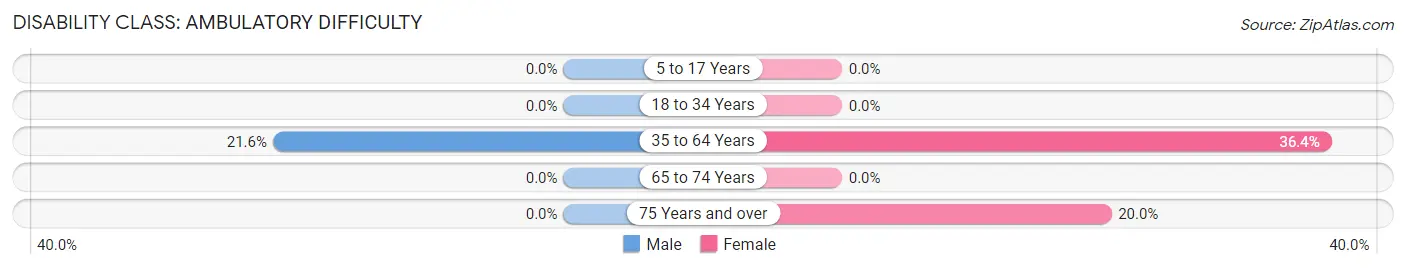
| Age Bracket | Male | Female |
| 5 to 17 Years | 0 (0.0%) | 0 (0.0%) |
| 18 to 34 Years | 0 (0.0%) | 0 (0.0%) |
| 35 to 64 Years | 11 (21.6%) | 12 (36.4%) |
| 65 to 74 Years | 0 (0.0%) | 0 (0.0%) |
| 75 Years and over | 0 (0.0%) | 6 (20.0%) |
Disability Class: Self-Care Difficulty
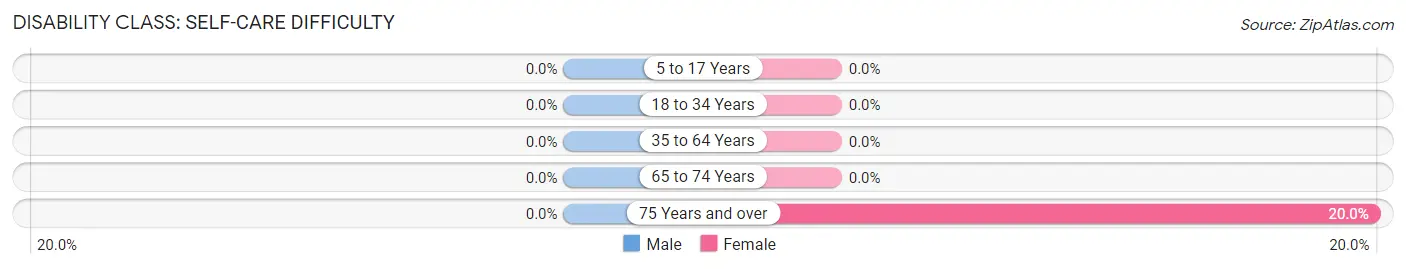
| Age Bracket | Male | Female |
| 5 to 17 Years | 0 (0.0%) | 0 (0.0%) |
| 18 to 34 Years | 0 (0.0%) | 0 (0.0%) |
| 35 to 64 Years | 0 (0.0%) | 0 (0.0%) |
| 65 to 74 Years | 0 (0.0%) | 0 (0.0%) |
| 75 Years and over | 0 (0.0%) | 6 (20.0%) |
Technology Access in Northwood
Computing Device Access in Northwood
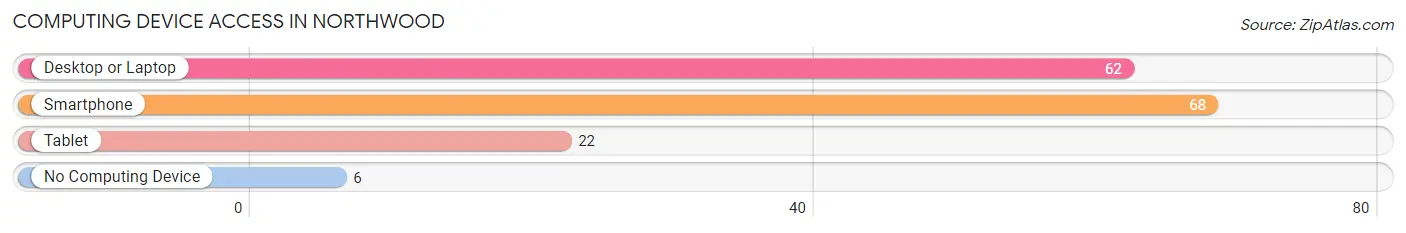
| Device Type | # Households | % Households |
| Desktop or Laptop | 62 | 83.8% |
| Smartphone | 68 | 91.9% |
| Tablet | 22 | 29.7% |
| No Computing Device | 6 | 8.1% |
| Total | 74 | 100.0% |
Internet Access in Northwood
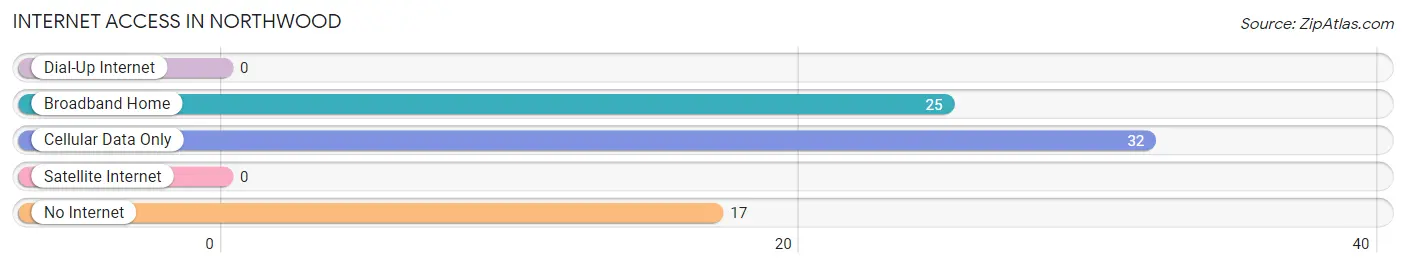
| Internet Type | # Households | % Households |
| Dial-Up Internet | 0 | 0.0% |
| Broadband Home | 25 | 33.8% |
| Cellular Data Only | 32 | 43.2% |
| Satellite Internet | 0 | 0.0% |
| No Internet | 17 | 23.0% |
| Total | 74 | 100.0% |
Northwood Summary
Northwood is a borough located in Allegheny County, Pennsylvania. It is situated in the northwest corner of the county, approximately 15 miles northwest of the city of Pittsburgh. The borough is bordered by the boroughs of Ross Township to the north, West View to the east, and McCandless Township to the south and west. The population of Northwood was 2,845 at the 2010 census.
History
Northwood was first settled in the early 1800s by a group of German immigrants. The area was originally known as “Germania” and was part of Ross Township. In 1868, the area was incorporated as the borough of Northwood. The name was chosen to reflect the area’s northern location in Allegheny County.
Geography
Northwood is located at 40°32'17" North, 80°2'17" West (40.538056, -80.038333). According to the United States Census Bureau, the borough has a total area of 0.7 square miles, all of it land.
Economy
Northwood’s economy is largely based on retail and services. The borough is home to several small businesses, including a grocery store, a hardware store, a pharmacy, and a variety of restaurants. The borough also has a number of professional offices, including doctors, lawyers, and accountants.
Demographics
As of the 2010 census, there were 2,845 people, 1,093 households, and 745 families residing in the borough. The population density was 4,072.9 people per square mile. The racial makeup of the borough was 94.2% White, 2.2% African American, 0.2% Native American, 1.2% Asian, 0.1% Pacific Islander, 0.7% from other races, and 1.6% from two or more races. Hispanic or Latino of any race were 2.2% of the population.
The median age in the borough was 43.2 years. 22.2% of residents were under the age of 18; 6.7% were between the ages of 18 and 24; 24.2% were from 25 to 44; 28.3% were from 45 to 64; and 18.6% were 65 years of age or older. The gender makeup of the borough was 48.2% male and 51.8% female.
The median income for a household in the borough was $50,938, and the median income for a family was $60,938. Males had a median income of $41,938 versus $30,938 for females. The per capita income for the borough was $25,938. About 4.2% of families and 5.7% of the population were below the poverty line, including 8.2% of those under age 18 and 4.2% of those age 65 or over.
Common Questions
What is Per Capita Income in Northwood?
Per Capita income in Northwood is $25,256.
What is Inequality or Gini Index in Northwood?
Inequality or Gini Index in Northwood is 0.33.
What is the Total Population of Northwood?
Total Population of Northwood is 147.
What is the Total Male Population of Northwood?
Total Male Population of Northwood is 58.
What is the Total Female Population of Northwood?
Total Female Population of Northwood is 89.
What is the Ratio of Males per 100 Females in Northwood?
There are 65.17 Males per 100 Females in Northwood.
What is the Ratio of Females per 100 Males in Northwood?
There are 153.45 Females per 100 Males in Northwood.
What is the Median Population Age in Northwood?
Median Population Age in Northwood is 62.5 Years.
What is the Average Family Size in Northwood
Average Family Size in Northwood is 3.2 People.
What is the Average Household Size in Northwood
Average Household Size in Northwood is 2.0 People.
How Large is the Labor Force in Northwood?
There are 95 People in the Labor Forcein in Northwood.
What is the Percentage of People in the Labor Force in Northwood?
71.4% of People are in the Labor Force in Northwood.
What is the Unemployment Rate in Northwood?
Unemployment Rate in Northwood is 13.7%.