Cities with the Highest Percentage of Immigrants from Eastern Africa in Iowa
RELATED REPORTS & OPTIONS
Eastern Africa
Iowa
Compare Cities
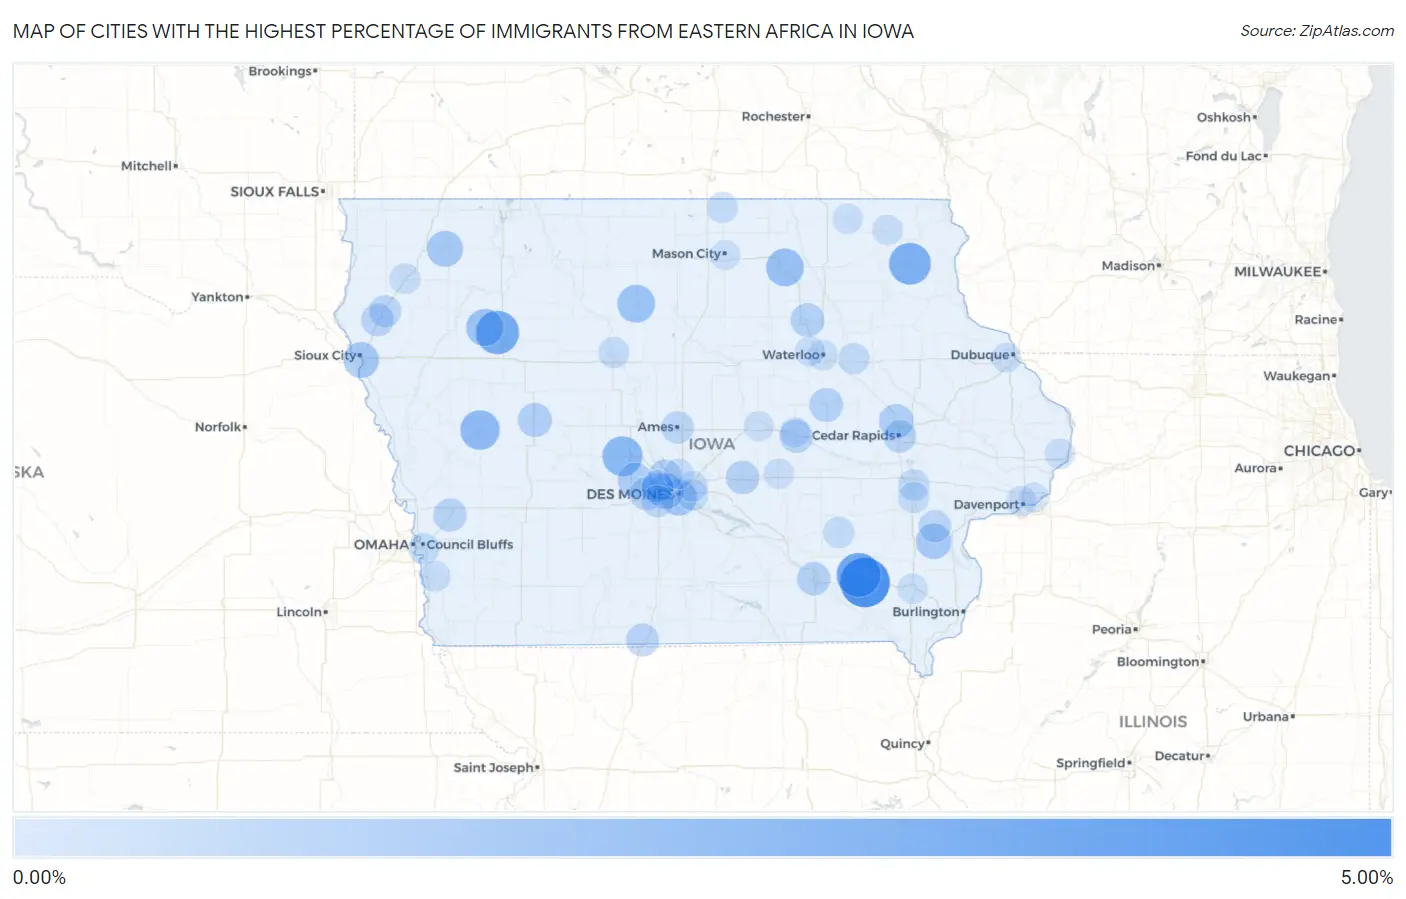
Map of Cities with the Highest Percentage of Immigrants from Eastern Africa in Iowa
0.00%
5.00%
Cities with the Highest Percentage of Immigrants from Eastern Africa in Iowa
| City | Eastern Africa | vs State | vs National | |
| 1. | Fairfield | 4.04% | 0.26%(+3.79)#-1 | 0.23%(+3.82)#0 |
| 2. | Maharishi Vedic City | 2.91% | 0.26%(+2.65)#0 | 0.23%(+2.68)#1 |
| 3. | Storm Lake | 2.70% | 0.26%(+2.44)#1 | 0.23%(+2.47)#2 |
| 4. | Postville | 2.41% | 0.26%(+2.16)#2 | 0.23%(+2.19)#3 |
| 5. | Perry | 1.99% | 0.26%(+1.74)#3 | 0.23%(+1.77)#96 |
| 6. | Denison | 1.90% | 0.26%(+1.64)#4 | 0.23%(+1.67)#97 |
| 7. | Charles City | 1.53% | 0.26%(+1.28)#5 | 0.23%(+1.31)#98 |
| 8. | Renwick | 1.52% | 0.26%(+1.26)#6 | 0.23%(+1.29)#99 |
| 9. | Alta | 1.45% | 0.26%(+1.19)#7 | 0.23%(+1.22)#100 |
| 10. | Des Moines | 1.24% | 0.26%(+0.981)#8 | 0.23%(+1.01)#101 |
| 11. | Sanborn | 1.17% | 0.26%(+0.915)#9 | 0.23%(+0.945)#102 |
| 12. | Sioux City | 1.11% | 0.26%(+0.856)#10 | 0.23%(+0.885)#103 |
| 13. | Columbus Junction | 1.08% | 0.26%(+0.827)#11 | 0.23%(+0.857)#104 |
| 14. | Windsor Heights | 1.08% | 0.26%(+0.820)#12 | 0.23%(+0.850)#105 |
| 15. | Dallas Center | 0.90% | 0.26%(+0.647)#13 | 0.23%(+0.677)#106 |
| 16. | Hiawatha | 0.88% | 0.26%(+0.620)#14 | 0.23%(+0.650)#107 |
| 17. | Carroll | 0.79% | 0.26%(+0.532)#15 | 0.23%(+0.561)#108 |
| 18. | Waverly | 0.72% | 0.26%(+0.464)#16 | 0.23%(+0.494)#109 |
| 19. | Dysart | 0.71% | 0.26%(+0.456)#17 | 0.23%(+0.486)#110 |
| 20. | Ottumwa | 0.66% | 0.26%(+0.405)#18 | 0.23%(+0.435)#111 |
| 21. | Johnston | 0.65% | 0.26%(+0.397)#19 | 0.23%(+0.427)#112 |
| 22. | Newton | 0.65% | 0.26%(+0.393)#20 | 0.23%(+0.423)#113 |
| 23. | Neola | 0.62% | 0.26%(+0.365)#21 | 0.23%(+0.395)#114 |
| 24. | Tama | 0.62% | 0.26%(+0.361)#22 | 0.23%(+0.391)#115 |
| 25. | Waukee | 0.58% | 0.26%(+0.326)#23 | 0.23%(+0.356)#116 |
| 26. | Lamoni | 0.57% | 0.26%(+0.312)#24 | 0.23%(+0.342)#117 |
| 27. | Cedar Rapids | 0.52% | 0.26%(+0.264)#25 | 0.23%(+0.294)#118 |
| 28. | Merrill | 0.52% | 0.26%(+0.264)#26 | 0.23%(+0.294)#119 |
| 29. | Clive | 0.47% | 0.26%(+0.211)#27 | 0.23%(+0.241)#120 |
| 30. | Ames | 0.46% | 0.26%(+0.199)#28 | 0.23%(+0.229)#121 |
| 31. | Le Mars | 0.46% | 0.26%(+0.198)#29 | 0.23%(+0.228)#122 |
| 32. | Conesville | 0.43% | 0.26%(+0.171)#30 | 0.23%(+0.201)#123 |
| 33. | Urbandale | 0.41% | 0.26%(+0.151)#31 | 0.23%(+0.181)#124 |
| 34. | West Des Moines | 0.37% | 0.26%(+0.115)#32 | 0.23%(+0.145)#125 |
| 35. | Iowa City | 0.28% | 0.26%(+0.026)#33 | 0.23%(+0.056)#126 |
| 36. | Jesup | 0.24% | 0.26%(-0.017)#34 | 0.23%(+0.013)#127 |
| 37. | Council Bluffs | 0.24% | 0.26%(-0.018)#35 | 0.23%(+0.012)#128 |
| 38. | Pleasant Hill | 0.23% | 0.26%(-0.028)#36 | 0.23%(+0.002)#129 |
| 39. | Hills | 0.22% | 0.26%(-0.032)#37 | 0.23%(-0.002)#130 |
| 40. | Sigourney | 0.22% | 0.26%(-0.039)#38 | 0.23%(-0.009)#131 |
| 41. | Fort Dodge | 0.20% | 0.26%(-0.056)#39 | 0.23%(-0.026)#132 |
| 42. | Northwood | 0.19% | 0.26%(-0.070)#40 | 0.23%(-0.040)#133 |
| 43. | Glenwood | 0.16% | 0.26%(-0.101)#41 | 0.23%(-0.071)#134 |
| 44. | Alton | 0.16% | 0.26%(-0.101)#42 | 0.23%(-0.071)#135 |
| 45. | Altoona | 0.13% | 0.26%(-0.122)#43 | 0.23%(-0.092)#136 |
| 46. | Grinnell | 0.095% | 0.26%(-0.163)#44 | 0.23%(-0.133)#137 |
| 47. | Decorah | 0.092% | 0.26%(-0.165)#45 | 0.23%(-0.135)#138 |
| 48. | Ankeny | 0.091% | 0.26%(-0.166)#46 | 0.23%(-0.137)#139 |
| 49. | Clinton | 0.082% | 0.26%(-0.176)#47 | 0.23%(-0.146)#140 |
| 50. | Waterloo | 0.070% | 0.26%(-0.187)#48 | 0.23%(-0.157)#141 |
| 51. | Davenport | 0.052% | 0.26%(-0.205)#49 | 0.23%(-0.175)#142 |
| 52. | Cresco | 0.051% | 0.26%(-0.206)#50 | 0.23%(-0.176)#143 |
| 53. | Toledo | 0.049% | 0.26%(-0.208)#51 | 0.23%(-0.178)#144 |
| 54. | Mount Pleasant | 0.043% | 0.26%(-0.214)#52 | 0.23%(-0.184)#145 |
| 55. | Marshalltown | 0.033% | 0.26%(-0.224)#53 | 0.23%(-0.195)#146 |
| 56. | Mason City | 0.026% | 0.26%(-0.231)#54 | 0.23%(-0.202)#147 |
| 57. | Dubuque | 0.0067% | 0.26%(-0.250)#55 | 0.23%(-0.220)#148 |
| 58. | Bettendorf | 0.0026% | 0.26%(-0.255)#56 | 0.23%(-0.225)#149 |
| 59. | Cedar Falls | 0.0025% | 0.26%(-0.255)#57 | 0.23%(-0.225)#150 |
Common Questions
What are the Top 10 Cities with the Highest Percentage of Immigrants from Eastern Africa in Iowa?
Top 10 Cities with the Highest Percentage of Immigrants from Eastern Africa in Iowa are:
#1
4.04%
#2
2.91%
#3
2.70%
#4
2.41%
#5
1.99%
#6
1.90%
#7
1.53%
#8
1.52%
#9
1.45%
#10
1.24%
What city has the Highest Percentage of Immigrants from Eastern Africa in Iowa?
Fairfield has the Highest Percentage of Immigrants from Eastern Africa in Iowa with 4.04%.
What is the Percentage of Immigrants from Eastern Africa in the State of Iowa?
Percentage of Immigrants from Eastern Africa in Iowa is 0.26%.
What is the Percentage of Immigrants from Eastern Africa in the United States?
Percentage of Immigrants from Eastern Africa in the United States is 0.23%.