Birmingham borough, PA Map & Demographics
Birmingham borough Overview
$30,283
PER CAPITA INCOME
$69,583
AVG FAMILY INCOME
$68,250
AVG HOUSEHOLD INCOME
30.5%
WAGE / INCOME GAP [ % ]
69.5¢/ $1
WAGE / INCOME GAP [ $ ]
0.26
INEQUALITY / GINI INDEX
63
TOTAL POPULATION
40
MALE POPULATION
23
FEMALE POPULATION
173.91
MALES / 100 FEMALES
57.50
FEMALES / 100 MALES
49.5
MEDIAN AGE
2.6
AVG FAMILY SIZE
2.2
AVG HOUSEHOLD SIZE
32
LABOR FORCE [ PEOPLE ]
61.5%
PERCENT IN LABOR FORCE
3.1%
UNEMPLOYMENT RATE
Income in Birmingham borough
Income Overview in Birmingham borough
Per Capita Income in Birmingham borough is $30,283, while median incomes of families and households are $69,583 and $68,250 respectively.
| Characteristic | Number | Measure |
| Per Capita Income | 63 | $30,283 |
| Median Family Income | 21 | $69,583 |
| Mean Family Income | 21 | $75,724 |
| Median Household Income | 29 | $68,250 |
| Mean Household Income | 29 | $67,010 |
| Income Deficit | 21 | $0 |
| Wage / Income Gap (%) | 63 | 30.50% |
| Wage / Income Gap ($) | 63 | 69.50¢ per $1 |
| Gini / Inequality Index | 63 | 0.26 |
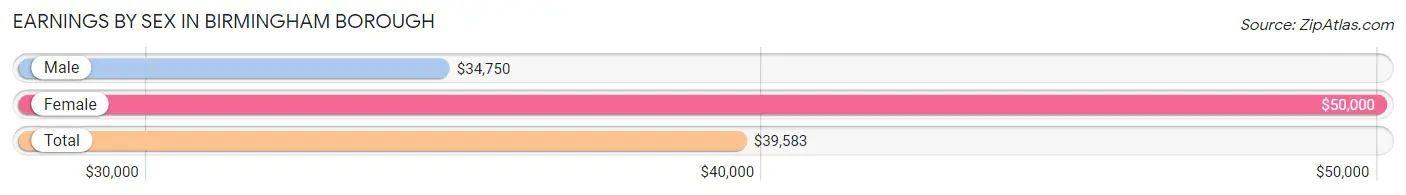
Earnings by Sex in Birmingham borough
Average Earnings in Birmingham borough are $39,583, $34,750 for men and $50,000 for women, a difference of 30.5%.
| Sex | Number | Average Earnings |
| Male | 21 (60.0%) | $34,750 |
| Female | 14 (40.0%) | $50,000 |
| Total | 35 (100.0%) | $39,583 |
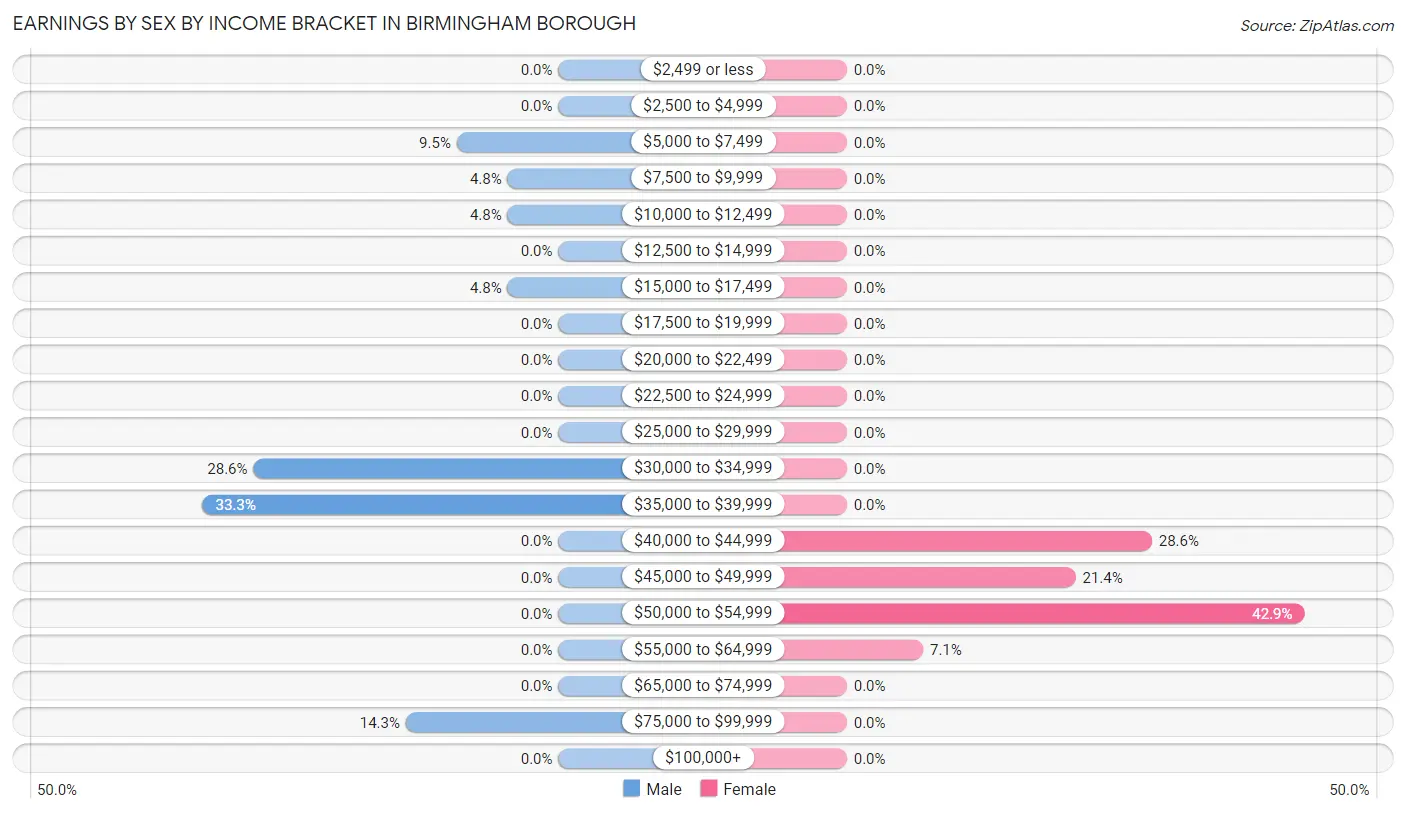
Earnings by Sex by Income Bracket in Birmingham borough
The most common earnings brackets in Birmingham borough are $35,000 to $39,999 for men (7 | 33.3%) and $50,000 to $54,999 for women (6 | 42.9%).
| Income | Male | Female |
| $2,499 or less | 0 (0.0%) | 0 (0.0%) |
| $2,500 to $4,999 | 0 (0.0%) | 0 (0.0%) |
| $5,000 to $7,499 | 2 (9.5%) | 0 (0.0%) |
| $7,500 to $9,999 | 1 (4.8%) | 0 (0.0%) |
| $10,000 to $12,499 | 1 (4.8%) | 0 (0.0%) |
| $12,500 to $14,999 | 0 (0.0%) | 0 (0.0%) |
| $15,000 to $17,499 | 1 (4.8%) | 0 (0.0%) |
| $17,500 to $19,999 | 0 (0.0%) | 0 (0.0%) |
| $20,000 to $22,499 | 0 (0.0%) | 0 (0.0%) |
| $22,500 to $24,999 | 0 (0.0%) | 0 (0.0%) |
| $25,000 to $29,999 | 0 (0.0%) | 0 (0.0%) |
| $30,000 to $34,999 | 6 (28.6%) | 0 (0.0%) |
| $35,000 to $39,999 | 7 (33.3%) | 0 (0.0%) |
| $40,000 to $44,999 | 0 (0.0%) | 4 (28.6%) |
| $45,000 to $49,999 | 0 (0.0%) | 3 (21.4%) |
| $50,000 to $54,999 | 0 (0.0%) | 6 (42.9%) |
| $55,000 to $64,999 | 0 (0.0%) | 1 (7.1%) |
| $65,000 to $74,999 | 0 (0.0%) | 0 (0.0%) |
| $75,000 to $99,999 | 3 (14.3%) | 0 (0.0%) |
| $100,000+ | 0 (0.0%) | 0 (0.0%) |
| Total | 21 (100.0%) | 14 (100.0%) |
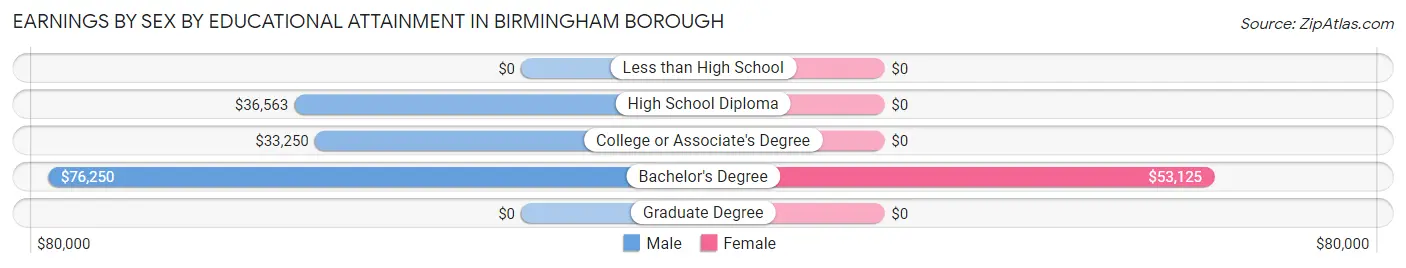
Earnings by Sex by Educational Attainment in Birmingham borough
Average earnings in Birmingham borough are $35,000 for men and $50,000 for women, a difference of 30.0%. Men with an educational attainment of bachelor's degree enjoy the highest average annual earnings of $76,250, while those with college or associate's degree education earn the least with $33,250. Women with an educational attainment of bachelor's degree earn the most with the average annual earnings of $53,125, while those with bachelor's degree education have the smallest earnings of $53,125.
| Educational Attainment | Male Income | Female Income |
| Less than High School | - | - |
| High School Diploma | $36,563 | $0 |
| College or Associate's Degree | $33,250 | $0 |
| Bachelor's Degree | $76,250 | $53,125 |
| Graduate Degree | - | - |
| Total | $35,000 | $50,000 |
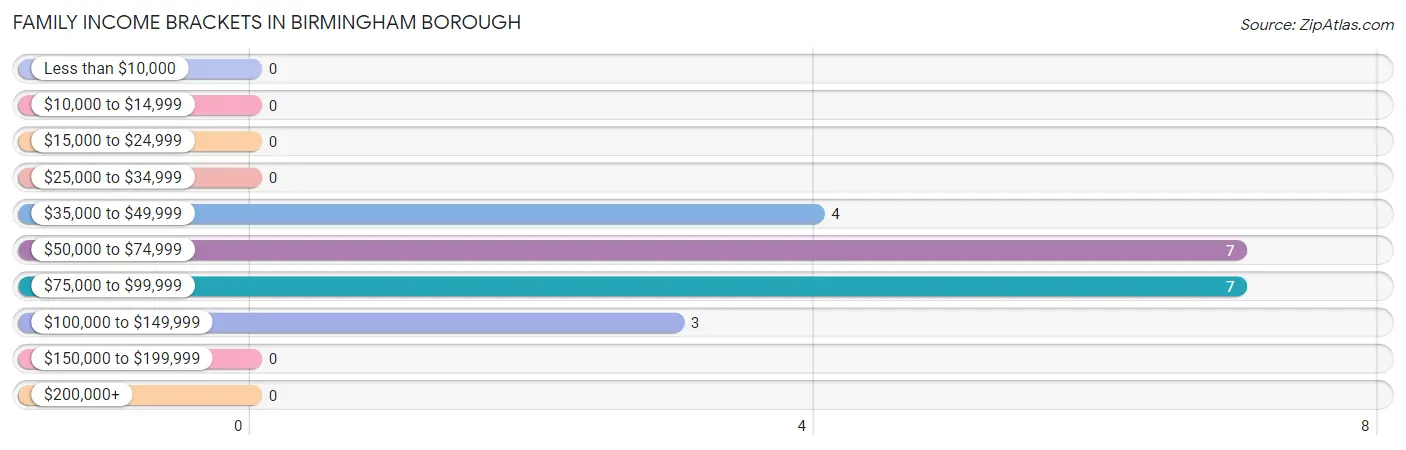
Family Income in Birmingham borough
Family Income Brackets in Birmingham borough
According to the Birmingham borough family income data, there are 7 families falling into the $50,000 to $74,999 income range, which is the most common income bracket and makes up 33.3% of all families.
| Income Bracket | # Families | % Families |
| Less than $10,000 | 0 | 0.0% |
| $10,000 to $14,999 | 0 | 0.0% |
| $15,000 to $24,999 | 0 | 0.0% |
| $25,000 to $34,999 | 0 | 0.0% |
| $35,000 to $49,999 | 4 | 19.0% |
| $50,000 to $74,999 | 7 | 33.3% |
| $75,000 to $99,999 | 7 | 33.3% |
| $100,000 to $149,999 | 3 | 14.3% |
| $150,000 to $199,999 | 0 | 0.0% |
| $200,000+ | 0 | 0.0% |
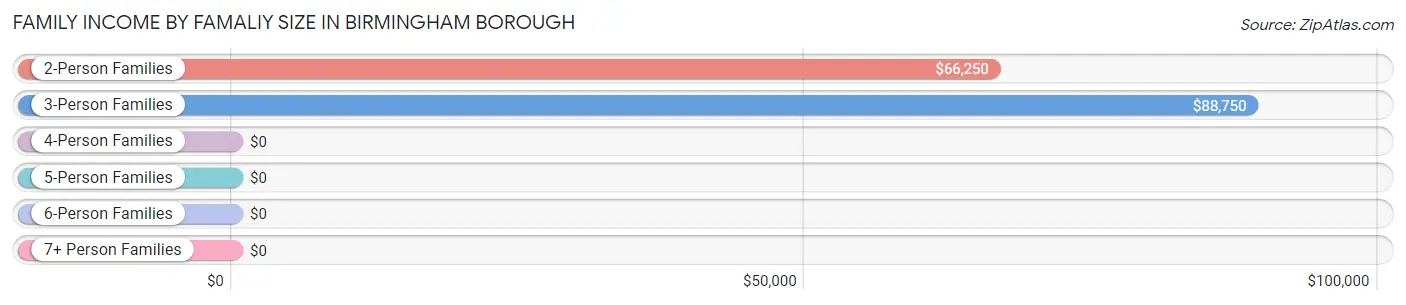
Family Income by Famaliy Size in Birmingham borough
3-person families (8 | 38.1%) account for the highest median family income in Birmingham borough with $88,750 per family, while 2-person families (12 | 57.1%) have the highest median income of $33,125 per family member.
| Income Bracket | # Families | Median Income |
| 2-Person Families | 12 (57.1%) | $66,250 |
| 3-Person Families | 8 (38.1%) | $88,750 |
| 4-Person Families | 1 (4.8%) | $0 |
| 5-Person Families | 0 (0.0%) | $0 |
| 6-Person Families | 0 (0.0%) | $0 |
| 7+ Person Families | 0 (0.0%) | $0 |
| Total | 21 (100.0%) | $69,583 |
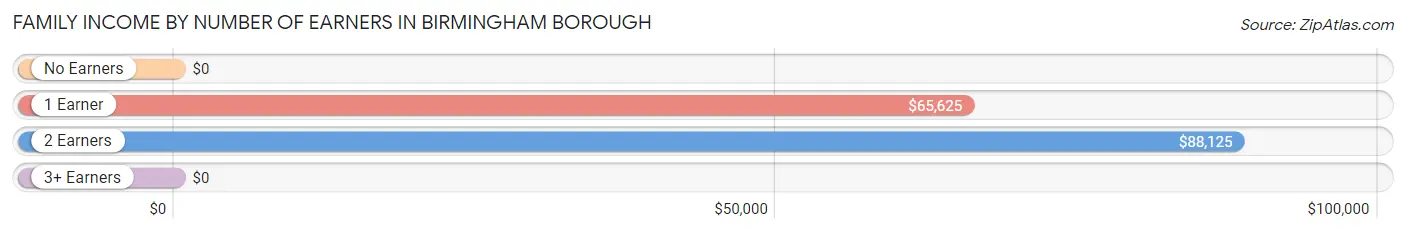
Family Income by Number of Earners in Birmingham borough
| Number of Earners | # Families | Median Income |
| No Earners | 2 (9.5%) | $0 |
| 1 Earner | 10 (47.6%) | $65,625 |
| 2 Earners | 8 (38.1%) | $88,125 |
| 3+ Earners | 1 (4.8%) | $0 |
| Total | 21 (100.0%) | $69,583 |
Household Income in Birmingham borough
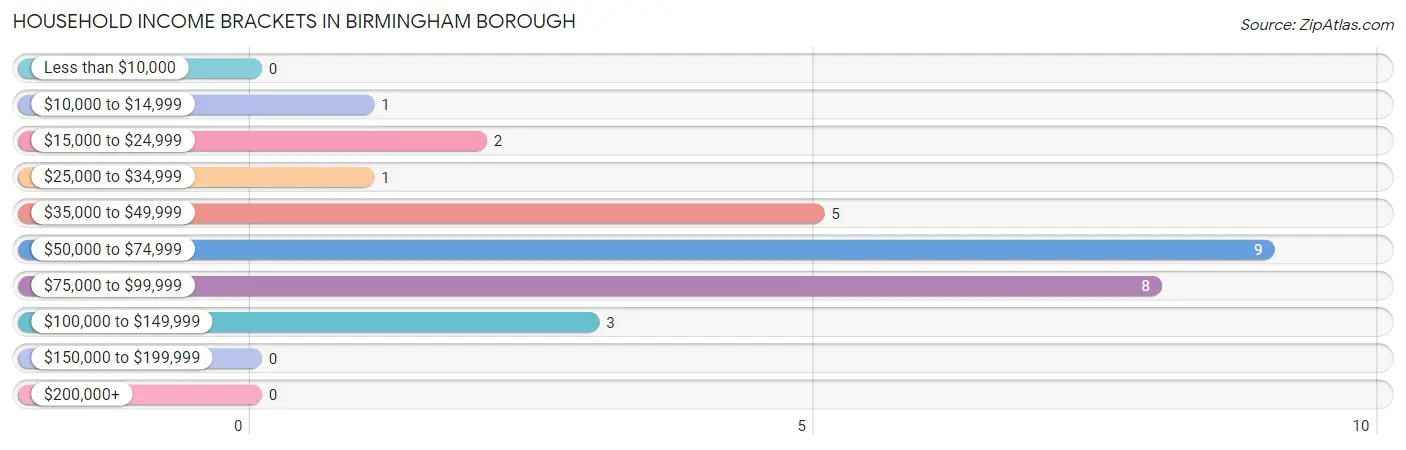
Household Income Brackets in Birmingham borough
With 9 households falling in the category, the $50,000 to $74,999 income range is the most frequent in Birmingham borough, accounting for 31.0% of all households.
| Income Bracket | # Households | % Households |
| Less than $10,000 | 0 | 0.0% |
| $10,000 to $14,999 | 1 | 3.4% |
| $15,000 to $24,999 | 2 | 6.9% |
| $25,000 to $34,999 | 1 | 3.4% |
| $35,000 to $49,999 | 5 | 17.2% |
| $50,000 to $74,999 | 9 | 31.0% |
| $75,000 to $99,999 | 8 | 27.6% |
| $100,000 to $149,999 | 3 | 10.3% |
| $150,000 to $199,999 | 0 | 0.0% |
| $200,000+ | 0 | 0.0% |
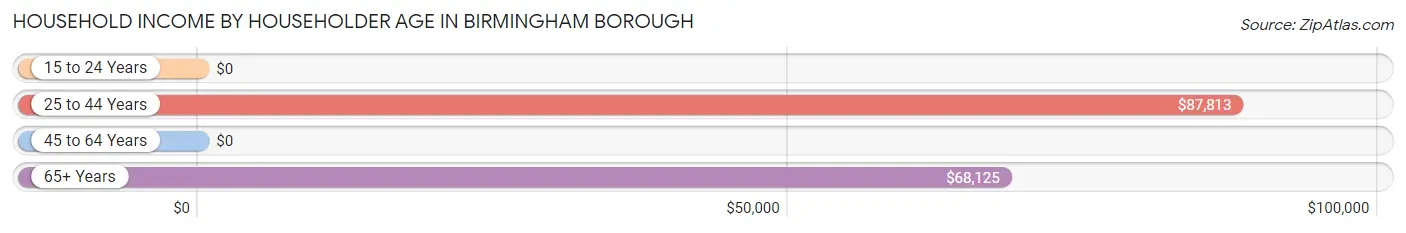
Household Income by Householder Age in Birmingham borough
The median household income in Birmingham borough is $68,250, with the highest median household income of $87,813 found in the 25 to 44 years age bracket for the primary householder. A total of 9 households (31.0%) fall into this category.
| Income Bracket | # Households | Median Income |
| 15 to 24 Years | 0 (0.0%) | $0 |
| 25 to 44 Years | 9 (31.0%) | $87,813 |
| 45 to 64 Years | 6 (20.7%) | $0 |
| 65+ Years | 14 (48.3%) | $68,125 |
| Total | 29 (100.0%) | $68,250 |
Poverty in Birmingham borough
Income Below Poverty by Sex and Age in Birmingham borough
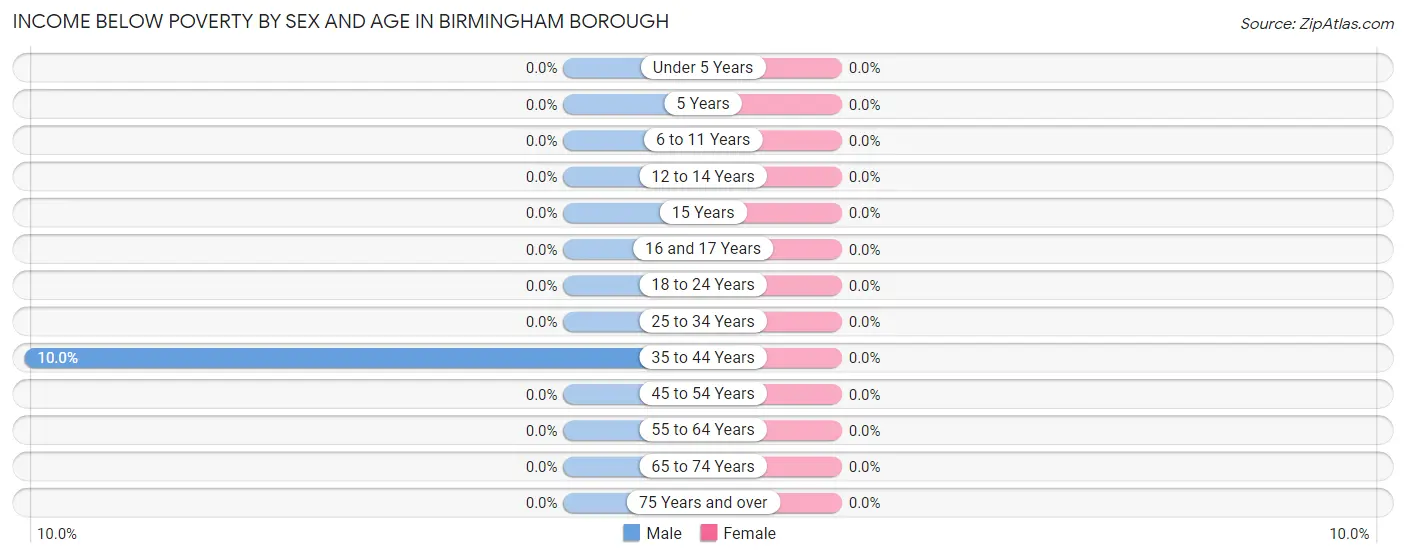
| Age Bracket | Male | Female |
| Under 5 Years | 0 (0.0%) | 0 (0.0%) |
| 5 Years | 0 (0.0%) | 0 (0.0%) |
| 6 to 11 Years | 0 (0.0%) | 0 (0.0%) |
| 12 to 14 Years | 0 (0.0%) | 0 (0.0%) |
| 15 Years | 0 (0.0%) | 0 (0.0%) |
| 16 and 17 Years | 0 (0.0%) | 0 (0.0%) |
| 18 to 24 Years | 0 (0.0%) | 0 (0.0%) |
| 25 to 34 Years | 0 (0.0%) | 0 (0.0%) |
| 35 to 44 Years | 1 (10.0%) | 0 (0.0%) |
| 45 to 54 Years | 0 (0.0%) | 0 (0.0%) |
| 55 to 64 Years | 0 (0.0%) | 0 (0.0%) |
| 65 to 74 Years | 0 (0.0%) | 0 (0.0%) |
| 75 Years and over | 0 (0.0%) | 0 (0.0%) |
| Total | 1 (2.5%) | 0 (0.0%) |
Income Above Poverty by Sex and Age in Birmingham borough
According to the poverty statistics in Birmingham borough, males aged under 5 years and females aged 25 to 34 years are the age groups that are most secure financially, with 100.0% of males and 100.0% of females in these age groups living above the poverty line.
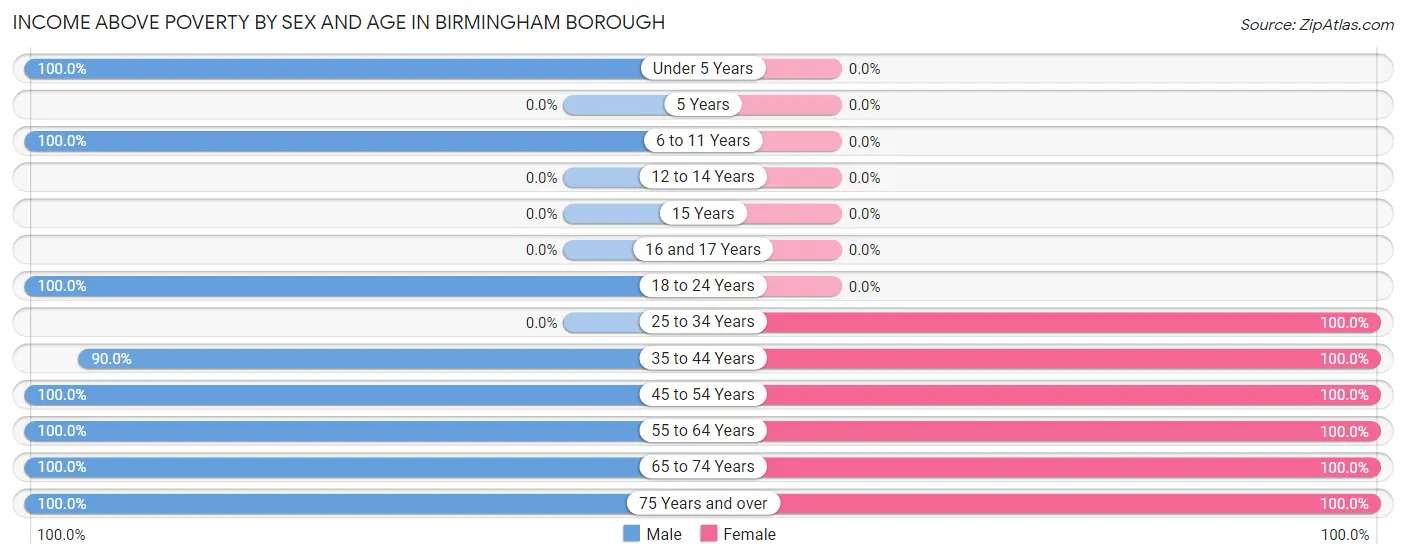
| Age Bracket | Male | Female |
| Under 5 Years | 7 (100.0%) | 0 (0.0%) |
| 5 Years | 0 (0.0%) | 0 (0.0%) |
| 6 to 11 Years | 4 (100.0%) | 0 (0.0%) |
| 12 to 14 Years | 0 (0.0%) | 0 (0.0%) |
| 15 Years | 0 (0.0%) | 0 (0.0%) |
| 16 and 17 Years | 0 (0.0%) | 0 (0.0%) |
| 18 to 24 Years | 1 (100.0%) | 0 (0.0%) |
| 25 to 34 Years | 0 (0.0%) | 5 (100.0%) |
| 35 to 44 Years | 9 (90.0%) | 2 (100.0%) |
| 45 to 54 Years | 3 (100.0%) | 2 (100.0%) |
| 55 to 64 Years | 5 (100.0%) | 6 (100.0%) |
| 65 to 74 Years | 4 (100.0%) | 2 (100.0%) |
| 75 Years and over | 6 (100.0%) | 6 (100.0%) |
| Total | 39 (97.5%) | 23 (100.0%) |
Income Below Poverty Among Married-Couple Families in Birmingham borough
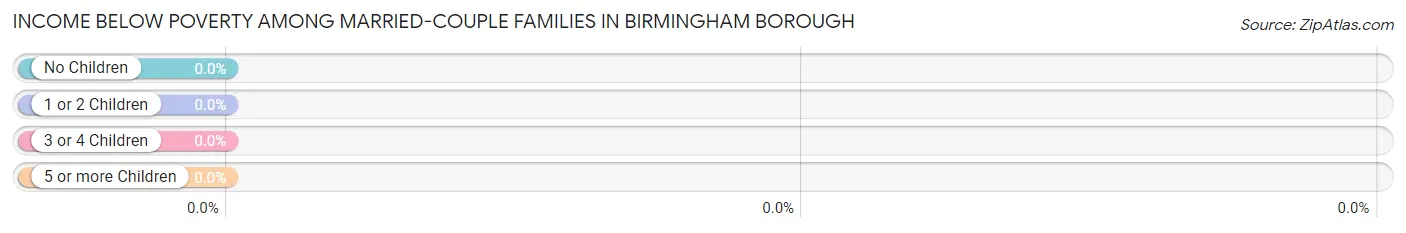
| Children | Above Poverty | Below Poverty |
| No Children | 15 (100.0%) | 0 (0.0%) |
| 1 or 2 Children | 6 (100.0%) | 0 (0.0%) |
| 3 or 4 Children | 0 (0.0%) | 0 (0.0%) |
| 5 or more Children | 0 (0.0%) | 0 (0.0%) |
| Total | 21 (100.0%) | 0 (0.0%) |
Income Below Poverty Among Single-Parent Households in Birmingham borough
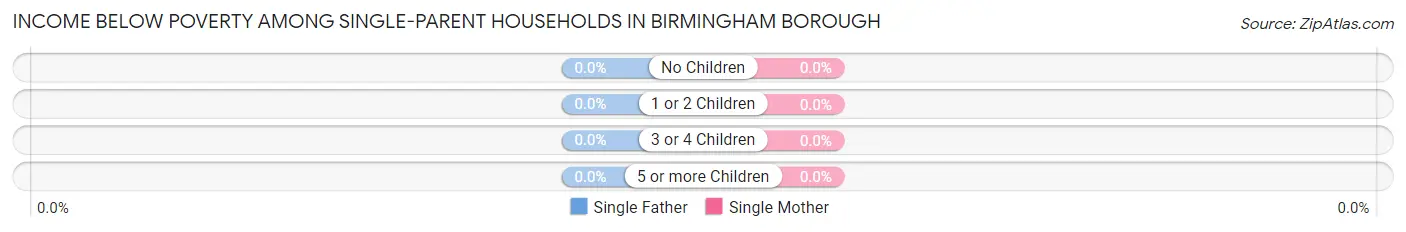
| Children | Single Father | Single Mother |
| No Children | 0 (0.0%) | 0 (0.0%) |
| 1 or 2 Children | 0 (0.0%) | 0 (0.0%) |
| 3 or 4 Children | 0 (0.0%) | 0 (0.0%) |
| 5 or more Children | 0 (0.0%) | 0 (0.0%) |
| Total | 0 (0.0%) | 0 (0.0%) |
Income Below Poverty Among Married-Couple vs Single-Parent Households in Birmingham borough
| Children | Married-Couple Families | Single-Parent Households |
| No Children | 0 (0.0%) | 0 (0.0%) |
| 1 or 2 Children | 0 (0.0%) | 0 (0.0%) |
| 3 or 4 Children | 0 (0.0%) | 0 (0.0%) |
| 5 or more Children | 0 (0.0%) | 0 (0.0%) |
| Total | 0 (0.0%) | 0 (0.0%) |
Race in Birmingham borough
The most populous races in Birmingham borough are , and White / Caucasian (63 | 100.0%).
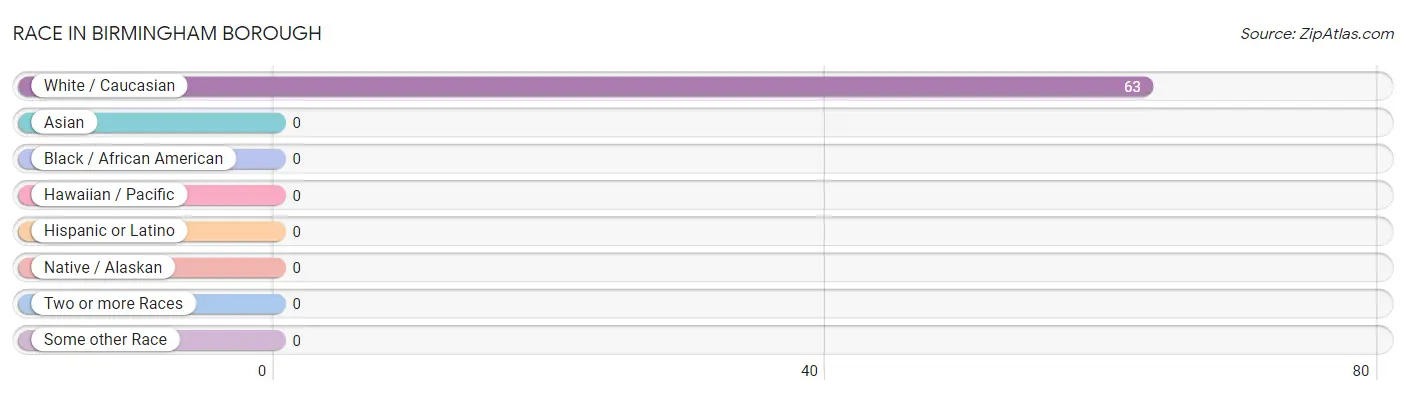
| Race | # Population | % Population |
| Asian | 0 | 0.0% |
| Black / African American | 0 | 0.0% |
| Hawaiian / Pacific | 0 | 0.0% |
| Hispanic or Latino | 0 | 0.0% |
| Native / Alaskan | 0 | 0.0% |
| White / Caucasian | 63 | 100.0% |
| Two or more Races | 0 | 0.0% |
| Some other Race | 0 | 0.0% |
| Total | 63 | 100.0% |
Ancestry in Birmingham borough
The most populous ancestries reported in Birmingham borough are German (27 | 42.9%), Irish (22 | 34.9%), English (13 | 20.6%), Italian (7 | 11.1%), and European (5 | 7.9%), together accounting for 117.5% of all Birmingham borough residents.
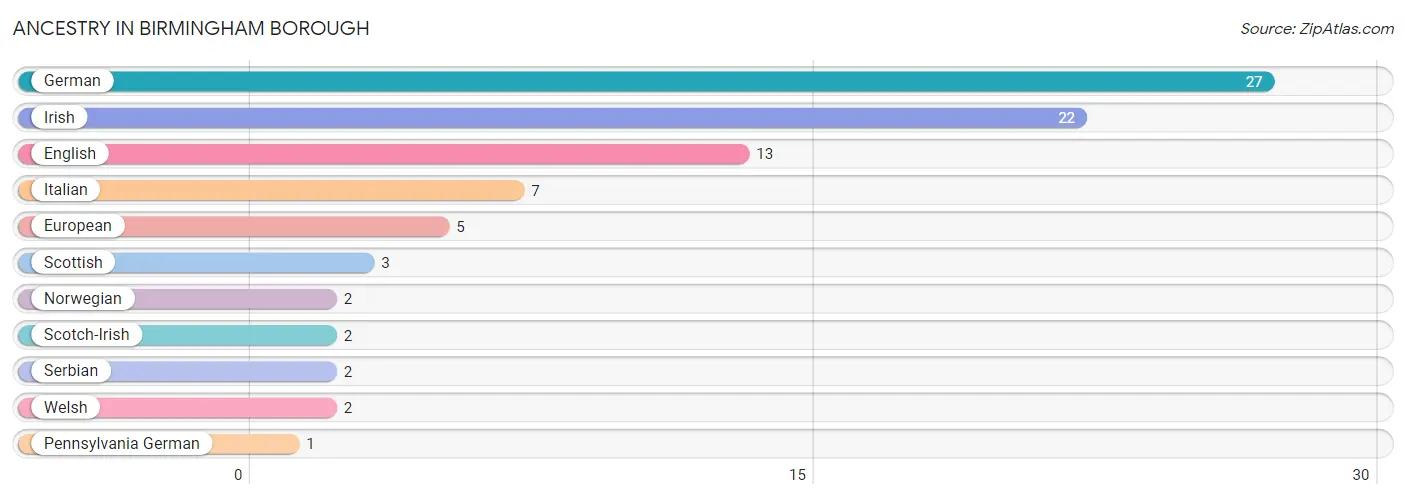
| Ancestry | # Population | % Population |
| English | 13 | 20.6% |
| European | 5 | 7.9% |
| German | 27 | 42.9% |
| Irish | 22 | 34.9% |
| Italian | 7 | 11.1% |
| Norwegian | 2 | 3.2% |
| Pennsylvania German | 1 | 1.6% |
| Scotch-Irish | 2 | 3.2% |
| Scottish | 3 | 4.8% |
| Serbian | 2 | 3.2% |
| Welsh | 2 | 3.2% | View All 11 Rows |
Immigrants in Birmingham borough

| Immigration Origin | # Population | % Population | View All 0 Rows |
Sex and Age in Birmingham borough
Sex and Age in Birmingham borough
The most populous age groups in Birmingham borough are 40 to 44 Years (8 | 20.0%) for men and 75 to 79 Years (6 | 26.1%) for women.
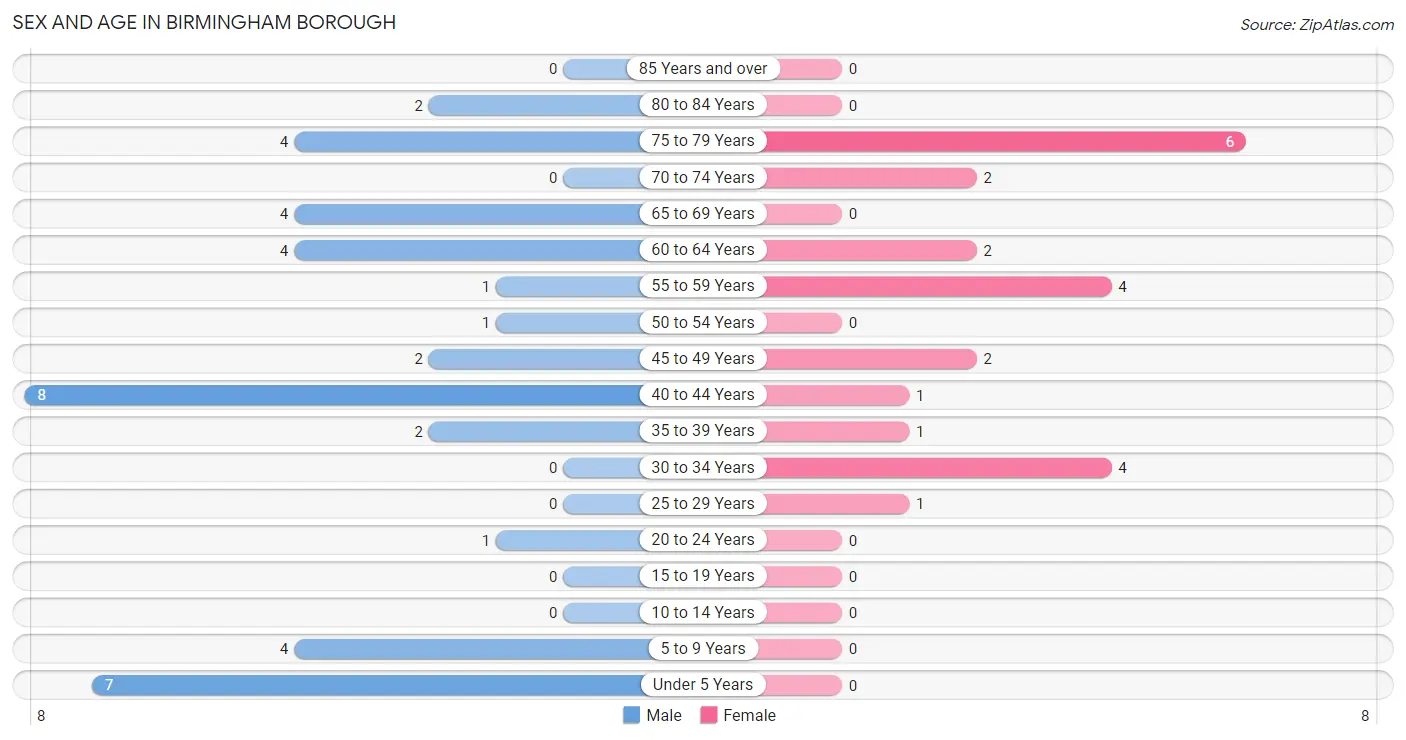
| Age Bracket | Male | Female |
| Under 5 Years | 7 (17.5%) | 0 (0.0%) |
| 5 to 9 Years | 4 (10.0%) | 0 (0.0%) |
| 10 to 14 Years | 0 (0.0%) | 0 (0.0%) |
| 15 to 19 Years | 0 (0.0%) | 0 (0.0%) |
| 20 to 24 Years | 1 (2.5%) | 0 (0.0%) |
| 25 to 29 Years | 0 (0.0%) | 1 (4.3%) |
| 30 to 34 Years | 0 (0.0%) | 4 (17.4%) |
| 35 to 39 Years | 2 (5.0%) | 1 (4.3%) |
| 40 to 44 Years | 8 (20.0%) | 1 (4.3%) |
| 45 to 49 Years | 2 (5.0%) | 2 (8.7%) |
| 50 to 54 Years | 1 (2.5%) | 0 (0.0%) |
| 55 to 59 Years | 1 (2.5%) | 4 (17.4%) |
| 60 to 64 Years | 4 (10.0%) | 2 (8.7%) |
| 65 to 69 Years | 4 (10.0%) | 0 (0.0%) |
| 70 to 74 Years | 0 (0.0%) | 2 (8.7%) |
| 75 to 79 Years | 4 (10.0%) | 6 (26.1%) |
| 80 to 84 Years | 2 (5.0%) | 0 (0.0%) |
| 85 Years and over | 0 (0.0%) | 0 (0.0%) |
| Total | 40 (100.0%) | 23 (100.0%) |
Families and Households in Birmingham borough
Median Family Size in Birmingham borough
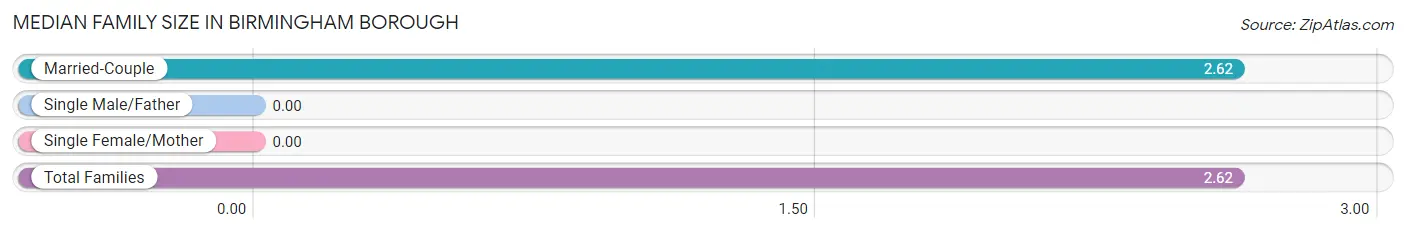
| Family Type | # Families | Family Size |
| Married-Couple | 21 (100.0%) | 2.62 |
| Single Male/Father | 0 (0.0%) | - |
| Single Female/Mother | 0 (0.0%) | - |
| Total Families | 21 (100.0%) | 2.62 |
Median Household Size in Birmingham borough
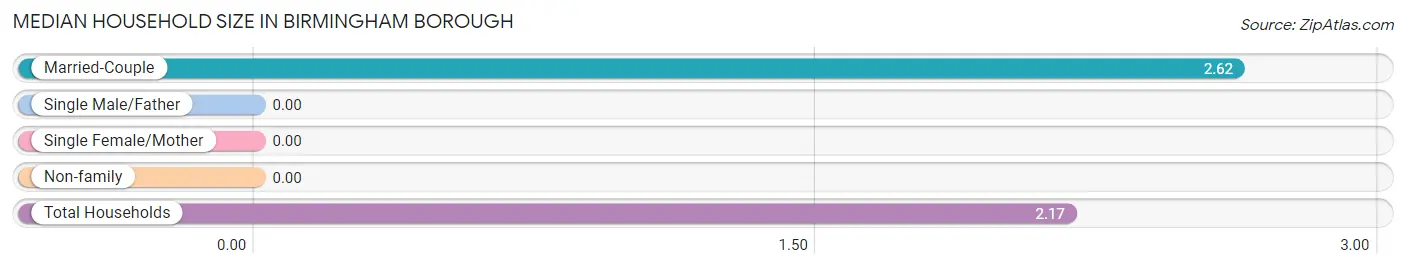
| Household Type | # Households | Household Size |
| Married-Couple | 21 (72.4%) | 2.62 |
| Single Male/Father | 0 (0.0%) | - |
| Single Female/Mother | 0 (0.0%) | - |
| Non-family | 8 (27.6%) | - |
| Total Households | 29 (100.0%) | 2.17 |
Household Size by Marriage Status in Birmingham borough
Out of a total of 29 households in Birmingham borough, 21 (72.4%) are family households, while 8 (27.6%) are nonfamily households. The most numerous type of family households are 2-person households, comprising 12, and the most common type of nonfamily households are 1-person households, comprising 8.
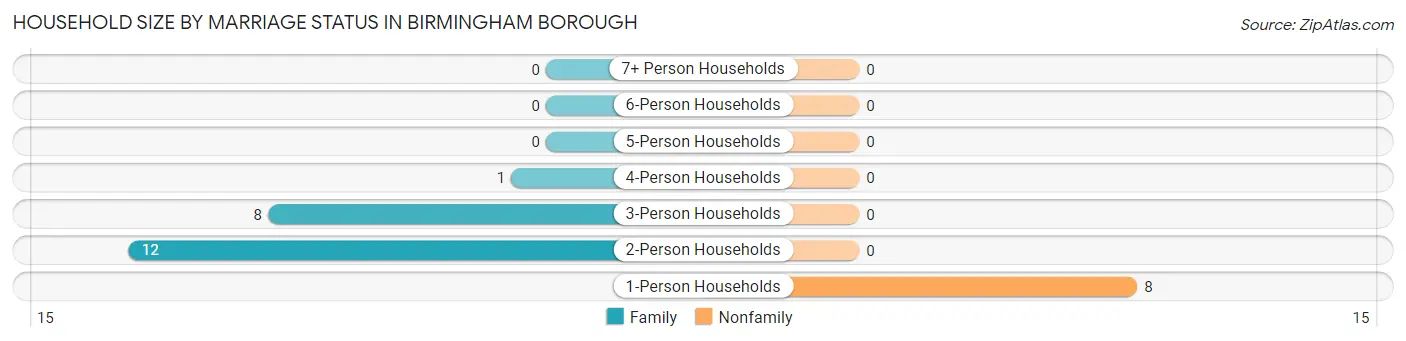
| Household Size | Family Households | Nonfamily Households |
| 1-Person Households | - | 8 (27.6%) |
| 2-Person Households | 12 (41.4%) | 0 (0.0%) |
| 3-Person Households | 8 (27.6%) | 0 (0.0%) |
| 4-Person Households | 1 (3.5%) | 0 (0.0%) |
| 5-Person Households | 0 (0.0%) | 0 (0.0%) |
| 6-Person Households | 0 (0.0%) | 0 (0.0%) |
| 7+ Person Households | 0 (0.0%) | 0 (0.0%) |
| Total | 21 (72.4%) | 8 (27.6%) |
Female Fertility in Birmingham borough
Fertility by Age in Birmingham borough
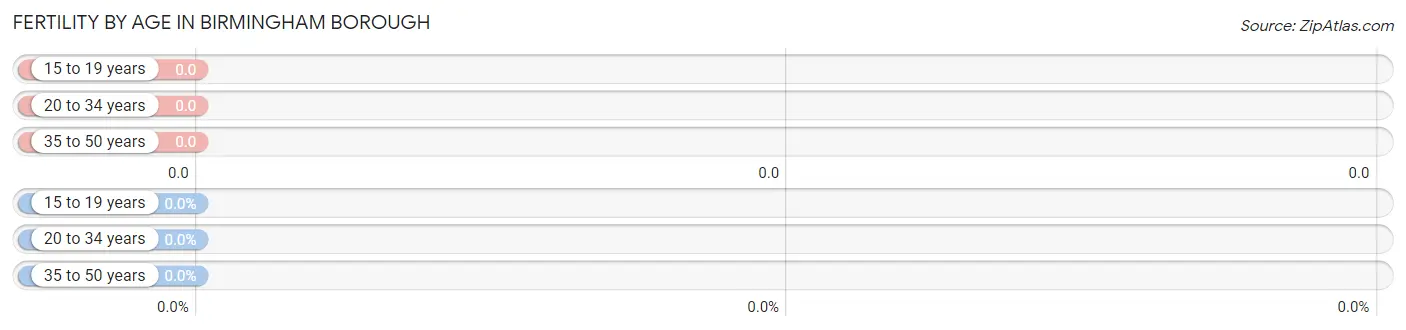
| Age Bracket | Women with Births | Births / 1,000 Women |
| 15 to 19 years | 0 (0.0%) | 0.0 |
| 20 to 34 years | 0 (0.0%) | 0.0 |
| 35 to 50 years | 0 (0.0%) | 0.0 |
| Total | 0 (0.0%) | 0.0 |
Fertility by Age by Marriage Status in Birmingham borough
| Age Bracket | Married | Unmarried |
| 15 to 19 years | 0 (0.0%) | 0 (0.0%) |
| 20 to 34 years | 0 (0.0%) | 0 (0.0%) |
| 35 to 50 years | 0 (0.0%) | 0 (0.0%) |
| Total | 0 (0.0%) | 0 (0.0%) |
Fertility by Education in Birmingham borough
| Educational Attainment | Women with Births | Births / 1,000 Women |
| Less than High School | 0 (0.0%) | 0.0 |
| High School Diploma | 0 (0.0%) | 0.0 |
| College or Associate's Degree | 0 (0.0%) | 0.0 |
| Bachelor's Degree | 0 (0.0%) | 0.0 |
| Graduate Degree | 0 (0.0%) | 0.0 |
| Total | 0 (0.0%) | 0.0 |
Fertility by Education by Marriage Status in Birmingham borough
| Educational Attainment | Married | Unmarried |
| Less than High School | 0 (0.0%) | 0 (0.0%) |
| High School Diploma | 0 (0.0%) | 0 (0.0%) |
| College or Associate's Degree | 0 (0.0%) | 0 (0.0%) |
| Bachelor's Degree | 0 (0.0%) | 0 (0.0%) |
| Graduate Degree | 0 (0.0%) | 0 (0.0%) |
| Total | 0 (0.0%) | 0 (0.0%) |
Employment Characteristics in Birmingham borough
Employment by Class of Employer in Birmingham borough
Among the 31 employed individuals in Birmingham borough, not-for-profit organizations (23 | 74.2%), private company employees (7 | 22.6%), and local government employees (1 | 3.2%) make up the most common classes of employment.
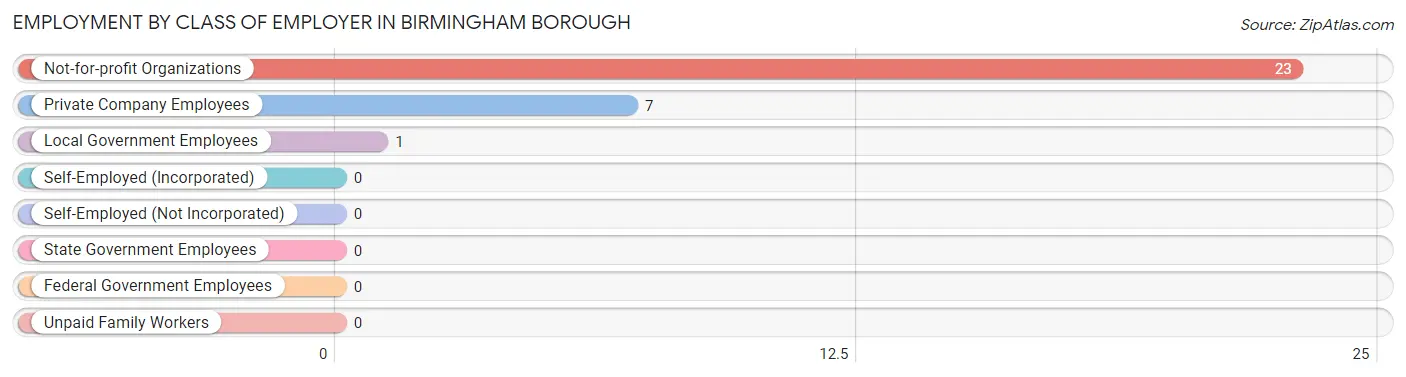
| Employer Class | # Employees | % Employees |
| Private Company Employees | 7 | 22.6% |
| Self-Employed (Incorporated) | 0 | 0.0% |
| Self-Employed (Not Incorporated) | 0 | 0.0% |
| Not-for-profit Organizations | 23 | 74.2% |
| Local Government Employees | 1 | 3.2% |
| State Government Employees | 0 | 0.0% |
| Federal Government Employees | 0 | 0.0% |
| Unpaid Family Workers | 0 | 0.0% |
| Total | 31 | 100.0% |
Employment Status by Age in Birmingham borough
According to the labor force statistics for Birmingham borough, out of the total population over 16 years of age (52), 61.5% or 32 individuals are in the labor force, with 3.1% or 1 of them unemployed. The age group with the highest labor force participation rate is 20 to 24 years, with 100.0% or 1 individuals in the labor force. Within the labor force, the 20 to 24 years age range has the highest percentage of unemployed individuals, with 100.0% or 1 of them being unemployed.
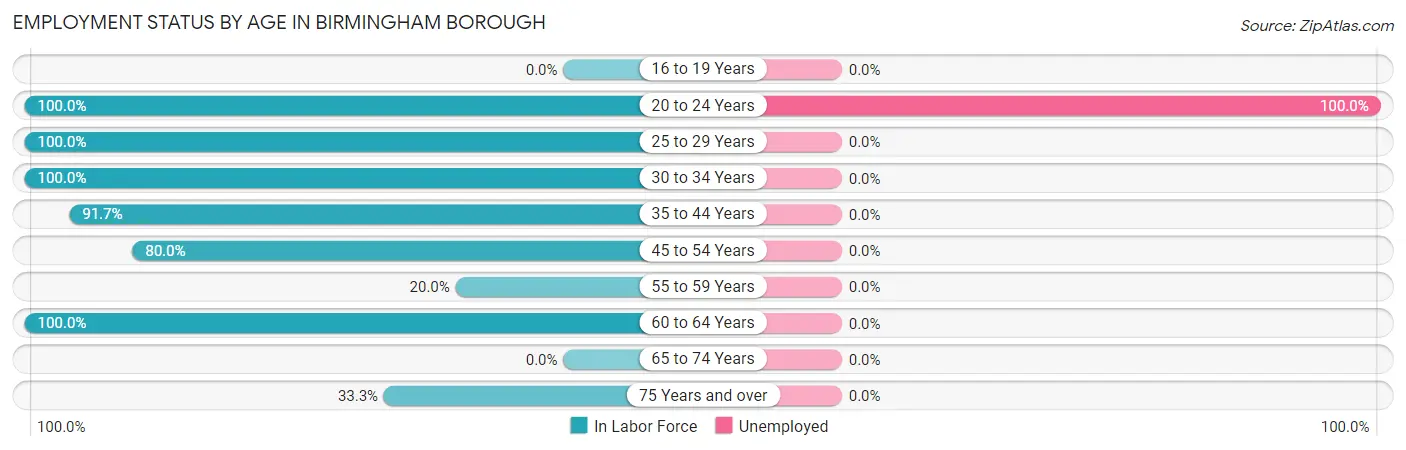
| Age Bracket | In Labor Force | Unemployed |
| 16 to 19 Years | 0 (0.0%) | 0 (0.0%) |
| 20 to 24 Years | 1 (100.0%) | 1 (100.0%) |
| 25 to 29 Years | 1 (100.0%) | 0 (0.0%) |
| 30 to 34 Years | 4 (100.0%) | 0 (0.0%) |
| 35 to 44 Years | 11 (91.7%) | 0 (0.0%) |
| 45 to 54 Years | 4 (80.0%) | 0 (0.0%) |
| 55 to 59 Years | 1 (20.0%) | 0 (0.0%) |
| 60 to 64 Years | 6 (100.0%) | 0 (0.0%) |
| 65 to 74 Years | 0 (0.0%) | 0 (0.0%) |
| 75 Years and over | 4 (33.3%) | 0 (0.0%) |
| Total | 32 (61.5%) | 1 (3.1%) |
Employment Status by Educational Attainment in Birmingham borough
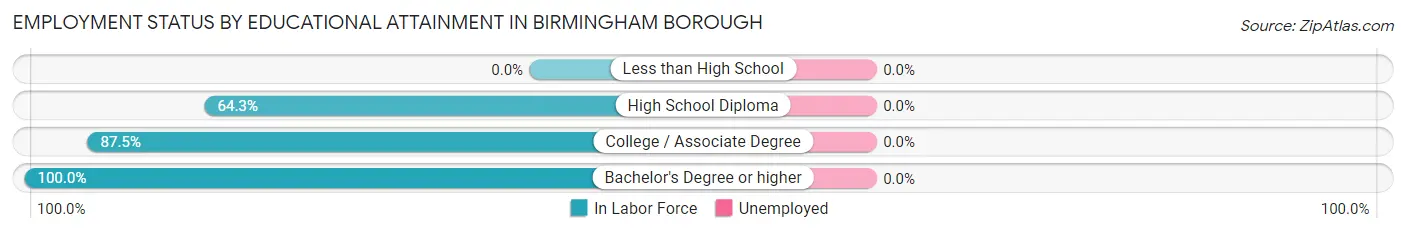
| Educational Attainment | In Labor Force | Unemployed |
| Less than High School | 0 (0.0%) | 0 (0.0%) |
| High School Diploma | 9 (64.3%) | 0 (0.0%) |
| College / Associate Degree | 7 (87.5%) | 0 (0.0%) |
| Bachelor's Degree or higher | 11 (100.0%) | 0 (0.0%) |
| Total | 27 (81.8%) | 0 (0.0%) |
Employment Occupations by Sex in Birmingham borough
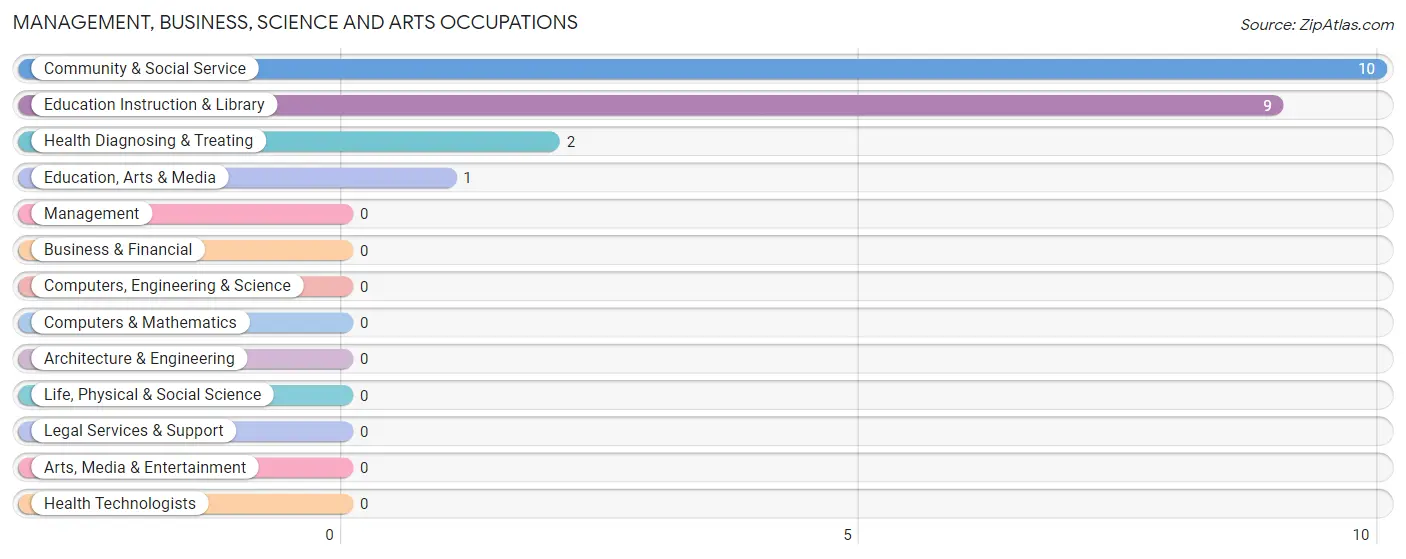
Management, Business, Science and Arts Occupations
The most common Management, Business, Science and Arts occupations in Birmingham borough are Community & Social Service (10 | 32.3%), Education Instruction & Library (9 | 29.0%), Health Diagnosing & Treating (2 | 6.5%), and Education, Arts & Media (1 | 3.2%).
Management, Business, Science and Arts Occupations by Sex
Within the Management, Business, Science and Arts occupations in Birmingham borough, the most male-oriented occupations are Health Diagnosing & Treating (100.0%), Education Instruction & Library (11.1%), and Community & Social Service (10.0%), while the most female-oriented occupations are Education, Arts & Media (100.0%), Community & Social Service (90.0%), and Education Instruction & Library (88.9%).
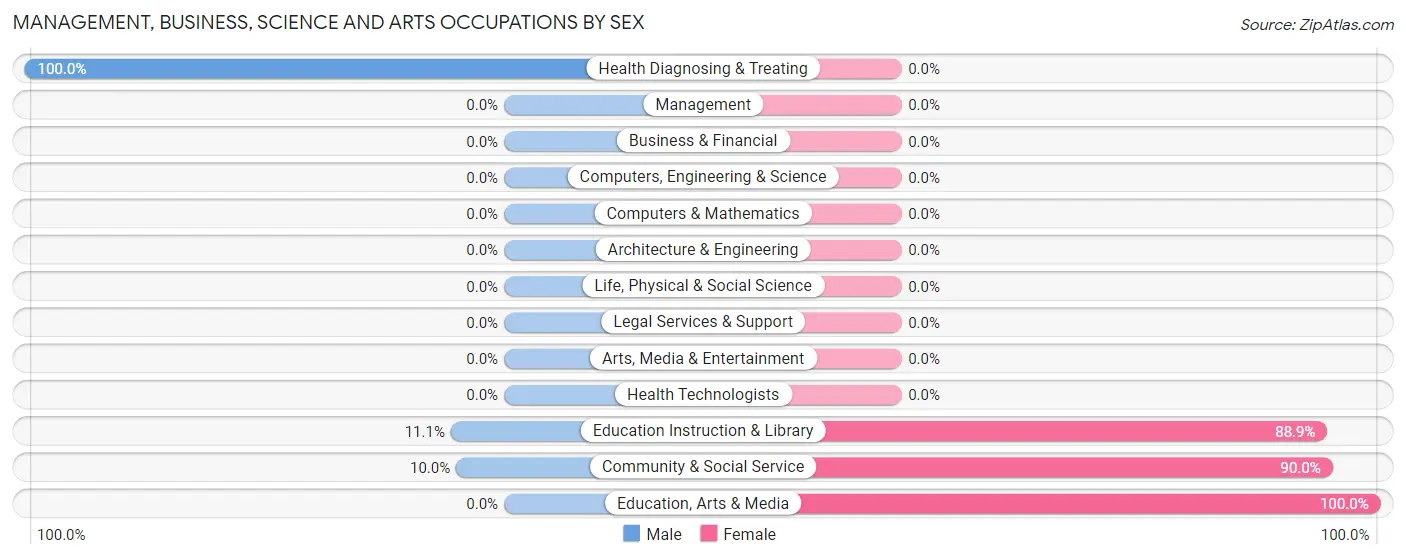
| Occupation | Male | Female |
| Management | 0 (0.0%) | 0 (0.0%) |
| Business & Financial | 0 (0.0%) | 0 (0.0%) |
| Computers, Engineering & Science | 0 (0.0%) | 0 (0.0%) |
| Computers & Mathematics | 0 (0.0%) | 0 (0.0%) |
| Architecture & Engineering | 0 (0.0%) | 0 (0.0%) |
| Life, Physical & Social Science | 0 (0.0%) | 0 (0.0%) |
| Community & Social Service | 1 (10.0%) | 9 (90.0%) |
| Education, Arts & Media | 0 (0.0%) | 1 (100.0%) |
| Legal Services & Support | 0 (0.0%) | 0 (0.0%) |
| Education Instruction & Library | 1 (11.1%) | 8 (88.9%) |
| Arts, Media & Entertainment | 0 (0.0%) | 0 (0.0%) |
| Health Diagnosing & Treating | 2 (100.0%) | 0 (0.0%) |
| Health Technologists | 0 (0.0%) | 0 (0.0%) |
| Total (Category) | 3 (25.0%) | 9 (75.0%) |
| Total (Overall) | 17 (54.8%) | 14 (45.2%) |
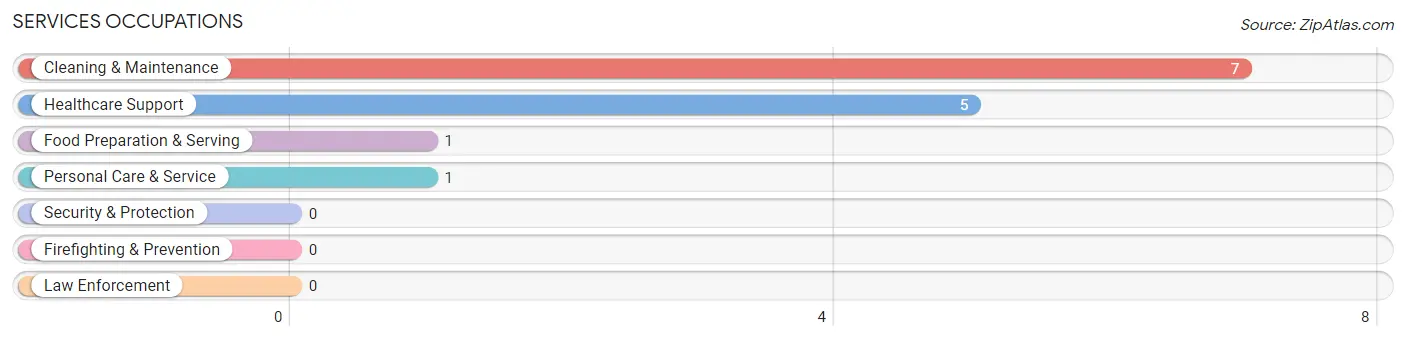
Services Occupations
The most common Services occupations in Birmingham borough are Cleaning & Maintenance (7 | 22.6%), Healthcare Support (5 | 16.1%), Food Preparation & Serving (1 | 3.2%), and Personal Care & Service (1 | 3.2%).
Services Occupations by Sex
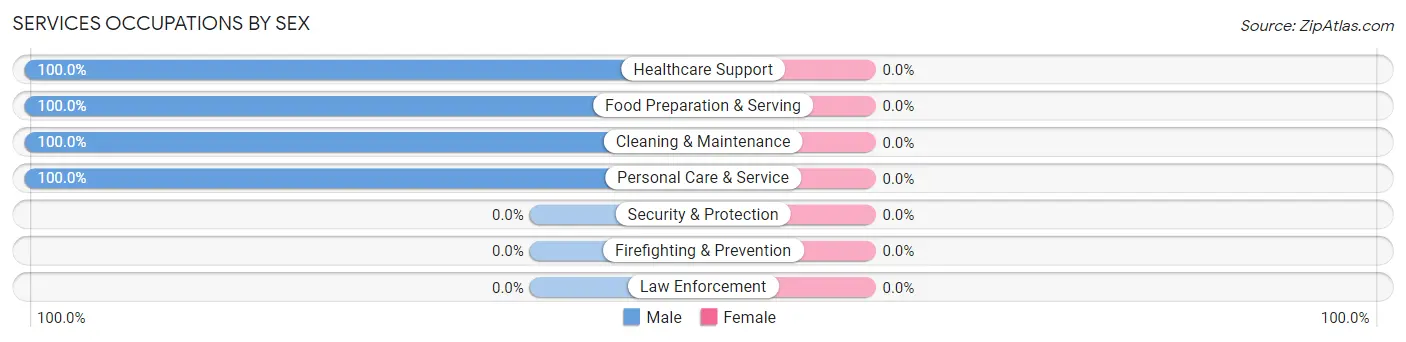
| Occupation | Male | Female |
| Healthcare Support | 5 (100.0%) | 0 (0.0%) |
| Security & Protection | 0 (0.0%) | 0 (0.0%) |
| Firefighting & Prevention | 0 (0.0%) | 0 (0.0%) |
| Law Enforcement | 0 (0.0%) | 0 (0.0%) |
| Food Preparation & Serving | 1 (100.0%) | 0 (0.0%) |
| Cleaning & Maintenance | 7 (100.0%) | 0 (0.0%) |
| Personal Care & Service | 1 (100.0%) | 0 (0.0%) |
| Total (Category) | 14 (100.0%) | 0 (0.0%) |
| Total (Overall) | 17 (54.8%) | 14 (45.2%) |
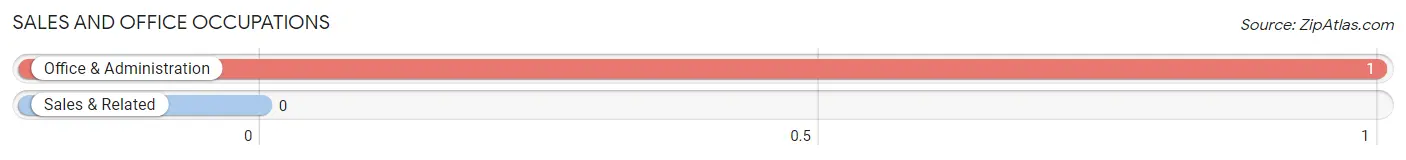
Sales and Office Occupations
The most common Sales and Office occupations in Birmingham borough are , and Office & Administration (1 | 3.2%).
Sales and Office Occupations by Sex
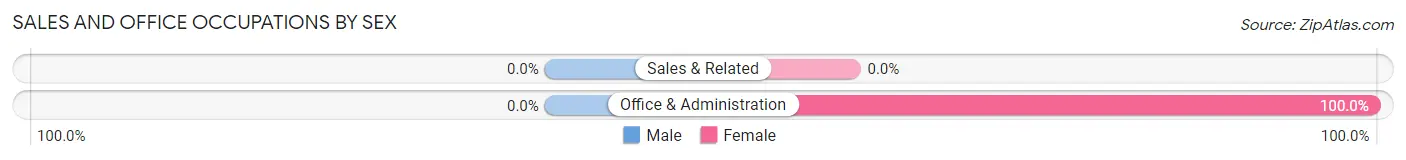
| Occupation | Male | Female |
| Sales & Related | 0 (0.0%) | 0 (0.0%) |
| Office & Administration | 0 (0.0%) | 1 (100.0%) |
| Total (Category) | 0 (0.0%) | 1 (100.0%) |
| Total (Overall) | 17 (54.8%) | 14 (45.2%) |
Natural Resources, Construction and Maintenance Occupations
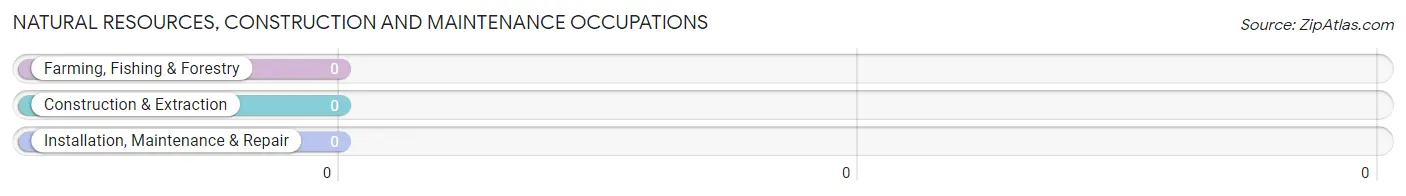
Natural Resources, Construction and Maintenance Occupations by Sex
| Occupation | Male | Female |
| Farming, Fishing & Forestry | 0 (0.0%) | 0 (0.0%) |
| Construction & Extraction | 0 (0.0%) | 0 (0.0%) |
| Installation, Maintenance & Repair | 0 (0.0%) | 0 (0.0%) |
| Total (Category) | 0 (0.0%) | 0 (0.0%) |
| Total (Overall) | 17 (54.8%) | 14 (45.2%) |
Production, Transportation and Moving Occupations
The most common Production, Transportation and Moving occupations in Birmingham borough are , and Production (4 | 12.9%).
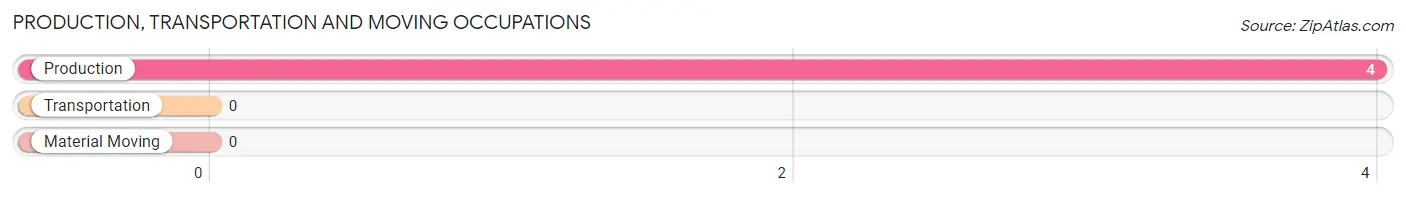
Production, Transportation and Moving Occupations by Sex
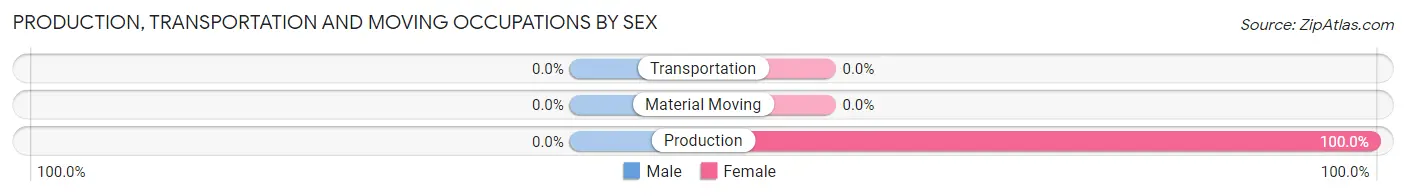
| Occupation | Male | Female |
| Production | 0 (0.0%) | 4 (100.0%) |
| Transportation | 0 (0.0%) | 0 (0.0%) |
| Material Moving | 0 (0.0%) | 0 (0.0%) |
| Total (Category) | 0 (0.0%) | 4 (100.0%) |
| Total (Overall) | 17 (54.8%) | 14 (45.2%) |
Employment Industries by Sex in Birmingham borough
Employment Industries in Birmingham borough
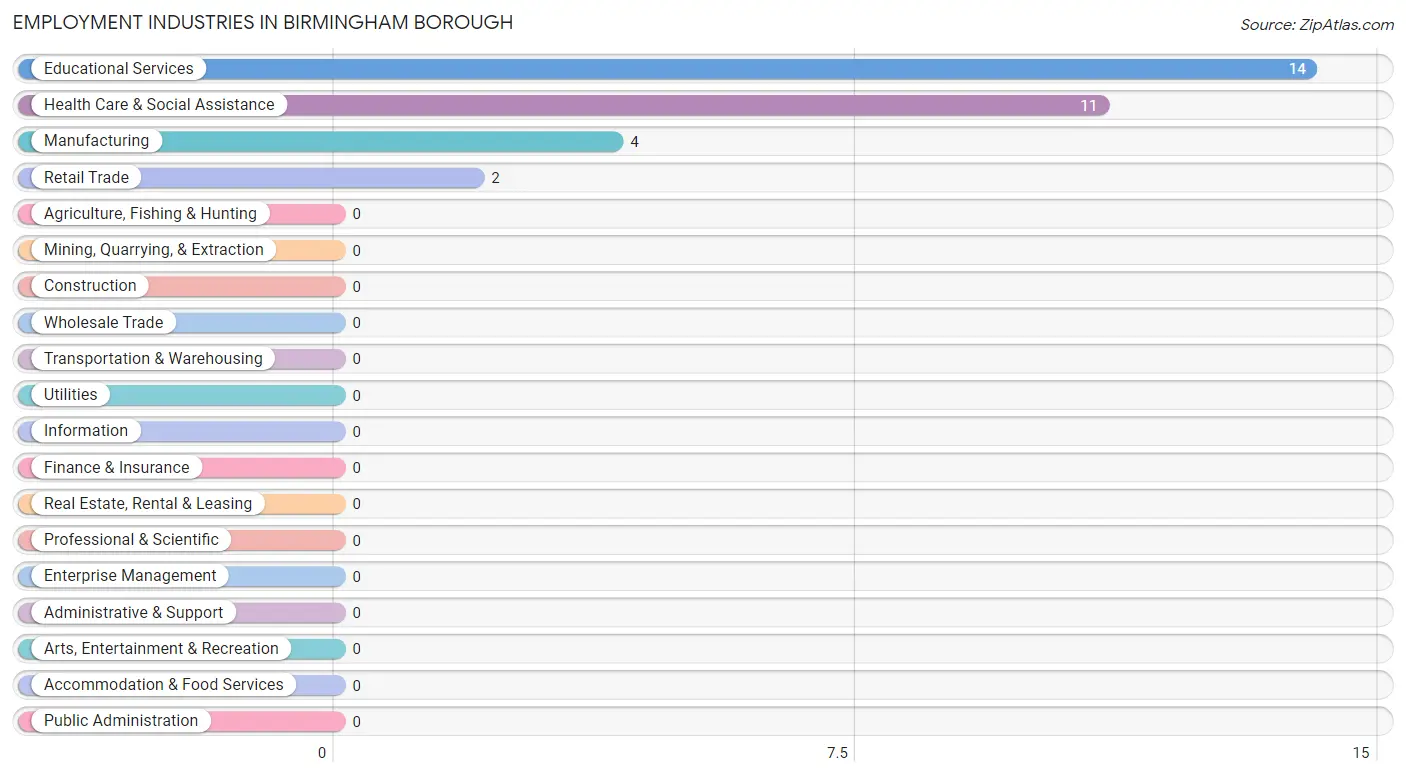
The major employment industries in Birmingham borough include Educational Services (14 | 45.2%), Health Care & Social Assistance (11 | 35.5%), Manufacturing (4 | 12.9%), and Retail Trade (2 | 6.5%).
Employment Industries by Sex in Birmingham borough
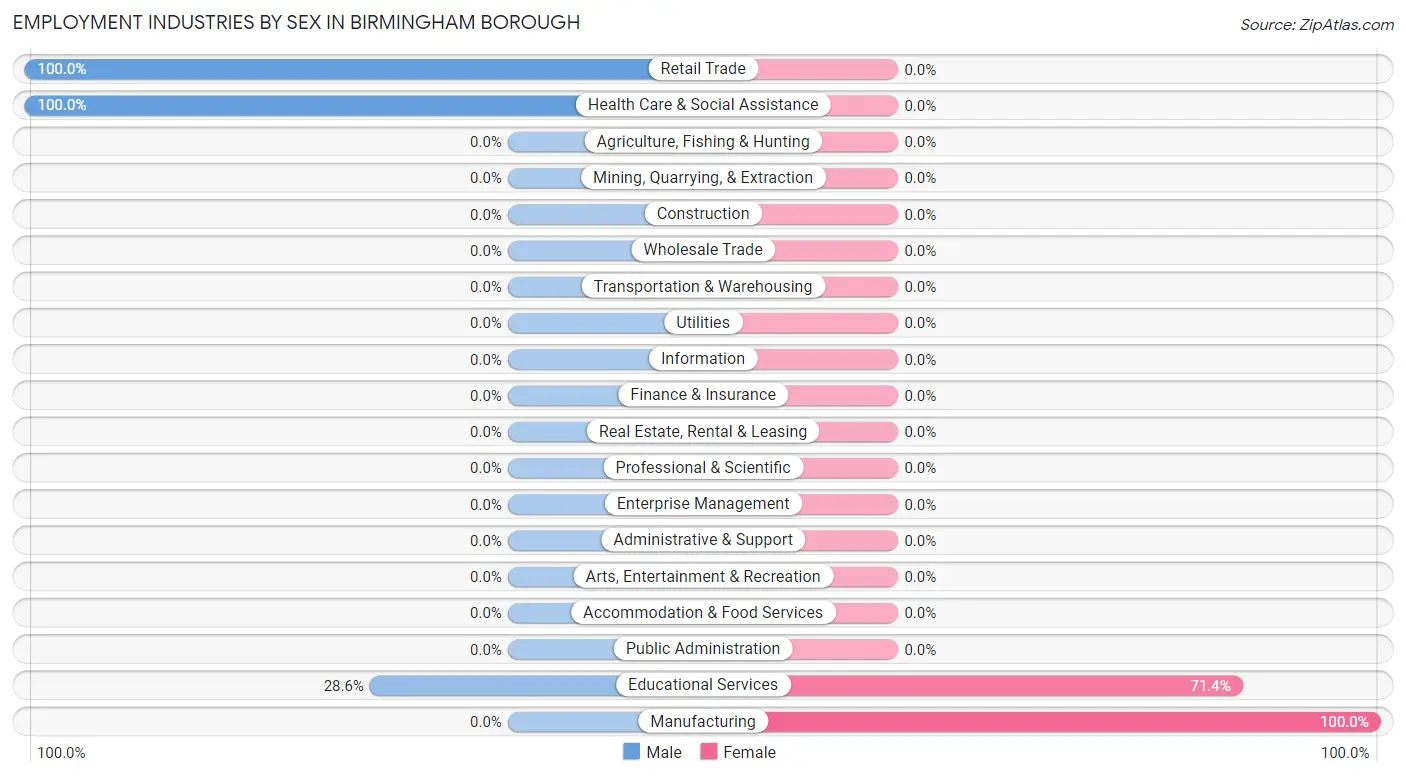
The Birmingham borough industries that see more men than women are Retail Trade (100.0%), Health Care & Social Assistance (100.0%), and Educational Services (28.6%), whereas the industries that tend to have a higher number of women are Manufacturing (100.0%), and Educational Services (71.4%).
| Industry | Male | Female |
| Agriculture, Fishing & Hunting | 0 (0.0%) | 0 (0.0%) |
| Mining, Quarrying, & Extraction | 0 (0.0%) | 0 (0.0%) |
| Construction | 0 (0.0%) | 0 (0.0%) |
| Manufacturing | 0 (0.0%) | 4 (100.0%) |
| Wholesale Trade | 0 (0.0%) | 0 (0.0%) |
| Retail Trade | 2 (100.0%) | 0 (0.0%) |
| Transportation & Warehousing | 0 (0.0%) | 0 (0.0%) |
| Utilities | 0 (0.0%) | 0 (0.0%) |
| Information | 0 (0.0%) | 0 (0.0%) |
| Finance & Insurance | 0 (0.0%) | 0 (0.0%) |
| Real Estate, Rental & Leasing | 0 (0.0%) | 0 (0.0%) |
| Professional & Scientific | 0 (0.0%) | 0 (0.0%) |
| Enterprise Management | 0 (0.0%) | 0 (0.0%) |
| Administrative & Support | 0 (0.0%) | 0 (0.0%) |
| Educational Services | 4 (28.6%) | 10 (71.4%) |
| Health Care & Social Assistance | 11 (100.0%) | 0 (0.0%) |
| Arts, Entertainment & Recreation | 0 (0.0%) | 0 (0.0%) |
| Accommodation & Food Services | 0 (0.0%) | 0 (0.0%) |
| Public Administration | 0 (0.0%) | 0 (0.0%) |
| Total | 17 (54.8%) | 14 (45.2%) |
Education in Birmingham borough
School Enrollment in Birmingham borough
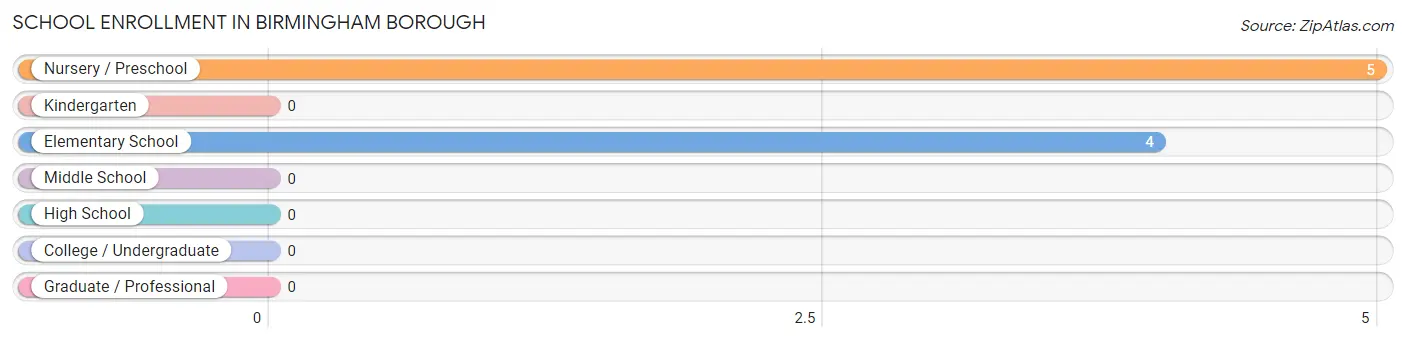
The most common levels of schooling among the 9 students in Birmingham borough are nursery / preschool (5 | 55.6%), and elementary school (4 | 44.4%).
| School Level | # Students | % Students |
| Nursery / Preschool | 5 | 55.6% |
| Kindergarten | 0 | 0.0% |
| Elementary School | 4 | 44.4% |
| Middle School | 0 | 0.0% |
| High School | 0 | 0.0% |
| College / Undergraduate | 0 | 0.0% |
| Graduate / Professional | 0 | 0.0% |
| Total | 9 | 100.0% |
School Enrollment by Age by Funding Source in Birmingham borough
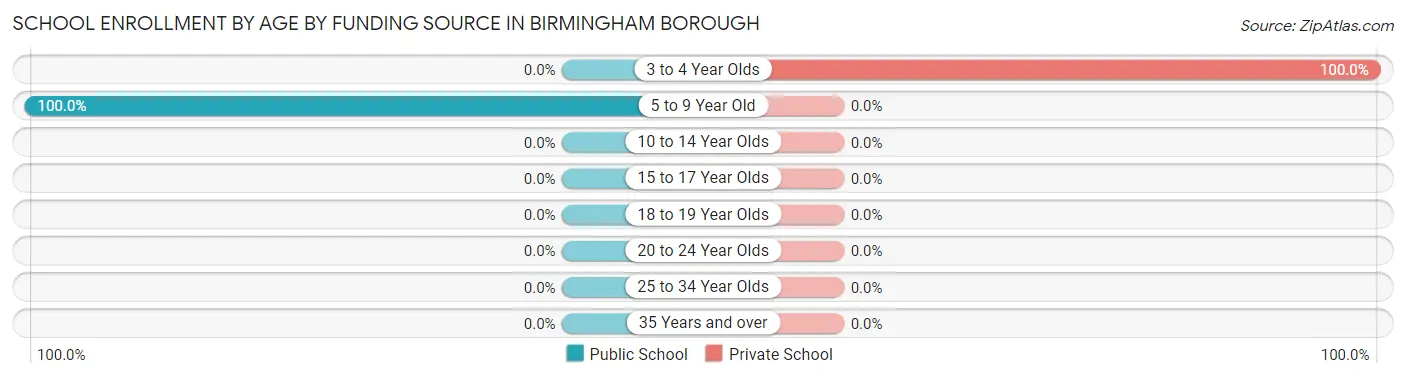
Out of a total of 9 students who are enrolled in schools in Birmingham borough, 5 (55.6%) attend a private institution, while the remaining 4 (44.4%) are enrolled in public schools. The age group of 3 to 4 year olds has the highest likelihood of being enrolled in private schools, with 5 (100.0% in the age bracket) enrolled. Conversely, the age group of 5 to 9 year old has the lowest likelihood of being enrolled in a private school, with 4 (100.0% in the age bracket) attending a public institution.
| Age Bracket | Public School | Private School |
| 3 to 4 Year Olds | 0 (0.0%) | 5 (100.0%) |
| 5 to 9 Year Old | 4 (100.0%) | 0 (0.0%) |
| 10 to 14 Year Olds | 0 (0.0%) | 0 (0.0%) |
| 15 to 17 Year Olds | 0 (0.0%) | 0 (0.0%) |
| 18 to 19 Year Olds | 0 (0.0%) | 0 (0.0%) |
| 20 to 24 Year Olds | 0 (0.0%) | 0 (0.0%) |
| 25 to 34 Year Olds | 0 (0.0%) | 0 (0.0%) |
| 35 Years and over | 0 (0.0%) | 0 (0.0%) |
| Total | 4 (44.4%) | 5 (55.6%) |
Educational Attainment by Field of Study in Birmingham borough
Education (6 | 27.3%), science & technology (5 | 22.7%), bio, nature & agricultural (3 | 13.6%), business (2 | 9.1%), and liberal arts & history (2 | 9.1%) are the most common fields of study among 22 individuals in Birmingham borough who have obtained a bachelor's degree or higher.
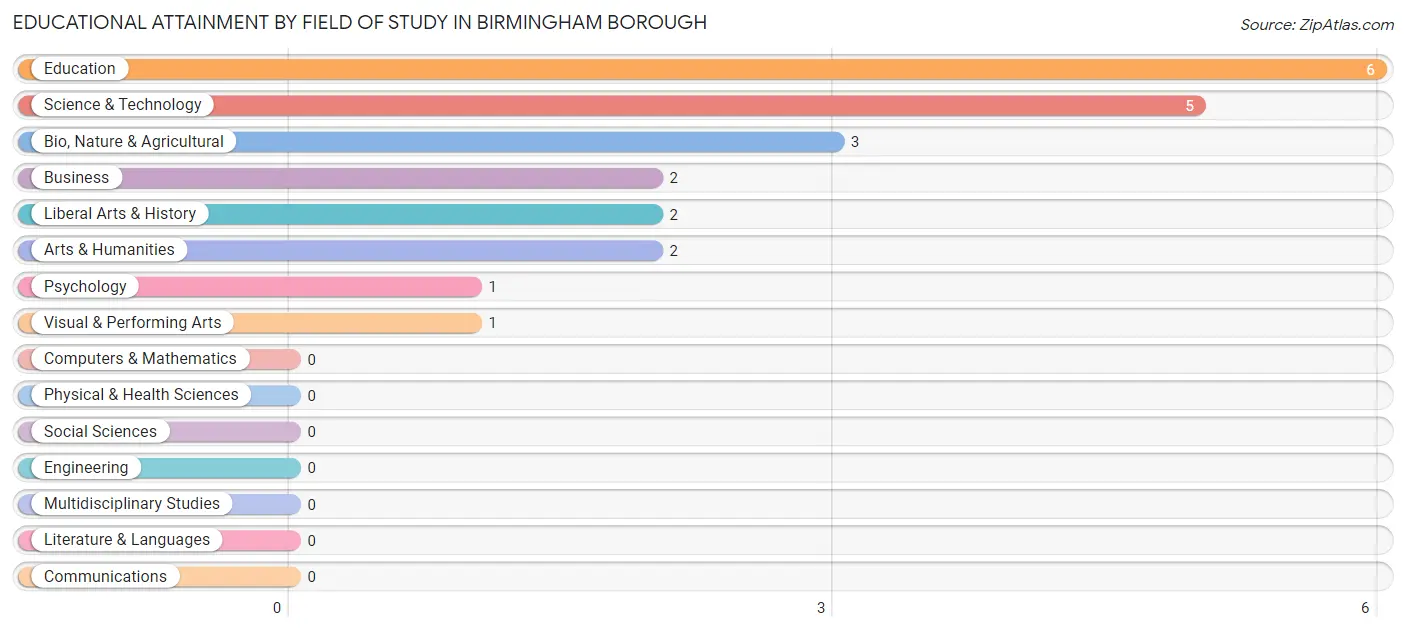
| Field of Study | # Graduates | % Graduates |
| Computers & Mathematics | 0 | 0.0% |
| Bio, Nature & Agricultural | 3 | 13.6% |
| Physical & Health Sciences | 0 | 0.0% |
| Psychology | 1 | 4.5% |
| Social Sciences | 0 | 0.0% |
| Engineering | 0 | 0.0% |
| Multidisciplinary Studies | 0 | 0.0% |
| Science & Technology | 5 | 22.7% |
| Business | 2 | 9.1% |
| Education | 6 | 27.3% |
| Literature & Languages | 0 | 0.0% |
| Liberal Arts & History | 2 | 9.1% |
| Visual & Performing Arts | 1 | 4.5% |
| Communications | 0 | 0.0% |
| Arts & Humanities | 2 | 9.1% |
| Total | 22 | 100.0% |
Transportation & Commute in Birmingham borough
Vehicle Availability by Sex in Birmingham borough
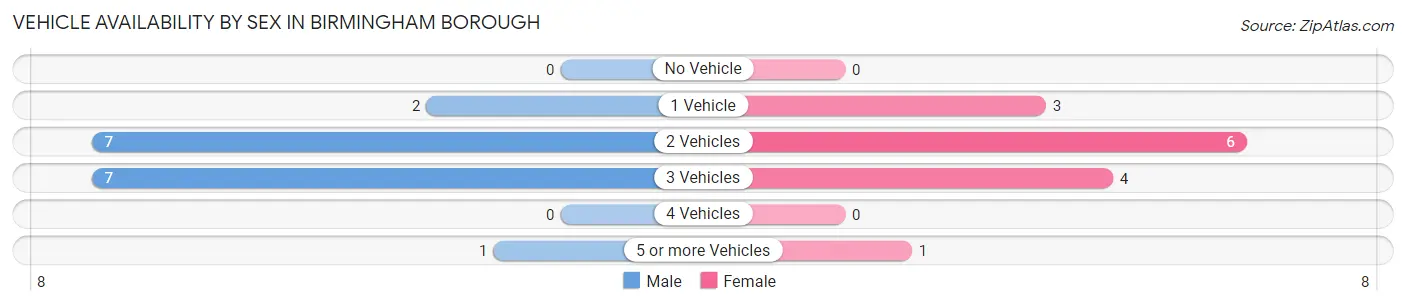
The most prevalent vehicle ownership categories in Birmingham borough are males with 2 vehicles (7, accounting for 41.2%) and females with 2 vehicles (6, making up 50.0%).
| Vehicles Available | Male | Female |
| No Vehicle | 0 (0.0%) | 0 (0.0%) |
| 1 Vehicle | 2 (11.8%) | 3 (21.4%) |
| 2 Vehicles | 7 (41.2%) | 6 (42.9%) |
| 3 Vehicles | 7 (41.2%) | 4 (28.6%) |
| 4 Vehicles | 0 (0.0%) | 0 (0.0%) |
| 5 or more Vehicles | 1 (5.9%) | 1 (7.1%) |
| Total | 17 (100.0%) | 14 (100.0%) |
Commute Time in Birmingham borough
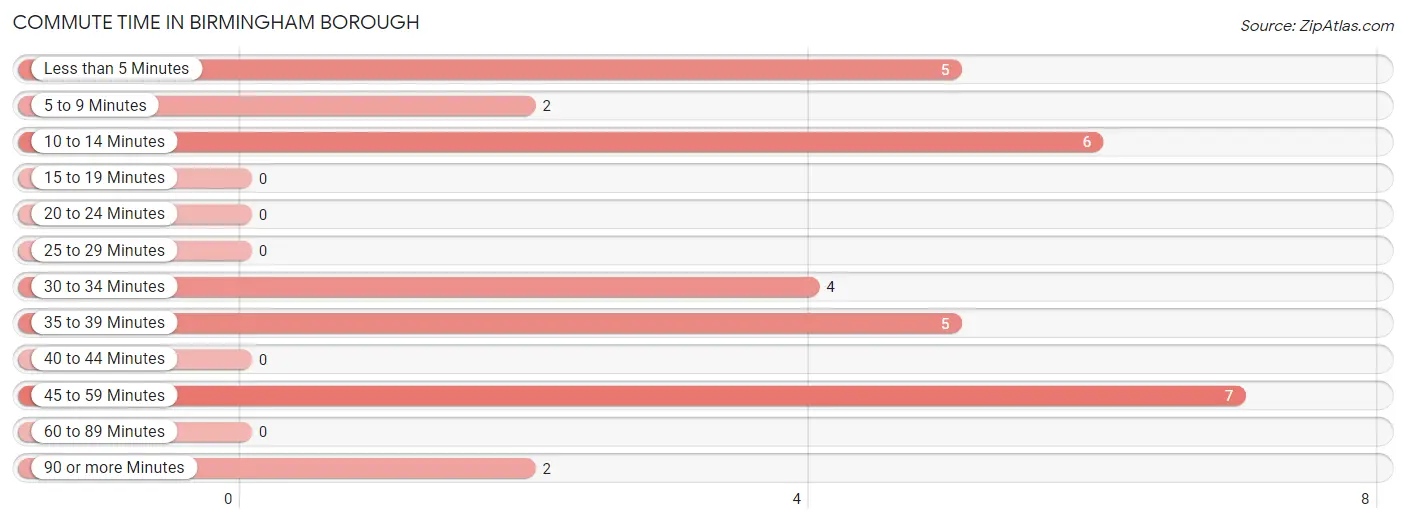
The most frequently occuring commute durations in Birmingham borough are 45 to 59 minutes (7 commuters, 22.6%), 10 to 14 minutes (6 commuters, 19.4%), and less than 5 minutes (5 commuters, 16.1%).
| Commute Time | # Commuters | % Commuters |
| Less than 5 Minutes | 5 | 16.1% |
| 5 to 9 Minutes | 2 | 6.5% |
| 10 to 14 Minutes | 6 | 19.4% |
| 15 to 19 Minutes | 0 | 0.0% |
| 20 to 24 Minutes | 0 | 0.0% |
| 25 to 29 Minutes | 0 | 0.0% |
| 30 to 34 Minutes | 4 | 12.9% |
| 35 to 39 Minutes | 5 | 16.1% |
| 40 to 44 Minutes | 0 | 0.0% |
| 45 to 59 Minutes | 7 | 22.6% |
| 60 to 89 Minutes | 0 | 0.0% |
| 90 or more Minutes | 2 | 6.5% |
Commute Time by Sex in Birmingham borough
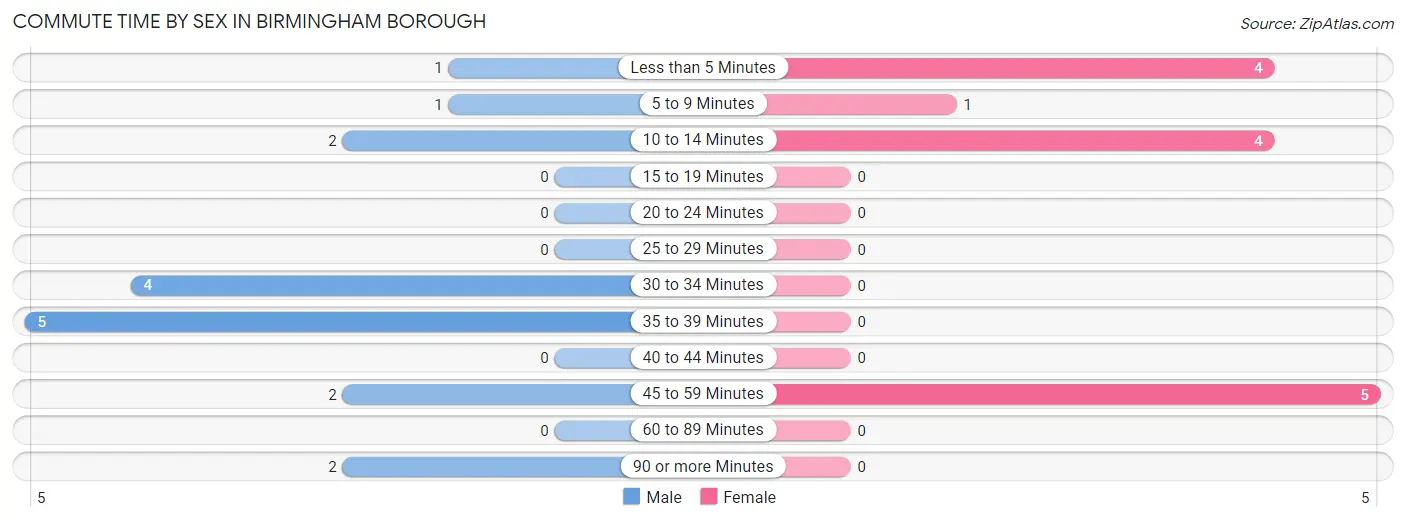
The most common commute times in Birmingham borough are 35 to 39 minutes (5 commuters, 29.4%) for males and 45 to 59 minutes (5 commuters, 35.7%) for females.
| Commute Time | Male | Female |
| Less than 5 Minutes | 1 (5.9%) | 4 (28.6%) |
| 5 to 9 Minutes | 1 (5.9%) | 1 (7.1%) |
| 10 to 14 Minutes | 2 (11.8%) | 4 (28.6%) |
| 15 to 19 Minutes | 0 (0.0%) | 0 (0.0%) |
| 20 to 24 Minutes | 0 (0.0%) | 0 (0.0%) |
| 25 to 29 Minutes | 0 (0.0%) | 0 (0.0%) |
| 30 to 34 Minutes | 4 (23.5%) | 0 (0.0%) |
| 35 to 39 Minutes | 5 (29.4%) | 0 (0.0%) |
| 40 to 44 Minutes | 0 (0.0%) | 0 (0.0%) |
| 45 to 59 Minutes | 2 (11.8%) | 5 (35.7%) |
| 60 to 89 Minutes | 0 (0.0%) | 0 (0.0%) |
| 90 or more Minutes | 2 (11.8%) | 0 (0.0%) |
Time of Departure to Work by Sex in Birmingham borough
The most frequent times of departure to work in Birmingham borough are 6:00 AM to 6:29 AM (6, 35.3%) for males and 7:00 AM to 7:29 AM (5, 35.7%) for females.
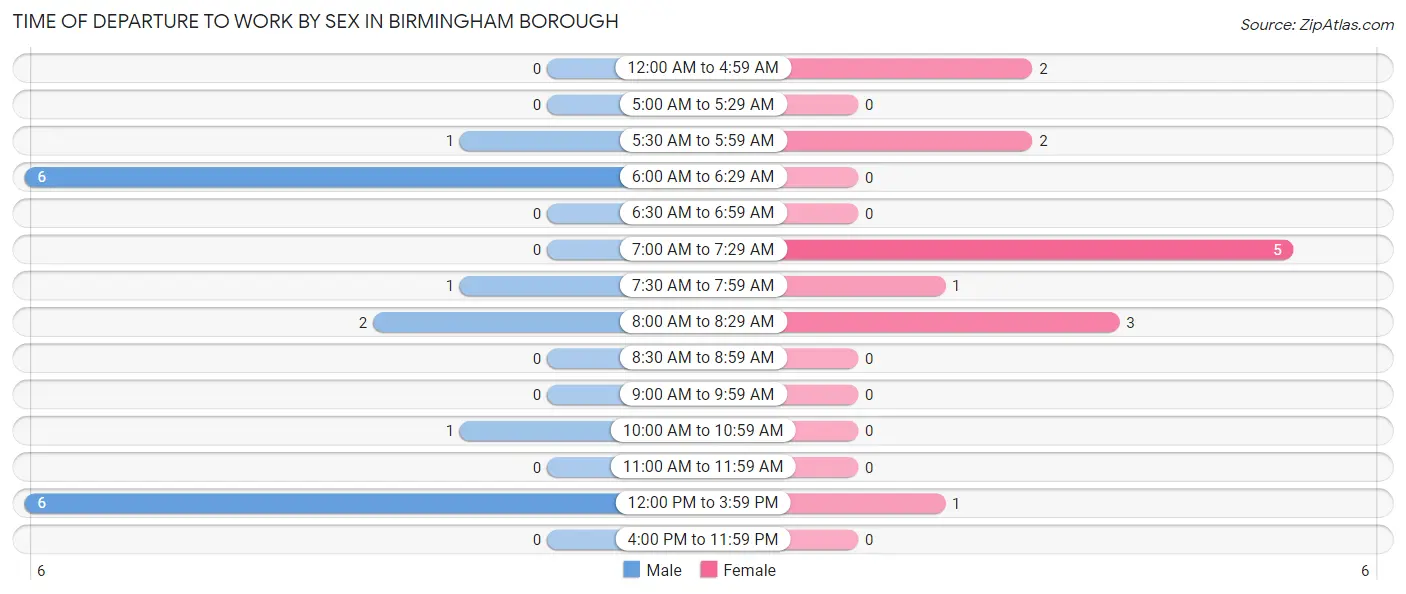
| Time of Departure | Male | Female |
| 12:00 AM to 4:59 AM | 0 (0.0%) | 2 (14.3%) |
| 5:00 AM to 5:29 AM | 0 (0.0%) | 0 (0.0%) |
| 5:30 AM to 5:59 AM | 1 (5.9%) | 2 (14.3%) |
| 6:00 AM to 6:29 AM | 6 (35.3%) | 0 (0.0%) |
| 6:30 AM to 6:59 AM | 0 (0.0%) | 0 (0.0%) |
| 7:00 AM to 7:29 AM | 0 (0.0%) | 5 (35.7%) |
| 7:30 AM to 7:59 AM | 1 (5.9%) | 1 (7.1%) |
| 8:00 AM to 8:29 AM | 2 (11.8%) | 3 (21.4%) |
| 8:30 AM to 8:59 AM | 0 (0.0%) | 0 (0.0%) |
| 9:00 AM to 9:59 AM | 0 (0.0%) | 0 (0.0%) |
| 10:00 AM to 10:59 AM | 1 (5.9%) | 0 (0.0%) |
| 11:00 AM to 11:59 AM | 0 (0.0%) | 0 (0.0%) |
| 12:00 PM to 3:59 PM | 6 (35.3%) | 1 (7.1%) |
| 4:00 PM to 11:59 PM | 0 (0.0%) | 0 (0.0%) |
| Total | 17 (100.0%) | 14 (100.0%) |
Housing Occupancy in Birmingham borough
Occupancy by Ownership in Birmingham borough
Of the total 29 dwellings in Birmingham borough, owner-occupied units account for 17 (58.6%), while renter-occupied units make up 12 (41.4%).
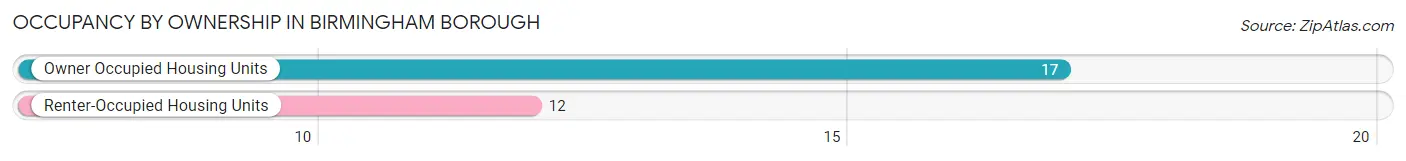
| Occupancy | # Housing Units | % Housing Units |
| Owner Occupied Housing Units | 17 | 58.6% |
| Renter-Occupied Housing Units | 12 | 41.4% |
| Total Occupied Housing Units | 29 | 100.0% |
Occupancy by Household Size in Birmingham borough
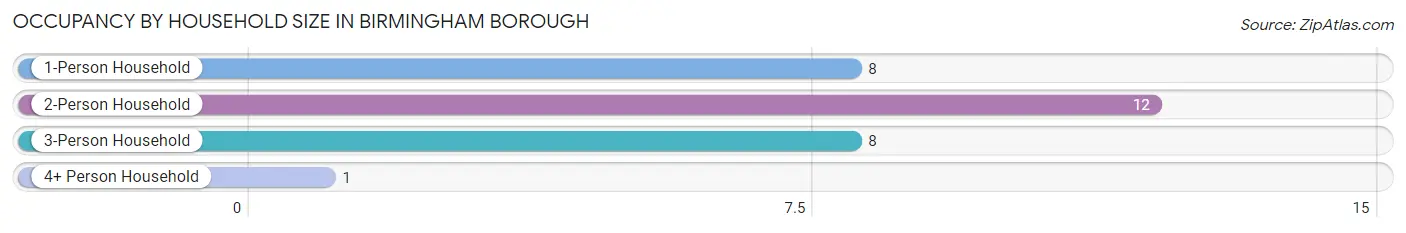
| Household Size | # Housing Units | % Housing Units |
| 1-Person Household | 8 | 27.6% |
| 2-Person Household | 12 | 41.4% |
| 3-Person Household | 8 | 27.6% |
| 4+ Person Household | 1 | 3.5% |
| Total Housing Units | 29 | 100.0% |
Occupancy by Ownership by Household Size in Birmingham borough
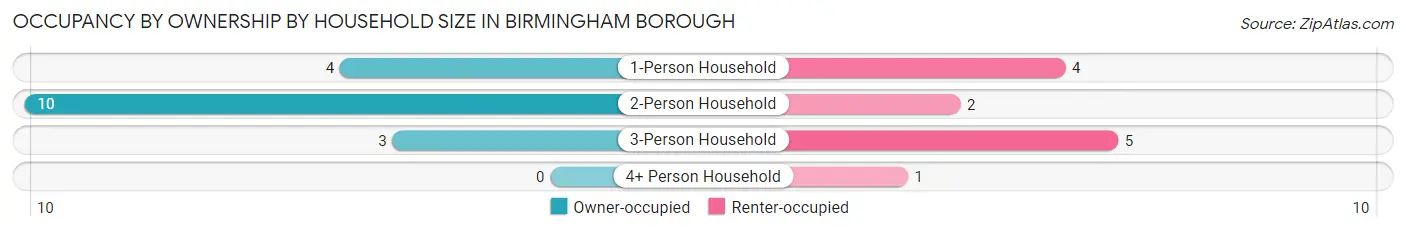
| Household Size | Owner-occupied | Renter-occupied |
| 1-Person Household | 4 (50.0%) | 4 (50.0%) |
| 2-Person Household | 10 (83.3%) | 2 (16.7%) |
| 3-Person Household | 3 (37.5%) | 5 (62.5%) |
| 4+ Person Household | 0 (0.0%) | 1 (100.0%) |
| Total Housing Units | 17 (58.6%) | 12 (41.4%) |
Occupancy by Educational Attainment in Birmingham borough
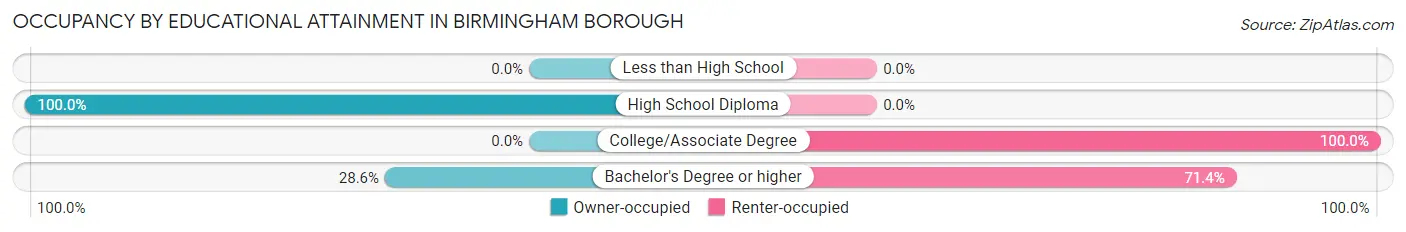
| Household Size | Owner-occupied | Renter-occupied |
| Less than High School | 0 (0.0%) | 0 (0.0%) |
| High School Diploma | 13 (100.0%) | 0 (0.0%) |
| College/Associate Degree | 0 (0.0%) | 2 (100.0%) |
| Bachelor's Degree or higher | 4 (28.6%) | 10 (71.4%) |
Occupancy by Age of Householder in Birmingham borough
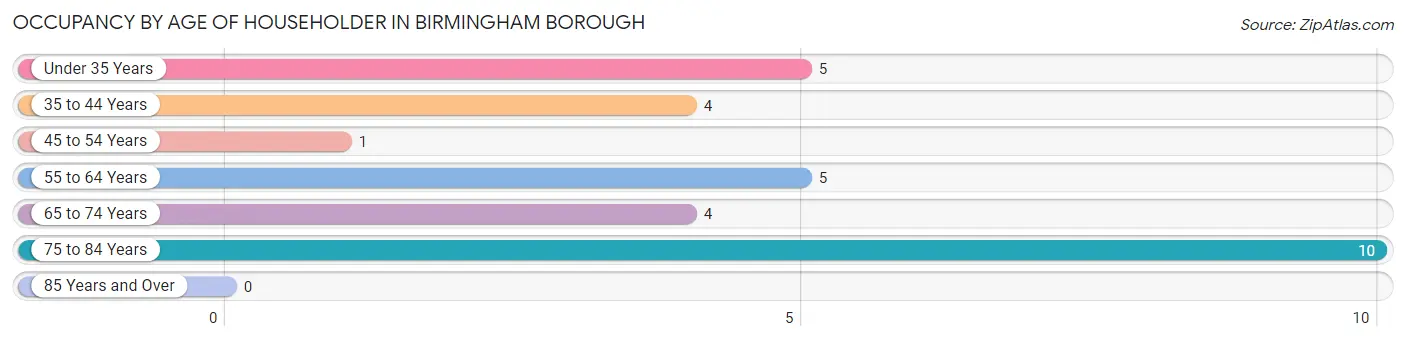
| Age Bracket | # Households | % Households |
| Under 35 Years | 5 | 17.2% |
| 35 to 44 Years | 4 | 13.8% |
| 45 to 54 Years | 1 | 3.5% |
| 55 to 64 Years | 5 | 17.2% |
| 65 to 74 Years | 4 | 13.8% |
| 75 to 84 Years | 10 | 34.5% |
| 85 Years and Over | 0 | 0.0% |
| Total | 29 | 100.0% |
Housing Finances in Birmingham borough
Median Income by Occupancy in Birmingham borough
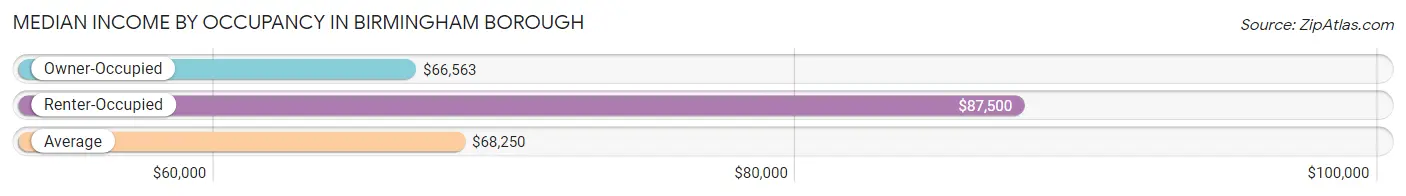
| Occupancy Type | # Households | Median Income |
| Owner-Occupied | 17 (58.6%) | $66,563 |
| Renter-Occupied | 12 (41.4%) | $87,500 |
| Average | 29 (100.0%) | $68,250 |
Occupancy by Householder Income Bracket in Birmingham borough
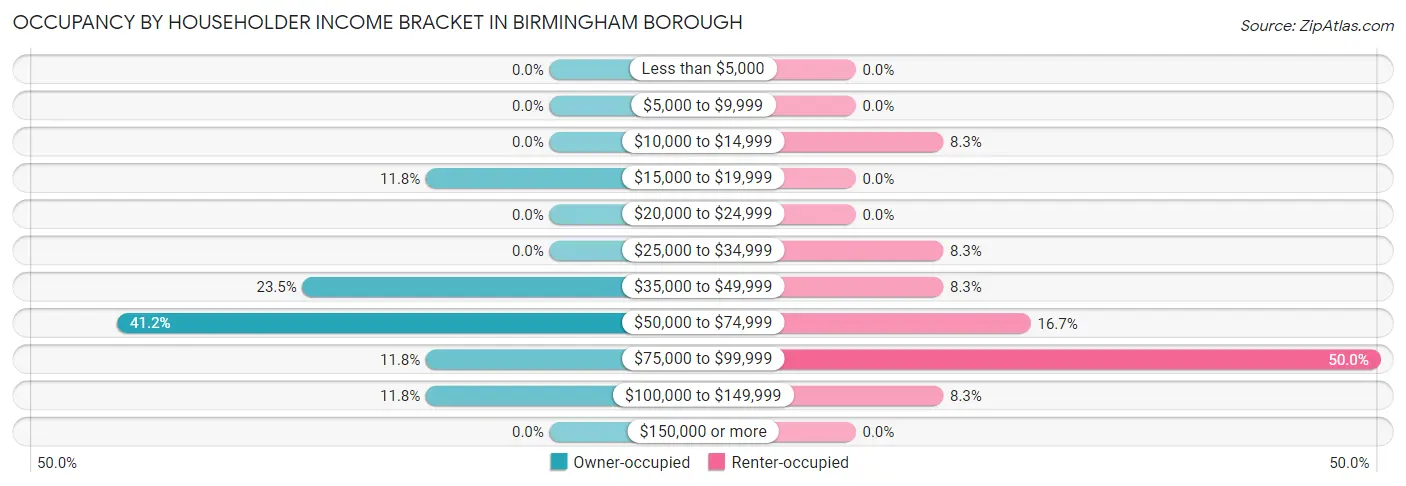
| Income Bracket | Owner-occupied | Renter-occupied |
| Less than $5,000 | 0 (0.0%) | 0 (0.0%) |
| $5,000 to $9,999 | 0 (0.0%) | 0 (0.0%) |
| $10,000 to $14,999 | 0 (0.0%) | 1 (8.3%) |
| $15,000 to $19,999 | 2 (11.8%) | 0 (0.0%) |
| $20,000 to $24,999 | 0 (0.0%) | 0 (0.0%) |
| $25,000 to $34,999 | 0 (0.0%) | 1 (8.3%) |
| $35,000 to $49,999 | 4 (23.5%) | 1 (8.3%) |
| $50,000 to $74,999 | 7 (41.2%) | 2 (16.7%) |
| $75,000 to $99,999 | 2 (11.8%) | 6 (50.0%) |
| $100,000 to $149,999 | 2 (11.8%) | 1 (8.3%) |
| $150,000 or more | 0 (0.0%) | 0 (0.0%) |
| Total | 17 (100.0%) | 12 (100.0%) |
Monthly Housing Cost Tiers in Birmingham borough
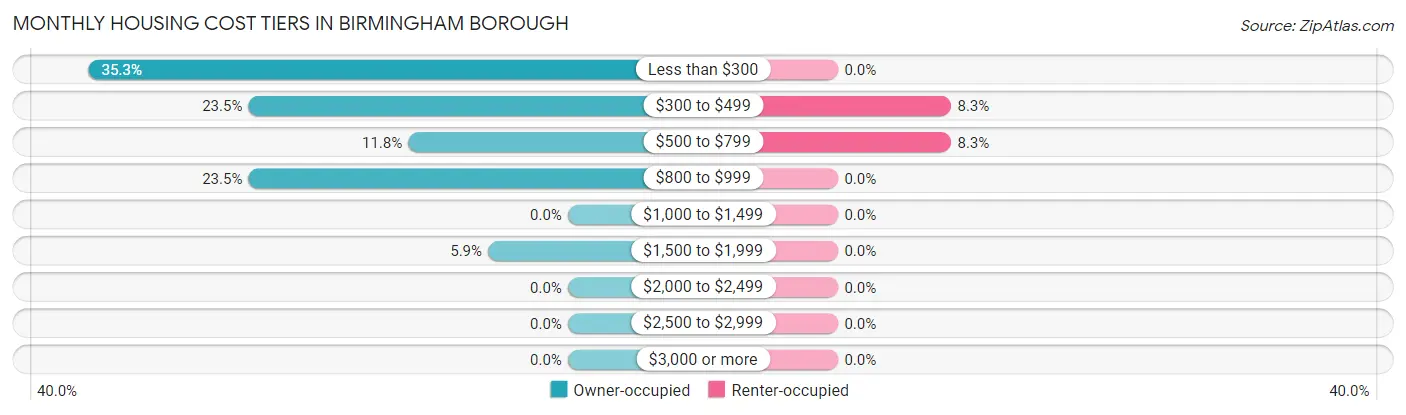
| Monthly Cost | Owner-occupied | Renter-occupied |
| Less than $300 | 6 (35.3%) | 0 (0.0%) |
| $300 to $499 | 4 (23.5%) | 1 (8.3%) |
| $500 to $799 | 2 (11.8%) | 1 (8.3%) |
| $800 to $999 | 4 (23.5%) | 0 (0.0%) |
| $1,000 to $1,499 | 0 (0.0%) | 0 (0.0%) |
| $1,500 to $1,999 | 1 (5.9%) | 0 (0.0%) |
| $2,000 to $2,499 | 0 (0.0%) | 0 (0.0%) |
| $2,500 to $2,999 | 0 (0.0%) | 0 (0.0%) |
| $3,000 or more | 0 (0.0%) | 0 (0.0%) |
| Total | 17 (100.0%) | 12 (100.0%) |
Physical Housing Characteristics in Birmingham borough
Housing Structures in Birmingham borough
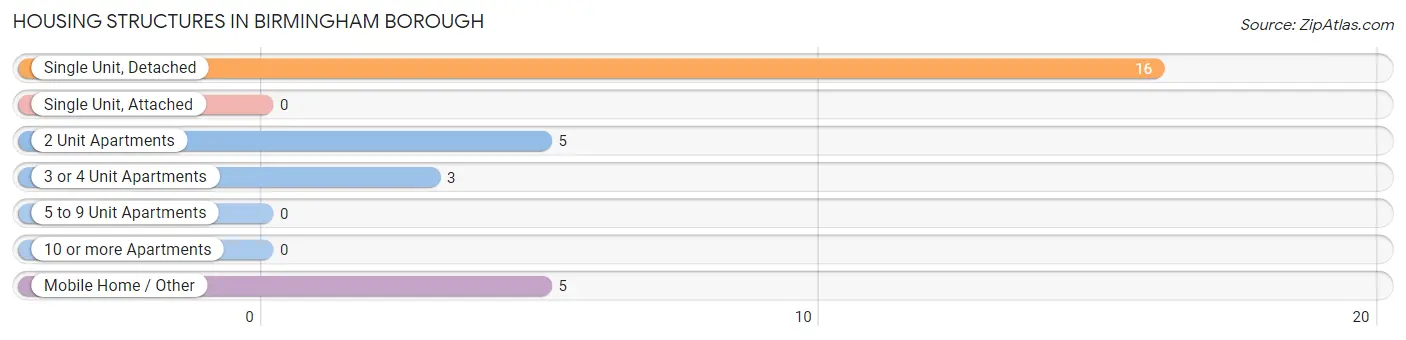
| Structure Type | # Housing Units | % Housing Units |
| Single Unit, Detached | 16 | 55.2% |
| Single Unit, Attached | 0 | 0.0% |
| 2 Unit Apartments | 5 | 17.2% |
| 3 or 4 Unit Apartments | 3 | 10.3% |
| 5 to 9 Unit Apartments | 0 | 0.0% |
| 10 or more Apartments | 0 | 0.0% |
| Mobile Home / Other | 5 | 17.2% |
| Total | 29 | 100.0% |
Housing Structures by Occupancy in Birmingham borough
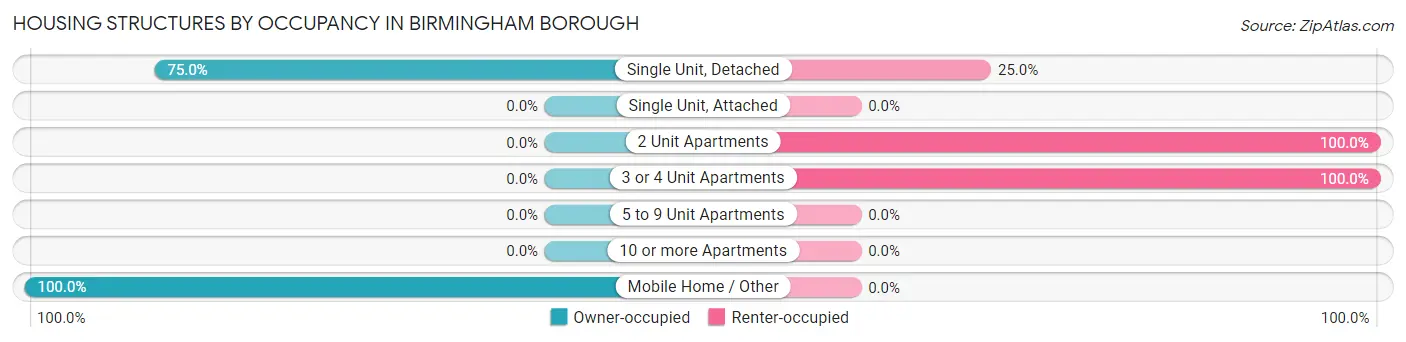
| Structure Type | Owner-occupied | Renter-occupied |
| Single Unit, Detached | 12 (75.0%) | 4 (25.0%) |
| Single Unit, Attached | 0 (0.0%) | 0 (0.0%) |
| 2 Unit Apartments | 0 (0.0%) | 5 (100.0%) |
| 3 or 4 Unit Apartments | 0 (0.0%) | 3 (100.0%) |
| 5 to 9 Unit Apartments | 0 (0.0%) | 0 (0.0%) |
| 10 or more Apartments | 0 (0.0%) | 0 (0.0%) |
| Mobile Home / Other | 5 (100.0%) | 0 (0.0%) |
| Total | 17 (58.6%) | 12 (41.4%) |
Housing Structures by Number of Rooms in Birmingham borough
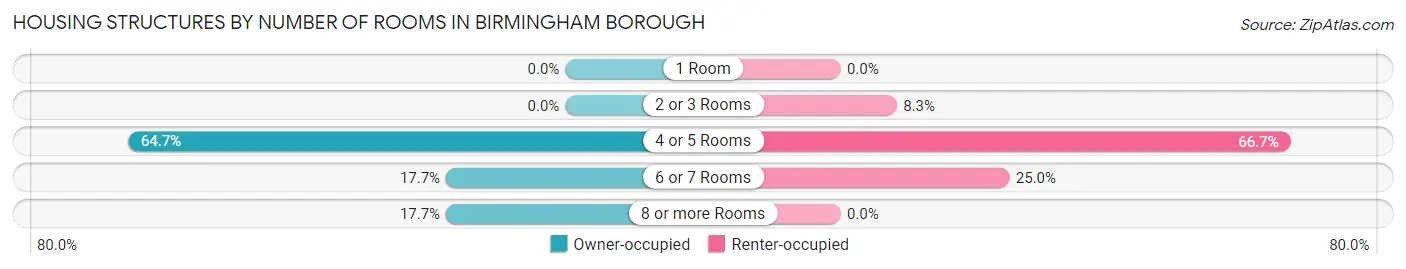
| Number of Rooms | Owner-occupied | Renter-occupied |
| 1 Room | 0 (0.0%) | 0 (0.0%) |
| 2 or 3 Rooms | 0 (0.0%) | 1 (8.3%) |
| 4 or 5 Rooms | 11 (64.7%) | 8 (66.7%) |
| 6 or 7 Rooms | 3 (17.6%) | 3 (25.0%) |
| 8 or more Rooms | 3 (17.6%) | 0 (0.0%) |
| Total | 17 (100.0%) | 12 (100.0%) |
Housing Structure by Heating Type in Birmingham borough
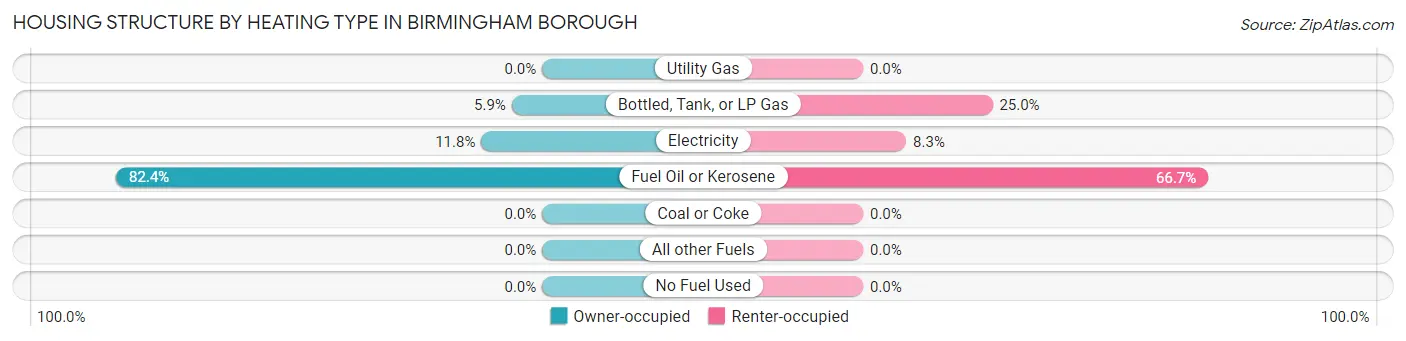
| Heating Type | Owner-occupied | Renter-occupied |
| Utility Gas | 0 (0.0%) | 0 (0.0%) |
| Bottled, Tank, or LP Gas | 1 (5.9%) | 3 (25.0%) |
| Electricity | 2 (11.8%) | 1 (8.3%) |
| Fuel Oil or Kerosene | 14 (82.4%) | 8 (66.7%) |
| Coal or Coke | 0 (0.0%) | 0 (0.0%) |
| All other Fuels | 0 (0.0%) | 0 (0.0%) |
| No Fuel Used | 0 (0.0%) | 0 (0.0%) |
| Total | 17 (100.0%) | 12 (100.0%) |
Household Vehicle Usage in Birmingham borough
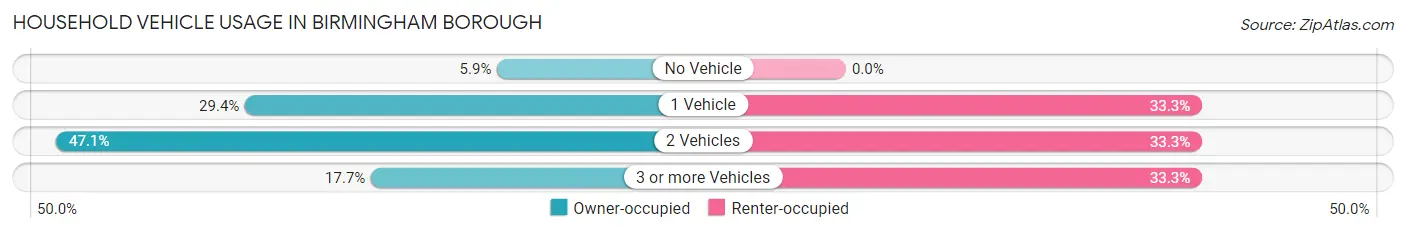
| Vehicles per Household | Owner-occupied | Renter-occupied |
| No Vehicle | 1 (5.9%) | 0 (0.0%) |
| 1 Vehicle | 5 (29.4%) | 4 (33.3%) |
| 2 Vehicles | 8 (47.1%) | 4 (33.3%) |
| 3 or more Vehicles | 3 (17.6%) | 4 (33.3%) |
| Total | 17 (100.0%) | 12 (100.0%) |
Real Estate & Mortgages in Birmingham borough
Real Estate and Mortgage Overview in Birmingham borough
| Characteristic | Without Mortgage | With Mortgage |
| Housing Units | 12 | 5 |
| Median Property Value | $125,000 | $0 |
| Median Household Income | $67,500 | $0 |
| Monthly Housing Costs | $300 | $0 |
| Real Estate Taxes | $800 | $0 |
Property Value by Mortgage Status in Birmingham borough
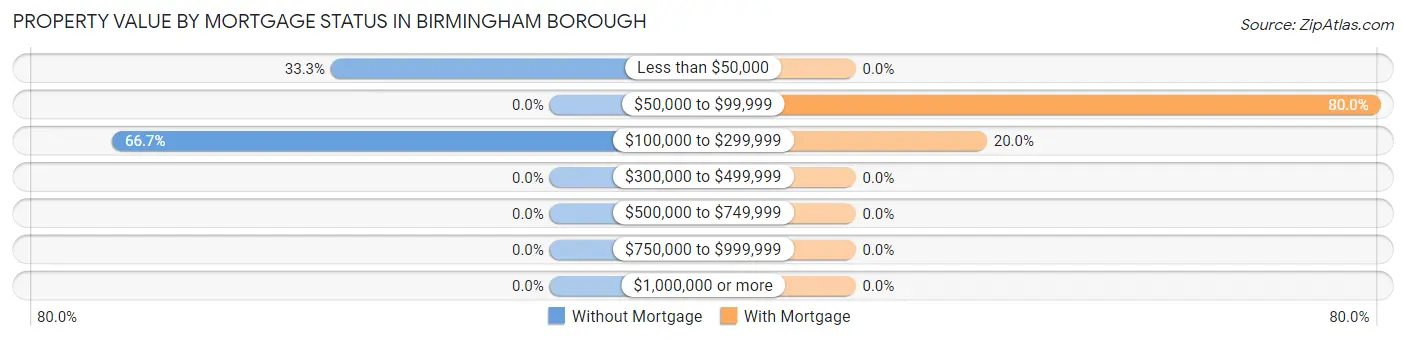
| Property Value | Without Mortgage | With Mortgage |
| Less than $50,000 | 4 (33.3%) | 0 (0.0%) |
| $50,000 to $99,999 | 0 (0.0%) | 4 (80.0%) |
| $100,000 to $299,999 | 8 (66.7%) | 1 (20.0%) |
| $300,000 to $499,999 | 0 (0.0%) | 0 (0.0%) |
| $500,000 to $749,999 | 0 (0.0%) | 0 (0.0%) |
| $750,000 to $999,999 | 0 (0.0%) | 0 (0.0%) |
| $1,000,000 or more | 0 (0.0%) | 0 (0.0%) |
| Total | 12 (100.0%) | 5 (100.0%) |
Household Income by Mortgage Status in Birmingham borough
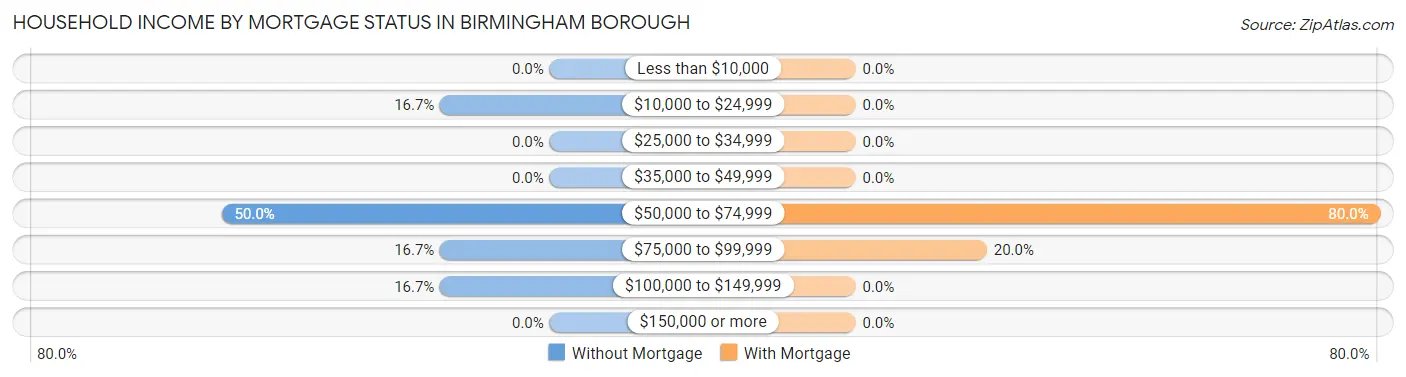
| Household Income | Without Mortgage | With Mortgage |
| Less than $10,000 | 0 (0.0%) | 0 (0.0%) |
| $10,000 to $24,999 | 2 (16.7%) | 0 (0.0%) |
| $25,000 to $34,999 | 0 (0.0%) | 0 (0.0%) |
| $35,000 to $49,999 | 0 (0.0%) | 0 (0.0%) |
| $50,000 to $74,999 | 6 (50.0%) | 4 (80.0%) |
| $75,000 to $99,999 | 2 (16.7%) | 1 (20.0%) |
| $100,000 to $149,999 | 2 (16.7%) | 0 (0.0%) |
| $150,000 or more | 0 (0.0%) | 0 (0.0%) |
| Total | 12 (100.0%) | 5 (100.0%) |
Property Value to Household Income Ratio in Birmingham borough
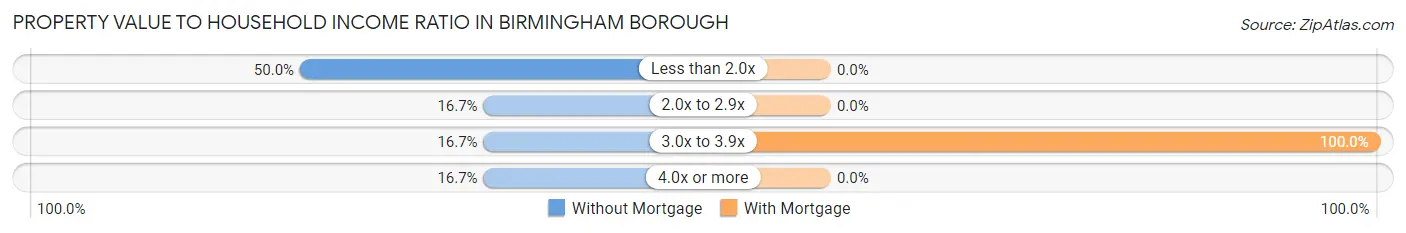
| Value-to-Income Ratio | Without Mortgage | With Mortgage |
| Less than 2.0x | 6 (50.0%) | 0 (0.0%) |
| 2.0x to 2.9x | 2 (16.7%) | 0 (0.0%) |
| 3.0x to 3.9x | 2 (16.7%) | 5 (100.0%) |
| 4.0x or more | 2 (16.7%) | 0 (0.0%) |
| Total | 12 (100.0%) | 5 (100.0%) |
Real Estate Taxes by Mortgage Status in Birmingham borough
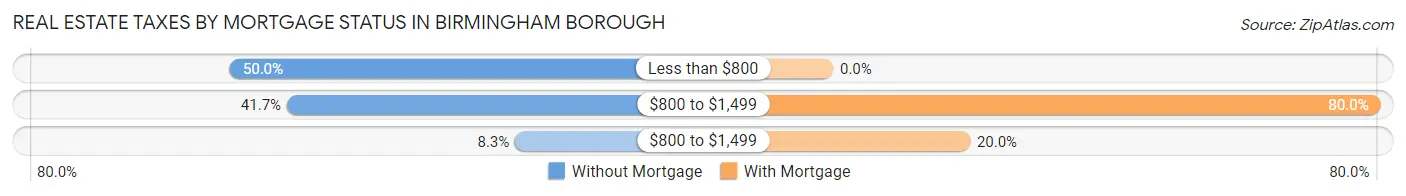
| Property Taxes | Without Mortgage | With Mortgage |
| Less than $800 | 6 (50.0%) | 0 (0.0%) |
| $800 to $1,499 | 5 (41.7%) | 4 (80.0%) |
| $800 to $1,499 | 1 (8.3%) | 1 (20.0%) |
| Total | 12 (100.0%) | 5 (100.0%) |
Health & Disability in Birmingham borough
Health Insurance Coverage by Age in Birmingham borough
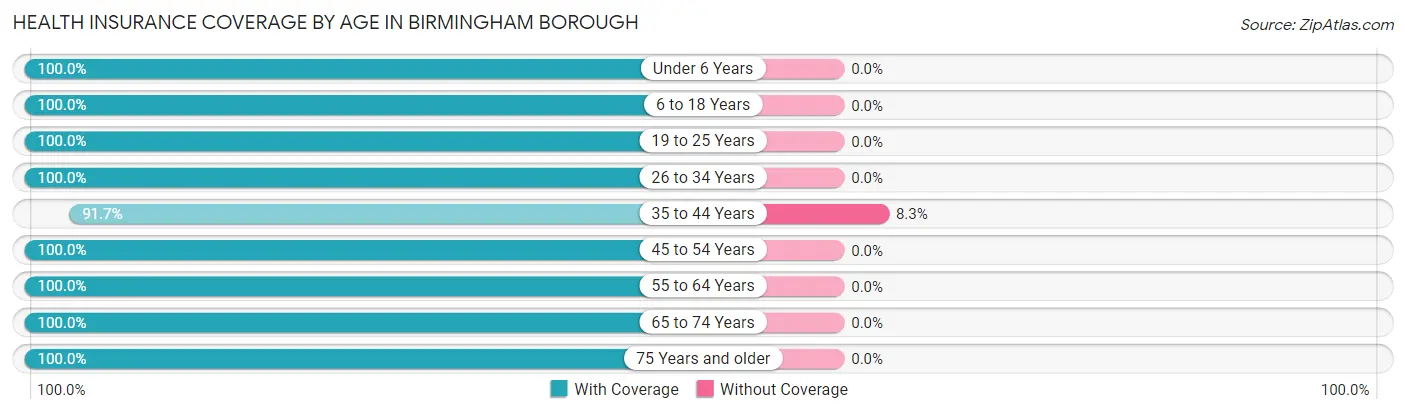
| Age Bracket | With Coverage | Without Coverage |
| Under 6 Years | 7 (100.0%) | 0 (0.0%) |
| 6 to 18 Years | 4 (100.0%) | 0 (0.0%) |
| 19 to 25 Years | 2 (100.0%) | 0 (0.0%) |
| 26 to 34 Years | 4 (100.0%) | 0 (0.0%) |
| 35 to 44 Years | 11 (91.7%) | 1 (8.3%) |
| 45 to 54 Years | 5 (100.0%) | 0 (0.0%) |
| 55 to 64 Years | 11 (100.0%) | 0 (0.0%) |
| 65 to 74 Years | 6 (100.0%) | 0 (0.0%) |
| 75 Years and older | 12 (100.0%) | 0 (0.0%) |
| Total | 62 (98.4%) | 1 (1.6%) |
Health Insurance Coverage by Citizenship Status in Birmingham borough
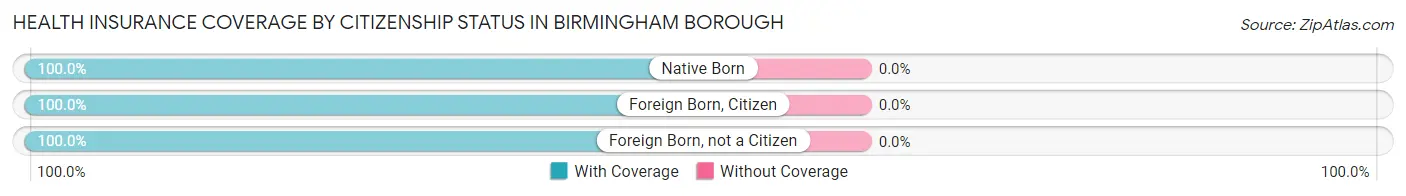
| Citizenship Status | With Coverage | Without Coverage |
| Native Born | 7 (100.0%) | 0 (0.0%) |
| Foreign Born, Citizen | 4 (100.0%) | 0 (0.0%) |
| Foreign Born, not a Citizen | 2 (100.0%) | 0 (0.0%) |
Health Insurance Coverage by Household Income in Birmingham borough
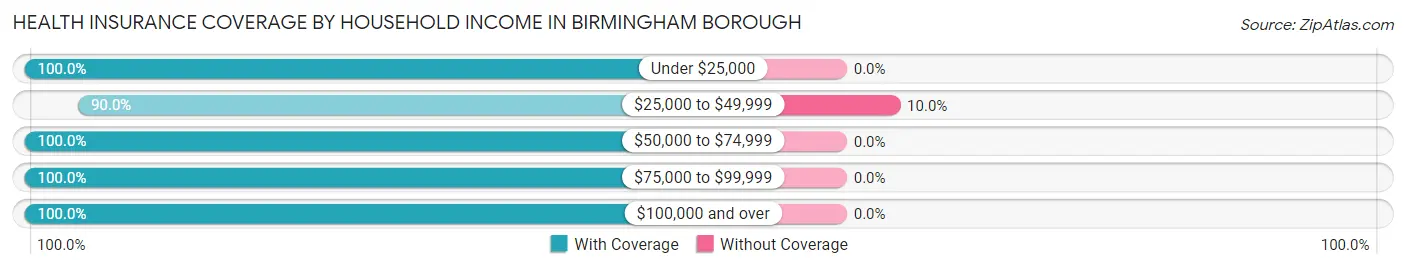
| Household Income | With Coverage | Without Coverage |
| Under $25,000 | 3 (100.0%) | 0 (0.0%) |
| $25,000 to $49,999 | 9 (90.0%) | 1 (10.0%) |
| $50,000 to $74,999 | 15 (100.0%) | 0 (0.0%) |
| $75,000 to $99,999 | 24 (100.0%) | 0 (0.0%) |
| $100,000 and over | 11 (100.0%) | 0 (0.0%) |
Public vs Private Health Insurance Coverage by Age in Birmingham borough
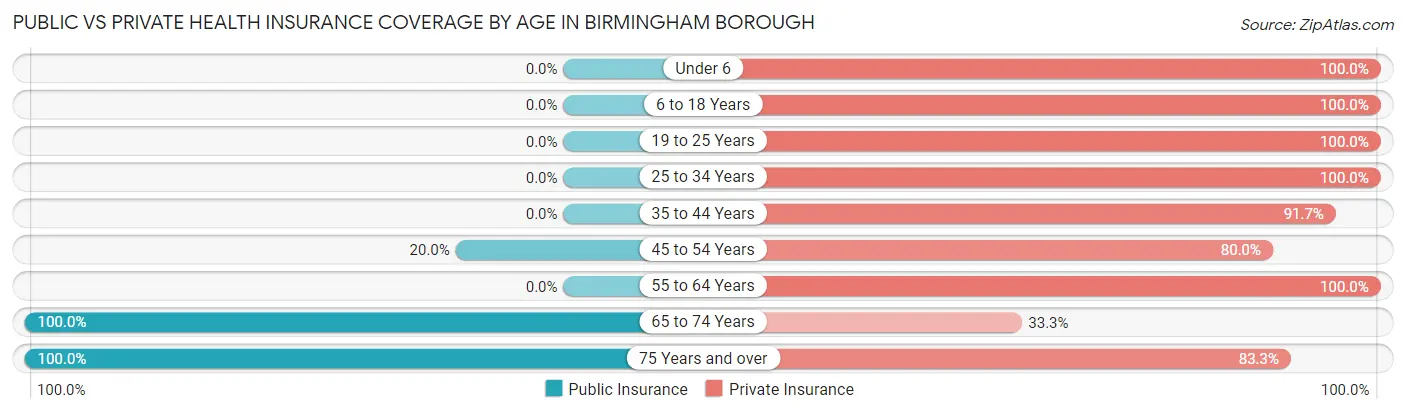
| Age Bracket | Public Insurance | Private Insurance |
| Under 6 | 0 (0.0%) | 7 (100.0%) |
| 6 to 18 Years | 0 (0.0%) | 4 (100.0%) |
| 19 to 25 Years | 0 (0.0%) | 2 (100.0%) |
| 25 to 34 Years | 0 (0.0%) | 4 (100.0%) |
| 35 to 44 Years | 0 (0.0%) | 11 (91.7%) |
| 45 to 54 Years | 1 (20.0%) | 4 (80.0%) |
| 55 to 64 Years | 0 (0.0%) | 11 (100.0%) |
| 65 to 74 Years | 6 (100.0%) | 2 (33.3%) |
| 75 Years and over | 12 (100.0%) | 10 (83.3%) |
| Total | 19 (30.2%) | 55 (87.3%) |
Disability Status by Sex by Age in Birmingham borough
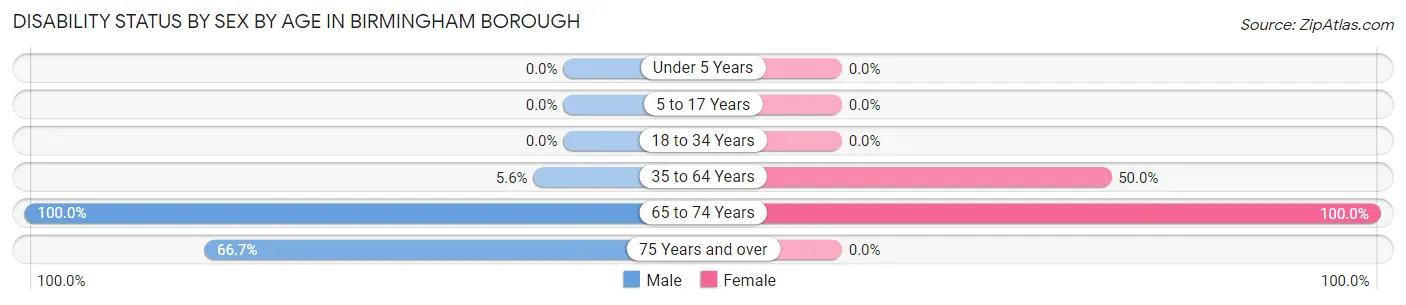
| Age Bracket | Male | Female |
| Under 5 Years | 0 (0.0%) | 0 (0.0%) |
| 5 to 17 Years | 0 (0.0%) | 0 (0.0%) |
| 18 to 34 Years | 0 (0.0%) | 0 (0.0%) |
| 35 to 64 Years | 1 (5.6%) | 5 (50.0%) |
| 65 to 74 Years | 4 (100.0%) | 2 (100.0%) |
| 75 Years and over | 4 (66.7%) | 0 (0.0%) |
Disability Class by Sex by Age in Birmingham borough
Disability Class: Hearing Difficulty
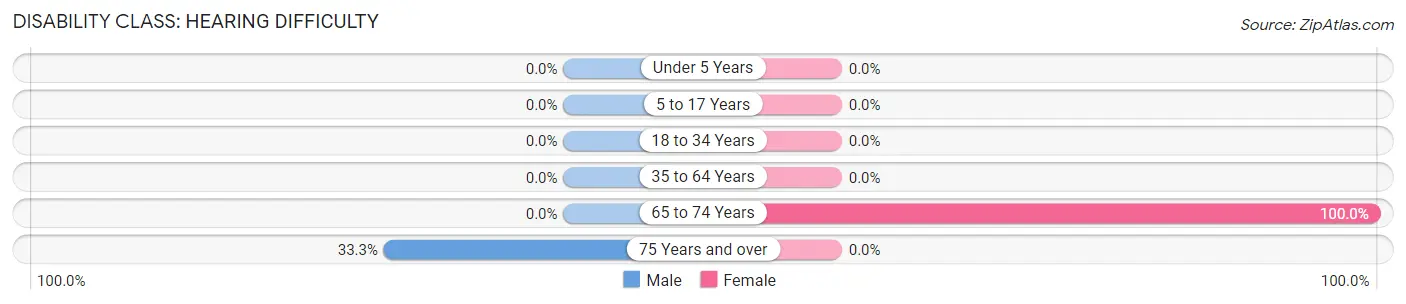
| Age Bracket | Male | Female |
| Under 5 Years | 0 (0.0%) | 0 (0.0%) |
| 5 to 17 Years | 0 (0.0%) | 0 (0.0%) |
| 18 to 34 Years | 0 (0.0%) | 0 (0.0%) |
| 35 to 64 Years | 0 (0.0%) | 0 (0.0%) |
| 65 to 74 Years | 0 (0.0%) | 2 (100.0%) |
| 75 Years and over | 2 (33.3%) | 0 (0.0%) |
Disability Class: Vision Difficulty
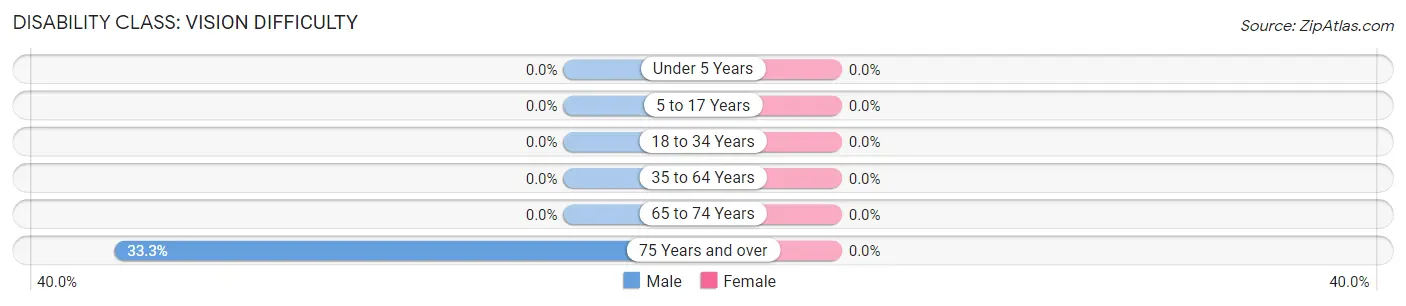
| Age Bracket | Male | Female |
| Under 5 Years | 0 (0.0%) | 0 (0.0%) |
| 5 to 17 Years | 0 (0.0%) | 0 (0.0%) |
| 18 to 34 Years | 0 (0.0%) | 0 (0.0%) |
| 35 to 64 Years | 0 (0.0%) | 0 (0.0%) |
| 65 to 74 Years | 0 (0.0%) | 0 (0.0%) |
| 75 Years and over | 2 (33.3%) | 0 (0.0%) |
Disability Class: Cognitive Difficulty
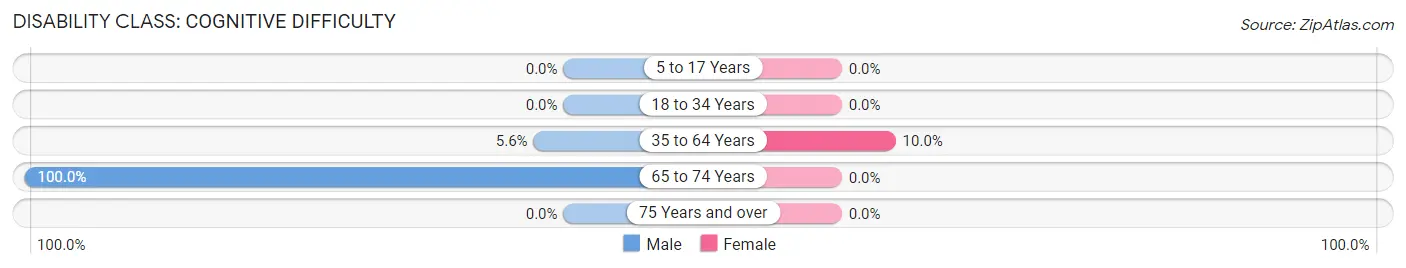
| Age Bracket | Male | Female |
| 5 to 17 Years | 0 (0.0%) | 0 (0.0%) |
| 18 to 34 Years | 0 (0.0%) | 0 (0.0%) |
| 35 to 64 Years | 1 (5.6%) | 1 (10.0%) |
| 65 to 74 Years | 4 (100.0%) | 0 (0.0%) |
| 75 Years and over | 0 (0.0%) | 0 (0.0%) |
Disability Class: Ambulatory Difficulty
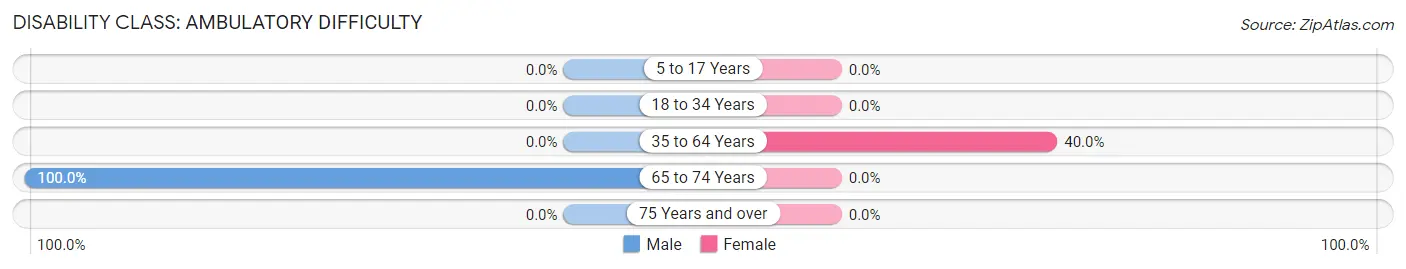
| Age Bracket | Male | Female |
| 5 to 17 Years | 0 (0.0%) | 0 (0.0%) |
| 18 to 34 Years | 0 (0.0%) | 0 (0.0%) |
| 35 to 64 Years | 0 (0.0%) | 4 (40.0%) |
| 65 to 74 Years | 4 (100.0%) | 0 (0.0%) |
| 75 Years and over | 0 (0.0%) | 0 (0.0%) |
Disability Class: Self-Care Difficulty
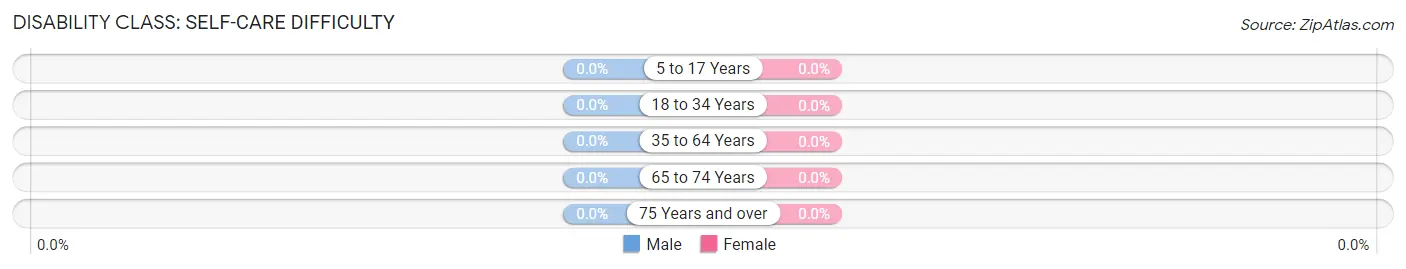
| Age Bracket | Male | Female |
| 5 to 17 Years | 0 (0.0%) | 0 (0.0%) |
| 18 to 34 Years | 0 (0.0%) | 0 (0.0%) |
| 35 to 64 Years | 0 (0.0%) | 0 (0.0%) |
| 65 to 74 Years | 0 (0.0%) | 0 (0.0%) |
| 75 Years and over | 0 (0.0%) | 0 (0.0%) |
Technology Access in Birmingham borough
Computing Device Access in Birmingham borough
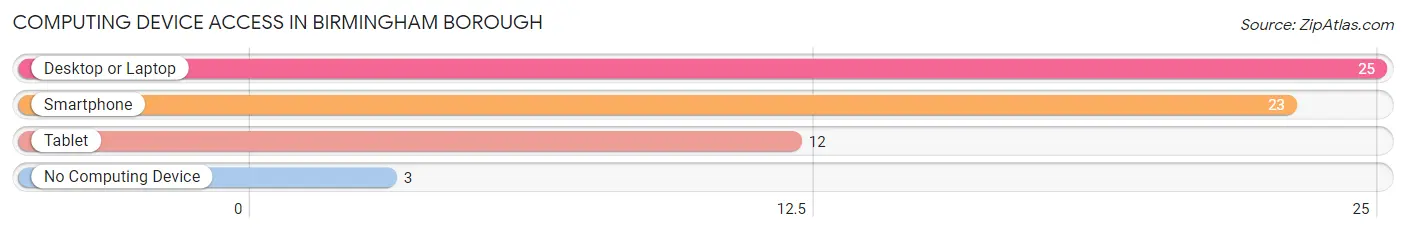
| Device Type | # Households | % Households |
| Desktop or Laptop | 25 | 86.2% |
| Smartphone | 23 | 79.3% |
| Tablet | 12 | 41.4% |
| No Computing Device | 3 | 10.3% |
| Total | 29 | 100.0% |
Internet Access in Birmingham borough
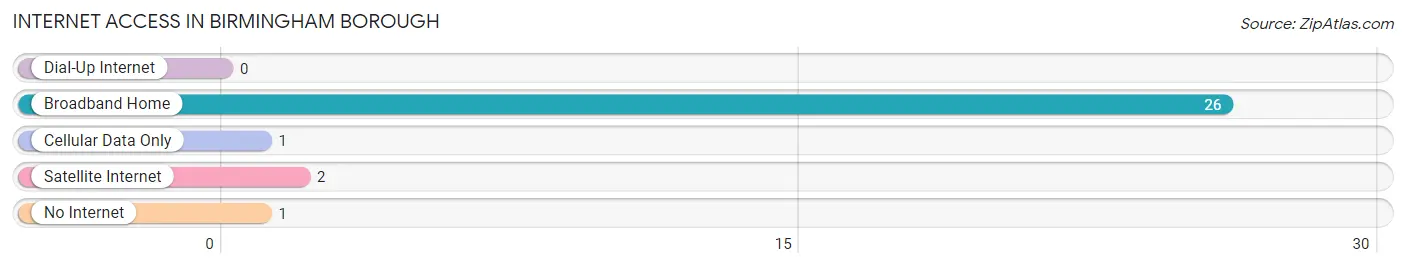
| Internet Type | # Households | % Households |
| Dial-Up Internet | 0 | 0.0% |
| Broadband Home | 26 | 89.7% |
| Cellular Data Only | 1 | 3.5% |
| Satellite Internet | 2 | 6.9% |
| No Internet | 1 | 3.5% |
| Total | 29 | 100.0% |
Birmingham borough Summary
Birmingham Borough is a borough located in the state of Pennsylvania in the United States. It is located in the southeastern corner of the state, in the Lehigh Valley region. The borough is part of the Allentown-Bethlehem-Easton metropolitan area. As of the 2010 census, the population of Birmingham Borough was 1,945.
History
The area that is now Birmingham Borough was first settled in the late 1700s by German immigrants. The area was originally known as “Germantown” and was part of Northampton County. In 1845, the area was incorporated as the Borough of Birmingham. The name was chosen to honor the city of Birmingham, England, which was a major industrial center at the time.
The borough grew rapidly in the late 19th and early 20th centuries, due to its proximity to the Lehigh Valley Railroad. The railroad provided easy access to the coal and iron ore mines in the area, which helped to fuel the industrial growth of the borough. By the early 1900s, Birmingham Borough had become a major industrial center, with several steel mills, coal mines, and other factories.
Geography
Birmingham Borough is located in the southeastern corner of Pennsylvania, in the Lehigh Valley region. It is bordered to the north by Northampton County, to the east by Bucks County, to the south by Montgomery County, and to the west by Lehigh County. The borough covers an area of 1.3 square miles, all of which is land.
The borough is located in the Lehigh Valley, which is a major agricultural and industrial region. The Lehigh River runs through the borough, and there are several small creeks and streams in the area. The borough is located in the Appalachian Mountains, and the terrain is mostly hilly.
Economy
The economy of Birmingham Borough is largely based on manufacturing and agriculture. The borough is home to several factories and industrial plants, including steel mills, coal mines, and other factories. The borough is also home to several farms, which produce a variety of crops, including corn, soybeans, and wheat.
The borough is also home to several small businesses, including restaurants, retail stores, and professional services. The borough is home to several small parks and recreational areas, which attract visitors from the surrounding area.
Demographics
As of the 2010 census, the population of Birmingham Borough was 1,945. The racial makeup of the borough was 95.3% White, 1.2% African American, 0.3% Native American, 0.7% Asian, 0.1% Pacific Islander, 0.7% from other races, and 1.7% from two or more races. Hispanic or Latino of any race were 2.2% of the population.
The median household income in the borough was $45,938, and the median family income was $54,375. The per capita income in the borough was $21,945. About 8.3% of the population was below the poverty line.
Common Questions
What is Per Capita Income in Birmingham borough?
Per Capita income in Birmingham borough is $30,283.
What is the Median Family Income in Birmingham borough?
Median Family Income in Birmingham borough is $69,583.
What is the Median Household income in Birmingham borough?
Median Household Income in Birmingham borough is $68,250.
What is Income or Wage Gap in Birmingham borough?
Income or Wage Gap in Birmingham borough is 30.5%.
Women in Birmingham borough earn 69.5 cents for every dollar earned by a man.
What is Inequality or Gini Index in Birmingham borough?
Inequality or Gini Index in Birmingham borough is 0.26.
What is the Total Population of Birmingham borough?
Total Population of Birmingham borough is 63.
What is the Total Male Population of Birmingham borough?
Total Male Population of Birmingham borough is 40.
What is the Total Female Population of Birmingham borough?
Total Female Population of Birmingham borough is 23.
What is the Ratio of Males per 100 Females in Birmingham borough?
There are 173.91 Males per 100 Females in Birmingham borough.
What is the Ratio of Females per 100 Males in Birmingham borough?
There are 57.50 Females per 100 Males in Birmingham borough.
What is the Median Population Age in Birmingham borough?
Median Population Age in Birmingham borough is 49.5 Years.
What is the Average Family Size in Birmingham borough
Average Family Size in Birmingham borough is 2.6 People.
What is the Average Household Size in Birmingham borough
Average Household Size in Birmingham borough is 2.2 People.
How Large is the Labor Force in Birmingham borough?
There are 32 People in the Labor Forcein in Birmingham borough.
What is the Percentage of People in the Labor Force in Birmingham borough?
61.5% of People are in the Labor Force in Birmingham borough.
What is the Unemployment Rate in Birmingham borough?
Unemployment Rate in Birmingham borough is 3.1%.