Pen Mar, PA Map & Demographics
Pen Mar Map
Pen Mar Overview
$40,786
PER CAPITA INCOME
$125,517
AVG FAMILY INCOME
$111,595
AVG HOUSEHOLD INCOME
35.6%
WAGE / INCOME GAP [ % ]
64.4¢/ $1
WAGE / INCOME GAP [ $ ]
0.27
INEQUALITY / GINI INDEX
1,177
TOTAL POPULATION
468
MALE POPULATION
709
FEMALE POPULATION
66.01
MALES / 100 FEMALES
151.50
FEMALES / 100 MALES
35.5
MEDIAN AGE
3.4
AVG FAMILY SIZE
3.1
AVG HOUSEHOLD SIZE
652
LABOR FORCE [ PEOPLE ]
85.1%
PERCENT IN LABOR FORCE
3.5%
UNEMPLOYMENT RATE
Income in Pen Mar
Income Overview in Pen Mar
Per Capita Income in Pen Mar is $40,786, while median incomes of families and households are $125,517 and $111,595 respectively.
| Characteristic | Number | Measure |
| Per Capita Income | 1,177 | $40,786 |
| Median Family Income | 324 | $125,517 |
| Mean Family Income | 324 | $129,465 |
| Median Household Income | 378 | $111,595 |
| Mean Household Income | 378 | $123,969 |
| Income Deficit | 324 | $0 |
| Wage / Income Gap (%) | 1,177 | 35.57% |
| Wage / Income Gap ($) | 1,177 | 64.43¢ per $1 |
| Gini / Inequality Index | 1,177 | 0.27 |
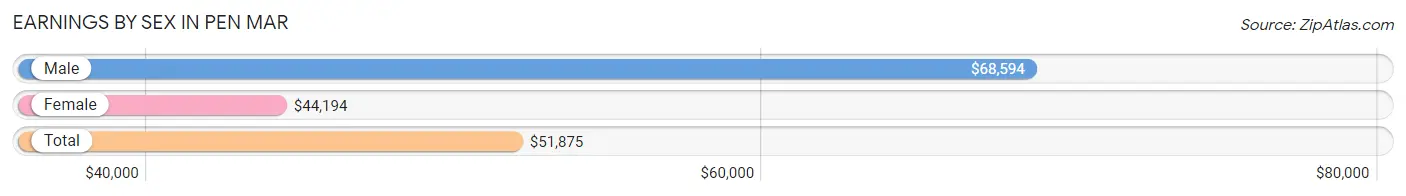
Earnings by Sex in Pen Mar
Average Earnings in Pen Mar are $51,875, $68,594 for men and $44,194 for women, a difference of 35.6%.
| Sex | Number | Average Earnings |
| Male | 355 (52.3%) | $68,594 |
| Female | 324 (47.7%) | $44,194 |
| Total | 679 (100.0%) | $51,875 |
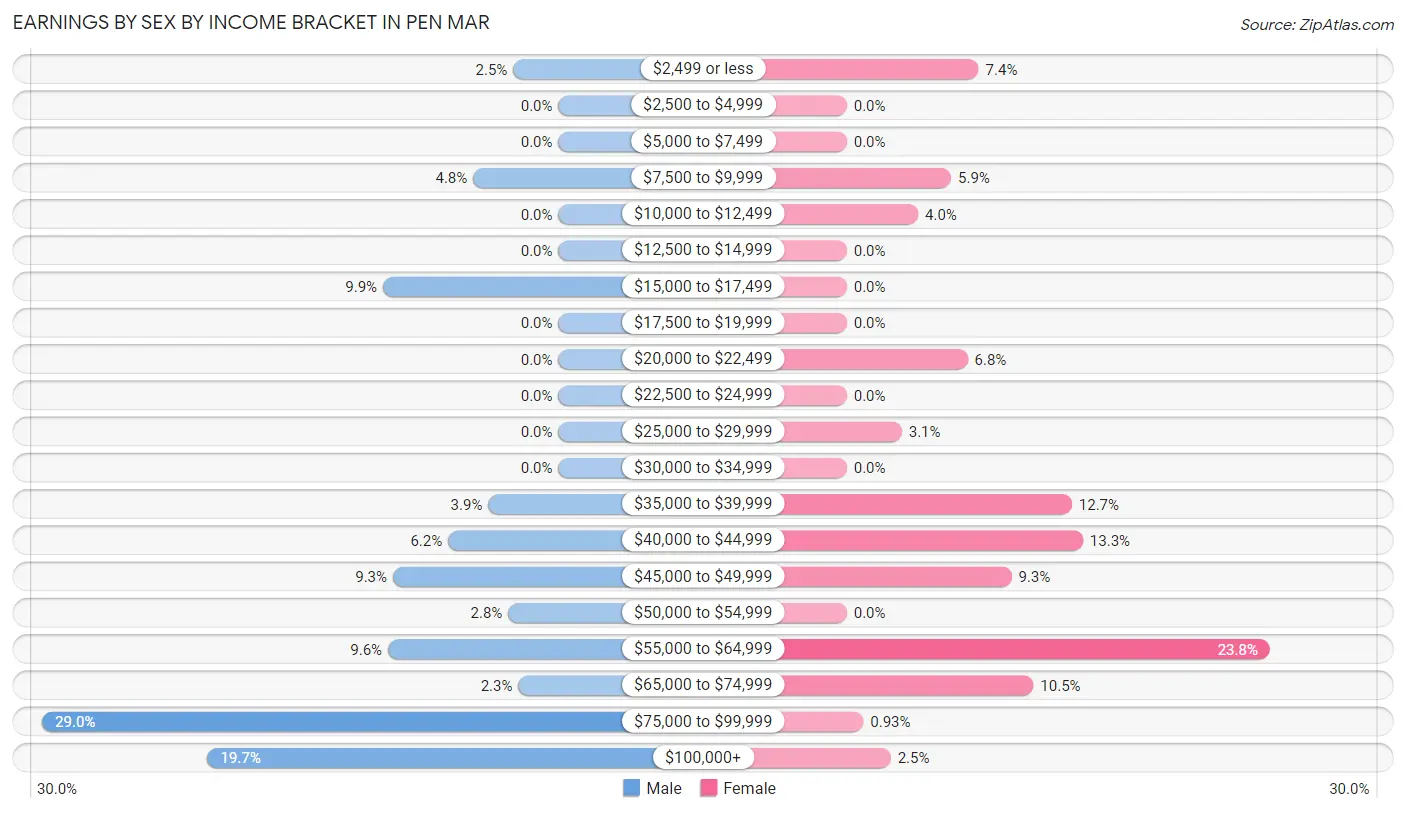
Earnings by Sex by Income Bracket in Pen Mar
The most common earnings brackets in Pen Mar are $75,000 to $99,999 for men (103 | 29.0%) and $55,000 to $64,999 for women (77 | 23.8%).
| Income | Male | Female |
| $2,499 or less | 9 (2.5%) | 24 (7.4%) |
| $2,500 to $4,999 | 0 (0.0%) | 0 (0.0%) |
| $5,000 to $7,499 | 0 (0.0%) | 0 (0.0%) |
| $7,500 to $9,999 | 17 (4.8%) | 19 (5.9%) |
| $10,000 to $12,499 | 0 (0.0%) | 13 (4.0%) |
| $12,500 to $14,999 | 0 (0.0%) | 0 (0.0%) |
| $15,000 to $17,499 | 35 (9.9%) | 0 (0.0%) |
| $17,500 to $19,999 | 0 (0.0%) | 0 (0.0%) |
| $20,000 to $22,499 | 0 (0.0%) | 22 (6.8%) |
| $22,500 to $24,999 | 0 (0.0%) | 0 (0.0%) |
| $25,000 to $29,999 | 0 (0.0%) | 10 (3.1%) |
| $30,000 to $34,999 | 0 (0.0%) | 0 (0.0%) |
| $35,000 to $39,999 | 14 (3.9%) | 41 (12.7%) |
| $40,000 to $44,999 | 22 (6.2%) | 43 (13.3%) |
| $45,000 to $49,999 | 33 (9.3%) | 30 (9.3%) |
| $50,000 to $54,999 | 10 (2.8%) | 0 (0.0%) |
| $55,000 to $64,999 | 34 (9.6%) | 77 (23.8%) |
| $65,000 to $74,999 | 8 (2.2%) | 34 (10.5%) |
| $75,000 to $99,999 | 103 (29.0%) | 3 (0.9%) |
| $100,000+ | 70 (19.7%) | 8 (2.5%) |
| Total | 355 (100.0%) | 324 (100.0%) |
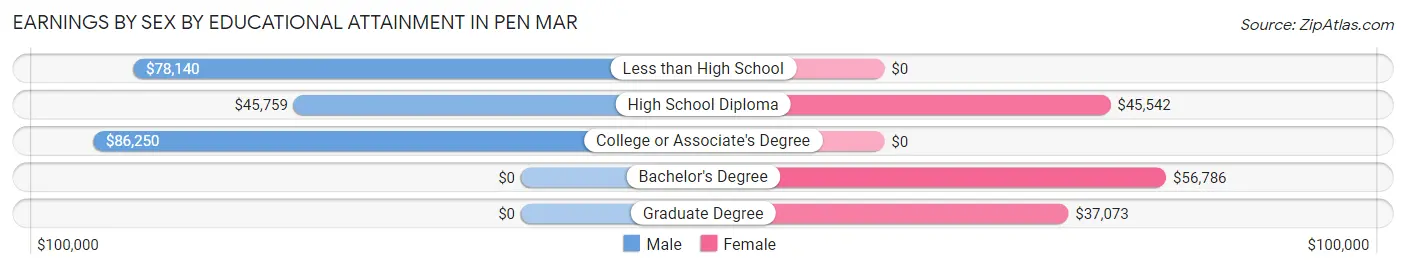
Earnings by Sex by Educational Attainment in Pen Mar
Average earnings in Pen Mar are $77,750 for men and $44,718 for women, a difference of 42.5%. Men with an educational attainment of college or associate's degree enjoy the highest average annual earnings of $86,250, while those with high school diploma education earn the least with $45,759. Women with an educational attainment of bachelor's degree earn the most with the average annual earnings of $56,786, while those with graduate degree education have the smallest earnings of $37,073.
| Educational Attainment | Male Income | Female Income |
| Less than High School | $78,140 | $0 |
| High School Diploma | $45,759 | $45,542 |
| College or Associate's Degree | $86,250 | $0 |
| Bachelor's Degree | - | - |
| Graduate Degree | - | - |
| Total | $77,750 | $44,718 |
Family Income in Pen Mar
Family Income Brackets in Pen Mar
According to the Pen Mar family income data, there are 80 families falling into the $75,000 to $99,999 income range, which is the most common income bracket and makes up 24.7% of all families.
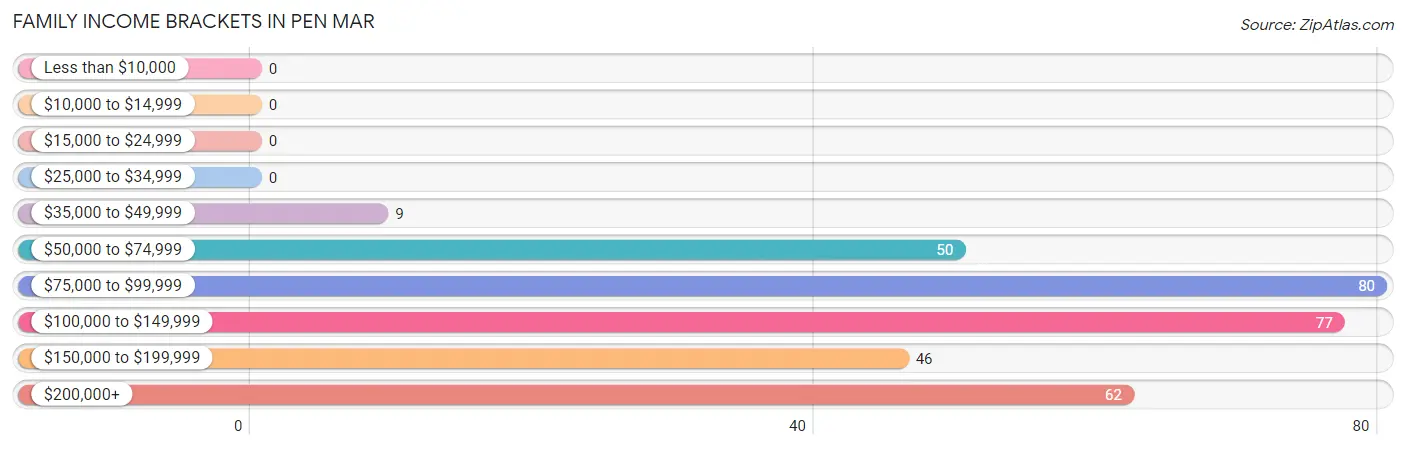
| Income Bracket | # Families | % Families |
| Less than $10,000 | 0 | 0.0% |
| $10,000 to $14,999 | 0 | 0.0% |
| $15,000 to $24,999 | 0 | 0.0% |
| $25,000 to $34,999 | 0 | 0.0% |
| $35,000 to $49,999 | 9 | 2.8% |
| $50,000 to $74,999 | 50 | 15.4% |
| $75,000 to $99,999 | 80 | 24.7% |
| $100,000 to $149,999 | 77 | 23.8% |
| $150,000 to $199,999 | 46 | 14.2% |
| $200,000+ | 62 | 19.1% |
Family Income by Famaliy Size in Pen Mar
4-person families (51 | 15.7%) account for the highest median family income in Pen Mar with $151,250 per family, while 2-person families (127 | 39.2%) have the highest median income of $55,110 per family member.
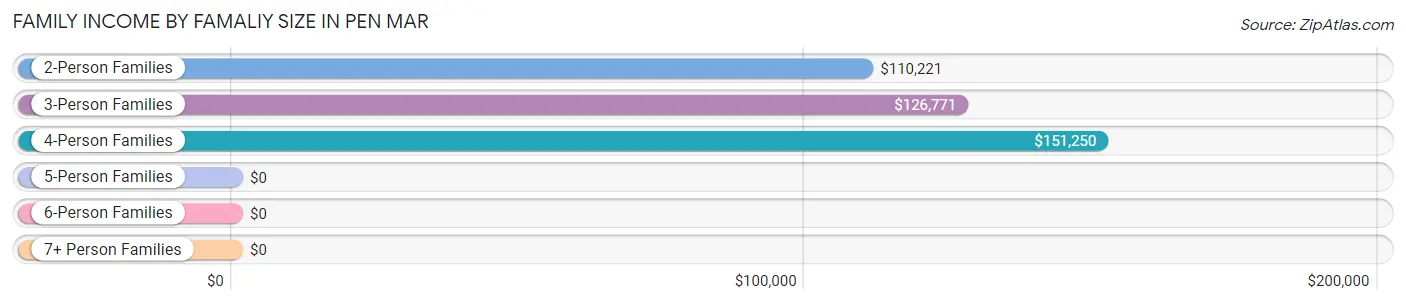
| Income Bracket | # Families | Median Income |
| 2-Person Families | 127 (39.2%) | $110,221 |
| 3-Person Families | 57 (17.6%) | $126,771 |
| 4-Person Families | 51 (15.7%) | $151,250 |
| 5-Person Families | 64 (19.8%) | $0 |
| 6-Person Families | 8 (2.5%) | $0 |
| 7+ Person Families | 17 (5.2%) | $0 |
| Total | 324 (100.0%) | $125,517 |
Family Income by Number of Earners in Pen Mar
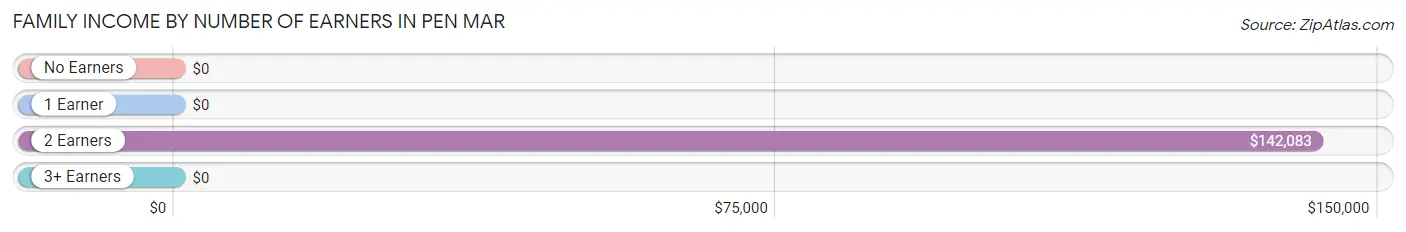
| Number of Earners | # Families | Median Income |
| No Earners | 17 (5.2%) | $0 |
| 1 Earner | 51 (15.7%) | $0 |
| 2 Earners | 232 (71.6%) | $142,083 |
| 3+ Earners | 24 (7.4%) | $0 |
| Total | 324 (100.0%) | $125,517 |
Household Income in Pen Mar
Household Income Brackets in Pen Mar
With 118 households falling in the category, the $100,000 to $149,999 income range is the most frequent in Pen Mar, accounting for 31.2% of all households.
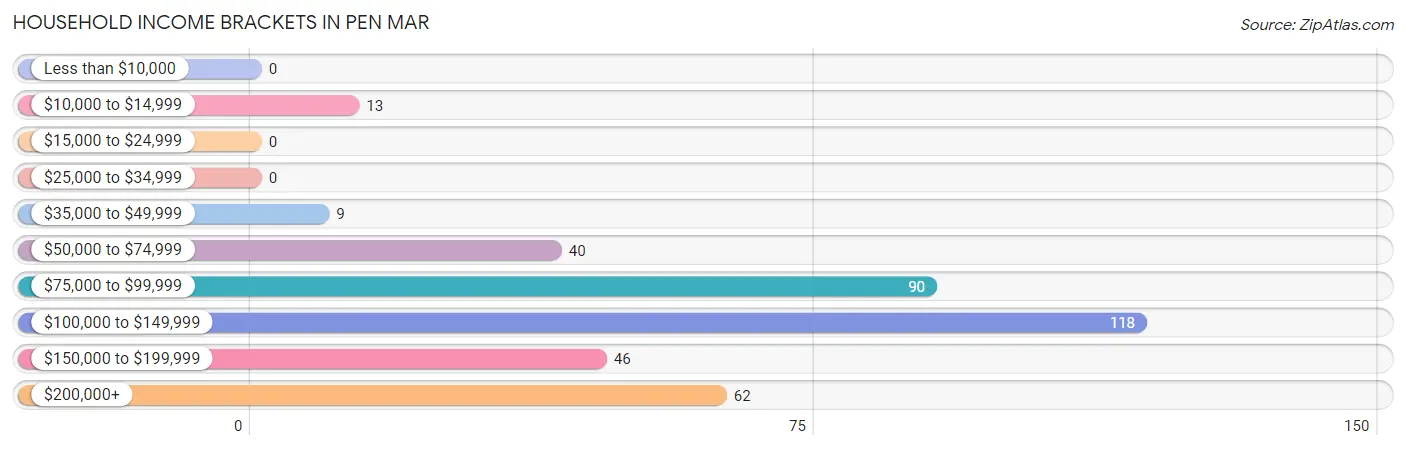
| Income Bracket | # Households | % Households |
| Less than $10,000 | 0 | 0.0% |
| $10,000 to $14,999 | 13 | 3.4% |
| $15,000 to $24,999 | 0 | 0.0% |
| $25,000 to $34,999 | 0 | 0.0% |
| $35,000 to $49,999 | 9 | 2.4% |
| $50,000 to $74,999 | 40 | 10.6% |
| $75,000 to $99,999 | 90 | 23.8% |
| $100,000 to $149,999 | 118 | 31.2% |
| $150,000 to $199,999 | 46 | 12.2% |
| $200,000+ | 62 | 16.4% |
Household Income by Householder Age in Pen Mar
The median household income in Pen Mar is $111,595, with the highest median household income of $126,853 found in the 25 to 44 years age bracket for the primary householder. A total of 159 households (42.1%) fall into this category.
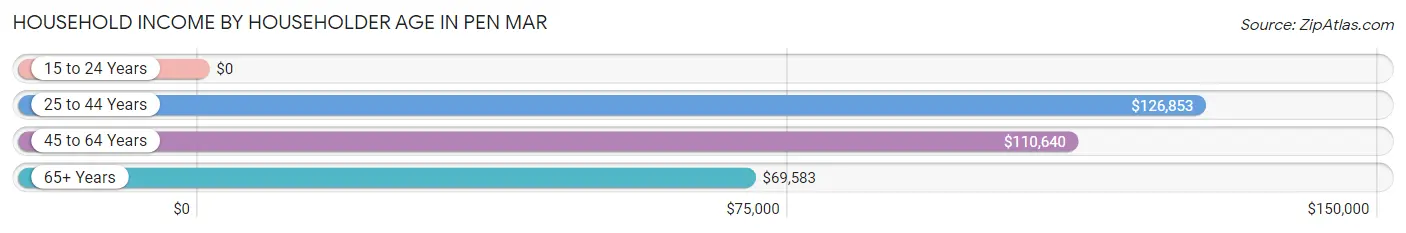
| Income Bracket | # Households | Median Income |
| 15 to 24 Years | 0 (0.0%) | $0 |
| 25 to 44 Years | 159 (42.1%) | $126,853 |
| 45 to 64 Years | 181 (47.9%) | $110,640 |
| 65+ Years | 38 (10.1%) | $69,583 |
| Total | 378 (100.0%) | $111,595 |
Poverty in Pen Mar
Income Below Poverty by Sex and Age in Pen Mar
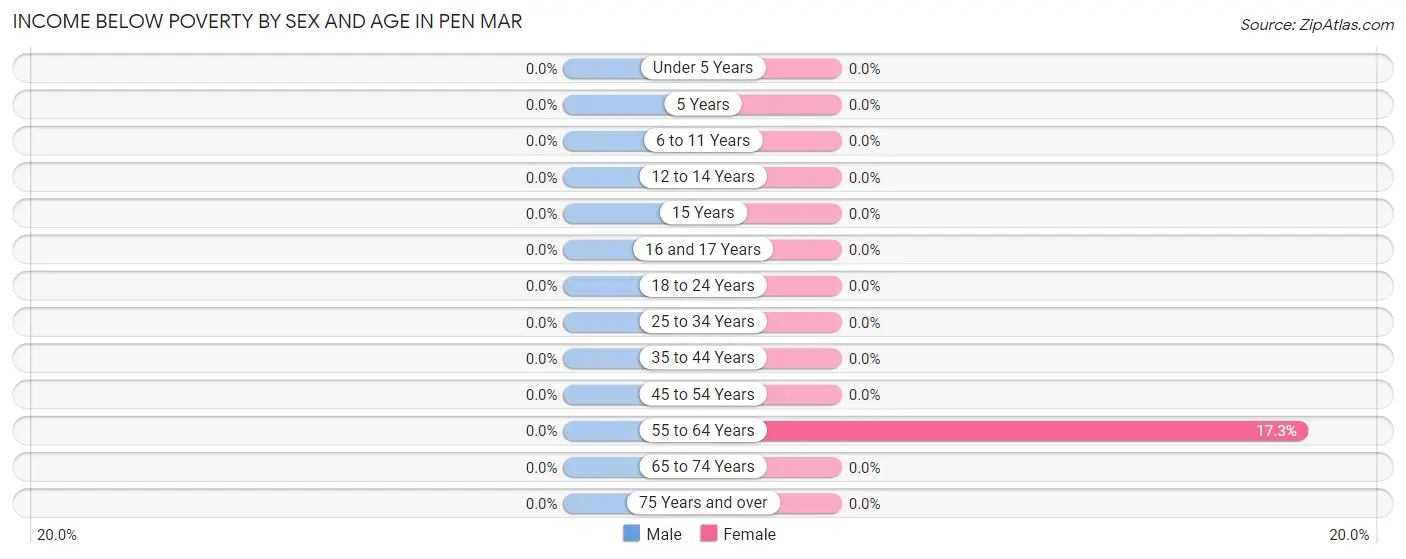
| Age Bracket | Male | Female |
| Under 5 Years | 0 (0.0%) | 0 (0.0%) |
| 5 Years | 0 (0.0%) | 0 (0.0%) |
| 6 to 11 Years | 0 (0.0%) | 0 (0.0%) |
| 12 to 14 Years | 0 (0.0%) | 0 (0.0%) |
| 15 Years | 0 (0.0%) | 0 (0.0%) |
| 16 and 17 Years | 0 (0.0%) | 0 (0.0%) |
| 18 to 24 Years | 0 (0.0%) | 0 (0.0%) |
| 25 to 34 Years | 0 (0.0%) | 0 (0.0%) |
| 35 to 44 Years | 0 (0.0%) | 0 (0.0%) |
| 45 to 54 Years | 0 (0.0%) | 0 (0.0%) |
| 55 to 64 Years | 0 (0.0%) | 13 (17.3%) |
| 65 to 74 Years | 0 (0.0%) | 0 (0.0%) |
| 75 Years and over | 0 (0.0%) | 0 (0.0%) |
| Total | 0 (0.0%) | 13 (1.8%) |
Income Above Poverty by Sex and Age in Pen Mar
According to the poverty statistics in Pen Mar, males aged under 5 years and females aged under 5 years are the age groups that are most secure financially, with 100.0% of males and 100.0% of females in these age groups living above the poverty line.
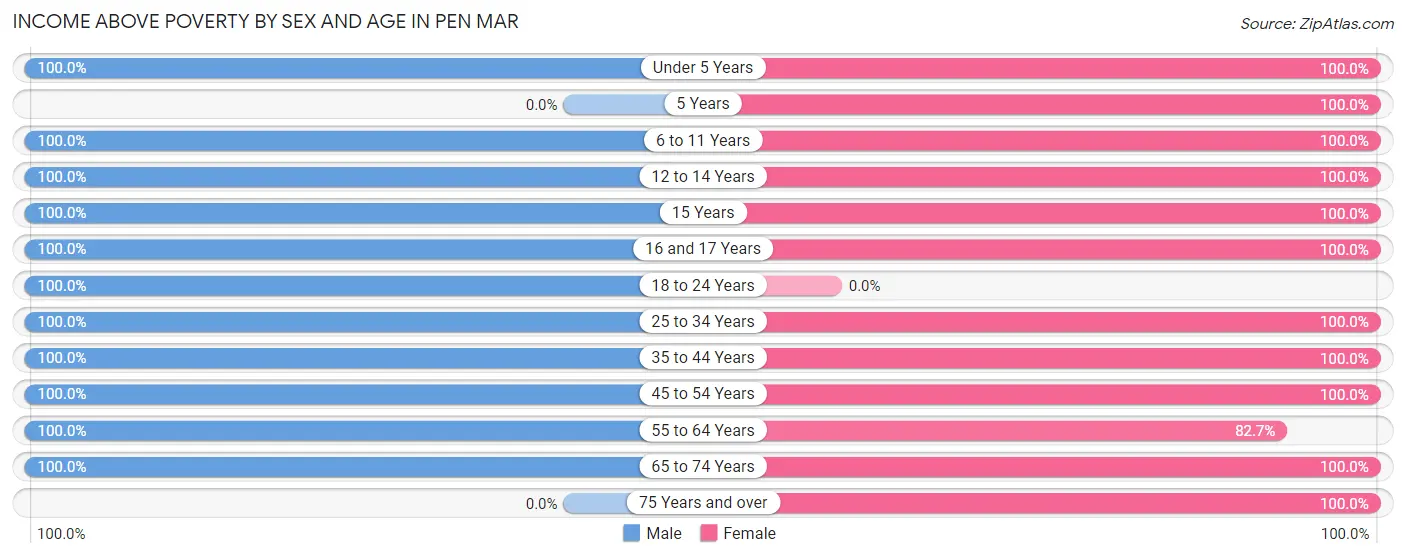
| Age Bracket | Male | Female |
| Under 5 Years | 22 (100.0%) | 86 (100.0%) |
| 5 Years | 0 (0.0%) | 15 (100.0%) |
| 6 to 11 Years | 50 (100.0%) | 101 (100.0%) |
| 12 to 14 Years | 10 (100.0%) | 63 (100.0%) |
| 15 Years | 14 (100.0%) | 50 (100.0%) |
| 16 and 17 Years | 9 (100.0%) | 13 (100.0%) |
| 18 to 24 Years | 12 (100.0%) | 0 (0.0%) |
| 25 to 34 Years | 30 (100.0%) | 41 (100.0%) |
| 35 to 44 Years | 150 (100.0%) | 147 (100.0%) |
| 45 to 54 Years | 110 (100.0%) | 75 (100.0%) |
| 55 to 64 Years | 32 (100.0%) | 62 (82.7%) |
| 65 to 74 Years | 29 (100.0%) | 33 (100.0%) |
| 75 Years and over | 0 (0.0%) | 10 (100.0%) |
| Total | 468 (100.0%) | 696 (98.2%) |
Income Below Poverty Among Married-Couple Families in Pen Mar
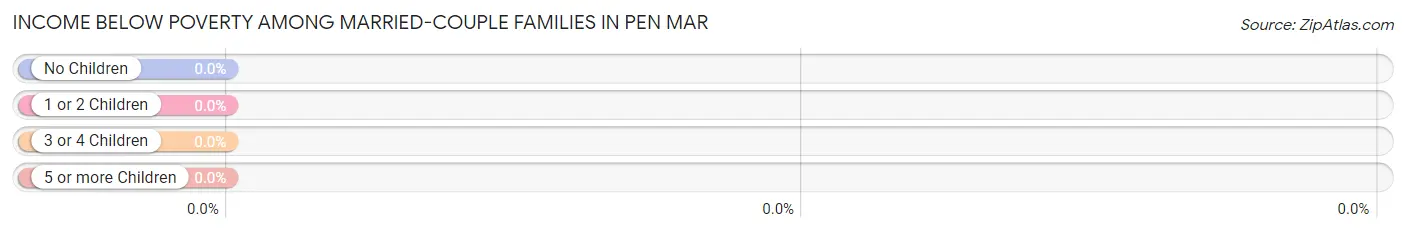
| Children | Above Poverty | Below Poverty |
| No Children | 127 (100.0%) | 0 (0.0%) |
| 1 or 2 Children | 98 (100.0%) | 0 (0.0%) |
| 3 or 4 Children | 72 (100.0%) | 0 (0.0%) |
| 5 or more Children | 17 (100.0%) | 0 (0.0%) |
| Total | 314 (100.0%) | 0 (0.0%) |
Income Below Poverty Among Single-Parent Households in Pen Mar
| Children | Single Father | Single Mother |
| No Children | 0 (0.0%) | 0 (0.0%) |
| 1 or 2 Children | 0 (0.0%) | 0 (0.0%) |
| 3 or 4 Children | 0 (0.0%) | 0 (0.0%) |
| 5 or more Children | 0 (0.0%) | 0 (0.0%) |
| Total | 0 (0.0%) | 0 (0.0%) |
Income Below Poverty Among Married-Couple vs Single-Parent Households in Pen Mar
| Children | Married-Couple Families | Single-Parent Households |
| No Children | 0 (0.0%) | 0 (0.0%) |
| 1 or 2 Children | 0 (0.0%) | 0 (0.0%) |
| 3 or 4 Children | 0 (0.0%) | 0 (0.0%) |
| 5 or more Children | 0 (0.0%) | 0 (0.0%) |
| Total | 0 (0.0%) | 0 (0.0%) |
Race in Pen Mar
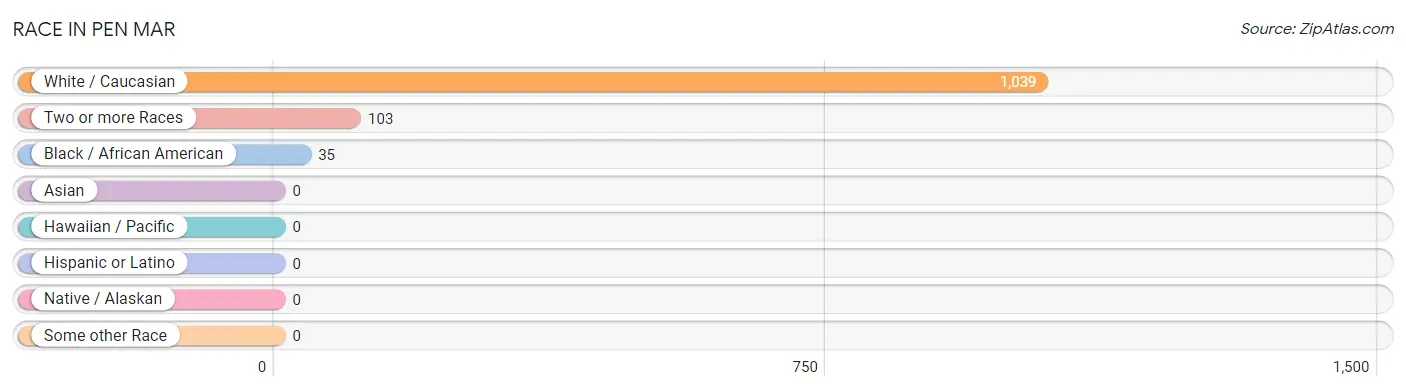
The most populous races in Pen Mar are White / Caucasian (1,039 | 88.3%), Two or more Races (103 | 8.7%), and Black / African American (35 | 3.0%).
| Race | # Population | % Population |
| Asian | 0 | 0.0% |
| Black / African American | 35 | 3.0% |
| Hawaiian / Pacific | 0 | 0.0% |
| Hispanic or Latino | 0 | 0.0% |
| Native / Alaskan | 0 | 0.0% |
| White / Caucasian | 1,039 | 88.3% |
| Two or more Races | 103 | 8.7% |
| Some other Race | 0 | 0.0% |
| Total | 1,177 | 100.0% |
Ancestry in Pen Mar
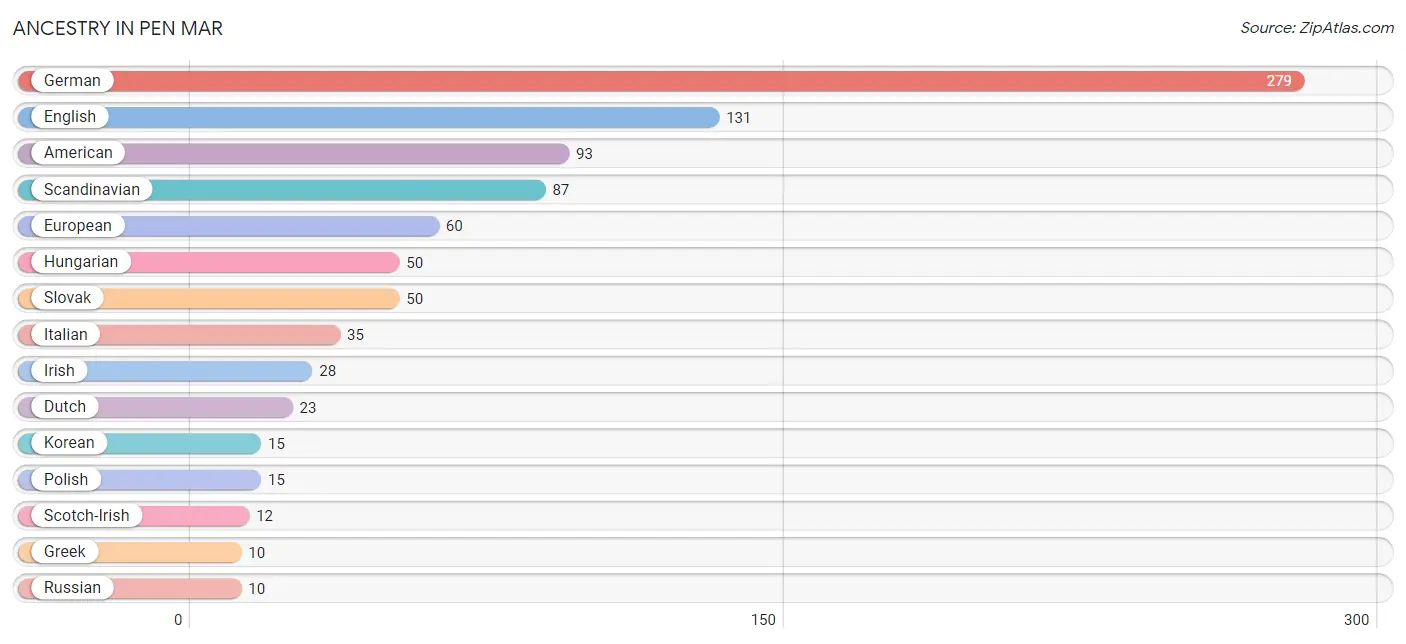
The most populous ancestries reported in Pen Mar are German (279 | 23.7%), English (131 | 11.1%), American (93 | 7.9%), Scandinavian (87 | 7.4%), and European (60 | 5.1%), together accounting for 55.2% of all Pen Mar residents.
| Ancestry | # Population | % Population |
| American | 93 | 7.9% |
| Dutch | 23 | 1.9% |
| English | 131 | 11.1% |
| European | 60 | 5.1% |
| French | 8 | 0.7% |
| French Canadian | 8 | 0.7% |
| German | 279 | 23.7% |
| Greek | 10 | 0.9% |
| Hungarian | 50 | 4.3% |
| Irish | 28 | 2.4% |
| Italian | 35 | 3.0% |
| Korean | 15 | 1.3% |
| Polish | 15 | 1.3% |
| Russian | 10 | 0.9% |
| Scandinavian | 87 | 7.4% |
| Scotch-Irish | 12 | 1.0% |
| Slovak | 50 | 4.3% | View All 17 Rows |
Immigrants in Pen Mar

| Immigration Origin | # Population | % Population | View All 0 Rows |
Sex and Age in Pen Mar
Sex and Age in Pen Mar
The most populous age groups in Pen Mar are 35 to 39 Years (119 | 25.4%) for men and 35 to 39 Years (137 | 19.3%) for women.
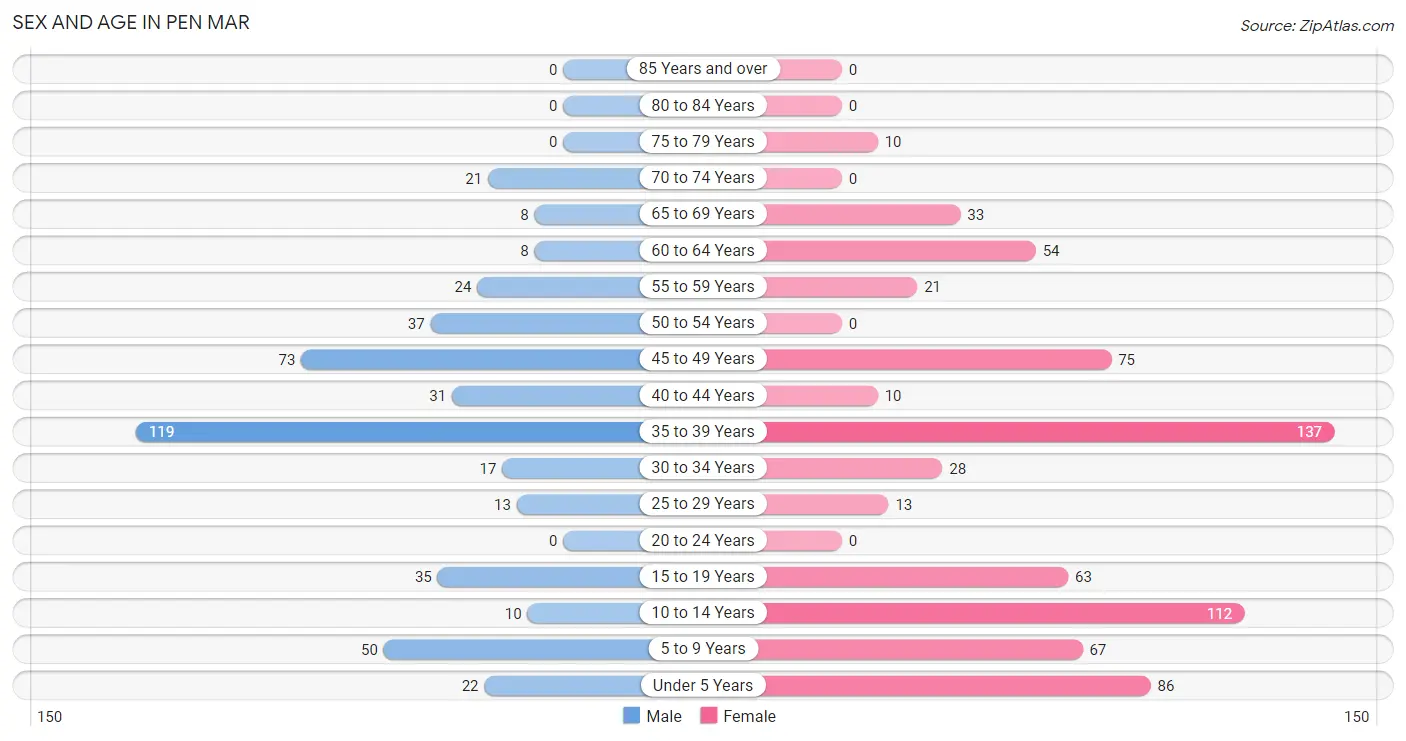
| Age Bracket | Male | Female |
| Under 5 Years | 22 (4.7%) | 86 (12.1%) |
| 5 to 9 Years | 50 (10.7%) | 67 (9.5%) |
| 10 to 14 Years | 10 (2.1%) | 112 (15.8%) |
| 15 to 19 Years | 35 (7.5%) | 63 (8.9%) |
| 20 to 24 Years | 0 (0.0%) | 0 (0.0%) |
| 25 to 29 Years | 13 (2.8%) | 13 (1.8%) |
| 30 to 34 Years | 17 (3.6%) | 28 (4.0%) |
| 35 to 39 Years | 119 (25.4%) | 137 (19.3%) |
| 40 to 44 Years | 31 (6.6%) | 10 (1.4%) |
| 45 to 49 Years | 73 (15.6%) | 75 (10.6%) |
| 50 to 54 Years | 37 (7.9%) | 0 (0.0%) |
| 55 to 59 Years | 24 (5.1%) | 21 (3.0%) |
| 60 to 64 Years | 8 (1.7%) | 54 (7.6%) |
| 65 to 69 Years | 8 (1.7%) | 33 (4.6%) |
| 70 to 74 Years | 21 (4.5%) | 0 (0.0%) |
| 75 to 79 Years | 0 (0.0%) | 10 (1.4%) |
| 80 to 84 Years | 0 (0.0%) | 0 (0.0%) |
| 85 Years and over | 0 (0.0%) | 0 (0.0%) |
| Total | 468 (100.0%) | 709 (100.0%) |
Families and Households in Pen Mar
Median Family Size in Pen Mar
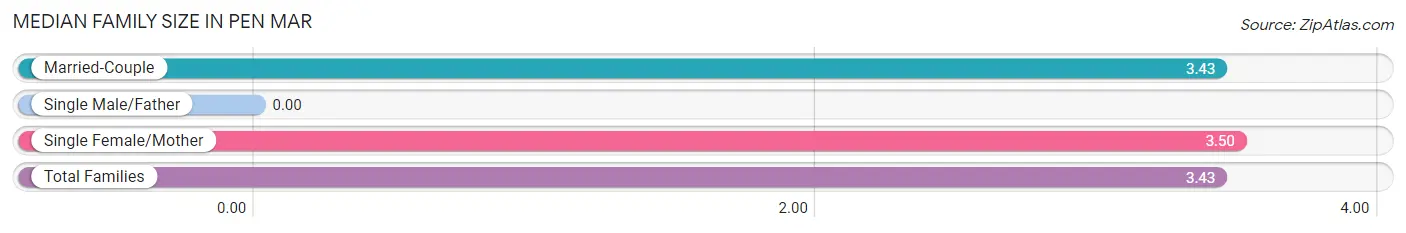
| Family Type | # Families | Family Size |
| Married-Couple | 314 (96.9%) | 3.43 |
| Single Male/Father | 0 (0.0%) | - |
| Single Female/Mother | 10 (3.1%) | 3.50 |
| Total Families | 324 (100.0%) | 3.43 |
Median Household Size in Pen Mar
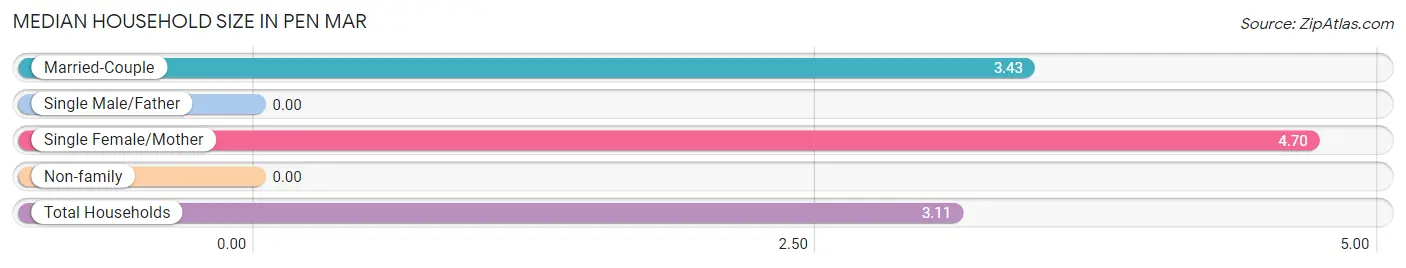
| Household Type | # Households | Household Size |
| Married-Couple | 314 (83.1%) | 3.43 |
| Single Male/Father | 0 (0.0%) | - |
| Single Female/Mother | 10 (2.6%) | 4.70 |
| Non-family | 54 (14.3%) | - |
| Total Households | 378 (100.0%) | 3.11 |
Household Size by Marriage Status in Pen Mar
Out of a total of 378 households in Pen Mar, 324 (85.7%) are family households, while 54 (14.3%) are nonfamily households. The most numerous type of family households are 2-person households, comprising 127, and the most common type of nonfamily households are 1-person households, comprising 54.
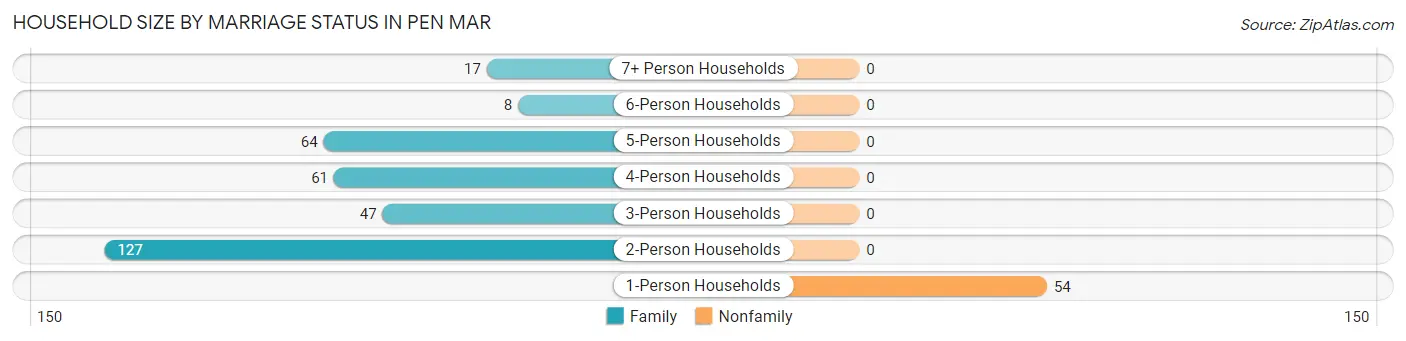
| Household Size | Family Households | Nonfamily Households |
| 1-Person Households | - | 54 (14.3%) |
| 2-Person Households | 127 (33.6%) | 0 (0.0%) |
| 3-Person Households | 47 (12.4%) | 0 (0.0%) |
| 4-Person Households | 61 (16.1%) | 0 (0.0%) |
| 5-Person Households | 64 (16.9%) | 0 (0.0%) |
| 6-Person Households | 8 (2.1%) | 0 (0.0%) |
| 7+ Person Households | 17 (4.5%) | 0 (0.0%) |
| Total | 324 (85.7%) | 54 (14.3%) |
Female Fertility in Pen Mar
Fertility by Age in Pen Mar
| Age Bracket | Women with Births | Births / 1,000 Women |
| 15 to 19 years | 0 (0.0%) | 0.0 |
| 20 to 34 years | 0 (0.0%) | 0.0 |
| 35 to 50 years | 0 (0.0%) | 0.0 |
| Total | 0 (0.0%) | 0.0 |
Fertility by Age by Marriage Status in Pen Mar
| Age Bracket | Married | Unmarried |
| 15 to 19 years | 0 (0.0%) | 0 (0.0%) |
| 20 to 34 years | 0 (0.0%) | 0 (0.0%) |
| 35 to 50 years | 0 (0.0%) | 0 (0.0%) |
| Total | 0 (0.0%) | 0 (0.0%) |
Fertility by Education in Pen Mar
| Educational Attainment | Women with Births | Births / 1,000 Women |
| Less than High School | 0 (0.0%) | 0.0 |
| High School Diploma | 0 (0.0%) | 0.0 |
| College or Associate's Degree | 0 (0.0%) | 0.0 |
| Bachelor's Degree | 0 (0.0%) | 0.0 |
| Graduate Degree | 0 (0.0%) | 0.0 |
| Total | 0 (0.0%) | 0.0 |
Fertility by Education by Marriage Status in Pen Mar
| Educational Attainment | Married | Unmarried |
| Less than High School | 0 (0.0%) | 0 (0.0%) |
| High School Diploma | 0 (0.0%) | 0 (0.0%) |
| College or Associate's Degree | 0 (0.0%) | 0 (0.0%) |
| Bachelor's Degree | 0 (0.0%) | 0 (0.0%) |
| Graduate Degree | 0 (0.0%) | 0 (0.0%) |
| Total | 0 (0.0%) | 0 (0.0%) |
Employment Characteristics in Pen Mar
Employment by Class of Employer in Pen Mar
Among the 629 employed individuals in Pen Mar, private company employees (329 | 52.3%), local government employees (113 | 18.0%), and not-for-profit organizations (59 | 9.4%) make up the most common classes of employment.
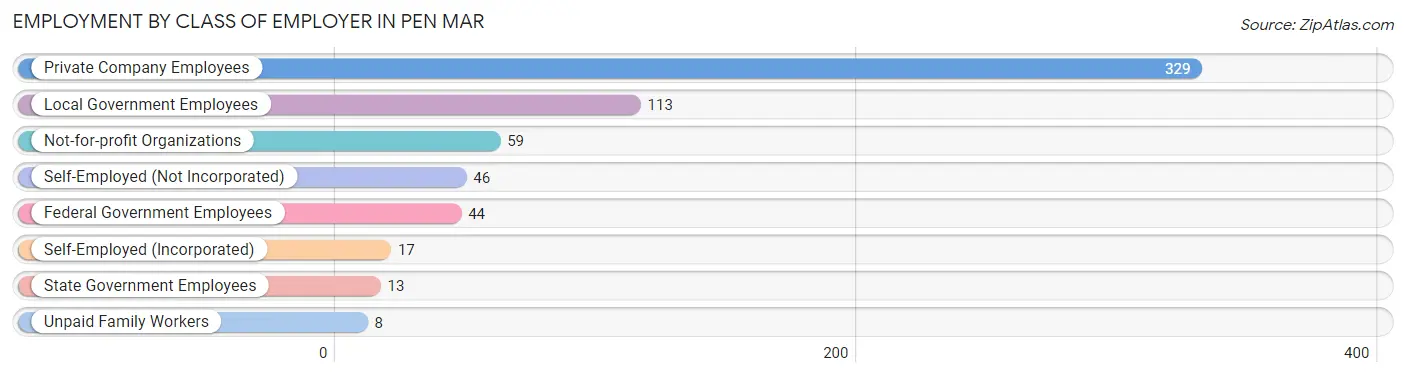
| Employer Class | # Employees | % Employees |
| Private Company Employees | 329 | 52.3% |
| Self-Employed (Incorporated) | 17 | 2.7% |
| Self-Employed (Not Incorporated) | 46 | 7.3% |
| Not-for-profit Organizations | 59 | 9.4% |
| Local Government Employees | 113 | 18.0% |
| State Government Employees | 13 | 2.1% |
| Federal Government Employees | 44 | 7.0% |
| Unpaid Family Workers | 8 | 1.3% |
| Total | 629 | 100.0% |
Employment Status by Age in Pen Mar
According to the labor force statistics for Pen Mar, out of the total population over 16 years of age (766), 85.1% or 652 individuals are in the labor force, with 3.5% or 23 of them unemployed. The age group with the highest labor force participation rate is 16 to 19 years, with 100.0% or 34 individuals in the labor force. Within the labor force, the 60 to 64 years age range has the highest percentage of unemployed individuals, with 24.1% or 13 of them being unemployed.
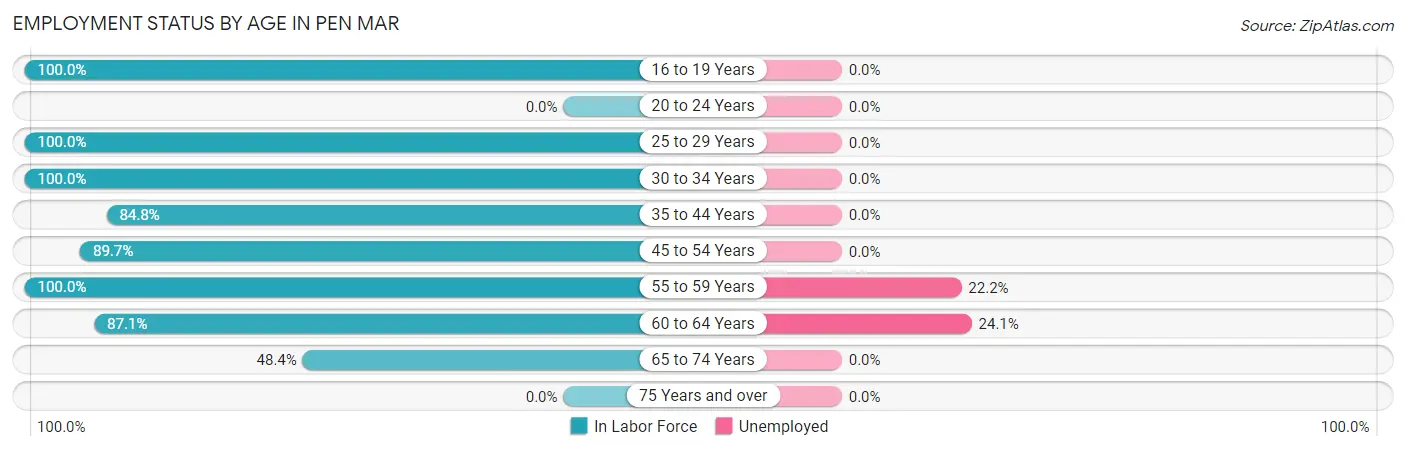
| Age Bracket | In Labor Force | Unemployed |
| 16 to 19 Years | 34 (100.0%) | 0 (0.0%) |
| 20 to 24 Years | 0 (0.0%) | 0 (0.0%) |
| 25 to 29 Years | 26 (100.0%) | 0 (0.0%) |
| 30 to 34 Years | 45 (100.0%) | 0 (0.0%) |
| 35 to 44 Years | 252 (84.8%) | 0 (0.0%) |
| 45 to 54 Years | 166 (89.7%) | 0 (0.0%) |
| 55 to 59 Years | 45 (100.0%) | 10 (22.2%) |
| 60 to 64 Years | 54 (87.1%) | 13 (24.1%) |
| 65 to 74 Years | 30 (48.4%) | 0 (0.0%) |
| 75 Years and over | 0 (0.0%) | 0 (0.0%) |
| Total | 652 (85.1%) | 23 (3.5%) |
Employment Status by Educational Attainment in Pen Mar
According to labor force statistics for Pen Mar, 89.1% of individuals (588) out of the total population between 25 and 64 years of age (660) are in the labor force, with 3.9% or 23 of them being unemployed. The group with the highest labor force participation rate are those with the educational attainment of high school diploma, with 100.0% or 156 individuals in the labor force. Within the labor force, individuals with less than high school education have the highest percentage of unemployment, with 14.1% or 10 of them being unemployed.
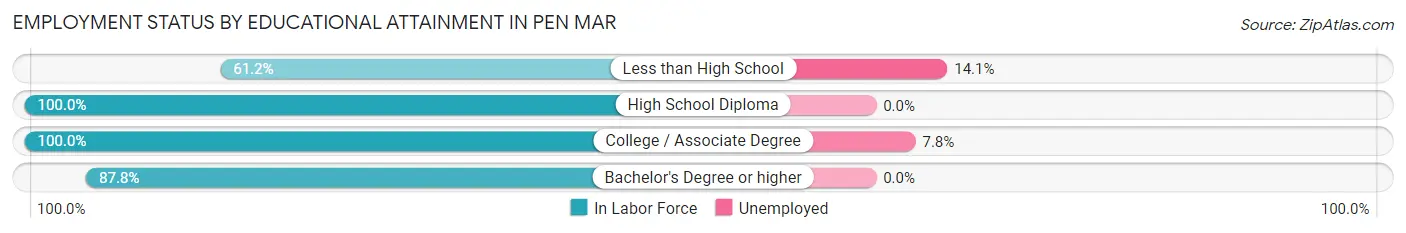
| Educational Attainment | In Labor Force | Unemployed |
| Less than High School | 71 (61.2%) | 16 (14.1%) |
| High School Diploma | 156 (100.0%) | 0 (0.0%) |
| College / Associate Degree | 167 (100.0%) | 13 (7.8%) |
| Bachelor's Degree or higher | 194 (87.8%) | 0 (0.0%) |
| Total | 588 (89.1%) | 26 (3.9%) |
Employment Occupations by Sex in Pen Mar
Management, Business, Science and Arts Occupations
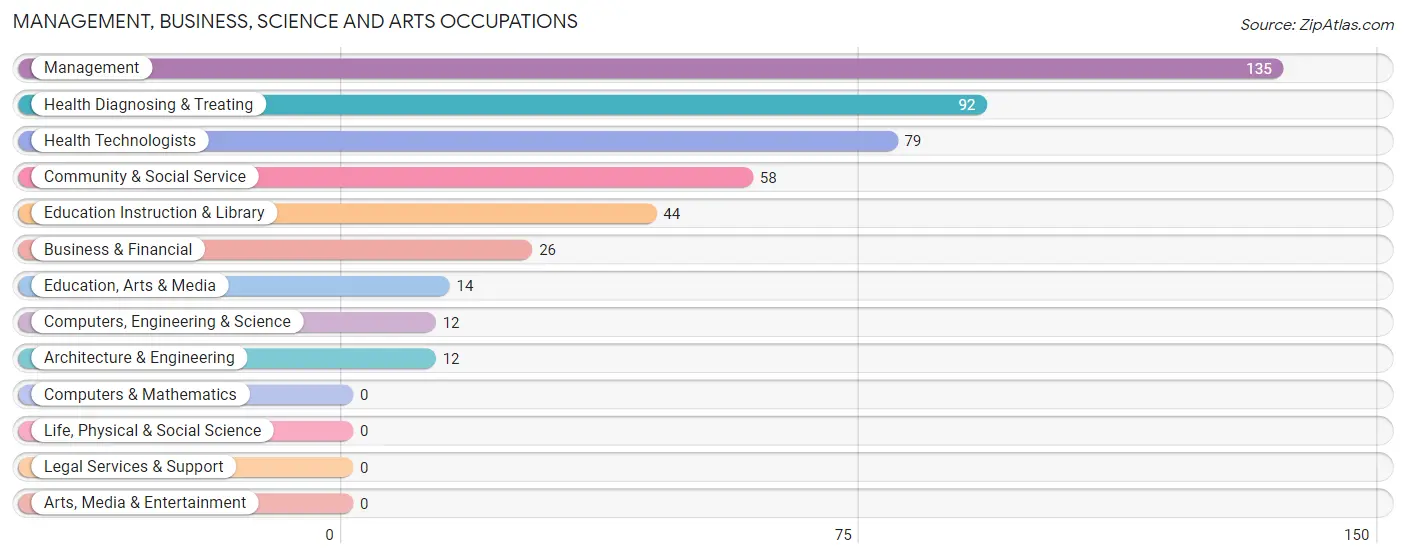
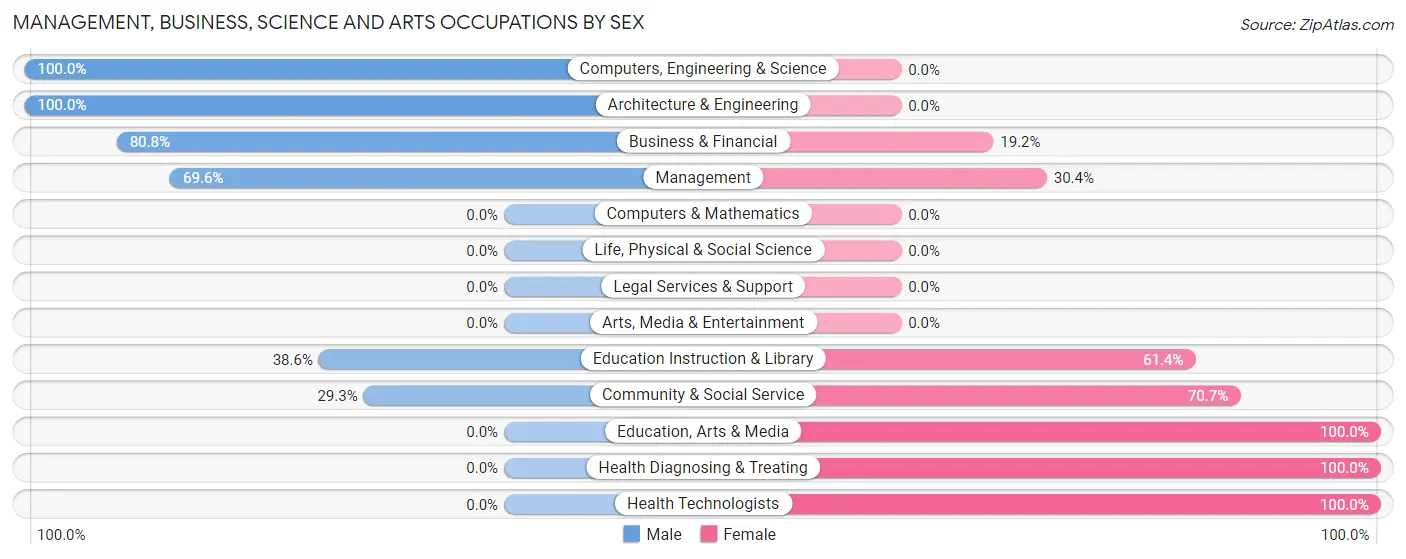
The most common Management, Business, Science and Arts occupations in Pen Mar are Management (135 | 21.5%), Health Diagnosing & Treating (92 | 14.6%), Health Technologists (79 | 12.6%), Community & Social Service (58 | 9.2%), and Education Instruction & Library (44 | 7.0%).
Management, Business, Science and Arts Occupations by Sex
Within the Management, Business, Science and Arts occupations in Pen Mar, the most male-oriented occupations are Computers, Engineering & Science (100.0%), Architecture & Engineering (100.0%), and Business & Financial (80.8%), while the most female-oriented occupations are Education, Arts & Media (100.0%), Health Diagnosing & Treating (100.0%), and Health Technologists (100.0%).
| Occupation | Male | Female |
| Management | 94 (69.6%) | 41 (30.4%) |
| Business & Financial | 21 (80.8%) | 5 (19.2%) |
| Computers, Engineering & Science | 12 (100.0%) | 0 (0.0%) |
| Computers & Mathematics | 0 (0.0%) | 0 (0.0%) |
| Architecture & Engineering | 12 (100.0%) | 0 (0.0%) |
| Life, Physical & Social Science | 0 (0.0%) | 0 (0.0%) |
| Community & Social Service | 17 (29.3%) | 41 (70.7%) |
| Education, Arts & Media | 0 (0.0%) | 14 (100.0%) |
| Legal Services & Support | 0 (0.0%) | 0 (0.0%) |
| Education Instruction & Library | 17 (38.6%) | 27 (61.4%) |
| Arts, Media & Entertainment | 0 (0.0%) | 0 (0.0%) |
| Health Diagnosing & Treating | 0 (0.0%) | 92 (100.0%) |
| Health Technologists | 0 (0.0%) | 79 (100.0%) |
| Total (Category) | 144 (44.6%) | 179 (55.4%) |
| Total (Overall) | 337 (53.6%) | 292 (46.4%) |
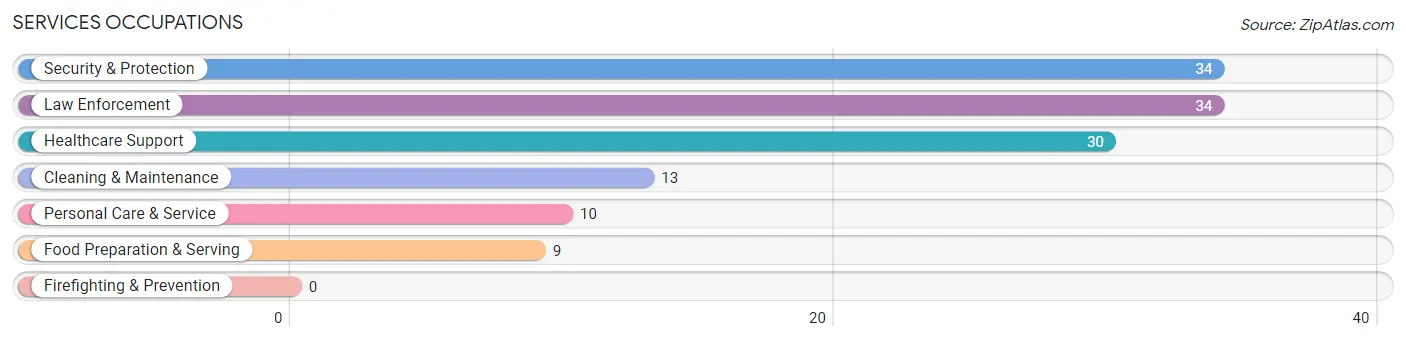
Services Occupations
The most common Services occupations in Pen Mar are Security & Protection (34 | 5.4%), Law Enforcement (34 | 5.4%), Healthcare Support (30 | 4.8%), Cleaning & Maintenance (13 | 2.1%), and Personal Care & Service (10 | 1.6%).
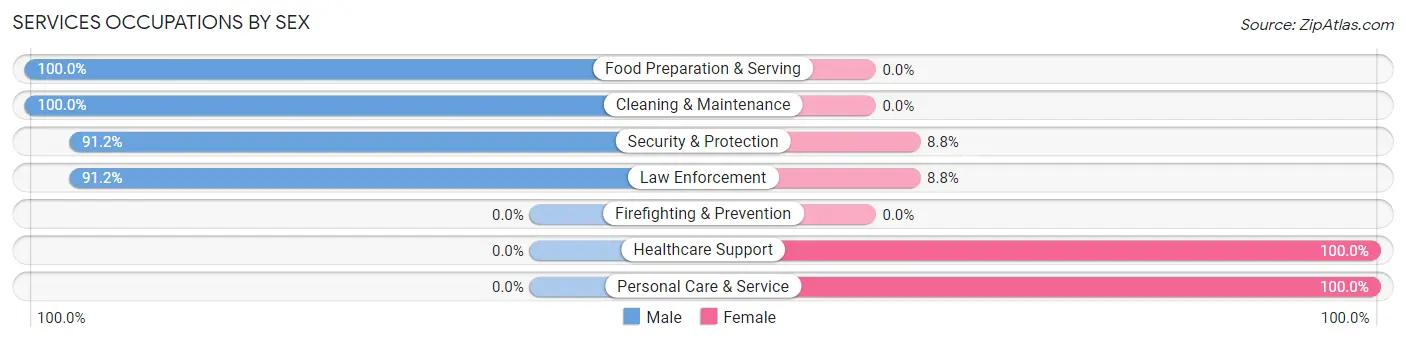
Services Occupations by Sex
Within the Services occupations in Pen Mar, the most male-oriented occupations are Food Preparation & Serving (100.0%), Cleaning & Maintenance (100.0%), and Security & Protection (91.2%), while the most female-oriented occupations are Healthcare Support (100.0%), Personal Care & Service (100.0%), and Security & Protection (8.8%).
| Occupation | Male | Female |
| Healthcare Support | 0 (0.0%) | 30 (100.0%) |
| Security & Protection | 31 (91.2%) | 3 (8.8%) |
| Firefighting & Prevention | 0 (0.0%) | 0 (0.0%) |
| Law Enforcement | 31 (91.2%) | 3 (8.8%) |
| Food Preparation & Serving | 9 (100.0%) | 0 (0.0%) |
| Cleaning & Maintenance | 13 (100.0%) | 0 (0.0%) |
| Personal Care & Service | 0 (0.0%) | 10 (100.0%) |
| Total (Category) | 53 (55.2%) | 43 (44.8%) |
| Total (Overall) | 337 (53.6%) | 292 (46.4%) |
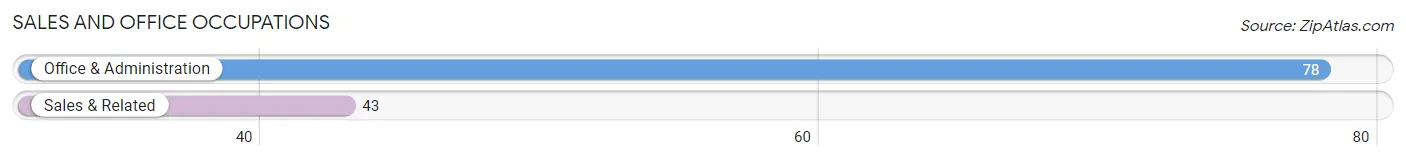
Sales and Office Occupations
The most common Sales and Office occupations in Pen Mar are Office & Administration (78 | 12.4%), and Sales & Related (43 | 6.8%).
Sales and Office Occupations by Sex
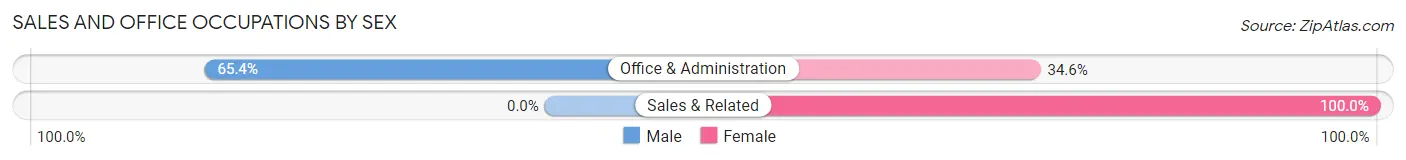
| Occupation | Male | Female |
| Sales & Related | 0 (0.0%) | 43 (100.0%) |
| Office & Administration | 51 (65.4%) | 27 (34.6%) |
| Total (Category) | 51 (42.1%) | 70 (57.9%) |
| Total (Overall) | 337 (53.6%) | 292 (46.4%) |
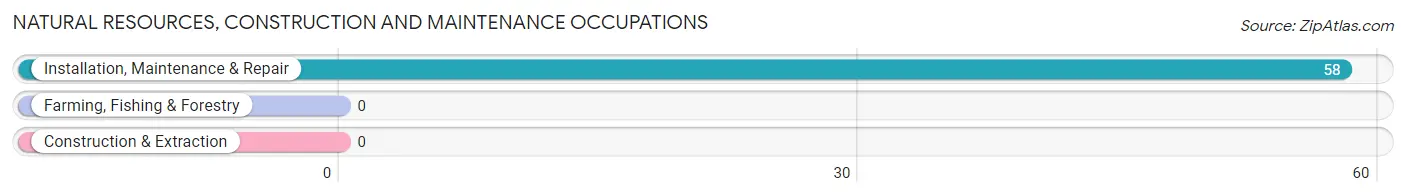
Natural Resources, Construction and Maintenance Occupations
The most common Natural Resources, Construction and Maintenance occupations in Pen Mar are , and Installation, Maintenance & Repair (58 | 9.2%).
Natural Resources, Construction and Maintenance Occupations by Sex
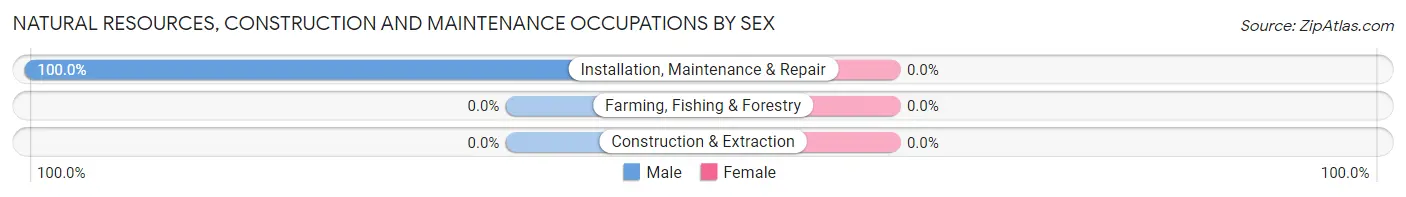
| Occupation | Male | Female |
| Farming, Fishing & Forestry | 0 (0.0%) | 0 (0.0%) |
| Construction & Extraction | 0 (0.0%) | 0 (0.0%) |
| Installation, Maintenance & Repair | 58 (100.0%) | 0 (0.0%) |
| Total (Category) | 58 (100.0%) | 0 (0.0%) |
| Total (Overall) | 337 (53.6%) | 292 (46.4%) |
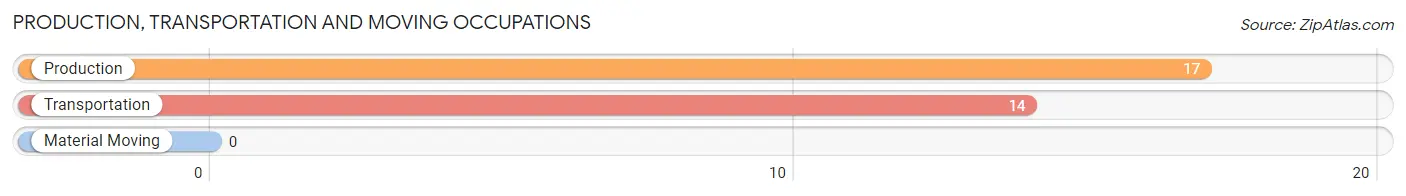
Production, Transportation and Moving Occupations
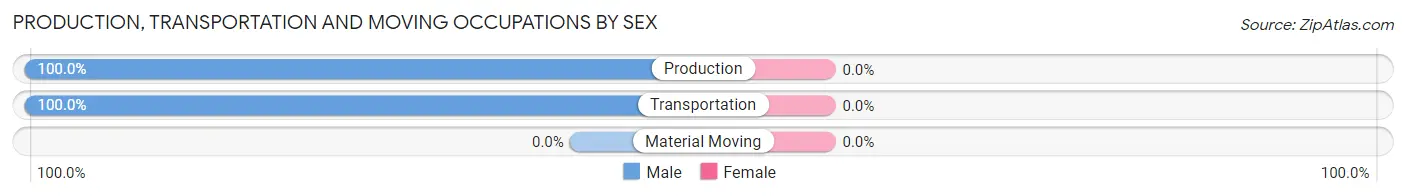
The most common Production, Transportation and Moving occupations in Pen Mar are Production (17 | 2.7%), and Transportation (14 | 2.2%).
Production, Transportation and Moving Occupations by Sex
| Occupation | Male | Female |
| Production | 17 (100.0%) | 0 (0.0%) |
| Transportation | 14 (100.0%) | 0 (0.0%) |
| Material Moving | 0 (0.0%) | 0 (0.0%) |
| Total (Category) | 31 (100.0%) | 0 (0.0%) |
| Total (Overall) | 337 (53.6%) | 292 (46.4%) |
Employment Industries by Sex in Pen Mar
Employment Industries in Pen Mar
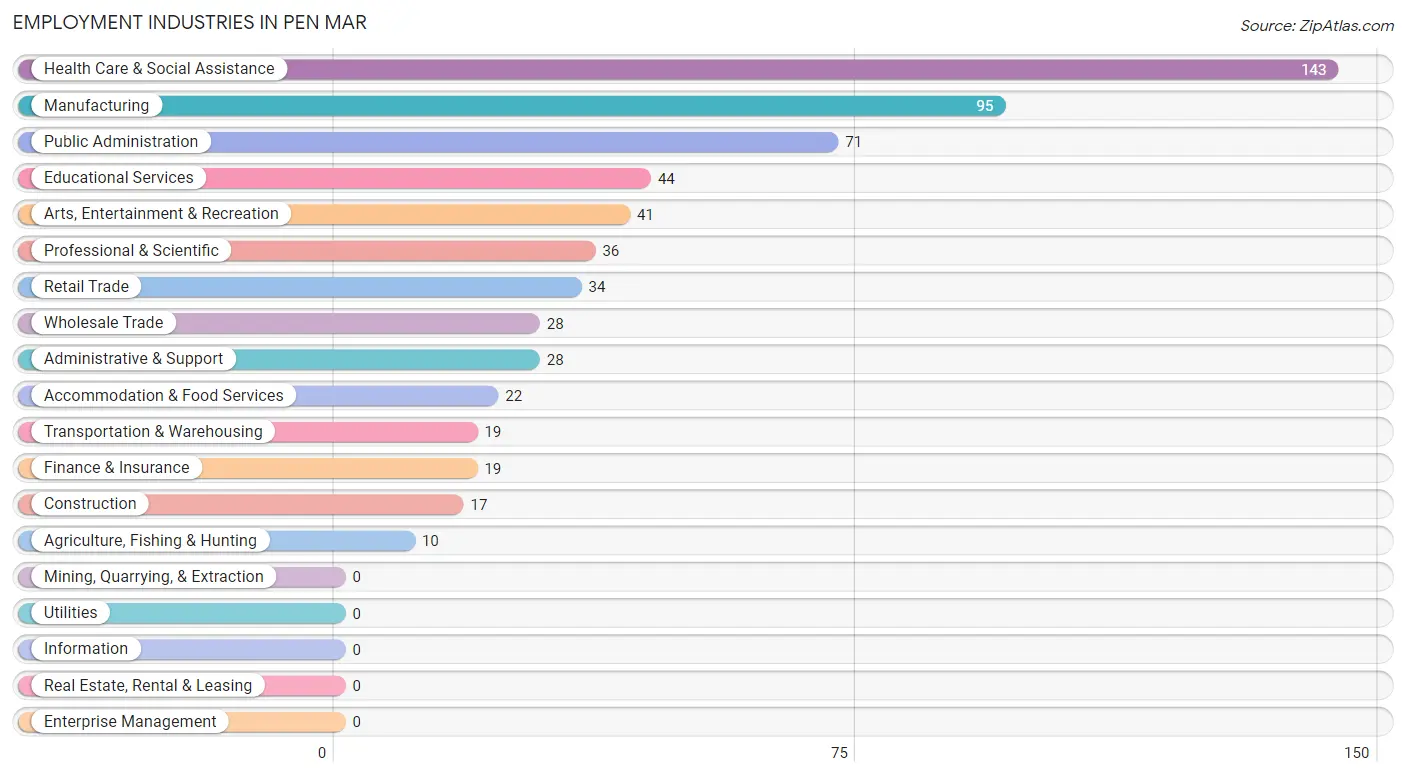
The major employment industries in Pen Mar include Health Care & Social Assistance (143 | 22.7%), Manufacturing (95 | 15.1%), Public Administration (71 | 11.3%), Educational Services (44 | 7.0%), and Arts, Entertainment & Recreation (41 | 6.5%).
Employment Industries by Sex in Pen Mar
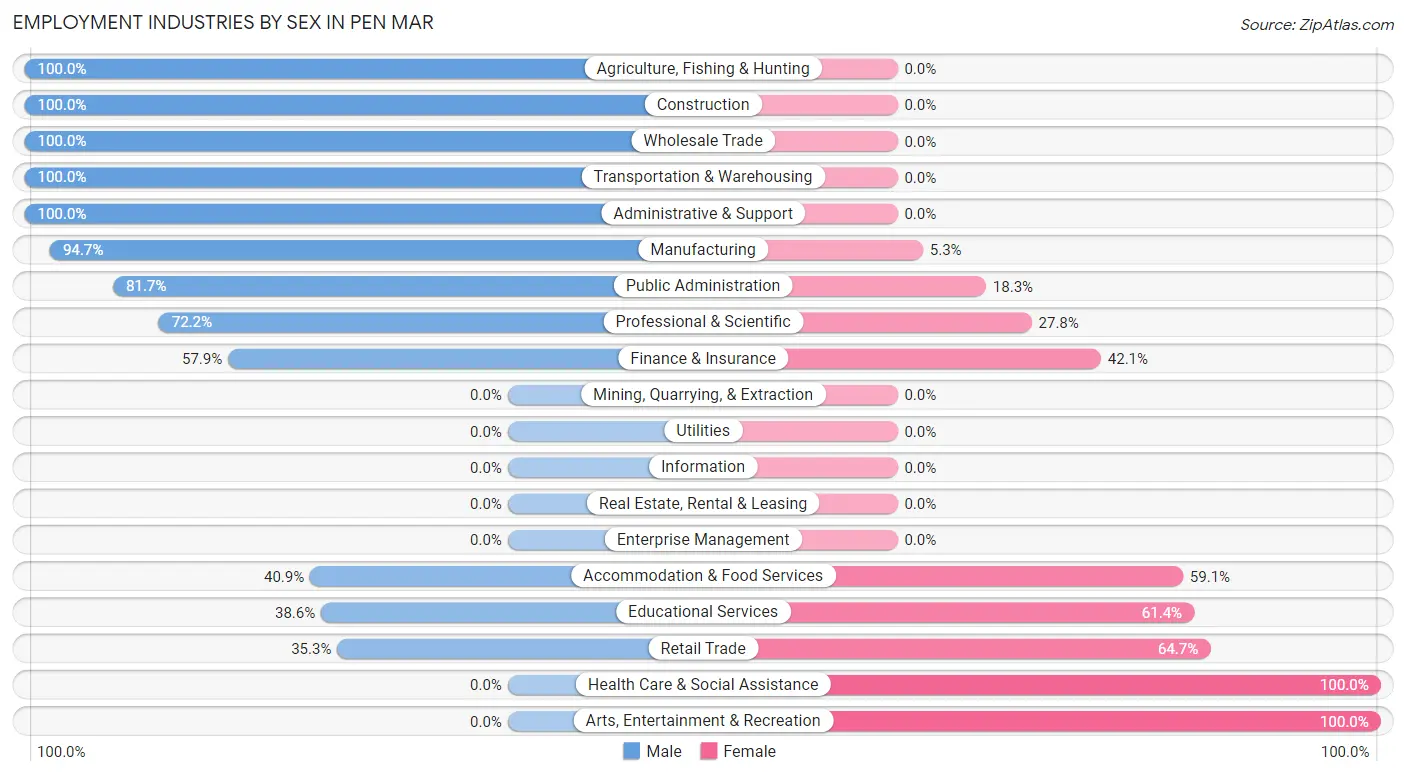
The Pen Mar industries that see more men than women are Agriculture, Fishing & Hunting (100.0%), Construction (100.0%), and Wholesale Trade (100.0%), whereas the industries that tend to have a higher number of women are Health Care & Social Assistance (100.0%), Arts, Entertainment & Recreation (100.0%), and Retail Trade (64.7%).
| Industry | Male | Female |
| Agriculture, Fishing & Hunting | 10 (100.0%) | 0 (0.0%) |
| Mining, Quarrying, & Extraction | 0 (0.0%) | 0 (0.0%) |
| Construction | 17 (100.0%) | 0 (0.0%) |
| Manufacturing | 90 (94.7%) | 5 (5.3%) |
| Wholesale Trade | 28 (100.0%) | 0 (0.0%) |
| Retail Trade | 12 (35.3%) | 22 (64.7%) |
| Transportation & Warehousing | 19 (100.0%) | 0 (0.0%) |
| Utilities | 0 (0.0%) | 0 (0.0%) |
| Information | 0 (0.0%) | 0 (0.0%) |
| Finance & Insurance | 11 (57.9%) | 8 (42.1%) |
| Real Estate, Rental & Leasing | 0 (0.0%) | 0 (0.0%) |
| Professional & Scientific | 26 (72.2%) | 10 (27.8%) |
| Enterprise Management | 0 (0.0%) | 0 (0.0%) |
| Administrative & Support | 28 (100.0%) | 0 (0.0%) |
| Educational Services | 17 (38.6%) | 27 (61.4%) |
| Health Care & Social Assistance | 0 (0.0%) | 143 (100.0%) |
| Arts, Entertainment & Recreation | 0 (0.0%) | 41 (100.0%) |
| Accommodation & Food Services | 9 (40.9%) | 13 (59.1%) |
| Public Administration | 58 (81.7%) | 13 (18.3%) |
| Total | 337 (53.6%) | 292 (46.4%) |
Education in Pen Mar
School Enrollment in Pen Mar
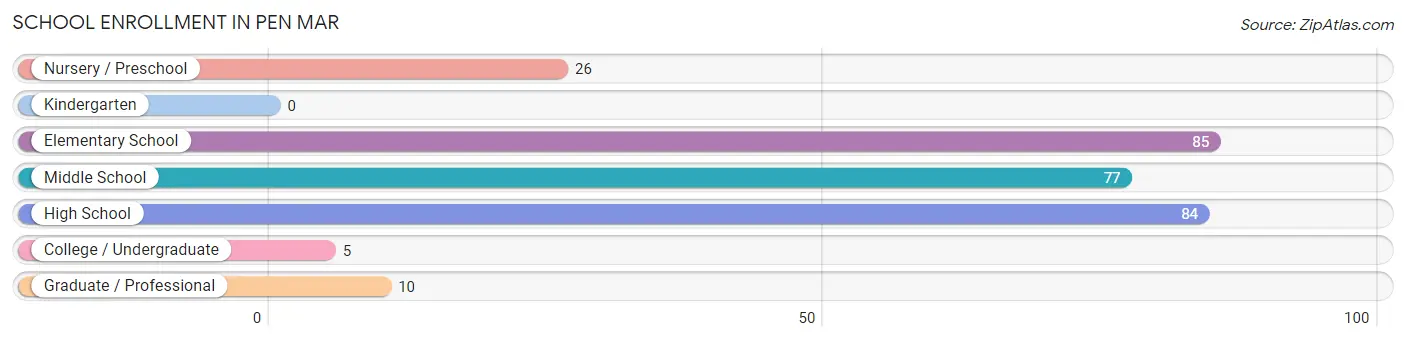
The most common levels of schooling among the 287 students in Pen Mar are elementary school (85 | 29.6%), high school (84 | 29.3%), and middle school (77 | 26.8%).
| School Level | # Students | % Students |
| Nursery / Preschool | 26 | 9.1% |
| Kindergarten | 0 | 0.0% |
| Elementary School | 85 | 29.6% |
| Middle School | 77 | 26.8% |
| High School | 84 | 29.3% |
| College / Undergraduate | 5 | 1.7% |
| Graduate / Professional | 10 | 3.5% |
| Total | 287 | 100.0% |
School Enrollment by Age by Funding Source in Pen Mar
Out of a total of 287 students who are enrolled in schools in Pen Mar, 20 (7.0%) attend a private institution, while the remaining 267 (93.0%) are enrolled in public schools. The age group of 25 to 34 year olds has the highest likelihood of being enrolled in private schools, with 10 (100.0% in the age bracket) enrolled. Conversely, the age group of 3 to 4 year olds has the lowest likelihood of being enrolled in a private school, with 11 (100.0% in the age bracket) attending a public institution.
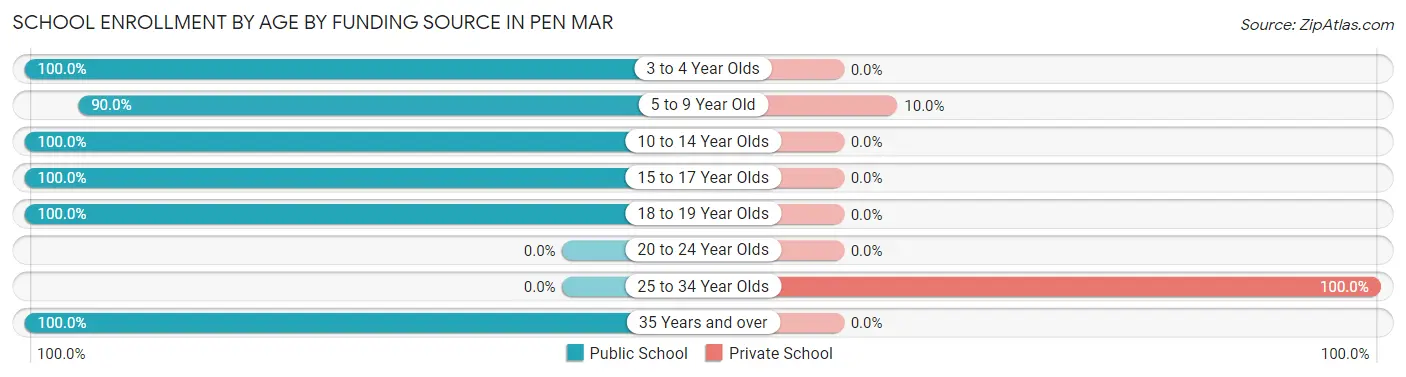
| Age Bracket | Public School | Private School |
| 3 to 4 Year Olds | 11 (100.0%) | 0 (0.0%) |
| 5 to 9 Year Old | 90 (90.0%) | 10 (10.0%) |
| 10 to 14 Year Olds | 63 (100.0%) | 0 (0.0%) |
| 15 to 17 Year Olds | 86 (100.0%) | 0 (0.0%) |
| 18 to 19 Year Olds | 12 (100.0%) | 0 (0.0%) |
| 20 to 24 Year Olds | 0 (0.0%) | 0 (0.0%) |
| 25 to 34 Year Olds | 0 (0.0%) | 10 (100.0%) |
| 35 Years and over | 5 (100.0%) | 0 (0.0%) |
| Total | 267 (93.0%) | 20 (7.0%) |
Educational Attainment by Field of Study in Pen Mar
Science & technology (64 | 26.3%), education (55 | 22.6%), business (31 | 12.8%), engineering (26 | 10.7%), and visual & performing arts (24 | 9.9%) are the most common fields of study among 243 individuals in Pen Mar who have obtained a bachelor's degree or higher.
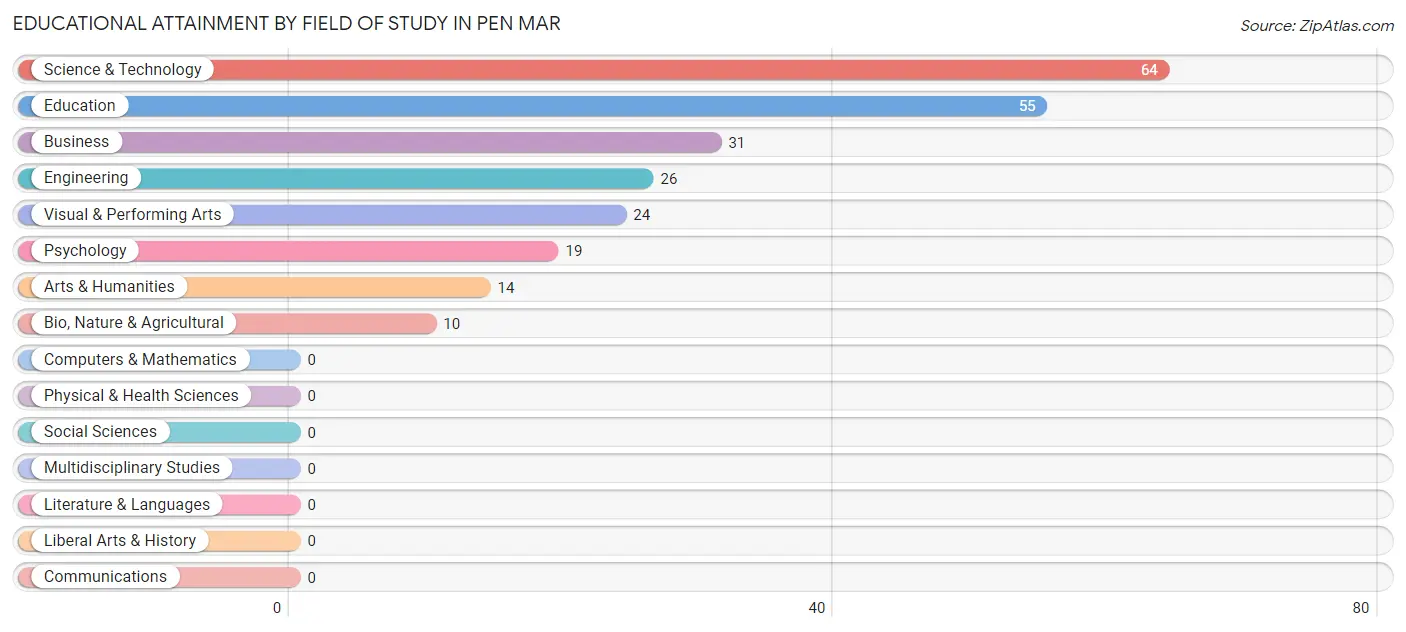
| Field of Study | # Graduates | % Graduates |
| Computers & Mathematics | 0 | 0.0% |
| Bio, Nature & Agricultural | 10 | 4.1% |
| Physical & Health Sciences | 0 | 0.0% |
| Psychology | 19 | 7.8% |
| Social Sciences | 0 | 0.0% |
| Engineering | 26 | 10.7% |
| Multidisciplinary Studies | 0 | 0.0% |
| Science & Technology | 64 | 26.3% |
| Business | 31 | 12.8% |
| Education | 55 | 22.6% |
| Literature & Languages | 0 | 0.0% |
| Liberal Arts & History | 0 | 0.0% |
| Visual & Performing Arts | 24 | 9.9% |
| Communications | 0 | 0.0% |
| Arts & Humanities | 14 | 5.8% |
| Total | 243 | 100.0% |
Transportation & Commute in Pen Mar
Vehicle Availability by Sex in Pen Mar
The most prevalent vehicle ownership categories in Pen Mar are males with 2 vehicles (175, accounting for 51.9%) and females with 2 vehicles (169, making up 59.9%).
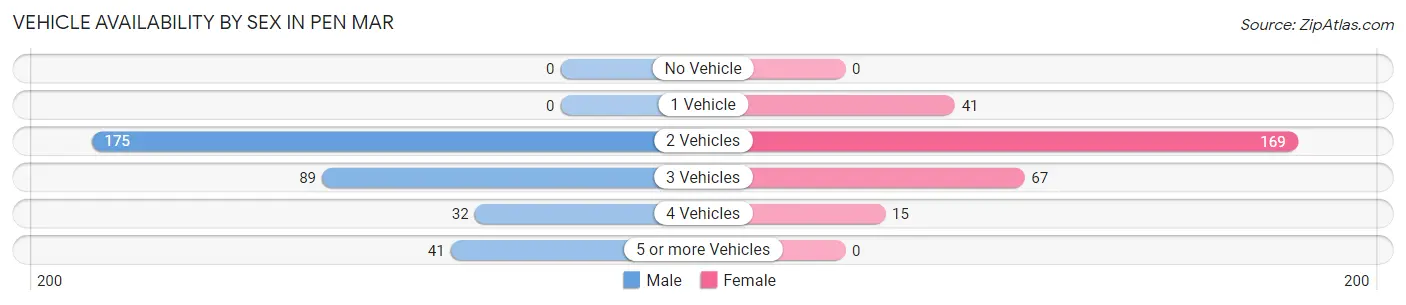
| Vehicles Available | Male | Female |
| No Vehicle | 0 (0.0%) | 0 (0.0%) |
| 1 Vehicle | 0 (0.0%) | 41 (14.0%) |
| 2 Vehicles | 175 (51.9%) | 169 (57.9%) |
| 3 Vehicles | 89 (26.4%) | 67 (23.0%) |
| 4 Vehicles | 32 (9.5%) | 15 (5.1%) |
| 5 or more Vehicles | 41 (12.2%) | 0 (0.0%) |
| Total | 337 (100.0%) | 292 (100.0%) |
Commute Time in Pen Mar
The most frequently occuring commute durations in Pen Mar are 40 to 44 minutes (93 commuters, 16.7%), 15 to 19 minutes (91 commuters, 16.3%), and 45 to 59 minutes (65 commuters, 11.7%).
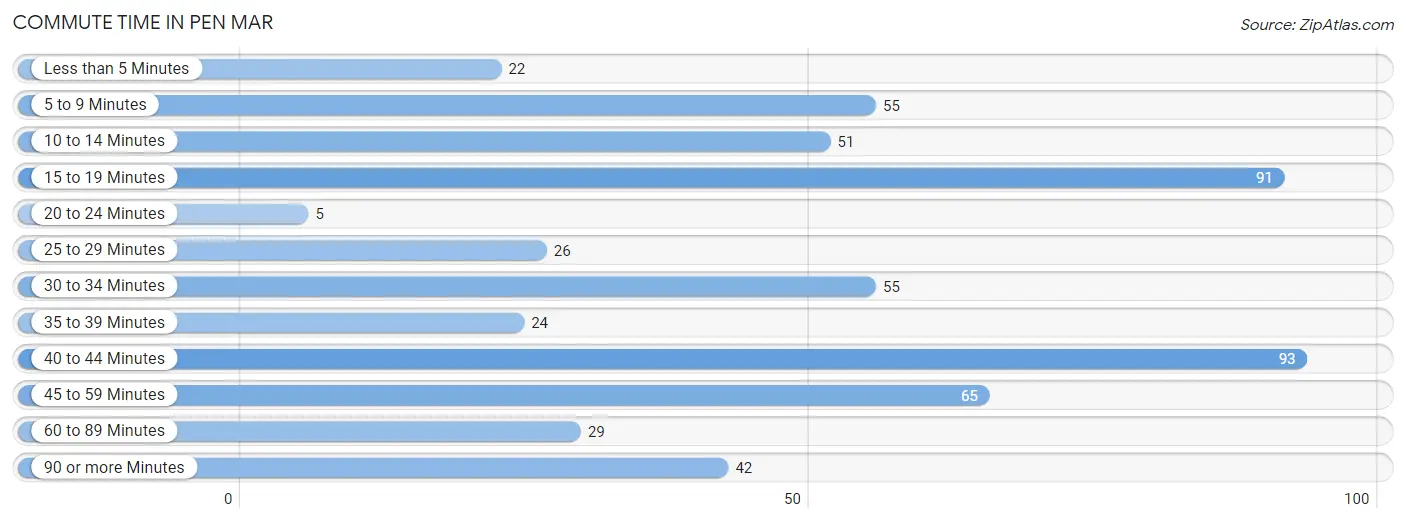
| Commute Time | # Commuters | % Commuters |
| Less than 5 Minutes | 22 | 3.9% |
| 5 to 9 Minutes | 55 | 9.9% |
| 10 to 14 Minutes | 51 | 9.1% |
| 15 to 19 Minutes | 91 | 16.3% |
| 20 to 24 Minutes | 5 | 0.9% |
| 25 to 29 Minutes | 26 | 4.7% |
| 30 to 34 Minutes | 55 | 9.9% |
| 35 to 39 Minutes | 24 | 4.3% |
| 40 to 44 Minutes | 93 | 16.7% |
| 45 to 59 Minutes | 65 | 11.7% |
| 60 to 89 Minutes | 29 | 5.2% |
| 90 or more Minutes | 42 | 7.5% |
Commute Time by Sex in Pen Mar
The most common commute times in Pen Mar are 40 to 44 minutes (93 commuters, 32.0%) for males and 15 to 19 minutes (60 commuters, 22.5%) for females.
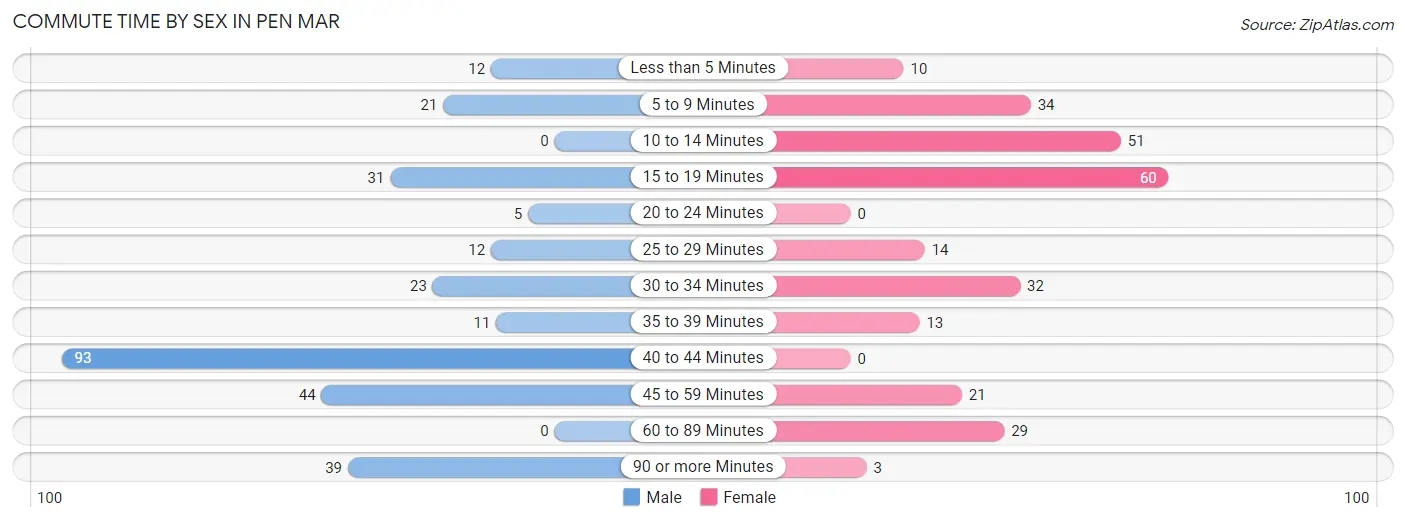
| Commute Time | Male | Female |
| Less than 5 Minutes | 12 (4.1%) | 10 (3.7%) |
| 5 to 9 Minutes | 21 (7.2%) | 34 (12.7%) |
| 10 to 14 Minutes | 0 (0.0%) | 51 (19.1%) |
| 15 to 19 Minutes | 31 (10.6%) | 60 (22.5%) |
| 20 to 24 Minutes | 5 (1.7%) | 0 (0.0%) |
| 25 to 29 Minutes | 12 (4.1%) | 14 (5.2%) |
| 30 to 34 Minutes | 23 (7.9%) | 32 (12.0%) |
| 35 to 39 Minutes | 11 (3.8%) | 13 (4.9%) |
| 40 to 44 Minutes | 93 (32.0%) | 0 (0.0%) |
| 45 to 59 Minutes | 44 (15.1%) | 21 (7.9%) |
| 60 to 89 Minutes | 0 (0.0%) | 29 (10.9%) |
| 90 or more Minutes | 39 (13.4%) | 3 (1.1%) |
Time of Departure to Work by Sex in Pen Mar
The most frequent times of departure to work in Pen Mar are 5:30 AM to 5:59 AM (68, 23.4%) for males and 7:30 AM to 7:59 AM (91, 34.1%) for females.
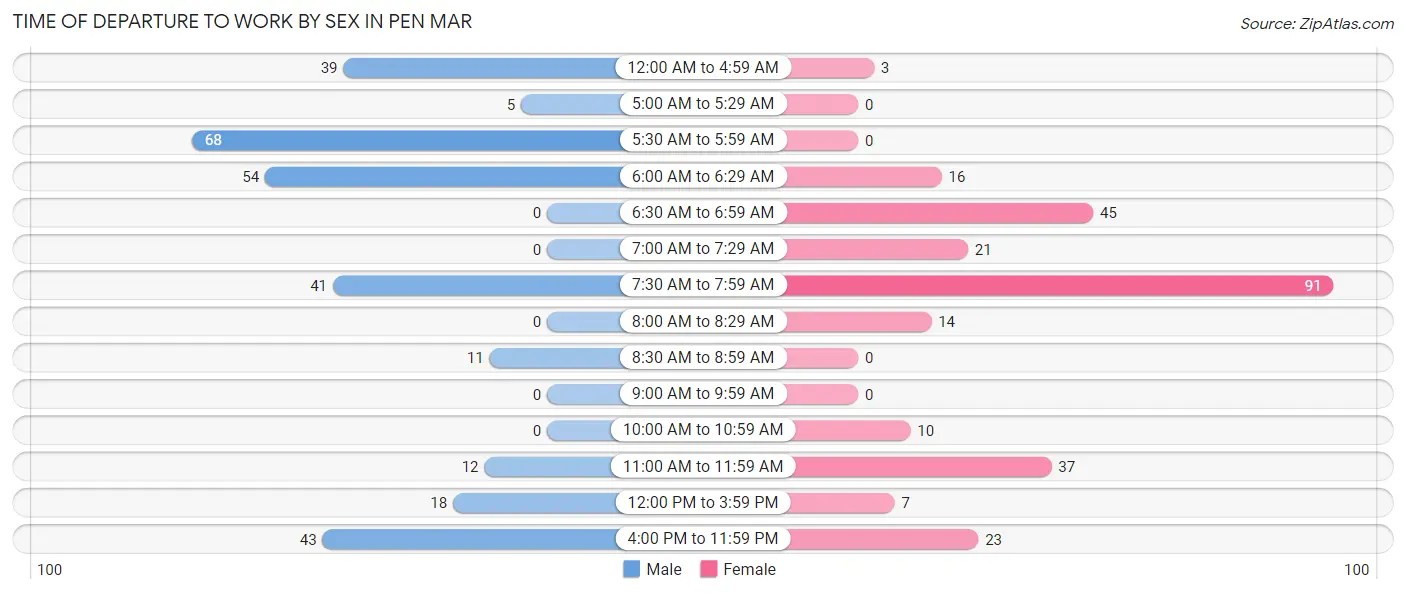
| Time of Departure | Male | Female |
| 12:00 AM to 4:59 AM | 39 (13.4%) | 3 (1.1%) |
| 5:00 AM to 5:29 AM | 5 (1.7%) | 0 (0.0%) |
| 5:30 AM to 5:59 AM | 68 (23.4%) | 0 (0.0%) |
| 6:00 AM to 6:29 AM | 54 (18.6%) | 16 (6.0%) |
| 6:30 AM to 6:59 AM | 0 (0.0%) | 45 (16.9%) |
| 7:00 AM to 7:29 AM | 0 (0.0%) | 21 (7.9%) |
| 7:30 AM to 7:59 AM | 41 (14.1%) | 91 (34.1%) |
| 8:00 AM to 8:29 AM | 0 (0.0%) | 14 (5.2%) |
| 8:30 AM to 8:59 AM | 11 (3.8%) | 0 (0.0%) |
| 9:00 AM to 9:59 AM | 0 (0.0%) | 0 (0.0%) |
| 10:00 AM to 10:59 AM | 0 (0.0%) | 10 (3.7%) |
| 11:00 AM to 11:59 AM | 12 (4.1%) | 37 (13.9%) |
| 12:00 PM to 3:59 PM | 18 (6.2%) | 7 (2.6%) |
| 4:00 PM to 11:59 PM | 43 (14.8%) | 23 (8.6%) |
| Total | 291 (100.0%) | 267 (100.0%) |
Housing Occupancy in Pen Mar
Occupancy by Ownership in Pen Mar
Of the total 378 dwellings in Pen Mar, owner-occupied units account for 378 (100.0%), while renter-occupied units make up 0 (0.0%).
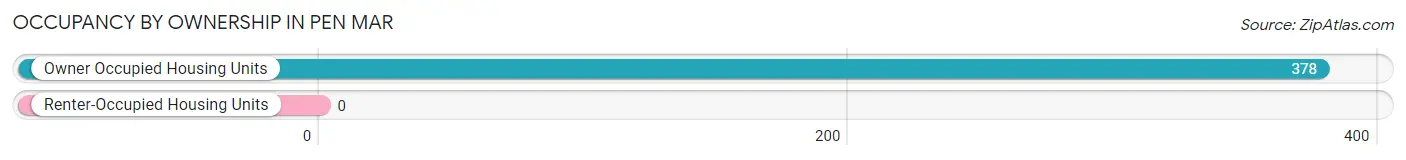
| Occupancy | # Housing Units | % Housing Units |
| Owner Occupied Housing Units | 378 | 100.0% |
| Renter-Occupied Housing Units | 0 | 0.0% |
| Total Occupied Housing Units | 378 | 100.0% |
Occupancy by Household Size in Pen Mar
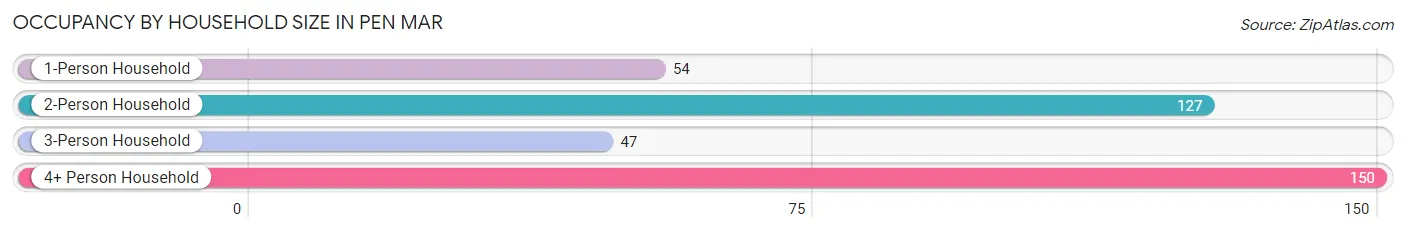
| Household Size | # Housing Units | % Housing Units |
| 1-Person Household | 54 | 14.3% |
| 2-Person Household | 127 | 33.6% |
| 3-Person Household | 47 | 12.4% |
| 4+ Person Household | 150 | 39.7% |
| Total Housing Units | 378 | 100.0% |
Occupancy by Ownership by Household Size in Pen Mar
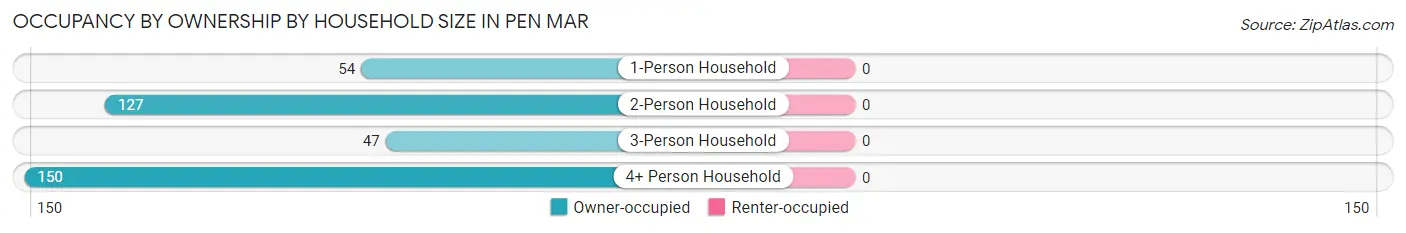
| Household Size | Owner-occupied | Renter-occupied |
| 1-Person Household | 54 (100.0%) | 0 (0.0%) |
| 2-Person Household | 127 (100.0%) | 0 (0.0%) |
| 3-Person Household | 47 (100.0%) | 0 (0.0%) |
| 4+ Person Household | 150 (100.0%) | 0 (0.0%) |
| Total Housing Units | 378 (100.0%) | 0 (0.0%) |
Occupancy by Educational Attainment in Pen Mar
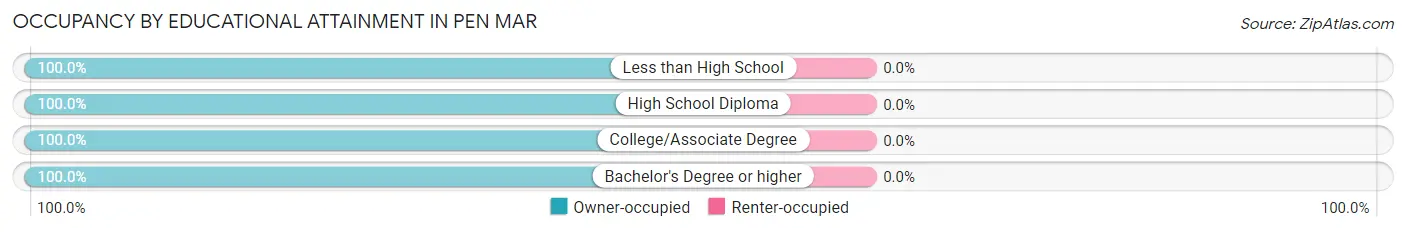
| Household Size | Owner-occupied | Renter-occupied |
| Less than High School | 51 (100.0%) | 0 (0.0%) |
| High School Diploma | 48 (100.0%) | 0 (0.0%) |
| College/Associate Degree | 145 (100.0%) | 0 (0.0%) |
| Bachelor's Degree or higher | 134 (100.0%) | 0 (0.0%) |
Occupancy by Age of Householder in Pen Mar
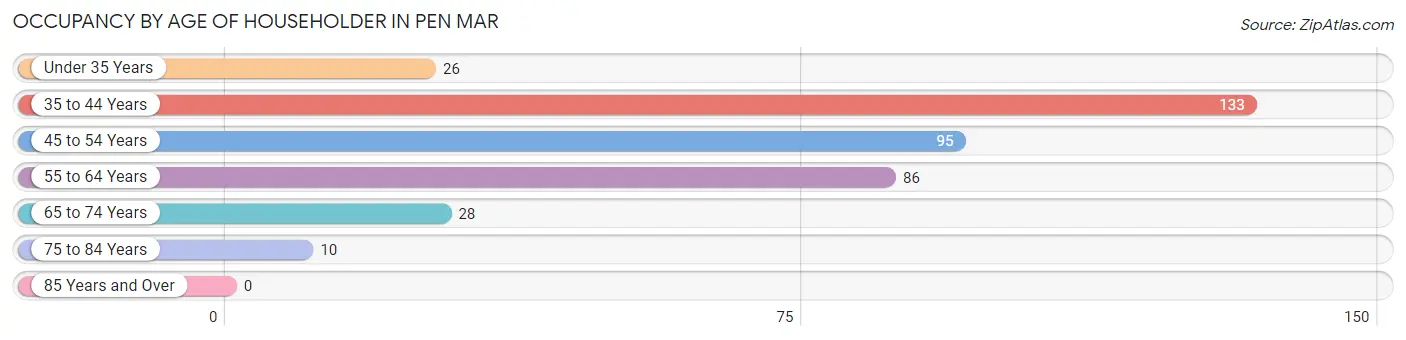
| Age Bracket | # Households | % Households |
| Under 35 Years | 26 | 6.9% |
| 35 to 44 Years | 133 | 35.2% |
| 45 to 54 Years | 95 | 25.1% |
| 55 to 64 Years | 86 | 22.8% |
| 65 to 74 Years | 28 | 7.4% |
| 75 to 84 Years | 10 | 2.6% |
| 85 Years and Over | 0 | 0.0% |
| Total | 378 | 100.0% |
Housing Finances in Pen Mar
Median Income by Occupancy in Pen Mar
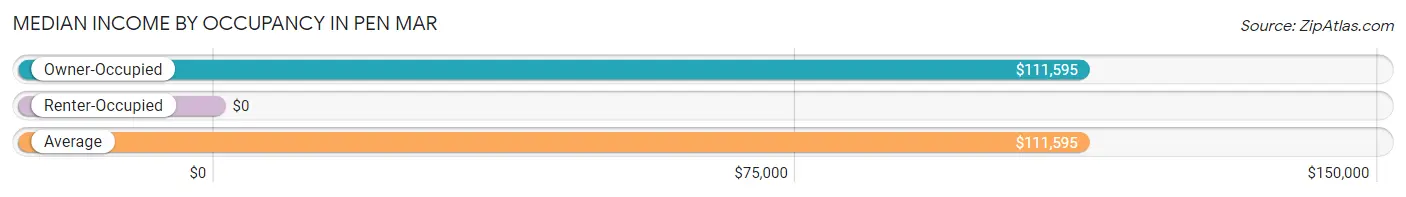
| Occupancy Type | # Households | Median Income |
| Owner-Occupied | 378 (100.0%) | $111,595 |
| Renter-Occupied | 0 (0.0%) | $0 |
| Average | 378 (100.0%) | $111,595 |
Occupancy by Householder Income Bracket in Pen Mar
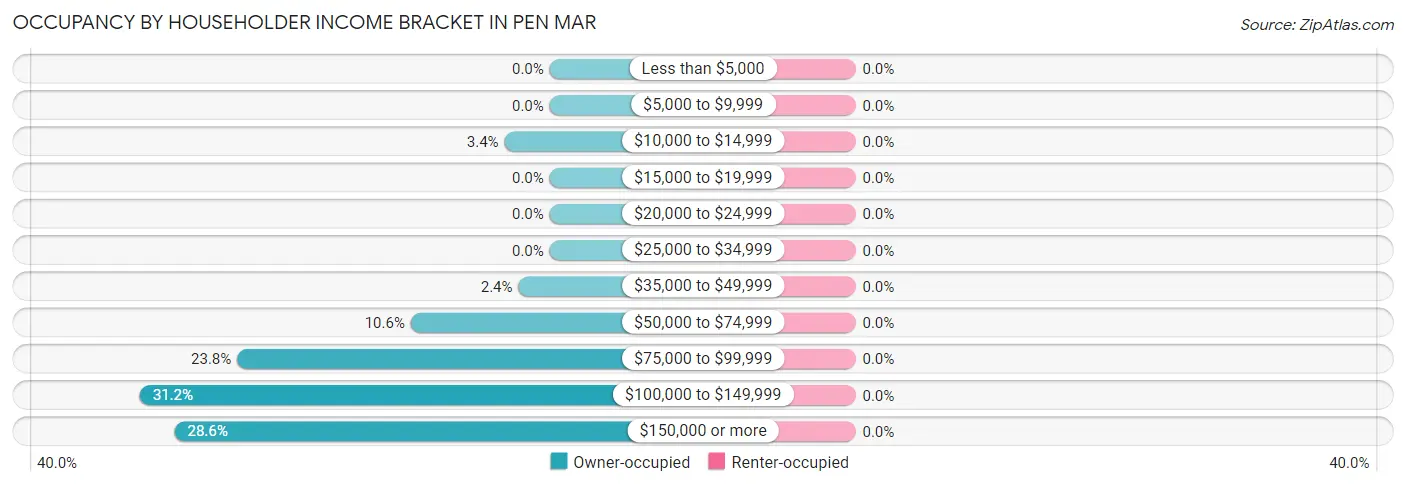
| Income Bracket | Owner-occupied | Renter-occupied |
| Less than $5,000 | 0 (0.0%) | 0 (0.0%) |
| $5,000 to $9,999 | 0 (0.0%) | 0 (0.0%) |
| $10,000 to $14,999 | 13 (3.4%) | 0 (0.0%) |
| $15,000 to $19,999 | 0 (0.0%) | 0 (0.0%) |
| $20,000 to $24,999 | 0 (0.0%) | 0 (0.0%) |
| $25,000 to $34,999 | 0 (0.0%) | 0 (0.0%) |
| $35,000 to $49,999 | 9 (2.4%) | 0 (0.0%) |
| $50,000 to $74,999 | 40 (10.6%) | 0 (0.0%) |
| $75,000 to $99,999 | 90 (23.8%) | 0 (0.0%) |
| $100,000 to $149,999 | 118 (31.2%) | 0 (0.0%) |
| $150,000 or more | 108 (28.6%) | 0 (0.0%) |
| Total | 378 (100.0%) | 0 (0.0%) |
Monthly Housing Cost Tiers in Pen Mar
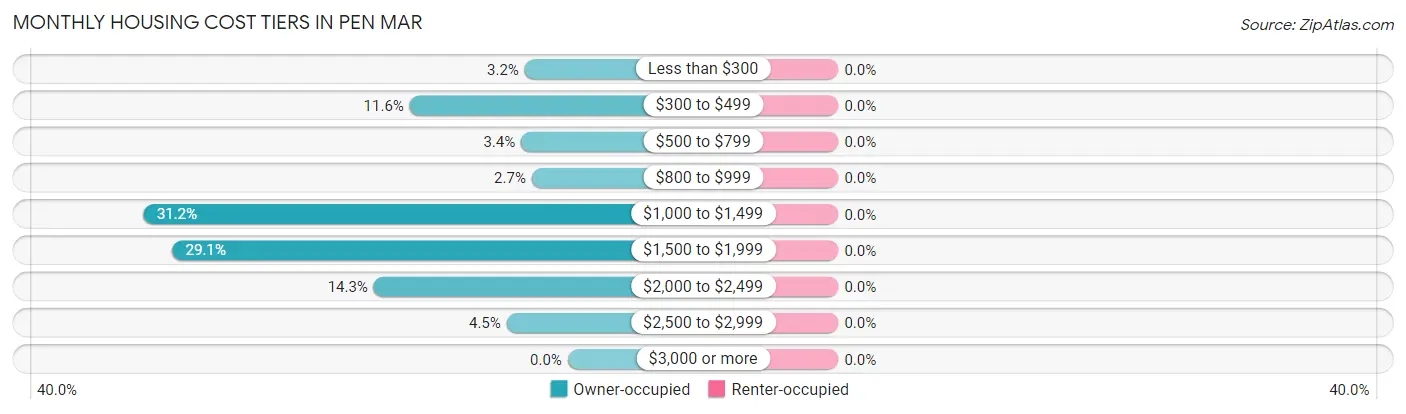
| Monthly Cost | Owner-occupied | Renter-occupied |
| Less than $300 | 12 (3.2%) | 0 (0.0%) |
| $300 to $499 | 44 (11.6%) | 0 (0.0%) |
| $500 to $799 | 13 (3.4%) | 0 (0.0%) |
| $800 to $999 | 10 (2.6%) | 0 (0.0%) |
| $1,000 to $1,499 | 118 (31.2%) | 0 (0.0%) |
| $1,500 to $1,999 | 110 (29.1%) | 0 (0.0%) |
| $2,000 to $2,499 | 54 (14.3%) | 0 (0.0%) |
| $2,500 to $2,999 | 17 (4.5%) | 0 (0.0%) |
| $3,000 or more | 0 (0.0%) | 0 (0.0%) |
| Total | 378 (100.0%) | 0 (0.0%) |
Physical Housing Characteristics in Pen Mar
Housing Structures in Pen Mar
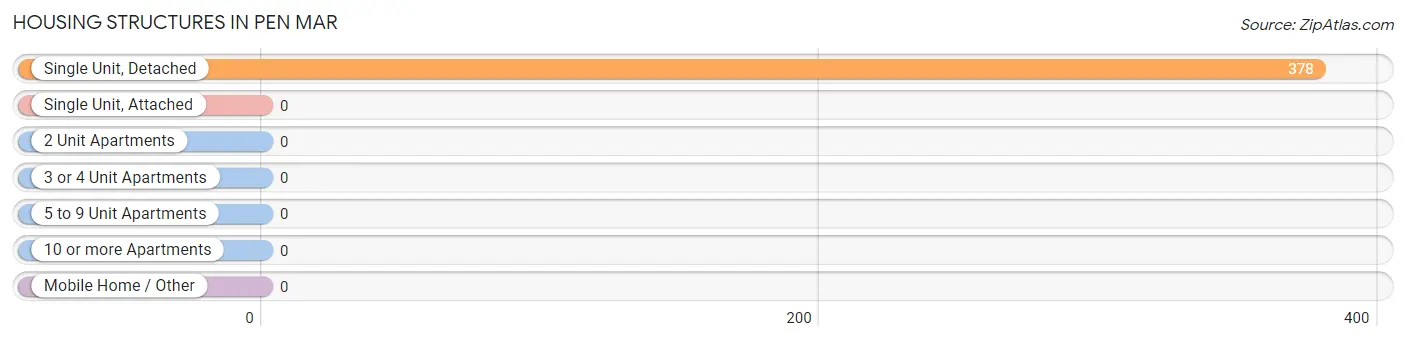
| Structure Type | # Housing Units | % Housing Units |
| Single Unit, Detached | 378 | 100.0% |
| Single Unit, Attached | 0 | 0.0% |
| 2 Unit Apartments | 0 | 0.0% |
| 3 or 4 Unit Apartments | 0 | 0.0% |
| 5 to 9 Unit Apartments | 0 | 0.0% |
| 10 or more Apartments | 0 | 0.0% |
| Mobile Home / Other | 0 | 0.0% |
| Total | 378 | 100.0% |
Housing Structures by Occupancy in Pen Mar
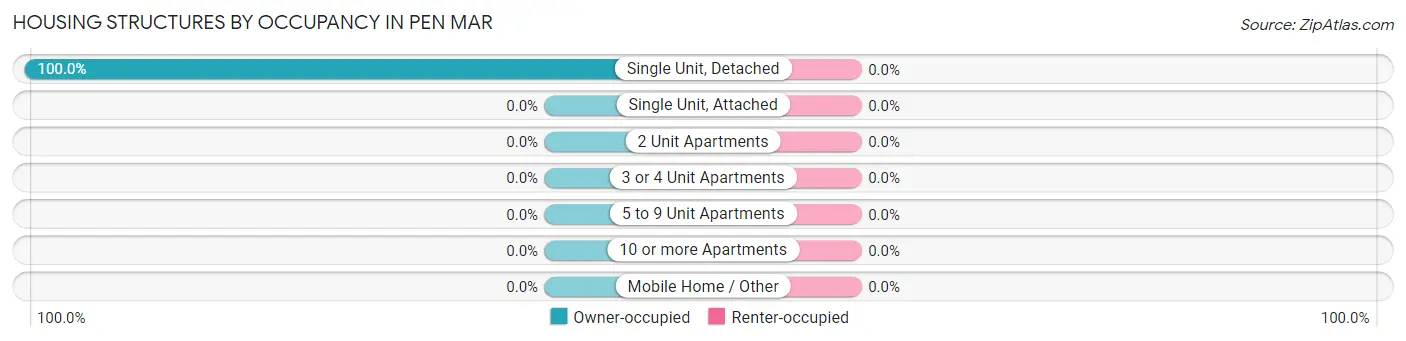
| Structure Type | Owner-occupied | Renter-occupied |
| Single Unit, Detached | 378 (100.0%) | 0 (0.0%) |
| Single Unit, Attached | 0 (0.0%) | 0 (0.0%) |
| 2 Unit Apartments | 0 (0.0%) | 0 (0.0%) |
| 3 or 4 Unit Apartments | 0 (0.0%) | 0 (0.0%) |
| 5 to 9 Unit Apartments | 0 (0.0%) | 0 (0.0%) |
| 10 or more Apartments | 0 (0.0%) | 0 (0.0%) |
| Mobile Home / Other | 0 (0.0%) | 0 (0.0%) |
| Total | 378 (100.0%) | 0 (0.0%) |
Housing Structures by Number of Rooms in Pen Mar
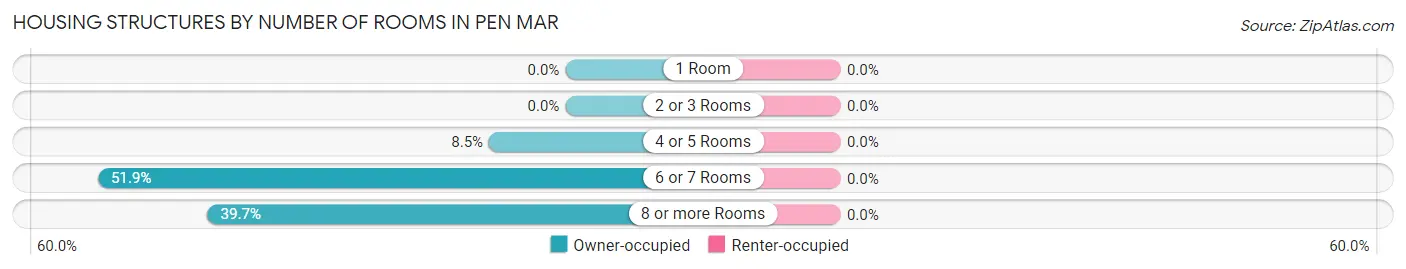
| Number of Rooms | Owner-occupied | Renter-occupied |
| 1 Room | 0 (0.0%) | 0 (0.0%) |
| 2 or 3 Rooms | 0 (0.0%) | 0 (0.0%) |
| 4 or 5 Rooms | 32 (8.5%) | 0 (0.0%) |
| 6 or 7 Rooms | 196 (51.8%) | 0 (0.0%) |
| 8 or more Rooms | 150 (39.7%) | 0 (0.0%) |
| Total | 378 (100.0%) | 0 (0.0%) |
Housing Structure by Heating Type in Pen Mar
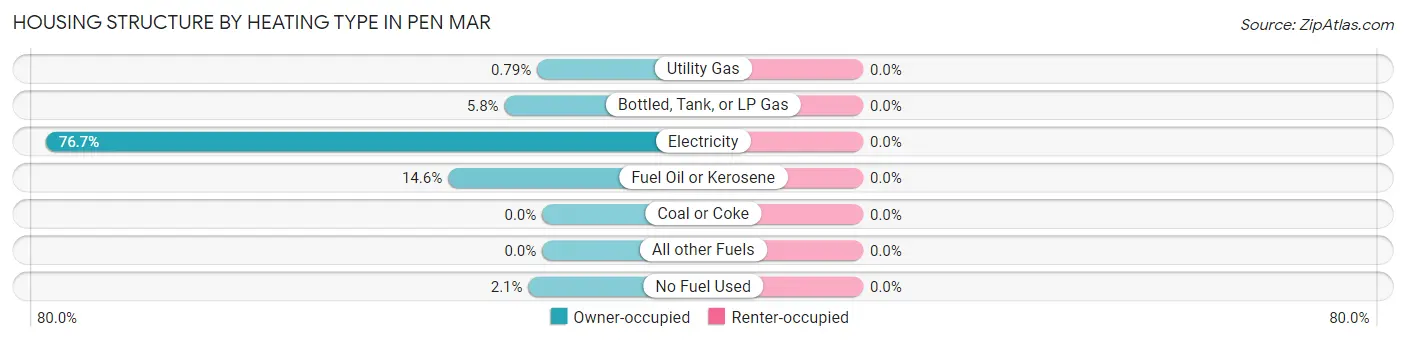
| Heating Type | Owner-occupied | Renter-occupied |
| Utility Gas | 3 (0.8%) | 0 (0.0%) |
| Bottled, Tank, or LP Gas | 22 (5.8%) | 0 (0.0%) |
| Electricity | 290 (76.7%) | 0 (0.0%) |
| Fuel Oil or Kerosene | 55 (14.5%) | 0 (0.0%) |
| Coal or Coke | 0 (0.0%) | 0 (0.0%) |
| All other Fuels | 0 (0.0%) | 0 (0.0%) |
| No Fuel Used | 8 (2.1%) | 0 (0.0%) |
| Total | 378 (100.0%) | 0 (0.0%) |
Household Vehicle Usage in Pen Mar
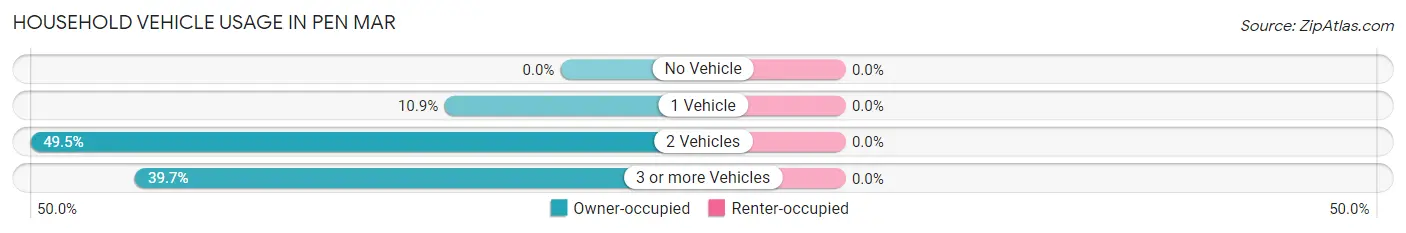
| Vehicles per Household | Owner-occupied | Renter-occupied |
| No Vehicle | 0 (0.0%) | 0 (0.0%) |
| 1 Vehicle | 41 (10.8%) | 0 (0.0%) |
| 2 Vehicles | 187 (49.5%) | 0 (0.0%) |
| 3 or more Vehicles | 150 (39.7%) | 0 (0.0%) |
| Total | 378 (100.0%) | 0 (0.0%) |
Real Estate & Mortgages in Pen Mar
Real Estate and Mortgage Overview in Pen Mar
| Characteristic | Without Mortgage | With Mortgage |
| Housing Units | 69 | 309 |
| Median Property Value | $232,400 | $257,400 |
| Median Household Income | - | - |
| Monthly Housing Costs | $420 | $0 |
| Real Estate Taxes | $4,138 | $0 |
Property Value by Mortgage Status in Pen Mar
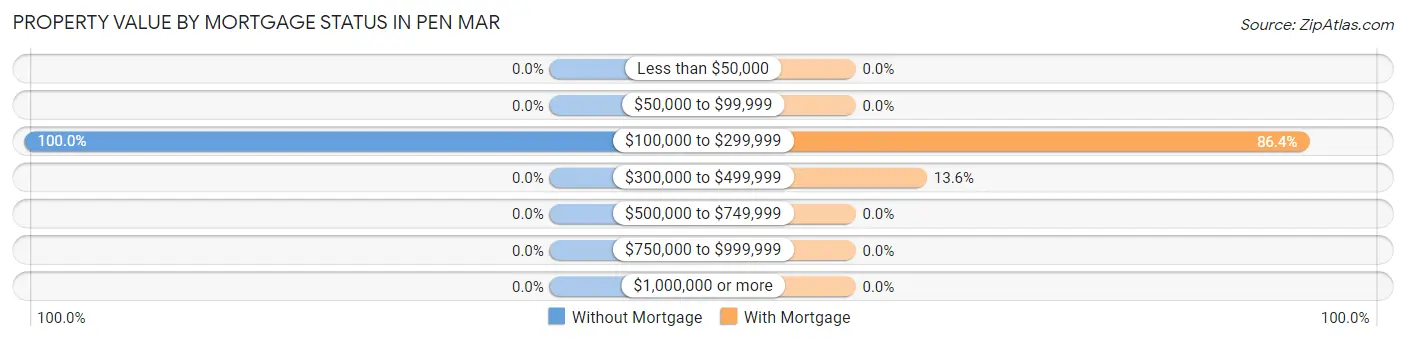
| Property Value | Without Mortgage | With Mortgage |
| Less than $50,000 | 0 (0.0%) | 0 (0.0%) |
| $50,000 to $99,999 | 0 (0.0%) | 0 (0.0%) |
| $100,000 to $299,999 | 69 (100.0%) | 267 (86.4%) |
| $300,000 to $499,999 | 0 (0.0%) | 42 (13.6%) |
| $500,000 to $749,999 | 0 (0.0%) | 0 (0.0%) |
| $750,000 to $999,999 | 0 (0.0%) | 0 (0.0%) |
| $1,000,000 or more | 0 (0.0%) | 0 (0.0%) |
| Total | 69 (100.0%) | 309 (100.0%) |
Household Income by Mortgage Status in Pen Mar
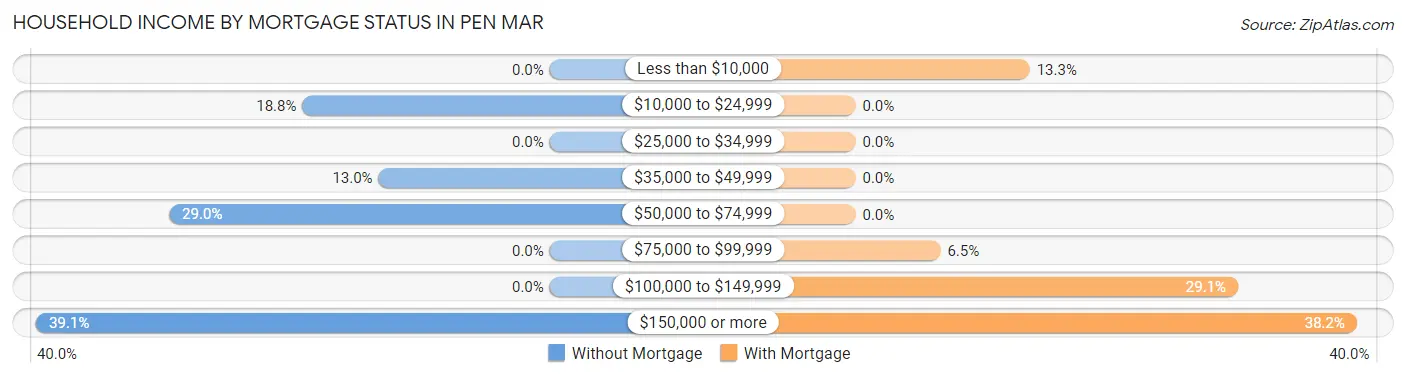
| Household Income | Without Mortgage | With Mortgage |
| Less than $10,000 | 0 (0.0%) | 41 (13.3%) |
| $10,000 to $24,999 | 13 (18.8%) | 0 (0.0%) |
| $25,000 to $34,999 | 0 (0.0%) | 0 (0.0%) |
| $35,000 to $49,999 | 9 (13.0%) | 0 (0.0%) |
| $50,000 to $74,999 | 20 (29.0%) | 0 (0.0%) |
| $75,000 to $99,999 | 0 (0.0%) | 20 (6.5%) |
| $100,000 to $149,999 | 0 (0.0%) | 90 (29.1%) |
| $150,000 or more | 27 (39.1%) | 118 (38.2%) |
| Total | 69 (100.0%) | 309 (100.0%) |
Property Value to Household Income Ratio in Pen Mar
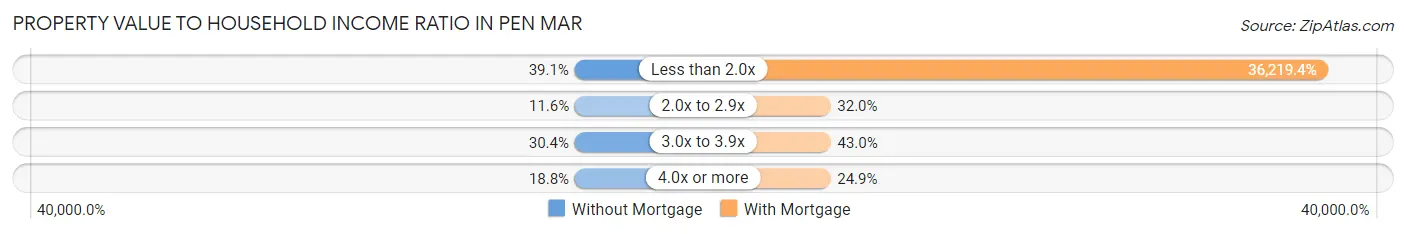
| Value-to-Income Ratio | Without Mortgage | With Mortgage |
| Less than 2.0x | 27 (39.1%) | 111,918 (36,219.4%) |
| 2.0x to 2.9x | 8 (11.6%) | 99 (32.0%) |
| 3.0x to 3.9x | 21 (30.4%) | 133 (43.0%) |
| 4.0x or more | 13 (18.8%) | 77 (24.9%) |
| Total | 69 (100.0%) | 309 (100.0%) |
Real Estate Taxes by Mortgage Status in Pen Mar
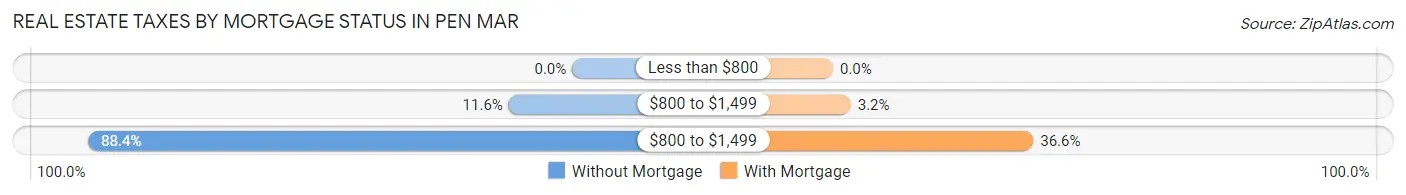
| Property Taxes | Without Mortgage | With Mortgage |
| Less than $800 | 0 (0.0%) | 0 (0.0%) |
| $800 to $1,499 | 8 (11.6%) | 10 (3.2%) |
| $800 to $1,499 | 61 (88.4%) | 113 (36.6%) |
| Total | 69 (100.0%) | 309 (100.0%) |
Health & Disability in Pen Mar
Health Insurance Coverage by Age in Pen Mar
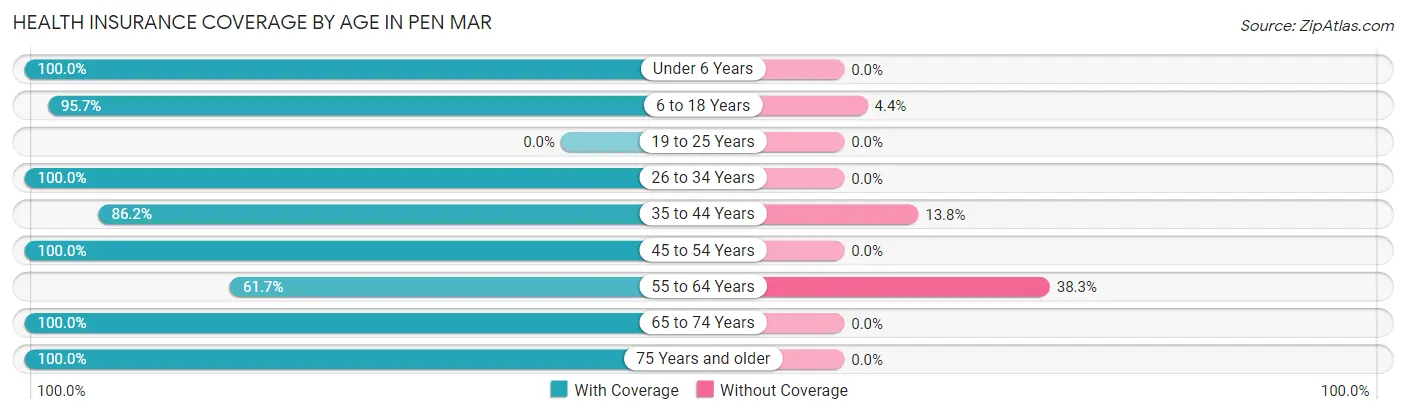
| Age Bracket | With Coverage | Without Coverage |
| Under 6 Years | 123 (100.0%) | 0 (0.0%) |
| 6 to 18 Years | 308 (95.7%) | 14 (4.3%) |
| 19 to 25 Years | 0 (0.0%) | 0 (0.0%) |
| 26 to 34 Years | 71 (100.0%) | 0 (0.0%) |
| 35 to 44 Years | 256 (86.2%) | 41 (13.8%) |
| 45 to 54 Years | 185 (100.0%) | 0 (0.0%) |
| 55 to 64 Years | 66 (61.7%) | 41 (38.3%) |
| 65 to 74 Years | 62 (100.0%) | 0 (0.0%) |
| 75 Years and older | 10 (100.0%) | 0 (0.0%) |
| Total | 1,081 (91.8%) | 96 (8.2%) |
Health Insurance Coverage by Citizenship Status in Pen Mar
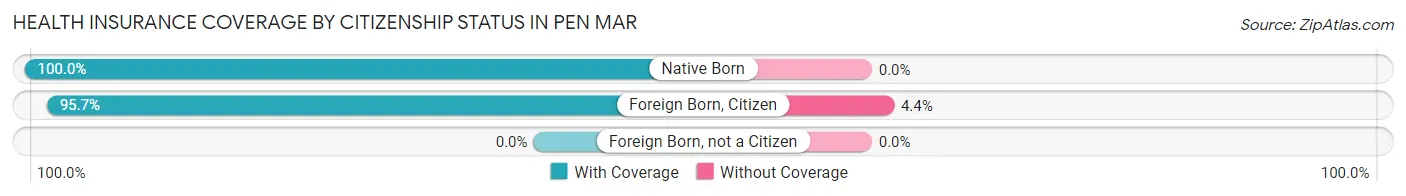
| Citizenship Status | With Coverage | Without Coverage |
| Native Born | 123 (100.0%) | 0 (0.0%) |
| Foreign Born, Citizen | 308 (95.7%) | 14 (4.3%) |
| Foreign Born, not a Citizen | 0 (0.0%) | 0 (0.0%) |
Health Insurance Coverage by Household Income in Pen Mar
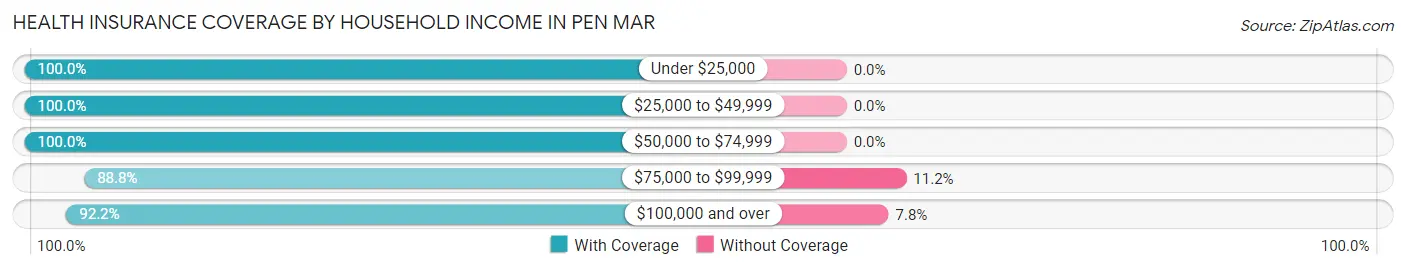
| Household Income | With Coverage | Without Coverage |
| Under $25,000 | 13 (100.0%) | 0 (0.0%) |
| $25,000 to $49,999 | 17 (100.0%) | 0 (0.0%) |
| $50,000 to $74,999 | 78 (100.0%) | 0 (0.0%) |
| $75,000 to $99,999 | 326 (88.8%) | 41 (11.2%) |
| $100,000 and over | 647 (92.2%) | 55 (7.8%) |
Public vs Private Health Insurance Coverage by Age in Pen Mar
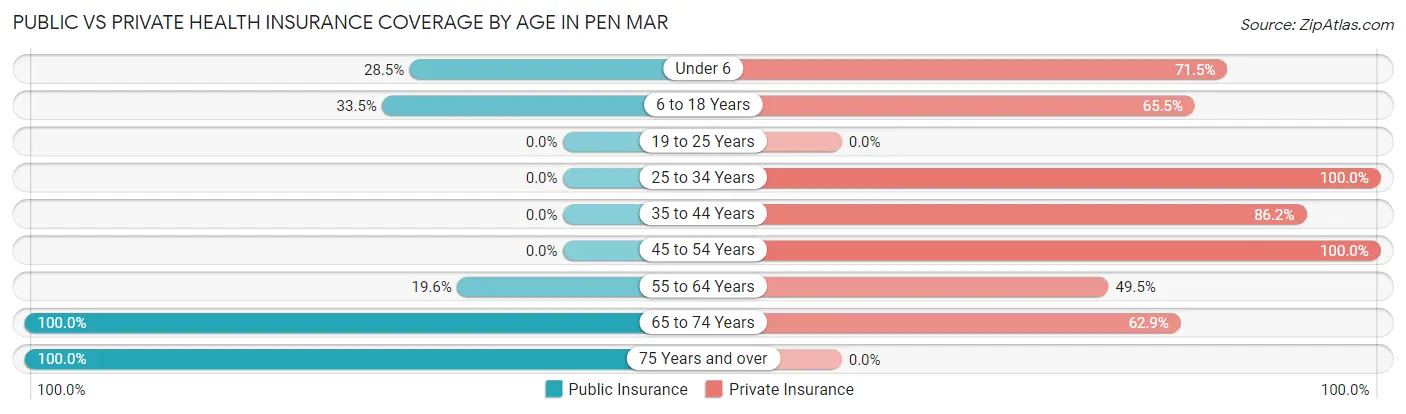
| Age Bracket | Public Insurance | Private Insurance |
| Under 6 | 35 (28.5%) | 88 (71.5%) |
| 6 to 18 Years | 108 (33.5%) | 211 (65.5%) |
| 19 to 25 Years | 0 (0.0%) | 0 (0.0%) |
| 25 to 34 Years | 0 (0.0%) | 71 (100.0%) |
| 35 to 44 Years | 0 (0.0%) | 256 (86.2%) |
| 45 to 54 Years | 0 (0.0%) | 185 (100.0%) |
| 55 to 64 Years | 21 (19.6%) | 53 (49.5%) |
| 65 to 74 Years | 62 (100.0%) | 39 (62.9%) |
| 75 Years and over | 10 (100.0%) | 0 (0.0%) |
| Total | 236 (20.1%) | 903 (76.7%) |
Disability Status by Sex by Age in Pen Mar
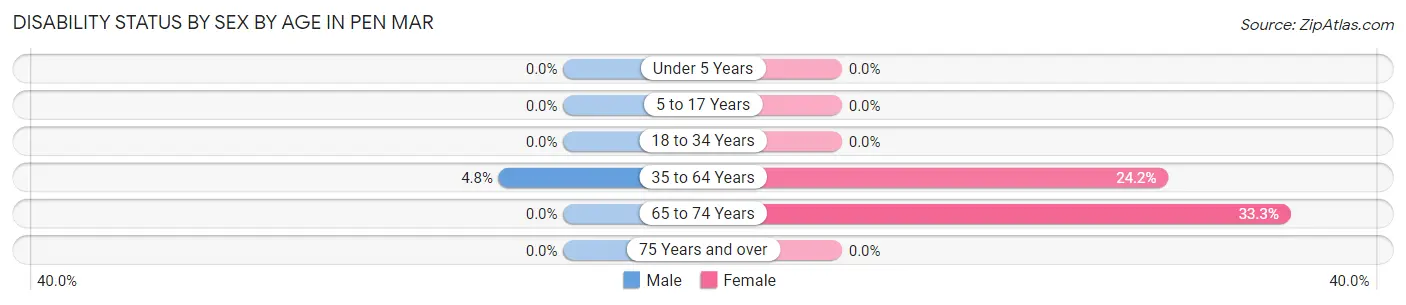
| Age Bracket | Male | Female |
| Under 5 Years | 0 (0.0%) | 0 (0.0%) |
| 5 to 17 Years | 0 (0.0%) | 0 (0.0%) |
| 18 to 34 Years | 0 (0.0%) | 0 (0.0%) |
| 35 to 64 Years | 14 (4.8%) | 72 (24.2%) |
| 65 to 74 Years | 0 (0.0%) | 11 (33.3%) |
| 75 Years and over | 0 (0.0%) | 0 (0.0%) |
Disability Class by Sex by Age in Pen Mar
Disability Class: Hearing Difficulty
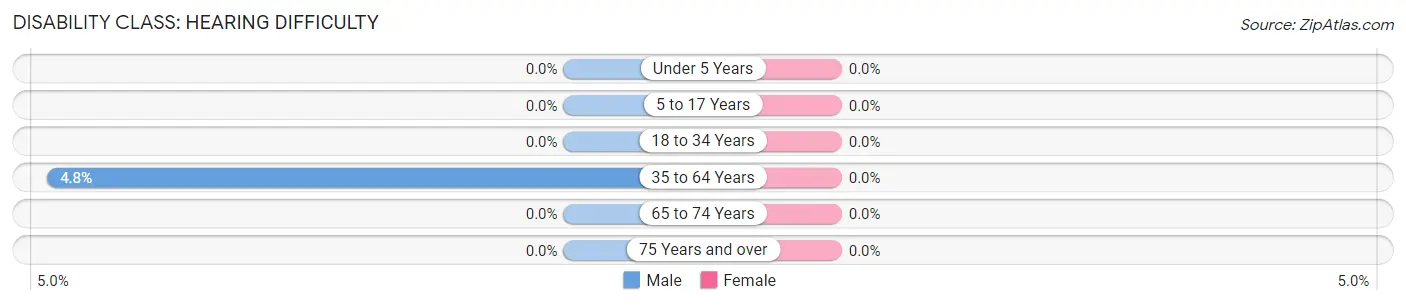
| Age Bracket | Male | Female |
| Under 5 Years | 0 (0.0%) | 0 (0.0%) |
| 5 to 17 Years | 0 (0.0%) | 0 (0.0%) |
| 18 to 34 Years | 0 (0.0%) | 0 (0.0%) |
| 35 to 64 Years | 14 (4.8%) | 0 (0.0%) |
| 65 to 74 Years | 0 (0.0%) | 0 (0.0%) |
| 75 Years and over | 0 (0.0%) | 0 (0.0%) |
Disability Class: Vision Difficulty
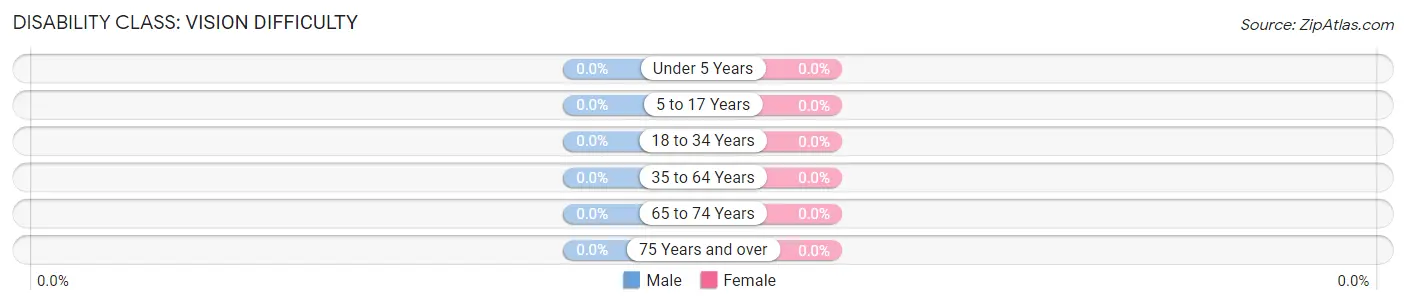
| Age Bracket | Male | Female |
| Under 5 Years | 0 (0.0%) | 0 (0.0%) |
| 5 to 17 Years | 0 (0.0%) | 0 (0.0%) |
| 18 to 34 Years | 0 (0.0%) | 0 (0.0%) |
| 35 to 64 Years | 0 (0.0%) | 0 (0.0%) |
| 65 to 74 Years | 0 (0.0%) | 0 (0.0%) |
| 75 Years and over | 0 (0.0%) | 0 (0.0%) |
Disability Class: Cognitive Difficulty
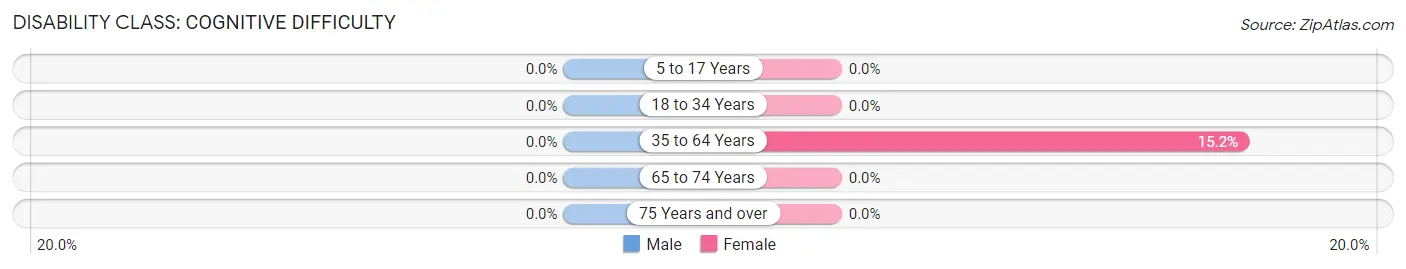
| Age Bracket | Male | Female |
| 5 to 17 Years | 0 (0.0%) | 0 (0.0%) |
| 18 to 34 Years | 0 (0.0%) | 0 (0.0%) |
| 35 to 64 Years | 0 (0.0%) | 45 (15.1%) |
| 65 to 74 Years | 0 (0.0%) | 0 (0.0%) |
| 75 Years and over | 0 (0.0%) | 0 (0.0%) |
Disability Class: Ambulatory Difficulty
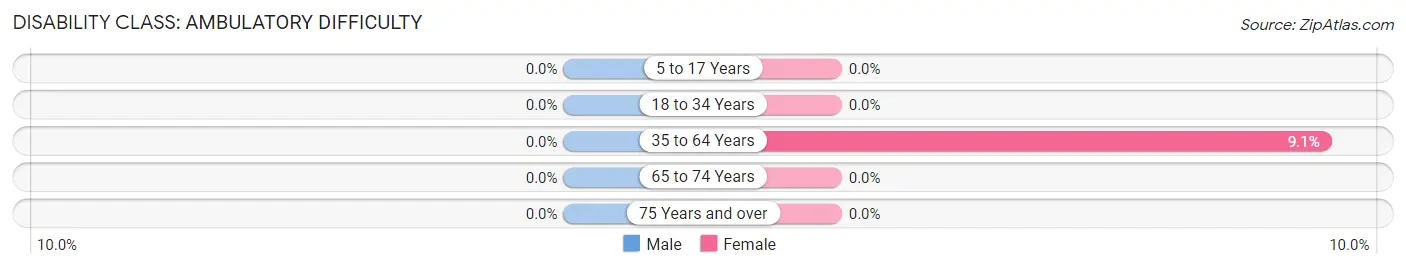
| Age Bracket | Male | Female |
| 5 to 17 Years | 0 (0.0%) | 0 (0.0%) |
| 18 to 34 Years | 0 (0.0%) | 0 (0.0%) |
| 35 to 64 Years | 0 (0.0%) | 27 (9.1%) |
| 65 to 74 Years | 0 (0.0%) | 0 (0.0%) |
| 75 Years and over | 0 (0.0%) | 0 (0.0%) |
Disability Class: Self-Care Difficulty
| Age Bracket | Male | Female |
| 5 to 17 Years | 0 (0.0%) | 0 (0.0%) |
| 18 to 34 Years | 0 (0.0%) | 0 (0.0%) |
| 35 to 64 Years | 0 (0.0%) | 0 (0.0%) |
| 65 to 74 Years | 0 (0.0%) | 0 (0.0%) |
| 75 Years and over | 0 (0.0%) | 0 (0.0%) |
Technology Access in Pen Mar
Computing Device Access in Pen Mar
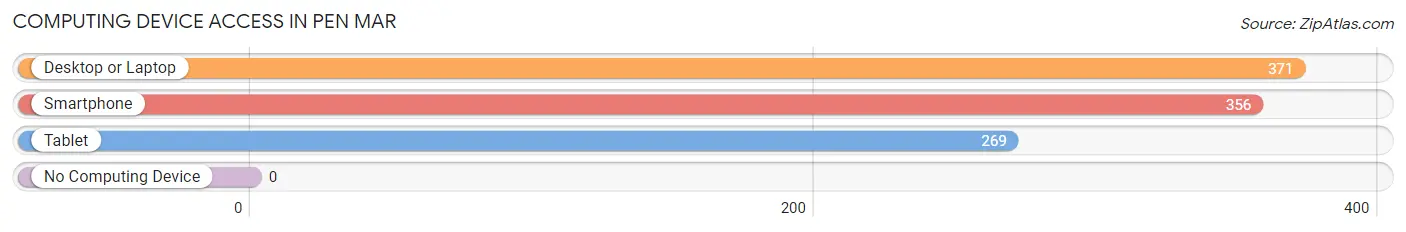
| Device Type | # Households | % Households |
| Desktop or Laptop | 371 | 98.2% |
| Smartphone | 356 | 94.2% |
| Tablet | 269 | 71.2% |
| No Computing Device | 0 | 0.0% |
| Total | 378 | 100.0% |
Internet Access in Pen Mar
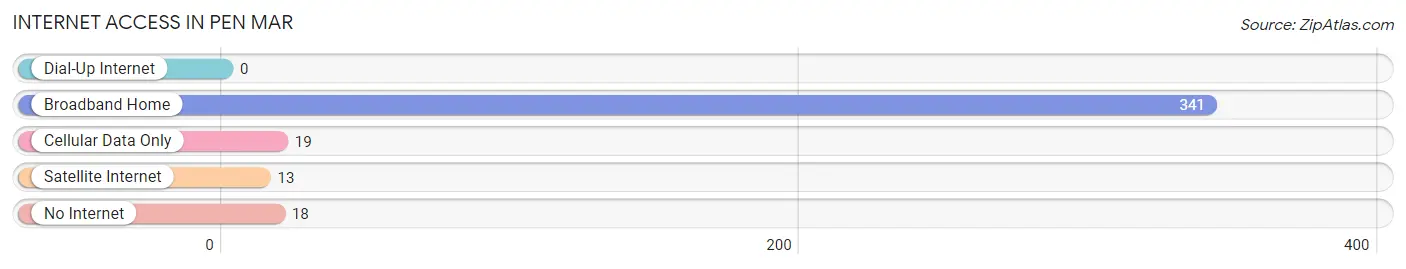
| Internet Type | # Households | % Households |
| Dial-Up Internet | 0 | 0.0% |
| Broadband Home | 341 | 90.2% |
| Cellular Data Only | 19 | 5.0% |
| Satellite Internet | 13 | 3.4% |
| No Internet | 18 | 4.8% |
| Total | 378 | 100.0% |
Pen Mar Summary
Mar Pen, Pennsylvania is a small borough located in the southeastern corner of the state. It is situated in the heart of the Susquehanna Valley, and is bordered by the Susquehanna River to the east and the Juniata River to the west. The borough is part of the Harrisburg-Carlisle Metropolitan Statistical Area, and is located approximately 25 miles south of Harrisburg.
History
Mar Pen was founded in 1790 by a group of settlers from Lancaster County. The town was named after the Mar Pen Creek, which runs through the area. The creek was named after the Mar Pen Indians, who were a Native American tribe that lived in the area prior to the arrival of the settlers.
The town quickly grew and became an important stop on the Susquehanna Turnpike, which connected Harrisburg to Philadelphia. The turnpike was a major transportation route for goods and people, and Mar Pen became a popular stopping point for travelers.
In the mid-1800s, the town was home to several industries, including a sawmill, a gristmill, and a tannery. The town also had a thriving agricultural industry, and was known for its production of apples, peaches, and other fruits.
Geography
Mar Pen is located in the southeastern corner of Pennsylvania, in the heart of the Susquehanna Valley. The borough is bordered by the Susquehanna River to the east and the Juniata River to the west. The borough is located approximately 25 miles south of Harrisburg, and is part of the Harrisburg-Carlisle Metropolitan Statistical Area.
The borough is situated on a flat plain, with an elevation of approximately 500 feet above sea level. The climate is humid continental, with hot summers and cold winters. The average annual temperature is around 50 degrees Fahrenheit, and the average annual precipitation is around 40 inches.
Economy
Mar Pen’s economy is largely based on agriculture and tourism. The town is home to several farms, which produce a variety of fruits and vegetables, including apples, peaches, and corn. The town is also home to several wineries, which produce a variety of wines.
The town is also a popular tourist destination, and is home to several attractions, including the Mar Pen Historical Society Museum, the Mar Pen Railroad Museum, and the Mar Pen Covered Bridge. The town also hosts several annual festivals, including the Mar Pen Apple Festival and the Mar Pen Peach Festival.
Demographics
As of the 2010 census, the population of Mar Pen was 1,845. The racial makeup of the borough was 97.3% White, 0.9% African American, 0.2% Native American, 0.3% Asian, and 1.3% from other races. The median household income was $45,938, and the median family income was $51,938.
Mar Pen is a small, rural borough with a strong sense of community. The town is home to several churches, and is known for its friendly, welcoming atmosphere. The town is also home to several small businesses, including restaurants, shops, and other services.
Common Questions
What is Per Capita Income in Pen Mar?
Per Capita income in Pen Mar is $40,786.
What is the Median Family Income in Pen Mar?
Median Family Income in Pen Mar is $125,517.
What is the Median Household income in Pen Mar?
Median Household Income in Pen Mar is $111,595.
What is Income or Wage Gap in Pen Mar?
Income or Wage Gap in Pen Mar is 35.6%.
Women in Pen Mar earn 64.4 cents for every dollar earned by a man.
What is Inequality or Gini Index in Pen Mar?
Inequality or Gini Index in Pen Mar is 0.27.
What is the Total Population of Pen Mar?
Total Population of Pen Mar is 1,177.
What is the Total Male Population of Pen Mar?
Total Male Population of Pen Mar is 468.
What is the Total Female Population of Pen Mar?
Total Female Population of Pen Mar is 709.
What is the Ratio of Males per 100 Females in Pen Mar?
There are 66.01 Males per 100 Females in Pen Mar.
What is the Ratio of Females per 100 Males in Pen Mar?
There are 151.50 Females per 100 Males in Pen Mar.
What is the Median Population Age in Pen Mar?
Median Population Age in Pen Mar is 35.5 Years.
What is the Average Family Size in Pen Mar
Average Family Size in Pen Mar is 3.4 People.
What is the Average Household Size in Pen Mar
Average Household Size in Pen Mar is 3.1 People.
How Large is the Labor Force in Pen Mar?
There are 652 People in the Labor Forcein in Pen Mar.
What is the Percentage of People in the Labor Force in Pen Mar?
85.1% of People are in the Labor Force in Pen Mar.
What is the Unemployment Rate in Pen Mar?
Unemployment Rate in Pen Mar is 3.5%.