Laporte borough, PA Map & Demographics
Laporte borough Overview
$33,316
PER CAPITA INCOME
$116,250
AVG FAMILY INCOME
$74,375
AVG HOUSEHOLD INCOME
54.2%
WAGE / INCOME GAP [ % ]
45.8¢/ $1
WAGE / INCOME GAP [ $ ]
0.30
INEQUALITY / GINI INDEX
254
TOTAL POPULATION
132
MALE POPULATION
122
FEMALE POPULATION
108.20
MALES / 100 FEMALES
92.42
FEMALES / 100 MALES
68.5
MEDIAN AGE
2.1
AVG FAMILY SIZE
1.8
AVG HOUSEHOLD SIZE
72
LABOR FORCE [ PEOPLE ]
30.0%
PERCENT IN LABOR FORCE
Income in Laporte borough
Income Overview in Laporte borough
Per Capita Income in Laporte borough is $33,316, while median incomes of families and households are $116,250 and $74,375 respectively.
| Characteristic | Number | Measure |
| Per Capita Income | 254 | $33,316 |
| Median Family Income | 52 | $116,250 |
| Mean Family Income | 52 | $118,565 |
| Median Household Income | 75 | $74,375 |
| Mean Household Income | 75 | $98,197 |
| Income Deficit | 52 | $0 |
| Wage / Income Gap (%) | 254 | 54.20% |
| Wage / Income Gap ($) | 254 | 45.80¢ per $1 |
| Gini / Inequality Index | 254 | 0.30 |
Earnings by Sex in Laporte borough
Average Earnings in Laporte borough are $45,250, $54,583 for men and $25,000 for women, a difference of 54.2%.
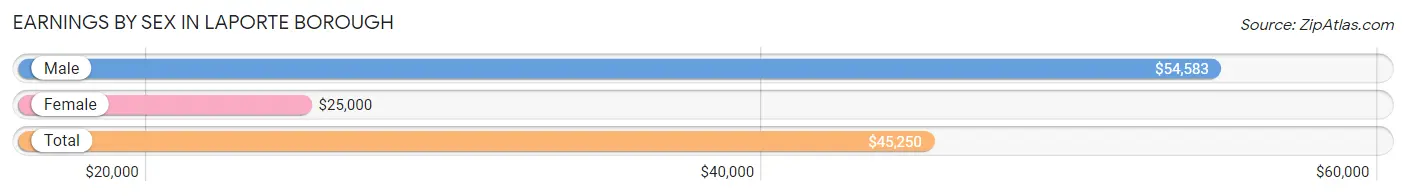
| Sex | Number | Average Earnings |
| Male | 35 (45.5%) | $54,583 |
| Female | 42 (54.5%) | $25,000 |
| Total | 77 (100.0%) | $45,250 |
Earnings by Sex by Income Bracket in Laporte borough
The most common earnings brackets in Laporte borough are $50,000 to $54,999 for men (11 | 31.4%) and $10,000 to $12,499 for women (11 | 26.2%).
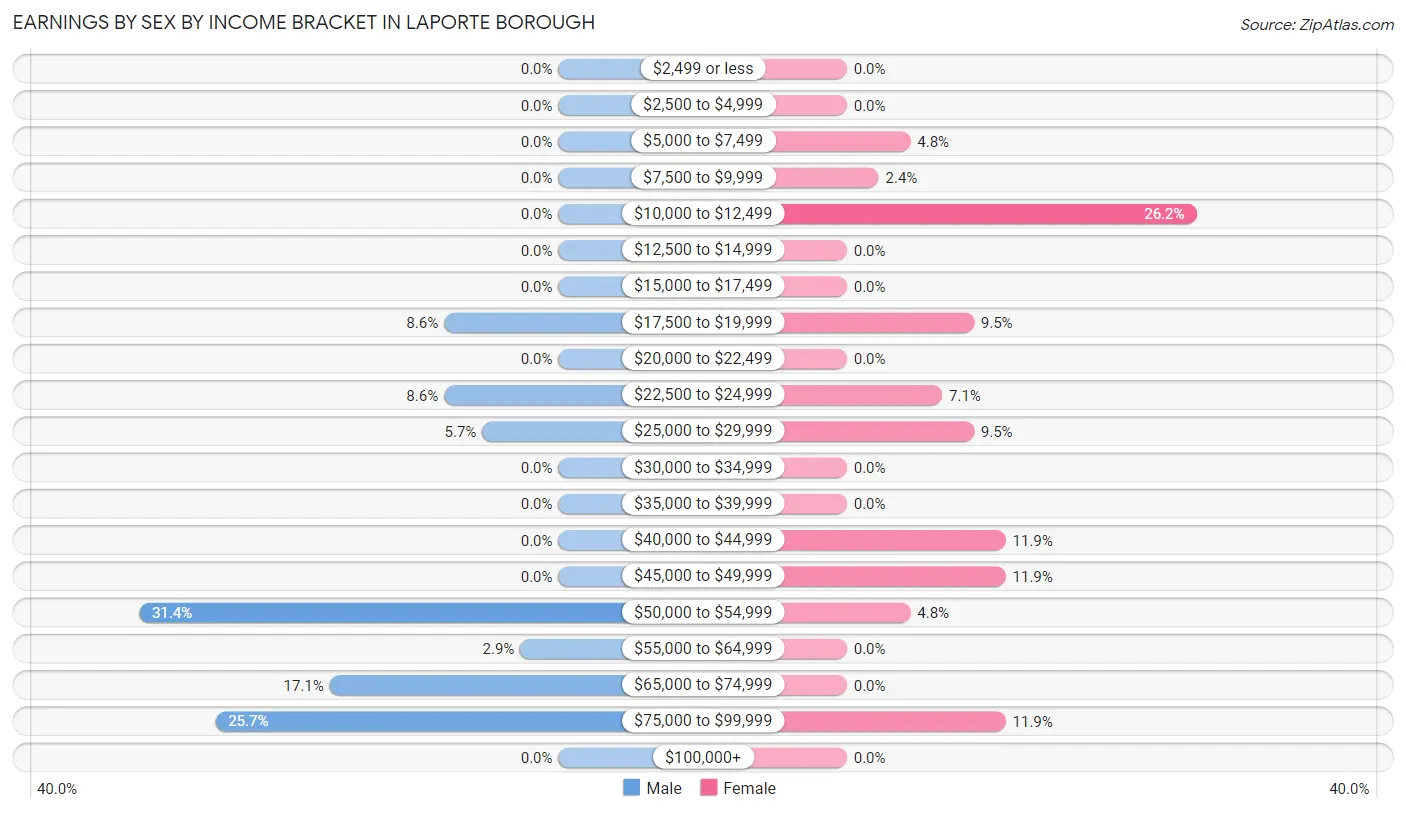
| Income | Male | Female |
| $2,499 or less | 0 (0.0%) | 0 (0.0%) |
| $2,500 to $4,999 | 0 (0.0%) | 0 (0.0%) |
| $5,000 to $7,499 | 0 (0.0%) | 2 (4.8%) |
| $7,500 to $9,999 | 0 (0.0%) | 1 (2.4%) |
| $10,000 to $12,499 | 0 (0.0%) | 11 (26.2%) |
| $12,500 to $14,999 | 0 (0.0%) | 0 (0.0%) |
| $15,000 to $17,499 | 0 (0.0%) | 0 (0.0%) |
| $17,500 to $19,999 | 3 (8.6%) | 4 (9.5%) |
| $20,000 to $22,499 | 0 (0.0%) | 0 (0.0%) |
| $22,500 to $24,999 | 3 (8.6%) | 3 (7.1%) |
| $25,000 to $29,999 | 2 (5.7%) | 4 (9.5%) |
| $30,000 to $34,999 | 0 (0.0%) | 0 (0.0%) |
| $35,000 to $39,999 | 0 (0.0%) | 0 (0.0%) |
| $40,000 to $44,999 | 0 (0.0%) | 5 (11.9%) |
| $45,000 to $49,999 | 0 (0.0%) | 5 (11.9%) |
| $50,000 to $54,999 | 11 (31.4%) | 2 (4.8%) |
| $55,000 to $64,999 | 1 (2.9%) | 0 (0.0%) |
| $65,000 to $74,999 | 6 (17.1%) | 0 (0.0%) |
| $75,000 to $99,999 | 9 (25.7%) | 5 (11.9%) |
| $100,000+ | 0 (0.0%) | 0 (0.0%) |
| Total | 35 (100.0%) | 42 (100.0%) |
Earnings by Sex by Educational Attainment in Laporte borough
Average earnings in Laporte borough are $54,861 for men and $25,313 for women, a difference of 53.9%. Men with an educational attainment of high school diploma enjoy the highest average annual earnings of $65,938, while those with bachelor's degree education earn the least with $54,286. Women with an educational attainment of college or associate's degree earn the most with the average annual earnings of $24,583, while those with college or associate's degree education have the smallest earnings of $24,583.
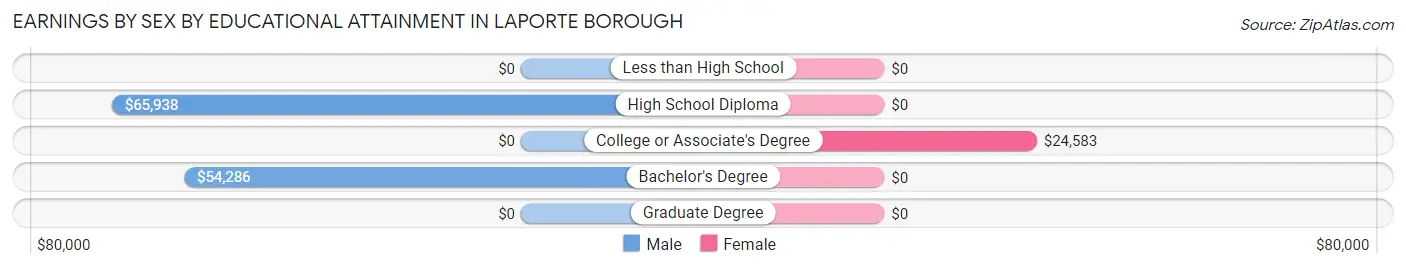
| Educational Attainment | Male Income | Female Income |
| Less than High School | - | - |
| High School Diploma | $65,938 | $0 |
| College or Associate's Degree | - | - |
| Bachelor's Degree | $54,286 | $0 |
| Graduate Degree | - | - |
| Total | $54,861 | $25,313 |
Family Income in Laporte borough
Family Income Brackets in Laporte borough
According to the Laporte borough family income data, there are 17 families falling into the $100,000 to $149,999 income range, which is the most common income bracket and makes up 32.7% of all families.
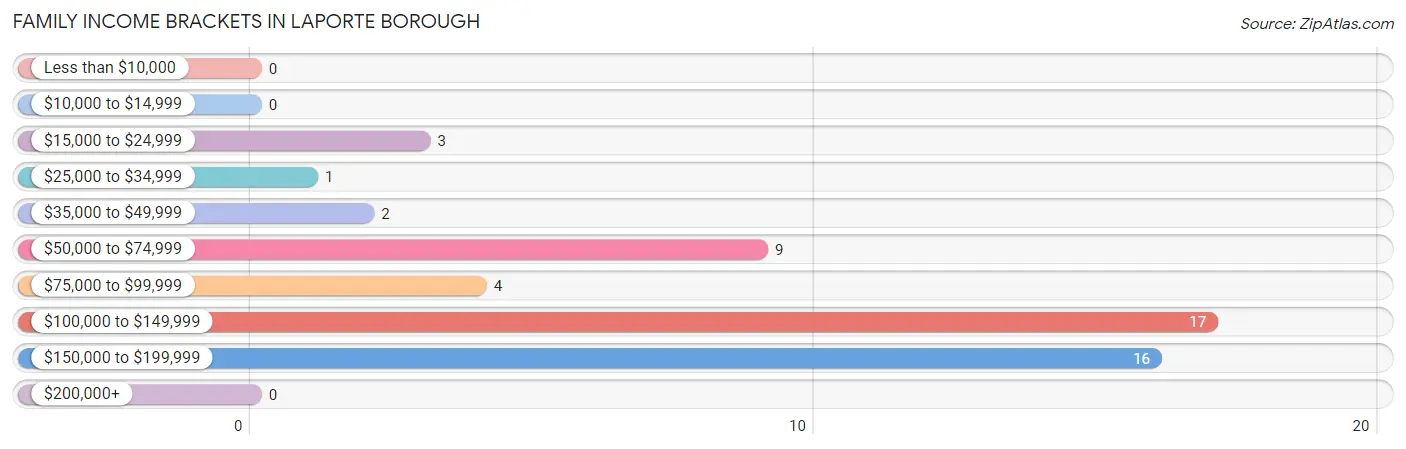
| Income Bracket | # Families | % Families |
| Less than $10,000 | 0 | 0.0% |
| $10,000 to $14,999 | 0 | 0.0% |
| $15,000 to $24,999 | 3 | 5.8% |
| $25,000 to $34,999 | 1 | 1.9% |
| $35,000 to $49,999 | 2 | 3.8% |
| $50,000 to $74,999 | 9 | 17.3% |
| $75,000 to $99,999 | 4 | 7.7% |
| $100,000 to $149,999 | 17 | 32.7% |
| $150,000 to $199,999 | 16 | 30.8% |
| $200,000+ | 0 | 0.0% |
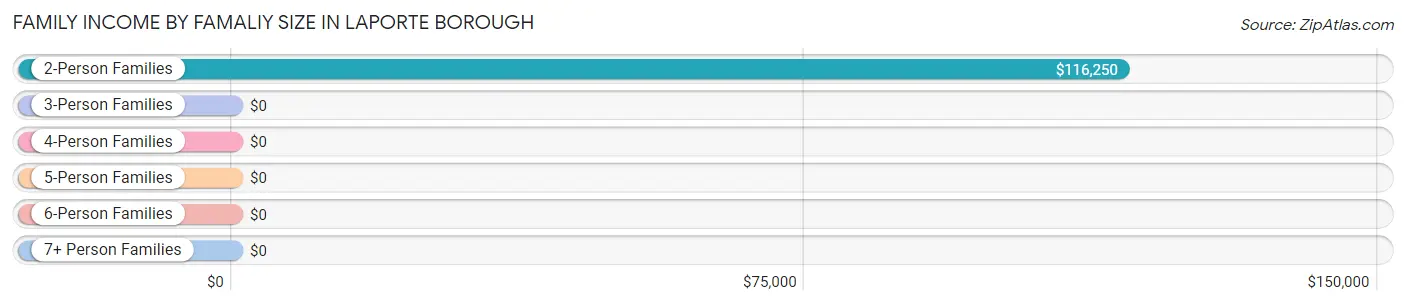
Family Income by Famaliy Size in Laporte borough
2-person families (38 | 73.1%) account for the highest median family income in Laporte borough with $116,250 per family, while 2-person families (38 | 73.1%) have the highest median income of $58,125 per family member.
| Income Bracket | # Families | Median Income |
| 2-Person Families | 38 (73.1%) | $116,250 |
| 3-Person Families | 7 (13.5%) | $0 |
| 4-Person Families | 7 (13.5%) | $0 |
| 5-Person Families | 0 (0.0%) | $0 |
| 6-Person Families | 0 (0.0%) | $0 |
| 7+ Person Families | 0 (0.0%) | $0 |
| Total | 52 (100.0%) | $116,250 |
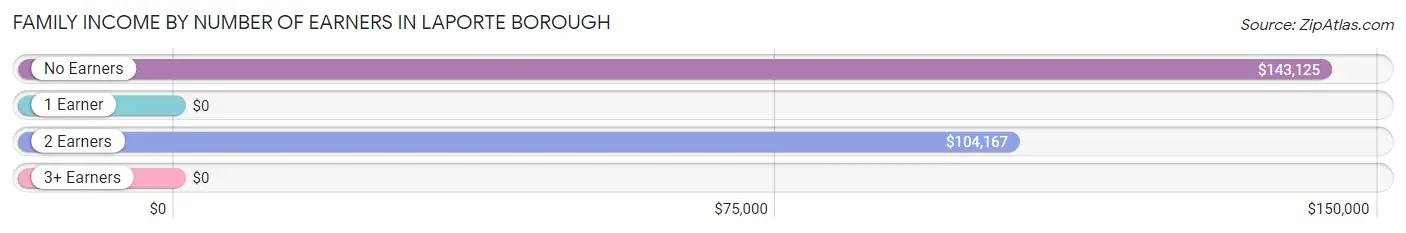
Family Income by Number of Earners in Laporte borough
| Number of Earners | # Families | Median Income |
| No Earners | 10 (19.2%) | $143,125 |
| 1 Earner | 12 (23.1%) | $0 |
| 2 Earners | 30 (57.7%) | $104,167 |
| 3+ Earners | 0 (0.0%) | $0 |
| Total | 52 (100.0%) | $116,250 |
Household Income in Laporte borough
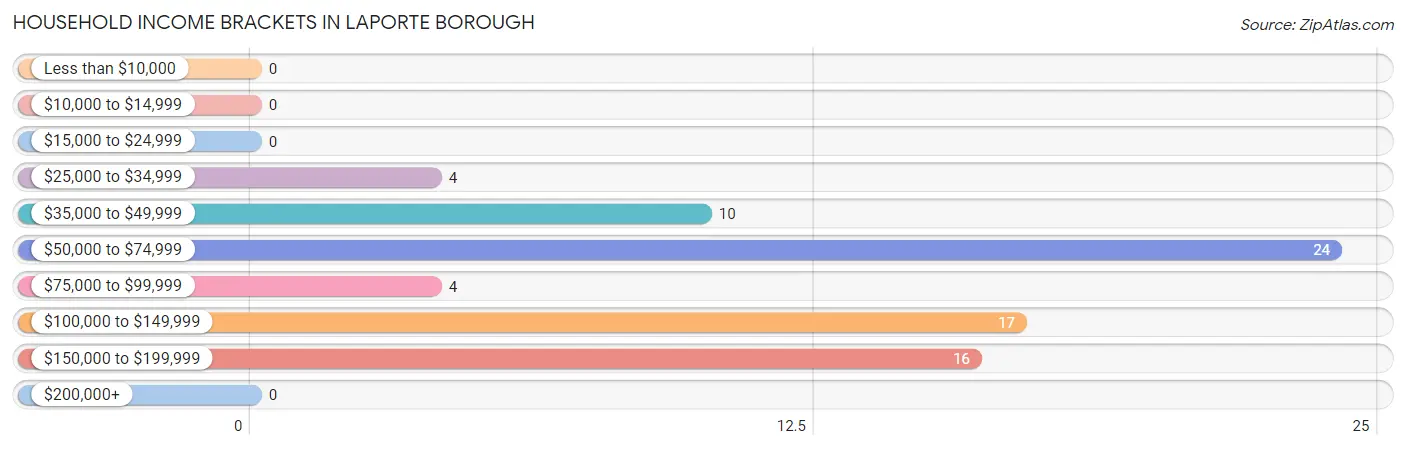
Household Income Brackets in Laporte borough
With 24 households falling in the category, the $50,000 to $74,999 income range is the most frequent in Laporte borough, accounting for 32.0% of all households.
| Income Bracket | # Households | % Households |
| Less than $10,000 | 0 | 0.0% |
| $10,000 to $14,999 | 0 | 0.0% |
| $15,000 to $24,999 | 0 | 0.0% |
| $25,000 to $34,999 | 4 | 5.3% |
| $35,000 to $49,999 | 10 | 13.3% |
| $50,000 to $74,999 | 24 | 32.0% |
| $75,000 to $99,999 | 4 | 5.3% |
| $100,000 to $149,999 | 17 | 22.7% |
| $150,000 to $199,999 | 16 | 21.3% |
| $200,000+ | 0 | 0.0% |
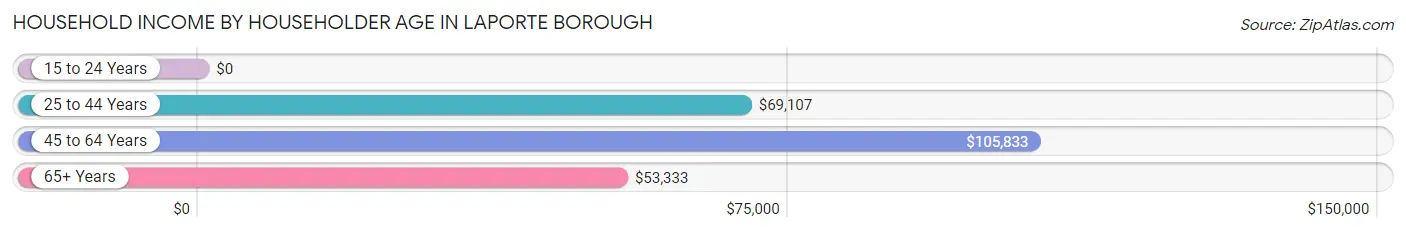
Household Income by Householder Age in Laporte borough
The median household income in Laporte borough is $74,375, with the highest median household income of $105,833 found in the 45 to 64 years age bracket for the primary householder. A total of 30 households (40.0%) fall into this category.
| Income Bracket | # Households | Median Income |
| 15 to 24 Years | 0 (0.0%) | $0 |
| 25 to 44 Years | 15 (20.0%) | $69,107 |
| 45 to 64 Years | 30 (40.0%) | $105,833 |
| 65+ Years | 30 (40.0%) | $53,333 |
| Total | 75 (100.0%) | $74,375 |
Poverty in Laporte borough
Income Below Poverty by Sex and Age in Laporte borough
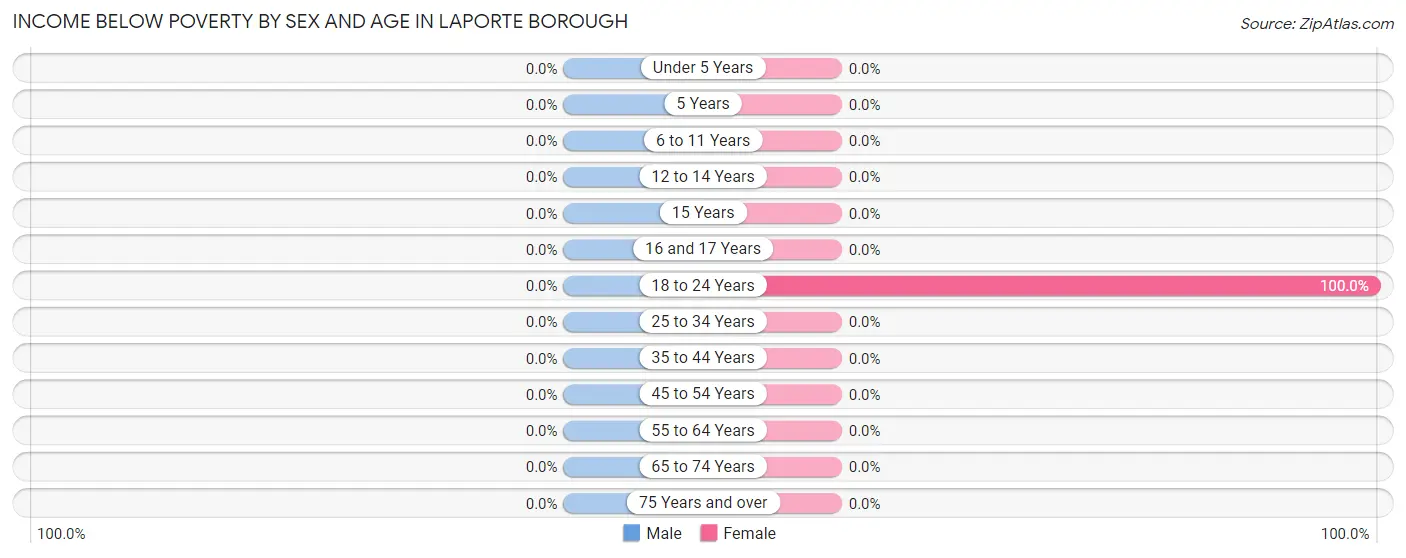
| Age Bracket | Male | Female |
| Under 5 Years | 0 (0.0%) | 0 (0.0%) |
| 5 Years | 0 (0.0%) | 0 (0.0%) |
| 6 to 11 Years | 0 (0.0%) | 0 (0.0%) |
| 12 to 14 Years | 0 (0.0%) | 0 (0.0%) |
| 15 Years | 0 (0.0%) | 0 (0.0%) |
| 16 and 17 Years | 0 (0.0%) | 0 (0.0%) |
| 18 to 24 Years | 0 (0.0%) | 1 (100.0%) |
| 25 to 34 Years | 0 (0.0%) | 0 (0.0%) |
| 35 to 44 Years | 0 (0.0%) | 0 (0.0%) |
| 45 to 54 Years | 0 (0.0%) | 0 (0.0%) |
| 55 to 64 Years | 0 (0.0%) | 0 (0.0%) |
| 65 to 74 Years | 0 (0.0%) | 0 (0.0%) |
| 75 Years and over | 0 (0.0%) | 0 (0.0%) |
| Total | 0 (0.0%) | 1 (1.5%) |
Income Above Poverty by Sex and Age in Laporte borough
According to the poverty statistics in Laporte borough, males aged under 5 years and females aged 25 to 34 years are the age groups that are most secure financially, with 100.0% of males and 100.0% of females in these age groups living above the poverty line.
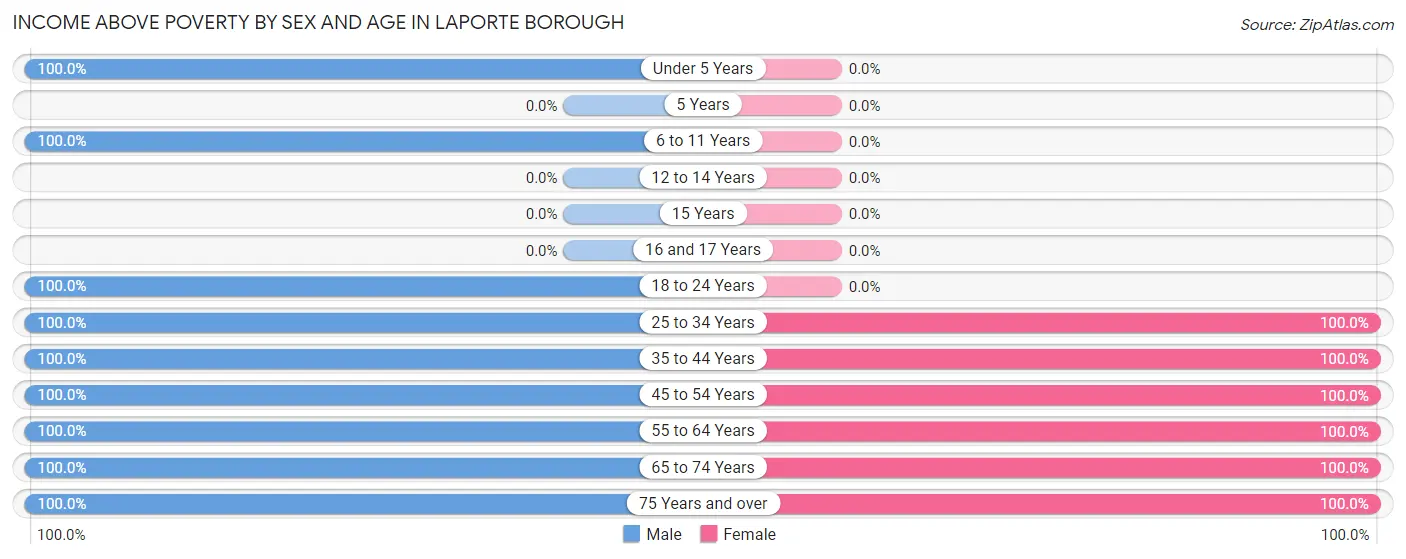
| Age Bracket | Male | Female |
| Under 5 Years | 6 (100.0%) | 0 (0.0%) |
| 5 Years | 0 (0.0%) | 0 (0.0%) |
| 6 to 11 Years | 8 (100.0%) | 0 (0.0%) |
| 12 to 14 Years | 0 (0.0%) | 0 (0.0%) |
| 15 Years | 0 (0.0%) | 0 (0.0%) |
| 16 and 17 Years | 0 (0.0%) | 0 (0.0%) |
| 18 to 24 Years | 2 (100.0%) | 0 (0.0%) |
| 25 to 34 Years | 8 (100.0%) | 5 (100.0%) |
| 35 to 44 Years | 7 (100.0%) | 6 (100.0%) |
| 45 to 54 Years | 4 (100.0%) | 3 (100.0%) |
| 55 to 64 Years | 14 (100.0%) | 21 (100.0%) |
| 65 to 74 Years | 11 (100.0%) | 22 (100.0%) |
| 75 Years and over | 7 (100.0%) | 11 (100.0%) |
| Total | 67 (100.0%) | 68 (98.6%) |
Income Below Poverty Among Married-Couple Families in Laporte borough
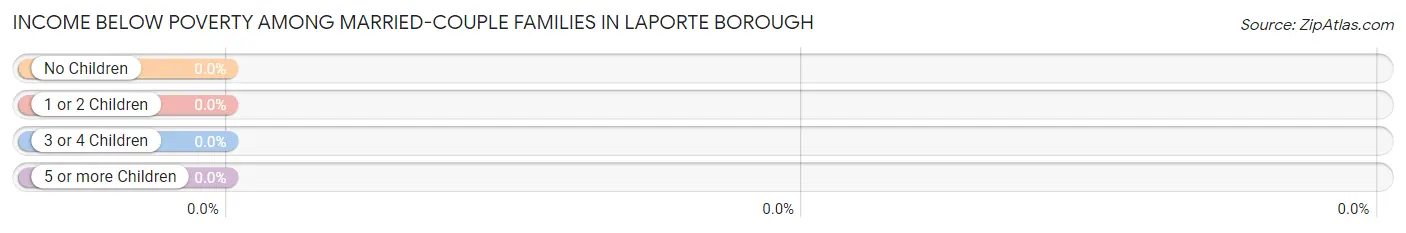
| Children | Above Poverty | Below Poverty |
| No Children | 35 (100.0%) | 0 (0.0%) |
| 1 or 2 Children | 12 (100.0%) | 0 (0.0%) |
| 3 or 4 Children | 0 (0.0%) | 0 (0.0%) |
| 5 or more Children | 0 (0.0%) | 0 (0.0%) |
| Total | 47 (100.0%) | 0 (0.0%) |
Income Below Poverty Among Single-Parent Households in Laporte borough
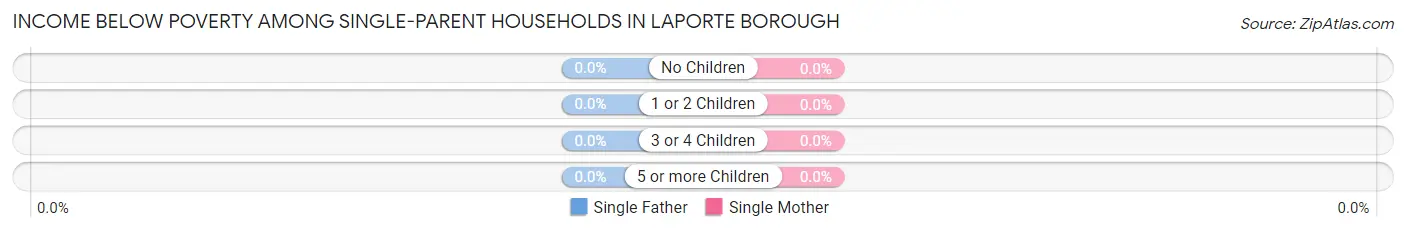
| Children | Single Father | Single Mother |
| No Children | 0 (0.0%) | 0 (0.0%) |
| 1 or 2 Children | 0 (0.0%) | 0 (0.0%) |
| 3 or 4 Children | 0 (0.0%) | 0 (0.0%) |
| 5 or more Children | 0 (0.0%) | 0 (0.0%) |
| Total | 0 (0.0%) | 0 (0.0%) |
Income Below Poverty Among Married-Couple vs Single-Parent Households in Laporte borough
| Children | Married-Couple Families | Single-Parent Households |
| No Children | 0 (0.0%) | 0 (0.0%) |
| 1 or 2 Children | 0 (0.0%) | 0 (0.0%) |
| 3 or 4 Children | 0 (0.0%) | 0 (0.0%) |
| 5 or more Children | 0 (0.0%) | 0 (0.0%) |
| Total | 0 (0.0%) | 0 (0.0%) |
Race in Laporte borough
The most populous races in Laporte borough are , and White / Caucasian (254 | 100.0%).
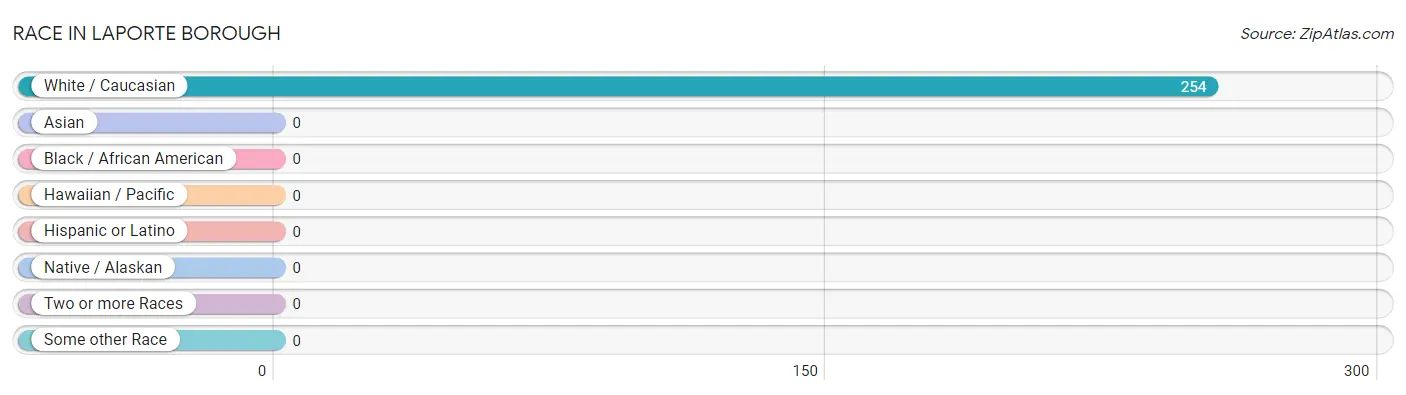
| Race | # Population | % Population |
| Asian | 0 | 0.0% |
| Black / African American | 0 | 0.0% |
| Hawaiian / Pacific | 0 | 0.0% |
| Hispanic or Latino | 0 | 0.0% |
| Native / Alaskan | 0 | 0.0% |
| White / Caucasian | 254 | 100.0% |
| Two or more Races | 0 | 0.0% |
| Some other Race | 0 | 0.0% |
| Total | 254 | 100.0% |
Ancestry in Laporte borough
The most populous ancestries reported in Laporte borough are German (88 | 34.6%), Irish (36 | 14.2%), English (25 | 9.8%), Polish (12 | 4.7%), and Italian (9 | 3.5%), together accounting for 66.9% of all Laporte borough residents.
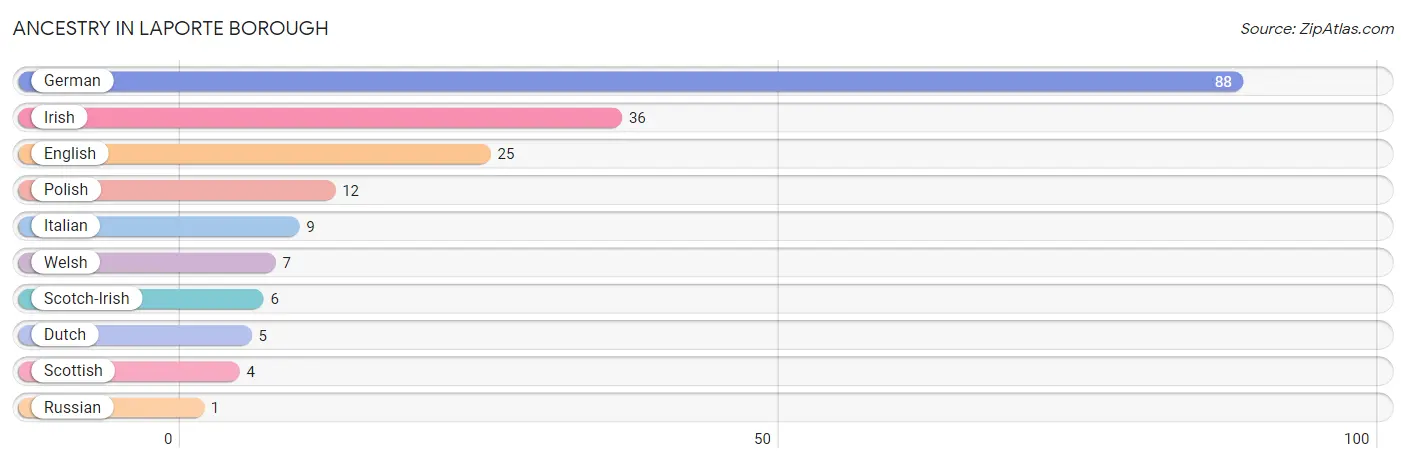
| Ancestry | # Population | % Population |
| Dutch | 5 | 2.0% |
| English | 25 | 9.8% |
| German | 88 | 34.6% |
| Irish | 36 | 14.2% |
| Italian | 9 | 3.5% |
| Polish | 12 | 4.7% |
| Russian | 1 | 0.4% |
| Scotch-Irish | 6 | 2.4% |
| Scottish | 4 | 1.6% |
| Welsh | 7 | 2.8% | View All 10 Rows |
Immigrants in Laporte borough
The most numerous immigrant groups reported in Laporte borough came from Europe (6 | 2.4%), Northern Europe (6 | 2.4%), and Scotland (6 | 2.4%), together accounting for 7.1% of all Laporte borough residents.
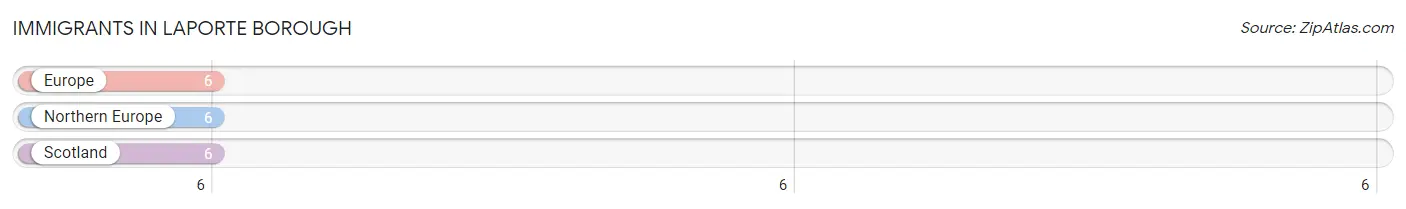
| Immigration Origin | # Population | % Population |
| Europe | 6 | 2.4% |
| Northern Europe | 6 | 2.4% |
| Scotland | 6 | 2.4% | View All 3 Rows |
Sex and Age in Laporte borough
Sex and Age in Laporte borough
The most populous age groups in Laporte borough are 70 to 74 Years (31 | 23.5%) for men and 85 Years and over (25 | 20.5%) for women.
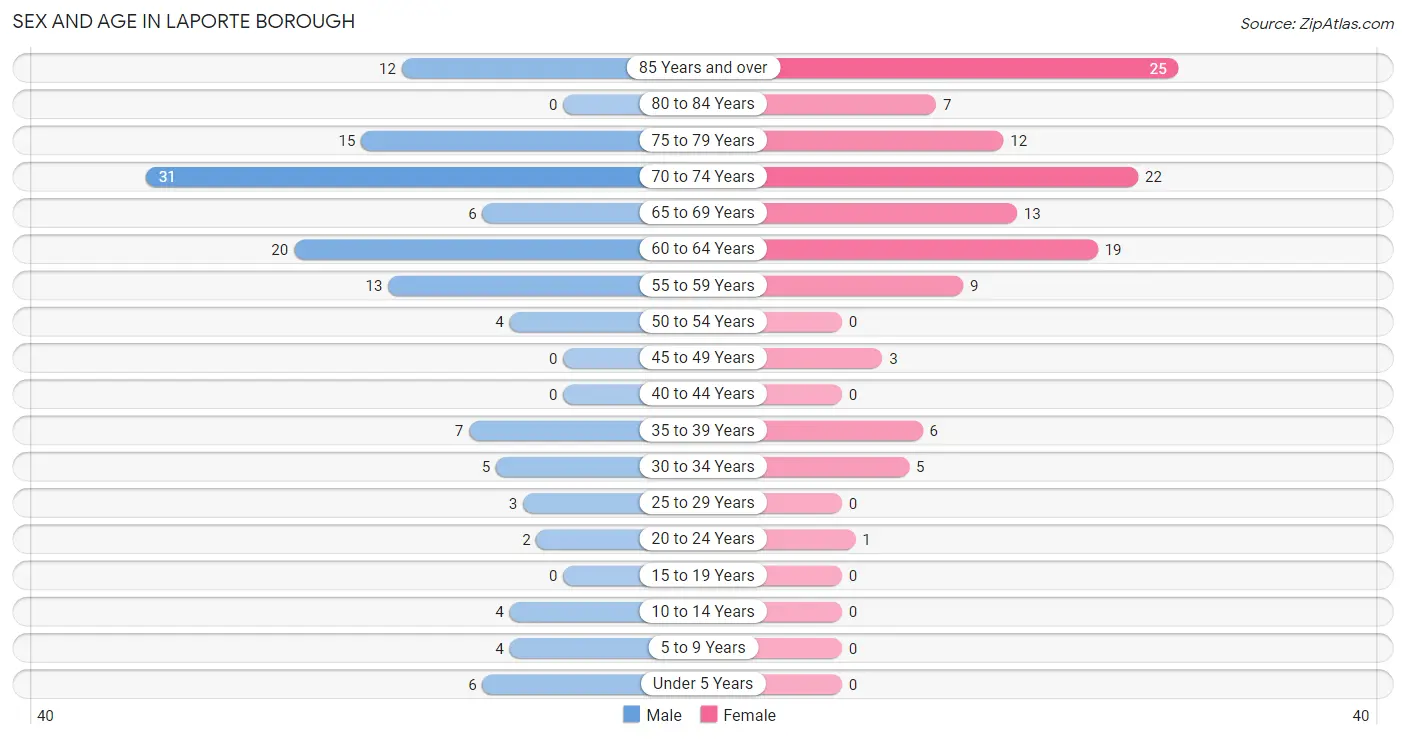
| Age Bracket | Male | Female |
| Under 5 Years | 6 (4.5%) | 0 (0.0%) |
| 5 to 9 Years | 4 (3.0%) | 0 (0.0%) |
| 10 to 14 Years | 4 (3.0%) | 0 (0.0%) |
| 15 to 19 Years | 0 (0.0%) | 0 (0.0%) |
| 20 to 24 Years | 2 (1.5%) | 1 (0.8%) |
| 25 to 29 Years | 3 (2.3%) | 0 (0.0%) |
| 30 to 34 Years | 5 (3.8%) | 5 (4.1%) |
| 35 to 39 Years | 7 (5.3%) | 6 (4.9%) |
| 40 to 44 Years | 0 (0.0%) | 0 (0.0%) |
| 45 to 49 Years | 0 (0.0%) | 3 (2.5%) |
| 50 to 54 Years | 4 (3.0%) | 0 (0.0%) |
| 55 to 59 Years | 13 (9.9%) | 9 (7.4%) |
| 60 to 64 Years | 20 (15.1%) | 19 (15.6%) |
| 65 to 69 Years | 6 (4.5%) | 13 (10.7%) |
| 70 to 74 Years | 31 (23.5%) | 22 (18.0%) |
| 75 to 79 Years | 15 (11.4%) | 12 (9.8%) |
| 80 to 84 Years | 0 (0.0%) | 7 (5.7%) |
| 85 Years and over | 12 (9.1%) | 25 (20.5%) |
| Total | 132 (100.0%) | 122 (100.0%) |
Families and Households in Laporte borough
Median Family Size in Laporte borough
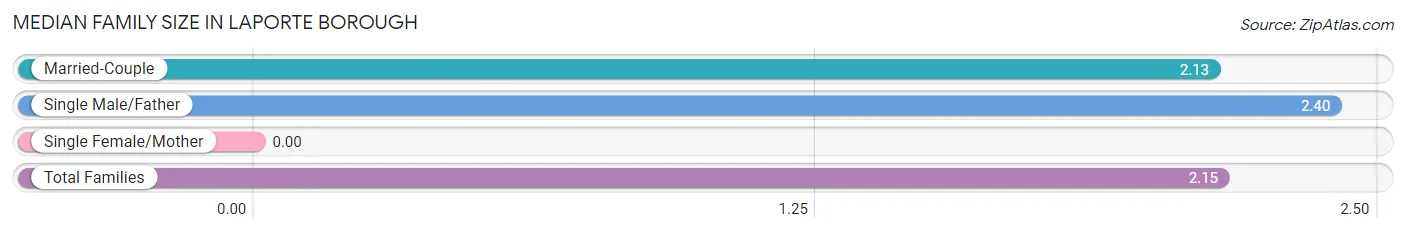
| Family Type | # Families | Family Size |
| Married-Couple | 47 (90.4%) | 2.13 |
| Single Male/Father | 5 (9.6%) | 2.40 |
| Single Female/Mother | 0 (0.0%) | - |
| Total Families | 52 (100.0%) | 2.15 |
Median Household Size in Laporte borough
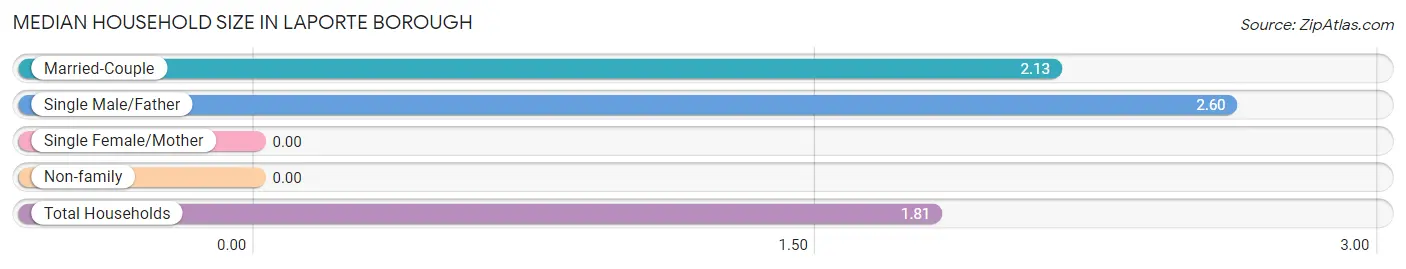
| Household Type | # Households | Household Size |
| Married-Couple | 47 (62.7%) | 2.13 |
| Single Male/Father | 5 (6.7%) | 2.60 |
| Single Female/Mother | 0 (0.0%) | - |
| Non-family | 23 (30.7%) | - |
| Total Households | 75 (100.0%) | 1.81 |
Household Size by Marriage Status in Laporte borough
Out of a total of 75 households in Laporte borough, 52 (69.3%) are family households, while 23 (30.7%) are nonfamily households. The most numerous type of family households are 2-person households, comprising 35, and the most common type of nonfamily households are 1-person households, comprising 23.
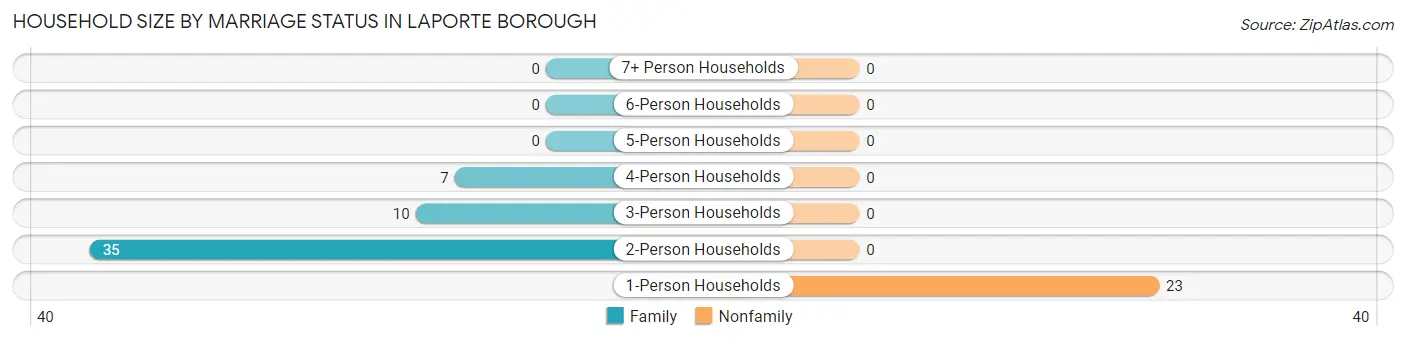
| Household Size | Family Households | Nonfamily Households |
| 1-Person Households | - | 23 (30.7%) |
| 2-Person Households | 35 (46.7%) | 0 (0.0%) |
| 3-Person Households | 10 (13.3%) | 0 (0.0%) |
| 4-Person Households | 7 (9.3%) | 0 (0.0%) |
| 5-Person Households | 0 (0.0%) | 0 (0.0%) |
| 6-Person Households | 0 (0.0%) | 0 (0.0%) |
| 7+ Person Households | 0 (0.0%) | 0 (0.0%) |
| Total | 52 (69.3%) | 23 (30.7%) |
Female Fertility in Laporte borough
Fertility by Age in Laporte borough
Average fertility rate in Laporte borough is 67.0 births per 1,000 women. Women in the age bracket of 20 to 34 years have the highest fertility rate with 167.0 births per 1,000 women. Women in the age bracket of 20 to 34 years acount for 100.0% of all women with births.
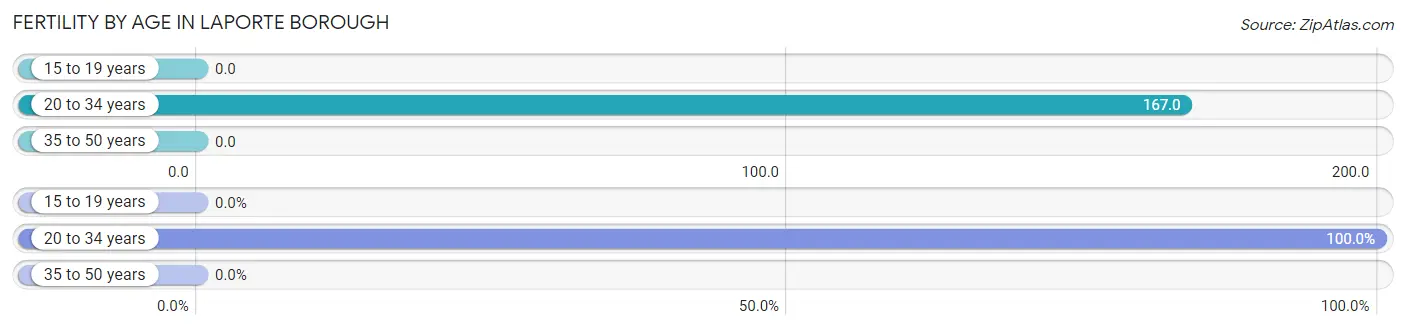
| Age Bracket | Women with Births | Births / 1,000 Women |
| 15 to 19 years | 0 (0.0%) | 0.0 |
| 20 to 34 years | 1 (100.0%) | 167.0 |
| 35 to 50 years | 0 (0.0%) | 0.0 |
| Total | 1 (100.0%) | 67.0 |
Fertility by Age by Marriage Status in Laporte borough
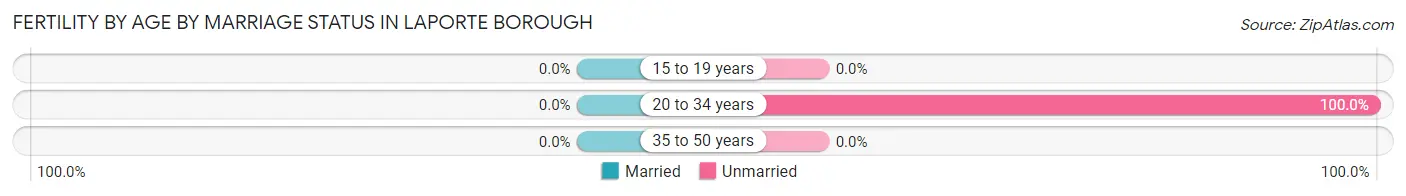
| Age Bracket | Married | Unmarried |
| 15 to 19 years | 0 (0.0%) | 0 (0.0%) |
| 20 to 34 years | 0 (0.0%) | 1 (100.0%) |
| 35 to 50 years | 0 (0.0%) | 0 (0.0%) |
| Total | 0 (0.0%) | 1 (100.0%) |
Fertility by Education in Laporte borough
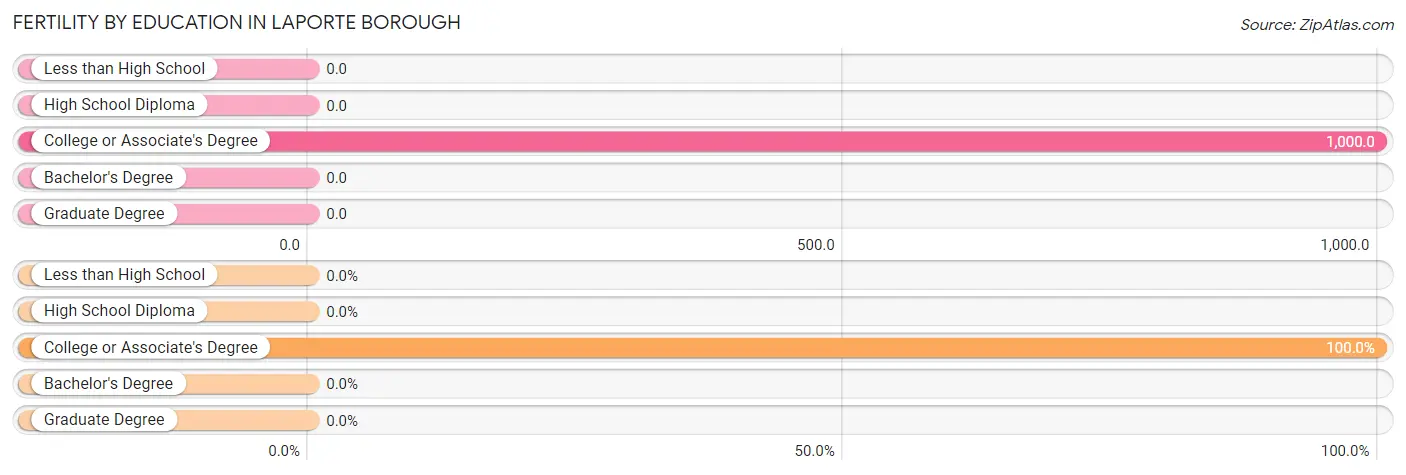
| Educational Attainment | Women with Births | Births / 1,000 Women |
| Less than High School | 0 (0.0%) | 0.0 |
| High School Diploma | 0 (0.0%) | 0.0 |
| College or Associate's Degree | 1 (100.0%) | 1,000.0 |
| Bachelor's Degree | 0 (0.0%) | 0.0 |
| Graduate Degree | 0 (0.0%) | 0.0 |
| Total | 1 (100.0%) | 67.0 |
Fertility by Education by Marriage Status in Laporte borough
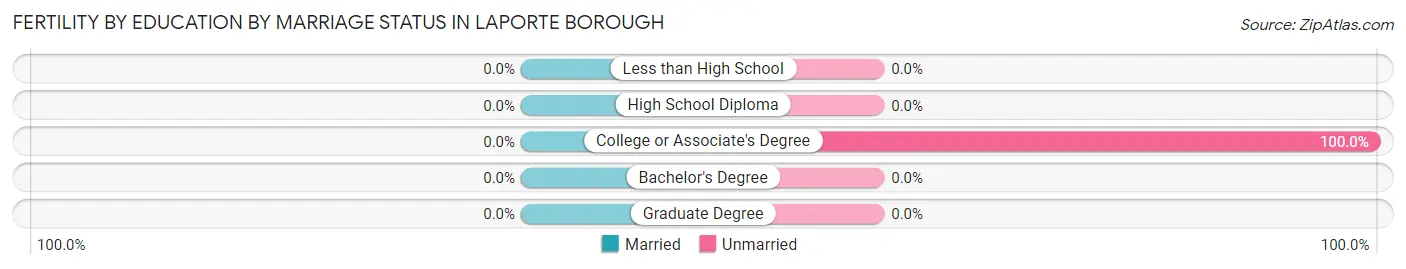
| Educational Attainment | Married | Unmarried |
| Less than High School | 0 (0.0%) | 0 (0.0%) |
| High School Diploma | 0 (0.0%) | 0 (0.0%) |
| College or Associate's Degree | 0 (0.0%) | 1 (100.0%) |
| Bachelor's Degree | 0 (0.0%) | 0 (0.0%) |
| Graduate Degree | 0 (0.0%) | 0 (0.0%) |
| Total | 0 (0.0%) | 1 (100.0%) |
Employment Characteristics in Laporte borough
Employment by Class of Employer in Laporte borough
Among the 66 employed individuals in Laporte borough, private company employees (30 | 45.5%), local government employees (18 | 27.3%), and self-employed (not incorporated) (10 | 15.1%) make up the most common classes of employment.
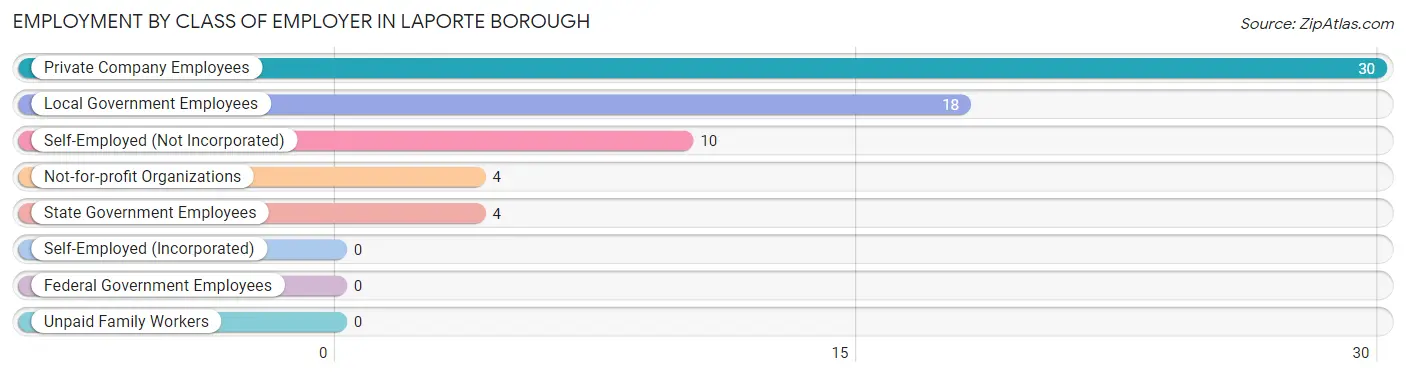
| Employer Class | # Employees | % Employees |
| Private Company Employees | 30 | 45.5% |
| Self-Employed (Incorporated) | 0 | 0.0% |
| Self-Employed (Not Incorporated) | 10 | 15.1% |
| Not-for-profit Organizations | 4 | 6.1% |
| Local Government Employees | 18 | 27.3% |
| State Government Employees | 4 | 6.1% |
| Federal Government Employees | 0 | 0.0% |
| Unpaid Family Workers | 0 | 0.0% |
| Total | 66 | 100.0% |
Employment Status by Age in Laporte borough
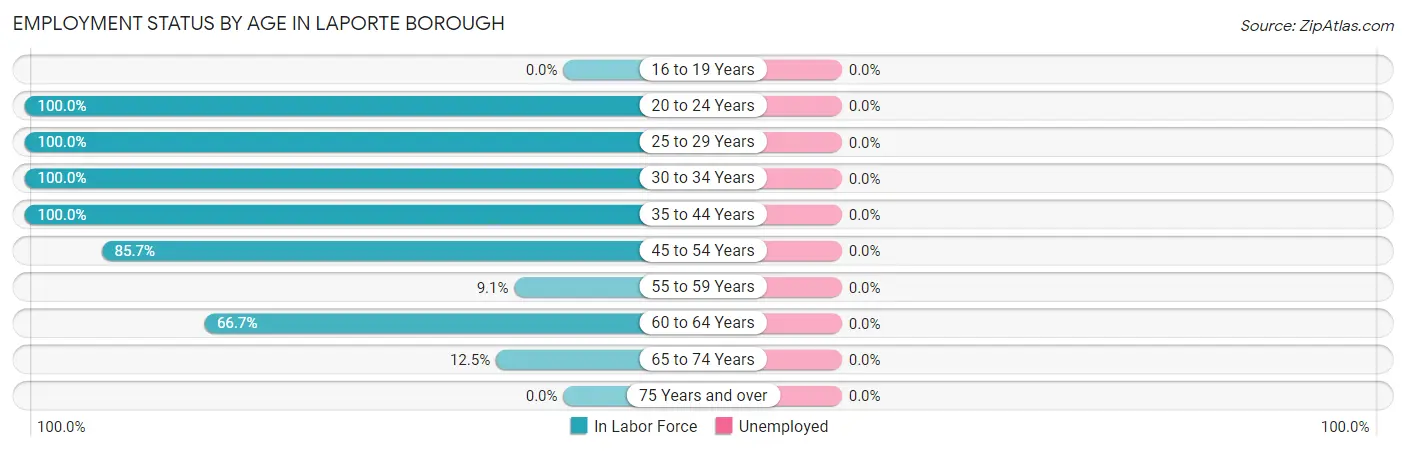
| Age Bracket | In Labor Force | Unemployed |
| 16 to 19 Years | 0 (0.0%) | 0 (0.0%) |
| 20 to 24 Years | 3 (100.0%) | 0 (0.0%) |
| 25 to 29 Years | 3 (100.0%) | 0 (0.0%) |
| 30 to 34 Years | 10 (100.0%) | 0 (0.0%) |
| 35 to 44 Years | 13 (100.0%) | 0 (0.0%) |
| 45 to 54 Years | 6 (85.7%) | 0 (0.0%) |
| 55 to 59 Years | 2 (9.1%) | 0 (0.0%) |
| 60 to 64 Years | 26 (66.7%) | 0 (0.0%) |
| 65 to 74 Years | 9 (12.5%) | 0 (0.0%) |
| 75 Years and over | 0 (0.0%) | 0 (0.0%) |
| Total | 72 (30.0%) | 0 (0.0%) |
Employment Status by Educational Attainment in Laporte borough

| Educational Attainment | In Labor Force | Unemployed |
| Less than High School | 0 (0.0%) | 0 (0.0%) |
| High School Diploma | 22 (44.9%) | 0 (0.0%) |
| College / Associate Degree | 8 (53.3%) | 0 (0.0%) |
| Bachelor's Degree or higher | 30 (100.0%) | 0 (0.0%) |
| Total | 60 (63.8%) | 0 (0.0%) |
Employment Occupations by Sex in Laporte borough
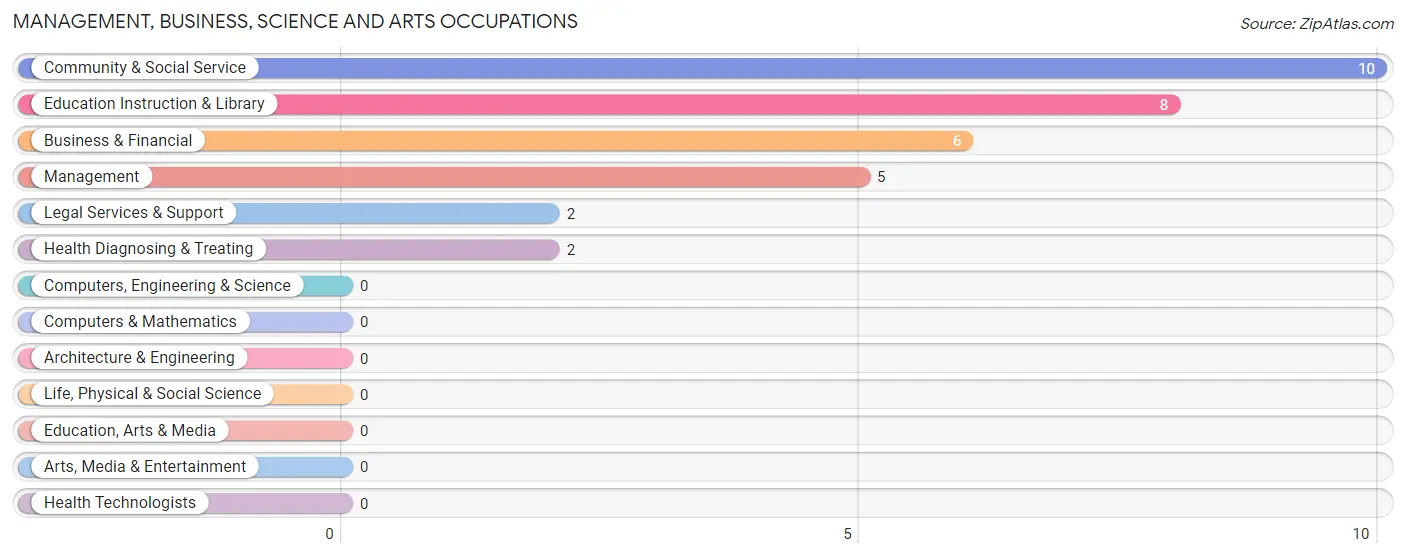
Management, Business, Science and Arts Occupations
The most common Management, Business, Science and Arts occupations in Laporte borough are Community & Social Service (10 | 13.9%), Education Instruction & Library (8 | 11.1%), Business & Financial (6 | 8.3%), Management (5 | 6.9%), and Legal Services & Support (2 | 2.8%).
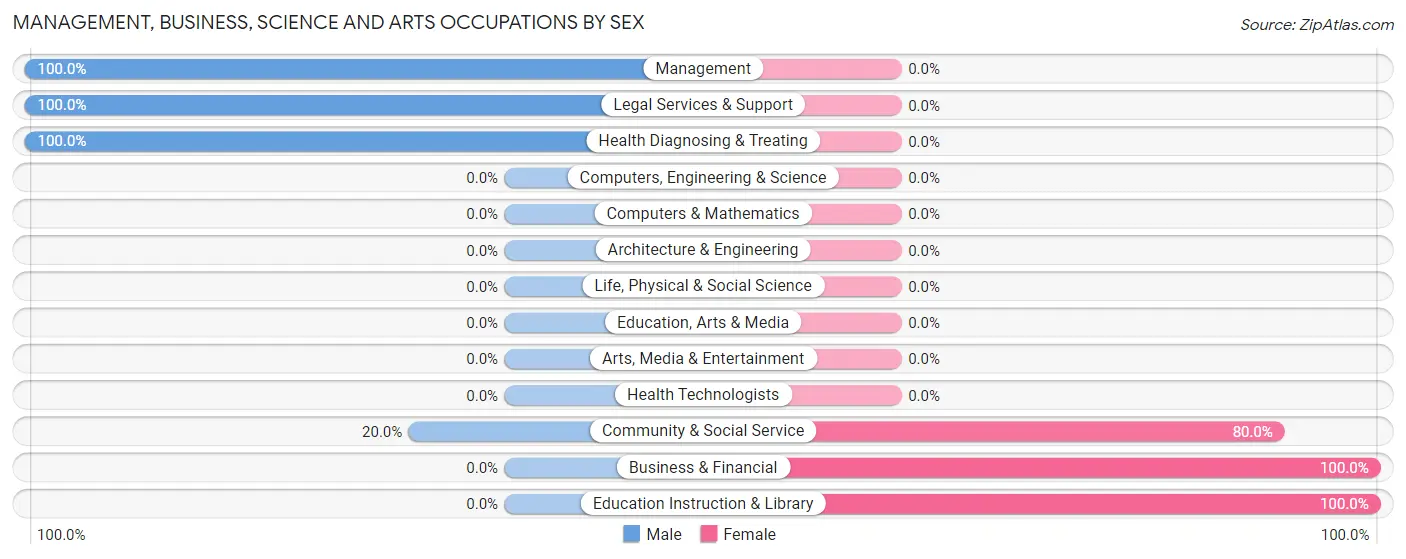
Management, Business, Science and Arts Occupations by Sex
Within the Management, Business, Science and Arts occupations in Laporte borough, the most male-oriented occupations are Management (100.0%), Legal Services & Support (100.0%), and Health Diagnosing & Treating (100.0%), while the most female-oriented occupations are Business & Financial (100.0%), Education Instruction & Library (100.0%), and Community & Social Service (80.0%).
| Occupation | Male | Female |
| Management | 5 (100.0%) | 0 (0.0%) |
| Business & Financial | 0 (0.0%) | 6 (100.0%) |
| Computers, Engineering & Science | 0 (0.0%) | 0 (0.0%) |
| Computers & Mathematics | 0 (0.0%) | 0 (0.0%) |
| Architecture & Engineering | 0 (0.0%) | 0 (0.0%) |
| Life, Physical & Social Science | 0 (0.0%) | 0 (0.0%) |
| Community & Social Service | 2 (20.0%) | 8 (80.0%) |
| Education, Arts & Media | 0 (0.0%) | 0 (0.0%) |
| Legal Services & Support | 2 (100.0%) | 0 (0.0%) |
| Education Instruction & Library | 0 (0.0%) | 8 (100.0%) |
| Arts, Media & Entertainment | 0 (0.0%) | 0 (0.0%) |
| Health Diagnosing & Treating | 2 (100.0%) | 0 (0.0%) |
| Health Technologists | 0 (0.0%) | 0 (0.0%) |
| Total (Category) | 9 (39.1%) | 14 (60.9%) |
| Total (Overall) | 32 (44.4%) | 40 (55.6%) |
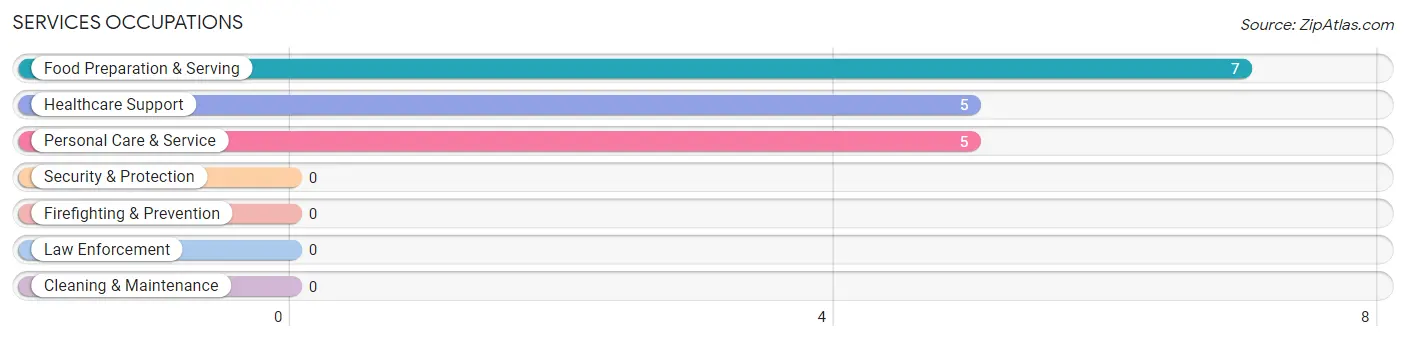
Services Occupations
The most common Services occupations in Laporte borough are Food Preparation & Serving (7 | 9.7%), Healthcare Support (5 | 6.9%), and Personal Care & Service (5 | 6.9%).
Services Occupations by Sex
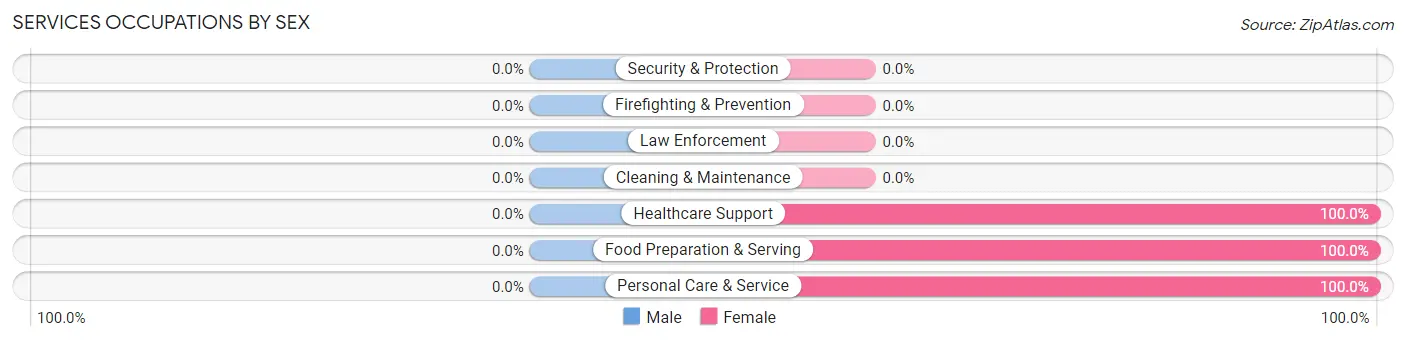
| Occupation | Male | Female |
| Healthcare Support | 0 (0.0%) | 5 (100.0%) |
| Security & Protection | 0 (0.0%) | 0 (0.0%) |
| Firefighting & Prevention | 0 (0.0%) | 0 (0.0%) |
| Law Enforcement | 0 (0.0%) | 0 (0.0%) |
| Food Preparation & Serving | 0 (0.0%) | 7 (100.0%) |
| Cleaning & Maintenance | 0 (0.0%) | 0 (0.0%) |
| Personal Care & Service | 0 (0.0%) | 5 (100.0%) |
| Total (Category) | 0 (0.0%) | 17 (100.0%) |
| Total (Overall) | 32 (44.4%) | 40 (55.6%) |
Sales and Office Occupations
The most common Sales and Office occupations in Laporte borough are Sales & Related (11 | 15.3%), and Office & Administration (5 | 6.9%).

Sales and Office Occupations by Sex

| Occupation | Male | Female |
| Sales & Related | 7 (63.6%) | 4 (36.4%) |
| Office & Administration | 0 (0.0%) | 5 (100.0%) |
| Total (Category) | 7 (43.8%) | 9 (56.2%) |
| Total (Overall) | 32 (44.4%) | 40 (55.6%) |
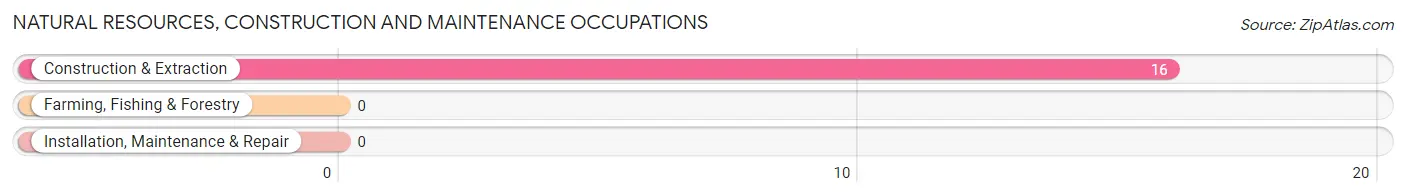
Natural Resources, Construction and Maintenance Occupations
The most common Natural Resources, Construction and Maintenance occupations in Laporte borough are , and Construction & Extraction (16 | 22.2%).
Natural Resources, Construction and Maintenance Occupations by Sex

| Occupation | Male | Female |
| Farming, Fishing & Forestry | 0 (0.0%) | 0 (0.0%) |
| Construction & Extraction | 16 (100.0%) | 0 (0.0%) |
| Installation, Maintenance & Repair | 0 (0.0%) | 0 (0.0%) |
| Total (Category) | 16 (100.0%) | 0 (0.0%) |
| Total (Overall) | 32 (44.4%) | 40 (55.6%) |
Production, Transportation and Moving Occupations
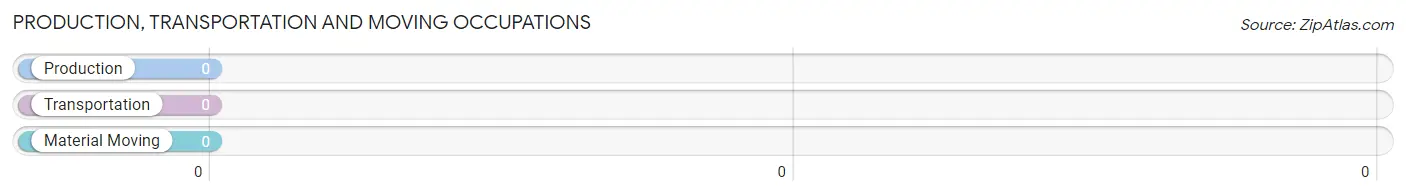
Production, Transportation and Moving Occupations by Sex
| Occupation | Male | Female |
| Production | 0 (0.0%) | 0 (0.0%) |
| Transportation | 0 (0.0%) | 0 (0.0%) |
| Material Moving | 0 (0.0%) | 0 (0.0%) |
| Total (Category) | 0 (0.0%) | 0 (0.0%) |
| Total (Overall) | 32 (44.4%) | 40 (55.6%) |
Employment Industries by Sex in Laporte borough
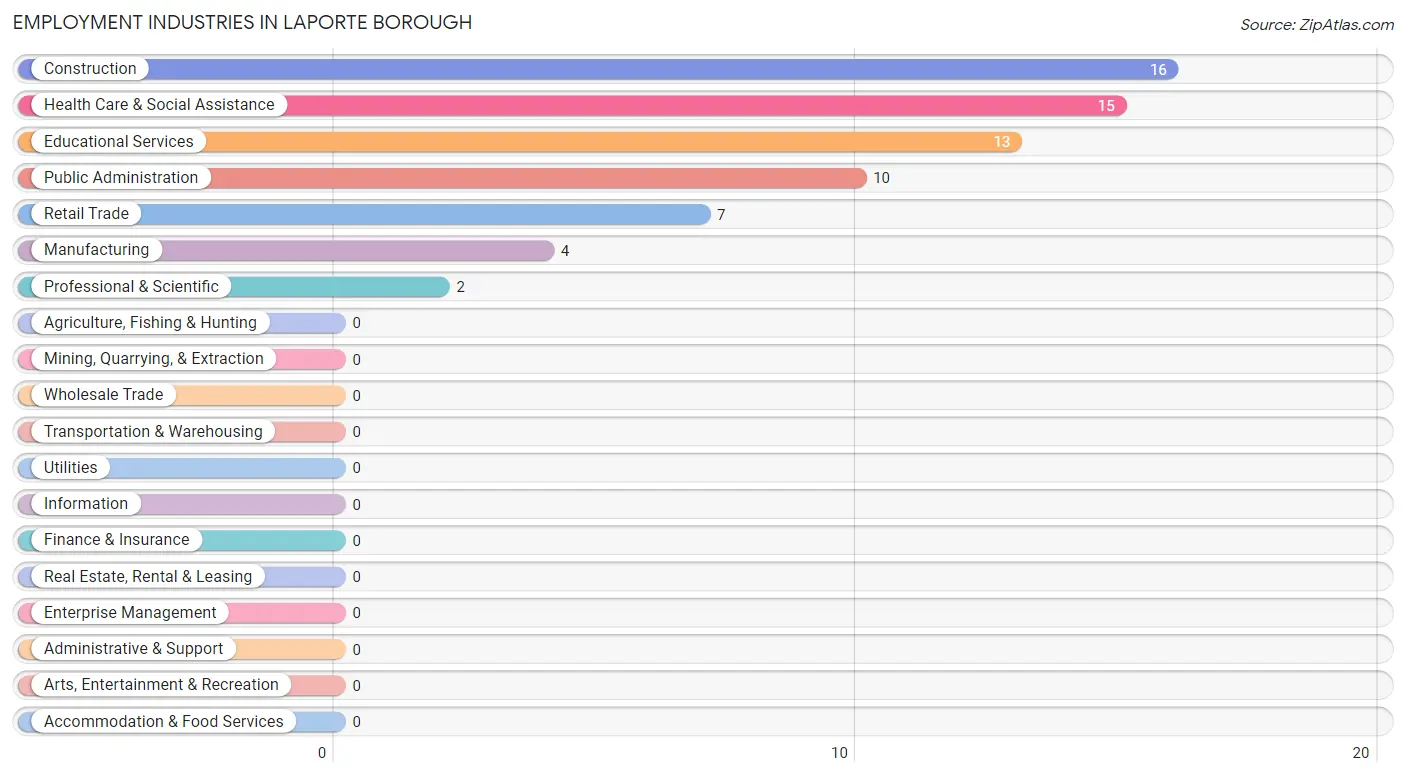
Employment Industries in Laporte borough
The major employment industries in Laporte borough include Construction (16 | 22.2%), Health Care & Social Assistance (15 | 20.8%), Educational Services (13 | 18.1%), Public Administration (10 | 13.9%), and Retail Trade (7 | 9.7%).
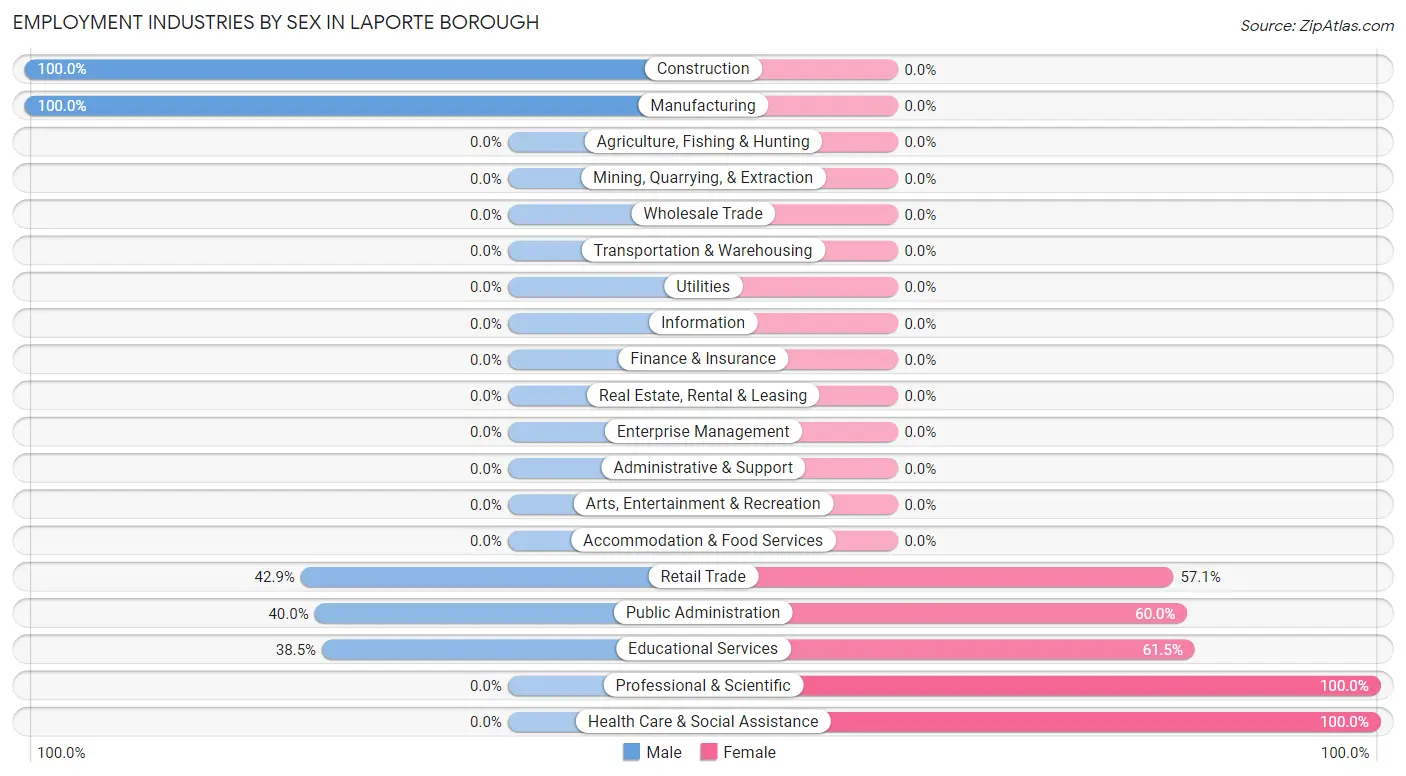
Employment Industries by Sex in Laporte borough
The Laporte borough industries that see more men than women are Construction (100.0%), Manufacturing (100.0%), and Retail Trade (42.9%), whereas the industries that tend to have a higher number of women are Professional & Scientific (100.0%), Health Care & Social Assistance (100.0%), and Educational Services (61.5%).
| Industry | Male | Female |
| Agriculture, Fishing & Hunting | 0 (0.0%) | 0 (0.0%) |
| Mining, Quarrying, & Extraction | 0 (0.0%) | 0 (0.0%) |
| Construction | 16 (100.0%) | 0 (0.0%) |
| Manufacturing | 4 (100.0%) | 0 (0.0%) |
| Wholesale Trade | 0 (0.0%) | 0 (0.0%) |
| Retail Trade | 3 (42.9%) | 4 (57.1%) |
| Transportation & Warehousing | 0 (0.0%) | 0 (0.0%) |
| Utilities | 0 (0.0%) | 0 (0.0%) |
| Information | 0 (0.0%) | 0 (0.0%) |
| Finance & Insurance | 0 (0.0%) | 0 (0.0%) |
| Real Estate, Rental & Leasing | 0 (0.0%) | 0 (0.0%) |
| Professional & Scientific | 0 (0.0%) | 2 (100.0%) |
| Enterprise Management | 0 (0.0%) | 0 (0.0%) |
| Administrative & Support | 0 (0.0%) | 0 (0.0%) |
| Educational Services | 5 (38.5%) | 8 (61.5%) |
| Health Care & Social Assistance | 0 (0.0%) | 15 (100.0%) |
| Arts, Entertainment & Recreation | 0 (0.0%) | 0 (0.0%) |
| Accommodation & Food Services | 0 (0.0%) | 0 (0.0%) |
| Public Administration | 4 (40.0%) | 6 (60.0%) |
| Total | 32 (44.4%) | 40 (55.6%) |
Education in Laporte borough
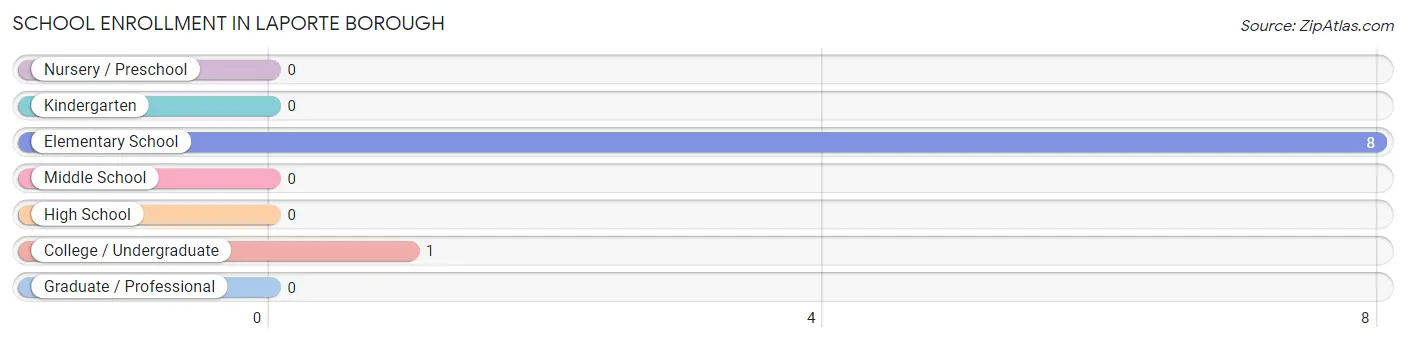
School Enrollment in Laporte borough
The most common levels of schooling among the 9 students in Laporte borough are elementary school (8 | 88.9%), and college / undergraduate (1 | 11.1%).
| School Level | # Students | % Students |
| Nursery / Preschool | 0 | 0.0% |
| Kindergarten | 0 | 0.0% |
| Elementary School | 8 | 88.9% |
| Middle School | 0 | 0.0% |
| High School | 0 | 0.0% |
| College / Undergraduate | 1 | 11.1% |
| Graduate / Professional | 0 | 0.0% |
| Total | 9 | 100.0% |
School Enrollment by Age by Funding Source in Laporte borough
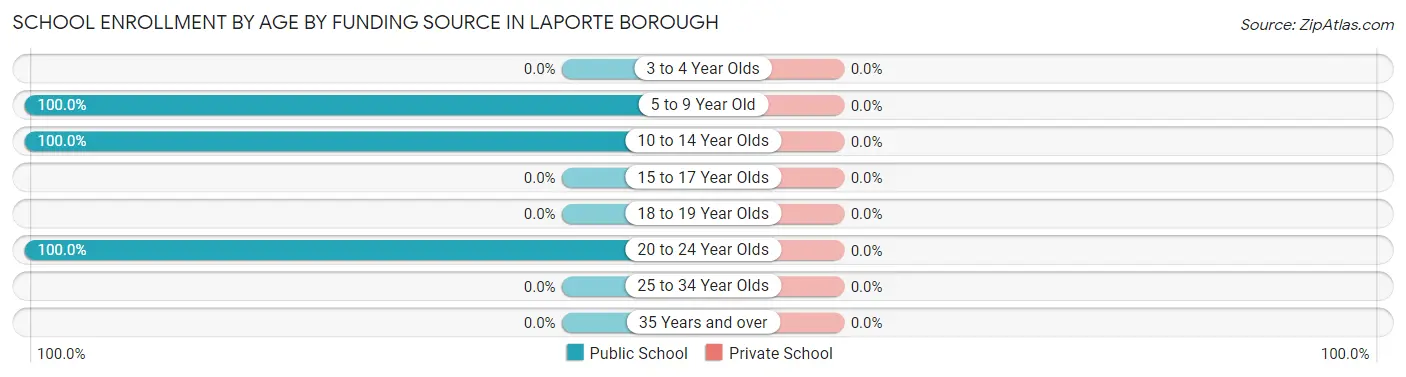
| Age Bracket | Public School | Private School |
| 3 to 4 Year Olds | 0 (0.0%) | 0 (0.0%) |
| 5 to 9 Year Old | 4 (100.0%) | 0 (0.0%) |
| 10 to 14 Year Olds | 4 (100.0%) | 0 (0.0%) |
| 15 to 17 Year Olds | 0 (0.0%) | 0 (0.0%) |
| 18 to 19 Year Olds | 0 (0.0%) | 0 (0.0%) |
| 20 to 24 Year Olds | 1 (100.0%) | 0 (0.0%) |
| 25 to 34 Year Olds | 0 (0.0%) | 0 (0.0%) |
| 35 Years and over | 0 (0.0%) | 0 (0.0%) |
| Total | 9 (100.0%) | 0 (0.0%) |
Educational Attainment by Field of Study in Laporte borough
Physical & health sciences (14 | 24.6%), education (14 | 24.6%), business (9 | 15.8%), literature & languages (5 | 8.8%), and visual & performing arts (5 | 8.8%) are the most common fields of study among 57 individuals in Laporte borough who have obtained a bachelor's degree or higher.
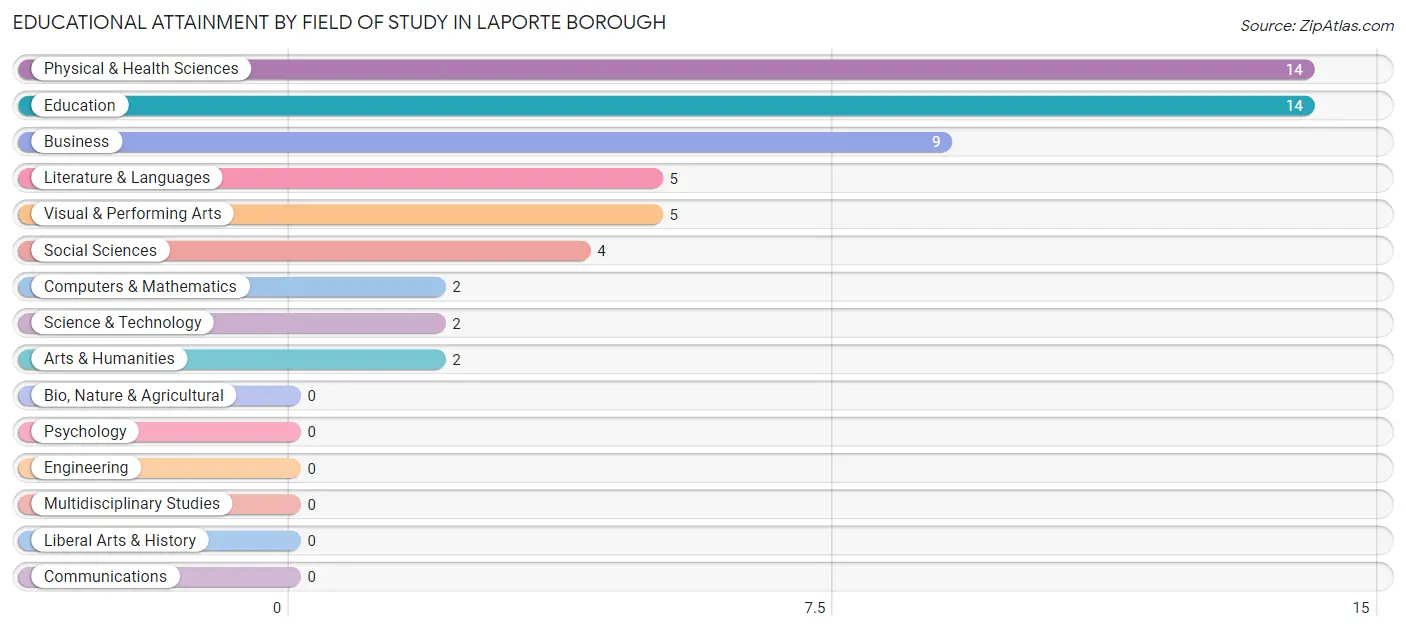
| Field of Study | # Graduates | % Graduates |
| Computers & Mathematics | 2 | 3.5% |
| Bio, Nature & Agricultural | 0 | 0.0% |
| Physical & Health Sciences | 14 | 24.6% |
| Psychology | 0 | 0.0% |
| Social Sciences | 4 | 7.0% |
| Engineering | 0 | 0.0% |
| Multidisciplinary Studies | 0 | 0.0% |
| Science & Technology | 2 | 3.5% |
| Business | 9 | 15.8% |
| Education | 14 | 24.6% |
| Literature & Languages | 5 | 8.8% |
| Liberal Arts & History | 0 | 0.0% |
| Visual & Performing Arts | 5 | 8.8% |
| Communications | 0 | 0.0% |
| Arts & Humanities | 2 | 3.5% |
| Total | 57 | 100.0% |
Transportation & Commute in Laporte borough
Vehicle Availability by Sex in Laporte borough
The most prevalent vehicle ownership categories in Laporte borough are males with 2 vehicles (14, accounting for 46.7%) and females with 2 vehicles (15, making up 38.9%).
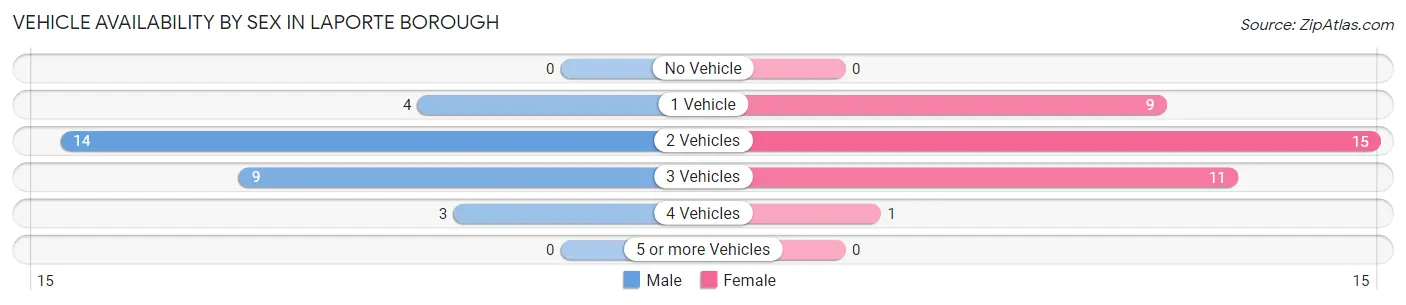
| Vehicles Available | Male | Female |
| No Vehicle | 0 (0.0%) | 0 (0.0%) |
| 1 Vehicle | 4 (13.3%) | 9 (25.0%) |
| 2 Vehicles | 14 (46.7%) | 15 (41.7%) |
| 3 Vehicles | 9 (30.0%) | 11 (30.6%) |
| 4 Vehicles | 3 (10.0%) | 1 (2.8%) |
| 5 or more Vehicles | 0 (0.0%) | 0 (0.0%) |
| Total | 30 (100.0%) | 36 (100.0%) |
Commute Time in Laporte borough
The most frequently occuring commute durations in Laporte borough are 5 to 9 minutes (22 commuters, 36.7%), less than 5 minutes (18 commuters, 30.0%), and 45 to 59 minutes (6 commuters, 10.0%).
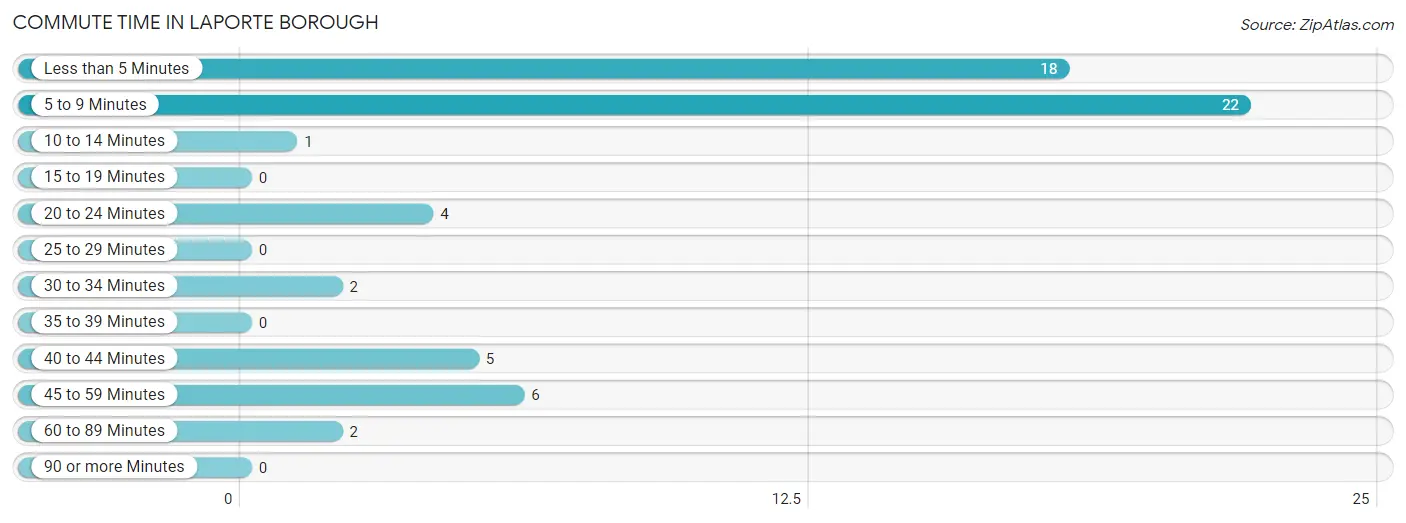
| Commute Time | # Commuters | % Commuters |
| Less than 5 Minutes | 18 | 30.0% |
| 5 to 9 Minutes | 22 | 36.7% |
| 10 to 14 Minutes | 1 | 1.7% |
| 15 to 19 Minutes | 0 | 0.0% |
| 20 to 24 Minutes | 4 | 6.7% |
| 25 to 29 Minutes | 0 | 0.0% |
| 30 to 34 Minutes | 2 | 3.3% |
| 35 to 39 Minutes | 0 | 0.0% |
| 40 to 44 Minutes | 5 | 8.3% |
| 45 to 59 Minutes | 6 | 10.0% |
| 60 to 89 Minutes | 2 | 3.3% |
| 90 or more Minutes | 0 | 0.0% |
Commute Time by Sex in Laporte borough
The most common commute times in Laporte borough are 5 to 9 minutes (11 commuters, 36.7%) for males and less than 5 minutes (11 commuters, 36.7%) for females.
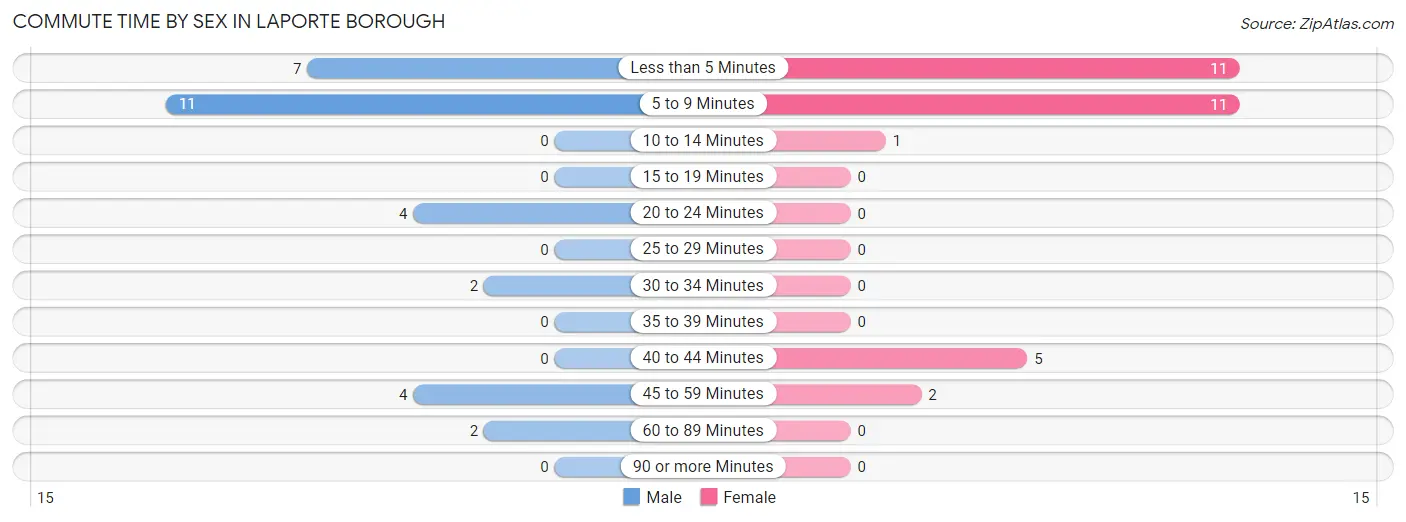
| Commute Time | Male | Female |
| Less than 5 Minutes | 7 (23.3%) | 11 (36.7%) |
| 5 to 9 Minutes | 11 (36.7%) | 11 (36.7%) |
| 10 to 14 Minutes | 0 (0.0%) | 1 (3.3%) |
| 15 to 19 Minutes | 0 (0.0%) | 0 (0.0%) |
| 20 to 24 Minutes | 4 (13.3%) | 0 (0.0%) |
| 25 to 29 Minutes | 0 (0.0%) | 0 (0.0%) |
| 30 to 34 Minutes | 2 (6.7%) | 0 (0.0%) |
| 35 to 39 Minutes | 0 (0.0%) | 0 (0.0%) |
| 40 to 44 Minutes | 0 (0.0%) | 5 (16.7%) |
| 45 to 59 Minutes | 4 (13.3%) | 2 (6.7%) |
| 60 to 89 Minutes | 2 (6.7%) | 0 (0.0%) |
| 90 or more Minutes | 0 (0.0%) | 0 (0.0%) |
Time of Departure to Work by Sex in Laporte borough
The most frequent times of departure to work in Laporte borough are 7:30 AM to 7:59 AM (9, 30.0%) for males and 7:30 AM to 7:59 AM (11, 36.7%) for females.
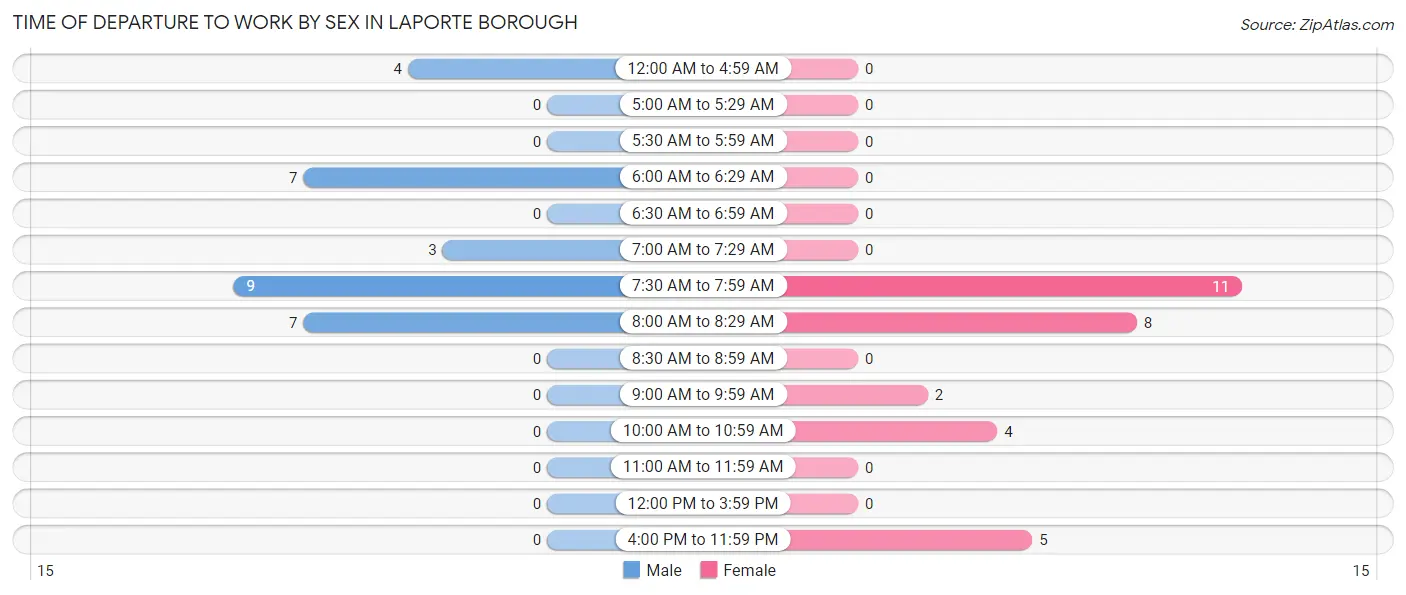
| Time of Departure | Male | Female |
| 12:00 AM to 4:59 AM | 4 (13.3%) | 0 (0.0%) |
| 5:00 AM to 5:29 AM | 0 (0.0%) | 0 (0.0%) |
| 5:30 AM to 5:59 AM | 0 (0.0%) | 0 (0.0%) |
| 6:00 AM to 6:29 AM | 7 (23.3%) | 0 (0.0%) |
| 6:30 AM to 6:59 AM | 0 (0.0%) | 0 (0.0%) |
| 7:00 AM to 7:29 AM | 3 (10.0%) | 0 (0.0%) |
| 7:30 AM to 7:59 AM | 9 (30.0%) | 11 (36.7%) |
| 8:00 AM to 8:29 AM | 7 (23.3%) | 8 (26.7%) |
| 8:30 AM to 8:59 AM | 0 (0.0%) | 0 (0.0%) |
| 9:00 AM to 9:59 AM | 0 (0.0%) | 2 (6.7%) |
| 10:00 AM to 10:59 AM | 0 (0.0%) | 4 (13.3%) |
| 11:00 AM to 11:59 AM | 0 (0.0%) | 0 (0.0%) |
| 12:00 PM to 3:59 PM | 0 (0.0%) | 0 (0.0%) |
| 4:00 PM to 11:59 PM | 0 (0.0%) | 5 (16.7%) |
| Total | 30 (100.0%) | 30 (100.0%) |
Housing Occupancy in Laporte borough
Occupancy by Ownership in Laporte borough
Of the total 75 dwellings in Laporte borough, owner-occupied units account for 62 (82.7%), while renter-occupied units make up 13 (17.3%).
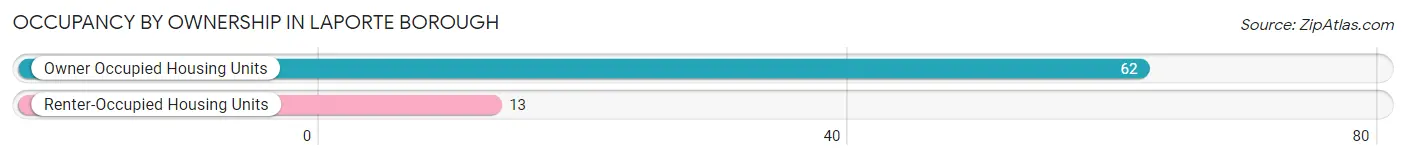
| Occupancy | # Housing Units | % Housing Units |
| Owner Occupied Housing Units | 62 | 82.7% |
| Renter-Occupied Housing Units | 13 | 17.3% |
| Total Occupied Housing Units | 75 | 100.0% |
Occupancy by Household Size in Laporte borough
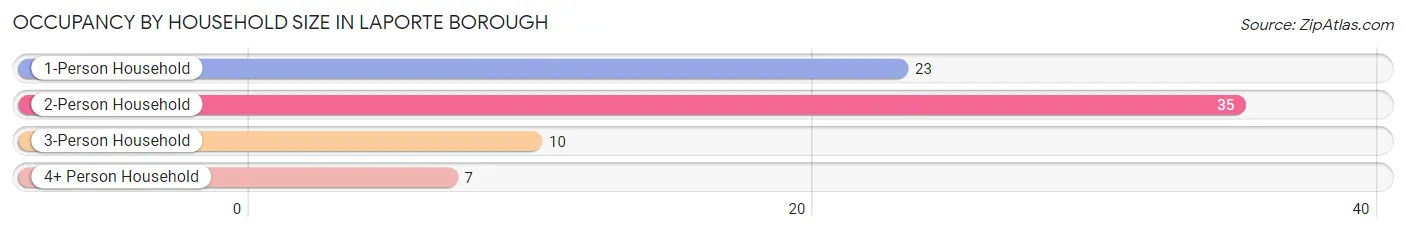
| Household Size | # Housing Units | % Housing Units |
| 1-Person Household | 23 | 30.7% |
| 2-Person Household | 35 | 46.7% |
| 3-Person Household | 10 | 13.3% |
| 4+ Person Household | 7 | 9.3% |
| Total Housing Units | 75 | 100.0% |
Occupancy by Ownership by Household Size in Laporte borough
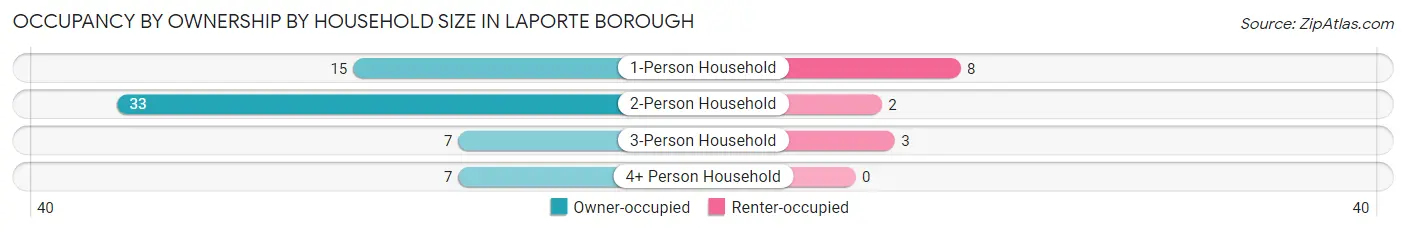
| Household Size | Owner-occupied | Renter-occupied |
| 1-Person Household | 15 (65.2%) | 8 (34.8%) |
| 2-Person Household | 33 (94.3%) | 2 (5.7%) |
| 3-Person Household | 7 (70.0%) | 3 (30.0%) |
| 4+ Person Household | 7 (100.0%) | 0 (0.0%) |
| Total Housing Units | 62 (82.7%) | 13 (17.3%) |
Occupancy by Educational Attainment in Laporte borough
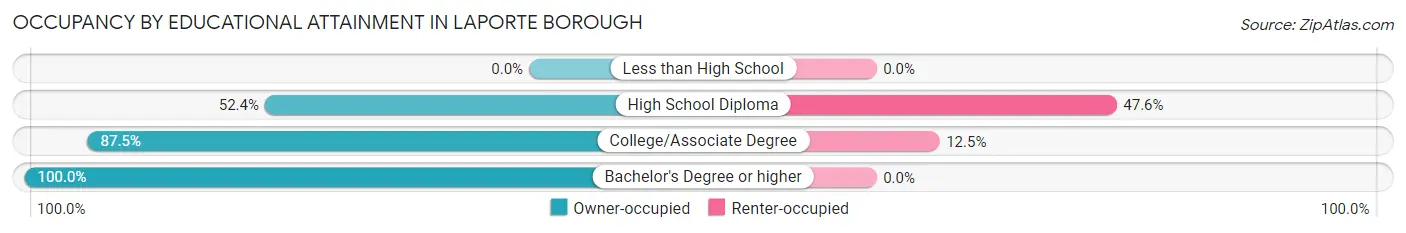
| Household Size | Owner-occupied | Renter-occupied |
| Less than High School | 0 (0.0%) | 0 (0.0%) |
| High School Diploma | 11 (52.4%) | 10 (47.6%) |
| College/Associate Degree | 21 (87.5%) | 3 (12.5%) |
| Bachelor's Degree or higher | 30 (100.0%) | 0 (0.0%) |
Occupancy by Age of Householder in Laporte borough
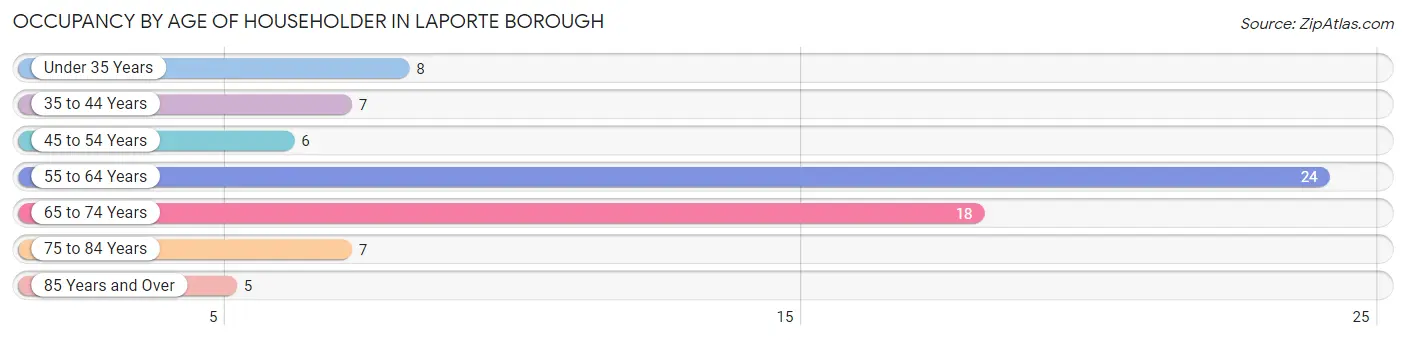
| Age Bracket | # Households | % Households |
| Under 35 Years | 8 | 10.7% |
| 35 to 44 Years | 7 | 9.3% |
| 45 to 54 Years | 6 | 8.0% |
| 55 to 64 Years | 24 | 32.0% |
| 65 to 74 Years | 18 | 24.0% |
| 75 to 84 Years | 7 | 9.3% |
| 85 Years and Over | 5 | 6.7% |
| Total | 75 | 100.0% |
Housing Finances in Laporte borough
Median Income by Occupancy in Laporte borough
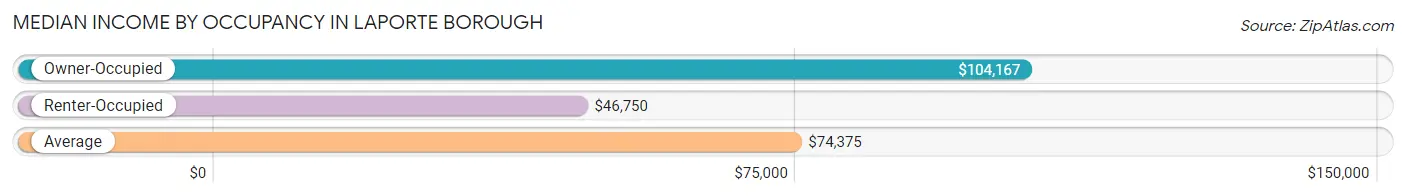
| Occupancy Type | # Households | Median Income |
| Owner-Occupied | 62 (82.7%) | $104,167 |
| Renter-Occupied | 13 (17.3%) | $46,750 |
| Average | 75 (100.0%) | $74,375 |
Occupancy by Householder Income Bracket in Laporte borough
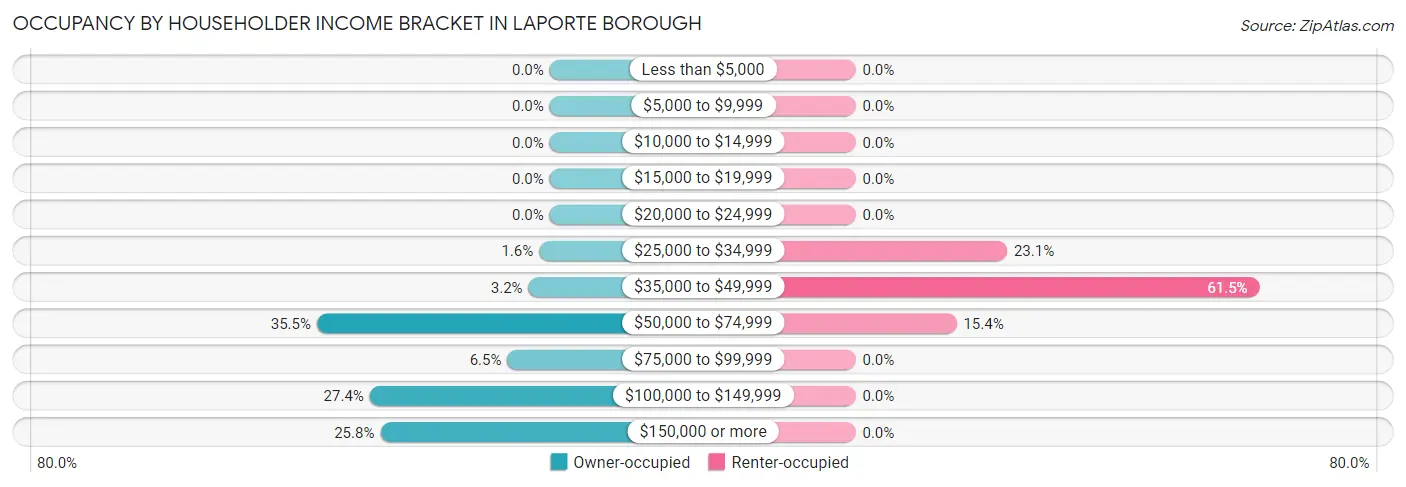
| Income Bracket | Owner-occupied | Renter-occupied |
| Less than $5,000 | 0 (0.0%) | 0 (0.0%) |
| $5,000 to $9,999 | 0 (0.0%) | 0 (0.0%) |
| $10,000 to $14,999 | 0 (0.0%) | 0 (0.0%) |
| $15,000 to $19,999 | 0 (0.0%) | 0 (0.0%) |
| $20,000 to $24,999 | 0 (0.0%) | 0 (0.0%) |
| $25,000 to $34,999 | 1 (1.6%) | 3 (23.1%) |
| $35,000 to $49,999 | 2 (3.2%) | 8 (61.5%) |
| $50,000 to $74,999 | 22 (35.5%) | 2 (15.4%) |
| $75,000 to $99,999 | 4 (6.5%) | 0 (0.0%) |
| $100,000 to $149,999 | 17 (27.4%) | 0 (0.0%) |
| $150,000 or more | 16 (25.8%) | 0 (0.0%) |
| Total | 62 (100.0%) | 13 (100.0%) |
Monthly Housing Cost Tiers in Laporte borough
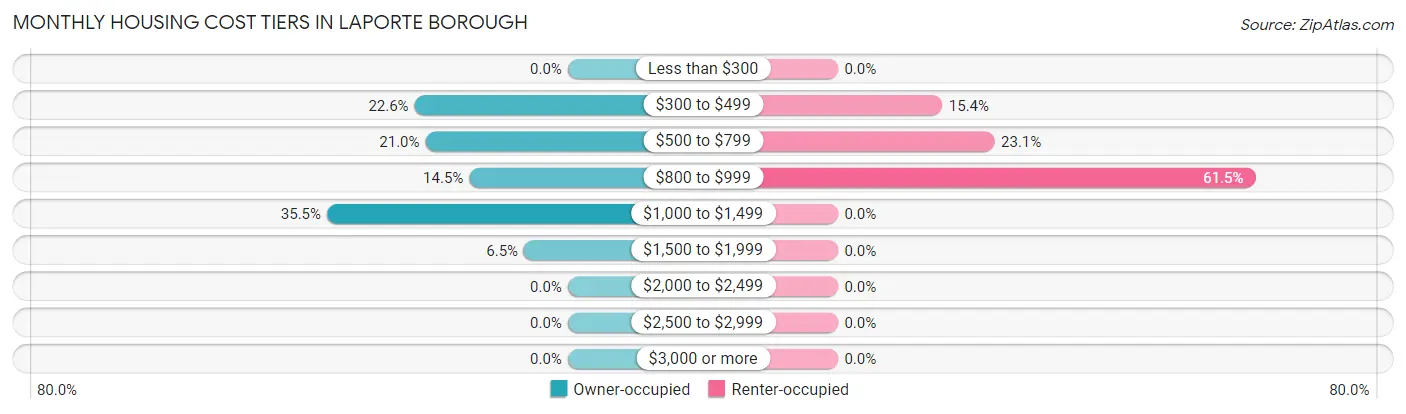
| Monthly Cost | Owner-occupied | Renter-occupied |
| Less than $300 | 0 (0.0%) | 0 (0.0%) |
| $300 to $499 | 14 (22.6%) | 2 (15.4%) |
| $500 to $799 | 13 (21.0%) | 3 (23.1%) |
| $800 to $999 | 9 (14.5%) | 8 (61.5%) |
| $1,000 to $1,499 | 22 (35.5%) | 0 (0.0%) |
| $1,500 to $1,999 | 4 (6.5%) | 0 (0.0%) |
| $2,000 to $2,499 | 0 (0.0%) | 0 (0.0%) |
| $2,500 to $2,999 | 0 (0.0%) | 0 (0.0%) |
| $3,000 or more | 0 (0.0%) | 0 (0.0%) |
| Total | 62 (100.0%) | 13 (100.0%) |
Physical Housing Characteristics in Laporte borough
Housing Structures in Laporte borough
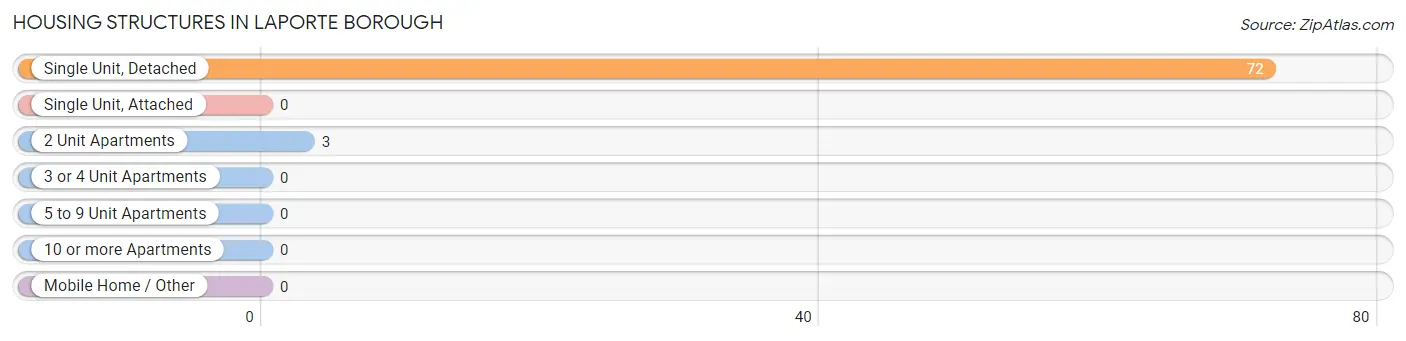
| Structure Type | # Housing Units | % Housing Units |
| Single Unit, Detached | 72 | 96.0% |
| Single Unit, Attached | 0 | 0.0% |
| 2 Unit Apartments | 3 | 4.0% |
| 3 or 4 Unit Apartments | 0 | 0.0% |
| 5 to 9 Unit Apartments | 0 | 0.0% |
| 10 or more Apartments | 0 | 0.0% |
| Mobile Home / Other | 0 | 0.0% |
| Total | 75 | 100.0% |
Housing Structures by Occupancy in Laporte borough
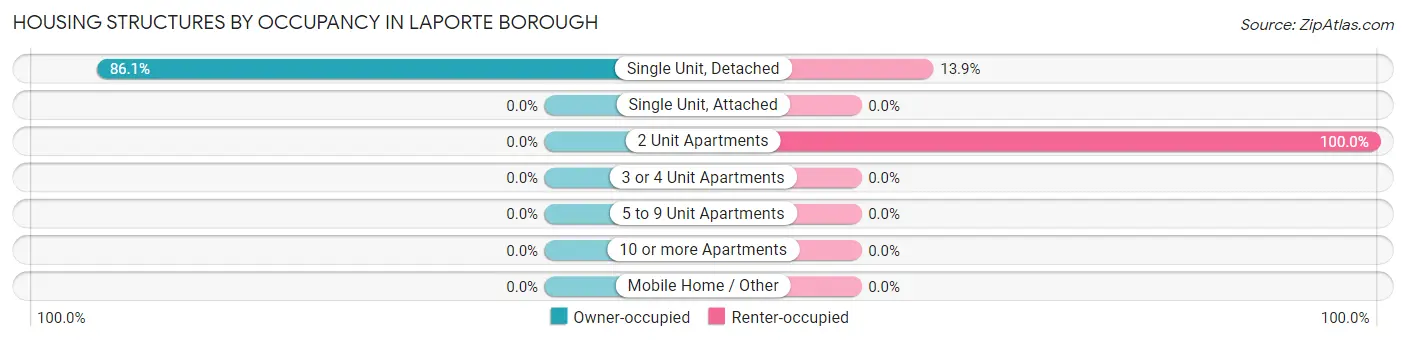
| Structure Type | Owner-occupied | Renter-occupied |
| Single Unit, Detached | 62 (86.1%) | 10 (13.9%) |
| Single Unit, Attached | 0 (0.0%) | 0 (0.0%) |
| 2 Unit Apartments | 0 (0.0%) | 3 (100.0%) |
| 3 or 4 Unit Apartments | 0 (0.0%) | 0 (0.0%) |
| 5 to 9 Unit Apartments | 0 (0.0%) | 0 (0.0%) |
| 10 or more Apartments | 0 (0.0%) | 0 (0.0%) |
| Mobile Home / Other | 0 (0.0%) | 0 (0.0%) |
| Total | 62 (82.7%) | 13 (17.3%) |
Housing Structures by Number of Rooms in Laporte borough
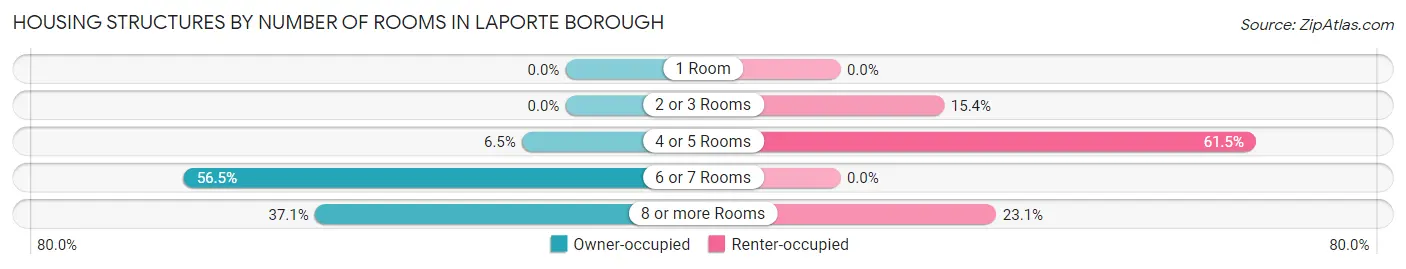
| Number of Rooms | Owner-occupied | Renter-occupied |
| 1 Room | 0 (0.0%) | 0 (0.0%) |
| 2 or 3 Rooms | 0 (0.0%) | 2 (15.4%) |
| 4 or 5 Rooms | 4 (6.5%) | 8 (61.5%) |
| 6 or 7 Rooms | 35 (56.5%) | 0 (0.0%) |
| 8 or more Rooms | 23 (37.1%) | 3 (23.1%) |
| Total | 62 (100.0%) | 13 (100.0%) |
Housing Structure by Heating Type in Laporte borough
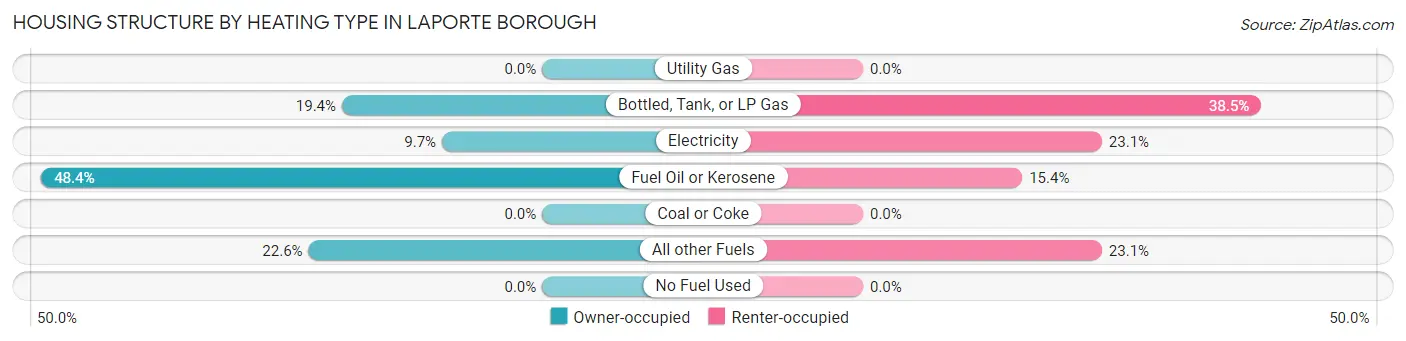
| Heating Type | Owner-occupied | Renter-occupied |
| Utility Gas | 0 (0.0%) | 0 (0.0%) |
| Bottled, Tank, or LP Gas | 12 (19.4%) | 5 (38.5%) |
| Electricity | 6 (9.7%) | 3 (23.1%) |
| Fuel Oil or Kerosene | 30 (48.4%) | 2 (15.4%) |
| Coal or Coke | 0 (0.0%) | 0 (0.0%) |
| All other Fuels | 14 (22.6%) | 3 (23.1%) |
| No Fuel Used | 0 (0.0%) | 0 (0.0%) |
| Total | 62 (100.0%) | 13 (100.0%) |
Household Vehicle Usage in Laporte borough
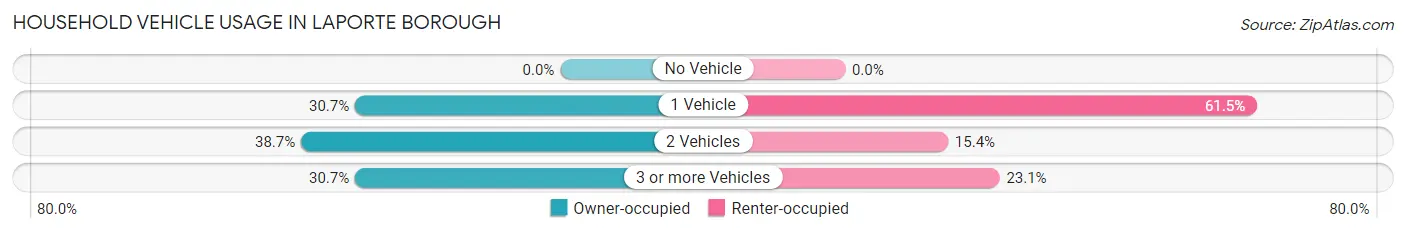
| Vehicles per Household | Owner-occupied | Renter-occupied |
| No Vehicle | 0 (0.0%) | 0 (0.0%) |
| 1 Vehicle | 19 (30.6%) | 8 (61.5%) |
| 2 Vehicles | 24 (38.7%) | 2 (15.4%) |
| 3 or more Vehicles | 19 (30.6%) | 3 (23.1%) |
| Total | 62 (100.0%) | 13 (100.0%) |
Real Estate & Mortgages in Laporte borough
Real Estate and Mortgage Overview in Laporte borough
| Characteristic | Without Mortgage | With Mortgage |
| Housing Units | 34 | 28 |
| Median Property Value | $166,700 | $200,000 |
| Median Household Income | $105,000 | $7 |
| Monthly Housing Costs | $523 | $0 |
| Real Estate Taxes | $1,471 | $0 |
Property Value by Mortgage Status in Laporte borough
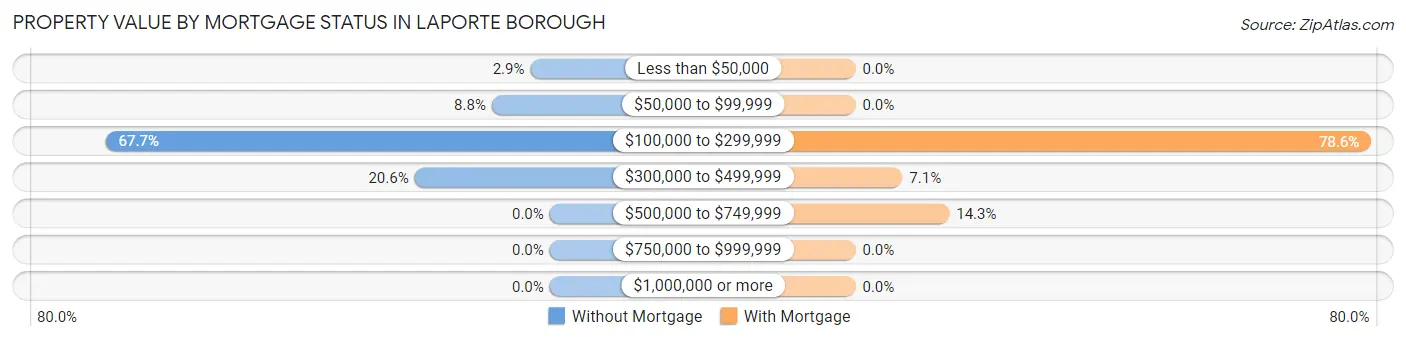
| Property Value | Without Mortgage | With Mortgage |
| Less than $50,000 | 1 (2.9%) | 0 (0.0%) |
| $50,000 to $99,999 | 3 (8.8%) | 0 (0.0%) |
| $100,000 to $299,999 | 23 (67.6%) | 22 (78.6%) |
| $300,000 to $499,999 | 7 (20.6%) | 2 (7.1%) |
| $500,000 to $749,999 | 0 (0.0%) | 4 (14.3%) |
| $750,000 to $999,999 | 0 (0.0%) | 0 (0.0%) |
| $1,000,000 or more | 0 (0.0%) | 0 (0.0%) |
| Total | 34 (100.0%) | 28 (100.0%) |
Household Income by Mortgage Status in Laporte borough
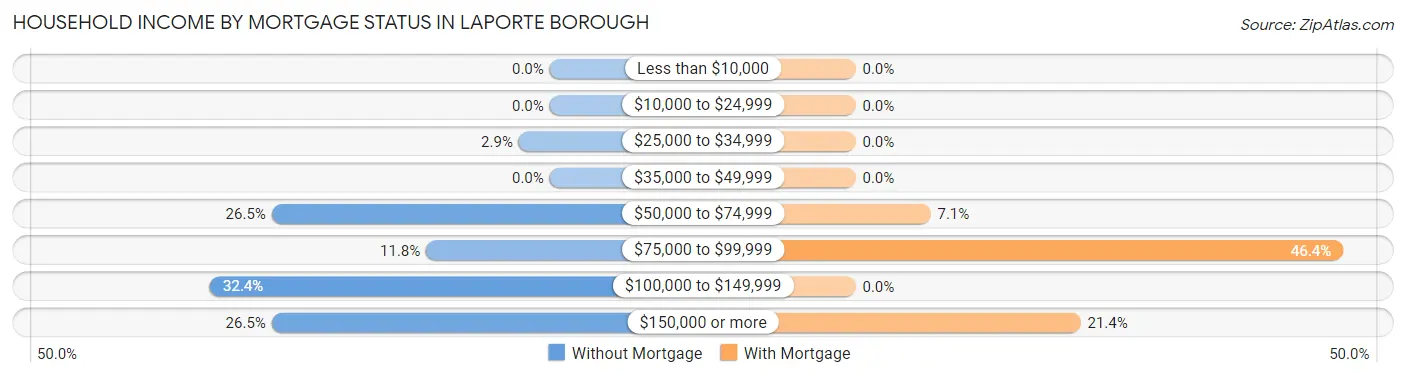
| Household Income | Without Mortgage | With Mortgage |
| Less than $10,000 | 0 (0.0%) | 0 (0.0%) |
| $10,000 to $24,999 | 0 (0.0%) | 0 (0.0%) |
| $25,000 to $34,999 | 1 (2.9%) | 0 (0.0%) |
| $35,000 to $49,999 | 0 (0.0%) | 0 (0.0%) |
| $50,000 to $74,999 | 9 (26.5%) | 2 (7.1%) |
| $75,000 to $99,999 | 4 (11.8%) | 13 (46.4%) |
| $100,000 to $149,999 | 11 (32.4%) | 0 (0.0%) |
| $150,000 or more | 9 (26.5%) | 6 (21.4%) |
| Total | 34 (100.0%) | 28 (100.0%) |
Property Value to Household Income Ratio in Laporte borough
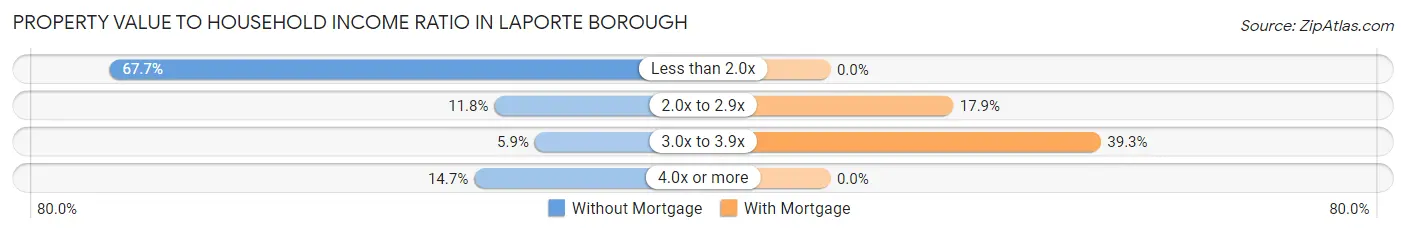
| Value-to-Income Ratio | Without Mortgage | With Mortgage |
| Less than 2.0x | 23 (67.6%) | 0 (0.0%) |
| 2.0x to 2.9x | 4 (11.8%) | 5 (17.9%) |
| 3.0x to 3.9x | 2 (5.9%) | 11 (39.3%) |
| 4.0x or more | 5 (14.7%) | 0 (0.0%) |
| Total | 34 (100.0%) | 28 (100.0%) |
Real Estate Taxes by Mortgage Status in Laporte borough
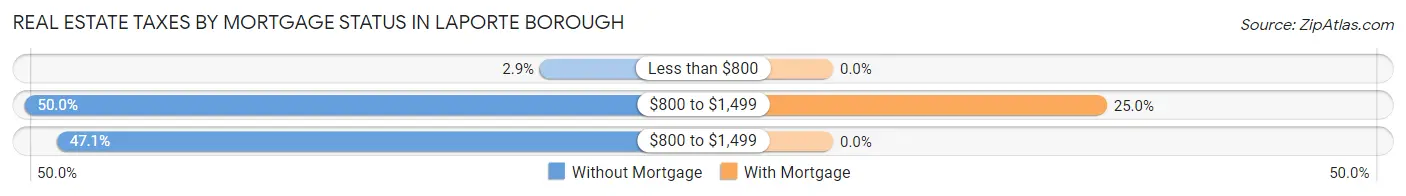
| Property Taxes | Without Mortgage | With Mortgage |
| Less than $800 | 1 (2.9%) | 0 (0.0%) |
| $800 to $1,499 | 17 (50.0%) | 7 (25.0%) |
| $800 to $1,499 | 16 (47.1%) | 0 (0.0%) |
| Total | 34 (100.0%) | 28 (100.0%) |
Health & Disability in Laporte borough
Health Insurance Coverage by Age in Laporte borough
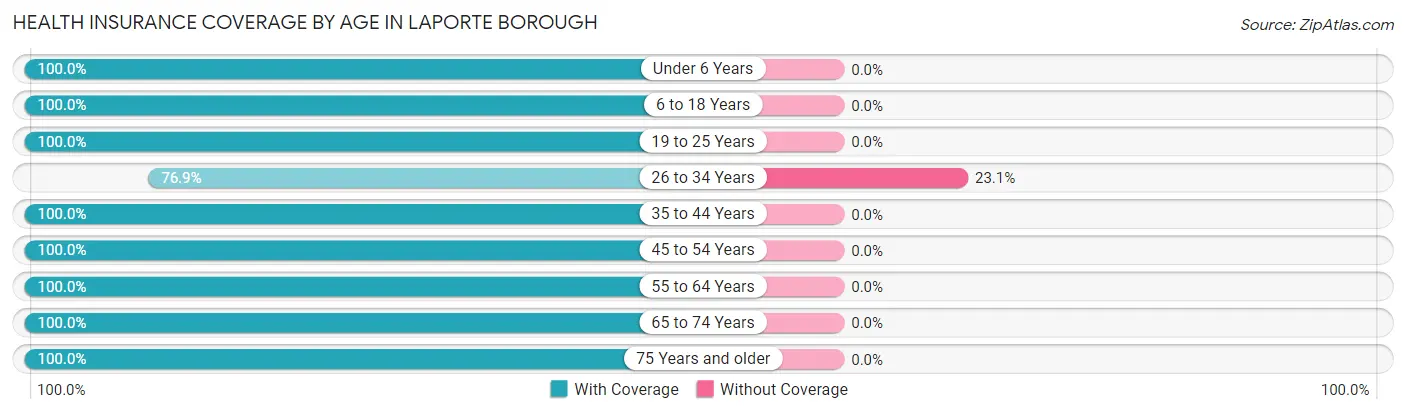
| Age Bracket | With Coverage | Without Coverage |
| Under 6 Years | 6 (100.0%) | 0 (0.0%) |
| 6 to 18 Years | 8 (100.0%) | 0 (0.0%) |
| 19 to 25 Years | 3 (100.0%) | 0 (0.0%) |
| 26 to 34 Years | 10 (76.9%) | 3 (23.1%) |
| 35 to 44 Years | 13 (100.0%) | 0 (0.0%) |
| 45 to 54 Years | 7 (100.0%) | 0 (0.0%) |
| 55 to 64 Years | 35 (100.0%) | 0 (0.0%) |
| 65 to 74 Years | 33 (100.0%) | 0 (0.0%) |
| 75 Years and older | 18 (100.0%) | 0 (0.0%) |
| Total | 133 (97.8%) | 3 (2.2%) |
Health Insurance Coverage by Citizenship Status in Laporte borough

| Citizenship Status | With Coverage | Without Coverage |
| Native Born | 6 (100.0%) | 0 (0.0%) |
| Foreign Born, Citizen | 8 (100.0%) | 0 (0.0%) |
| Foreign Born, not a Citizen | 3 (100.0%) | 0 (0.0%) |
Health Insurance Coverage by Household Income in Laporte borough
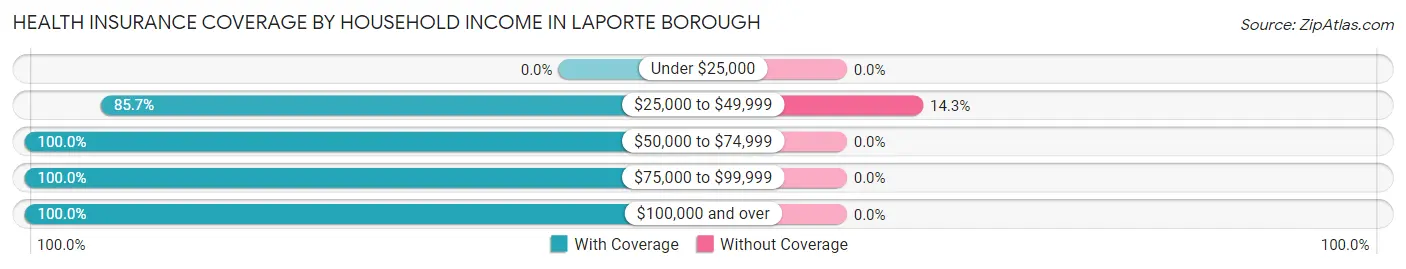
| Household Income | With Coverage | Without Coverage |
| Under $25,000 | 0 (0.0%) | 0 (0.0%) |
| $25,000 to $49,999 | 18 (85.7%) | 3 (14.3%) |
| $50,000 to $74,999 | 42 (100.0%) | 0 (0.0%) |
| $75,000 to $99,999 | 8 (100.0%) | 0 (0.0%) |
| $100,000 and over | 65 (100.0%) | 0 (0.0%) |
Public vs Private Health Insurance Coverage by Age in Laporte borough
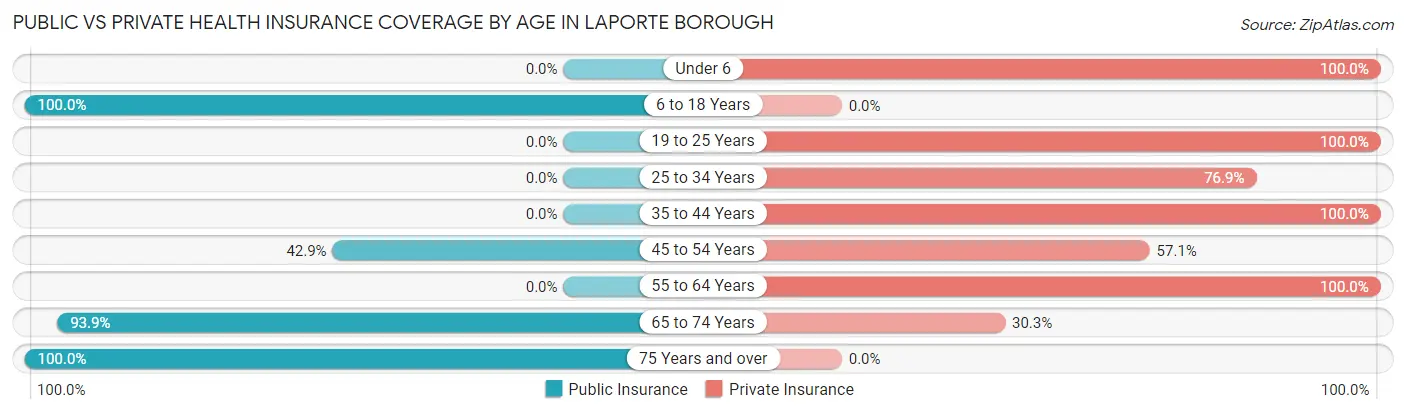
| Age Bracket | Public Insurance | Private Insurance |
| Under 6 | 0 (0.0%) | 6 (100.0%) |
| 6 to 18 Years | 8 (100.0%) | 0 (0.0%) |
| 19 to 25 Years | 0 (0.0%) | 3 (100.0%) |
| 25 to 34 Years | 0 (0.0%) | 10 (76.9%) |
| 35 to 44 Years | 0 (0.0%) | 13 (100.0%) |
| 45 to 54 Years | 3 (42.9%) | 4 (57.1%) |
| 55 to 64 Years | 0 (0.0%) | 35 (100.0%) |
| 65 to 74 Years | 31 (93.9%) | 10 (30.3%) |
| 75 Years and over | 18 (100.0%) | 0 (0.0%) |
| Total | 60 (44.1%) | 81 (59.6%) |
Disability Status by Sex by Age in Laporte borough
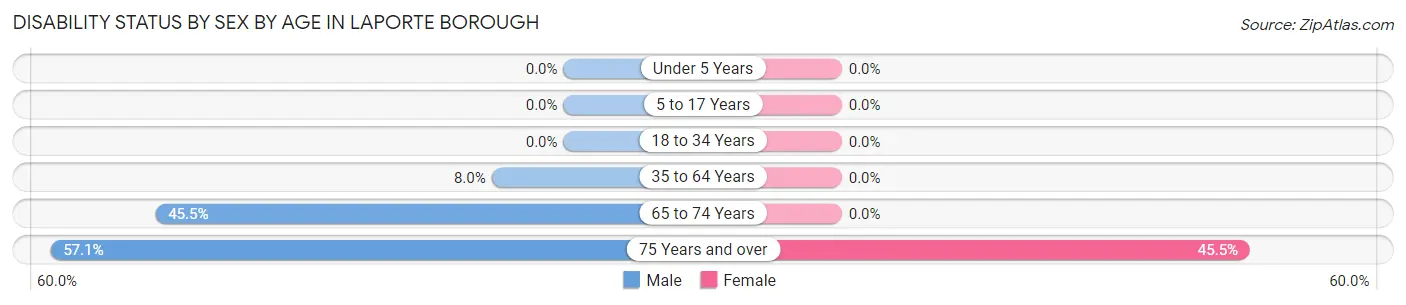
| Age Bracket | Male | Female |
| Under 5 Years | 0 (0.0%) | 0 (0.0%) |
| 5 to 17 Years | 0 (0.0%) | 0 (0.0%) |
| 18 to 34 Years | 0 (0.0%) | 0 (0.0%) |
| 35 to 64 Years | 2 (8.0%) | 0 (0.0%) |
| 65 to 74 Years | 5 (45.5%) | 0 (0.0%) |
| 75 Years and over | 4 (57.1%) | 5 (45.5%) |
Disability Class by Sex by Age in Laporte borough
Disability Class: Hearing Difficulty
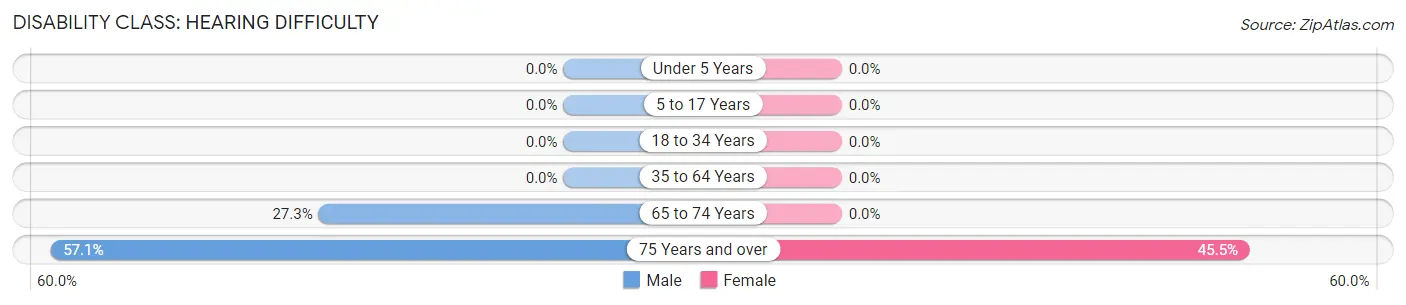
| Age Bracket | Male | Female |
| Under 5 Years | 0 (0.0%) | 0 (0.0%) |
| 5 to 17 Years | 0 (0.0%) | 0 (0.0%) |
| 18 to 34 Years | 0 (0.0%) | 0 (0.0%) |
| 35 to 64 Years | 0 (0.0%) | 0 (0.0%) |
| 65 to 74 Years | 3 (27.3%) | 0 (0.0%) |
| 75 Years and over | 4 (57.1%) | 5 (45.5%) |
Disability Class: Vision Difficulty
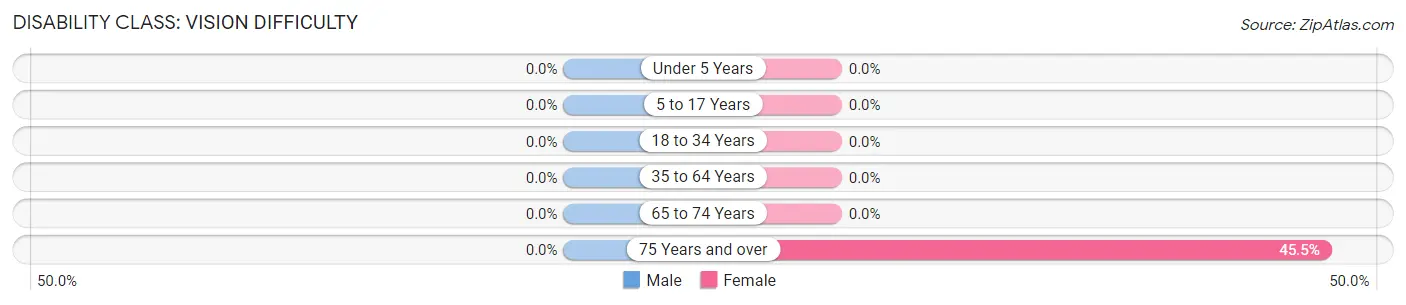
| Age Bracket | Male | Female |
| Under 5 Years | 0 (0.0%) | 0 (0.0%) |
| 5 to 17 Years | 0 (0.0%) | 0 (0.0%) |
| 18 to 34 Years | 0 (0.0%) | 0 (0.0%) |
| 35 to 64 Years | 0 (0.0%) | 0 (0.0%) |
| 65 to 74 Years | 0 (0.0%) | 0 (0.0%) |
| 75 Years and over | 0 (0.0%) | 5 (45.5%) |
Disability Class: Cognitive Difficulty
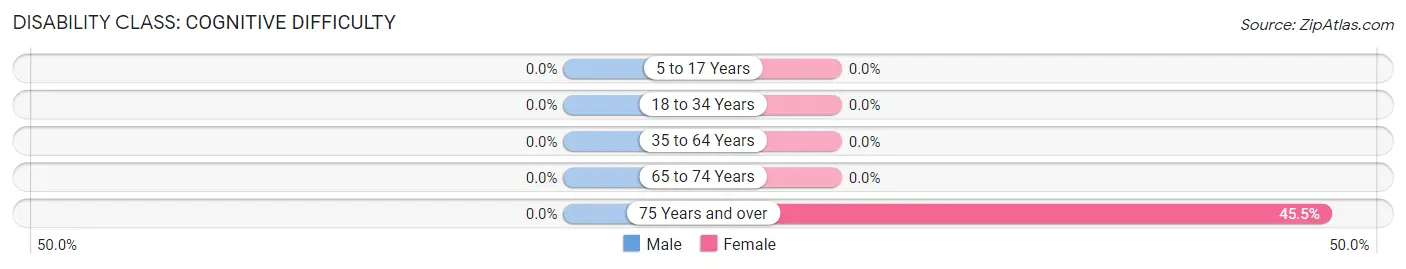
| Age Bracket | Male | Female |
| 5 to 17 Years | 0 (0.0%) | 0 (0.0%) |
| 18 to 34 Years | 0 (0.0%) | 0 (0.0%) |
| 35 to 64 Years | 0 (0.0%) | 0 (0.0%) |
| 65 to 74 Years | 0 (0.0%) | 0 (0.0%) |
| 75 Years and over | 0 (0.0%) | 5 (45.5%) |
Disability Class: Ambulatory Difficulty
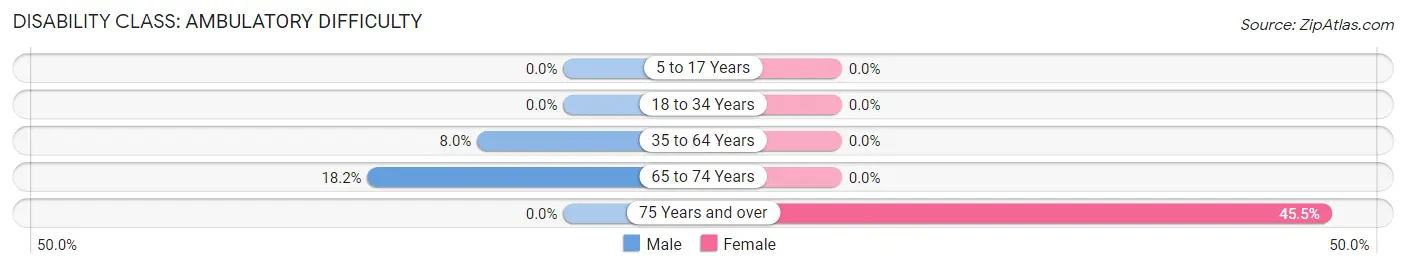
| Age Bracket | Male | Female |
| 5 to 17 Years | 0 (0.0%) | 0 (0.0%) |
| 18 to 34 Years | 0 (0.0%) | 0 (0.0%) |
| 35 to 64 Years | 2 (8.0%) | 0 (0.0%) |
| 65 to 74 Years | 2 (18.2%) | 0 (0.0%) |
| 75 Years and over | 0 (0.0%) | 5 (45.5%) |
Disability Class: Self-Care Difficulty
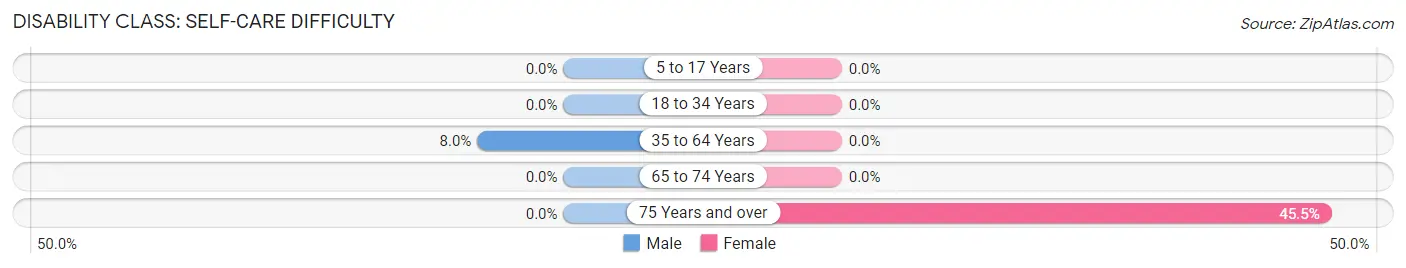
| Age Bracket | Male | Female |
| 5 to 17 Years | 0 (0.0%) | 0 (0.0%) |
| 18 to 34 Years | 0 (0.0%) | 0 (0.0%) |
| 35 to 64 Years | 2 (8.0%) | 0 (0.0%) |
| 65 to 74 Years | 0 (0.0%) | 0 (0.0%) |
| 75 Years and over | 0 (0.0%) | 5 (45.5%) |
Technology Access in Laporte borough
Computing Device Access in Laporte borough
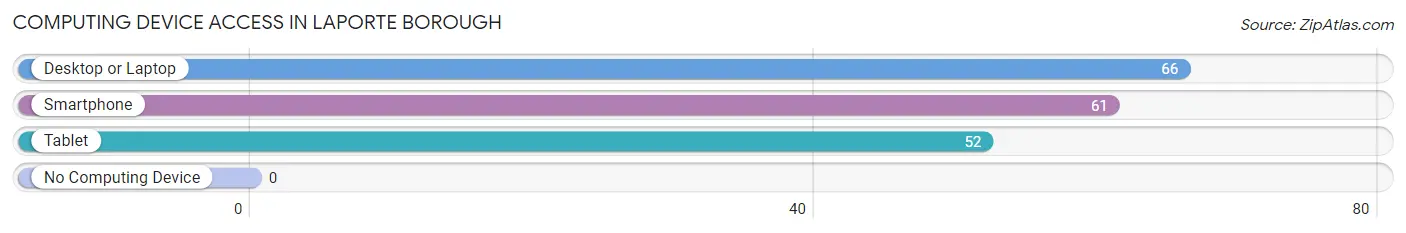
| Device Type | # Households | % Households |
| Desktop or Laptop | 66 | 88.0% |
| Smartphone | 61 | 81.3% |
| Tablet | 52 | 69.3% |
| No Computing Device | 0 | 0.0% |
| Total | 75 | 100.0% |
Internet Access in Laporte borough
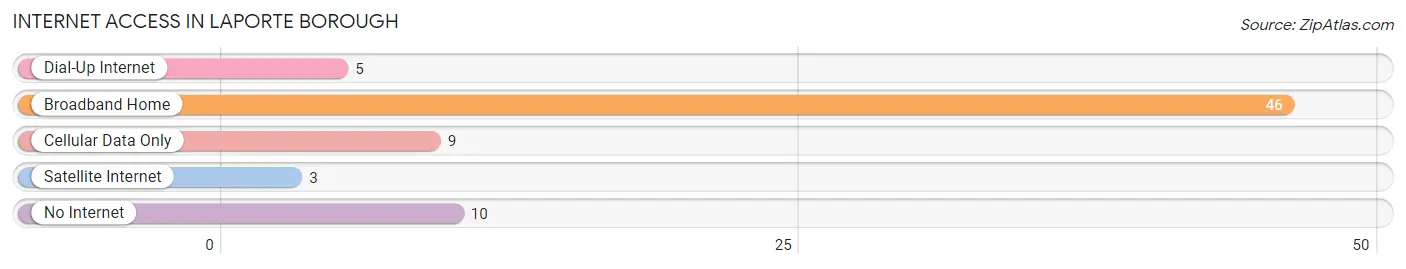
| Internet Type | # Households | % Households |
| Dial-Up Internet | 5 | 6.7% |
| Broadband Home | 46 | 61.3% |
| Cellular Data Only | 9 | 12.0% |
| Satellite Internet | 3 | 4.0% |
| No Internet | 10 | 13.3% |
| Total | 75 | 100.0% |
Laporte borough Summary
Laporte Borough is a small borough located in Sullivan County, Pennsylvania. It is situated in the Endless Mountains region of the state, and is bordered by the townships of Davidson, Elkland, and Shrewsbury. The population of Laporte Borough was 1,093 at the 2010 census.
History
Laporte Borough was founded in 1845 by a group of settlers from New England. The town was named after the French explorer, Robert de La Salle, who explored the area in 1669. The first settlers were primarily farmers, and the town quickly grew to become a thriving agricultural community. The town was incorporated in 1851, and the first mayor was elected in 1852.
In the late 19th century, Laporte Borough became a popular tourist destination. The town was known for its scenic beauty, and many visitors came to enjoy the area's natural beauty. The town also became a popular destination for hunters and fishermen.
In the early 20th century, Laporte Borough began to experience a decline in population. This was due to the decline of the local agricultural industry, as well as the increasing popularity of nearby cities such as Williamsport and Scranton. The population of Laporte Borough continued to decline until the 1970s, when the town began to experience a resurgence in population.
Geography
Laporte Borough is located in the Endless Mountains region of Pennsylvania. The borough is situated in the northern part of Sullivan County, and is bordered by the townships of Davidson, Elkland, and Shrewsbury. The borough is located approximately 30 miles south of Williamsport, and approximately 40 miles north of Scranton.
The terrain of Laporte Borough is mostly hilly, with some flat areas. The borough is located in the Susquehanna River Valley, and is surrounded by mountains. The highest point in the borough is located at an elevation of 1,845 feet.
Economy
The economy of Laporte Borough is largely based on agriculture and tourism. The town is home to several small farms, which produce a variety of crops, including corn, soybeans, and hay. The town is also home to several small businesses, including restaurants, shops, and lodging.
Tourism is an important part of the economy of Laporte Borough. The town is home to several popular attractions, including the Laporte Museum, the Laporte Historical Society, and the Laporte County Park. The town is also home to several popular events, such as the Laporte County Fair and the Laporte County Music Festival.
Demographics
As of the 2010 census, the population of Laporte Borough was 1,093. The racial makeup of the borough was 97.2% White, 0.7% African American, 0.2% Native American, 0.2% Asian, 0.1% from other races, and 1.7% from two or more races. Hispanic or Latino of any race were 0.7% of the population.
The median income for a household in the borough was $37,500, and the median income for a family was $45,000. The per capita income for the borough was $18,945. About 11.2% of families and 14.2% of the population were below the poverty line, including 18.2% of those under age 18 and 8.3% of those age 65 or over.
Common Questions
What is Per Capita Income in Laporte borough?
Per Capita income in Laporte borough is $33,316.
What is the Median Family Income in Laporte borough?
Median Family Income in Laporte borough is $116,250.
What is the Median Household income in Laporte borough?
Median Household Income in Laporte borough is $74,375.
What is Income or Wage Gap in Laporte borough?
Income or Wage Gap in Laporte borough is 54.2%.
Women in Laporte borough earn 45.8 cents for every dollar earned by a man.
What is Inequality or Gini Index in Laporte borough?
Inequality or Gini Index in Laporte borough is 0.30.
What is the Total Population of Laporte borough?
Total Population of Laporte borough is 254.
What is the Total Male Population of Laporte borough?
Total Male Population of Laporte borough is 132.
What is the Total Female Population of Laporte borough?
Total Female Population of Laporte borough is 122.
What is the Ratio of Males per 100 Females in Laporte borough?
There are 108.20 Males per 100 Females in Laporte borough.
What is the Ratio of Females per 100 Males in Laporte borough?
There are 92.42 Females per 100 Males in Laporte borough.
What is the Median Population Age in Laporte borough?
Median Population Age in Laporte borough is 68.5 Years.
What is the Average Family Size in Laporte borough
Average Family Size in Laporte borough is 2.1 People.
What is the Average Household Size in Laporte borough
Average Household Size in Laporte borough is 1.8 People.
How Large is the Labor Force in Laporte borough?
There are 72 People in the Labor Forcein in Laporte borough.
What is the Percentage of People in the Labor Force in Laporte borough?
30.0% of People are in the Labor Force in Laporte borough.