Eastlawn Gardens, PA Map & Demographics
Eastlawn Gardens Map
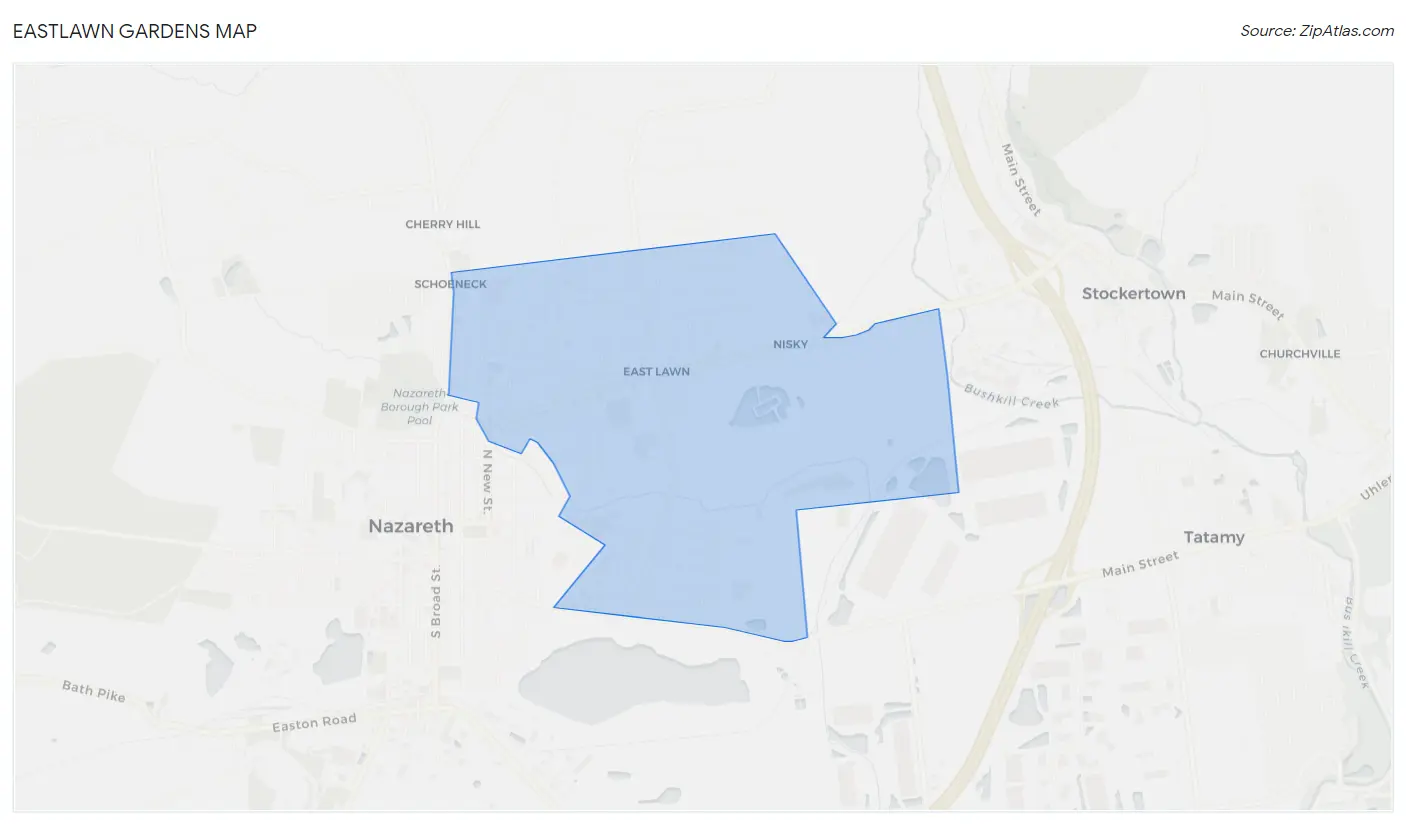
Eastlawn Gardens Overview
$51,939
PER CAPITA INCOME
$124,899
AVG FAMILY INCOME
$108,449
AVG HOUSEHOLD INCOME
12.1%
WAGE / INCOME GAP [ % ]
87.9¢/ $1
WAGE / INCOME GAP [ $ ]
0.35
INEQUALITY / GINI INDEX
3,536
TOTAL POPULATION
1,812
MALE POPULATION
1,724
FEMALE POPULATION
105.10
MALES / 100 FEMALES
95.14
FEMALES / 100 MALES
50.1
MEDIAN AGE
2.9
AVG FAMILY SIZE
2.6
AVG HOUSEHOLD SIZE
2,192
LABOR FORCE [ PEOPLE ]
70.1%
PERCENT IN LABOR FORCE
1.6%
UNEMPLOYMENT RATE
Income in Eastlawn Gardens
Income Overview in Eastlawn Gardens
Per Capita Income in Eastlawn Gardens is $51,939, while median incomes of families and households are $124,899 and $108,449 respectively.
| Characteristic | Number | Measure |
| Per Capita Income | 3,536 | $51,939 |
| Median Family Income | 1,077 | $124,899 |
| Mean Family Income | 1,077 | $148,416 |
| Median Household Income | 1,375 | $108,449 |
| Mean Household Income | 1,375 | $131,329 |
| Income Deficit | 1,077 | $0 |
| Wage / Income Gap (%) | 3,536 | 12.13% |
| Wage / Income Gap ($) | 3,536 | 87.87¢ per $1 |
| Gini / Inequality Index | 3,536 | 0.35 |
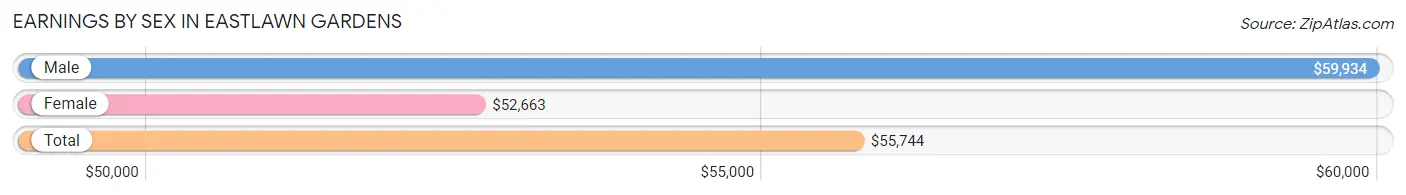
Earnings by Sex in Eastlawn Gardens
Average Earnings in Eastlawn Gardens are $55,744, $59,934 for men and $52,663 for women, a difference of 12.1%.
| Sex | Number | Average Earnings |
| Male | 1,220 (53.5%) | $59,934 |
| Female | 1,061 (46.5%) | $52,663 |
| Total | 2,281 (100.0%) | $55,744 |
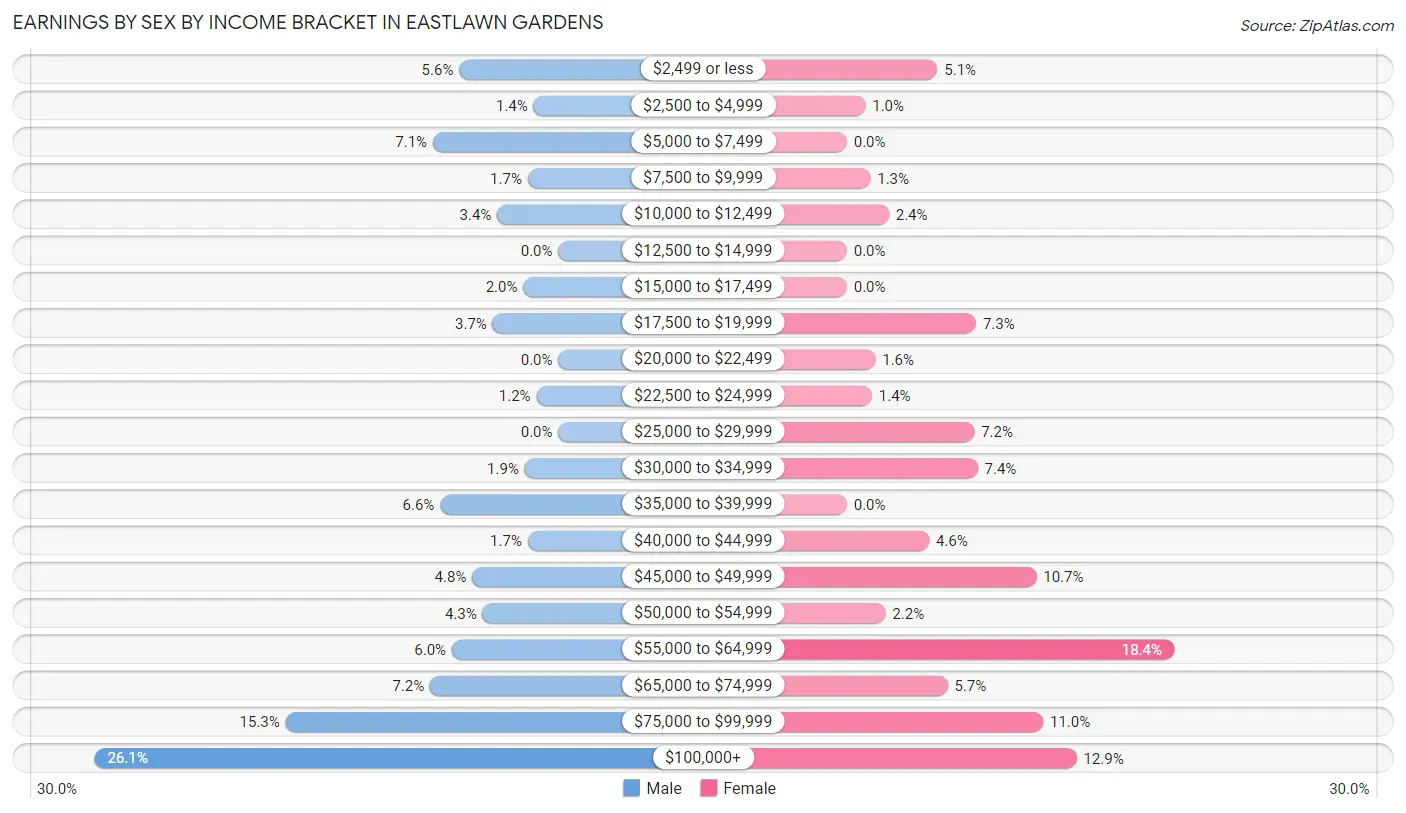
Earnings by Sex by Income Bracket in Eastlawn Gardens
The most common earnings brackets in Eastlawn Gardens are $100,000+ for men (318 | 26.1%) and $55,000 to $64,999 for women (195 | 18.4%).
| Income | Male | Female |
| $2,499 or less | 68 (5.6%) | 54 (5.1%) |
| $2,500 to $4,999 | 17 (1.4%) | 11 (1.0%) |
| $5,000 to $7,499 | 86 (7.0%) | 0 (0.0%) |
| $7,500 to $9,999 | 21 (1.7%) | 14 (1.3%) |
| $10,000 to $12,499 | 42 (3.4%) | 25 (2.4%) |
| $12,500 to $14,999 | 0 (0.0%) | 0 (0.0%) |
| $15,000 to $17,499 | 24 (2.0%) | 0 (0.0%) |
| $17,500 to $19,999 | 45 (3.7%) | 77 (7.3%) |
| $20,000 to $22,499 | 0 (0.0%) | 17 (1.6%) |
| $22,500 to $24,999 | 15 (1.2%) | 15 (1.4%) |
| $25,000 to $29,999 | 0 (0.0%) | 76 (7.2%) |
| $30,000 to $34,999 | 23 (1.9%) | 78 (7.3%) |
| $35,000 to $39,999 | 81 (6.6%) | 0 (0.0%) |
| $40,000 to $44,999 | 21 (1.7%) | 49 (4.6%) |
| $45,000 to $49,999 | 59 (4.8%) | 113 (10.6%) |
| $50,000 to $54,999 | 52 (4.3%) | 23 (2.2%) |
| $55,000 to $64,999 | 73 (6.0%) | 195 (18.4%) |
| $65,000 to $74,999 | 88 (7.2%) | 60 (5.7%) |
| $75,000 to $99,999 | 187 (15.3%) | 117 (11.0%) |
| $100,000+ | 318 (26.1%) | 137 (12.9%) |
| Total | 1,220 (100.0%) | 1,061 (100.0%) |
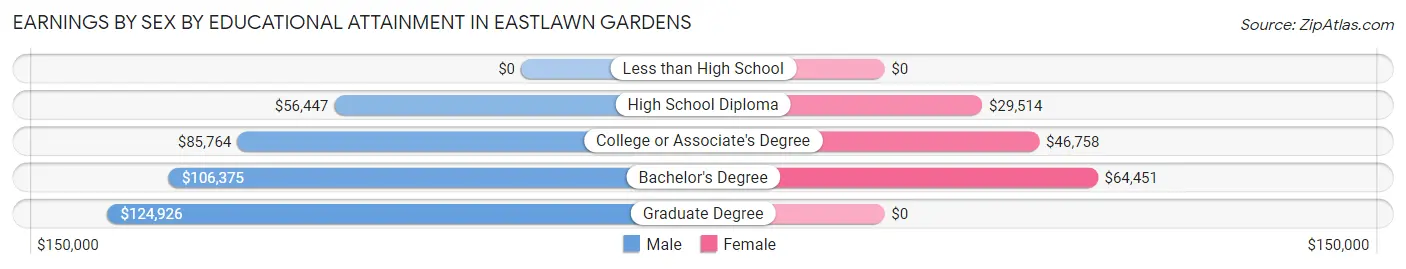
Earnings by Sex by Educational Attainment in Eastlawn Gardens
Average earnings in Eastlawn Gardens are $84,868 for men and $55,966 for women, a difference of 34.1%. Men with an educational attainment of graduate degree enjoy the highest average annual earnings of $124,926, while those with high school diploma education earn the least with $56,447. Women with an educational attainment of bachelor's degree earn the most with the average annual earnings of $64,451, while those with high school diploma education have the smallest earnings of $29,514.
| Educational Attainment | Male Income | Female Income |
| Less than High School | - | - |
| High School Diploma | $56,447 | $29,514 |
| College or Associate's Degree | $85,764 | $46,758 |
| Bachelor's Degree | $106,375 | $64,451 |
| Graduate Degree | $124,926 | $0 |
| Total | $84,868 | $55,966 |
Family Income in Eastlawn Gardens
Family Income Brackets in Eastlawn Gardens
According to the Eastlawn Gardens family income data, there are 335 families falling into the $100,000 to $149,999 income range, which is the most common income bracket and makes up 31.1% of all families.
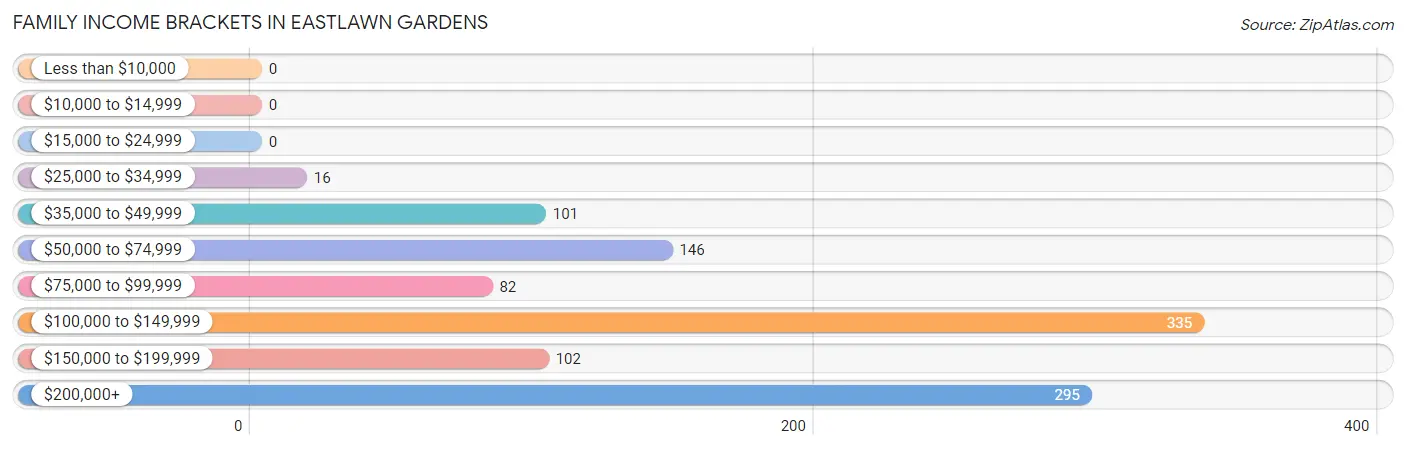
| Income Bracket | # Families | % Families |
| Less than $10,000 | 0 | 0.0% |
| $10,000 to $14,999 | 0 | 0.0% |
| $15,000 to $24,999 | 0 | 0.0% |
| $25,000 to $34,999 | 16 | 1.5% |
| $35,000 to $49,999 | 101 | 9.4% |
| $50,000 to $74,999 | 146 | 13.6% |
| $75,000 to $99,999 | 82 | 7.6% |
| $100,000 to $149,999 | 335 | 31.1% |
| $150,000 to $199,999 | 102 | 9.5% |
| $200,000+ | 295 | 27.4% |
Family Income by Famaliy Size in Eastlawn Gardens
3-person families (330 | 30.6%) account for the highest median family income in Eastlawn Gardens with $182,083 per family, while 3-person families (330 | 30.6%) have the highest median income of $60,694 per family member.
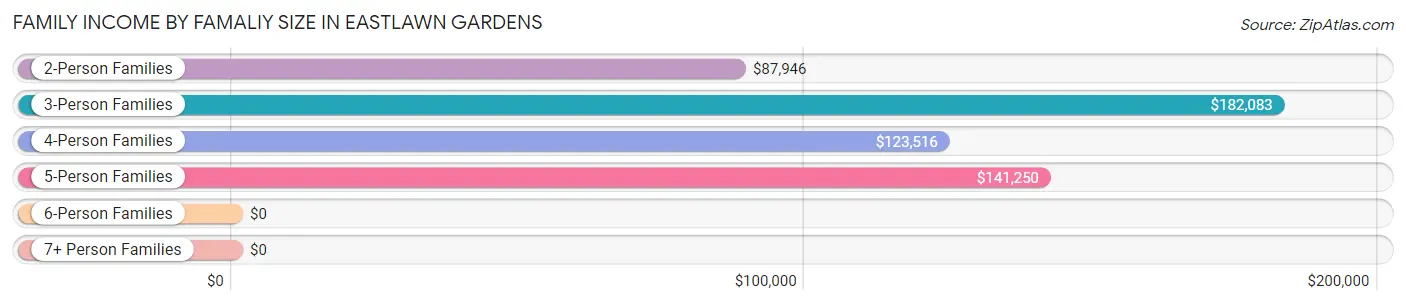
| Income Bracket | # Families | Median Income |
| 2-Person Families | 491 (45.6%) | $87,946 |
| 3-Person Families | 330 (30.6%) | $182,083 |
| 4-Person Families | 159 (14.8%) | $123,516 |
| 5-Person Families | 85 (7.9%) | $141,250 |
| 6-Person Families | 12 (1.1%) | $0 |
| 7+ Person Families | 0 (0.0%) | $0 |
| Total | 1,077 (100.0%) | $124,899 |
Family Income by Number of Earners in Eastlawn Gardens
The median family income in Eastlawn Gardens is $124,899, with families comprising 3+ earners (296) having the highest median family income of $212,500, while families with no earners (164) have the lowest median family income of $47,031, accounting for 27.5% and 15.2% of families, respectively.
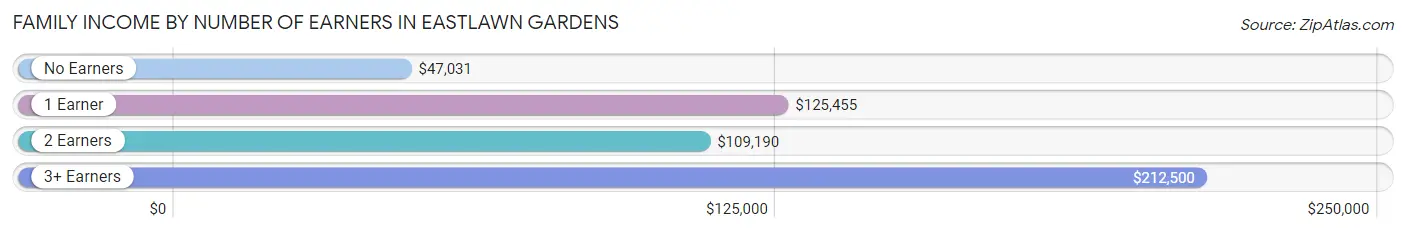
| Number of Earners | # Families | Median Income |
| No Earners | 164 (15.2%) | $47,031 |
| 1 Earner | 134 (12.4%) | $125,455 |
| 2 Earners | 483 (44.9%) | $109,190 |
| 3+ Earners | 296 (27.5%) | $212,500 |
| Total | 1,077 (100.0%) | $124,899 |
Household Income in Eastlawn Gardens
Household Income Brackets in Eastlawn Gardens
With 390 households falling in the category, the $100,000 to $149,999 income range is the most frequent in Eastlawn Gardens, accounting for 28.4% of all households.
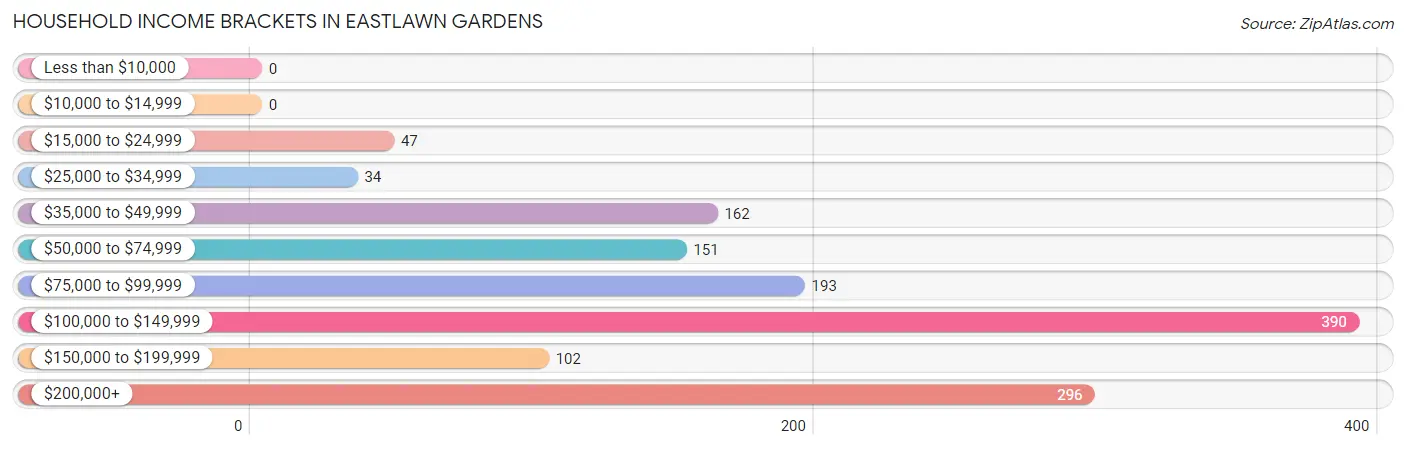
| Income Bracket | # Households | % Households |
| Less than $10,000 | 0 | 0.0% |
| $10,000 to $14,999 | 0 | 0.0% |
| $15,000 to $24,999 | 47 | 3.4% |
| $25,000 to $34,999 | 34 | 2.5% |
| $35,000 to $49,999 | 162 | 11.8% |
| $50,000 to $74,999 | 151 | 11.0% |
| $75,000 to $99,999 | 193 | 14.0% |
| $100,000 to $149,999 | 390 | 28.4% |
| $150,000 to $199,999 | 102 | 7.4% |
| $200,000+ | 296 | 21.5% |
Household Income by Householder Age in Eastlawn Gardens
The median household income in Eastlawn Gardens is $108,449, with the highest median household income of $132,434 found in the 45 to 64 years age bracket for the primary householder. A total of 761 households (55.3%) fall into this category.
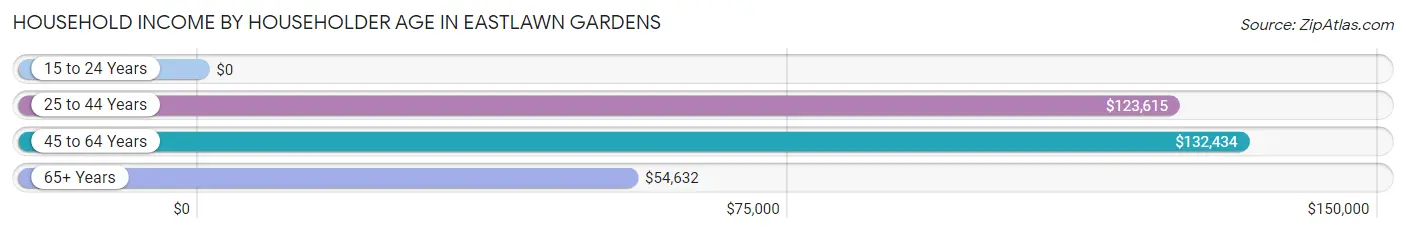
| Income Bracket | # Households | Median Income |
| 15 to 24 Years | 0 (0.0%) | $0 |
| 25 to 44 Years | 213 (15.5%) | $123,615 |
| 45 to 64 Years | 761 (55.3%) | $132,434 |
| 65+ Years | 401 (29.2%) | $54,632 |
| Total | 1,375 (100.0%) | $108,449 |
Poverty in Eastlawn Gardens
Income Below Poverty by Sex and Age in Eastlawn Gardens
With 2.8% poverty level for males and 0.9% for females among the residents of Eastlawn Gardens, 25 to 34 year old males and 35 to 44 year old females are the most vulnerable to poverty, with 22 males (15.0%) and 15 females (11.6%) in their respective age groups living below the poverty level.
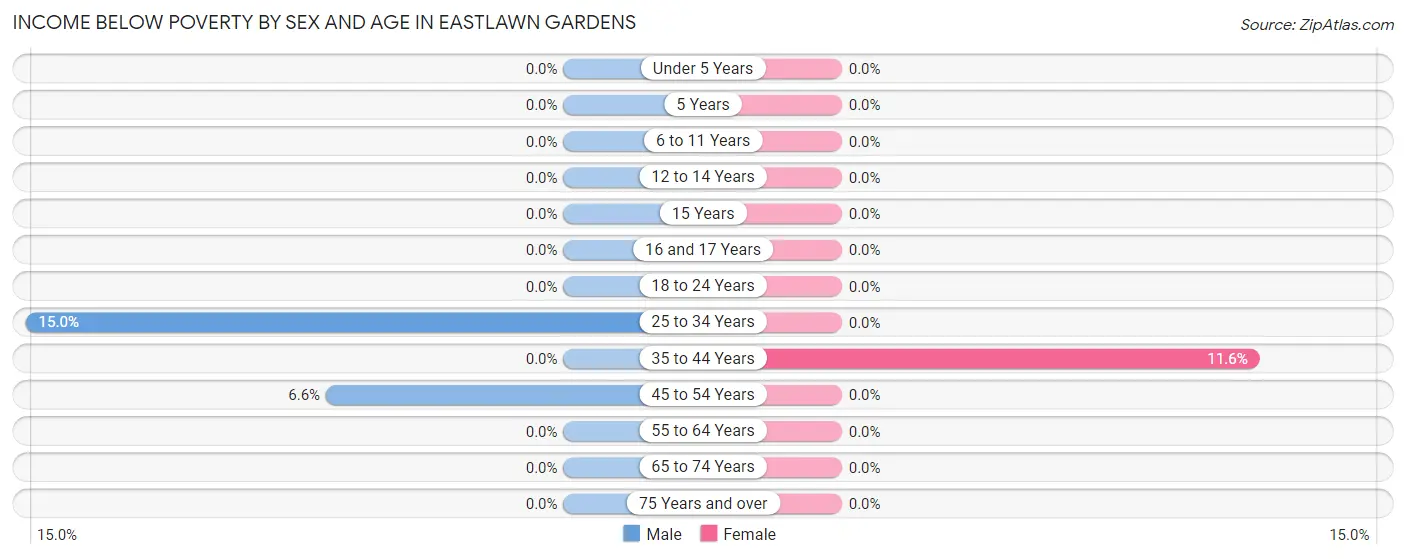
| Age Bracket | Male | Female |
| Under 5 Years | 0 (0.0%) | 0 (0.0%) |
| 5 Years | 0 (0.0%) | 0 (0.0%) |
| 6 to 11 Years | 0 (0.0%) | 0 (0.0%) |
| 12 to 14 Years | 0 (0.0%) | 0 (0.0%) |
| 15 Years | 0 (0.0%) | 0 (0.0%) |
| 16 and 17 Years | 0 (0.0%) | 0 (0.0%) |
| 18 to 24 Years | 0 (0.0%) | 0 (0.0%) |
| 25 to 34 Years | 22 (15.0%) | 0 (0.0%) |
| 35 to 44 Years | 0 (0.0%) | 15 (11.6%) |
| 45 to 54 Years | 29 (6.6%) | 0 (0.0%) |
| 55 to 64 Years | 0 (0.0%) | 0 (0.0%) |
| 65 to 74 Years | 0 (0.0%) | 0 (0.0%) |
| 75 Years and over | 0 (0.0%) | 0 (0.0%) |
| Total | 51 (2.8%) | 15 (0.9%) |
Income Above Poverty by Sex and Age in Eastlawn Gardens
According to the poverty statistics in Eastlawn Gardens, males aged 5 years and females aged under 5 years are the age groups that are most secure financially, with 100.0% of males and 100.0% of females in these age groups living above the poverty line.
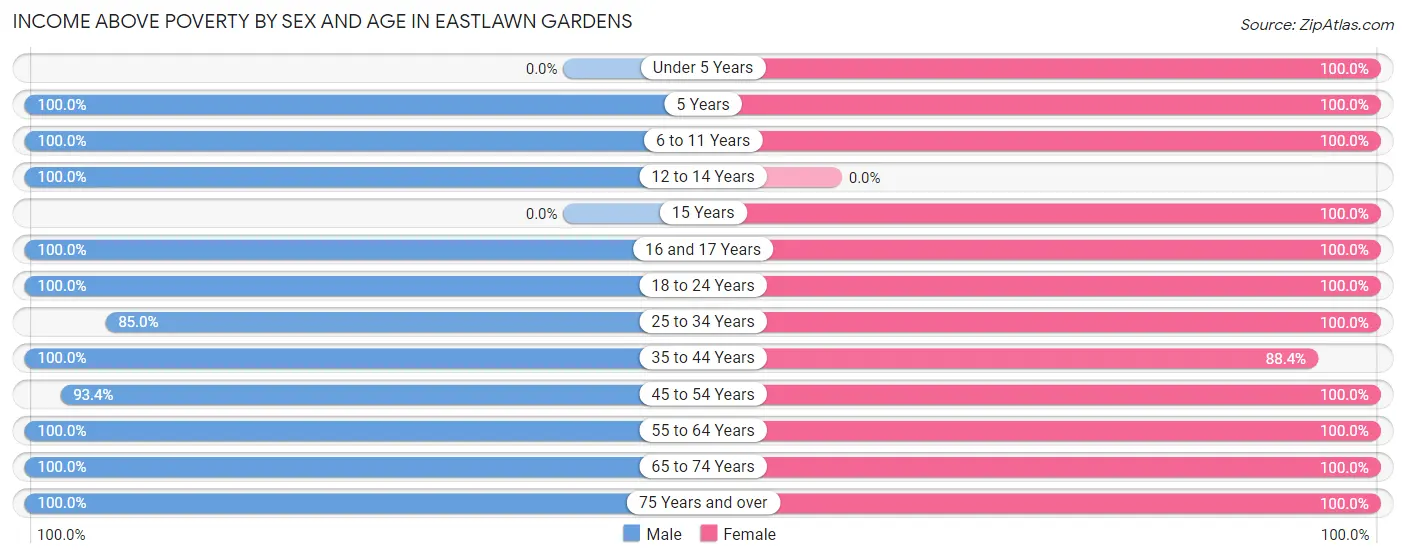
| Age Bracket | Male | Female |
| Under 5 Years | 0 (0.0%) | 46 (100.0%) |
| 5 Years | 15 (100.0%) | 18 (100.0%) |
| 6 to 11 Years | 101 (100.0%) | 68 (100.0%) |
| 12 to 14 Years | 97 (100.0%) | 0 (0.0%) |
| 15 Years | 0 (0.0%) | 64 (100.0%) |
| 16 and 17 Years | 118 (100.0%) | 62 (100.0%) |
| 18 to 24 Years | 263 (100.0%) | 88 (100.0%) |
| 25 to 34 Years | 125 (85.0%) | 164 (100.0%) |
| 35 to 44 Years | 82 (100.0%) | 114 (88.4%) |
| 45 to 54 Years | 410 (93.4%) | 515 (100.0%) |
| 55 to 64 Years | 258 (100.0%) | 257 (100.0%) |
| 65 to 74 Years | 149 (100.0%) | 124 (100.0%) |
| 75 Years and over | 143 (100.0%) | 189 (100.0%) |
| Total | 1,761 (97.2%) | 1,709 (99.1%) |
Income Below Poverty Among Married-Couple Families in Eastlawn Gardens
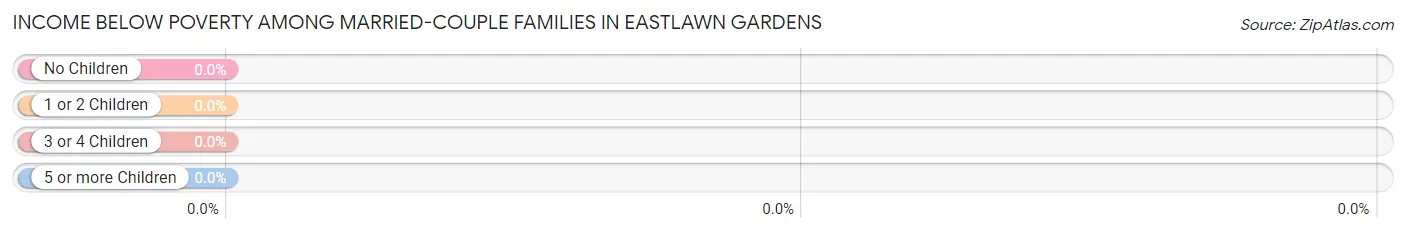
| Children | Above Poverty | Below Poverty |
| No Children | 602 (100.0%) | 0 (0.0%) |
| 1 or 2 Children | 212 (100.0%) | 0 (0.0%) |
| 3 or 4 Children | 44 (100.0%) | 0 (0.0%) |
| 5 or more Children | 0 (0.0%) | 0 (0.0%) |
| Total | 858 (100.0%) | 0 (0.0%) |
Income Below Poverty Among Single-Parent Households in Eastlawn Gardens
| Children | Single Father | Single Mother |
| No Children | 0 (0.0%) | 0 (0.0%) |
| 1 or 2 Children | 0 (0.0%) | 0 (0.0%) |
| 3 or 4 Children | 0 (0.0%) | 0 (0.0%) |
| 5 or more Children | 0 (0.0%) | 0 (0.0%) |
| Total | 0 (0.0%) | 0 (0.0%) |
Income Below Poverty Among Married-Couple vs Single-Parent Households in Eastlawn Gardens
| Children | Married-Couple Families | Single-Parent Households |
| No Children | 0 (0.0%) | 0 (0.0%) |
| 1 or 2 Children | 0 (0.0%) | 0 (0.0%) |
| 3 or 4 Children | 0 (0.0%) | 0 (0.0%) |
| 5 or more Children | 0 (0.0%) | 0 (0.0%) |
| Total | 0 (0.0%) | 0 (0.0%) |
Race in Eastlawn Gardens
The most populous races in Eastlawn Gardens are White / Caucasian (3,424 | 96.8%), Hispanic or Latino (112 | 3.2%), and Two or more Races (71 | 2.0%).
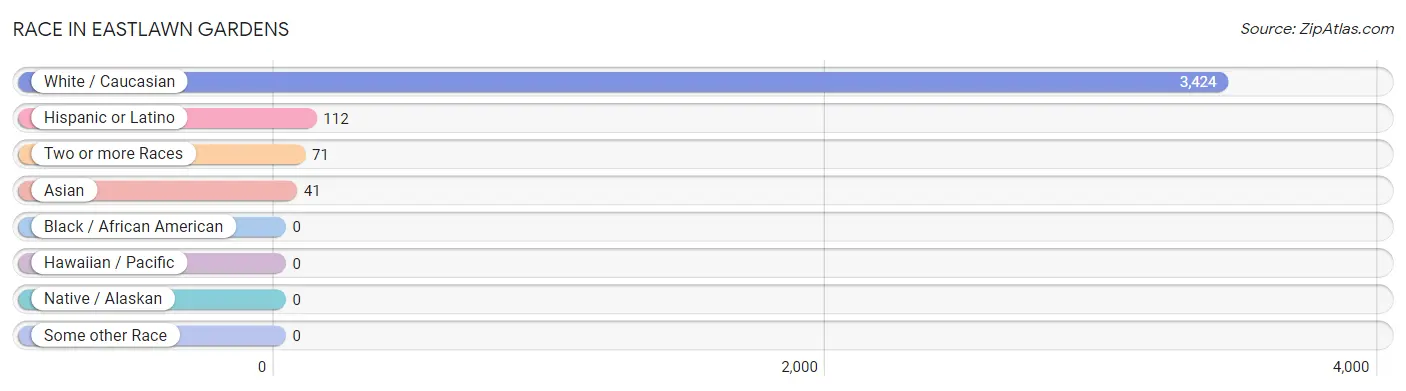
| Race | # Population | % Population |
| Asian | 41 | 1.2% |
| Black / African American | 0 | 0.0% |
| Hawaiian / Pacific | 0 | 0.0% |
| Hispanic or Latino | 112 | 3.2% |
| Native / Alaskan | 0 | 0.0% |
| White / Caucasian | 3,424 | 96.8% |
| Two or more Races | 71 | 2.0% |
| Some other Race | 0 | 0.0% |
| Total | 3,536 | 100.0% |
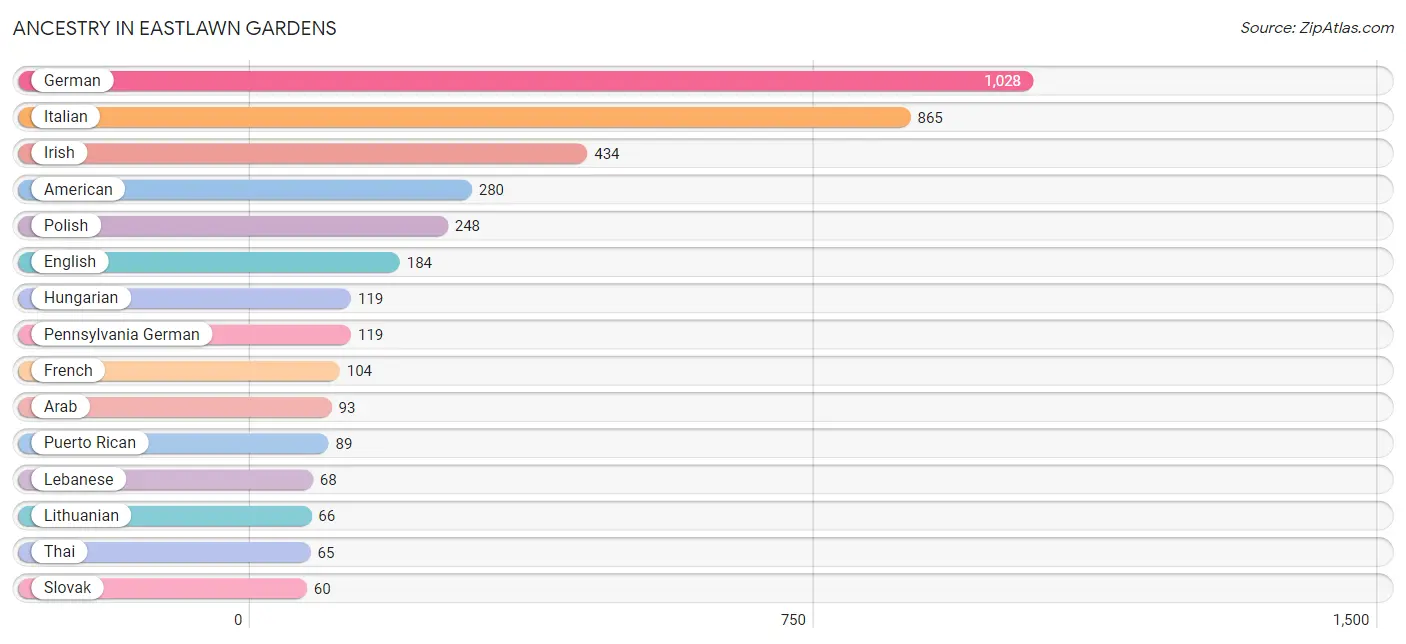
Ancestry in Eastlawn Gardens
The most populous ancestries reported in Eastlawn Gardens are German (1,028 | 29.1%), Italian (865 | 24.5%), Irish (434 | 12.3%), American (280 | 7.9%), and Polish (248 | 7.0%), together accounting for 80.7% of all Eastlawn Gardens residents.
| Ancestry | # Population | % Population |
| American | 280 | 7.9% |
| Arab | 93 | 2.6% |
| Austrian | 17 | 0.5% |
| Bhutanese | 18 | 0.5% |
| British | 39 | 1.1% |
| Croatian | 17 | 0.5% |
| Dominican | 23 | 0.6% |
| Dutch | 34 | 1.0% |
| Eastern European | 24 | 0.7% |
| English | 184 | 5.2% |
| European | 21 | 0.6% |
| French | 104 | 2.9% |
| German | 1,028 | 29.1% |
| Hungarian | 119 | 3.4% |
| Irish | 434 | 12.3% |
| Italian | 865 | 24.5% |
| Lebanese | 68 | 1.9% |
| Lithuanian | 66 | 1.9% |
| Northern European | 39 | 1.1% |
| Pennsylvania German | 119 | 3.4% |
| Polish | 248 | 7.0% |
| Portuguese | 41 | 1.2% |
| Puerto Rican | 89 | 2.5% |
| Romanian | 31 | 0.9% |
| Scotch-Irish | 19 | 0.5% |
| Scottish | 14 | 0.4% |
| Slavic | 22 | 0.6% |
| Slovak | 60 | 1.7% |
| Slovene | 18 | 0.5% |
| Swedish | 40 | 1.1% |
| Syrian | 25 | 0.7% |
| Thai | 65 | 1.8% |
| Ukrainian | 33 | 0.9% |
| Welsh | 50 | 1.4% | View All 34 Rows |
Immigrants in Eastlawn Gardens
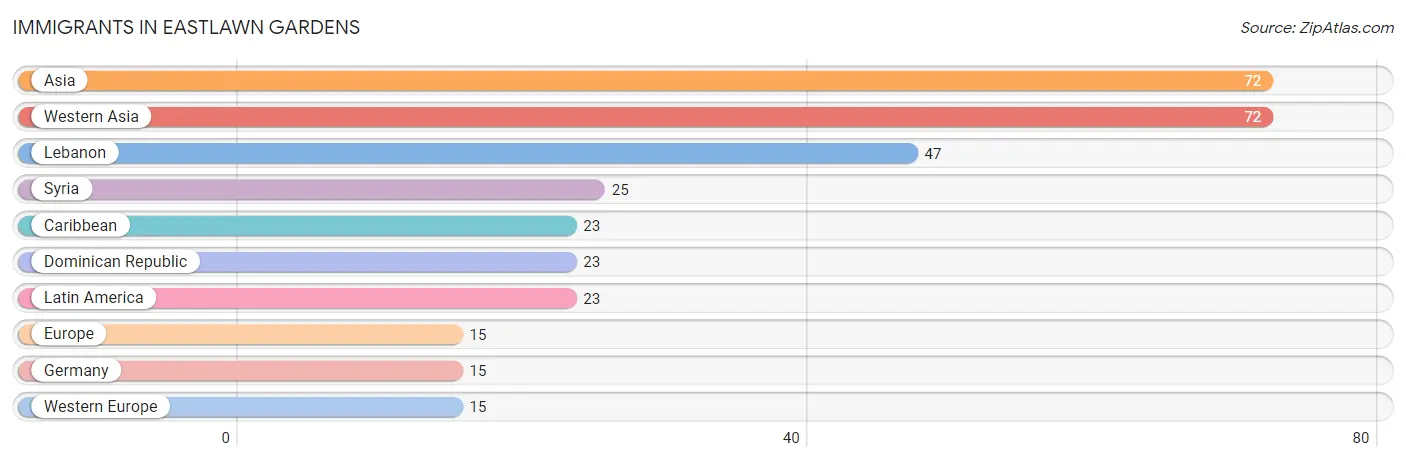
The most numerous immigrant groups reported in Eastlawn Gardens came from Asia (72 | 2.0%), Western Asia (72 | 2.0%), Lebanon (47 | 1.3%), Syria (25 | 0.7%), and Caribbean (23 | 0.6%), together accounting for 6.8% of all Eastlawn Gardens residents.
| Immigration Origin | # Population | % Population |
| Asia | 72 | 2.0% |
| Caribbean | 23 | 0.6% |
| Dominican Republic | 23 | 0.6% |
| Europe | 15 | 0.4% |
| Germany | 15 | 0.4% |
| Latin America | 23 | 0.6% |
| Lebanon | 47 | 1.3% |
| Syria | 25 | 0.7% |
| Western Asia | 72 | 2.0% |
| Western Europe | 15 | 0.4% | View All 10 Rows |
Sex and Age in Eastlawn Gardens
Sex and Age in Eastlawn Gardens
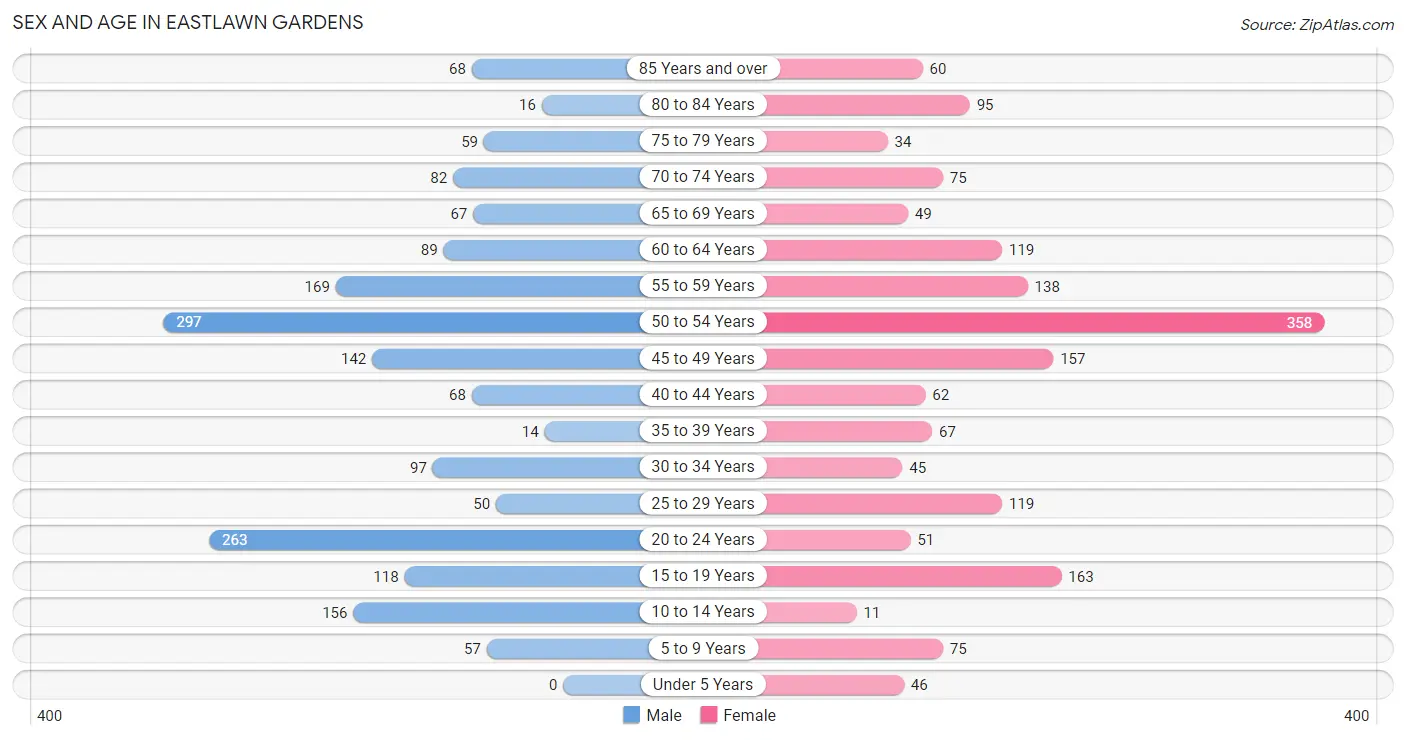
The most populous age groups in Eastlawn Gardens are 50 to 54 Years (297 | 16.4%) for men and 50 to 54 Years (358 | 20.8%) for women.
| Age Bracket | Male | Female |
| Under 5 Years | 0 (0.0%) | 46 (2.7%) |
| 5 to 9 Years | 57 (3.2%) | 75 (4.3%) |
| 10 to 14 Years | 156 (8.6%) | 11 (0.6%) |
| 15 to 19 Years | 118 (6.5%) | 163 (9.5%) |
| 20 to 24 Years | 263 (14.5%) | 51 (3.0%) |
| 25 to 29 Years | 50 (2.8%) | 119 (6.9%) |
| 30 to 34 Years | 97 (5.3%) | 45 (2.6%) |
| 35 to 39 Years | 14 (0.8%) | 67 (3.9%) |
| 40 to 44 Years | 68 (3.7%) | 62 (3.6%) |
| 45 to 49 Years | 142 (7.8%) | 157 (9.1%) |
| 50 to 54 Years | 297 (16.4%) | 358 (20.8%) |
| 55 to 59 Years | 169 (9.3%) | 138 (8.0%) |
| 60 to 64 Years | 89 (4.9%) | 119 (6.9%) |
| 65 to 69 Years | 67 (3.7%) | 49 (2.8%) |
| 70 to 74 Years | 82 (4.5%) | 75 (4.3%) |
| 75 to 79 Years | 59 (3.3%) | 34 (2.0%) |
| 80 to 84 Years | 16 (0.9%) | 95 (5.5%) |
| 85 Years and over | 68 (3.7%) | 60 (3.5%) |
| Total | 1,812 (100.0%) | 1,724 (100.0%) |
Families and Households in Eastlawn Gardens
Median Family Size in Eastlawn Gardens
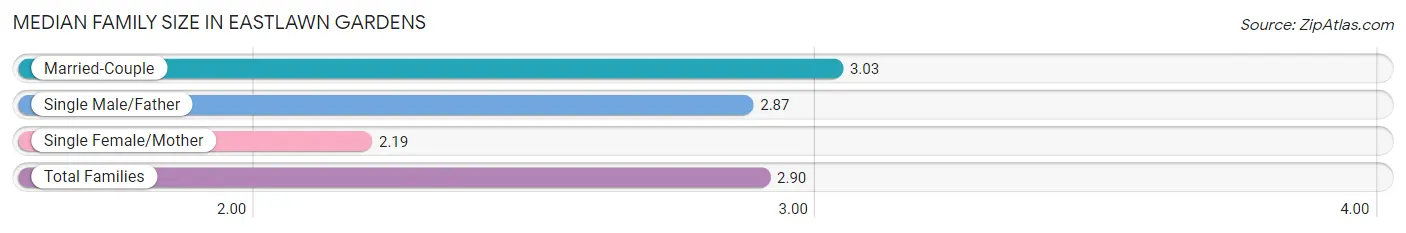
The median family size in Eastlawn Gardens is 2.90 persons per family, with married-couple families (858 | 79.7%) accounting for the largest median family size of 3.03 persons per family. On the other hand, single female/mother families (152 | 14.1%) represent the smallest median family size with 2.19 persons per family.
| Family Type | # Families | Family Size |
| Married-Couple | 858 (79.7%) | 3.03 |
| Single Male/Father | 67 (6.2%) | 2.87 |
| Single Female/Mother | 152 (14.1%) | 2.19 |
| Total Families | 1,077 (100.0%) | 2.90 |
Median Household Size in Eastlawn Gardens
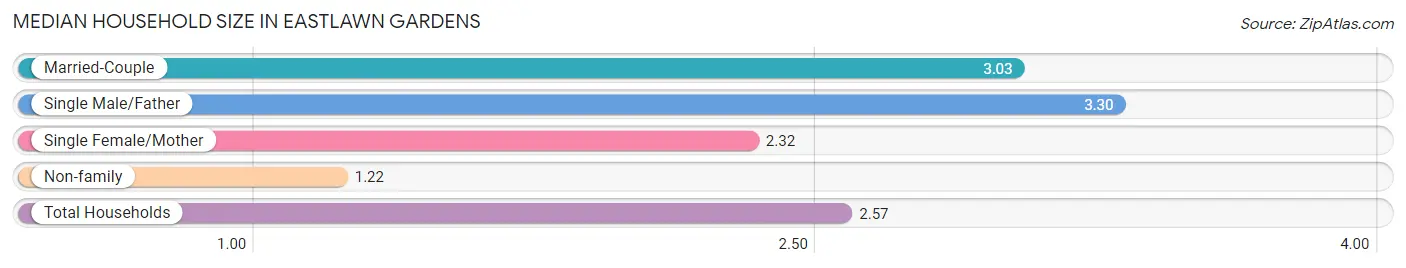
The median household size in Eastlawn Gardens is 2.57 persons per household, with single male/father households (67 | 4.9%) accounting for the largest median household size of 3.3 persons per household. non-family households (298 | 21.7%) represent the smallest median household size with 1.22 persons per household.
| Household Type | # Households | Household Size |
| Married-Couple | 858 (62.4%) | 3.03 |
| Single Male/Father | 67 (4.9%) | 3.30 |
| Single Female/Mother | 152 (11.1%) | 2.32 |
| Non-family | 298 (21.7%) | 1.22 |
| Total Households | 1,375 (100.0%) | 2.57 |
Household Size by Marriage Status in Eastlawn Gardens
Out of a total of 1,375 households in Eastlawn Gardens, 1,077 (78.3%) are family households, while 298 (21.7%) are nonfamily households. The most numerous type of family households are 2-person households, comprising 457, and the most common type of nonfamily households are 1-person households, comprising 228.
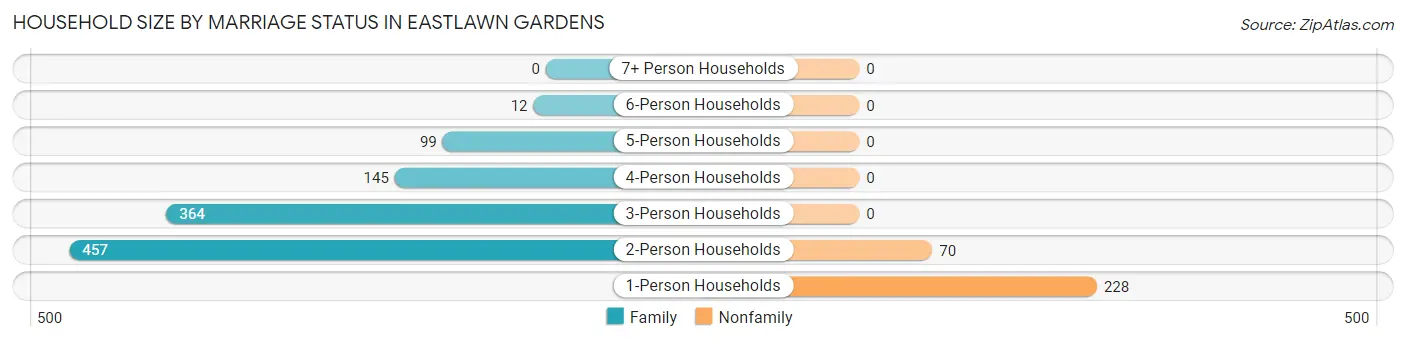
| Household Size | Family Households | Nonfamily Households |
| 1-Person Households | - | 228 (16.6%) |
| 2-Person Households | 457 (33.2%) | 70 (5.1%) |
| 3-Person Households | 364 (26.5%) | 0 (0.0%) |
| 4-Person Households | 145 (10.5%) | 0 (0.0%) |
| 5-Person Households | 99 (7.2%) | 0 (0.0%) |
| 6-Person Households | 12 (0.9%) | 0 (0.0%) |
| 7+ Person Households | 0 (0.0%) | 0 (0.0%) |
| Total | 1,077 (78.3%) | 298 (21.7%) |
Female Fertility in Eastlawn Gardens
Fertility by Age in Eastlawn Gardens
| Age Bracket | Women with Births | Births / 1,000 Women |
| 15 to 19 years | 0 (0.0%) | 0.0 |
| 20 to 34 years | 0 (0.0%) | 0.0 |
| 35 to 50 years | 0 (0.0%) | 0.0 |
| Total | 0 (0.0%) | 0.0 |
Fertility by Age by Marriage Status in Eastlawn Gardens
| Age Bracket | Married | Unmarried |
| 15 to 19 years | 0 (0.0%) | 0 (0.0%) |
| 20 to 34 years | 0 (0.0%) | 0 (0.0%) |
| 35 to 50 years | 0 (0.0%) | 0 (0.0%) |
| Total | 0 (0.0%) | 0 (0.0%) |
Fertility by Education in Eastlawn Gardens
| Educational Attainment | Women with Births | Births / 1,000 Women |
| Less than High School | 0 (0.0%) | 0.0 |
| High School Diploma | 0 (0.0%) | 0.0 |
| College or Associate's Degree | 0 (0.0%) | 0.0 |
| Bachelor's Degree | 0 (0.0%) | 0.0 |
| Graduate Degree | 0 (0.0%) | 0.0 |
| Total | 0 (0.0%) | 0.0 |
Fertility by Education by Marriage Status in Eastlawn Gardens
| Educational Attainment | Married | Unmarried |
| Less than High School | 0 (0.0%) | 0 (0.0%) |
| High School Diploma | 0 (0.0%) | 0 (0.0%) |
| College or Associate's Degree | 0 (0.0%) | 0 (0.0%) |
| Bachelor's Degree | 0 (0.0%) | 0 (0.0%) |
| Graduate Degree | 0 (0.0%) | 0 (0.0%) |
| Total | 0 (0.0%) | 0 (0.0%) |
Employment Characteristics in Eastlawn Gardens
Employment by Class of Employer in Eastlawn Gardens
Among the 2,134 employed individuals in Eastlawn Gardens, private company employees (1,369 | 64.1%), local government employees (341 | 16.0%), and not-for-profit organizations (277 | 13.0%) make up the most common classes of employment.
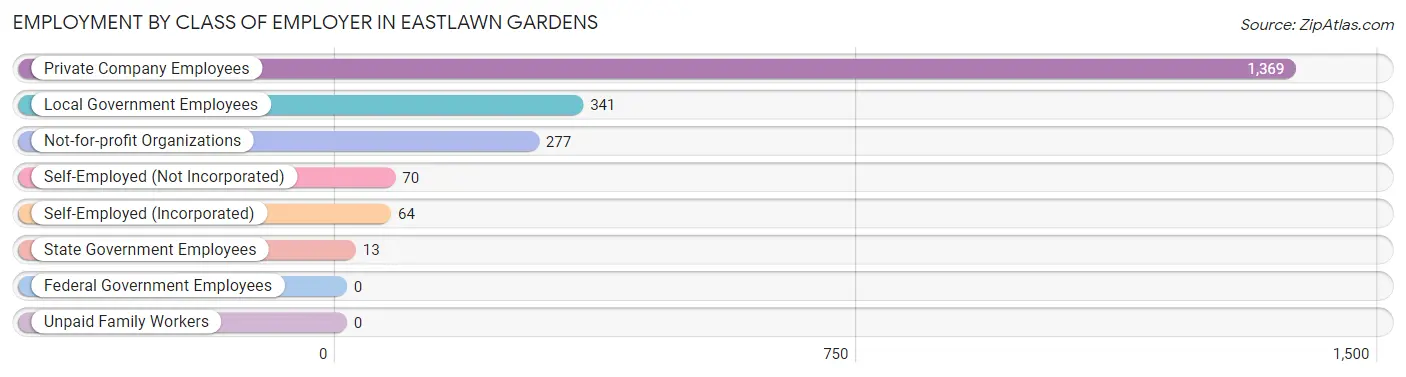
| Employer Class | # Employees | % Employees |
| Private Company Employees | 1,369 | 64.1% |
| Self-Employed (Incorporated) | 64 | 3.0% |
| Self-Employed (Not Incorporated) | 70 | 3.3% |
| Not-for-profit Organizations | 277 | 13.0% |
| Local Government Employees | 341 | 16.0% |
| State Government Employees | 13 | 0.6% |
| Federal Government Employees | 0 | 0.0% |
| Unpaid Family Workers | 0 | 0.0% |
| Total | 2,134 | 100.0% |
Employment Status by Age in Eastlawn Gardens
According to the labor force statistics for Eastlawn Gardens, out of the total population over 16 years of age (3,127), 70.1% or 2,192 individuals are in the labor force, with 1.6% or 35 of them unemployed. The age group with the highest labor force participation rate is 25 to 29 years, with 100.0% or 169 individuals in the labor force. Within the labor force, the 65 to 74 years age range has the highest percentage of unemployed individuals, with 47.4% or 18 of them being unemployed.
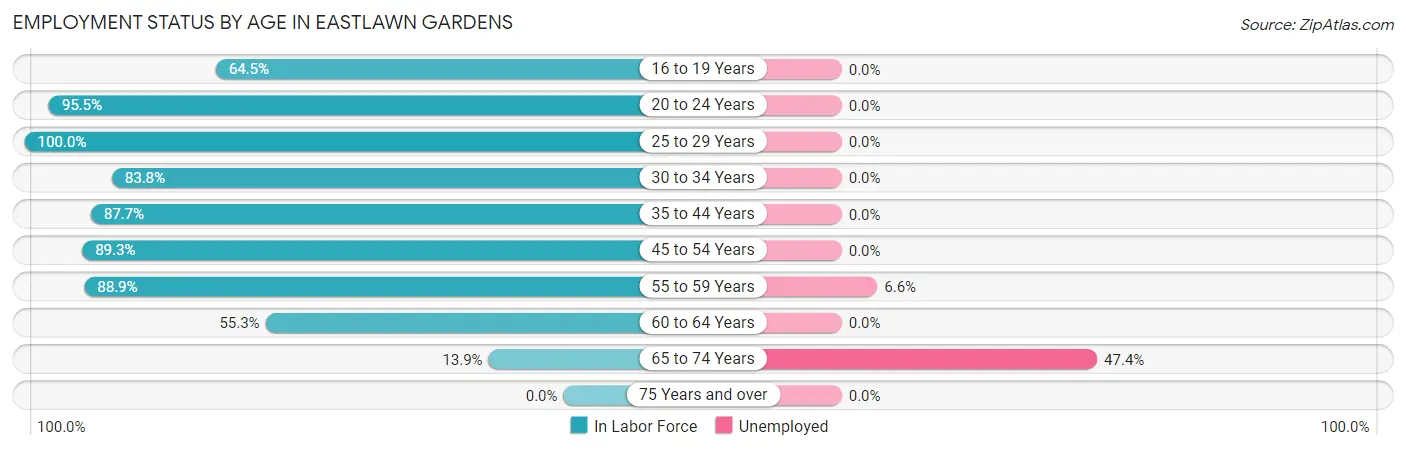
| Age Bracket | In Labor Force | Unemployed |
| 16 to 19 Years | 140 (64.5%) | 0 (0.0%) |
| 20 to 24 Years | 300 (95.5%) | 0 (0.0%) |
| 25 to 29 Years | 169 (100.0%) | 0 (0.0%) |
| 30 to 34 Years | 119 (83.8%) | 0 (0.0%) |
| 35 to 44 Years | 185 (87.7%) | 0 (0.0%) |
| 45 to 54 Years | 852 (89.3%) | 0 (0.0%) |
| 55 to 59 Years | 273 (88.9%) | 18 (6.6%) |
| 60 to 64 Years | 115 (55.3%) | 0 (0.0%) |
| 65 to 74 Years | 38 (13.9%) | 18 (47.4%) |
| 75 Years and over | 0 (0.0%) | 0 (0.0%) |
| Total | 2,192 (70.1%) | 35 (1.6%) |
Employment Status by Educational Attainment in Eastlawn Gardens
According to labor force statistics for Eastlawn Gardens, 86.0% of individuals (1,712) out of the total population between 25 and 64 years of age (1,991) are in the labor force, with 1.1% or 19 of them being unemployed. The group with the highest labor force participation rate are those with the educational attainment of less than high school, with 100.0% or 20 individuals in the labor force. Within the labor force, individuals with high school diploma education have the highest percentage of unemployment, with 7.7% or 18 of them being unemployed.
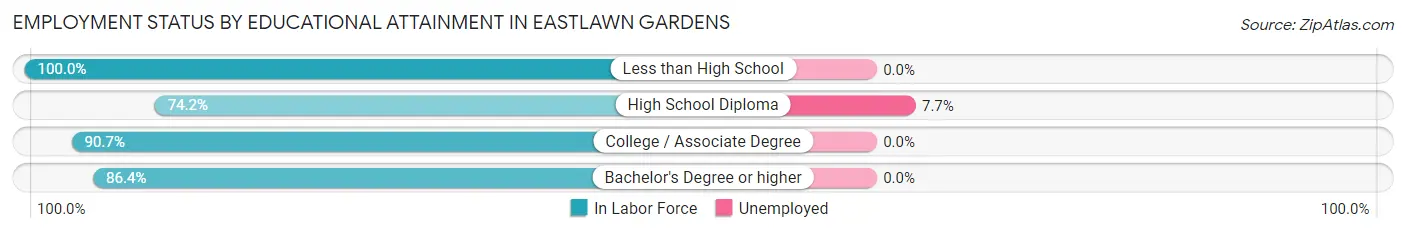
| Educational Attainment | In Labor Force | Unemployed |
| Less than High School | 20 (100.0%) | 0 (0.0%) |
| High School Diploma | 233 (74.2%) | 24 (7.7%) |
| College / Associate Degree | 594 (90.7%) | 0 (0.0%) |
| Bachelor's Degree or higher | 866 (86.4%) | 0 (0.0%) |
| Total | 1,712 (86.0%) | 22 (1.1%) |
Employment Occupations by Sex in Eastlawn Gardens
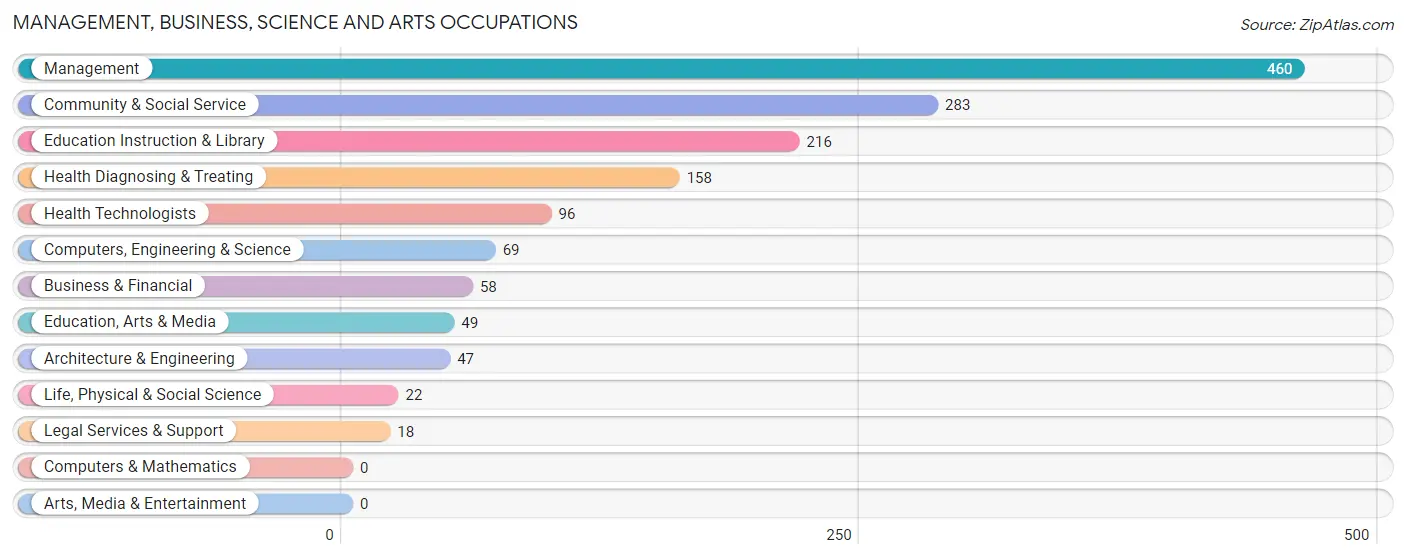
Management, Business, Science and Arts Occupations
The most common Management, Business, Science and Arts occupations in Eastlawn Gardens are Management (460 | 21.3%), Community & Social Service (283 | 13.1%), Education Instruction & Library (216 | 10.0%), Health Diagnosing & Treating (158 | 7.3%), and Health Technologists (96 | 4.4%).
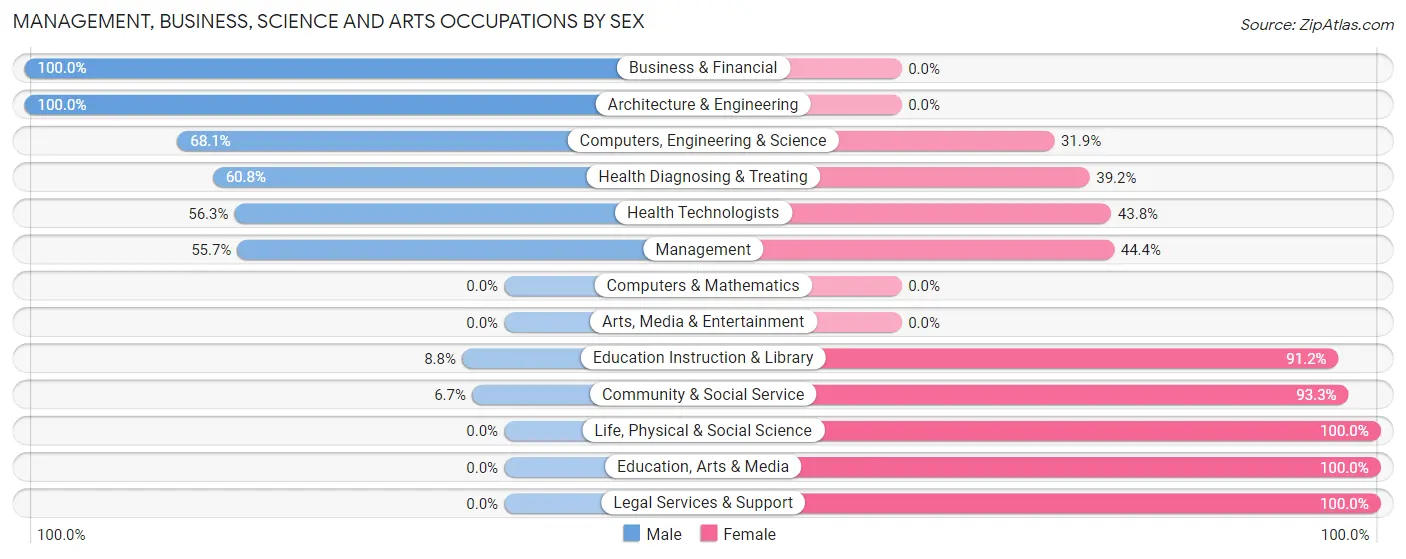
Management, Business, Science and Arts Occupations by Sex
Within the Management, Business, Science and Arts occupations in Eastlawn Gardens, the most male-oriented occupations are Business & Financial (100.0%), Architecture & Engineering (100.0%), and Computers, Engineering & Science (68.1%), while the most female-oriented occupations are Life, Physical & Social Science (100.0%), Education, Arts & Media (100.0%), and Legal Services & Support (100.0%).
| Occupation | Male | Female |
| Management | 256 (55.6%) | 204 (44.4%) |
| Business & Financial | 58 (100.0%) | 0 (0.0%) |
| Computers, Engineering & Science | 47 (68.1%) | 22 (31.9%) |
| Computers & Mathematics | 0 (0.0%) | 0 (0.0%) |
| Architecture & Engineering | 47 (100.0%) | 0 (0.0%) |
| Life, Physical & Social Science | 0 (0.0%) | 22 (100.0%) |
| Community & Social Service | 19 (6.7%) | 264 (93.3%) |
| Education, Arts & Media | 0 (0.0%) | 49 (100.0%) |
| Legal Services & Support | 0 (0.0%) | 18 (100.0%) |
| Education Instruction & Library | 19 (8.8%) | 197 (91.2%) |
| Arts, Media & Entertainment | 0 (0.0%) | 0 (0.0%) |
| Health Diagnosing & Treating | 96 (60.8%) | 62 (39.2%) |
| Health Technologists | 54 (56.2%) | 42 (43.8%) |
| Total (Category) | 476 (46.3%) | 552 (53.7%) |
| Total (Overall) | 1,161 (53.9%) | 994 (46.1%) |
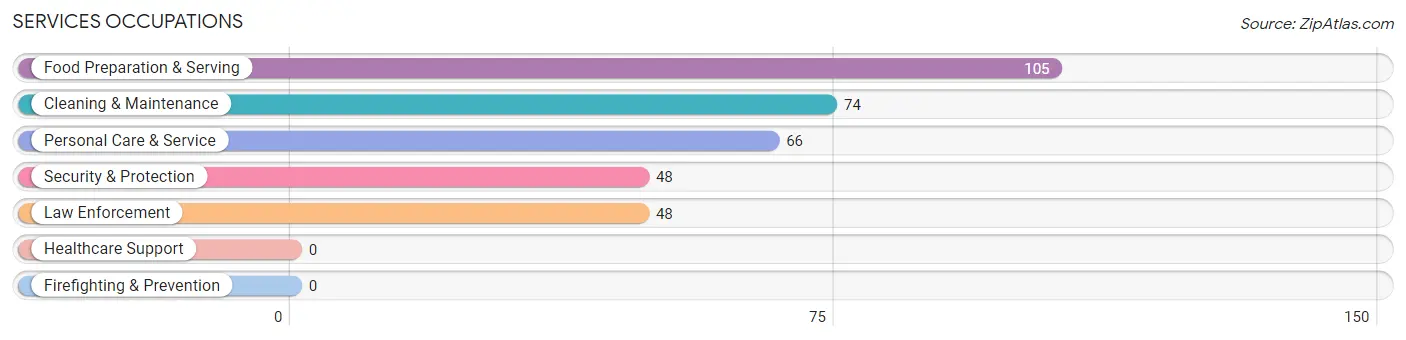
Services Occupations
The most common Services occupations in Eastlawn Gardens are Food Preparation & Serving (105 | 4.9%), Cleaning & Maintenance (74 | 3.4%), Personal Care & Service (66 | 3.1%), Security & Protection (48 | 2.2%), and Law Enforcement (48 | 2.2%).
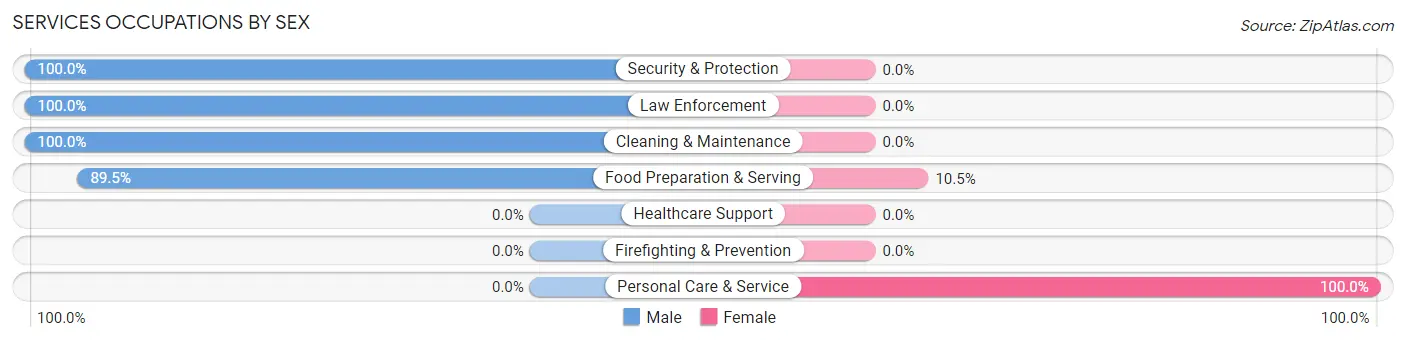
Services Occupations by Sex
Within the Services occupations in Eastlawn Gardens, the most male-oriented occupations are Security & Protection (100.0%), Law Enforcement (100.0%), and Cleaning & Maintenance (100.0%), while the most female-oriented occupations are Personal Care & Service (100.0%), and Food Preparation & Serving (10.5%).
| Occupation | Male | Female |
| Healthcare Support | 0 (0.0%) | 0 (0.0%) |
| Security & Protection | 48 (100.0%) | 0 (0.0%) |
| Firefighting & Prevention | 0 (0.0%) | 0 (0.0%) |
| Law Enforcement | 48 (100.0%) | 0 (0.0%) |
| Food Preparation & Serving | 94 (89.5%) | 11 (10.5%) |
| Cleaning & Maintenance | 74 (100.0%) | 0 (0.0%) |
| Personal Care & Service | 0 (0.0%) | 66 (100.0%) |
| Total (Category) | 216 (73.7%) | 77 (26.3%) |
| Total (Overall) | 1,161 (53.9%) | 994 (46.1%) |
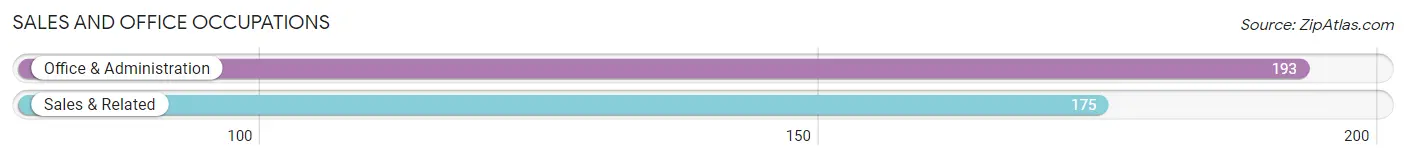
Sales and Office Occupations
The most common Sales and Office occupations in Eastlawn Gardens are Office & Administration (193 | 9.0%), and Sales & Related (175 | 8.1%).
Sales and Office Occupations by Sex
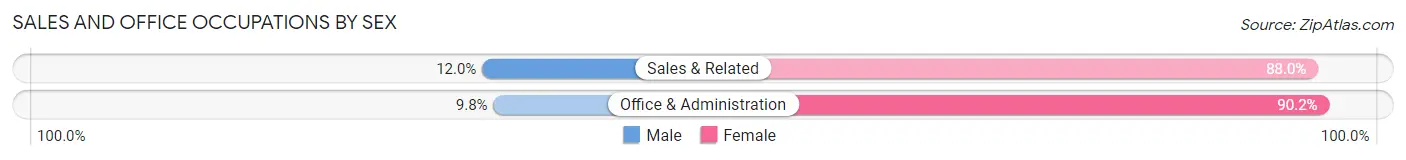
| Occupation | Male | Female |
| Sales & Related | 21 (12.0%) | 154 (88.0%) |
| Office & Administration | 19 (9.8%) | 174 (90.2%) |
| Total (Category) | 40 (10.9%) | 328 (89.1%) |
| Total (Overall) | 1,161 (53.9%) | 994 (46.1%) |
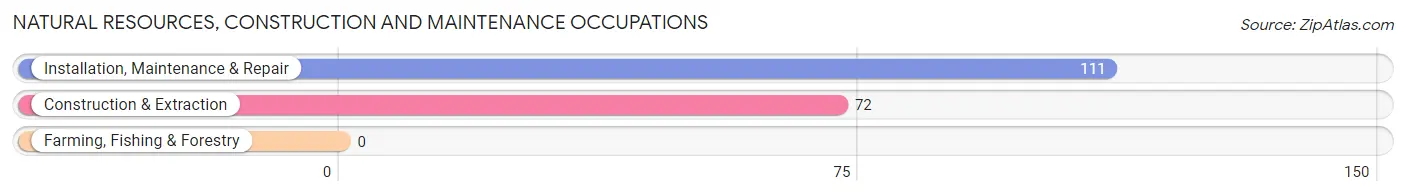
Natural Resources, Construction and Maintenance Occupations
The most common Natural Resources, Construction and Maintenance occupations in Eastlawn Gardens are Installation, Maintenance & Repair (111 | 5.1%), and Construction & Extraction (72 | 3.3%).
Natural Resources, Construction and Maintenance Occupations by Sex
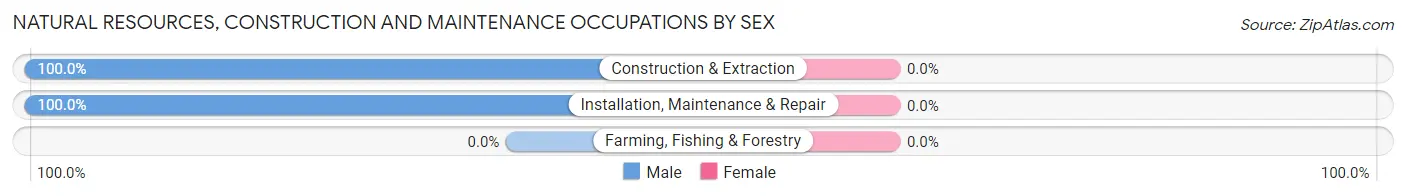
| Occupation | Male | Female |
| Farming, Fishing & Forestry | 0 (0.0%) | 0 (0.0%) |
| Construction & Extraction | 72 (100.0%) | 0 (0.0%) |
| Installation, Maintenance & Repair | 111 (100.0%) | 0 (0.0%) |
| Total (Category) | 183 (100.0%) | 0 (0.0%) |
| Total (Overall) | 1,161 (53.9%) | 994 (46.1%) |
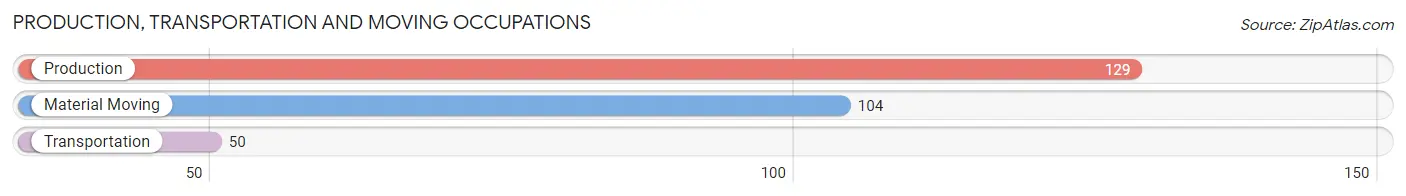
Production, Transportation and Moving Occupations
The most common Production, Transportation and Moving occupations in Eastlawn Gardens are Production (129 | 6.0%), Material Moving (104 | 4.8%), and Transportation (50 | 2.3%).
Production, Transportation and Moving Occupations by Sex
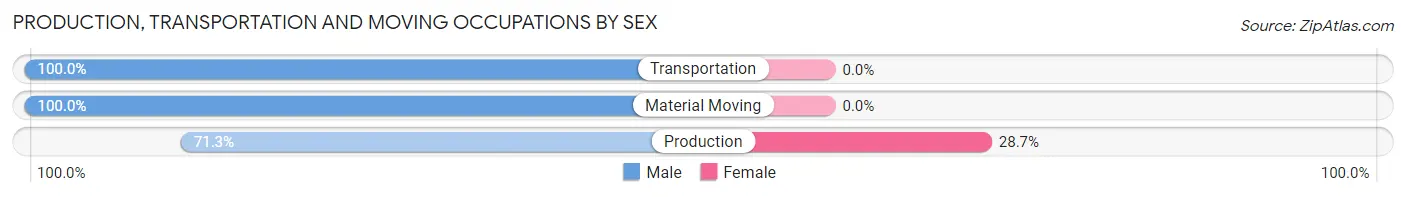
| Occupation | Male | Female |
| Production | 92 (71.3%) | 37 (28.7%) |
| Transportation | 50 (100.0%) | 0 (0.0%) |
| Material Moving | 104 (100.0%) | 0 (0.0%) |
| Total (Category) | 246 (86.9%) | 37 (13.1%) |
| Total (Overall) | 1,161 (53.9%) | 994 (46.1%) |
Employment Industries by Sex in Eastlawn Gardens
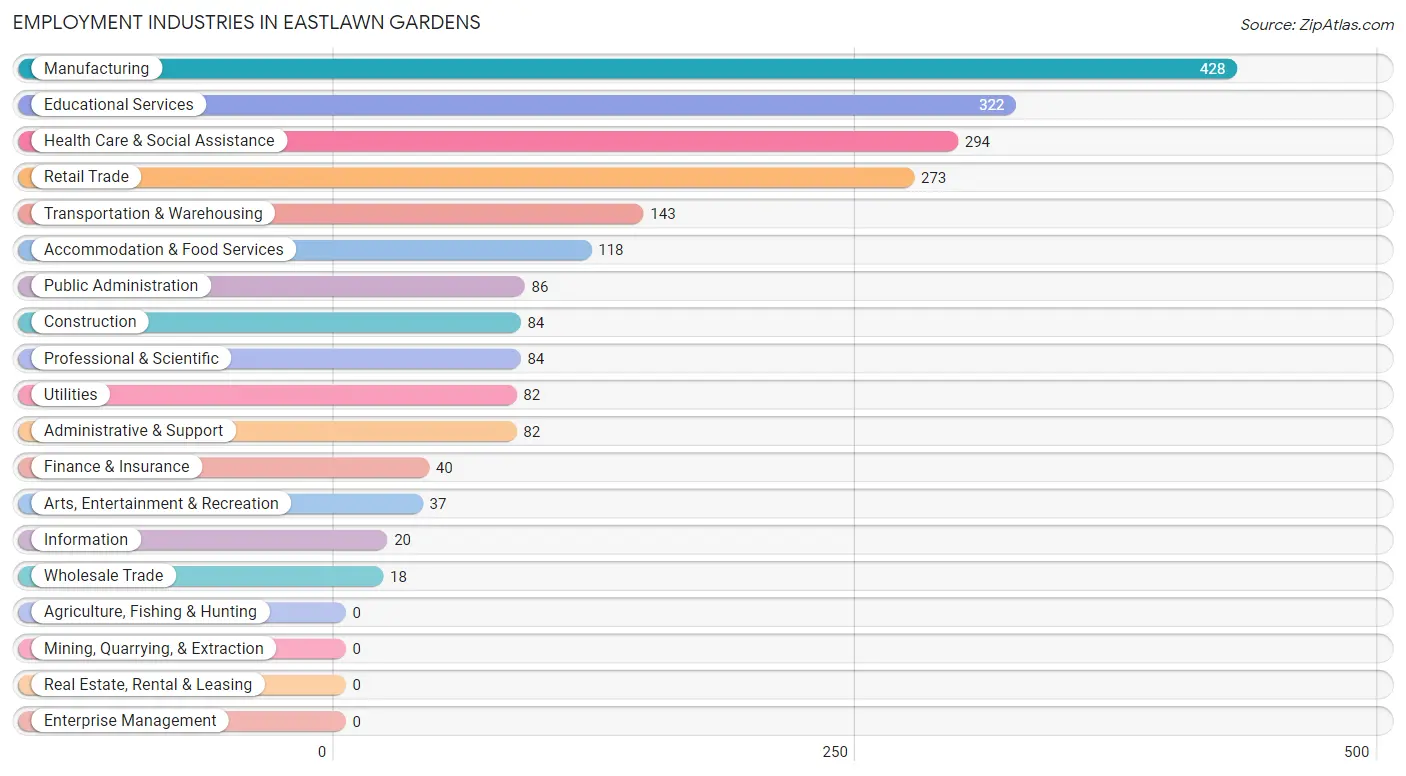
Employment Industries in Eastlawn Gardens
The major employment industries in Eastlawn Gardens include Manufacturing (428 | 19.9%), Educational Services (322 | 14.9%), Health Care & Social Assistance (294 | 13.6%), Retail Trade (273 | 12.7%), and Transportation & Warehousing (143 | 6.6%).
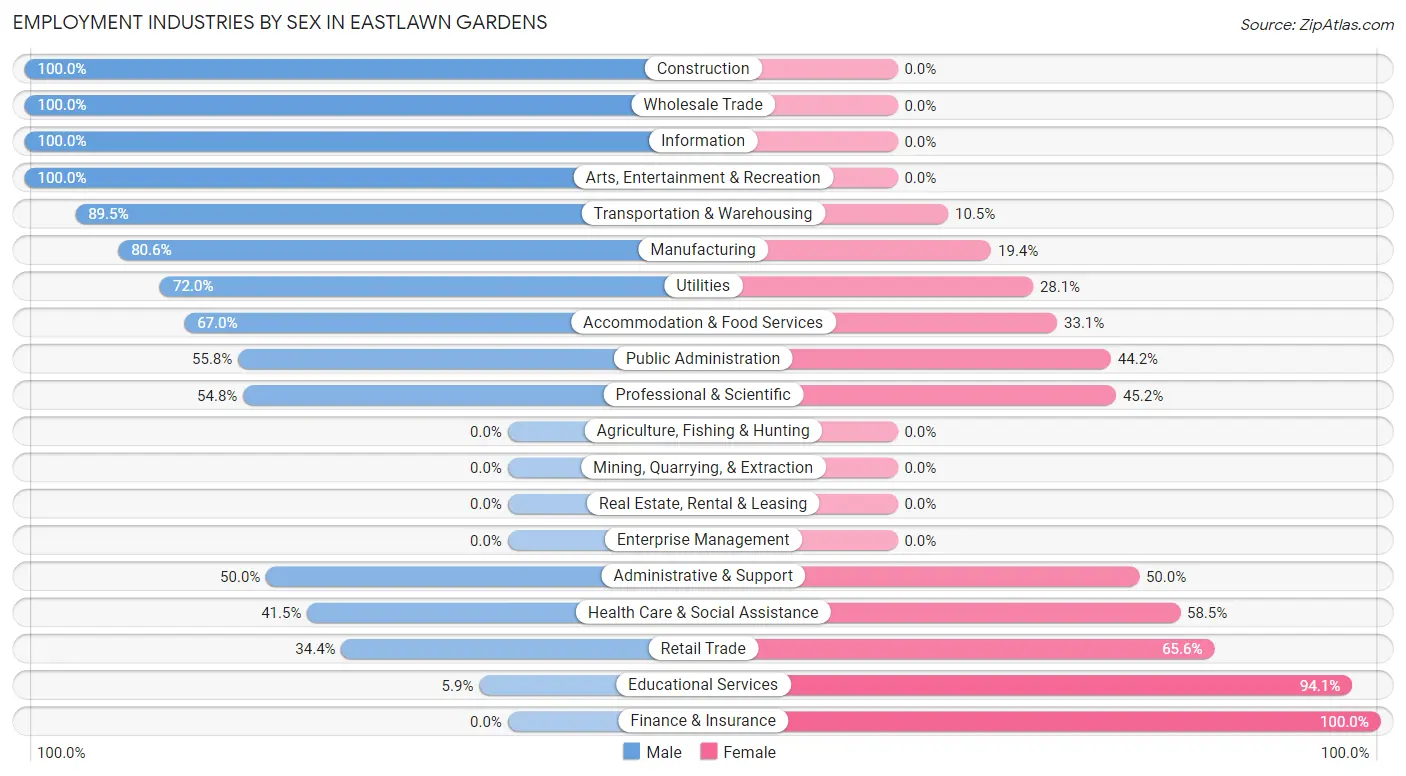
Employment Industries by Sex in Eastlawn Gardens
The Eastlawn Gardens industries that see more men than women are Construction (100.0%), Wholesale Trade (100.0%), and Information (100.0%), whereas the industries that tend to have a higher number of women are Finance & Insurance (100.0%), Educational Services (94.1%), and Retail Trade (65.6%).
| Industry | Male | Female |
| Agriculture, Fishing & Hunting | 0 (0.0%) | 0 (0.0%) |
| Mining, Quarrying, & Extraction | 0 (0.0%) | 0 (0.0%) |
| Construction | 84 (100.0%) | 0 (0.0%) |
| Manufacturing | 345 (80.6%) | 83 (19.4%) |
| Wholesale Trade | 18 (100.0%) | 0 (0.0%) |
| Retail Trade | 94 (34.4%) | 179 (65.6%) |
| Transportation & Warehousing | 128 (89.5%) | 15 (10.5%) |
| Utilities | 59 (72.0%) | 23 (28.1%) |
| Information | 20 (100.0%) | 0 (0.0%) |
| Finance & Insurance | 0 (0.0%) | 40 (100.0%) |
| Real Estate, Rental & Leasing | 0 (0.0%) | 0 (0.0%) |
| Professional & Scientific | 46 (54.8%) | 38 (45.2%) |
| Enterprise Management | 0 (0.0%) | 0 (0.0%) |
| Administrative & Support | 41 (50.0%) | 41 (50.0%) |
| Educational Services | 19 (5.9%) | 303 (94.1%) |
| Health Care & Social Assistance | 122 (41.5%) | 172 (58.5%) |
| Arts, Entertainment & Recreation | 37 (100.0%) | 0 (0.0%) |
| Accommodation & Food Services | 79 (66.9%) | 39 (33.1%) |
| Public Administration | 48 (55.8%) | 38 (44.2%) |
| Total | 1,161 (53.9%) | 994 (46.1%) |
Education in Eastlawn Gardens
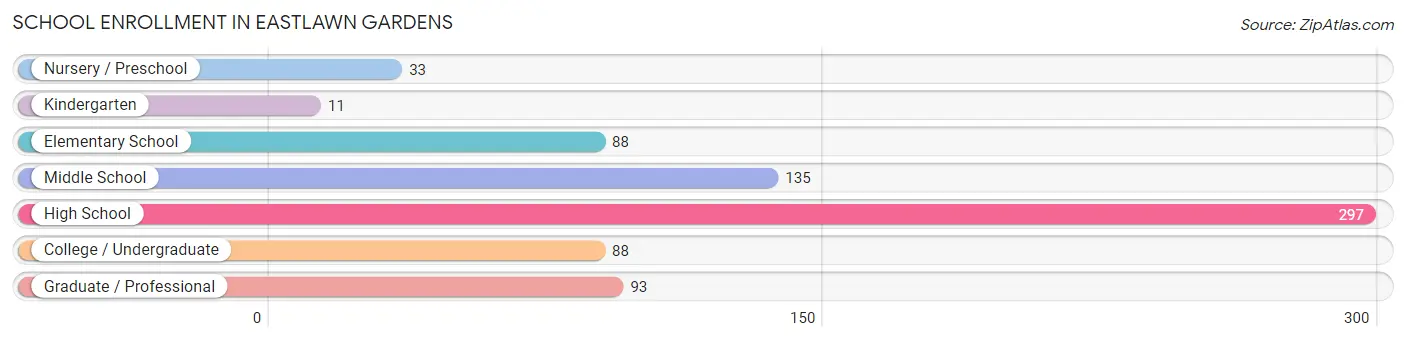
School Enrollment in Eastlawn Gardens
The most common levels of schooling among the 745 students in Eastlawn Gardens are high school (297 | 39.9%), middle school (135 | 18.1%), and graduate / professional (93 | 12.5%).
| School Level | # Students | % Students |
| Nursery / Preschool | 33 | 4.4% |
| Kindergarten | 11 | 1.5% |
| Elementary School | 88 | 11.8% |
| Middle School | 135 | 18.1% |
| High School | 297 | 39.9% |
| College / Undergraduate | 88 | 11.8% |
| Graduate / Professional | 93 | 12.5% |
| Total | 745 | 100.0% |
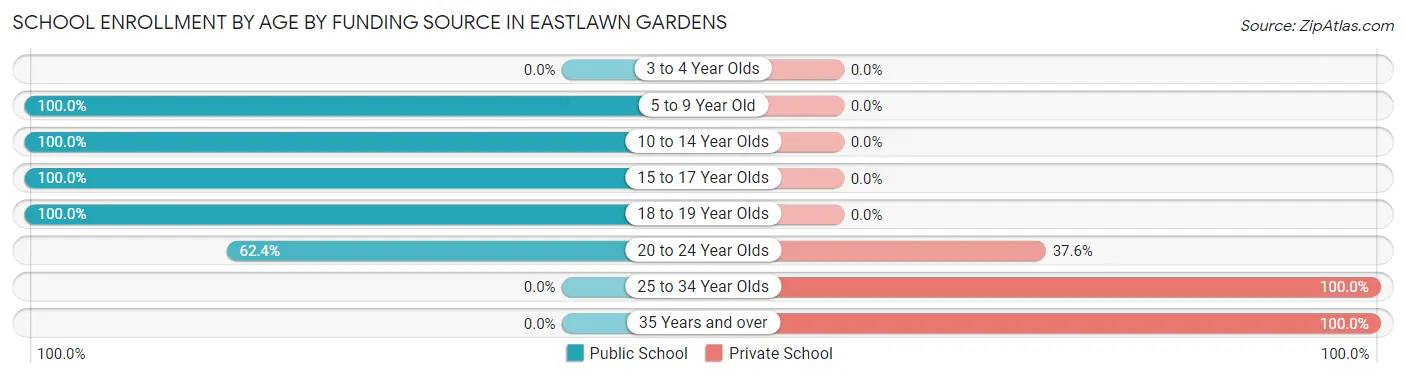
School Enrollment by Age by Funding Source in Eastlawn Gardens
Out of a total of 745 students who are enrolled in schools in Eastlawn Gardens, 107 (14.4%) attend a private institution, while the remaining 638 (85.6%) are enrolled in public schools. The age group of 25 to 34 year olds has the highest likelihood of being enrolled in private schools, with 54 (100.0% in the age bracket) enrolled. Conversely, the age group of 5 to 9 year old has the lowest likelihood of being enrolled in a private school, with 132 (100.0% in the age bracket) attending a public institution.
| Age Bracket | Public School | Private School |
| 3 to 4 Year Olds | 0 (0.0%) | 0 (0.0%) |
| 5 to 9 Year Old | 132 (100.0%) | 0 (0.0%) |
| 10 to 14 Year Olds | 167 (100.0%) | 0 (0.0%) |
| 15 to 17 Year Olds | 244 (100.0%) | 0 (0.0%) |
| 18 to 19 Year Olds | 37 (100.0%) | 0 (0.0%) |
| 20 to 24 Year Olds | 58 (62.4%) | 35 (37.6%) |
| 25 to 34 Year Olds | 0 (0.0%) | 54 (100.0%) |
| 35 Years and over | 0 (0.0%) | 18 (100.0%) |
| Total | 638 (85.6%) | 107 (14.4%) |
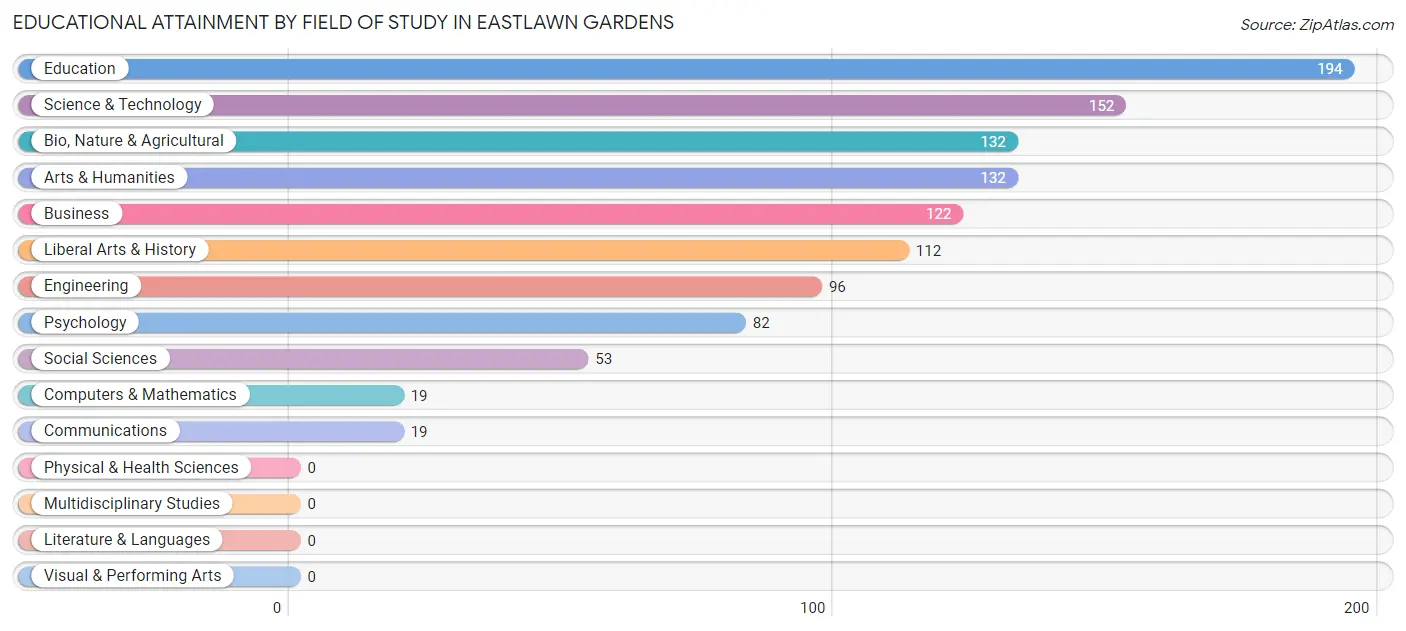
Educational Attainment by Field of Study in Eastlawn Gardens
Education (194 | 17.4%), science & technology (152 | 13.7%), bio, nature & agricultural (132 | 11.9%), arts & humanities (132 | 11.9%), and business (122 | 11.0%) are the most common fields of study among 1,113 individuals in Eastlawn Gardens who have obtained a bachelor's degree or higher.
| Field of Study | # Graduates | % Graduates |
| Computers & Mathematics | 19 | 1.7% |
| Bio, Nature & Agricultural | 132 | 11.9% |
| Physical & Health Sciences | 0 | 0.0% |
| Psychology | 82 | 7.4% |
| Social Sciences | 53 | 4.8% |
| Engineering | 96 | 8.6% |
| Multidisciplinary Studies | 0 | 0.0% |
| Science & Technology | 152 | 13.7% |
| Business | 122 | 11.0% |
| Education | 194 | 17.4% |
| Literature & Languages | 0 | 0.0% |
| Liberal Arts & History | 112 | 10.1% |
| Visual & Performing Arts | 0 | 0.0% |
| Communications | 19 | 1.7% |
| Arts & Humanities | 132 | 11.9% |
| Total | 1,113 | 100.0% |
Transportation & Commute in Eastlawn Gardens
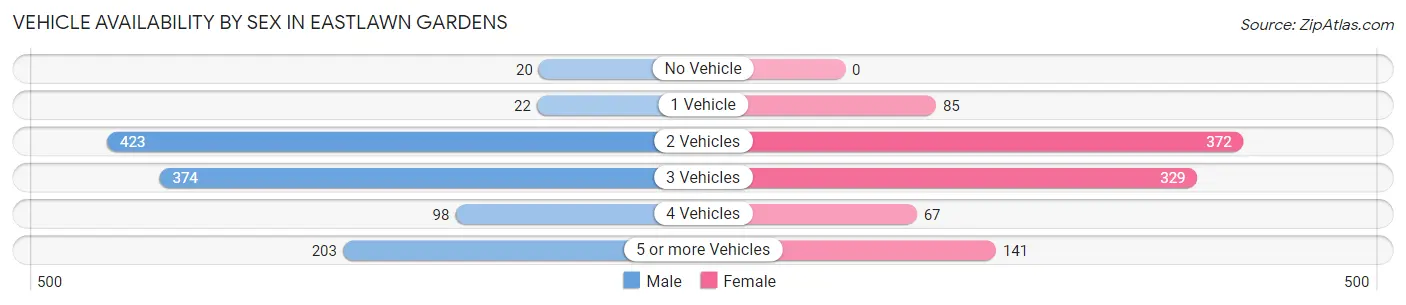
Vehicle Availability by Sex in Eastlawn Gardens
The most prevalent vehicle ownership categories in Eastlawn Gardens are males with 2 vehicles (423, accounting for 37.1%) and females with 2 vehicles (372, making up 42.6%).
| Vehicles Available | Male | Female |
| No Vehicle | 20 (1.8%) | 0 (0.0%) |
| 1 Vehicle | 22 (1.9%) | 85 (8.6%) |
| 2 Vehicles | 423 (37.1%) | 372 (37.4%) |
| 3 Vehicles | 374 (32.8%) | 329 (33.1%) |
| 4 Vehicles | 98 (8.6%) | 67 (6.7%) |
| 5 or more Vehicles | 203 (17.8%) | 141 (14.2%) |
| Total | 1,140 (100.0%) | 994 (100.0%) |
Commute Time in Eastlawn Gardens
The most frequently occuring commute durations in Eastlawn Gardens are 10 to 14 minutes (373 commuters, 18.2%), 30 to 34 minutes (300 commuters, 14.6%), and 15 to 19 minutes (294 commuters, 14.3%).
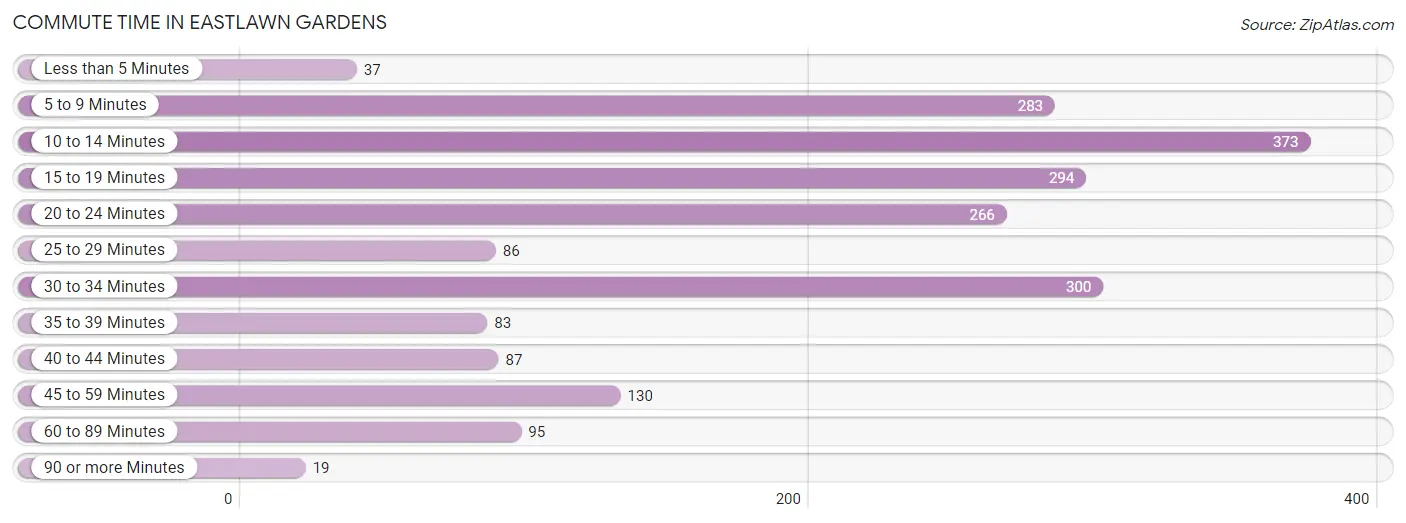
| Commute Time | # Commuters | % Commuters |
| Less than 5 Minutes | 37 | 1.8% |
| 5 to 9 Minutes | 283 | 13.8% |
| 10 to 14 Minutes | 373 | 18.2% |
| 15 to 19 Minutes | 294 | 14.3% |
| 20 to 24 Minutes | 266 | 13.0% |
| 25 to 29 Minutes | 86 | 4.2% |
| 30 to 34 Minutes | 300 | 14.6% |
| 35 to 39 Minutes | 83 | 4.0% |
| 40 to 44 Minutes | 87 | 4.2% |
| 45 to 59 Minutes | 130 | 6.3% |
| 60 to 89 Minutes | 95 | 4.6% |
| 90 or more Minutes | 19 | 0.9% |
Commute Time by Sex in Eastlawn Gardens
The most common commute times in Eastlawn Gardens are 10 to 14 minutes (232 commuters, 20.3%) for males and 15 to 19 minutes (200 commuters, 21.9%) for females.
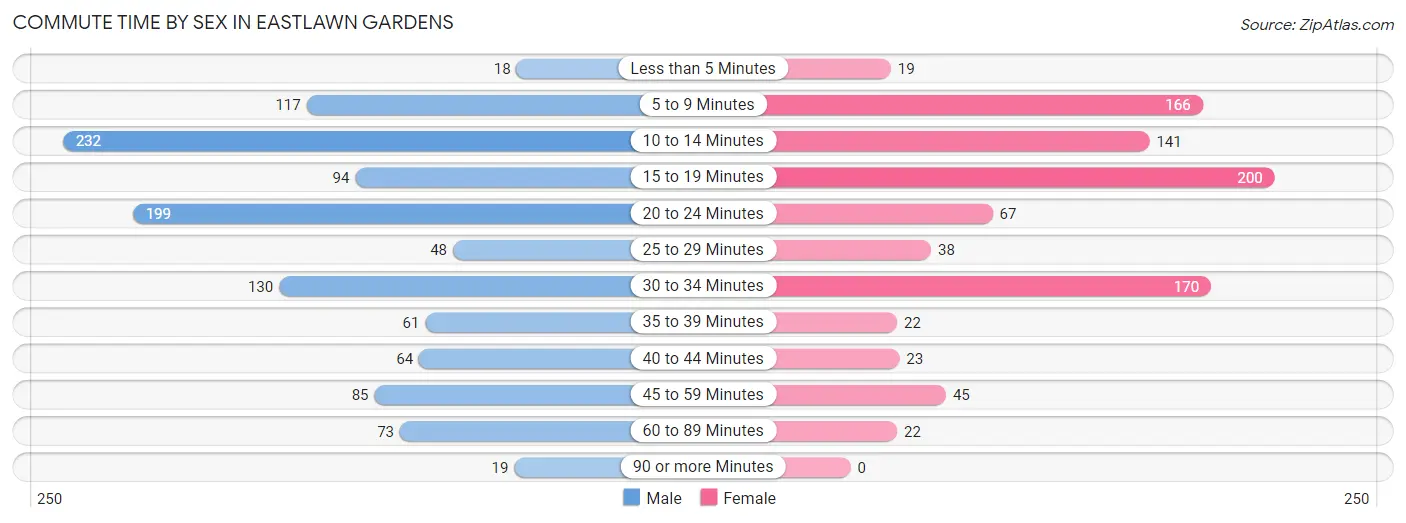
| Commute Time | Male | Female |
| Less than 5 Minutes | 18 (1.6%) | 19 (2.1%) |
| 5 to 9 Minutes | 117 (10.3%) | 166 (18.2%) |
| 10 to 14 Minutes | 232 (20.3%) | 141 (15.4%) |
| 15 to 19 Minutes | 94 (8.3%) | 200 (21.9%) |
| 20 to 24 Minutes | 199 (17.5%) | 67 (7.3%) |
| 25 to 29 Minutes | 48 (4.2%) | 38 (4.2%) |
| 30 to 34 Minutes | 130 (11.4%) | 170 (18.6%) |
| 35 to 39 Minutes | 61 (5.3%) | 22 (2.4%) |
| 40 to 44 Minutes | 64 (5.6%) | 23 (2.5%) |
| 45 to 59 Minutes | 85 (7.5%) | 45 (4.9%) |
| 60 to 89 Minutes | 73 (6.4%) | 22 (2.4%) |
| 90 or more Minutes | 19 (1.7%) | 0 (0.0%) |
Time of Departure to Work by Sex in Eastlawn Gardens
The most frequent times of departure to work in Eastlawn Gardens are 7:30 AM to 7:59 AM (168, 14.7%) for males and 7:00 AM to 7:29 AM (287, 31.4%) for females.
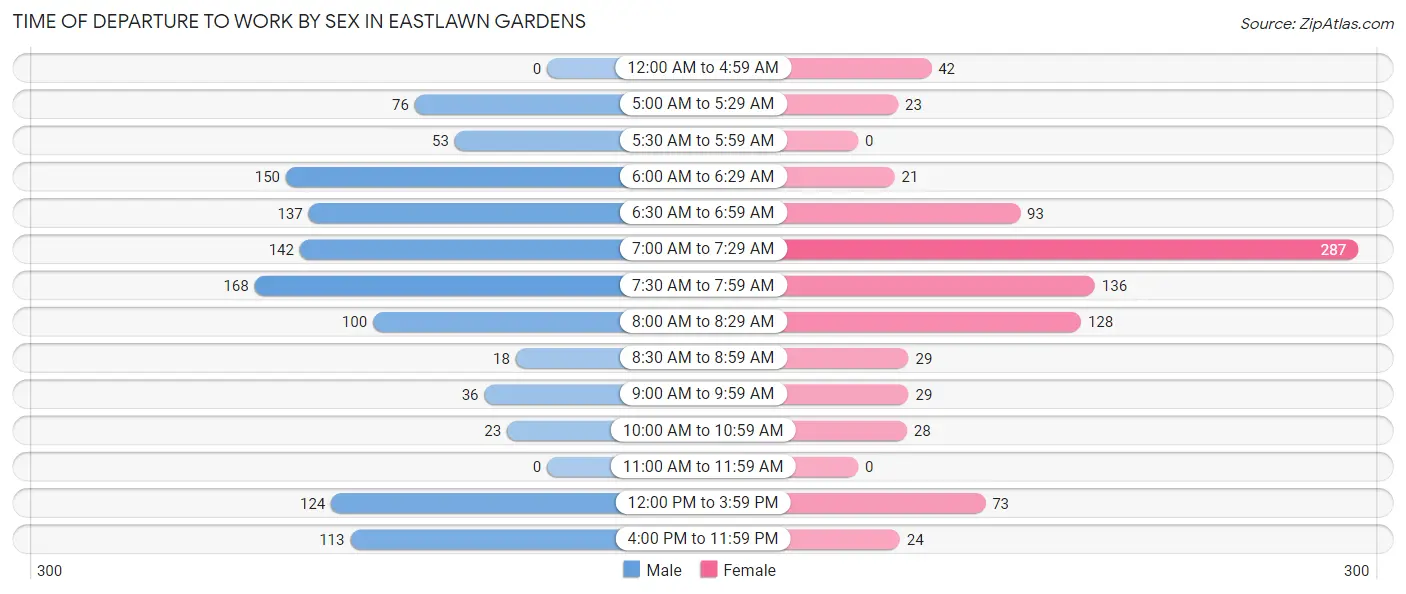
| Time of Departure | Male | Female |
| 12:00 AM to 4:59 AM | 0 (0.0%) | 42 (4.6%) |
| 5:00 AM to 5:29 AM | 76 (6.7%) | 23 (2.5%) |
| 5:30 AM to 5:59 AM | 53 (4.6%) | 0 (0.0%) |
| 6:00 AM to 6:29 AM | 150 (13.2%) | 21 (2.3%) |
| 6:30 AM to 6:59 AM | 137 (12.0%) | 93 (10.2%) |
| 7:00 AM to 7:29 AM | 142 (12.5%) | 287 (31.4%) |
| 7:30 AM to 7:59 AM | 168 (14.7%) | 136 (14.9%) |
| 8:00 AM to 8:29 AM | 100 (8.8%) | 128 (14.0%) |
| 8:30 AM to 8:59 AM | 18 (1.6%) | 29 (3.2%) |
| 9:00 AM to 9:59 AM | 36 (3.2%) | 29 (3.2%) |
| 10:00 AM to 10:59 AM | 23 (2.0%) | 28 (3.1%) |
| 11:00 AM to 11:59 AM | 0 (0.0%) | 0 (0.0%) |
| 12:00 PM to 3:59 PM | 124 (10.9%) | 73 (8.0%) |
| 4:00 PM to 11:59 PM | 113 (9.9%) | 24 (2.6%) |
| Total | 1,140 (100.0%) | 913 (100.0%) |
Housing Occupancy in Eastlawn Gardens
Occupancy by Ownership in Eastlawn Gardens
Of the total 1,375 dwellings in Eastlawn Gardens, owner-occupied units account for 1,278 (92.9%), while renter-occupied units make up 97 (7.0%).
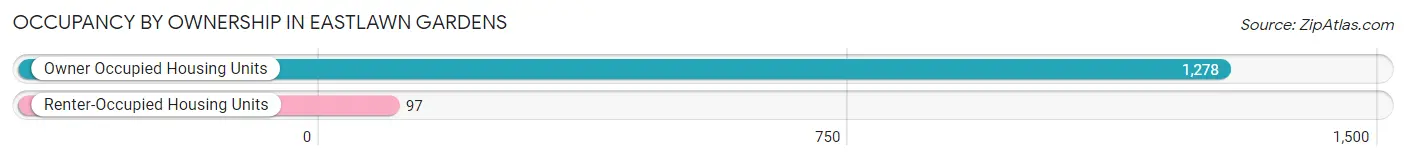
| Occupancy | # Housing Units | % Housing Units |
| Owner Occupied Housing Units | 1,278 | 92.9% |
| Renter-Occupied Housing Units | 97 | 7.0% |
| Total Occupied Housing Units | 1,375 | 100.0% |
Occupancy by Household Size in Eastlawn Gardens
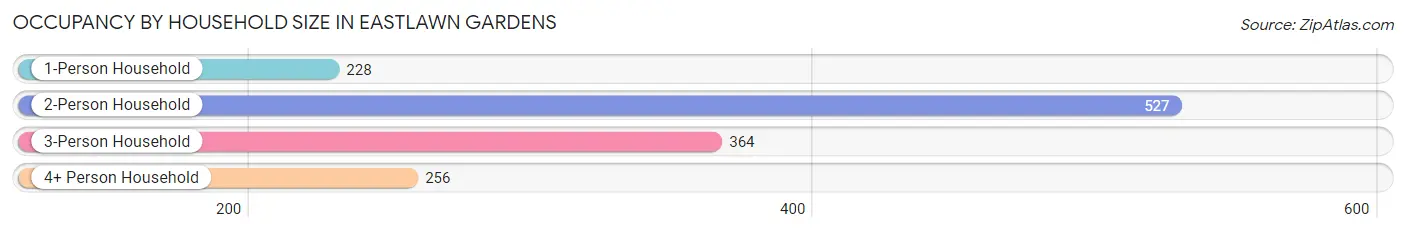
| Household Size | # Housing Units | % Housing Units |
| 1-Person Household | 228 | 16.6% |
| 2-Person Household | 527 | 38.3% |
| 3-Person Household | 364 | 26.5% |
| 4+ Person Household | 256 | 18.6% |
| Total Housing Units | 1,375 | 100.0% |
Occupancy by Ownership by Household Size in Eastlawn Gardens
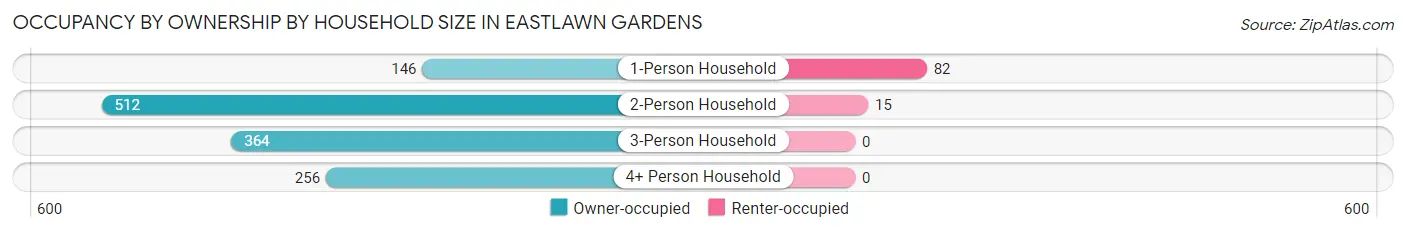
| Household Size | Owner-occupied | Renter-occupied |
| 1-Person Household | 146 (64.0%) | 82 (36.0%) |
| 2-Person Household | 512 (97.2%) | 15 (2.9%) |
| 3-Person Household | 364 (100.0%) | 0 (0.0%) |
| 4+ Person Household | 256 (100.0%) | 0 (0.0%) |
| Total Housing Units | 1,278 (92.9%) | 97 (7.0%) |
Occupancy by Educational Attainment in Eastlawn Gardens
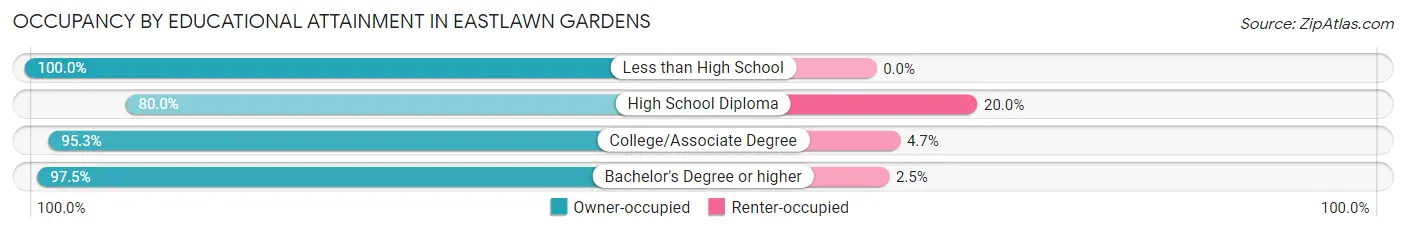
| Household Size | Owner-occupied | Renter-occupied |
| Less than High School | 17 (100.0%) | 0 (0.0%) |
| High School Diploma | 240 (80.0%) | 60 (20.0%) |
| College/Associate Degree | 445 (95.3%) | 22 (4.7%) |
| Bachelor's Degree or higher | 576 (97.5%) | 15 (2.5%) |
Occupancy by Age of Householder in Eastlawn Gardens
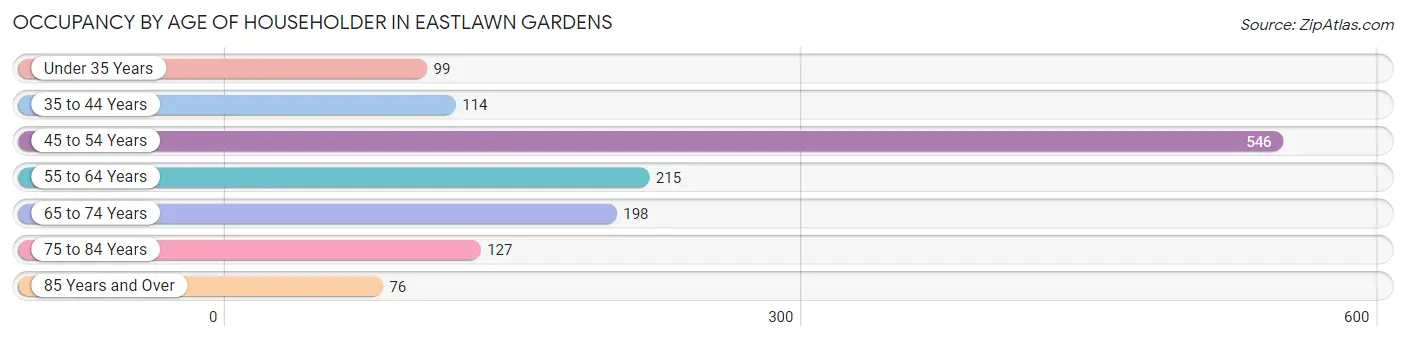
| Age Bracket | # Households | % Households |
| Under 35 Years | 99 | 7.2% |
| 35 to 44 Years | 114 | 8.3% |
| 45 to 54 Years | 546 | 39.7% |
| 55 to 64 Years | 215 | 15.6% |
| 65 to 74 Years | 198 | 14.4% |
| 75 to 84 Years | 127 | 9.2% |
| 85 Years and Over | 76 | 5.5% |
| Total | 1,375 | 100.0% |
Housing Finances in Eastlawn Gardens
Median Income by Occupancy in Eastlawn Gardens
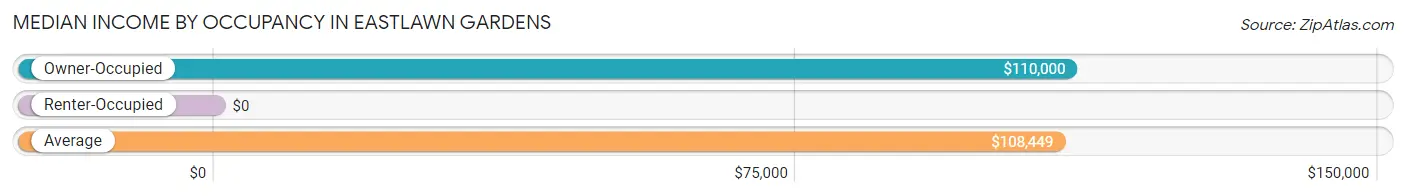
| Occupancy Type | # Households | Median Income |
| Owner-Occupied | 1,278 (92.9%) | $110,000 |
| Renter-Occupied | 97 (7.0%) | $0 |
| Average | 1,375 (100.0%) | $108,449 |
Occupancy by Householder Income Bracket in Eastlawn Gardens
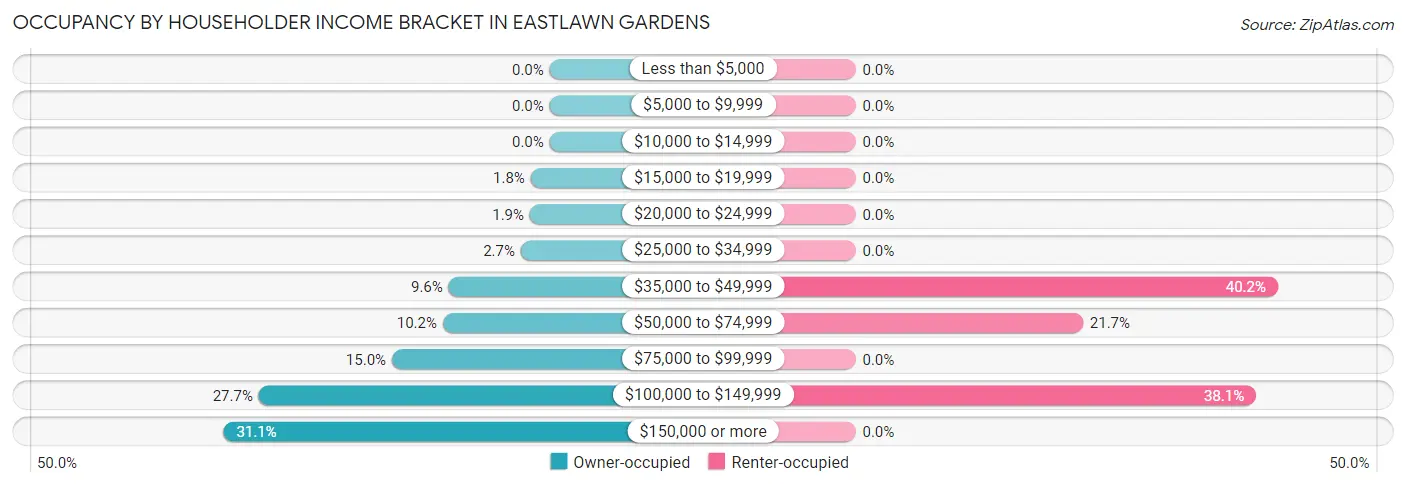
| Income Bracket | Owner-occupied | Renter-occupied |
| Less than $5,000 | 0 (0.0%) | 0 (0.0%) |
| $5,000 to $9,999 | 0 (0.0%) | 0 (0.0%) |
| $10,000 to $14,999 | 0 (0.0%) | 0 (0.0%) |
| $15,000 to $19,999 | 23 (1.8%) | 0 (0.0%) |
| $20,000 to $24,999 | 24 (1.9%) | 0 (0.0%) |
| $25,000 to $34,999 | 35 (2.7%) | 0 (0.0%) |
| $35,000 to $49,999 | 123 (9.6%) | 39 (40.2%) |
| $50,000 to $74,999 | 130 (10.2%) | 21 (21.6%) |
| $75,000 to $99,999 | 192 (15.0%) | 0 (0.0%) |
| $100,000 to $149,999 | 354 (27.7%) | 37 (38.1%) |
| $150,000 or more | 397 (31.1%) | 0 (0.0%) |
| Total | 1,278 (100.0%) | 97 (100.0%) |
Monthly Housing Cost Tiers in Eastlawn Gardens
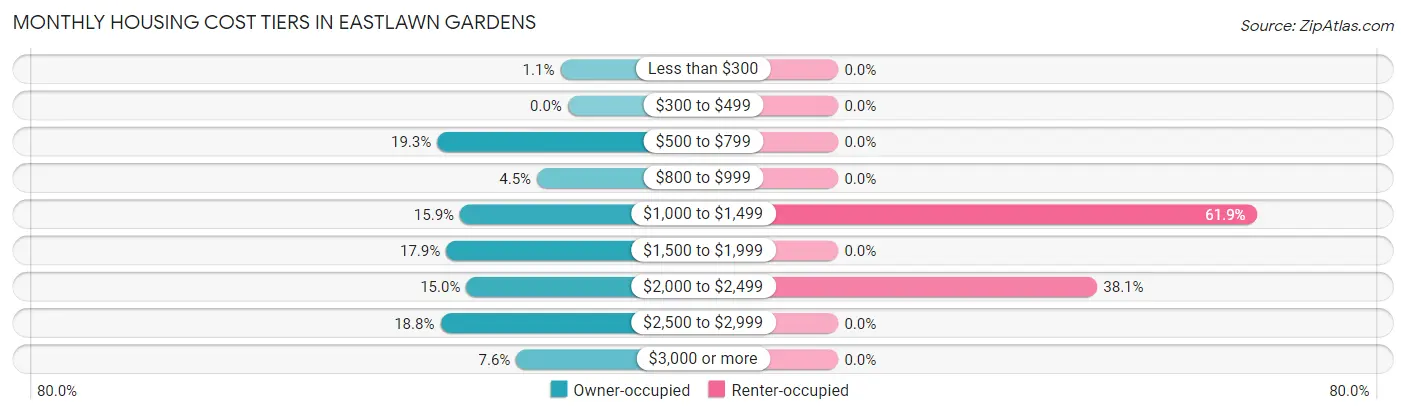
| Monthly Cost | Owner-occupied | Renter-occupied |
| Less than $300 | 14 (1.1%) | 0 (0.0%) |
| $300 to $499 | 0 (0.0%) | 0 (0.0%) |
| $500 to $799 | 246 (19.3%) | 0 (0.0%) |
| $800 to $999 | 58 (4.5%) | 0 (0.0%) |
| $1,000 to $1,499 | 203 (15.9%) | 60 (61.9%) |
| $1,500 to $1,999 | 229 (17.9%) | 0 (0.0%) |
| $2,000 to $2,499 | 191 (14.9%) | 37 (38.1%) |
| $2,500 to $2,999 | 240 (18.8%) | 0 (0.0%) |
| $3,000 or more | 97 (7.6%) | 0 (0.0%) |
| Total | 1,278 (100.0%) | 97 (100.0%) |
Physical Housing Characteristics in Eastlawn Gardens
Housing Structures in Eastlawn Gardens
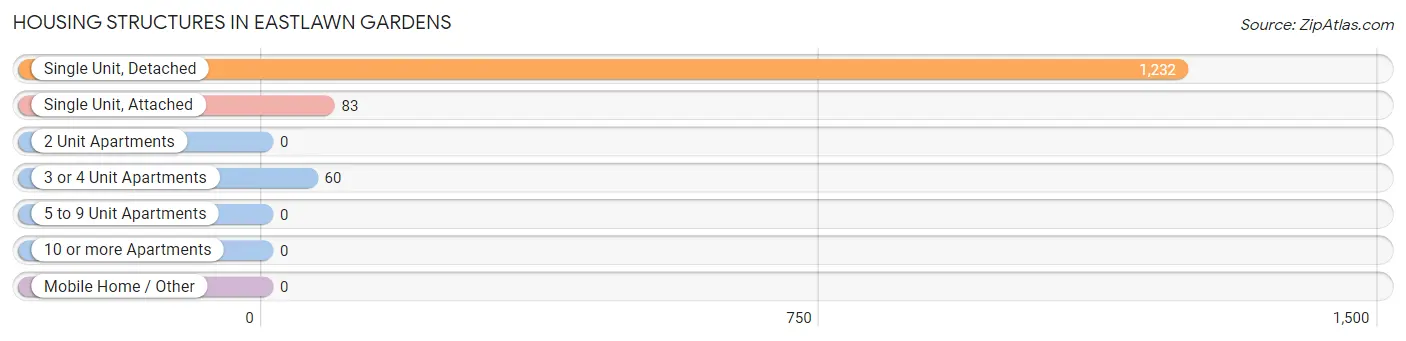
| Structure Type | # Housing Units | % Housing Units |
| Single Unit, Detached | 1,232 | 89.6% |
| Single Unit, Attached | 83 | 6.0% |
| 2 Unit Apartments | 0 | 0.0% |
| 3 or 4 Unit Apartments | 60 | 4.4% |
| 5 to 9 Unit Apartments | 0 | 0.0% |
| 10 or more Apartments | 0 | 0.0% |
| Mobile Home / Other | 0 | 0.0% |
| Total | 1,375 | 100.0% |
Housing Structures by Occupancy in Eastlawn Gardens
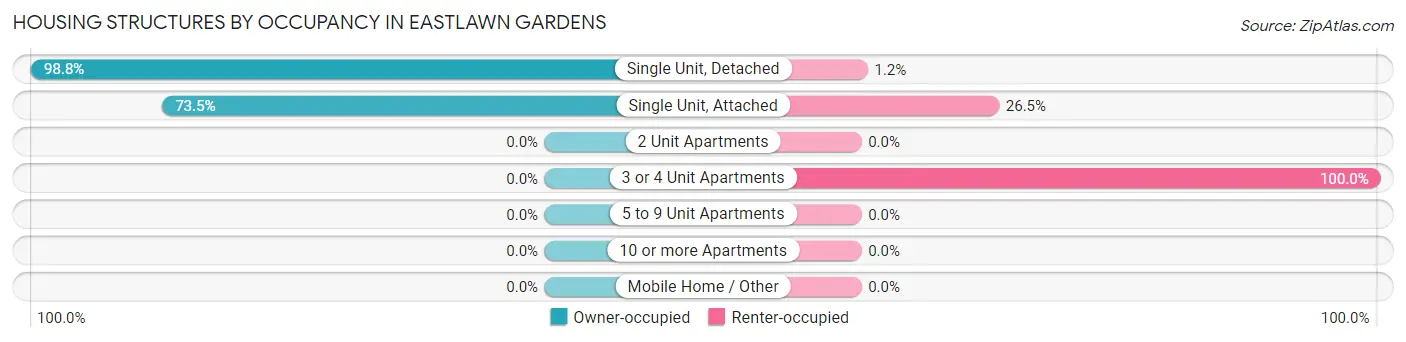
| Structure Type | Owner-occupied | Renter-occupied |
| Single Unit, Detached | 1,217 (98.8%) | 15 (1.2%) |
| Single Unit, Attached | 61 (73.5%) | 22 (26.5%) |
| 2 Unit Apartments | 0 (0.0%) | 0 (0.0%) |
| 3 or 4 Unit Apartments | 0 (0.0%) | 60 (100.0%) |
| 5 to 9 Unit Apartments | 0 (0.0%) | 0 (0.0%) |
| 10 or more Apartments | 0 (0.0%) | 0 (0.0%) |
| Mobile Home / Other | 0 (0.0%) | 0 (0.0%) |
| Total | 1,278 (92.9%) | 97 (7.0%) |
Housing Structures by Number of Rooms in Eastlawn Gardens
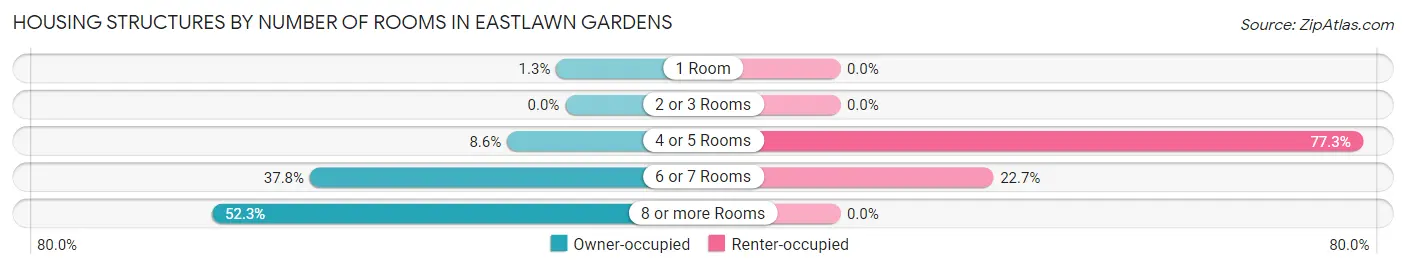
| Number of Rooms | Owner-occupied | Renter-occupied |
| 1 Room | 17 (1.3%) | 0 (0.0%) |
| 2 or 3 Rooms | 0 (0.0%) | 0 (0.0%) |
| 4 or 5 Rooms | 110 (8.6%) | 75 (77.3%) |
| 6 or 7 Rooms | 483 (37.8%) | 22 (22.7%) |
| 8 or more Rooms | 668 (52.3%) | 0 (0.0%) |
| Total | 1,278 (100.0%) | 97 (100.0%) |
Housing Structure by Heating Type in Eastlawn Gardens
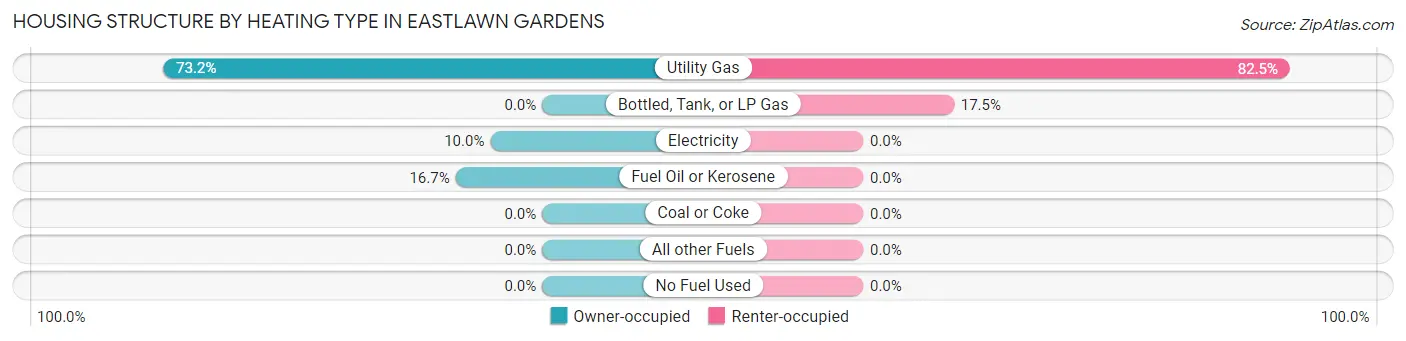
| Heating Type | Owner-occupied | Renter-occupied |
| Utility Gas | 936 (73.2%) | 80 (82.5%) |
| Bottled, Tank, or LP Gas | 0 (0.0%) | 17 (17.5%) |
| Electricity | 128 (10.0%) | 0 (0.0%) |
| Fuel Oil or Kerosene | 214 (16.7%) | 0 (0.0%) |
| Coal or Coke | 0 (0.0%) | 0 (0.0%) |
| All other Fuels | 0 (0.0%) | 0 (0.0%) |
| No Fuel Used | 0 (0.0%) | 0 (0.0%) |
| Total | 1,278 (100.0%) | 97 (100.0%) |
Household Vehicle Usage in Eastlawn Gardens
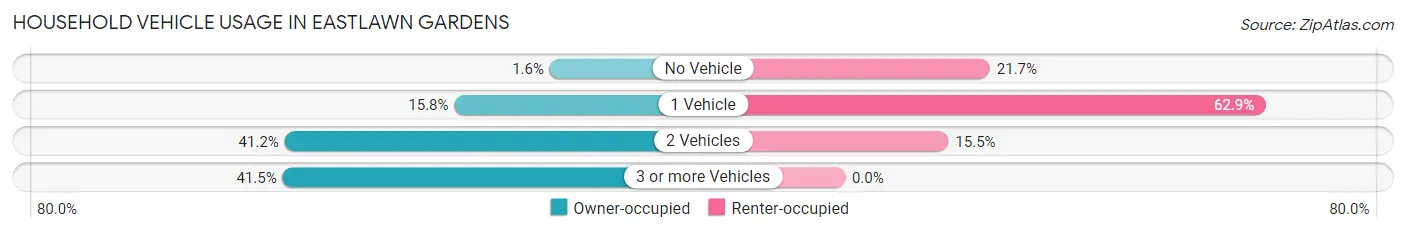
| Vehicles per Household | Owner-occupied | Renter-occupied |
| No Vehicle | 20 (1.6%) | 21 (21.6%) |
| 1 Vehicle | 202 (15.8%) | 61 (62.9%) |
| 2 Vehicles | 526 (41.2%) | 15 (15.5%) |
| 3 or more Vehicles | 530 (41.5%) | 0 (0.0%) |
| Total | 1,278 (100.0%) | 97 (100.0%) |
Real Estate & Mortgages in Eastlawn Gardens
Real Estate and Mortgage Overview in Eastlawn Gardens
| Characteristic | Without Mortgage | With Mortgage |
| Housing Units | 299 | 979 |
| Median Property Value | $239,700 | $336,800 |
| Median Household Income | $87,882 | $376 |
| Monthly Housing Costs | $683 | $97 |
| Real Estate Taxes | $3,873 | $0 |
Property Value by Mortgage Status in Eastlawn Gardens
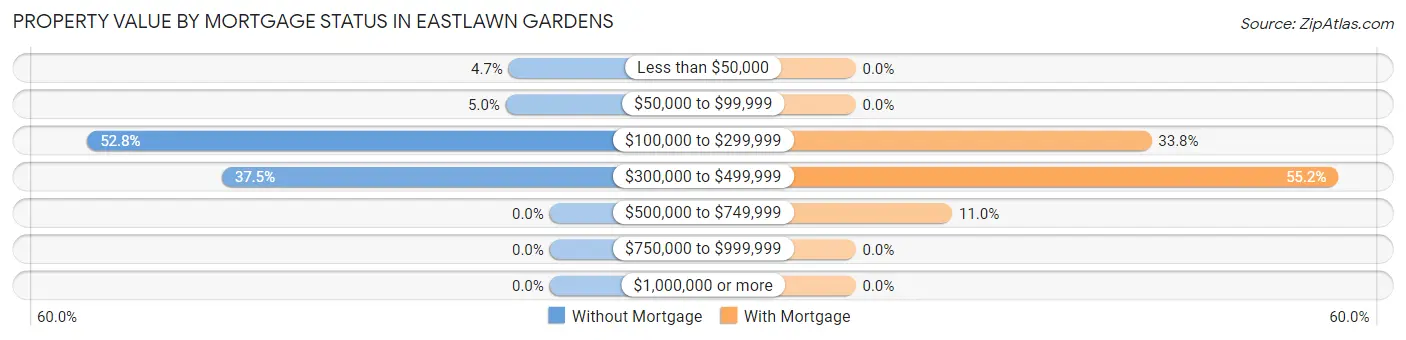
| Property Value | Without Mortgage | With Mortgage |
| Less than $50,000 | 14 (4.7%) | 0 (0.0%) |
| $50,000 to $99,999 | 15 (5.0%) | 0 (0.0%) |
| $100,000 to $299,999 | 158 (52.8%) | 331 (33.8%) |
| $300,000 to $499,999 | 112 (37.5%) | 540 (55.2%) |
| $500,000 to $749,999 | 0 (0.0%) | 108 (11.0%) |
| $750,000 to $999,999 | 0 (0.0%) | 0 (0.0%) |
| $1,000,000 or more | 0 (0.0%) | 0 (0.0%) |
| Total | 299 (100.0%) | 979 (100.0%) |
Household Income by Mortgage Status in Eastlawn Gardens
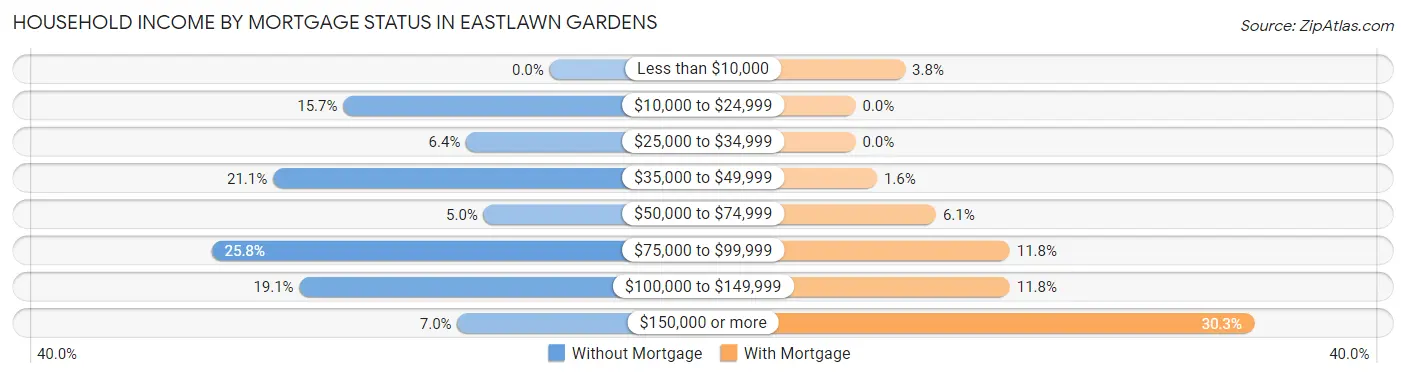
| Household Income | Without Mortgage | With Mortgage |
| Less than $10,000 | 0 (0.0%) | 37 (3.8%) |
| $10,000 to $24,999 | 47 (15.7%) | 0 (0.0%) |
| $25,000 to $34,999 | 19 (6.4%) | 0 (0.0%) |
| $35,000 to $49,999 | 63 (21.1%) | 16 (1.6%) |
| $50,000 to $74,999 | 15 (5.0%) | 60 (6.1%) |
| $75,000 to $99,999 | 77 (25.8%) | 115 (11.7%) |
| $100,000 to $149,999 | 57 (19.1%) | 115 (11.7%) |
| $150,000 or more | 21 (7.0%) | 297 (30.3%) |
| Total | 299 (100.0%) | 979 (100.0%) |
Property Value to Household Income Ratio in Eastlawn Gardens
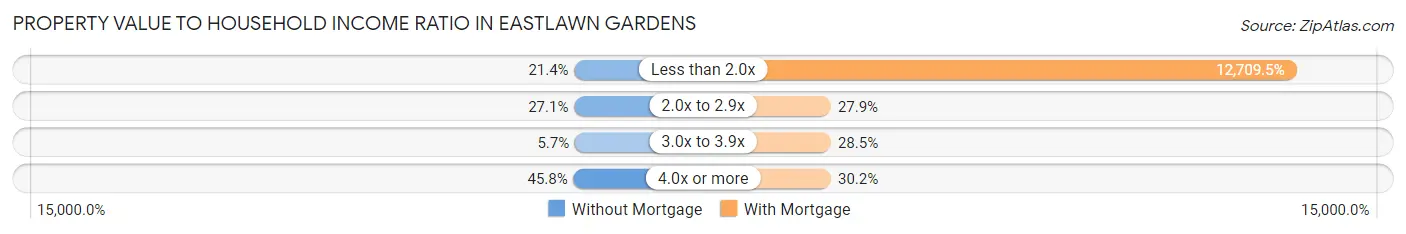
| Value-to-Income Ratio | Without Mortgage | With Mortgage |
| Less than 2.0x | 64 (21.4%) | 124,426 (12,709.5%) |
| 2.0x to 2.9x | 81 (27.1%) | 273 (27.9%) |
| 3.0x to 3.9x | 17 (5.7%) | 279 (28.5%) |
| 4.0x or more | 137 (45.8%) | 296 (30.2%) |
| Total | 299 (100.0%) | 979 (100.0%) |
Real Estate Taxes by Mortgage Status in Eastlawn Gardens
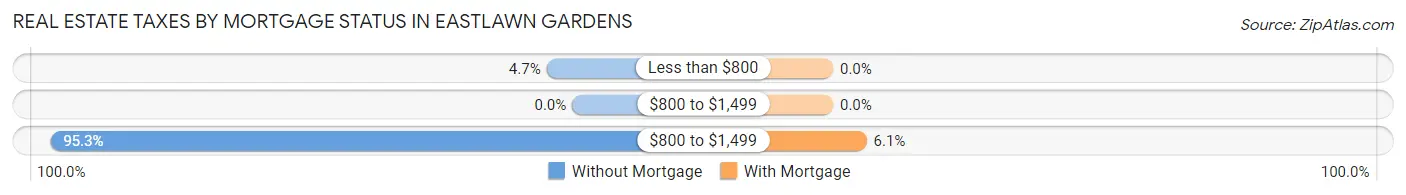
| Property Taxes | Without Mortgage | With Mortgage |
| Less than $800 | 14 (4.7%) | 0 (0.0%) |
| $800 to $1,499 | 0 (0.0%) | 0 (0.0%) |
| $800 to $1,499 | 285 (95.3%) | 60 (6.1%) |
| Total | 299 (100.0%) | 979 (100.0%) |
Health & Disability in Eastlawn Gardens
Health Insurance Coverage by Age in Eastlawn Gardens
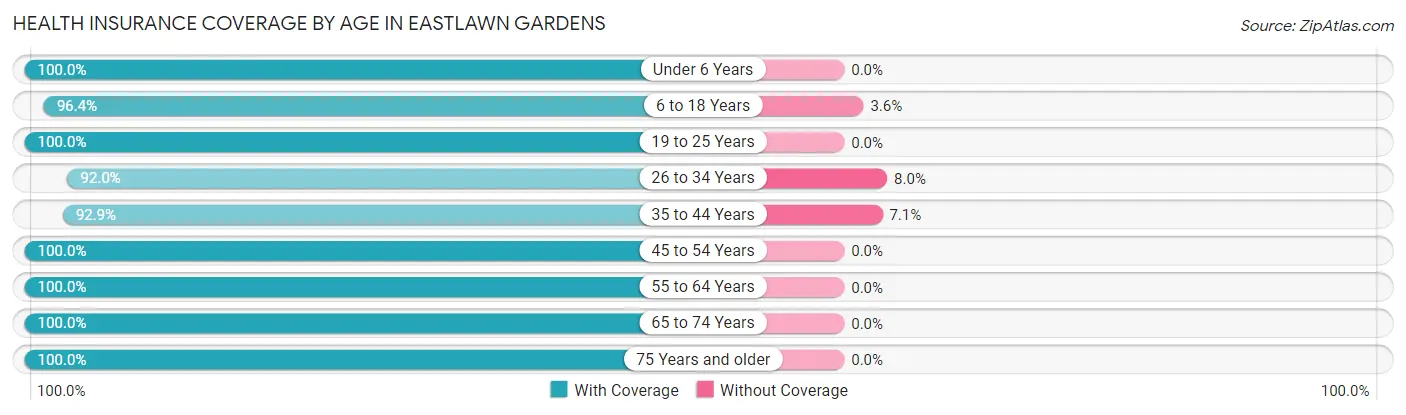
| Age Bracket | With Coverage | Without Coverage |
| Under 6 Years | 79 (100.0%) | 0 (0.0%) |
| 6 to 18 Years | 512 (96.4%) | 19 (3.6%) |
| 19 to 25 Years | 353 (100.0%) | 0 (0.0%) |
| 26 to 34 Years | 265 (92.0%) | 23 (8.0%) |
| 35 to 44 Years | 196 (92.9%) | 15 (7.1%) |
| 45 to 54 Years | 954 (100.0%) | 0 (0.0%) |
| 55 to 64 Years | 515 (100.0%) | 0 (0.0%) |
| 65 to 74 Years | 273 (100.0%) | 0 (0.0%) |
| 75 Years and older | 332 (100.0%) | 0 (0.0%) |
| Total | 3,479 (98.4%) | 57 (1.6%) |
Health Insurance Coverage by Citizenship Status in Eastlawn Gardens
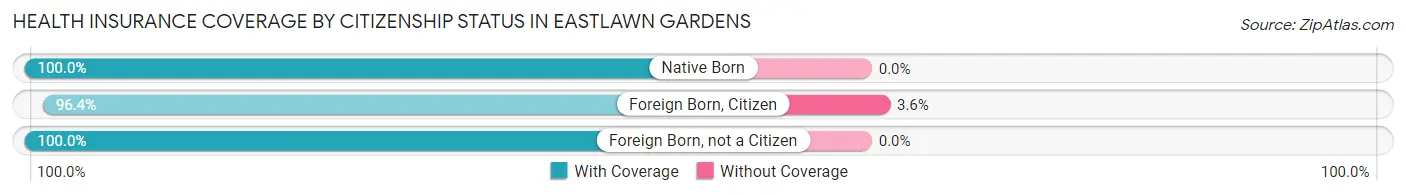
| Citizenship Status | With Coverage | Without Coverage |
| Native Born | 79 (100.0%) | 0 (0.0%) |
| Foreign Born, Citizen | 512 (96.4%) | 19 (3.6%) |
| Foreign Born, not a Citizen | 353 (100.0%) | 0 (0.0%) |
Health Insurance Coverage by Household Income in Eastlawn Gardens
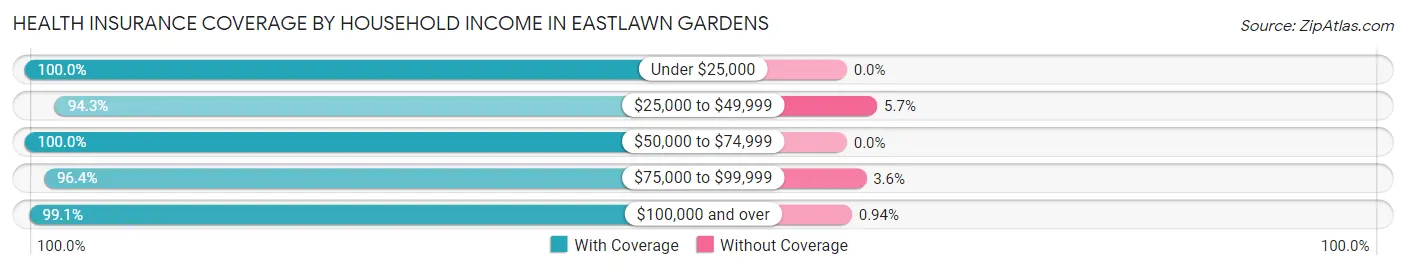
| Household Income | With Coverage | Without Coverage |
| Under $25,000 | 47 (100.0%) | 0 (0.0%) |
| $25,000 to $49,999 | 315 (94.3%) | 19 (5.7%) |
| $50,000 to $74,999 | 291 (100.0%) | 0 (0.0%) |
| $75,000 to $99,999 | 397 (96.4%) | 15 (3.6%) |
| $100,000 and over | 2,429 (99.1%) | 23 (0.9%) |
Public vs Private Health Insurance Coverage by Age in Eastlawn Gardens
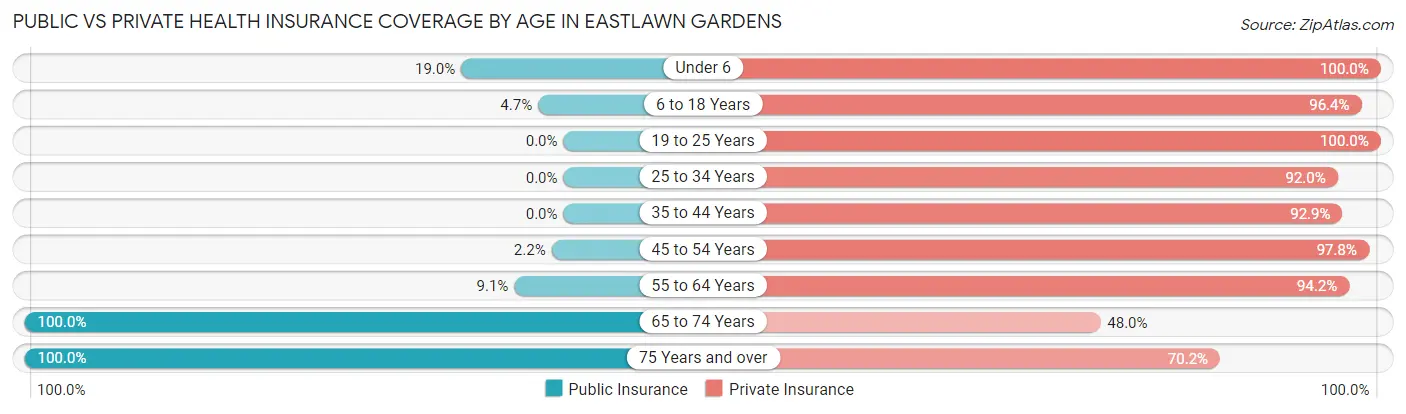
| Age Bracket | Public Insurance | Private Insurance |
| Under 6 | 15 (19.0%) | 79 (100.0%) |
| 6 to 18 Years | 25 (4.7%) | 512 (96.4%) |
| 19 to 25 Years | 0 (0.0%) | 353 (100.0%) |
| 25 to 34 Years | 0 (0.0%) | 265 (92.0%) |
| 35 to 44 Years | 0 (0.0%) | 196 (92.9%) |
| 45 to 54 Years | 21 (2.2%) | 933 (97.8%) |
| 55 to 64 Years | 47 (9.1%) | 485 (94.2%) |
| 65 to 74 Years | 273 (100.0%) | 131 (48.0%) |
| 75 Years and over | 332 (100.0%) | 233 (70.2%) |
| Total | 713 (20.2%) | 3,187 (90.1%) |
Disability Status by Sex by Age in Eastlawn Gardens
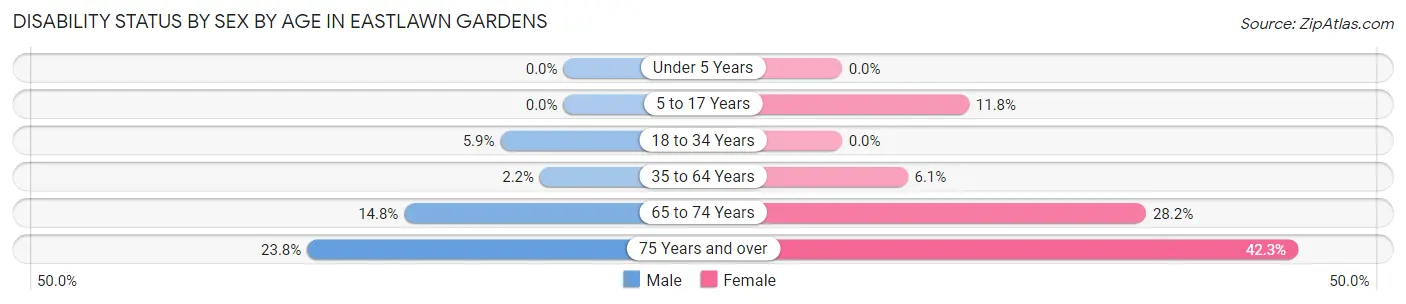
| Age Bracket | Male | Female |
| Under 5 Years | 0 (0.0%) | 0 (0.0%) |
| 5 to 17 Years | 0 (0.0%) | 25 (11.8%) |
| 18 to 34 Years | 24 (5.9%) | 0 (0.0%) |
| 35 to 64 Years | 17 (2.2%) | 55 (6.1%) |
| 65 to 74 Years | 22 (14.8%) | 35 (28.2%) |
| 75 Years and over | 34 (23.8%) | 80 (42.3%) |
Disability Class by Sex by Age in Eastlawn Gardens
Disability Class: Hearing Difficulty
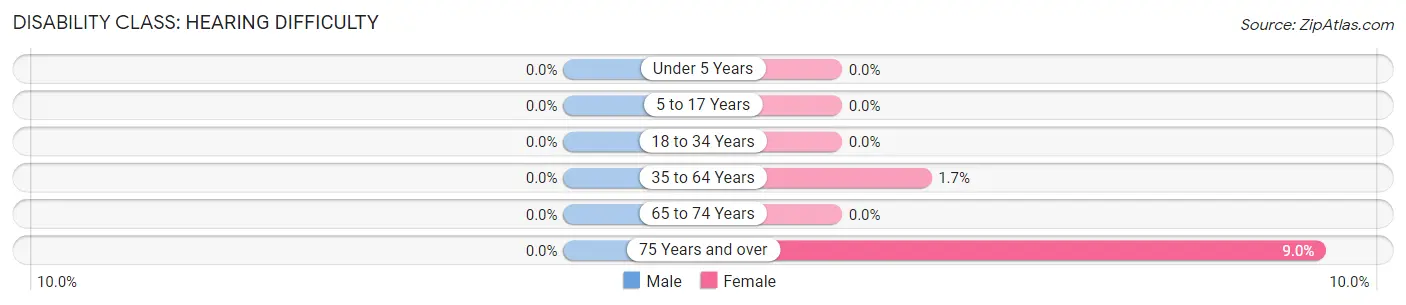
| Age Bracket | Male | Female |
| Under 5 Years | 0 (0.0%) | 0 (0.0%) |
| 5 to 17 Years | 0 (0.0%) | 0 (0.0%) |
| 18 to 34 Years | 0 (0.0%) | 0 (0.0%) |
| 35 to 64 Years | 0 (0.0%) | 15 (1.7%) |
| 65 to 74 Years | 0 (0.0%) | 0 (0.0%) |
| 75 Years and over | 0 (0.0%) | 17 (9.0%) |
Disability Class: Vision Difficulty
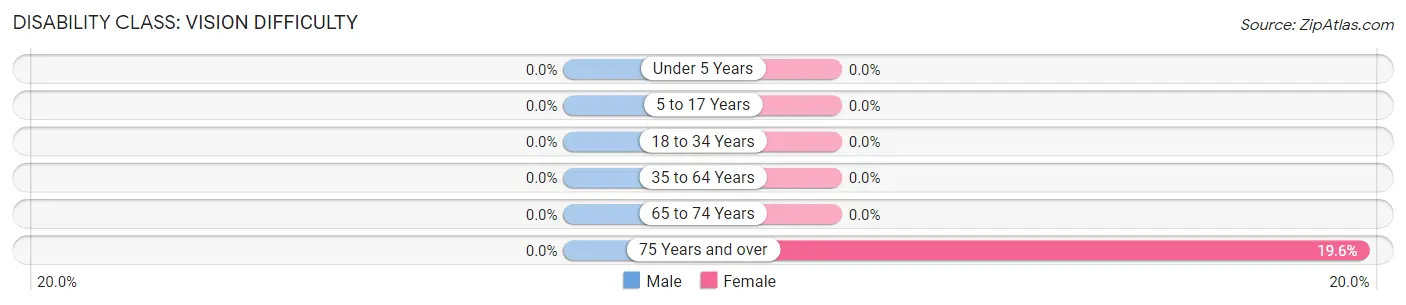
| Age Bracket | Male | Female |
| Under 5 Years | 0 (0.0%) | 0 (0.0%) |
| 5 to 17 Years | 0 (0.0%) | 0 (0.0%) |
| 18 to 34 Years | 0 (0.0%) | 0 (0.0%) |
| 35 to 64 Years | 0 (0.0%) | 0 (0.0%) |
| 65 to 74 Years | 0 (0.0%) | 0 (0.0%) |
| 75 Years and over | 0 (0.0%) | 37 (19.6%) |
Disability Class: Cognitive Difficulty
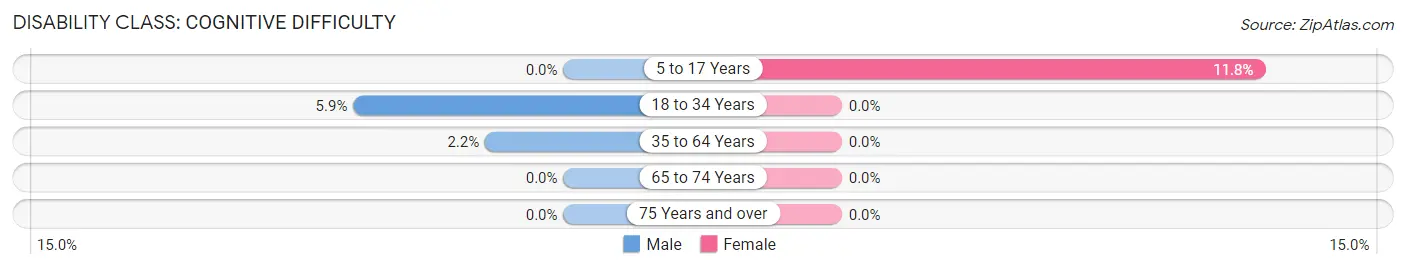
| Age Bracket | Male | Female |
| 5 to 17 Years | 0 (0.0%) | 25 (11.8%) |
| 18 to 34 Years | 24 (5.9%) | 0 (0.0%) |
| 35 to 64 Years | 17 (2.2%) | 0 (0.0%) |
| 65 to 74 Years | 0 (0.0%) | 0 (0.0%) |
| 75 Years and over | 0 (0.0%) | 0 (0.0%) |
Disability Class: Ambulatory Difficulty
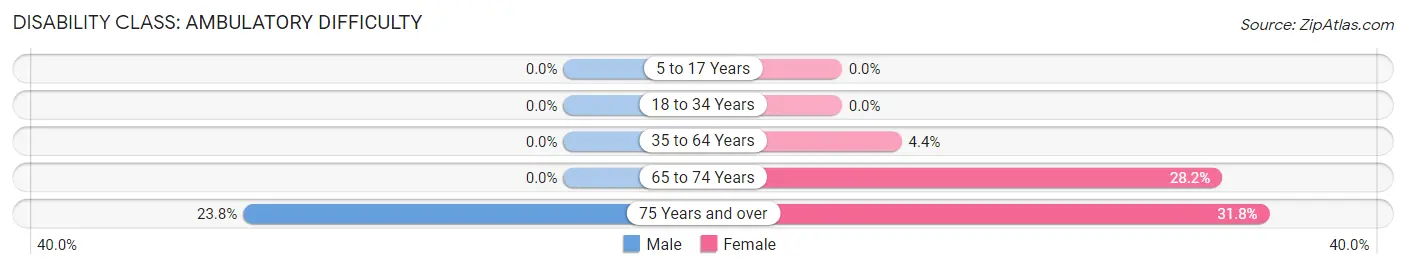
| Age Bracket | Male | Female |
| 5 to 17 Years | 0 (0.0%) | 0 (0.0%) |
| 18 to 34 Years | 0 (0.0%) | 0 (0.0%) |
| 35 to 64 Years | 0 (0.0%) | 40 (4.4%) |
| 65 to 74 Years | 0 (0.0%) | 35 (28.2%) |
| 75 Years and over | 34 (23.8%) | 60 (31.8%) |
Disability Class: Self-Care Difficulty
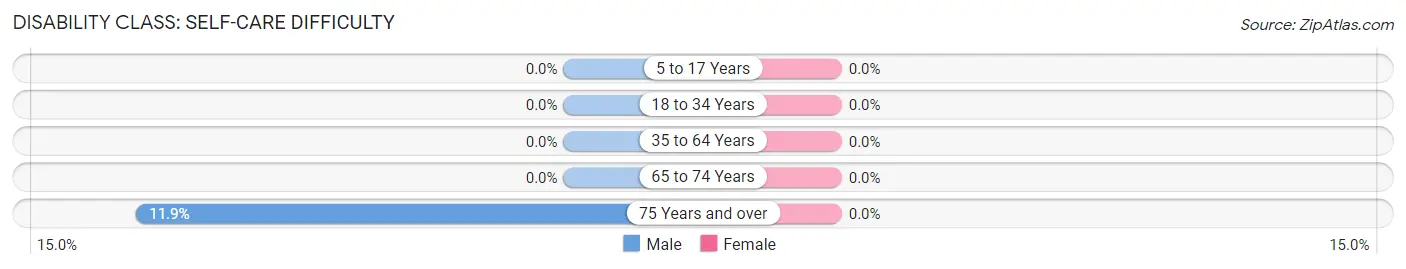
| Age Bracket | Male | Female |
| 5 to 17 Years | 0 (0.0%) | 0 (0.0%) |
| 18 to 34 Years | 0 (0.0%) | 0 (0.0%) |
| 35 to 64 Years | 0 (0.0%) | 0 (0.0%) |
| 65 to 74 Years | 0 (0.0%) | 0 (0.0%) |
| 75 Years and over | 17 (11.9%) | 0 (0.0%) |
Technology Access in Eastlawn Gardens
Computing Device Access in Eastlawn Gardens
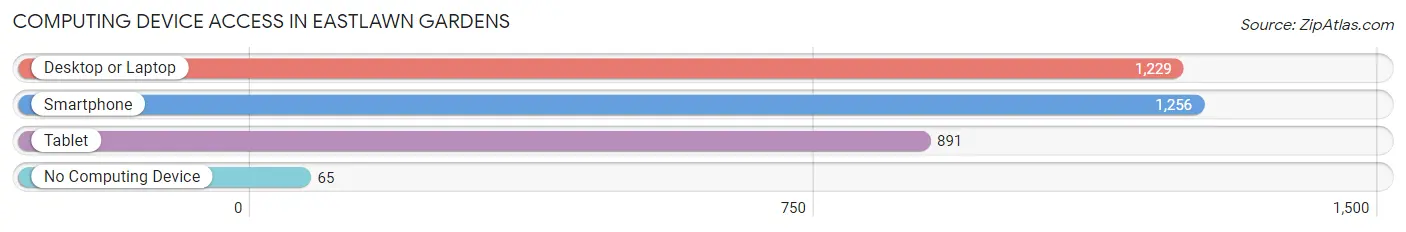
| Device Type | # Households | % Households |
| Desktop or Laptop | 1,229 | 89.4% |
| Smartphone | 1,256 | 91.3% |
| Tablet | 891 | 64.8% |
| No Computing Device | 65 | 4.7% |
| Total | 1,375 | 100.0% |
Internet Access in Eastlawn Gardens
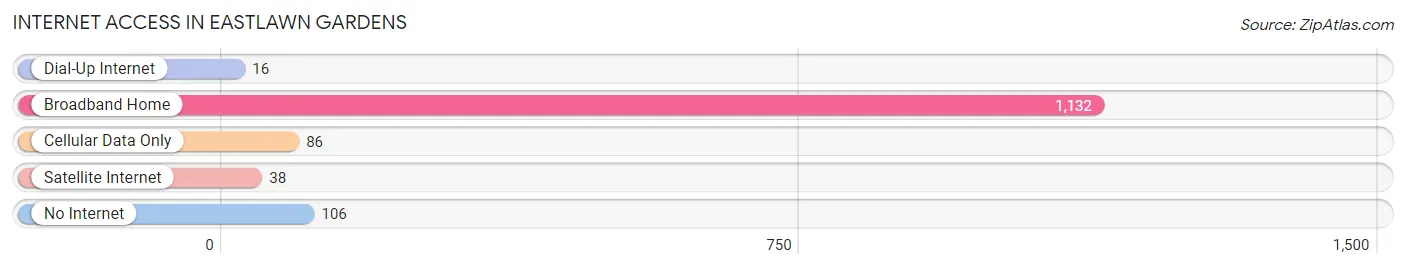
| Internet Type | # Households | % Households |
| Dial-Up Internet | 16 | 1.2% |
| Broadband Home | 1,132 | 82.3% |
| Cellular Data Only | 86 | 6.2% |
| Satellite Internet | 38 | 2.8% |
| No Internet | 106 | 7.7% |
| Total | 1,375 | 100.0% |
Eastlawn Gardens Summary
Eastlawn Gardens is a small borough located in Bucks County, Pennsylvania. It is situated in the northeast corner of the county, just south of the city of Philadelphia. The borough was incorporated in 1891 and has a population of approximately 1,500 people.
History
Eastlawn Gardens was originally part of the township of Bristol, which was established in 1692. The area was first settled by Quakers in the early 1700s. The first recorded deed in the area was in 1717, when William Eastlawn purchased a tract of land from the Penn family. The area was known as Eastlawn’s Plantation until 1891, when it was incorporated as the borough of Eastlawn Gardens.
The borough was named after William Eastlawn, who was a prominent Quaker and a leader in the local community. He was a successful farmer and businessman, and he owned a large tract of land in the area. He was also a leader in the local Quaker community, and he was instrumental in the establishment of the Eastlawn Friends Meeting House, which is still in operation today.
Geography
Eastlawn Gardens is located in the northeast corner of Bucks County, Pennsylvania. It is situated on the Delaware River, just south of the city of Philadelphia. The borough is bordered by the boroughs of Bristol, Croydon, and Levittown, as well as the townships of Middletown and Lower Southampton.
The borough is mostly residential, with some commercial and industrial areas. The main roads in the borough are Bristol Pike, Eastlawn Avenue, and Levittown Parkway. The borough is served by SEPTA bus routes and the Trenton Line of the SEPTA Regional Rail.
Economy
The economy of Eastlawn Gardens is largely based on the service industry. The borough is home to a variety of small businesses, including restaurants, retail stores, and professional services. The borough also has a few industrial businesses, including a printing company and a metal fabrication shop.
The borough is also home to a number of educational institutions, including Bucks County Community College and the Bucks County Technical High School. The borough is also home to a number of parks and recreational facilities, including a public pool, a skate park, and a community center.
Demographics
As of the 2010 census, the population of Eastlawn Gardens was 1,500. The racial makeup of the borough was 94.2% White, 2.7% African American, 0.7% Asian, 0.3% from other races, and 2.1% from two or more races. Hispanic or Latino of any race were 1.3% of the population.
The median income for a household in the borough was $50,000, and the median income for a family was $60,000. The per capita income for the borough was $25,000. About 8.3% of families and 10.3% of the population were below the poverty line, including 14.3% of those under age 18 and 6.7% of those age 65 or over.
Eastlawn Gardens is a small borough with a rich history and a diverse population. The borough is home to a variety of businesses and educational institutions, as well as a number of parks and recreational facilities. The borough has a strong economy and a low poverty rate, making it an attractive place to live and work.
Common Questions
What is Per Capita Income in Eastlawn Gardens?
Per Capita income in Eastlawn Gardens is $51,939.
What is the Median Family Income in Eastlawn Gardens?
Median Family Income in Eastlawn Gardens is $124,899.
What is the Median Household income in Eastlawn Gardens?
Median Household Income in Eastlawn Gardens is $108,449.
What is Income or Wage Gap in Eastlawn Gardens?
Income or Wage Gap in Eastlawn Gardens is 12.1%.
Women in Eastlawn Gardens earn 87.9 cents for every dollar earned by a man.
What is Inequality or Gini Index in Eastlawn Gardens?
Inequality or Gini Index in Eastlawn Gardens is 0.35.
What is the Total Population of Eastlawn Gardens?
Total Population of Eastlawn Gardens is 3,536.
What is the Total Male Population of Eastlawn Gardens?
Total Male Population of Eastlawn Gardens is 1,812.
What is the Total Female Population of Eastlawn Gardens?
Total Female Population of Eastlawn Gardens is 1,724.
What is the Ratio of Males per 100 Females in Eastlawn Gardens?
There are 105.10 Males per 100 Females in Eastlawn Gardens.
What is the Ratio of Females per 100 Males in Eastlawn Gardens?
There are 95.14 Females per 100 Males in Eastlawn Gardens.
What is the Median Population Age in Eastlawn Gardens?
Median Population Age in Eastlawn Gardens is 50.1 Years.
What is the Average Family Size in Eastlawn Gardens
Average Family Size in Eastlawn Gardens is 2.9 People.
What is the Average Household Size in Eastlawn Gardens
Average Household Size in Eastlawn Gardens is 2.6 People.
How Large is the Labor Force in Eastlawn Gardens?
There are 2,192 People in the Labor Forcein in Eastlawn Gardens.
What is the Percentage of People in the Labor Force in Eastlawn Gardens?
70.1% of People are in the Labor Force in Eastlawn Gardens.
What is the Unemployment Rate in Eastlawn Gardens?
Unemployment Rate in Eastlawn Gardens is 1.6%.