Force, PA Map & Demographics
Force Map
Force Overview
$19,875
PER CAPITA INCOME
$50,250
AVG FAMILY INCOME
$31,786
AVG HOUSEHOLD INCOME
54.6%
WAGE / INCOME GAP [ % ]
45.4¢/ $1
WAGE / INCOME GAP [ $ ]
0.34
INEQUALITY / GINI INDEX
269
TOTAL POPULATION
91
MALE POPULATION
178
FEMALE POPULATION
51.12
MALES / 100 FEMALES
195.60
FEMALES / 100 MALES
38.5
MEDIAN AGE
2.4
AVG FAMILY SIZE
2.4
AVG HOUSEHOLD SIZE
113
LABOR FORCE [ PEOPLE ]
61.7%
PERCENT IN LABOR FORCE
Force Zip Codes
Force Area Codes
Income in Force
Income Overview in Force
Per Capita Income in Force is $19,875, while median incomes of families and households are $50,250 and $31,786 respectively.
| Characteristic | Number | Measure |
| Per Capita Income | 269 | $19,875 |
| Median Family Income | 88 | $50,250 |
| Mean Family Income | 88 | $50,414 |
| Median Household Income | 112 | $31,786 |
| Mean Household Income | 112 | $47,604 |
| Income Deficit | 88 | $0 |
| Wage / Income Gap (%) | 269 | 54.56% |
| Wage / Income Gap ($) | 269 | 45.44¢ per $1 |
| Gini / Inequality Index | 269 | 0.34 |
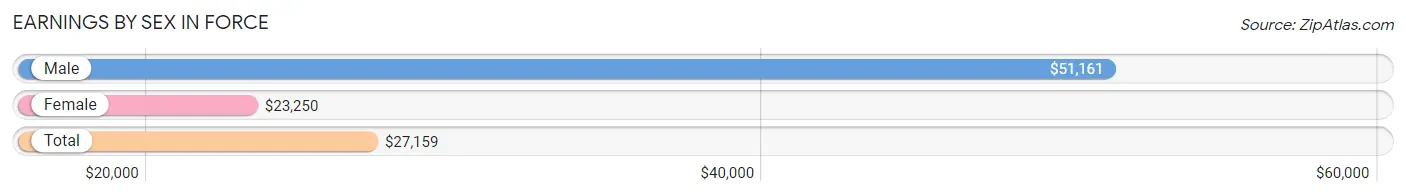
Earnings by Sex in Force
Average Earnings in Force are $27,159, $51,161 for men and $23,250 for women, a difference of 54.6%.
| Sex | Number | Average Earnings |
| Male | 47 (41.6%) | $51,161 |
| Female | 66 (58.4%) | $23,250 |
| Total | 113 (100.0%) | $27,159 |
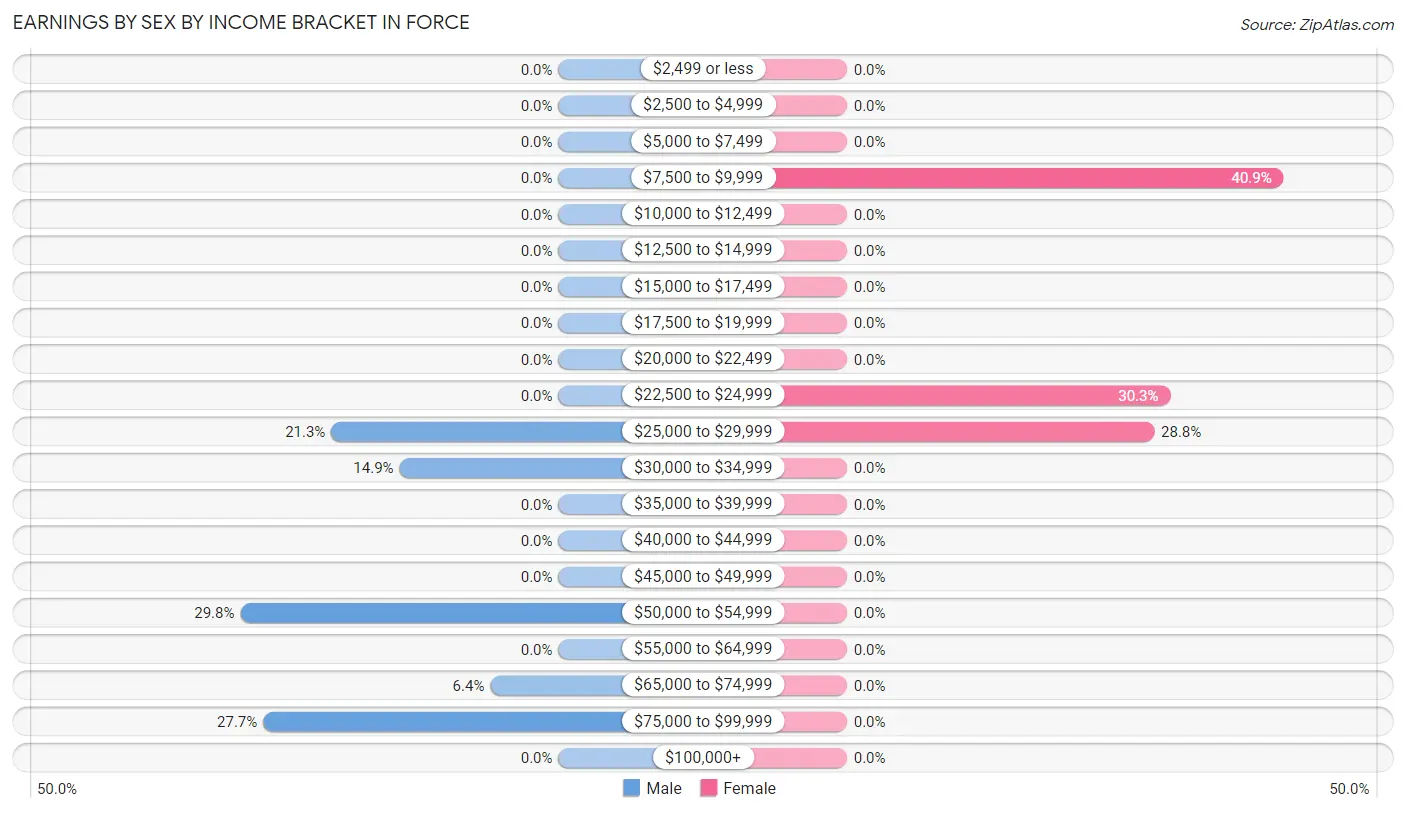
Earnings by Sex by Income Bracket in Force
The most common earnings brackets in Force are $50,000 to $54,999 for men (14 | 29.8%) and $7,500 to $9,999 for women (27 | 40.9%).
| Income | Male | Female |
| $2,499 or less | 0 (0.0%) | 0 (0.0%) |
| $2,500 to $4,999 | 0 (0.0%) | 0 (0.0%) |
| $5,000 to $7,499 | 0 (0.0%) | 0 (0.0%) |
| $7,500 to $9,999 | 0 (0.0%) | 27 (40.9%) |
| $10,000 to $12,499 | 0 (0.0%) | 0 (0.0%) |
| $12,500 to $14,999 | 0 (0.0%) | 0 (0.0%) |
| $15,000 to $17,499 | 0 (0.0%) | 0 (0.0%) |
| $17,500 to $19,999 | 0 (0.0%) | 0 (0.0%) |
| $20,000 to $22,499 | 0 (0.0%) | 0 (0.0%) |
| $22,500 to $24,999 | 0 (0.0%) | 20 (30.3%) |
| $25,000 to $29,999 | 10 (21.3%) | 19 (28.8%) |
| $30,000 to $34,999 | 7 (14.9%) | 0 (0.0%) |
| $35,000 to $39,999 | 0 (0.0%) | 0 (0.0%) |
| $40,000 to $44,999 | 0 (0.0%) | 0 (0.0%) |
| $45,000 to $49,999 | 0 (0.0%) | 0 (0.0%) |
| $50,000 to $54,999 | 14 (29.8%) | 0 (0.0%) |
| $55,000 to $64,999 | 0 (0.0%) | 0 (0.0%) |
| $65,000 to $74,999 | 3 (6.4%) | 0 (0.0%) |
| $75,000 to $99,999 | 13 (27.7%) | 0 (0.0%) |
| $100,000+ | 0 (0.0%) | 0 (0.0%) |
| Total | 47 (100.0%) | 66 (100.0%) |
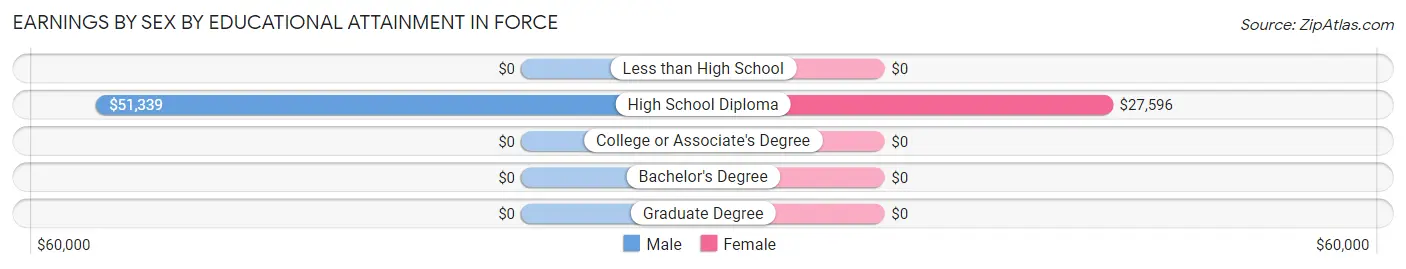
Earnings by Sex by Educational Attainment in Force
Average earnings in Force are $51,161 for men and $23,250 for women, a difference of 54.6%. Men with an educational attainment of high school diploma enjoy the highest average annual earnings of $51,339, while those with high school diploma education earn the least with $51,339. Women with an educational attainment of high school diploma earn the most with the average annual earnings of $27,596, while those with high school diploma education have the smallest earnings of $27,596.
| Educational Attainment | Male Income | Female Income |
| Less than High School | - | - |
| High School Diploma | $51,339 | $27,596 |
| College or Associate's Degree | - | - |
| Bachelor's Degree | - | - |
| Graduate Degree | - | - |
| Total | $51,161 | $23,250 |
Family Income in Force
Family Income Brackets in Force
According to the Force family income data, there are 33 families falling into the $50,000 to $74,999 income range, which is the most common income bracket and makes up 37.5% of all families.
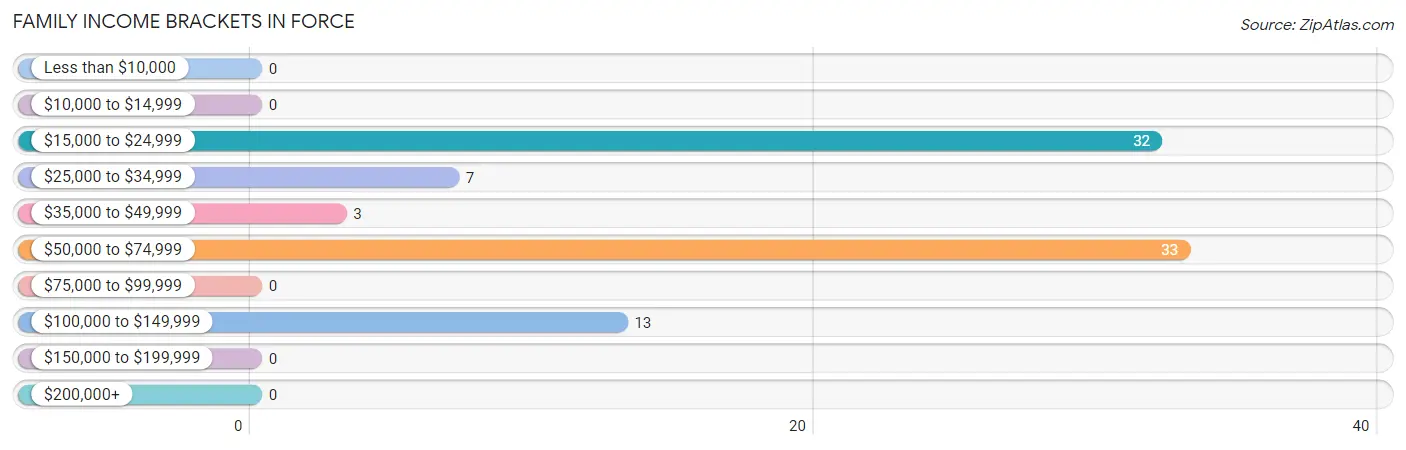
| Income Bracket | # Families | % Families |
| Less than $10,000 | 0 | 0.0% |
| $10,000 to $14,999 | 0 | 0.0% |
| $15,000 to $24,999 | 32 | 36.4% |
| $25,000 to $34,999 | 7 | 8.0% |
| $35,000 to $49,999 | 3 | 3.4% |
| $50,000 to $74,999 | 33 | 37.5% |
| $75,000 to $99,999 | 0 | 0.0% |
| $100,000 to $149,999 | 13 | 14.8% |
| $150,000 to $199,999 | 0 | 0.0% |
| $200,000+ | 0 | 0.0% |
Family Income by Famaliy Size in Force
2-person families (85 | 96.6%) account for the highest median family income in Force with $50,063 per family, while 2-person families (85 | 96.6%) have the highest median income of $25,032 per family member.
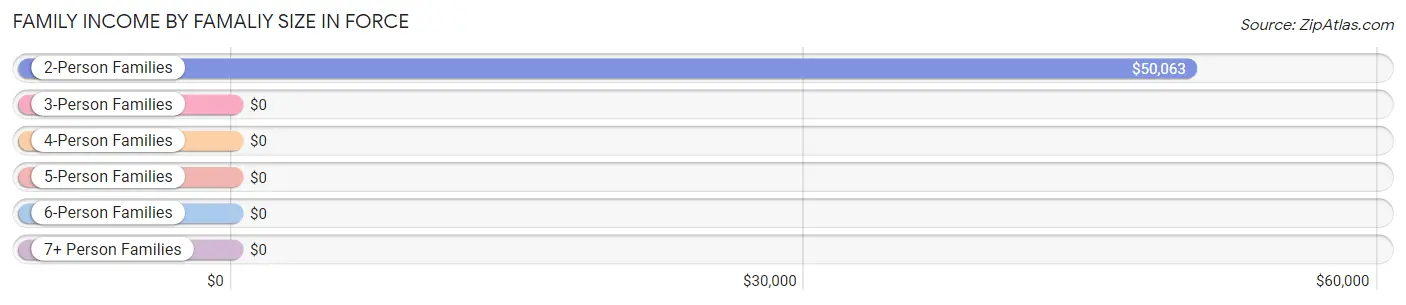
| Income Bracket | # Families | Median Income |
| 2-Person Families | 85 (96.6%) | $50,063 |
| 3-Person Families | 0 (0.0%) | $0 |
| 4-Person Families | 0 (0.0%) | $0 |
| 5-Person Families | 0 (0.0%) | $0 |
| 6-Person Families | 3 (3.4%) | $0 |
| 7+ Person Families | 0 (0.0%) | $0 |
| Total | 88 (100.0%) | $50,250 |
Family Income by Number of Earners in Force
| Number of Earners | # Families | Median Income |
| No Earners | 8 (9.1%) | $0 |
| 1 Earner | 61 (69.3%) | $0 |
| 2 Earners | 19 (21.6%) | $0 |
| 3+ Earners | 0 (0.0%) | $0 |
| Total | 88 (100.0%) | $50,250 |
Household Income in Force
Household Income Brackets in Force
With 48 households falling in the category, the $15,000 to $24,999 income range is the most frequent in Force, accounting for 42.9% of all households.
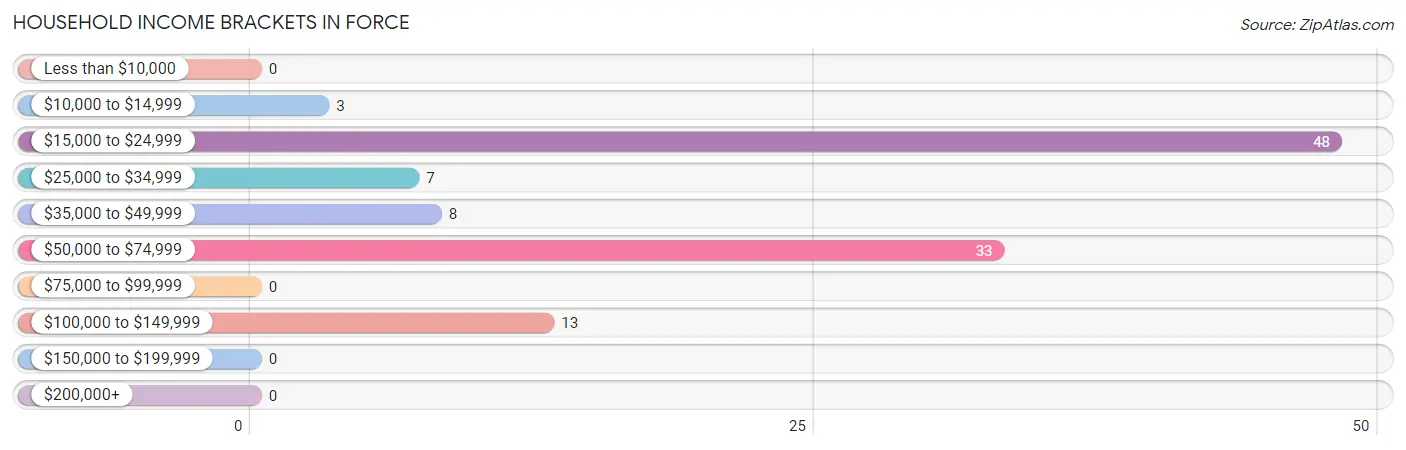
| Income Bracket | # Households | % Households |
| Less than $10,000 | 0 | 0.0% |
| $10,000 to $14,999 | 3 | 2.7% |
| $15,000 to $24,999 | 48 | 42.9% |
| $25,000 to $34,999 | 7 | 6.3% |
| $35,000 to $49,999 | 8 | 7.1% |
| $50,000 to $74,999 | 33 | 29.5% |
| $75,000 to $99,999 | 0 | 0.0% |
| $100,000 to $149,999 | 13 | 11.6% |
| $150,000 to $199,999 | 0 | 0.0% |
| $200,000+ | 0 | 0.0% |
Household Income by Householder Age in Force
The median household income in Force is $31,786, with the highest median household income of $74,643 found in the 25 to 44 years age bracket for the primary householder. A total of 30 households (26.8%) fall into this category.
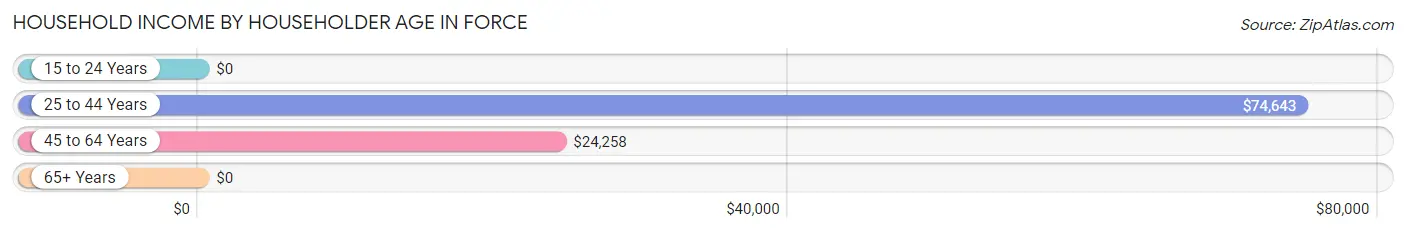
| Income Bracket | # Households | Median Income |
| 15 to 24 Years | 0 (0.0%) | $0 |
| 25 to 44 Years | 30 (26.8%) | $74,643 |
| 45 to 64 Years | 45 (40.2%) | $24,258 |
| 65+ Years | 37 (33.0%) | $0 |
| Total | 112 (100.0%) | $31,786 |
Poverty in Force
Income Below Poverty by Sex and Age in Force
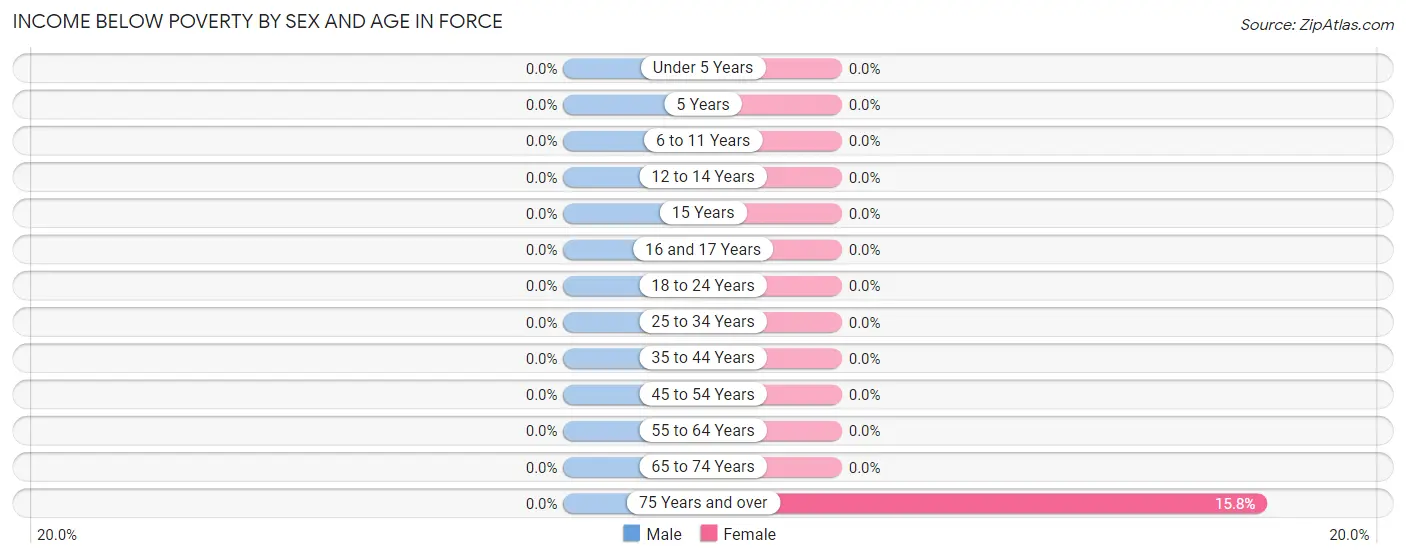
| Age Bracket | Male | Female |
| Under 5 Years | 0 (0.0%) | 0 (0.0%) |
| 5 Years | 0 (0.0%) | 0 (0.0%) |
| 6 to 11 Years | 0 (0.0%) | 0 (0.0%) |
| 12 to 14 Years | 0 (0.0%) | 0 (0.0%) |
| 15 Years | 0 (0.0%) | 0 (0.0%) |
| 16 and 17 Years | 0 (0.0%) | 0 (0.0%) |
| 18 to 24 Years | 0 (0.0%) | 0 (0.0%) |
| 25 to 34 Years | 0 (0.0%) | 0 (0.0%) |
| 35 to 44 Years | 0 (0.0%) | 0 (0.0%) |
| 45 to 54 Years | 0 (0.0%) | 0 (0.0%) |
| 55 to 64 Years | 0 (0.0%) | 0 (0.0%) |
| 65 to 74 Years | 0 (0.0%) | 0 (0.0%) |
| 75 Years and over | 0 (0.0%) | 3 (15.8%) |
| Total | 0 (0.0%) | 3 (1.9%) |
Income Above Poverty by Sex and Age in Force
According to the poverty statistics in Force, males aged 6 to 11 years and females aged 5 years are the age groups that are most secure financially, with 100.0% of males and 100.0% of females in these age groups living above the poverty line.
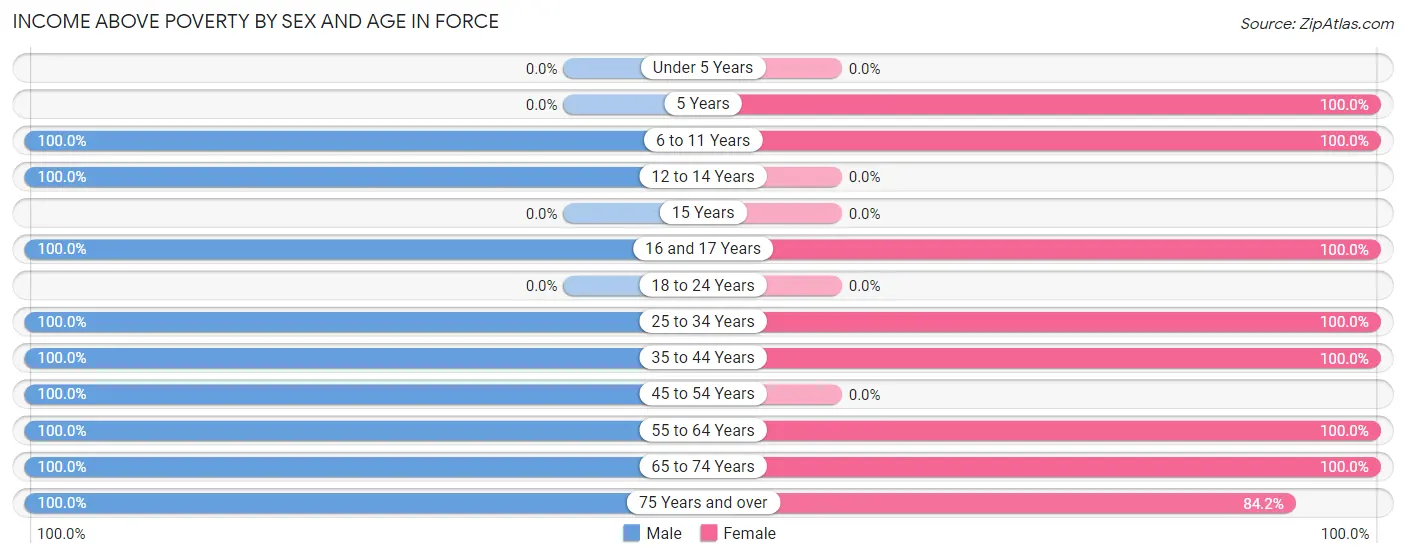
| Age Bracket | Male | Female |
| Under 5 Years | 0 (0.0%) | 0 (0.0%) |
| 5 Years | 0 (0.0%) | 44 (100.0%) |
| 6 to 11 Years | 17 (100.0%) | 4 (100.0%) |
| 12 to 14 Years | 3 (100.0%) | 0 (0.0%) |
| 15 Years | 0 (0.0%) | 0 (0.0%) |
| 16 and 17 Years | 11 (100.0%) | 5 (100.0%) |
| 18 to 24 Years | 0 (0.0%) | 0 (0.0%) |
| 25 to 34 Years | 13 (100.0%) | 13 (100.0%) |
| 35 to 44 Years | 17 (100.0%) | 17 (100.0%) |
| 45 to 54 Years | 5 (100.0%) | 0 (0.0%) |
| 55 to 64 Years | 17 (100.0%) | 39 (100.0%) |
| 65 to 74 Years | 5 (100.0%) | 19 (100.0%) |
| 75 Years and over | 3 (100.0%) | 16 (84.2%) |
| Total | 91 (100.0%) | 157 (98.1%) |
Income Below Poverty Among Married-Couple Families in Force
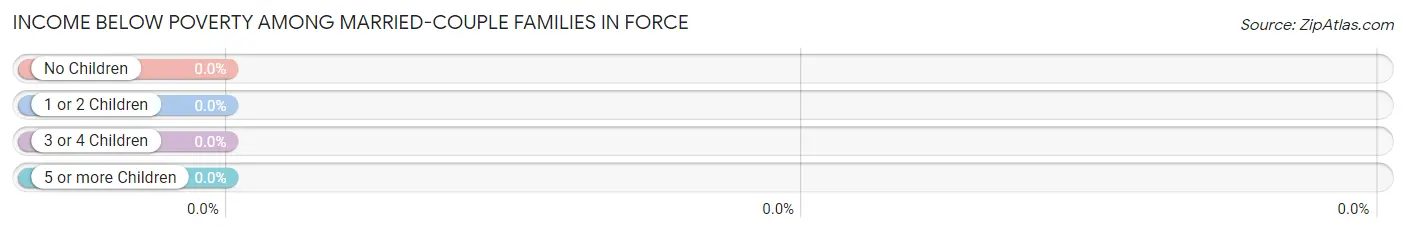
| Children | Above Poverty | Below Poverty |
| No Children | 27 (100.0%) | 0 (0.0%) |
| 1 or 2 Children | 0 (0.0%) | 0 (0.0%) |
| 3 or 4 Children | 3 (100.0%) | 0 (0.0%) |
| 5 or more Children | 0 (0.0%) | 0 (0.0%) |
| Total | 30 (100.0%) | 0 (0.0%) |
Income Below Poverty Among Single-Parent Households in Force
| Children | Single Father | Single Mother |
| No Children | 0 (0.0%) | 0 (0.0%) |
| 1 or 2 Children | 0 (0.0%) | 0 (0.0%) |
| 3 or 4 Children | 0 (0.0%) | 0 (0.0%) |
| 5 or more Children | 0 (0.0%) | 0 (0.0%) |
| Total | 0 (0.0%) | 0 (0.0%) |
Income Below Poverty Among Married-Couple vs Single-Parent Households in Force
| Children | Married-Couple Families | Single-Parent Households |
| No Children | 0 (0.0%) | 0 (0.0%) |
| 1 or 2 Children | 0 (0.0%) | 0 (0.0%) |
| 3 or 4 Children | 0 (0.0%) | 0 (0.0%) |
| 5 or more Children | 0 (0.0%) | 0 (0.0%) |
| Total | 0 (0.0%) | 0 (0.0%) |
Race in Force
The most populous races in Force are , and White / Caucasian (269 | 100.0%).
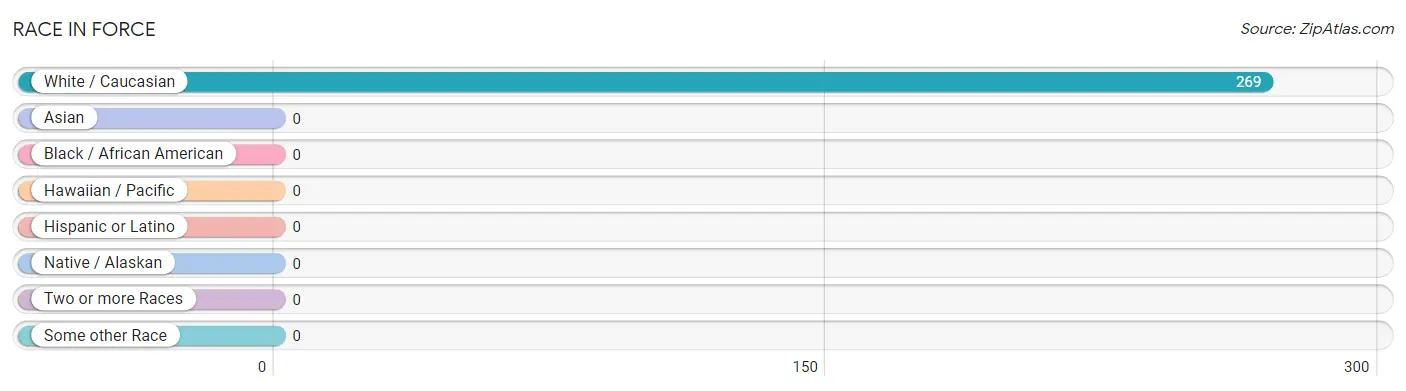
| Race | # Population | % Population |
| Asian | 0 | 0.0% |
| Black / African American | 0 | 0.0% |
| Hawaiian / Pacific | 0 | 0.0% |
| Hispanic or Latino | 0 | 0.0% |
| Native / Alaskan | 0 | 0.0% |
| White / Caucasian | 269 | 100.0% |
| Two or more Races | 0 | 0.0% |
| Some other Race | 0 | 0.0% |
| Total | 269 | 100.0% |
Ancestry in Force
The most populous ancestries reported in Force are German (153 | 56.9%), English (94 | 34.9%), Italian (92 | 34.2%), American (15 | 5.6%), and French (9 | 3.4%), together accounting for 135.0% of all Force residents.
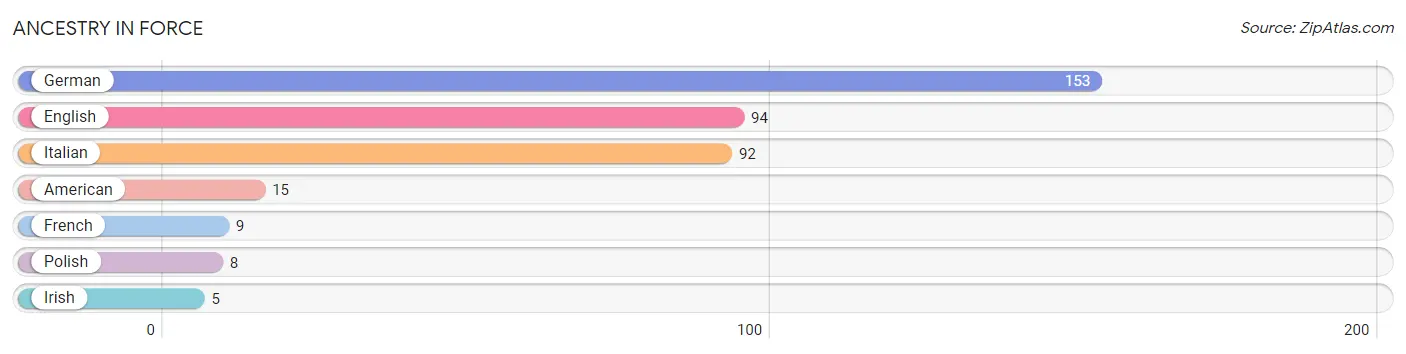
| Ancestry | # Population | % Population |
| American | 15 | 5.6% |
| English | 94 | 34.9% |
| French | 9 | 3.4% |
| German | 153 | 56.9% |
| Irish | 5 | 1.9% |
| Italian | 92 | 34.2% |
| Polish | 8 | 3.0% | View All 7 Rows |
Immigrants in Force

| Immigration Origin | # Population | % Population | View All 0 Rows |
Sex and Age in Force
Sex and Age in Force
The most populous age groups in Force are 5 to 9 Years (17 | 18.7%) for men and 5 to 9 Years (48 | 27.0%) for women.
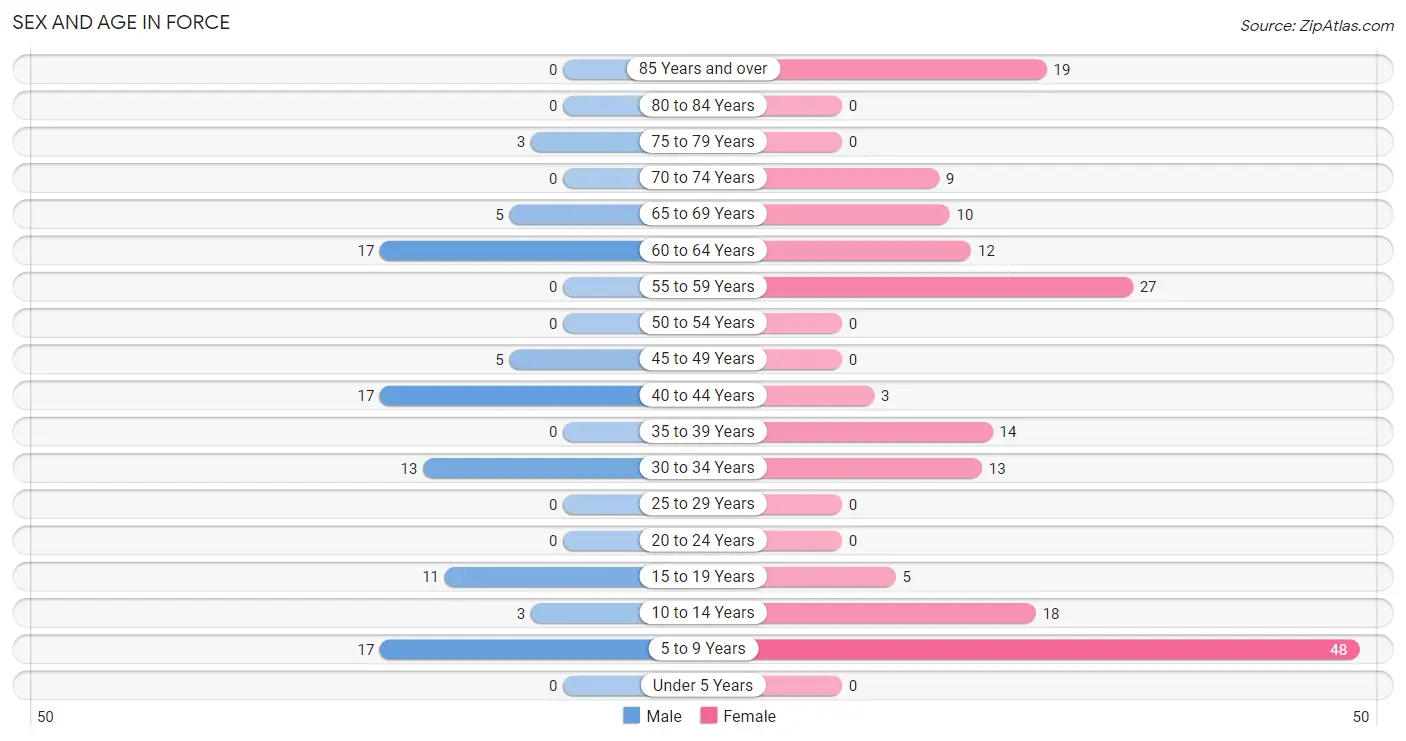
| Age Bracket | Male | Female |
| Under 5 Years | 0 (0.0%) | 0 (0.0%) |
| 5 to 9 Years | 17 (18.7%) | 48 (27.0%) |
| 10 to 14 Years | 3 (3.3%) | 18 (10.1%) |
| 15 to 19 Years | 11 (12.1%) | 5 (2.8%) |
| 20 to 24 Years | 0 (0.0%) | 0 (0.0%) |
| 25 to 29 Years | 0 (0.0%) | 0 (0.0%) |
| 30 to 34 Years | 13 (14.3%) | 13 (7.3%) |
| 35 to 39 Years | 0 (0.0%) | 14 (7.9%) |
| 40 to 44 Years | 17 (18.7%) | 3 (1.7%) |
| 45 to 49 Years | 5 (5.5%) | 0 (0.0%) |
| 50 to 54 Years | 0 (0.0%) | 0 (0.0%) |
| 55 to 59 Years | 0 (0.0%) | 27 (15.2%) |
| 60 to 64 Years | 17 (18.7%) | 12 (6.7%) |
| 65 to 69 Years | 5 (5.5%) | 10 (5.6%) |
| 70 to 74 Years | 0 (0.0%) | 9 (5.1%) |
| 75 to 79 Years | 3 (3.3%) | 0 (0.0%) |
| 80 to 84 Years | 0 (0.0%) | 0 (0.0%) |
| 85 Years and over | 0 (0.0%) | 19 (10.7%) |
| Total | 91 (100.0%) | 178 (100.0%) |
Families and Households in Force
Median Family Size in Force
The median family size in Force is 2.42 persons per family, with married-couple families (30 | 34.1%) accounting for the largest median family size of 2.5 persons per family. On the other hand, single male/father families (21 | 23.9%) represent the smallest median family size with 2.19 persons per family.
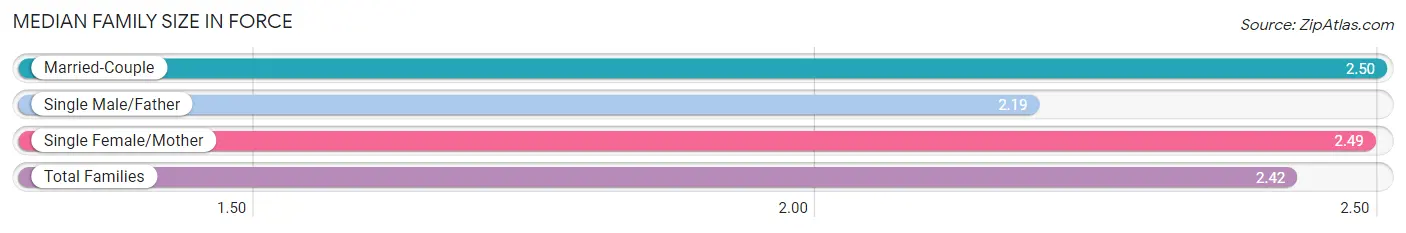
| Family Type | # Families | Family Size |
| Married-Couple | 30 (34.1%) | 2.50 |
| Single Male/Father | 21 (23.9%) | 2.19 |
| Single Female/Mother | 37 (42.0%) | 2.49 |
| Total Families | 88 (100.0%) | 2.42 |
Median Household Size in Force
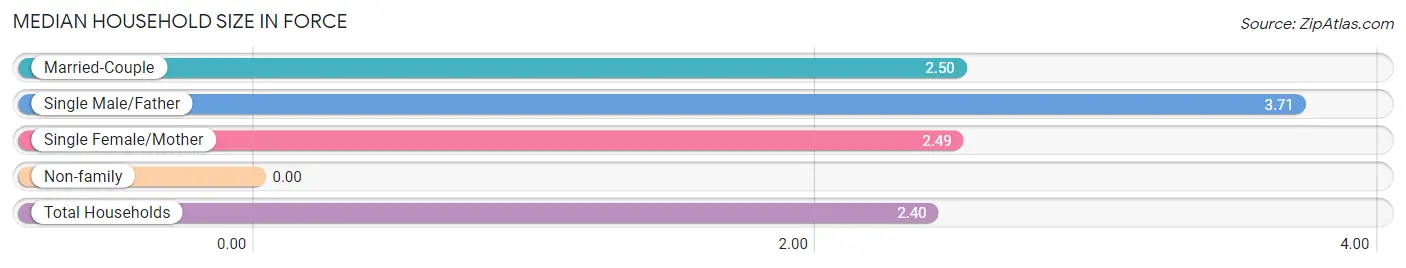
| Household Type | # Households | Household Size |
| Married-Couple | 30 (26.8%) | 2.50 |
| Single Male/Father | 21 (18.8%) | 3.71 |
| Single Female/Mother | 37 (33.0%) | 2.49 |
| Non-family | 24 (21.4%) | - |
| Total Households | 112 (100.0%) | 2.40 |
Household Size by Marriage Status in Force
Out of a total of 112 households in Force, 88 (78.6%) are family households, while 24 (21.4%) are nonfamily households. The most numerous type of family households are 2-person households, comprising 71, and the most common type of nonfamily households are 1-person households, comprising 24.
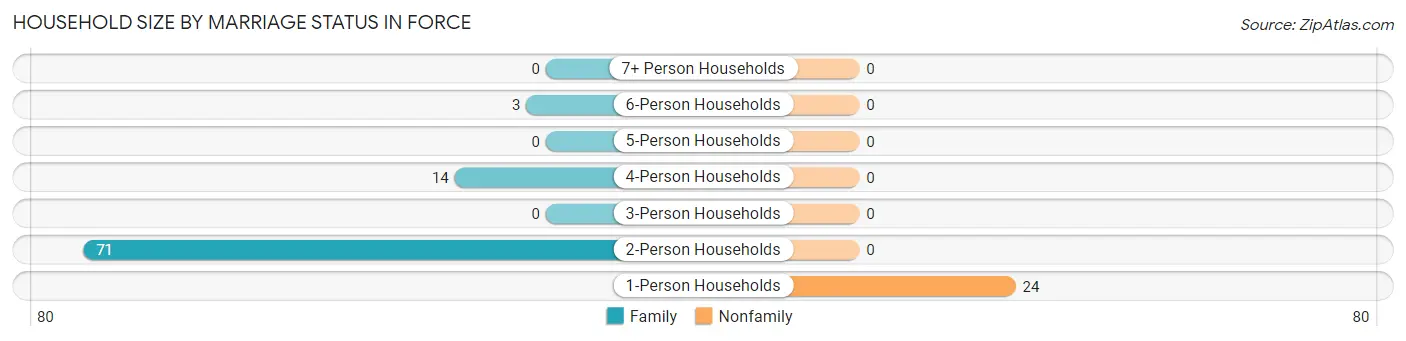
| Household Size | Family Households | Nonfamily Households |
| 1-Person Households | - | 24 (21.4%) |
| 2-Person Households | 71 (63.4%) | 0 (0.0%) |
| 3-Person Households | 0 (0.0%) | 0 (0.0%) |
| 4-Person Households | 14 (12.5%) | 0 (0.0%) |
| 5-Person Households | 0 (0.0%) | 0 (0.0%) |
| 6-Person Households | 3 (2.7%) | 0 (0.0%) |
| 7+ Person Households | 0 (0.0%) | 0 (0.0%) |
| Total | 88 (78.6%) | 24 (21.4%) |
Female Fertility in Force
Fertility by Age in Force
| Age Bracket | Women with Births | Births / 1,000 Women |
| 15 to 19 years | 0 (0.0%) | 0.0 |
| 20 to 34 years | 0 (0.0%) | 0.0 |
| 35 to 50 years | 0 (0.0%) | 0.0 |
| Total | 0 (0.0%) | 0.0 |
Fertility by Age by Marriage Status in Force
| Age Bracket | Married | Unmarried |
| 15 to 19 years | 0 (0.0%) | 0 (0.0%) |
| 20 to 34 years | 0 (0.0%) | 0 (0.0%) |
| 35 to 50 years | 0 (0.0%) | 0 (0.0%) |
| Total | 0 (0.0%) | 0 (0.0%) |
Fertility by Education in Force
| Educational Attainment | Women with Births | Births / 1,000 Women |
| Less than High School | 0 (0.0%) | 0.0 |
| High School Diploma | 0 (0.0%) | 0.0 |
| College or Associate's Degree | 0 (0.0%) | 0.0 |
| Bachelor's Degree | 0 (0.0%) | 0.0 |
| Graduate Degree | 0 (0.0%) | 0.0 |
| Total | 0 (0.0%) | 0.0 |
Fertility by Education by Marriage Status in Force
| Educational Attainment | Married | Unmarried |
| Less than High School | 0 (0.0%) | 0 (0.0%) |
| High School Diploma | 0 (0.0%) | 0 (0.0%) |
| College or Associate's Degree | 0 (0.0%) | 0 (0.0%) |
| Bachelor's Degree | 0 (0.0%) | 0 (0.0%) |
| Graduate Degree | 0 (0.0%) | 0 (0.0%) |
| Total | 0 (0.0%) | 0 (0.0%) |
Employment Characteristics in Force
Employment by Class of Employer in Force
Among the 113 employed individuals in Force, private company employees (108 | 95.6%), and local government employees (5 | 4.4%) make up the most common classes of employment.
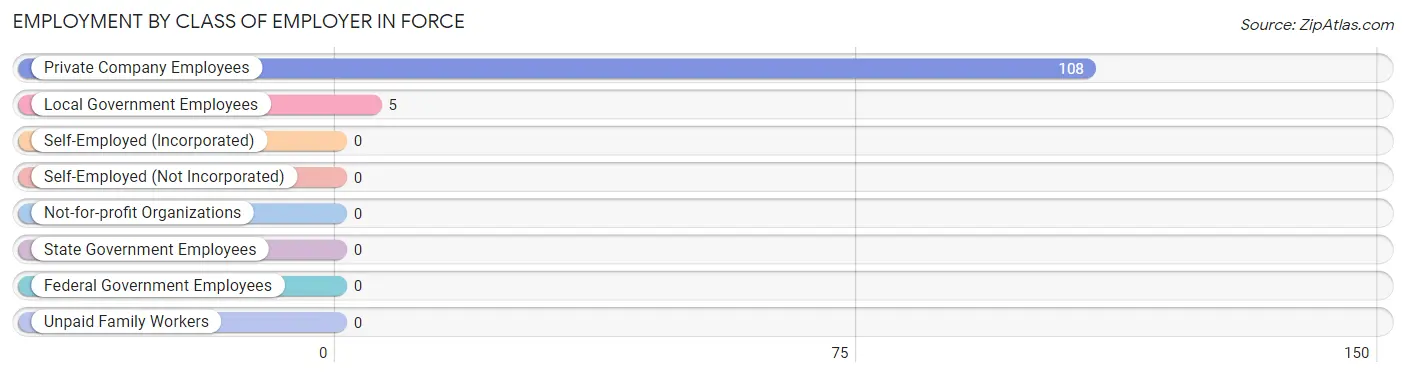
| Employer Class | # Employees | % Employees |
| Private Company Employees | 108 | 95.6% |
| Self-Employed (Incorporated) | 0 | 0.0% |
| Self-Employed (Not Incorporated) | 0 | 0.0% |
| Not-for-profit Organizations | 0 | 0.0% |
| Local Government Employees | 5 | 4.4% |
| State Government Employees | 0 | 0.0% |
| Federal Government Employees | 0 | 0.0% |
| Unpaid Family Workers | 0 | 0.0% |
| Total | 113 | 100.0% |
Employment Status by Age in Force
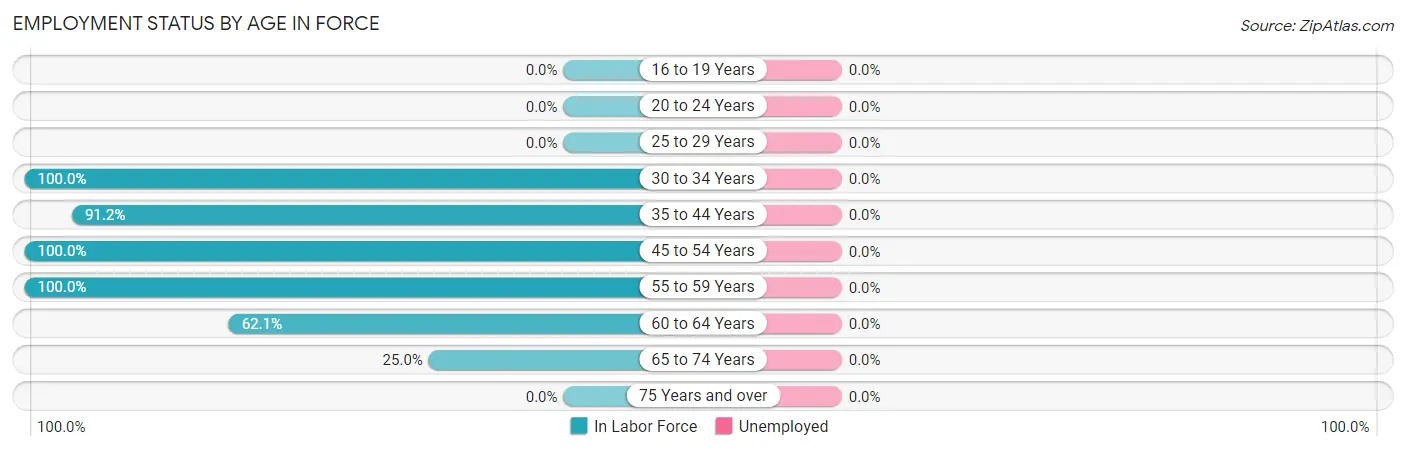
| Age Bracket | In Labor Force | Unemployed |
| 16 to 19 Years | 0 (0.0%) | 0 (0.0%) |
| 20 to 24 Years | 0 (0.0%) | 0 (0.0%) |
| 25 to 29 Years | 0 (0.0%) | 0 (0.0%) |
| 30 to 34 Years | 26 (100.0%) | 0 (0.0%) |
| 35 to 44 Years | 31 (91.2%) | 0 (0.0%) |
| 45 to 54 Years | 5 (100.0%) | 0 (0.0%) |
| 55 to 59 Years | 27 (100.0%) | 0 (0.0%) |
| 60 to 64 Years | 18 (62.1%) | 0 (0.0%) |
| 65 to 74 Years | 6 (25.0%) | 0 (0.0%) |
| 75 Years and over | 0 (0.0%) | 0 (0.0%) |
| Total | 113 (61.7%) | 0 (0.0%) |
Employment Status by Educational Attainment in Force
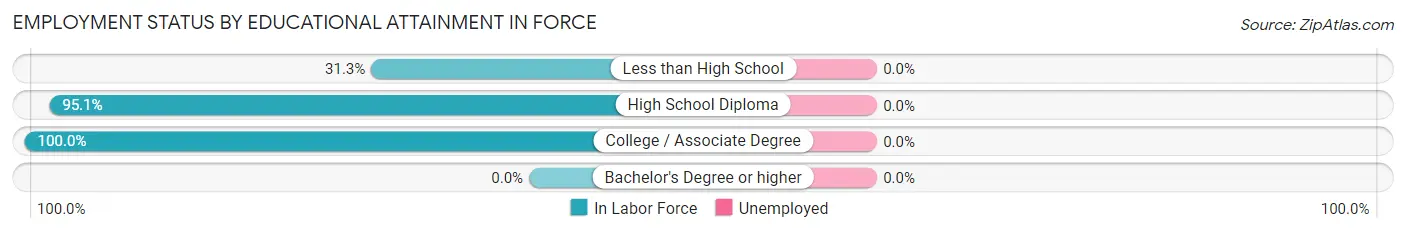
| Educational Attainment | In Labor Force | Unemployed |
| Less than High School | 5 (31.3%) | 0 (0.0%) |
| High School Diploma | 58 (95.1%) | 0 (0.0%) |
| College / Associate Degree | 44 (100.0%) | 0 (0.0%) |
| Bachelor's Degree or higher | 0 (0.0%) | 0 (0.0%) |
| Total | 107 (88.4%) | 0 (0.0%) |
Employment Occupations by Sex in Force
Management, Business, Science and Arts Occupations
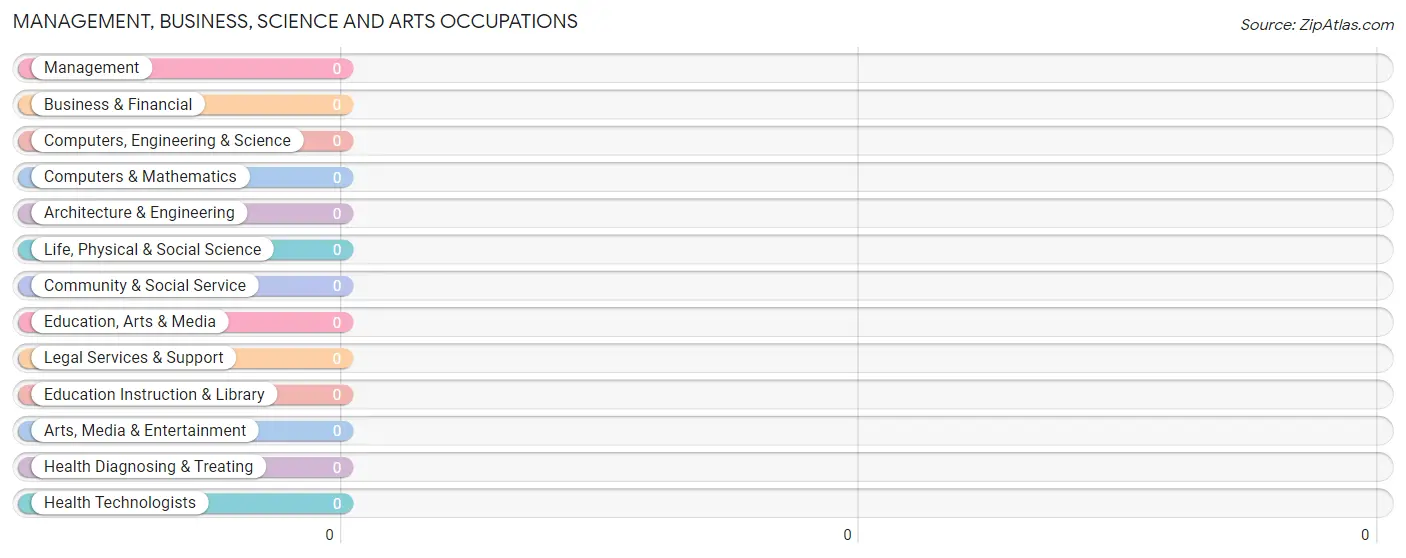
Management, Business, Science and Arts Occupations by Sex
| Occupation | Male | Female |
| Management | 0 (0.0%) | 0 (0.0%) |
| Business & Financial | 0 (0.0%) | 0 (0.0%) |
| Computers, Engineering & Science | 0 (0.0%) | 0 (0.0%) |
| Computers & Mathematics | 0 (0.0%) | 0 (0.0%) |
| Architecture & Engineering | 0 (0.0%) | 0 (0.0%) |
| Life, Physical & Social Science | 0 (0.0%) | 0 (0.0%) |
| Community & Social Service | 0 (0.0%) | 0 (0.0%) |
| Education, Arts & Media | 0 (0.0%) | 0 (0.0%) |
| Legal Services & Support | 0 (0.0%) | 0 (0.0%) |
| Education Instruction & Library | 0 (0.0%) | 0 (0.0%) |
| Arts, Media & Entertainment | 0 (0.0%) | 0 (0.0%) |
| Health Diagnosing & Treating | 0 (0.0%) | 0 (0.0%) |
| Health Technologists | 0 (0.0%) | 0 (0.0%) |
| Total (Category) | 0 (0.0%) | 0 (0.0%) |
| Total (Overall) | 47 (41.6%) | 66 (58.4%) |
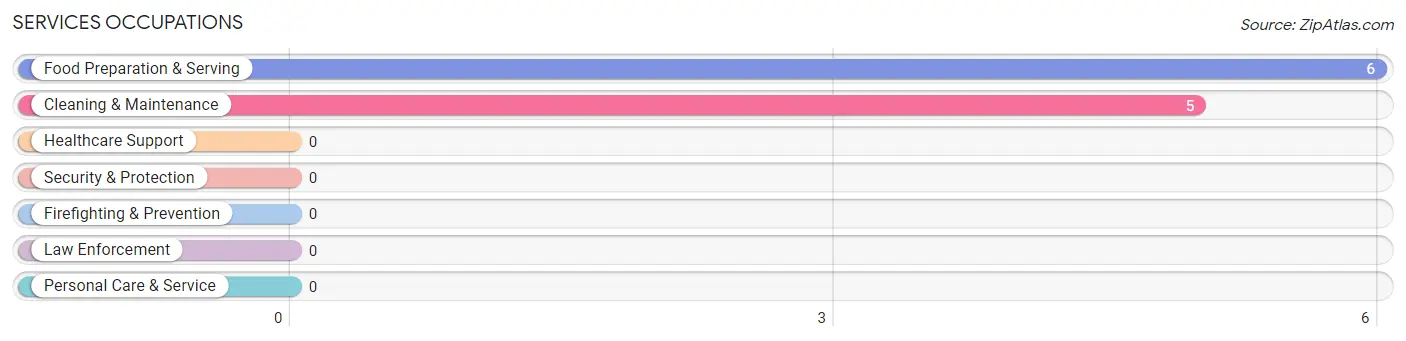
Services Occupations
The most common Services occupations in Force are Food Preparation & Serving (6 | 5.3%), and Cleaning & Maintenance (5 | 4.4%).
Services Occupations by Sex
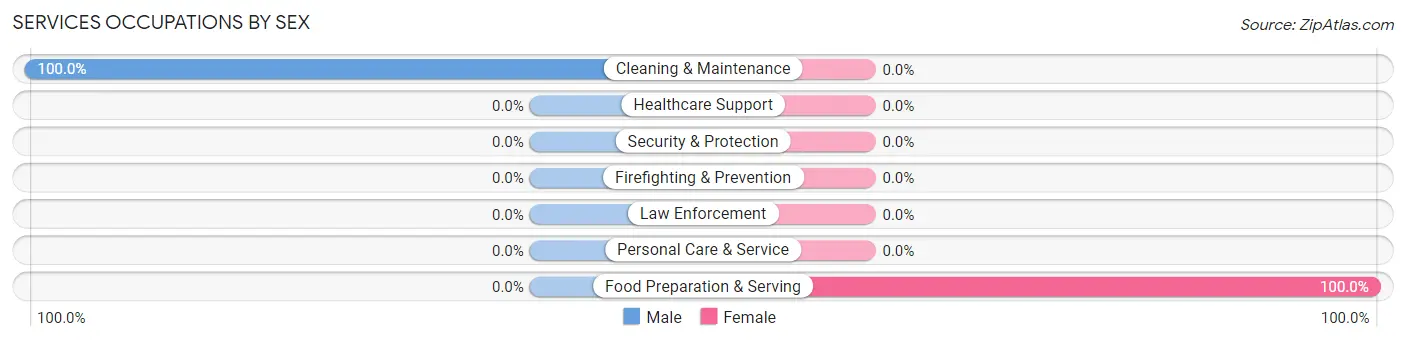
| Occupation | Male | Female |
| Healthcare Support | 0 (0.0%) | 0 (0.0%) |
| Security & Protection | 0 (0.0%) | 0 (0.0%) |
| Firefighting & Prevention | 0 (0.0%) | 0 (0.0%) |
| Law Enforcement | 0 (0.0%) | 0 (0.0%) |
| Food Preparation & Serving | 0 (0.0%) | 6 (100.0%) |
| Cleaning & Maintenance | 5 (100.0%) | 0 (0.0%) |
| Personal Care & Service | 0 (0.0%) | 0 (0.0%) |
| Total (Category) | 5 (45.5%) | 6 (54.5%) |
| Total (Overall) | 47 (41.6%) | 66 (58.4%) |
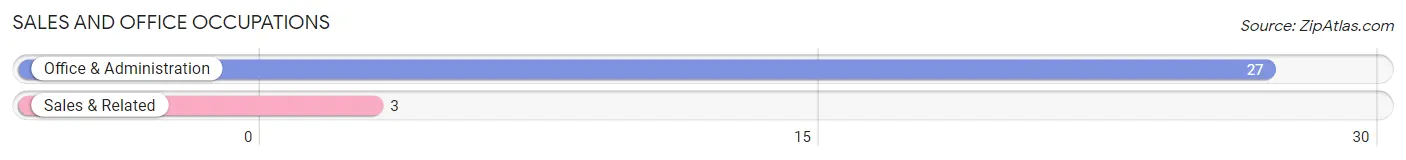
Sales and Office Occupations
The most common Sales and Office occupations in Force are Office & Administration (27 | 23.9%), and Sales & Related (3 | 2.6%).
Sales and Office Occupations by Sex

| Occupation | Male | Female |
| Sales & Related | 3 (100.0%) | 0 (0.0%) |
| Office & Administration | 0 (0.0%) | 27 (100.0%) |
| Total (Category) | 3 (10.0%) | 27 (90.0%) |
| Total (Overall) | 47 (41.6%) | 66 (58.4%) |
Natural Resources, Construction and Maintenance Occupations
The most common Natural Resources, Construction and Maintenance occupations in Force are , and Construction & Extraction (5 | 4.4%).
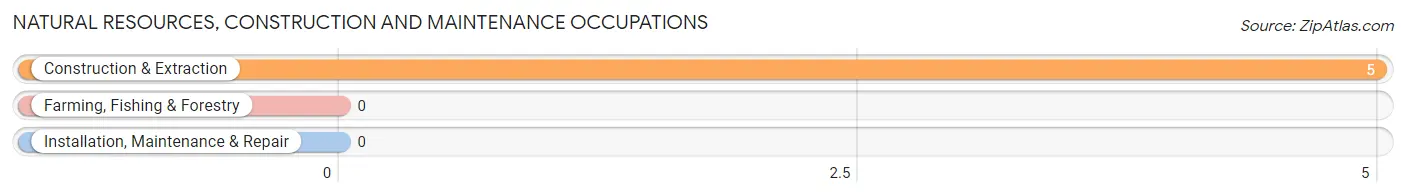
Natural Resources, Construction and Maintenance Occupations by Sex
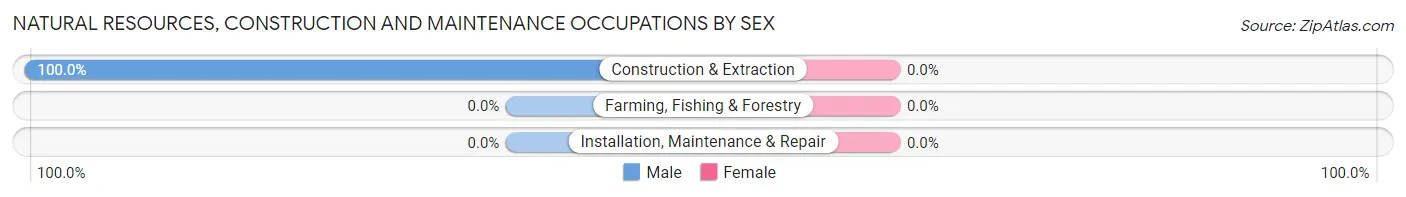
| Occupation | Male | Female |
| Farming, Fishing & Forestry | 0 (0.0%) | 0 (0.0%) |
| Construction & Extraction | 5 (100.0%) | 0 (0.0%) |
| Installation, Maintenance & Repair | 0 (0.0%) | 0 (0.0%) |
| Total (Category) | 5 (100.0%) | 0 (0.0%) |
| Total (Overall) | 47 (41.6%) | 66 (58.4%) |
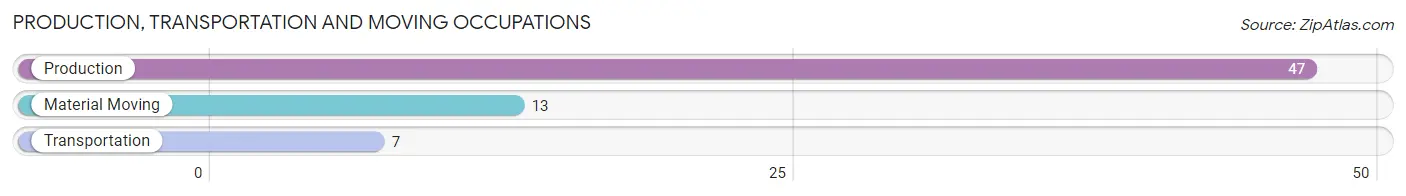
Production, Transportation and Moving Occupations
The most common Production, Transportation and Moving occupations in Force are Production (47 | 41.6%), Material Moving (13 | 11.5%), and Transportation (7 | 6.2%).
Production, Transportation and Moving Occupations by Sex
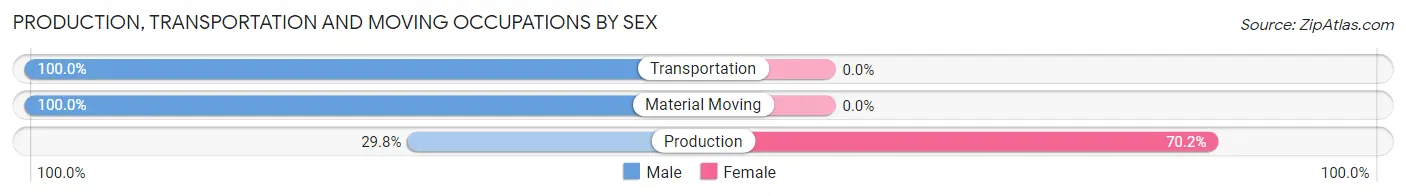
| Occupation | Male | Female |
| Production | 14 (29.8%) | 33 (70.2%) |
| Transportation | 7 (100.0%) | 0 (0.0%) |
| Material Moving | 13 (100.0%) | 0 (0.0%) |
| Total (Category) | 34 (50.7%) | 33 (49.2%) |
| Total (Overall) | 47 (41.6%) | 66 (58.4%) |
Employment Industries by Sex in Force
Employment Industries in Force
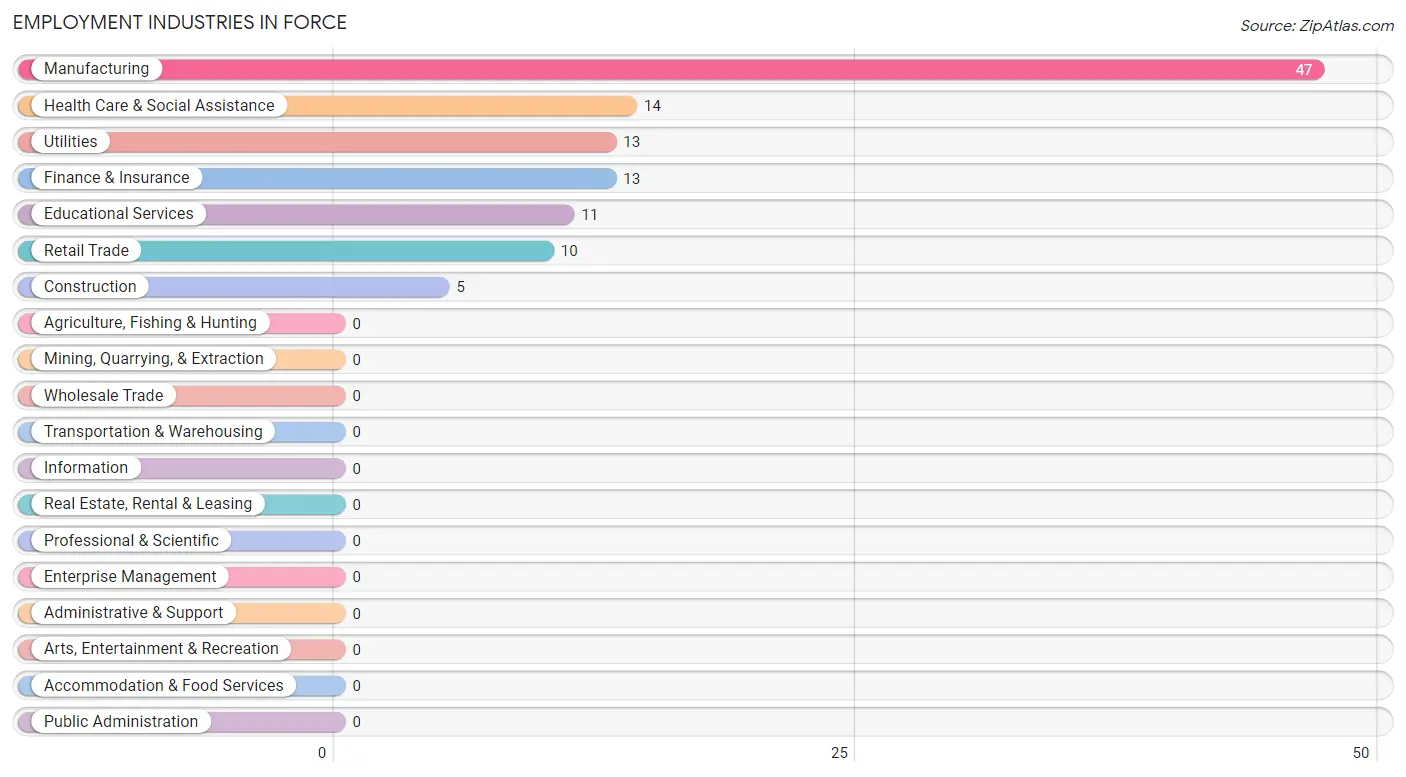
The major employment industries in Force include Manufacturing (47 | 41.6%), Health Care & Social Assistance (14 | 12.4%), Utilities (13 | 11.5%), Finance & Insurance (13 | 11.5%), and Educational Services (11 | 9.7%).
Employment Industries by Sex in Force
The Force industries that see more men than women are Construction (100.0%), Retail Trade (100.0%), and Utilities (100.0%), whereas the industries that tend to have a higher number of women are Finance & Insurance (100.0%), Health Care & Social Assistance (100.0%), and Manufacturing (70.2%).
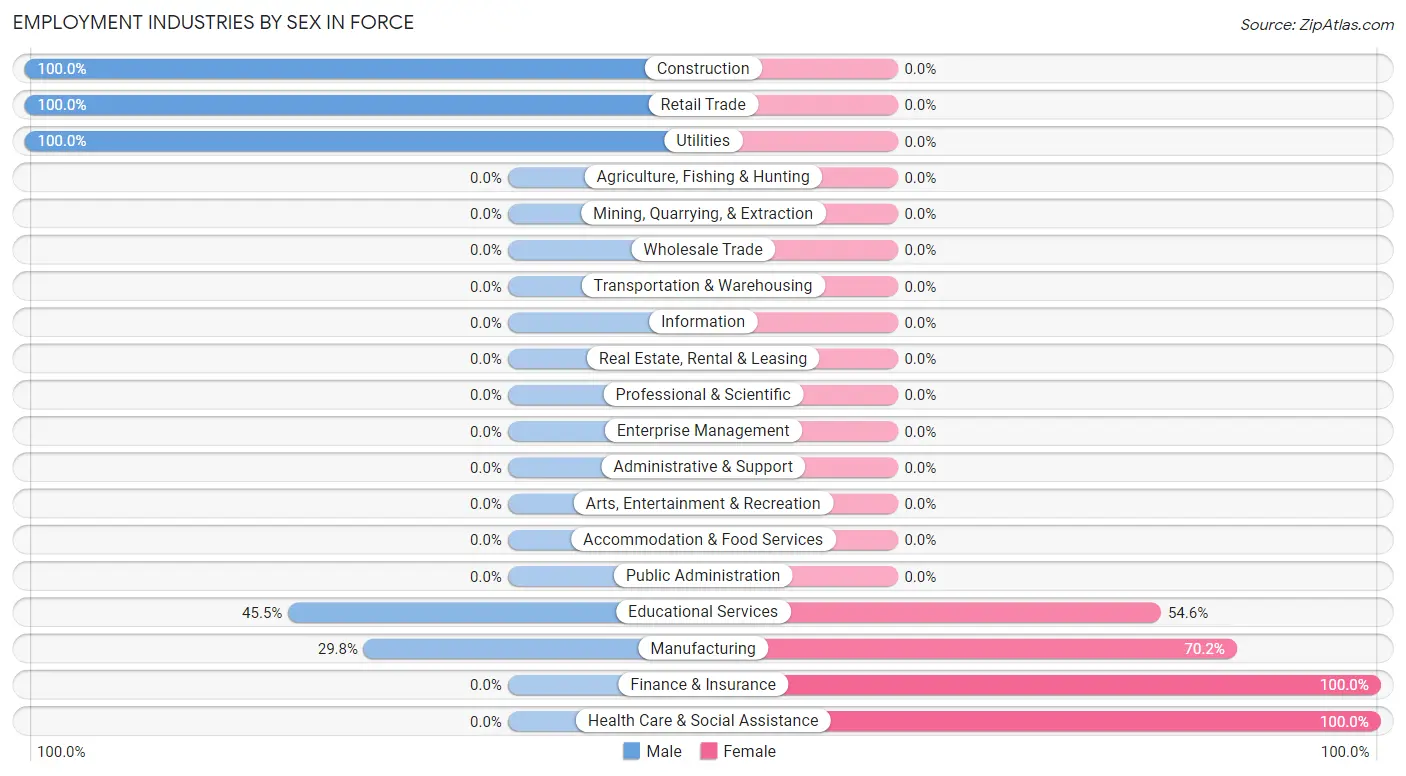
| Industry | Male | Female |
| Agriculture, Fishing & Hunting | 0 (0.0%) | 0 (0.0%) |
| Mining, Quarrying, & Extraction | 0 (0.0%) | 0 (0.0%) |
| Construction | 5 (100.0%) | 0 (0.0%) |
| Manufacturing | 14 (29.8%) | 33 (70.2%) |
| Wholesale Trade | 0 (0.0%) | 0 (0.0%) |
| Retail Trade | 10 (100.0%) | 0 (0.0%) |
| Transportation & Warehousing | 0 (0.0%) | 0 (0.0%) |
| Utilities | 13 (100.0%) | 0 (0.0%) |
| Information | 0 (0.0%) | 0 (0.0%) |
| Finance & Insurance | 0 (0.0%) | 13 (100.0%) |
| Real Estate, Rental & Leasing | 0 (0.0%) | 0 (0.0%) |
| Professional & Scientific | 0 (0.0%) | 0 (0.0%) |
| Enterprise Management | 0 (0.0%) | 0 (0.0%) |
| Administrative & Support | 0 (0.0%) | 0 (0.0%) |
| Educational Services | 5 (45.5%) | 6 (54.5%) |
| Health Care & Social Assistance | 0 (0.0%) | 14 (100.0%) |
| Arts, Entertainment & Recreation | 0 (0.0%) | 0 (0.0%) |
| Accommodation & Food Services | 0 (0.0%) | 0 (0.0%) |
| Public Administration | 0 (0.0%) | 0 (0.0%) |
| Total | 47 (41.6%) | 66 (58.4%) |
Education in Force
School Enrollment in Force
The most common levels of schooling among the 102 students in Force are kindergarten (47 | 46.1%), middle school (21 | 20.6%), and elementary school (18 | 17.6%).
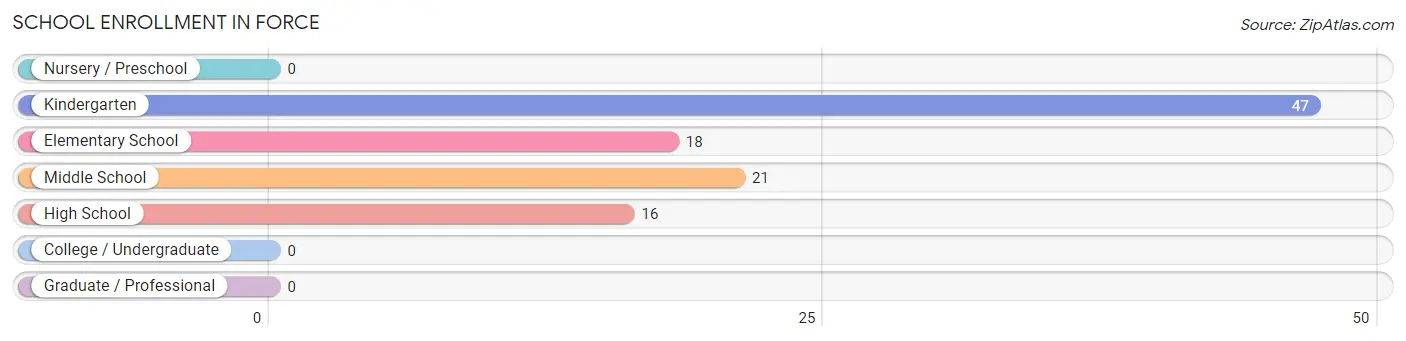
| School Level | # Students | % Students |
| Nursery / Preschool | 0 | 0.0% |
| Kindergarten | 47 | 46.1% |
| Elementary School | 18 | 17.6% |
| Middle School | 21 | 20.6% |
| High School | 16 | 15.7% |
| College / Undergraduate | 0 | 0.0% |
| Graduate / Professional | 0 | 0.0% |
| Total | 102 | 100.0% |
School Enrollment by Age by Funding Source in Force
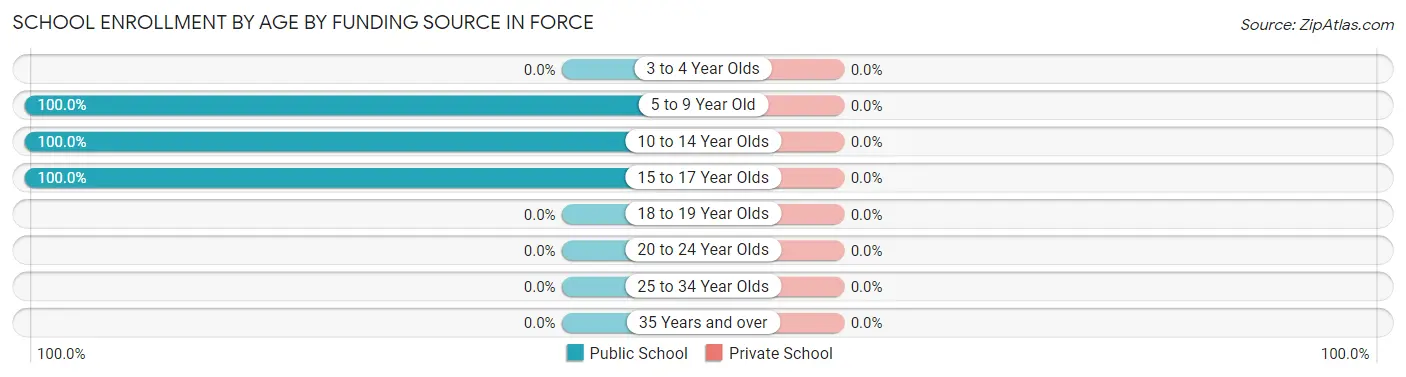
| Age Bracket | Public School | Private School |
| 3 to 4 Year Olds | 0 (0.0%) | 0 (0.0%) |
| 5 to 9 Year Old | 65 (100.0%) | 0 (0.0%) |
| 10 to 14 Year Olds | 21 (100.0%) | 0 (0.0%) |
| 15 to 17 Year Olds | 16 (100.0%) | 0 (0.0%) |
| 18 to 19 Year Olds | 0 (0.0%) | 0 (0.0%) |
| 20 to 24 Year Olds | 0 (0.0%) | 0 (0.0%) |
| 25 to 34 Year Olds | 0 (0.0%) | 0 (0.0%) |
| 35 Years and over | 0 (0.0%) | 0 (0.0%) |
| Total | 102 (100.0%) | 0 (0.0%) |
Educational Attainment by Field of Study in Force
| Field of Study | # Graduates | % Graduates |
| Computers & Mathematics | 0 | 0.0% |
| Bio, Nature & Agricultural | 0 | 0.0% |
| Physical & Health Sciences | 0 | 0.0% |
| Psychology | 0 | 0.0% |
| Social Sciences | 0 | 0.0% |
| Engineering | 0 | 0.0% |
| Multidisciplinary Studies | 0 | 0.0% |
| Science & Technology | 0 | 0.0% |
| Business | 0 | 0.0% |
| Education | 0 | 0.0% |
| Literature & Languages | 0 | 0.0% |
| Liberal Arts & History | 0 | 0.0% |
| Visual & Performing Arts | 0 | 0.0% |
| Communications | 0 | 0.0% |
| Arts & Humanities | 0 | 0.0% |
| Total | 0 | 0.0% |
Transportation & Commute in Force
Vehicle Availability by Sex in Force
The most prevalent vehicle ownership categories in Force are males with 2 vehicles (30, accounting for 63.8%) and females with 2 vehicles (27, making up 45.5%).
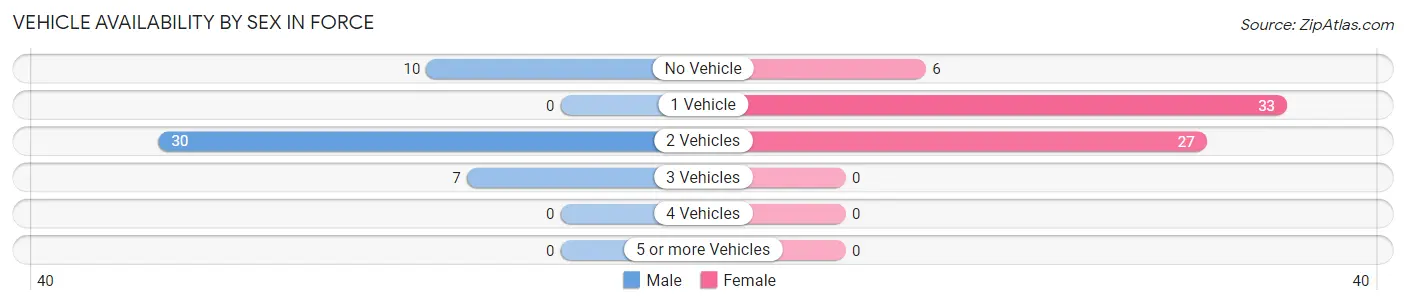
| Vehicles Available | Male | Female |
| No Vehicle | 10 (21.3%) | 6 (9.1%) |
| 1 Vehicle | 0 (0.0%) | 33 (50.0%) |
| 2 Vehicles | 30 (63.8%) | 27 (40.9%) |
| 3 Vehicles | 7 (14.9%) | 0 (0.0%) |
| 4 Vehicles | 0 (0.0%) | 0 (0.0%) |
| 5 or more Vehicles | 0 (0.0%) | 0 (0.0%) |
| Total | 47 (100.0%) | 66 (100.0%) |
Commute Time in Force
The most frequently occuring commute durations in Force are 20 to 24 minutes (37 commuters, 32.7%), less than 5 minutes (27 commuters, 23.9%), and 25 to 29 minutes (19 commuters, 16.8%).
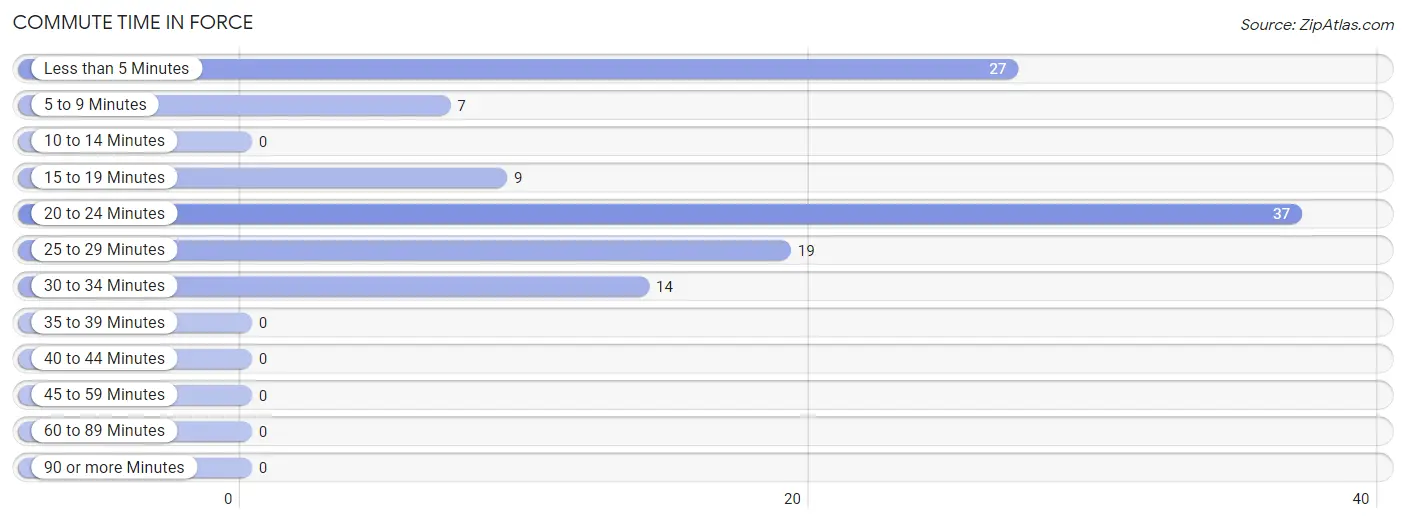
| Commute Time | # Commuters | % Commuters |
| Less than 5 Minutes | 27 | 23.9% |
| 5 to 9 Minutes | 7 | 6.2% |
| 10 to 14 Minutes | 0 | 0.0% |
| 15 to 19 Minutes | 9 | 8.0% |
| 20 to 24 Minutes | 37 | 32.7% |
| 25 to 29 Minutes | 19 | 16.8% |
| 30 to 34 Minutes | 14 | 12.4% |
| 35 to 39 Minutes | 0 | 0.0% |
| 40 to 44 Minutes | 0 | 0.0% |
| 45 to 59 Minutes | 0 | 0.0% |
| 60 to 89 Minutes | 0 | 0.0% |
| 90 or more Minutes | 0 | 0.0% |
Commute Time by Sex in Force
The most common commute times in Force are 20 to 24 minutes (18 commuters, 38.3%) for males and less than 5 minutes (27 commuters, 40.9%) for females.
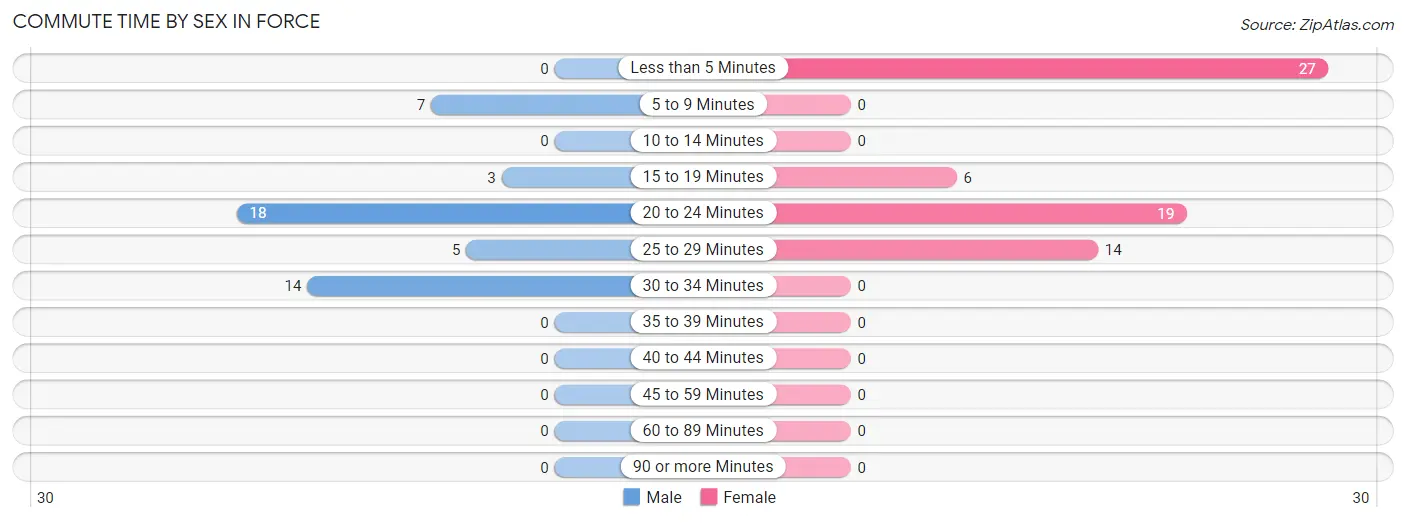
| Commute Time | Male | Female |
| Less than 5 Minutes | 0 (0.0%) | 27 (40.9%) |
| 5 to 9 Minutes | 7 (14.9%) | 0 (0.0%) |
| 10 to 14 Minutes | 0 (0.0%) | 0 (0.0%) |
| 15 to 19 Minutes | 3 (6.4%) | 6 (9.1%) |
| 20 to 24 Minutes | 18 (38.3%) | 19 (28.8%) |
| 25 to 29 Minutes | 5 (10.6%) | 14 (21.2%) |
| 30 to 34 Minutes | 14 (29.8%) | 0 (0.0%) |
| 35 to 39 Minutes | 0 (0.0%) | 0 (0.0%) |
| 40 to 44 Minutes | 0 (0.0%) | 0 (0.0%) |
| 45 to 59 Minutes | 0 (0.0%) | 0 (0.0%) |
| 60 to 89 Minutes | 0 (0.0%) | 0 (0.0%) |
| 90 or more Minutes | 0 (0.0%) | 0 (0.0%) |
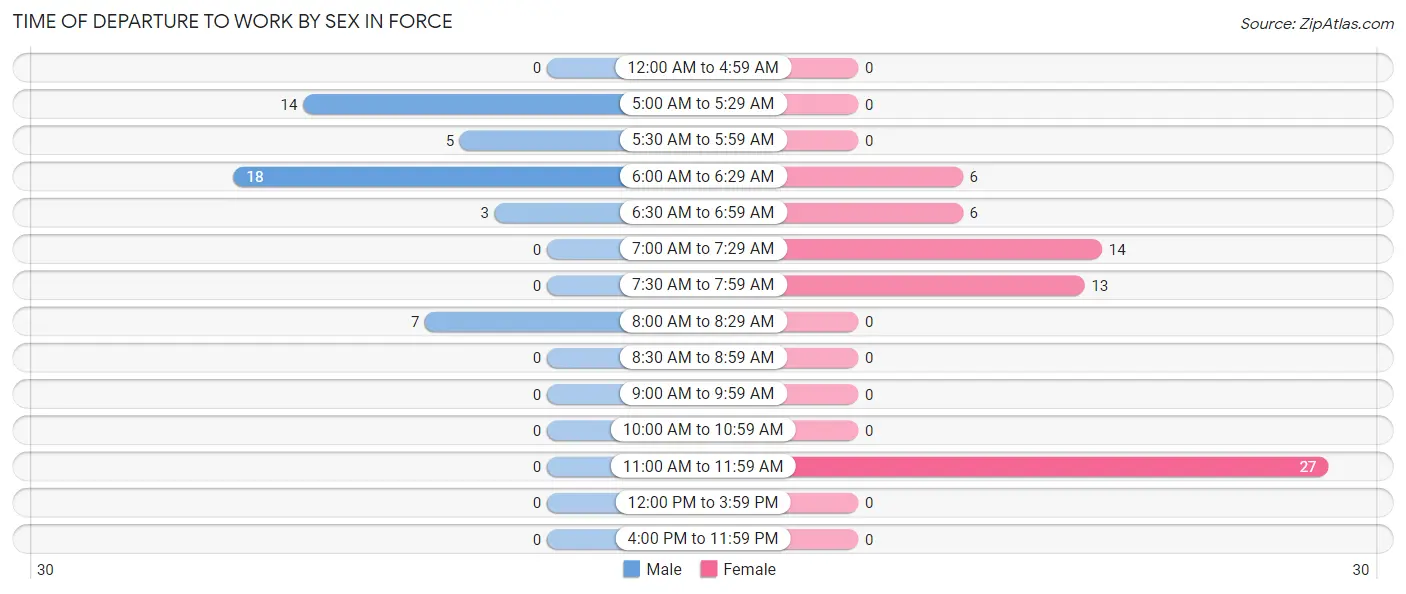
Time of Departure to Work by Sex in Force
The most frequent times of departure to work in Force are 6:00 AM to 6:29 AM (18, 38.3%) for males and 11:00 AM to 11:59 AM (27, 40.9%) for females.
| Time of Departure | Male | Female |
| 12:00 AM to 4:59 AM | 0 (0.0%) | 0 (0.0%) |
| 5:00 AM to 5:29 AM | 14 (29.8%) | 0 (0.0%) |
| 5:30 AM to 5:59 AM | 5 (10.6%) | 0 (0.0%) |
| 6:00 AM to 6:29 AM | 18 (38.3%) | 6 (9.1%) |
| 6:30 AM to 6:59 AM | 3 (6.4%) | 6 (9.1%) |
| 7:00 AM to 7:29 AM | 0 (0.0%) | 14 (21.2%) |
| 7:30 AM to 7:59 AM | 0 (0.0%) | 13 (19.7%) |
| 8:00 AM to 8:29 AM | 7 (14.9%) | 0 (0.0%) |
| 8:30 AM to 8:59 AM | 0 (0.0%) | 0 (0.0%) |
| 9:00 AM to 9:59 AM | 0 (0.0%) | 0 (0.0%) |
| 10:00 AM to 10:59 AM | 0 (0.0%) | 0 (0.0%) |
| 11:00 AM to 11:59 AM | 0 (0.0%) | 27 (40.9%) |
| 12:00 PM to 3:59 PM | 0 (0.0%) | 0 (0.0%) |
| 4:00 PM to 11:59 PM | 0 (0.0%) | 0 (0.0%) |
| Total | 47 (100.0%) | 66 (100.0%) |
Housing Occupancy in Force
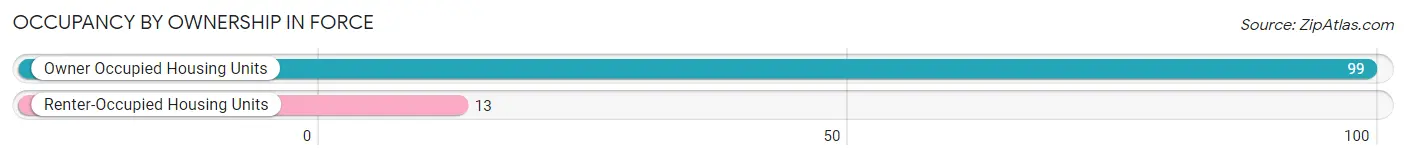
Occupancy by Ownership in Force
Of the total 112 dwellings in Force, owner-occupied units account for 99 (88.4%), while renter-occupied units make up 13 (11.6%).
| Occupancy | # Housing Units | % Housing Units |
| Owner Occupied Housing Units | 99 | 88.4% |
| Renter-Occupied Housing Units | 13 | 11.6% |
| Total Occupied Housing Units | 112 | 100.0% |
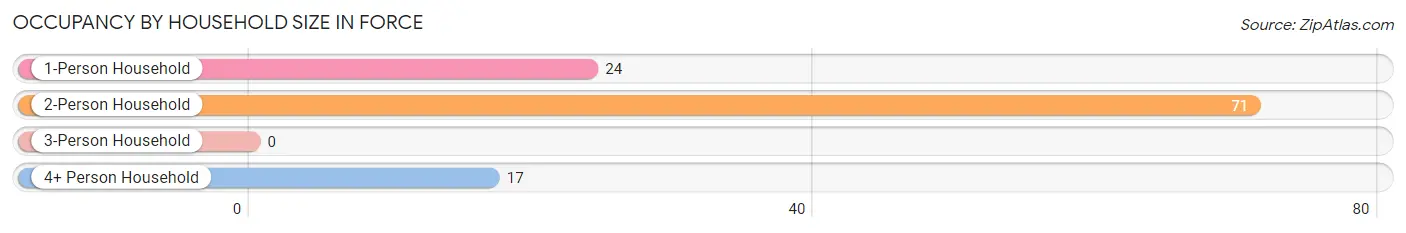
Occupancy by Household Size in Force
| Household Size | # Housing Units | % Housing Units |
| 1-Person Household | 24 | 21.4% |
| 2-Person Household | 71 | 63.4% |
| 3-Person Household | 0 | 0.0% |
| 4+ Person Household | 17 | 15.2% |
| Total Housing Units | 112 | 100.0% |
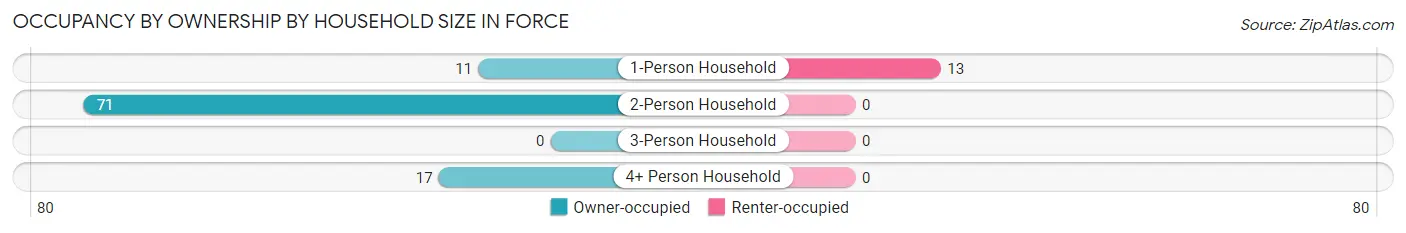
Occupancy by Ownership by Household Size in Force
| Household Size | Owner-occupied | Renter-occupied |
| 1-Person Household | 11 (45.8%) | 13 (54.2%) |
| 2-Person Household | 71 (100.0%) | 0 (0.0%) |
| 3-Person Household | 0 (0.0%) | 0 (0.0%) |
| 4+ Person Household | 17 (100.0%) | 0 (0.0%) |
| Total Housing Units | 99 (88.4%) | 13 (11.6%) |
Occupancy by Educational Attainment in Force
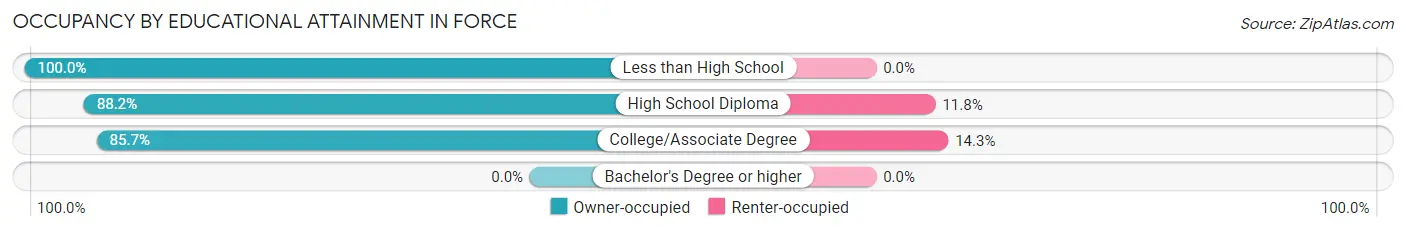
| Household Size | Owner-occupied | Renter-occupied |
| Less than High School | 9 (100.0%) | 0 (0.0%) |
| High School Diploma | 60 (88.2%) | 8 (11.8%) |
| College/Associate Degree | 30 (85.7%) | 5 (14.3%) |
| Bachelor's Degree or higher | 0 (0.0%) | 0 (0.0%) |
Occupancy by Age of Householder in Force
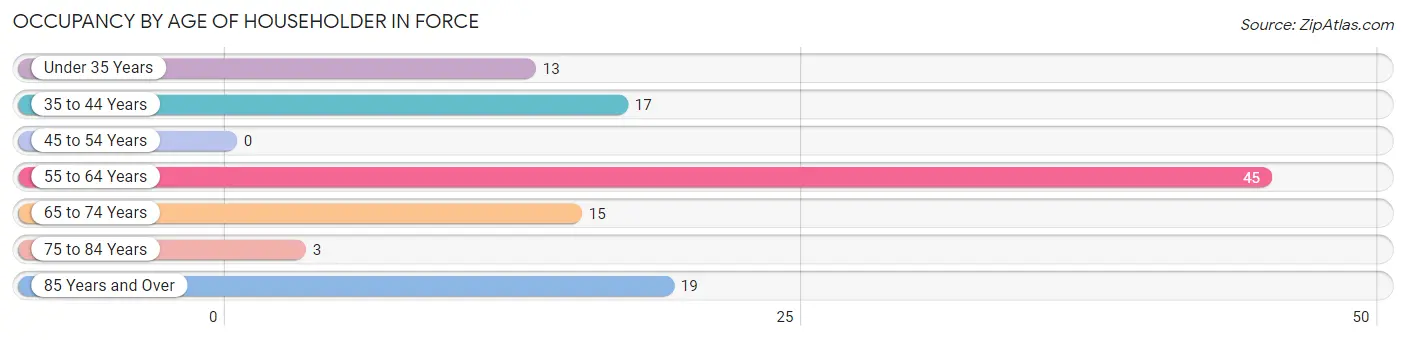
| Age Bracket | # Households | % Households |
| Under 35 Years | 13 | 11.6% |
| 35 to 44 Years | 17 | 15.2% |
| 45 to 54 Years | 0 | 0.0% |
| 55 to 64 Years | 45 | 40.2% |
| 65 to 74 Years | 15 | 13.4% |
| 75 to 84 Years | 3 | 2.7% |
| 85 Years and Over | 19 | 17.0% |
| Total | 112 | 100.0% |
Housing Finances in Force
Median Income by Occupancy in Force
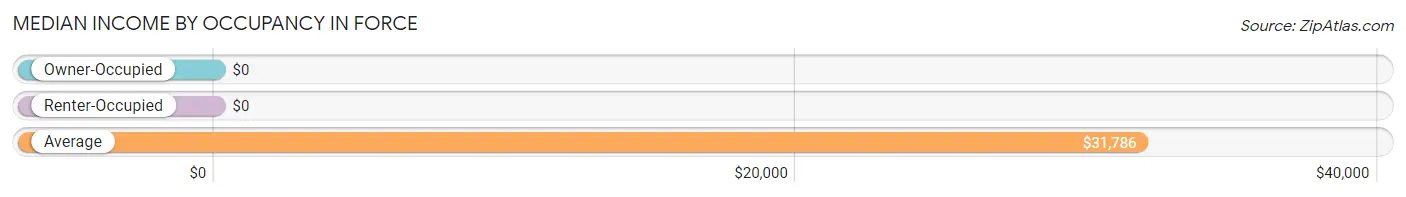
| Occupancy Type | # Households | Median Income |
| Owner-Occupied | 99 (88.4%) | $0 |
| Renter-Occupied | 13 (11.6%) | $0 |
| Average | 112 (100.0%) | $31,786 |
Occupancy by Householder Income Bracket in Force
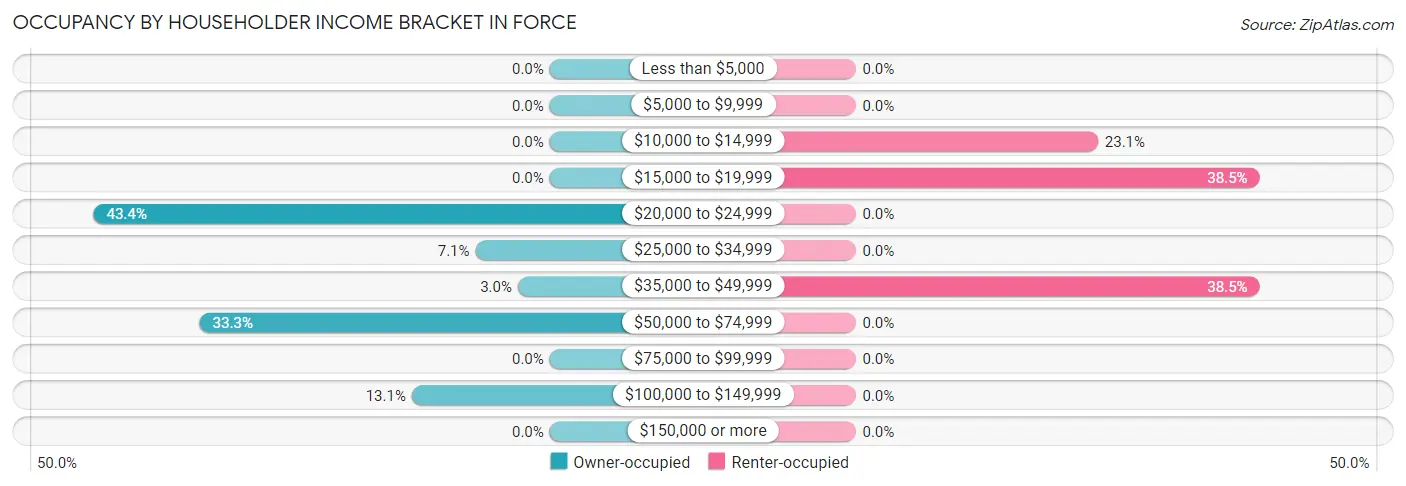
| Income Bracket | Owner-occupied | Renter-occupied |
| Less than $5,000 | 0 (0.0%) | 0 (0.0%) |
| $5,000 to $9,999 | 0 (0.0%) | 0 (0.0%) |
| $10,000 to $14,999 | 0 (0.0%) | 3 (23.1%) |
| $15,000 to $19,999 | 0 (0.0%) | 5 (38.5%) |
| $20,000 to $24,999 | 43 (43.4%) | 0 (0.0%) |
| $25,000 to $34,999 | 7 (7.1%) | 0 (0.0%) |
| $35,000 to $49,999 | 3 (3.0%) | 5 (38.5%) |
| $50,000 to $74,999 | 33 (33.3%) | 0 (0.0%) |
| $75,000 to $99,999 | 0 (0.0%) | 0 (0.0%) |
| $100,000 to $149,999 | 13 (13.1%) | 0 (0.0%) |
| $150,000 or more | 0 (0.0%) | 0 (0.0%) |
| Total | 99 (100.0%) | 13 (100.0%) |
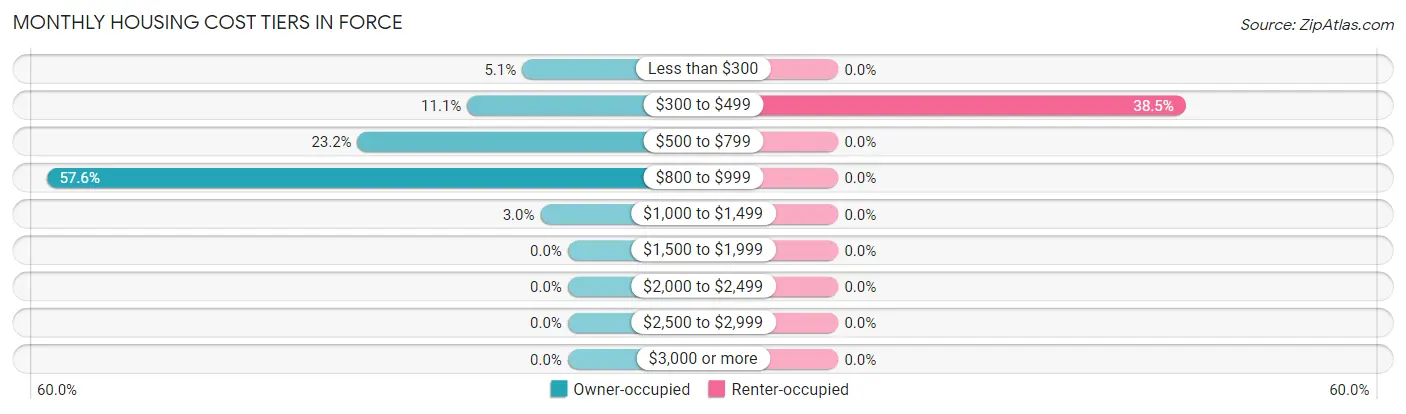
Monthly Housing Cost Tiers in Force
| Monthly Cost | Owner-occupied | Renter-occupied |
| Less than $300 | 5 (5.1%) | 0 (0.0%) |
| $300 to $499 | 11 (11.1%) | 5 (38.5%) |
| $500 to $799 | 23 (23.2%) | 0 (0.0%) |
| $800 to $999 | 57 (57.6%) | 0 (0.0%) |
| $1,000 to $1,499 | 3 (3.0%) | 0 (0.0%) |
| $1,500 to $1,999 | 0 (0.0%) | 0 (0.0%) |
| $2,000 to $2,499 | 0 (0.0%) | 0 (0.0%) |
| $2,500 to $2,999 | 0 (0.0%) | 0 (0.0%) |
| $3,000 or more | 0 (0.0%) | 0 (0.0%) |
| Total | 99 (100.0%) | 13 (100.0%) |
Physical Housing Characteristics in Force
Housing Structures in Force
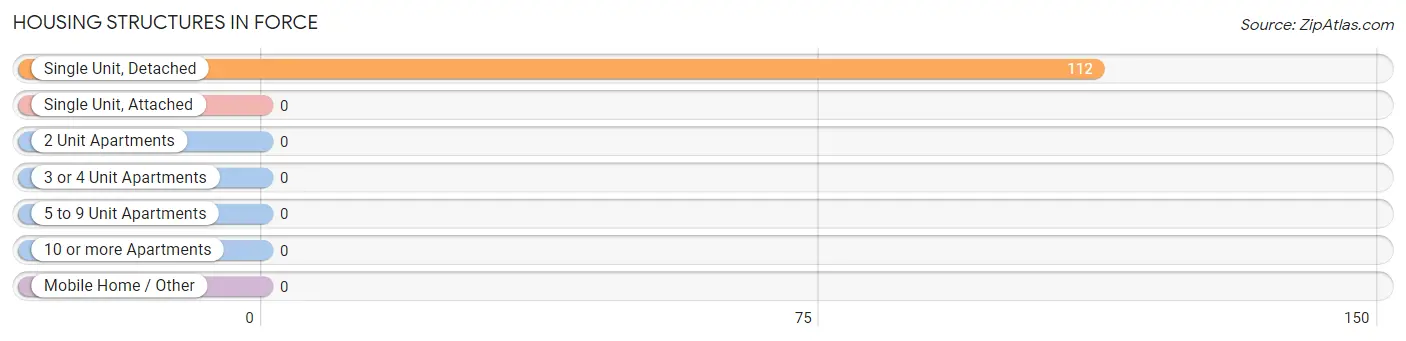
| Structure Type | # Housing Units | % Housing Units |
| Single Unit, Detached | 112 | 100.0% |
| Single Unit, Attached | 0 | 0.0% |
| 2 Unit Apartments | 0 | 0.0% |
| 3 or 4 Unit Apartments | 0 | 0.0% |
| 5 to 9 Unit Apartments | 0 | 0.0% |
| 10 or more Apartments | 0 | 0.0% |
| Mobile Home / Other | 0 | 0.0% |
| Total | 112 | 100.0% |
Housing Structures by Occupancy in Force

| Structure Type | Owner-occupied | Renter-occupied |
| Single Unit, Detached | 99 (88.4%) | 13 (11.6%) |
| Single Unit, Attached | 0 (0.0%) | 0 (0.0%) |
| 2 Unit Apartments | 0 (0.0%) | 0 (0.0%) |
| 3 or 4 Unit Apartments | 0 (0.0%) | 0 (0.0%) |
| 5 to 9 Unit Apartments | 0 (0.0%) | 0 (0.0%) |
| 10 or more Apartments | 0 (0.0%) | 0 (0.0%) |
| Mobile Home / Other | 0 (0.0%) | 0 (0.0%) |
| Total | 99 (88.4%) | 13 (11.6%) |
Housing Structures by Number of Rooms in Force
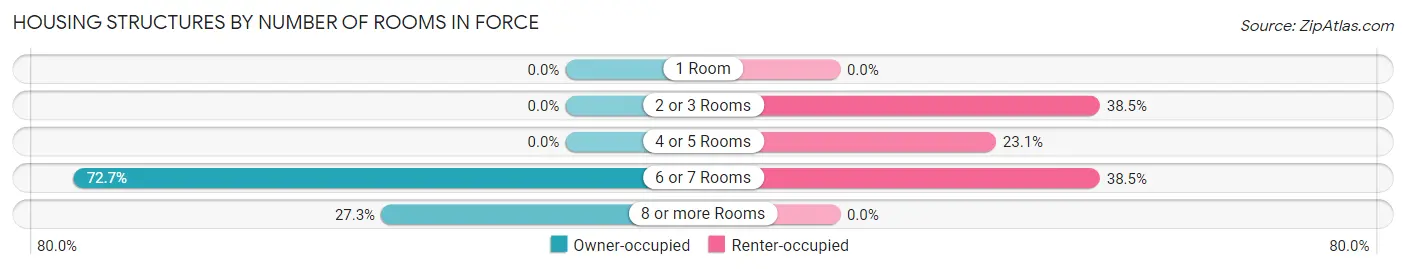
| Number of Rooms | Owner-occupied | Renter-occupied |
| 1 Room | 0 (0.0%) | 0 (0.0%) |
| 2 or 3 Rooms | 0 (0.0%) | 5 (38.5%) |
| 4 or 5 Rooms | 0 (0.0%) | 3 (23.1%) |
| 6 or 7 Rooms | 72 (72.7%) | 5 (38.5%) |
| 8 or more Rooms | 27 (27.3%) | 0 (0.0%) |
| Total | 99 (100.0%) | 13 (100.0%) |
Housing Structure by Heating Type in Force
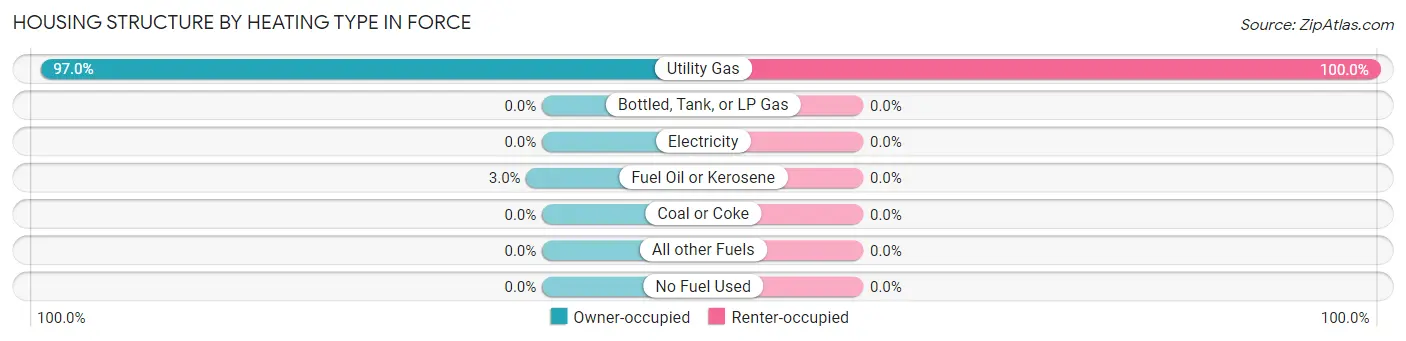
| Heating Type | Owner-occupied | Renter-occupied |
| Utility Gas | 96 (97.0%) | 13 (100.0%) |
| Bottled, Tank, or LP Gas | 0 (0.0%) | 0 (0.0%) |
| Electricity | 0 (0.0%) | 0 (0.0%) |
| Fuel Oil or Kerosene | 3 (3.0%) | 0 (0.0%) |
| Coal or Coke | 0 (0.0%) | 0 (0.0%) |
| All other Fuels | 0 (0.0%) | 0 (0.0%) |
| No Fuel Used | 0 (0.0%) | 0 (0.0%) |
| Total | 99 (100.0%) | 13 (100.0%) |
Household Vehicle Usage in Force
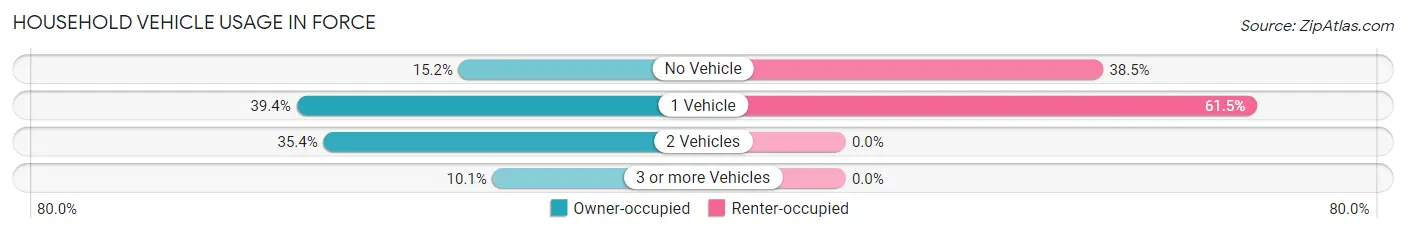
| Vehicles per Household | Owner-occupied | Renter-occupied |
| No Vehicle | 15 (15.1%) | 5 (38.5%) |
| 1 Vehicle | 39 (39.4%) | 8 (61.5%) |
| 2 Vehicles | 35 (35.3%) | 0 (0.0%) |
| 3 or more Vehicles | 10 (10.1%) | 0 (0.0%) |
| Total | 99 (100.0%) | 13 (100.0%) |
Real Estate & Mortgages in Force
Real Estate and Mortgage Overview in Force
| Characteristic | Without Mortgage | With Mortgage |
| Housing Units | 25 | 74 |
| Median Property Value | $41,900 | $52,200 |
| Median Household Income | $42,083 | $0 |
| Monthly Housing Costs | $430 | $0 |
| Real Estate Taxes | $1,221 | $0 |
Property Value by Mortgage Status in Force
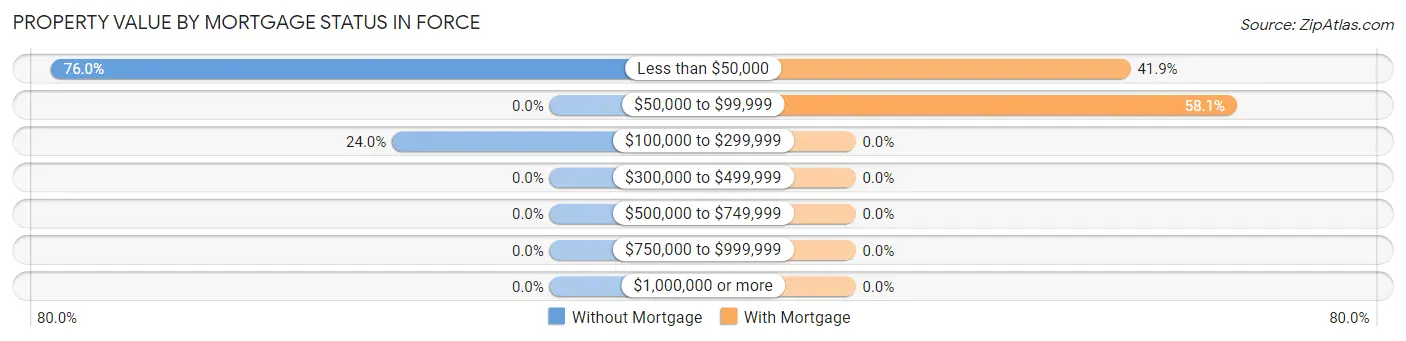
| Property Value | Without Mortgage | With Mortgage |
| Less than $50,000 | 19 (76.0%) | 31 (41.9%) |
| $50,000 to $99,999 | 0 (0.0%) | 43 (58.1%) |
| $100,000 to $299,999 | 6 (24.0%) | 0 (0.0%) |
| $300,000 to $499,999 | 0 (0.0%) | 0 (0.0%) |
| $500,000 to $749,999 | 0 (0.0%) | 0 (0.0%) |
| $750,000 to $999,999 | 0 (0.0%) | 0 (0.0%) |
| $1,000,000 or more | 0 (0.0%) | 0 (0.0%) |
| Total | 25 (100.0%) | 74 (100.0%) |
Household Income by Mortgage Status in Force
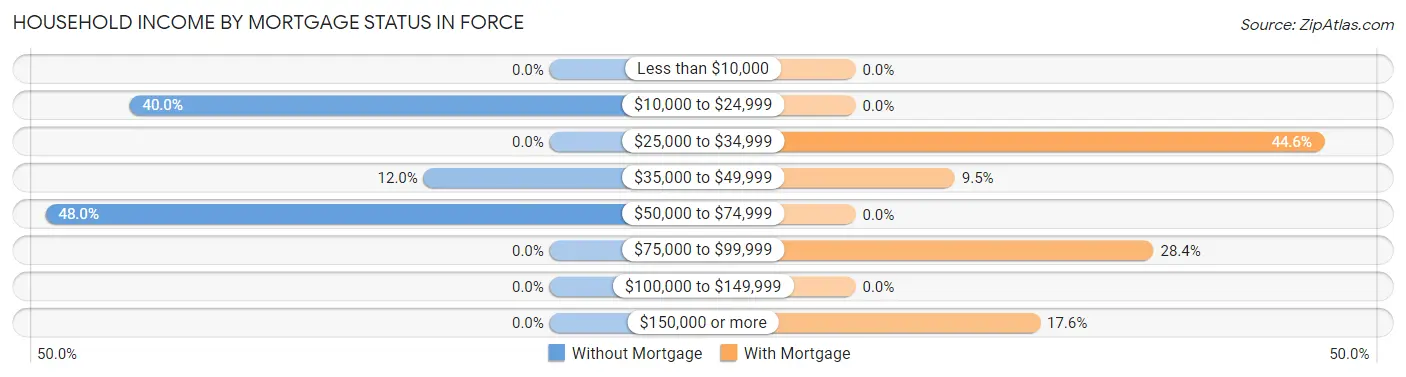
| Household Income | Without Mortgage | With Mortgage |
| Less than $10,000 | 0 (0.0%) | 0 (0.0%) |
| $10,000 to $24,999 | 10 (40.0%) | 0 (0.0%) |
| $25,000 to $34,999 | 0 (0.0%) | 33 (44.6%) |
| $35,000 to $49,999 | 3 (12.0%) | 7 (9.5%) |
| $50,000 to $74,999 | 12 (48.0%) | 0 (0.0%) |
| $75,000 to $99,999 | 0 (0.0%) | 21 (28.4%) |
| $100,000 to $149,999 | 0 (0.0%) | 0 (0.0%) |
| $150,000 or more | 0 (0.0%) | 13 (17.6%) |
| Total | 25 (100.0%) | 74 (100.0%) |
Property Value to Household Income Ratio in Force
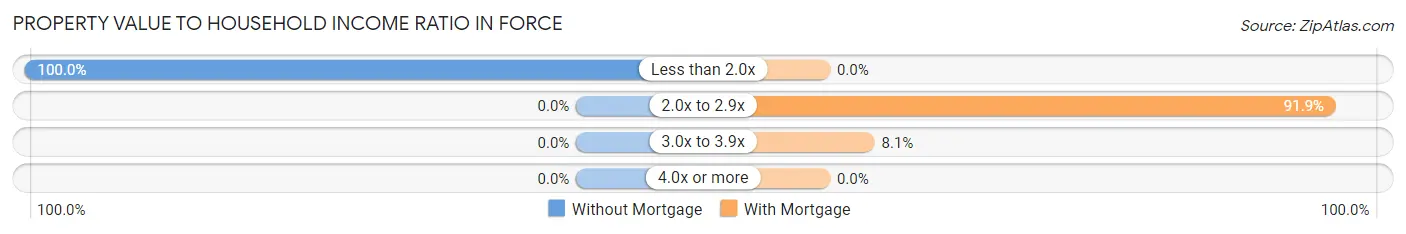
| Value-to-Income Ratio | Without Mortgage | With Mortgage |
| Less than 2.0x | 25 (100.0%) | 0 (0.0%) |
| 2.0x to 2.9x | 0 (0.0%) | 68 (91.9%) |
| 3.0x to 3.9x | 0 (0.0%) | 6 (8.1%) |
| 4.0x or more | 0 (0.0%) | 0 (0.0%) |
| Total | 25 (100.0%) | 74 (100.0%) |
Real Estate Taxes by Mortgage Status in Force
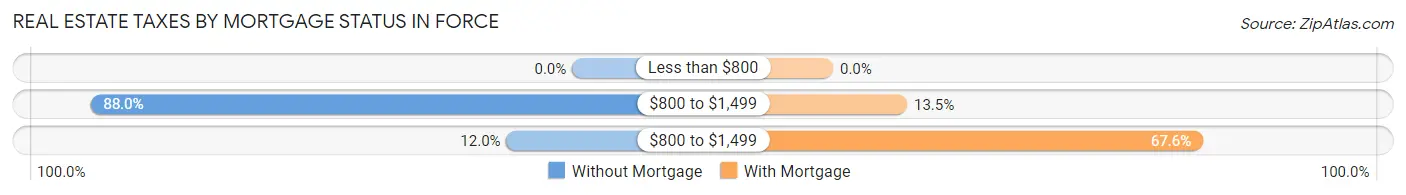
| Property Taxes | Without Mortgage | With Mortgage |
| Less than $800 | 0 (0.0%) | 0 (0.0%) |
| $800 to $1,499 | 22 (88.0%) | 10 (13.5%) |
| $800 to $1,499 | 3 (12.0%) | 50 (67.6%) |
| Total | 25 (100.0%) | 74 (100.0%) |
Health & Disability in Force
Health Insurance Coverage by Age in Force
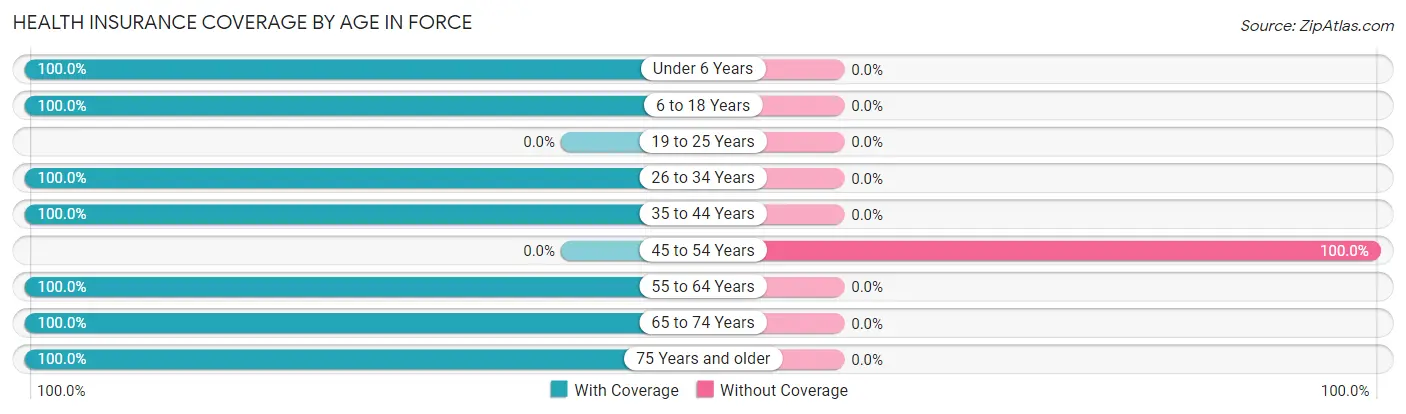
| Age Bracket | With Coverage | Without Coverage |
| Under 6 Years | 44 (100.0%) | 0 (0.0%) |
| 6 to 18 Years | 58 (100.0%) | 0 (0.0%) |
| 19 to 25 Years | 0 (0.0%) | 0 (0.0%) |
| 26 to 34 Years | 26 (100.0%) | 0 (0.0%) |
| 35 to 44 Years | 34 (100.0%) | 0 (0.0%) |
| 45 to 54 Years | 0 (0.0%) | 5 (100.0%) |
| 55 to 64 Years | 56 (100.0%) | 0 (0.0%) |
| 65 to 74 Years | 24 (100.0%) | 0 (0.0%) |
| 75 Years and older | 22 (100.0%) | 0 (0.0%) |
| Total | 264 (98.1%) | 5 (1.9%) |
Health Insurance Coverage by Citizenship Status in Force
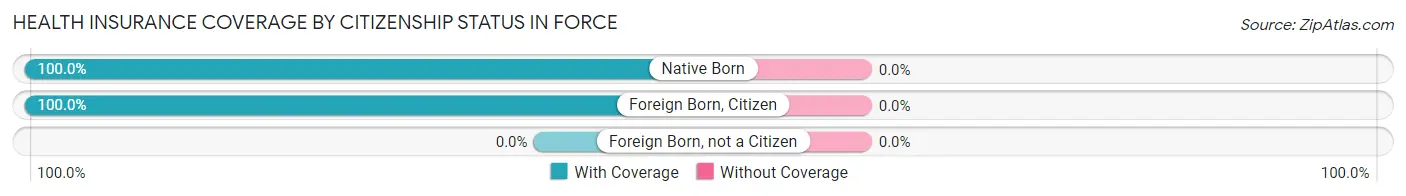
| Citizenship Status | With Coverage | Without Coverage |
| Native Born | 44 (100.0%) | 0 (0.0%) |
| Foreign Born, Citizen | 58 (100.0%) | 0 (0.0%) |
| Foreign Born, not a Citizen | 0 (0.0%) | 0 (0.0%) |
Health Insurance Coverage by Household Income in Force
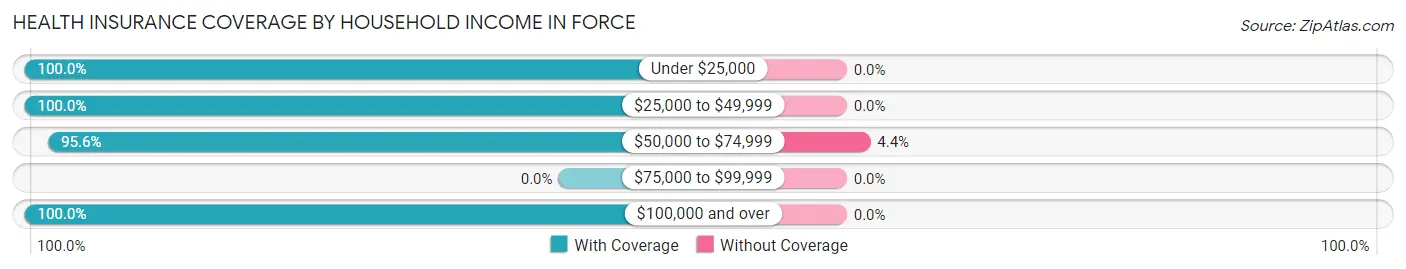
| Household Income | With Coverage | Without Coverage |
| Under $25,000 | 101 (100.0%) | 0 (0.0%) |
| $25,000 to $49,999 | 29 (100.0%) | 0 (0.0%) |
| $50,000 to $74,999 | 108 (95.6%) | 5 (4.4%) |
| $75,000 to $99,999 | 0 (0.0%) | 0 (0.0%) |
| $100,000 and over | 26 (100.0%) | 0 (0.0%) |
Public vs Private Health Insurance Coverage by Age in Force
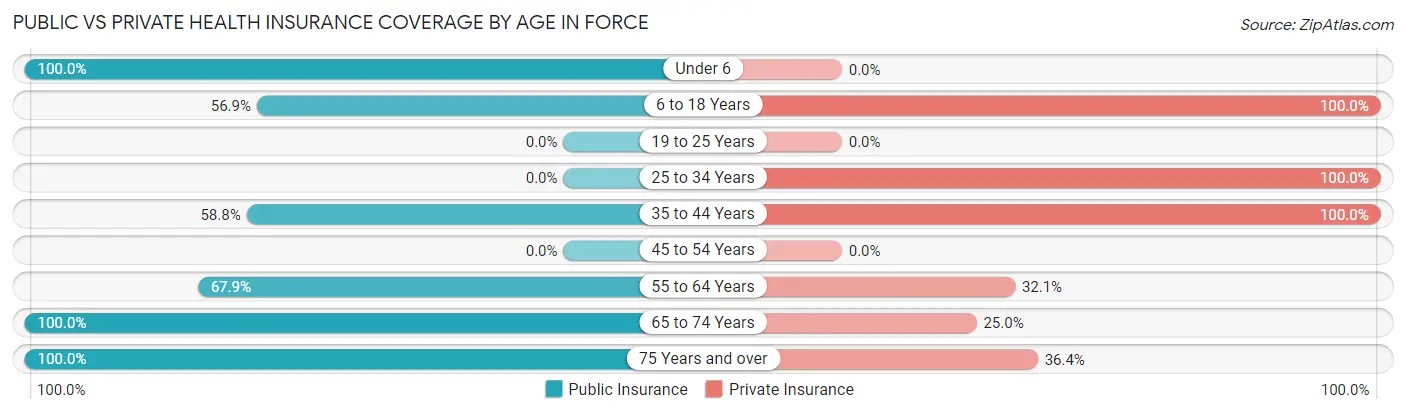
| Age Bracket | Public Insurance | Private Insurance |
| Under 6 | 44 (100.0%) | 0 (0.0%) |
| 6 to 18 Years | 33 (56.9%) | 58 (100.0%) |
| 19 to 25 Years | 0 (0.0%) | 0 (0.0%) |
| 25 to 34 Years | 0 (0.0%) | 26 (100.0%) |
| 35 to 44 Years | 20 (58.8%) | 34 (100.0%) |
| 45 to 54 Years | 0 (0.0%) | 0 (0.0%) |
| 55 to 64 Years | 38 (67.9%) | 18 (32.1%) |
| 65 to 74 Years | 24 (100.0%) | 6 (25.0%) |
| 75 Years and over | 22 (100.0%) | 8 (36.4%) |
| Total | 181 (67.3%) | 150 (55.8%) |
Disability Status by Sex by Age in Force
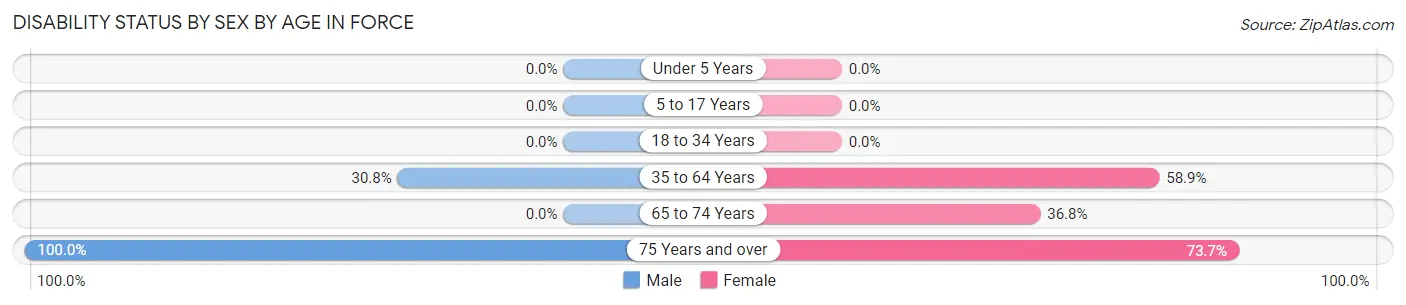
| Age Bracket | Male | Female |
| Under 5 Years | 0 (0.0%) | 0 (0.0%) |
| 5 to 17 Years | 0 (0.0%) | 0 (0.0%) |
| 18 to 34 Years | 0 (0.0%) | 0 (0.0%) |
| 35 to 64 Years | 12 (30.8%) | 33 (58.9%) |
| 65 to 74 Years | 0 (0.0%) | 7 (36.8%) |
| 75 Years and over | 3 (100.0%) | 14 (73.7%) |
Disability Class by Sex by Age in Force
Disability Class: Hearing Difficulty
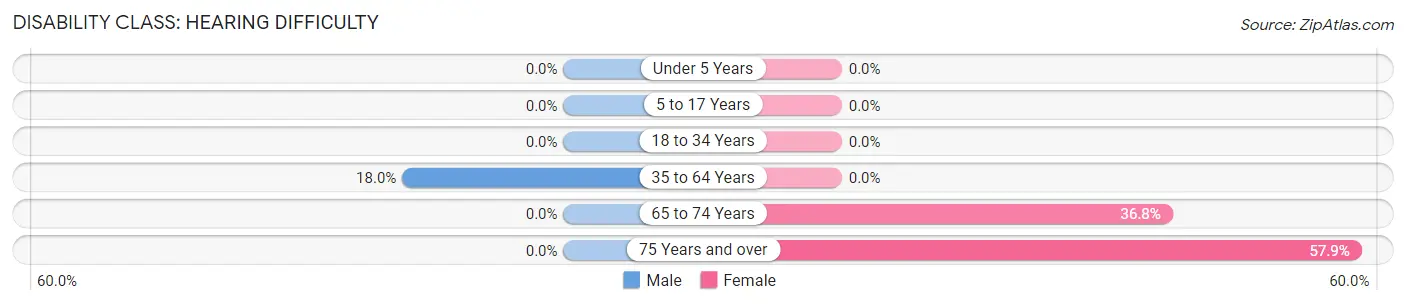
| Age Bracket | Male | Female |
| Under 5 Years | 0 (0.0%) | 0 (0.0%) |
| 5 to 17 Years | 0 (0.0%) | 0 (0.0%) |
| 18 to 34 Years | 0 (0.0%) | 0 (0.0%) |
| 35 to 64 Years | 7 (17.9%) | 0 (0.0%) |
| 65 to 74 Years | 0 (0.0%) | 7 (36.8%) |
| 75 Years and over | 0 (0.0%) | 11 (57.9%) |
Disability Class: Vision Difficulty
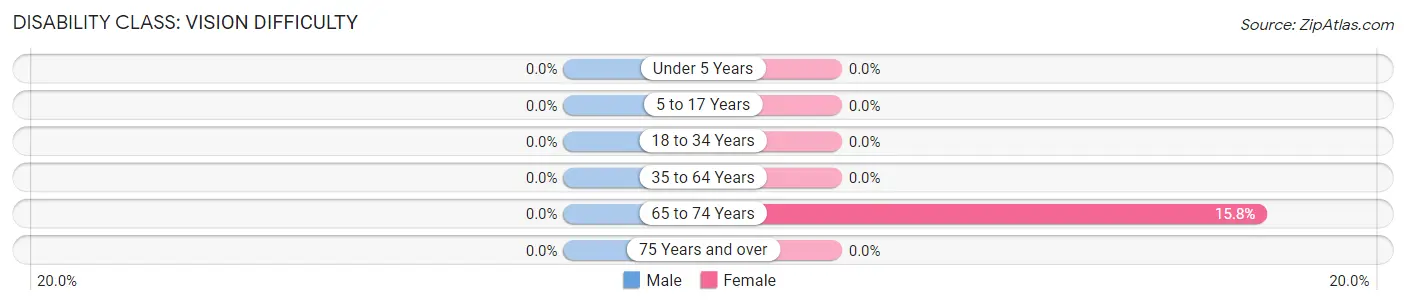
| Age Bracket | Male | Female |
| Under 5 Years | 0 (0.0%) | 0 (0.0%) |
| 5 to 17 Years | 0 (0.0%) | 0 (0.0%) |
| 18 to 34 Years | 0 (0.0%) | 0 (0.0%) |
| 35 to 64 Years | 0 (0.0%) | 0 (0.0%) |
| 65 to 74 Years | 0 (0.0%) | 3 (15.8%) |
| 75 Years and over | 0 (0.0%) | 0 (0.0%) |
Disability Class: Cognitive Difficulty
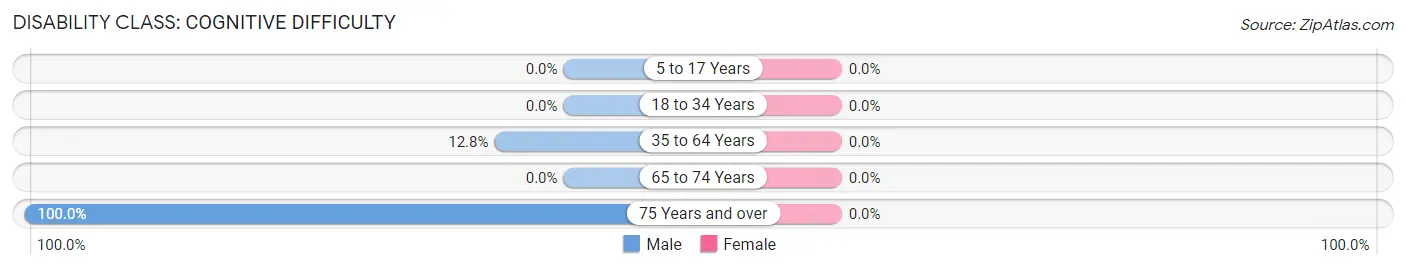
| Age Bracket | Male | Female |
| 5 to 17 Years | 0 (0.0%) | 0 (0.0%) |
| 18 to 34 Years | 0 (0.0%) | 0 (0.0%) |
| 35 to 64 Years | 5 (12.8%) | 0 (0.0%) |
| 65 to 74 Years | 0 (0.0%) | 0 (0.0%) |
| 75 Years and over | 3 (100.0%) | 0 (0.0%) |
Disability Class: Ambulatory Difficulty
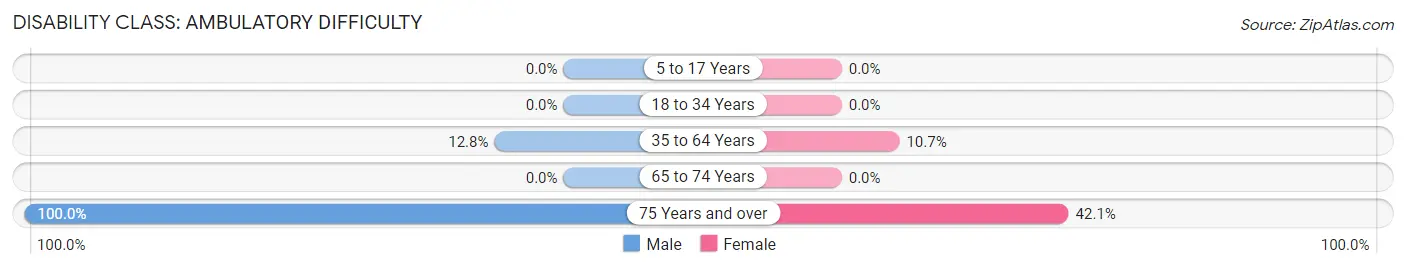
| Age Bracket | Male | Female |
| 5 to 17 Years | 0 (0.0%) | 0 (0.0%) |
| 18 to 34 Years | 0 (0.0%) | 0 (0.0%) |
| 35 to 64 Years | 5 (12.8%) | 6 (10.7%) |
| 65 to 74 Years | 0 (0.0%) | 0 (0.0%) |
| 75 Years and over | 3 (100.0%) | 8 (42.1%) |
Disability Class: Self-Care Difficulty
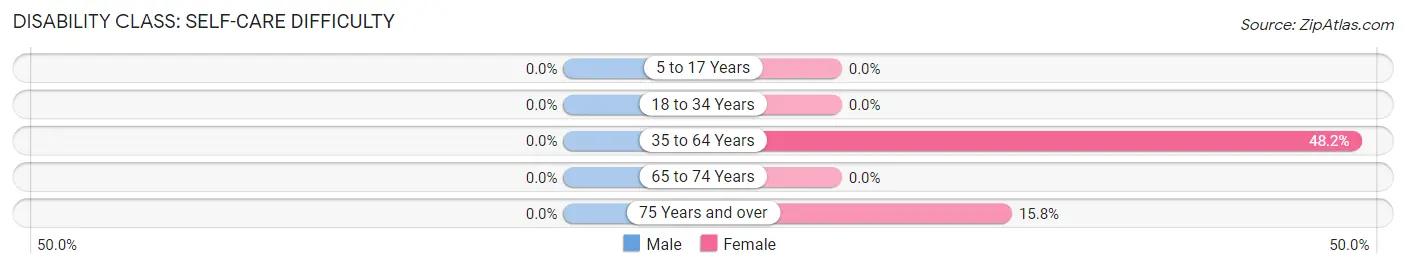
| Age Bracket | Male | Female |
| 5 to 17 Years | 0 (0.0%) | 0 (0.0%) |
| 18 to 34 Years | 0 (0.0%) | 0 (0.0%) |
| 35 to 64 Years | 0 (0.0%) | 27 (48.2%) |
| 65 to 74 Years | 0 (0.0%) | 0 (0.0%) |
| 75 Years and over | 0 (0.0%) | 3 (15.8%) |
Technology Access in Force
Computing Device Access in Force
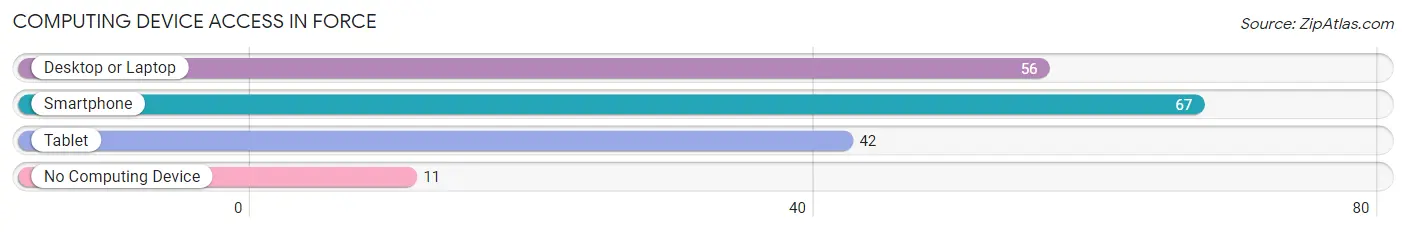
| Device Type | # Households | % Households |
| Desktop or Laptop | 56 | 50.0% |
| Smartphone | 67 | 59.8% |
| Tablet | 42 | 37.5% |
| No Computing Device | 11 | 9.8% |
| Total | 112 | 100.0% |
Internet Access in Force
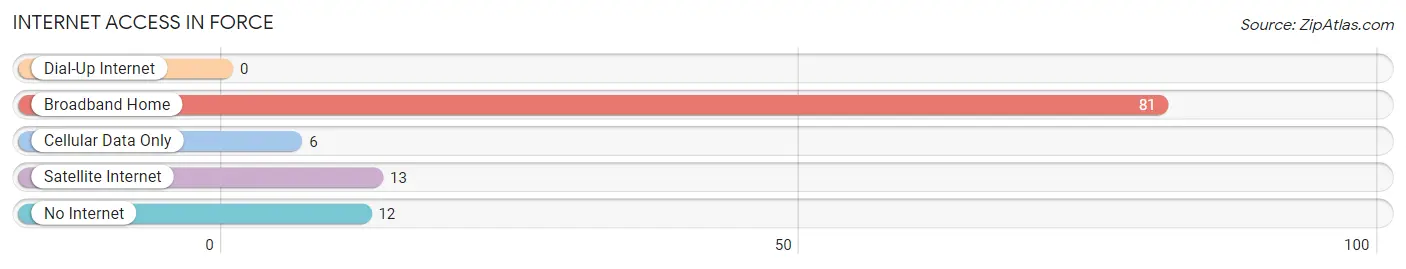
| Internet Type | # Households | % Households |
| Dial-Up Internet | 0 | 0.0% |
| Broadband Home | 81 | 72.3% |
| Cellular Data Only | 6 | 5.4% |
| Satellite Internet | 13 | 11.6% |
| No Internet | 12 | 10.7% |
| Total | 112 | 100.0% |
Force Summary
Pennsylvania, located in the Northeastern United States, is the 33rd most populous state in the country and the 6th most populous state in the Northeast. It is bordered by New York, New Jersey, Delaware, Maryland, West Virginia, and Ohio. Pennsylvania is known for its rich history, diverse geography, and vibrant economy.
History
Pennsylvania was founded in 1681 by William Penn, a Quaker, who was granted a charter by King Charles II of England. Penn named the colony after his father, Admiral William Penn. The colony was initially populated by Quakers, who were seeking religious freedom. Pennsylvania was one of the original 13 colonies that formed the United States of America.
During the Revolutionary War, Pennsylvania was a major battleground. The Battle of Gettysburg, which was fought in 1863, was one of the most important battles of the war. Pennsylvania was also the site of the signing of the Declaration of Independence in 1776.
Geography
Pennsylvania is located in the Northeastern United States and is bordered by New York, New Jersey, Delaware, Maryland, West Virginia, and Ohio. It is the 33rd largest state in the country and the 6th most populous state in the Northeast.
Pennsylvania is divided into two distinct regions: the Appalachian Mountains in the east and the Great Lakes region in the west. The Appalachian Mountains are home to the Allegheny National Forest, which is the largest national forest in the eastern United States. The Great Lakes region is home to the cities of Pittsburgh and Erie.
Pennsylvania is home to a variety of landscapes, including rolling hills, lush forests, and vast farmlands. The state is also home to numerous rivers, including the Susquehanna, Delaware, and Allegheny.
Economy
Pennsylvania has a diverse economy that is driven by a variety of industries. The state is home to a number of large corporations, including Hershey, PPG Industries, and PNC Financial Services.
The state is also home to a number of major universities, including the University of Pennsylvania, Carnegie Mellon University, and the University of Pittsburgh. These universities are major contributors to the state’s economy, providing jobs and research opportunities.
Pennsylvania is also home to a number of major industries, including manufacturing, energy, and agriculture. The state is home to a number of large manufacturing companies, including Boeing, General Electric, and Siemens. The energy industry is also a major contributor to the state’s economy, with a number of large oil and gas companies operating in the state.
Demographics
As of 2020, Pennsylvania had an estimated population of 12.8 million people. The state is home to a diverse population, with the largest ethnic groups being White (77.2%), Black or African American (11.2%), and Hispanic or Latino (7.2%).
Pennsylvania is also home to a large number of immigrants, with the largest groups being from India, China, and Mexico. The state is also home to a large number of religious groups, with the largest being Christian (77.2%), followed by Jewish (2.2%), Muslim (1.2%), and Buddhist (0.7%).
Conclusion
Pennsylvania is a state with a rich history, diverse geography, and vibrant economy. It is home to a diverse population and is a major contributor to the United States economy. The state is home to a number of large corporations, universities, and industries, and is a major player in the energy and manufacturing sectors. Pennsylvania is a great place to live, work, and visit.
Common Questions
What is Per Capita Income in Force?
Per Capita income in Force is $19,875.
What is the Median Family Income in Force?
Median Family Income in Force is $50,250.
What is the Median Household income in Force?
Median Household Income in Force is $31,786.
What is Income or Wage Gap in Force?
Income or Wage Gap in Force is 54.6%.
Women in Force earn 45.4 cents for every dollar earned by a man.
What is Inequality or Gini Index in Force?
Inequality or Gini Index in Force is 0.34.
What is the Total Population of Force?
Total Population of Force is 269.
What is the Total Male Population of Force?
Total Male Population of Force is 91.
What is the Total Female Population of Force?
Total Female Population of Force is 178.
What is the Ratio of Males per 100 Females in Force?
There are 51.12 Males per 100 Females in Force.
What is the Ratio of Females per 100 Males in Force?
There are 195.60 Females per 100 Males in Force.
What is the Median Population Age in Force?
Median Population Age in Force is 38.5 Years.
What is the Average Family Size in Force
Average Family Size in Force is 2.4 People.
What is the Average Household Size in Force
Average Household Size in Force is 2.4 People.
How Large is the Labor Force in Force?
There are 113 People in the Labor Forcein in Force.
What is the Percentage of People in the Labor Force in Force?
61.7% of People are in the Labor Force in Force.