Silkworth, PA Map & Demographics
Silkworth Map
Silkworth Overview
$41,176
PER CAPITA INCOME
$65,673
AVG FAMILY INCOME
$49,028
AVG HOUSEHOLD INCOME
43.0%
WAGE / INCOME GAP [ % ]
57.0¢/ $1
WAGE / INCOME GAP [ $ ]
0.46
INEQUALITY / GINI INDEX
496
TOTAL POPULATION
205
MALE POPULATION
291
FEMALE POPULATION
70.45
MALES / 100 FEMALES
141.95
FEMALES / 100 MALES
60.4
MEDIAN AGE
2.2
AVG FAMILY SIZE
1.8
AVG HOUSEHOLD SIZE
218
LABOR FORCE [ PEOPLE ]
44.7%
PERCENT IN LABOR FORCE
6.9%
UNEMPLOYMENT RATE
Income in Silkworth
Income Overview in Silkworth
Per Capita Income in Silkworth is $41,176, while median incomes of families and households are $65,673 and $49,028 respectively.
| Characteristic | Number | Measure |
| Per Capita Income | 496 | $41,176 |
| Median Family Income | 152 | $65,673 |
| Mean Family Income | 152 | $74,451 |
| Median Household Income | 279 | $49,028 |
| Mean Household Income | 279 | $73,209 |
| Income Deficit | 152 | $0 |
| Wage / Income Gap (%) | 496 | 43.02% |
| Wage / Income Gap ($) | 496 | 56.98¢ per $1 |
| Gini / Inequality Index | 496 | 0.46 |
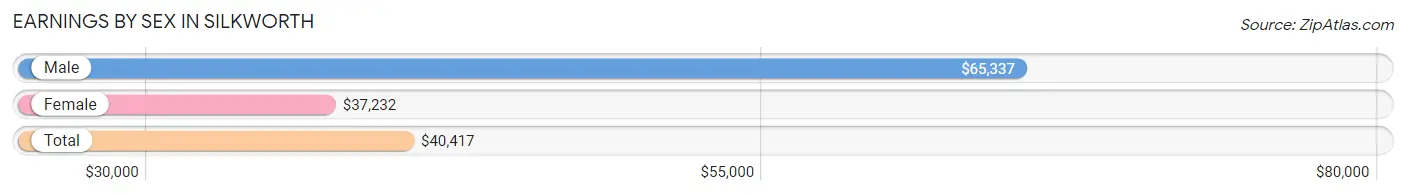
Earnings by Sex in Silkworth
Average Earnings in Silkworth are $40,417, $65,337 for men and $37,232 for women, a difference of 43.0%.
| Sex | Number | Average Earnings |
| Male | 73 (35.8%) | $65,337 |
| Female | 131 (64.2%) | $37,232 |
| Total | 204 (100.0%) | $40,417 |
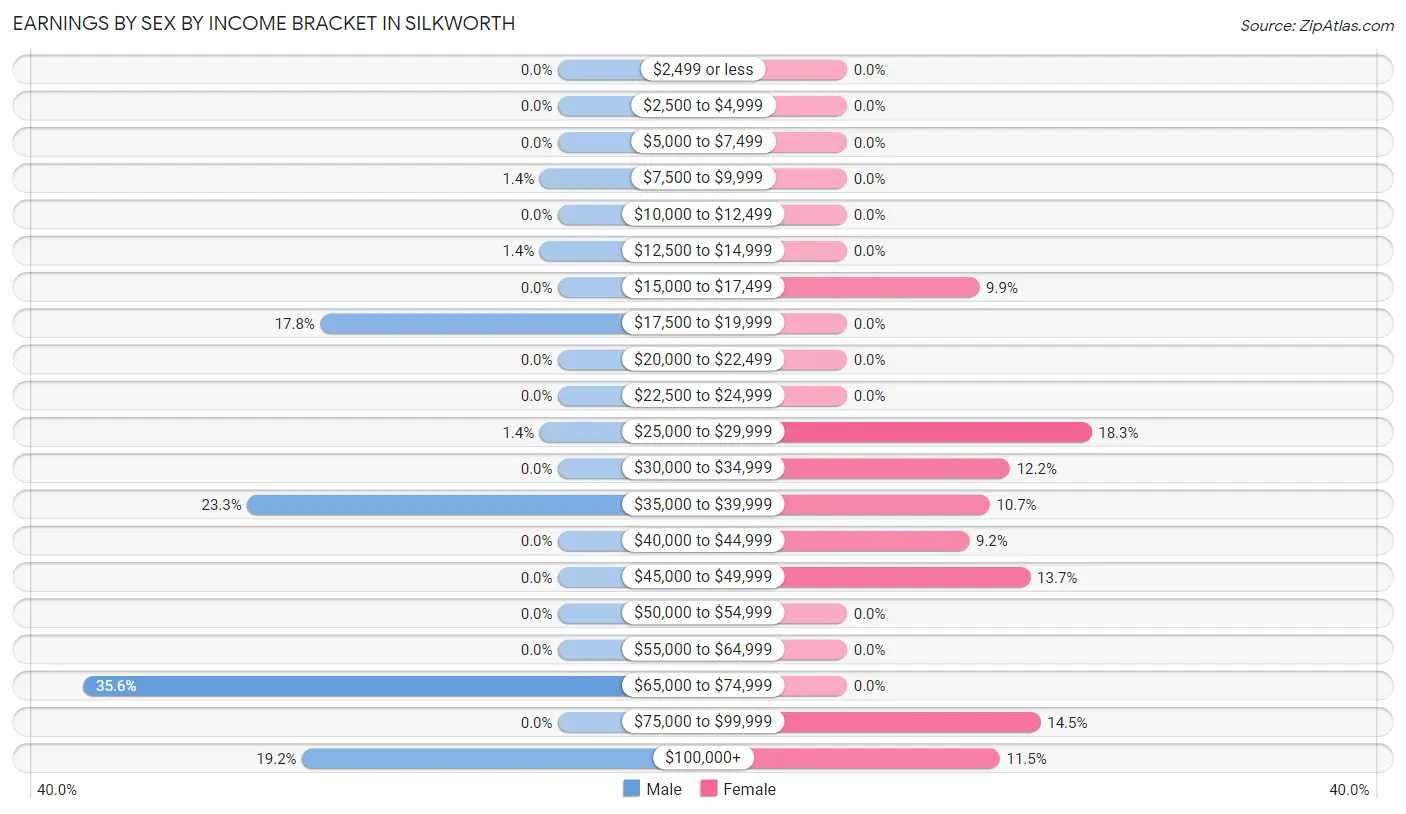
Earnings by Sex by Income Bracket in Silkworth
The most common earnings brackets in Silkworth are $65,000 to $74,999 for men (26 | 35.6%) and $25,000 to $29,999 for women (24 | 18.3%).
| Income | Male | Female |
| $2,499 or less | 0 (0.0%) | 0 (0.0%) |
| $2,500 to $4,999 | 0 (0.0%) | 0 (0.0%) |
| $5,000 to $7,499 | 0 (0.0%) | 0 (0.0%) |
| $7,500 to $9,999 | 1 (1.4%) | 0 (0.0%) |
| $10,000 to $12,499 | 0 (0.0%) | 0 (0.0%) |
| $12,500 to $14,999 | 1 (1.4%) | 0 (0.0%) |
| $15,000 to $17,499 | 0 (0.0%) | 13 (9.9%) |
| $17,500 to $19,999 | 13 (17.8%) | 0 (0.0%) |
| $20,000 to $22,499 | 0 (0.0%) | 0 (0.0%) |
| $22,500 to $24,999 | 0 (0.0%) | 0 (0.0%) |
| $25,000 to $29,999 | 1 (1.4%) | 24 (18.3%) |
| $30,000 to $34,999 | 0 (0.0%) | 16 (12.2%) |
| $35,000 to $39,999 | 17 (23.3%) | 14 (10.7%) |
| $40,000 to $44,999 | 0 (0.0%) | 12 (9.2%) |
| $45,000 to $49,999 | 0 (0.0%) | 18 (13.7%) |
| $50,000 to $54,999 | 0 (0.0%) | 0 (0.0%) |
| $55,000 to $64,999 | 0 (0.0%) | 0 (0.0%) |
| $65,000 to $74,999 | 26 (35.6%) | 0 (0.0%) |
| $75,000 to $99,999 | 0 (0.0%) | 19 (14.5%) |
| $100,000+ | 14 (19.2%) | 15 (11.5%) |
| Total | 73 (100.0%) | 131 (100.0%) |
Earnings by Sex by Educational Attainment in Silkworth
| Educational Attainment | Male Income | Female Income |
| Less than High School | - | - |
| High School Diploma | - | - |
| College or Associate's Degree | - | - |
| Bachelor's Degree | - | - |
| Graduate Degree | - | - |
| Total | $65,385 | $37,232 |
Family Income in Silkworth
Family Income Brackets in Silkworth
According to the Silkworth family income data, there are 40 families falling into the $50,000 to $74,999 income range, which is the most common income bracket and makes up 26.3% of all families.
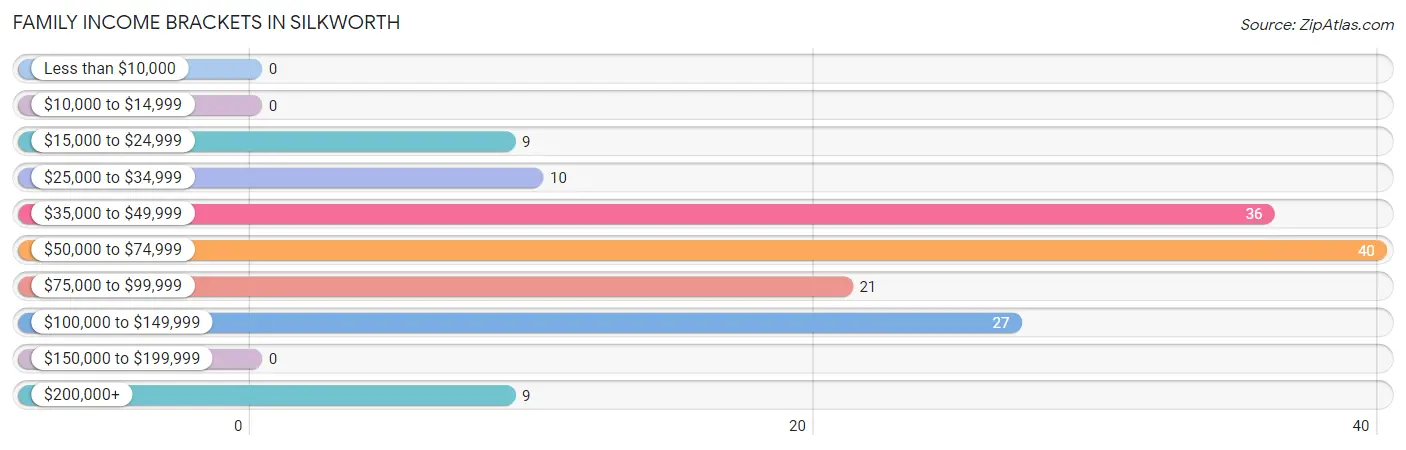
| Income Bracket | # Families | % Families |
| Less than $10,000 | 0 | 0.0% |
| $10,000 to $14,999 | 0 | 0.0% |
| $15,000 to $24,999 | 9 | 5.9% |
| $25,000 to $34,999 | 10 | 6.6% |
| $35,000 to $49,999 | 36 | 23.7% |
| $50,000 to $74,999 | 40 | 26.3% |
| $75,000 to $99,999 | 21 | 13.8% |
| $100,000 to $149,999 | 27 | 17.8% |
| $150,000 to $199,999 | 0 | 0.0% |
| $200,000+ | 9 | 5.9% |
Family Income by Famaliy Size in Silkworth
3-person families (39 | 25.7%) account for the highest median family income in Silkworth with $100,859 per family, while 3-person families (39 | 25.7%) have the highest median income of $33,620 per family member.
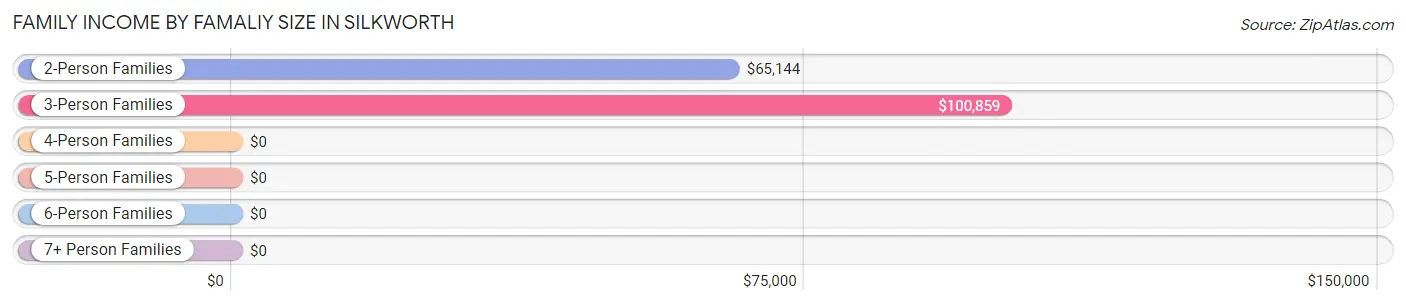
| Income Bracket | # Families | Median Income |
| 2-Person Families | 113 (74.3%) | $65,144 |
| 3-Person Families | 39 (25.7%) | $100,859 |
| 4-Person Families | 0 (0.0%) | $0 |
| 5-Person Families | 0 (0.0%) | $0 |
| 6-Person Families | 0 (0.0%) | $0 |
| 7+ Person Families | 0 (0.0%) | $0 |
| Total | 152 (100.0%) | $65,673 |
Family Income by Number of Earners in Silkworth
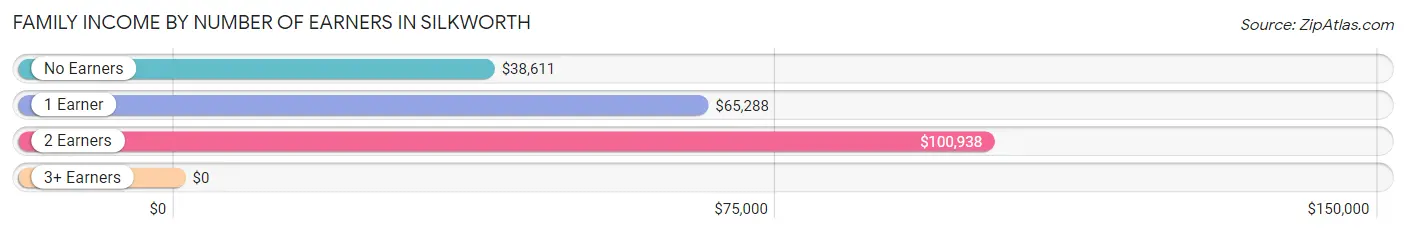
| Number of Earners | # Families | Median Income |
| No Earners | 46 (30.3%) | $38,611 |
| 1 Earner | 68 (44.7%) | $65,288 |
| 2 Earners | 38 (25.0%) | $100,938 |
| 3+ Earners | 0 (0.0%) | $0 |
| Total | 152 (100.0%) | $65,673 |
Household Income in Silkworth
Household Income Brackets in Silkworth
With 57 households falling in the category, the $35,000 to $49,999 income range is the most frequent in Silkworth, accounting for 20.4% of all households.
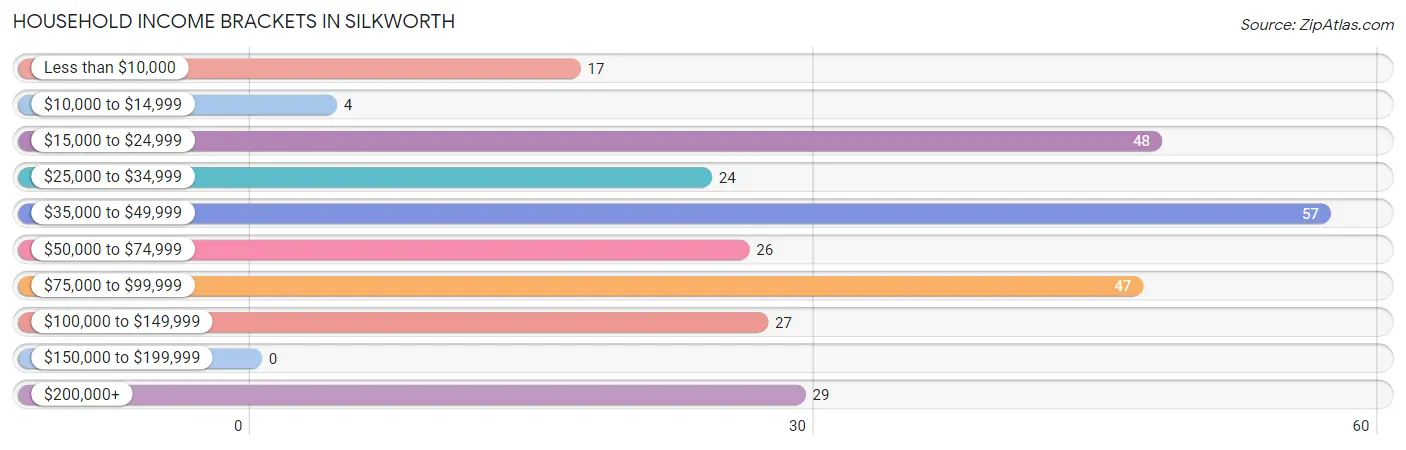
| Income Bracket | # Households | % Households |
| Less than $10,000 | 17 | 6.1% |
| $10,000 to $14,999 | 4 | 1.4% |
| $15,000 to $24,999 | 48 | 17.2% |
| $25,000 to $34,999 | 24 | 8.6% |
| $35,000 to $49,999 | 57 | 20.4% |
| $50,000 to $74,999 | 26 | 9.3% |
| $75,000 to $99,999 | 47 | 16.8% |
| $100,000 to $149,999 | 27 | 9.7% |
| $150,000 to $199,999 | 0 | 0.0% |
| $200,000+ | 29 | 10.4% |
Household Income by Householder Age in Silkworth
The median household income in Silkworth is $49,028, with the highest median household income of $77,981 found in the 45 to 64 years age bracket for the primary householder. A total of 157 households (56.3%) fall into this category.
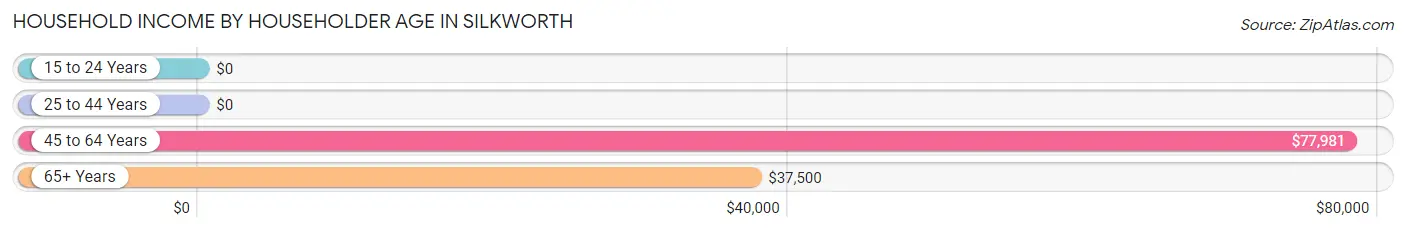
| Income Bracket | # Households | Median Income |
| 15 to 24 Years | 0 (0.0%) | $0 |
| 25 to 44 Years | 14 (5.0%) | $0 |
| 45 to 64 Years | 157 (56.3%) | $77,981 |
| 65+ Years | 108 (38.7%) | $37,500 |
| Total | 279 (100.0%) | $49,028 |
Poverty in Silkworth
Income Below Poverty by Sex and Age in Silkworth
With 5.4% poverty level for males and 4.1% for females among the residents of Silkworth, 18 to 24 year old males and 65 to 74 year old females are the most vulnerable to poverty, with 2 males (100.0%) and 12 females (16.4%) in their respective age groups living below the poverty level.
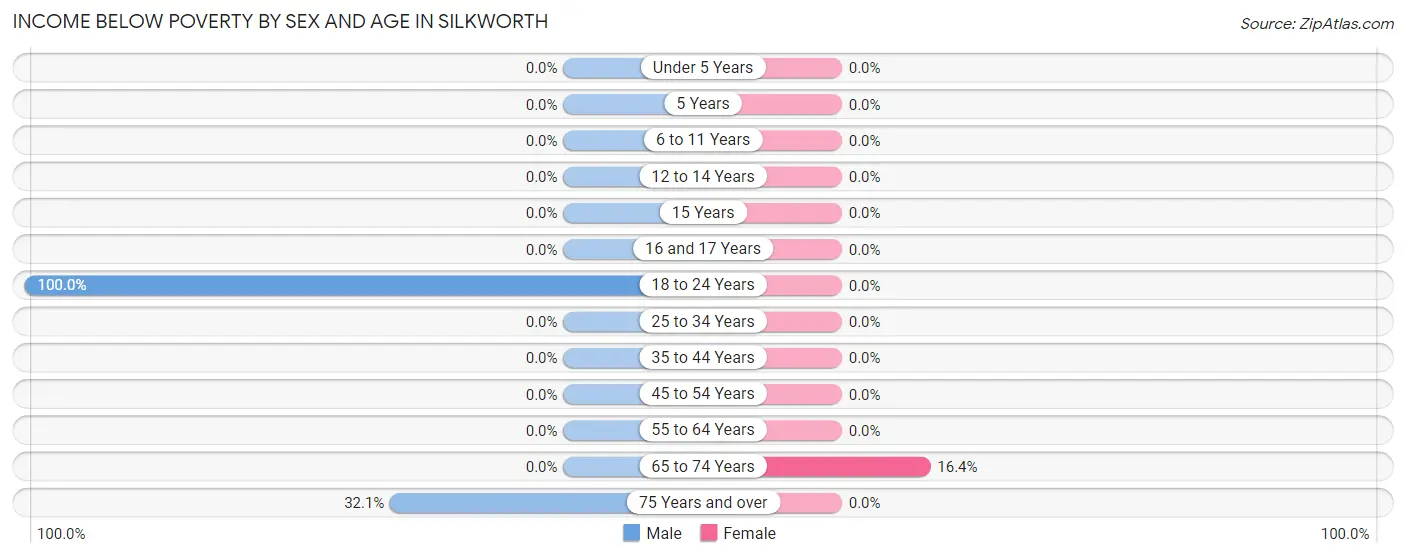
| Age Bracket | Male | Female |
| Under 5 Years | 0 (0.0%) | 0 (0.0%) |
| 5 Years | 0 (0.0%) | 0 (0.0%) |
| 6 to 11 Years | 0 (0.0%) | 0 (0.0%) |
| 12 to 14 Years | 0 (0.0%) | 0 (0.0%) |
| 15 Years | 0 (0.0%) | 0 (0.0%) |
| 16 and 17 Years | 0 (0.0%) | 0 (0.0%) |
| 18 to 24 Years | 2 (100.0%) | 0 (0.0%) |
| 25 to 34 Years | 0 (0.0%) | 0 (0.0%) |
| 35 to 44 Years | 0 (0.0%) | 0 (0.0%) |
| 45 to 54 Years | 0 (0.0%) | 0 (0.0%) |
| 55 to 64 Years | 0 (0.0%) | 0 (0.0%) |
| 65 to 74 Years | 0 (0.0%) | 12 (16.4%) |
| 75 Years and over | 9 (32.1%) | 0 (0.0%) |
| Total | 11 (5.4%) | 12 (4.1%) |
Income Above Poverty by Sex and Age in Silkworth
According to the poverty statistics in Silkworth, males aged under 5 years and females aged 16 and 17 years are the age groups that are most secure financially, with 100.0% of males and 100.0% of females in these age groups living above the poverty line.
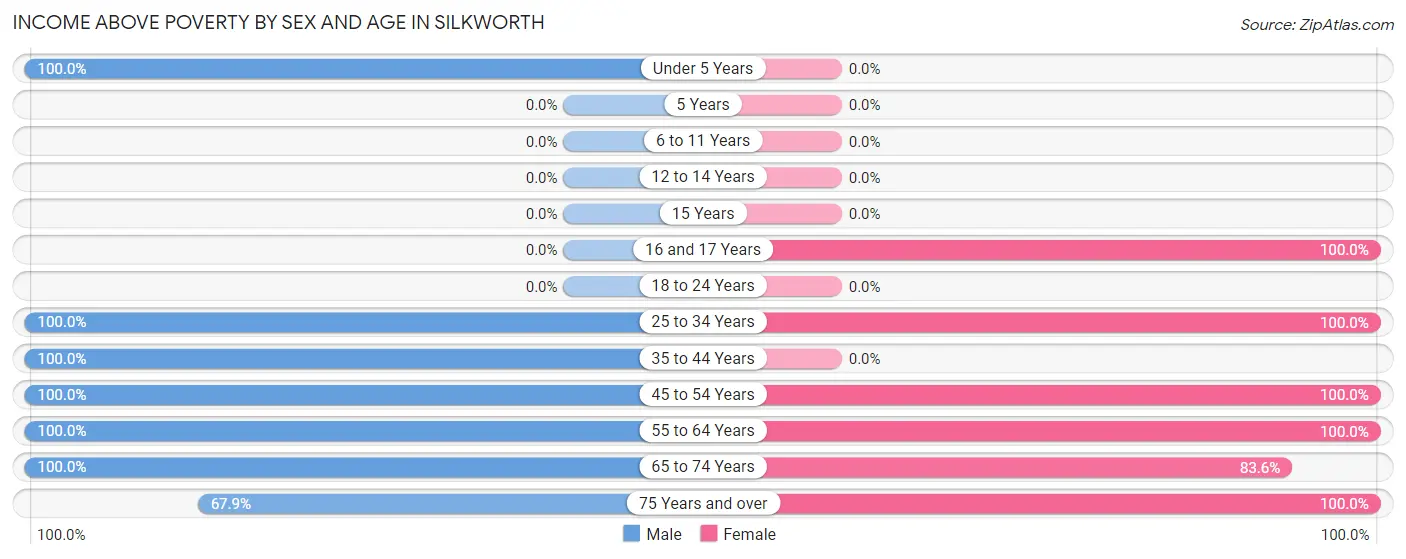
| Age Bracket | Male | Female |
| Under 5 Years | 8 (100.0%) | 0 (0.0%) |
| 5 Years | 0 (0.0%) | 0 (0.0%) |
| 6 to 11 Years | 0 (0.0%) | 0 (0.0%) |
| 12 to 14 Years | 0 (0.0%) | 0 (0.0%) |
| 15 Years | 0 (0.0%) | 0 (0.0%) |
| 16 and 17 Years | 0 (0.0%) | 25 (100.0%) |
| 18 to 24 Years | 0 (0.0%) | 0 (0.0%) |
| 25 to 34 Years | 9 (100.0%) | 26 (100.0%) |
| 35 to 44 Years | 5 (100.0%) | 0 (0.0%) |
| 45 to 54 Years | 42 (100.0%) | 53 (100.0%) |
| 55 to 64 Years | 63 (100.0%) | 95 (100.0%) |
| 65 to 74 Years | 48 (100.0%) | 61 (83.6%) |
| 75 Years and over | 19 (67.9%) | 19 (100.0%) |
| Total | 194 (94.6%) | 279 (95.9%) |
Income Below Poverty Among Married-Couple Families in Silkworth
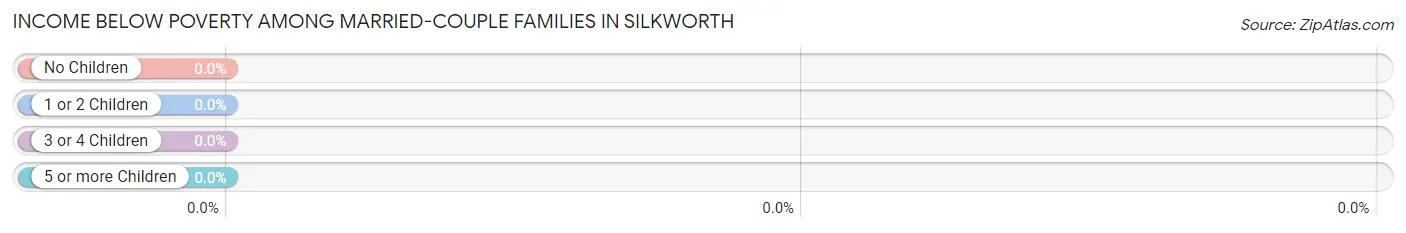
| Children | Above Poverty | Below Poverty |
| No Children | 103 (100.0%) | 0 (0.0%) |
| 1 or 2 Children | 9 (100.0%) | 0 (0.0%) |
| 3 or 4 Children | 0 (0.0%) | 0 (0.0%) |
| 5 or more Children | 0 (0.0%) | 0 (0.0%) |
| Total | 112 (100.0%) | 0 (0.0%) |
Income Below Poverty Among Single-Parent Households in Silkworth
| Children | Single Father | Single Mother |
| No Children | 0 (0.0%) | 0 (0.0%) |
| 1 or 2 Children | 0 (0.0%) | 0 (0.0%) |
| 3 or 4 Children | 0 (0.0%) | 0 (0.0%) |
| 5 or more Children | 0 (0.0%) | 0 (0.0%) |
| Total | 0 (0.0%) | 0 (0.0%) |
Income Below Poverty Among Married-Couple vs Single-Parent Households in Silkworth
| Children | Married-Couple Families | Single-Parent Households |
| No Children | 0 (0.0%) | 0 (0.0%) |
| 1 or 2 Children | 0 (0.0%) | 0 (0.0%) |
| 3 or 4 Children | 0 (0.0%) | 0 (0.0%) |
| 5 or more Children | 0 (0.0%) | 0 (0.0%) |
| Total | 0 (0.0%) | 0 (0.0%) |
Race in Silkworth
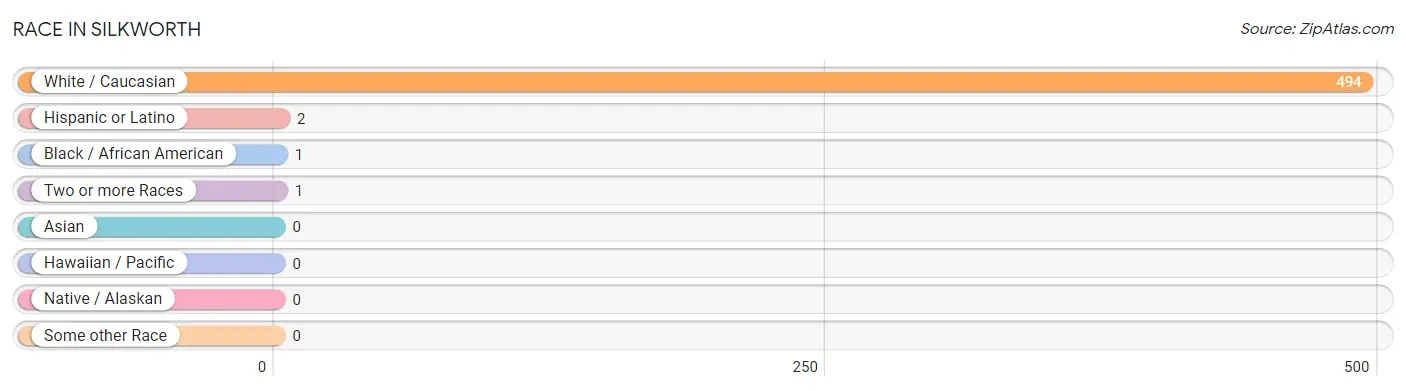
The most populous races in Silkworth are White / Caucasian (494 | 99.6%), Hispanic or Latino (2 | 0.4%), and Black / African American (1 | 0.2%).
| Race | # Population | % Population |
| Asian | 0 | 0.0% |
| Black / African American | 1 | 0.2% |
| Hawaiian / Pacific | 0 | 0.0% |
| Hispanic or Latino | 2 | 0.4% |
| Native / Alaskan | 0 | 0.0% |
| White / Caucasian | 494 | 99.6% |
| Two or more Races | 1 | 0.2% |
| Some other Race | 0 | 0.0% |
| Total | 496 | 100.0% |
Ancestry in Silkworth
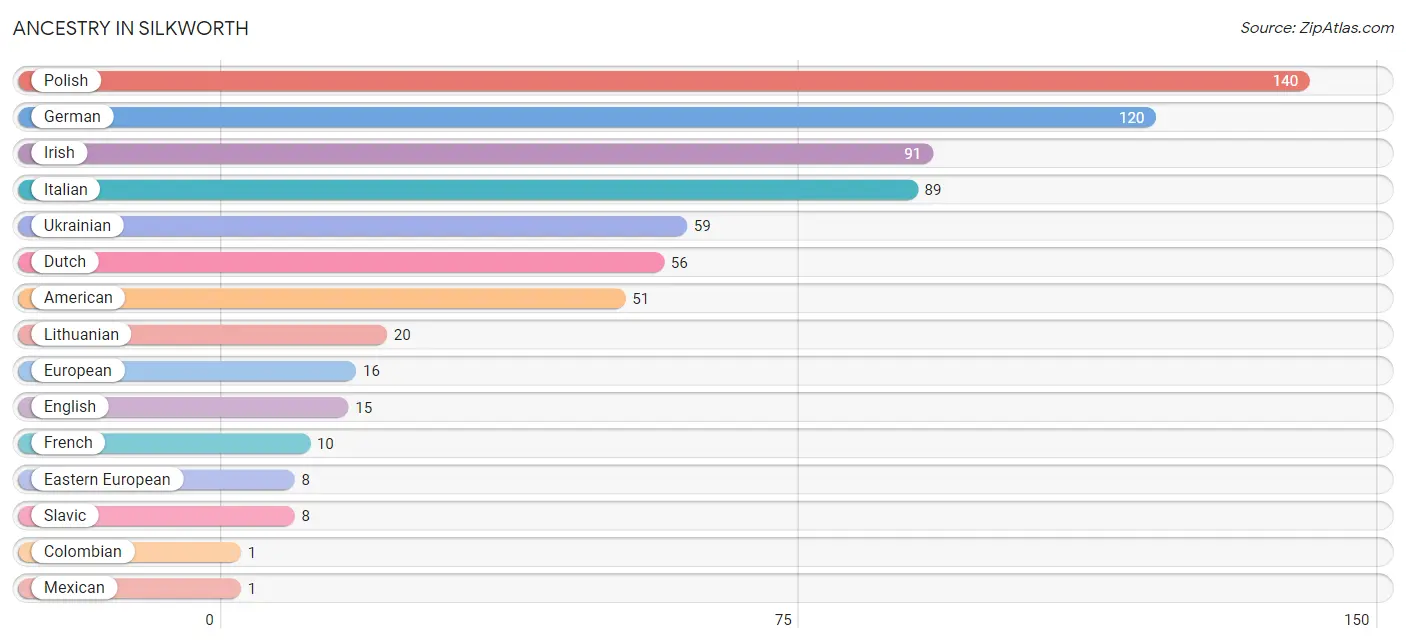
The most populous ancestries reported in Silkworth are Polish (140 | 28.2%), German (120 | 24.2%), Irish (91 | 18.3%), Italian (89 | 17.9%), and Ukrainian (59 | 11.9%), together accounting for 100.6% of all Silkworth residents.
| Ancestry | # Population | % Population |
| American | 51 | 10.3% |
| Colombian | 1 | 0.2% |
| Dutch | 56 | 11.3% |
| Eastern European | 8 | 1.6% |
| English | 15 | 3.0% |
| European | 16 | 3.2% |
| French | 10 | 2.0% |
| German | 120 | 24.2% |
| Irish | 91 | 18.3% |
| Italian | 89 | 17.9% |
| Lithuanian | 20 | 4.0% |
| Mexican | 1 | 0.2% |
| Polish | 140 | 28.2% |
| Slavic | 8 | 1.6% |
| South American | 1 | 0.2% |
| Ukrainian | 59 | 11.9% | View All 16 Rows |
Immigrants in Silkworth
The most numerous immigrant groups reported in Silkworth came from Central America (1 | 0.2%), Latin America (1 | 0.2%), and Mexico (1 | 0.2%), together accounting for 0.6% of all Silkworth residents.
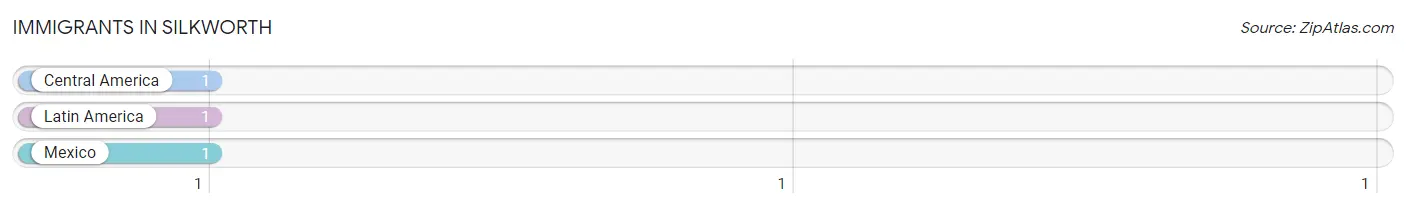
| Immigration Origin | # Population | % Population |
| Central America | 1 | 0.2% |
| Latin America | 1 | 0.2% |
| Mexico | 1 | 0.2% | View All 3 Rows |
Sex and Age in Silkworth
Sex and Age in Silkworth
The most populous age groups in Silkworth are 60 to 64 Years (41 | 20.0%) for men and 60 to 64 Years (63 | 21.6%) for women.
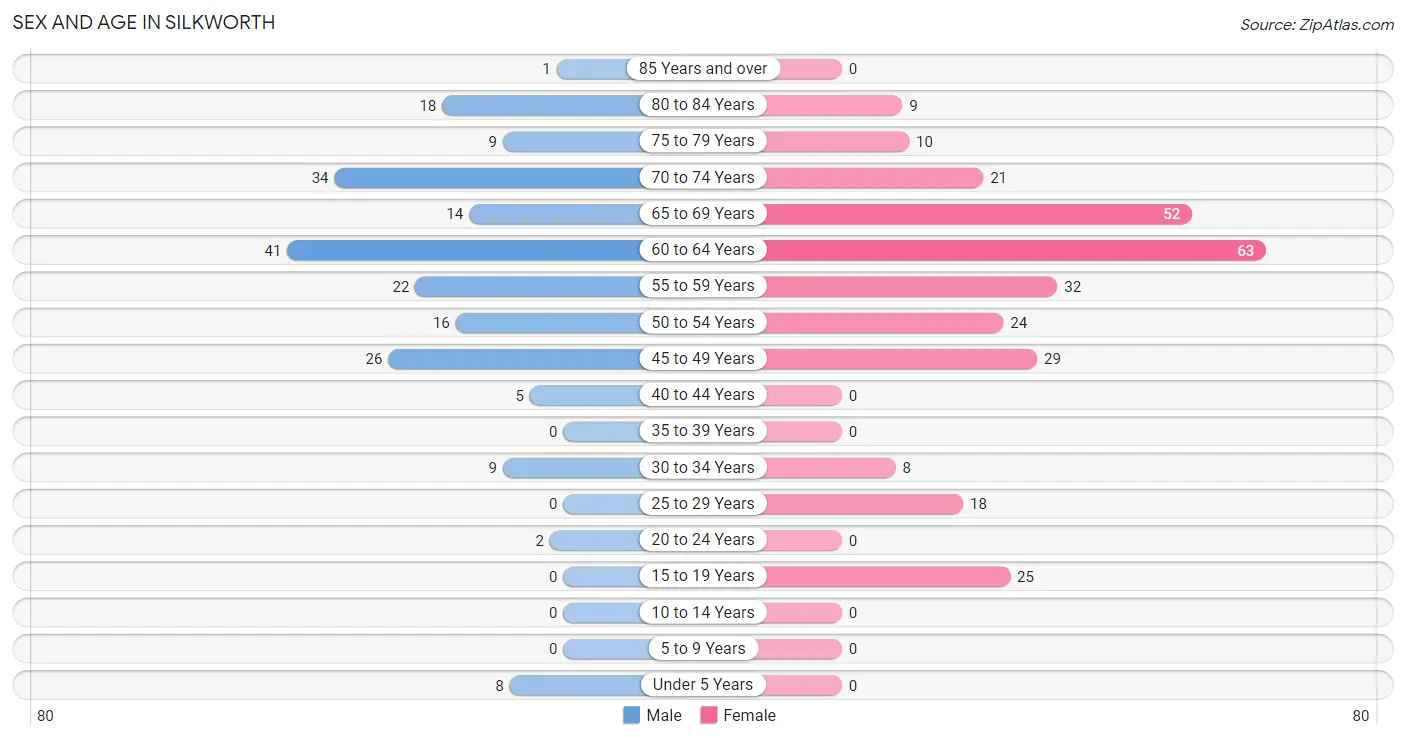
| Age Bracket | Male | Female |
| Under 5 Years | 8 (3.9%) | 0 (0.0%) |
| 5 to 9 Years | 0 (0.0%) | 0 (0.0%) |
| 10 to 14 Years | 0 (0.0%) | 0 (0.0%) |
| 15 to 19 Years | 0 (0.0%) | 25 (8.6%) |
| 20 to 24 Years | 2 (1.0%) | 0 (0.0%) |
| 25 to 29 Years | 0 (0.0%) | 18 (6.2%) |
| 30 to 34 Years | 9 (4.4%) | 8 (2.8%) |
| 35 to 39 Years | 0 (0.0%) | 0 (0.0%) |
| 40 to 44 Years | 5 (2.4%) | 0 (0.0%) |
| 45 to 49 Years | 26 (12.7%) | 29 (10.0%) |
| 50 to 54 Years | 16 (7.8%) | 24 (8.3%) |
| 55 to 59 Years | 22 (10.7%) | 32 (11.0%) |
| 60 to 64 Years | 41 (20.0%) | 63 (21.6%) |
| 65 to 69 Years | 14 (6.8%) | 52 (17.9%) |
| 70 to 74 Years | 34 (16.6%) | 21 (7.2%) |
| 75 to 79 Years | 9 (4.4%) | 10 (3.4%) |
| 80 to 84 Years | 18 (8.8%) | 9 (3.1%) |
| 85 Years and over | 1 (0.5%) | 0 (0.0%) |
| Total | 205 (100.0%) | 291 (100.0%) |
Families and Households in Silkworth
Median Family Size in Silkworth
The median family size in Silkworth is 2.24 persons per family, with single female/mother families (14 | 9.2%) accounting for the largest median family size of 3.14 persons per family. On the other hand, single male/father families (26 | 17.1%) represent the smallest median family size with 1.96 persons per family.
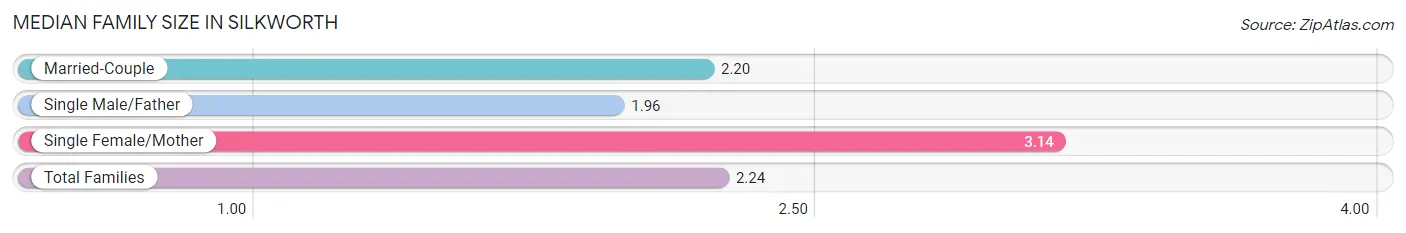
| Family Type | # Families | Family Size |
| Married-Couple | 112 (73.7%) | 2.20 |
| Single Male/Father | 26 (17.1%) | 1.96 |
| Single Female/Mother | 14 (9.2%) | 3.14 |
| Total Families | 152 (100.0%) | 2.24 |
Median Household Size in Silkworth
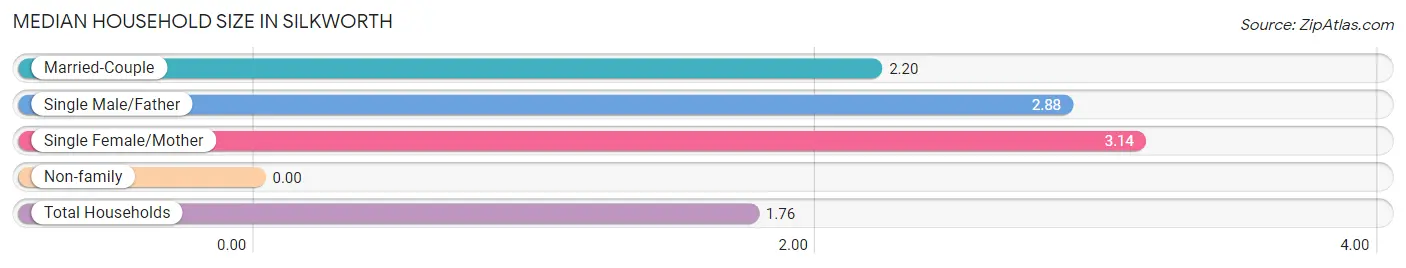
| Household Type | # Households | Household Size |
| Married-Couple | 112 (40.1%) | 2.20 |
| Single Male/Father | 26 (9.3%) | 2.88 |
| Single Female/Mother | 14 (5.0%) | 3.14 |
| Non-family | 127 (45.5%) | - |
| Total Households | 279 (100.0%) | 1.76 |
Household Size by Marriage Status in Silkworth
Out of a total of 279 households in Silkworth, 152 (54.5%) are family households, while 127 (45.5%) are nonfamily households. The most numerous type of family households are 2-person households, comprising 87, and the most common type of nonfamily households are 1-person households, comprising 127.
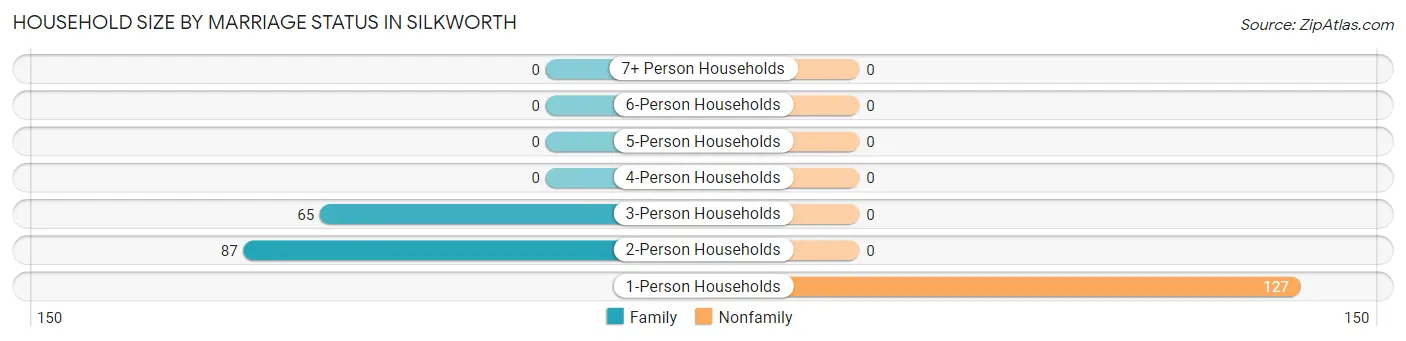
| Household Size | Family Households | Nonfamily Households |
| 1-Person Households | - | 127 (45.5%) |
| 2-Person Households | 87 (31.2%) | 0 (0.0%) |
| 3-Person Households | 65 (23.3%) | 0 (0.0%) |
| 4-Person Households | 0 (0.0%) | 0 (0.0%) |
| 5-Person Households | 0 (0.0%) | 0 (0.0%) |
| 6-Person Households | 0 (0.0%) | 0 (0.0%) |
| 7+ Person Households | 0 (0.0%) | 0 (0.0%) |
| Total | 152 (54.5%) | 127 (45.5%) |
Female Fertility in Silkworth
Fertility by Age in Silkworth
Average fertility rate in Silkworth is 100.0 births per 1,000 women. Women in the age bracket of 20 to 34 years have the highest fertility rate with 308.0 births per 1,000 women. Women in the age bracket of 20 to 34 years acount for 100.0% of all women with births.
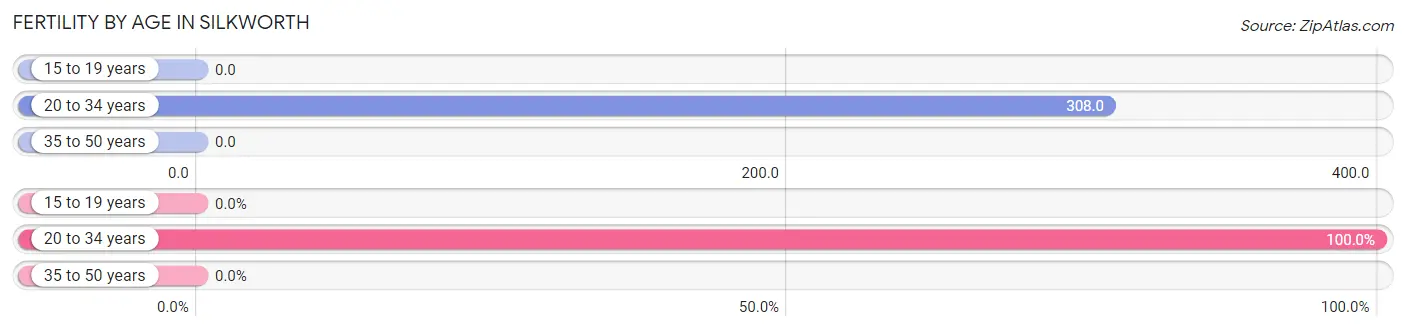
| Age Bracket | Women with Births | Births / 1,000 Women |
| 15 to 19 years | 0 (0.0%) | 0.0 |
| 20 to 34 years | 8 (100.0%) | 308.0 |
| 35 to 50 years | 0 (0.0%) | 0.0 |
| Total | 8 (100.0%) | 100.0 |
Fertility by Age by Marriage Status in Silkworth
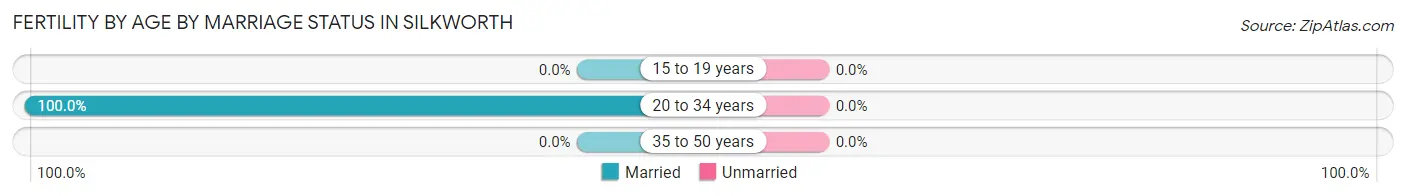
| Age Bracket | Married | Unmarried |
| 15 to 19 years | 0 (0.0%) | 0 (0.0%) |
| 20 to 34 years | 8 (100.0%) | 0 (0.0%) |
| 35 to 50 years | 0 (0.0%) | 0 (0.0%) |
| Total | 8 (100.0%) | 0 (0.0%) |
Fertility by Education in Silkworth
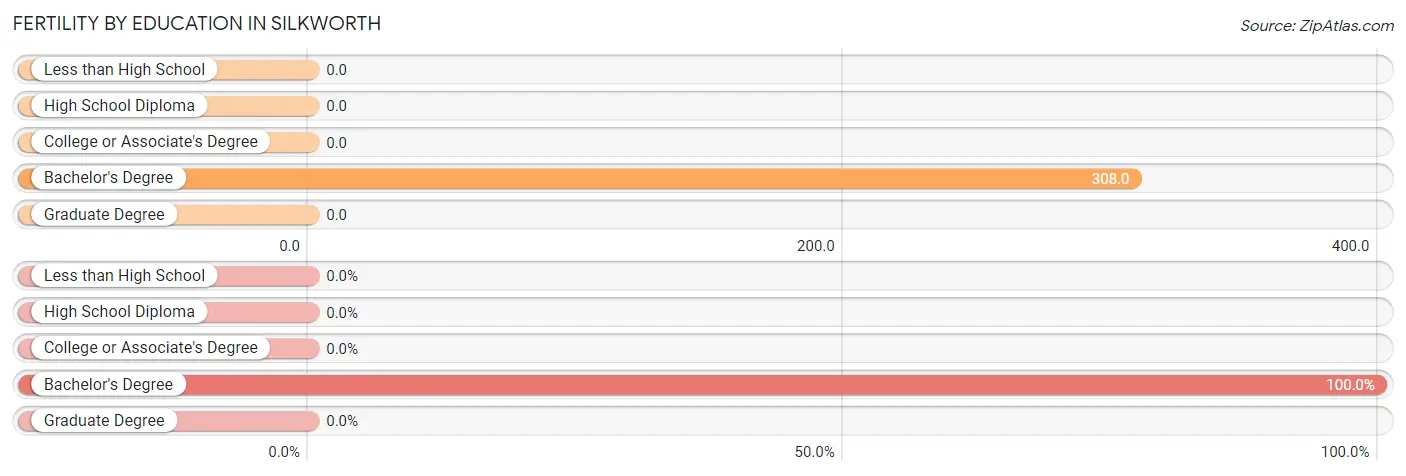
| Educational Attainment | Women with Births | Births / 1,000 Women |
| Less than High School | 0 (0.0%) | 0.0 |
| High School Diploma | 0 (0.0%) | 0.0 |
| College or Associate's Degree | 0 (0.0%) | 0.0 |
| Bachelor's Degree | 8 (100.0%) | 308.0 |
| Graduate Degree | 0 (0.0%) | 0.0 |
| Total | 8 (100.0%) | 100.0 |
Fertility by Education by Marriage Status in Silkworth
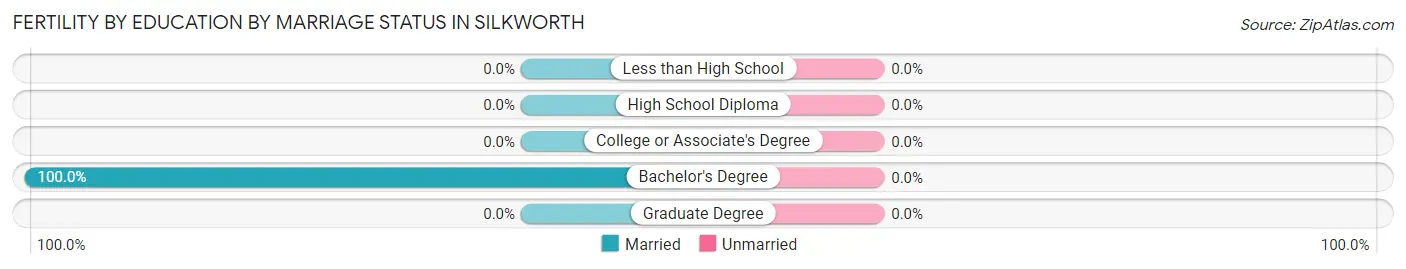
| Educational Attainment | Married | Unmarried |
| Less than High School | 0 (0.0%) | 0 (0.0%) |
| High School Diploma | 0 (0.0%) | 0 (0.0%) |
| College or Associate's Degree | 0 (0.0%) | 0 (0.0%) |
| Bachelor's Degree | 8 (100.0%) | 0 (0.0%) |
| Graduate Degree | 0 (0.0%) | 0 (0.0%) |
| Total | 8 (100.0%) | 0 (0.0%) |
Employment Characteristics in Silkworth
Employment by Class of Employer in Silkworth
Among the 195 employed individuals in Silkworth, private company employees (103 | 52.8%), not-for-profit organizations (32 | 16.4%), and state government employees (25 | 12.8%) make up the most common classes of employment.
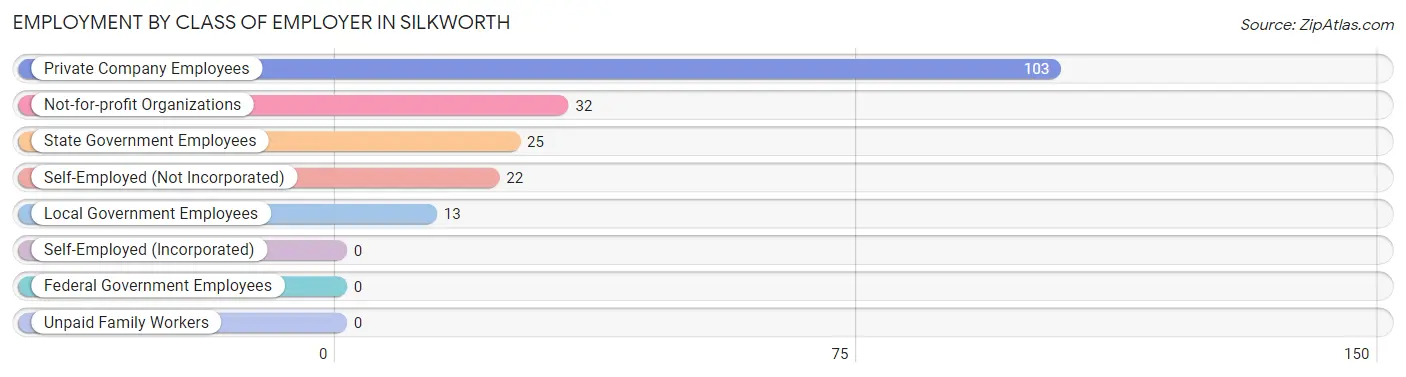
| Employer Class | # Employees | % Employees |
| Private Company Employees | 103 | 52.8% |
| Self-Employed (Incorporated) | 0 | 0.0% |
| Self-Employed (Not Incorporated) | 22 | 11.3% |
| Not-for-profit Organizations | 32 | 16.4% |
| Local Government Employees | 13 | 6.7% |
| State Government Employees | 25 | 12.8% |
| Federal Government Employees | 0 | 0.0% |
| Unpaid Family Workers | 0 | 0.0% |
| Total | 195 | 100.0% |
Employment Status by Age in Silkworth
According to the labor force statistics for Silkworth, out of the total population over 16 years of age (488), 44.7% or 218 individuals are in the labor force, with 6.9% or 15 of them unemployed. The age group with the highest labor force participation rate is 25 to 29 years, with 100.0% or 18 individuals in the labor force. Within the labor force, the 45 to 54 years age range has the highest percentage of unemployed individuals, with 15.8% or 15 of them being unemployed.
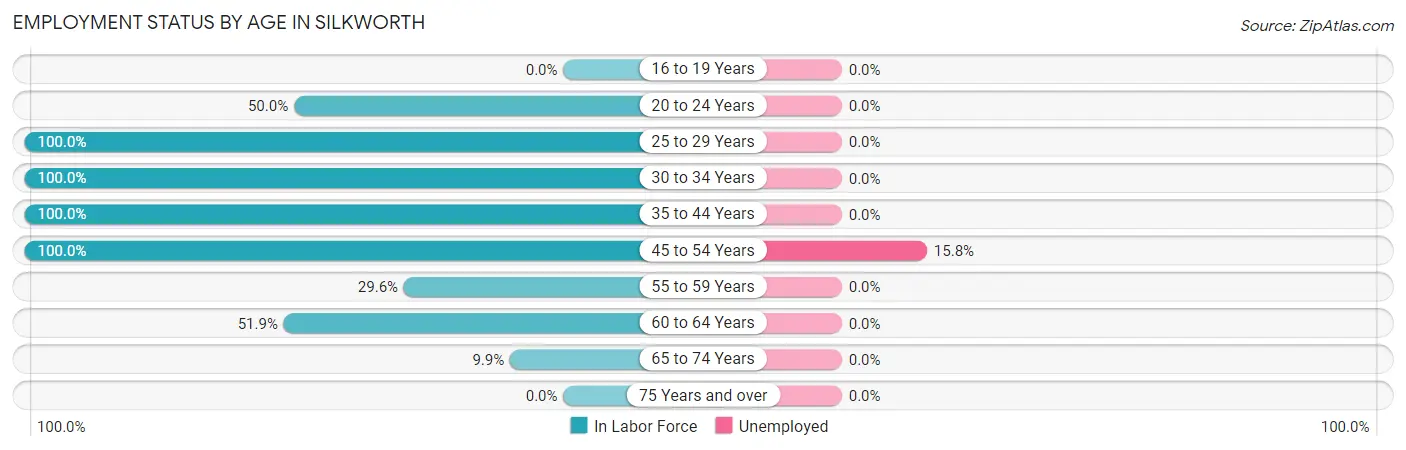
| Age Bracket | In Labor Force | Unemployed |
| 16 to 19 Years | 0 (0.0%) | 0 (0.0%) |
| 20 to 24 Years | 1 (50.0%) | 0 (0.0%) |
| 25 to 29 Years | 18 (100.0%) | 0 (0.0%) |
| 30 to 34 Years | 17 (100.0%) | 0 (0.0%) |
| 35 to 44 Years | 5 (100.0%) | 0 (0.0%) |
| 45 to 54 Years | 95 (100.0%) | 15 (15.8%) |
| 55 to 59 Years | 16 (29.6%) | 0 (0.0%) |
| 60 to 64 Years | 54 (51.9%) | 0 (0.0%) |
| 65 to 74 Years | 12 (9.9%) | 0 (0.0%) |
| 75 Years and over | 0 (0.0%) | 0 (0.0%) |
| Total | 218 (44.7%) | 15 (6.9%) |
Employment Status by Educational Attainment in Silkworth
According to labor force statistics for Silkworth, 70.0% of individuals (205) out of the total population between 25 and 64 years of age (293) are in the labor force, with 7.3% or 15 of them being unemployed. The group with the highest labor force participation rate are those with the educational attainment of high school diploma, with 77.6% or 76 individuals in the labor force. Within the labor force, individuals with less than high school education have the highest percentage of unemployment, with 31.9% or 15 of them being unemployed.
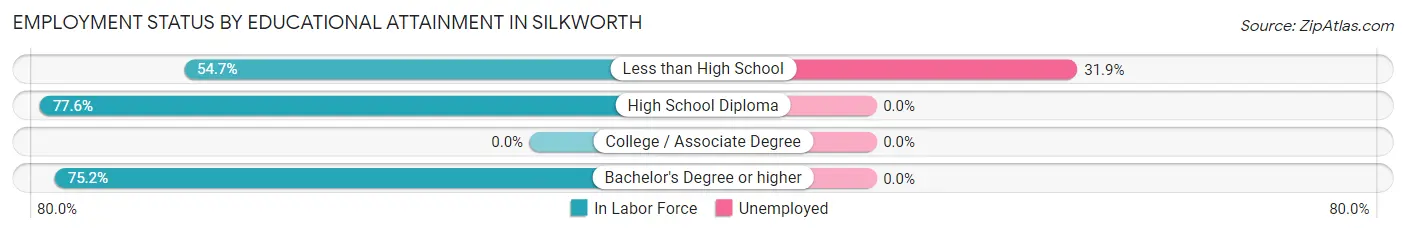
| Educational Attainment | In Labor Force | Unemployed |
| Less than High School | 47 (54.7%) | 27 (31.9%) |
| High School Diploma | 76 (77.6%) | 0 (0.0%) |
| College / Associate Degree | 0 (0.0%) | 0 (0.0%) |
| Bachelor's Degree or higher | 82 (75.2%) | 0 (0.0%) |
| Total | 205 (70.0%) | 21 (7.3%) |
Employment Occupations by Sex in Silkworth
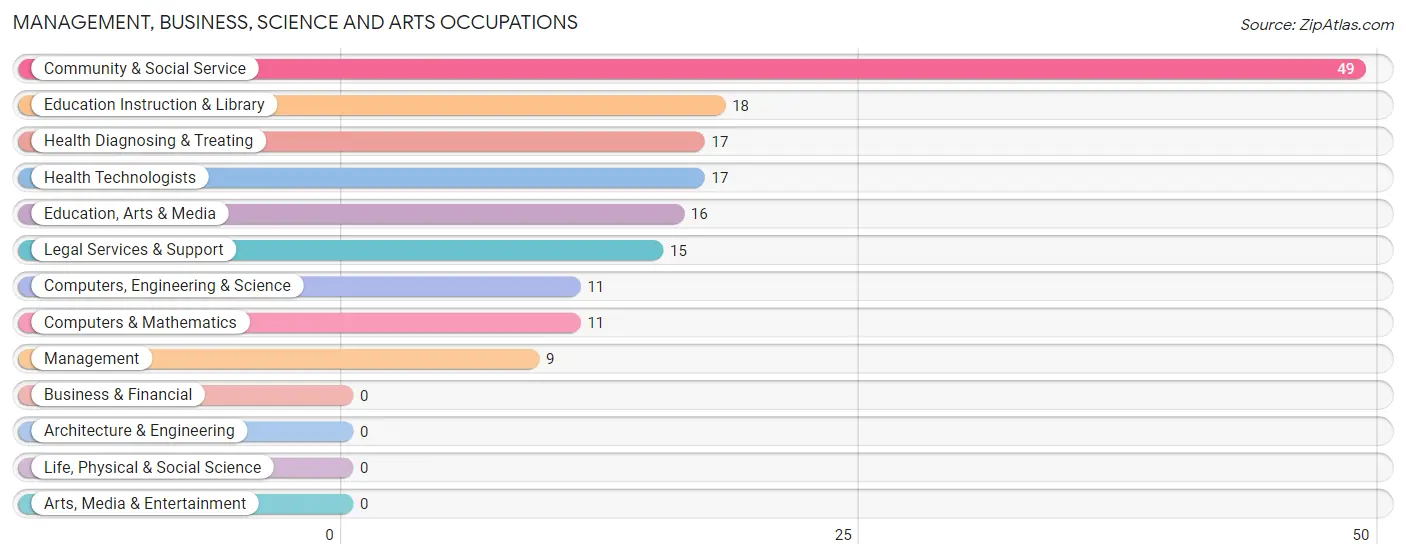
Management, Business, Science and Arts Occupations
The most common Management, Business, Science and Arts occupations in Silkworth are Community & Social Service (49 | 24.1%), Education Instruction & Library (18 | 8.9%), Health Diagnosing & Treating (17 | 8.4%), Health Technologists (17 | 8.4%), and Education, Arts & Media (16 | 7.9%).
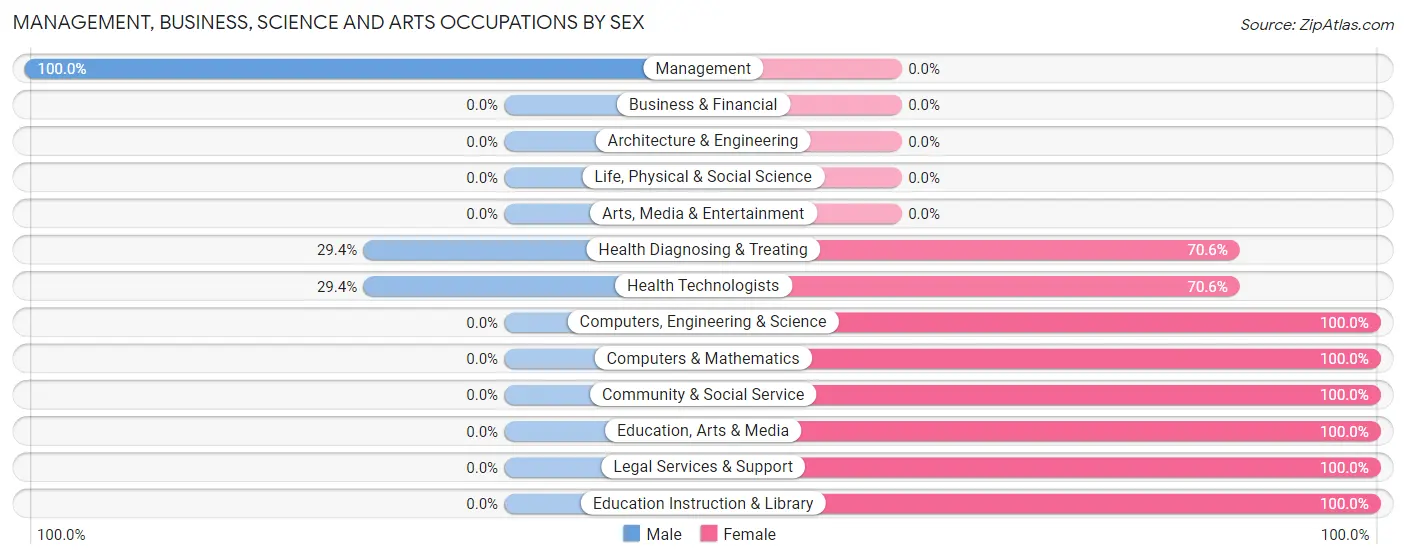
Management, Business, Science and Arts Occupations by Sex
Within the Management, Business, Science and Arts occupations in Silkworth, the most male-oriented occupations are Management (100.0%), Health Diagnosing & Treating (29.4%), and Health Technologists (29.4%), while the most female-oriented occupations are Computers, Engineering & Science (100.0%), Computers & Mathematics (100.0%), and Community & Social Service (100.0%).
| Occupation | Male | Female |
| Management | 9 (100.0%) | 0 (0.0%) |
| Business & Financial | 0 (0.0%) | 0 (0.0%) |
| Computers, Engineering & Science | 0 (0.0%) | 11 (100.0%) |
| Computers & Mathematics | 0 (0.0%) | 11 (100.0%) |
| Architecture & Engineering | 0 (0.0%) | 0 (0.0%) |
| Life, Physical & Social Science | 0 (0.0%) | 0 (0.0%) |
| Community & Social Service | 0 (0.0%) | 49 (100.0%) |
| Education, Arts & Media | 0 (0.0%) | 16 (100.0%) |
| Legal Services & Support | 0 (0.0%) | 15 (100.0%) |
| Education Instruction & Library | 0 (0.0%) | 18 (100.0%) |
| Arts, Media & Entertainment | 0 (0.0%) | 0 (0.0%) |
| Health Diagnosing & Treating | 5 (29.4%) | 12 (70.6%) |
| Health Technologists | 5 (29.4%) | 12 (70.6%) |
| Total (Category) | 14 (16.3%) | 72 (83.7%) |
| Total (Overall) | 72 (35.5%) | 131 (64.5%) |
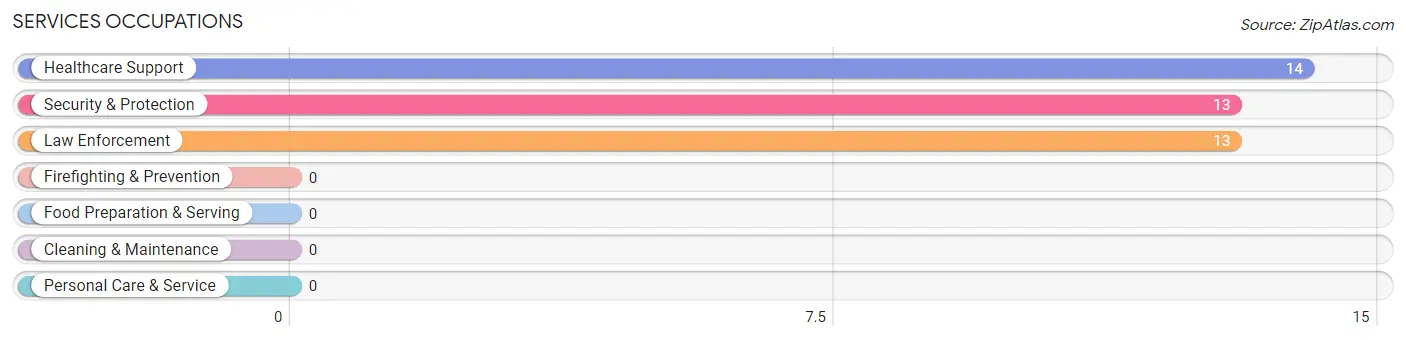
Services Occupations
The most common Services occupations in Silkworth are Healthcare Support (14 | 6.9%), Security & Protection (13 | 6.4%), and Law Enforcement (13 | 6.4%).
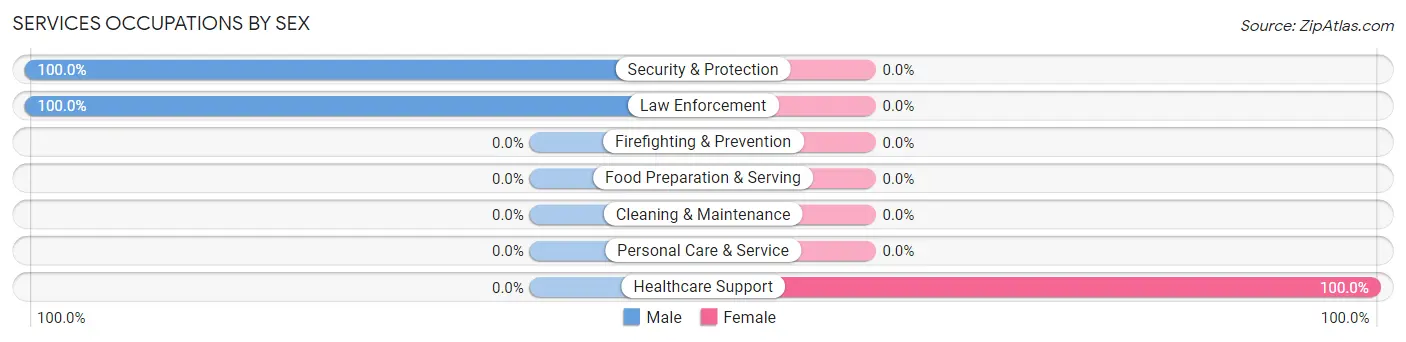
Services Occupations by Sex
| Occupation | Male | Female |
| Healthcare Support | 0 (0.0%) | 14 (100.0%) |
| Security & Protection | 13 (100.0%) | 0 (0.0%) |
| Firefighting & Prevention | 0 (0.0%) | 0 (0.0%) |
| Law Enforcement | 13 (100.0%) | 0 (0.0%) |
| Food Preparation & Serving | 0 (0.0%) | 0 (0.0%) |
| Cleaning & Maintenance | 0 (0.0%) | 0 (0.0%) |
| Personal Care & Service | 0 (0.0%) | 0 (0.0%) |
| Total (Category) | 13 (48.1%) | 14 (51.8%) |
| Total (Overall) | 72 (35.5%) | 131 (64.5%) |
Sales and Office Occupations
The most common Sales and Office occupations in Silkworth are , and Sales & Related (21 | 10.3%).
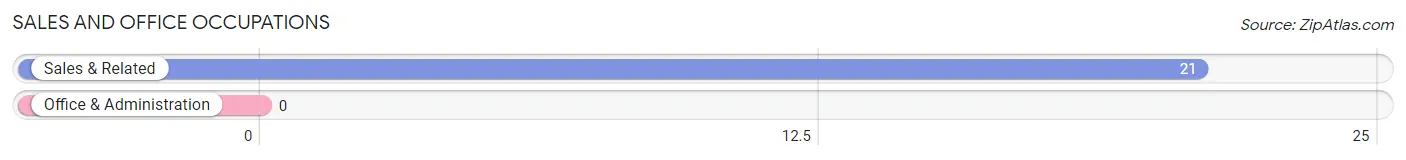
Sales and Office Occupations by Sex
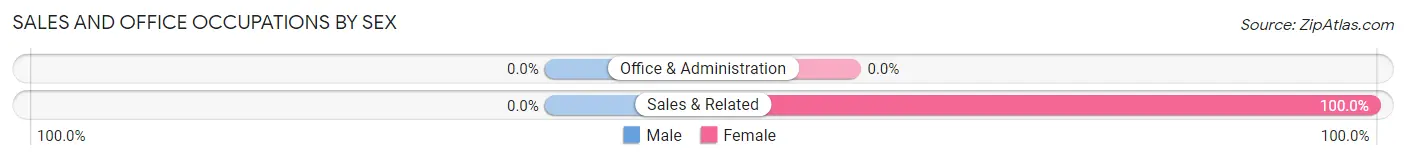
| Occupation | Male | Female |
| Sales & Related | 0 (0.0%) | 21 (100.0%) |
| Office & Administration | 0 (0.0%) | 0 (0.0%) |
| Total (Category) | 0 (0.0%) | 21 (100.0%) |
| Total (Overall) | 72 (35.5%) | 131 (64.5%) |
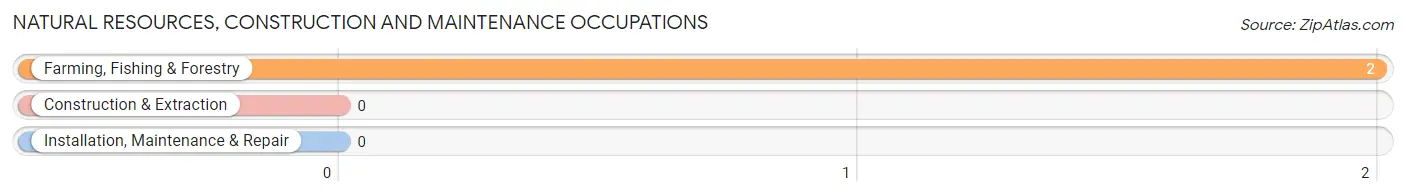
Natural Resources, Construction and Maintenance Occupations
The most common Natural Resources, Construction and Maintenance occupations in Silkworth are , and Farming, Fishing & Forestry (2 | 1.0%).
Natural Resources, Construction and Maintenance Occupations by Sex
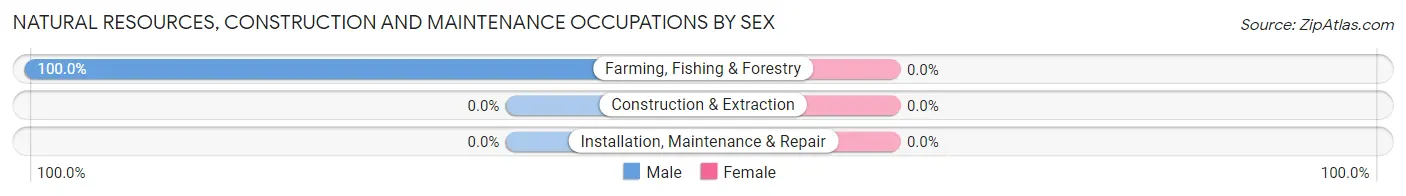
| Occupation | Male | Female |
| Farming, Fishing & Forestry | 2 (100.0%) | 0 (0.0%) |
| Construction & Extraction | 0 (0.0%) | 0 (0.0%) |
| Installation, Maintenance & Repair | 0 (0.0%) | 0 (0.0%) |
| Total (Category) | 2 (100.0%) | 0 (0.0%) |
| Total (Overall) | 72 (35.5%) | 131 (64.5%) |
Production, Transportation and Moving Occupations
The most common Production, Transportation and Moving occupations in Silkworth are Transportation (43 | 21.2%), and Material Moving (24 | 11.8%).
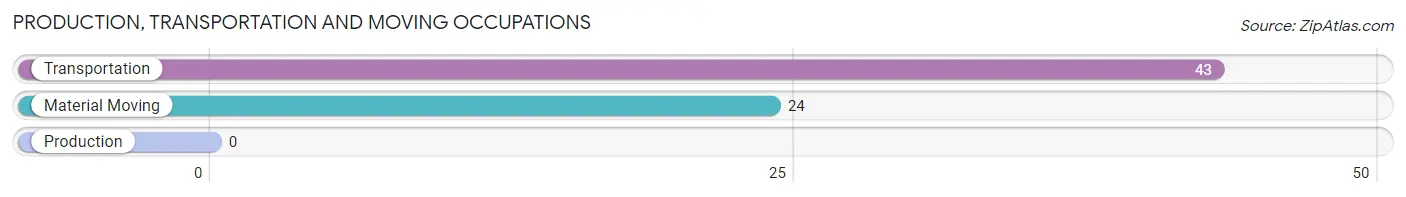
Production, Transportation and Moving Occupations by Sex
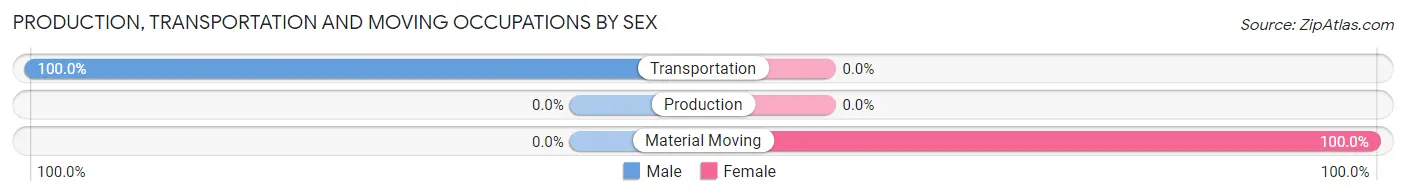
| Occupation | Male | Female |
| Production | 0 (0.0%) | 0 (0.0%) |
| Transportation | 43 (100.0%) | 0 (0.0%) |
| Material Moving | 0 (0.0%) | 24 (100.0%) |
| Total (Category) | 43 (64.2%) | 24 (35.8%) |
| Total (Overall) | 72 (35.5%) | 131 (64.5%) |
Employment Industries by Sex in Silkworth
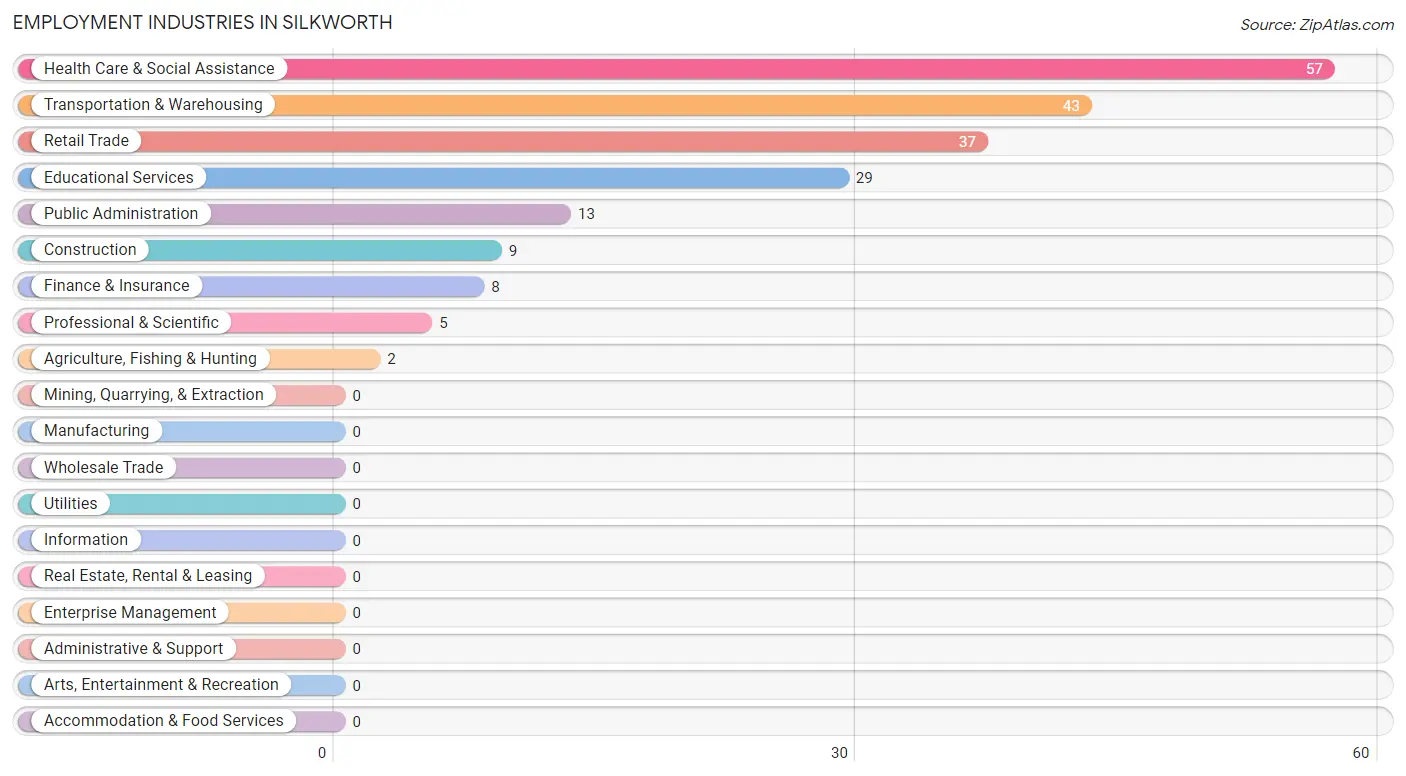
Employment Industries in Silkworth
The major employment industries in Silkworth include Health Care & Social Assistance (57 | 28.1%), Transportation & Warehousing (43 | 21.2%), Retail Trade (37 | 18.2%), Educational Services (29 | 14.3%), and Public Administration (13 | 6.4%).
Employment Industries by Sex in Silkworth
The Silkworth industries that see more men than women are Agriculture, Fishing & Hunting (100.0%), Construction (100.0%), and Transportation & Warehousing (100.0%), whereas the industries that tend to have a higher number of women are Retail Trade (100.0%), Finance & Insurance (100.0%), and Educational Services (100.0%).
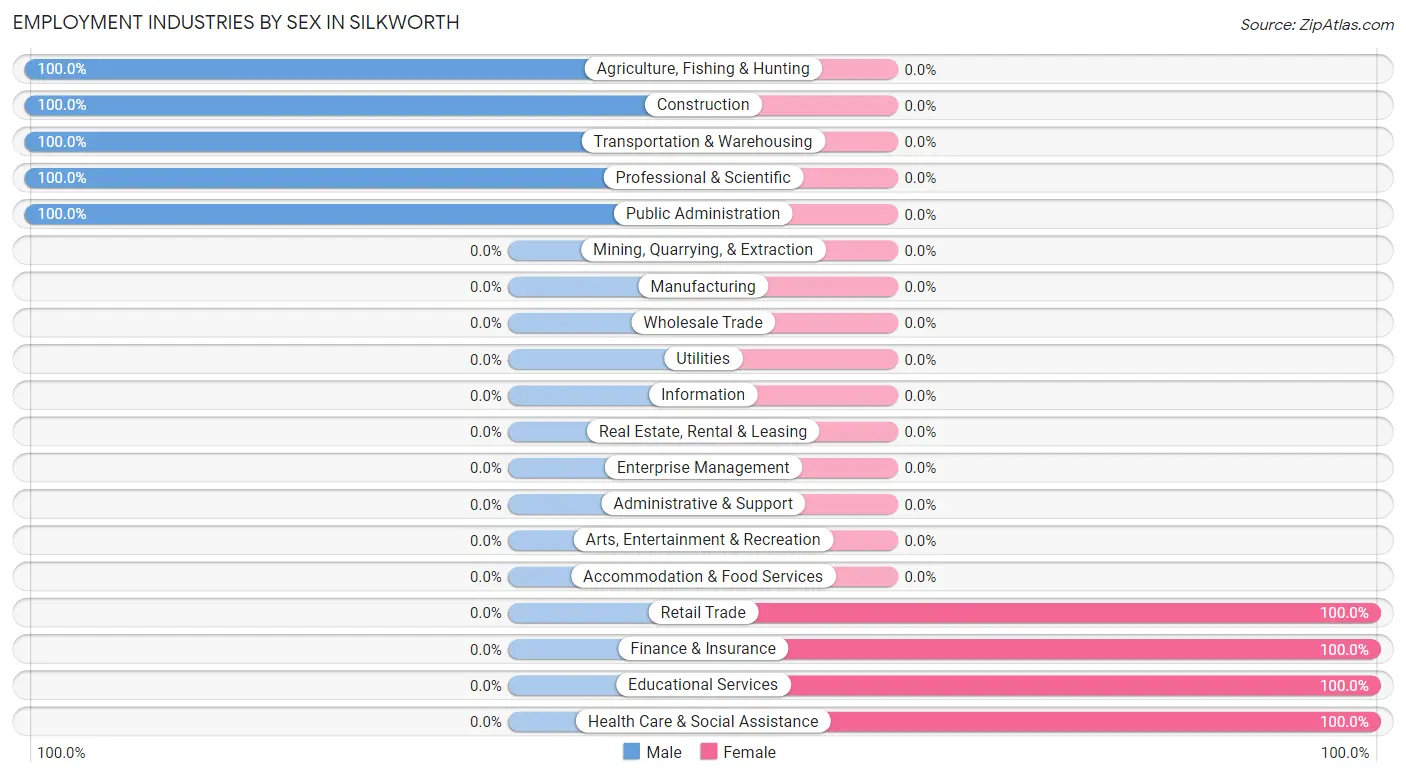
| Industry | Male | Female |
| Agriculture, Fishing & Hunting | 2 (100.0%) | 0 (0.0%) |
| Mining, Quarrying, & Extraction | 0 (0.0%) | 0 (0.0%) |
| Construction | 9 (100.0%) | 0 (0.0%) |
| Manufacturing | 0 (0.0%) | 0 (0.0%) |
| Wholesale Trade | 0 (0.0%) | 0 (0.0%) |
| Retail Trade | 0 (0.0%) | 37 (100.0%) |
| Transportation & Warehousing | 43 (100.0%) | 0 (0.0%) |
| Utilities | 0 (0.0%) | 0 (0.0%) |
| Information | 0 (0.0%) | 0 (0.0%) |
| Finance & Insurance | 0 (0.0%) | 8 (100.0%) |
| Real Estate, Rental & Leasing | 0 (0.0%) | 0 (0.0%) |
| Professional & Scientific | 5 (100.0%) | 0 (0.0%) |
| Enterprise Management | 0 (0.0%) | 0 (0.0%) |
| Administrative & Support | 0 (0.0%) | 0 (0.0%) |
| Educational Services | 0 (0.0%) | 29 (100.0%) |
| Health Care & Social Assistance | 0 (0.0%) | 57 (100.0%) |
| Arts, Entertainment & Recreation | 0 (0.0%) | 0 (0.0%) |
| Accommodation & Food Services | 0 (0.0%) | 0 (0.0%) |
| Public Administration | 13 (100.0%) | 0 (0.0%) |
| Total | 72 (35.5%) | 131 (64.5%) |
Education in Silkworth
School Enrollment in Silkworth
The most common levels of schooling among the 27 students in Silkworth are high school (25 | 92.6%), and college / undergraduate (2 | 7.4%).
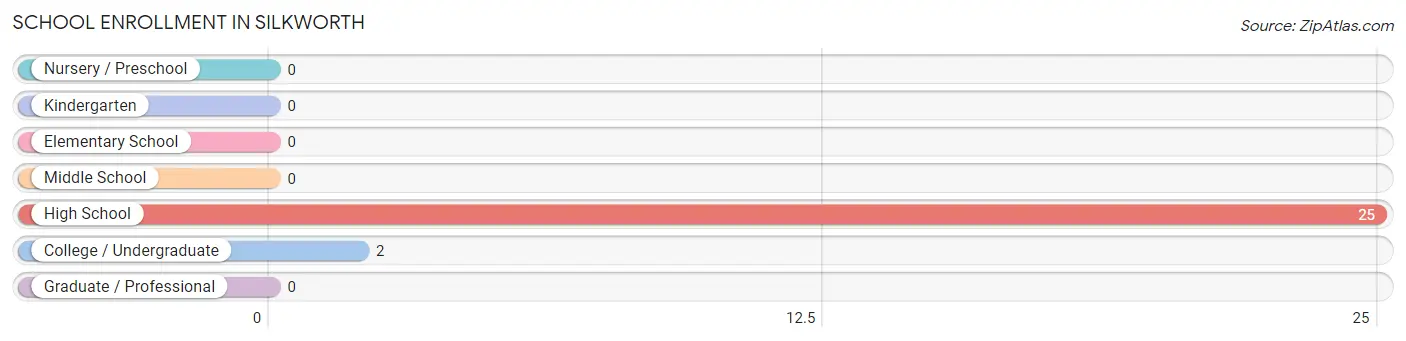
| School Level | # Students | % Students |
| Nursery / Preschool | 0 | 0.0% |
| Kindergarten | 0 | 0.0% |
| Elementary School | 0 | 0.0% |
| Middle School | 0 | 0.0% |
| High School | 25 | 92.6% |
| College / Undergraduate | 2 | 7.4% |
| Graduate / Professional | 0 | 0.0% |
| Total | 27 | 100.0% |
School Enrollment by Age by Funding Source in Silkworth
Out of a total of 27 students who are enrolled in schools in Silkworth, 2 (7.4%) attend a private institution, while the remaining 25 (92.6%) are enrolled in public schools. The age group of 20 to 24 year olds has the highest likelihood of being enrolled in private schools, with 2 (100.0% in the age bracket) enrolled. Conversely, the age group of 15 to 17 year olds has the lowest likelihood of being enrolled in a private school, with 25 (100.0% in the age bracket) attending a public institution.
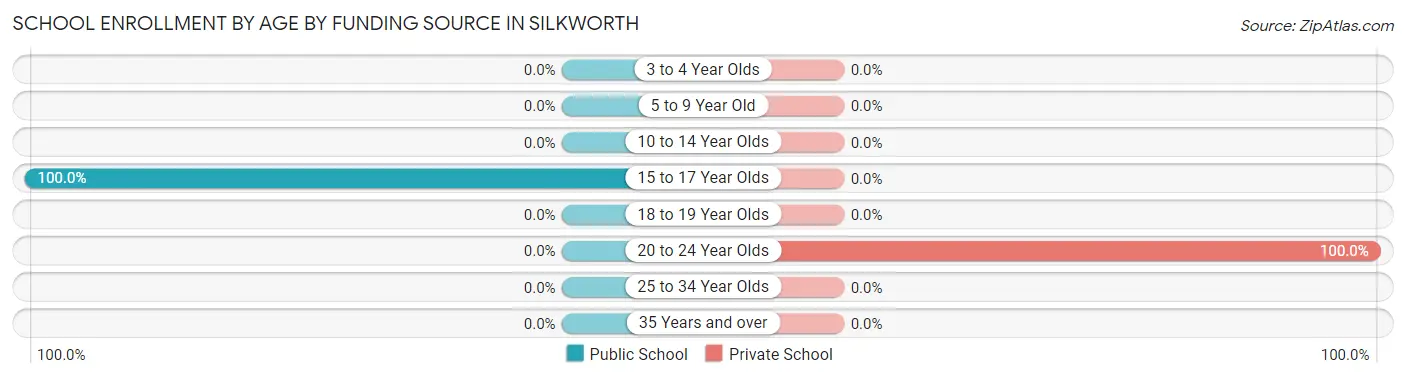
| Age Bracket | Public School | Private School |
| 3 to 4 Year Olds | 0 (0.0%) | 0 (0.0%) |
| 5 to 9 Year Old | 0 (0.0%) | 0 (0.0%) |
| 10 to 14 Year Olds | 0 (0.0%) | 0 (0.0%) |
| 15 to 17 Year Olds | 25 (100.0%) | 0 (0.0%) |
| 18 to 19 Year Olds | 0 (0.0%) | 0 (0.0%) |
| 20 to 24 Year Olds | 0 (0.0%) | 2 (100.0%) |
| 25 to 34 Year Olds | 0 (0.0%) | 0 (0.0%) |
| 35 Years and over | 0 (0.0%) | 0 (0.0%) |
| Total | 25 (92.6%) | 2 (7.4%) |
Educational Attainment by Field of Study in Silkworth
Business (27 | 17.0%), education (27 | 17.0%), social sciences (25 | 15.7%), science & technology (19 | 11.9%), and physical & health sciences (16 | 10.1%) are the most common fields of study among 159 individuals in Silkworth who have obtained a bachelor's degree or higher.
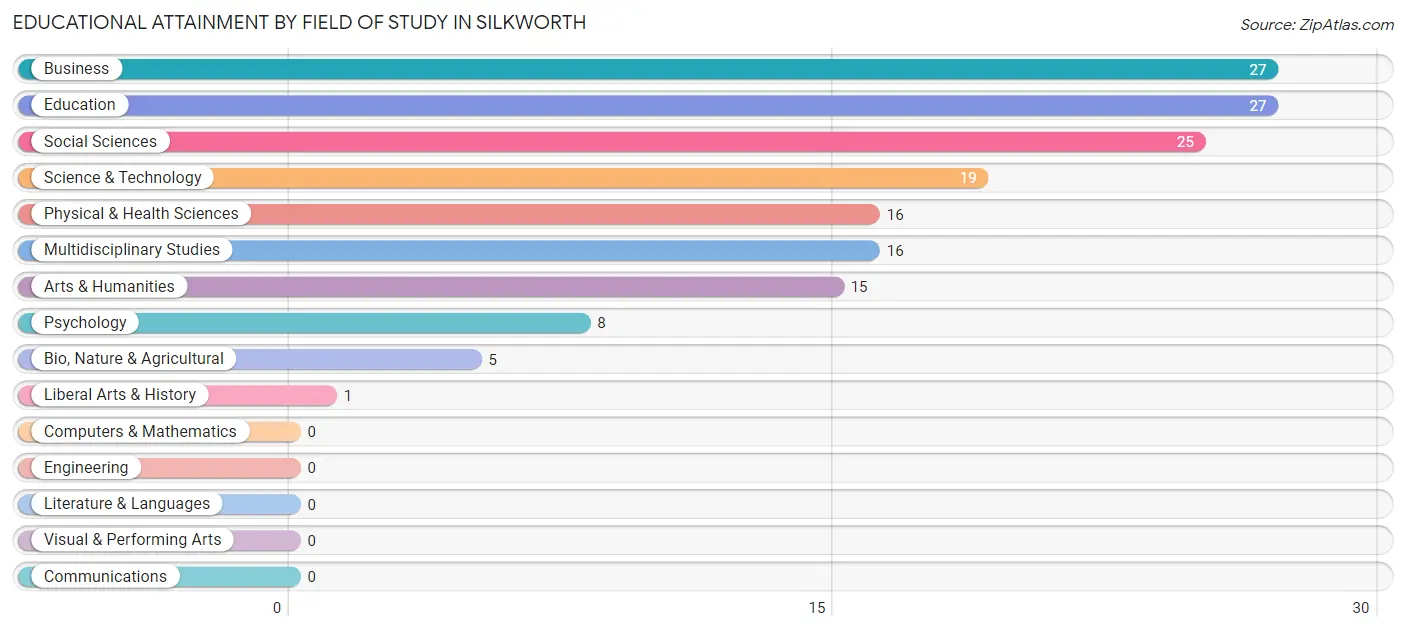
| Field of Study | # Graduates | % Graduates |
| Computers & Mathematics | 0 | 0.0% |
| Bio, Nature & Agricultural | 5 | 3.1% |
| Physical & Health Sciences | 16 | 10.1% |
| Psychology | 8 | 5.0% |
| Social Sciences | 25 | 15.7% |
| Engineering | 0 | 0.0% |
| Multidisciplinary Studies | 16 | 10.1% |
| Science & Technology | 19 | 11.9% |
| Business | 27 | 17.0% |
| Education | 27 | 17.0% |
| Literature & Languages | 0 | 0.0% |
| Liberal Arts & History | 1 | 0.6% |
| Visual & Performing Arts | 0 | 0.0% |
| Communications | 0 | 0.0% |
| Arts & Humanities | 15 | 9.4% |
| Total | 159 | 100.0% |
Transportation & Commute in Silkworth
Vehicle Availability by Sex in Silkworth
The most prevalent vehicle ownership categories in Silkworth are males with 2 vehicles (65, accounting for 92.9%) and females with 2 vehicles (77, making up 52.8%).
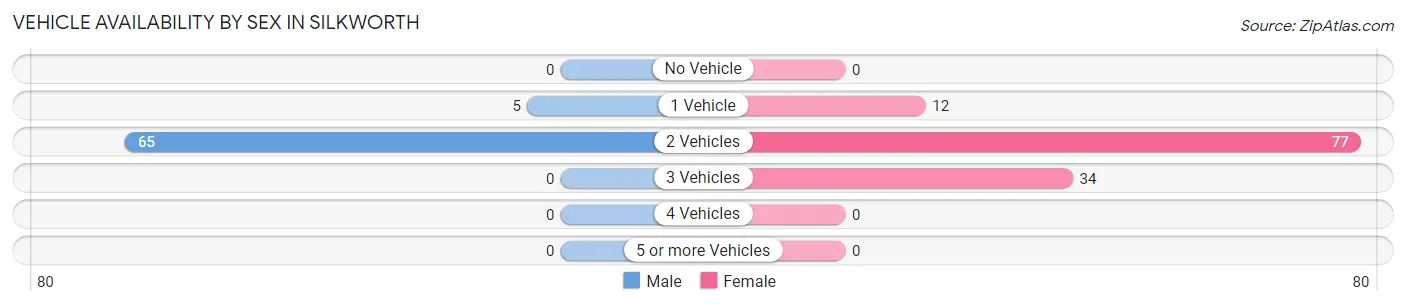
| Vehicles Available | Male | Female |
| No Vehicle | 0 (0.0%) | 0 (0.0%) |
| 1 Vehicle | 5 (7.1%) | 12 (9.8%) |
| 2 Vehicles | 65 (92.9%) | 77 (62.6%) |
| 3 Vehicles | 0 (0.0%) | 34 (27.6%) |
| 4 Vehicles | 0 (0.0%) | 0 (0.0%) |
| 5 or more Vehicles | 0 (0.0%) | 0 (0.0%) |
| Total | 70 (100.0%) | 123 (100.0%) |
Commute Time in Silkworth
The most frequently occuring commute durations in Silkworth are 25 to 29 minutes (55 commuters, 30.6%), 30 to 34 minutes (54 commuters, 30.0%), and 20 to 24 minutes (28 commuters, 15.6%).
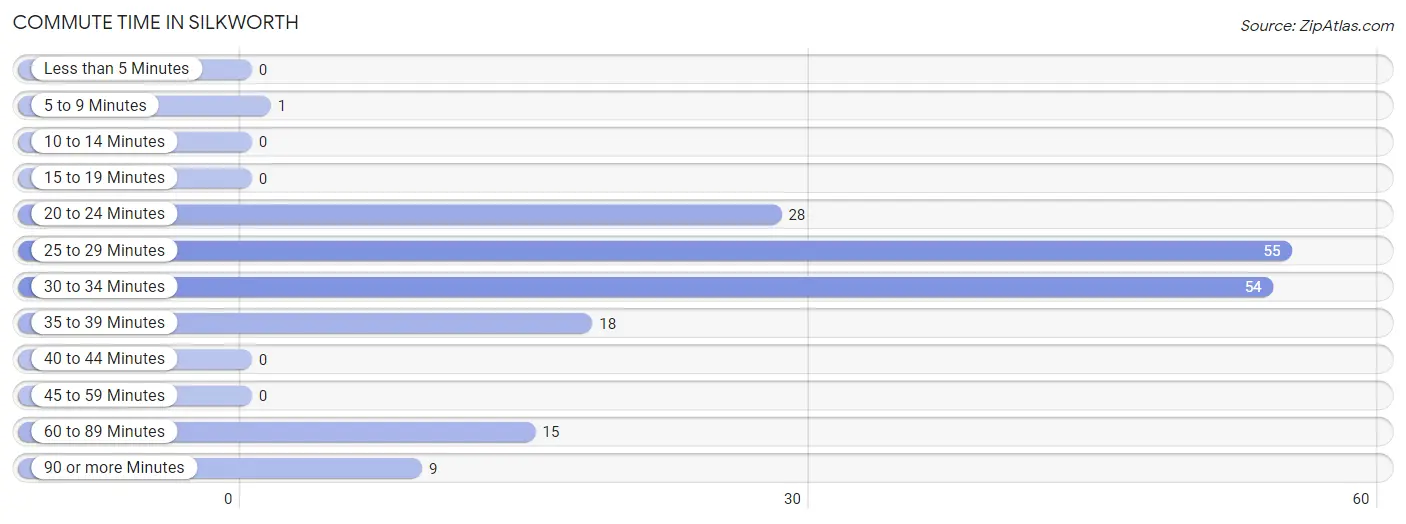
| Commute Time | # Commuters | % Commuters |
| Less than 5 Minutes | 0 | 0.0% |
| 5 to 9 Minutes | 1 | 0.6% |
| 10 to 14 Minutes | 0 | 0.0% |
| 15 to 19 Minutes | 0 | 0.0% |
| 20 to 24 Minutes | 28 | 15.6% |
| 25 to 29 Minutes | 55 | 30.6% |
| 30 to 34 Minutes | 54 | 30.0% |
| 35 to 39 Minutes | 18 | 10.0% |
| 40 to 44 Minutes | 0 | 0.0% |
| 45 to 59 Minutes | 0 | 0.0% |
| 60 to 89 Minutes | 15 | 8.3% |
| 90 or more Minutes | 9 | 5.0% |
Commute Time by Sex in Silkworth
The most common commute times in Silkworth are 30 to 34 minutes (26 commuters, 36.6%) for males and 25 to 29 minutes (37 commuters, 33.9%) for females.
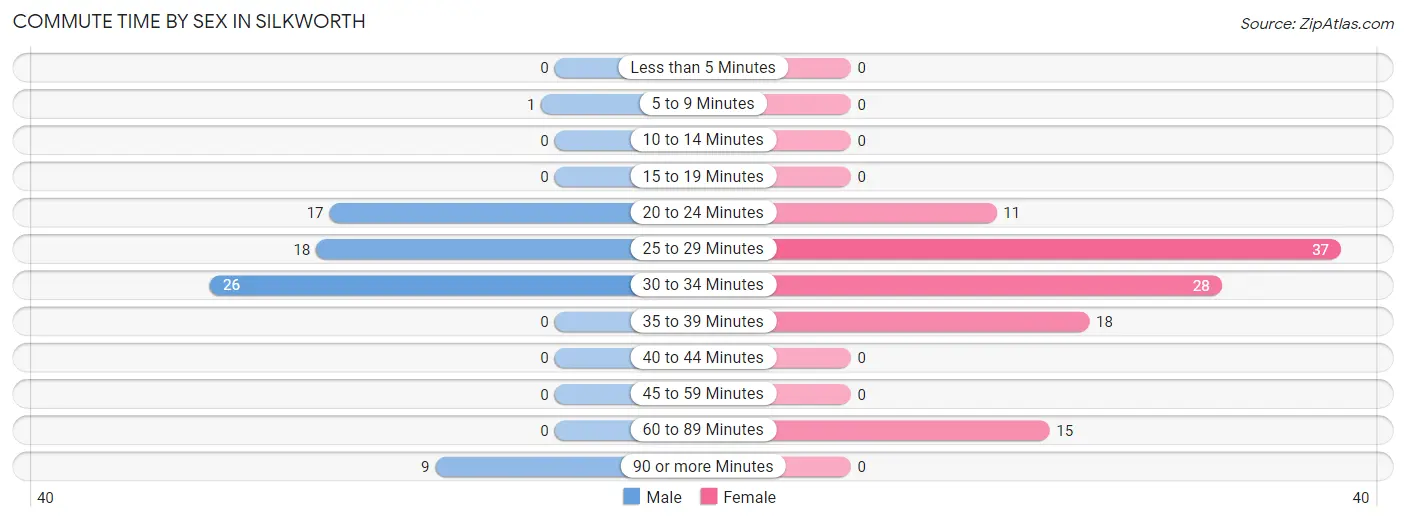
| Commute Time | Male | Female |
| Less than 5 Minutes | 0 (0.0%) | 0 (0.0%) |
| 5 to 9 Minutes | 1 (1.4%) | 0 (0.0%) |
| 10 to 14 Minutes | 0 (0.0%) | 0 (0.0%) |
| 15 to 19 Minutes | 0 (0.0%) | 0 (0.0%) |
| 20 to 24 Minutes | 17 (23.9%) | 11 (10.1%) |
| 25 to 29 Minutes | 18 (25.4%) | 37 (33.9%) |
| 30 to 34 Minutes | 26 (36.6%) | 28 (25.7%) |
| 35 to 39 Minutes | 0 (0.0%) | 18 (16.5%) |
| 40 to 44 Minutes | 0 (0.0%) | 0 (0.0%) |
| 45 to 59 Minutes | 0 (0.0%) | 0 (0.0%) |
| 60 to 89 Minutes | 0 (0.0%) | 15 (13.8%) |
| 90 or more Minutes | 9 (12.7%) | 0 (0.0%) |
Time of Departure to Work by Sex in Silkworth
The most frequent times of departure to work in Silkworth are 12:00 AM to 4:59 AM (35, 49.3%) for males and 7:30 AM to 7:59 AM (42, 38.5%) for females.
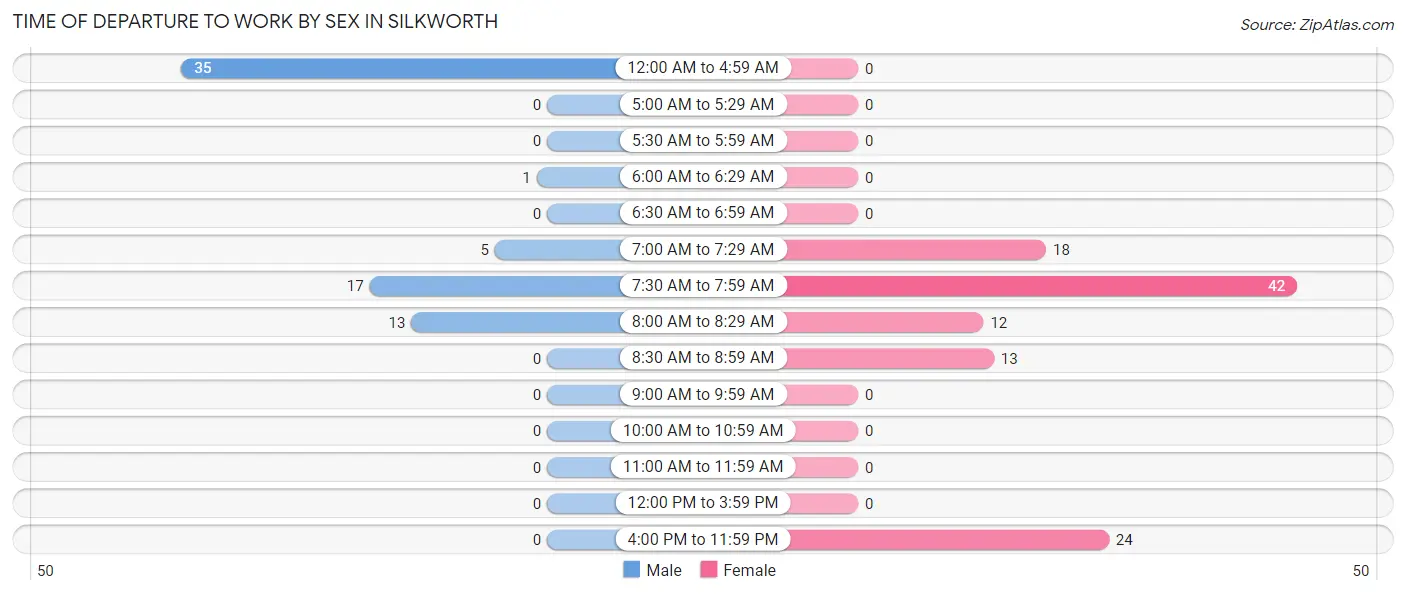
| Time of Departure | Male | Female |
| 12:00 AM to 4:59 AM | 35 (49.3%) | 0 (0.0%) |
| 5:00 AM to 5:29 AM | 0 (0.0%) | 0 (0.0%) |
| 5:30 AM to 5:59 AM | 0 (0.0%) | 0 (0.0%) |
| 6:00 AM to 6:29 AM | 1 (1.4%) | 0 (0.0%) |
| 6:30 AM to 6:59 AM | 0 (0.0%) | 0 (0.0%) |
| 7:00 AM to 7:29 AM | 5 (7.0%) | 18 (16.5%) |
| 7:30 AM to 7:59 AM | 17 (23.9%) | 42 (38.5%) |
| 8:00 AM to 8:29 AM | 13 (18.3%) | 12 (11.0%) |
| 8:30 AM to 8:59 AM | 0 (0.0%) | 13 (11.9%) |
| 9:00 AM to 9:59 AM | 0 (0.0%) | 0 (0.0%) |
| 10:00 AM to 10:59 AM | 0 (0.0%) | 0 (0.0%) |
| 11:00 AM to 11:59 AM | 0 (0.0%) | 0 (0.0%) |
| 12:00 PM to 3:59 PM | 0 (0.0%) | 0 (0.0%) |
| 4:00 PM to 11:59 PM | 0 (0.0%) | 24 (22.0%) |
| Total | 71 (100.0%) | 109 (100.0%) |
Housing Occupancy in Silkworth
Occupancy by Ownership in Silkworth
Of the total 279 dwellings in Silkworth, owner-occupied units account for 273 (97.9%), while renter-occupied units make up 6 (2.1%).
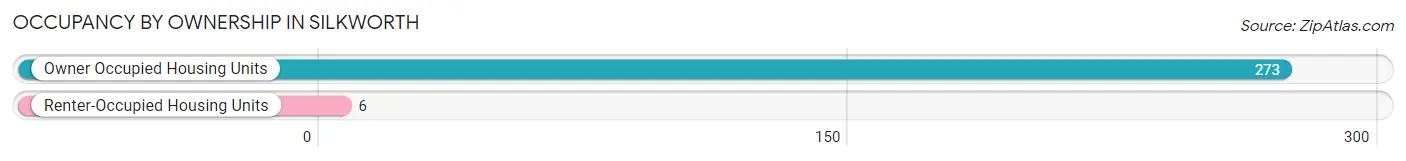
| Occupancy | # Housing Units | % Housing Units |
| Owner Occupied Housing Units | 273 | 97.9% |
| Renter-Occupied Housing Units | 6 | 2.1% |
| Total Occupied Housing Units | 279 | 100.0% |
Occupancy by Household Size in Silkworth
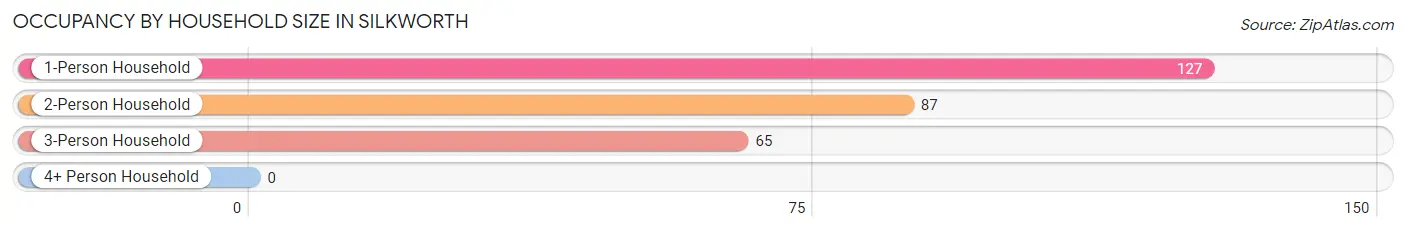
| Household Size | # Housing Units | % Housing Units |
| 1-Person Household | 127 | 45.5% |
| 2-Person Household | 87 | 31.2% |
| 3-Person Household | 65 | 23.3% |
| 4+ Person Household | 0 | 0.0% |
| Total Housing Units | 279 | 100.0% |
Occupancy by Ownership by Household Size in Silkworth
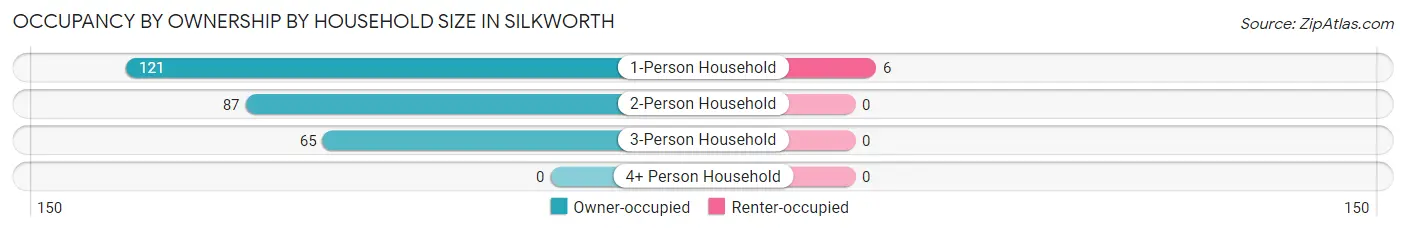
| Household Size | Owner-occupied | Renter-occupied |
| 1-Person Household | 121 (95.3%) | 6 (4.7%) |
| 2-Person Household | 87 (100.0%) | 0 (0.0%) |
| 3-Person Household | 65 (100.0%) | 0 (0.0%) |
| 4+ Person Household | 0 (0.0%) | 0 (0.0%) |
| Total Housing Units | 273 (97.9%) | 6 (2.1%) |
Occupancy by Educational Attainment in Silkworth
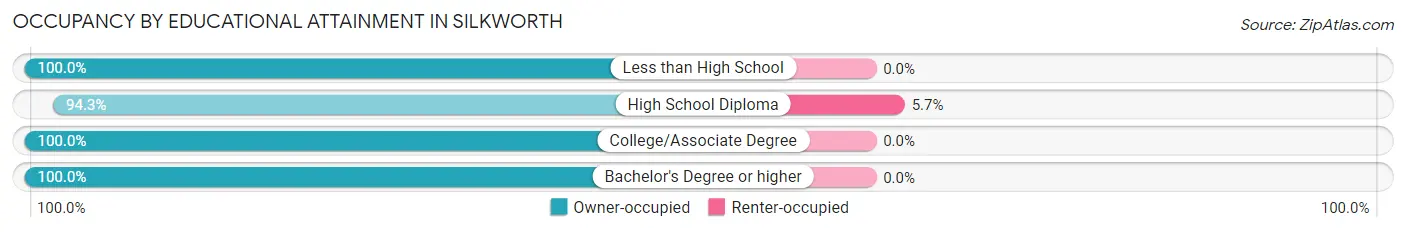
| Household Size | Owner-occupied | Renter-occupied |
| Less than High School | 70 (100.0%) | 0 (0.0%) |
| High School Diploma | 100 (94.3%) | 6 (5.7%) |
| College/Associate Degree | 30 (100.0%) | 0 (0.0%) |
| Bachelor's Degree or higher | 73 (100.0%) | 0 (0.0%) |
Occupancy by Age of Householder in Silkworth
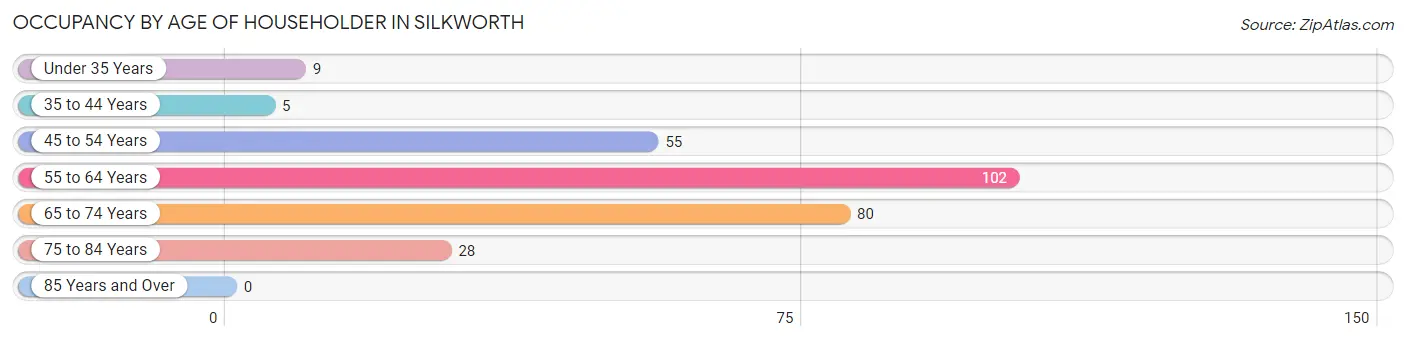
| Age Bracket | # Households | % Households |
| Under 35 Years | 9 | 3.2% |
| 35 to 44 Years | 5 | 1.8% |
| 45 to 54 Years | 55 | 19.7% |
| 55 to 64 Years | 102 | 36.6% |
| 65 to 74 Years | 80 | 28.7% |
| 75 to 84 Years | 28 | 10.0% |
| 85 Years and Over | 0 | 0.0% |
| Total | 279 | 100.0% |
Housing Finances in Silkworth
Median Income by Occupancy in Silkworth
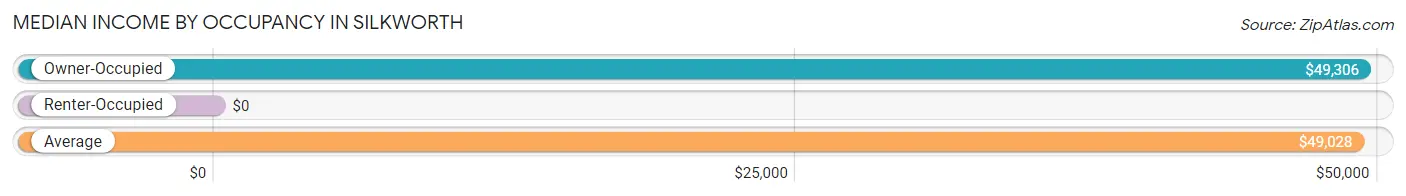
| Occupancy Type | # Households | Median Income |
| Owner-Occupied | 273 (97.9%) | $49,306 |
| Renter-Occupied | 6 (2.1%) | $0 |
| Average | 279 (100.0%) | $49,028 |
Occupancy by Householder Income Bracket in Silkworth
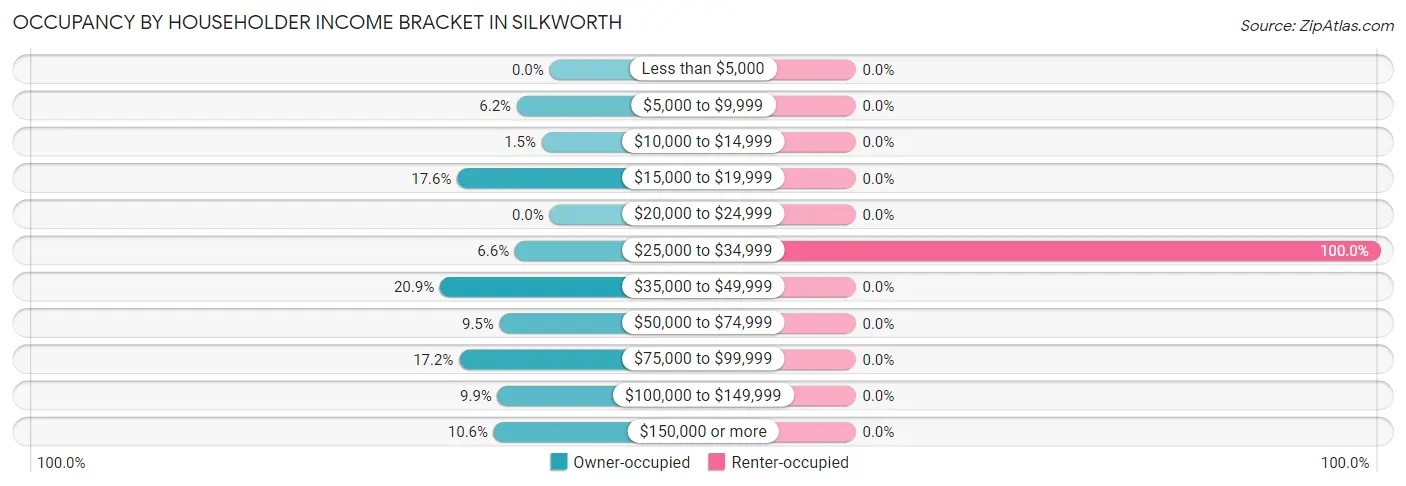
| Income Bracket | Owner-occupied | Renter-occupied |
| Less than $5,000 | 0 (0.0%) | 0 (0.0%) |
| $5,000 to $9,999 | 17 (6.2%) | 0 (0.0%) |
| $10,000 to $14,999 | 4 (1.5%) | 0 (0.0%) |
| $15,000 to $19,999 | 48 (17.6%) | 0 (0.0%) |
| $20,000 to $24,999 | 0 (0.0%) | 0 (0.0%) |
| $25,000 to $34,999 | 18 (6.6%) | 6 (100.0%) |
| $35,000 to $49,999 | 57 (20.9%) | 0 (0.0%) |
| $50,000 to $74,999 | 26 (9.5%) | 0 (0.0%) |
| $75,000 to $99,999 | 47 (17.2%) | 0 (0.0%) |
| $100,000 to $149,999 | 27 (9.9%) | 0 (0.0%) |
| $150,000 or more | 29 (10.6%) | 0 (0.0%) |
| Total | 273 (100.0%) | 6 (100.0%) |
Monthly Housing Cost Tiers in Silkworth
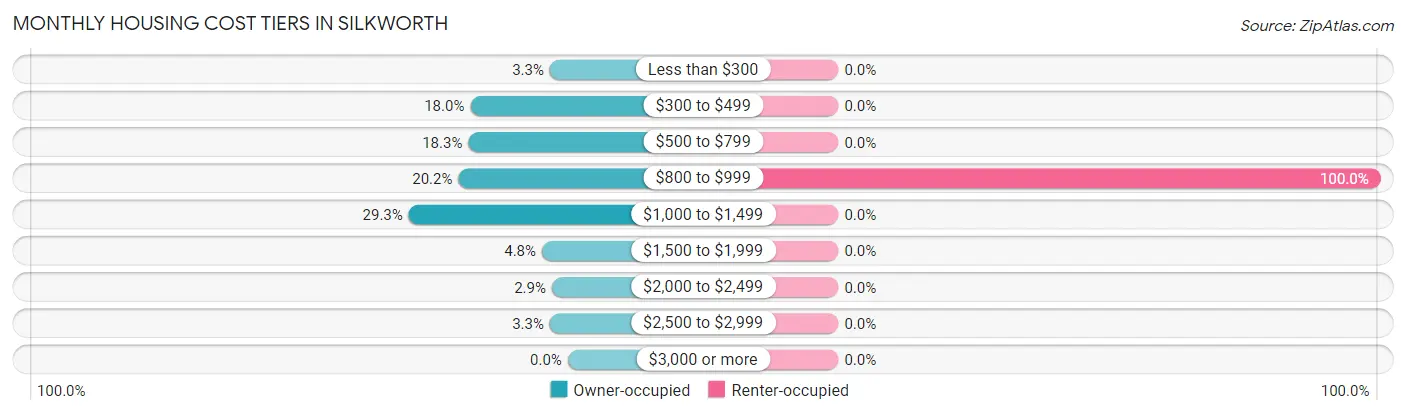
| Monthly Cost | Owner-occupied | Renter-occupied |
| Less than $300 | 9 (3.3%) | 0 (0.0%) |
| $300 to $499 | 49 (17.9%) | 0 (0.0%) |
| $500 to $799 | 50 (18.3%) | 0 (0.0%) |
| $800 to $999 | 55 (20.2%) | 6 (100.0%) |
| $1,000 to $1,499 | 80 (29.3%) | 0 (0.0%) |
| $1,500 to $1,999 | 13 (4.8%) | 0 (0.0%) |
| $2,000 to $2,499 | 8 (2.9%) | 0 (0.0%) |
| $2,500 to $2,999 | 9 (3.3%) | 0 (0.0%) |
| $3,000 or more | 0 (0.0%) | 0 (0.0%) |
| Total | 273 (100.0%) | 6 (100.0%) |
Physical Housing Characteristics in Silkworth
Housing Structures in Silkworth
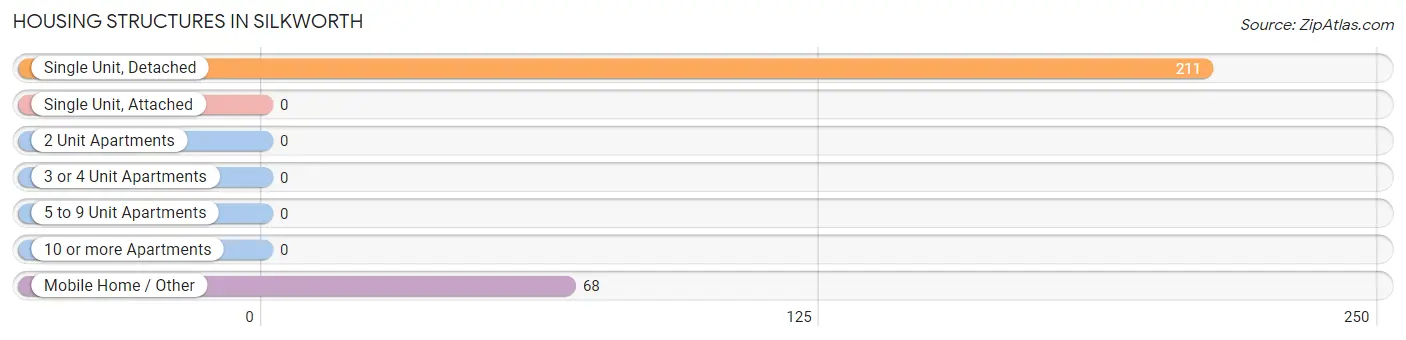
| Structure Type | # Housing Units | % Housing Units |
| Single Unit, Detached | 211 | 75.6% |
| Single Unit, Attached | 0 | 0.0% |
| 2 Unit Apartments | 0 | 0.0% |
| 3 or 4 Unit Apartments | 0 | 0.0% |
| 5 to 9 Unit Apartments | 0 | 0.0% |
| 10 or more Apartments | 0 | 0.0% |
| Mobile Home / Other | 68 | 24.4% |
| Total | 279 | 100.0% |
Housing Structures by Occupancy in Silkworth
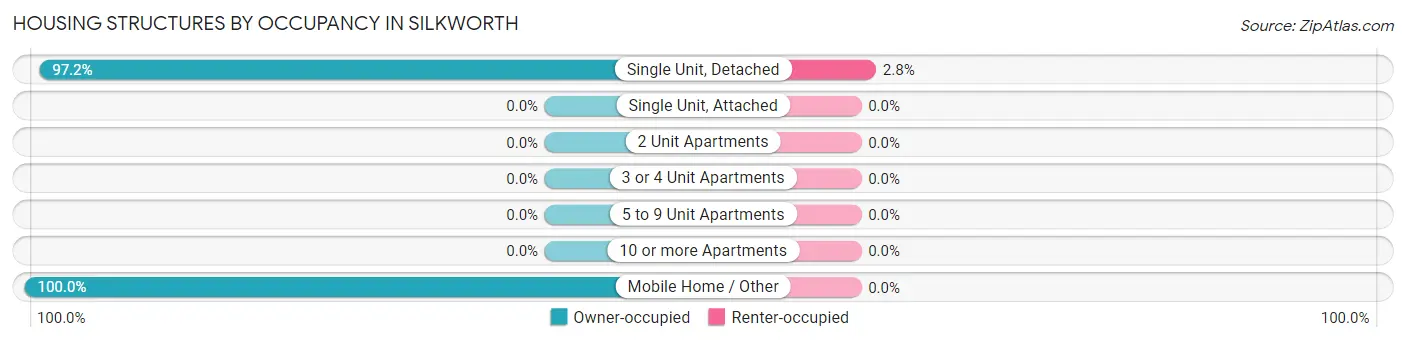
| Structure Type | Owner-occupied | Renter-occupied |
| Single Unit, Detached | 205 (97.2%) | 6 (2.8%) |
| Single Unit, Attached | 0 (0.0%) | 0 (0.0%) |
| 2 Unit Apartments | 0 (0.0%) | 0 (0.0%) |
| 3 or 4 Unit Apartments | 0 (0.0%) | 0 (0.0%) |
| 5 to 9 Unit Apartments | 0 (0.0%) | 0 (0.0%) |
| 10 or more Apartments | 0 (0.0%) | 0 (0.0%) |
| Mobile Home / Other | 68 (100.0%) | 0 (0.0%) |
| Total | 273 (97.9%) | 6 (2.1%) |
Housing Structures by Number of Rooms in Silkworth
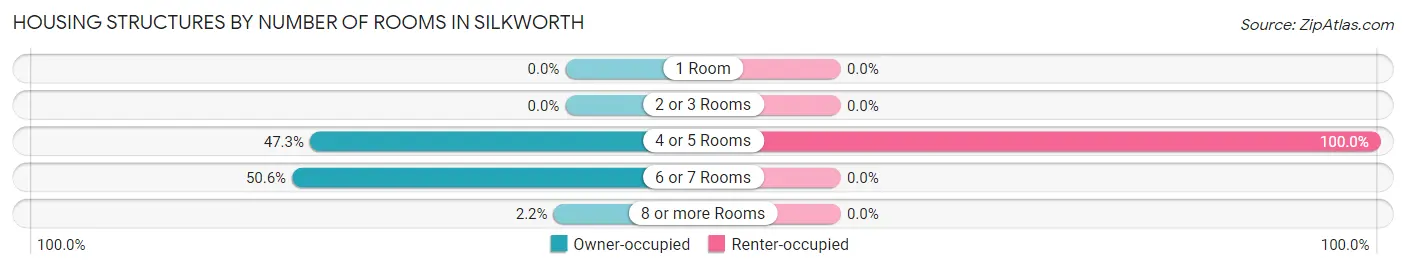
| Number of Rooms | Owner-occupied | Renter-occupied |
| 1 Room | 0 (0.0%) | 0 (0.0%) |
| 2 or 3 Rooms | 0 (0.0%) | 0 (0.0%) |
| 4 or 5 Rooms | 129 (47.2%) | 6 (100.0%) |
| 6 or 7 Rooms | 138 (50.5%) | 0 (0.0%) |
| 8 or more Rooms | 6 (2.2%) | 0 (0.0%) |
| Total | 273 (100.0%) | 6 (100.0%) |
Housing Structure by Heating Type in Silkworth
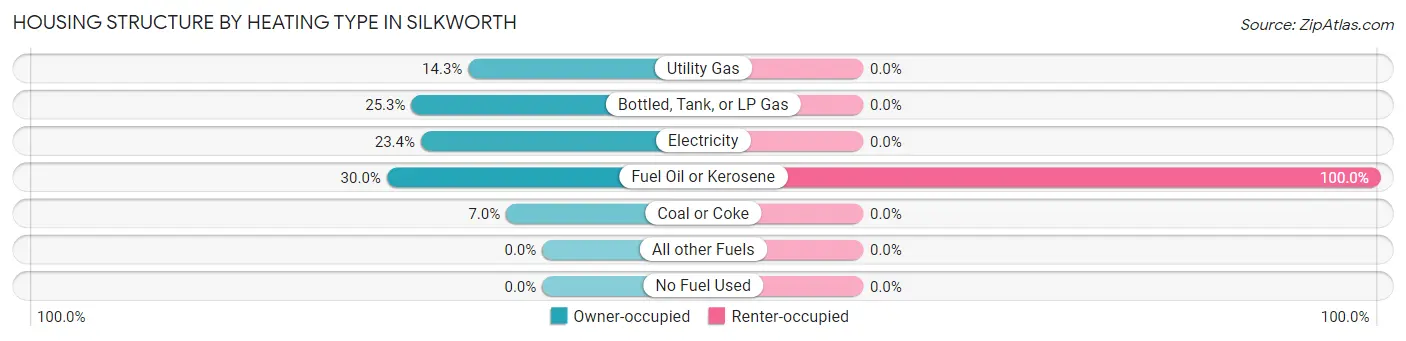
| Heating Type | Owner-occupied | Renter-occupied |
| Utility Gas | 39 (14.3%) | 0 (0.0%) |
| Bottled, Tank, or LP Gas | 69 (25.3%) | 0 (0.0%) |
| Electricity | 64 (23.4%) | 0 (0.0%) |
| Fuel Oil or Kerosene | 82 (30.0%) | 6 (100.0%) |
| Coal or Coke | 19 (7.0%) | 0 (0.0%) |
| All other Fuels | 0 (0.0%) | 0 (0.0%) |
| No Fuel Used | 0 (0.0%) | 0 (0.0%) |
| Total | 273 (100.0%) | 6 (100.0%) |
Household Vehicle Usage in Silkworth
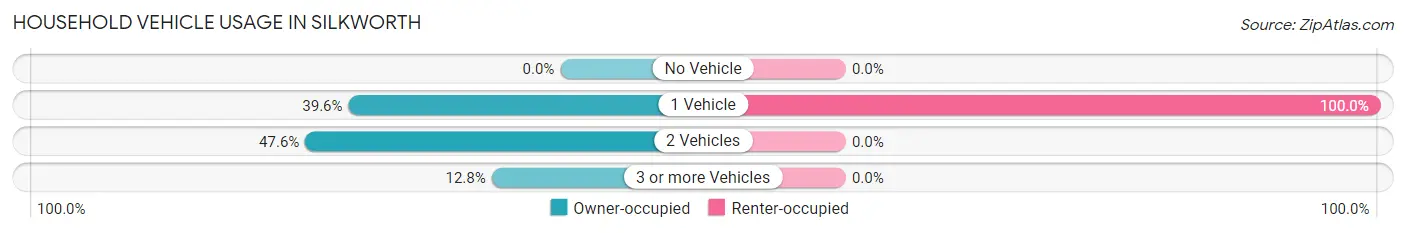
| Vehicles per Household | Owner-occupied | Renter-occupied |
| No Vehicle | 0 (0.0%) | 0 (0.0%) |
| 1 Vehicle | 108 (39.6%) | 6 (100.0%) |
| 2 Vehicles | 130 (47.6%) | 0 (0.0%) |
| 3 or more Vehicles | 35 (12.8%) | 0 (0.0%) |
| Total | 273 (100.0%) | 6 (100.0%) |
Real Estate & Mortgages in Silkworth
Real Estate and Mortgage Overview in Silkworth
| Characteristic | Without Mortgage | With Mortgage |
| Housing Units | 170 | 103 |
| Median Property Value | $201,300 | $126,800 |
| Median Household Income | $35,833 | $9 |
| Monthly Housing Costs | $636 | $0 |
| Real Estate Taxes | $3,308 | $0 |
Property Value by Mortgage Status in Silkworth
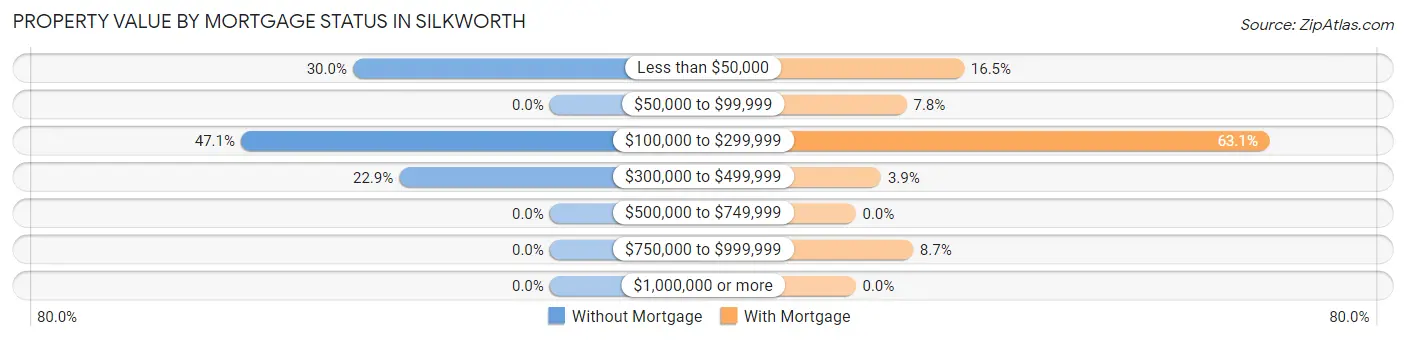
| Property Value | Without Mortgage | With Mortgage |
| Less than $50,000 | 51 (30.0%) | 17 (16.5%) |
| $50,000 to $99,999 | 0 (0.0%) | 8 (7.8%) |
| $100,000 to $299,999 | 80 (47.1%) | 65 (63.1%) |
| $300,000 to $499,999 | 39 (22.9%) | 4 (3.9%) |
| $500,000 to $749,999 | 0 (0.0%) | 0 (0.0%) |
| $750,000 to $999,999 | 0 (0.0%) | 9 (8.7%) |
| $1,000,000 or more | 0 (0.0%) | 0 (0.0%) |
| Total | 170 (100.0%) | 103 (100.0%) |
Household Income by Mortgage Status in Silkworth
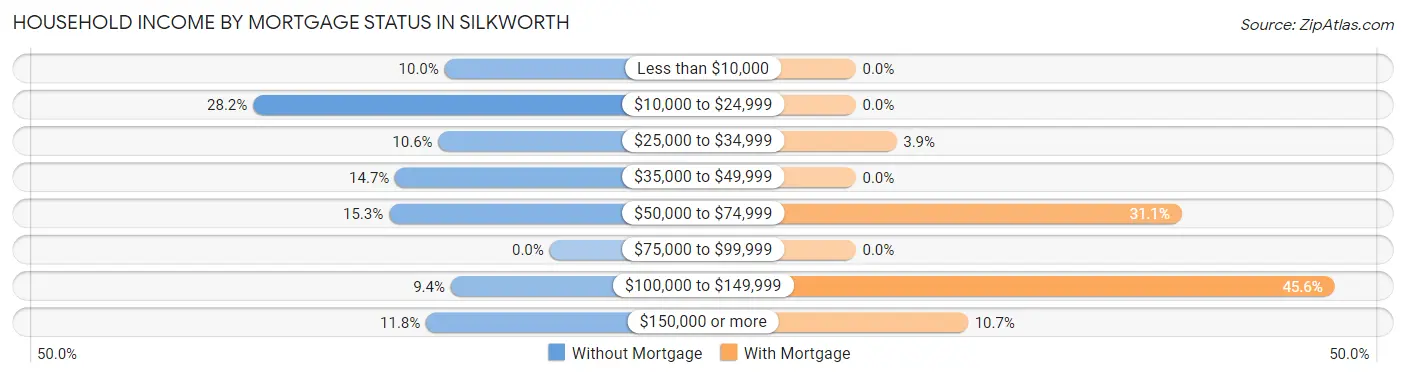
| Household Income | Without Mortgage | With Mortgage |
| Less than $10,000 | 17 (10.0%) | 0 (0.0%) |
| $10,000 to $24,999 | 48 (28.2%) | 0 (0.0%) |
| $25,000 to $34,999 | 18 (10.6%) | 4 (3.9%) |
| $35,000 to $49,999 | 25 (14.7%) | 0 (0.0%) |
| $50,000 to $74,999 | 26 (15.3%) | 32 (31.1%) |
| $75,000 to $99,999 | 0 (0.0%) | 0 (0.0%) |
| $100,000 to $149,999 | 16 (9.4%) | 47 (45.6%) |
| $150,000 or more | 20 (11.8%) | 11 (10.7%) |
| Total | 170 (100.0%) | 103 (100.0%) |
Property Value to Household Income Ratio in Silkworth
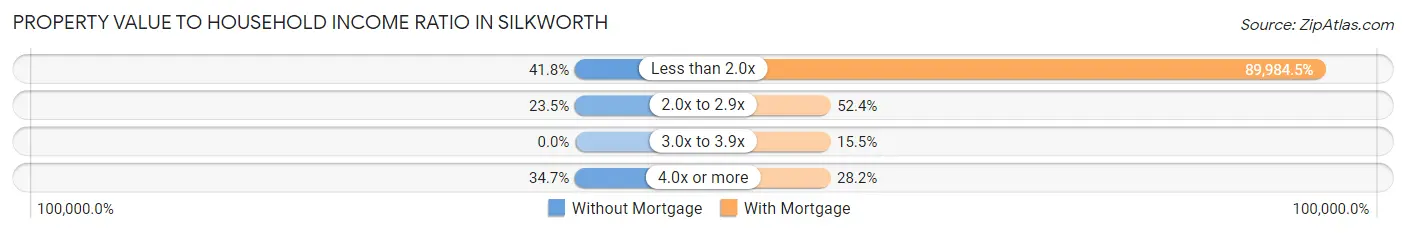
| Value-to-Income Ratio | Without Mortgage | With Mortgage |
| Less than 2.0x | 71 (41.8%) | 92,684 (89,984.5%) |
| 2.0x to 2.9x | 40 (23.5%) | 54 (52.4%) |
| 3.0x to 3.9x | 0 (0.0%) | 16 (15.5%) |
| 4.0x or more | 59 (34.7%) | 29 (28.2%) |
| Total | 170 (100.0%) | 103 (100.0%) |
Real Estate Taxes by Mortgage Status in Silkworth
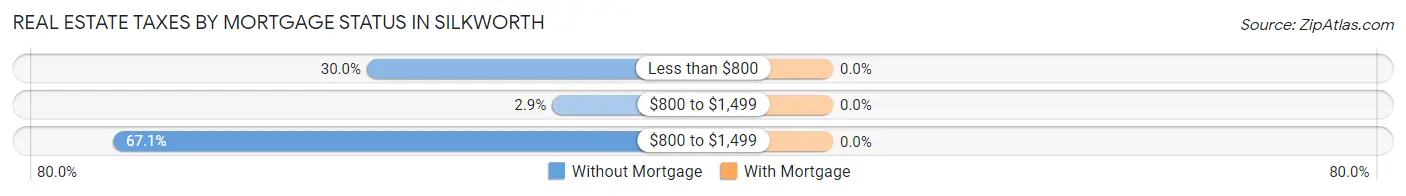
| Property Taxes | Without Mortgage | With Mortgage |
| Less than $800 | 51 (30.0%) | 0 (0.0%) |
| $800 to $1,499 | 5 (2.9%) | 0 (0.0%) |
| $800 to $1,499 | 114 (67.1%) | 0 (0.0%) |
| Total | 170 (100.0%) | 103 (100.0%) |
Health & Disability in Silkworth
Health Insurance Coverage by Age in Silkworth
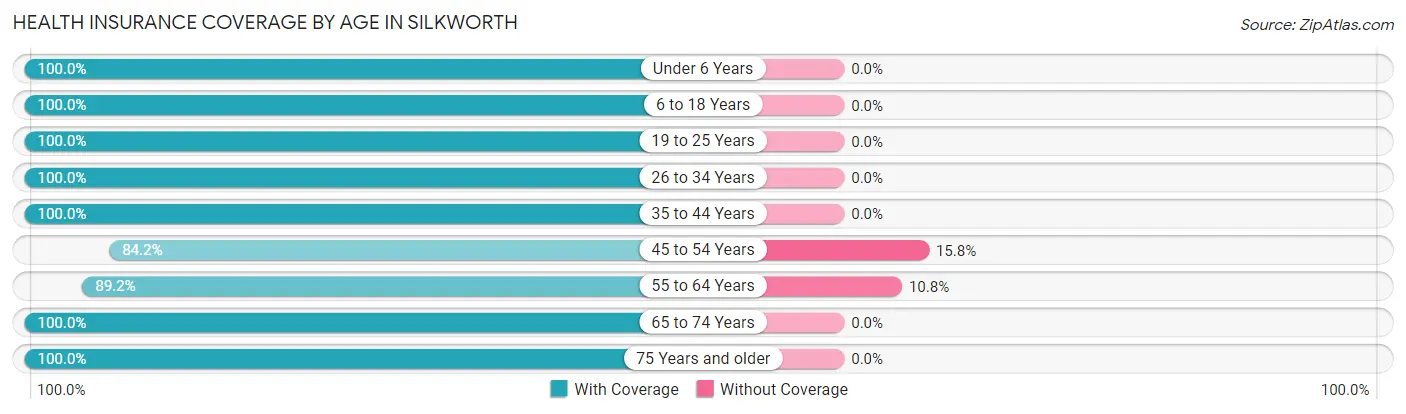
| Age Bracket | With Coverage | Without Coverage |
| Under 6 Years | 8 (100.0%) | 0 (0.0%) |
| 6 to 18 Years | 25 (100.0%) | 0 (0.0%) |
| 19 to 25 Years | 20 (100.0%) | 0 (0.0%) |
| 26 to 34 Years | 17 (100.0%) | 0 (0.0%) |
| 35 to 44 Years | 5 (100.0%) | 0 (0.0%) |
| 45 to 54 Years | 80 (84.2%) | 15 (15.8%) |
| 55 to 64 Years | 141 (89.2%) | 17 (10.8%) |
| 65 to 74 Years | 121 (100.0%) | 0 (0.0%) |
| 75 Years and older | 47 (100.0%) | 0 (0.0%) |
| Total | 464 (93.5%) | 32 (6.5%) |
Health Insurance Coverage by Citizenship Status in Silkworth
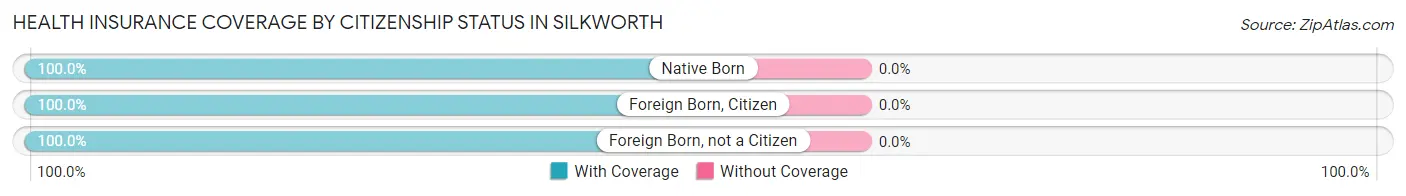
| Citizenship Status | With Coverage | Without Coverage |
| Native Born | 8 (100.0%) | 0 (0.0%) |
| Foreign Born, Citizen | 25 (100.0%) | 0 (0.0%) |
| Foreign Born, not a Citizen | 20 (100.0%) | 0 (0.0%) |
Health Insurance Coverage by Household Income in Silkworth
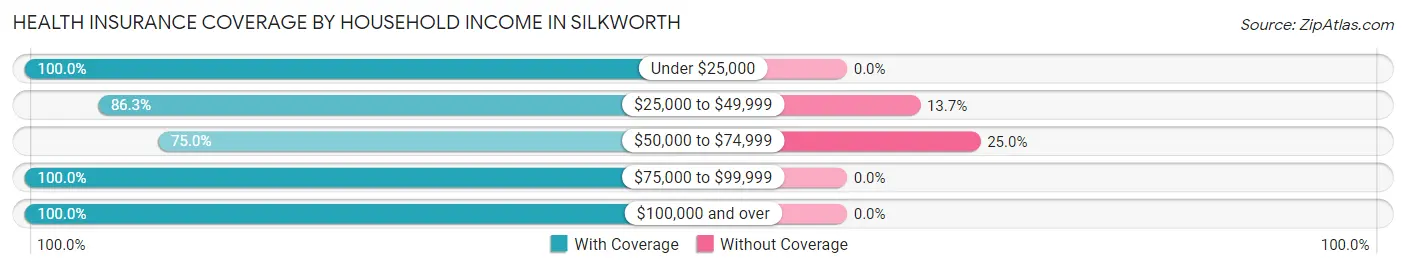
| Household Income | With Coverage | Without Coverage |
| Under $25,000 | 78 (100.0%) | 0 (0.0%) |
| $25,000 to $49,999 | 107 (86.3%) | 17 (13.7%) |
| $50,000 to $74,999 | 42 (75.0%) | 14 (25.0%) |
| $75,000 to $99,999 | 117 (100.0%) | 0 (0.0%) |
| $100,000 and over | 117 (100.0%) | 0 (0.0%) |
Public vs Private Health Insurance Coverage by Age in Silkworth
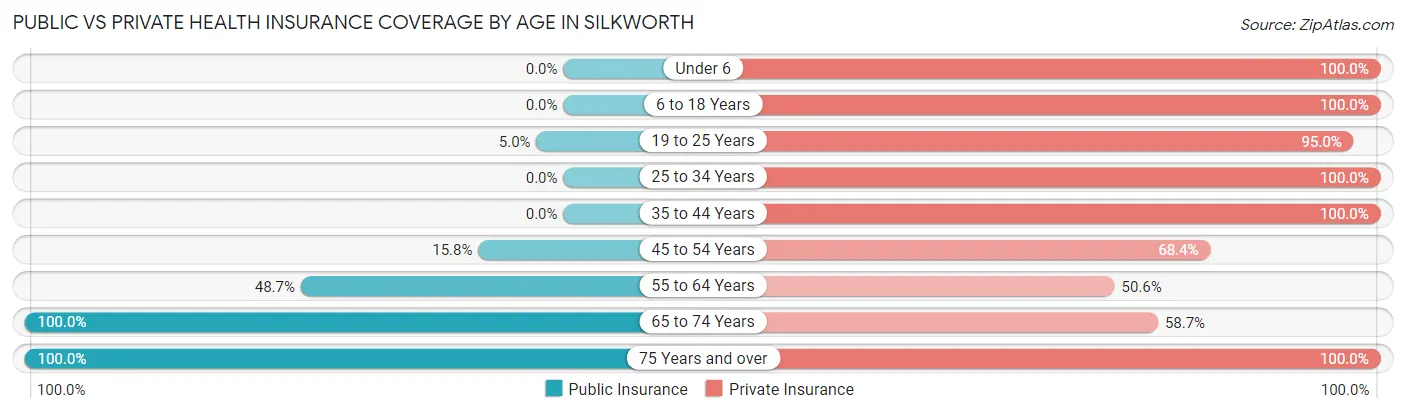
| Age Bracket | Public Insurance | Private Insurance |
| Under 6 | 0 (0.0%) | 8 (100.0%) |
| 6 to 18 Years | 0 (0.0%) | 25 (100.0%) |
| 19 to 25 Years | 1 (5.0%) | 19 (95.0%) |
| 25 to 34 Years | 0 (0.0%) | 17 (100.0%) |
| 35 to 44 Years | 0 (0.0%) | 5 (100.0%) |
| 45 to 54 Years | 15 (15.8%) | 65 (68.4%) |
| 55 to 64 Years | 77 (48.7%) | 80 (50.6%) |
| 65 to 74 Years | 121 (100.0%) | 71 (58.7%) |
| 75 Years and over | 47 (100.0%) | 47 (100.0%) |
| Total | 261 (52.6%) | 337 (67.9%) |
Disability Status by Sex by Age in Silkworth
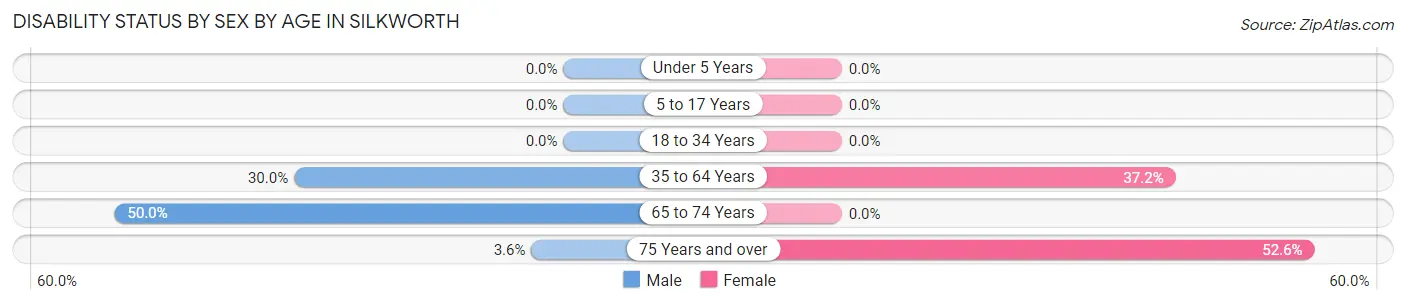
| Age Bracket | Male | Female |
| Under 5 Years | 0 (0.0%) | 0 (0.0%) |
| 5 to 17 Years | 0 (0.0%) | 0 (0.0%) |
| 18 to 34 Years | 0 (0.0%) | 0 (0.0%) |
| 35 to 64 Years | 33 (30.0%) | 55 (37.2%) |
| 65 to 74 Years | 24 (50.0%) | 0 (0.0%) |
| 75 Years and over | 1 (3.6%) | 10 (52.6%) |
Disability Class by Sex by Age in Silkworth
Disability Class: Hearing Difficulty
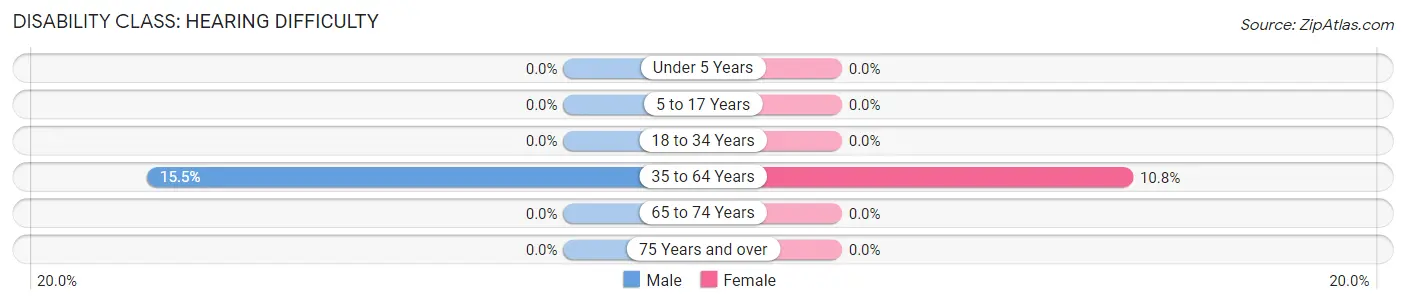
| Age Bracket | Male | Female |
| Under 5 Years | 0 (0.0%) | 0 (0.0%) |
| 5 to 17 Years | 0 (0.0%) | 0 (0.0%) |
| 18 to 34 Years | 0 (0.0%) | 0 (0.0%) |
| 35 to 64 Years | 17 (15.4%) | 16 (10.8%) |
| 65 to 74 Years | 0 (0.0%) | 0 (0.0%) |
| 75 Years and over | 0 (0.0%) | 0 (0.0%) |
Disability Class: Vision Difficulty
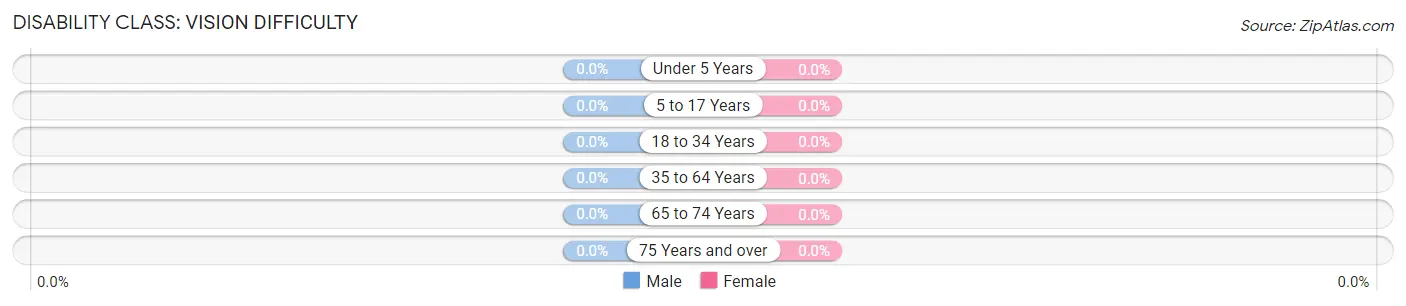
| Age Bracket | Male | Female |
| Under 5 Years | 0 (0.0%) | 0 (0.0%) |
| 5 to 17 Years | 0 (0.0%) | 0 (0.0%) |
| 18 to 34 Years | 0 (0.0%) | 0 (0.0%) |
| 35 to 64 Years | 0 (0.0%) | 0 (0.0%) |
| 65 to 74 Years | 0 (0.0%) | 0 (0.0%) |
| 75 Years and over | 0 (0.0%) | 0 (0.0%) |
Disability Class: Cognitive Difficulty
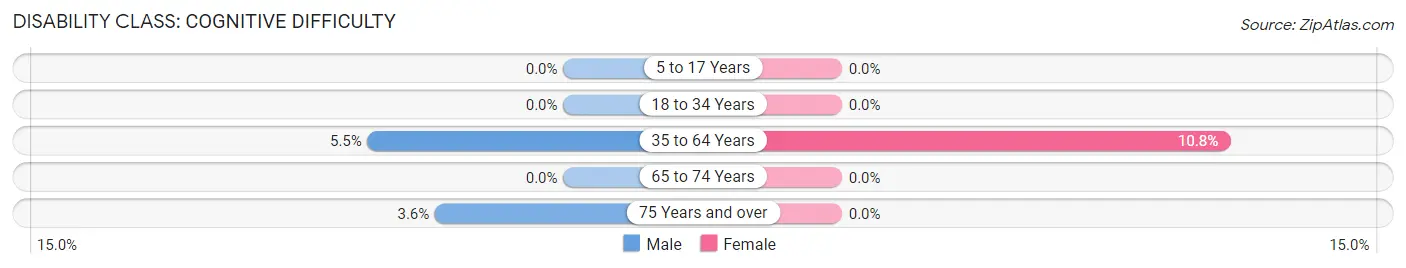
| Age Bracket | Male | Female |
| 5 to 17 Years | 0 (0.0%) | 0 (0.0%) |
| 18 to 34 Years | 0 (0.0%) | 0 (0.0%) |
| 35 to 64 Years | 6 (5.4%) | 16 (10.8%) |
| 65 to 74 Years | 0 (0.0%) | 0 (0.0%) |
| 75 Years and over | 1 (3.6%) | 0 (0.0%) |
Disability Class: Ambulatory Difficulty
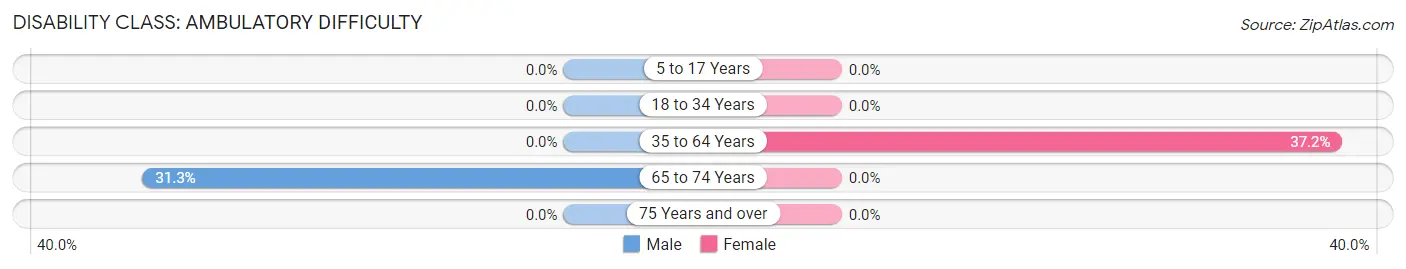
| Age Bracket | Male | Female |
| 5 to 17 Years | 0 (0.0%) | 0 (0.0%) |
| 18 to 34 Years | 0 (0.0%) | 0 (0.0%) |
| 35 to 64 Years | 0 (0.0%) | 55 (37.2%) |
| 65 to 74 Years | 15 (31.2%) | 0 (0.0%) |
| 75 Years and over | 0 (0.0%) | 0 (0.0%) |
Disability Class: Self-Care Difficulty
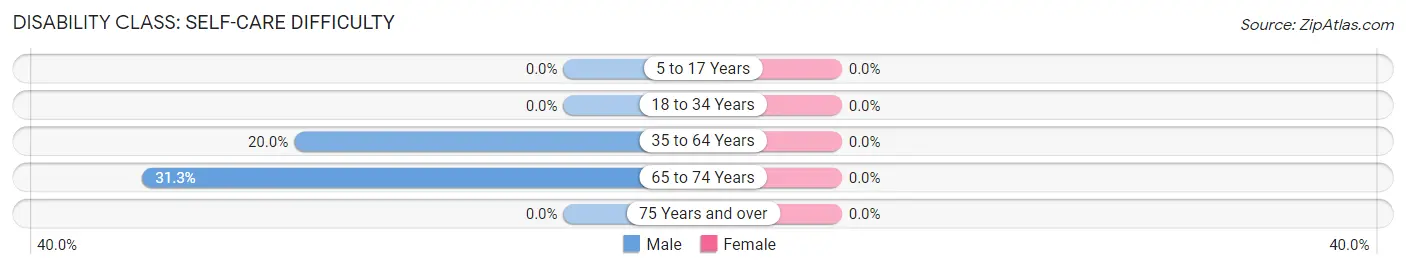
| Age Bracket | Male | Female |
| 5 to 17 Years | 0 (0.0%) | 0 (0.0%) |
| 18 to 34 Years | 0 (0.0%) | 0 (0.0%) |
| 35 to 64 Years | 22 (20.0%) | 0 (0.0%) |
| 65 to 74 Years | 15 (31.2%) | 0 (0.0%) |
| 75 Years and over | 0 (0.0%) | 0 (0.0%) |
Technology Access in Silkworth
Computing Device Access in Silkworth
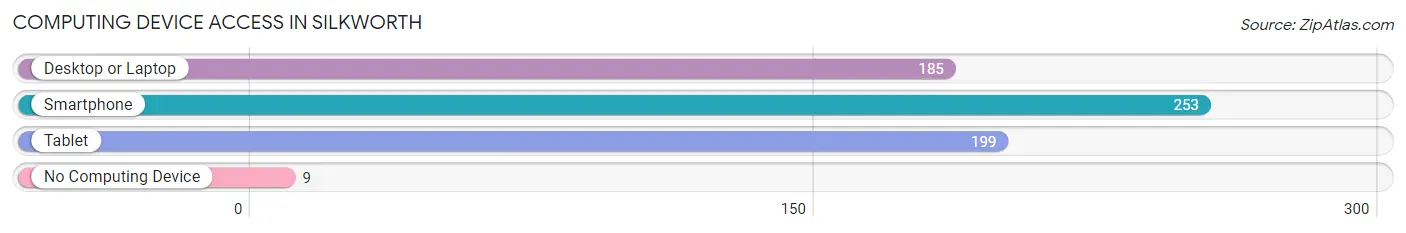
| Device Type | # Households | % Households |
| Desktop or Laptop | 185 | 66.3% |
| Smartphone | 253 | 90.7% |
| Tablet | 199 | 71.3% |
| No Computing Device | 9 | 3.2% |
| Total | 279 | 100.0% |
Internet Access in Silkworth
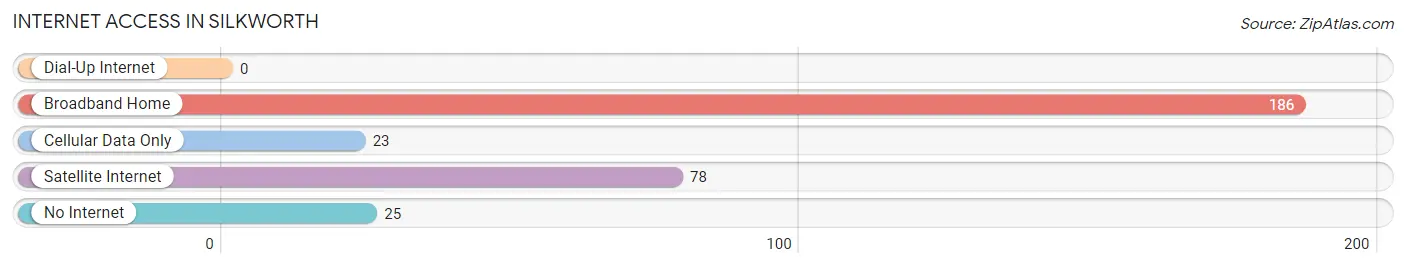
| Internet Type | # Households | % Households |
| Dial-Up Internet | 0 | 0.0% |
| Broadband Home | 186 | 66.7% |
| Cellular Data Only | 23 | 8.2% |
| Satellite Internet | 78 | 28.0% |
| No Internet | 25 | 9.0% |
| Total | 279 | 100.0% |
Silkworth Summary
Silkworth is a small borough located in Luzerne County, Pennsylvania. It is situated in the Wyoming Valley, a region of the state known for its rich history and culture. The borough is located in the heart of the valley, just south of Wilkes-Barre and north of Pittston. The population of Silkworth was 1,845 as of the 2010 census.
History
The area that is now Silkworth was first settled in the late 1700s by a group of Welsh immigrants. The town was originally known as “Silkworth” after the silkworm industry that was prominent in the area. The town was officially incorporated in 1891.
In the early 1900s, Silkworth was a thriving industrial center. The silkworm industry was still prominent, but the town also had a number of other industries, including coal mining, textiles, and manufacturing. The town was also home to a number of businesses, including a hotel, a bank, and a movie theater.
The Great Depression hit Silkworth hard, and many of the town’s businesses closed. The silkworm industry also declined, and the town’s population began to decline as well. The population of Silkworth was 1,845 as of the 2010 census.
Geography
Silkworth is located in the Wyoming Valley of northeastern Pennsylvania. The borough is situated in the heart of the valley, just south of Wilkes-Barre and north of Pittston. The borough is bordered by the Susquehanna River to the east and the Lackawanna River to the west.
The borough has a total area of 0.7 square miles, all of which is land. The terrain is mostly flat, with some rolling hills. The climate is humid continental, with cold winters and hot, humid summers.
Economy
Silkworth’s economy is largely based on the service industry. The town is home to a number of restaurants, bars, and other businesses that cater to the local population. The town also has a number of retail stores, including a grocery store, a hardware store, and a pharmacy.
The town is also home to a number of manufacturing businesses, including a plastics factory and a metal fabrication plant. The town is also home to a number of small businesses, including a bakery, a florist, and a furniture store.
Demographics
As of the 2010 census, the population of Silkworth was 1,845. The racial makeup of the borough was 97.3% White, 0.9% African American, 0.2% Native American, 0.2% Asian, and 1.4% from other races. Hispanic or Latino of any race were 1.2% of the population.
The median household income in Silkworth was $37,917, and the median family income was $45,000. The per capita income was $19,945. About 11.2% of families and 13.2% of the population were below the poverty line, including 17.2% of those under age 18 and 8.2% of those age 65 or over.
Common Questions
What is Per Capita Income in Silkworth?
Per Capita income in Silkworth is $41,176.
What is the Median Family Income in Silkworth?
Median Family Income in Silkworth is $65,673.
What is the Median Household income in Silkworth?
Median Household Income in Silkworth is $49,028.
What is Income or Wage Gap in Silkworth?
Income or Wage Gap in Silkworth is 43.0%.
Women in Silkworth earn 57.0 cents for every dollar earned by a man.
What is Inequality or Gini Index in Silkworth?
Inequality or Gini Index in Silkworth is 0.46.
What is the Total Population of Silkworth?
Total Population of Silkworth is 496.
What is the Total Male Population of Silkworth?
Total Male Population of Silkworth is 205.
What is the Total Female Population of Silkworth?
Total Female Population of Silkworth is 291.
What is the Ratio of Males per 100 Females in Silkworth?
There are 70.45 Males per 100 Females in Silkworth.
What is the Ratio of Females per 100 Males in Silkworth?
There are 141.95 Females per 100 Males in Silkworth.
What is the Median Population Age in Silkworth?
Median Population Age in Silkworth is 60.4 Years.
What is the Average Family Size in Silkworth
Average Family Size in Silkworth is 2.2 People.
What is the Average Household Size in Silkworth
Average Household Size in Silkworth is 1.8 People.
How Large is the Labor Force in Silkworth?
There are 218 People in the Labor Forcein in Silkworth.
What is the Percentage of People in the Labor Force in Silkworth?
44.7% of People are in the Labor Force in Silkworth.
What is the Unemployment Rate in Silkworth?
Unemployment Rate in Silkworth is 6.9%.