Twilight borough, PA Map & Demographics
Twilight borough Overview
$46,394
PER CAPITA INCOME
$84,375
AVG FAMILY INCOME
$68,542
AVG HOUSEHOLD INCOME
67.2%
WAGE / INCOME GAP [ % ]
32.8¢/ $1
WAGE / INCOME GAP [ $ ]
0.59
INEQUALITY / GINI INDEX
265
TOTAL POPULATION
118
MALE POPULATION
147
FEMALE POPULATION
80.27
MALES / 100 FEMALES
124.58
FEMALES / 100 MALES
45.1
MEDIAN AGE
3.5
AVG FAMILY SIZE
3.0
AVG HOUSEHOLD SIZE
115
LABOR FORCE [ PEOPLE ]
50.7%
PERCENT IN LABOR FORCE
3.5%
UNEMPLOYMENT RATE
Income in Twilight borough
Income Overview in Twilight borough
Per Capita Income in Twilight borough is $46,394, while median incomes of families and households are $84,375 and $68,542 respectively.
| Characteristic | Number | Measure |
| Per Capita Income | 265 | $46,394 |
| Median Family Income | 71 | $84,375 |
| Mean Family Income | 71 | $165,149 |
| Median Household Income | 87 | $68,542 |
| Mean Household Income | 87 | $140,182 |
| Income Deficit | 71 | $0 |
| Wage / Income Gap (%) | 265 | 67.17% |
| Wage / Income Gap ($) | 265 | 32.83¢ per $1 |
| Gini / Inequality Index | 265 | 0.59 |
Earnings by Sex in Twilight borough
Average Earnings in Twilight borough are $36,250, $51,406 for men and $16,875 for women, a difference of 67.2%.
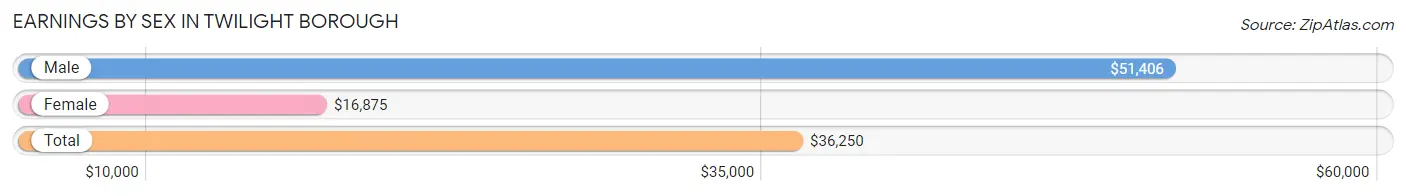
| Sex | Number | Average Earnings |
| Male | 49 (41.2%) | $51,406 |
| Female | 70 (58.8%) | $16,875 |
| Total | 119 (100.0%) | $36,250 |
Earnings by Sex by Income Bracket in Twilight borough
The most common earnings brackets in Twilight borough are $100,000+ for men (15 | 30.6%) and $5,000 to $7,499 for women (12 | 17.1%).
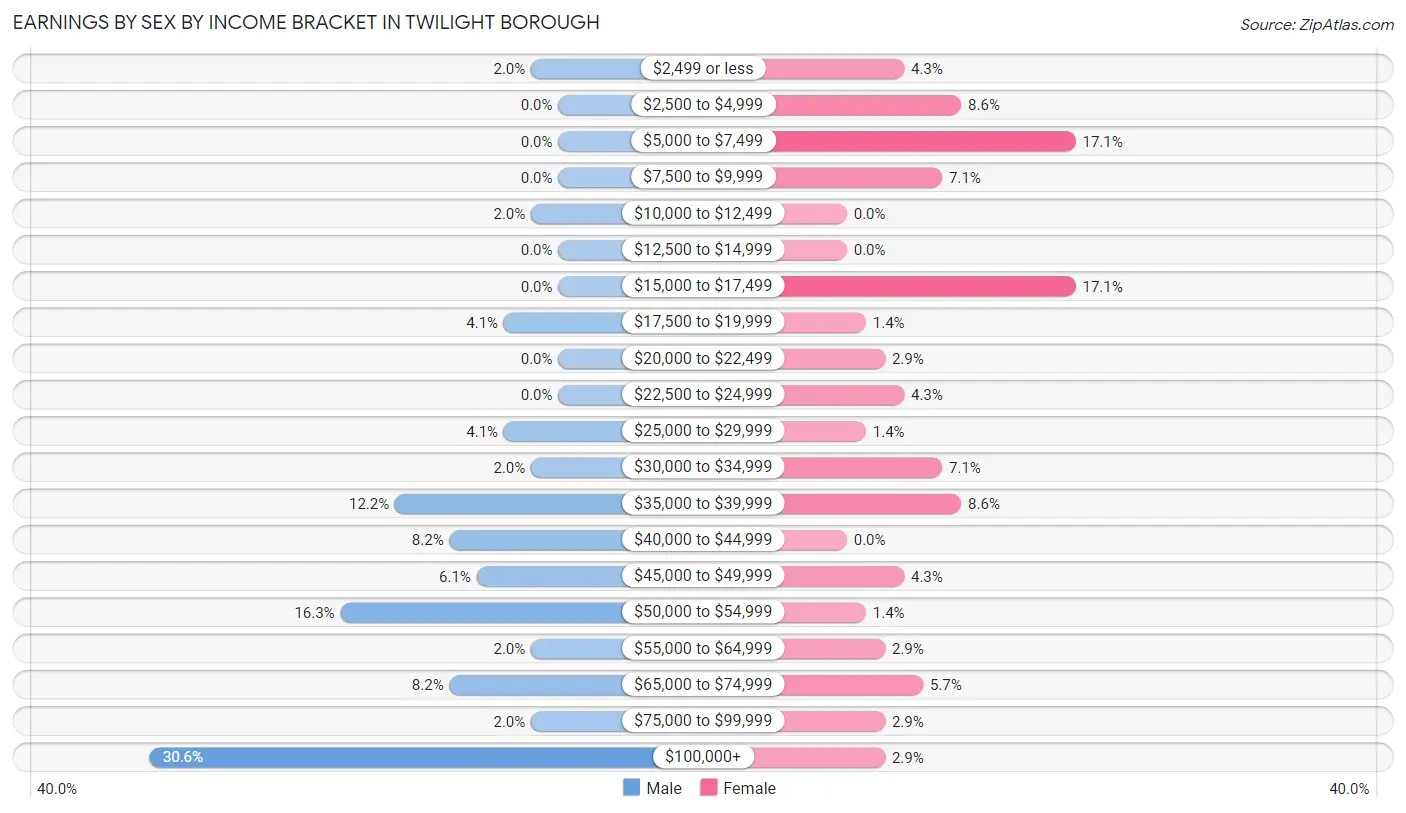
| Income | Male | Female |
| $2,499 or less | 1 (2.0%) | 3 (4.3%) |
| $2,500 to $4,999 | 0 (0.0%) | 6 (8.6%) |
| $5,000 to $7,499 | 0 (0.0%) | 12 (17.1%) |
| $7,500 to $9,999 | 0 (0.0%) | 5 (7.1%) |
| $10,000 to $12,499 | 1 (2.0%) | 0 (0.0%) |
| $12,500 to $14,999 | 0 (0.0%) | 0 (0.0%) |
| $15,000 to $17,499 | 0 (0.0%) | 12 (17.1%) |
| $17,500 to $19,999 | 2 (4.1%) | 1 (1.4%) |
| $20,000 to $22,499 | 0 (0.0%) | 2 (2.9%) |
| $22,500 to $24,999 | 0 (0.0%) | 3 (4.3%) |
| $25,000 to $29,999 | 2 (4.1%) | 1 (1.4%) |
| $30,000 to $34,999 | 1 (2.0%) | 5 (7.1%) |
| $35,000 to $39,999 | 6 (12.2%) | 6 (8.6%) |
| $40,000 to $44,999 | 4 (8.2%) | 0 (0.0%) |
| $45,000 to $49,999 | 3 (6.1%) | 3 (4.3%) |
| $50,000 to $54,999 | 8 (16.3%) | 1 (1.4%) |
| $55,000 to $64,999 | 1 (2.0%) | 2 (2.9%) |
| $65,000 to $74,999 | 4 (8.2%) | 4 (5.7%) |
| $75,000 to $99,999 | 1 (2.0%) | 2 (2.9%) |
| $100,000+ | 15 (30.6%) | 2 (2.9%) |
| Total | 49 (100.0%) | 70 (100.0%) |
Earnings by Sex by Educational Attainment in Twilight borough
Average earnings in Twilight borough are $51,563 for men and $22,917 for women, a difference of 55.6%. Men with an educational attainment of high school diploma enjoy the highest average annual earnings of $86,250, while those with college or associate's degree education earn the least with $50,625. Women with an educational attainment of bachelor's degree earn the most with the average annual earnings of $56,250, while those with college or associate's degree education have the smallest earnings of $17,083.
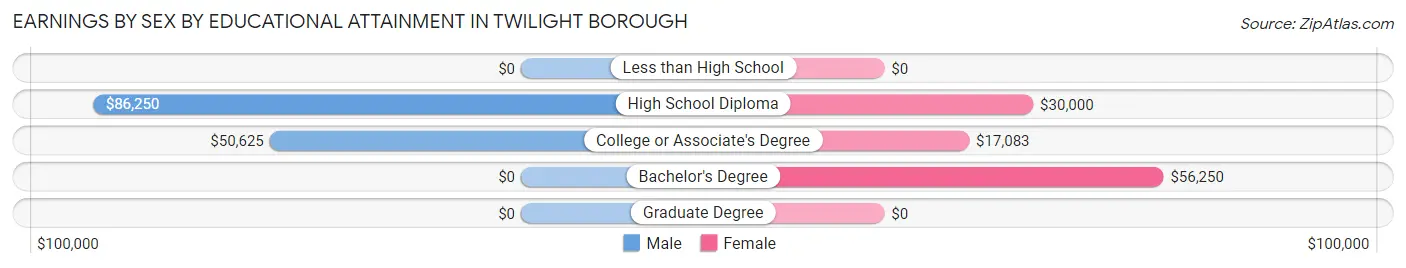
| Educational Attainment | Male Income | Female Income |
| Less than High School | - | - |
| High School Diploma | $86,250 | $30,000 |
| College or Associate's Degree | $50,625 | $17,083 |
| Bachelor's Degree | - | - |
| Graduate Degree | - | - |
| Total | $51,563 | $22,917 |
Family Income in Twilight borough
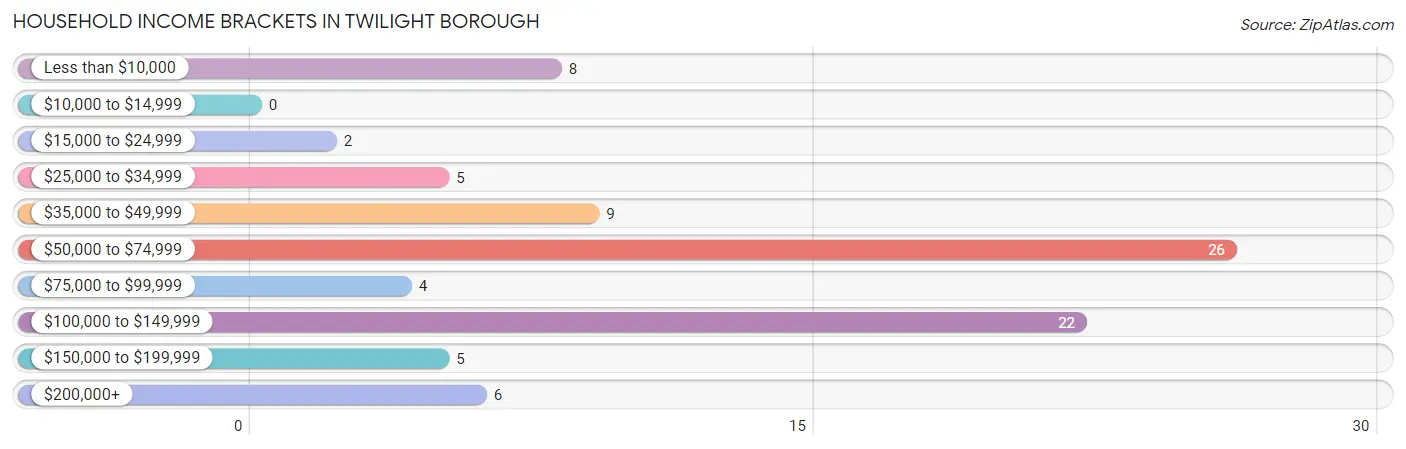
Family Income Brackets in Twilight borough
According to the Twilight borough family income data, there are 26 families falling into the $50,000 to $74,999 income range, which is the most common income bracket and makes up 36.6% of all families.
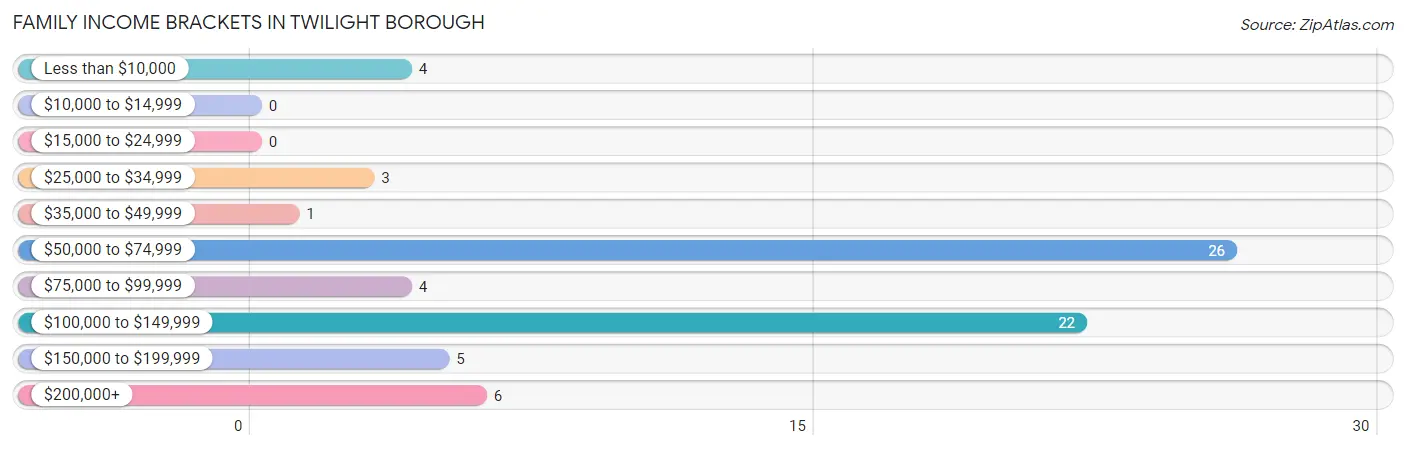
| Income Bracket | # Families | % Families |
| Less than $10,000 | 4 | 5.6% |
| $10,000 to $14,999 | 0 | 0.0% |
| $15,000 to $24,999 | 0 | 0.0% |
| $25,000 to $34,999 | 3 | 4.2% |
| $35,000 to $49,999 | 1 | 1.4% |
| $50,000 to $74,999 | 26 | 36.6% |
| $75,000 to $99,999 | 4 | 5.6% |
| $100,000 to $149,999 | 22 | 31.0% |
| $150,000 to $199,999 | 5 | 7.0% |
| $200,000+ | 6 | 8.5% |
Family Income by Famaliy Size in Twilight borough
4-person families (22 | 31.0%) account for the highest median family income in Twilight borough with $116,346 per family, while 2-person families (31 | 43.7%) have the highest median income of $31,875 per family member.
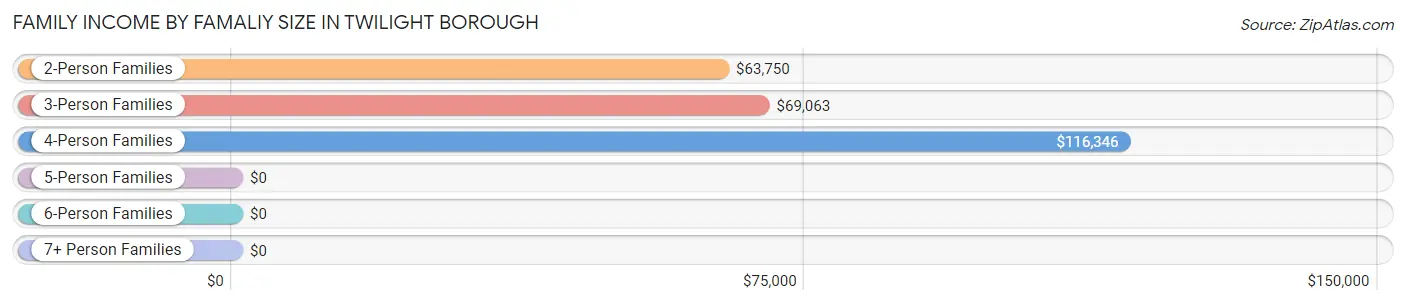
| Income Bracket | # Families | Median Income |
| 2-Person Families | 31 (43.7%) | $63,750 |
| 3-Person Families | 9 (12.7%) | $69,063 |
| 4-Person Families | 22 (31.0%) | $116,346 |
| 5-Person Families | 9 (12.7%) | $0 |
| 6-Person Families | 0 (0.0%) | $0 |
| 7+ Person Families | 0 (0.0%) | $0 |
| Total | 71 (100.0%) | $84,375 |
Family Income by Number of Earners in Twilight borough
The median family income in Twilight borough is $84,375, with families comprising 2 earners (32) having the highest median family income of $115,962, while families with 1 earner (11) have the lowest median family income of $57,917, accounting for 45.1% and 15.5% of families, respectively.
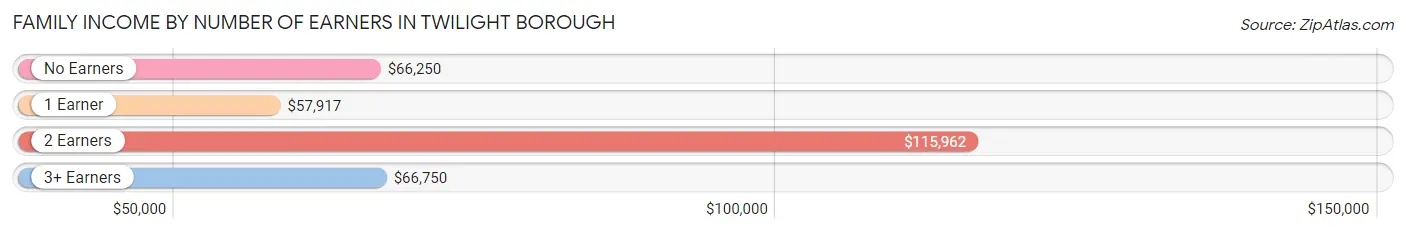
| Number of Earners | # Families | Median Income |
| No Earners | 19 (26.8%) | $66,250 |
| 1 Earner | 11 (15.5%) | $57,917 |
| 2 Earners | 32 (45.1%) | $115,962 |
| 3+ Earners | 9 (12.7%) | $66,750 |
| Total | 71 (100.0%) | $84,375 |
Household Income in Twilight borough
Household Income Brackets in Twilight borough
With 26 households falling in the category, the $50,000 to $74,999 income range is the most frequent in Twilight borough, accounting for 29.9% of all households.
| Income Bracket | # Households | % Households |
| Less than $10,000 | 8 | 9.2% |
| $10,000 to $14,999 | 0 | 0.0% |
| $15,000 to $24,999 | 2 | 2.3% |
| $25,000 to $34,999 | 5 | 5.7% |
| $35,000 to $49,999 | 9 | 10.3% |
| $50,000 to $74,999 | 26 | 29.9% |
| $75,000 to $99,999 | 4 | 4.6% |
| $100,000 to $149,999 | 22 | 25.3% |
| $150,000 to $199,999 | 5 | 5.7% |
| $200,000+ | 6 | 6.9% |
Household Income by Householder Age in Twilight borough
The median household income in Twilight borough is $68,542, with the highest median household income of $87,500 found in the 45 to 64 years age bracket for the primary householder. A total of 42 households (48.3%) fall into this category.
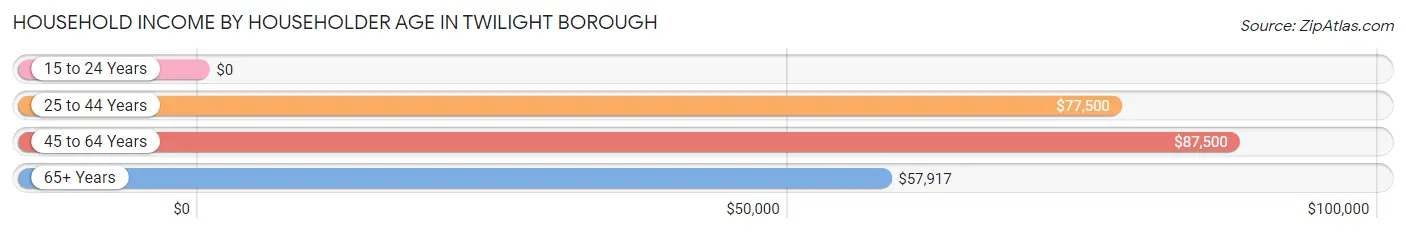
| Income Bracket | # Households | Median Income |
| 15 to 24 Years | 0 (0.0%) | $0 |
| 25 to 44 Years | 14 (16.1%) | $77,500 |
| 45 to 64 Years | 42 (48.3%) | $87,500 |
| 65+ Years | 31 (35.6%) | $57,917 |
| Total | 87 (100.0%) | $68,542 |
Poverty in Twilight borough
Income Below Poverty by Sex and Age in Twilight borough
With 3.4% poverty level for males and 8.2% for females among the residents of Twilight borough, 75 year old and over males and 25 to 34 year old females are the most vulnerable to poverty, with 4 males (50.0%) and 4 females (57.1%) in their respective age groups living below the poverty level.
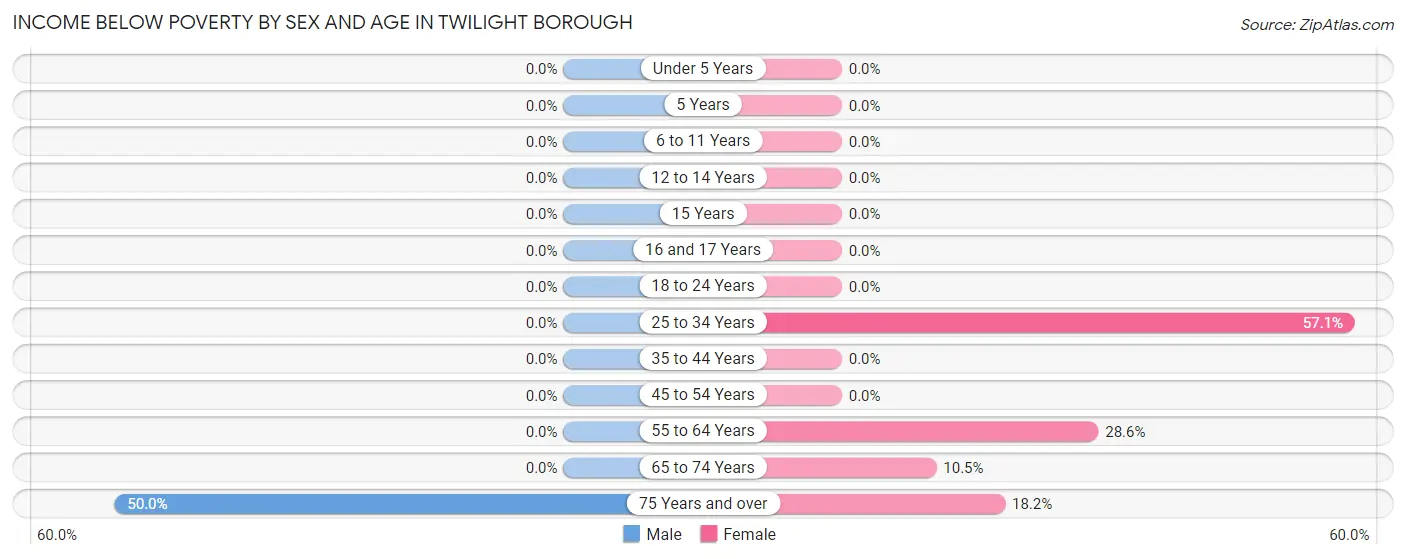
| Age Bracket | Male | Female |
| Under 5 Years | 0 (0.0%) | 0 (0.0%) |
| 5 Years | 0 (0.0%) | 0 (0.0%) |
| 6 to 11 Years | 0 (0.0%) | 0 (0.0%) |
| 12 to 14 Years | 0 (0.0%) | 0 (0.0%) |
| 15 Years | 0 (0.0%) | 0 (0.0%) |
| 16 and 17 Years | 0 (0.0%) | 0 (0.0%) |
| 18 to 24 Years | 0 (0.0%) | 0 (0.0%) |
| 25 to 34 Years | 0 (0.0%) | 4 (57.1%) |
| 35 to 44 Years | 0 (0.0%) | 0 (0.0%) |
| 45 to 54 Years | 0 (0.0%) | 0 (0.0%) |
| 55 to 64 Years | 0 (0.0%) | 4 (28.6%) |
| 65 to 74 Years | 0 (0.0%) | 2 (10.5%) |
| 75 Years and over | 4 (50.0%) | 2 (18.2%) |
| Total | 4 (3.4%) | 12 (8.2%) |
Income Above Poverty by Sex and Age in Twilight borough
According to the poverty statistics in Twilight borough, males aged under 5 years and females aged under 5 years are the age groups that are most secure financially, with 100.0% of males and 100.0% of females in these age groups living above the poverty line.
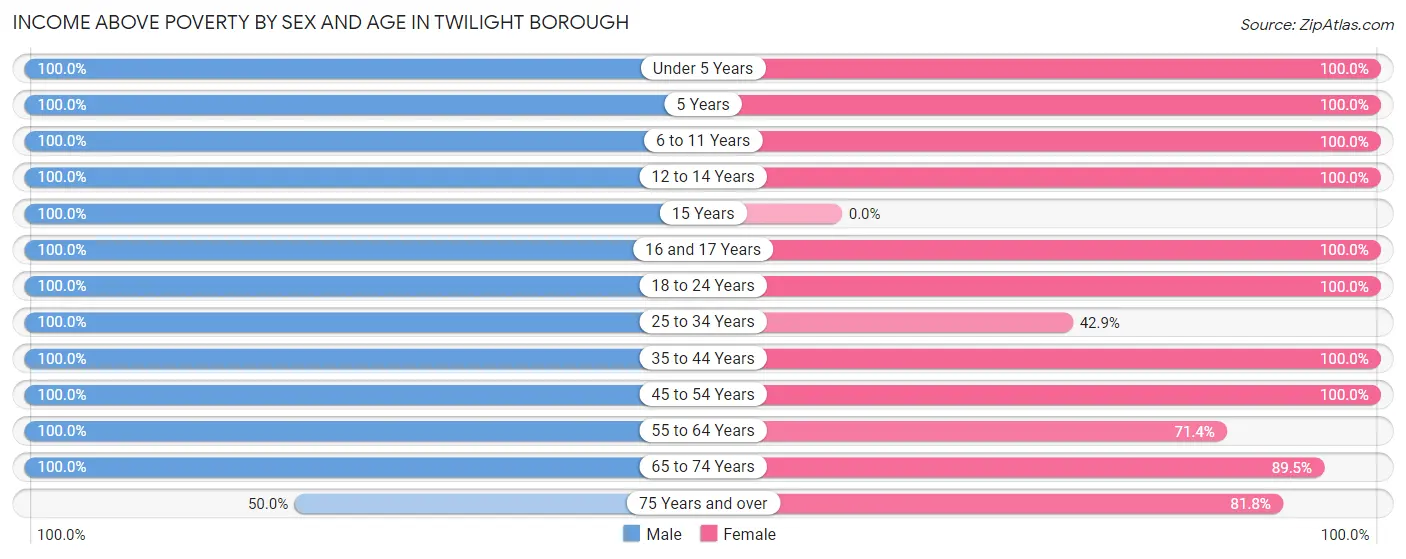
| Age Bracket | Male | Female |
| Under 5 Years | 3 (100.0%) | 3 (100.0%) |
| 5 Years | 1 (100.0%) | 6 (100.0%) |
| 6 to 11 Years | 5 (100.0%) | 8 (100.0%) |
| 12 to 14 Years | 1 (100.0%) | 6 (100.0%) |
| 15 Years | 5 (100.0%) | 0 (0.0%) |
| 16 and 17 Years | 19 (100.0%) | 6 (100.0%) |
| 18 to 24 Years | 6 (100.0%) | 27 (100.0%) |
| 25 to 34 Years | 5 (100.0%) | 3 (42.9%) |
| 35 to 44 Years | 9 (100.0%) | 14 (100.0%) |
| 45 to 54 Years | 30 (100.0%) | 26 (100.0%) |
| 55 to 64 Years | 7 (100.0%) | 10 (71.4%) |
| 65 to 74 Years | 19 (100.0%) | 17 (89.5%) |
| 75 Years and over | 4 (50.0%) | 9 (81.8%) |
| Total | 114 (96.6%) | 135 (91.8%) |
Income Below Poverty Among Married-Couple Families in Twilight borough
The poverty statistics for married-couple families in Twilight borough show that 6.0% or 4 of the total 67 families live below the poverty line. Families with no children have the highest poverty rate of 11.1%, comprising of 4 families. On the other hand, families with 1 or 2 children have the lowest poverty rate of 0.0%, which includes 0 families.
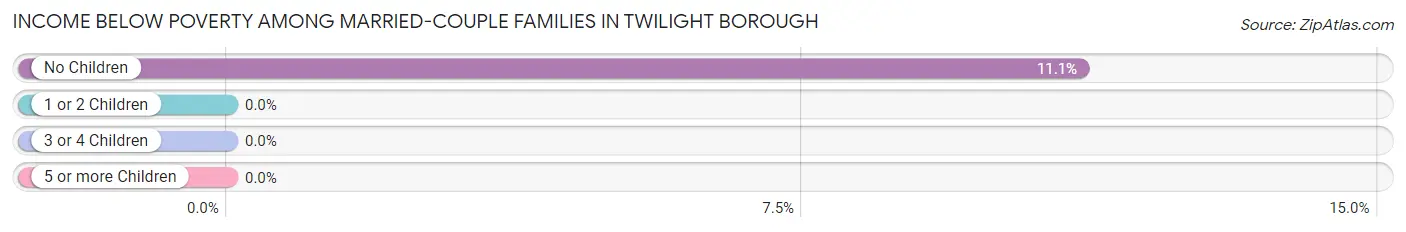
| Children | Above Poverty | Below Poverty |
| No Children | 32 (88.9%) | 4 (11.1%) |
| 1 or 2 Children | 30 (100.0%) | 0 (0.0%) |
| 3 or 4 Children | 1 (100.0%) | 0 (0.0%) |
| 5 or more Children | 0 (0.0%) | 0 (0.0%) |
| Total | 63 (94.0%) | 4 (6.0%) |
Income Below Poverty Among Single-Parent Households in Twilight borough
| Children | Single Father | Single Mother |
| No Children | 0 (0.0%) | 0 (0.0%) |
| 1 or 2 Children | 0 (0.0%) | 0 (0.0%) |
| 3 or 4 Children | 0 (0.0%) | 0 (0.0%) |
| 5 or more Children | 0 (0.0%) | 0 (0.0%) |
| Total | 0 (0.0%) | 0 (0.0%) |
Income Below Poverty Among Married-Couple vs Single-Parent Households in Twilight borough
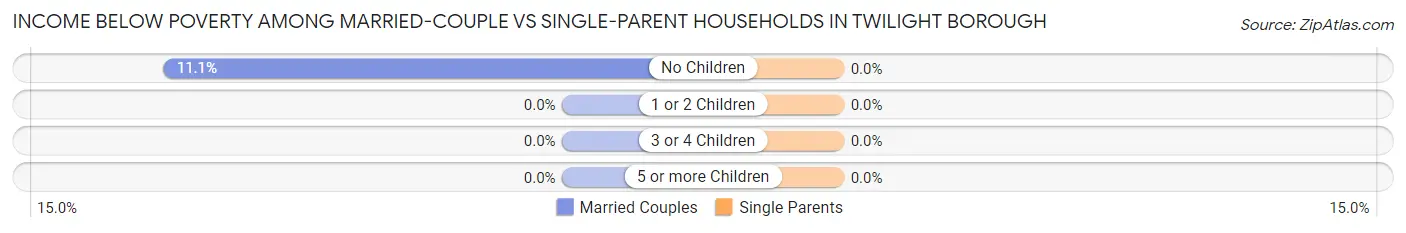
| Children | Married-Couple Families | Single-Parent Households |
| No Children | 4 (11.1%) | 0 (0.0%) |
| 1 or 2 Children | 0 (0.0%) | 0 (0.0%) |
| 3 or 4 Children | 0 (0.0%) | 0 (0.0%) |
| 5 or more Children | 0 (0.0%) | 0 (0.0%) |
| Total | 4 (6.0%) | 0 (0.0%) |
Race in Twilight borough
The most populous races in Twilight borough are White / Caucasian (196 | 74.0%), Two or more Races (65 | 24.5%), and Black / African American (4 | 1.5%).
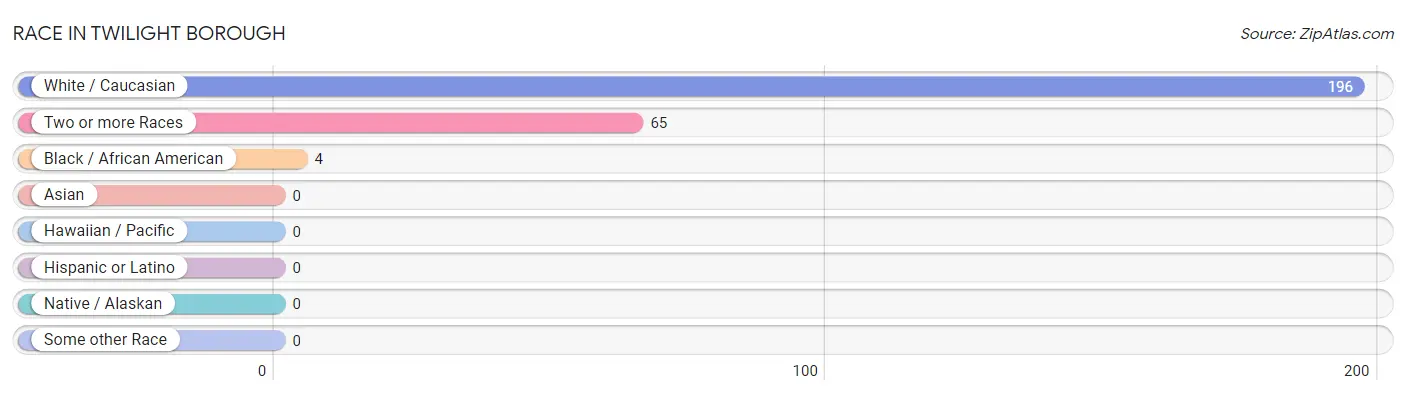
| Race | # Population | % Population |
| Asian | 0 | 0.0% |
| Black / African American | 4 | 1.5% |
| Hawaiian / Pacific | 0 | 0.0% |
| Hispanic or Latino | 0 | 0.0% |
| Native / Alaskan | 0 | 0.0% |
| White / Caucasian | 196 | 74.0% |
| Two or more Races | 65 | 24.5% |
| Some other Race | 0 | 0.0% |
| Total | 265 | 100.0% |
Ancestry in Twilight borough
The most populous ancestries reported in Twilight borough are Italian (47 | 17.7%), Irish (37 | 14.0%), German (20 | 7.5%), Belgian (13 | 4.9%), and English (13 | 4.9%), together accounting for 49.1% of all Twilight borough residents.
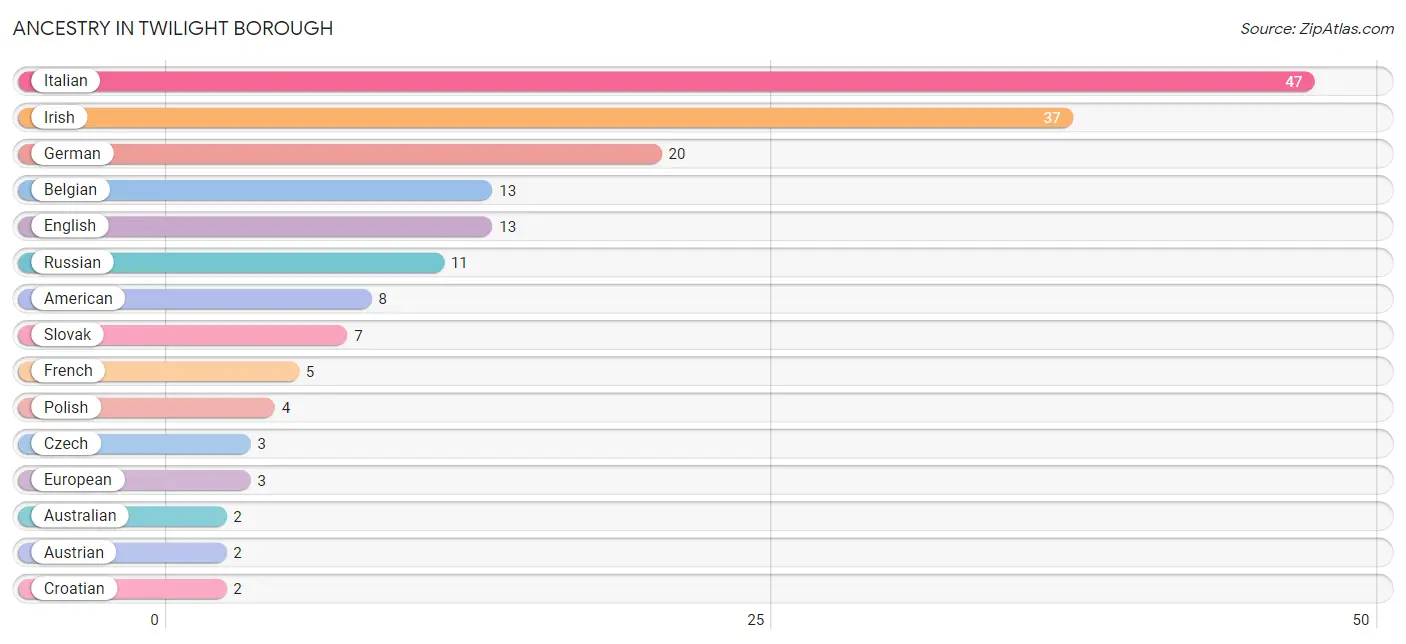
| Ancestry | # Population | % Population |
| American | 8 | 3.0% |
| Australian | 2 | 0.7% |
| Austrian | 2 | 0.7% |
| Belgian | 13 | 4.9% |
| Croatian | 2 | 0.7% |
| Czech | 3 | 1.1% |
| Czechoslovakian | 2 | 0.7% |
| Eastern European | 1 | 0.4% |
| English | 13 | 4.9% |
| European | 3 | 1.1% |
| French | 5 | 1.9% |
| German | 20 | 7.5% |
| Irish | 37 | 14.0% |
| Italian | 47 | 17.7% |
| Lithuanian | 1 | 0.4% |
| Polish | 4 | 1.5% |
| Russian | 11 | 4.2% |
| Scotch-Irish | 2 | 0.7% |
| Serbian | 2 | 0.7% |
| Slavic | 2 | 0.7% |
| Slovak | 7 | 2.6% |
| Swedish | 1 | 0.4% |
| Welsh | 1 | 0.4% | View All 23 Rows |
Immigrants in Twilight borough

| Immigration Origin | # Population | % Population | View All 0 Rows |
Sex and Age in Twilight borough
Sex and Age in Twilight borough
The most populous age groups in Twilight borough are 15 to 19 Years (25 | 21.2%) for men and 20 to 24 Years (22 | 15.0%) for women.
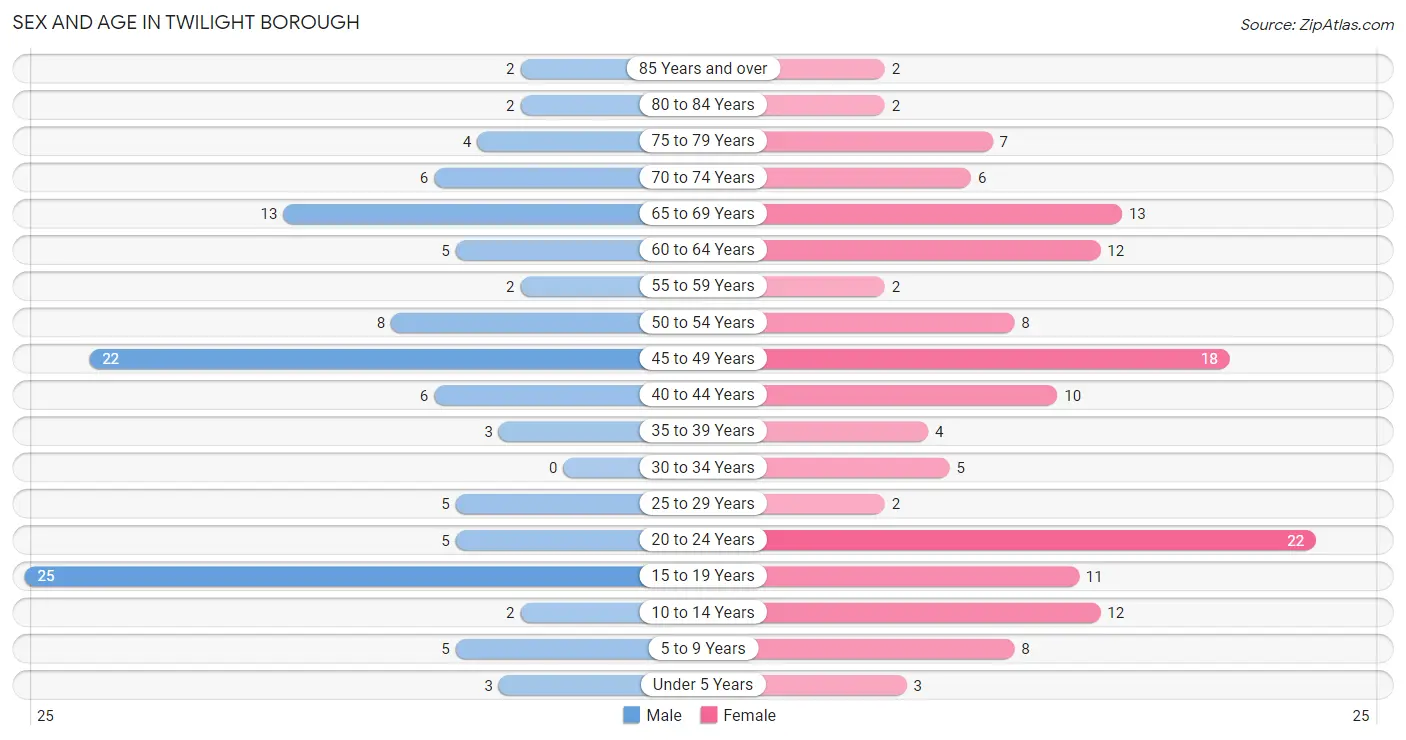
| Age Bracket | Male | Female |
| Under 5 Years | 3 (2.5%) | 3 (2.0%) |
| 5 to 9 Years | 5 (4.2%) | 8 (5.4%) |
| 10 to 14 Years | 2 (1.7%) | 12 (8.2%) |
| 15 to 19 Years | 25 (21.2%) | 11 (7.5%) |
| 20 to 24 Years | 5 (4.2%) | 22 (15.0%) |
| 25 to 29 Years | 5 (4.2%) | 2 (1.4%) |
| 30 to 34 Years | 0 (0.0%) | 5 (3.4%) |
| 35 to 39 Years | 3 (2.5%) | 4 (2.7%) |
| 40 to 44 Years | 6 (5.1%) | 10 (6.8%) |
| 45 to 49 Years | 22 (18.6%) | 18 (12.2%) |
| 50 to 54 Years | 8 (6.8%) | 8 (5.4%) |
| 55 to 59 Years | 2 (1.7%) | 2 (1.4%) |
| 60 to 64 Years | 5 (4.2%) | 12 (8.2%) |
| 65 to 69 Years | 13 (11.0%) | 13 (8.8%) |
| 70 to 74 Years | 6 (5.1%) | 6 (4.1%) |
| 75 to 79 Years | 4 (3.4%) | 7 (4.8%) |
| 80 to 84 Years | 2 (1.7%) | 2 (1.4%) |
| 85 Years and over | 2 (1.7%) | 2 (1.4%) |
| Total | 118 (100.0%) | 147 (100.0%) |
Families and Households in Twilight borough
Median Family Size in Twilight borough
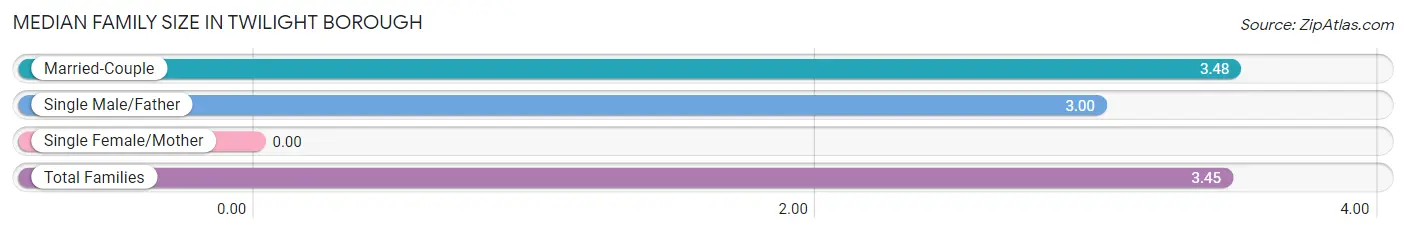
| Family Type | # Families | Family Size |
| Married-Couple | 67 (94.4%) | 3.48 |
| Single Male/Father | 4 (5.6%) | 3.00 |
| Single Female/Mother | 0 (0.0%) | - |
| Total Families | 71 (100.0%) | 3.45 |
Median Household Size in Twilight borough
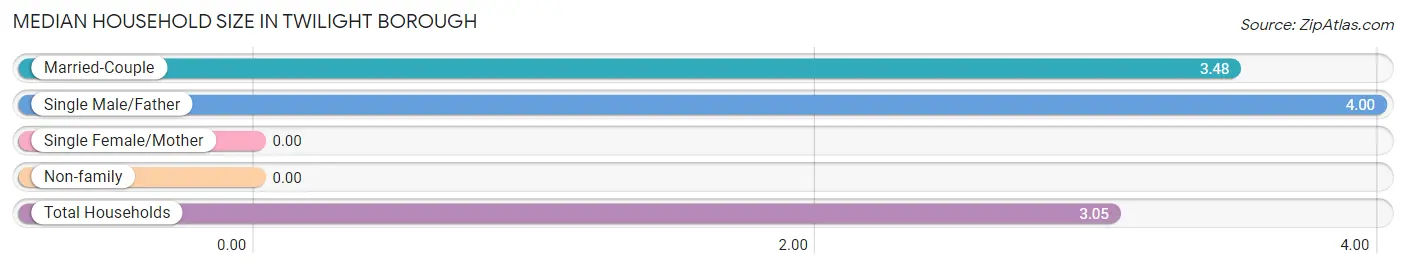
| Household Type | # Households | Household Size |
| Married-Couple | 67 (77.0%) | 3.48 |
| Single Male/Father | 4 (4.6%) | 4.00 |
| Single Female/Mother | 0 (0.0%) | - |
| Non-family | 16 (18.4%) | - |
| Total Households | 87 (100.0%) | 3.05 |
Household Size by Marriage Status in Twilight borough
Out of a total of 87 households in Twilight borough, 71 (81.6%) are family households, while 16 (18.4%) are nonfamily households. The most numerous type of family households are 2-person households, comprising 31, and the most common type of nonfamily households are 1-person households, comprising 16.
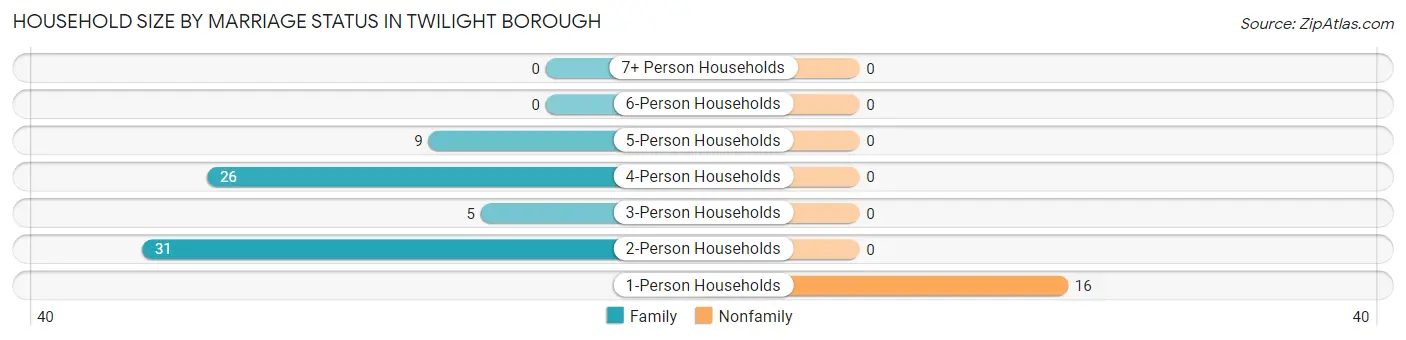
| Household Size | Family Households | Nonfamily Households |
| 1-Person Households | - | 16 (18.4%) |
| 2-Person Households | 31 (35.6%) | 0 (0.0%) |
| 3-Person Households | 5 (5.8%) | 0 (0.0%) |
| 4-Person Households | 26 (29.9%) | 0 (0.0%) |
| 5-Person Households | 9 (10.3%) | 0 (0.0%) |
| 6-Person Households | 0 (0.0%) | 0 (0.0%) |
| 7+ Person Households | 0 (0.0%) | 0 (0.0%) |
| Total | 71 (81.6%) | 16 (18.4%) |
Female Fertility in Twilight borough
Fertility by Age in Twilight borough
Average fertility rate in Twilight borough is 56.0 births per 1,000 women. Women in the age bracket of 20 to 34 years have the highest fertility rate with 138.0 births per 1,000 women. Women in the age bracket of 20 to 34 years acount for 100.0% of all women with births.
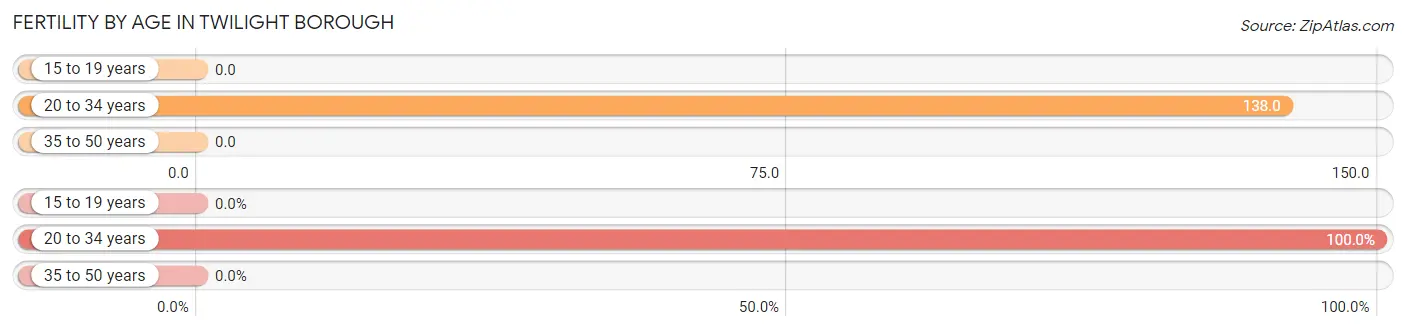
| Age Bracket | Women with Births | Births / 1,000 Women |
| 15 to 19 years | 0 (0.0%) | 0.0 |
| 20 to 34 years | 4 (100.0%) | 138.0 |
| 35 to 50 years | 0 (0.0%) | 0.0 |
| Total | 4 (100.0%) | 56.0 |
Fertility by Age by Marriage Status in Twilight borough
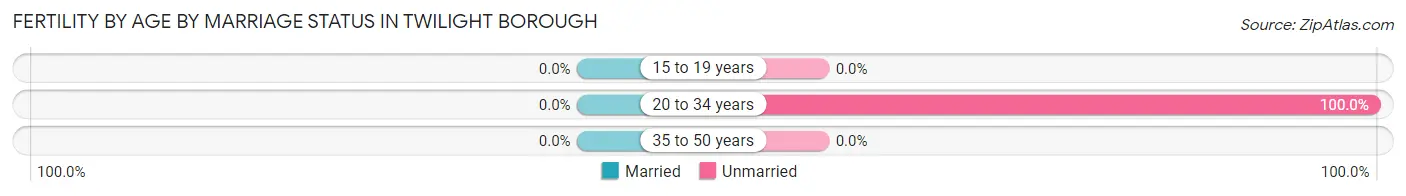
| Age Bracket | Married | Unmarried |
| 15 to 19 years | 0 (0.0%) | 0 (0.0%) |
| 20 to 34 years | 0 (0.0%) | 4 (100.0%) |
| 35 to 50 years | 0 (0.0%) | 0 (0.0%) |
| Total | 0 (0.0%) | 4 (100.0%) |
Fertility by Education in Twilight borough
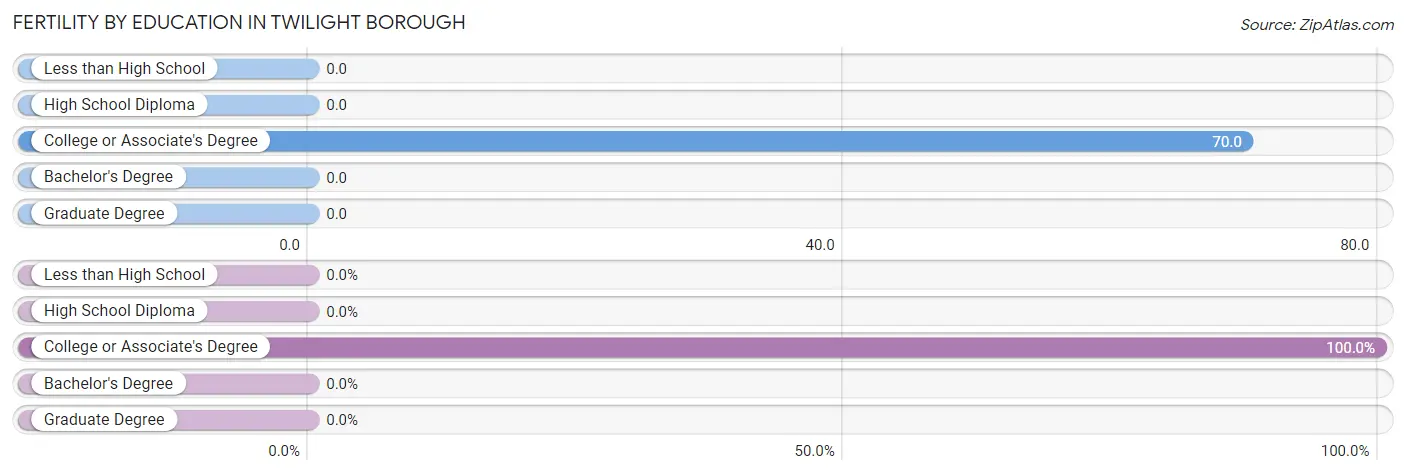
| Educational Attainment | Women with Births | Births / 1,000 Women |
| Less than High School | 0 (0.0%) | 0.0 |
| High School Diploma | 0 (0.0%) | 0.0 |
| College or Associate's Degree | 4 (100.0%) | 70.0 |
| Bachelor's Degree | 0 (0.0%) | 0.0 |
| Graduate Degree | 0 (0.0%) | 0.0 |
| Total | 4 (100.0%) | 56.0 |
Fertility by Education by Marriage Status in Twilight borough
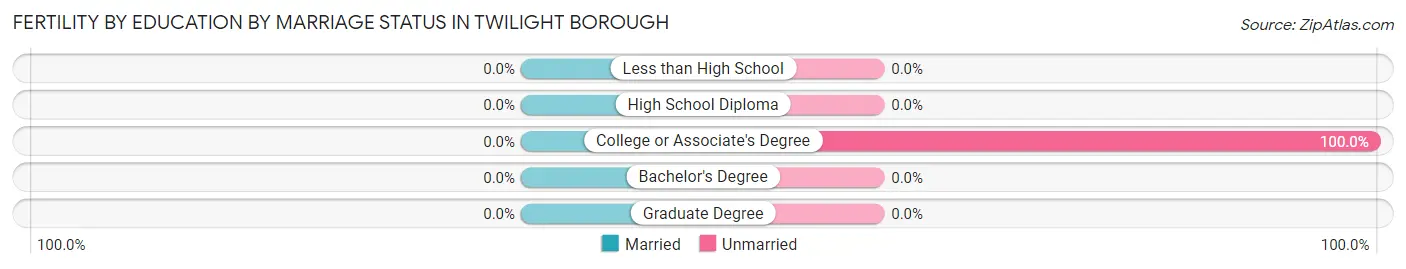
| Educational Attainment | Married | Unmarried |
| Less than High School | 0 (0.0%) | 0 (0.0%) |
| High School Diploma | 0 (0.0%) | 0 (0.0%) |
| College or Associate's Degree | 0 (0.0%) | 4 (100.0%) |
| Bachelor's Degree | 0 (0.0%) | 0 (0.0%) |
| Graduate Degree | 0 (0.0%) | 0 (0.0%) |
| Total | 0 (0.0%) | 4 (100.0%) |
Employment Characteristics in Twilight borough
Employment by Class of Employer in Twilight borough
Among the 104 employed individuals in Twilight borough, private company employees (85 | 81.7%), not-for-profit organizations (12 | 11.5%), and state government employees (4 | 3.8%) make up the most common classes of employment.
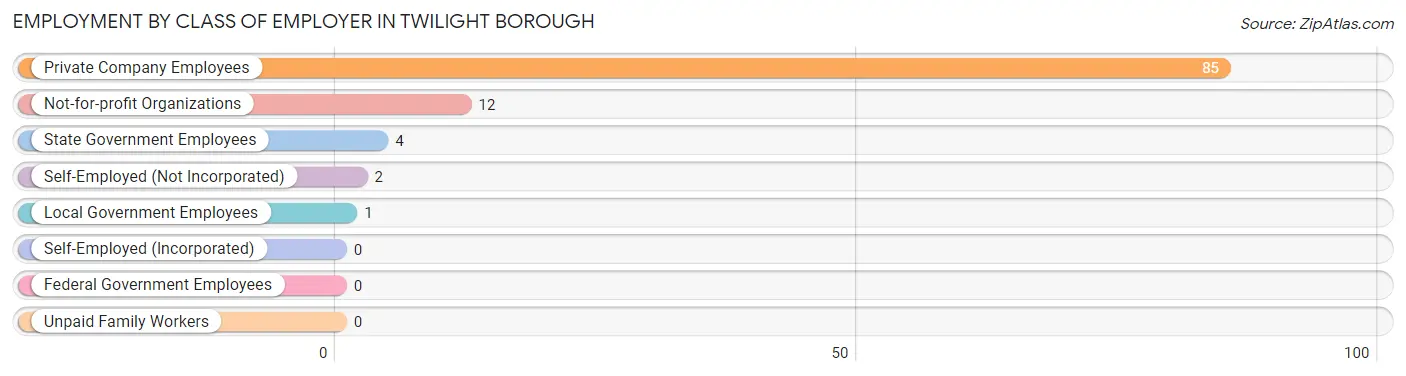
| Employer Class | # Employees | % Employees |
| Private Company Employees | 85 | 81.7% |
| Self-Employed (Incorporated) | 0 | 0.0% |
| Self-Employed (Not Incorporated) | 2 | 1.9% |
| Not-for-profit Organizations | 12 | 11.5% |
| Local Government Employees | 1 | 1.0% |
| State Government Employees | 4 | 3.8% |
| Federal Government Employees | 0 | 0.0% |
| Unpaid Family Workers | 0 | 0.0% |
| Total | 104 | 100.0% |
Employment Status by Age in Twilight borough
According to the labor force statistics for Twilight borough, out of the total population over 16 years of age (227), 50.7% or 115 individuals are in the labor force, with 3.5% or 4 of them unemployed. The age group with the highest labor force participation rate is 25 to 29 years, with 100.0% or 7 individuals in the labor force. Within the labor force, the 65 to 74 years age range has the highest percentage of unemployed individuals, with 100.0% or 2 of them being unemployed.
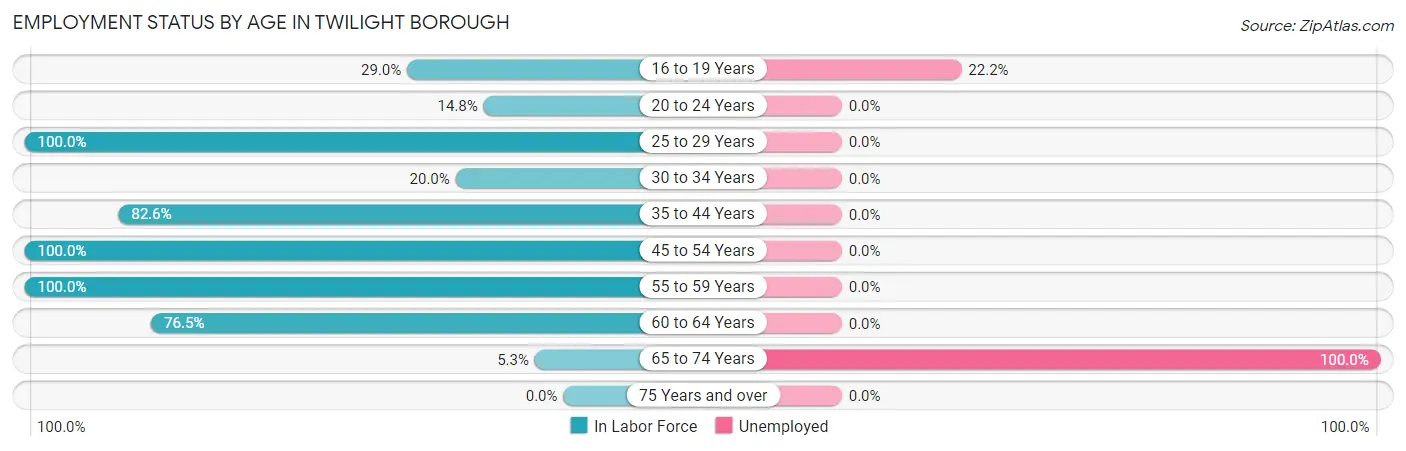
| Age Bracket | In Labor Force | Unemployed |
| 16 to 19 Years | 9 (29.0%) | 2 (22.2%) |
| 20 to 24 Years | 4 (14.8%) | 0 (0.0%) |
| 25 to 29 Years | 7 (100.0%) | 0 (0.0%) |
| 30 to 34 Years | 1 (20.0%) | 0 (0.0%) |
| 35 to 44 Years | 19 (82.6%) | 0 (0.0%) |
| 45 to 54 Years | 56 (100.0%) | 0 (0.0%) |
| 55 to 59 Years | 4 (100.0%) | 0 (0.0%) |
| 60 to 64 Years | 13 (76.5%) | 0 (0.0%) |
| 65 to 74 Years | 2 (5.3%) | 2 (100.0%) |
| 75 Years and over | 0 (0.0%) | 0 (0.0%) |
| Total | 115 (50.7%) | 4 (3.5%) |
Employment Status by Educational Attainment in Twilight borough
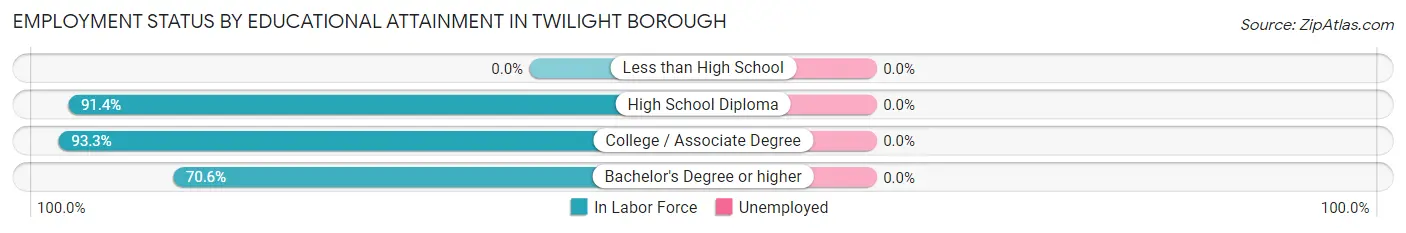
| Educational Attainment | In Labor Force | Unemployed |
| Less than High School | 0 (0.0%) | 0 (0.0%) |
| High School Diploma | 32 (91.4%) | 0 (0.0%) |
| College / Associate Degree | 56 (93.3%) | 0 (0.0%) |
| Bachelor's Degree or higher | 12 (70.6%) | 0 (0.0%) |
| Total | 100 (89.3%) | 0 (0.0%) |
Employment Occupations by Sex in Twilight borough
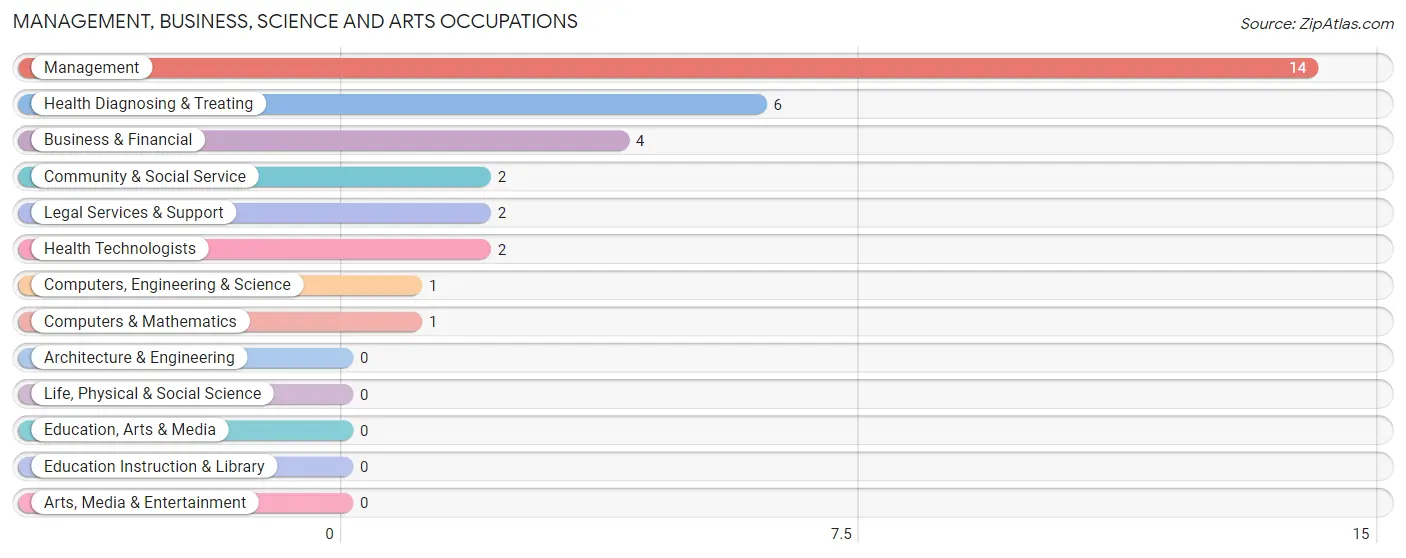
Management, Business, Science and Arts Occupations
The most common Management, Business, Science and Arts occupations in Twilight borough are Management (14 | 12.6%), Health Diagnosing & Treating (6 | 5.4%), Business & Financial (4 | 3.6%), Community & Social Service (2 | 1.8%), and Legal Services & Support (2 | 1.8%).
Management, Business, Science and Arts Occupations by Sex
Within the Management, Business, Science and Arts occupations in Twilight borough, the most male-oriented occupations are Computers, Engineering & Science (100.0%), Computers & Mathematics (100.0%), and Business & Financial (50.0%), while the most female-oriented occupations are Community & Social Service (100.0%), Legal Services & Support (100.0%), and Health Diagnosing & Treating (100.0%).
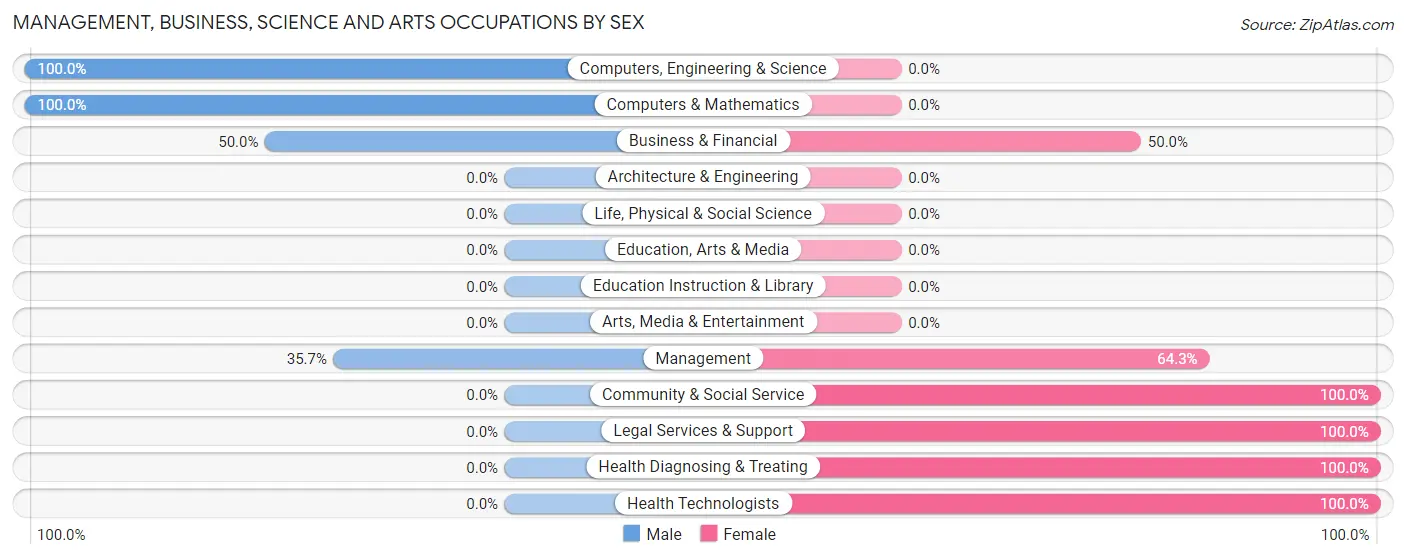
| Occupation | Male | Female |
| Management | 5 (35.7%) | 9 (64.3%) |
| Business & Financial | 2 (50.0%) | 2 (50.0%) |
| Computers, Engineering & Science | 1 (100.0%) | 0 (0.0%) |
| Computers & Mathematics | 1 (100.0%) | 0 (0.0%) |
| Architecture & Engineering | 0 (0.0%) | 0 (0.0%) |
| Life, Physical & Social Science | 0 (0.0%) | 0 (0.0%) |
| Community & Social Service | 0 (0.0%) | 2 (100.0%) |
| Education, Arts & Media | 0 (0.0%) | 0 (0.0%) |
| Legal Services & Support | 0 (0.0%) | 2 (100.0%) |
| Education Instruction & Library | 0 (0.0%) | 0 (0.0%) |
| Arts, Media & Entertainment | 0 (0.0%) | 0 (0.0%) |
| Health Diagnosing & Treating | 0 (0.0%) | 6 (100.0%) |
| Health Technologists | 0 (0.0%) | 2 (100.0%) |
| Total (Category) | 8 (29.6%) | 19 (70.4%) |
| Total (Overall) | 48 (43.2%) | 63 (56.8%) |
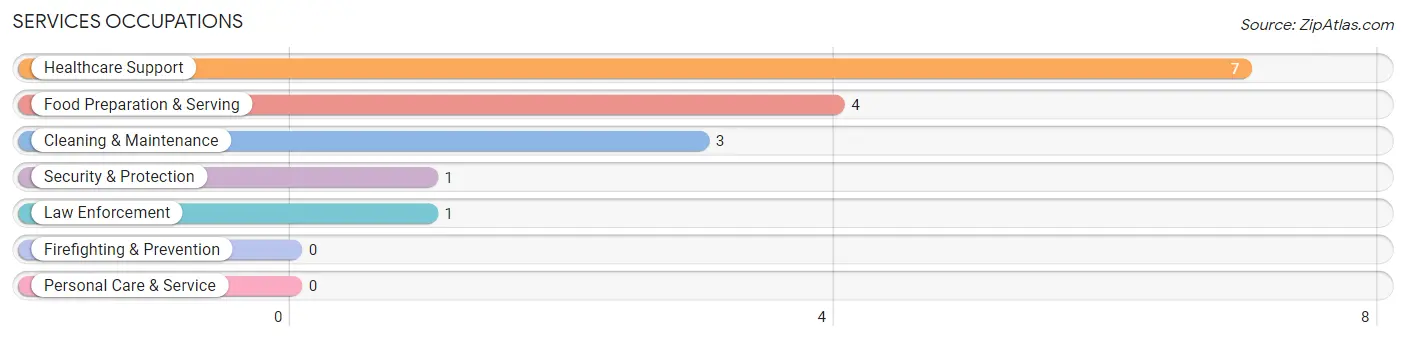
Services Occupations
The most common Services occupations in Twilight borough are Healthcare Support (7 | 6.3%), Food Preparation & Serving (4 | 3.6%), Cleaning & Maintenance (3 | 2.7%), Security & Protection (1 | 0.9%), and Law Enforcement (1 | 0.9%).
Services Occupations by Sex
Within the Services occupations in Twilight borough, the most male-oriented occupations are Security & Protection (100.0%), Law Enforcement (100.0%), and Food Preparation & Serving (25.0%), while the most female-oriented occupations are Healthcare Support (100.0%), Cleaning & Maintenance (100.0%), and Food Preparation & Serving (75.0%).
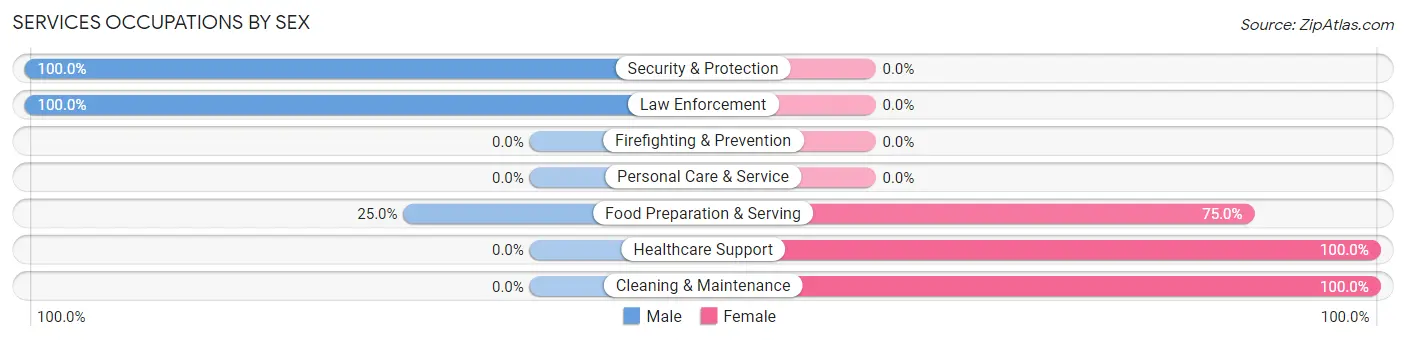
| Occupation | Male | Female |
| Healthcare Support | 0 (0.0%) | 7 (100.0%) |
| Security & Protection | 1 (100.0%) | 0 (0.0%) |
| Firefighting & Prevention | 0 (0.0%) | 0 (0.0%) |
| Law Enforcement | 1 (100.0%) | 0 (0.0%) |
| Food Preparation & Serving | 1 (25.0%) | 3 (75.0%) |
| Cleaning & Maintenance | 0 (0.0%) | 3 (100.0%) |
| Personal Care & Service | 0 (0.0%) | 0 (0.0%) |
| Total (Category) | 2 (13.3%) | 13 (86.7%) |
| Total (Overall) | 48 (43.2%) | 63 (56.8%) |
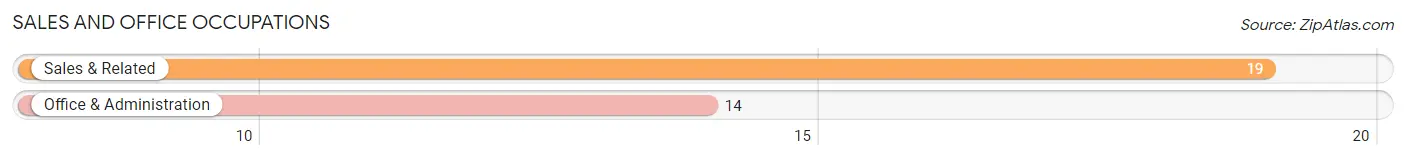
Sales and Office Occupations
The most common Sales and Office occupations in Twilight borough are Sales & Related (19 | 17.1%), and Office & Administration (14 | 12.6%).
Sales and Office Occupations by Sex
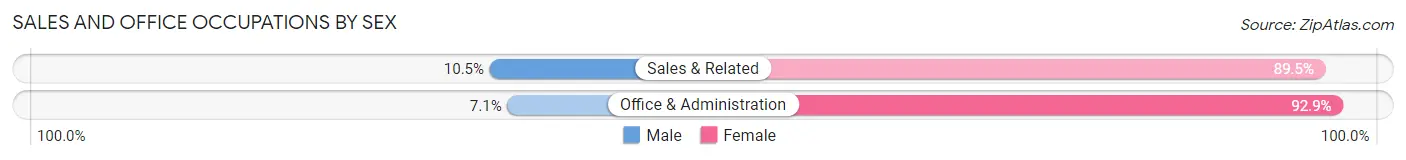
| Occupation | Male | Female |
| Sales & Related | 2 (10.5%) | 17 (89.5%) |
| Office & Administration | 1 (7.1%) | 13 (92.9%) |
| Total (Category) | 3 (9.1%) | 30 (90.9%) |
| Total (Overall) | 48 (43.2%) | 63 (56.8%) |
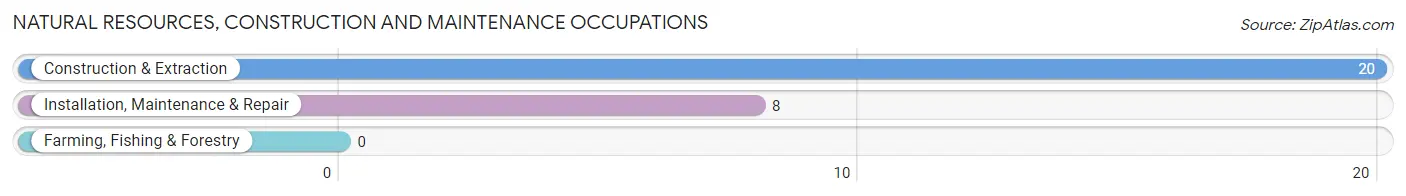
Natural Resources, Construction and Maintenance Occupations
The most common Natural Resources, Construction and Maintenance occupations in Twilight borough are Construction & Extraction (20 | 18.0%), and Installation, Maintenance & Repair (8 | 7.2%).
Natural Resources, Construction and Maintenance Occupations by Sex
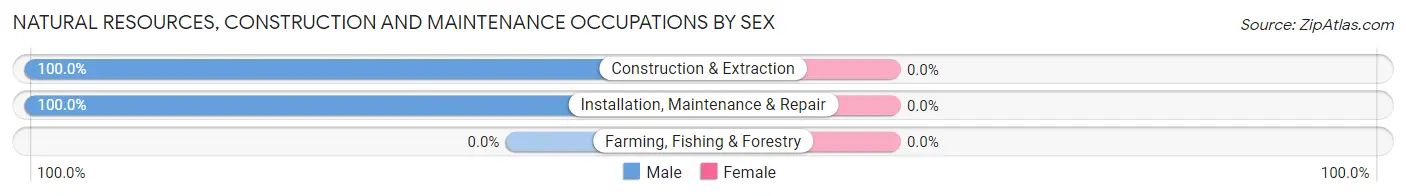
| Occupation | Male | Female |
| Farming, Fishing & Forestry | 0 (0.0%) | 0 (0.0%) |
| Construction & Extraction | 20 (100.0%) | 0 (0.0%) |
| Installation, Maintenance & Repair | 8 (100.0%) | 0 (0.0%) |
| Total (Category) | 28 (100.0%) | 0 (0.0%) |
| Total (Overall) | 48 (43.2%) | 63 (56.8%) |
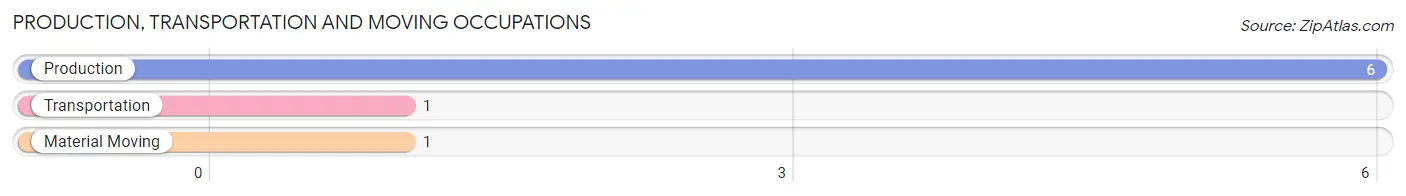
Production, Transportation and Moving Occupations
The most common Production, Transportation and Moving occupations in Twilight borough are Production (6 | 5.4%), Transportation (1 | 0.9%), and Material Moving (1 | 0.9%).
Production, Transportation and Moving Occupations by Sex
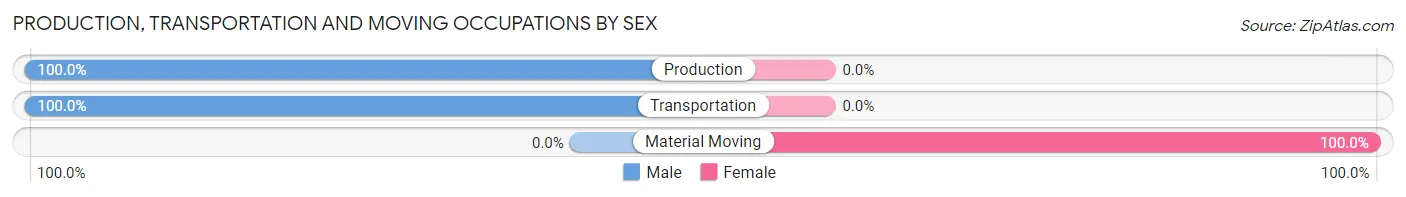
| Occupation | Male | Female |
| Production | 6 (100.0%) | 0 (0.0%) |
| Transportation | 1 (100.0%) | 0 (0.0%) |
| Material Moving | 0 (0.0%) | 1 (100.0%) |
| Total (Category) | 7 (87.5%) | 1 (12.5%) |
| Total (Overall) | 48 (43.2%) | 63 (56.8%) |
Employment Industries by Sex in Twilight borough
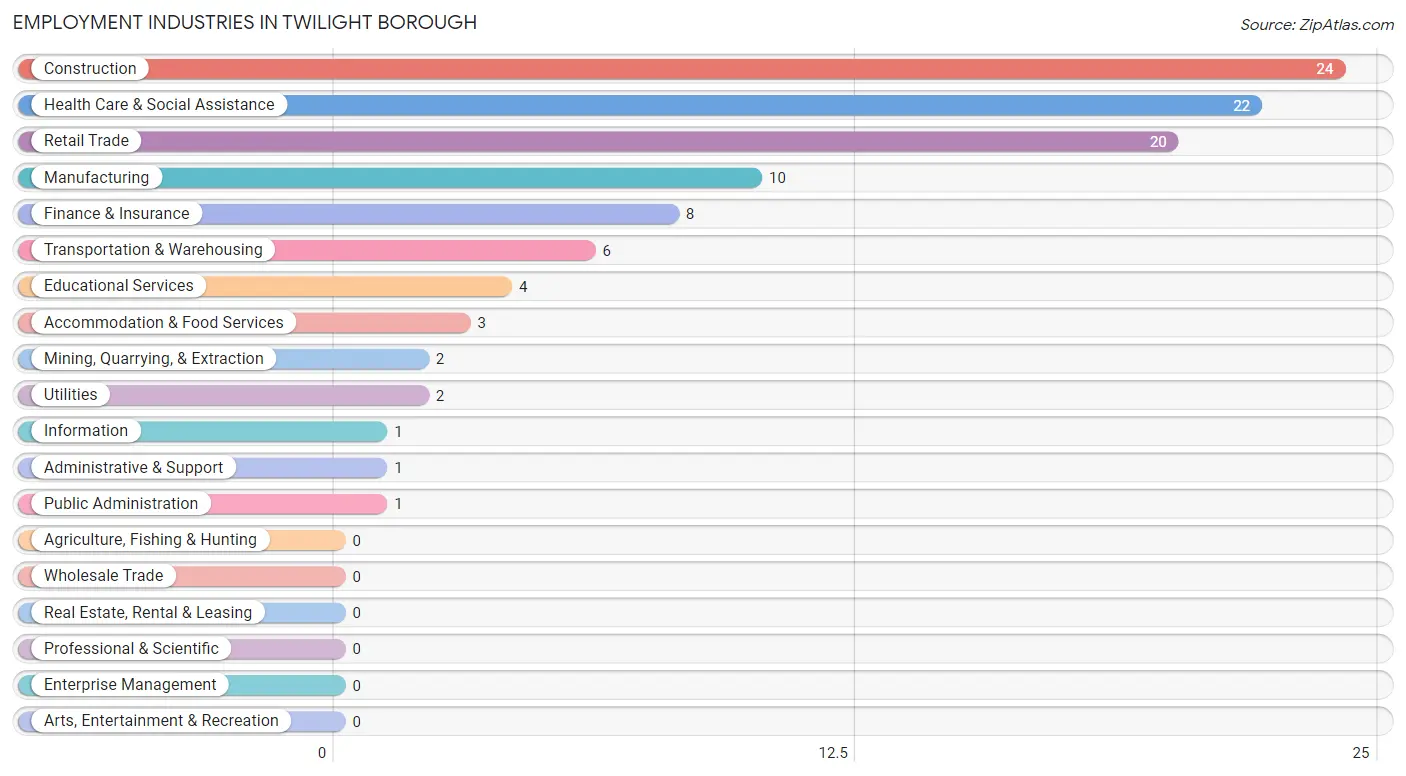
Employment Industries in Twilight borough
The major employment industries in Twilight borough include Construction (24 | 21.6%), Health Care & Social Assistance (22 | 19.8%), Retail Trade (20 | 18.0%), Manufacturing (10 | 9.0%), and Finance & Insurance (8 | 7.2%).
Employment Industries by Sex in Twilight borough
The Twilight borough industries that see more men than women are Mining, Quarrying, & Extraction (100.0%), Construction (100.0%), and Utilities (100.0%), whereas the industries that tend to have a higher number of women are Finance & Insurance (100.0%), Educational Services (100.0%), and Health Care & Social Assistance (100.0%).
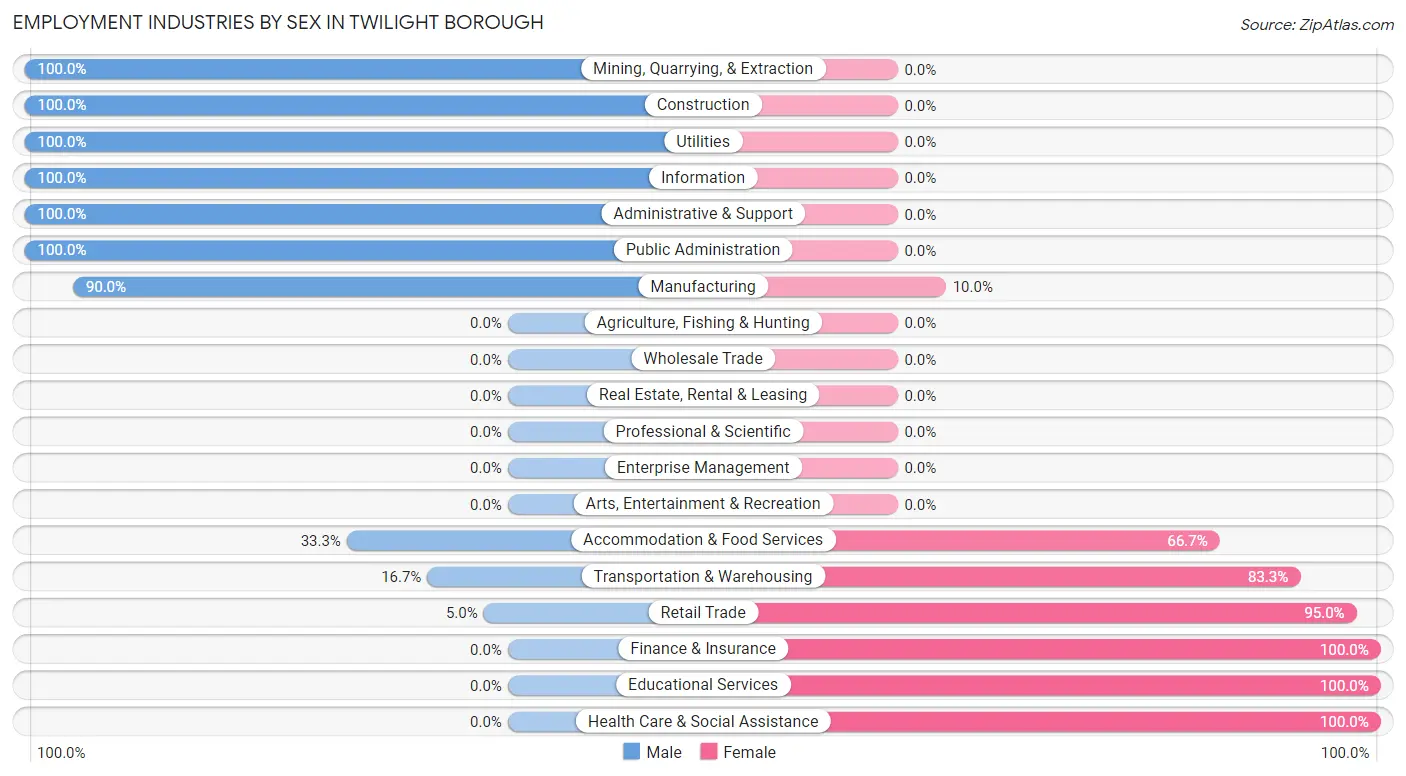
| Industry | Male | Female |
| Agriculture, Fishing & Hunting | 0 (0.0%) | 0 (0.0%) |
| Mining, Quarrying, & Extraction | 2 (100.0%) | 0 (0.0%) |
| Construction | 24 (100.0%) | 0 (0.0%) |
| Manufacturing | 9 (90.0%) | 1 (10.0%) |
| Wholesale Trade | 0 (0.0%) | 0 (0.0%) |
| Retail Trade | 1 (5.0%) | 19 (95.0%) |
| Transportation & Warehousing | 1 (16.7%) | 5 (83.3%) |
| Utilities | 2 (100.0%) | 0 (0.0%) |
| Information | 1 (100.0%) | 0 (0.0%) |
| Finance & Insurance | 0 (0.0%) | 8 (100.0%) |
| Real Estate, Rental & Leasing | 0 (0.0%) | 0 (0.0%) |
| Professional & Scientific | 0 (0.0%) | 0 (0.0%) |
| Enterprise Management | 0 (0.0%) | 0 (0.0%) |
| Administrative & Support | 1 (100.0%) | 0 (0.0%) |
| Educational Services | 0 (0.0%) | 4 (100.0%) |
| Health Care & Social Assistance | 0 (0.0%) | 22 (100.0%) |
| Arts, Entertainment & Recreation | 0 (0.0%) | 0 (0.0%) |
| Accommodation & Food Services | 1 (33.3%) | 2 (66.7%) |
| Public Administration | 1 (100.0%) | 0 (0.0%) |
| Total | 48 (43.2%) | 63 (56.8%) |
Education in Twilight borough
School Enrollment in Twilight borough
The most common levels of schooling among the 44 students in Twilight borough are middle school (12 | 27.3%), high school (11 | 25.0%), and college / undergraduate (11 | 25.0%).
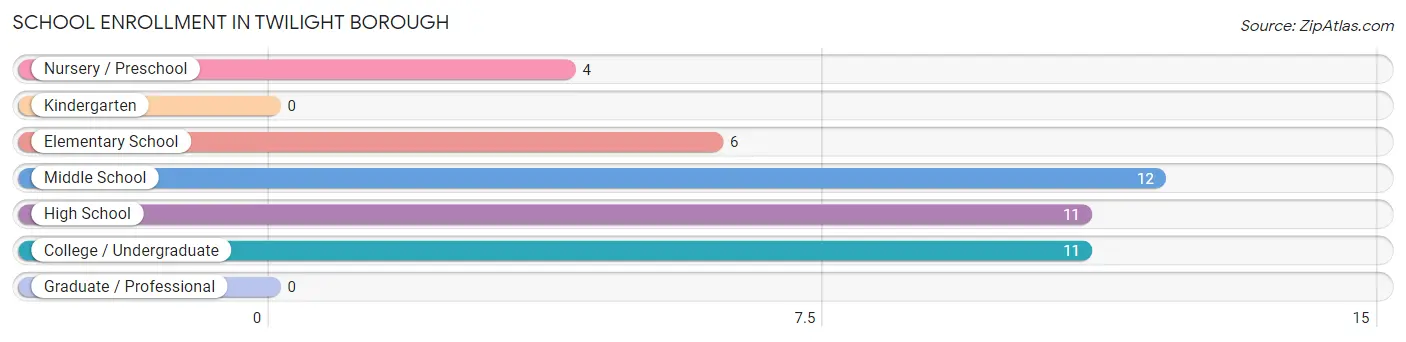
| School Level | # Students | % Students |
| Nursery / Preschool | 4 | 9.1% |
| Kindergarten | 0 | 0.0% |
| Elementary School | 6 | 13.6% |
| Middle School | 12 | 27.3% |
| High School | 11 | 25.0% |
| College / Undergraduate | 11 | 25.0% |
| Graduate / Professional | 0 | 0.0% |
| Total | 44 | 100.0% |
School Enrollment by Age by Funding Source in Twilight borough
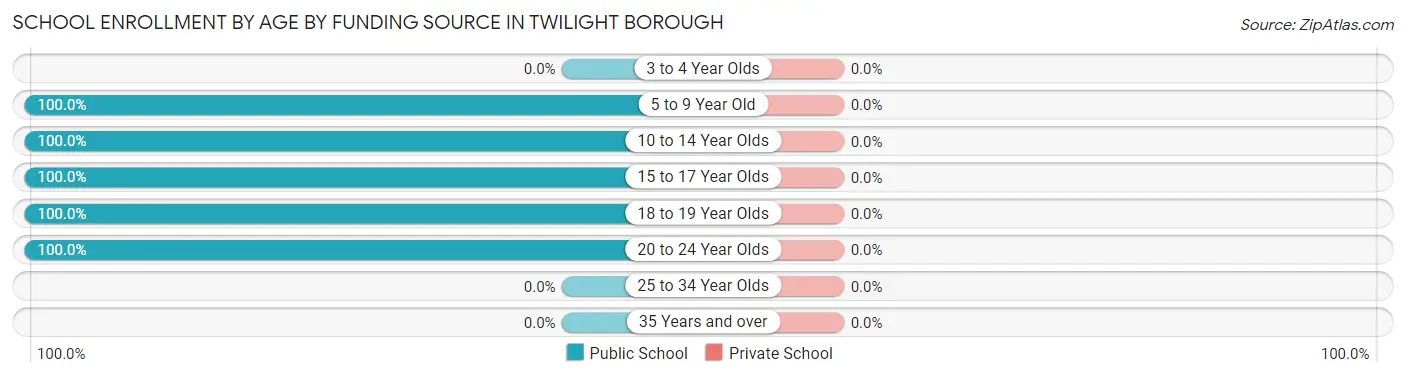
| Age Bracket | Public School | Private School |
| 3 to 4 Year Olds | 0 (0.0%) | 0 (0.0%) |
| 5 to 9 Year Old | 10 (100.0%) | 0 (0.0%) |
| 10 to 14 Year Olds | 12 (100.0%) | 0 (0.0%) |
| 15 to 17 Year Olds | 11 (100.0%) | 0 (0.0%) |
| 18 to 19 Year Olds | 6 (100.0%) | 0 (0.0%) |
| 20 to 24 Year Olds | 5 (100.0%) | 0 (0.0%) |
| 25 to 34 Year Olds | 0 (0.0%) | 0 (0.0%) |
| 35 Years and over | 0 (0.0%) | 0 (0.0%) |
| Total | 44 (100.0%) | 0 (0.0%) |
Educational Attainment by Field of Study in Twilight borough
Psychology (5 | 19.2%), education (5 | 19.2%), engineering (4 | 15.4%), science & technology (4 | 15.4%), and bio, nature & agricultural (2 | 7.7%) are the most common fields of study among 26 individuals in Twilight borough who have obtained a bachelor's degree or higher.
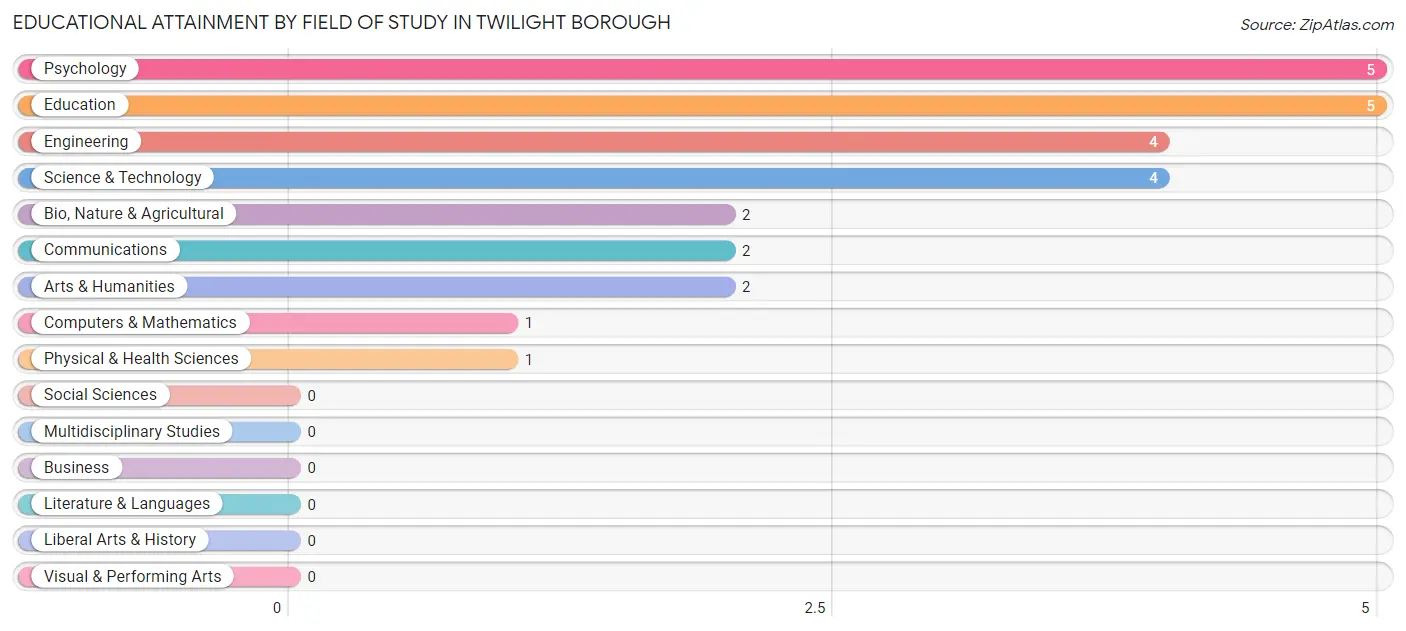
| Field of Study | # Graduates | % Graduates |
| Computers & Mathematics | 1 | 3.8% |
| Bio, Nature & Agricultural | 2 | 7.7% |
| Physical & Health Sciences | 1 | 3.8% |
| Psychology | 5 | 19.2% |
| Social Sciences | 0 | 0.0% |
| Engineering | 4 | 15.4% |
| Multidisciplinary Studies | 0 | 0.0% |
| Science & Technology | 4 | 15.4% |
| Business | 0 | 0.0% |
| Education | 5 | 19.2% |
| Literature & Languages | 0 | 0.0% |
| Liberal Arts & History | 0 | 0.0% |
| Visual & Performing Arts | 0 | 0.0% |
| Communications | 2 | 7.7% |
| Arts & Humanities | 2 | 7.7% |
| Total | 26 | 100.0% |
Transportation & Commute in Twilight borough
Vehicle Availability by Sex in Twilight borough
The most prevalent vehicle ownership categories in Twilight borough are males with 2 vehicles (13, accounting for 29.5%) and females with 2 vehicles (15, making up 21.7%).
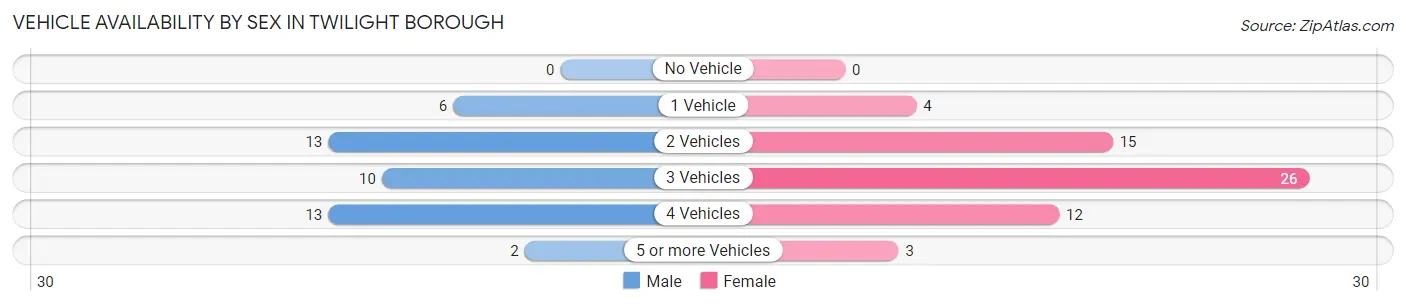
| Vehicles Available | Male | Female |
| No Vehicle | 0 (0.0%) | 0 (0.0%) |
| 1 Vehicle | 6 (13.6%) | 4 (6.7%) |
| 2 Vehicles | 13 (29.5%) | 15 (25.0%) |
| 3 Vehicles | 10 (22.7%) | 26 (43.3%) |
| 4 Vehicles | 13 (29.5%) | 12 (20.0%) |
| 5 or more Vehicles | 2 (4.5%) | 3 (5.0%) |
| Total | 44 (100.0%) | 60 (100.0%) |
Commute Time in Twilight borough
The most frequently occuring commute durations in Twilight borough are 30 to 34 minutes (23 commuters, 23.0%), 60 to 89 minutes (17 commuters, 17.0%), and 25 to 29 minutes (16 commuters, 16.0%).
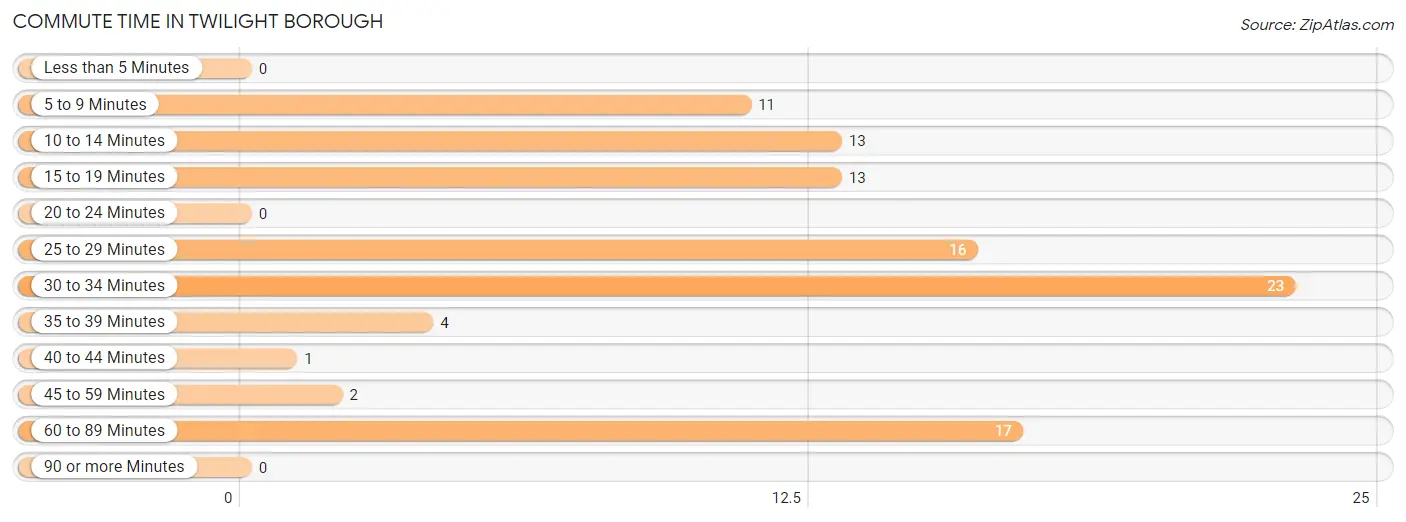
| Commute Time | # Commuters | % Commuters |
| Less than 5 Minutes | 0 | 0.0% |
| 5 to 9 Minutes | 11 | 11.0% |
| 10 to 14 Minutes | 13 | 13.0% |
| 15 to 19 Minutes | 13 | 13.0% |
| 20 to 24 Minutes | 0 | 0.0% |
| 25 to 29 Minutes | 16 | 16.0% |
| 30 to 34 Minutes | 23 | 23.0% |
| 35 to 39 Minutes | 4 | 4.0% |
| 40 to 44 Minutes | 1 | 1.0% |
| 45 to 59 Minutes | 2 | 2.0% |
| 60 to 89 Minutes | 17 | 17.0% |
| 90 or more Minutes | 0 | 0.0% |
Commute Time by Sex in Twilight borough
The most common commute times in Twilight borough are 60 to 89 minutes (15 commuters, 34.1%) for males and 10 to 14 minutes (13 commuters, 23.2%) for females.
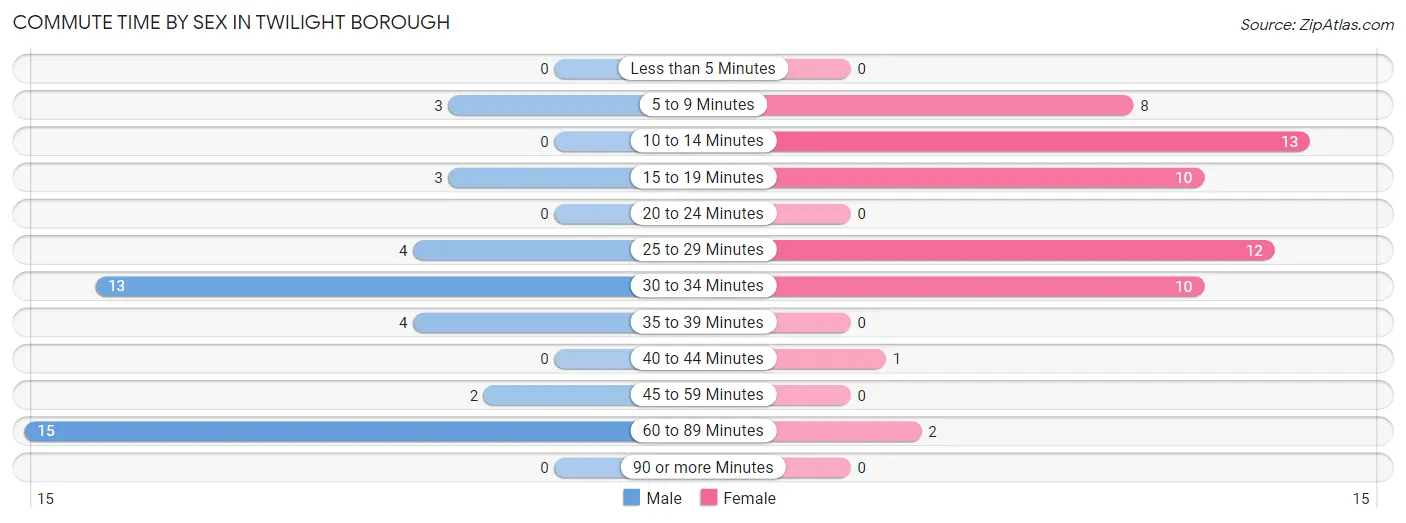
| Commute Time | Male | Female |
| Less than 5 Minutes | 0 (0.0%) | 0 (0.0%) |
| 5 to 9 Minutes | 3 (6.8%) | 8 (14.3%) |
| 10 to 14 Minutes | 0 (0.0%) | 13 (23.2%) |
| 15 to 19 Minutes | 3 (6.8%) | 10 (17.9%) |
| 20 to 24 Minutes | 0 (0.0%) | 0 (0.0%) |
| 25 to 29 Minutes | 4 (9.1%) | 12 (21.4%) |
| 30 to 34 Minutes | 13 (29.5%) | 10 (17.9%) |
| 35 to 39 Minutes | 4 (9.1%) | 0 (0.0%) |
| 40 to 44 Minutes | 0 (0.0%) | 1 (1.8%) |
| 45 to 59 Minutes | 2 (4.5%) | 0 (0.0%) |
| 60 to 89 Minutes | 15 (34.1%) | 2 (3.6%) |
| 90 or more Minutes | 0 (0.0%) | 0 (0.0%) |
Time of Departure to Work by Sex in Twilight borough
The most frequent times of departure to work in Twilight borough are 7:00 AM to 7:29 AM (15, 34.1%) for males and 8:30 AM to 8:59 AM (13, 23.2%) for females.
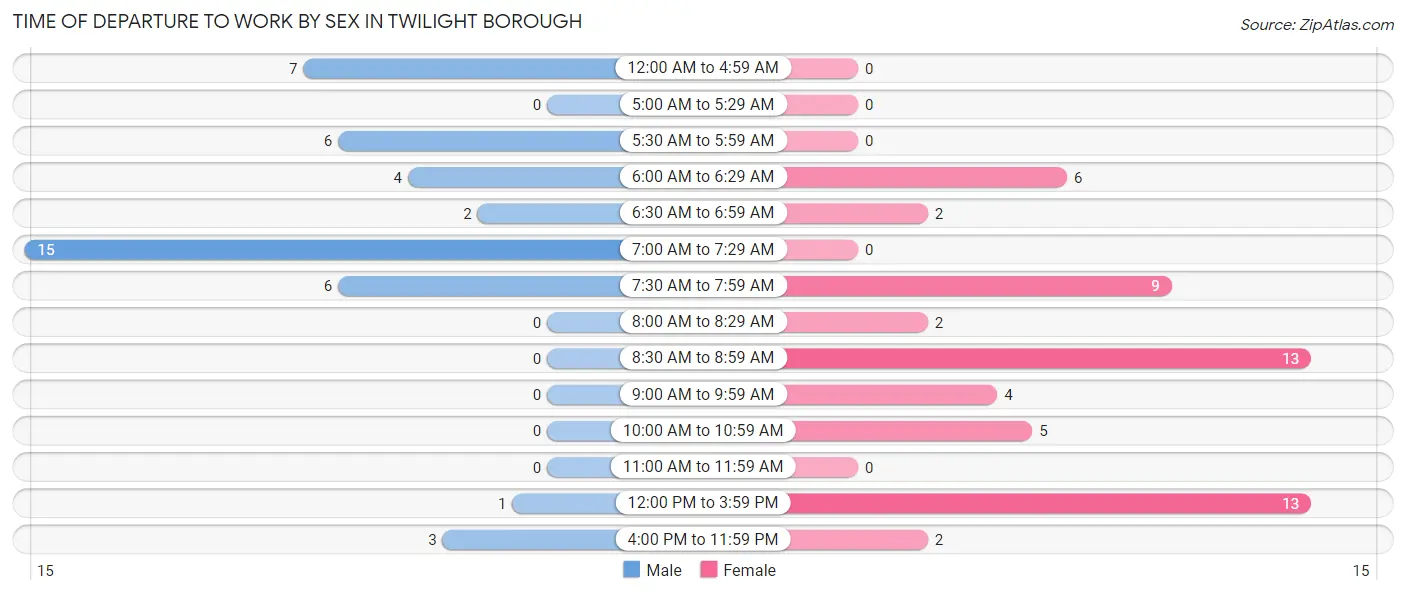
| Time of Departure | Male | Female |
| 12:00 AM to 4:59 AM | 7 (15.9%) | 0 (0.0%) |
| 5:00 AM to 5:29 AM | 0 (0.0%) | 0 (0.0%) |
| 5:30 AM to 5:59 AM | 6 (13.6%) | 0 (0.0%) |
| 6:00 AM to 6:29 AM | 4 (9.1%) | 6 (10.7%) |
| 6:30 AM to 6:59 AM | 2 (4.5%) | 2 (3.6%) |
| 7:00 AM to 7:29 AM | 15 (34.1%) | 0 (0.0%) |
| 7:30 AM to 7:59 AM | 6 (13.6%) | 9 (16.1%) |
| 8:00 AM to 8:29 AM | 0 (0.0%) | 2 (3.6%) |
| 8:30 AM to 8:59 AM | 0 (0.0%) | 13 (23.2%) |
| 9:00 AM to 9:59 AM | 0 (0.0%) | 4 (7.1%) |
| 10:00 AM to 10:59 AM | 0 (0.0%) | 5 (8.9%) |
| 11:00 AM to 11:59 AM | 0 (0.0%) | 0 (0.0%) |
| 12:00 PM to 3:59 PM | 1 (2.3%) | 13 (23.2%) |
| 4:00 PM to 11:59 PM | 3 (6.8%) | 2 (3.6%) |
| Total | 44 (100.0%) | 56 (100.0%) |
Housing Occupancy in Twilight borough
Occupancy by Ownership in Twilight borough
Of the total 87 dwellings in Twilight borough, owner-occupied units account for 85 (97.7%), while renter-occupied units make up 2 (2.3%).
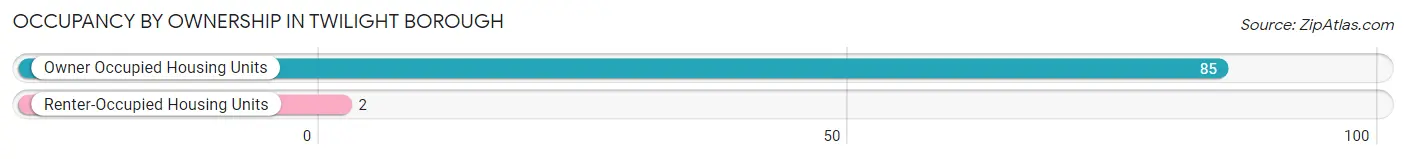
| Occupancy | # Housing Units | % Housing Units |
| Owner Occupied Housing Units | 85 | 97.7% |
| Renter-Occupied Housing Units | 2 | 2.3% |
| Total Occupied Housing Units | 87 | 100.0% |
Occupancy by Household Size in Twilight borough
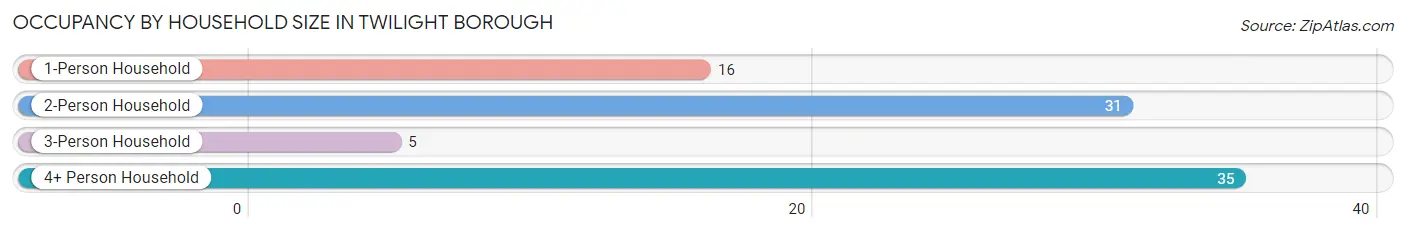
| Household Size | # Housing Units | % Housing Units |
| 1-Person Household | 16 | 18.4% |
| 2-Person Household | 31 | 35.6% |
| 3-Person Household | 5 | 5.8% |
| 4+ Person Household | 35 | 40.2% |
| Total Housing Units | 87 | 100.0% |
Occupancy by Ownership by Household Size in Twilight borough
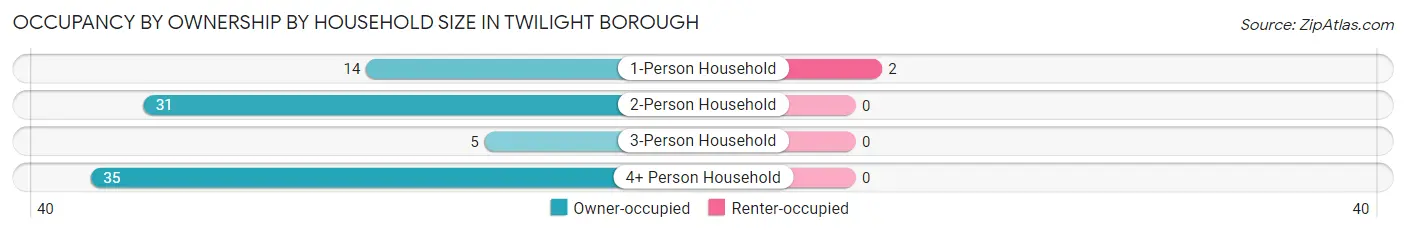
| Household Size | Owner-occupied | Renter-occupied |
| 1-Person Household | 14 (87.5%) | 2 (12.5%) |
| 2-Person Household | 31 (100.0%) | 0 (0.0%) |
| 3-Person Household | 5 (100.0%) | 0 (0.0%) |
| 4+ Person Household | 35 (100.0%) | 0 (0.0%) |
| Total Housing Units | 85 (97.7%) | 2 (2.3%) |
Occupancy by Educational Attainment in Twilight borough
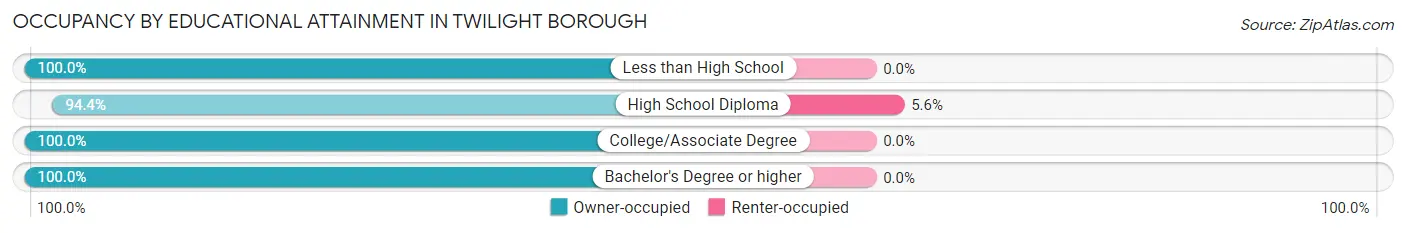
| Household Size | Owner-occupied | Renter-occupied |
| Less than High School | 4 (100.0%) | 0 (0.0%) |
| High School Diploma | 34 (94.4%) | 2 (5.6%) |
| College/Associate Degree | 36 (100.0%) | 0 (0.0%) |
| Bachelor's Degree or higher | 11 (100.0%) | 0 (0.0%) |
Occupancy by Age of Householder in Twilight borough
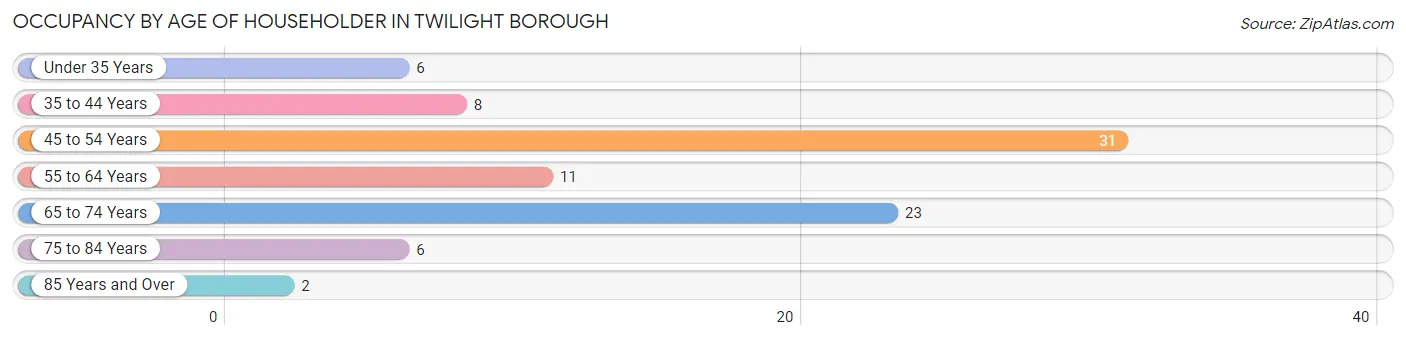
| Age Bracket | # Households | % Households |
| Under 35 Years | 6 | 6.9% |
| 35 to 44 Years | 8 | 9.2% |
| 45 to 54 Years | 31 | 35.6% |
| 55 to 64 Years | 11 | 12.6% |
| 65 to 74 Years | 23 | 26.4% |
| 75 to 84 Years | 6 | 6.9% |
| 85 Years and Over | 2 | 2.3% |
| Total | 87 | 100.0% |
Housing Finances in Twilight borough
Median Income by Occupancy in Twilight borough
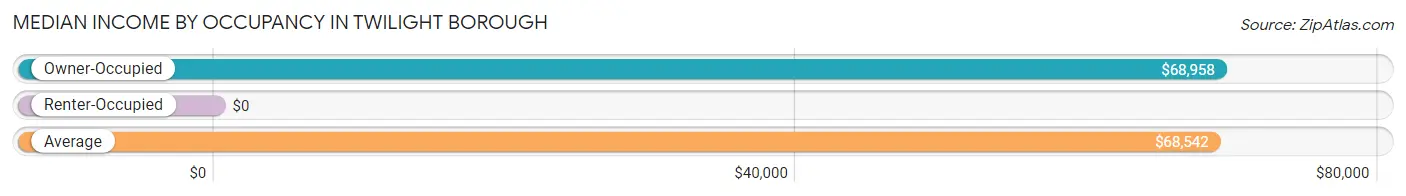
| Occupancy Type | # Households | Median Income |
| Owner-Occupied | 85 (97.7%) | $68,958 |
| Renter-Occupied | 2 (2.3%) | $0 |
| Average | 87 (100.0%) | $68,542 |
Occupancy by Householder Income Bracket in Twilight borough
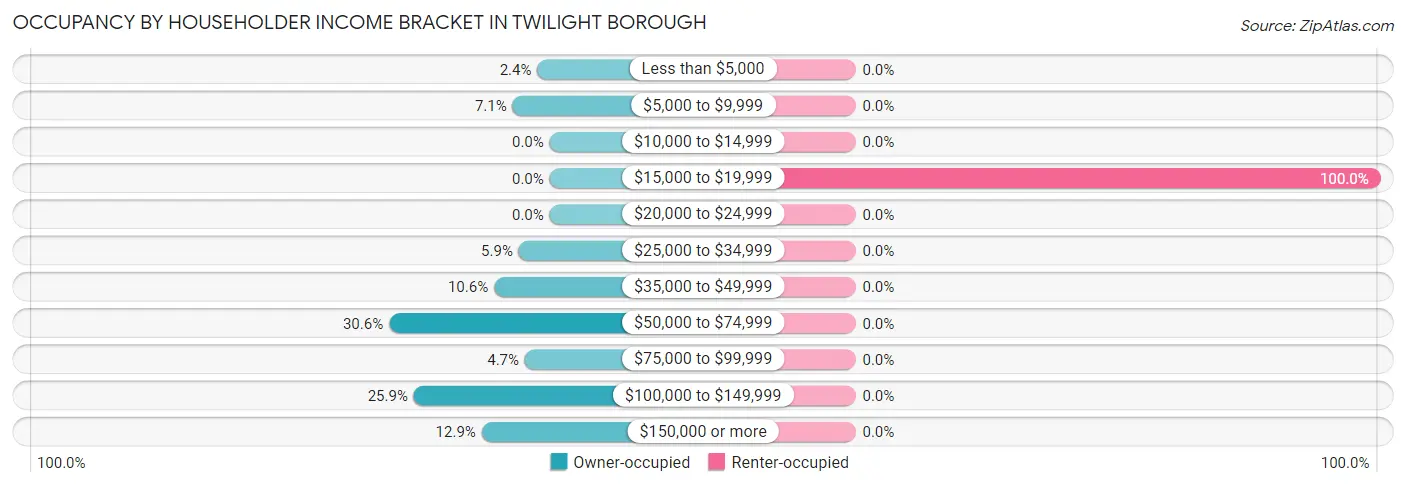
| Income Bracket | Owner-occupied | Renter-occupied |
| Less than $5,000 | 2 (2.4%) | 0 (0.0%) |
| $5,000 to $9,999 | 6 (7.1%) | 0 (0.0%) |
| $10,000 to $14,999 | 0 (0.0%) | 0 (0.0%) |
| $15,000 to $19,999 | 0 (0.0%) | 2 (100.0%) |
| $20,000 to $24,999 | 0 (0.0%) | 0 (0.0%) |
| $25,000 to $34,999 | 5 (5.9%) | 0 (0.0%) |
| $35,000 to $49,999 | 9 (10.6%) | 0 (0.0%) |
| $50,000 to $74,999 | 26 (30.6%) | 0 (0.0%) |
| $75,000 to $99,999 | 4 (4.7%) | 0 (0.0%) |
| $100,000 to $149,999 | 22 (25.9%) | 0 (0.0%) |
| $150,000 or more | 11 (12.9%) | 0 (0.0%) |
| Total | 85 (100.0%) | 2 (100.0%) |
Monthly Housing Cost Tiers in Twilight borough
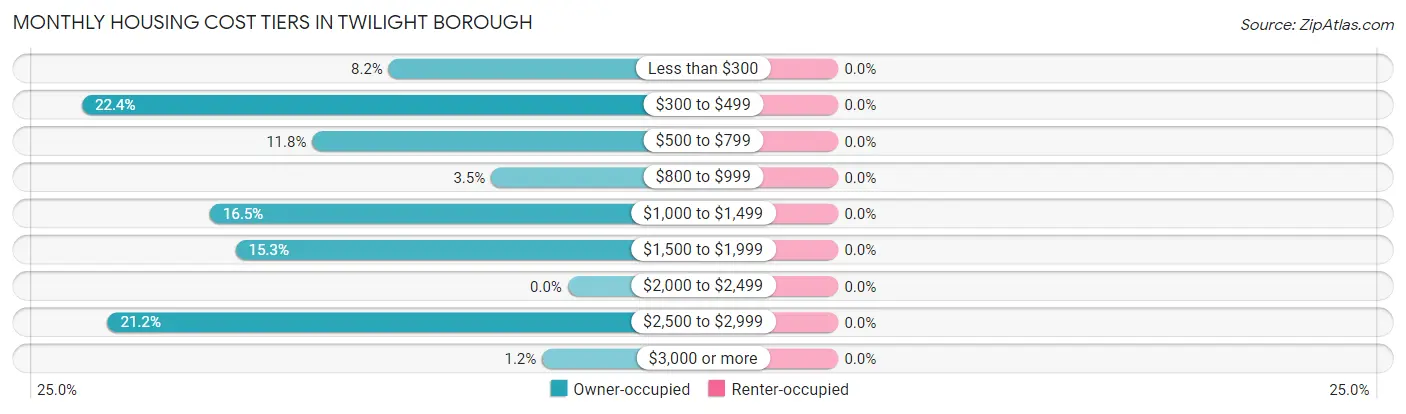
| Monthly Cost | Owner-occupied | Renter-occupied |
| Less than $300 | 7 (8.2%) | 0 (0.0%) |
| $300 to $499 | 19 (22.4%) | 0 (0.0%) |
| $500 to $799 | 10 (11.8%) | 0 (0.0%) |
| $800 to $999 | 3 (3.5%) | 0 (0.0%) |
| $1,000 to $1,499 | 14 (16.5%) | 0 (0.0%) |
| $1,500 to $1,999 | 13 (15.3%) | 0 (0.0%) |
| $2,000 to $2,499 | 0 (0.0%) | 0 (0.0%) |
| $2,500 to $2,999 | 18 (21.2%) | 0 (0.0%) |
| $3,000 or more | 1 (1.2%) | 0 (0.0%) |
| Total | 85 (100.0%) | 2 (100.0%) |
Physical Housing Characteristics in Twilight borough
Housing Structures in Twilight borough
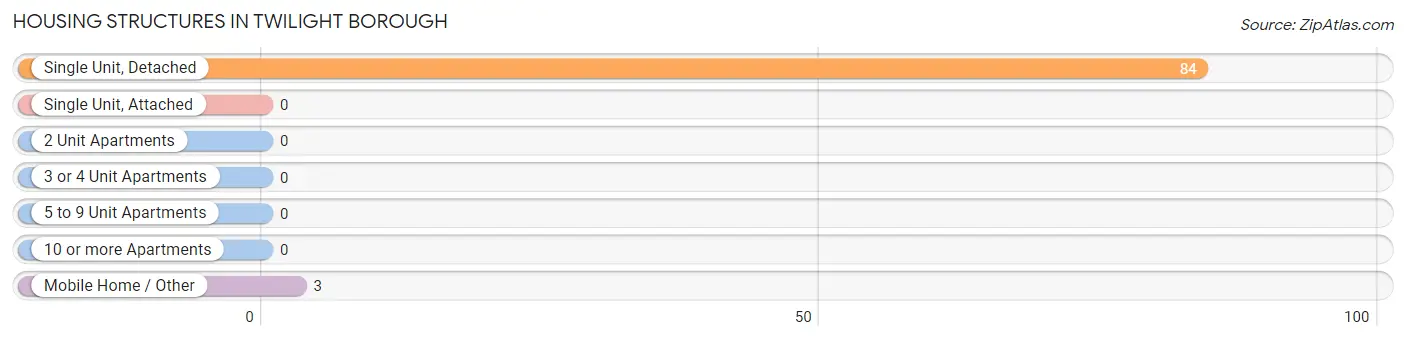
| Structure Type | # Housing Units | % Housing Units |
| Single Unit, Detached | 84 | 96.6% |
| Single Unit, Attached | 0 | 0.0% |
| 2 Unit Apartments | 0 | 0.0% |
| 3 or 4 Unit Apartments | 0 | 0.0% |
| 5 to 9 Unit Apartments | 0 | 0.0% |
| 10 or more Apartments | 0 | 0.0% |
| Mobile Home / Other | 3 | 3.5% |
| Total | 87 | 100.0% |
Housing Structures by Occupancy in Twilight borough
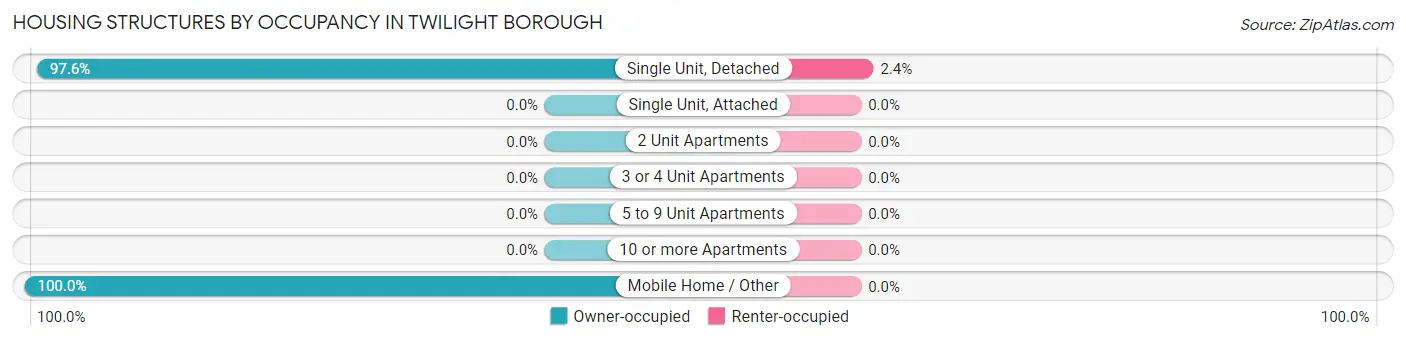
| Structure Type | Owner-occupied | Renter-occupied |
| Single Unit, Detached | 82 (97.6%) | 2 (2.4%) |
| Single Unit, Attached | 0 (0.0%) | 0 (0.0%) |
| 2 Unit Apartments | 0 (0.0%) | 0 (0.0%) |
| 3 or 4 Unit Apartments | 0 (0.0%) | 0 (0.0%) |
| 5 to 9 Unit Apartments | 0 (0.0%) | 0 (0.0%) |
| 10 or more Apartments | 0 (0.0%) | 0 (0.0%) |
| Mobile Home / Other | 3 (100.0%) | 0 (0.0%) |
| Total | 85 (97.7%) | 2 (2.3%) |
Housing Structures by Number of Rooms in Twilight borough
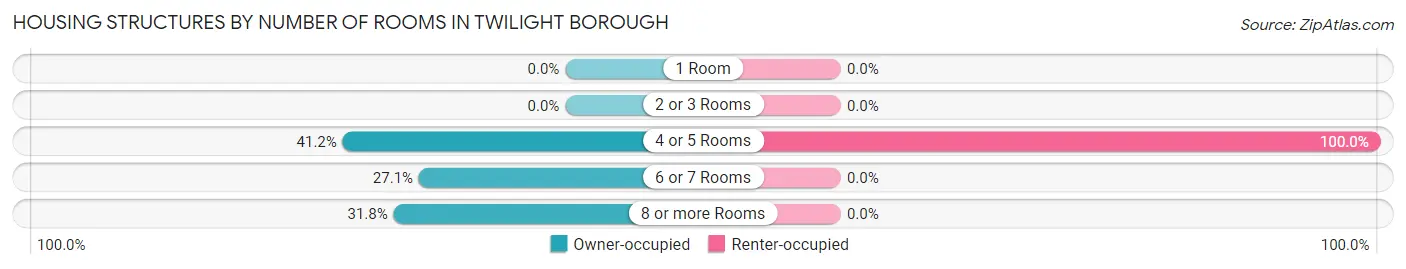
| Number of Rooms | Owner-occupied | Renter-occupied |
| 1 Room | 0 (0.0%) | 0 (0.0%) |
| 2 or 3 Rooms | 0 (0.0%) | 0 (0.0%) |
| 4 or 5 Rooms | 35 (41.2%) | 2 (100.0%) |
| 6 or 7 Rooms | 23 (27.1%) | 0 (0.0%) |
| 8 or more Rooms | 27 (31.8%) | 0 (0.0%) |
| Total | 85 (100.0%) | 2 (100.0%) |
Housing Structure by Heating Type in Twilight borough
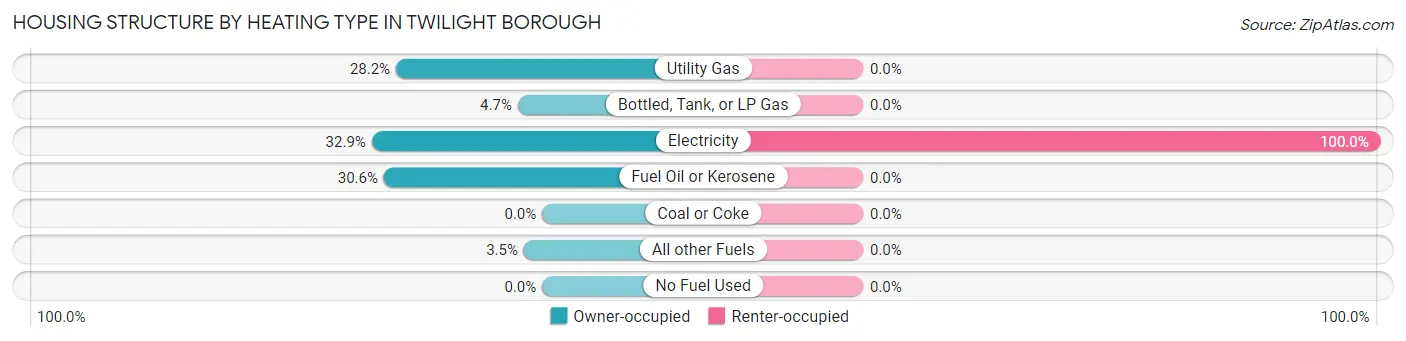
| Heating Type | Owner-occupied | Renter-occupied |
| Utility Gas | 24 (28.2%) | 0 (0.0%) |
| Bottled, Tank, or LP Gas | 4 (4.7%) | 0 (0.0%) |
| Electricity | 28 (32.9%) | 2 (100.0%) |
| Fuel Oil or Kerosene | 26 (30.6%) | 0 (0.0%) |
| Coal or Coke | 0 (0.0%) | 0 (0.0%) |
| All other Fuels | 3 (3.5%) | 0 (0.0%) |
| No Fuel Used | 0 (0.0%) | 0 (0.0%) |
| Total | 85 (100.0%) | 2 (100.0%) |
Household Vehicle Usage in Twilight borough
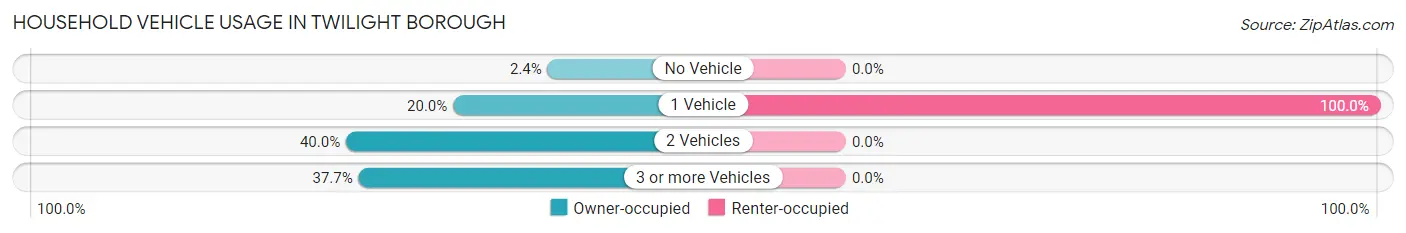
| Vehicles per Household | Owner-occupied | Renter-occupied |
| No Vehicle | 2 (2.4%) | 0 (0.0%) |
| 1 Vehicle | 17 (20.0%) | 2 (100.0%) |
| 2 Vehicles | 34 (40.0%) | 0 (0.0%) |
| 3 or more Vehicles | 32 (37.7%) | 0 (0.0%) |
| Total | 85 (100.0%) | 2 (100.0%) |
Real Estate & Mortgages in Twilight borough
Real Estate and Mortgage Overview in Twilight borough
| Characteristic | Without Mortgage | With Mortgage |
| Housing Units | 40 | 45 |
| Median Property Value | $105,600 | $167,900 |
| Median Household Income | $51,250 | $9 |
| Monthly Housing Costs | $463 | $1 |
| Real Estate Taxes | $1,375 | $0 |
Property Value by Mortgage Status in Twilight borough
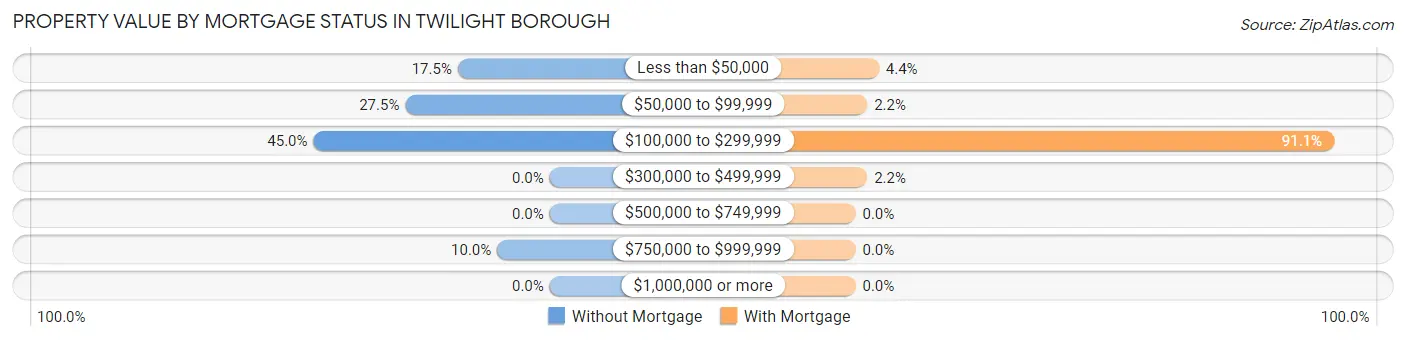
| Property Value | Without Mortgage | With Mortgage |
| Less than $50,000 | 7 (17.5%) | 2 (4.4%) |
| $50,000 to $99,999 | 11 (27.5%) | 1 (2.2%) |
| $100,000 to $299,999 | 18 (45.0%) | 41 (91.1%) |
| $300,000 to $499,999 | 0 (0.0%) | 1 (2.2%) |
| $500,000 to $749,999 | 0 (0.0%) | 0 (0.0%) |
| $750,000 to $999,999 | 4 (10.0%) | 0 (0.0%) |
| $1,000,000 or more | 0 (0.0%) | 0 (0.0%) |
| Total | 40 (100.0%) | 45 (100.0%) |
Household Income by Mortgage Status in Twilight borough
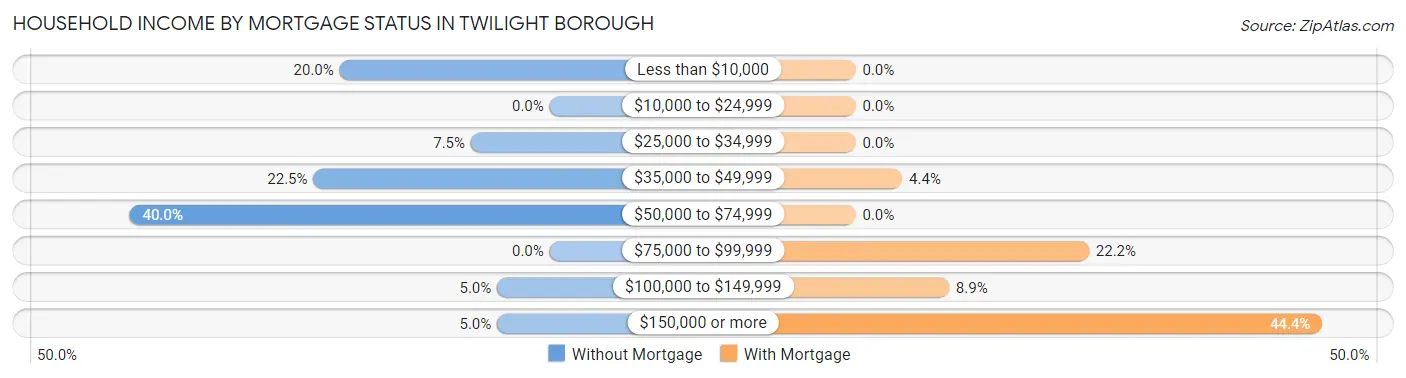
| Household Income | Without Mortgage | With Mortgage |
| Less than $10,000 | 8 (20.0%) | 0 (0.0%) |
| $10,000 to $24,999 | 0 (0.0%) | 0 (0.0%) |
| $25,000 to $34,999 | 3 (7.5%) | 0 (0.0%) |
| $35,000 to $49,999 | 9 (22.5%) | 2 (4.4%) |
| $50,000 to $74,999 | 16 (40.0%) | 0 (0.0%) |
| $75,000 to $99,999 | 0 (0.0%) | 10 (22.2%) |
| $100,000 to $149,999 | 2 (5.0%) | 4 (8.9%) |
| $150,000 or more | 2 (5.0%) | 20 (44.4%) |
| Total | 40 (100.0%) | 45 (100.0%) |
Property Value to Household Income Ratio in Twilight borough
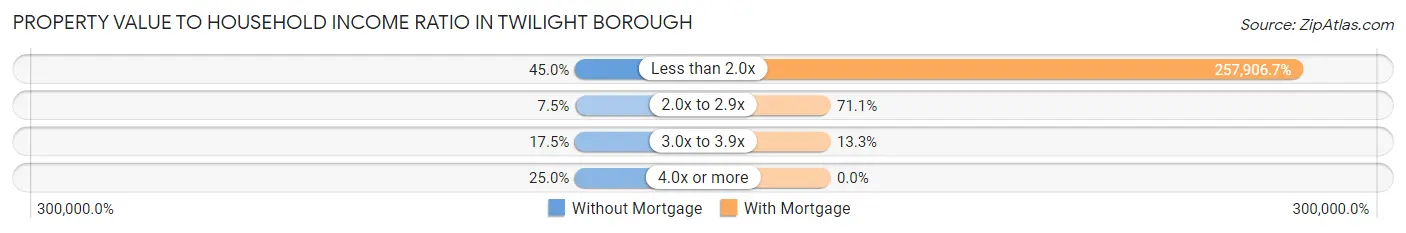
| Value-to-Income Ratio | Without Mortgage | With Mortgage |
| Less than 2.0x | 18 (45.0%) | 116,058 (257,906.7%) |
| 2.0x to 2.9x | 3 (7.5%) | 32 (71.1%) |
| 3.0x to 3.9x | 7 (17.5%) | 6 (13.3%) |
| 4.0x or more | 10 (25.0%) | 0 (0.0%) |
| Total | 40 (100.0%) | 45 (100.0%) |
Real Estate Taxes by Mortgage Status in Twilight borough
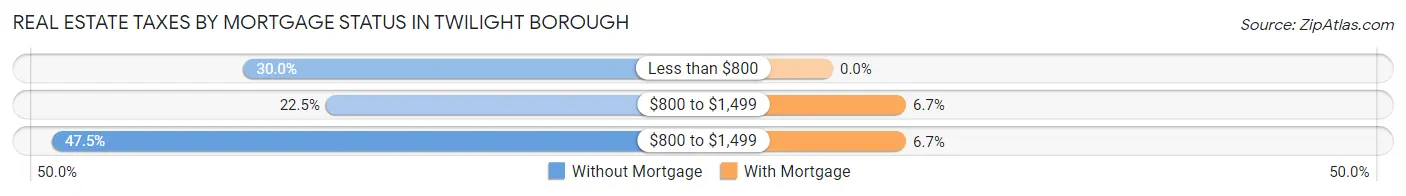
| Property Taxes | Without Mortgage | With Mortgage |
| Less than $800 | 12 (30.0%) | 0 (0.0%) |
| $800 to $1,499 | 9 (22.5%) | 3 (6.7%) |
| $800 to $1,499 | 19 (47.5%) | 3 (6.7%) |
| Total | 40 (100.0%) | 45 (100.0%) |
Health & Disability in Twilight borough
Health Insurance Coverage by Age in Twilight borough
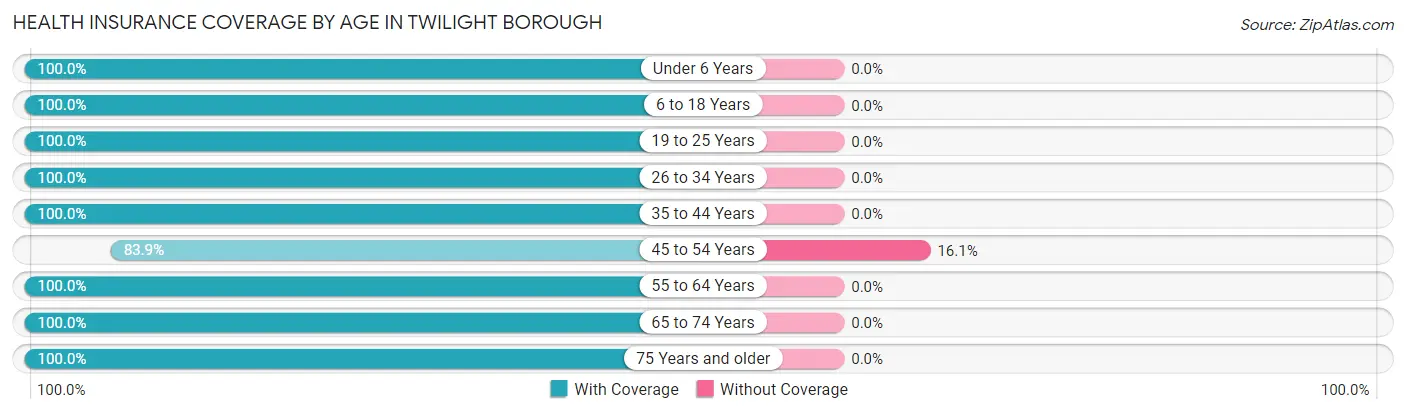
| Age Bracket | With Coverage | Without Coverage |
| Under 6 Years | 13 (100.0%) | 0 (0.0%) |
| 6 to 18 Years | 55 (100.0%) | 0 (0.0%) |
| 19 to 25 Years | 29 (100.0%) | 0 (0.0%) |
| 26 to 34 Years | 11 (100.0%) | 0 (0.0%) |
| 35 to 44 Years | 23 (100.0%) | 0 (0.0%) |
| 45 to 54 Years | 47 (83.9%) | 9 (16.1%) |
| 55 to 64 Years | 21 (100.0%) | 0 (0.0%) |
| 65 to 74 Years | 38 (100.0%) | 0 (0.0%) |
| 75 Years and older | 19 (100.0%) | 0 (0.0%) |
| Total | 256 (96.6%) | 9 (3.4%) |
Health Insurance Coverage by Citizenship Status in Twilight borough
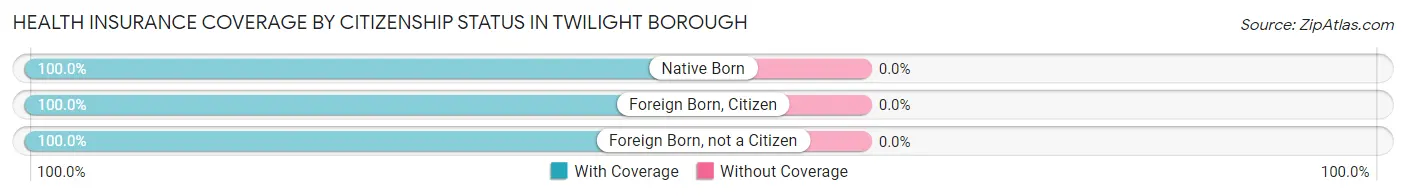
| Citizenship Status | With Coverage | Without Coverage |
| Native Born | 13 (100.0%) | 0 (0.0%) |
| Foreign Born, Citizen | 55 (100.0%) | 0 (0.0%) |
| Foreign Born, not a Citizen | 29 (100.0%) | 0 (0.0%) |
Health Insurance Coverage by Household Income in Twilight borough
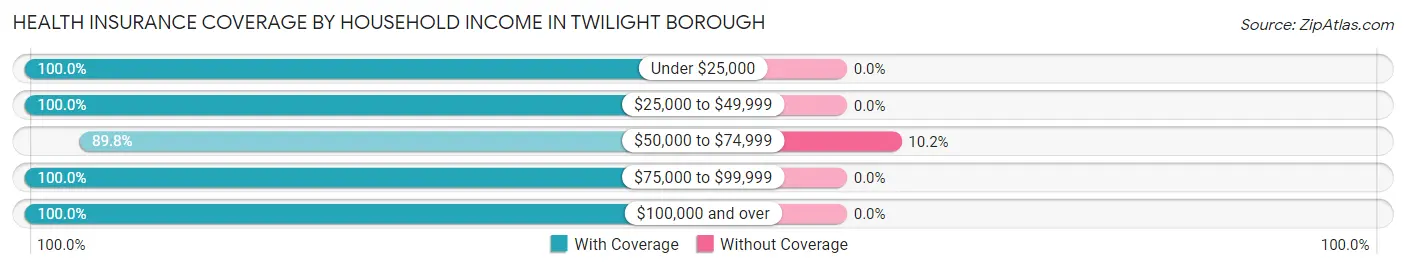
| Household Income | With Coverage | Without Coverage |
| Under $25,000 | 14 (100.0%) | 0 (0.0%) |
| $25,000 to $49,999 | 20 (100.0%) | 0 (0.0%) |
| $50,000 to $74,999 | 79 (89.8%) | 9 (10.2%) |
| $75,000 to $99,999 | 14 (100.0%) | 0 (0.0%) |
| $100,000 and over | 129 (100.0%) | 0 (0.0%) |
Public vs Private Health Insurance Coverage by Age in Twilight borough
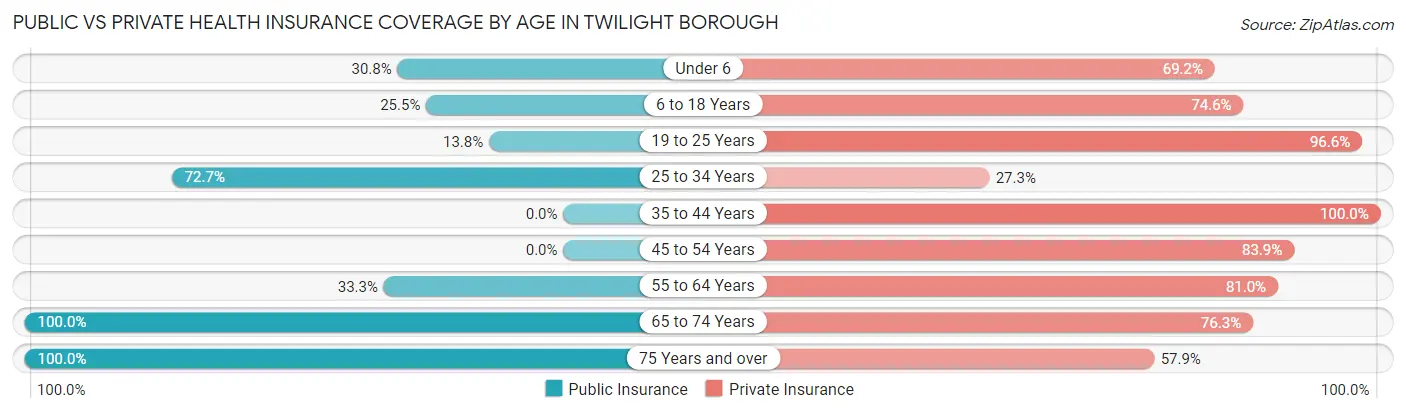
| Age Bracket | Public Insurance | Private Insurance |
| Under 6 | 4 (30.8%) | 9 (69.2%) |
| 6 to 18 Years | 14 (25.5%) | 41 (74.6%) |
| 19 to 25 Years | 4 (13.8%) | 28 (96.6%) |
| 25 to 34 Years | 8 (72.7%) | 3 (27.3%) |
| 35 to 44 Years | 0 (0.0%) | 23 (100.0%) |
| 45 to 54 Years | 0 (0.0%) | 47 (83.9%) |
| 55 to 64 Years | 7 (33.3%) | 17 (80.9%) |
| 65 to 74 Years | 38 (100.0%) | 29 (76.3%) |
| 75 Years and over | 19 (100.0%) | 11 (57.9%) |
| Total | 94 (35.5%) | 208 (78.5%) |
Disability Status by Sex by Age in Twilight borough
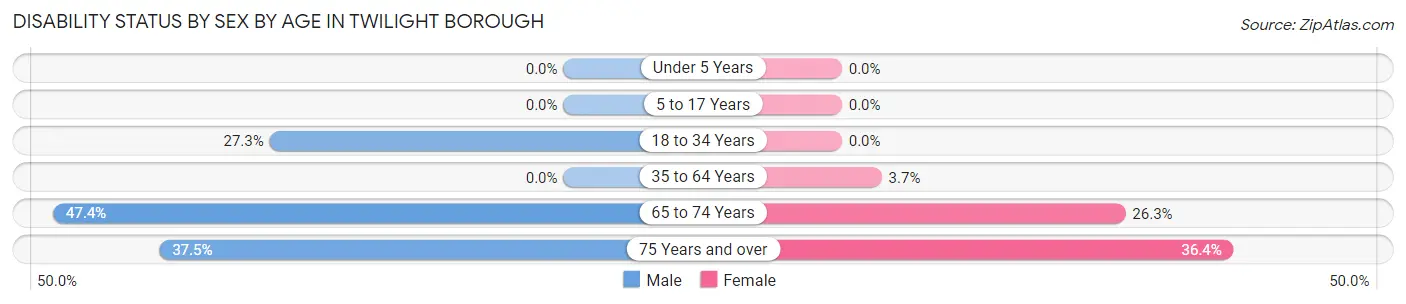
| Age Bracket | Male | Female |
| Under 5 Years | 0 (0.0%) | 0 (0.0%) |
| 5 to 17 Years | 0 (0.0%) | 0 (0.0%) |
| 18 to 34 Years | 3 (27.3%) | 0 (0.0%) |
| 35 to 64 Years | 0 (0.0%) | 2 (3.7%) |
| 65 to 74 Years | 9 (47.4%) | 5 (26.3%) |
| 75 Years and over | 3 (37.5%) | 4 (36.4%) |
Disability Class by Sex by Age in Twilight borough
Disability Class: Hearing Difficulty
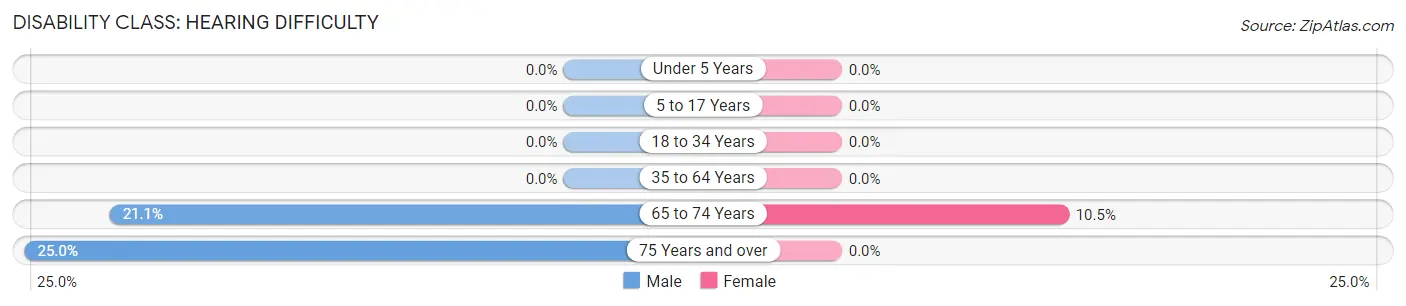
| Age Bracket | Male | Female |
| Under 5 Years | 0 (0.0%) | 0 (0.0%) |
| 5 to 17 Years | 0 (0.0%) | 0 (0.0%) |
| 18 to 34 Years | 0 (0.0%) | 0 (0.0%) |
| 35 to 64 Years | 0 (0.0%) | 0 (0.0%) |
| 65 to 74 Years | 4 (21.0%) | 2 (10.5%) |
| 75 Years and over | 2 (25.0%) | 0 (0.0%) |
Disability Class: Vision Difficulty
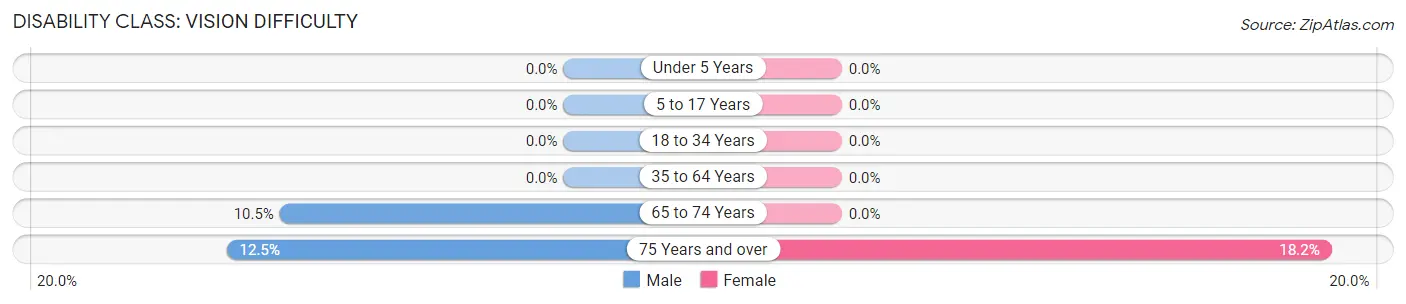
| Age Bracket | Male | Female |
| Under 5 Years | 0 (0.0%) | 0 (0.0%) |
| 5 to 17 Years | 0 (0.0%) | 0 (0.0%) |
| 18 to 34 Years | 0 (0.0%) | 0 (0.0%) |
| 35 to 64 Years | 0 (0.0%) | 0 (0.0%) |
| 65 to 74 Years | 2 (10.5%) | 0 (0.0%) |
| 75 Years and over | 1 (12.5%) | 2 (18.2%) |
Disability Class: Cognitive Difficulty
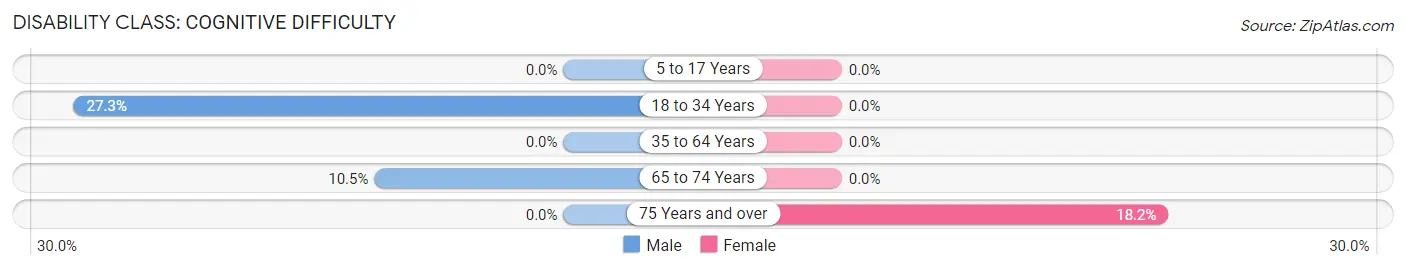
| Age Bracket | Male | Female |
| 5 to 17 Years | 0 (0.0%) | 0 (0.0%) |
| 18 to 34 Years | 3 (27.3%) | 0 (0.0%) |
| 35 to 64 Years | 0 (0.0%) | 0 (0.0%) |
| 65 to 74 Years | 2 (10.5%) | 0 (0.0%) |
| 75 Years and over | 0 (0.0%) | 2 (18.2%) |
Disability Class: Ambulatory Difficulty
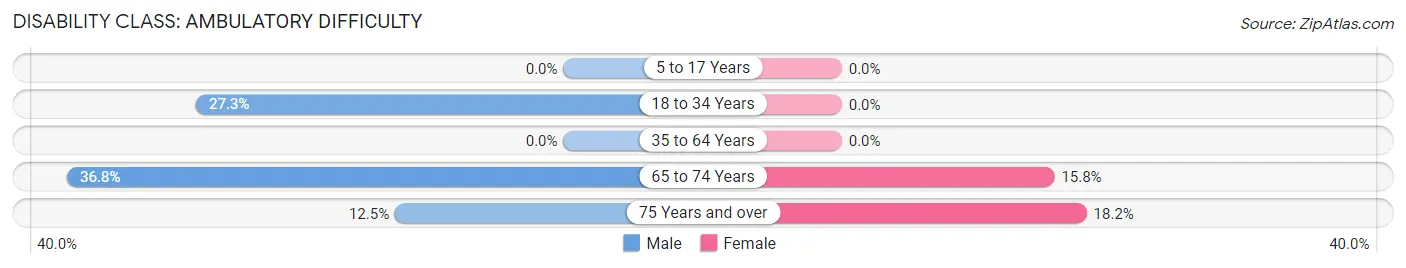
| Age Bracket | Male | Female |
| 5 to 17 Years | 0 (0.0%) | 0 (0.0%) |
| 18 to 34 Years | 3 (27.3%) | 0 (0.0%) |
| 35 to 64 Years | 0 (0.0%) | 0 (0.0%) |
| 65 to 74 Years | 7 (36.8%) | 3 (15.8%) |
| 75 Years and over | 1 (12.5%) | 2 (18.2%) |
Disability Class: Self-Care Difficulty
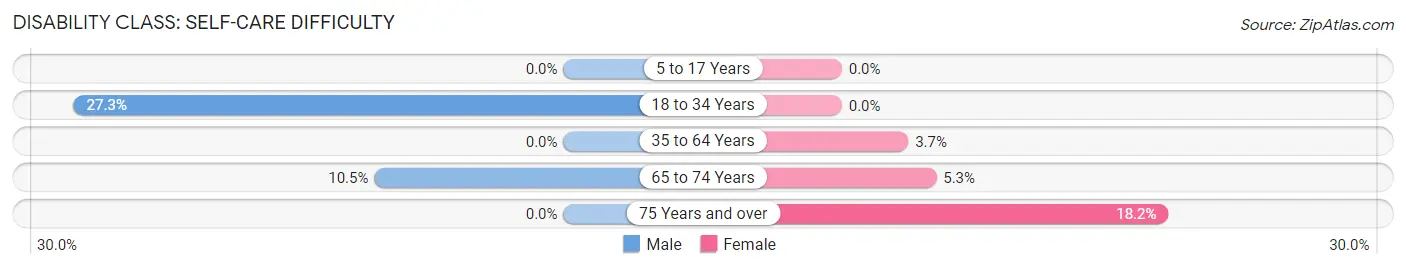
| Age Bracket | Male | Female |
| 5 to 17 Years | 0 (0.0%) | 0 (0.0%) |
| 18 to 34 Years | 3 (27.3%) | 0 (0.0%) |
| 35 to 64 Years | 0 (0.0%) | 2 (3.7%) |
| 65 to 74 Years | 2 (10.5%) | 1 (5.3%) |
| 75 Years and over | 0 (0.0%) | 2 (18.2%) |
Technology Access in Twilight borough
Computing Device Access in Twilight borough
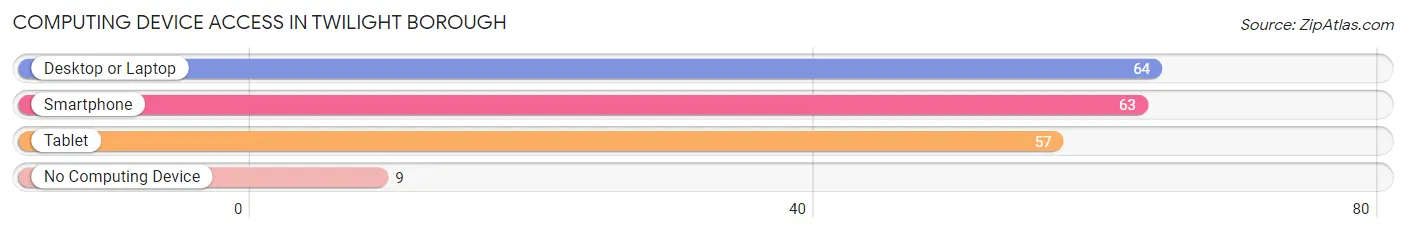
| Device Type | # Households | % Households |
| Desktop or Laptop | 64 | 73.6% |
| Smartphone | 63 | 72.4% |
| Tablet | 57 | 65.5% |
| No Computing Device | 9 | 10.3% |
| Total | 87 | 100.0% |
Internet Access in Twilight borough
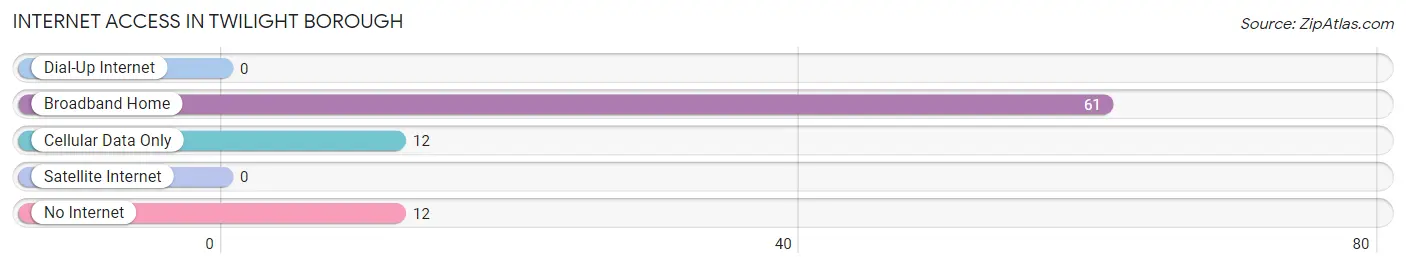
| Internet Type | # Households | % Households |
| Dial-Up Internet | 0 | 0.0% |
| Broadband Home | 61 | 70.1% |
| Cellular Data Only | 12 | 13.8% |
| Satellite Internet | 0 | 0.0% |
| No Internet | 12 | 13.8% |
| Total | 87 | 100.0% |
Twilight borough Summary
Twilight Borough is a small borough located in the Allegheny Mountains of Pennsylvania. It is situated in the northern part of the state, about 30 miles from the state capital of Harrisburg. The borough is home to a population of approximately 1,500 people, and is part of the larger Bedford County.
History
Twilight Borough was founded in 1820 by a group of settlers from the nearby town of Bedford. The settlers were looking for a place to settle that was away from the hustle and bustle of the larger towns and cities. They chose the area because of its natural beauty and the abundance of resources. The settlers named the area Twilight because of the beautiful sunsets that could be seen from the area.
The first settlers in the area were mostly farmers, and the area quickly became known for its agricultural production. The area was also known for its timber production, and the settlers quickly began to build homes and businesses in the area.
In the late 1800s, the area began to experience a period of growth and development. The railroad was extended to the area, and the town began to attract more people. The population of the area grew to over 1,000 people by the turn of the century.
Geography
Twilight Borough is located in the northern part of Pennsylvania, in the Allegheny Mountains. The borough is situated in a valley, surrounded by mountains on all sides. The area is known for its natural beauty, and is home to a variety of wildlife. The area is also known for its abundance of natural resources, including timber, coal, and natural gas.
The borough is located in a temperate climate, with mild winters and warm summers. The average temperature in the area is around 50 degrees Fahrenheit. The area receives an average of 40 inches of precipitation each year, with most of it falling in the form of snow.
Economy
The economy of Twilight Borough is largely based on agriculture and timber production. The area is home to a variety of farms, and the timber industry is also a major contributor to the local economy. The area is also home to a number of small businesses, including restaurants, shops, and other services.
The area is also home to a number of tourist attractions, including the Allegheny National Forest and the Allegheny River. The area is also home to a number of outdoor recreation activities, including camping, fishing, and hiking.
Demographics
As of the 2010 census, the population of Twilight Borough was 1,500 people. The population is largely white, with a small percentage of African Americans and other minorities. The median household income in the area is around $40,000, and the median age is around 40 years old. The area is largely rural, with most of the population living in small towns and villages.
Common Questions
What is Per Capita Income in Twilight borough?
Per Capita income in Twilight borough is $46,394.
What is the Median Family Income in Twilight borough?
Median Family Income in Twilight borough is $84,375.
What is the Median Household income in Twilight borough?
Median Household Income in Twilight borough is $68,542.
What is Income or Wage Gap in Twilight borough?
Income or Wage Gap in Twilight borough is 67.2%.
Women in Twilight borough earn 32.8 cents for every dollar earned by a man.
What is Inequality or Gini Index in Twilight borough?
Inequality or Gini Index in Twilight borough is 0.59.
What is the Total Population of Twilight borough?
Total Population of Twilight borough is 265.
What is the Total Male Population of Twilight borough?
Total Male Population of Twilight borough is 118.
What is the Total Female Population of Twilight borough?
Total Female Population of Twilight borough is 147.
What is the Ratio of Males per 100 Females in Twilight borough?
There are 80.27 Males per 100 Females in Twilight borough.
What is the Ratio of Females per 100 Males in Twilight borough?
There are 124.58 Females per 100 Males in Twilight borough.
What is the Median Population Age in Twilight borough?
Median Population Age in Twilight borough is 45.1 Years.
What is the Average Family Size in Twilight borough
Average Family Size in Twilight borough is 3.5 People.
What is the Average Household Size in Twilight borough
Average Household Size in Twilight borough is 3.0 People.
How Large is the Labor Force in Twilight borough?
There are 115 People in the Labor Forcein in Twilight borough.
What is the Percentage of People in the Labor Force in Twilight borough?
50.7% of People are in the Labor Force in Twilight borough.
What is the Unemployment Rate in Twilight borough?
Unemployment Rate in Twilight borough is 3.5%.