Dillsburg borough, PA Map & Demographics
Dillsburg borough Overview
$35,704
PER CAPITA INCOME
$96,875
AVG FAMILY INCOME
$78,674
AVG HOUSEHOLD INCOME
29.3%
WAGE / INCOME GAP [ % ]
70.7¢/ $1
WAGE / INCOME GAP [ $ ]
0.37
INEQUALITY / GINI INDEX
2,629
TOTAL POPULATION
1,243
MALE POPULATION
1,386
FEMALE POPULATION
89.68
MALES / 100 FEMALES
111.50
FEMALES / 100 MALES
34.3
MEDIAN AGE
3.1
AVG FAMILY SIZE
2.6
AVG HOUSEHOLD SIZE
1,559
LABOR FORCE [ PEOPLE ]
78.3%
PERCENT IN LABOR FORCE
4.4%
UNEMPLOYMENT RATE
Income in Dillsburg borough
Income Overview in Dillsburg borough
Per Capita Income in Dillsburg borough is $35,704, while median incomes of families and households are $96,875 and $78,674 respectively.
| Characteristic | Number | Measure |
| Per Capita Income | 2,629 | $35,704 |
| Median Family Income | 667 | $96,875 |
| Mean Family Income | 667 | $106,022 |
| Median Household Income | 1,023 | $78,674 |
| Mean Household Income | 1,023 | $90,188 |
| Income Deficit | 667 | $0 |
| Wage / Income Gap (%) | 2,629 | 29.32% |
| Wage / Income Gap ($) | 2,629 | 70.68¢ per $1 |
| Gini / Inequality Index | 2,629 | 0.37 |
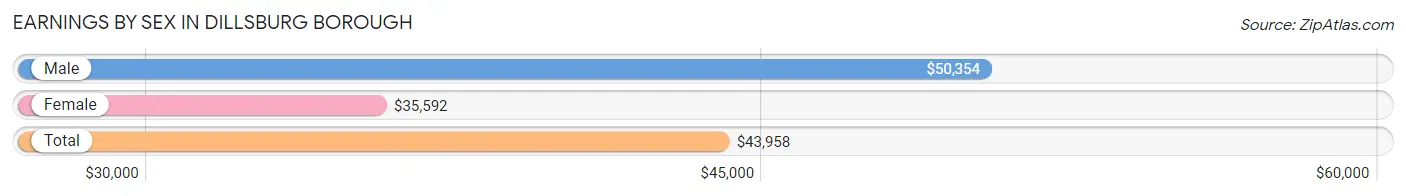
Earnings by Sex in Dillsburg borough
Average Earnings in Dillsburg borough are $43,958, $50,354 for men and $35,592 for women, a difference of 29.3%.
| Sex | Number | Average Earnings |
| Male | 809 (50.9%) | $50,354 |
| Female | 779 (49.1%) | $35,592 |
| Total | 1,588 (100.0%) | $43,958 |
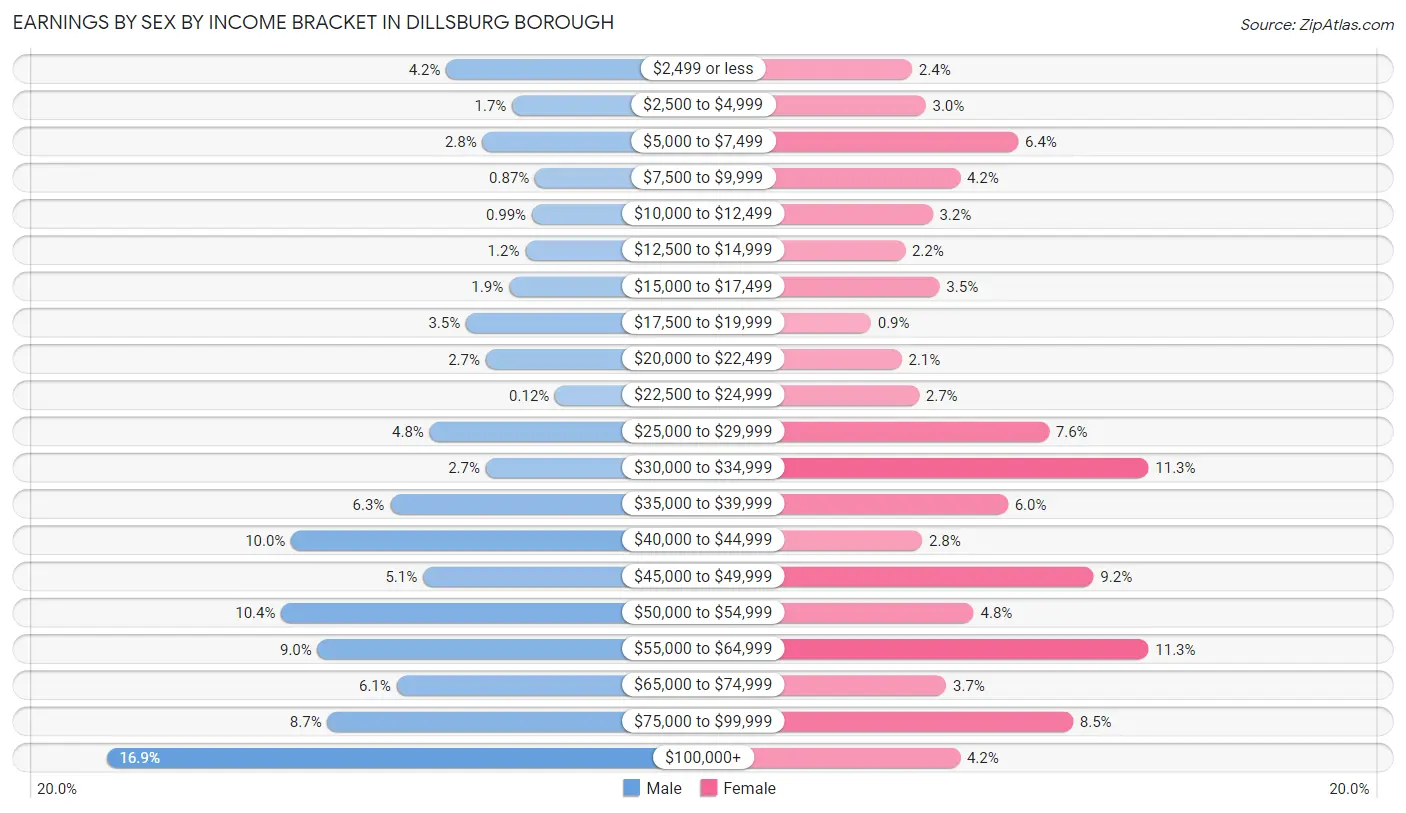
Earnings by Sex by Income Bracket in Dillsburg borough
The most common earnings brackets in Dillsburg borough are $100,000+ for men (137 | 16.9%) and $30,000 to $34,999 for women (88 | 11.3%).
| Income | Male | Female |
| $2,499 or less | 34 (4.2%) | 19 (2.4%) |
| $2,500 to $4,999 | 14 (1.7%) | 23 (2.9%) |
| $5,000 to $7,499 | 23 (2.8%) | 50 (6.4%) |
| $7,500 to $9,999 | 7 (0.9%) | 33 (4.2%) |
| $10,000 to $12,499 | 8 (1.0%) | 25 (3.2%) |
| $12,500 to $14,999 | 10 (1.2%) | 17 (2.2%) |
| $15,000 to $17,499 | 15 (1.8%) | 27 (3.5%) |
| $17,500 to $19,999 | 28 (3.5%) | 7 (0.9%) |
| $20,000 to $22,499 | 22 (2.7%) | 16 (2.1%) |
| $22,500 to $24,999 | 1 (0.1%) | 21 (2.7%) |
| $25,000 to $29,999 | 39 (4.8%) | 59 (7.6%) |
| $30,000 to $34,999 | 22 (2.7%) | 88 (11.3%) |
| $35,000 to $39,999 | 51 (6.3%) | 47 (6.0%) |
| $40,000 to $44,999 | 81 (10.0%) | 22 (2.8%) |
| $45,000 to $49,999 | 41 (5.1%) | 72 (9.2%) |
| $50,000 to $54,999 | 84 (10.4%) | 37 (4.8%) |
| $55,000 to $64,999 | 73 (9.0%) | 88 (11.3%) |
| $65,000 to $74,999 | 49 (6.1%) | 29 (3.7%) |
| $75,000 to $99,999 | 70 (8.6%) | 66 (8.5%) |
| $100,000+ | 137 (16.9%) | 33 (4.2%) |
| Total | 809 (100.0%) | 779 (100.0%) |
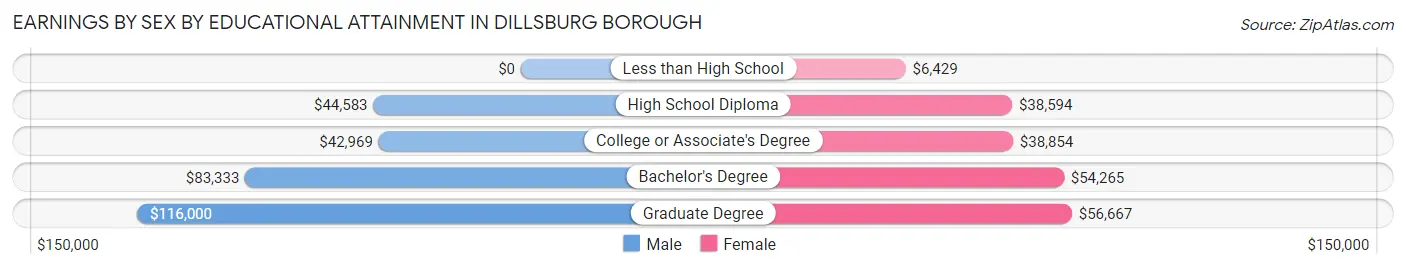
Earnings by Sex by Educational Attainment in Dillsburg borough
Average earnings in Dillsburg borough are $51,208 for men and $43,125 for women, a difference of 15.8%. Men with an educational attainment of graduate degree enjoy the highest average annual earnings of $116,000, while those with college or associate's degree education earn the least with $42,969. Women with an educational attainment of graduate degree earn the most with the average annual earnings of $56,667, while those with less than high school education have the smallest earnings of $6,429.
| Educational Attainment | Male Income | Female Income |
| Less than High School | - | - |
| High School Diploma | $44,583 | $38,594 |
| College or Associate's Degree | $42,969 | $38,854 |
| Bachelor's Degree | $83,333 | $54,265 |
| Graduate Degree | $116,000 | $56,667 |
| Total | $51,208 | $43,125 |
Family Income in Dillsburg borough
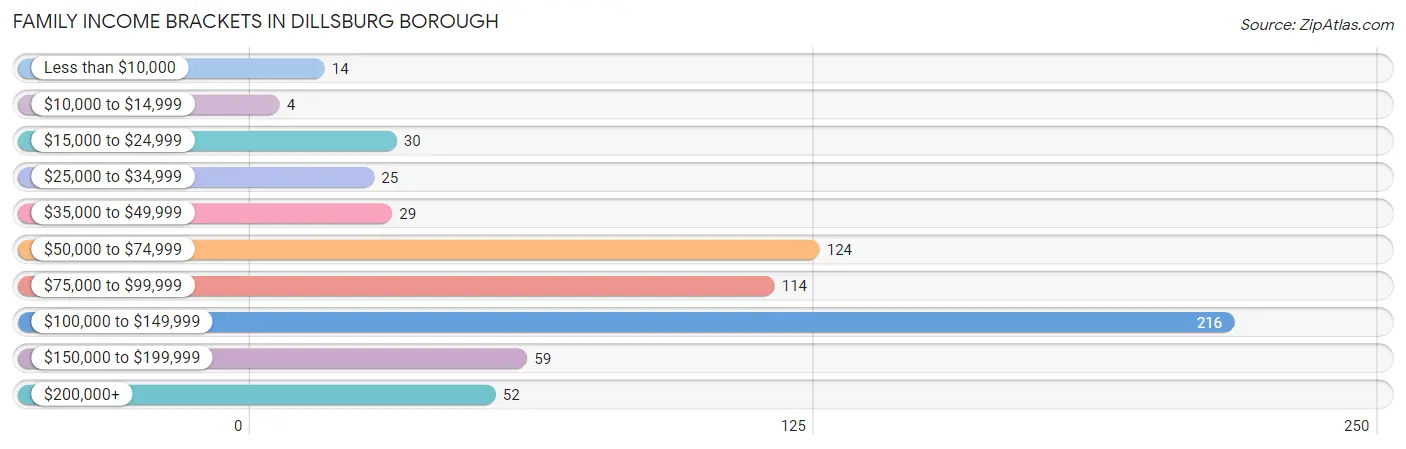
Family Income Brackets in Dillsburg borough
According to the Dillsburg borough family income data, there are 216 families falling into the $100,000 to $149,999 income range, which is the most common income bracket and makes up 32.4% of all families. Conversely, the $10,000 to $14,999 income bracket is the least frequent group with only 4 families (0.6%) belonging to this category.
| Income Bracket | # Families | % Families |
| Less than $10,000 | 14 | 2.1% |
| $10,000 to $14,999 | 4 | 0.6% |
| $15,000 to $24,999 | 30 | 4.5% |
| $25,000 to $34,999 | 25 | 3.7% |
| $35,000 to $49,999 | 29 | 4.3% |
| $50,000 to $74,999 | 124 | 18.6% |
| $75,000 to $99,999 | 114 | 17.1% |
| $100,000 to $149,999 | 216 | 32.4% |
| $150,000 to $199,999 | 59 | 8.8% |
| $200,000+ | 52 | 7.8% |
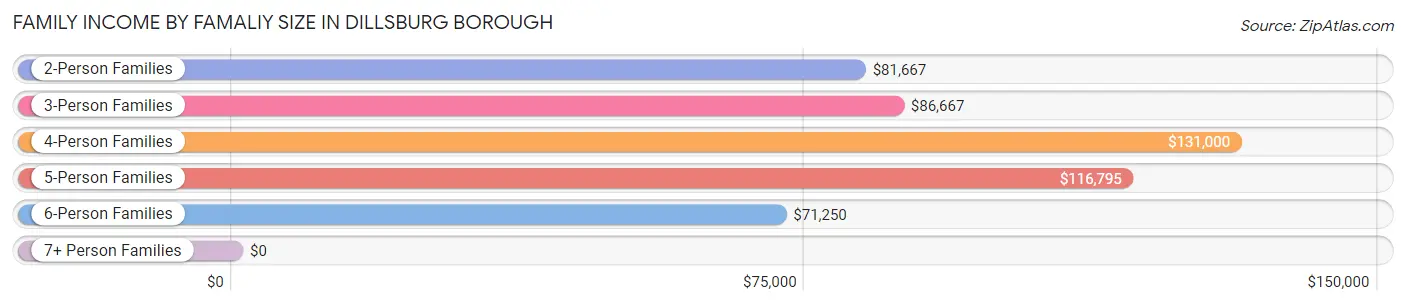
Family Income by Famaliy Size in Dillsburg borough
4-person families (94 | 14.1%) account for the highest median family income in Dillsburg borough with $131,000 per family, while 2-person families (320 | 48.0%) have the highest median income of $40,834 per family member.
| Income Bracket | # Families | Median Income |
| 2-Person Families | 320 (48.0%) | $81,667 |
| 3-Person Families | 146 (21.9%) | $86,667 |
| 4-Person Families | 94 (14.1%) | $131,000 |
| 5-Person Families | 74 (11.1%) | $116,795 |
| 6-Person Families | 14 (2.1%) | $71,250 |
| 7+ Person Families | 19 (2.9%) | $0 |
| Total | 667 (100.0%) | $96,875 |
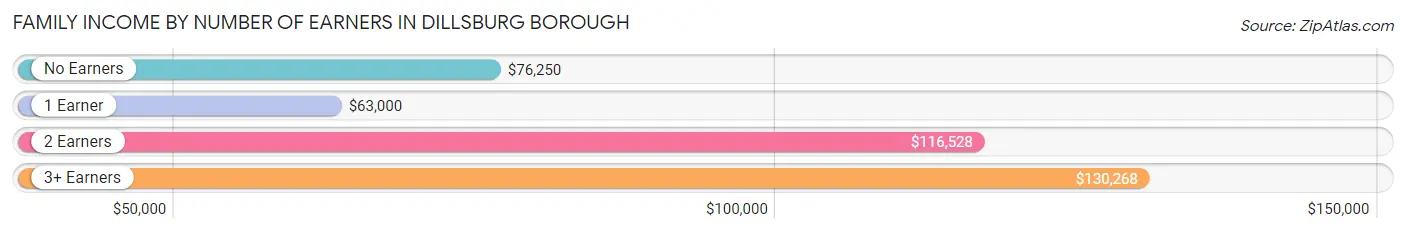
Family Income by Number of Earners in Dillsburg borough
The median family income in Dillsburg borough is $96,875, with families comprising 3+ earners (83) having the highest median family income of $130,268, while families with 1 earner (220) have the lowest median family income of $63,000, accounting for 12.4% and 33.0% of families, respectively.
| Number of Earners | # Families | Median Income |
| No Earners | 33 (5.0%) | $76,250 |
| 1 Earner | 220 (33.0%) | $63,000 |
| 2 Earners | 331 (49.6%) | $116,528 |
| 3+ Earners | 83 (12.4%) | $130,268 |
| Total | 667 (100.0%) | $96,875 |
Household Income in Dillsburg borough
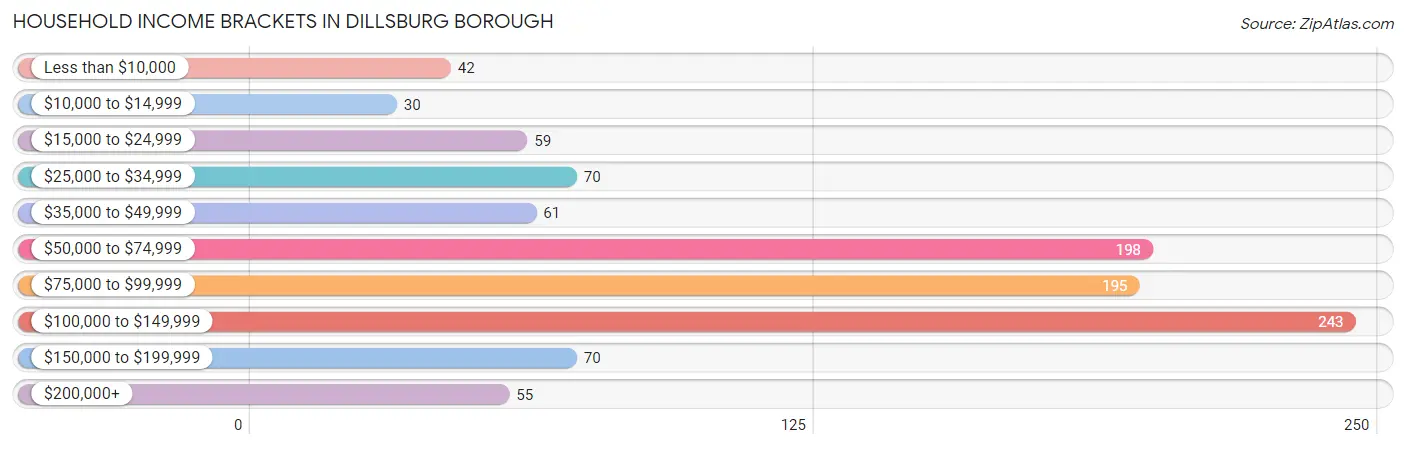
Household Income Brackets in Dillsburg borough
With 243 households falling in the category, the $100,000 to $149,999 income range is the most frequent in Dillsburg borough, accounting for 23.7% of all households. In contrast, only 30 households (2.9%) fall into the $10,000 to $14,999 income bracket, making it the least populous group.
| Income Bracket | # Households | % Households |
| Less than $10,000 | 42 | 4.1% |
| $10,000 to $14,999 | 30 | 2.9% |
| $15,000 to $24,999 | 59 | 5.8% |
| $25,000 to $34,999 | 70 | 6.8% |
| $35,000 to $49,999 | 61 | 6.0% |
| $50,000 to $74,999 | 198 | 19.4% |
| $75,000 to $99,999 | 195 | 19.1% |
| $100,000 to $149,999 | 243 | 23.8% |
| $150,000 to $199,999 | 70 | 6.8% |
| $200,000+ | 55 | 5.4% |
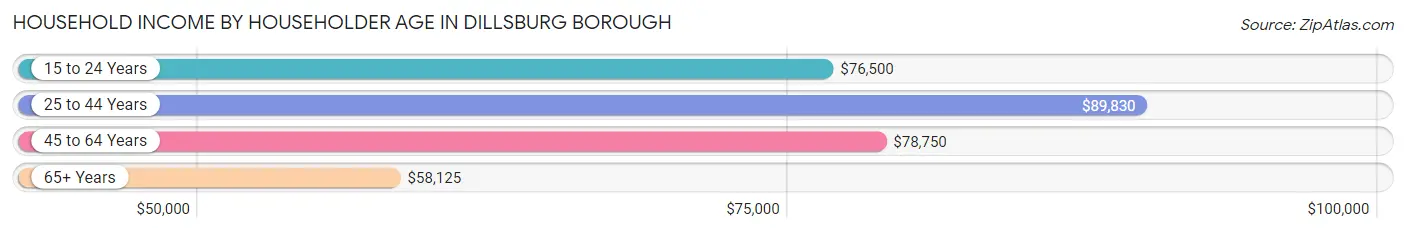
Household Income by Householder Age in Dillsburg borough
The median household income in Dillsburg borough is $78,674, with the highest median household income of $89,830 found in the 25 to 44 years age bracket for the primary householder. A total of 449 households (43.9%) fall into this category. Meanwhile, the 65+ years age bracket for the primary householder has the lowest median household income of $58,125, with 148 households (14.5%) in this group.
| Income Bracket | # Households | Median Income |
| 15 to 24 Years | 28 (2.7%) | $76,500 |
| 25 to 44 Years | 449 (43.9%) | $89,830 |
| 45 to 64 Years | 398 (38.9%) | $78,750 |
| 65+ Years | 148 (14.5%) | $58,125 |
| Total | 1,023 (100.0%) | $78,674 |
Poverty in Dillsburg borough
Income Below Poverty by Sex and Age in Dillsburg borough
With 9.7% poverty level for males and 10.4% for females among the residents of Dillsburg borough, under 5 year old males and 6 to 11 year old females are the most vulnerable to poverty, with 22 males (33.3%) and 39 females (29.8%) in their respective age groups living below the poverty level.
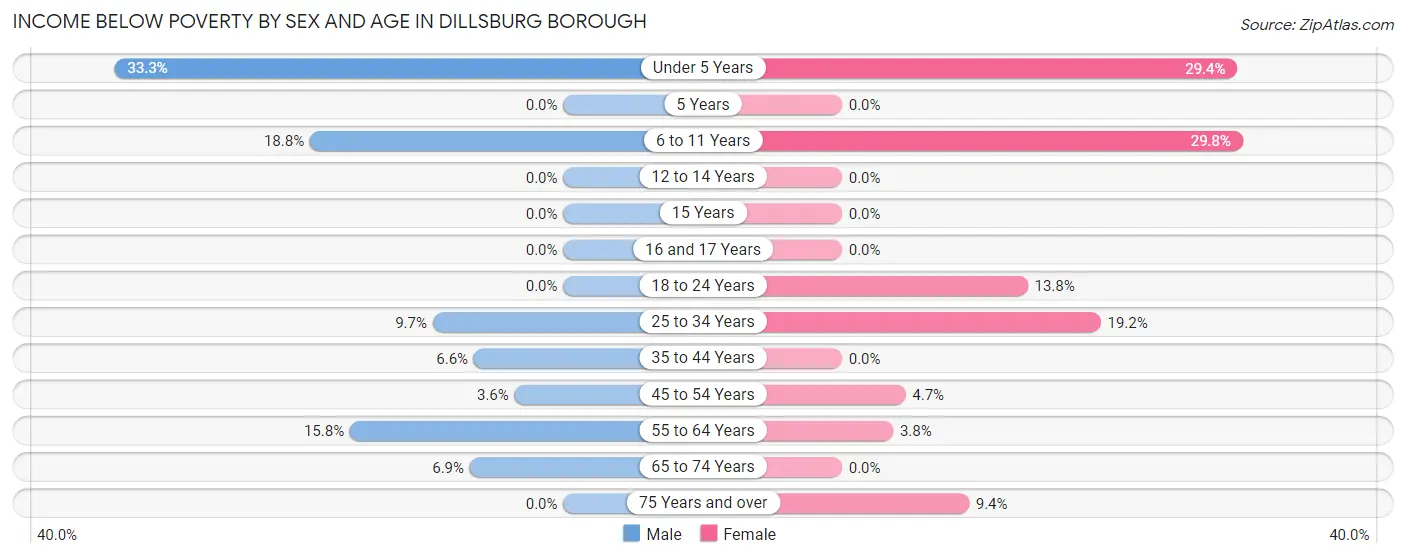
| Age Bracket | Male | Female |
| Under 5 Years | 22 (33.3%) | 32 (29.4%) |
| 5 Years | 0 (0.0%) | 0 (0.0%) |
| 6 to 11 Years | 19 (18.8%) | 39 (29.8%) |
| 12 to 14 Years | 0 (0.0%) | 0 (0.0%) |
| 15 Years | 0 (0.0%) | 0 (0.0%) |
| 16 and 17 Years | 0 (0.0%) | 0 (0.0%) |
| 18 to 24 Years | 0 (0.0%) | 12 (13.8%) |
| 25 to 34 Years | 22 (9.7%) | 44 (19.2%) |
| 35 to 44 Years | 15 (6.6%) | 0 (0.0%) |
| 45 to 54 Years | 5 (3.6%) | 6 (4.7%) |
| 55 to 64 Years | 32 (15.8%) | 6 (3.8%) |
| 65 to 74 Years | 5 (6.9%) | 0 (0.0%) |
| 75 Years and over | 0 (0.0%) | 5 (9.4%) |
| Total | 120 (9.7%) | 144 (10.4%) |
Income Above Poverty by Sex and Age in Dillsburg borough
According to the poverty statistics in Dillsburg borough, males aged 5 years and females aged 5 years are the age groups that are most secure financially, with 100.0% of males and 100.0% of females in these age groups living above the poverty line.
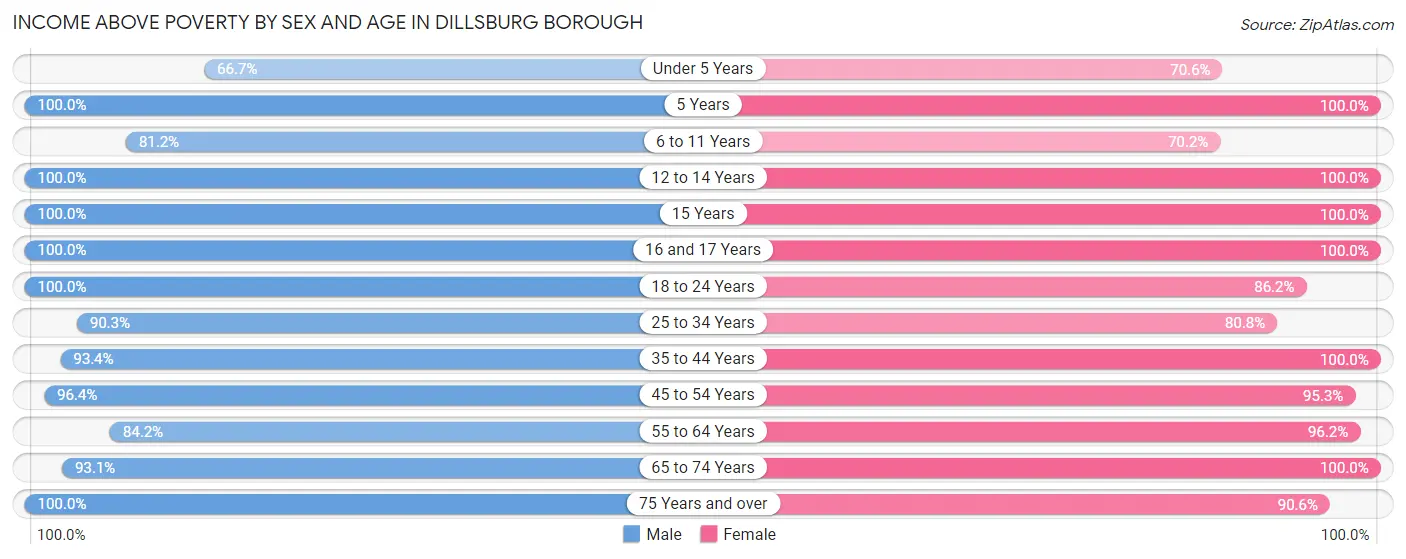
| Age Bracket | Male | Female |
| Under 5 Years | 44 (66.7%) | 77 (70.6%) |
| 5 Years | 20 (100.0%) | 13 (100.0%) |
| 6 to 11 Years | 82 (81.2%) | 92 (70.2%) |
| 12 to 14 Years | 31 (100.0%) | 95 (100.0%) |
| 15 Years | 27 (100.0%) | 45 (100.0%) |
| 16 and 17 Years | 29 (100.0%) | 54 (100.0%) |
| 18 to 24 Years | 58 (100.0%) | 75 (86.2%) |
| 25 to 34 Years | 205 (90.3%) | 185 (80.8%) |
| 35 to 44 Years | 211 (93.4%) | 206 (100.0%) |
| 45 to 54 Years | 133 (96.4%) | 121 (95.3%) |
| 55 to 64 Years | 170 (84.2%) | 152 (96.2%) |
| 65 to 74 Years | 67 (93.1%) | 79 (100.0%) |
| 75 Years and over | 46 (100.0%) | 48 (90.6%) |
| Total | 1,123 (90.3%) | 1,242 (89.6%) |
Income Below Poverty Among Married-Couple Families in Dillsburg borough
The poverty statistics for married-couple families in Dillsburg borough show that 5.0% or 22 of the total 441 families live below the poverty line. Families with 5 or more children have the highest poverty rate of 73.7%, comprising of 14 families. On the other hand, families with no children have the lowest poverty rate of 0.0%, which includes 0 families.
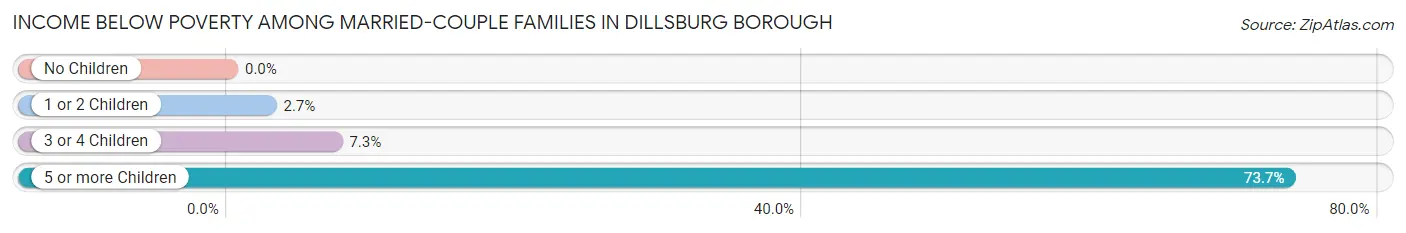
| Children | Above Poverty | Below Poverty |
| No Children | 218 (100.0%) | 0 (0.0%) |
| 1 or 2 Children | 145 (97.3%) | 4 (2.7%) |
| 3 or 4 Children | 51 (92.7%) | 4 (7.3%) |
| 5 or more Children | 5 (26.3%) | 14 (73.7%) |
| Total | 419 (95.0%) | 22 (5.0%) |
Income Below Poverty Among Single-Parent Households in Dillsburg borough
According to the poverty data in Dillsburg borough, 17.1% or 14 single-father households and 4.2% or 6 single-mother households are living below the poverty line. Among single-father households, those with 1 or 2 children have the highest poverty rate, with 14 households (30.4%) experiencing poverty. Likewise, among single-mother households, those with 1 or 2 children have the highest poverty rate, with 6 households (5.3%) falling below the poverty line.
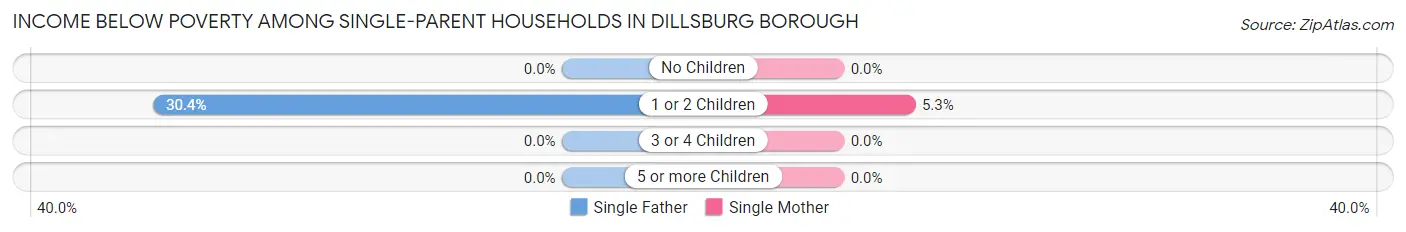
| Children | Single Father | Single Mother |
| No Children | 0 (0.0%) | 0 (0.0%) |
| 1 or 2 Children | 14 (30.4%) | 6 (5.3%) |
| 3 or 4 Children | 0 (0.0%) | 0 (0.0%) |
| 5 or more Children | 0 (0.0%) | 0 (0.0%) |
| Total | 14 (17.1%) | 6 (4.2%) |
Income Below Poverty Among Married-Couple vs Single-Parent Households in Dillsburg borough
The poverty data for Dillsburg borough shows that 22 of the married-couple family households (5.0%) and 20 of the single-parent households (8.8%) are living below the poverty level. Within the married-couple family households, those with 5 or more children have the highest poverty rate, with 14 households (73.7%) falling below the poverty line. Among the single-parent households, those with 1 or 2 children have the highest poverty rate, with 20 household (12.6%) living below poverty.
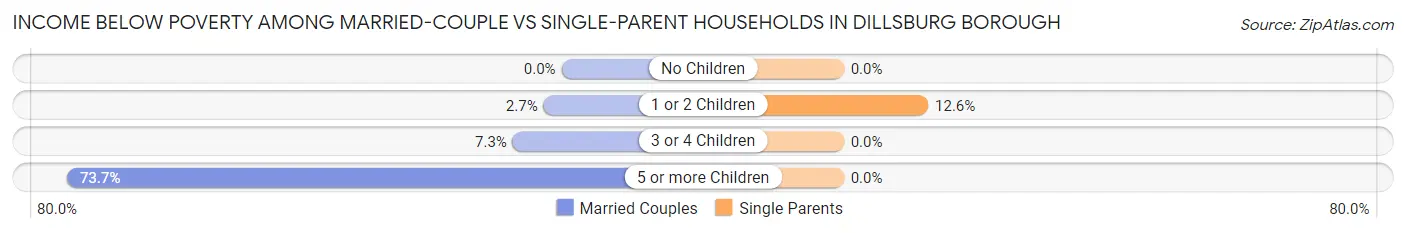
| Children | Married-Couple Families | Single-Parent Households |
| No Children | 0 (0.0%) | 0 (0.0%) |
| 1 or 2 Children | 4 (2.7%) | 20 (12.6%) |
| 3 or 4 Children | 4 (7.3%) | 0 (0.0%) |
| 5 or more Children | 14 (73.7%) | 0 (0.0%) |
| Total | 22 (5.0%) | 20 (8.8%) |
Race in Dillsburg borough
The most populous races in Dillsburg borough are White / Caucasian (2,344 | 89.2%), Hispanic or Latino (187 | 7.1%), and Two or more Races (164 | 6.2%).
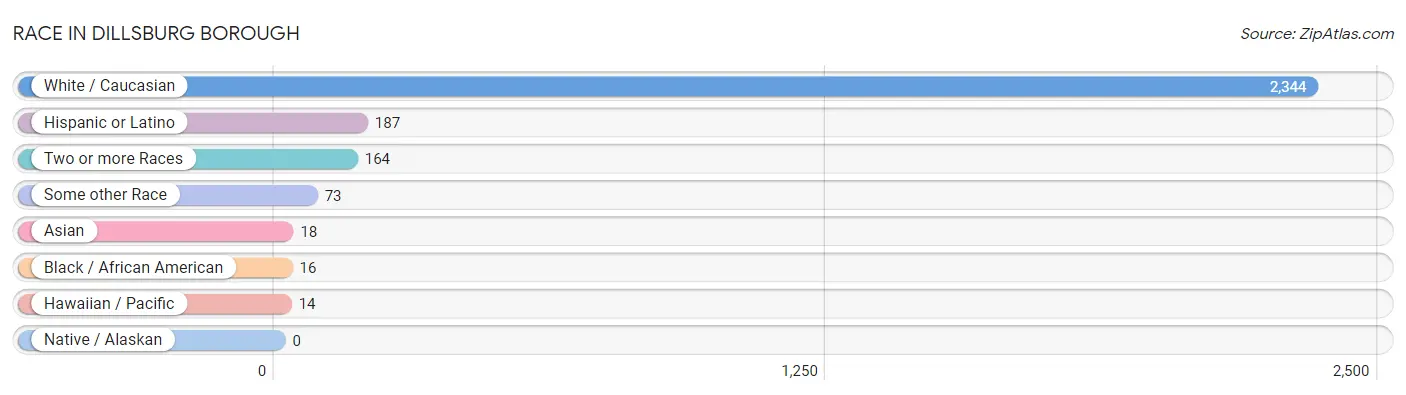
| Race | # Population | % Population |
| Asian | 18 | 0.7% |
| Black / African American | 16 | 0.6% |
| Hawaiian / Pacific | 14 | 0.5% |
| Hispanic or Latino | 187 | 7.1% |
| Native / Alaskan | 0 | 0.0% |
| White / Caucasian | 2,344 | 89.2% |
| Two or more Races | 164 | 6.2% |
| Some other Race | 73 | 2.8% |
| Total | 2,629 | 100.0% |
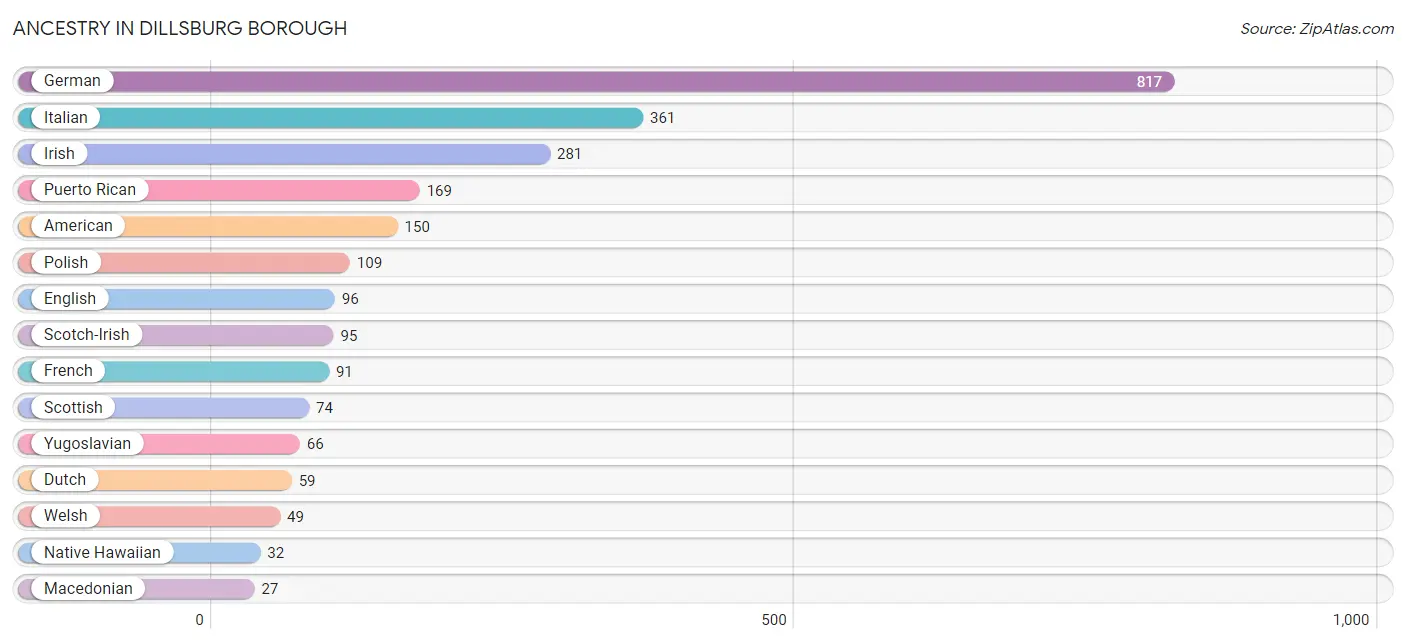
Ancestry in Dillsburg borough
The most populous ancestries reported in Dillsburg borough are German (817 | 31.1%), Italian (361 | 13.7%), Irish (281 | 10.7%), Puerto Rican (169 | 6.4%), and American (150 | 5.7%), together accounting for 67.6% of all Dillsburg borough residents.
| Ancestry | # Population | % Population |
| American | 150 | 5.7% |
| Arab | 11 | 0.4% |
| Bhutanese | 21 | 0.8% |
| British | 5 | 0.2% |
| Burmese | 5 | 0.2% |
| Central American | 14 | 0.5% |
| Croatian | 20 | 0.8% |
| Danish | 5 | 0.2% |
| Delaware | 4 | 0.2% |
| Dutch | 59 | 2.2% |
| English | 96 | 3.6% |
| European | 12 | 0.5% |
| Finnish | 10 | 0.4% |
| French | 91 | 3.5% |
| French Canadian | 20 | 0.8% |
| German | 817 | 31.1% |
| Hungarian | 11 | 0.4% |
| Indian (Asian) | 10 | 0.4% |
| Irish | 281 | 10.7% |
| Italian | 361 | 13.7% |
| Lebanese | 11 | 0.4% |
| Macedonian | 27 | 1.0% |
| Mexican | 4 | 0.2% |
| Native Hawaiian | 32 | 1.2% |
| Norwegian | 10 | 0.4% |
| Pakistani | 3 | 0.1% |
| Panamanian | 14 | 0.5% |
| Polish | 109 | 4.2% |
| Puerto Rican | 169 | 6.4% |
| Romanian | 5 | 0.2% |
| Russian | 15 | 0.6% |
| Scotch-Irish | 95 | 3.6% |
| Scottish | 74 | 2.8% |
| Slavic | 4 | 0.2% |
| Slovak | 14 | 0.5% |
| Swedish | 11 | 0.4% |
| Swiss | 25 | 0.9% |
| Ukrainian | 16 | 0.6% |
| Welsh | 49 | 1.9% |
| Yugoslavian | 66 | 2.5% | View All 40 Rows |
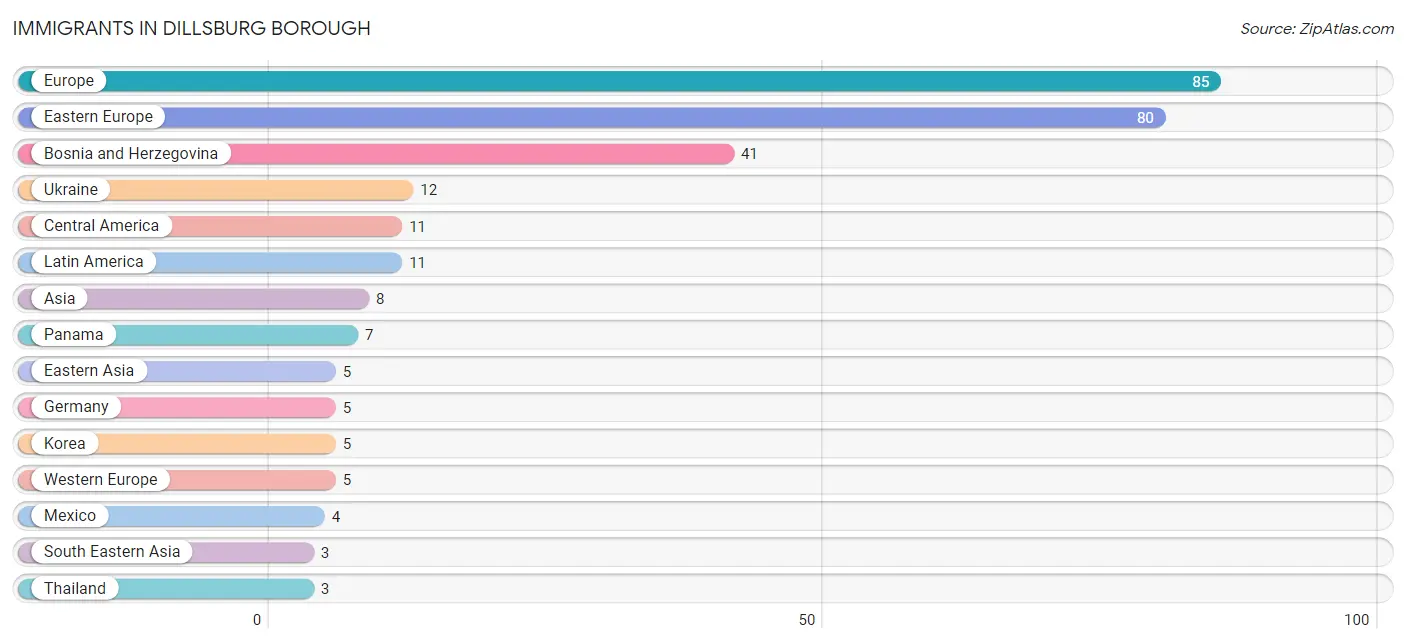
Immigrants in Dillsburg borough
The most numerous immigrant groups reported in Dillsburg borough came from Europe (85 | 3.2%), Eastern Europe (80 | 3.0%), Bosnia and Herzegovina (41 | 1.6%), Ukraine (12 | 0.5%), and Central America (11 | 0.4%), together accounting for 8.7% of all Dillsburg borough residents.
| Immigration Origin | # Population | % Population |
| Asia | 8 | 0.3% |
| Bosnia and Herzegovina | 41 | 1.6% |
| Central America | 11 | 0.4% |
| Eastern Asia | 5 | 0.2% |
| Eastern Europe | 80 | 3.0% |
| Europe | 85 | 3.2% |
| Germany | 5 | 0.2% |
| Korea | 5 | 0.2% |
| Latin America | 11 | 0.4% |
| Mexico | 4 | 0.2% |
| Panama | 7 | 0.3% |
| South Eastern Asia | 3 | 0.1% |
| Thailand | 3 | 0.1% |
| Ukraine | 12 | 0.5% |
| Western Europe | 5 | 0.2% | View All 15 Rows |
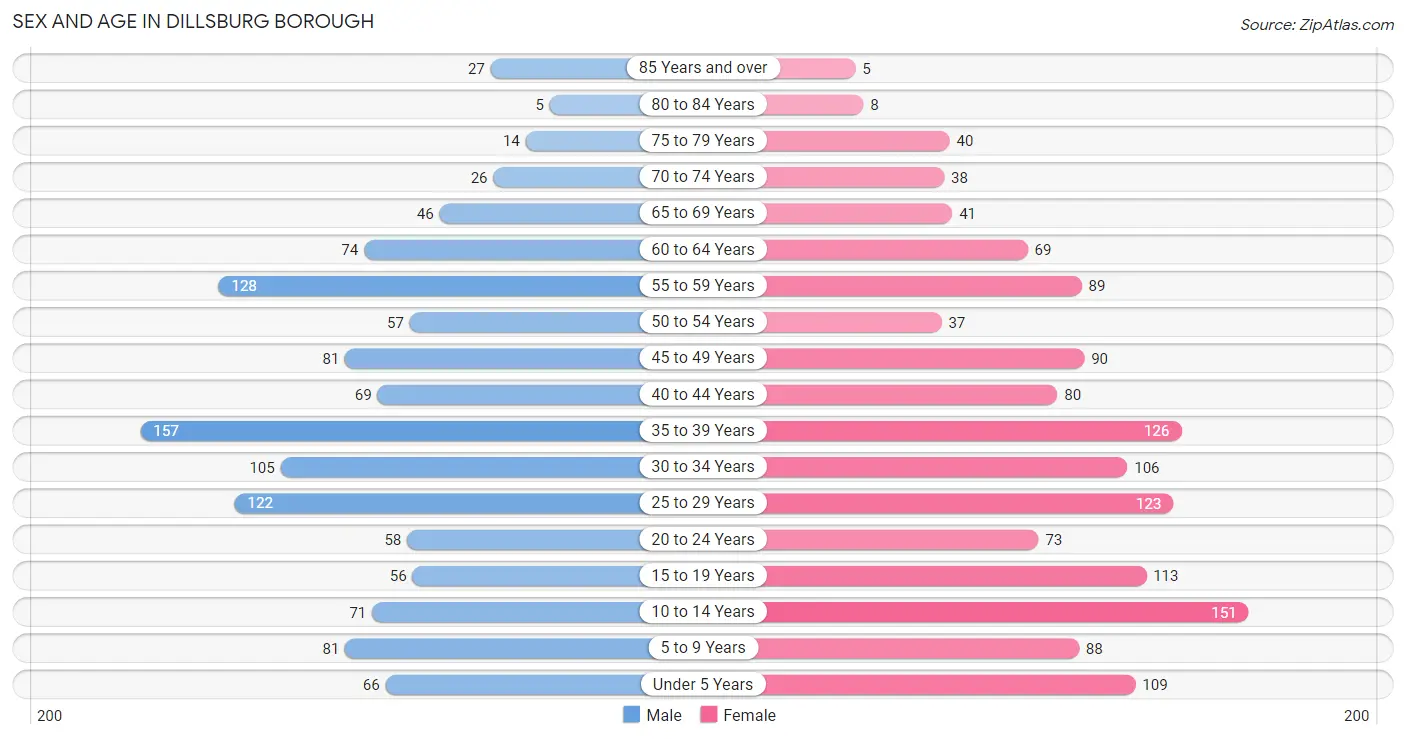
Sex and Age in Dillsburg borough
Sex and Age in Dillsburg borough
The most populous age groups in Dillsburg borough are 35 to 39 Years (157 | 12.6%) for men and 10 to 14 Years (151 | 10.9%) for women.
| Age Bracket | Male | Female |
| Under 5 Years | 66 (5.3%) | 109 (7.9%) |
| 5 to 9 Years | 81 (6.5%) | 88 (6.4%) |
| 10 to 14 Years | 71 (5.7%) | 151 (10.9%) |
| 15 to 19 Years | 56 (4.5%) | 113 (8.2%) |
| 20 to 24 Years | 58 (4.7%) | 73 (5.3%) |
| 25 to 29 Years | 122 (9.8%) | 123 (8.9%) |
| 30 to 34 Years | 105 (8.5%) | 106 (7.6%) |
| 35 to 39 Years | 157 (12.6%) | 126 (9.1%) |
| 40 to 44 Years | 69 (5.6%) | 80 (5.8%) |
| 45 to 49 Years | 81 (6.5%) | 90 (6.5%) |
| 50 to 54 Years | 57 (4.6%) | 37 (2.7%) |
| 55 to 59 Years | 128 (10.3%) | 89 (6.4%) |
| 60 to 64 Years | 74 (5.9%) | 69 (5.0%) |
| 65 to 69 Years | 46 (3.7%) | 41 (3.0%) |
| 70 to 74 Years | 26 (2.1%) | 38 (2.7%) |
| 75 to 79 Years | 14 (1.1%) | 40 (2.9%) |
| 80 to 84 Years | 5 (0.4%) | 8 (0.6%) |
| 85 Years and over | 27 (2.2%) | 5 (0.4%) |
| Total | 1,243 (100.0%) | 1,386 (100.0%) |
Families and Households in Dillsburg borough
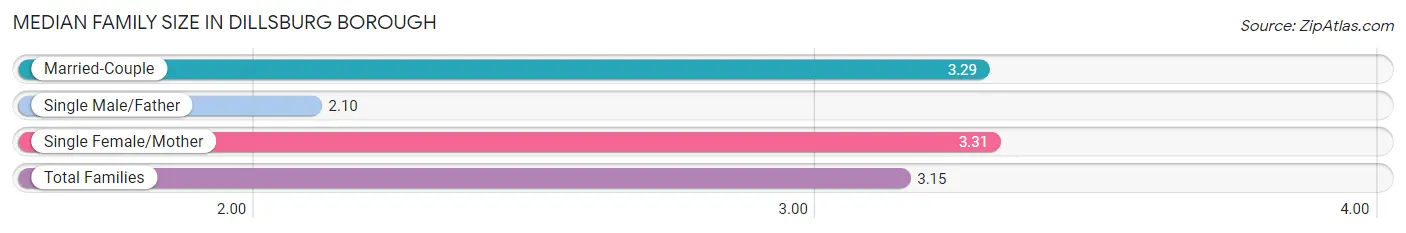
Median Family Size in Dillsburg borough
The median family size in Dillsburg borough is 3.15 persons per family, with single female/mother families (144 | 21.6%) accounting for the largest median family size of 3.31 persons per family. On the other hand, single male/father families (82 | 12.3%) represent the smallest median family size with 2.10 persons per family.
| Family Type | # Families | Family Size |
| Married-Couple | 441 (66.1%) | 3.29 |
| Single Male/Father | 82 (12.3%) | 2.10 |
| Single Female/Mother | 144 (21.6%) | 3.31 |
| Total Families | 667 (100.0%) | 3.15 |
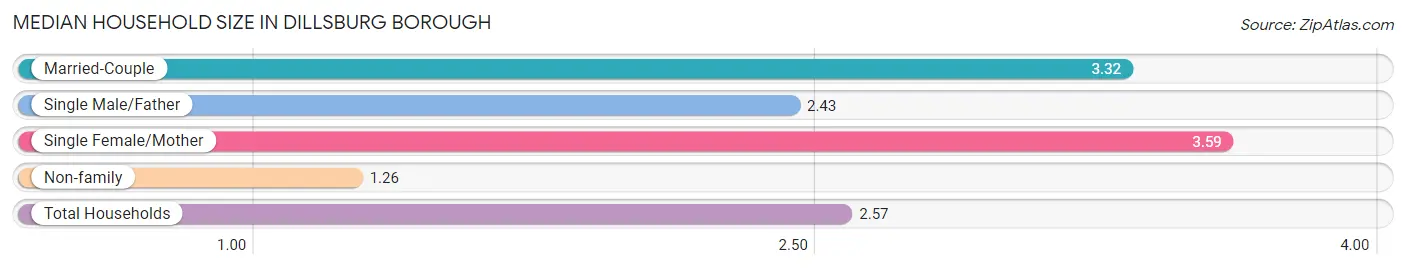
Median Household Size in Dillsburg borough
The median household size in Dillsburg borough is 2.57 persons per household, with single female/mother households (144 | 14.1%) accounting for the largest median household size of 3.59 persons per household. non-family households (356 | 34.8%) represent the smallest median household size with 1.26 persons per household.
| Household Type | # Households | Household Size |
| Married-Couple | 441 (43.1%) | 3.32 |
| Single Male/Father | 82 (8.0%) | 2.43 |
| Single Female/Mother | 144 (14.1%) | 3.59 |
| Non-family | 356 (34.8%) | 1.26 |
| Total Households | 1,023 (100.0%) | 2.57 |
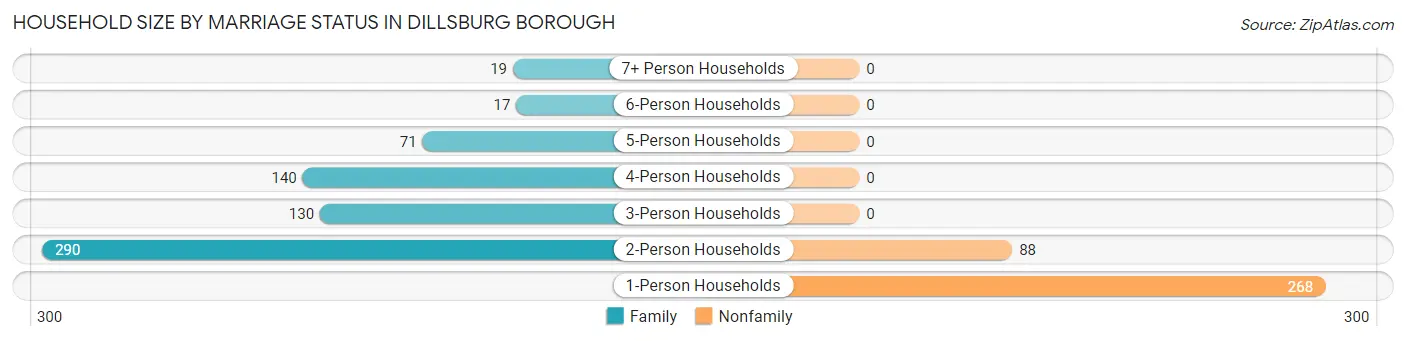
Household Size by Marriage Status in Dillsburg borough
Out of a total of 1,023 households in Dillsburg borough, 667 (65.2%) are family households, while 356 (34.8%) are nonfamily households. The most numerous type of family households are 2-person households, comprising 290, and the most common type of nonfamily households are 1-person households, comprising 268.
| Household Size | Family Households | Nonfamily Households |
| 1-Person Households | - | 268 (26.2%) |
| 2-Person Households | 290 (28.3%) | 88 (8.6%) |
| 3-Person Households | 130 (12.7%) | 0 (0.0%) |
| 4-Person Households | 140 (13.7%) | 0 (0.0%) |
| 5-Person Households | 71 (6.9%) | 0 (0.0%) |
| 6-Person Households | 17 (1.7%) | 0 (0.0%) |
| 7+ Person Households | 19 (1.9%) | 0 (0.0%) |
| Total | 667 (65.2%) | 356 (34.8%) |
Female Fertility in Dillsburg borough
Fertility by Age in Dillsburg borough
Average fertility rate in Dillsburg borough is 56.0 births per 1,000 women. Women in the age bracket of 20 to 34 years have the highest fertility rate with 116.0 births per 1,000 women. Women in the age bracket of 20 to 34 years acount for 87.5% of all women with births.
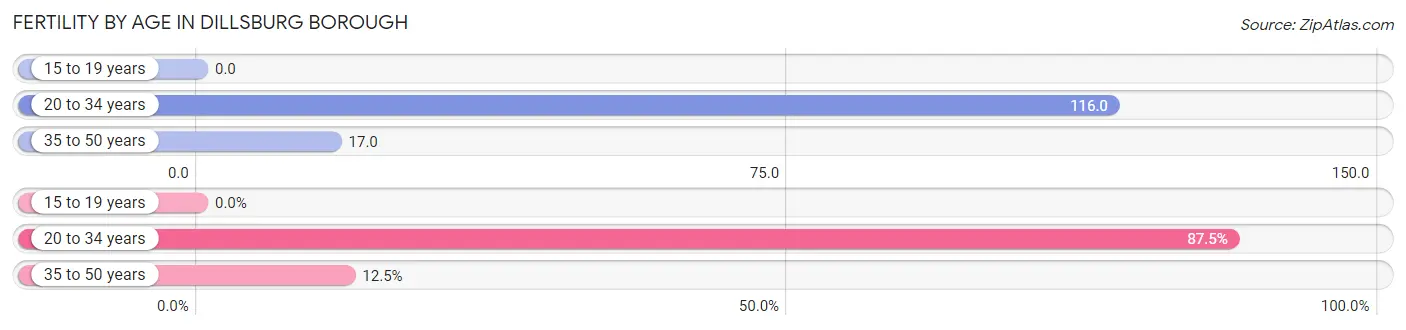
| Age Bracket | Women with Births | Births / 1,000 Women |
| 15 to 19 years | 0 (0.0%) | 0.0 |
| 20 to 34 years | 35 (87.5%) | 116.0 |
| 35 to 50 years | 5 (12.5%) | 17.0 |
| Total | 40 (100.0%) | 56.0 |
Fertility by Age by Marriage Status in Dillsburg borough
57.5% of women with births (40) in Dillsburg borough are married. The highest percentage of unmarried women with births falls into 35 to 50 years age bracket with 100.0% of them unmarried at the time of birth, while the lowest percentage of unmarried women with births belong to 20 to 34 years age bracket with 34.3% of them unmarried.
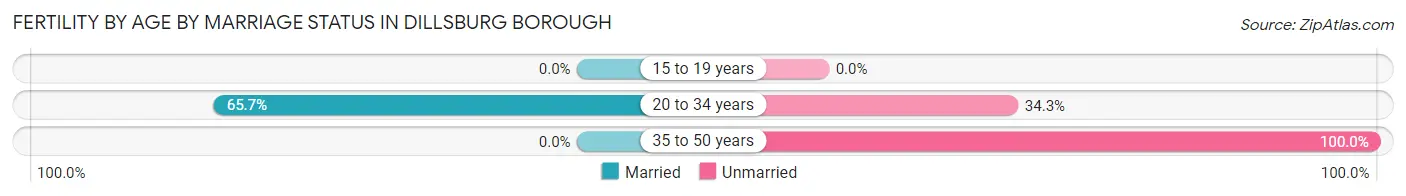
| Age Bracket | Married | Unmarried |
| 15 to 19 years | 0 (0.0%) | 0 (0.0%) |
| 20 to 34 years | 23 (65.7%) | 12 (34.3%) |
| 35 to 50 years | 0 (0.0%) | 5 (100.0%) |
| Total | 23 (57.5%) | 17 (42.5%) |
Fertility by Education in Dillsburg borough
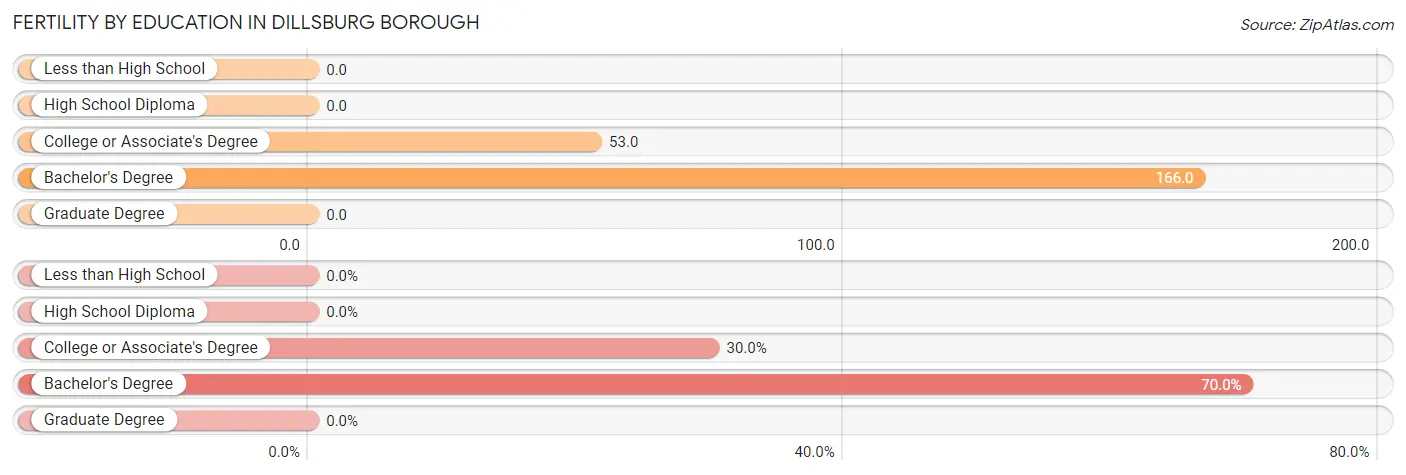
| Educational Attainment | Women with Births | Births / 1,000 Women |
| Less than High School | 0 (0.0%) | 0.0 |
| High School Diploma | 0 (0.0%) | 0.0 |
| College or Associate's Degree | 12 (30.0%) | 53.0 |
| Bachelor's Degree | 28 (70.0%) | 166.0 |
| Graduate Degree | 0 (0.0%) | 0.0 |
| Total | 40 (100.0%) | 56.0 |
Fertility by Education by Marriage Status in Dillsburg borough
42.5% of women with births in Dillsburg borough are unmarried. Women with the educational attainment of college or associate's degree are most likely to be married with 100.0% of them married at childbirth, while women with the educational attainment of bachelor's degree are least likely to be married with 60.7% of them unmarried at childbirth.
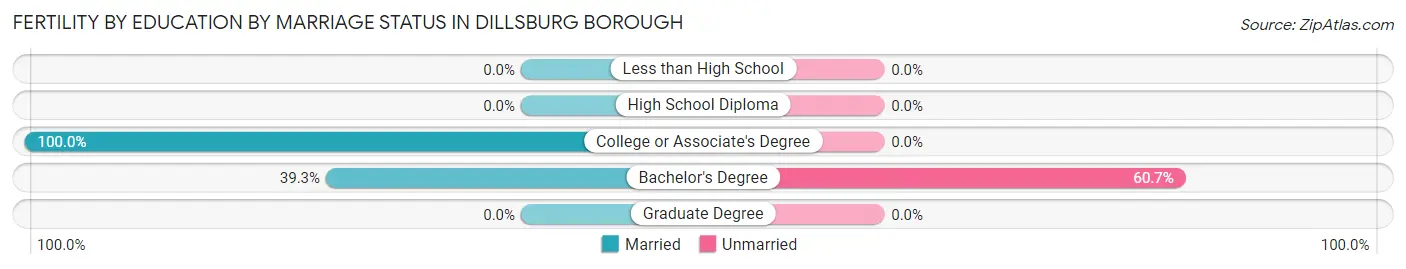
| Educational Attainment | Married | Unmarried |
| Less than High School | 0 (0.0%) | 0 (0.0%) |
| High School Diploma | 0 (0.0%) | 0 (0.0%) |
| College or Associate's Degree | 12 (100.0%) | 0 (0.0%) |
| Bachelor's Degree | 11 (39.3%) | 17 (60.7%) |
| Graduate Degree | 0 (0.0%) | 0 (0.0%) |
| Total | 23 (57.5%) | 17 (42.5%) |
Employment Characteristics in Dillsburg borough
Employment by Class of Employer in Dillsburg borough
Among the 1,471 employed individuals in Dillsburg borough, private company employees (1,014 | 68.9%), not-for-profit organizations (177 | 12.0%), and self-employed (not incorporated) (81 | 5.5%) make up the most common classes of employment.
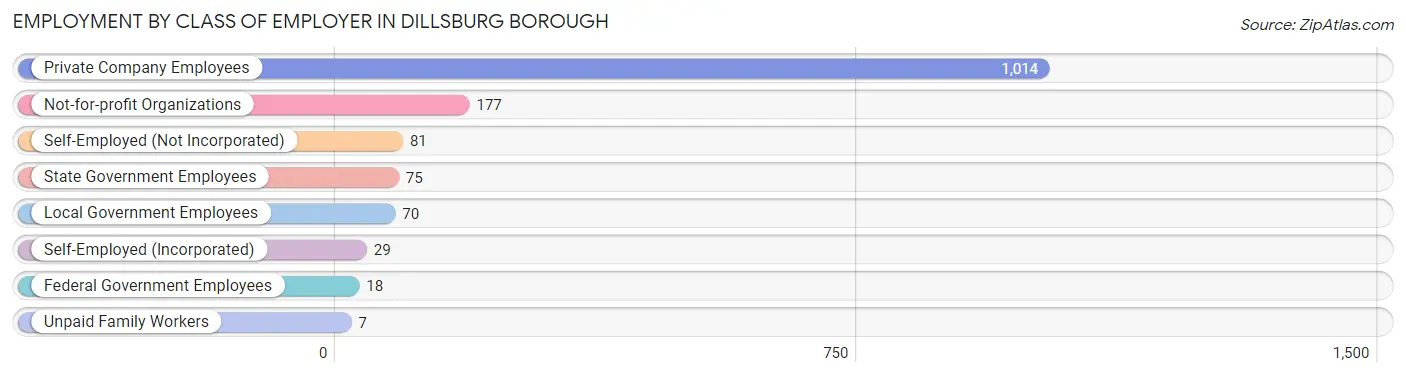
| Employer Class | # Employees | % Employees |
| Private Company Employees | 1,014 | 68.9% |
| Self-Employed (Incorporated) | 29 | 2.0% |
| Self-Employed (Not Incorporated) | 81 | 5.5% |
| Not-for-profit Organizations | 177 | 12.0% |
| Local Government Employees | 70 | 4.8% |
| State Government Employees | 75 | 5.1% |
| Federal Government Employees | 18 | 1.2% |
| Unpaid Family Workers | 7 | 0.5% |
| Total | 1,471 | 100.0% |
Employment Status by Age in Dillsburg borough
According to the labor force statistics for Dillsburg borough, out of the total population over 16 years of age (1,991), 78.3% or 1,559 individuals are in the labor force, with 4.4% or 69 of them unemployed. The age group with the highest labor force participation rate is 30 to 34 years, with 98.1% or 207 individuals in the labor force. Within the labor force, the 16 to 19 years age range has the highest percentage of unemployed individuals, with 24.3% or 17 of them being unemployed.
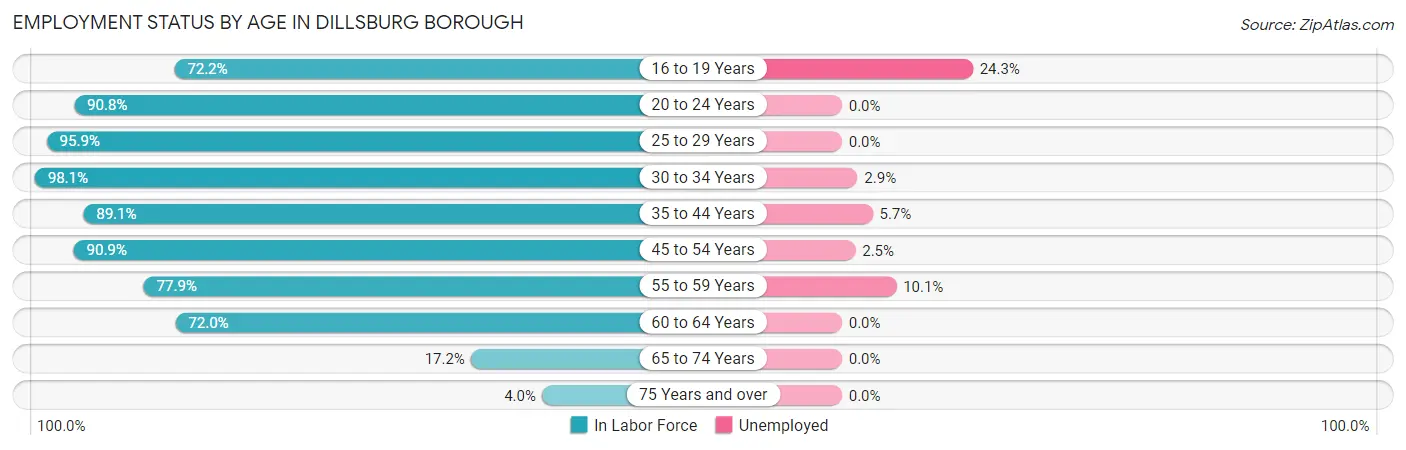
| Age Bracket | In Labor Force | Unemployed |
| 16 to 19 Years | 70 (72.2%) | 17 (24.3%) |
| 20 to 24 Years | 119 (90.8%) | 0 (0.0%) |
| 25 to 29 Years | 235 (95.9%) | 0 (0.0%) |
| 30 to 34 Years | 207 (98.1%) | 6 (2.9%) |
| 35 to 44 Years | 385 (89.1%) | 22 (5.7%) |
| 45 to 54 Years | 241 (90.9%) | 6 (2.5%) |
| 55 to 59 Years | 169 (77.9%) | 17 (10.1%) |
| 60 to 64 Years | 103 (72.0%) | 0 (0.0%) |
| 65 to 74 Years | 26 (17.2%) | 0 (0.0%) |
| 75 Years and over | 4 (4.0%) | 0 (0.0%) |
| Total | 1,559 (78.3%) | 69 (4.4%) |
Employment Status by Educational Attainment in Dillsburg borough
According to labor force statistics for Dillsburg borough, 88.6% of individuals (1,341) out of the total population between 25 and 64 years of age (1,513) are in the labor force, with 3.8% or 51 of them being unemployed. The group with the highest labor force participation rate are those with the educational attainment of bachelor's degree or higher, with 93.7% or 431 individuals in the labor force. Within the labor force, individuals with college / associate degree education have the highest percentage of unemployment, with 10.4% or 45 of them being unemployed.
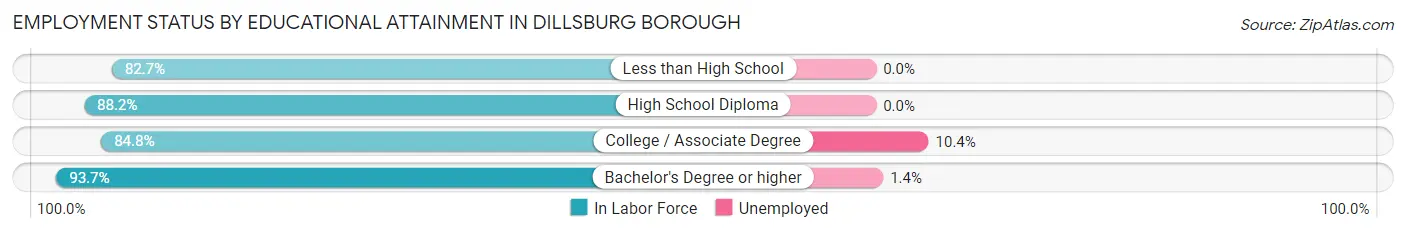
| Educational Attainment | In Labor Force | Unemployed |
| Less than High School | 43 (82.7%) | 0 (0.0%) |
| High School Diploma | 435 (88.2%) | 0 (0.0%) |
| College / Associate Degree | 431 (84.8%) | 53 (10.4%) |
| Bachelor's Degree or higher | 431 (93.7%) | 6 (1.4%) |
| Total | 1,341 (88.6%) | 57 (3.8%) |
Employment Occupations by Sex in Dillsburg borough
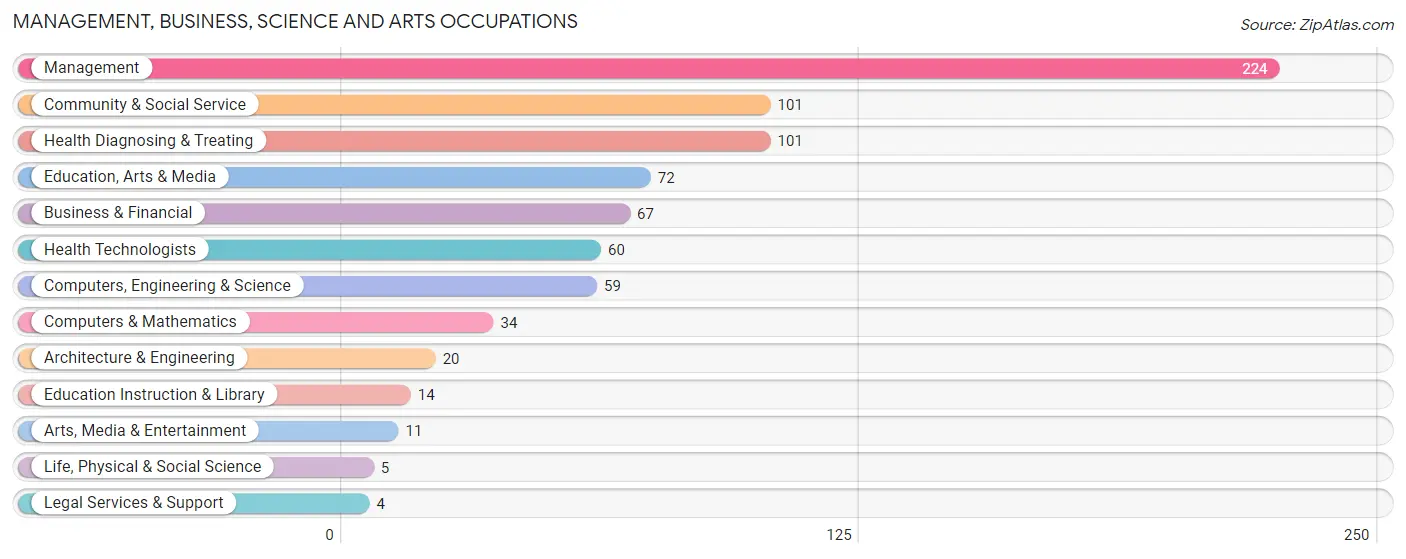
Management, Business, Science and Arts Occupations
The most common Management, Business, Science and Arts occupations in Dillsburg borough are Management (224 | 15.0%), Community & Social Service (101 | 6.8%), Health Diagnosing & Treating (101 | 6.8%), Education, Arts & Media (72 | 4.8%), and Business & Financial (67 | 4.5%).
Management, Business, Science and Arts Occupations by Sex
Within the Management, Business, Science and Arts occupations in Dillsburg borough, the most male-oriented occupations are Life, Physical & Social Science (100.0%), Legal Services & Support (100.0%), and Arts, Media & Entertainment (100.0%), while the most female-oriented occupations are Education Instruction & Library (100.0%), Health Diagnosing & Treating (100.0%), and Health Technologists (100.0%).
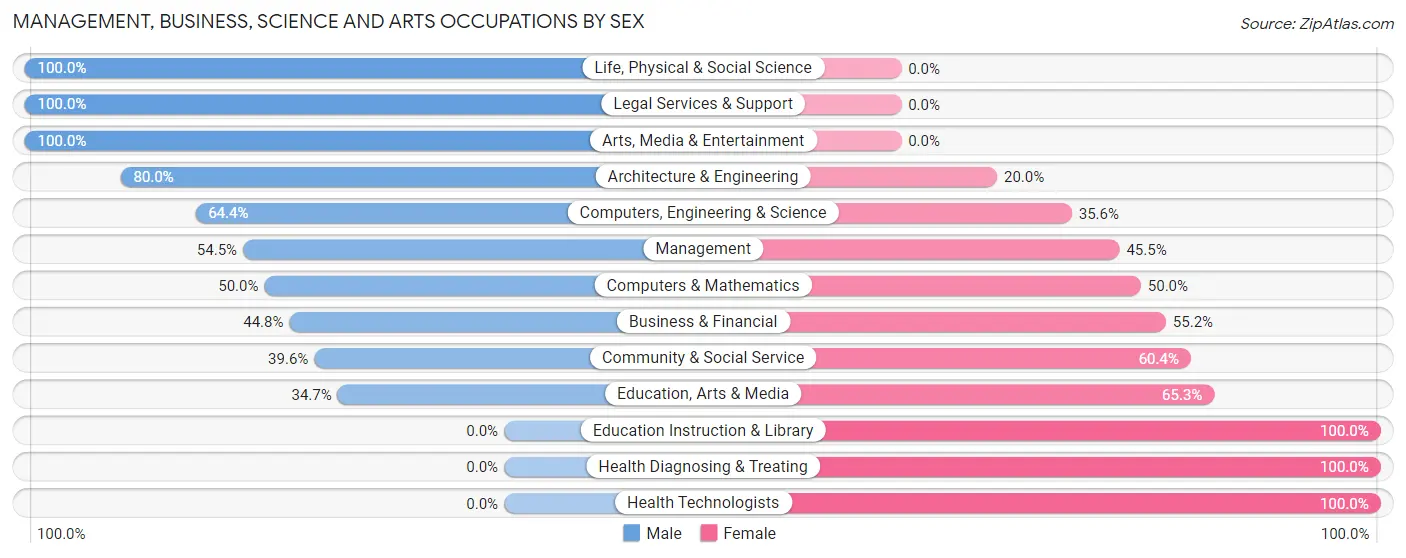
| Occupation | Male | Female |
| Management | 122 (54.5%) | 102 (45.5%) |
| Business & Financial | 30 (44.8%) | 37 (55.2%) |
| Computers, Engineering & Science | 38 (64.4%) | 21 (35.6%) |
| Computers & Mathematics | 17 (50.0%) | 17 (50.0%) |
| Architecture & Engineering | 16 (80.0%) | 4 (20.0%) |
| Life, Physical & Social Science | 5 (100.0%) | 0 (0.0%) |
| Community & Social Service | 40 (39.6%) | 61 (60.4%) |
| Education, Arts & Media | 25 (34.7%) | 47 (65.3%) |
| Legal Services & Support | 4 (100.0%) | 0 (0.0%) |
| Education Instruction & Library | 0 (0.0%) | 14 (100.0%) |
| Arts, Media & Entertainment | 11 (100.0%) | 0 (0.0%) |
| Health Diagnosing & Treating | 0 (0.0%) | 101 (100.0%) |
| Health Technologists | 0 (0.0%) | 60 (100.0%) |
| Total (Category) | 230 (41.7%) | 322 (58.3%) |
| Total (Overall) | 764 (51.2%) | 727 (48.8%) |
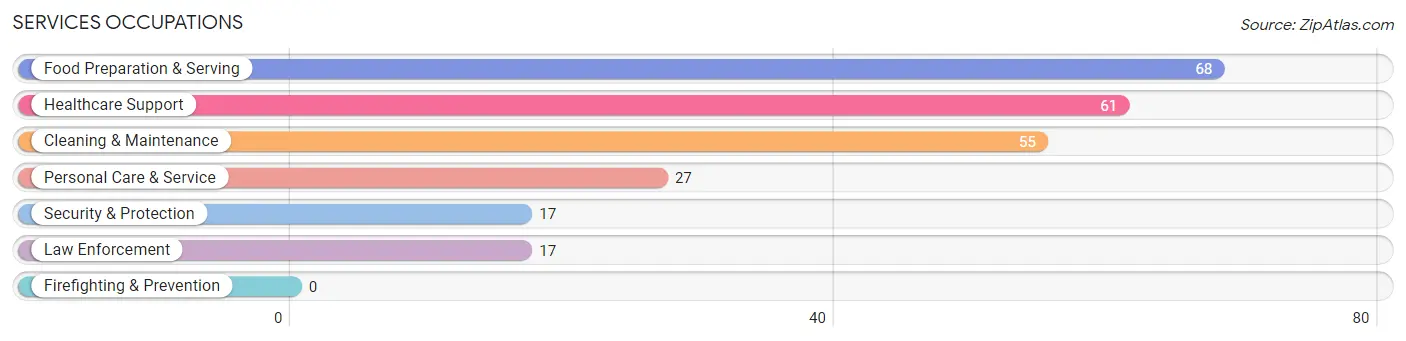
Services Occupations
The most common Services occupations in Dillsburg borough are Food Preparation & Serving (68 | 4.6%), Healthcare Support (61 | 4.1%), Cleaning & Maintenance (55 | 3.7%), Personal Care & Service (27 | 1.8%), and Security & Protection (17 | 1.1%).
Services Occupations by Sex
Within the Services occupations in Dillsburg borough, the most male-oriented occupations are Security & Protection (100.0%), Law Enforcement (100.0%), and Cleaning & Maintenance (47.3%), while the most female-oriented occupations are Food Preparation & Serving (79.4%), Personal Care & Service (77.8%), and Healthcare Support (75.4%).
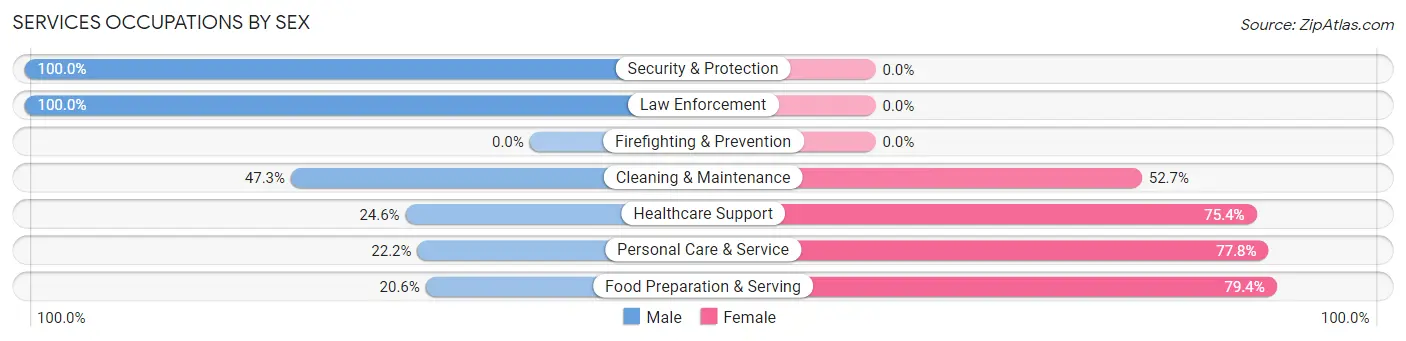
| Occupation | Male | Female |
| Healthcare Support | 15 (24.6%) | 46 (75.4%) |
| Security & Protection | 17 (100.0%) | 0 (0.0%) |
| Firefighting & Prevention | 0 (0.0%) | 0 (0.0%) |
| Law Enforcement | 17 (100.0%) | 0 (0.0%) |
| Food Preparation & Serving | 14 (20.6%) | 54 (79.4%) |
| Cleaning & Maintenance | 26 (47.3%) | 29 (52.7%) |
| Personal Care & Service | 6 (22.2%) | 21 (77.8%) |
| Total (Category) | 78 (34.2%) | 150 (65.8%) |
| Total (Overall) | 764 (51.2%) | 727 (48.8%) |
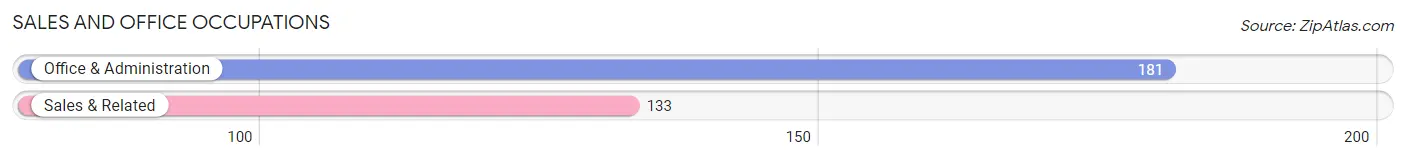
Sales and Office Occupations
The most common Sales and Office occupations in Dillsburg borough are Office & Administration (181 | 12.1%), and Sales & Related (133 | 8.9%).
Sales and Office Occupations by Sex
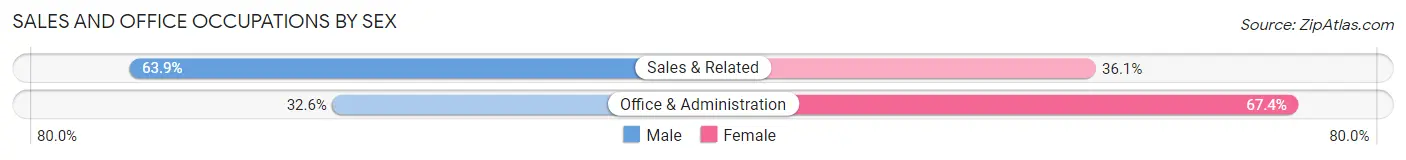
| Occupation | Male | Female |
| Sales & Related | 85 (63.9%) | 48 (36.1%) |
| Office & Administration | 59 (32.6%) | 122 (67.4%) |
| Total (Category) | 144 (45.9%) | 170 (54.1%) |
| Total (Overall) | 764 (51.2%) | 727 (48.8%) |
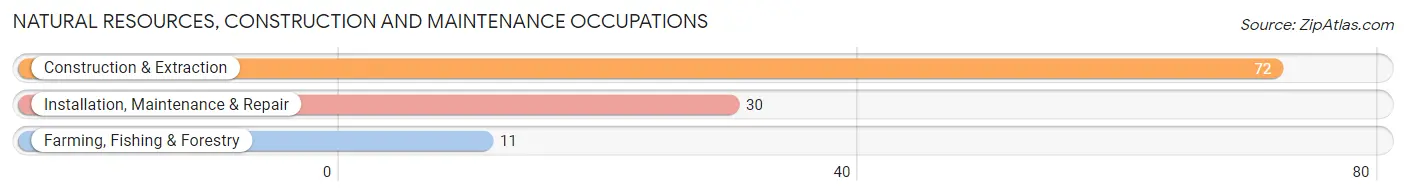
Natural Resources, Construction and Maintenance Occupations
The most common Natural Resources, Construction and Maintenance occupations in Dillsburg borough are Construction & Extraction (72 | 4.8%), Installation, Maintenance & Repair (30 | 2.0%), and Farming, Fishing & Forestry (11 | 0.7%).
Natural Resources, Construction and Maintenance Occupations by Sex
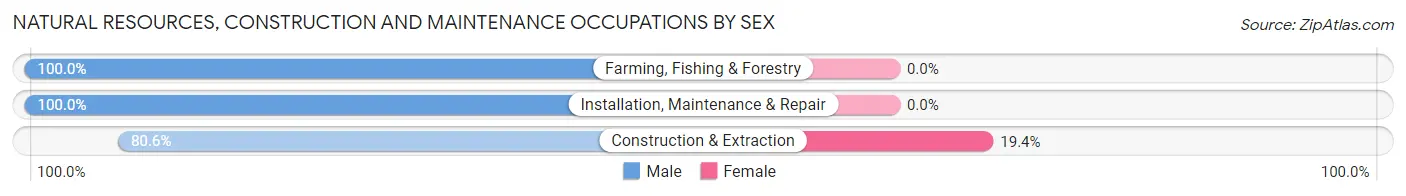
| Occupation | Male | Female |
| Farming, Fishing & Forestry | 11 (100.0%) | 0 (0.0%) |
| Construction & Extraction | 58 (80.6%) | 14 (19.4%) |
| Installation, Maintenance & Repair | 30 (100.0%) | 0 (0.0%) |
| Total (Category) | 99 (87.6%) | 14 (12.4%) |
| Total (Overall) | 764 (51.2%) | 727 (48.8%) |
Production, Transportation and Moving Occupations
The most common Production, Transportation and Moving occupations in Dillsburg borough are Transportation (101 | 6.8%), Production (97 | 6.5%), and Material Moving (86 | 5.8%).
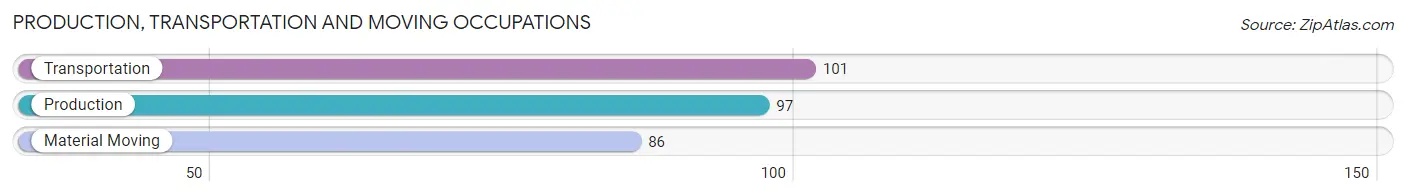
Production, Transportation and Moving Occupations by Sex
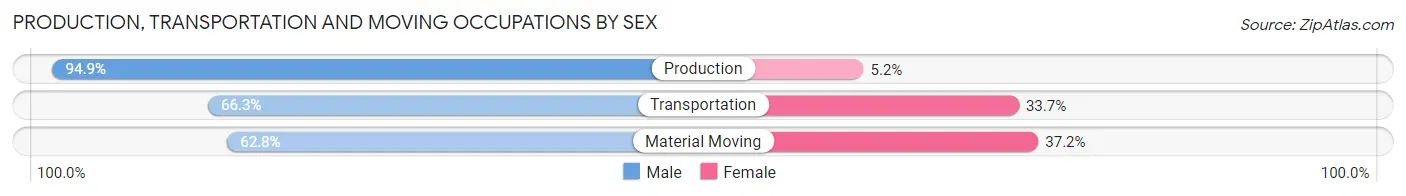
| Occupation | Male | Female |
| Production | 92 (94.9%) | 5 (5.1%) |
| Transportation | 67 (66.3%) | 34 (33.7%) |
| Material Moving | 54 (62.8%) | 32 (37.2%) |
| Total (Category) | 213 (75.0%) | 71 (25.0%) |
| Total (Overall) | 764 (51.2%) | 727 (48.8%) |
Employment Industries by Sex in Dillsburg borough
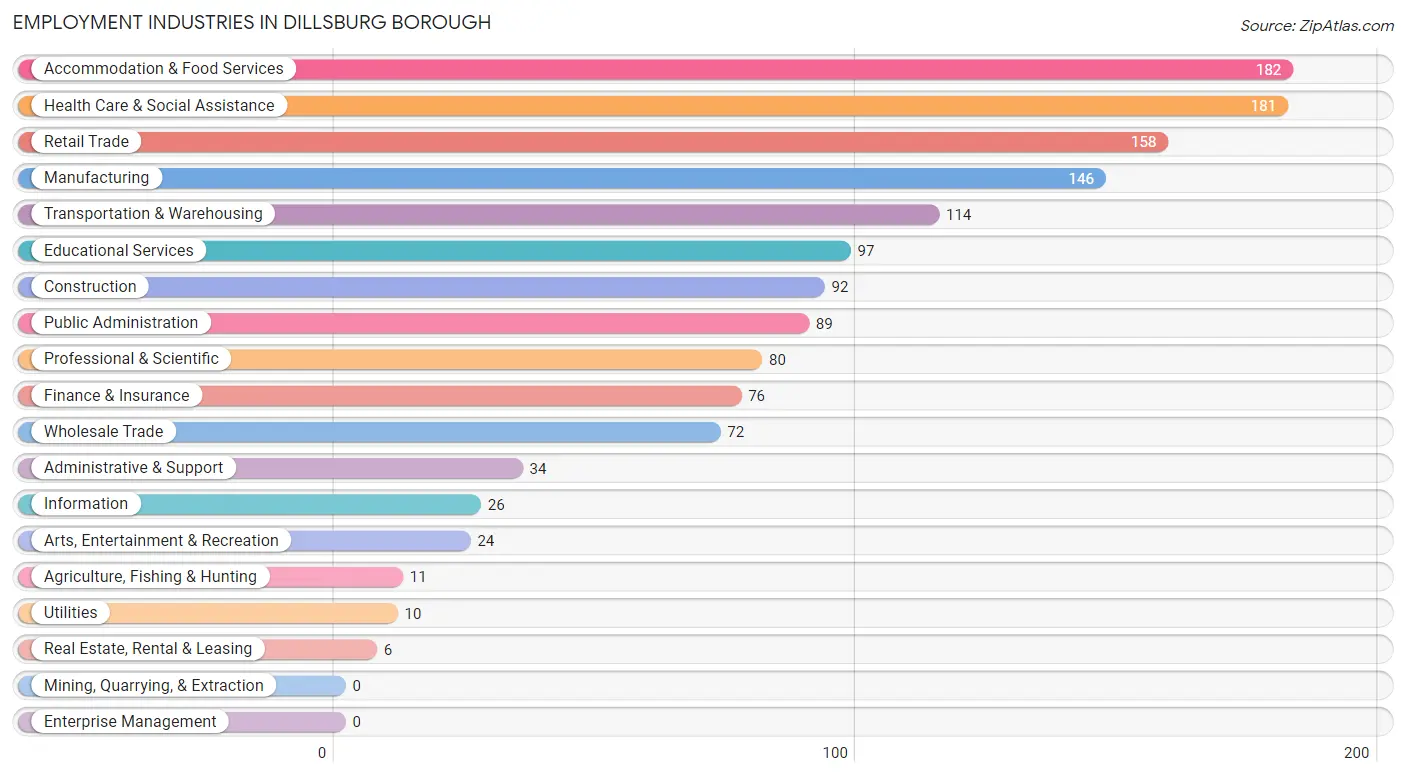
Employment Industries in Dillsburg borough
The major employment industries in Dillsburg borough include Accommodation & Food Services (182 | 12.2%), Health Care & Social Assistance (181 | 12.1%), Retail Trade (158 | 10.6%), Manufacturing (146 | 9.8%), and Transportation & Warehousing (114 | 7.6%).
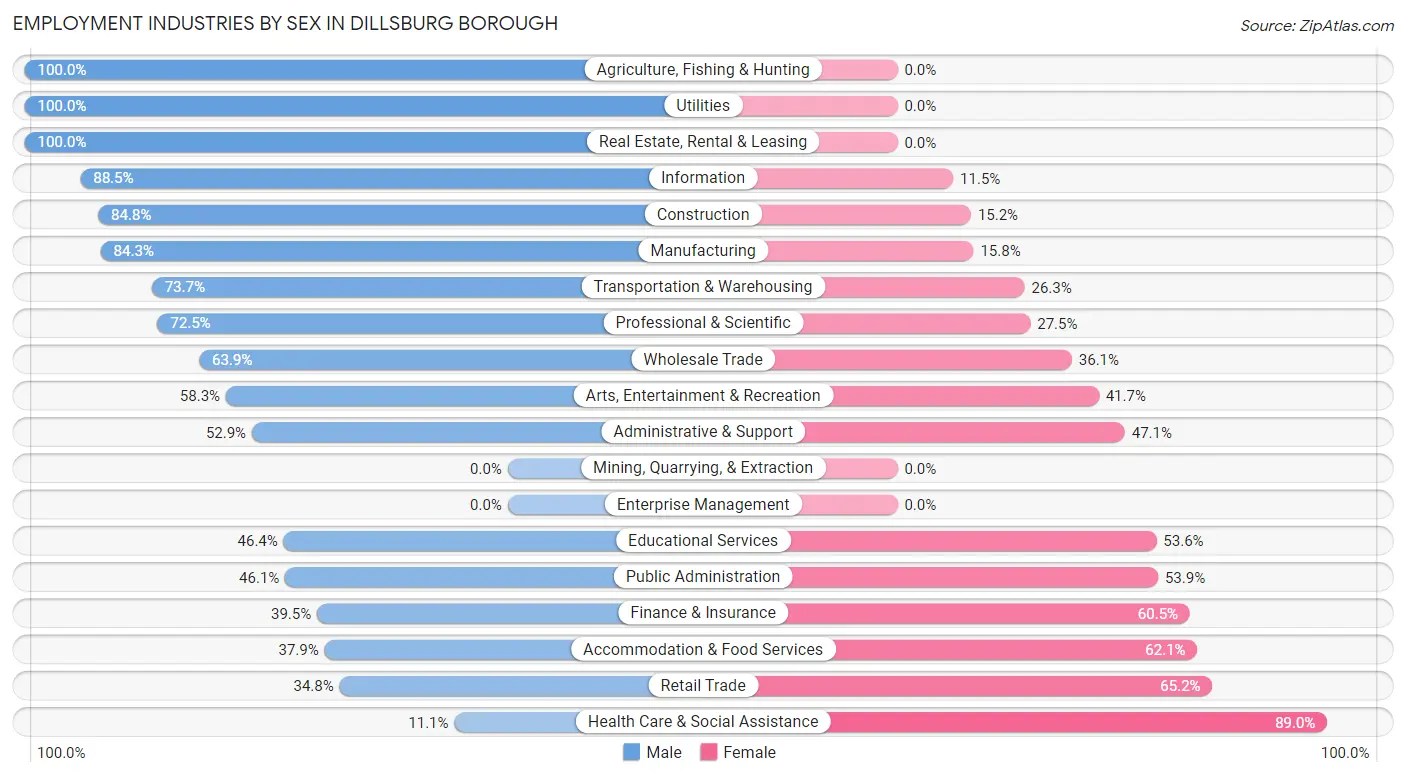
Employment Industries by Sex in Dillsburg borough
The Dillsburg borough industries that see more men than women are Agriculture, Fishing & Hunting (100.0%), Utilities (100.0%), and Real Estate, Rental & Leasing (100.0%), whereas the industries that tend to have a higher number of women are Health Care & Social Assistance (88.9%), Retail Trade (65.2%), and Accommodation & Food Services (62.1%).
| Industry | Male | Female |
| Agriculture, Fishing & Hunting | 11 (100.0%) | 0 (0.0%) |
| Mining, Quarrying, & Extraction | 0 (0.0%) | 0 (0.0%) |
| Construction | 78 (84.8%) | 14 (15.2%) |
| Manufacturing | 123 (84.3%) | 23 (15.8%) |
| Wholesale Trade | 46 (63.9%) | 26 (36.1%) |
| Retail Trade | 55 (34.8%) | 103 (65.2%) |
| Transportation & Warehousing | 84 (73.7%) | 30 (26.3%) |
| Utilities | 10 (100.0%) | 0 (0.0%) |
| Information | 23 (88.5%) | 3 (11.5%) |
| Finance & Insurance | 30 (39.5%) | 46 (60.5%) |
| Real Estate, Rental & Leasing | 6 (100.0%) | 0 (0.0%) |
| Professional & Scientific | 58 (72.5%) | 22 (27.5%) |
| Enterprise Management | 0 (0.0%) | 0 (0.0%) |
| Administrative & Support | 18 (52.9%) | 16 (47.1%) |
| Educational Services | 45 (46.4%) | 52 (53.6%) |
| Health Care & Social Assistance | 20 (11.1%) | 161 (88.9%) |
| Arts, Entertainment & Recreation | 14 (58.3%) | 10 (41.7%) |
| Accommodation & Food Services | 69 (37.9%) | 113 (62.1%) |
| Public Administration | 41 (46.1%) | 48 (53.9%) |
| Total | 764 (51.2%) | 727 (48.8%) |
Education in Dillsburg borough
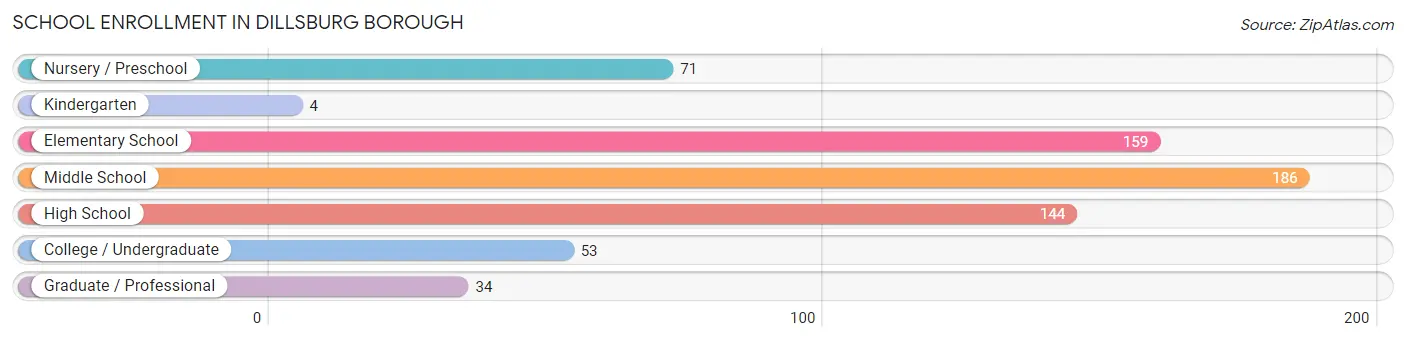
School Enrollment in Dillsburg borough
The most common levels of schooling among the 651 students in Dillsburg borough are middle school (186 | 28.6%), elementary school (159 | 24.4%), and high school (144 | 22.1%).
| School Level | # Students | % Students |
| Nursery / Preschool | 71 | 10.9% |
| Kindergarten | 4 | 0.6% |
| Elementary School | 159 | 24.4% |
| Middle School | 186 | 28.6% |
| High School | 144 | 22.1% |
| College / Undergraduate | 53 | 8.1% |
| Graduate / Professional | 34 | 5.2% |
| Total | 651 | 100.0% |
School Enrollment by Age by Funding Source in Dillsburg borough
Out of a total of 651 students who are enrolled in schools in Dillsburg borough, 91 (14.0%) attend a private institution, while the remaining 560 (86.0%) are enrolled in public schools. The age group of 3 to 4 year olds has the highest likelihood of being enrolled in private schools, with 17 (40.5% in the age bracket) enrolled. Conversely, the age group of 18 to 19 year olds has the lowest likelihood of being enrolled in a private school, with 14 (100.0% in the age bracket) attending a public institution.
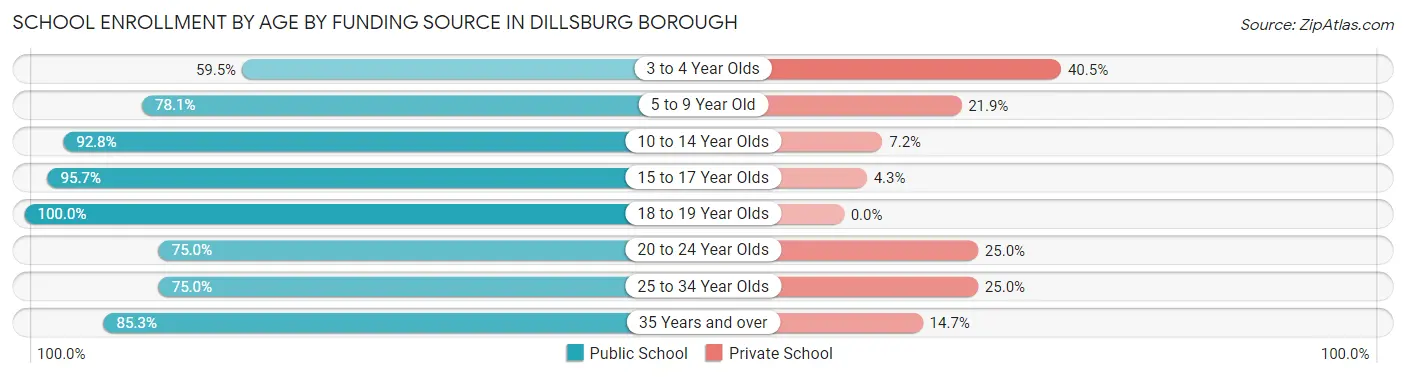
| Age Bracket | Public School | Private School |
| 3 to 4 Year Olds | 25 (59.5%) | 17 (40.5%) |
| 5 to 9 Year Old | 132 (78.1%) | 37 (21.9%) |
| 10 to 14 Year Olds | 193 (92.8%) | 15 (7.2%) |
| 15 to 17 Year Olds | 134 (95.7%) | 6 (4.3%) |
| 18 to 19 Year Olds | 14 (100.0%) | 0 (0.0%) |
| 20 to 24 Year Olds | 15 (75.0%) | 5 (25.0%) |
| 25 to 34 Year Olds | 18 (75.0%) | 6 (25.0%) |
| 35 Years and over | 29 (85.3%) | 5 (14.7%) |
| Total | 560 (86.0%) | 91 (14.0%) |
Educational Attainment by Field of Study in Dillsburg borough
Science & technology (102 | 18.6%), business (99 | 18.1%), psychology (69 | 12.6%), education (50 | 9.1%), and computers & mathematics (39 | 7.1%) are the most common fields of study among 547 individuals in Dillsburg borough who have obtained a bachelor's degree or higher.
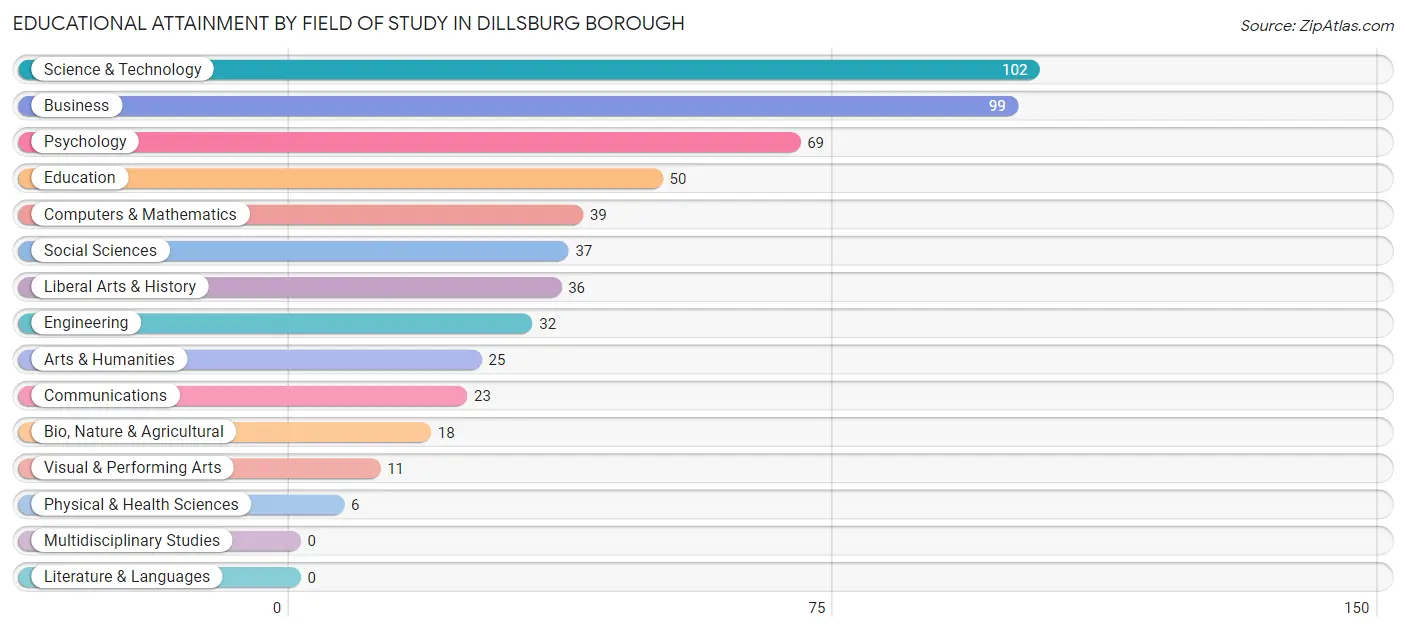
| Field of Study | # Graduates | % Graduates |
| Computers & Mathematics | 39 | 7.1% |
| Bio, Nature & Agricultural | 18 | 3.3% |
| Physical & Health Sciences | 6 | 1.1% |
| Psychology | 69 | 12.6% |
| Social Sciences | 37 | 6.8% |
| Engineering | 32 | 5.9% |
| Multidisciplinary Studies | 0 | 0.0% |
| Science & Technology | 102 | 18.6% |
| Business | 99 | 18.1% |
| Education | 50 | 9.1% |
| Literature & Languages | 0 | 0.0% |
| Liberal Arts & History | 36 | 6.6% |
| Visual & Performing Arts | 11 | 2.0% |
| Communications | 23 | 4.2% |
| Arts & Humanities | 25 | 4.6% |
| Total | 547 | 100.0% |
Transportation & Commute in Dillsburg borough
Vehicle Availability by Sex in Dillsburg borough
The most prevalent vehicle ownership categories in Dillsburg borough are males with 2 vehicles (351, accounting for 46.6%) and females with 2 vehicles (369, making up 48.9%).
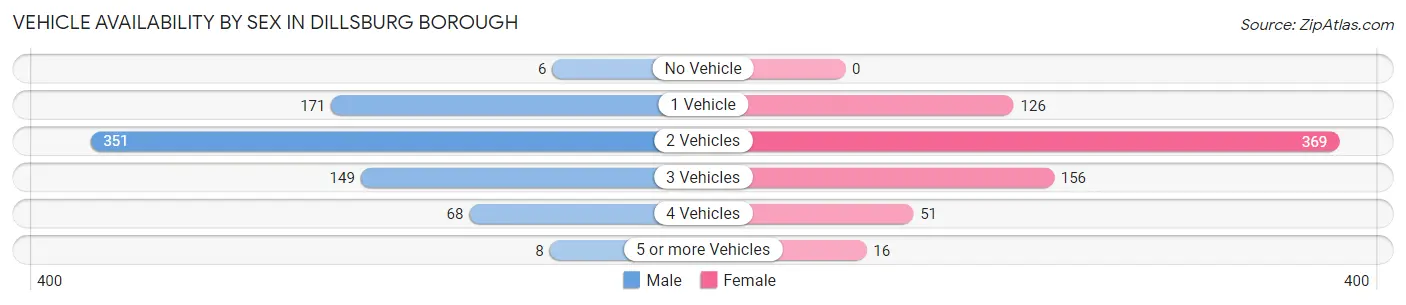
| Vehicles Available | Male | Female |
| No Vehicle | 6 (0.8%) | 0 (0.0%) |
| 1 Vehicle | 171 (22.7%) | 126 (17.5%) |
| 2 Vehicles | 351 (46.6%) | 369 (51.4%) |
| 3 Vehicles | 149 (19.8%) | 156 (21.7%) |
| 4 Vehicles | 68 (9.0%) | 51 (7.1%) |
| 5 or more Vehicles | 8 (1.1%) | 16 (2.2%) |
| Total | 753 (100.0%) | 718 (100.0%) |
Commute Time in Dillsburg borough
The most frequently occuring commute durations in Dillsburg borough are 20 to 24 minutes (187 commuters, 14.1%), 25 to 29 minutes (168 commuters, 12.6%), and 10 to 14 minutes (161 commuters, 12.1%).
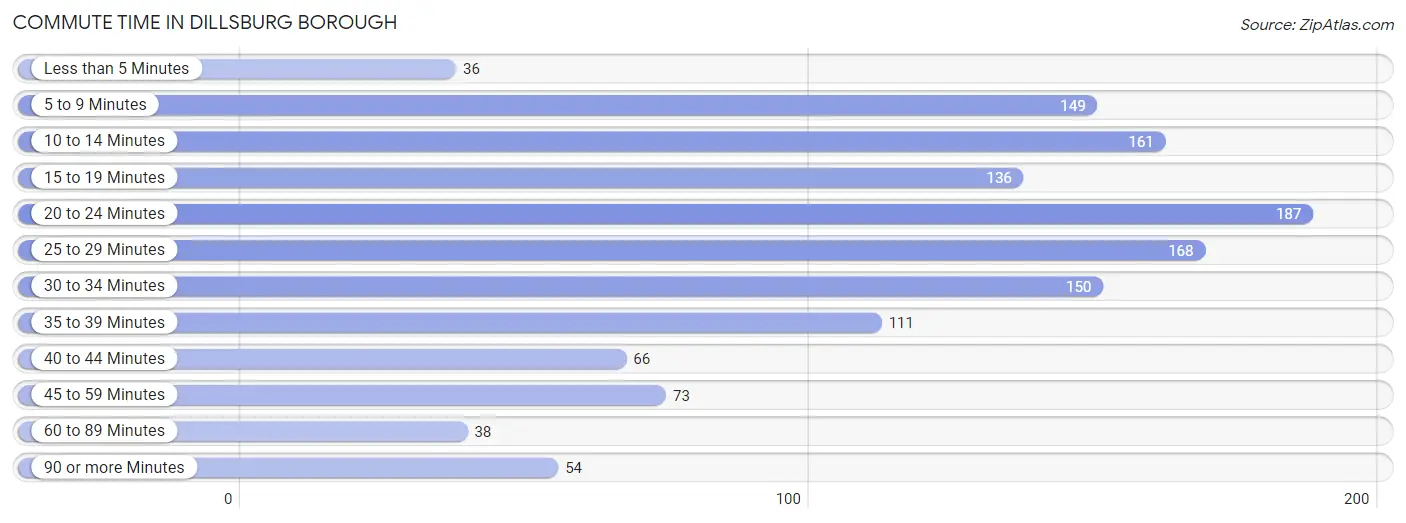
| Commute Time | # Commuters | % Commuters |
| Less than 5 Minutes | 36 | 2.7% |
| 5 to 9 Minutes | 149 | 11.2% |
| 10 to 14 Minutes | 161 | 12.1% |
| 15 to 19 Minutes | 136 | 10.2% |
| 20 to 24 Minutes | 187 | 14.1% |
| 25 to 29 Minutes | 168 | 12.6% |
| 30 to 34 Minutes | 150 | 11.3% |
| 35 to 39 Minutes | 111 | 8.4% |
| 40 to 44 Minutes | 66 | 5.0% |
| 45 to 59 Minutes | 73 | 5.5% |
| 60 to 89 Minutes | 38 | 2.9% |
| 90 or more Minutes | 54 | 4.1% |
Commute Time by Sex in Dillsburg borough
The most common commute times in Dillsburg borough are 25 to 29 minutes (133 commuters, 18.6%) for males and 20 to 24 minutes (86 commuters, 14.0%) for females.
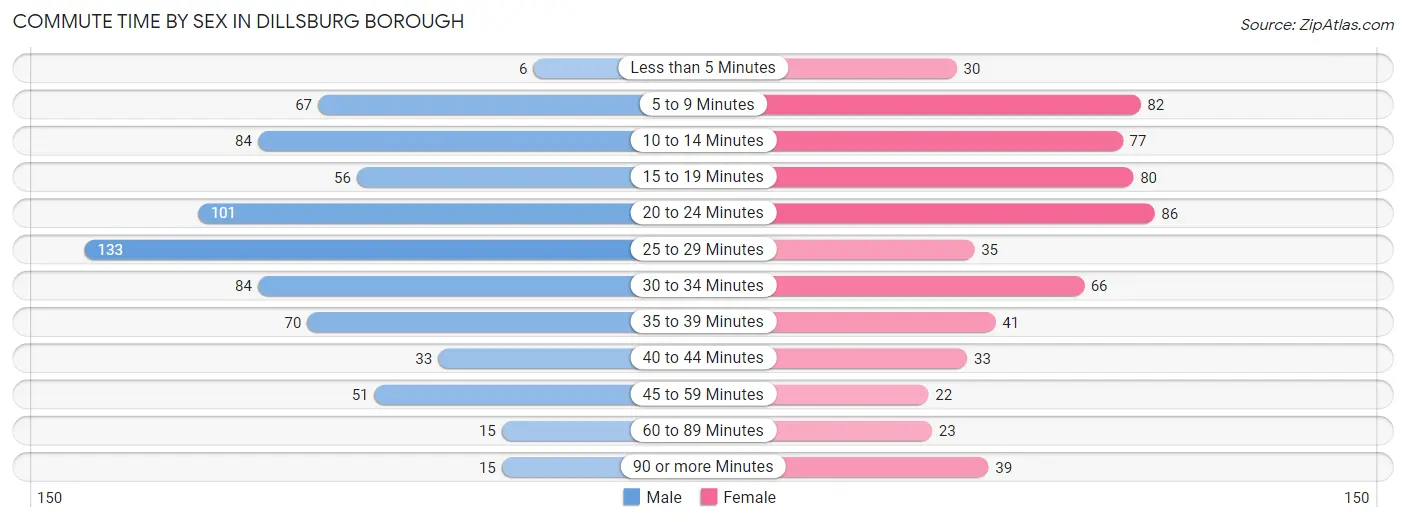
| Commute Time | Male | Female |
| Less than 5 Minutes | 6 (0.8%) | 30 (4.9%) |
| 5 to 9 Minutes | 67 (9.4%) | 82 (13.4%) |
| 10 to 14 Minutes | 84 (11.7%) | 77 (12.5%) |
| 15 to 19 Minutes | 56 (7.8%) | 80 (13.0%) |
| 20 to 24 Minutes | 101 (14.1%) | 86 (14.0%) |
| 25 to 29 Minutes | 133 (18.6%) | 35 (5.7%) |
| 30 to 34 Minutes | 84 (11.7%) | 66 (10.7%) |
| 35 to 39 Minutes | 70 (9.8%) | 41 (6.7%) |
| 40 to 44 Minutes | 33 (4.6%) | 33 (5.4%) |
| 45 to 59 Minutes | 51 (7.1%) | 22 (3.6%) |
| 60 to 89 Minutes | 15 (2.1%) | 23 (3.7%) |
| 90 or more Minutes | 15 (2.1%) | 39 (6.4%) |
Time of Departure to Work by Sex in Dillsburg borough
The most frequent times of departure to work in Dillsburg borough are 6:00 AM to 6:29 AM (108, 15.1%) for males and 8:00 AM to 8:29 AM (107, 17.4%) for females.
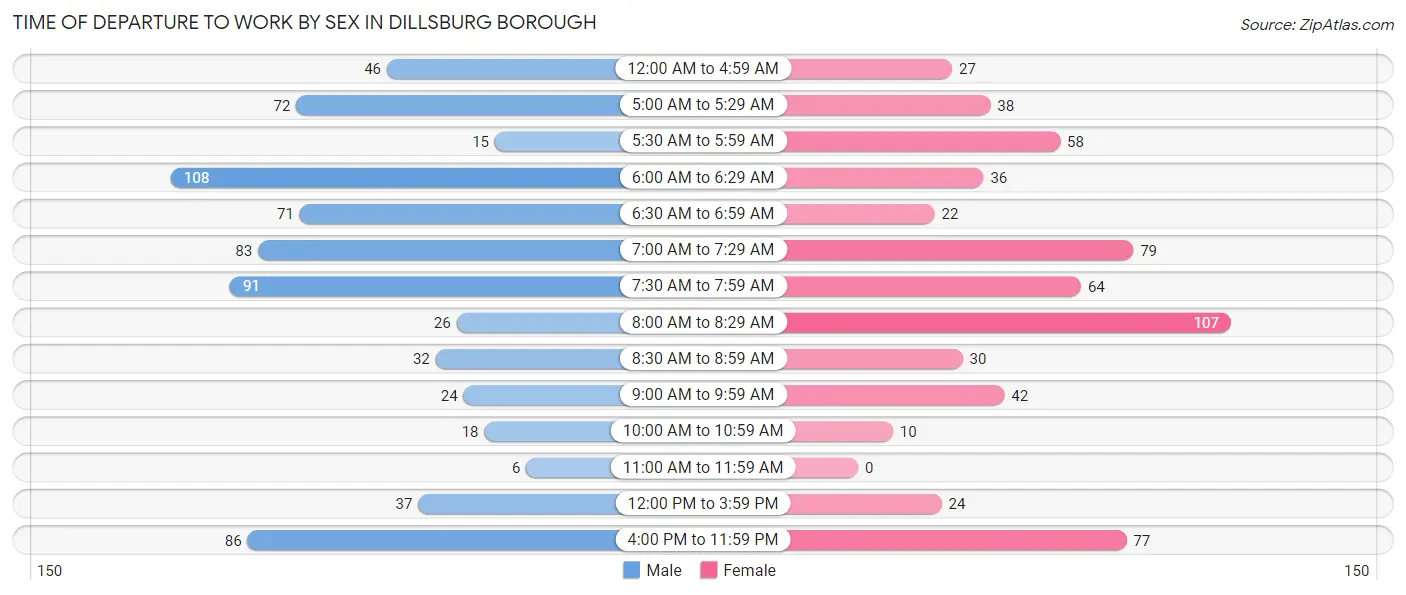
| Time of Departure | Male | Female |
| 12:00 AM to 4:59 AM | 46 (6.4%) | 27 (4.4%) |
| 5:00 AM to 5:29 AM | 72 (10.1%) | 38 (6.2%) |
| 5:30 AM to 5:59 AM | 15 (2.1%) | 58 (9.5%) |
| 6:00 AM to 6:29 AM | 108 (15.1%) | 36 (5.9%) |
| 6:30 AM to 6:59 AM | 71 (9.9%) | 22 (3.6%) |
| 7:00 AM to 7:29 AM | 83 (11.6%) | 79 (12.9%) |
| 7:30 AM to 7:59 AM | 91 (12.7%) | 64 (10.4%) |
| 8:00 AM to 8:29 AM | 26 (3.6%) | 107 (17.4%) |
| 8:30 AM to 8:59 AM | 32 (4.5%) | 30 (4.9%) |
| 9:00 AM to 9:59 AM | 24 (3.4%) | 42 (6.8%) |
| 10:00 AM to 10:59 AM | 18 (2.5%) | 10 (1.6%) |
| 11:00 AM to 11:59 AM | 6 (0.8%) | 0 (0.0%) |
| 12:00 PM to 3:59 PM | 37 (5.2%) | 24 (3.9%) |
| 4:00 PM to 11:59 PM | 86 (12.0%) | 77 (12.5%) |
| Total | 715 (100.0%) | 614 (100.0%) |
Housing Occupancy in Dillsburg borough
Occupancy by Ownership in Dillsburg borough
Of the total 1,023 dwellings in Dillsburg borough, owner-occupied units account for 702 (68.6%), while renter-occupied units make up 321 (31.4%).
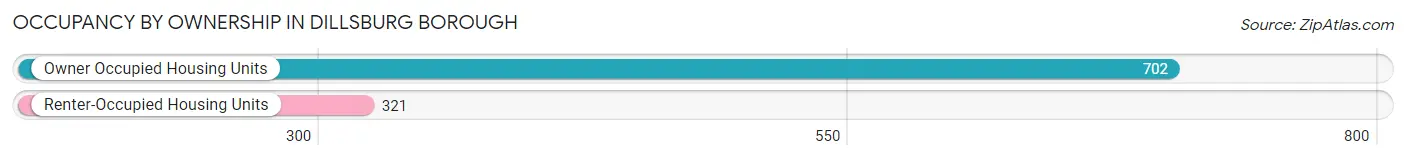
| Occupancy | # Housing Units | % Housing Units |
| Owner Occupied Housing Units | 702 | 68.6% |
| Renter-Occupied Housing Units | 321 | 31.4% |
| Total Occupied Housing Units | 1,023 | 100.0% |
Occupancy by Household Size in Dillsburg borough
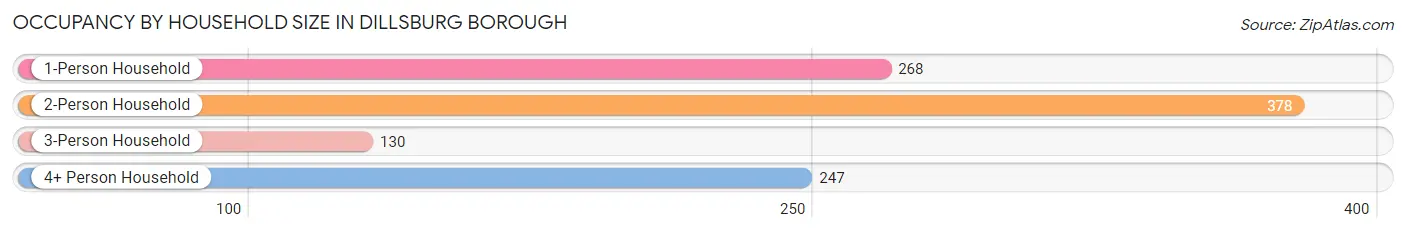
| Household Size | # Housing Units | % Housing Units |
| 1-Person Household | 268 | 26.2% |
| 2-Person Household | 378 | 36.9% |
| 3-Person Household | 130 | 12.7% |
| 4+ Person Household | 247 | 24.1% |
| Total Housing Units | 1,023 | 100.0% |
Occupancy by Ownership by Household Size in Dillsburg borough
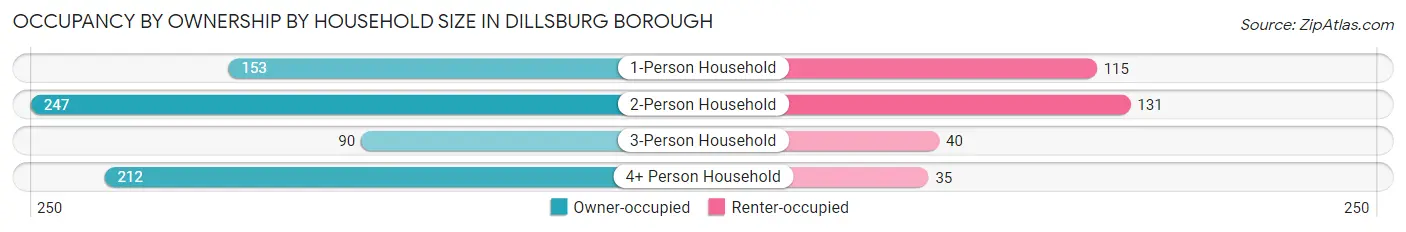
| Household Size | Owner-occupied | Renter-occupied |
| 1-Person Household | 153 (57.1%) | 115 (42.9%) |
| 2-Person Household | 247 (65.3%) | 131 (34.7%) |
| 3-Person Household | 90 (69.2%) | 40 (30.8%) |
| 4+ Person Household | 212 (85.8%) | 35 (14.2%) |
| Total Housing Units | 702 (68.6%) | 321 (31.4%) |
Occupancy by Educational Attainment in Dillsburg borough
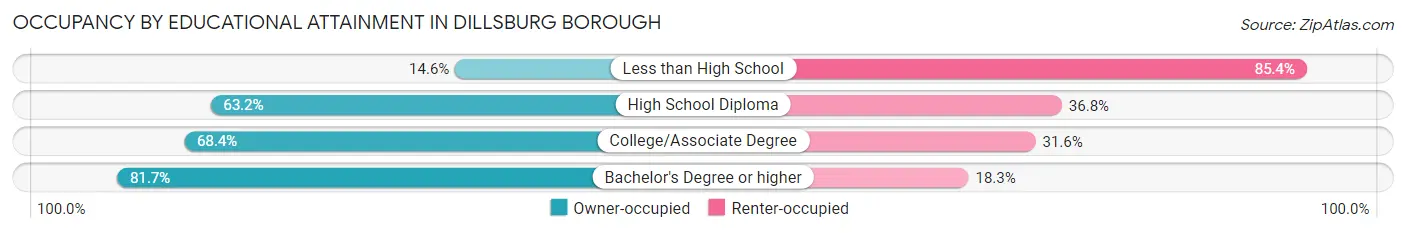
| Household Size | Owner-occupied | Renter-occupied |
| Less than High School | 6 (14.6%) | 35 (85.4%) |
| High School Diploma | 223 (63.2%) | 130 (36.8%) |
| College/Associate Degree | 210 (68.4%) | 97 (31.6%) |
| Bachelor's Degree or higher | 263 (81.7%) | 59 (18.3%) |
Occupancy by Age of Householder in Dillsburg borough
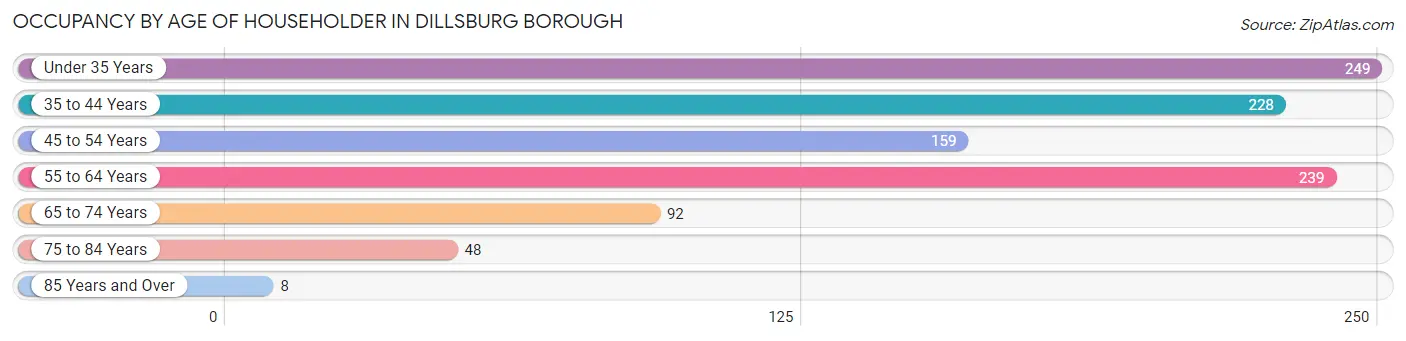
| Age Bracket | # Households | % Households |
| Under 35 Years | 249 | 24.3% |
| 35 to 44 Years | 228 | 22.3% |
| 45 to 54 Years | 159 | 15.5% |
| 55 to 64 Years | 239 | 23.4% |
| 65 to 74 Years | 92 | 9.0% |
| 75 to 84 Years | 48 | 4.7% |
| 85 Years and Over | 8 | 0.8% |
| Total | 1,023 | 100.0% |
Housing Finances in Dillsburg borough
Median Income by Occupancy in Dillsburg borough
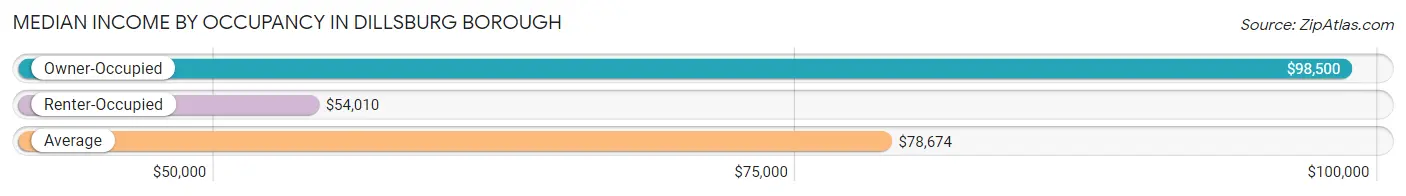
| Occupancy Type | # Households | Median Income |
| Owner-Occupied | 702 (68.6%) | $98,500 |
| Renter-Occupied | 321 (31.4%) | $54,010 |
| Average | 1,023 (100.0%) | $78,674 |
Occupancy by Householder Income Bracket in Dillsburg borough
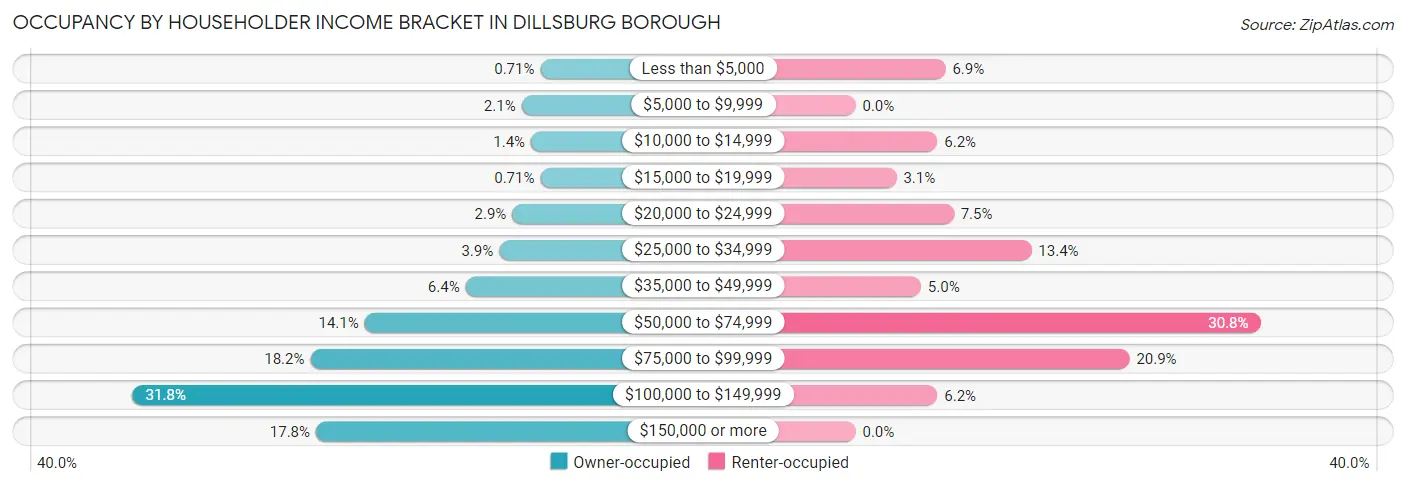
| Income Bracket | Owner-occupied | Renter-occupied |
| Less than $5,000 | 5 (0.7%) | 22 (6.9%) |
| $5,000 to $9,999 | 15 (2.1%) | 0 (0.0%) |
| $10,000 to $14,999 | 10 (1.4%) | 20 (6.2%) |
| $15,000 to $19,999 | 5 (0.7%) | 10 (3.1%) |
| $20,000 to $24,999 | 20 (2.9%) | 24 (7.5%) |
| $25,000 to $34,999 | 27 (3.8%) | 43 (13.4%) |
| $35,000 to $49,999 | 45 (6.4%) | 16 (5.0%) |
| $50,000 to $74,999 | 99 (14.1%) | 99 (30.8%) |
| $75,000 to $99,999 | 128 (18.2%) | 67 (20.9%) |
| $100,000 to $149,999 | 223 (31.8%) | 20 (6.2%) |
| $150,000 or more | 125 (17.8%) | 0 (0.0%) |
| Total | 702 (100.0%) | 321 (100.0%) |
Monthly Housing Cost Tiers in Dillsburg borough
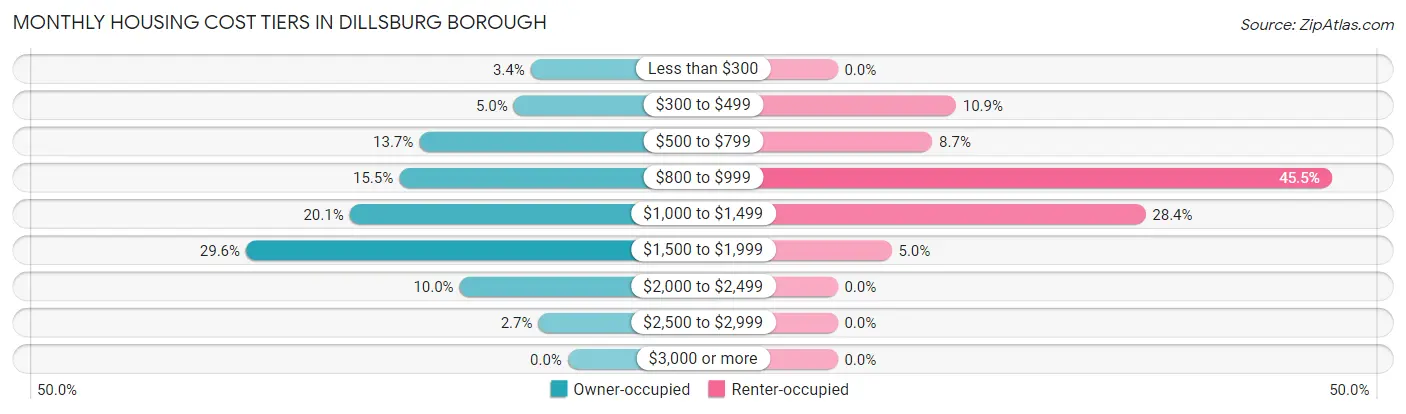
| Monthly Cost | Owner-occupied | Renter-occupied |
| Less than $300 | 24 (3.4%) | 0 (0.0%) |
| $300 to $499 | 35 (5.0%) | 35 (10.9%) |
| $500 to $799 | 96 (13.7%) | 28 (8.7%) |
| $800 to $999 | 109 (15.5%) | 146 (45.5%) |
| $1,000 to $1,499 | 141 (20.1%) | 91 (28.3%) |
| $1,500 to $1,999 | 208 (29.6%) | 16 (5.0%) |
| $2,000 to $2,499 | 70 (10.0%) | 0 (0.0%) |
| $2,500 to $2,999 | 19 (2.7%) | 0 (0.0%) |
| $3,000 or more | 0 (0.0%) | 0 (0.0%) |
| Total | 702 (100.0%) | 321 (100.0%) |
Physical Housing Characteristics in Dillsburg borough
Housing Structures in Dillsburg borough
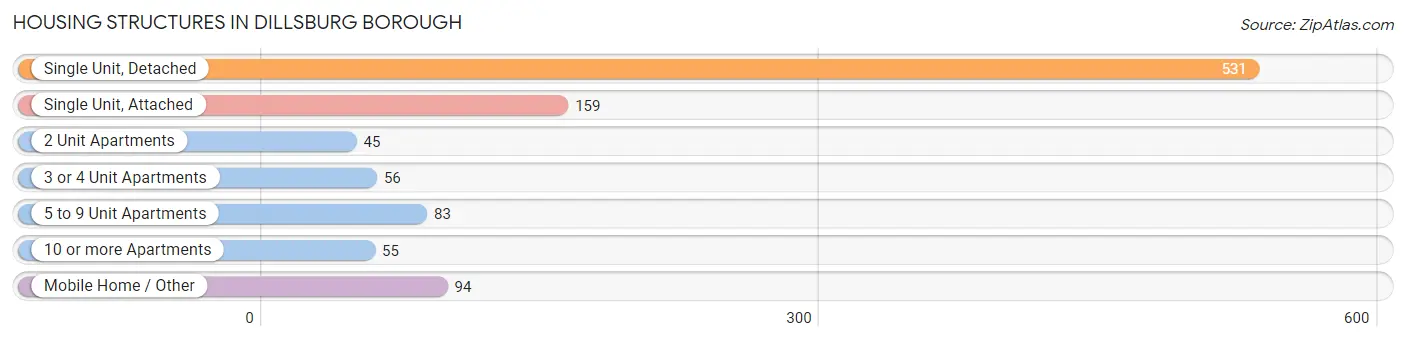
| Structure Type | # Housing Units | % Housing Units |
| Single Unit, Detached | 531 | 51.9% |
| Single Unit, Attached | 159 | 15.5% |
| 2 Unit Apartments | 45 | 4.4% |
| 3 or 4 Unit Apartments | 56 | 5.5% |
| 5 to 9 Unit Apartments | 83 | 8.1% |
| 10 or more Apartments | 55 | 5.4% |
| Mobile Home / Other | 94 | 9.2% |
| Total | 1,023 | 100.0% |
Housing Structures by Occupancy in Dillsburg borough
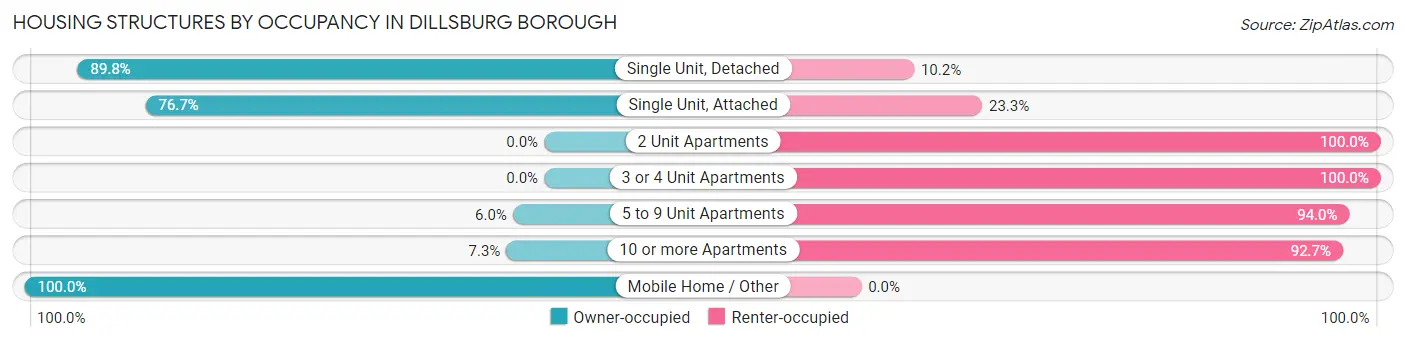
| Structure Type | Owner-occupied | Renter-occupied |
| Single Unit, Detached | 477 (89.8%) | 54 (10.2%) |
| Single Unit, Attached | 122 (76.7%) | 37 (23.3%) |
| 2 Unit Apartments | 0 (0.0%) | 45 (100.0%) |
| 3 or 4 Unit Apartments | 0 (0.0%) | 56 (100.0%) |
| 5 to 9 Unit Apartments | 5 (6.0%) | 78 (94.0%) |
| 10 or more Apartments | 4 (7.3%) | 51 (92.7%) |
| Mobile Home / Other | 94 (100.0%) | 0 (0.0%) |
| Total | 702 (68.6%) | 321 (31.4%) |
Housing Structures by Number of Rooms in Dillsburg borough
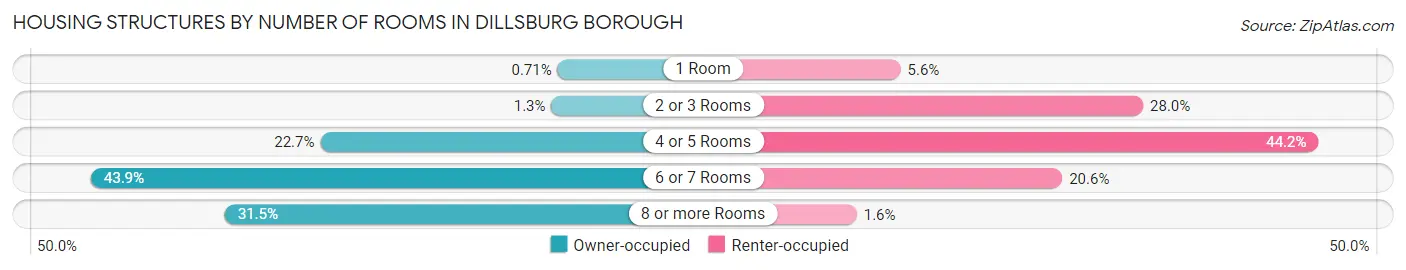
| Number of Rooms | Owner-occupied | Renter-occupied |
| 1 Room | 5 (0.7%) | 18 (5.6%) |
| 2 or 3 Rooms | 9 (1.3%) | 90 (28.0%) |
| 4 or 5 Rooms | 159 (22.7%) | 142 (44.2%) |
| 6 or 7 Rooms | 308 (43.9%) | 66 (20.6%) |
| 8 or more Rooms | 221 (31.5%) | 5 (1.6%) |
| Total | 702 (100.0%) | 321 (100.0%) |
Housing Structure by Heating Type in Dillsburg borough
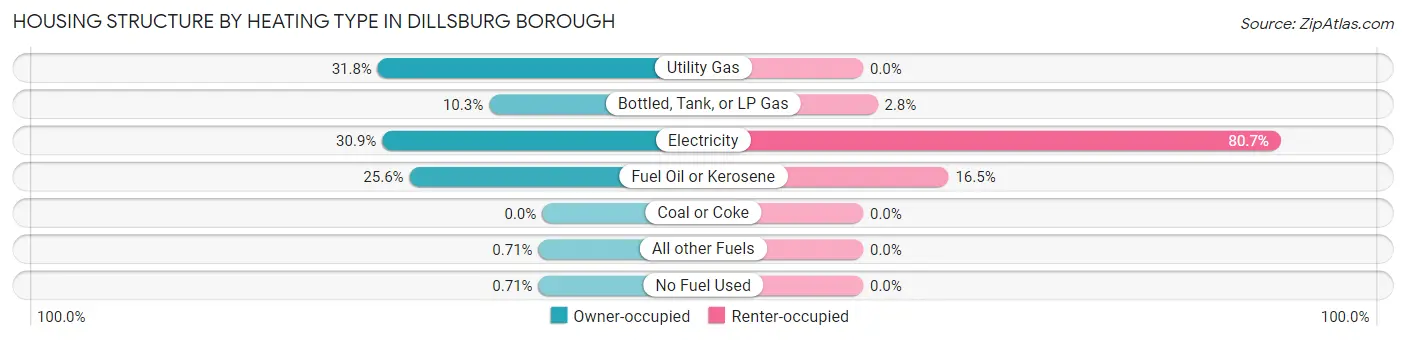
| Heating Type | Owner-occupied | Renter-occupied |
| Utility Gas | 223 (31.8%) | 0 (0.0%) |
| Bottled, Tank, or LP Gas | 72 (10.3%) | 9 (2.8%) |
| Electricity | 217 (30.9%) | 259 (80.7%) |
| Fuel Oil or Kerosene | 180 (25.6%) | 53 (16.5%) |
| Coal or Coke | 0 (0.0%) | 0 (0.0%) |
| All other Fuels | 5 (0.7%) | 0 (0.0%) |
| No Fuel Used | 5 (0.7%) | 0 (0.0%) |
| Total | 702 (100.0%) | 321 (100.0%) |
Household Vehicle Usage in Dillsburg borough
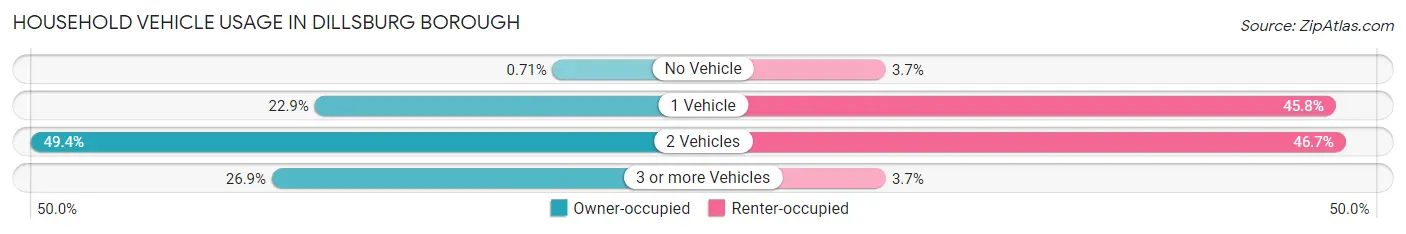
| Vehicles per Household | Owner-occupied | Renter-occupied |
| No Vehicle | 5 (0.7%) | 12 (3.7%) |
| 1 Vehicle | 161 (22.9%) | 147 (45.8%) |
| 2 Vehicles | 347 (49.4%) | 150 (46.7%) |
| 3 or more Vehicles | 189 (26.9%) | 12 (3.7%) |
| Total | 702 (100.0%) | 321 (100.0%) |
Real Estate & Mortgages in Dillsburg borough
Real Estate and Mortgage Overview in Dillsburg borough
| Characteristic | Without Mortgage | With Mortgage |
| Housing Units | 246 | 456 |
| Median Property Value | $155,000 | $227,700 |
| Median Household Income | $75,132 | $112 |
| Monthly Housing Costs | $749 | $0 |
| Real Estate Taxes | $2,500 | $0 |
Property Value by Mortgage Status in Dillsburg borough
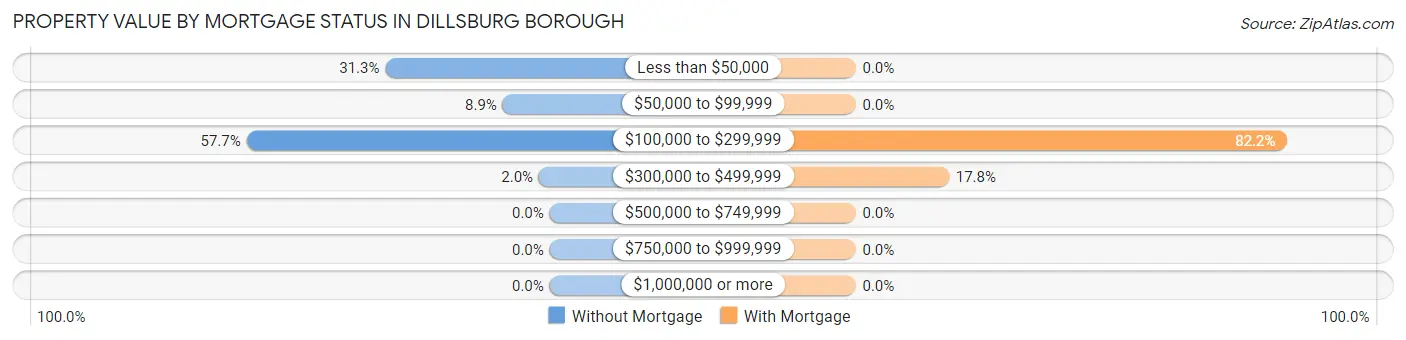
| Property Value | Without Mortgage | With Mortgage |
| Less than $50,000 | 77 (31.3%) | 0 (0.0%) |
| $50,000 to $99,999 | 22 (8.9%) | 0 (0.0%) |
| $100,000 to $299,999 | 142 (57.7%) | 375 (82.2%) |
| $300,000 to $499,999 | 5 (2.0%) | 81 (17.8%) |
| $500,000 to $749,999 | 0 (0.0%) | 0 (0.0%) |
| $750,000 to $999,999 | 0 (0.0%) | 0 (0.0%) |
| $1,000,000 or more | 0 (0.0%) | 0 (0.0%) |
| Total | 246 (100.0%) | 456 (100.0%) |
Household Income by Mortgage Status in Dillsburg borough
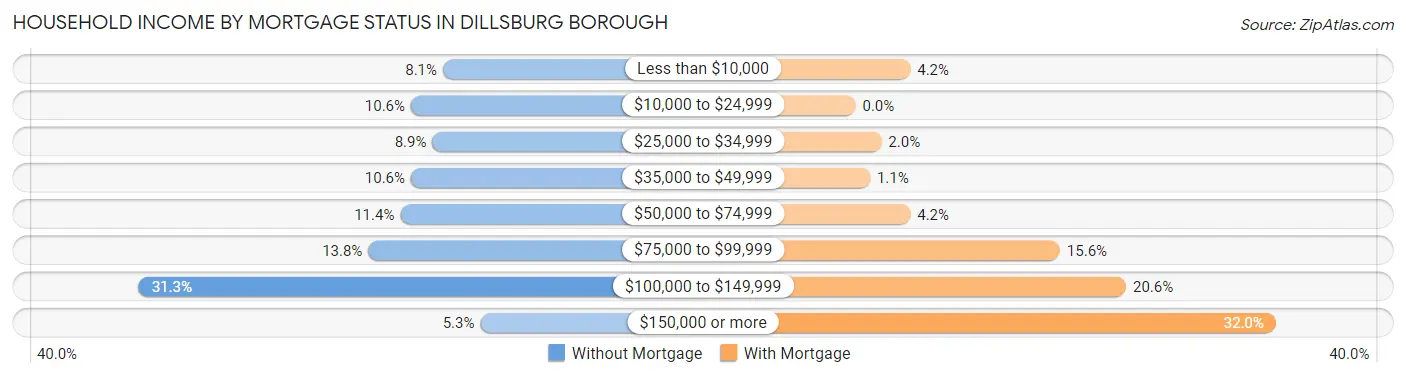
| Household Income | Without Mortgage | With Mortgage |
| Less than $10,000 | 20 (8.1%) | 19 (4.2%) |
| $10,000 to $24,999 | 26 (10.6%) | 0 (0.0%) |
| $25,000 to $34,999 | 22 (8.9%) | 9 (2.0%) |
| $35,000 to $49,999 | 26 (10.6%) | 5 (1.1%) |
| $50,000 to $74,999 | 28 (11.4%) | 19 (4.2%) |
| $75,000 to $99,999 | 34 (13.8%) | 71 (15.6%) |
| $100,000 to $149,999 | 77 (31.3%) | 94 (20.6%) |
| $150,000 or more | 13 (5.3%) | 146 (32.0%) |
| Total | 246 (100.0%) | 456 (100.0%) |
Property Value to Household Income Ratio in Dillsburg borough
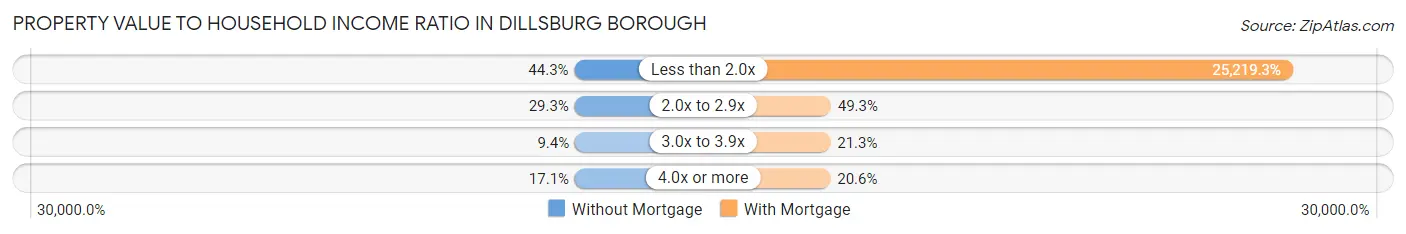
| Value-to-Income Ratio | Without Mortgage | With Mortgage |
| Less than 2.0x | 109 (44.3%) | 115,000 (25,219.3%) |
| 2.0x to 2.9x | 72 (29.3%) | 225 (49.3%) |
| 3.0x to 3.9x | 23 (9.3%) | 97 (21.3%) |
| 4.0x or more | 42 (17.1%) | 94 (20.6%) |
| Total | 246 (100.0%) | 456 (100.0%) |
Real Estate Taxes by Mortgage Status in Dillsburg borough
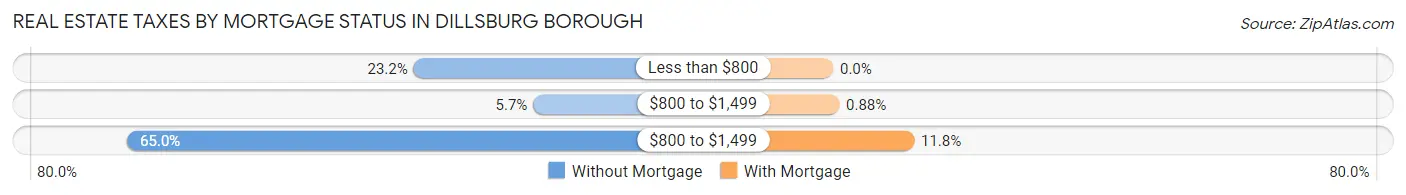
| Property Taxes | Without Mortgage | With Mortgage |
| Less than $800 | 57 (23.2%) | 0 (0.0%) |
| $800 to $1,499 | 14 (5.7%) | 4 (0.9%) |
| $800 to $1,499 | 160 (65.0%) | 54 (11.8%) |
| Total | 246 (100.0%) | 456 (100.0%) |
Health & Disability in Dillsburg borough
Health Insurance Coverage by Age in Dillsburg borough
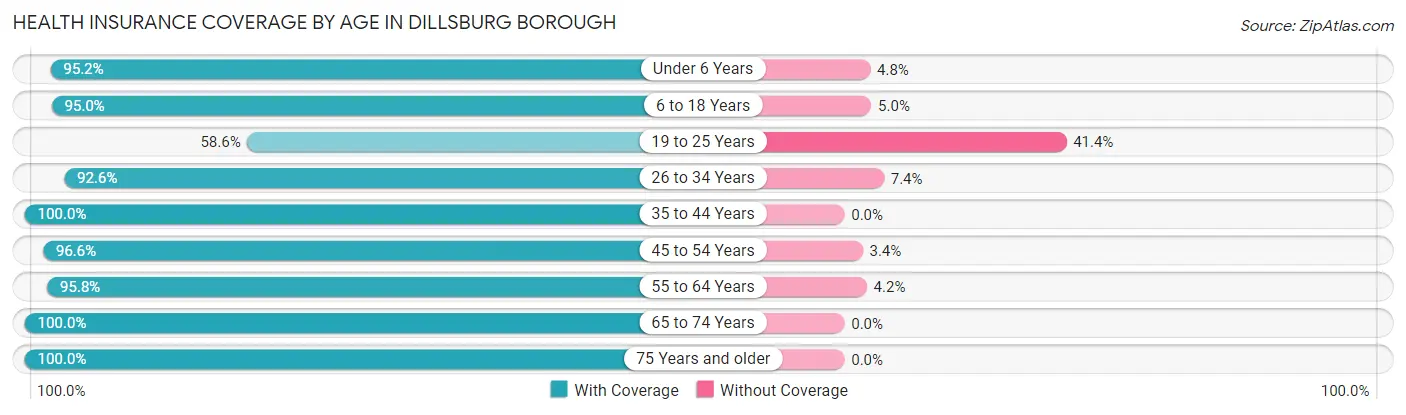
| Age Bracket | With Coverage | Without Coverage |
| Under 6 Years | 198 (95.2%) | 10 (4.8%) |
| 6 to 18 Years | 493 (95.0%) | 26 (5.0%) |
| 19 to 25 Years | 102 (58.6%) | 72 (41.4%) |
| 26 to 34 Years | 390 (92.6%) | 31 (7.4%) |
| 35 to 44 Years | 432 (100.0%) | 0 (0.0%) |
| 45 to 54 Years | 256 (96.6%) | 9 (3.4%) |
| 55 to 64 Years | 345 (95.8%) | 15 (4.2%) |
| 65 to 74 Years | 151 (100.0%) | 0 (0.0%) |
| 75 Years and older | 99 (100.0%) | 0 (0.0%) |
| Total | 2,466 (93.8%) | 163 (6.2%) |
Health Insurance Coverage by Citizenship Status in Dillsburg borough
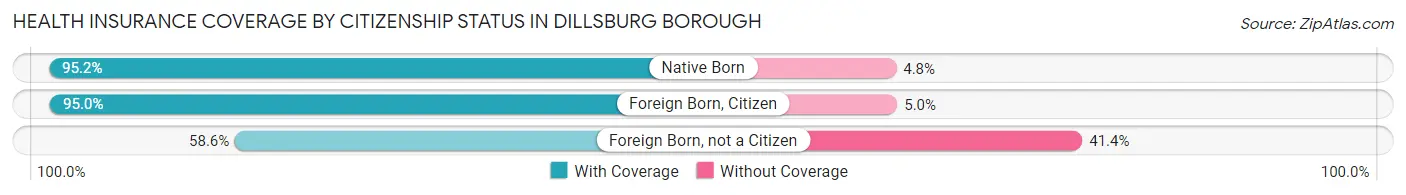
| Citizenship Status | With Coverage | Without Coverage |
| Native Born | 198 (95.2%) | 10 (4.8%) |
| Foreign Born, Citizen | 493 (95.0%) | 26 (5.0%) |
| Foreign Born, not a Citizen | 102 (58.6%) | 72 (41.4%) |
Health Insurance Coverage by Household Income in Dillsburg borough
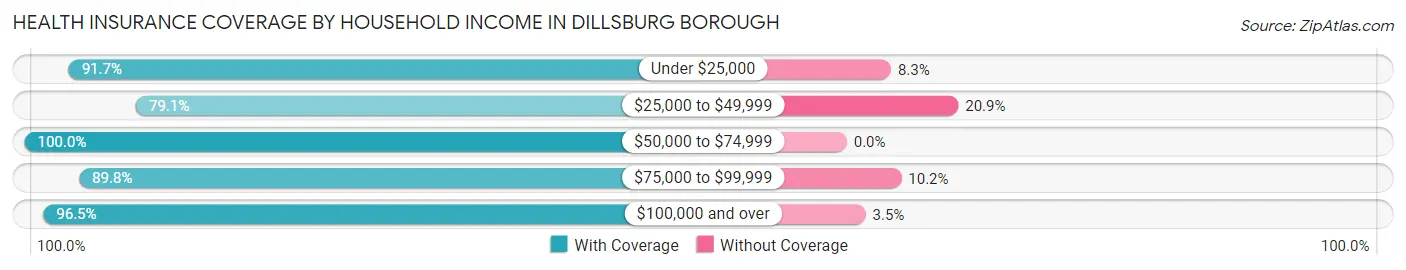
| Household Income | With Coverage | Without Coverage |
| Under $25,000 | 233 (91.7%) | 21 (8.3%) |
| $25,000 to $49,999 | 178 (79.1%) | 47 (20.9%) |
| $50,000 to $74,999 | 476 (100.0%) | 0 (0.0%) |
| $75,000 to $99,999 | 483 (89.8%) | 55 (10.2%) |
| $100,000 and over | 1,096 (96.5%) | 40 (3.5%) |
Public vs Private Health Insurance Coverage by Age in Dillsburg borough
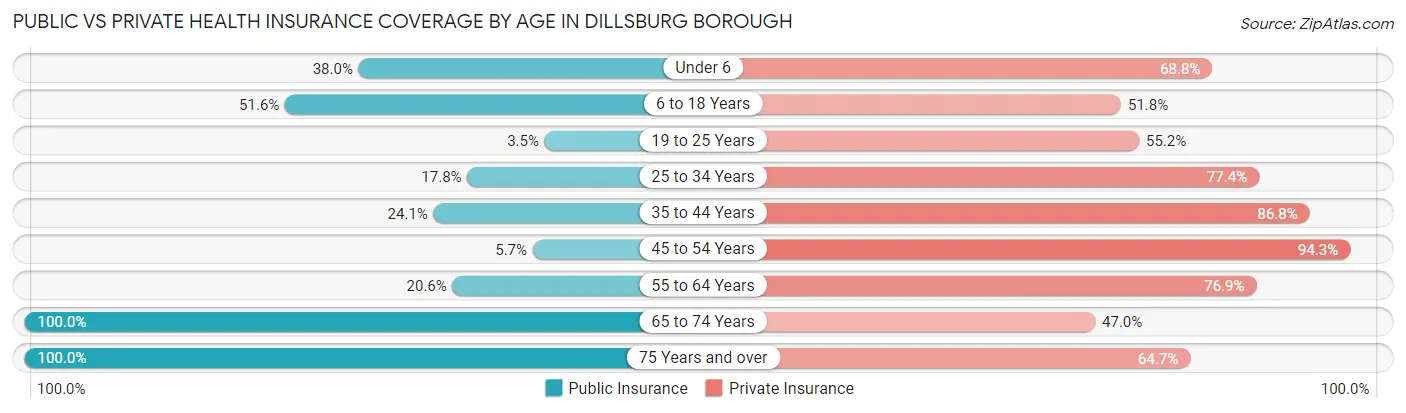
| Age Bracket | Public Insurance | Private Insurance |
| Under 6 | 79 (38.0%) | 143 (68.8%) |
| 6 to 18 Years | 268 (51.6%) | 269 (51.8%) |
| 19 to 25 Years | 6 (3.5%) | 96 (55.2%) |
| 25 to 34 Years | 75 (17.8%) | 326 (77.4%) |
| 35 to 44 Years | 104 (24.1%) | 375 (86.8%) |
| 45 to 54 Years | 15 (5.7%) | 250 (94.3%) |
| 55 to 64 Years | 74 (20.6%) | 277 (76.9%) |
| 65 to 74 Years | 151 (100.0%) | 71 (47.0%) |
| 75 Years and over | 99 (100.0%) | 64 (64.6%) |
| Total | 871 (33.1%) | 1,871 (71.2%) |
Disability Status by Sex by Age in Dillsburg borough
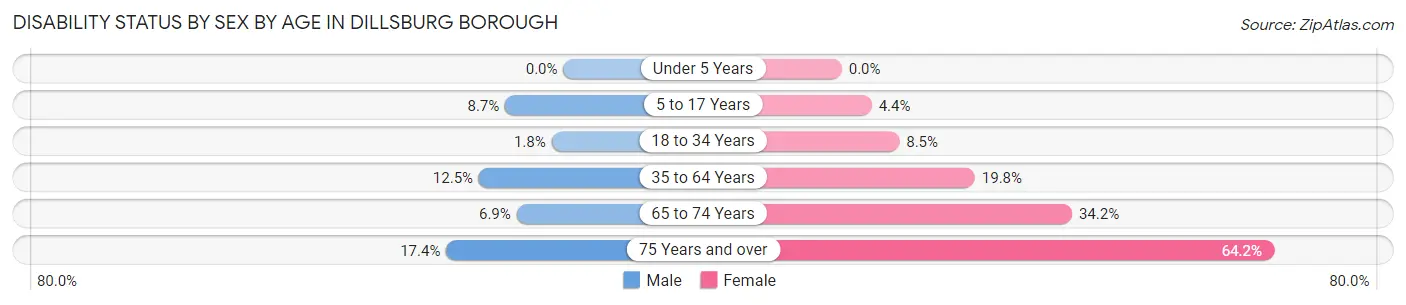
| Age Bracket | Male | Female |
| Under 5 Years | 0 (0.0%) | 0 (0.0%) |
| 5 to 17 Years | 18 (8.6%) | 15 (4.4%) |
| 18 to 34 Years | 5 (1.8%) | 27 (8.5%) |
| 35 to 64 Years | 71 (12.5%) | 97 (19.8%) |
| 65 to 74 Years | 5 (6.9%) | 27 (34.2%) |
| 75 Years and over | 8 (17.4%) | 34 (64.1%) |
Disability Class by Sex by Age in Dillsburg borough
Disability Class: Hearing Difficulty
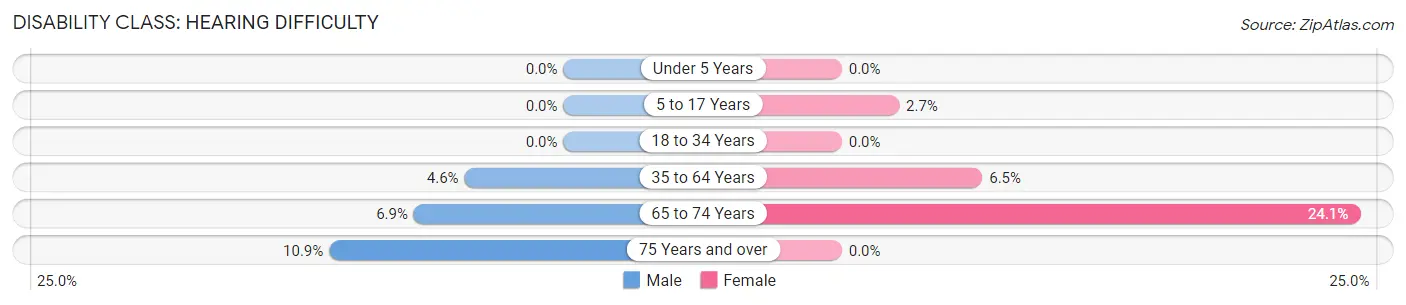
| Age Bracket | Male | Female |
| Under 5 Years | 0 (0.0%) | 0 (0.0%) |
| 5 to 17 Years | 0 (0.0%) | 9 (2.7%) |
| 18 to 34 Years | 0 (0.0%) | 0 (0.0%) |
| 35 to 64 Years | 26 (4.6%) | 32 (6.5%) |
| 65 to 74 Years | 5 (6.9%) | 19 (24.0%) |
| 75 Years and over | 5 (10.9%) | 0 (0.0%) |
Disability Class: Vision Difficulty
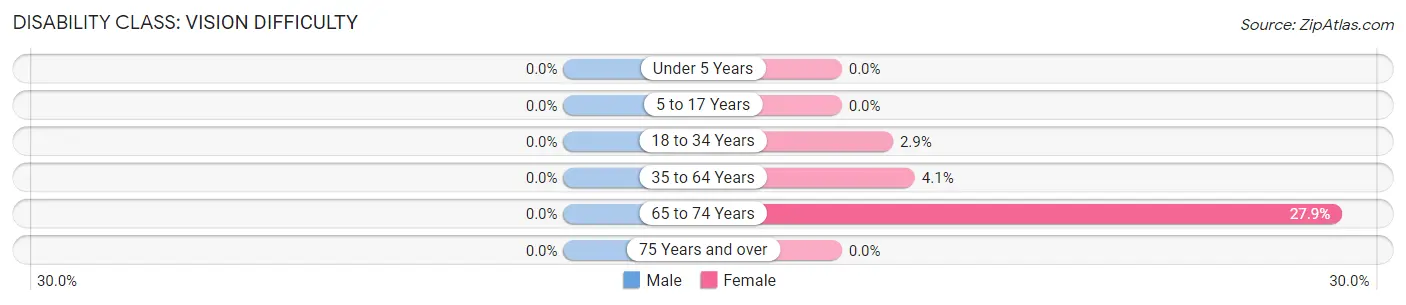
| Age Bracket | Male | Female |
| Under 5 Years | 0 (0.0%) | 0 (0.0%) |
| 5 to 17 Years | 0 (0.0%) | 0 (0.0%) |
| 18 to 34 Years | 0 (0.0%) | 9 (2.9%) |
| 35 to 64 Years | 0 (0.0%) | 20 (4.1%) |
| 65 to 74 Years | 0 (0.0%) | 22 (27.9%) |
| 75 Years and over | 0 (0.0%) | 0 (0.0%) |
Disability Class: Cognitive Difficulty
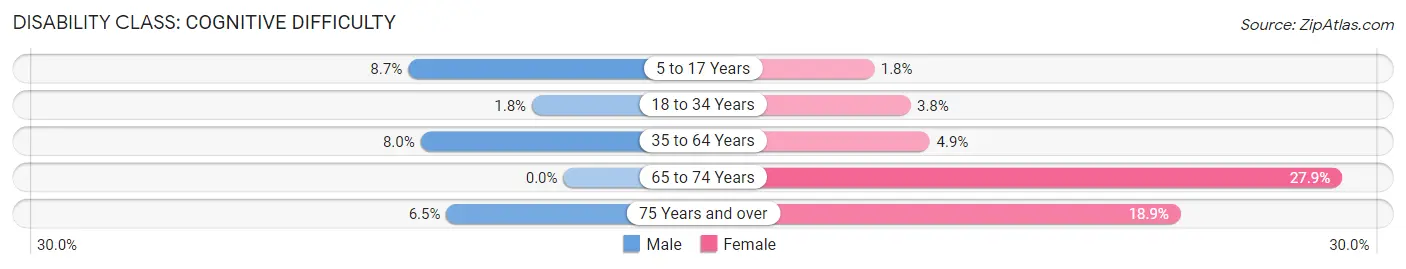
| Age Bracket | Male | Female |
| 5 to 17 Years | 18 (8.6%) | 6 (1.8%) |
| 18 to 34 Years | 5 (1.8%) | 12 (3.8%) |
| 35 to 64 Years | 45 (8.0%) | 24 (4.9%) |
| 65 to 74 Years | 0 (0.0%) | 22 (27.9%) |
| 75 Years and over | 3 (6.5%) | 10 (18.9%) |
Disability Class: Ambulatory Difficulty
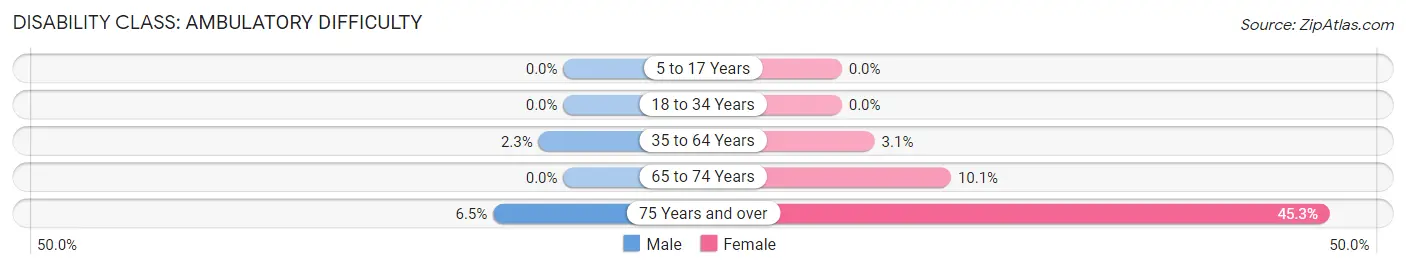
| Age Bracket | Male | Female |
| 5 to 17 Years | 0 (0.0%) | 0 (0.0%) |
| 18 to 34 Years | 0 (0.0%) | 0 (0.0%) |
| 35 to 64 Years | 13 (2.3%) | 15 (3.0%) |
| 65 to 74 Years | 0 (0.0%) | 8 (10.1%) |
| 75 Years and over | 3 (6.5%) | 24 (45.3%) |
Disability Class: Self-Care Difficulty
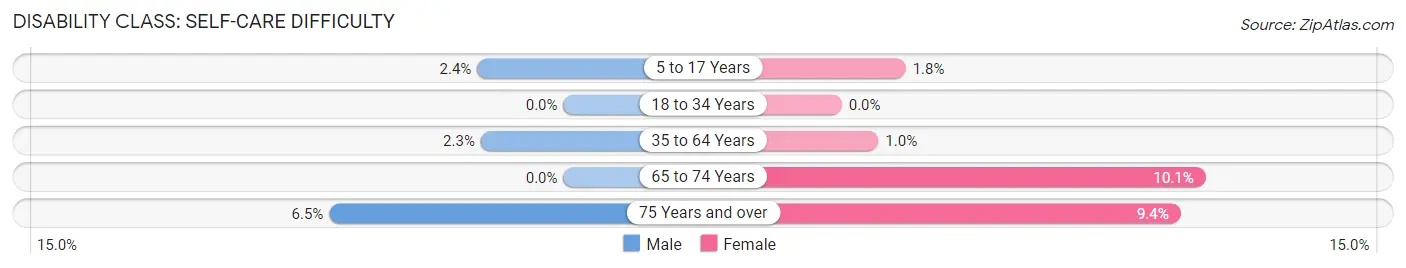
| Age Bracket | Male | Female |
| 5 to 17 Years | 5 (2.4%) | 6 (1.8%) |
| 18 to 34 Years | 0 (0.0%) | 0 (0.0%) |
| 35 to 64 Years | 13 (2.3%) | 5 (1.0%) |
| 65 to 74 Years | 0 (0.0%) | 8 (10.1%) |
| 75 Years and over | 3 (6.5%) | 5 (9.4%) |
Technology Access in Dillsburg borough
Computing Device Access in Dillsburg borough
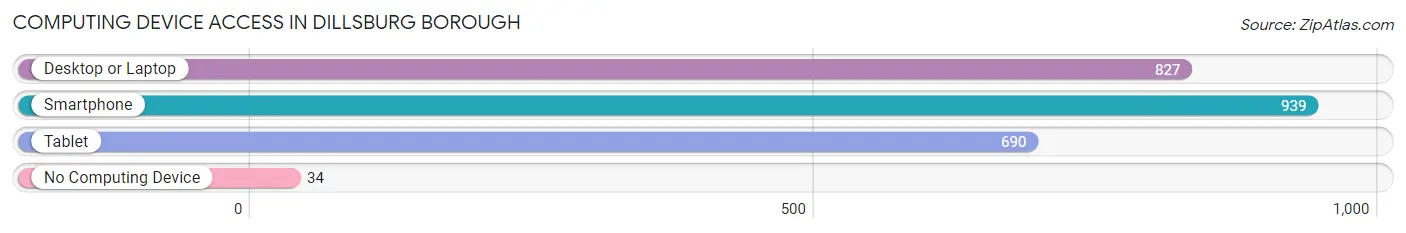
| Device Type | # Households | % Households |
| Desktop or Laptop | 827 | 80.8% |
| Smartphone | 939 | 91.8% |
| Tablet | 690 | 67.4% |
| No Computing Device | 34 | 3.3% |
| Total | 1,023 | 100.0% |
Internet Access in Dillsburg borough
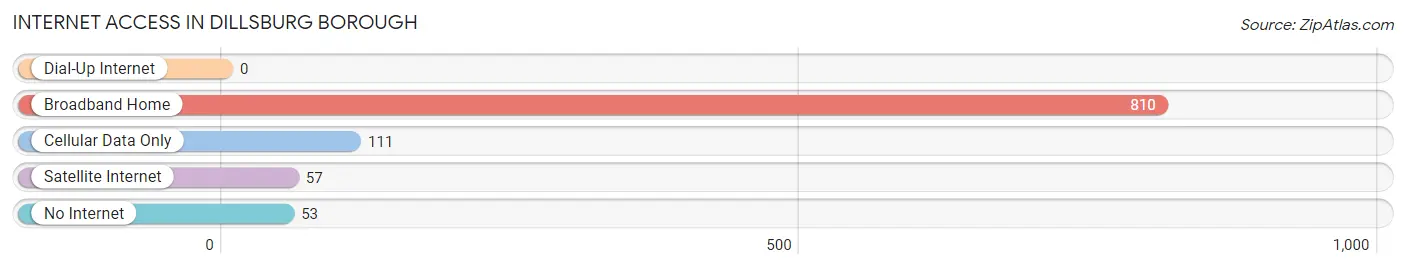
| Internet Type | # Households | % Households |
| Dial-Up Internet | 0 | 0.0% |
| Broadband Home | 810 | 79.2% |
| Cellular Data Only | 111 | 10.8% |
| Satellite Internet | 57 | 5.6% |
| No Internet | 53 | 5.2% |
| Total | 1,023 | 100.0% |
Dillsburg borough Summary
Dillsburg Borough is a small borough located in York County, Pennsylvania. It is situated in the northern part of the county, approximately 20 miles north of the state capital of Harrisburg. The borough is home to a population of approximately 2,000 people, and is part of the larger Dillsburg Area, which includes the surrounding townships of Carroll, Franklin, Monaghan, and Warrington.
History
The area that is now Dillsburg Borough was first settled in 1740 by a group of German immigrants led by John Dill. The group purchased a large tract of land from the local Native American tribes and established a small farming community. The town was originally known as Dillstown, and was officially incorporated as a borough in 1864.
The town was named after John Dill, who was a prominent local businessman and politician. He served as a member of the Pennsylvania House of Representatives from 1845 to 1848, and was a major contributor to the development of the town.
Geography
Dillsburg Borough is located in northern York County, approximately 20 miles north of Harrisburg. It is situated in the Appalachian Mountains, and is surrounded by rolling hills and farmland. The borough is located at the intersection of two major highways, U.S. Route 15 and Pennsylvania Route 74.
The borough covers an area of 1.2 square miles, and is home to a population of approximately 2,000 people. The town is served by the Dillsburg Area School District, which includes the borough and the surrounding townships of Carroll, Franklin, Monaghan, and Warrington.
Economy
The economy of Dillsburg Borough is largely based on agriculture and tourism. The town is home to several small businesses, including a variety of restaurants, shops, and services. The town is also home to a number of small manufacturing companies, including a plastics factory and a metal fabrication plant.
The town is also home to a number of tourist attractions, including the Dillsburg Farmers Fair, which is held annually in August. The fair features a variety of agricultural exhibits, carnival rides, and live entertainment.
Demographics
As of the 2010 census, the population of Dillsburg Borough was 2,039. The racial makeup of the borough was 97.2% White, 0.7% African American, 0.3% Native American, 0.4% Asian, 0.1% Pacific Islander, 0.3% from other races, and 1.0% from two or more races. Hispanic or Latino of any race were 1.2% of the population.
The median household income in Dillsburg Borough was $50,938, and the median family income was $60,938. The per capita income for the borough was $25,938. About 6.2% of families and 8.2% of the population were below the poverty line, including 10.2% of those under age 18 and 5.2% of those age 65 or over.
Common Questions
What is Per Capita Income in Dillsburg borough?
Per Capita income in Dillsburg borough is $35,704.
What is the Median Family Income in Dillsburg borough?
Median Family Income in Dillsburg borough is $96,875.
What is the Median Household income in Dillsburg borough?
Median Household Income in Dillsburg borough is $78,674.
What is Income or Wage Gap in Dillsburg borough?
Income or Wage Gap in Dillsburg borough is 29.3%.
Women in Dillsburg borough earn 70.7 cents for every dollar earned by a man.
What is Inequality or Gini Index in Dillsburg borough?
Inequality or Gini Index in Dillsburg borough is 0.37.
What is the Total Population of Dillsburg borough?
Total Population of Dillsburg borough is 2,629.
What is the Total Male Population of Dillsburg borough?
Total Male Population of Dillsburg borough is 1,243.
What is the Total Female Population of Dillsburg borough?
Total Female Population of Dillsburg borough is 1,386.
What is the Ratio of Males per 100 Females in Dillsburg borough?
There are 89.68 Males per 100 Females in Dillsburg borough.
What is the Ratio of Females per 100 Males in Dillsburg borough?
There are 111.50 Females per 100 Males in Dillsburg borough.
What is the Median Population Age in Dillsburg borough?
Median Population Age in Dillsburg borough is 34.3 Years.
What is the Average Family Size in Dillsburg borough
Average Family Size in Dillsburg borough is 3.1 People.
What is the Average Household Size in Dillsburg borough
Average Household Size in Dillsburg borough is 2.6 People.
How Large is the Labor Force in Dillsburg borough?
There are 1,559 People in the Labor Forcein in Dillsburg borough.
What is the Percentage of People in the Labor Force in Dillsburg borough?
78.3% of People are in the Labor Force in Dillsburg borough.
What is the Unemployment Rate in Dillsburg borough?
Unemployment Rate in Dillsburg borough is 4.4%.