East Brady borough, PA Map & Demographics
East Brady borough Overview
$32,293
PER CAPITA INCOME
$94,167
AVG FAMILY INCOME
$59,375
AVG HOUSEHOLD INCOME
43.7%
WAGE / INCOME GAP [ % ]
56.3¢/ $1
WAGE / INCOME GAP [ $ ]
0.43
INEQUALITY / GINI INDEX
1,072
TOTAL POPULATION
551
MALE POPULATION
521
FEMALE POPULATION
105.76
MALES / 100 FEMALES
94.56
FEMALES / 100 MALES
41.1
MEDIAN AGE
3.1
AVG FAMILY SIZE
2.4
AVG HOUSEHOLD SIZE
508
LABOR FORCE [ PEOPLE ]
57.2%
PERCENT IN LABOR FORCE
5.1%
UNEMPLOYMENT RATE
Income in East Brady borough
Income Overview in East Brady borough
Per Capita Income in East Brady borough is $32,293, while median incomes of families and households are $94,167 and $59,375 respectively.
| Characteristic | Number | Measure |
| Per Capita Income | 1,072 | $32,293 |
| Median Family Income | 258 | $94,167 |
| Mean Family Income | 258 | $103,396 |
| Median Household Income | 440 | $59,375 |
| Mean Household Income | 440 | $75,407 |
| Income Deficit | 258 | $0 |
| Wage / Income Gap (%) | 1,072 | 43.72% |
| Wage / Income Gap ($) | 1,072 | 56.28¢ per $1 |
| Gini / Inequality Index | 1,072 | 0.43 |
Earnings by Sex in East Brady borough
Average Earnings in East Brady borough are $47,685, $53,750 for men and $30,250 for women, a difference of 43.7%.
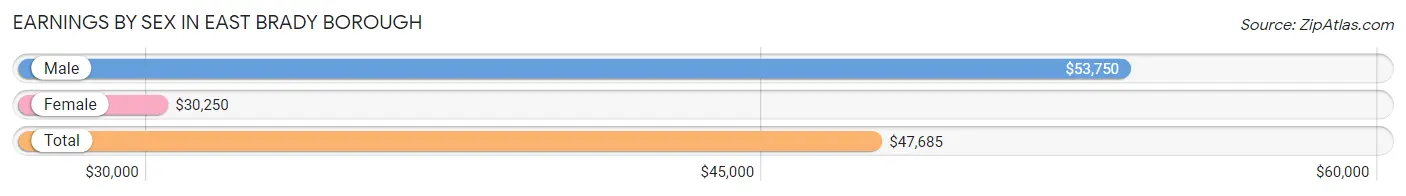
| Sex | Number | Average Earnings |
| Male | 319 (61.4%) | $53,750 |
| Female | 201 (38.7%) | $30,250 |
| Total | 520 (100.0%) | $47,685 |
Earnings by Sex by Income Bracket in East Brady borough
The most common earnings brackets in East Brady borough are $55,000 to $64,999 for men (52 | 16.3%) and $5,000 to $7,499 for women (23 | 11.4%).
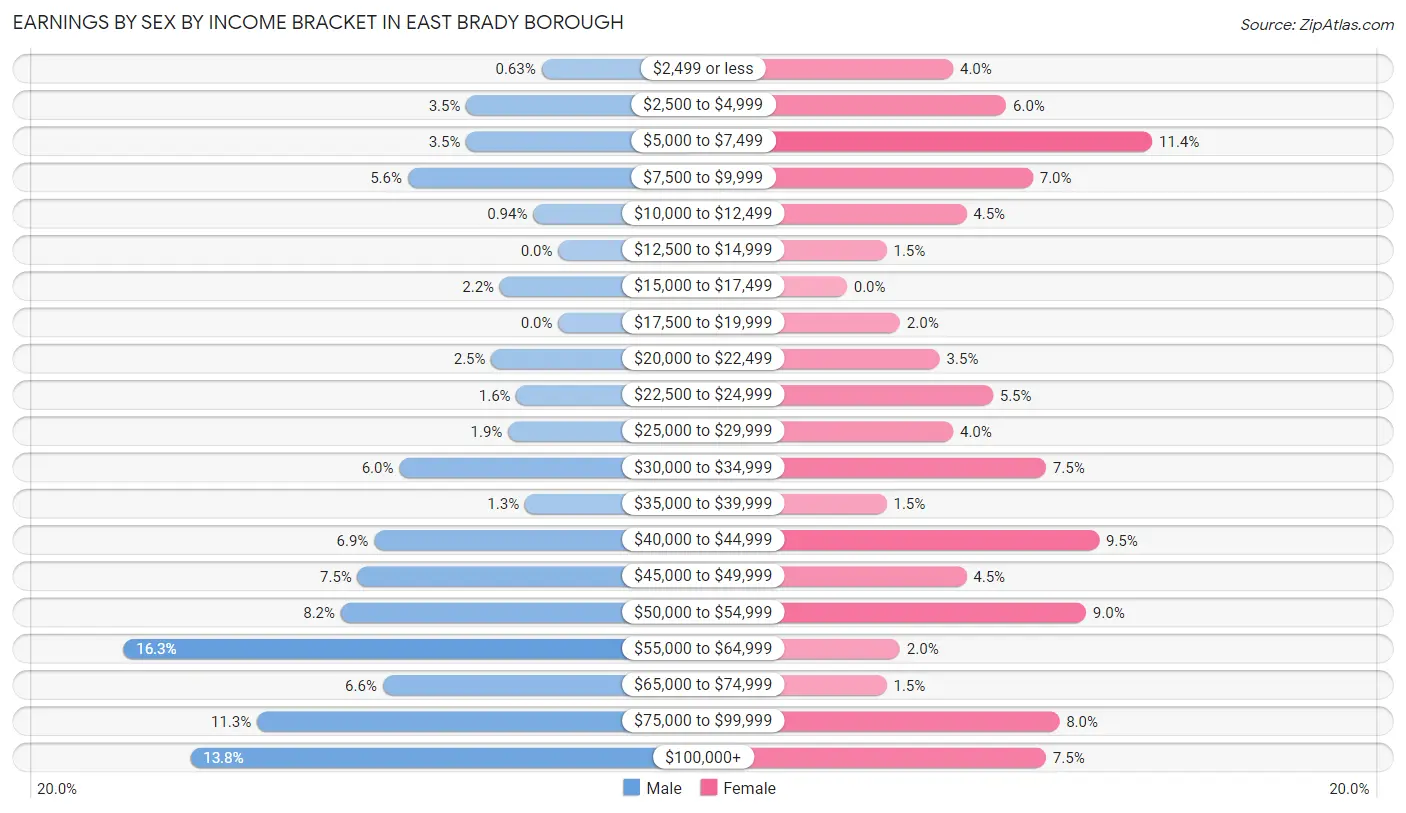
| Income | Male | Female |
| $2,499 or less | 2 (0.6%) | 8 (4.0%) |
| $2,500 to $4,999 | 11 (3.5%) | 12 (6.0%) |
| $5,000 to $7,499 | 11 (3.5%) | 23 (11.4%) |
| $7,500 to $9,999 | 18 (5.6%) | 14 (7.0%) |
| $10,000 to $12,499 | 3 (0.9%) | 9 (4.5%) |
| $12,500 to $14,999 | 0 (0.0%) | 3 (1.5%) |
| $15,000 to $17,499 | 7 (2.2%) | 0 (0.0%) |
| $17,500 to $19,999 | 0 (0.0%) | 4 (2.0%) |
| $20,000 to $22,499 | 8 (2.5%) | 7 (3.5%) |
| $22,500 to $24,999 | 5 (1.6%) | 11 (5.5%) |
| $25,000 to $29,999 | 6 (1.9%) | 8 (4.0%) |
| $30,000 to $34,999 | 19 (6.0%) | 15 (7.5%) |
| $35,000 to $39,999 | 4 (1.3%) | 3 (1.5%) |
| $40,000 to $44,999 | 22 (6.9%) | 19 (9.5%) |
| $45,000 to $49,999 | 24 (7.5%) | 9 (4.5%) |
| $50,000 to $54,999 | 26 (8.2%) | 18 (9.0%) |
| $55,000 to $64,999 | 52 (16.3%) | 4 (2.0%) |
| $65,000 to $74,999 | 21 (6.6%) | 3 (1.5%) |
| $75,000 to $99,999 | 36 (11.3%) | 16 (8.0%) |
| $100,000+ | 44 (13.8%) | 15 (7.5%) |
| Total | 319 (100.0%) | 201 (100.0%) |
Earnings by Sex by Educational Attainment in East Brady borough
Average earnings in East Brady borough are $54,712 for men and $31,917 for women, a difference of 41.7%. Men with an educational attainment of high school diploma enjoy the highest average annual earnings of $49,028, while those with college or associate's degree education earn the least with $47,083. Women with an educational attainment of bachelor's degree earn the most with the average annual earnings of $51,136, while those with college or associate's degree education have the smallest earnings of $31,458.
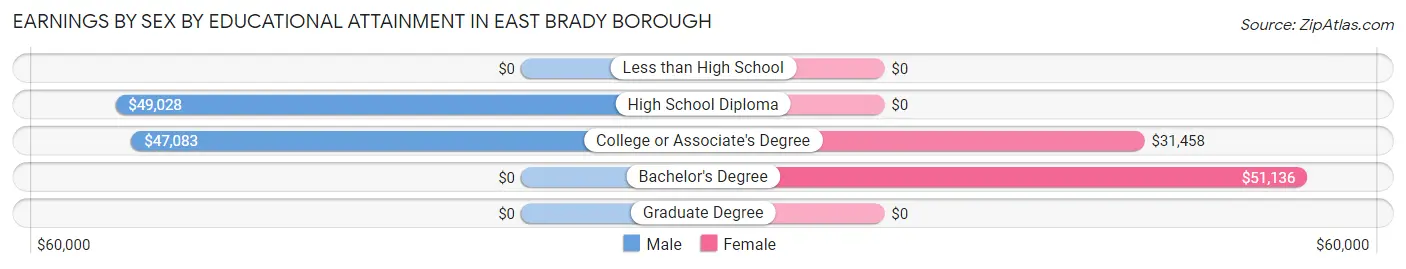
| Educational Attainment | Male Income | Female Income |
| Less than High School | - | - |
| High School Diploma | $49,028 | $0 |
| College or Associate's Degree | $47,083 | $31,458 |
| Bachelor's Degree | - | - |
| Graduate Degree | - | - |
| Total | $54,712 | $31,917 |
Family Income in East Brady borough
Family Income Brackets in East Brady borough
According to the East Brady borough family income data, there are 63 families falling into the $50,000 to $74,999 income range, which is the most common income bracket and makes up 24.4% of all families.
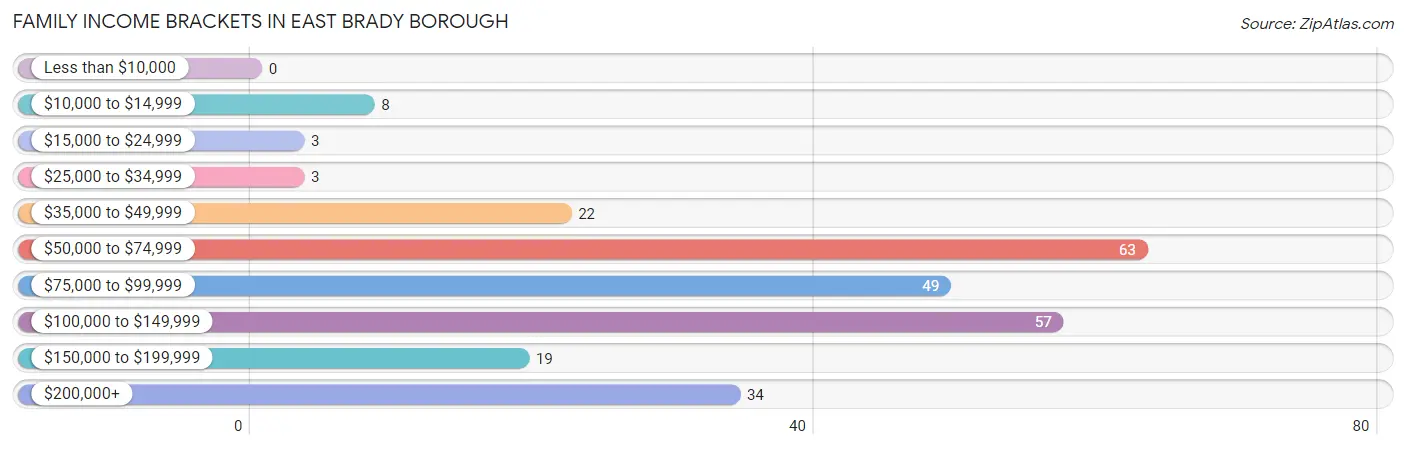
| Income Bracket | # Families | % Families |
| Less than $10,000 | 0 | 0.0% |
| $10,000 to $14,999 | 8 | 3.1% |
| $15,000 to $24,999 | 3 | 1.2% |
| $25,000 to $34,999 | 3 | 1.2% |
| $35,000 to $49,999 | 22 | 8.5% |
| $50,000 to $74,999 | 63 | 24.4% |
| $75,000 to $99,999 | 49 | 19.0% |
| $100,000 to $149,999 | 57 | 22.1% |
| $150,000 to $199,999 | 19 | 7.4% |
| $200,000+ | 34 | 13.2% |
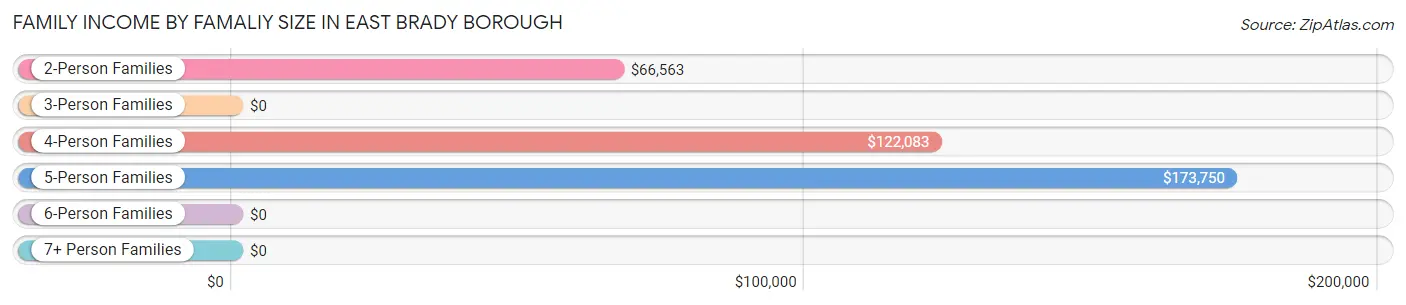
Family Income by Famaliy Size in East Brady borough
5-person families (17 | 6.6%) account for the highest median family income in East Brady borough with $173,750 per family, while 5-person families (17 | 6.6%) have the highest median income of $34,750 per family member.
| Income Bracket | # Families | Median Income |
| 2-Person Families | 107 (41.5%) | $66,563 |
| 3-Person Families | 53 (20.5%) | $0 |
| 4-Person Families | 77 (29.8%) | $122,083 |
| 5-Person Families | 17 (6.6%) | $173,750 |
| 6-Person Families | 4 (1.5%) | $0 |
| 7+ Person Families | 0 (0.0%) | $0 |
| Total | 258 (100.0%) | $94,167 |
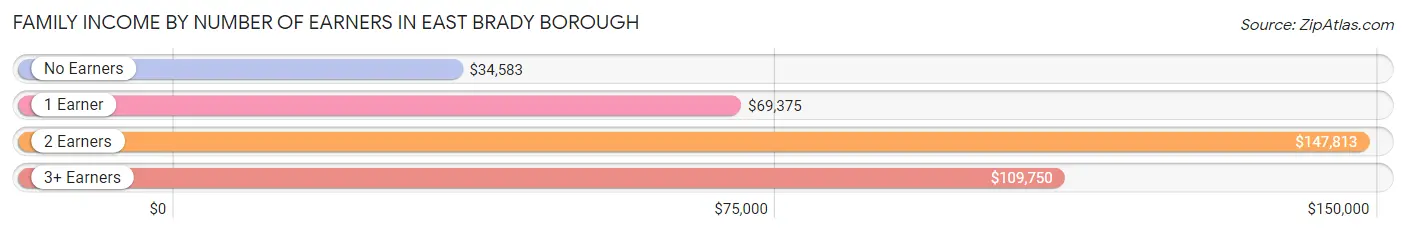
Family Income by Number of Earners in East Brady borough
The median family income in East Brady borough is $94,167, with families comprising 2 earners (99) having the highest median family income of $147,813, while families with no earners (17) have the lowest median family income of $34,583, accounting for 38.4% and 6.6% of families, respectively.
| Number of Earners | # Families | Median Income |
| No Earners | 17 (6.6%) | $34,583 |
| 1 Earner | 110 (42.6%) | $69,375 |
| 2 Earners | 99 (38.4%) | $147,813 |
| 3+ Earners | 32 (12.4%) | $109,750 |
| Total | 258 (100.0%) | $94,167 |
Household Income in East Brady borough
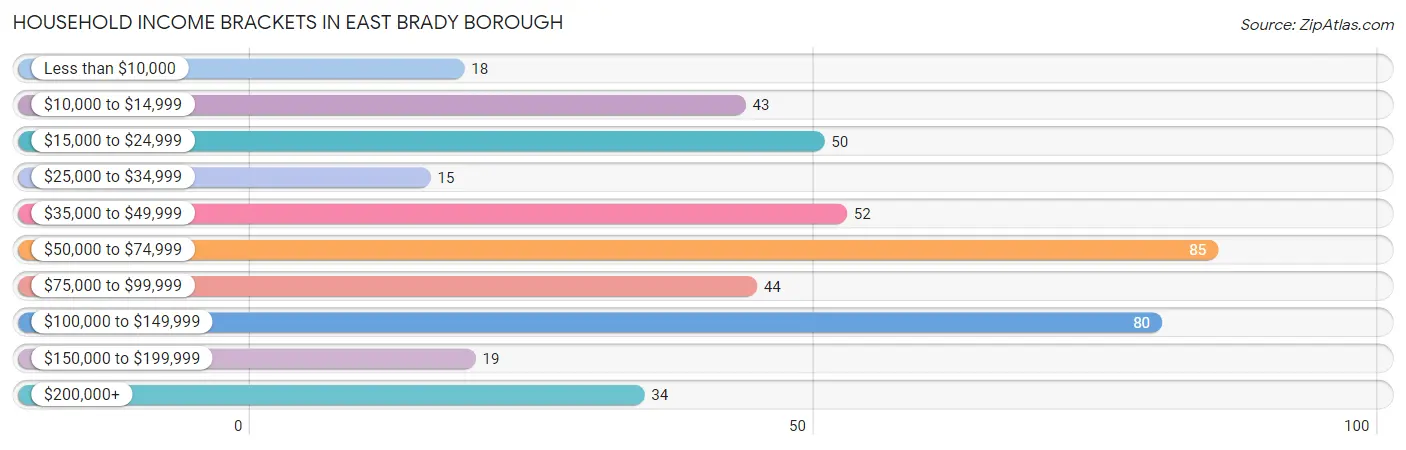
Household Income Brackets in East Brady borough
With 85 households falling in the category, the $50,000 to $74,999 income range is the most frequent in East Brady borough, accounting for 19.3% of all households. In contrast, only 15 households (3.4%) fall into the $25,000 to $34,999 income bracket, making it the least populous group.
| Income Bracket | # Households | % Households |
| Less than $10,000 | 18 | 4.1% |
| $10,000 to $14,999 | 43 | 9.8% |
| $15,000 to $24,999 | 50 | 11.4% |
| $25,000 to $34,999 | 15 | 3.4% |
| $35,000 to $49,999 | 52 | 11.8% |
| $50,000 to $74,999 | 85 | 19.3% |
| $75,000 to $99,999 | 44 | 10.0% |
| $100,000 to $149,999 | 80 | 18.2% |
| $150,000 to $199,999 | 19 | 4.3% |
| $200,000+ | 34 | 7.7% |
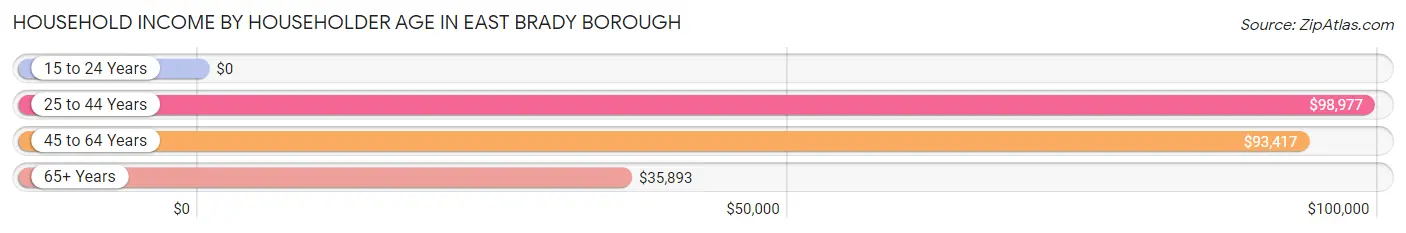
Household Income by Householder Age in East Brady borough
The median household income in East Brady borough is $59,375, with the highest median household income of $98,977 found in the 25 to 44 years age bracket for the primary householder. A total of 125 households (28.4%) fall into this category.
| Income Bracket | # Households | Median Income |
| 15 to 24 Years | 0 (0.0%) | $0 |
| 25 to 44 Years | 125 (28.4%) | $98,977 |
| 45 to 64 Years | 149 (33.9%) | $93,417 |
| 65+ Years | 166 (37.7%) | $35,893 |
| Total | 440 (100.0%) | $59,375 |
Poverty in East Brady borough
Income Below Poverty by Sex and Age in East Brady borough
With 3.6% poverty level for males and 16.5% for females among the residents of East Brady borough, 12 to 14 year old males and 75 year old and over females are the most vulnerable to poverty, with 5 males (22.7%) and 15 females (31.2%) in their respective age groups living below the poverty level.
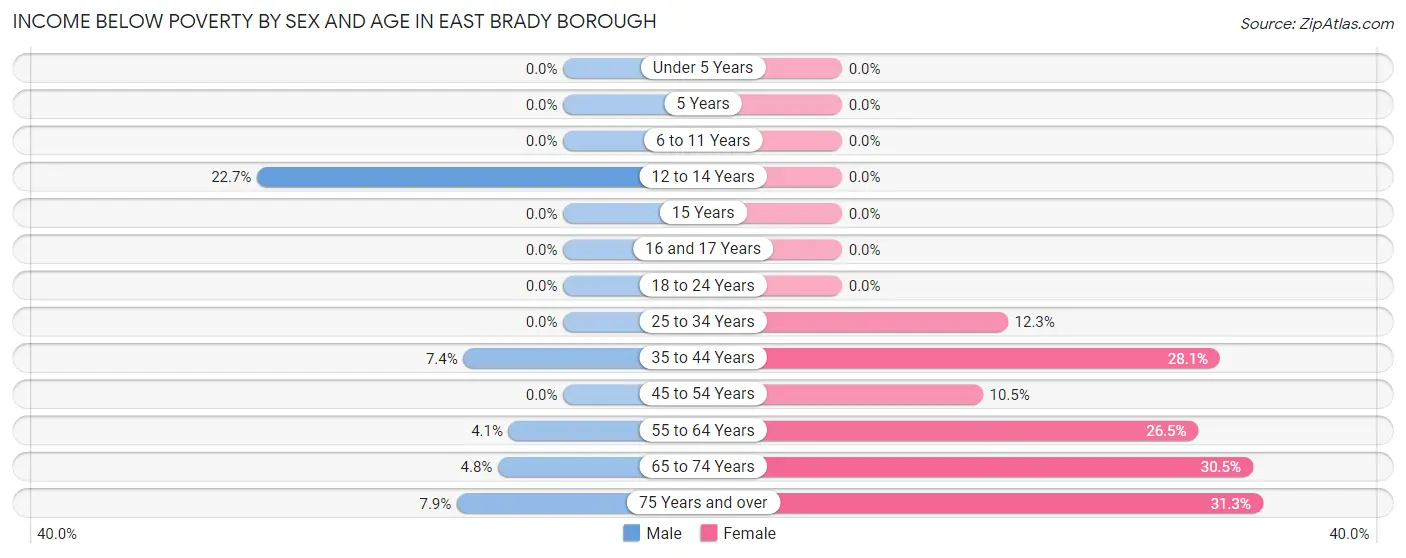
| Age Bracket | Male | Female |
| Under 5 Years | 0 (0.0%) | 0 (0.0%) |
| 5 Years | 0 (0.0%) | 0 (0.0%) |
| 6 to 11 Years | 0 (0.0%) | 0 (0.0%) |
| 12 to 14 Years | 5 (22.7%) | 0 (0.0%) |
| 15 Years | 0 (0.0%) | 0 (0.0%) |
| 16 and 17 Years | 0 (0.0%) | 0 (0.0%) |
| 18 to 24 Years | 0 (0.0%) | 0 (0.0%) |
| 25 to 34 Years | 0 (0.0%) | 8 (12.3%) |
| 35 to 44 Years | 6 (7.4%) | 16 (28.1%) |
| 45 to 54 Years | 0 (0.0%) | 7 (10.4%) |
| 55 to 64 Years | 3 (4.1%) | 18 (26.5%) |
| 65 to 74 Years | 3 (4.8%) | 18 (30.5%) |
| 75 Years and over | 3 (7.9%) | 15 (31.2%) |
| Total | 20 (3.6%) | 82 (16.5%) |
Income Above Poverty by Sex and Age in East Brady borough
According to the poverty statistics in East Brady borough, males aged under 5 years and females aged under 5 years are the age groups that are most secure financially, with 100.0% of males and 100.0% of females in these age groups living above the poverty line.
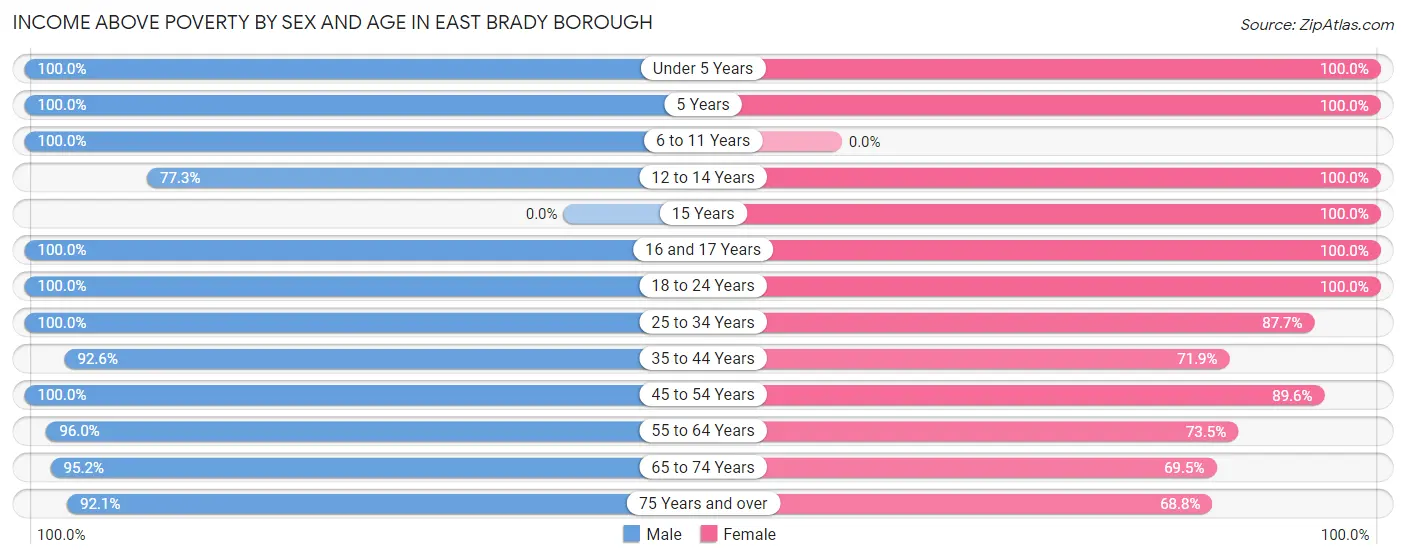
| Age Bracket | Male | Female |
| Under 5 Years | 25 (100.0%) | 40 (100.0%) |
| 5 Years | 3 (100.0%) | 4 (100.0%) |
| 6 to 11 Years | 38 (100.0%) | 0 (0.0%) |
| 12 to 14 Years | 17 (77.3%) | 30 (100.0%) |
| 15 Years | 0 (0.0%) | 20 (100.0%) |
| 16 and 17 Years | 21 (100.0%) | 26 (100.0%) |
| 18 to 24 Years | 63 (100.0%) | 13 (100.0%) |
| 25 to 34 Years | 82 (100.0%) | 57 (87.7%) |
| 35 to 44 Years | 75 (92.6%) | 41 (71.9%) |
| 45 to 54 Years | 42 (100.0%) | 60 (89.5%) |
| 55 to 64 Years | 71 (96.0%) | 50 (73.5%) |
| 65 to 74 Years | 59 (95.2%) | 41 (69.5%) |
| 75 Years and over | 35 (92.1%) | 33 (68.8%) |
| Total | 531 (96.4%) | 415 (83.5%) |
Income Below Poverty Among Married-Couple Families in East Brady borough
The poverty statistics for married-couple families in East Brady borough show that 1.6% or 3 of the total 184 families live below the poverty line. Families with no children have the highest poverty rate of 3.1%, comprising of 3 families. On the other hand, families with 1 or 2 children have the lowest poverty rate of 0.0%, which includes 0 families.
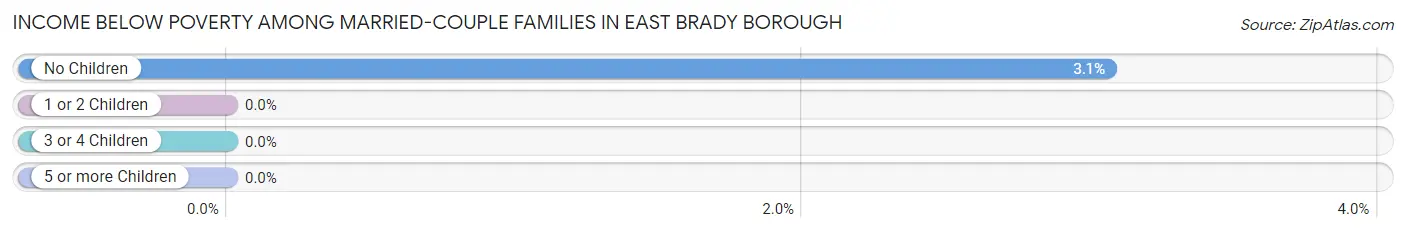
| Children | Above Poverty | Below Poverty |
| No Children | 95 (96.9%) | 3 (3.1%) |
| 1 or 2 Children | 72 (100.0%) | 0 (0.0%) |
| 3 or 4 Children | 14 (100.0%) | 0 (0.0%) |
| 5 or more Children | 0 (0.0%) | 0 (0.0%) |
| Total | 181 (98.4%) | 3 (1.6%) |
Income Below Poverty Among Single-Parent Households in East Brady borough
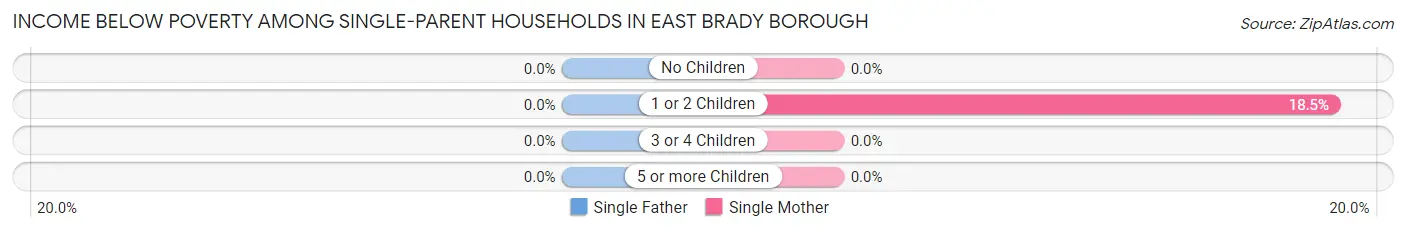
| Children | Single Father | Single Mother |
| No Children | 0 (0.0%) | 0 (0.0%) |
| 1 or 2 Children | 0 (0.0%) | 5 (18.5%) |
| 3 or 4 Children | 0 (0.0%) | 0 (0.0%) |
| 5 or more Children | 0 (0.0%) | 0 (0.0%) |
| Total | 0 (0.0%) | 5 (14.3%) |
Income Below Poverty Among Married-Couple vs Single-Parent Households in East Brady borough
The poverty data for East Brady borough shows that 3 of the married-couple family households (1.6%) and 5 of the single-parent households (6.8%) are living below the poverty level. Within the married-couple family households, those with no children have the highest poverty rate, with 3 households (3.1%) falling below the poverty line. Among the single-parent households, those with 1 or 2 children have the highest poverty rate, with 5 household (9.6%) living below poverty.
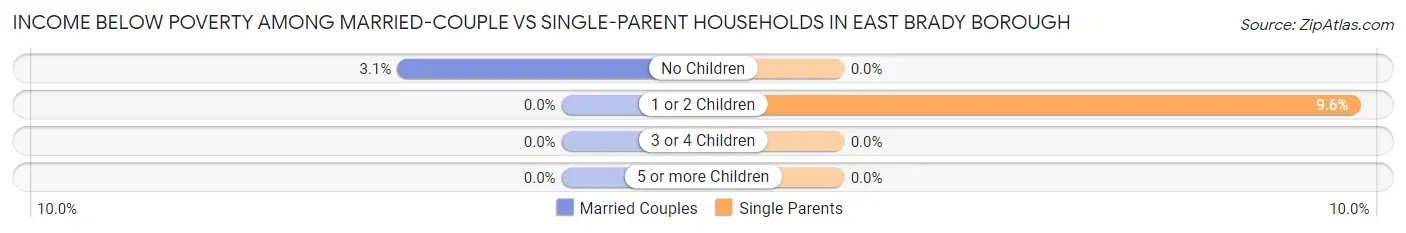
| Children | Married-Couple Families | Single-Parent Households |
| No Children | 3 (3.1%) | 0 (0.0%) |
| 1 or 2 Children | 0 (0.0%) | 5 (9.6%) |
| 3 or 4 Children | 0 (0.0%) | 0 (0.0%) |
| 5 or more Children | 0 (0.0%) | 0 (0.0%) |
| Total | 3 (1.6%) | 5 (6.8%) |
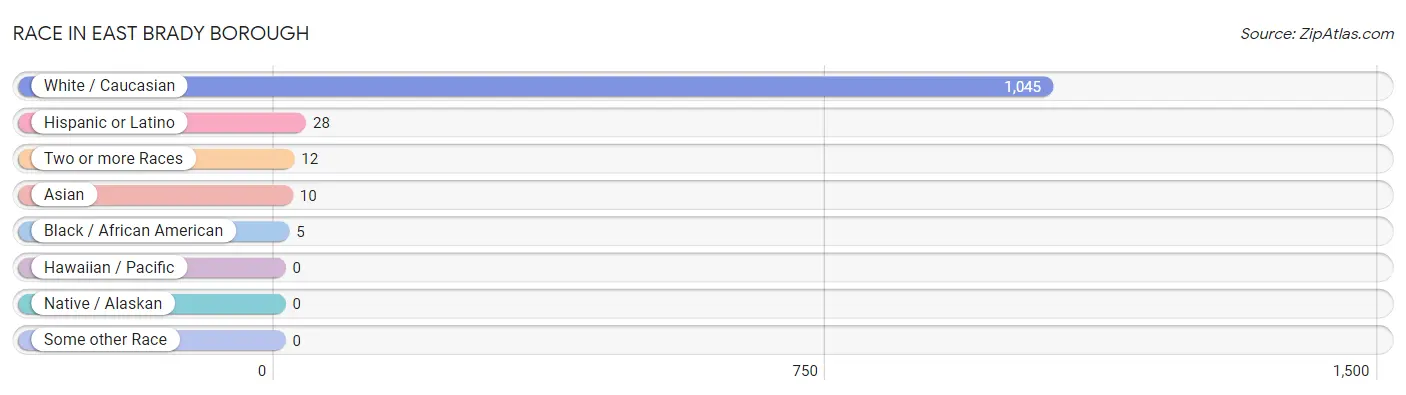
Race in East Brady borough
The most populous races in East Brady borough are White / Caucasian (1,045 | 97.5%), Hispanic or Latino (28 | 2.6%), and Two or more Races (12 | 1.1%).
| Race | # Population | % Population |
| Asian | 10 | 0.9% |
| Black / African American | 5 | 0.5% |
| Hawaiian / Pacific | 0 | 0.0% |
| Hispanic or Latino | 28 | 2.6% |
| Native / Alaskan | 0 | 0.0% |
| White / Caucasian | 1,045 | 97.5% |
| Two or more Races | 12 | 1.1% |
| Some other Race | 0 | 0.0% |
| Total | 1,072 | 100.0% |
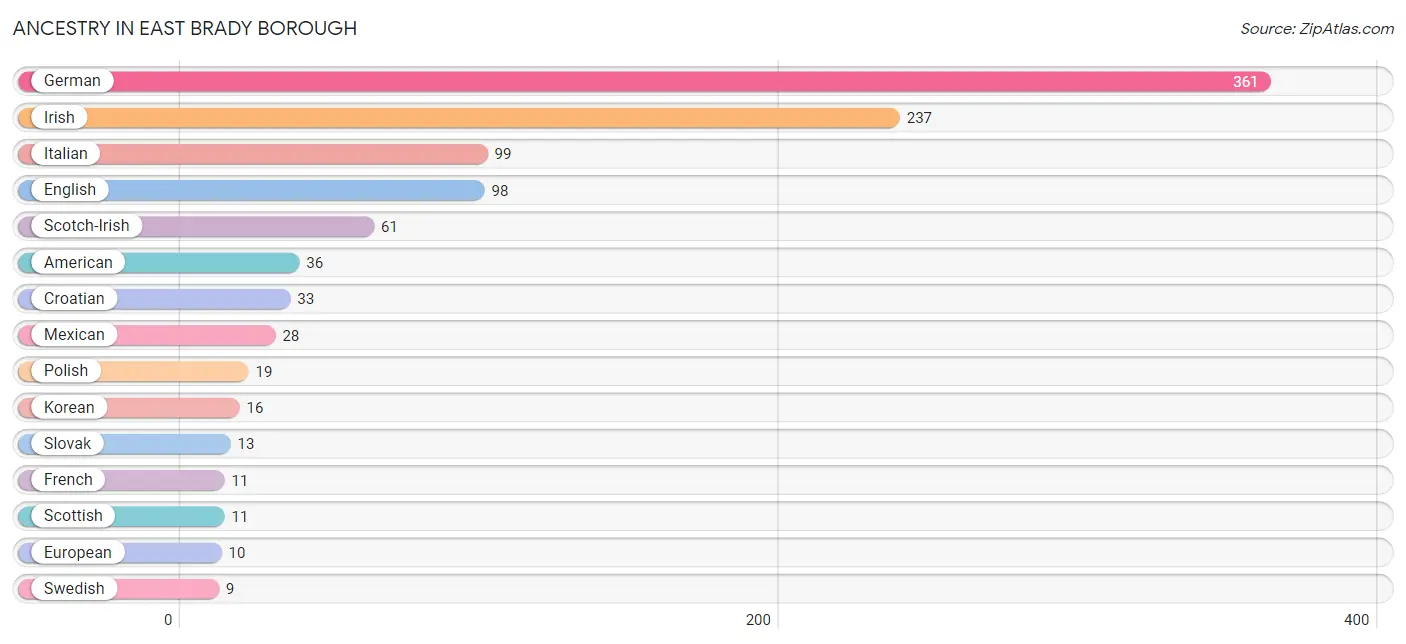
Ancestry in East Brady borough
The most populous ancestries reported in East Brady borough are German (361 | 33.7%), Irish (237 | 22.1%), Italian (99 | 9.2%), English (98 | 9.1%), and Scotch-Irish (61 | 5.7%), together accounting for 79.9% of all East Brady borough residents.
| Ancestry | # Population | % Population |
| American | 36 | 3.4% |
| Apache | 1 | 0.1% |
| Croatian | 33 | 3.1% |
| Dutch | 3 | 0.3% |
| English | 98 | 9.1% |
| European | 10 | 0.9% |
| French | 11 | 1.0% |
| German | 361 | 33.7% |
| Hungarian | 3 | 0.3% |
| Irish | 237 | 22.1% |
| Italian | 99 | 9.2% |
| Korean | 16 | 1.5% |
| Mexican | 28 | 2.6% |
| Pennsylvania German | 6 | 0.6% |
| Polish | 19 | 1.8% |
| Russian | 5 | 0.5% |
| Scotch-Irish | 61 | 5.7% |
| Scottish | 11 | 1.0% |
| Slavic | 3 | 0.3% |
| Slovak | 13 | 1.2% |
| Slovene | 4 | 0.4% |
| Swedish | 9 | 0.8% |
| Welsh | 7 | 0.6% | View All 23 Rows |
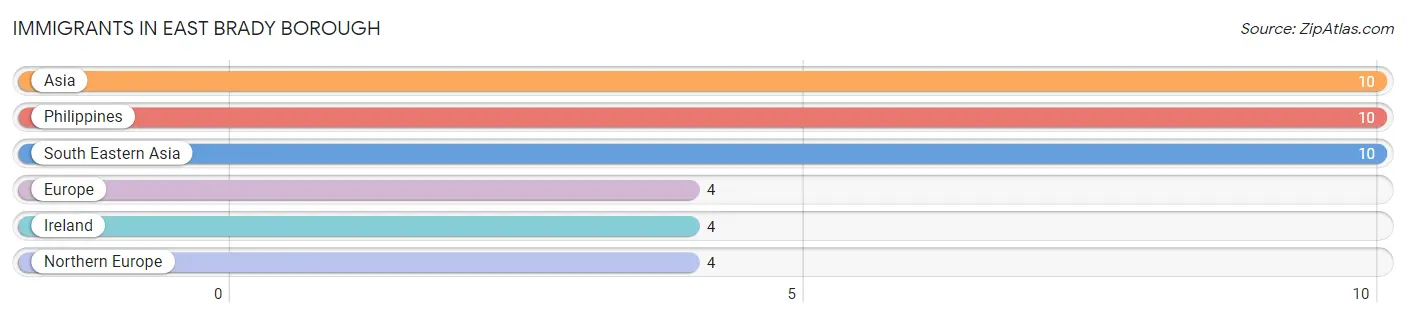
Immigrants in East Brady borough
The most numerous immigrant groups reported in East Brady borough came from Asia (10 | 0.9%), Philippines (10 | 0.9%), South Eastern Asia (10 | 0.9%), Europe (4 | 0.4%), and Ireland (4 | 0.4%), together accounting for 3.5% of all East Brady borough residents.
| Immigration Origin | # Population | % Population |
| Asia | 10 | 0.9% |
| Europe | 4 | 0.4% |
| Ireland | 4 | 0.4% |
| Northern Europe | 4 | 0.4% |
| Philippines | 10 | 0.9% |
| South Eastern Asia | 10 | 0.9% | View All 6 Rows |
Sex and Age in East Brady borough
Sex and Age in East Brady borough
The most populous age groups in East Brady borough are 20 to 24 Years (63 | 11.4%) for men and 15 to 19 Years (51 | 9.8%) for women.
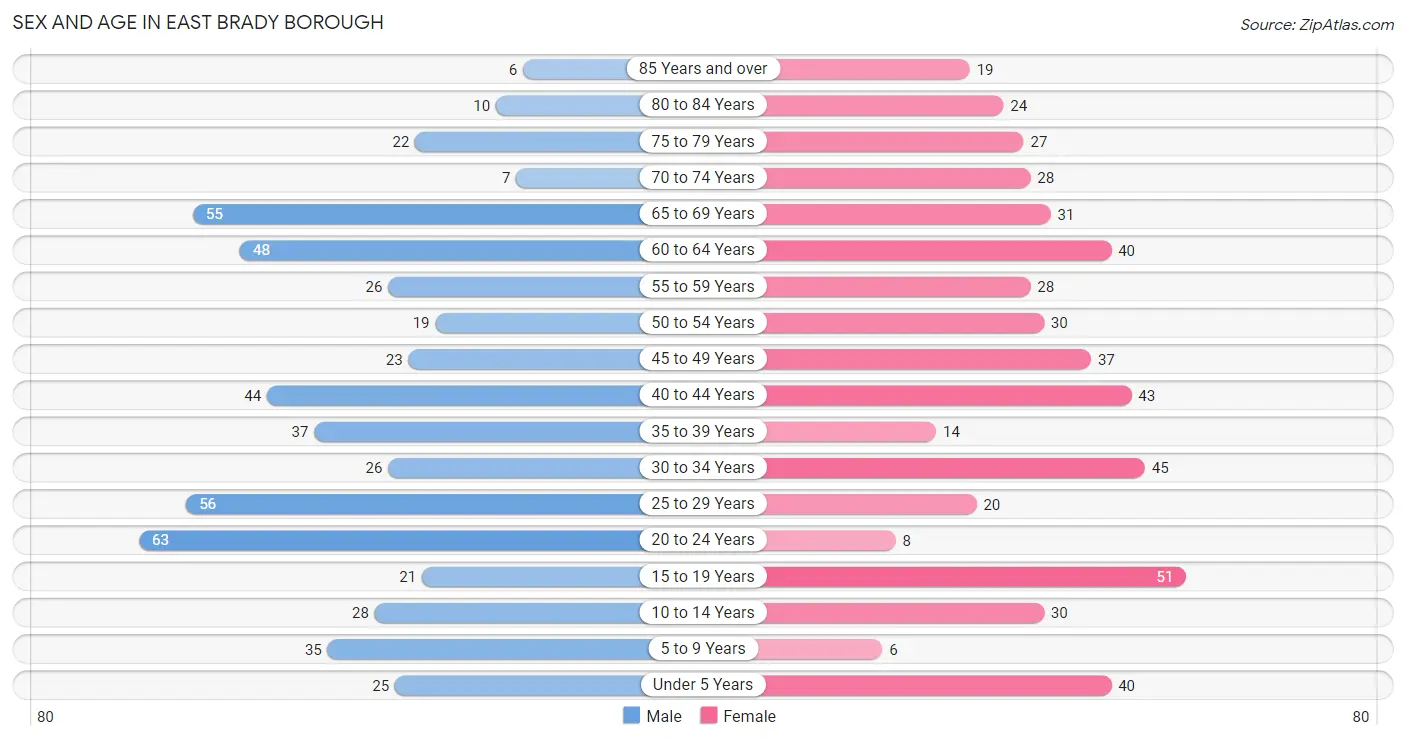
| Age Bracket | Male | Female |
| Under 5 Years | 25 (4.5%) | 40 (7.7%) |
| 5 to 9 Years | 35 (6.4%) | 6 (1.1%) |
| 10 to 14 Years | 28 (5.1%) | 30 (5.8%) |
| 15 to 19 Years | 21 (3.8%) | 51 (9.8%) |
| 20 to 24 Years | 63 (11.4%) | 8 (1.5%) |
| 25 to 29 Years | 56 (10.2%) | 20 (3.8%) |
| 30 to 34 Years | 26 (4.7%) | 45 (8.6%) |
| 35 to 39 Years | 37 (6.7%) | 14 (2.7%) |
| 40 to 44 Years | 44 (8.0%) | 43 (8.3%) |
| 45 to 49 Years | 23 (4.2%) | 37 (7.1%) |
| 50 to 54 Years | 19 (3.5%) | 30 (5.8%) |
| 55 to 59 Years | 26 (4.7%) | 28 (5.4%) |
| 60 to 64 Years | 48 (8.7%) | 40 (7.7%) |
| 65 to 69 Years | 55 (10.0%) | 31 (5.9%) |
| 70 to 74 Years | 7 (1.3%) | 28 (5.4%) |
| 75 to 79 Years | 22 (4.0%) | 27 (5.2%) |
| 80 to 84 Years | 10 (1.8%) | 24 (4.6%) |
| 85 Years and over | 6 (1.1%) | 19 (3.6%) |
| Total | 551 (100.0%) | 521 (100.0%) |
Families and Households in East Brady borough
Median Family Size in East Brady borough
The median family size in East Brady borough is 3.13 persons per family, with married-couple families (184 | 71.3%) accounting for the largest median family size of 3.52 persons per family. On the other hand, single female/mother families (35 | 13.6%) represent the smallest median family size with 2.11 persons per family.
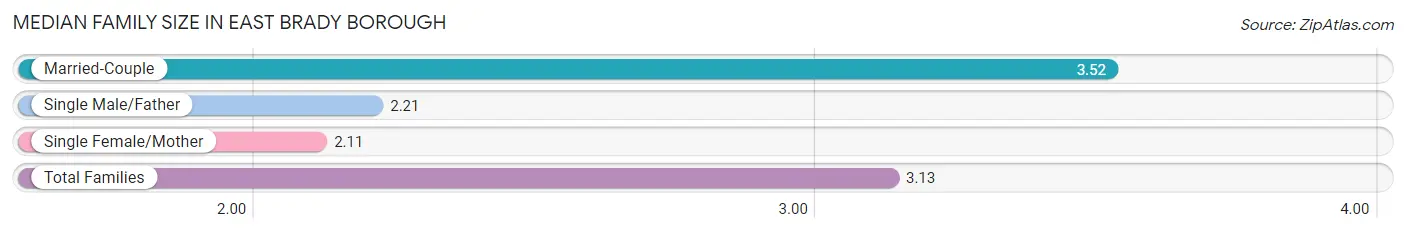
| Family Type | # Families | Family Size |
| Married-Couple | 184 (71.3%) | 3.52 |
| Single Male/Father | 39 (15.1%) | 2.21 |
| Single Female/Mother | 35 (13.6%) | 2.11 |
| Total Families | 258 (100.0%) | 3.13 |
Median Household Size in East Brady borough
The median household size in East Brady borough is 2.36 persons per household, with married-couple households (184 | 41.8%) accounting for the largest median household size of 3.52 persons per household. non-family households (182 | 41.4%) represent the smallest median household size with 1.12 persons per household.
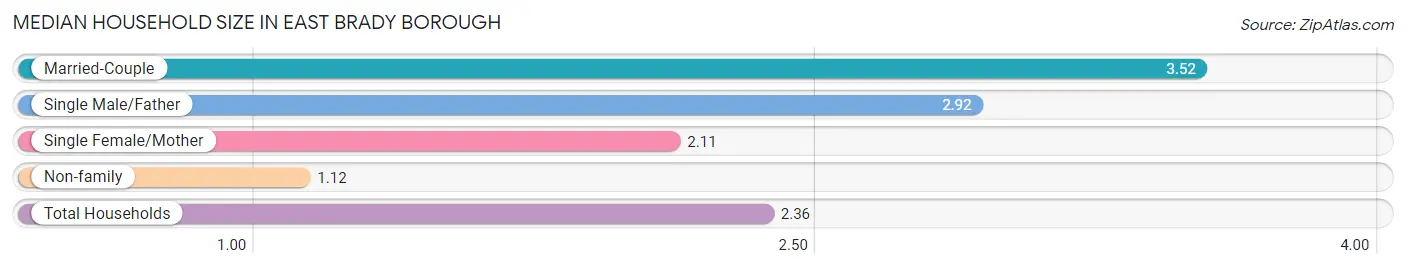
| Household Type | # Households | Household Size |
| Married-Couple | 184 (41.8%) | 3.52 |
| Single Male/Father | 39 (8.9%) | 2.92 |
| Single Female/Mother | 35 (8.0%) | 2.11 |
| Non-family | 182 (41.4%) | 1.12 |
| Total Households | 440 (100.0%) | 2.36 |
Household Size by Marriage Status in East Brady borough
Out of a total of 440 households in East Brady borough, 258 (58.6%) are family households, while 182 (41.4%) are nonfamily households. The most numerous type of family households are 2-person households, comprising 84, and the most common type of nonfamily households are 1-person households, comprising 164.
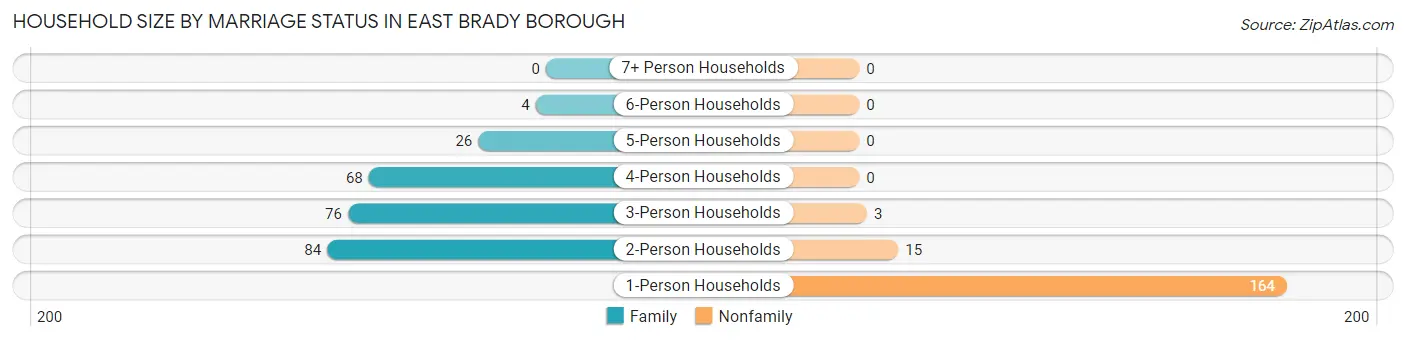
| Household Size | Family Households | Nonfamily Households |
| 1-Person Households | - | 164 (37.3%) |
| 2-Person Households | 84 (19.1%) | 15 (3.4%) |
| 3-Person Households | 76 (17.3%) | 3 (0.7%) |
| 4-Person Households | 68 (15.4%) | 0 (0.0%) |
| 5-Person Households | 26 (5.9%) | 0 (0.0%) |
| 6-Person Households | 4 (0.9%) | 0 (0.0%) |
| 7+ Person Households | 0 (0.0%) | 0 (0.0%) |
| Total | 258 (58.6%) | 182 (41.4%) |
Female Fertility in East Brady borough
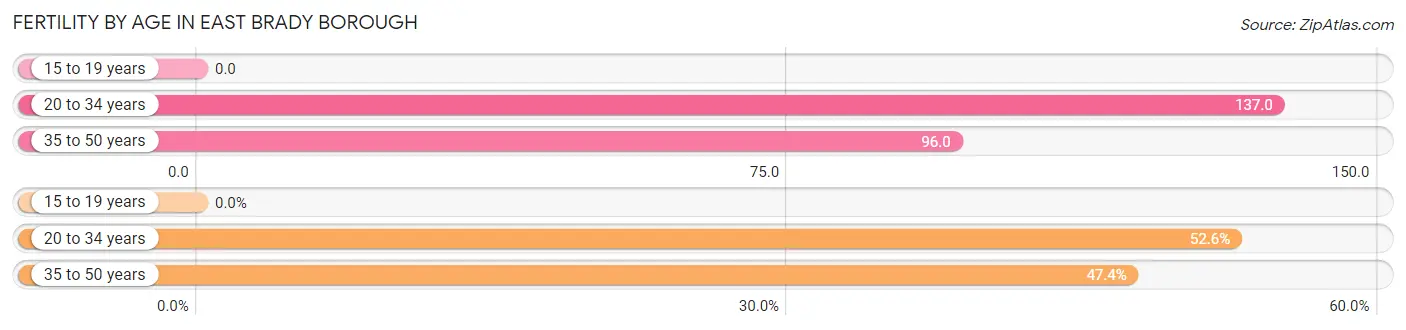
Fertility by Age in East Brady borough
Average fertility rate in East Brady borough is 87.0 births per 1,000 women. Women in the age bracket of 20 to 34 years have the highest fertility rate with 137.0 births per 1,000 women. Women in the age bracket of 20 to 34 years acount for 52.6% of all women with births.
| Age Bracket | Women with Births | Births / 1,000 Women |
| 15 to 19 years | 0 (0.0%) | 0.0 |
| 20 to 34 years | 10 (52.6%) | 137.0 |
| 35 to 50 years | 9 (47.4%) | 96.0 |
| Total | 19 (100.0%) | 87.0 |
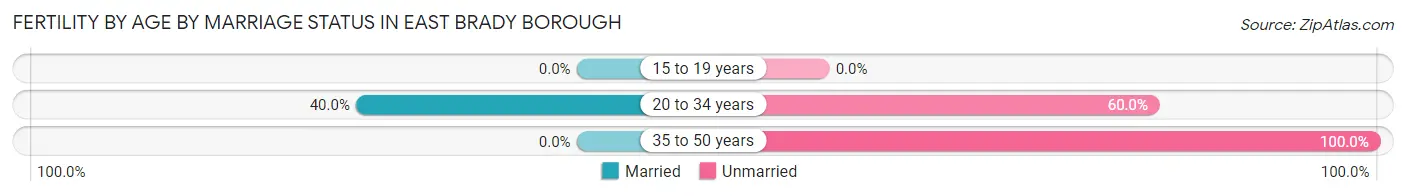
Fertility by Age by Marriage Status in East Brady borough
21.1% of women with births (19) in East Brady borough are married. The highest percentage of unmarried women with births falls into 35 to 50 years age bracket with 100.0% of them unmarried at the time of birth, while the lowest percentage of unmarried women with births belong to 20 to 34 years age bracket with 60.0% of them unmarried.
| Age Bracket | Married | Unmarried |
| 15 to 19 years | 0 (0.0%) | 0 (0.0%) |
| 20 to 34 years | 4 (40.0%) | 6 (60.0%) |
| 35 to 50 years | 0 (0.0%) | 9 (100.0%) |
| Total | 4 (21.0%) | 15 (78.9%) |
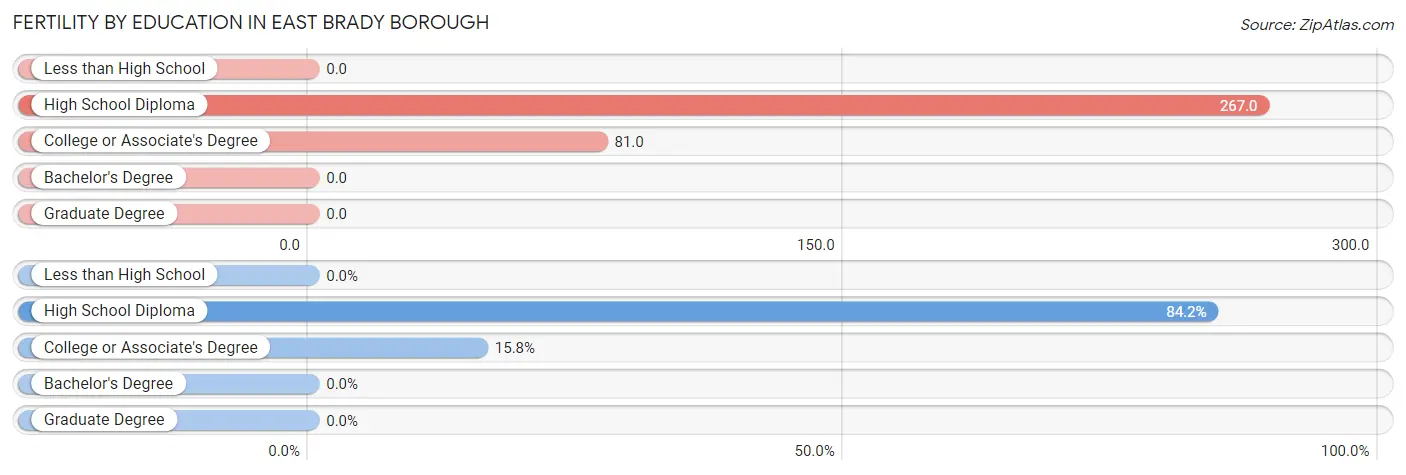
Fertility by Education in East Brady borough
| Educational Attainment | Women with Births | Births / 1,000 Women |
| Less than High School | 0 (0.0%) | 0.0 |
| High School Diploma | 16 (84.2%) | 267.0 |
| College or Associate's Degree | 3 (15.8%) | 81.0 |
| Bachelor's Degree | 0 (0.0%) | 0.0 |
| Graduate Degree | 0 (0.0%) | 0.0 |
| Total | 19 (100.0%) | 87.0 |
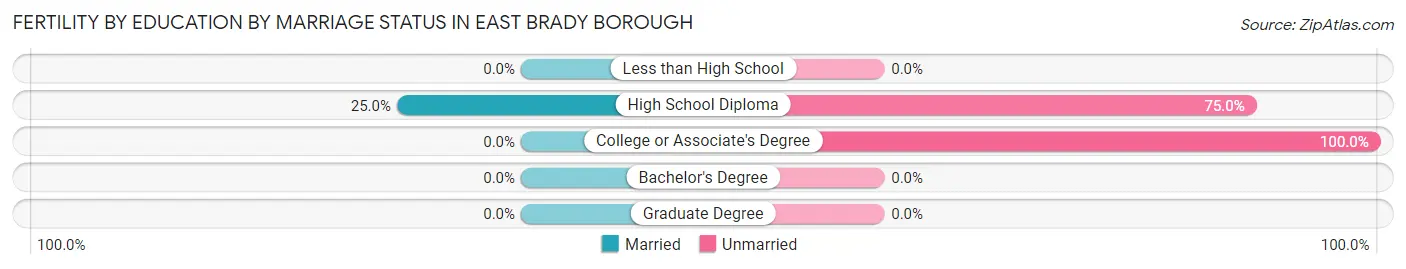
Fertility by Education by Marriage Status in East Brady borough
78.9% of women with births in East Brady borough are unmarried. Women with the educational attainment of high school diploma are most likely to be married with 25.0% of them married at childbirth, while women with the educational attainment of college or associate's degree are least likely to be married with 100.0% of them unmarried at childbirth.
| Educational Attainment | Married | Unmarried |
| Less than High School | 0 (0.0%) | 0 (0.0%) |
| High School Diploma | 4 (25.0%) | 12 (75.0%) |
| College or Associate's Degree | 0 (0.0%) | 3 (100.0%) |
| Bachelor's Degree | 0 (0.0%) | 0 (0.0%) |
| Graduate Degree | 0 (0.0%) | 0 (0.0%) |
| Total | 4 (21.0%) | 15 (78.9%) |
Employment Characteristics in East Brady borough
Employment by Class of Employer in East Brady borough
Among the 482 employed individuals in East Brady borough, private company employees (365 | 75.7%), local government employees (40 | 8.3%), and not-for-profit organizations (33 | 6.9%) make up the most common classes of employment.
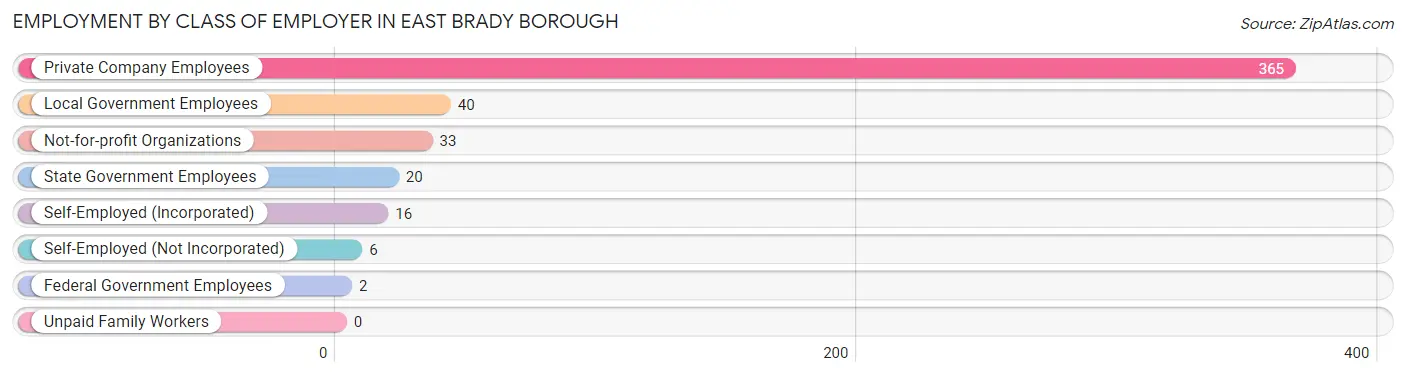
| Employer Class | # Employees | % Employees |
| Private Company Employees | 365 | 75.7% |
| Self-Employed (Incorporated) | 16 | 3.3% |
| Self-Employed (Not Incorporated) | 6 | 1.2% |
| Not-for-profit Organizations | 33 | 6.9% |
| Local Government Employees | 40 | 8.3% |
| State Government Employees | 20 | 4.2% |
| Federal Government Employees | 2 | 0.4% |
| Unpaid Family Workers | 0 | 0.0% |
| Total | 482 | 100.0% |
Employment Status by Age in East Brady borough
According to the labor force statistics for East Brady borough, out of the total population over 16 years of age (888), 57.2% or 508 individuals are in the labor force, with 5.1% or 26 of them unemployed. The age group with the highest labor force participation rate is 30 to 34 years, with 93.0% or 66 individuals in the labor force. Within the labor force, the 35 to 44 years age range has the highest percentage of unemployed individuals, with 13.2% or 15 of them being unemployed.
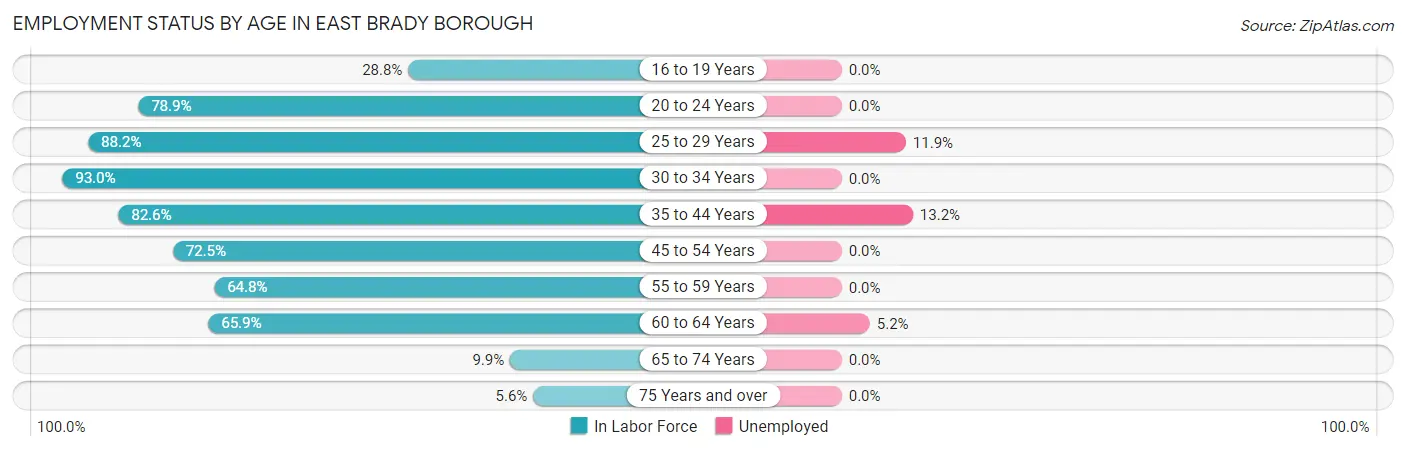
| Age Bracket | In Labor Force | Unemployed |
| 16 to 19 Years | 15 (28.8%) | 0 (0.0%) |
| 20 to 24 Years | 56 (78.9%) | 0 (0.0%) |
| 25 to 29 Years | 67 (88.2%) | 8 (11.9%) |
| 30 to 34 Years | 66 (93.0%) | 0 (0.0%) |
| 35 to 44 Years | 114 (82.6%) | 15 (13.2%) |
| 45 to 54 Years | 79 (72.5%) | 0 (0.0%) |
| 55 to 59 Years | 35 (64.8%) | 0 (0.0%) |
| 60 to 64 Years | 58 (65.9%) | 3 (5.2%) |
| 65 to 74 Years | 12 (9.9%) | 0 (0.0%) |
| 75 Years and over | 6 (5.6%) | 0 (0.0%) |
| Total | 508 (57.2%) | 26 (5.1%) |
Employment Status by Educational Attainment in East Brady borough
According to labor force statistics for East Brady borough, 78.2% of individuals (419) out of the total population between 25 and 64 years of age (536) are in the labor force, with 6.2% or 26 of them being unemployed. The group with the highest labor force participation rate are those with the educational attainment of college / associate degree, with 88.3% or 113 individuals in the labor force. Within the labor force, individuals with less than high school education have the highest percentage of unemployment, with 31.0% or 9 of them being unemployed.
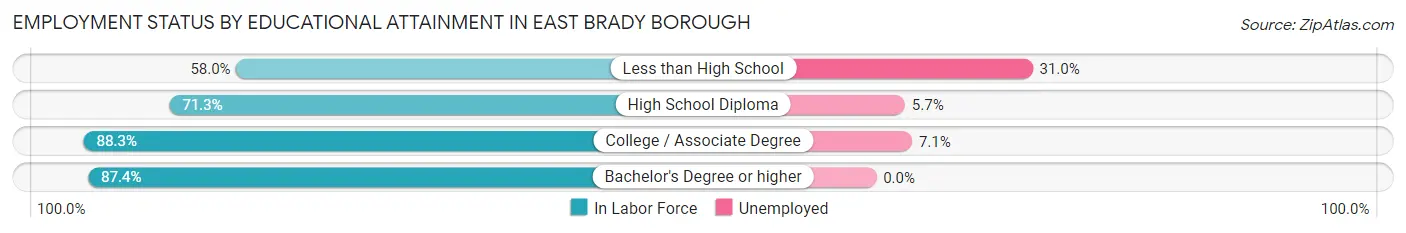
| Educational Attainment | In Labor Force | Unemployed |
| Less than High School | 29 (58.0%) | 16 (31.0%) |
| High School Diploma | 159 (71.3%) | 13 (5.7%) |
| College / Associate Degree | 113 (88.3%) | 9 (7.1%) |
| Bachelor's Degree or higher | 118 (87.4%) | 0 (0.0%) |
| Total | 419 (78.2%) | 33 (6.2%) |
Employment Occupations by Sex in East Brady borough
Management, Business, Science and Arts Occupations
The most common Management, Business, Science and Arts occupations in East Brady borough are Health Diagnosing & Treating (52 | 10.8%), Business & Financial (24 | 5.0%), Computers, Engineering & Science (21 | 4.4%), Health Technologists (21 | 4.4%), and Community & Social Service (20 | 4.2%).
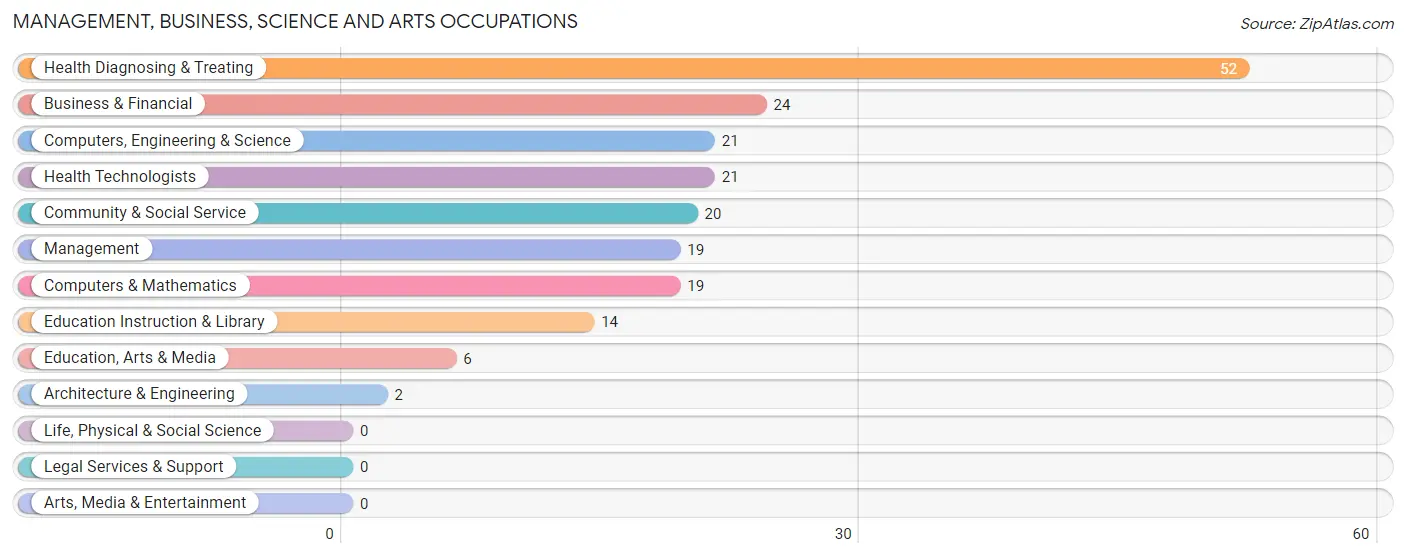
Management, Business, Science and Arts Occupations by Sex
Within the Management, Business, Science and Arts occupations in East Brady borough, the most male-oriented occupations are Architecture & Engineering (100.0%), Education, Arts & Media (50.0%), and Community & Social Service (40.0%), while the most female-oriented occupations are Business & Financial (100.0%), Health Technologists (100.0%), and Health Diagnosing & Treating (86.5%).
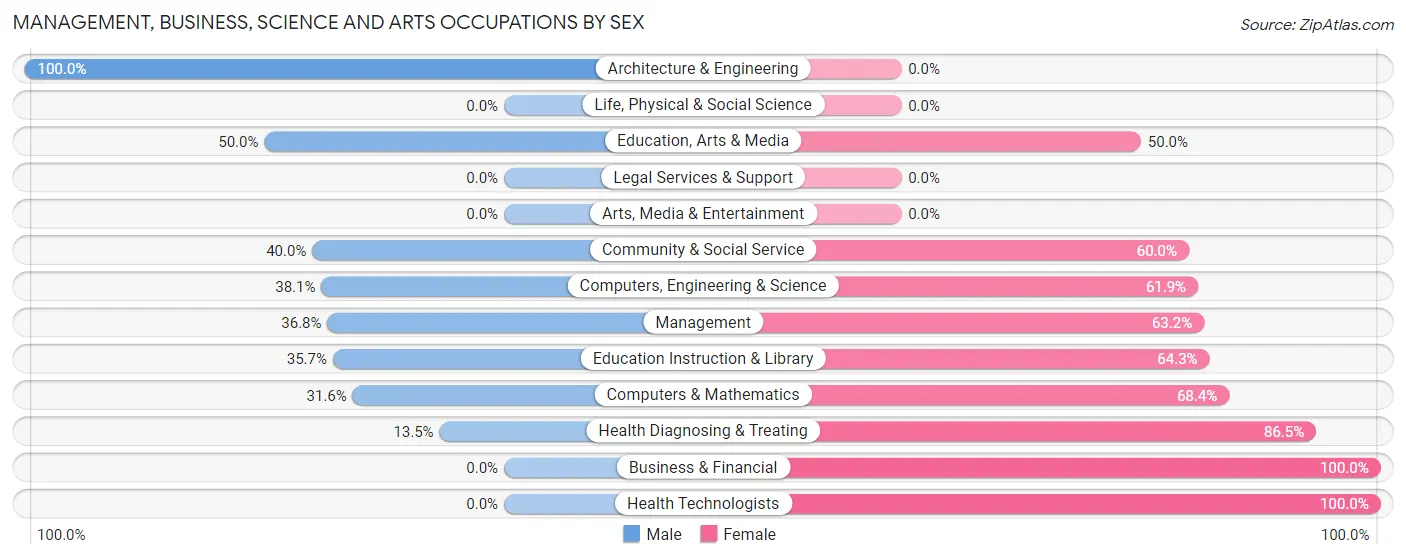
| Occupation | Male | Female |
| Management | 7 (36.8%) | 12 (63.2%) |
| Business & Financial | 0 (0.0%) | 24 (100.0%) |
| Computers, Engineering & Science | 8 (38.1%) | 13 (61.9%) |
| Computers & Mathematics | 6 (31.6%) | 13 (68.4%) |
| Architecture & Engineering | 2 (100.0%) | 0 (0.0%) |
| Life, Physical & Social Science | 0 (0.0%) | 0 (0.0%) |
| Community & Social Service | 8 (40.0%) | 12 (60.0%) |
| Education, Arts & Media | 3 (50.0%) | 3 (50.0%) |
| Legal Services & Support | 0 (0.0%) | 0 (0.0%) |
| Education Instruction & Library | 5 (35.7%) | 9 (64.3%) |
| Arts, Media & Entertainment | 0 (0.0%) | 0 (0.0%) |
| Health Diagnosing & Treating | 7 (13.5%) | 45 (86.5%) |
| Health Technologists | 0 (0.0%) | 21 (100.0%) |
| Total (Category) | 30 (22.1%) | 106 (77.9%) |
| Total (Overall) | 296 (61.4%) | 186 (38.6%) |
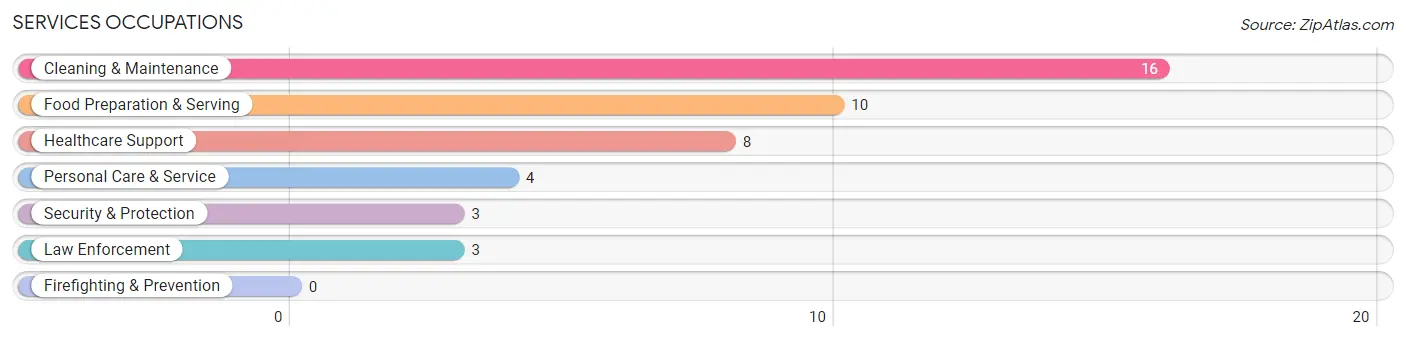
Services Occupations
The most common Services occupations in East Brady borough are Cleaning & Maintenance (16 | 3.3%), Food Preparation & Serving (10 | 2.1%), Healthcare Support (8 | 1.7%), Personal Care & Service (4 | 0.8%), and Security & Protection (3 | 0.6%).
Services Occupations by Sex
Within the Services occupations in East Brady borough, the most male-oriented occupations are Security & Protection (100.0%), Law Enforcement (100.0%), and Cleaning & Maintenance (56.2%), while the most female-oriented occupations are Healthcare Support (100.0%), Food Preparation & Serving (100.0%), and Personal Care & Service (100.0%).
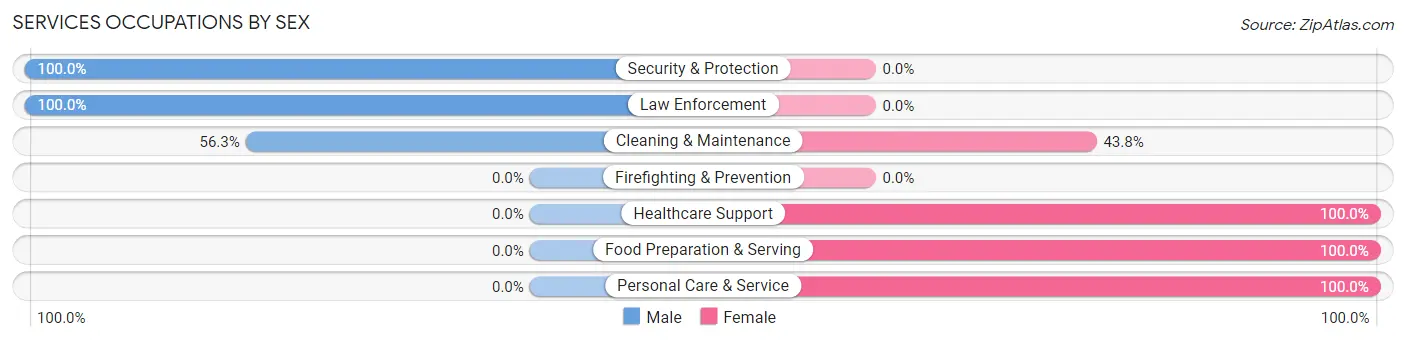
| Occupation | Male | Female |
| Healthcare Support | 0 (0.0%) | 8 (100.0%) |
| Security & Protection | 3 (100.0%) | 0 (0.0%) |
| Firefighting & Prevention | 0 (0.0%) | 0 (0.0%) |
| Law Enforcement | 3 (100.0%) | 0 (0.0%) |
| Food Preparation & Serving | 0 (0.0%) | 10 (100.0%) |
| Cleaning & Maintenance | 9 (56.2%) | 7 (43.8%) |
| Personal Care & Service | 0 (0.0%) | 4 (100.0%) |
| Total (Category) | 12 (29.3%) | 29 (70.7%) |
| Total (Overall) | 296 (61.4%) | 186 (38.6%) |
Sales and Office Occupations
The most common Sales and Office occupations in East Brady borough are Sales & Related (47 | 9.8%), and Office & Administration (33 | 6.9%).
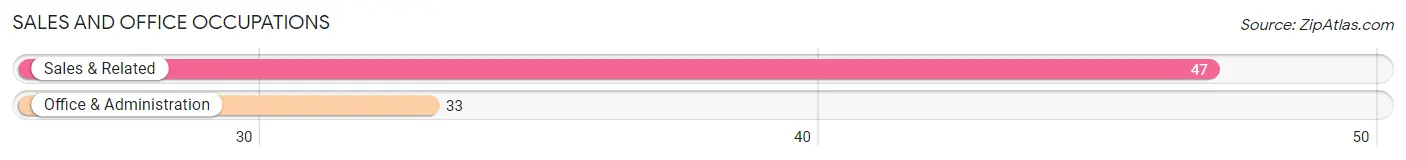
Sales and Office Occupations by Sex
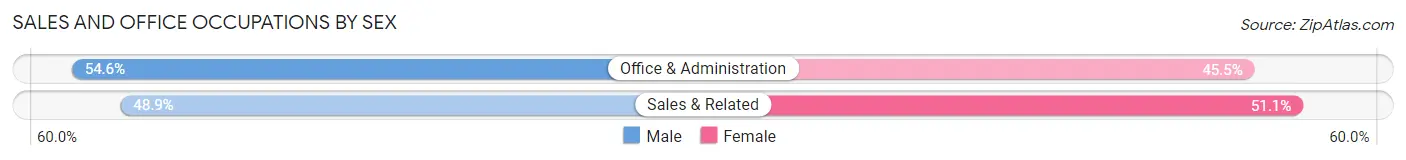
| Occupation | Male | Female |
| Sales & Related | 23 (48.9%) | 24 (51.1%) |
| Office & Administration | 18 (54.5%) | 15 (45.5%) |
| Total (Category) | 41 (51.2%) | 39 (48.7%) |
| Total (Overall) | 296 (61.4%) | 186 (38.6%) |
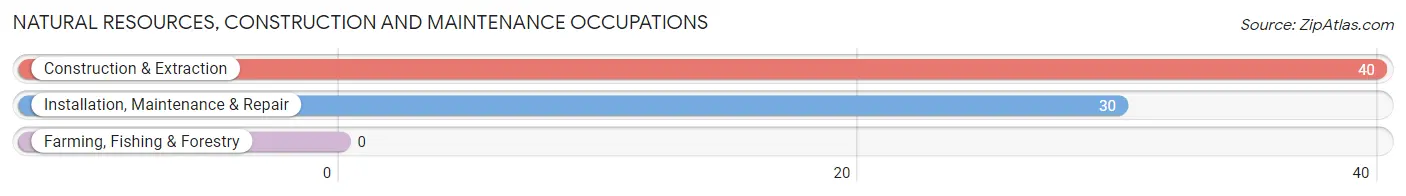
Natural Resources, Construction and Maintenance Occupations
The most common Natural Resources, Construction and Maintenance occupations in East Brady borough are Construction & Extraction (40 | 8.3%), and Installation, Maintenance & Repair (30 | 6.2%).
Natural Resources, Construction and Maintenance Occupations by Sex
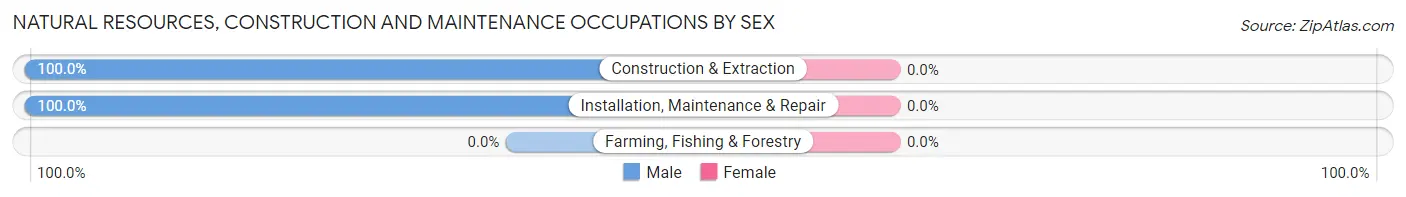
| Occupation | Male | Female |
| Farming, Fishing & Forestry | 0 (0.0%) | 0 (0.0%) |
| Construction & Extraction | 40 (100.0%) | 0 (0.0%) |
| Installation, Maintenance & Repair | 30 (100.0%) | 0 (0.0%) |
| Total (Category) | 70 (100.0%) | 0 (0.0%) |
| Total (Overall) | 296 (61.4%) | 186 (38.6%) |
Production, Transportation and Moving Occupations
The most common Production, Transportation and Moving occupations in East Brady borough are Production (73 | 15.1%), Material Moving (53 | 11.0%), and Transportation (29 | 6.0%).
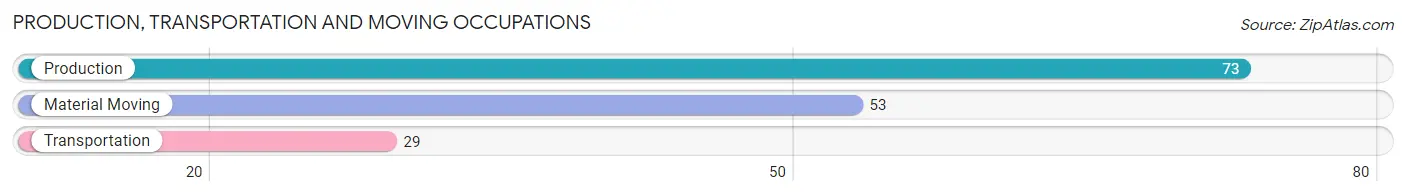
Production, Transportation and Moving Occupations by Sex
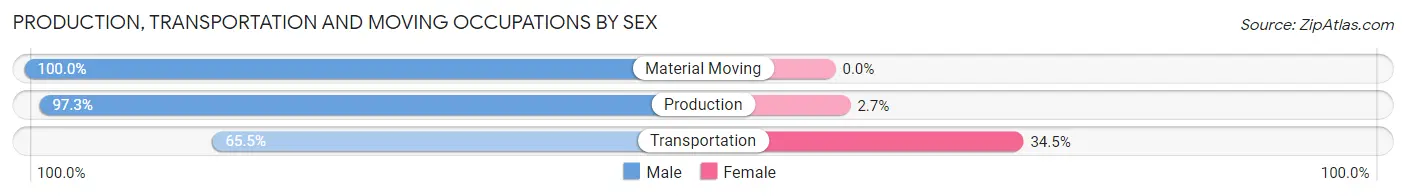
| Occupation | Male | Female |
| Production | 71 (97.3%) | 2 (2.7%) |
| Transportation | 19 (65.5%) | 10 (34.5%) |
| Material Moving | 53 (100.0%) | 0 (0.0%) |
| Total (Category) | 143 (92.3%) | 12 (7.7%) |
| Total (Overall) | 296 (61.4%) | 186 (38.6%) |
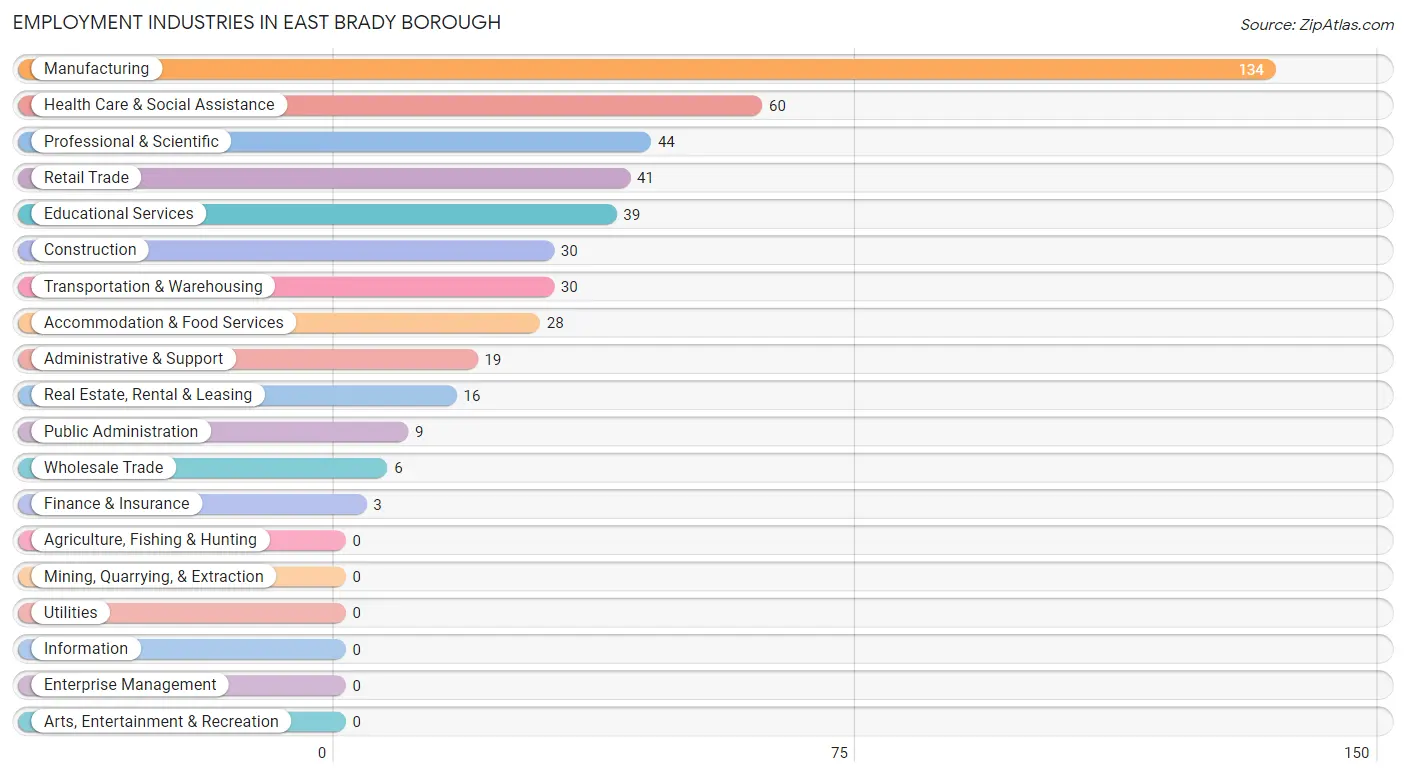
Employment Industries by Sex in East Brady borough
Employment Industries in East Brady borough
The major employment industries in East Brady borough include Manufacturing (134 | 27.8%), Health Care & Social Assistance (60 | 12.4%), Professional & Scientific (44 | 9.1%), Retail Trade (41 | 8.5%), and Educational Services (39 | 8.1%).
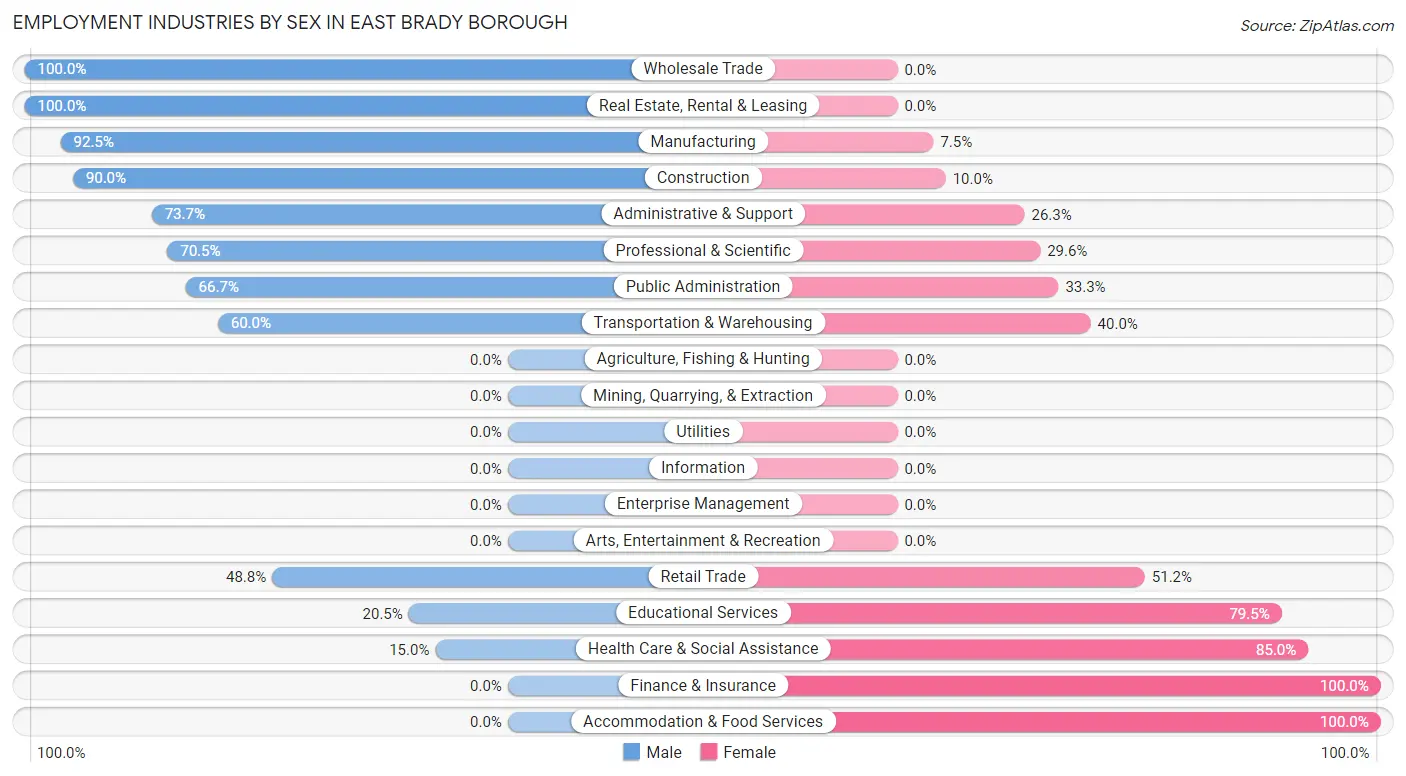
Employment Industries by Sex in East Brady borough
The East Brady borough industries that see more men than women are Wholesale Trade (100.0%), Real Estate, Rental & Leasing (100.0%), and Manufacturing (92.5%), whereas the industries that tend to have a higher number of women are Finance & Insurance (100.0%), Accommodation & Food Services (100.0%), and Health Care & Social Assistance (85.0%).
| Industry | Male | Female |
| Agriculture, Fishing & Hunting | 0 (0.0%) | 0 (0.0%) |
| Mining, Quarrying, & Extraction | 0 (0.0%) | 0 (0.0%) |
| Construction | 27 (90.0%) | 3 (10.0%) |
| Manufacturing | 124 (92.5%) | 10 (7.5%) |
| Wholesale Trade | 6 (100.0%) | 0 (0.0%) |
| Retail Trade | 20 (48.8%) | 21 (51.2%) |
| Transportation & Warehousing | 18 (60.0%) | 12 (40.0%) |
| Utilities | 0 (0.0%) | 0 (0.0%) |
| Information | 0 (0.0%) | 0 (0.0%) |
| Finance & Insurance | 0 (0.0%) | 3 (100.0%) |
| Real Estate, Rental & Leasing | 16 (100.0%) | 0 (0.0%) |
| Professional & Scientific | 31 (70.5%) | 13 (29.5%) |
| Enterprise Management | 0 (0.0%) | 0 (0.0%) |
| Administrative & Support | 14 (73.7%) | 5 (26.3%) |
| Educational Services | 8 (20.5%) | 31 (79.5%) |
| Health Care & Social Assistance | 9 (15.0%) | 51 (85.0%) |
| Arts, Entertainment & Recreation | 0 (0.0%) | 0 (0.0%) |
| Accommodation & Food Services | 0 (0.0%) | 28 (100.0%) |
| Public Administration | 6 (66.7%) | 3 (33.3%) |
| Total | 296 (61.4%) | 186 (38.6%) |
Education in East Brady borough
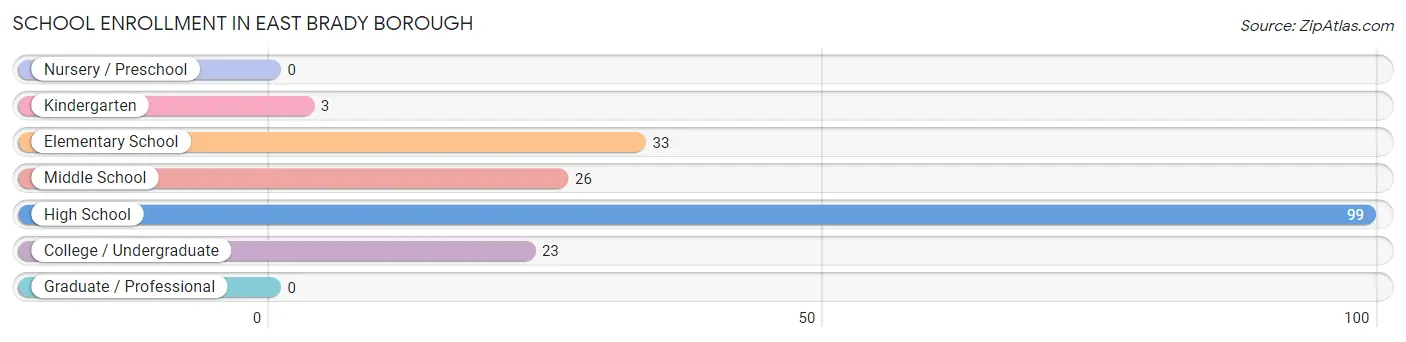
School Enrollment in East Brady borough
The most common levels of schooling among the 184 students in East Brady borough are high school (99 | 53.8%), elementary school (33 | 17.9%), and middle school (26 | 14.1%).
| School Level | # Students | % Students |
| Nursery / Preschool | 0 | 0.0% |
| Kindergarten | 3 | 1.6% |
| Elementary School | 33 | 17.9% |
| Middle School | 26 | 14.1% |
| High School | 99 | 53.8% |
| College / Undergraduate | 23 | 12.5% |
| Graduate / Professional | 0 | 0.0% |
| Total | 184 | 100.0% |
School Enrollment by Age by Funding Source in East Brady borough
Out of a total of 184 students who are enrolled in schools in East Brady borough, 6 (3.3%) attend a private institution, while the remaining 178 (96.7%) are enrolled in public schools. The age group of 20 to 24 year olds has the highest likelihood of being enrolled in private schools, with 6 (28.6% in the age bracket) enrolled. Conversely, the age group of 5 to 9 year old has the lowest likelihood of being enrolled in a private school, with 34 (100.0% in the age bracket) attending a public institution.
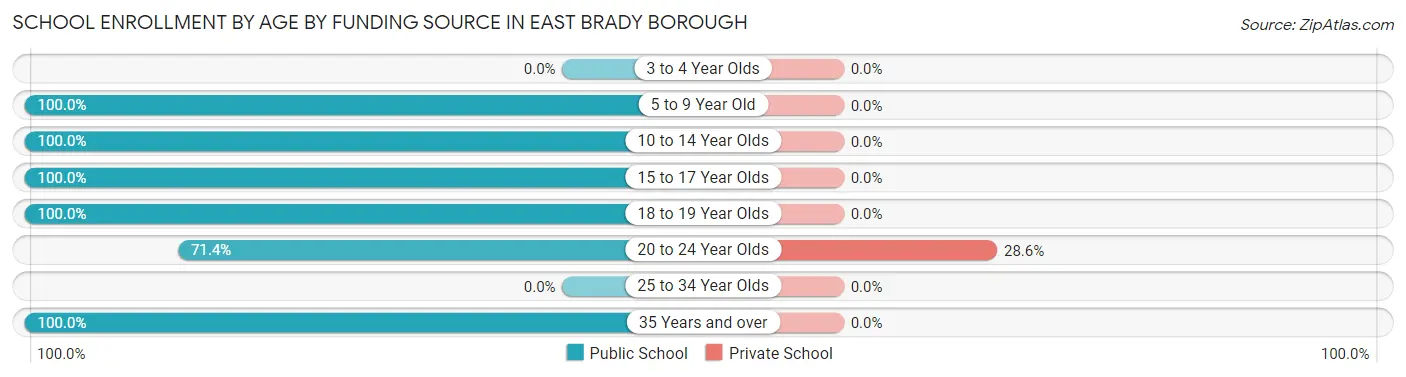
| Age Bracket | Public School | Private School |
| 3 to 4 Year Olds | 0 (0.0%) | 0 (0.0%) |
| 5 to 9 Year Old | 34 (100.0%) | 0 (0.0%) |
| 10 to 14 Year Olds | 55 (100.0%) | 0 (0.0%) |
| 15 to 17 Year Olds | 67 (100.0%) | 0 (0.0%) |
| 18 to 19 Year Olds | 5 (100.0%) | 0 (0.0%) |
| 20 to 24 Year Olds | 15 (71.4%) | 6 (28.6%) |
| 25 to 34 Year Olds | 0 (0.0%) | 0 (0.0%) |
| 35 Years and over | 2 (100.0%) | 0 (0.0%) |
| Total | 178 (96.7%) | 6 (3.3%) |
Educational Attainment by Field of Study in East Brady borough
Science & technology (32 | 20.0%), communications (30 | 18.8%), education (21 | 13.1%), engineering (19 | 11.9%), and business (15 | 9.4%) are the most common fields of study among 160 individuals in East Brady borough who have obtained a bachelor's degree or higher.
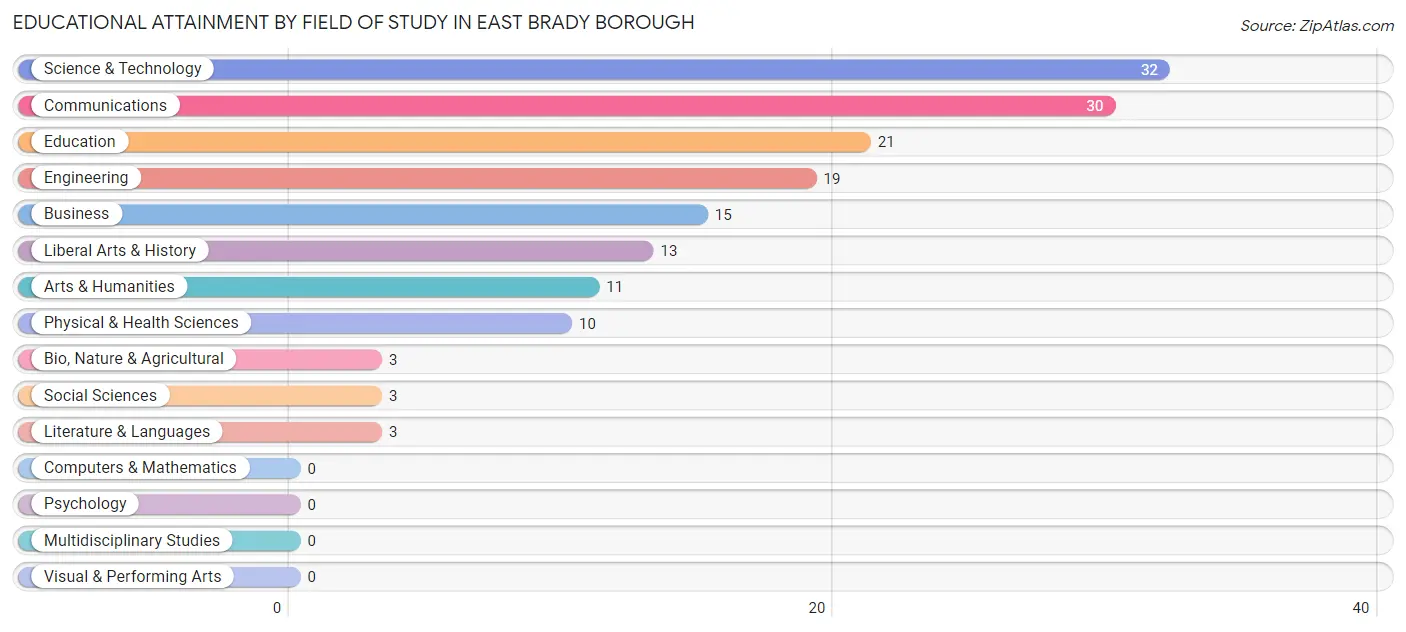
| Field of Study | # Graduates | % Graduates |
| Computers & Mathematics | 0 | 0.0% |
| Bio, Nature & Agricultural | 3 | 1.9% |
| Physical & Health Sciences | 10 | 6.2% |
| Psychology | 0 | 0.0% |
| Social Sciences | 3 | 1.9% |
| Engineering | 19 | 11.9% |
| Multidisciplinary Studies | 0 | 0.0% |
| Science & Technology | 32 | 20.0% |
| Business | 15 | 9.4% |
| Education | 21 | 13.1% |
| Literature & Languages | 3 | 1.9% |
| Liberal Arts & History | 13 | 8.1% |
| Visual & Performing Arts | 0 | 0.0% |
| Communications | 30 | 18.8% |
| Arts & Humanities | 11 | 6.9% |
| Total | 160 | 100.0% |
Transportation & Commute in East Brady borough
Vehicle Availability by Sex in East Brady borough
The most prevalent vehicle ownership categories in East Brady borough are males with 2 vehicles (119, accounting for 40.2%) and females with 2 vehicles (77, making up 64.0%).
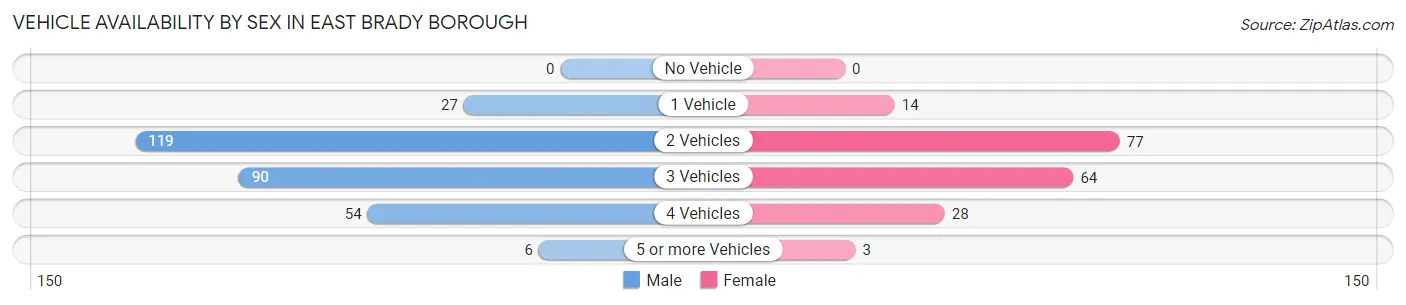
| Vehicles Available | Male | Female |
| No Vehicle | 0 (0.0%) | 0 (0.0%) |
| 1 Vehicle | 27 (9.1%) | 14 (7.5%) |
| 2 Vehicles | 119 (40.2%) | 77 (41.4%) |
| 3 Vehicles | 90 (30.4%) | 64 (34.4%) |
| 4 Vehicles | 54 (18.2%) | 28 (15.0%) |
| 5 or more Vehicles | 6 (2.0%) | 3 (1.6%) |
| Total | 296 (100.0%) | 186 (100.0%) |
Commute Time in East Brady borough
The most frequently occuring commute durations in East Brady borough are 45 to 59 minutes (70 commuters, 15.3%), 30 to 34 minutes (62 commuters, 13.6%), and 40 to 44 minutes (48 commuters, 10.5%).
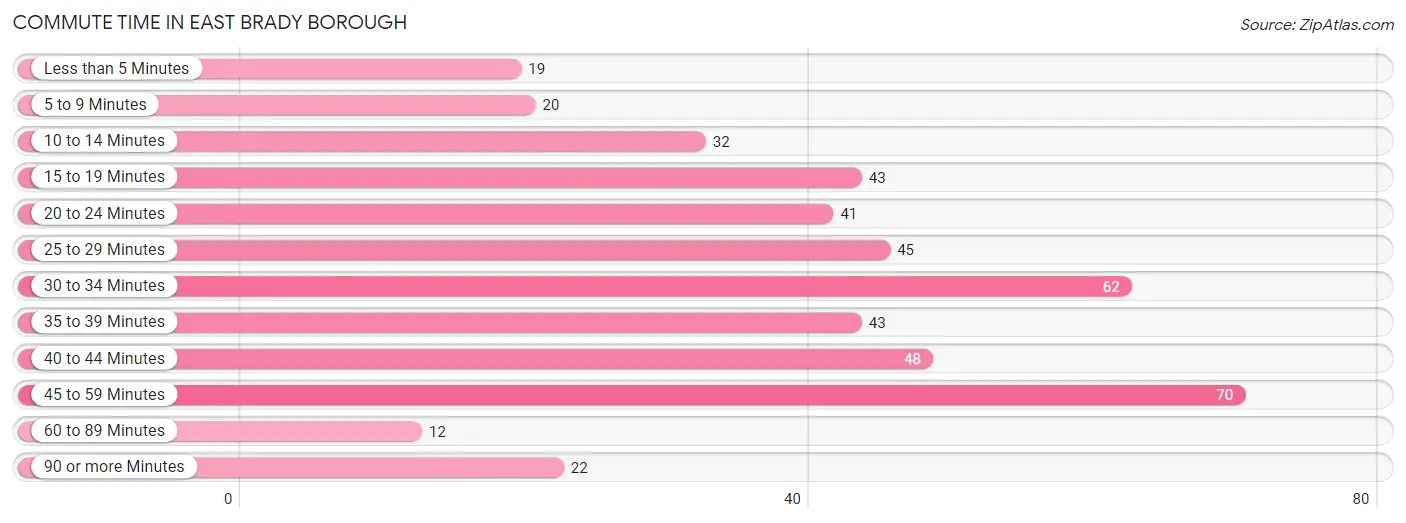
| Commute Time | # Commuters | % Commuters |
| Less than 5 Minutes | 19 | 4.2% |
| 5 to 9 Minutes | 20 | 4.4% |
| 10 to 14 Minutes | 32 | 7.0% |
| 15 to 19 Minutes | 43 | 9.4% |
| 20 to 24 Minutes | 41 | 9.0% |
| 25 to 29 Minutes | 45 | 9.9% |
| 30 to 34 Minutes | 62 | 13.6% |
| 35 to 39 Minutes | 43 | 9.4% |
| 40 to 44 Minutes | 48 | 10.5% |
| 45 to 59 Minutes | 70 | 15.3% |
| 60 to 89 Minutes | 12 | 2.6% |
| 90 or more Minutes | 22 | 4.8% |
Commute Time by Sex in East Brady borough
The most common commute times in East Brady borough are 30 to 34 minutes (49 commuters, 17.0%) for males and 25 to 29 minutes (45 commuters, 26.8%) for females.
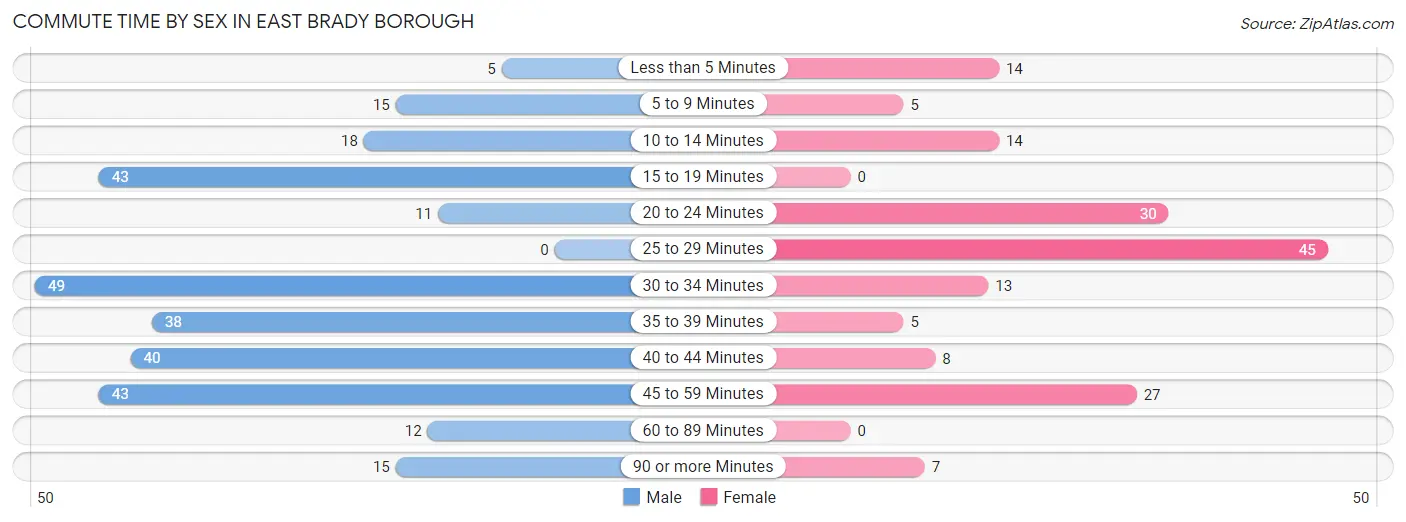
| Commute Time | Male | Female |
| Less than 5 Minutes | 5 (1.7%) | 14 (8.3%) |
| 5 to 9 Minutes | 15 (5.2%) | 5 (3.0%) |
| 10 to 14 Minutes | 18 (6.2%) | 14 (8.3%) |
| 15 to 19 Minutes | 43 (14.9%) | 0 (0.0%) |
| 20 to 24 Minutes | 11 (3.8%) | 30 (17.9%) |
| 25 to 29 Minutes | 0 (0.0%) | 45 (26.8%) |
| 30 to 34 Minutes | 49 (17.0%) | 13 (7.7%) |
| 35 to 39 Minutes | 38 (13.2%) | 5 (3.0%) |
| 40 to 44 Minutes | 40 (13.8%) | 8 (4.8%) |
| 45 to 59 Minutes | 43 (14.9%) | 27 (16.1%) |
| 60 to 89 Minutes | 12 (4.2%) | 0 (0.0%) |
| 90 or more Minutes | 15 (5.2%) | 7 (4.2%) |
Time of Departure to Work by Sex in East Brady borough
The most frequent times of departure to work in East Brady borough are 6:00 AM to 6:29 AM (57, 19.7%) for males and 6:30 AM to 6:59 AM (34, 20.2%) for females.
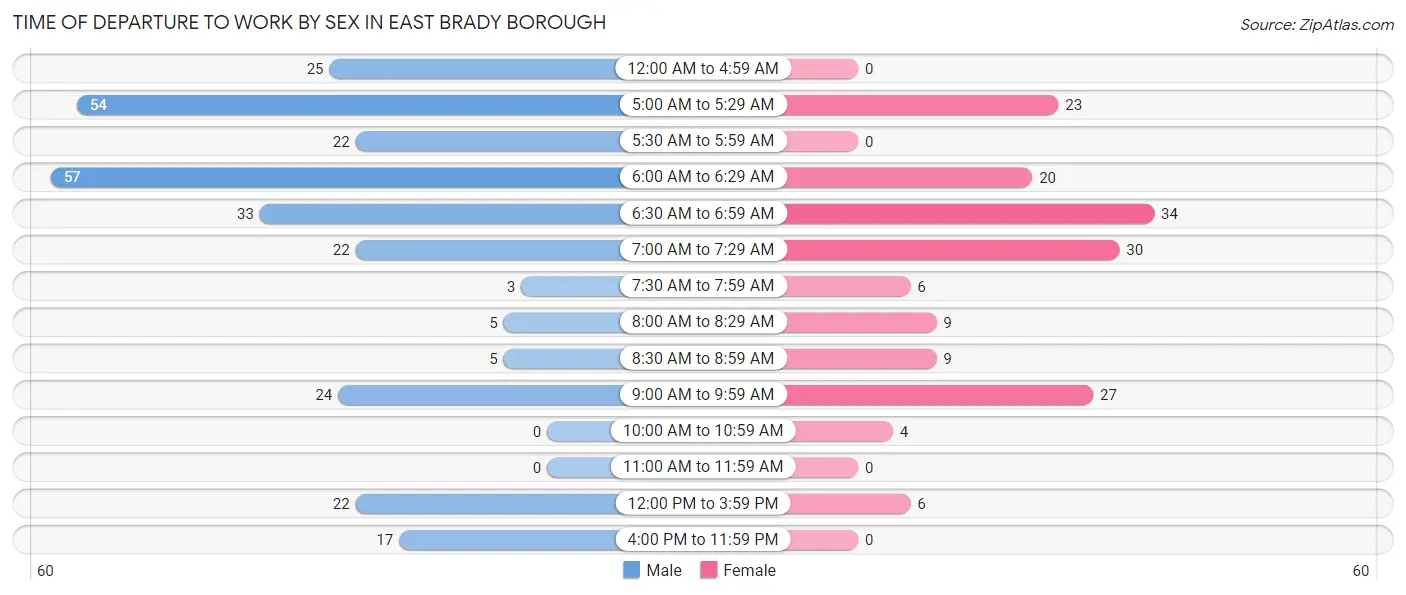
| Time of Departure | Male | Female |
| 12:00 AM to 4:59 AM | 25 (8.6%) | 0 (0.0%) |
| 5:00 AM to 5:29 AM | 54 (18.7%) | 23 (13.7%) |
| 5:30 AM to 5:59 AM | 22 (7.6%) | 0 (0.0%) |
| 6:00 AM to 6:29 AM | 57 (19.7%) | 20 (11.9%) |
| 6:30 AM to 6:59 AM | 33 (11.4%) | 34 (20.2%) |
| 7:00 AM to 7:29 AM | 22 (7.6%) | 30 (17.9%) |
| 7:30 AM to 7:59 AM | 3 (1.0%) | 6 (3.6%) |
| 8:00 AM to 8:29 AM | 5 (1.7%) | 9 (5.4%) |
| 8:30 AM to 8:59 AM | 5 (1.7%) | 9 (5.4%) |
| 9:00 AM to 9:59 AM | 24 (8.3%) | 27 (16.1%) |
| 10:00 AM to 10:59 AM | 0 (0.0%) | 4 (2.4%) |
| 11:00 AM to 11:59 AM | 0 (0.0%) | 0 (0.0%) |
| 12:00 PM to 3:59 PM | 22 (7.6%) | 6 (3.6%) |
| 4:00 PM to 11:59 PM | 17 (5.9%) | 0 (0.0%) |
| Total | 289 (100.0%) | 168 (100.0%) |
Housing Occupancy in East Brady borough
Occupancy by Ownership in East Brady borough
Of the total 440 dwellings in East Brady borough, owner-occupied units account for 288 (65.4%), while renter-occupied units make up 152 (34.5%).
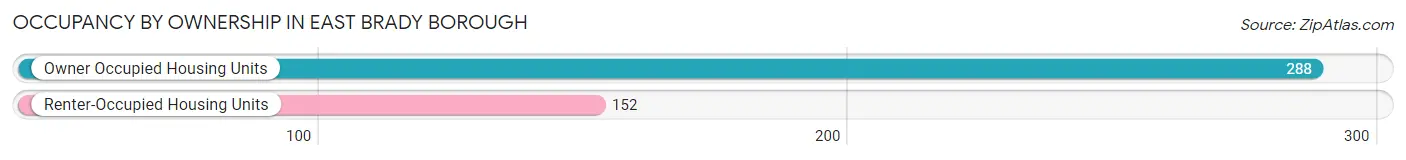
| Occupancy | # Housing Units | % Housing Units |
| Owner Occupied Housing Units | 288 | 65.4% |
| Renter-Occupied Housing Units | 152 | 34.5% |
| Total Occupied Housing Units | 440 | 100.0% |
Occupancy by Household Size in East Brady borough
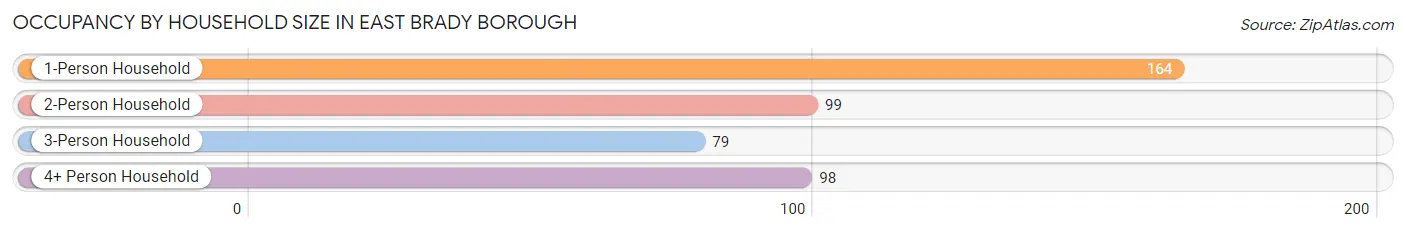
| Household Size | # Housing Units | % Housing Units |
| 1-Person Household | 164 | 37.3% |
| 2-Person Household | 99 | 22.5% |
| 3-Person Household | 79 | 17.9% |
| 4+ Person Household | 98 | 22.3% |
| Total Housing Units | 440 | 100.0% |
Occupancy by Ownership by Household Size in East Brady borough
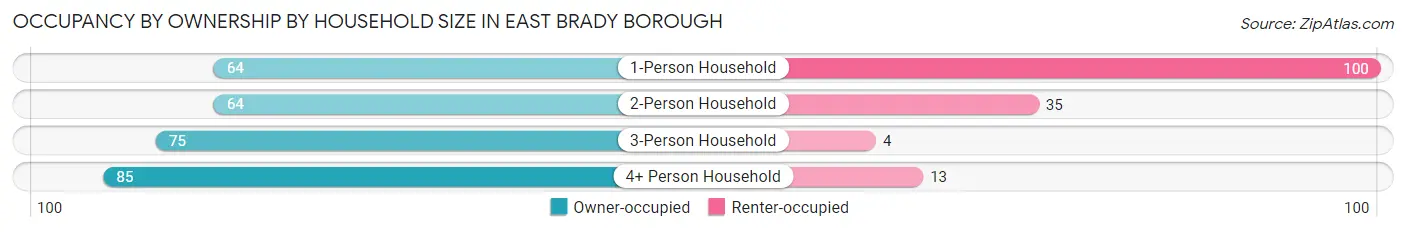
| Household Size | Owner-occupied | Renter-occupied |
| 1-Person Household | 64 (39.0%) | 100 (61.0%) |
| 2-Person Household | 64 (64.6%) | 35 (35.3%) |
| 3-Person Household | 75 (94.9%) | 4 (5.1%) |
| 4+ Person Household | 85 (86.7%) | 13 (13.3%) |
| Total Housing Units | 288 (65.4%) | 152 (34.5%) |
Occupancy by Educational Attainment in East Brady borough
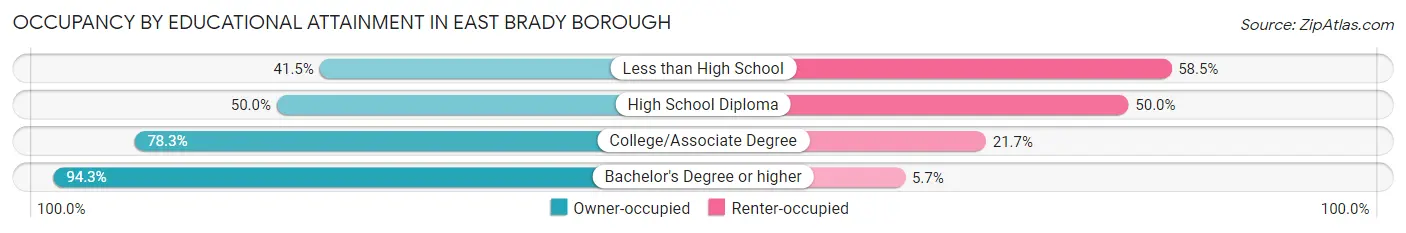
| Household Size | Owner-occupied | Renter-occupied |
| Less than High School | 22 (41.5%) | 31 (58.5%) |
| High School Diploma | 95 (50.0%) | 95 (50.0%) |
| College/Associate Degree | 72 (78.3%) | 20 (21.7%) |
| Bachelor's Degree or higher | 99 (94.3%) | 6 (5.7%) |
Occupancy by Age of Householder in East Brady borough
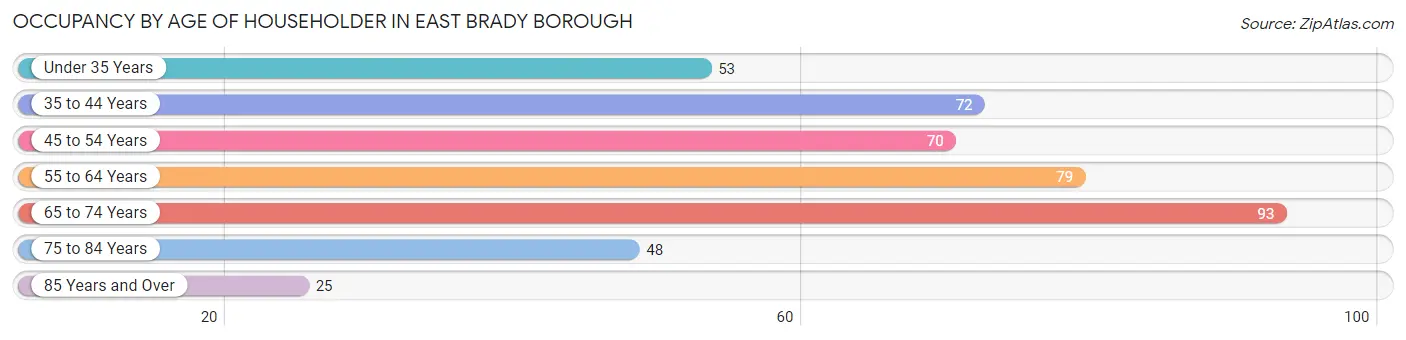
| Age Bracket | # Households | % Households |
| Under 35 Years | 53 | 12.0% |
| 35 to 44 Years | 72 | 16.4% |
| 45 to 54 Years | 70 | 15.9% |
| 55 to 64 Years | 79 | 17.9% |
| 65 to 74 Years | 93 | 21.1% |
| 75 to 84 Years | 48 | 10.9% |
| 85 Years and Over | 25 | 5.7% |
| Total | 440 | 100.0% |
Housing Finances in East Brady borough
Median Income by Occupancy in East Brady borough
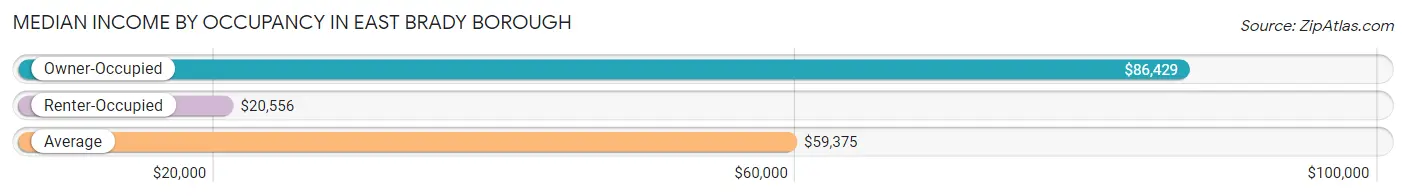
| Occupancy Type | # Households | Median Income |
| Owner-Occupied | 288 (65.4%) | $86,429 |
| Renter-Occupied | 152 (34.5%) | $20,556 |
| Average | 440 (100.0%) | $59,375 |
Occupancy by Householder Income Bracket in East Brady borough
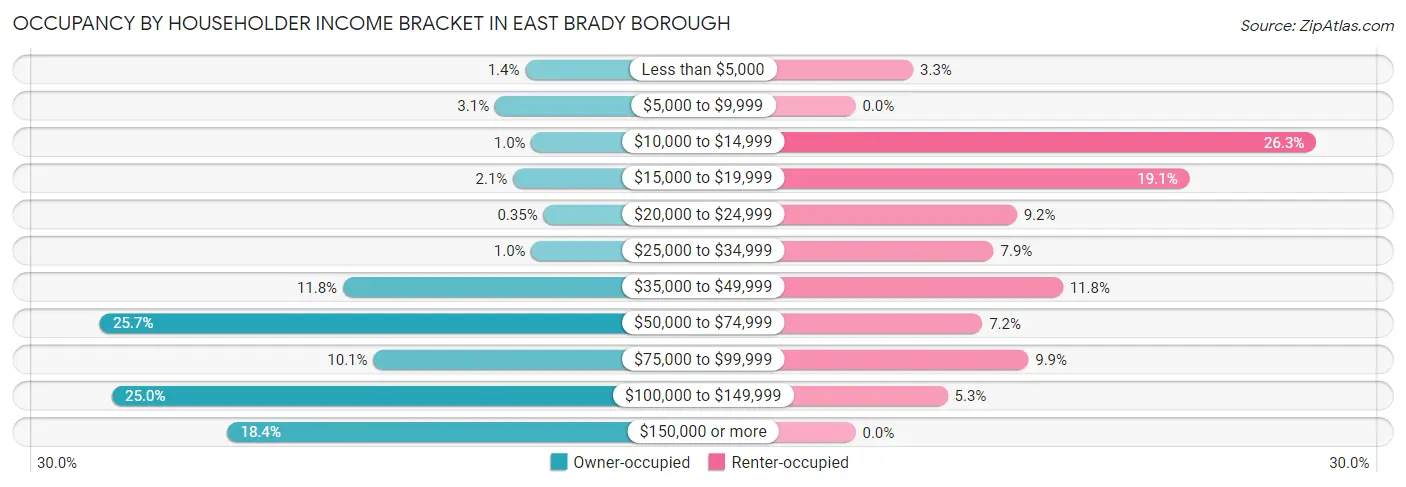
| Income Bracket | Owner-occupied | Renter-occupied |
| Less than $5,000 | 4 (1.4%) | 5 (3.3%) |
| $5,000 to $9,999 | 9 (3.1%) | 0 (0.0%) |
| $10,000 to $14,999 | 3 (1.0%) | 40 (26.3%) |
| $15,000 to $19,999 | 6 (2.1%) | 29 (19.1%) |
| $20,000 to $24,999 | 1 (0.4%) | 14 (9.2%) |
| $25,000 to $34,999 | 3 (1.0%) | 12 (7.9%) |
| $35,000 to $49,999 | 34 (11.8%) | 18 (11.8%) |
| $50,000 to $74,999 | 74 (25.7%) | 11 (7.2%) |
| $75,000 to $99,999 | 29 (10.1%) | 15 (9.9%) |
| $100,000 to $149,999 | 72 (25.0%) | 8 (5.3%) |
| $150,000 or more | 53 (18.4%) | 0 (0.0%) |
| Total | 288 (100.0%) | 152 (100.0%) |
Monthly Housing Cost Tiers in East Brady borough
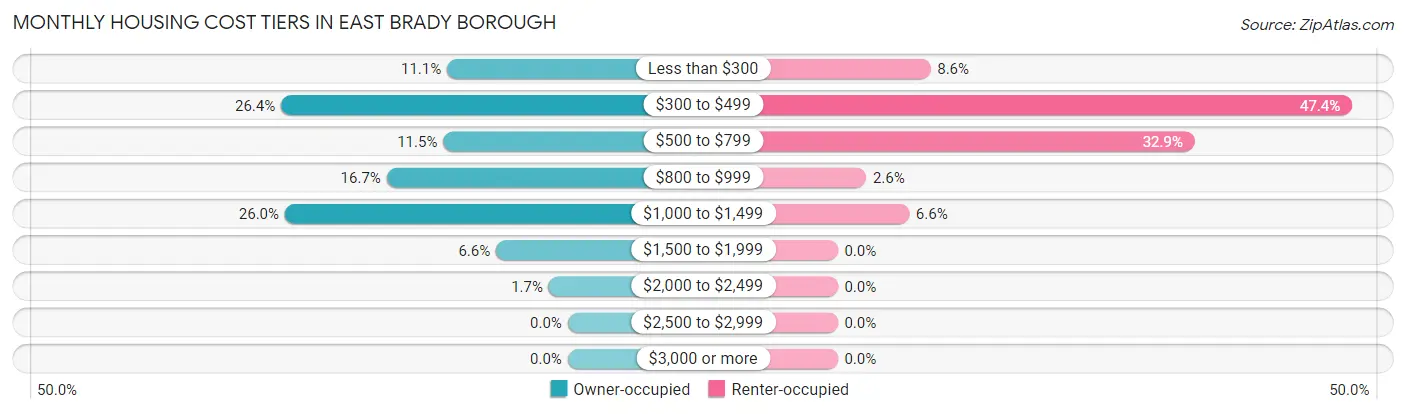
| Monthly Cost | Owner-occupied | Renter-occupied |
| Less than $300 | 32 (11.1%) | 13 (8.6%) |
| $300 to $499 | 76 (26.4%) | 72 (47.4%) |
| $500 to $799 | 33 (11.5%) | 50 (32.9%) |
| $800 to $999 | 48 (16.7%) | 4 (2.6%) |
| $1,000 to $1,499 | 75 (26.0%) | 10 (6.6%) |
| $1,500 to $1,999 | 19 (6.6%) | 0 (0.0%) |
| $2,000 to $2,499 | 5 (1.7%) | 0 (0.0%) |
| $2,500 to $2,999 | 0 (0.0%) | 0 (0.0%) |
| $3,000 or more | 0 (0.0%) | 0 (0.0%) |
| Total | 288 (100.0%) | 152 (100.0%) |
Physical Housing Characteristics in East Brady borough
Housing Structures in East Brady borough
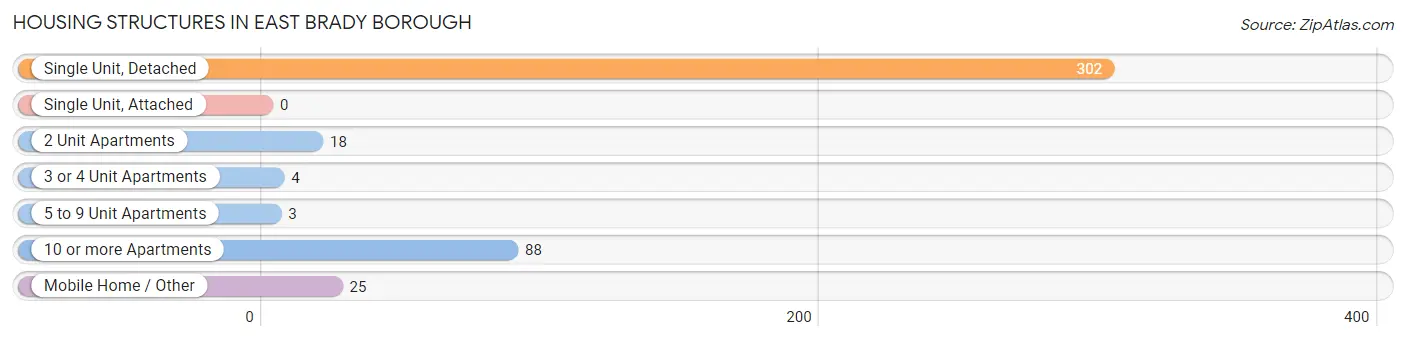
| Structure Type | # Housing Units | % Housing Units |
| Single Unit, Detached | 302 | 68.6% |
| Single Unit, Attached | 0 | 0.0% |
| 2 Unit Apartments | 18 | 4.1% |
| 3 or 4 Unit Apartments | 4 | 0.9% |
| 5 to 9 Unit Apartments | 3 | 0.7% |
| 10 or more Apartments | 88 | 20.0% |
| Mobile Home / Other | 25 | 5.7% |
| Total | 440 | 100.0% |
Housing Structures by Occupancy in East Brady borough
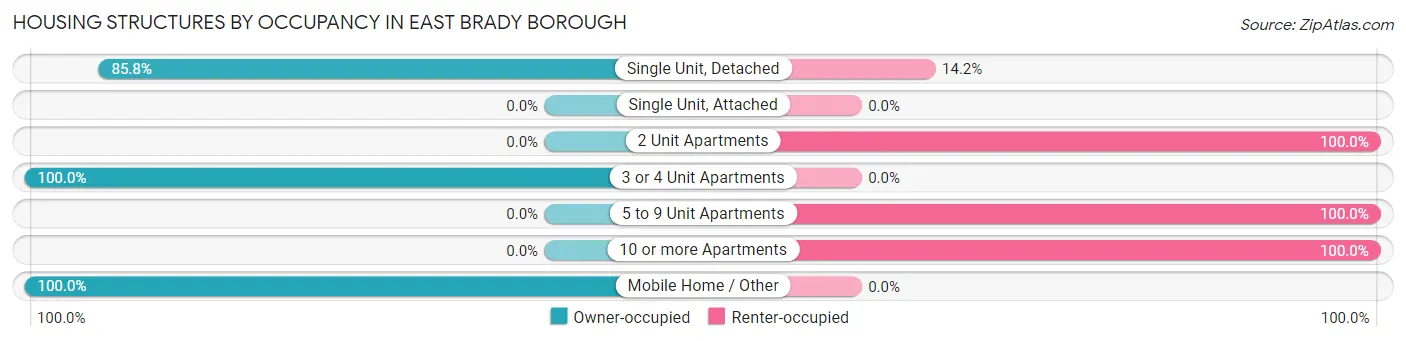
| Structure Type | Owner-occupied | Renter-occupied |
| Single Unit, Detached | 259 (85.8%) | 43 (14.2%) |
| Single Unit, Attached | 0 (0.0%) | 0 (0.0%) |
| 2 Unit Apartments | 0 (0.0%) | 18 (100.0%) |
| 3 or 4 Unit Apartments | 4 (100.0%) | 0 (0.0%) |
| 5 to 9 Unit Apartments | 0 (0.0%) | 3 (100.0%) |
| 10 or more Apartments | 0 (0.0%) | 88 (100.0%) |
| Mobile Home / Other | 25 (100.0%) | 0 (0.0%) |
| Total | 288 (65.4%) | 152 (34.5%) |
Housing Structures by Number of Rooms in East Brady borough
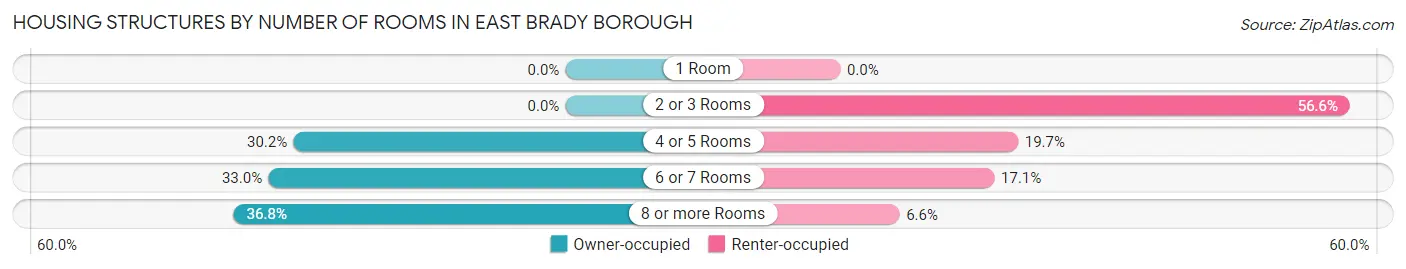
| Number of Rooms | Owner-occupied | Renter-occupied |
| 1 Room | 0 (0.0%) | 0 (0.0%) |
| 2 or 3 Rooms | 0 (0.0%) | 86 (56.6%) |
| 4 or 5 Rooms | 87 (30.2%) | 30 (19.7%) |
| 6 or 7 Rooms | 95 (33.0%) | 26 (17.1%) |
| 8 or more Rooms | 106 (36.8%) | 10 (6.6%) |
| Total | 288 (100.0%) | 152 (100.0%) |
Housing Structure by Heating Type in East Brady borough
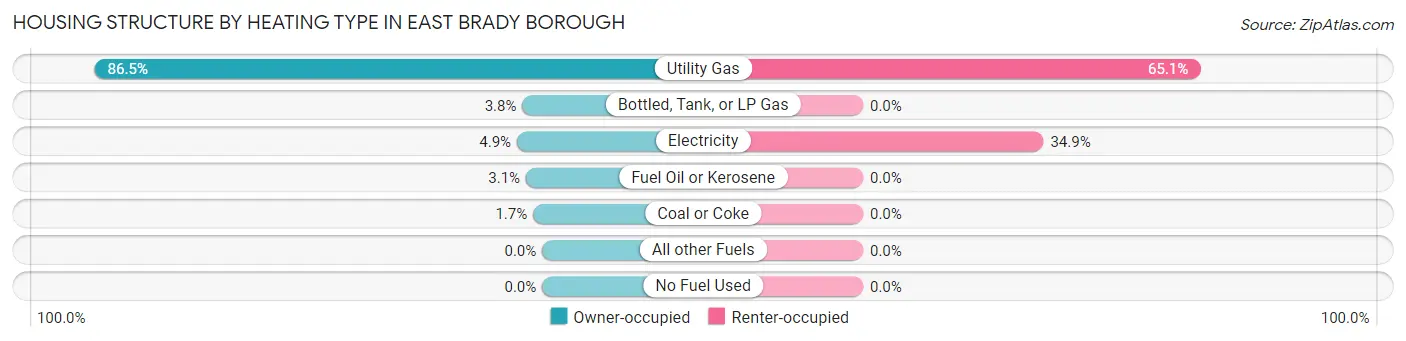
| Heating Type | Owner-occupied | Renter-occupied |
| Utility Gas | 249 (86.5%) | 99 (65.1%) |
| Bottled, Tank, or LP Gas | 11 (3.8%) | 0 (0.0%) |
| Electricity | 14 (4.9%) | 53 (34.9%) |
| Fuel Oil or Kerosene | 9 (3.1%) | 0 (0.0%) |
| Coal or Coke | 5 (1.7%) | 0 (0.0%) |
| All other Fuels | 0 (0.0%) | 0 (0.0%) |
| No Fuel Used | 0 (0.0%) | 0 (0.0%) |
| Total | 288 (100.0%) | 152 (100.0%) |
Household Vehicle Usage in East Brady borough
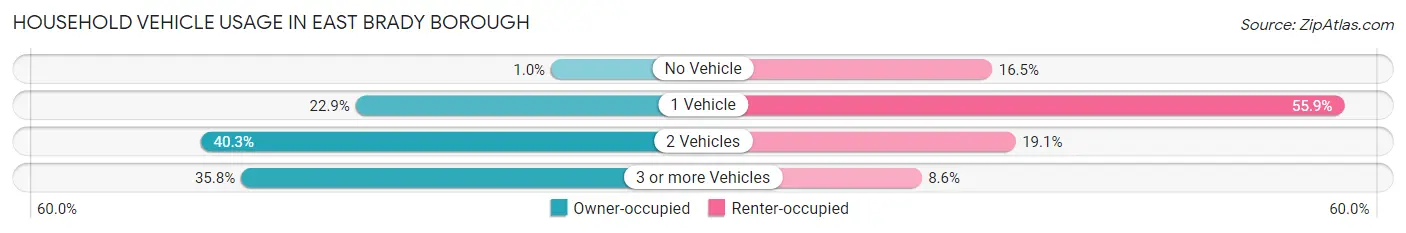
| Vehicles per Household | Owner-occupied | Renter-occupied |
| No Vehicle | 3 (1.0%) | 25 (16.5%) |
| 1 Vehicle | 66 (22.9%) | 85 (55.9%) |
| 2 Vehicles | 116 (40.3%) | 29 (19.1%) |
| 3 or more Vehicles | 103 (35.8%) | 13 (8.6%) |
| Total | 288 (100.0%) | 152 (100.0%) |
Real Estate & Mortgages in East Brady borough
Real Estate and Mortgage Overview in East Brady borough
| Characteristic | Without Mortgage | With Mortgage |
| Housing Units | 127 | 161 |
| Median Property Value | $88,300 | $138,100 |
| Median Household Income | $65,938 | $41 |
| Monthly Housing Costs | $405 | $0 |
| Real Estate Taxes | $958 | $2 |
Property Value by Mortgage Status in East Brady borough
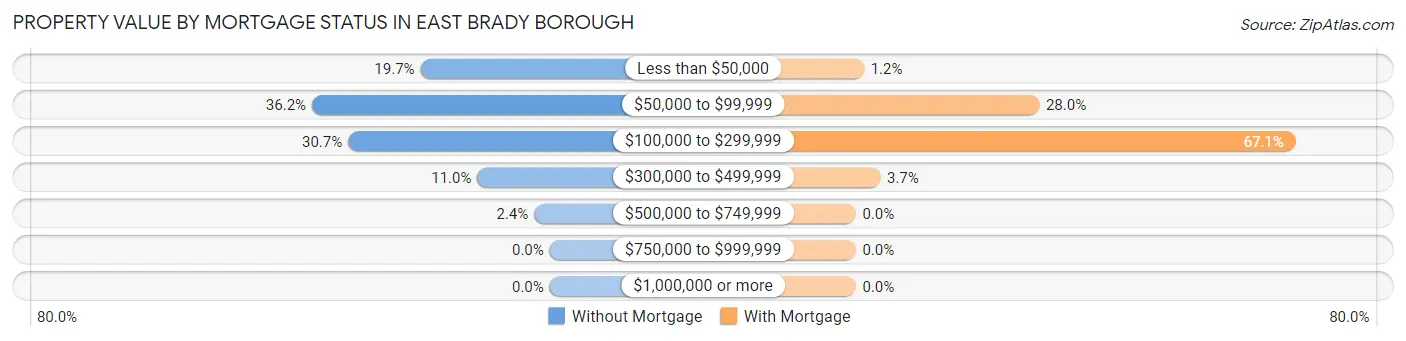
| Property Value | Without Mortgage | With Mortgage |
| Less than $50,000 | 25 (19.7%) | 2 (1.2%) |
| $50,000 to $99,999 | 46 (36.2%) | 45 (28.0%) |
| $100,000 to $299,999 | 39 (30.7%) | 108 (67.1%) |
| $300,000 to $499,999 | 14 (11.0%) | 6 (3.7%) |
| $500,000 to $749,999 | 3 (2.4%) | 0 (0.0%) |
| $750,000 to $999,999 | 0 (0.0%) | 0 (0.0%) |
| $1,000,000 or more | 0 (0.0%) | 0 (0.0%) |
| Total | 127 (100.0%) | 161 (100.0%) |
Household Income by Mortgage Status in East Brady borough
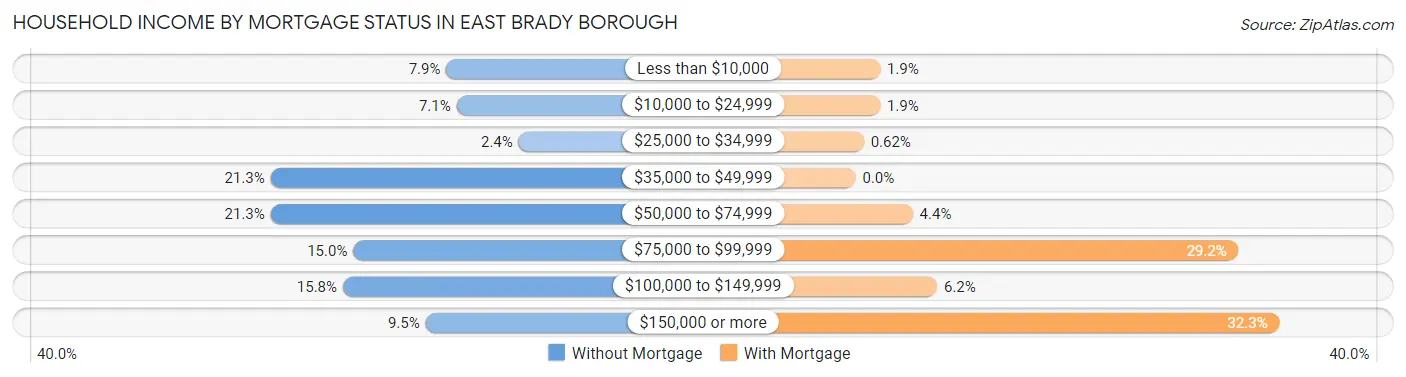
| Household Income | Without Mortgage | With Mortgage |
| Less than $10,000 | 10 (7.9%) | 3 (1.9%) |
| $10,000 to $24,999 | 9 (7.1%) | 3 (1.9%) |
| $25,000 to $34,999 | 3 (2.4%) | 1 (0.6%) |
| $35,000 to $49,999 | 27 (21.3%) | 0 (0.0%) |
| $50,000 to $74,999 | 27 (21.3%) | 7 (4.3%) |
| $75,000 to $99,999 | 19 (15.0%) | 47 (29.2%) |
| $100,000 to $149,999 | 20 (15.8%) | 10 (6.2%) |
| $150,000 or more | 12 (9.5%) | 52 (32.3%) |
| Total | 127 (100.0%) | 161 (100.0%) |
Property Value to Household Income Ratio in East Brady borough
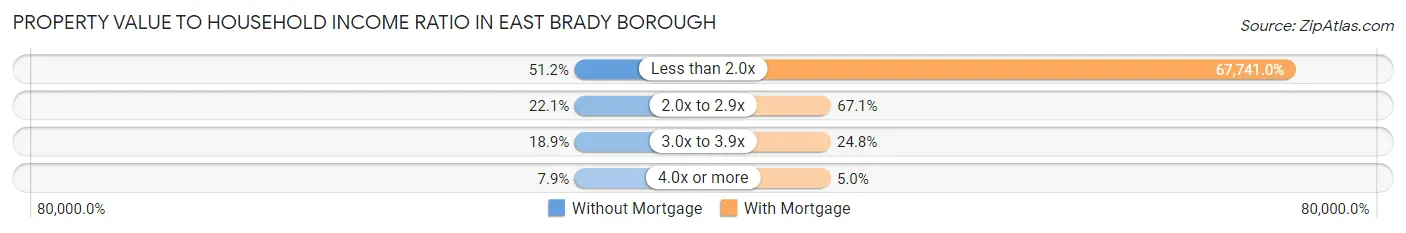
| Value-to-Income Ratio | Without Mortgage | With Mortgage |
| Less than 2.0x | 65 (51.2%) | 109,063 (67,741.0%) |
| 2.0x to 2.9x | 28 (22.1%) | 108 (67.1%) |
| 3.0x to 3.9x | 24 (18.9%) | 40 (24.8%) |
| 4.0x or more | 10 (7.9%) | 8 (5.0%) |
| Total | 127 (100.0%) | 161 (100.0%) |
Real Estate Taxes by Mortgage Status in East Brady borough
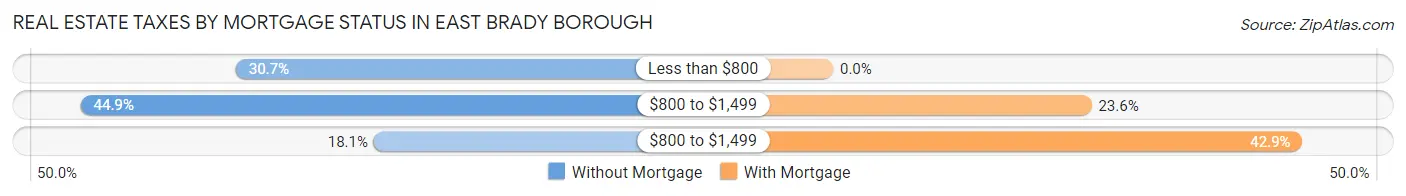
| Property Taxes | Without Mortgage | With Mortgage |
| Less than $800 | 39 (30.7%) | 0 (0.0%) |
| $800 to $1,499 | 57 (44.9%) | 38 (23.6%) |
| $800 to $1,499 | 23 (18.1%) | 69 (42.9%) |
| Total | 127 (100.0%) | 161 (100.0%) |
Health & Disability in East Brady borough
Health Insurance Coverage by Age in East Brady borough
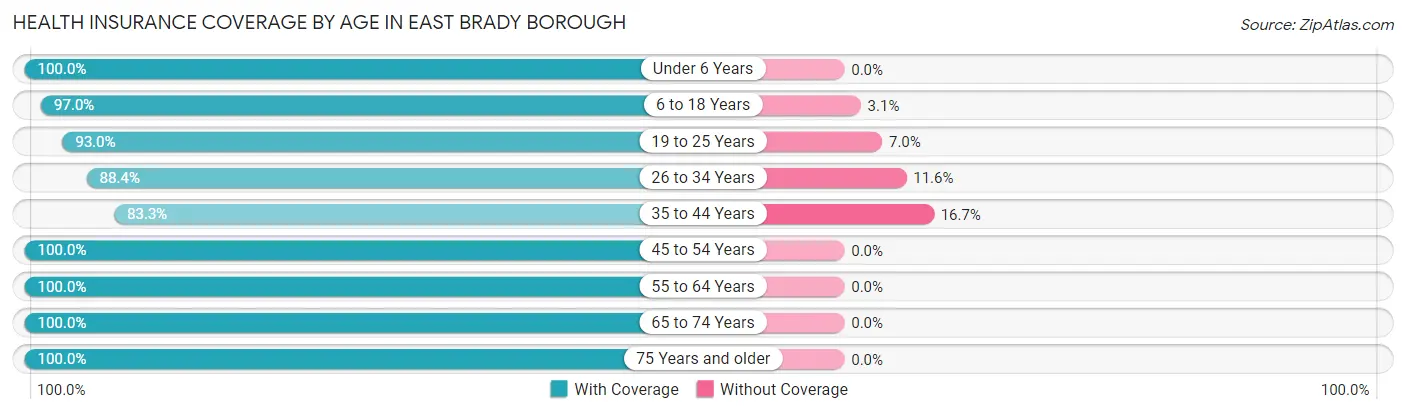
| Age Bracket | With Coverage | Without Coverage |
| Under 6 Years | 72 (100.0%) | 0 (0.0%) |
| 6 to 18 Years | 159 (97.0%) | 5 (3.0%) |
| 19 to 25 Years | 66 (93.0%) | 5 (7.0%) |
| 26 to 34 Years | 130 (88.4%) | 17 (11.6%) |
| 35 to 44 Years | 115 (83.3%) | 23 (16.7%) |
| 45 to 54 Years | 109 (100.0%) | 0 (0.0%) |
| 55 to 64 Years | 142 (100.0%) | 0 (0.0%) |
| 65 to 74 Years | 121 (100.0%) | 0 (0.0%) |
| 75 Years and older | 86 (100.0%) | 0 (0.0%) |
| Total | 1,000 (95.2%) | 50 (4.8%) |
Health Insurance Coverage by Citizenship Status in East Brady borough
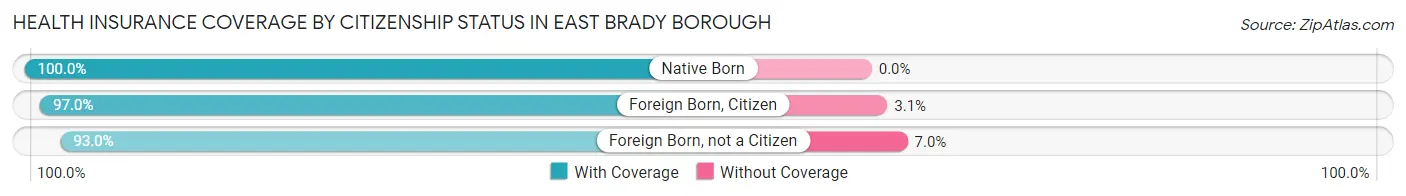
| Citizenship Status | With Coverage | Without Coverage |
| Native Born | 72 (100.0%) | 0 (0.0%) |
| Foreign Born, Citizen | 159 (97.0%) | 5 (3.0%) |
| Foreign Born, not a Citizen | 66 (93.0%) | 5 (7.0%) |
Health Insurance Coverage by Household Income in East Brady borough
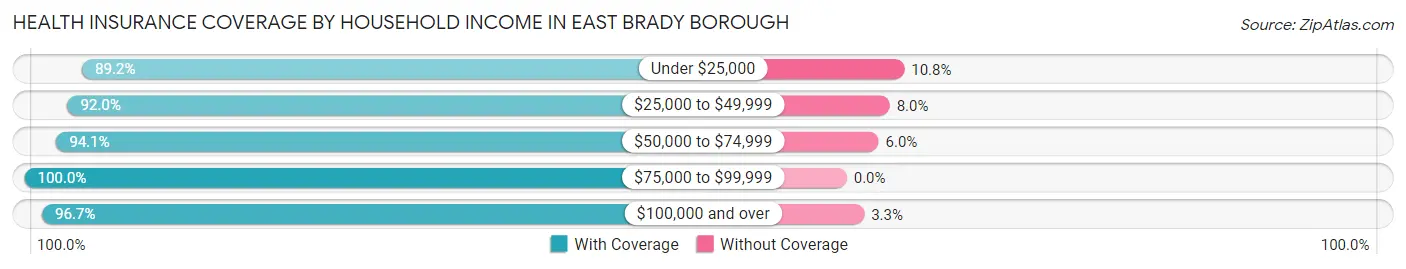
| Household Income | With Coverage | Without Coverage |
| Under $25,000 | 116 (89.2%) | 14 (10.8%) |
| $25,000 to $49,999 | 103 (92.0%) | 9 (8.0%) |
| $50,000 to $74,999 | 174 (94.1%) | 11 (5.9%) |
| $75,000 to $99,999 | 122 (100.0%) | 0 (0.0%) |
| $100,000 and over | 474 (96.7%) | 16 (3.3%) |
Public vs Private Health Insurance Coverage by Age in East Brady borough
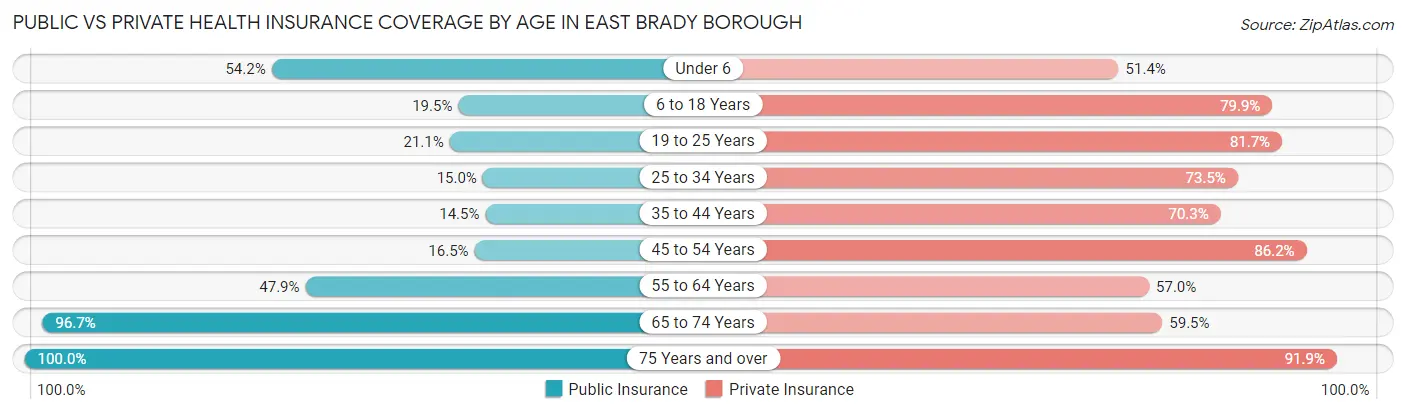
| Age Bracket | Public Insurance | Private Insurance |
| Under 6 | 39 (54.2%) | 37 (51.4%) |
| 6 to 18 Years | 32 (19.5%) | 131 (79.9%) |
| 19 to 25 Years | 15 (21.1%) | 58 (81.7%) |
| 25 to 34 Years | 22 (15.0%) | 108 (73.5%) |
| 35 to 44 Years | 20 (14.5%) | 97 (70.3%) |
| 45 to 54 Years | 18 (16.5%) | 94 (86.2%) |
| 55 to 64 Years | 68 (47.9%) | 81 (57.0%) |
| 65 to 74 Years | 117 (96.7%) | 72 (59.5%) |
| 75 Years and over | 86 (100.0%) | 79 (91.9%) |
| Total | 417 (39.7%) | 757 (72.1%) |
Disability Status by Sex by Age in East Brady borough
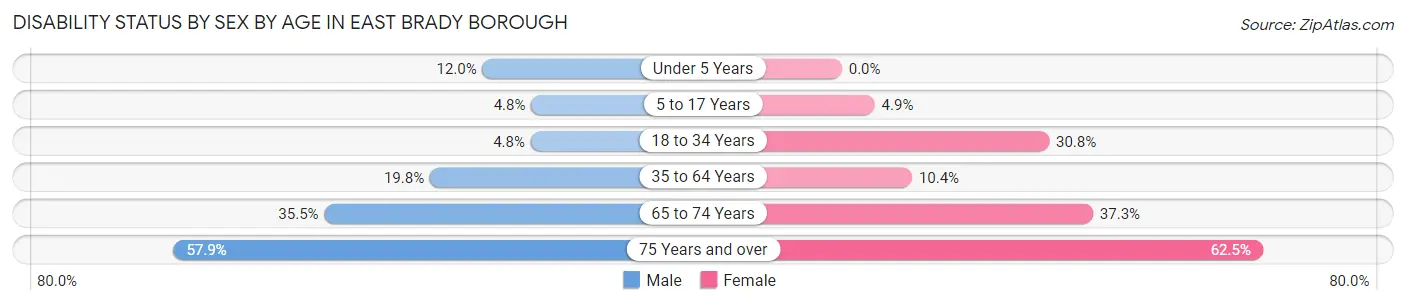
| Age Bracket | Male | Female |
| Under 5 Years | 3 (12.0%) | 0 (0.0%) |
| 5 to 17 Years | 4 (4.8%) | 4 (4.9%) |
| 18 to 34 Years | 7 (4.8%) | 24 (30.8%) |
| 35 to 64 Years | 39 (19.8%) | 20 (10.4%) |
| 65 to 74 Years | 22 (35.5%) | 22 (37.3%) |
| 75 Years and over | 22 (57.9%) | 30 (62.5%) |
Disability Class by Sex by Age in East Brady borough
Disability Class: Hearing Difficulty
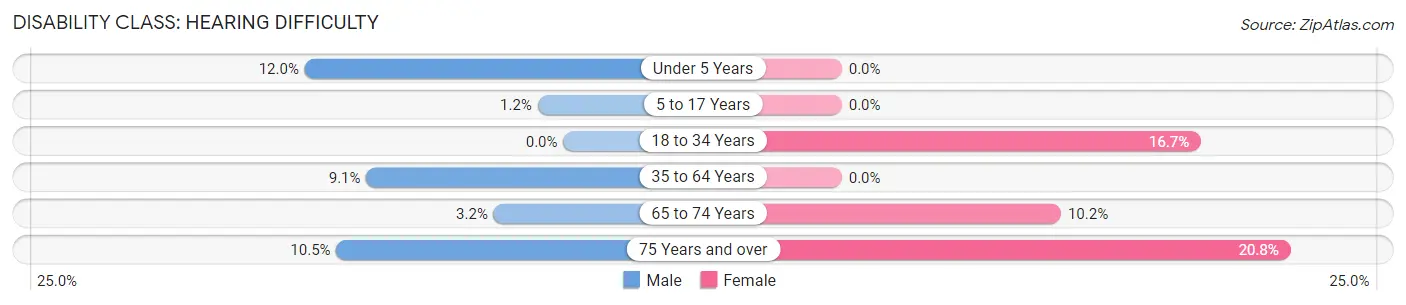
| Age Bracket | Male | Female |
| Under 5 Years | 3 (12.0%) | 0 (0.0%) |
| 5 to 17 Years | 1 (1.2%) | 0 (0.0%) |
| 18 to 34 Years | 0 (0.0%) | 13 (16.7%) |
| 35 to 64 Years | 18 (9.1%) | 0 (0.0%) |
| 65 to 74 Years | 2 (3.2%) | 6 (10.2%) |
| 75 Years and over | 4 (10.5%) | 10 (20.8%) |
Disability Class: Vision Difficulty
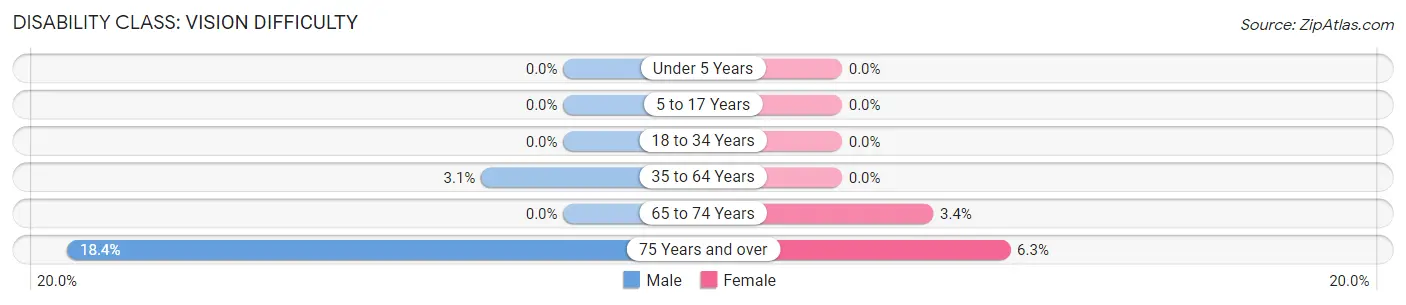
| Age Bracket | Male | Female |
| Under 5 Years | 0 (0.0%) | 0 (0.0%) |
| 5 to 17 Years | 0 (0.0%) | 0 (0.0%) |
| 18 to 34 Years | 0 (0.0%) | 0 (0.0%) |
| 35 to 64 Years | 6 (3.0%) | 0 (0.0%) |
| 65 to 74 Years | 0 (0.0%) | 2 (3.4%) |
| 75 Years and over | 7 (18.4%) | 3 (6.2%) |
Disability Class: Cognitive Difficulty
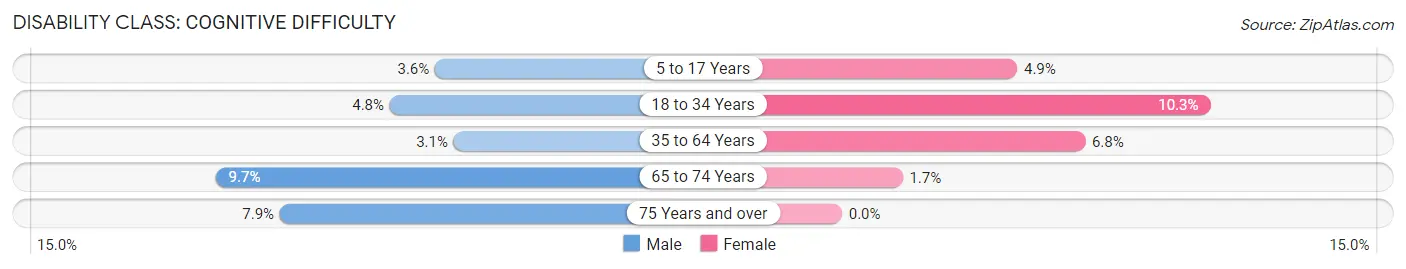
| Age Bracket | Male | Female |
| 5 to 17 Years | 3 (3.6%) | 4 (4.9%) |
| 18 to 34 Years | 7 (4.8%) | 8 (10.3%) |
| 35 to 64 Years | 6 (3.0%) | 13 (6.8%) |
| 65 to 74 Years | 6 (9.7%) | 1 (1.7%) |
| 75 Years and over | 3 (7.9%) | 0 (0.0%) |
Disability Class: Ambulatory Difficulty
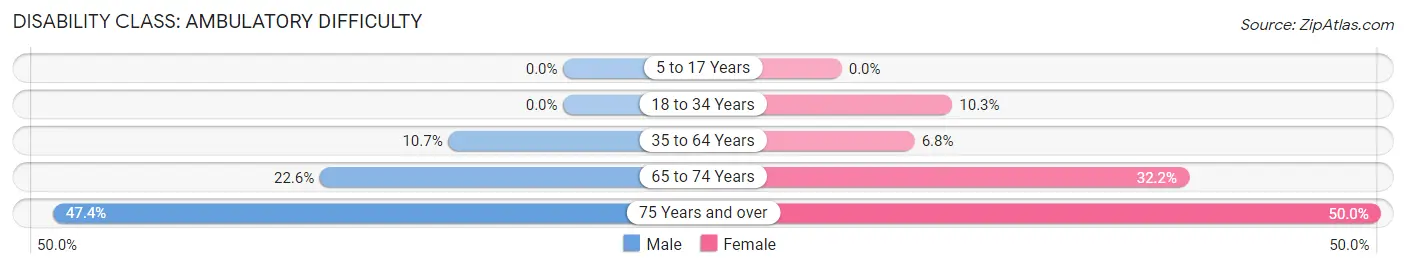
| Age Bracket | Male | Female |
| 5 to 17 Years | 0 (0.0%) | 0 (0.0%) |
| 18 to 34 Years | 0 (0.0%) | 8 (10.3%) |
| 35 to 64 Years | 21 (10.7%) | 13 (6.8%) |
| 65 to 74 Years | 14 (22.6%) | 19 (32.2%) |
| 75 Years and over | 18 (47.4%) | 24 (50.0%) |
Disability Class: Self-Care Difficulty
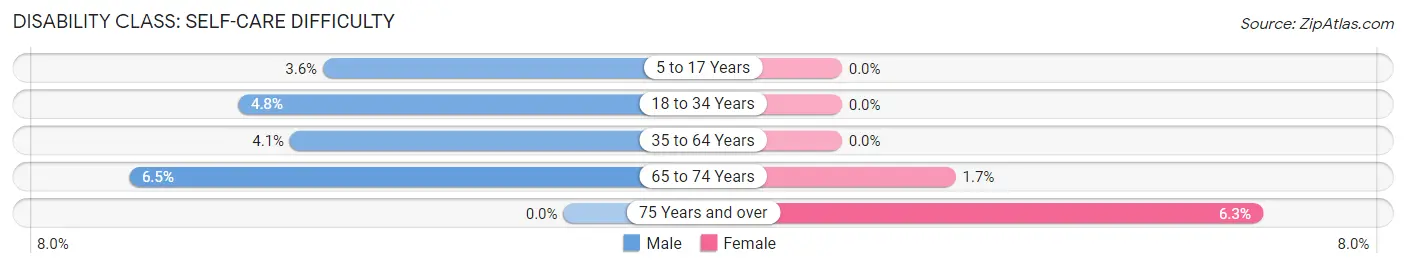
| Age Bracket | Male | Female |
| 5 to 17 Years | 3 (3.6%) | 0 (0.0%) |
| 18 to 34 Years | 7 (4.8%) | 0 (0.0%) |
| 35 to 64 Years | 8 (4.1%) | 0 (0.0%) |
| 65 to 74 Years | 4 (6.5%) | 1 (1.7%) |
| 75 Years and over | 0 (0.0%) | 3 (6.2%) |
Technology Access in East Brady borough
Computing Device Access in East Brady borough
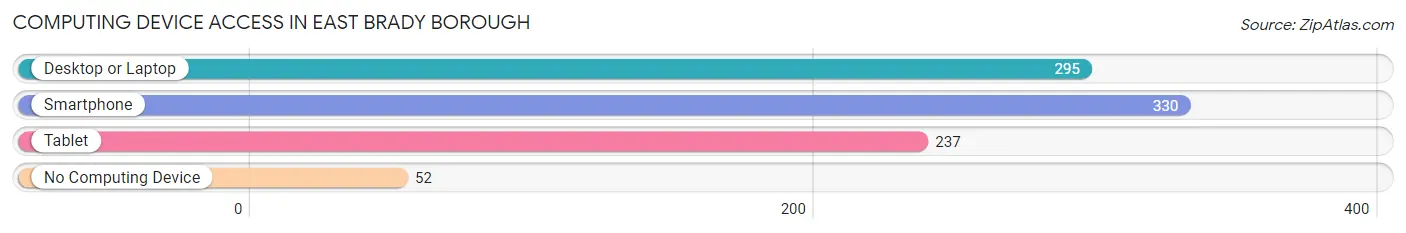
| Device Type | # Households | % Households |
| Desktop or Laptop | 295 | 67.0% |
| Smartphone | 330 | 75.0% |
| Tablet | 237 | 53.9% |
| No Computing Device | 52 | 11.8% |
| Total | 440 | 100.0% |
Internet Access in East Brady borough
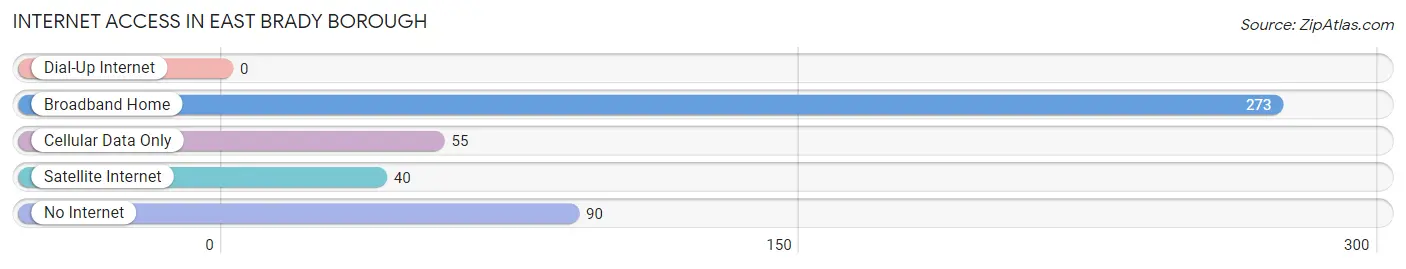
| Internet Type | # Households | % Households |
| Dial-Up Internet | 0 | 0.0% |
| Broadband Home | 273 | 62.1% |
| Cellular Data Only | 55 | 12.5% |
| Satellite Internet | 40 | 9.1% |
| No Internet | 90 | 20.4% |
| Total | 440 | 100.0% |
East Brady borough Summary
History
East Brady Borough is a small borough located in Butler County, Pennsylvania. It is situated along the Allegheny River, approximately 40 miles north of Pittsburgh. The borough was founded in 1876 and was named after the Brady family, who were early settlers in the area.
The first settlers in the area were Native Americans, who lived in the area for thousands of years before the arrival of Europeans. The first Europeans to settle in the area were the French, who established a trading post in the area in the late 1700s. The area was then part of the Northwest Territory, and was later part of the Commonwealth of Pennsylvania.
The Brady family arrived in the area in the early 1800s and established a farm. The family was influential in the development of the area, and the borough was named after them. The Brady family also established a ferry service across the Allegheny River, which was an important transportation link for the area.
The borough was officially incorporated in 1876, and the first mayor was elected in 1877. The borough was primarily an agricultural community, with the main crops being corn, wheat, and hay. The borough also had a number of small businesses, including a sawmill, a gristmill, and a blacksmith shop.
In the late 1800s, the borough began to grow and develop. The first school was built in 1883, and the first church was built in 1885. The borough also had a number of stores, including a general store, a drug store, and a hardware store.
The borough continued to grow and develop throughout the 20th century. In the 1950s, the borough was connected to the Pennsylvania Turnpike, which provided easy access to Pittsburgh and other cities. The borough also had a number of small businesses, including a grocery store, a hardware store, and a gas station.
Geography
East Brady Borough is located in Butler County, Pennsylvania. It is situated along the Allegheny River, approximately 40 miles north of Pittsburgh. The borough covers an area of 1.2 square miles, and has a population of approximately 1,400 people.
The borough is located in a rural area, and is surrounded by rolling hills and farmland. The borough is located in the Allegheny Plateau region of Pennsylvania, and is part of the Allegheny River watershed. The borough is located in the Eastern Time Zone.
Economy
The economy of East Brady Borough is primarily based on agriculture and tourism. The borough is home to a number of small businesses, including a grocery store, a hardware store, and a gas station. The borough also has a number of restaurants and bars.
The borough is also home to a number of tourist attractions, including the Brady's Bend Overlook, which offers views of the Allegheny River and the surrounding countryside. The borough also has a number of parks and recreational areas, including the Brady's Bend Park and the Brady's Bend Nature Preserve.
Demographics
As of the 2010 census, the population of East Brady Borough was 1,400 people. The racial makeup of the borough was 97.4% White, 0.7% African American, 0.1% Native American, 0.3% Asian, and 1.5% from other races. The median household income was $37,500, and the median family income was $45,000. The per capita income was $19,000.
Common Questions
What is Per Capita Income in East Brady borough?
Per Capita income in East Brady borough is $32,293.
What is the Median Family Income in East Brady borough?
Median Family Income in East Brady borough is $94,167.
What is the Median Household income in East Brady borough?
Median Household Income in East Brady borough is $59,375.
What is Income or Wage Gap in East Brady borough?
Income or Wage Gap in East Brady borough is 43.7%.
Women in East Brady borough earn 56.3 cents for every dollar earned by a man.
What is Inequality or Gini Index in East Brady borough?
Inequality or Gini Index in East Brady borough is 0.43.
What is the Total Population of East Brady borough?
Total Population of East Brady borough is 1,072.
What is the Total Male Population of East Brady borough?
Total Male Population of East Brady borough is 551.
What is the Total Female Population of East Brady borough?
Total Female Population of East Brady borough is 521.
What is the Ratio of Males per 100 Females in East Brady borough?
There are 105.76 Males per 100 Females in East Brady borough.
What is the Ratio of Females per 100 Males in East Brady borough?
There are 94.56 Females per 100 Males in East Brady borough.
What is the Median Population Age in East Brady borough?
Median Population Age in East Brady borough is 41.1 Years.
What is the Average Family Size in East Brady borough
Average Family Size in East Brady borough is 3.1 People.
What is the Average Household Size in East Brady borough
Average Household Size in East Brady borough is 2.4 People.
How Large is the Labor Force in East Brady borough?
There are 508 People in the Labor Forcein in East Brady borough.
What is the Percentage of People in the Labor Force in East Brady borough?
57.2% of People are in the Labor Force in East Brady borough.
What is the Unemployment Rate in East Brady borough?
Unemployment Rate in East Brady borough is 5.1%.