Dublin borough, PA Map & Demographics
Dublin borough Overview
$43,084
PER CAPITA INCOME
$106,833
AVG FAMILY INCOME
$87,292
AVG HOUSEHOLD INCOME
3.0%
WAGE / INCOME GAP [ % ]
97.0¢/ $1
WAGE / INCOME GAP [ $ ]
0.40
INEQUALITY / GINI INDEX
2,206
TOTAL POPULATION
1,066
MALE POPULATION
1,140
FEMALE POPULATION
93.51
MALES / 100 FEMALES
106.94
FEMALES / 100 MALES
40.2
MEDIAN AGE
3.4
AVG FAMILY SIZE
2.2
AVG HOUSEHOLD SIZE
1,299
LABOR FORCE [ PEOPLE ]
73.0%
PERCENT IN LABOR FORCE
5.7%
UNEMPLOYMENT RATE
Income in Dublin borough
Income Overview in Dublin borough
Per Capita Income in Dublin borough is $43,084, while median incomes of families and households are $106,833 and $87,292 respectively.
| Characteristic | Number | Measure |
| Per Capita Income | 2,206 | $43,084 |
| Median Family Income | 494 | $106,833 |
| Mean Family Income | 494 | $120,459 |
| Median Household Income | 966 | $87,292 |
| Mean Household Income | 966 | $97,194 |
| Income Deficit | 494 | $0 |
| Wage / Income Gap (%) | 2,206 | 3.03% |
| Wage / Income Gap ($) | 2,206 | 96.97¢ per $1 |
| Gini / Inequality Index | 2,206 | 0.40 |
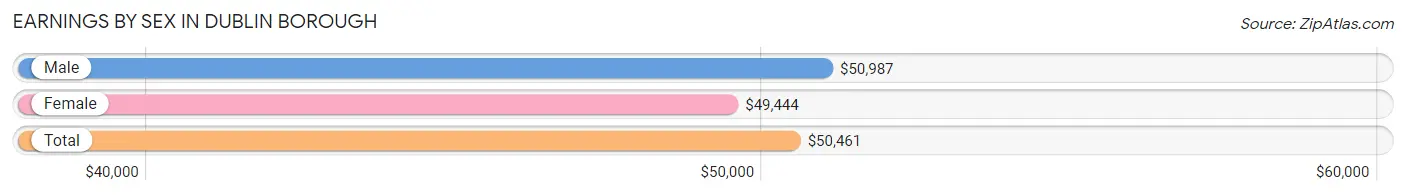
Earnings by Sex in Dublin borough
Average Earnings in Dublin borough are $50,461, $50,987 for men and $49,444 for women, a difference of 3.0%.
| Sex | Number | Average Earnings |
| Male | 677 (52.9%) | $50,987 |
| Female | 602 (47.1%) | $49,444 |
| Total | 1,279 (100.0%) | $50,461 |
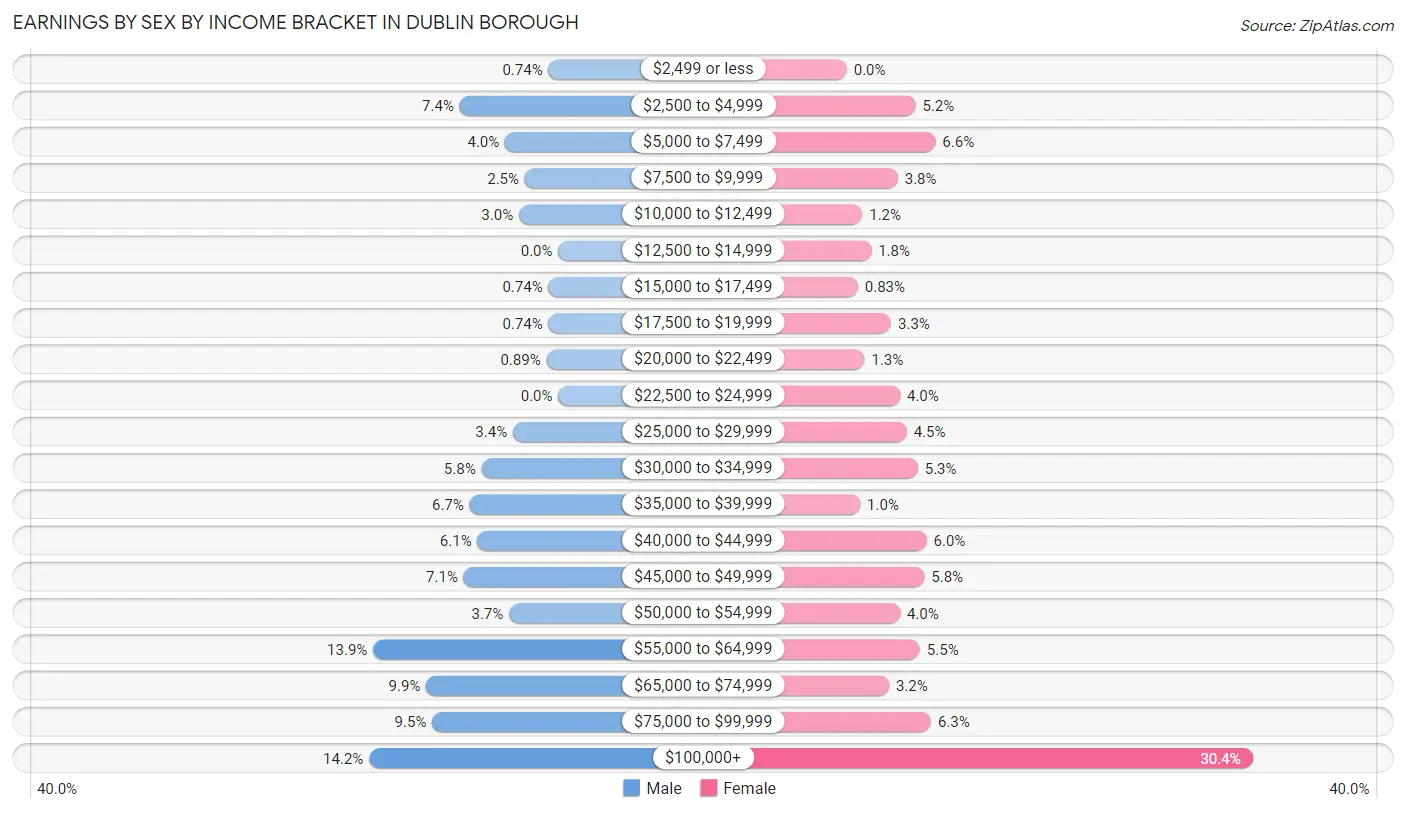
Earnings by Sex by Income Bracket in Dublin borough
The most common earnings brackets in Dublin borough are $100,000+ for men (96 | 14.2%) and $100,000+ for women (183 | 30.4%).
| Income | Male | Female |
| $2,499 or less | 5 (0.7%) | 0 (0.0%) |
| $2,500 to $4,999 | 50 (7.4%) | 31 (5.1%) |
| $5,000 to $7,499 | 27 (4.0%) | 40 (6.6%) |
| $7,500 to $9,999 | 17 (2.5%) | 23 (3.8%) |
| $10,000 to $12,499 | 20 (2.9%) | 7 (1.2%) |
| $12,500 to $14,999 | 0 (0.0%) | 11 (1.8%) |
| $15,000 to $17,499 | 5 (0.7%) | 5 (0.8%) |
| $17,500 to $19,999 | 5 (0.7%) | 20 (3.3%) |
| $20,000 to $22,499 | 6 (0.9%) | 8 (1.3%) |
| $22,500 to $24,999 | 0 (0.0%) | 24 (4.0%) |
| $25,000 to $29,999 | 23 (3.4%) | 27 (4.5%) |
| $30,000 to $34,999 | 39 (5.8%) | 32 (5.3%) |
| $35,000 to $39,999 | 45 (6.7%) | 6 (1.0%) |
| $40,000 to $44,999 | 41 (6.1%) | 36 (6.0%) |
| $45,000 to $49,999 | 48 (7.1%) | 35 (5.8%) |
| $50,000 to $54,999 | 25 (3.7%) | 24 (4.0%) |
| $55,000 to $64,999 | 94 (13.9%) | 33 (5.5%) |
| $65,000 to $74,999 | 67 (9.9%) | 19 (3.2%) |
| $75,000 to $99,999 | 64 (9.5%) | 38 (6.3%) |
| $100,000+ | 96 (14.2%) | 183 (30.4%) |
| Total | 677 (100.0%) | 602 (100.0%) |
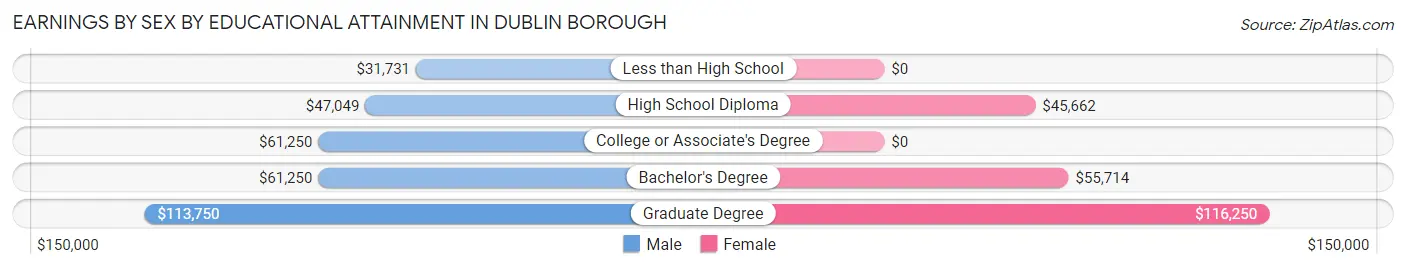
Earnings by Sex by Educational Attainment in Dublin borough
Average earnings in Dublin borough are $56,292 for men and $54,427 for women, a difference of 3.3%. Men with an educational attainment of graduate degree enjoy the highest average annual earnings of $113,750, while those with less than high school education earn the least with $31,731. Women with an educational attainment of graduate degree earn the most with the average annual earnings of $116,250, while those with high school diploma education have the smallest earnings of $45,662.
| Educational Attainment | Male Income | Female Income |
| Less than High School | $31,731 | $0 |
| High School Diploma | $47,049 | $45,662 |
| College or Associate's Degree | $61,250 | $0 |
| Bachelor's Degree | $61,250 | $55,714 |
| Graduate Degree | $113,750 | $116,250 |
| Total | $56,292 | $54,427 |
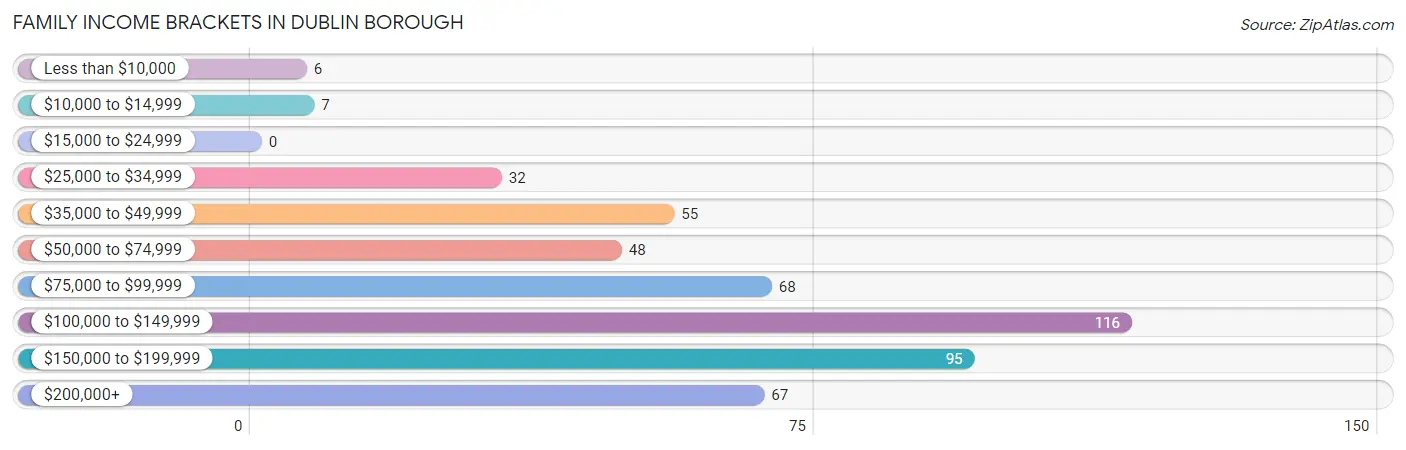
Family Income in Dublin borough
Family Income Brackets in Dublin borough
According to the Dublin borough family income data, there are 116 families falling into the $100,000 to $149,999 income range, which is the most common income bracket and makes up 23.5% of all families.
| Income Bracket | # Families | % Families |
| Less than $10,000 | 6 | 1.2% |
| $10,000 to $14,999 | 7 | 1.4% |
| $15,000 to $24,999 | 0 | 0.0% |
| $25,000 to $34,999 | 32 | 6.5% |
| $35,000 to $49,999 | 55 | 11.1% |
| $50,000 to $74,999 | 48 | 9.7% |
| $75,000 to $99,999 | 68 | 13.8% |
| $100,000 to $149,999 | 116 | 23.5% |
| $150,000 to $199,999 | 95 | 19.2% |
| $200,000+ | 67 | 13.6% |
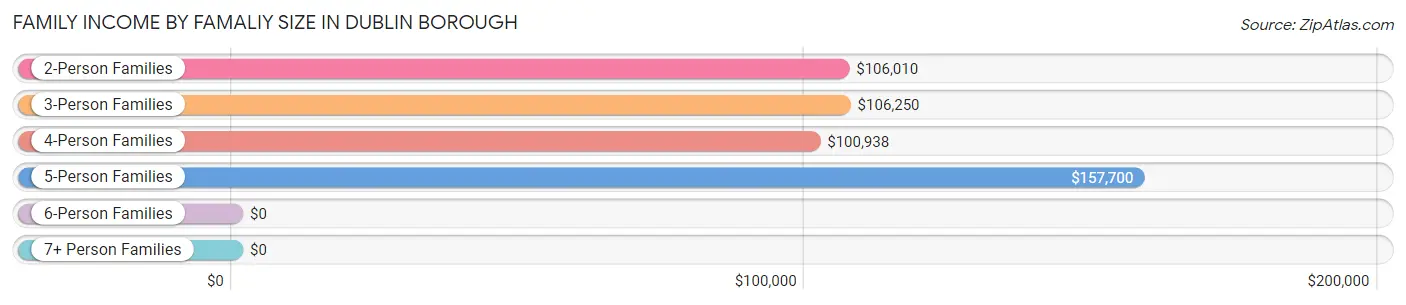
Family Income by Famaliy Size in Dublin borough
5-person families (78 | 15.8%) account for the highest median family income in Dublin borough with $157,700 per family, while 2-person families (167 | 33.8%) have the highest median income of $53,005 per family member.
| Income Bracket | # Families | Median Income |
| 2-Person Families | 167 (33.8%) | $106,010 |
| 3-Person Families | 178 (36.0%) | $106,250 |
| 4-Person Families | 57 (11.5%) | $100,938 |
| 5-Person Families | 78 (15.8%) | $157,700 |
| 6-Person Families | 3 (0.6%) | $0 |
| 7+ Person Families | 11 (2.2%) | $0 |
| Total | 494 (100.0%) | $106,833 |
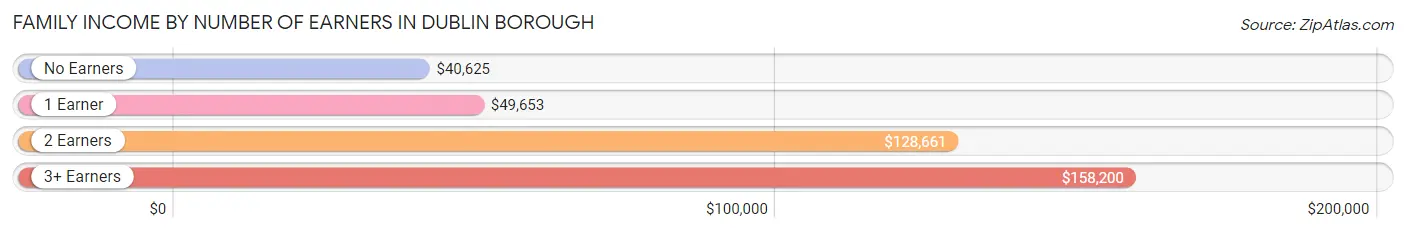
Family Income by Number of Earners in Dublin borough
The median family income in Dublin borough is $106,833, with families comprising 3+ earners (74) having the highest median family income of $158,200, while families with no earners (28) have the lowest median family income of $40,625, accounting for 15.0% and 5.7% of families, respectively.
| Number of Earners | # Families | Median Income |
| No Earners | 28 (5.7%) | $40,625 |
| 1 Earner | 149 (30.2%) | $49,653 |
| 2 Earners | 243 (49.2%) | $128,661 |
| 3+ Earners | 74 (15.0%) | $158,200 |
| Total | 494 (100.0%) | $106,833 |
Household Income in Dublin borough
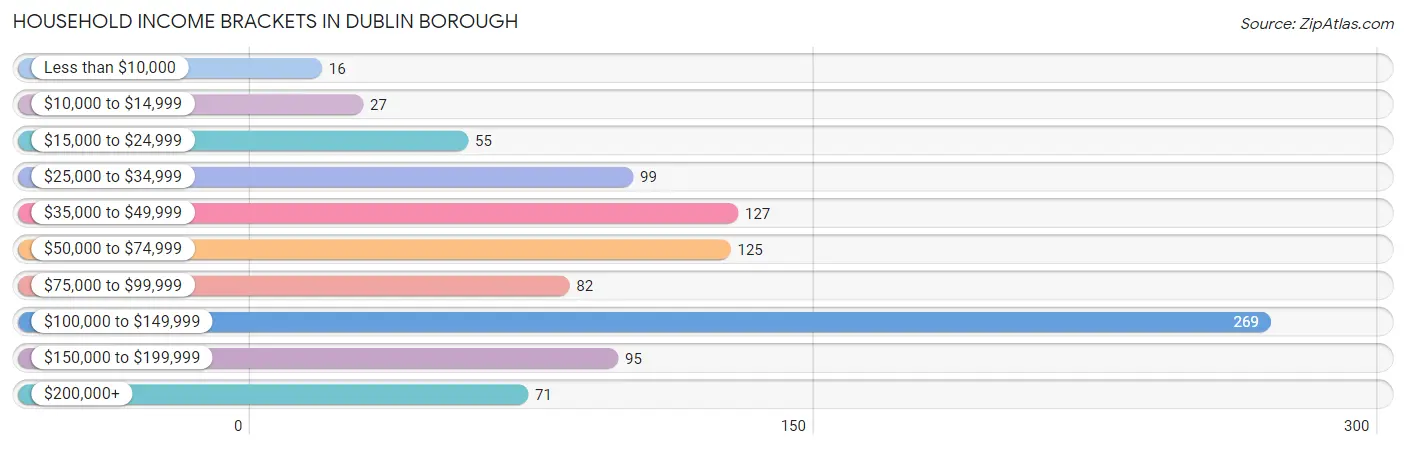
Household Income Brackets in Dublin borough
With 269 households falling in the category, the $100,000 to $149,999 income range is the most frequent in Dublin borough, accounting for 27.9% of all households. In contrast, only 16 households (1.7%) fall into the less than $10,000 income bracket, making it the least populous group.
| Income Bracket | # Households | % Households |
| Less than $10,000 | 16 | 1.7% |
| $10,000 to $14,999 | 27 | 2.8% |
| $15,000 to $24,999 | 55 | 5.7% |
| $25,000 to $34,999 | 99 | 10.2% |
| $35,000 to $49,999 | 127 | 13.1% |
| $50,000 to $74,999 | 125 | 12.9% |
| $75,000 to $99,999 | 82 | 8.5% |
| $100,000 to $149,999 | 269 | 27.8% |
| $150,000 to $199,999 | 95 | 9.8% |
| $200,000+ | 71 | 7.3% |
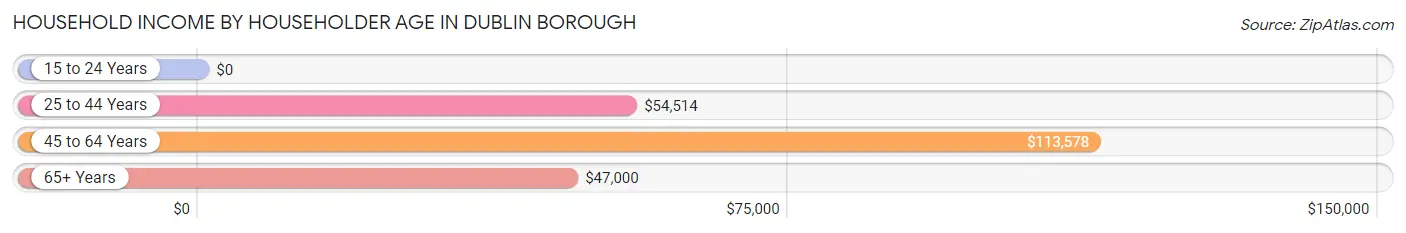
Household Income by Householder Age in Dublin borough
The median household income in Dublin borough is $87,292, with the highest median household income of $113,578 found in the 45 to 64 years age bracket for the primary householder. A total of 517 households (53.5%) fall into this category.
| Income Bracket | # Households | Median Income |
| 15 to 24 Years | 0 (0.0%) | $0 |
| 25 to 44 Years | 259 (26.8%) | $54,514 |
| 45 to 64 Years | 517 (53.5%) | $113,578 |
| 65+ Years | 190 (19.7%) | $47,000 |
| Total | 966 (100.0%) | $87,292 |
Poverty in Dublin borough
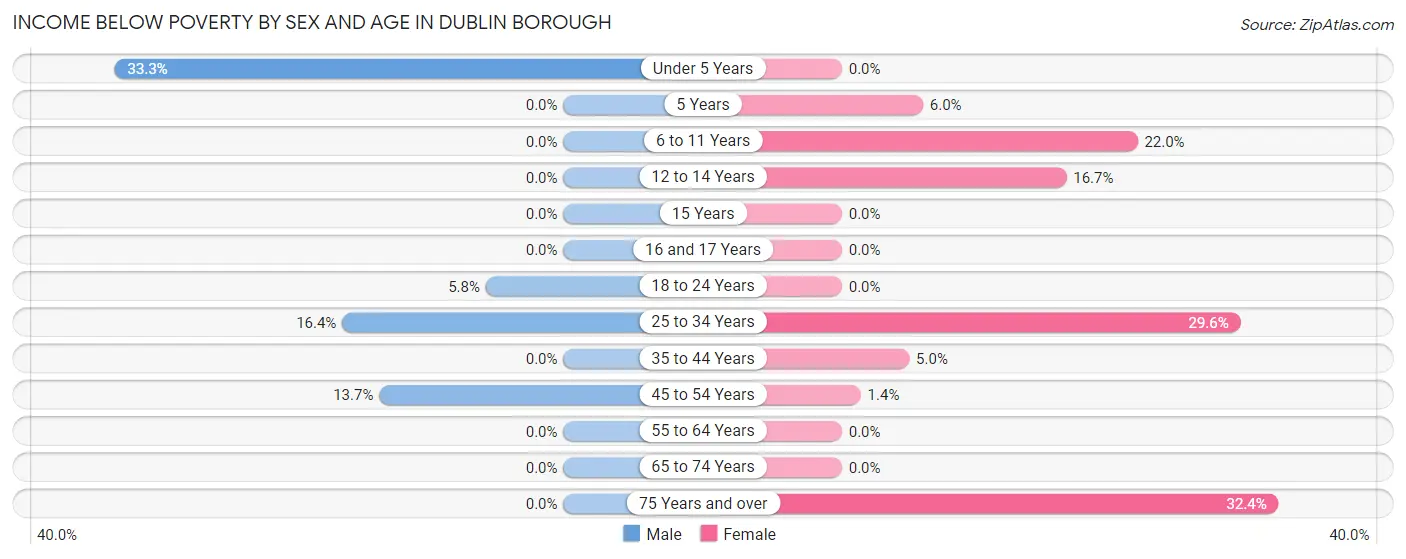
Income Below Poverty by Sex and Age in Dublin borough
With 7.2% poverty level for males and 9.1% for females among the residents of Dublin borough, under 5 year old males and 75 year old and over females are the most vulnerable to poverty, with 17 males (33.3%) and 24 females (32.4%) in their respective age groups living below the poverty level.
| Age Bracket | Male | Female |
| Under 5 Years | 17 (33.3%) | 0 (0.0%) |
| 5 Years | 0 (0.0%) | 5 (6.0%) |
| 6 to 11 Years | 0 (0.0%) | 18 (22.0%) |
| 12 to 14 Years | 0 (0.0%) | 12 (16.7%) |
| 15 Years | 0 (0.0%) | 0 (0.0%) |
| 16 and 17 Years | 0 (0.0%) | 0 (0.0%) |
| 18 to 24 Years | 8 (5.8%) | 0 (0.0%) |
| 25 to 34 Years | 33 (16.4%) | 37 (29.6%) |
| 35 to 44 Years | 0 (0.0%) | 4 (5.0%) |
| 45 to 54 Years | 19 (13.7%) | 4 (1.4%) |
| 55 to 64 Years | 0 (0.0%) | 0 (0.0%) |
| 65 to 74 Years | 0 (0.0%) | 0 (0.0%) |
| 75 Years and over | 0 (0.0%) | 24 (32.4%) |
| Total | 77 (7.2%) | 104 (9.1%) |
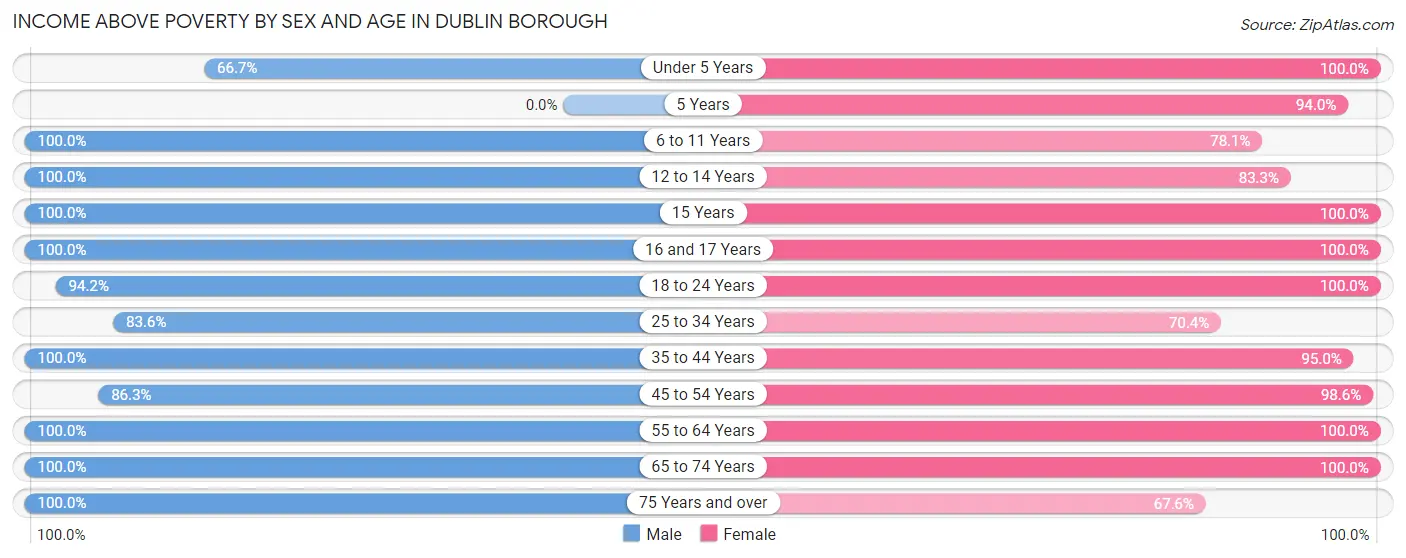
Income Above Poverty by Sex and Age in Dublin borough
According to the poverty statistics in Dublin borough, males aged 6 to 11 years and females aged under 5 years are the age groups that are most secure financially, with 100.0% of males and 100.0% of females in these age groups living above the poverty line.
| Age Bracket | Male | Female |
| Under 5 Years | 34 (66.7%) | 20 (100.0%) |
| 5 Years | 0 (0.0%) | 78 (94.0%) |
| 6 to 11 Years | 49 (100.0%) | 64 (78.0%) |
| 12 to 14 Years | 46 (100.0%) | 60 (83.3%) |
| 15 Years | 8 (100.0%) | 16 (100.0%) |
| 16 and 17 Years | 3 (100.0%) | 61 (100.0%) |
| 18 to 24 Years | 131 (94.2%) | 41 (100.0%) |
| 25 to 34 Years | 168 (83.6%) | 88 (70.4%) |
| 35 to 44 Years | 106 (100.0%) | 76 (95.0%) |
| 45 to 54 Years | 120 (86.3%) | 282 (98.6%) |
| 55 to 64 Years | 199 (100.0%) | 123 (100.0%) |
| 65 to 74 Years | 85 (100.0%) | 77 (100.0%) |
| 75 Years and over | 40 (100.0%) | 50 (67.6%) |
| Total | 989 (92.8%) | 1,036 (90.9%) |
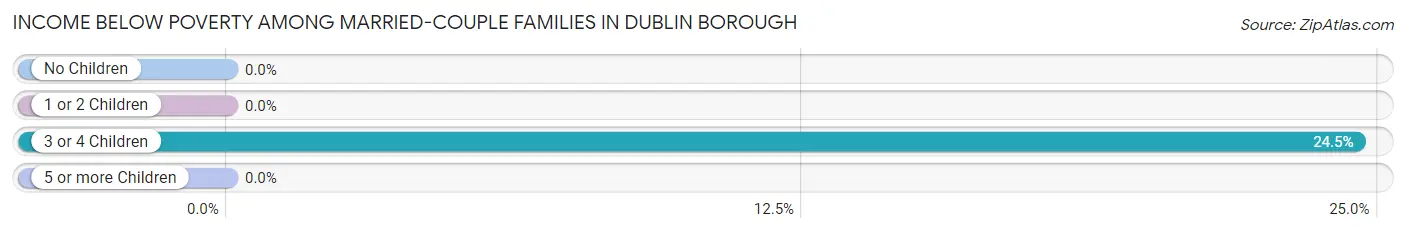
Income Below Poverty Among Married-Couple Families in Dublin borough
The poverty statistics for married-couple families in Dublin borough show that 3.4% or 13 of the total 380 families live below the poverty line. Families with 3 or 4 children have the highest poverty rate of 24.5%, comprising of 13 families. On the other hand, families with no children have the lowest poverty rate of 0.0%, which includes 0 families.
| Children | Above Poverty | Below Poverty |
| No Children | 191 (100.0%) | 0 (0.0%) |
| 1 or 2 Children | 136 (100.0%) | 0 (0.0%) |
| 3 or 4 Children | 40 (75.5%) | 13 (24.5%) |
| 5 or more Children | 0 (0.0%) | 0 (0.0%) |
| Total | 367 (96.6%) | 13 (3.4%) |
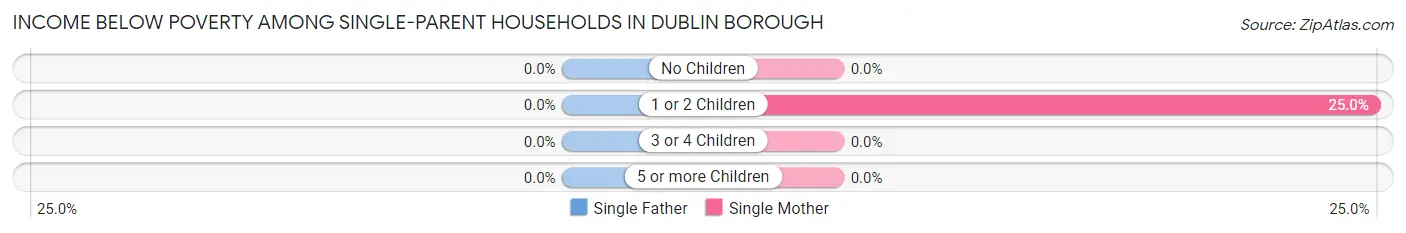
Income Below Poverty Among Single-Parent Households in Dublin borough
| Children | Single Father | Single Mother |
| No Children | 0 (0.0%) | 0 (0.0%) |
| 1 or 2 Children | 0 (0.0%) | 13 (25.0%) |
| 3 or 4 Children | 0 (0.0%) | 0 (0.0%) |
| 5 or more Children | 0 (0.0%) | 0 (0.0%) |
| Total | 0 (0.0%) | 13 (23.2%) |
Income Below Poverty Among Married-Couple vs Single-Parent Households in Dublin borough
The poverty data for Dublin borough shows that 13 of the married-couple family households (3.4%) and 13 of the single-parent households (11.4%) are living below the poverty level. Within the married-couple family households, those with 3 or 4 children have the highest poverty rate, with 13 households (24.5%) falling below the poverty line. Among the single-parent households, those with 1 or 2 children have the highest poverty rate, with 13 household (15.1%) living below poverty.
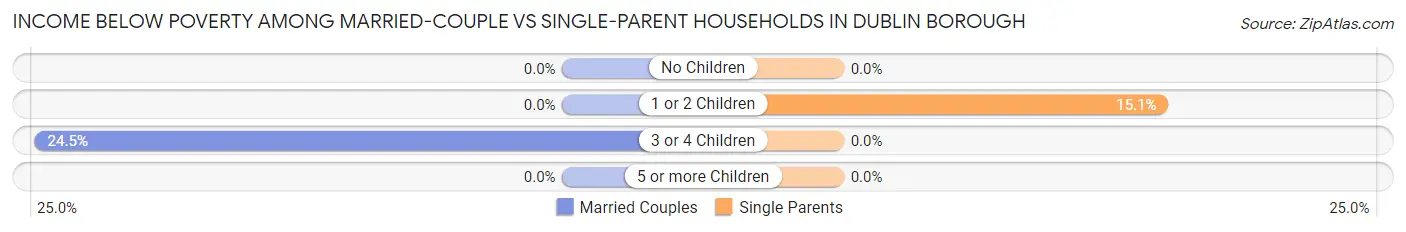
| Children | Married-Couple Families | Single-Parent Households |
| No Children | 0 (0.0%) | 0 (0.0%) |
| 1 or 2 Children | 0 (0.0%) | 13 (15.1%) |
| 3 or 4 Children | 13 (24.5%) | 0 (0.0%) |
| 5 or more Children | 0 (0.0%) | 0 (0.0%) |
| Total | 13 (3.4%) | 13 (11.4%) |
Race in Dublin borough
The most populous races in Dublin borough are White / Caucasian (1,871 | 84.8%), Hispanic or Latino (147 | 6.7%), and Two or more Races (107 | 4.9%).
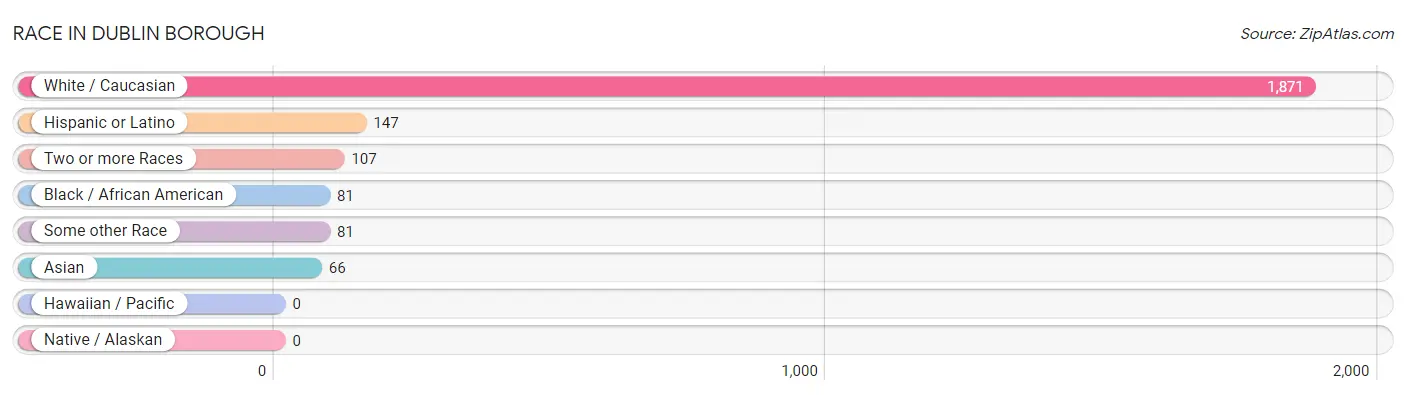
| Race | # Population | % Population |
| Asian | 66 | 3.0% |
| Black / African American | 81 | 3.7% |
| Hawaiian / Pacific | 0 | 0.0% |
| Hispanic or Latino | 147 | 6.7% |
| Native / Alaskan | 0 | 0.0% |
| White / Caucasian | 1,871 | 84.8% |
| Two or more Races | 107 | 4.9% |
| Some other Race | 81 | 3.7% |
| Total | 2,206 | 100.0% |
Ancestry in Dublin borough
The most populous ancestries reported in Dublin borough are German (567 | 25.7%), Irish (507 | 23.0%), Italian (272 | 12.3%), American (175 | 7.9%), and English (145 | 6.6%), together accounting for 75.5% of all Dublin borough residents.
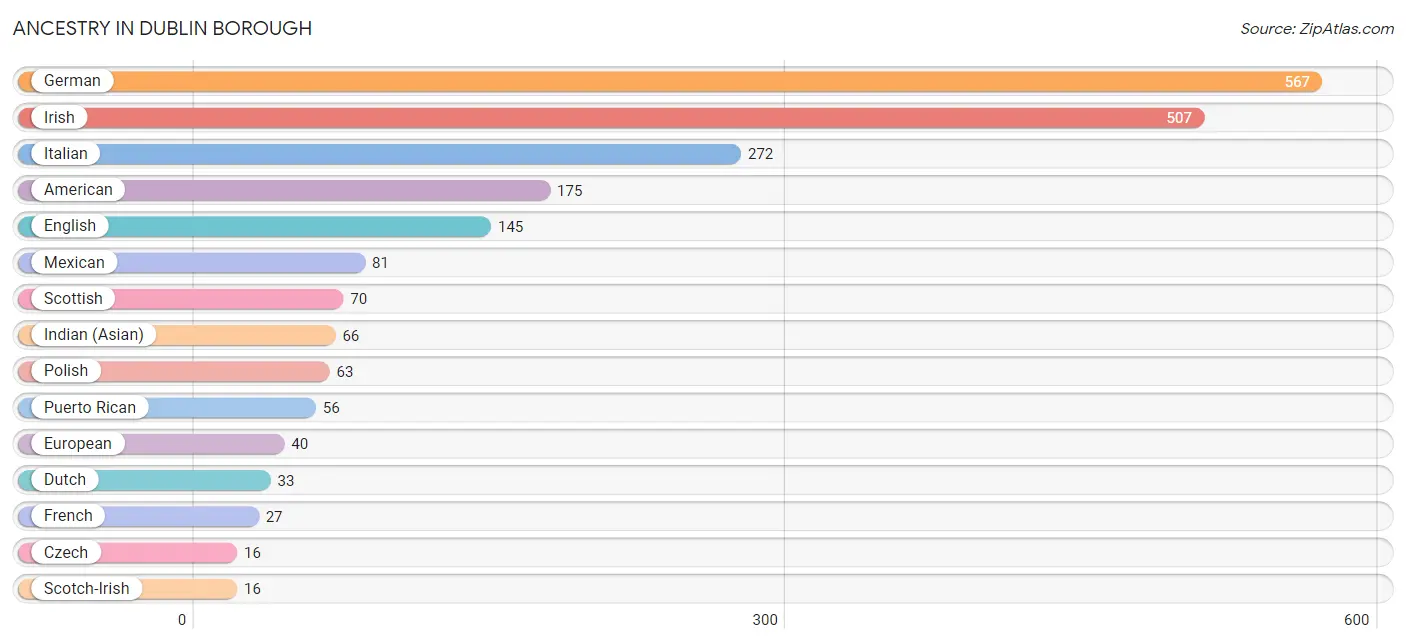
| Ancestry | # Population | % Population |
| American | 175 | 7.9% |
| Austrian | 5 | 0.2% |
| Central American | 10 | 0.4% |
| Czech | 16 | 0.7% |
| Dutch | 33 | 1.5% |
| English | 145 | 6.6% |
| European | 40 | 1.8% |
| French | 27 | 1.2% |
| French Canadian | 4 | 0.2% |
| German | 567 | 25.7% |
| Guatemalan | 10 | 0.4% |
| Hungarian | 11 | 0.5% |
| Indian (Asian) | 66 | 3.0% |
| Irish | 507 | 23.0% |
| Italian | 272 | 12.3% |
| Lithuanian | 8 | 0.4% |
| Mexican | 81 | 3.7% |
| Norwegian | 8 | 0.4% |
| Pennsylvania German | 5 | 0.2% |
| Polish | 63 | 2.9% |
| Puerto Rican | 56 | 2.5% |
| Russian | 4 | 0.2% |
| Scandinavian | 8 | 0.4% |
| Scotch-Irish | 16 | 0.7% |
| Scottish | 70 | 3.2% |
| Swedish | 15 | 0.7% |
| Swiss | 10 | 0.4% |
| Ukrainian | 7 | 0.3% |
| Welsh | 12 | 0.5% | View All 29 Rows |
Immigrants in Dublin borough
The most numerous immigrant groups reported in Dublin borough came from Central America (38 | 1.7%), Latin America (38 | 1.7%), Asia (34 | 1.5%), China (34 | 1.5%), and Eastern Asia (34 | 1.5%), together accounting for 8.1% of all Dublin borough residents.
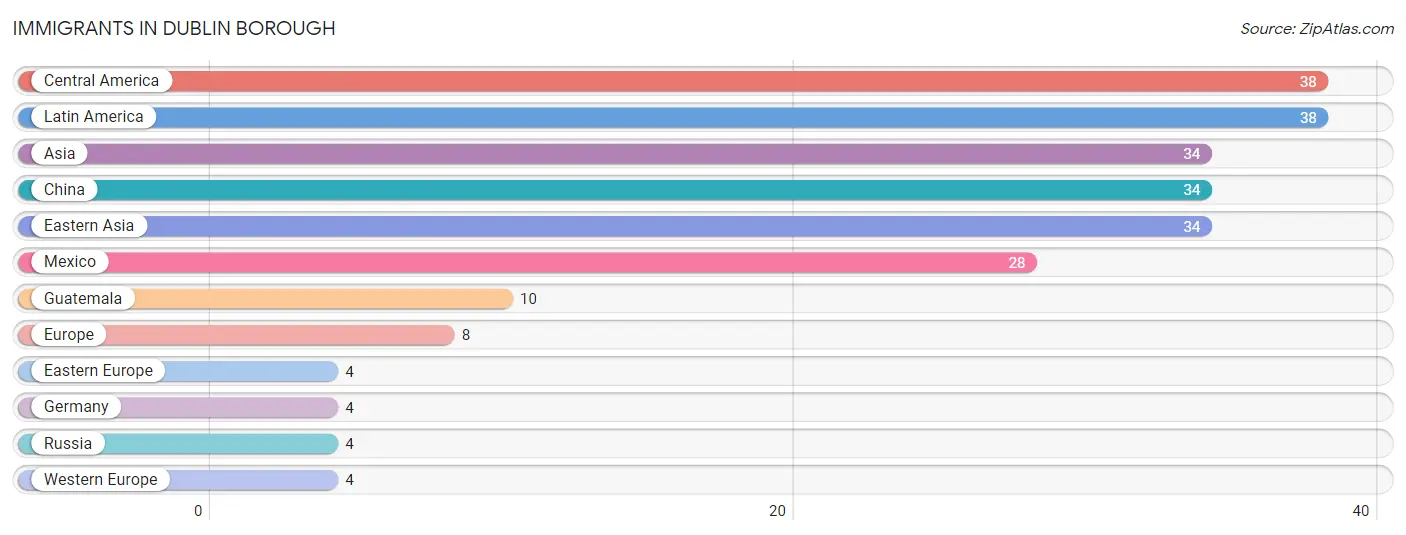
| Immigration Origin | # Population | % Population |
| Asia | 34 | 1.5% |
| Central America | 38 | 1.7% |
| China | 34 | 1.5% |
| Eastern Asia | 34 | 1.5% |
| Eastern Europe | 4 | 0.2% |
| Europe | 8 | 0.4% |
| Germany | 4 | 0.2% |
| Guatemala | 10 | 0.4% |
| Latin America | 38 | 1.7% |
| Mexico | 28 | 1.3% |
| Russia | 4 | 0.2% |
| Western Europe | 4 | 0.2% | View All 12 Rows |
Sex and Age in Dublin borough
Sex and Age in Dublin borough
The most populous age groups in Dublin borough are 60 to 64 Years (135 | 12.7%) for men and 45 to 49 Years (167 | 14.6%) for women.
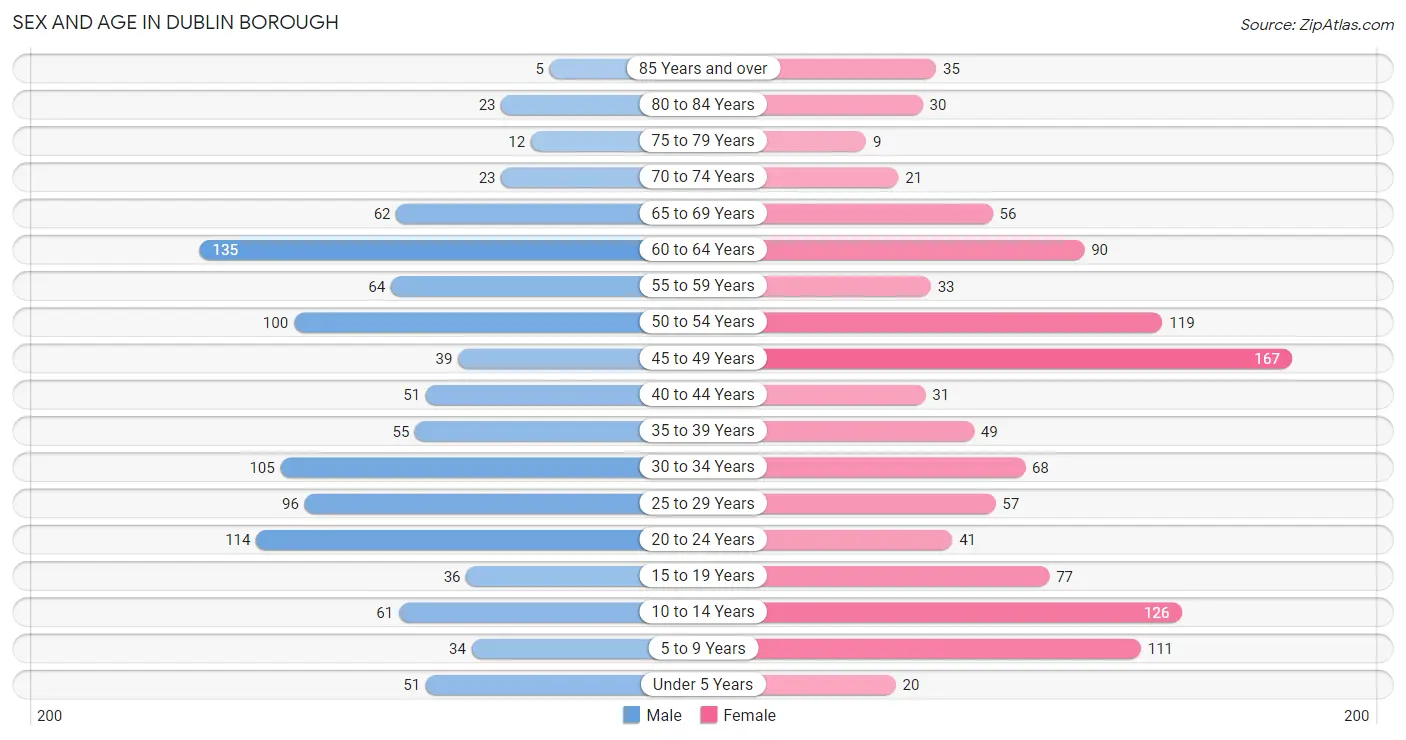
| Age Bracket | Male | Female |
| Under 5 Years | 51 (4.8%) | 20 (1.8%) |
| 5 to 9 Years | 34 (3.2%) | 111 (9.7%) |
| 10 to 14 Years | 61 (5.7%) | 126 (11.1%) |
| 15 to 19 Years | 36 (3.4%) | 77 (6.8%) |
| 20 to 24 Years | 114 (10.7%) | 41 (3.6%) |
| 25 to 29 Years | 96 (9.0%) | 57 (5.0%) |
| 30 to 34 Years | 105 (9.9%) | 68 (6.0%) |
| 35 to 39 Years | 55 (5.2%) | 49 (4.3%) |
| 40 to 44 Years | 51 (4.8%) | 31 (2.7%) |
| 45 to 49 Years | 39 (3.7%) | 167 (14.6%) |
| 50 to 54 Years | 100 (9.4%) | 119 (10.4%) |
| 55 to 59 Years | 64 (6.0%) | 33 (2.9%) |
| 60 to 64 Years | 135 (12.7%) | 90 (7.9%) |
| 65 to 69 Years | 62 (5.8%) | 56 (4.9%) |
| 70 to 74 Years | 23 (2.2%) | 21 (1.8%) |
| 75 to 79 Years | 12 (1.1%) | 9 (0.8%) |
| 80 to 84 Years | 23 (2.2%) | 30 (2.6%) |
| 85 Years and over | 5 (0.5%) | 35 (3.1%) |
| Total | 1,066 (100.0%) | 1,140 (100.0%) |
Families and Households in Dublin borough
Median Family Size in Dublin borough
The median family size in Dublin borough is 3.36 persons per family, with married-couple families (380 | 76.9%) accounting for the largest median family size of 3.61 persons per family. On the other hand, single male/father families (58 | 11.7%) represent the smallest median family size with 2.41 persons per family.
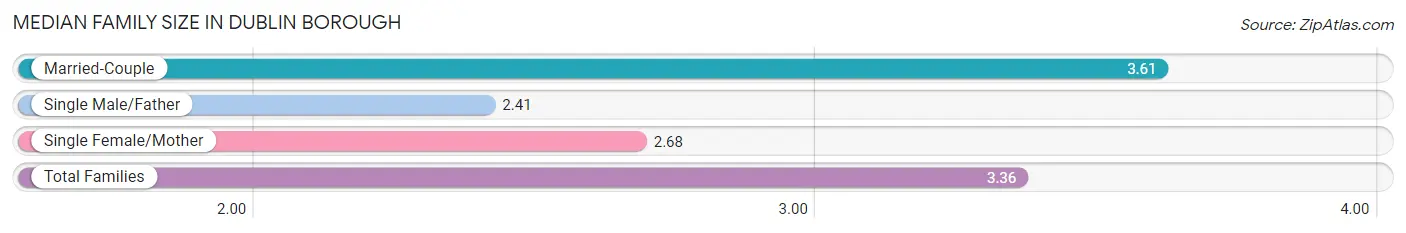
| Family Type | # Families | Family Size |
| Married-Couple | 380 (76.9%) | 3.61 |
| Single Male/Father | 58 (11.7%) | 2.41 |
| Single Female/Mother | 56 (11.3%) | 2.68 |
| Total Families | 494 (100.0%) | 3.36 |
Median Household Size in Dublin borough
The median household size in Dublin borough is 2.25 persons per household, with married-couple households (380 | 39.3%) accounting for the largest median household size of 3.61 persons per household. non-family households (472 | 48.9%) represent the smallest median household size with 1.05 persons per household.
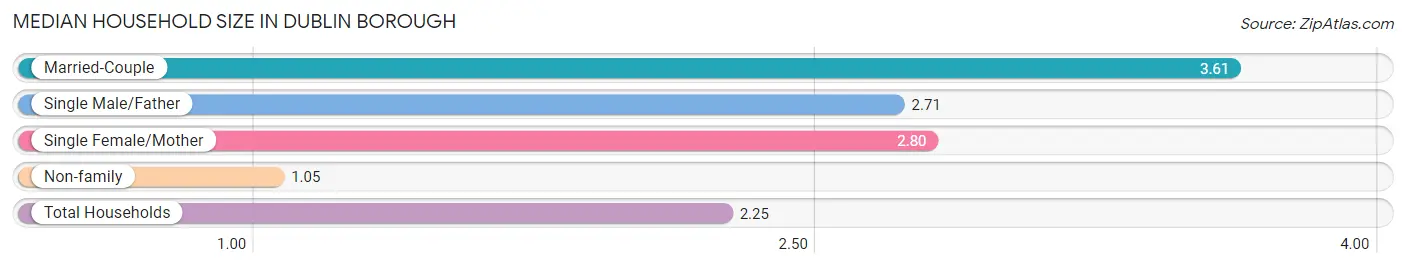
| Household Type | # Households | Household Size |
| Married-Couple | 380 (39.3%) | 3.61 |
| Single Male/Father | 58 (6.0%) | 2.71 |
| Single Female/Mother | 56 (5.8%) | 2.80 |
| Non-family | 472 (48.9%) | 1.05 |
| Total Households | 966 (100.0%) | 2.25 |
Household Size by Marriage Status in Dublin borough
Out of a total of 966 households in Dublin borough, 494 (51.1%) are family households, while 472 (48.9%) are nonfamily households. The most numerous type of family households are 2-person households, comprising 167, and the most common type of nonfamily households are 1-person households, comprising 449.
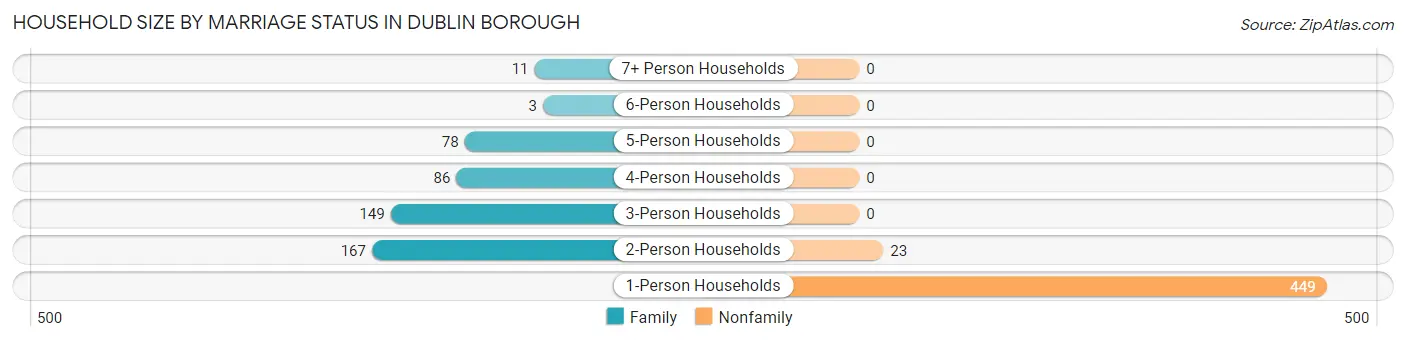
| Household Size | Family Households | Nonfamily Households |
| 1-Person Households | - | 449 (46.5%) |
| 2-Person Households | 167 (17.3%) | 23 (2.4%) |
| 3-Person Households | 149 (15.4%) | 0 (0.0%) |
| 4-Person Households | 86 (8.9%) | 0 (0.0%) |
| 5-Person Households | 78 (8.1%) | 0 (0.0%) |
| 6-Person Households | 3 (0.3%) | 0 (0.0%) |
| 7+ Person Households | 11 (1.1%) | 0 (0.0%) |
| Total | 494 (51.1%) | 472 (48.9%) |
Female Fertility in Dublin borough
Fertility by Age in Dublin borough
Average fertility rate in Dublin borough is 40.0 births per 1,000 women. Women in the age bracket of 20 to 34 years have the highest fertility rate with 102.0 births per 1,000 women. Women in the age bracket of 20 to 34 years acount for 80.9% of all women with births.
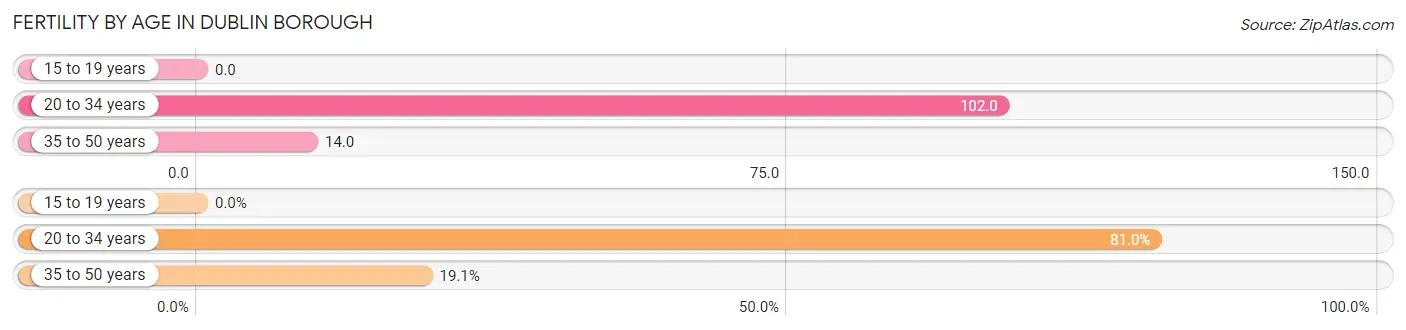
| Age Bracket | Women with Births | Births / 1,000 Women |
| 15 to 19 years | 0 (0.0%) | 0.0 |
| 20 to 34 years | 17 (80.9%) | 102.0 |
| 35 to 50 years | 4 (19.1%) | 14.0 |
| Total | 21 (100.0%) | 40.0 |
Fertility by Age by Marriage Status in Dublin borough
23.8% of women with births (21) in Dublin borough are married. The highest percentage of unmarried women with births falls into 35 to 50 years age bracket with 100.0% of them unmarried at the time of birth, while the lowest percentage of unmarried women with births belong to 20 to 34 years age bracket with 70.6% of them unmarried.
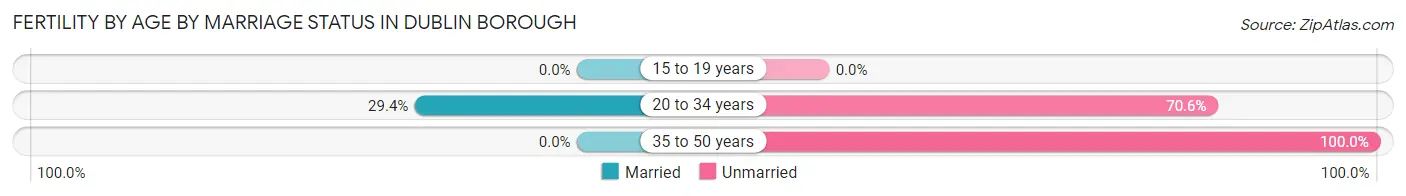
| Age Bracket | Married | Unmarried |
| 15 to 19 years | 0 (0.0%) | 0 (0.0%) |
| 20 to 34 years | 5 (29.4%) | 12 (70.6%) |
| 35 to 50 years | 0 (0.0%) | 4 (100.0%) |
| Total | 5 (23.8%) | 16 (76.2%) |
Fertility by Education in Dublin borough
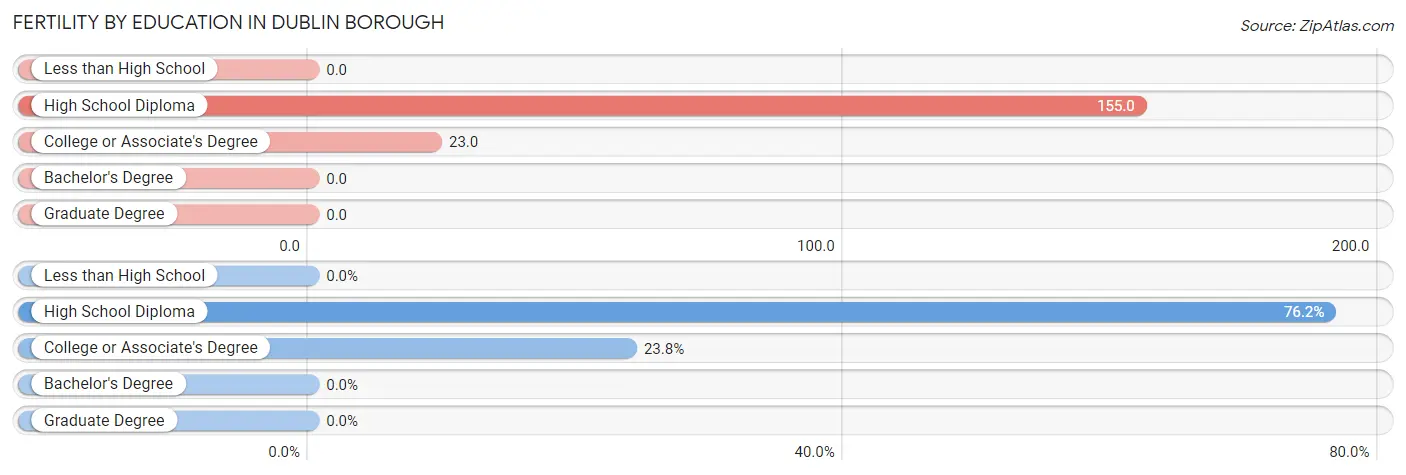
| Educational Attainment | Women with Births | Births / 1,000 Women |
| Less than High School | 0 (0.0%) | 0.0 |
| High School Diploma | 16 (76.2%) | 155.0 |
| College or Associate's Degree | 5 (23.8%) | 23.0 |
| Bachelor's Degree | 0 (0.0%) | 0.0 |
| Graduate Degree | 0 (0.0%) | 0.0 |
| Total | 21 (100.0%) | 40.0 |
Fertility by Education by Marriage Status in Dublin borough
76.2% of women with births in Dublin borough are unmarried. Women with the educational attainment of college or associate's degree are most likely to be married with 100.0% of them married at childbirth, while women with the educational attainment of high school diploma are least likely to be married with 100.0% of them unmarried at childbirth.
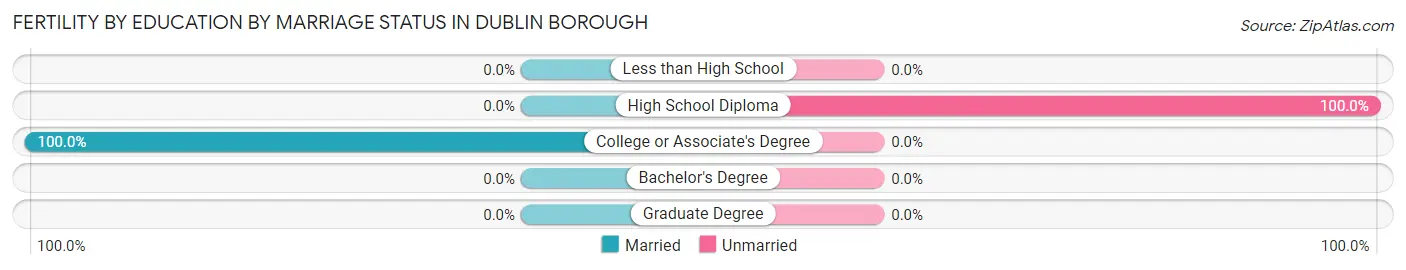
| Educational Attainment | Married | Unmarried |
| Less than High School | 0 (0.0%) | 0 (0.0%) |
| High School Diploma | 0 (0.0%) | 16 (100.0%) |
| College or Associate's Degree | 5 (100.0%) | 0 (0.0%) |
| Bachelor's Degree | 0 (0.0%) | 0 (0.0%) |
| Graduate Degree | 0 (0.0%) | 0 (0.0%) |
| Total | 5 (23.8%) | 16 (76.2%) |
Employment Characteristics in Dublin borough
Employment by Class of Employer in Dublin borough
Among the 1,208 employed individuals in Dublin borough, private company employees (750 | 62.1%), not-for-profit organizations (243 | 20.1%), and local government employees (94 | 7.8%) make up the most common classes of employment.
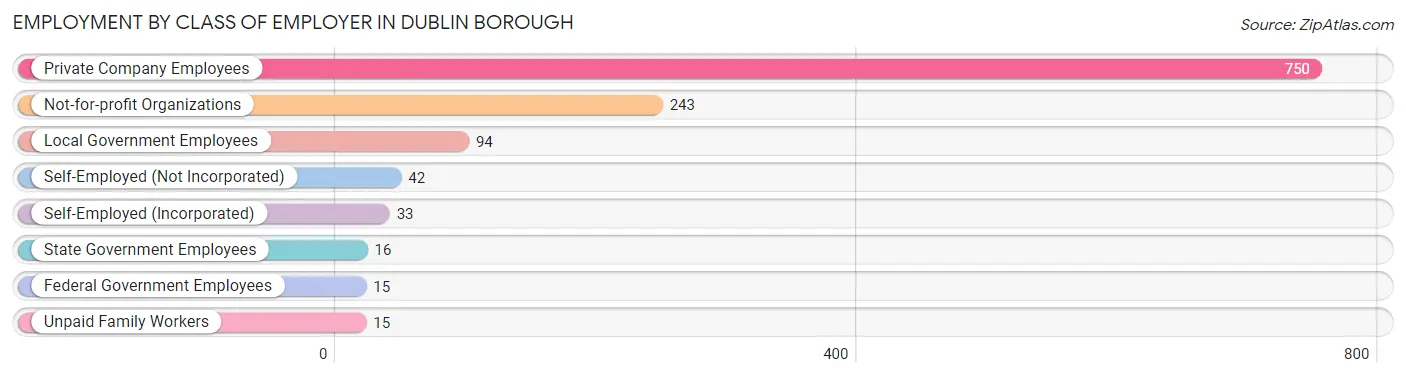
| Employer Class | # Employees | % Employees |
| Private Company Employees | 750 | 62.1% |
| Self-Employed (Incorporated) | 33 | 2.7% |
| Self-Employed (Not Incorporated) | 42 | 3.5% |
| Not-for-profit Organizations | 243 | 20.1% |
| Local Government Employees | 94 | 7.8% |
| State Government Employees | 16 | 1.3% |
| Federal Government Employees | 15 | 1.2% |
| Unpaid Family Workers | 15 | 1.2% |
| Total | 1,208 | 100.0% |
Employment Status by Age in Dublin borough
According to the labor force statistics for Dublin borough, out of the total population over 16 years of age (1,779), 73.0% or 1,299 individuals are in the labor force, with 5.7% or 74 of them unemployed. The age group with the highest labor force participation rate is 25 to 29 years, with 96.7% or 148 individuals in the labor force. Within the labor force, the 20 to 24 years age range has the highest percentage of unemployed individuals, with 30.4% or 21 of them being unemployed.
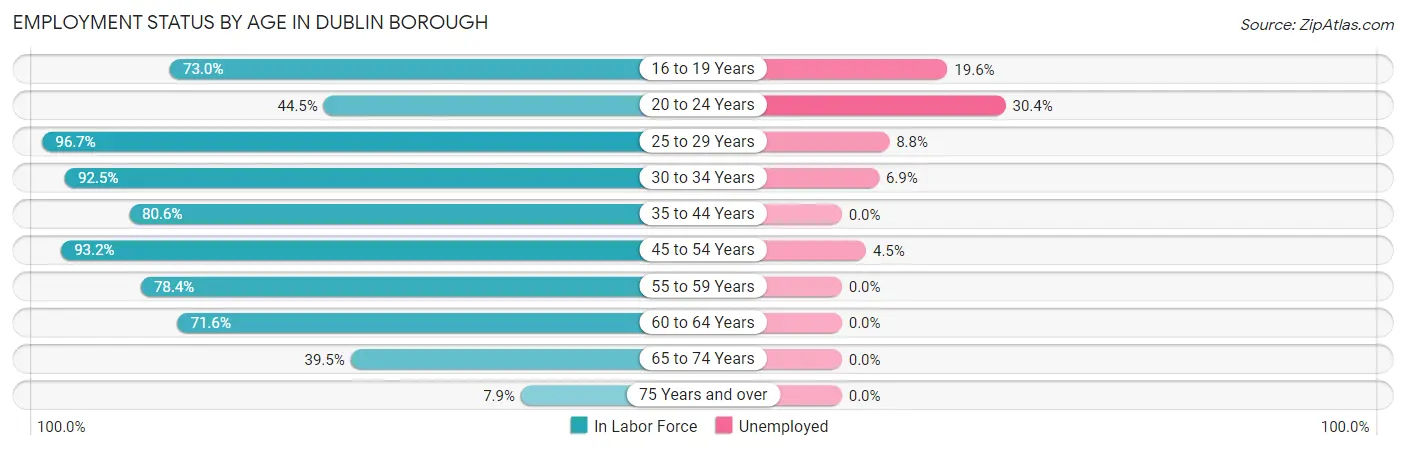
| Age Bracket | In Labor Force | Unemployed |
| 16 to 19 Years | 65 (73.0%) | 13 (19.6%) |
| 20 to 24 Years | 69 (44.5%) | 21 (30.4%) |
| 25 to 29 Years | 148 (96.7%) | 13 (8.8%) |
| 30 to 34 Years | 160 (92.5%) | 11 (6.9%) |
| 35 to 44 Years | 150 (80.6%) | 0 (0.0%) |
| 45 to 54 Years | 396 (93.2%) | 18 (4.5%) |
| 55 to 59 Years | 76 (78.4%) | 0 (0.0%) |
| 60 to 64 Years | 161 (71.6%) | 0 (0.0%) |
| 65 to 74 Years | 64 (39.5%) | 0 (0.0%) |
| 75 Years and over | 9 (7.9%) | 0 (0.0%) |
| Total | 1,299 (73.0%) | 74 (5.7%) |
Employment Status by Educational Attainment in Dublin borough
According to labor force statistics for Dublin borough, 86.7% of individuals (1,092) out of the total population between 25 and 64 years of age (1,259) are in the labor force, with 3.8% or 41 of them being unemployed. The group with the highest labor force participation rate are those with the educational attainment of college / associate degree, with 88.7% or 394 individuals in the labor force. Within the labor force, individuals with college / associate degree education have the highest percentage of unemployment, with 6.3% or 25 of them being unemployed.
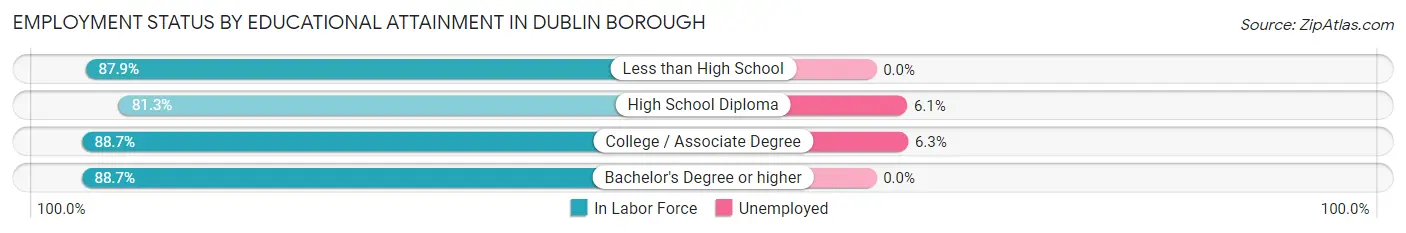
| Educational Attainment | In Labor Force | Unemployed |
| Less than High School | 58 (87.9%) | 0 (0.0%) |
| High School Diploma | 279 (81.3%) | 21 (6.1%) |
| College / Associate Degree | 394 (88.7%) | 28 (6.3%) |
| Bachelor's Degree or higher | 360 (88.7%) | 0 (0.0%) |
| Total | 1,092 (86.7%) | 48 (3.8%) |
Employment Occupations by Sex in Dublin borough
Management, Business, Science and Arts Occupations
The most common Management, Business, Science and Arts occupations in Dublin borough are Community & Social Service (163 | 13.4%), Health Diagnosing & Treating (156 | 12.8%), Management (107 | 8.8%), Education Instruction & Library (102 | 8.4%), and Computers, Engineering & Science (70 | 5.8%).
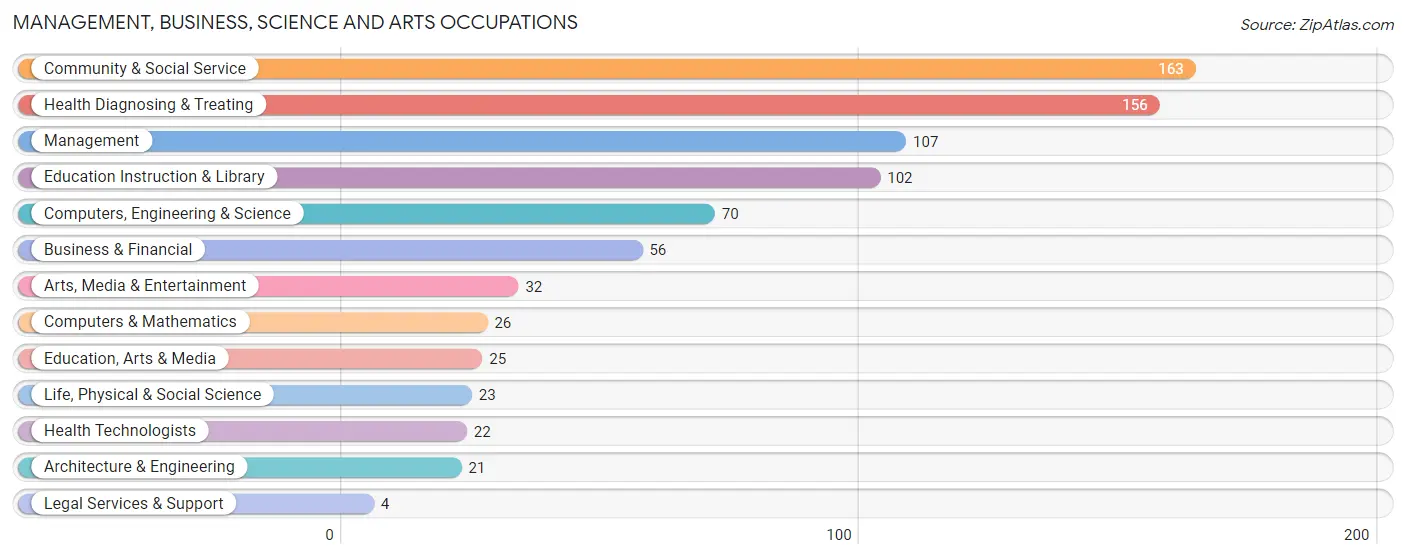
Management, Business, Science and Arts Occupations by Sex
Within the Management, Business, Science and Arts occupations in Dublin borough, the most male-oriented occupations are Life, Physical & Social Science (82.6%), Architecture & Engineering (76.2%), and Computers, Engineering & Science (70.0%), while the most female-oriented occupations are Legal Services & Support (100.0%), Health Diagnosing & Treating (92.9%), and Education Instruction & Library (73.5%).
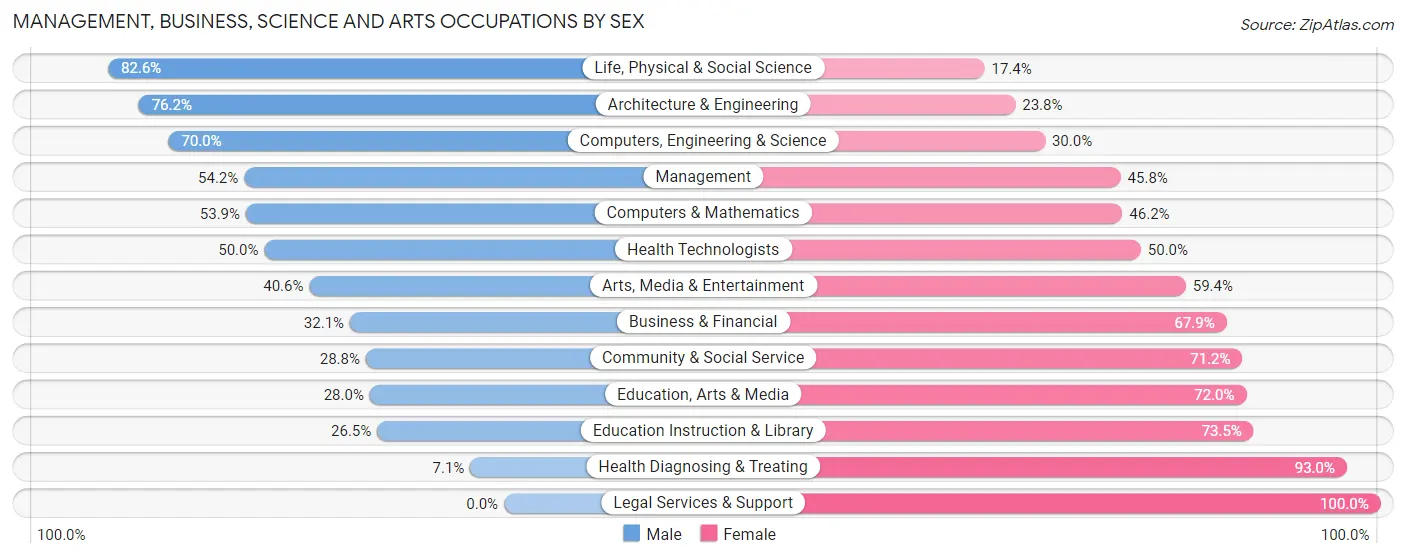
| Occupation | Male | Female |
| Management | 58 (54.2%) | 49 (45.8%) |
| Business & Financial | 18 (32.1%) | 38 (67.9%) |
| Computers, Engineering & Science | 49 (70.0%) | 21 (30.0%) |
| Computers & Mathematics | 14 (53.8%) | 12 (46.2%) |
| Architecture & Engineering | 16 (76.2%) | 5 (23.8%) |
| Life, Physical & Social Science | 19 (82.6%) | 4 (17.4%) |
| Community & Social Service | 47 (28.8%) | 116 (71.2%) |
| Education, Arts & Media | 7 (28.0%) | 18 (72.0%) |
| Legal Services & Support | 0 (0.0%) | 4 (100.0%) |
| Education Instruction & Library | 27 (26.5%) | 75 (73.5%) |
| Arts, Media & Entertainment | 13 (40.6%) | 19 (59.4%) |
| Health Diagnosing & Treating | 11 (7.0%) | 145 (92.9%) |
| Health Technologists | 11 (50.0%) | 11 (50.0%) |
| Total (Category) | 183 (33.2%) | 369 (66.8%) |
| Total (Overall) | 639 (52.6%) | 576 (47.4%) |
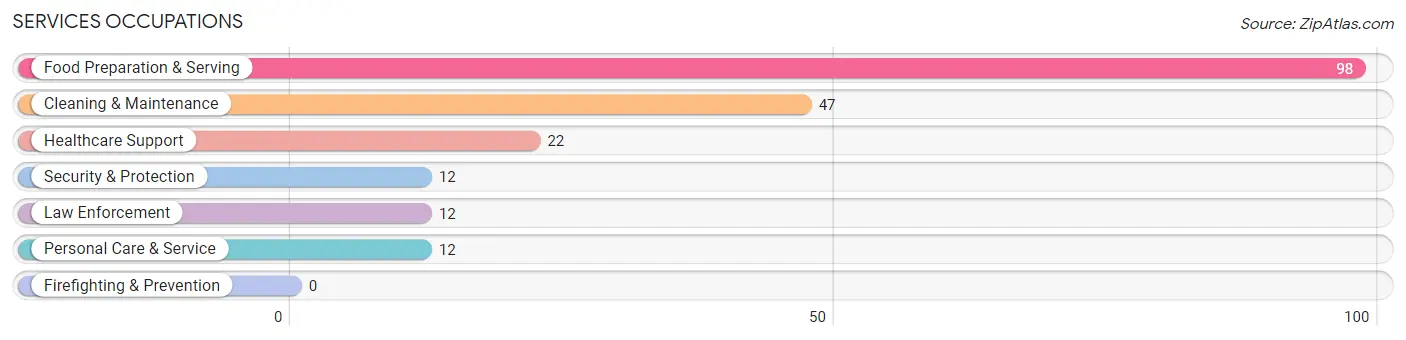
Services Occupations
The most common Services occupations in Dublin borough are Food Preparation & Serving (98 | 8.1%), Cleaning & Maintenance (47 | 3.9%), Healthcare Support (22 | 1.8%), Security & Protection (12 | 1.0%), and Law Enforcement (12 | 1.0%).
Services Occupations by Sex
Within the Services occupations in Dublin borough, the most male-oriented occupations are Security & Protection (100.0%), Law Enforcement (100.0%), and Cleaning & Maintenance (100.0%), while the most female-oriented occupations are Healthcare Support (100.0%), Personal Care & Service (100.0%), and Food Preparation & Serving (48.0%).
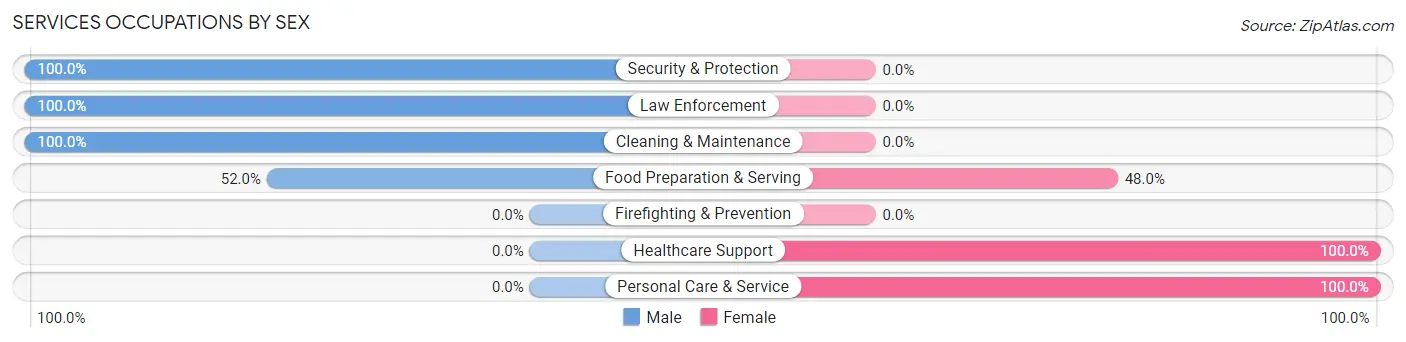
| Occupation | Male | Female |
| Healthcare Support | 0 (0.0%) | 22 (100.0%) |
| Security & Protection | 12 (100.0%) | 0 (0.0%) |
| Firefighting & Prevention | 0 (0.0%) | 0 (0.0%) |
| Law Enforcement | 12 (100.0%) | 0 (0.0%) |
| Food Preparation & Serving | 51 (52.0%) | 47 (48.0%) |
| Cleaning & Maintenance | 47 (100.0%) | 0 (0.0%) |
| Personal Care & Service | 0 (0.0%) | 12 (100.0%) |
| Total (Category) | 110 (57.6%) | 81 (42.4%) |
| Total (Overall) | 639 (52.6%) | 576 (47.4%) |
Sales and Office Occupations
The most common Sales and Office occupations in Dublin borough are Sales & Related (145 | 11.9%), and Office & Administration (80 | 6.6%).

Sales and Office Occupations by Sex

| Occupation | Male | Female |
| Sales & Related | 106 (73.1%) | 39 (26.9%) |
| Office & Administration | 15 (18.8%) | 65 (81.2%) |
| Total (Category) | 121 (53.8%) | 104 (46.2%) |
| Total (Overall) | 639 (52.6%) | 576 (47.4%) |
Natural Resources, Construction and Maintenance Occupations
The most common Natural Resources, Construction and Maintenance occupations in Dublin borough are Installation, Maintenance & Repair (59 | 4.9%), and Construction & Extraction (48 | 4.0%).
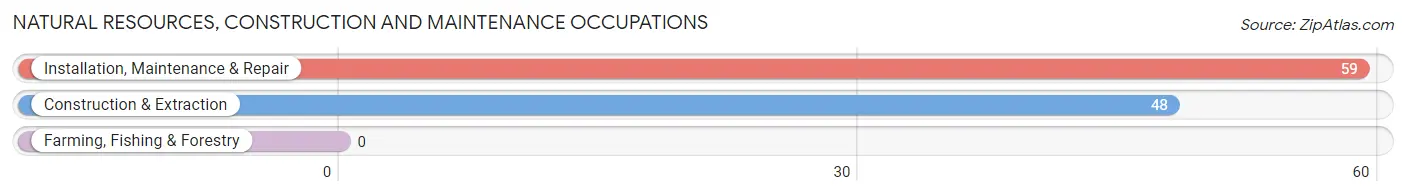
Natural Resources, Construction and Maintenance Occupations by Sex

| Occupation | Male | Female |
| Farming, Fishing & Forestry | 0 (0.0%) | 0 (0.0%) |
| Construction & Extraction | 48 (100.0%) | 0 (0.0%) |
| Installation, Maintenance & Repair | 55 (93.2%) | 4 (6.8%) |
| Total (Category) | 103 (96.3%) | 4 (3.7%) |
| Total (Overall) | 639 (52.6%) | 576 (47.4%) |
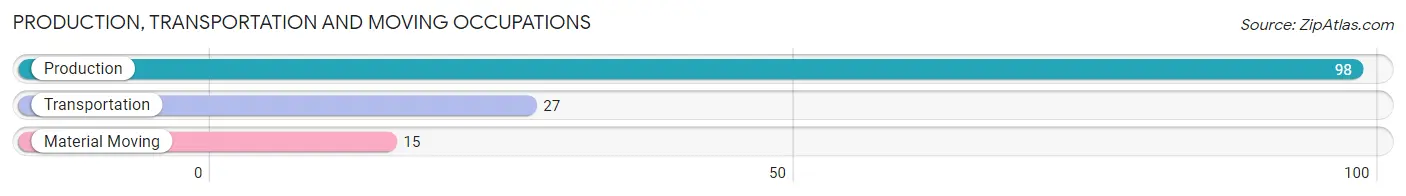
Production, Transportation and Moving Occupations
The most common Production, Transportation and Moving occupations in Dublin borough are Production (98 | 8.1%), Transportation (27 | 2.2%), and Material Moving (15 | 1.2%).
Production, Transportation and Moving Occupations by Sex
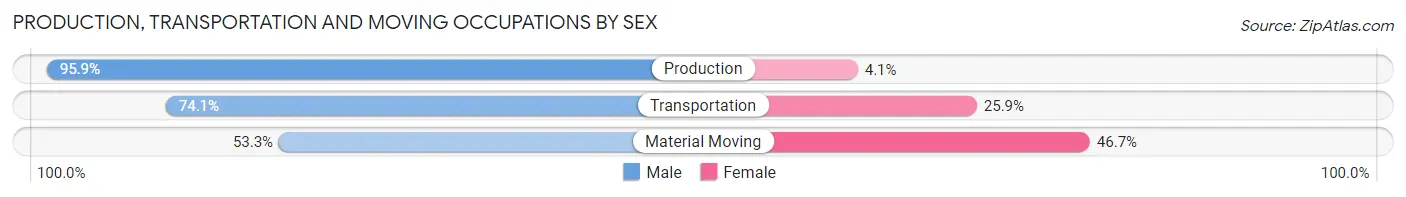
| Occupation | Male | Female |
| Production | 94 (95.9%) | 4 (4.1%) |
| Transportation | 20 (74.1%) | 7 (25.9%) |
| Material Moving | 8 (53.3%) | 7 (46.7%) |
| Total (Category) | 122 (87.1%) | 18 (12.9%) |
| Total (Overall) | 639 (52.6%) | 576 (47.4%) |
Employment Industries by Sex in Dublin borough
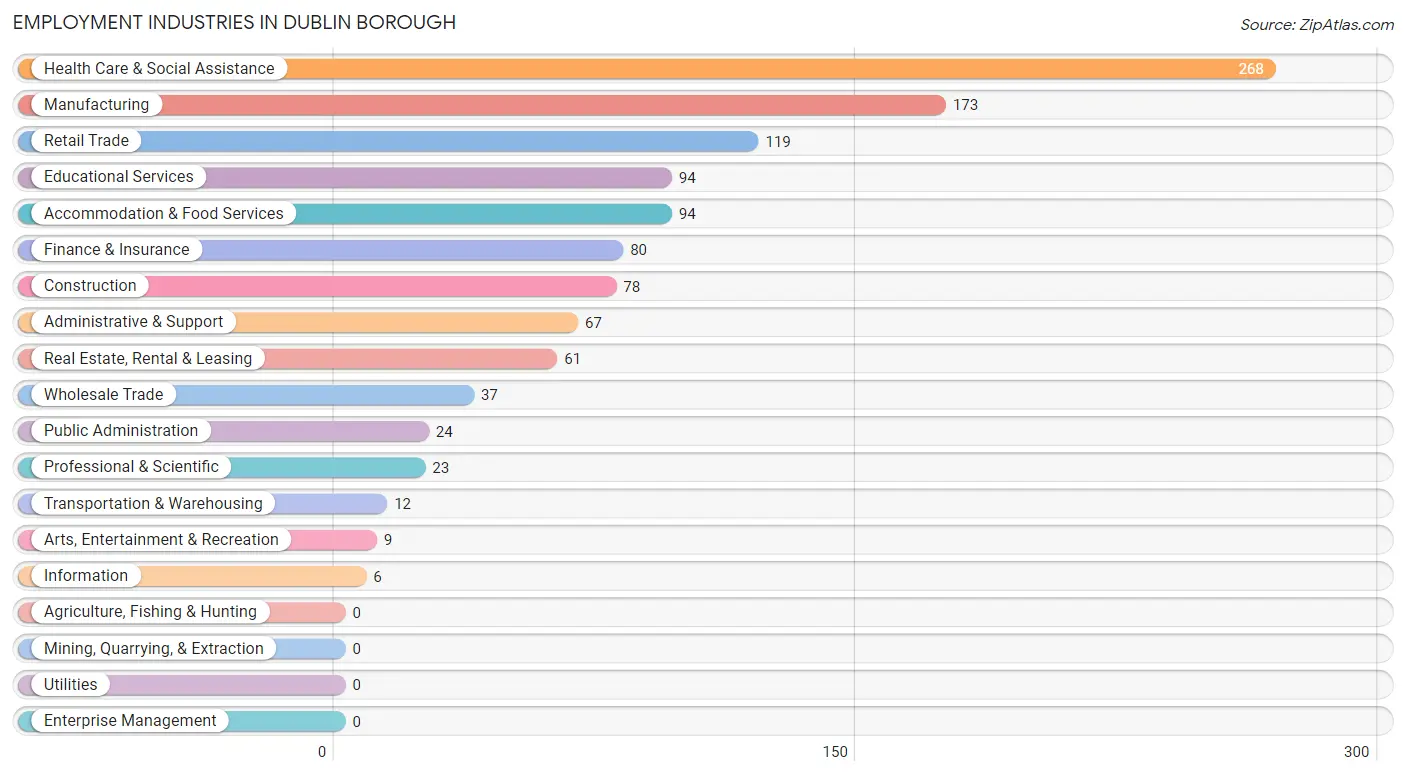
Employment Industries in Dublin borough
The major employment industries in Dublin borough include Health Care & Social Assistance (268 | 22.1%), Manufacturing (173 | 14.2%), Retail Trade (119 | 9.8%), Educational Services (94 | 7.7%), and Accommodation & Food Services (94 | 7.7%).
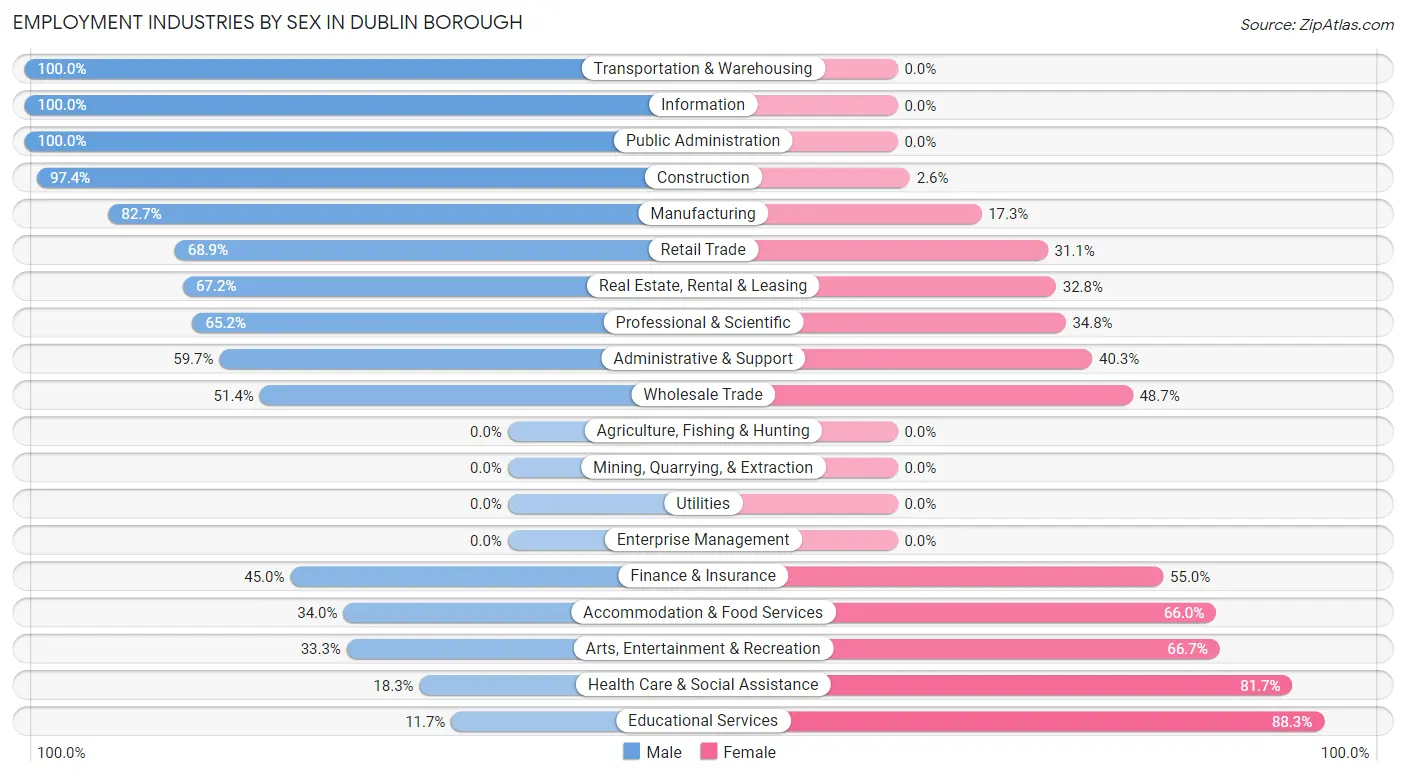
Employment Industries by Sex in Dublin borough
The Dublin borough industries that see more men than women are Transportation & Warehousing (100.0%), Information (100.0%), and Public Administration (100.0%), whereas the industries that tend to have a higher number of women are Educational Services (88.3%), Health Care & Social Assistance (81.7%), and Arts, Entertainment & Recreation (66.7%).
| Industry | Male | Female |
| Agriculture, Fishing & Hunting | 0 (0.0%) | 0 (0.0%) |
| Mining, Quarrying, & Extraction | 0 (0.0%) | 0 (0.0%) |
| Construction | 76 (97.4%) | 2 (2.6%) |
| Manufacturing | 143 (82.7%) | 30 (17.3%) |
| Wholesale Trade | 19 (51.3%) | 18 (48.6%) |
| Retail Trade | 82 (68.9%) | 37 (31.1%) |
| Transportation & Warehousing | 12 (100.0%) | 0 (0.0%) |
| Utilities | 0 (0.0%) | 0 (0.0%) |
| Information | 6 (100.0%) | 0 (0.0%) |
| Finance & Insurance | 36 (45.0%) | 44 (55.0%) |
| Real Estate, Rental & Leasing | 41 (67.2%) | 20 (32.8%) |
| Professional & Scientific | 15 (65.2%) | 8 (34.8%) |
| Enterprise Management | 0 (0.0%) | 0 (0.0%) |
| Administrative & Support | 40 (59.7%) | 27 (40.3%) |
| Educational Services | 11 (11.7%) | 83 (88.3%) |
| Health Care & Social Assistance | 49 (18.3%) | 219 (81.7%) |
| Arts, Entertainment & Recreation | 3 (33.3%) | 6 (66.7%) |
| Accommodation & Food Services | 32 (34.0%) | 62 (66.0%) |
| Public Administration | 24 (100.0%) | 0 (0.0%) |
| Total | 639 (52.6%) | 576 (47.4%) |
Education in Dublin borough
School Enrollment in Dublin borough
The most common levels of schooling among the 512 students in Dublin borough are middle school (163 | 31.8%), high school (103 | 20.1%), and kindergarten (81 | 15.8%).
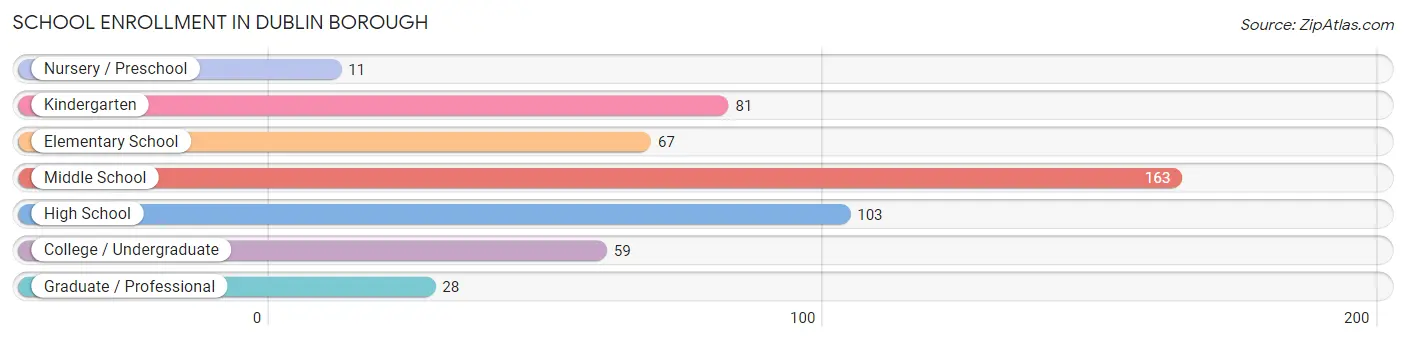
| School Level | # Students | % Students |
| Nursery / Preschool | 11 | 2.1% |
| Kindergarten | 81 | 15.8% |
| Elementary School | 67 | 13.1% |
| Middle School | 163 | 31.8% |
| High School | 103 | 20.1% |
| College / Undergraduate | 59 | 11.5% |
| Graduate / Professional | 28 | 5.5% |
| Total | 512 | 100.0% |
School Enrollment by Age by Funding Source in Dublin borough
Out of a total of 512 students who are enrolled in schools in Dublin borough, 192 (37.5%) attend a private institution, while the remaining 320 (62.5%) are enrolled in public schools. The age group of 3 to 4 year olds has the highest likelihood of being enrolled in private schools, with 3 (100.0% in the age bracket) enrolled. Conversely, the age group of 18 to 19 year olds has the lowest likelihood of being enrolled in a private school, with 7 (100.0% in the age bracket) attending a public institution.
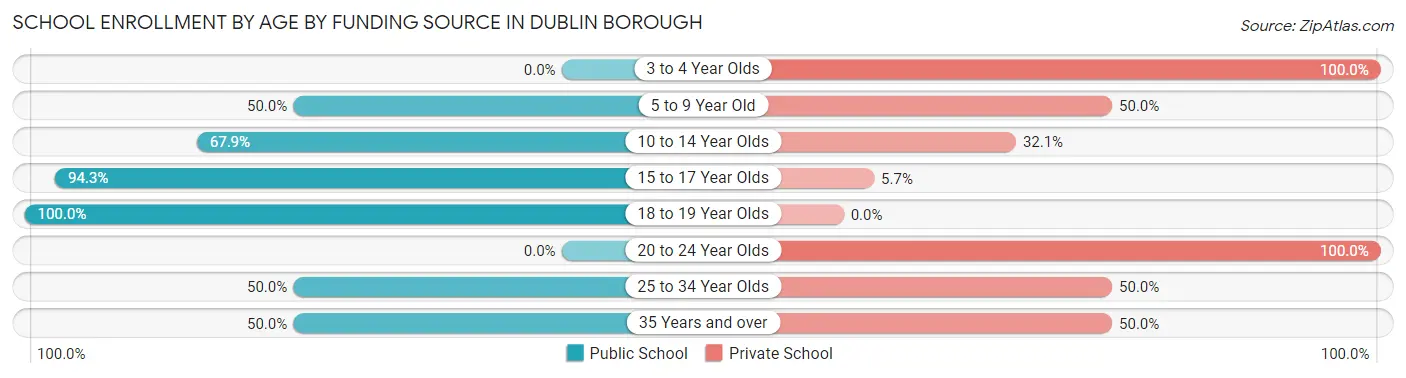
| Age Bracket | Public School | Private School |
| 3 to 4 Year Olds | 0 (0.0%) | 3 (100.0%) |
| 5 to 9 Year Old | 70 (50.0%) | 70 (50.0%) |
| 10 to 14 Year Olds | 127 (67.9%) | 60 (32.1%) |
| 15 to 17 Year Olds | 83 (94.3%) | 5 (5.7%) |
| 18 to 19 Year Olds | 7 (100.0%) | 0 (0.0%) |
| 20 to 24 Year Olds | 0 (0.0%) | 21 (100.0%) |
| 25 to 34 Year Olds | 21 (50.0%) | 21 (50.0%) |
| 35 Years and over | 12 (50.0%) | 12 (50.0%) |
| Total | 320 (62.5%) | 192 (37.5%) |
Educational Attainment by Field of Study in Dublin borough
Business (135 | 27.3%), education (88 | 17.8%), engineering (64 | 13.0%), bio, nature & agricultural (57 | 11.5%), and arts & humanities (39 | 7.9%) are the most common fields of study among 494 individuals in Dublin borough who have obtained a bachelor's degree or higher.
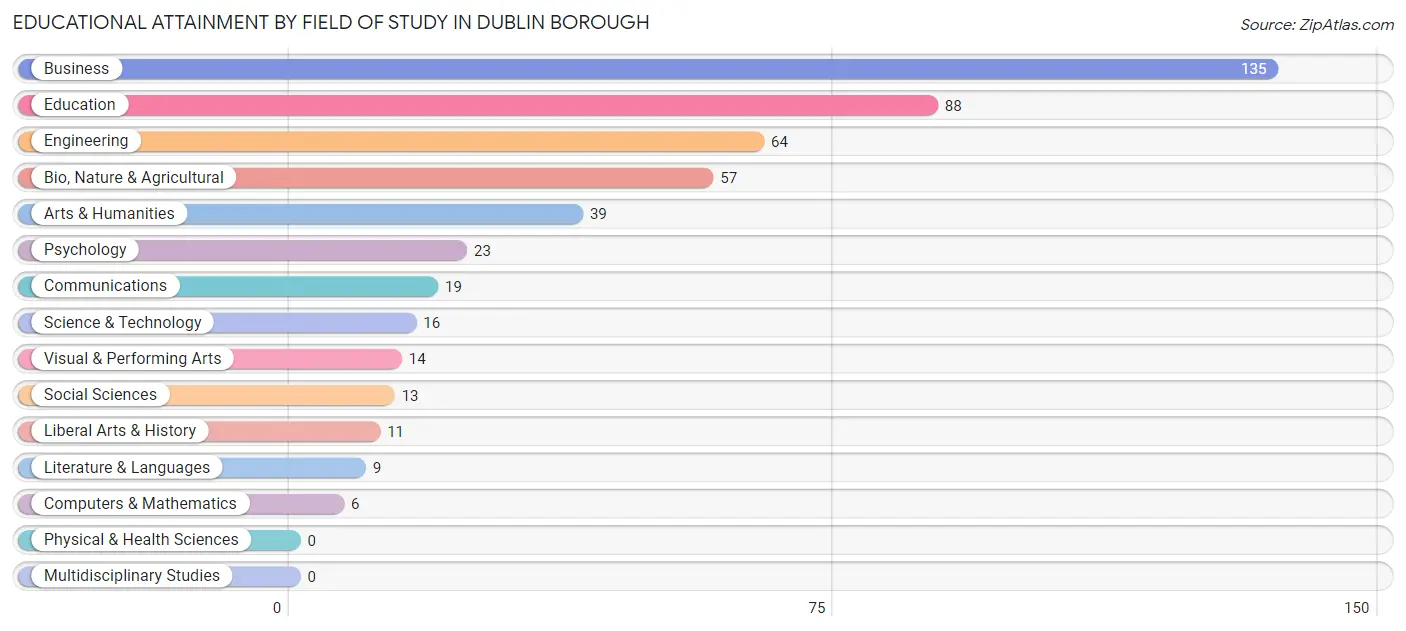
| Field of Study | # Graduates | % Graduates |
| Computers & Mathematics | 6 | 1.2% |
| Bio, Nature & Agricultural | 57 | 11.5% |
| Physical & Health Sciences | 0 | 0.0% |
| Psychology | 23 | 4.7% |
| Social Sciences | 13 | 2.6% |
| Engineering | 64 | 13.0% |
| Multidisciplinary Studies | 0 | 0.0% |
| Science & Technology | 16 | 3.2% |
| Business | 135 | 27.3% |
| Education | 88 | 17.8% |
| Literature & Languages | 9 | 1.8% |
| Liberal Arts & History | 11 | 2.2% |
| Visual & Performing Arts | 14 | 2.8% |
| Communications | 19 | 3.8% |
| Arts & Humanities | 39 | 7.9% |
| Total | 494 | 100.0% |
Transportation & Commute in Dublin borough
Vehicle Availability by Sex in Dublin borough
The most prevalent vehicle ownership categories in Dublin borough are males with 2 vehicles (263, accounting for 41.1%) and females with 2 vehicles (197, making up 46.3%).
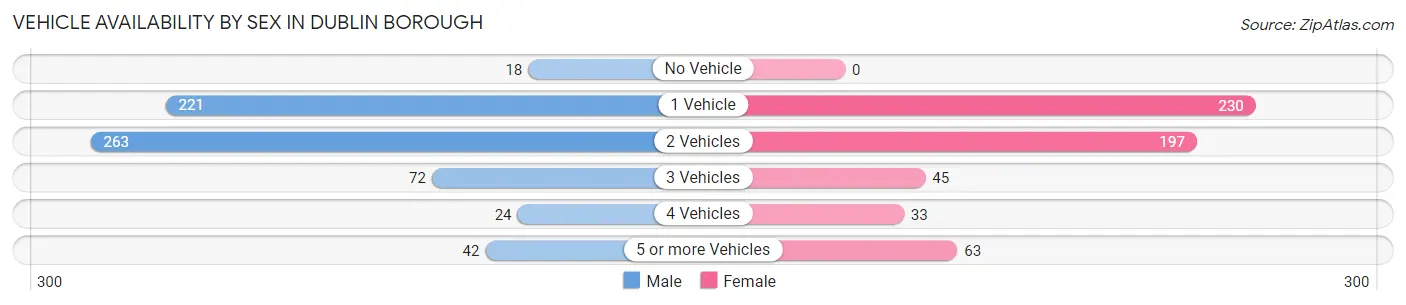
| Vehicles Available | Male | Female |
| No Vehicle | 18 (2.8%) | 0 (0.0%) |
| 1 Vehicle | 221 (34.5%) | 230 (40.5%) |
| 2 Vehicles | 263 (41.1%) | 197 (34.7%) |
| 3 Vehicles | 72 (11.3%) | 45 (7.9%) |
| 4 Vehicles | 24 (3.7%) | 33 (5.8%) |
| 5 or more Vehicles | 42 (6.6%) | 63 (11.1%) |
| Total | 640 (100.0%) | 568 (100.0%) |
Commute Time in Dublin borough
The most frequently occuring commute durations in Dublin borough are 20 to 24 minutes (266 commuters, 23.9%), 30 to 34 minutes (178 commuters, 16.0%), and 15 to 19 minutes (132 commuters, 11.8%).
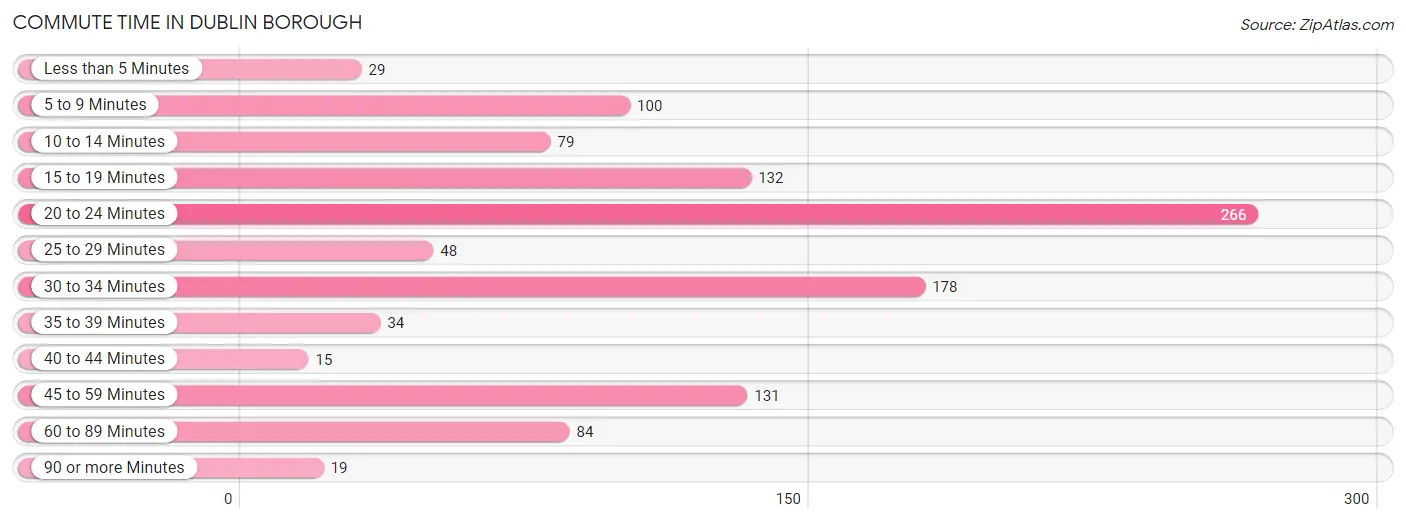
| Commute Time | # Commuters | % Commuters |
| Less than 5 Minutes | 29 | 2.6% |
| 5 to 9 Minutes | 100 | 9.0% |
| 10 to 14 Minutes | 79 | 7.1% |
| 15 to 19 Minutes | 132 | 11.8% |
| 20 to 24 Minutes | 266 | 23.9% |
| 25 to 29 Minutes | 48 | 4.3% |
| 30 to 34 Minutes | 178 | 16.0% |
| 35 to 39 Minutes | 34 | 3.0% |
| 40 to 44 Minutes | 15 | 1.3% |
| 45 to 59 Minutes | 131 | 11.7% |
| 60 to 89 Minutes | 84 | 7.5% |
| 90 or more Minutes | 19 | 1.7% |
Commute Time by Sex in Dublin borough
The most common commute times in Dublin borough are 20 to 24 minutes (172 commuters, 29.4%) for males and 30 to 34 minutes (160 commuters, 30.2%) for females.
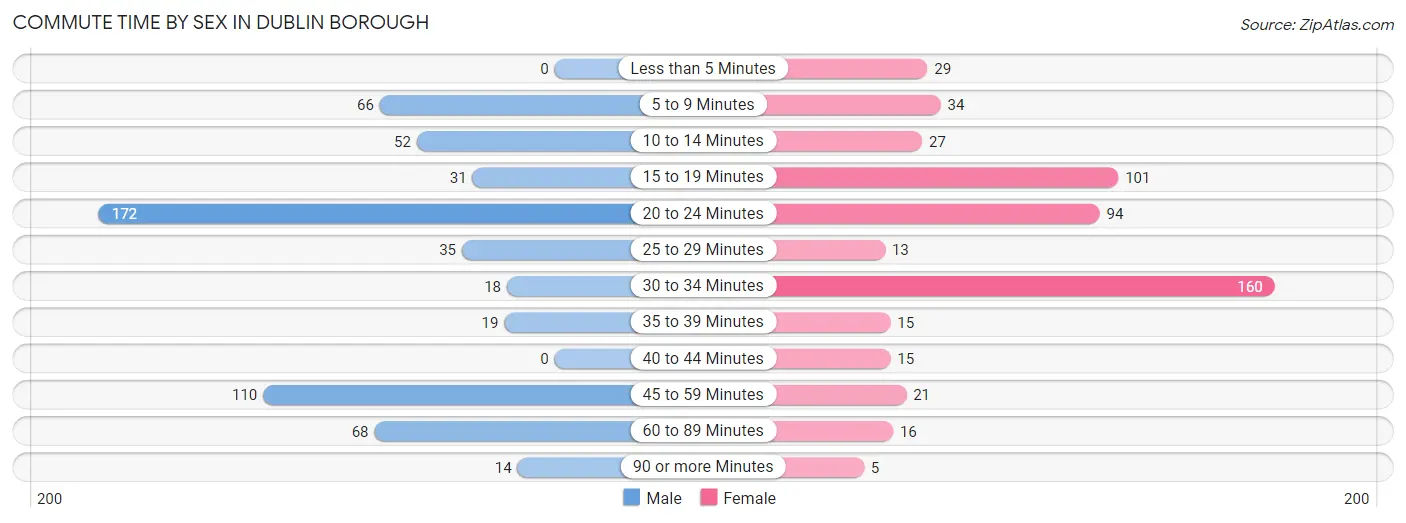
| Commute Time | Male | Female |
| Less than 5 Minutes | 0 (0.0%) | 29 (5.5%) |
| 5 to 9 Minutes | 66 (11.3%) | 34 (6.4%) |
| 10 to 14 Minutes | 52 (8.9%) | 27 (5.1%) |
| 15 to 19 Minutes | 31 (5.3%) | 101 (19.1%) |
| 20 to 24 Minutes | 172 (29.4%) | 94 (17.7%) |
| 25 to 29 Minutes | 35 (6.0%) | 13 (2.5%) |
| 30 to 34 Minutes | 18 (3.1%) | 160 (30.2%) |
| 35 to 39 Minutes | 19 (3.3%) | 15 (2.8%) |
| 40 to 44 Minutes | 0 (0.0%) | 15 (2.8%) |
| 45 to 59 Minutes | 110 (18.8%) | 21 (4.0%) |
| 60 to 89 Minutes | 68 (11.6%) | 16 (3.0%) |
| 90 or more Minutes | 14 (2.4%) | 5 (0.9%) |
Time of Departure to Work by Sex in Dublin borough
The most frequent times of departure to work in Dublin borough are 6:30 AM to 6:59 AM (104, 17.8%) for males and 7:00 AM to 7:29 AM (153, 28.9%) for females.
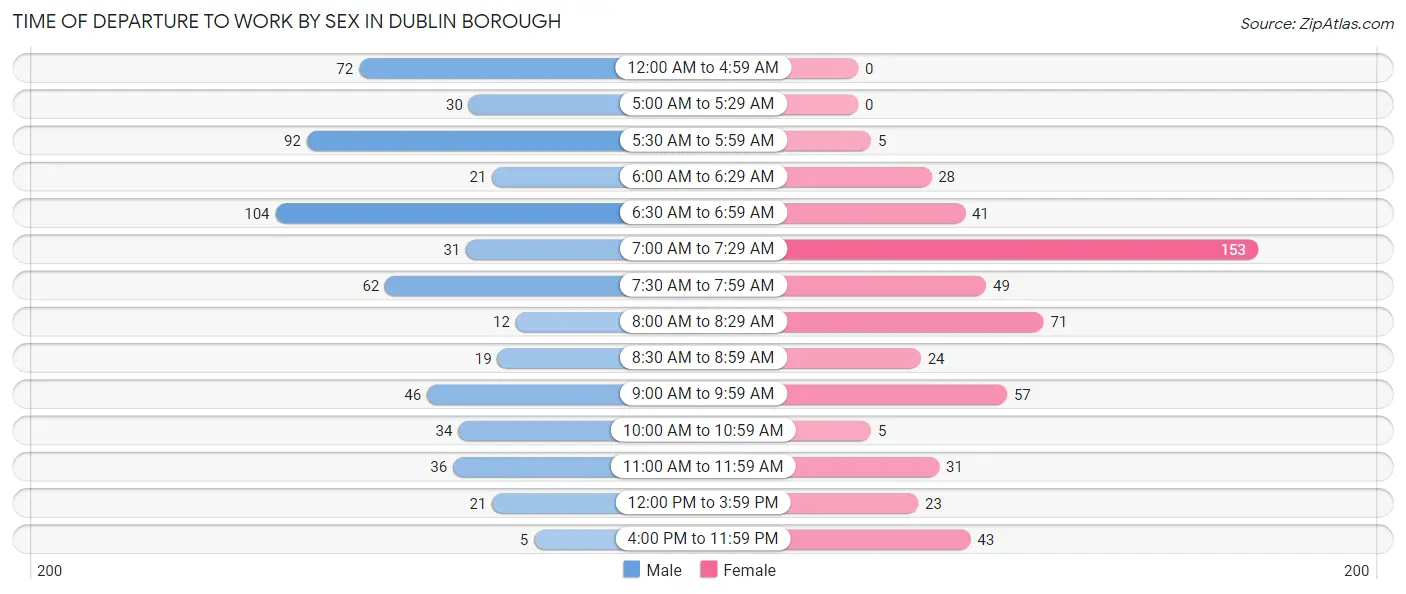
| Time of Departure | Male | Female |
| 12:00 AM to 4:59 AM | 72 (12.3%) | 0 (0.0%) |
| 5:00 AM to 5:29 AM | 30 (5.1%) | 0 (0.0%) |
| 5:30 AM to 5:59 AM | 92 (15.7%) | 5 (0.9%) |
| 6:00 AM to 6:29 AM | 21 (3.6%) | 28 (5.3%) |
| 6:30 AM to 6:59 AM | 104 (17.8%) | 41 (7.7%) |
| 7:00 AM to 7:29 AM | 31 (5.3%) | 153 (28.9%) |
| 7:30 AM to 7:59 AM | 62 (10.6%) | 49 (9.2%) |
| 8:00 AM to 8:29 AM | 12 (2.1%) | 71 (13.4%) |
| 8:30 AM to 8:59 AM | 19 (3.3%) | 24 (4.5%) |
| 9:00 AM to 9:59 AM | 46 (7.9%) | 57 (10.7%) |
| 10:00 AM to 10:59 AM | 34 (5.8%) | 5 (0.9%) |
| 11:00 AM to 11:59 AM | 36 (6.1%) | 31 (5.9%) |
| 12:00 PM to 3:59 PM | 21 (3.6%) | 23 (4.3%) |
| 4:00 PM to 11:59 PM | 5 (0.9%) | 43 (8.1%) |
| Total | 585 (100.0%) | 530 (100.0%) |
Housing Occupancy in Dublin borough
Occupancy by Ownership in Dublin borough
Of the total 966 dwellings in Dublin borough, owner-occupied units account for 586 (60.7%), while renter-occupied units make up 380 (39.3%).
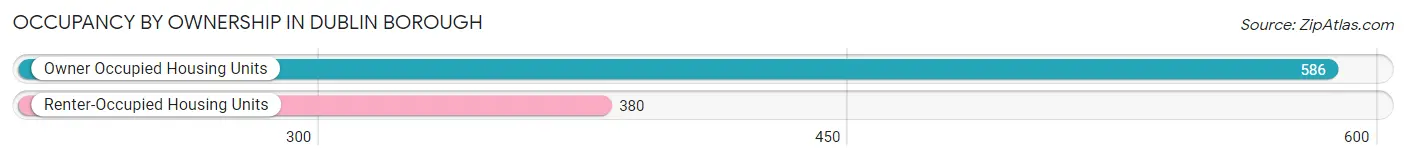
| Occupancy | # Housing Units | % Housing Units |
| Owner Occupied Housing Units | 586 | 60.7% |
| Renter-Occupied Housing Units | 380 | 39.3% |
| Total Occupied Housing Units | 966 | 100.0% |
Occupancy by Household Size in Dublin borough
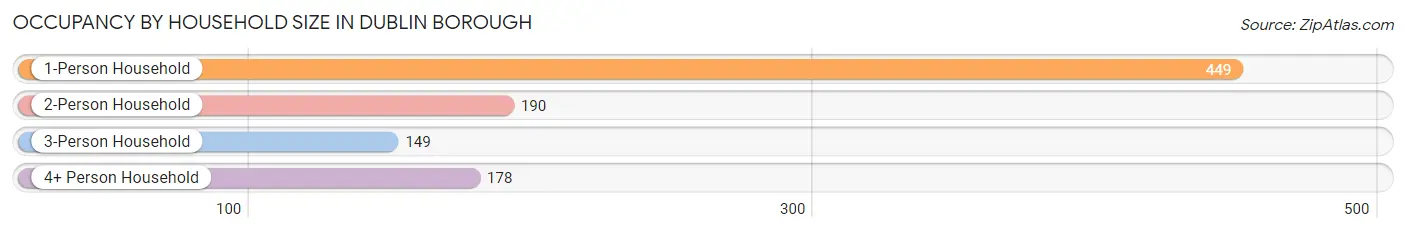
| Household Size | # Housing Units | % Housing Units |
| 1-Person Household | 449 | 46.5% |
| 2-Person Household | 190 | 19.7% |
| 3-Person Household | 149 | 15.4% |
| 4+ Person Household | 178 | 18.4% |
| Total Housing Units | 966 | 100.0% |
Occupancy by Ownership by Household Size in Dublin borough
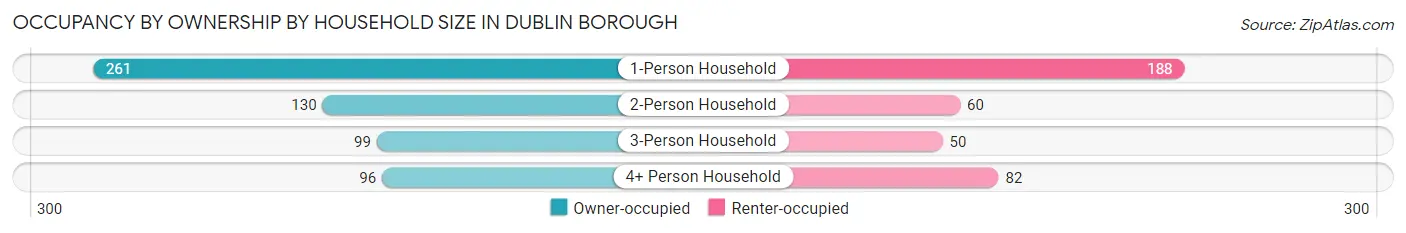
| Household Size | Owner-occupied | Renter-occupied |
| 1-Person Household | 261 (58.1%) | 188 (41.9%) |
| 2-Person Household | 130 (68.4%) | 60 (31.6%) |
| 3-Person Household | 99 (66.4%) | 50 (33.6%) |
| 4+ Person Household | 96 (53.9%) | 82 (46.1%) |
| Total Housing Units | 586 (60.7%) | 380 (39.3%) |
Occupancy by Educational Attainment in Dublin borough
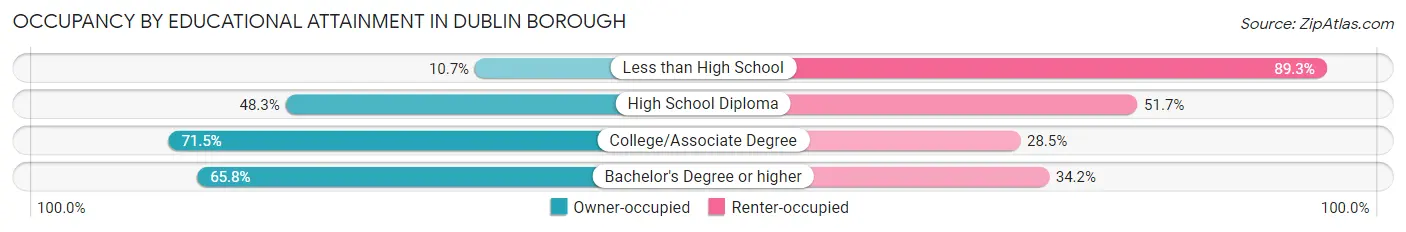
| Household Size | Owner-occupied | Renter-occupied |
| Less than High School | 6 (10.7%) | 50 (89.3%) |
| High School Diploma | 111 (48.3%) | 119 (51.7%) |
| College/Associate Degree | 273 (71.5%) | 109 (28.5%) |
| Bachelor's Degree or higher | 196 (65.8%) | 102 (34.2%) |
Occupancy by Age of Householder in Dublin borough
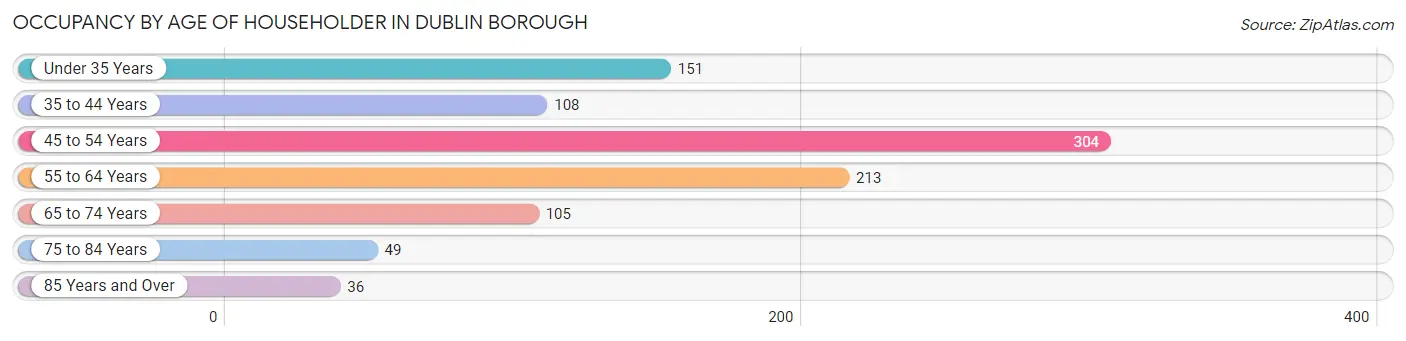
| Age Bracket | # Households | % Households |
| Under 35 Years | 151 | 15.6% |
| 35 to 44 Years | 108 | 11.2% |
| 45 to 54 Years | 304 | 31.5% |
| 55 to 64 Years | 213 | 22.1% |
| 65 to 74 Years | 105 | 10.9% |
| 75 to 84 Years | 49 | 5.1% |
| 85 Years and Over | 36 | 3.7% |
| Total | 966 | 100.0% |
Housing Finances in Dublin borough
Median Income by Occupancy in Dublin borough
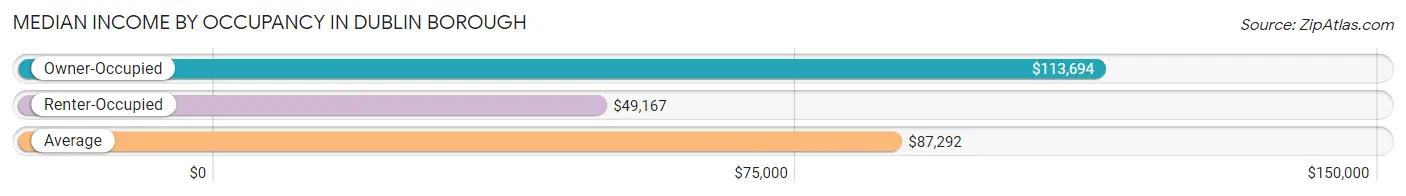
| Occupancy Type | # Households | Median Income |
| Owner-Occupied | 586 (60.7%) | $113,694 |
| Renter-Occupied | 380 (39.3%) | $49,167 |
| Average | 966 (100.0%) | $87,292 |
Occupancy by Householder Income Bracket in Dublin borough
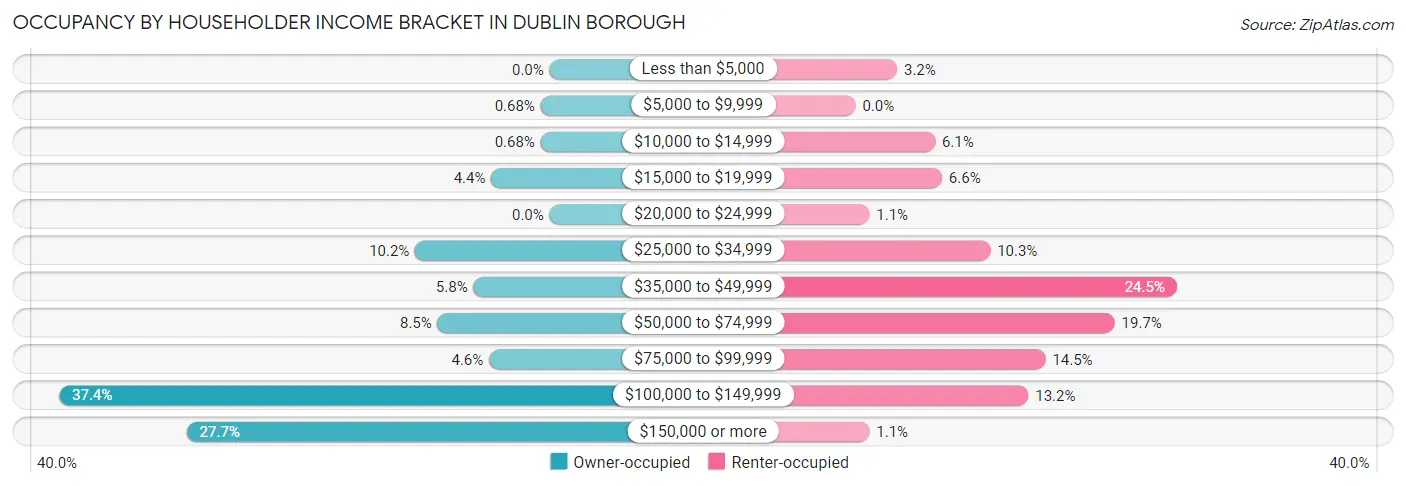
| Income Bracket | Owner-occupied | Renter-occupied |
| Less than $5,000 | 0 (0.0%) | 12 (3.2%) |
| $5,000 to $9,999 | 4 (0.7%) | 0 (0.0%) |
| $10,000 to $14,999 | 4 (0.7%) | 23 (6.0%) |
| $15,000 to $19,999 | 26 (4.4%) | 25 (6.6%) |
| $20,000 to $24,999 | 0 (0.0%) | 4 (1.1%) |
| $25,000 to $34,999 | 60 (10.2%) | 39 (10.3%) |
| $35,000 to $49,999 | 34 (5.8%) | 93 (24.5%) |
| $50,000 to $74,999 | 50 (8.5%) | 75 (19.7%) |
| $75,000 to $99,999 | 27 (4.6%) | 55 (14.5%) |
| $100,000 to $149,999 | 219 (37.4%) | 50 (13.2%) |
| $150,000 or more | 162 (27.7%) | 4 (1.1%) |
| Total | 586 (100.0%) | 380 (100.0%) |
Monthly Housing Cost Tiers in Dublin borough
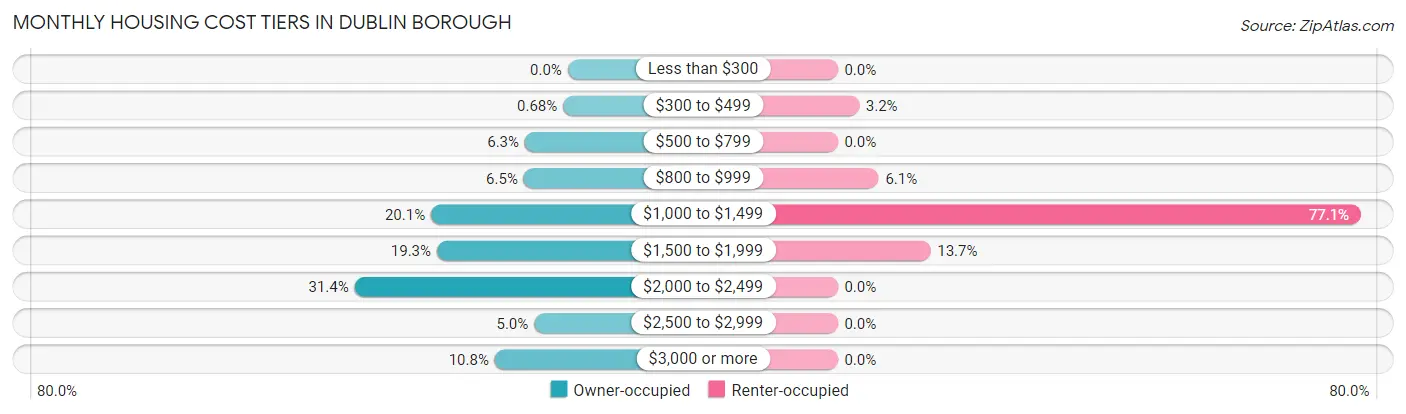
| Monthly Cost | Owner-occupied | Renter-occupied |
| Less than $300 | 0 (0.0%) | 0 (0.0%) |
| $300 to $499 | 4 (0.7%) | 12 (3.2%) |
| $500 to $799 | 37 (6.3%) | 0 (0.0%) |
| $800 to $999 | 38 (6.5%) | 23 (6.0%) |
| $1,000 to $1,499 | 118 (20.1%) | 293 (77.1%) |
| $1,500 to $1,999 | 113 (19.3%) | 52 (13.7%) |
| $2,000 to $2,499 | 184 (31.4%) | 0 (0.0%) |
| $2,500 to $2,999 | 29 (5.0%) | 0 (0.0%) |
| $3,000 or more | 63 (10.7%) | 0 (0.0%) |
| Total | 586 (100.0%) | 380 (100.0%) |
Physical Housing Characteristics in Dublin borough
Housing Structures in Dublin borough
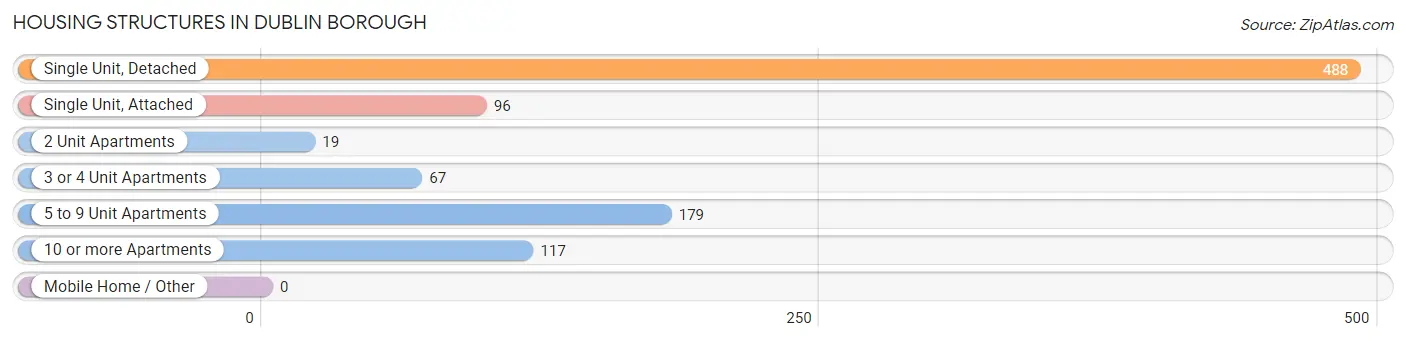
| Structure Type | # Housing Units | % Housing Units |
| Single Unit, Detached | 488 | 50.5% |
| Single Unit, Attached | 96 | 9.9% |
| 2 Unit Apartments | 19 | 2.0% |
| 3 or 4 Unit Apartments | 67 | 6.9% |
| 5 to 9 Unit Apartments | 179 | 18.5% |
| 10 or more Apartments | 117 | 12.1% |
| Mobile Home / Other | 0 | 0.0% |
| Total | 966 | 100.0% |
Housing Structures by Occupancy in Dublin borough
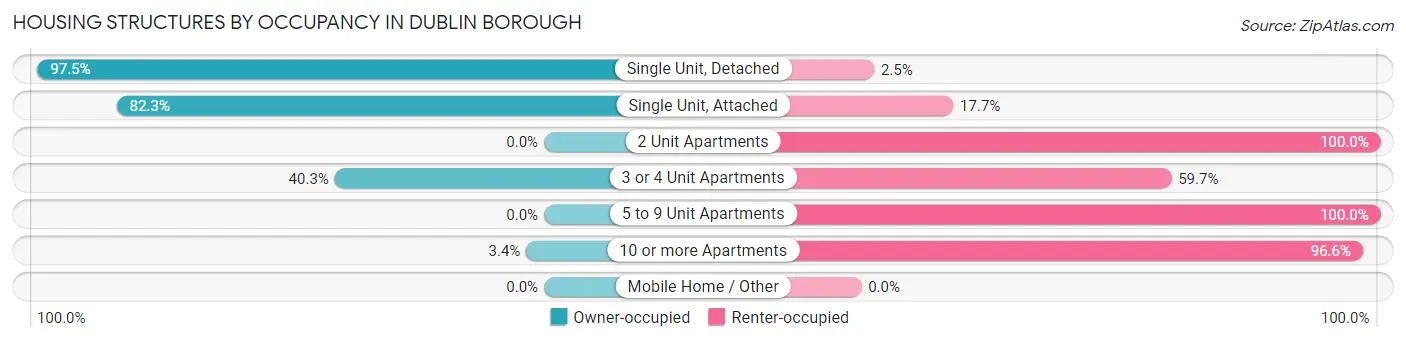
| Structure Type | Owner-occupied | Renter-occupied |
| Single Unit, Detached | 476 (97.5%) | 12 (2.5%) |
| Single Unit, Attached | 79 (82.3%) | 17 (17.7%) |
| 2 Unit Apartments | 0 (0.0%) | 19 (100.0%) |
| 3 or 4 Unit Apartments | 27 (40.3%) | 40 (59.7%) |
| 5 to 9 Unit Apartments | 0 (0.0%) | 179 (100.0%) |
| 10 or more Apartments | 4 (3.4%) | 113 (96.6%) |
| Mobile Home / Other | 0 (0.0%) | 0 (0.0%) |
| Total | 586 (60.7%) | 380 (39.3%) |
Housing Structures by Number of Rooms in Dublin borough
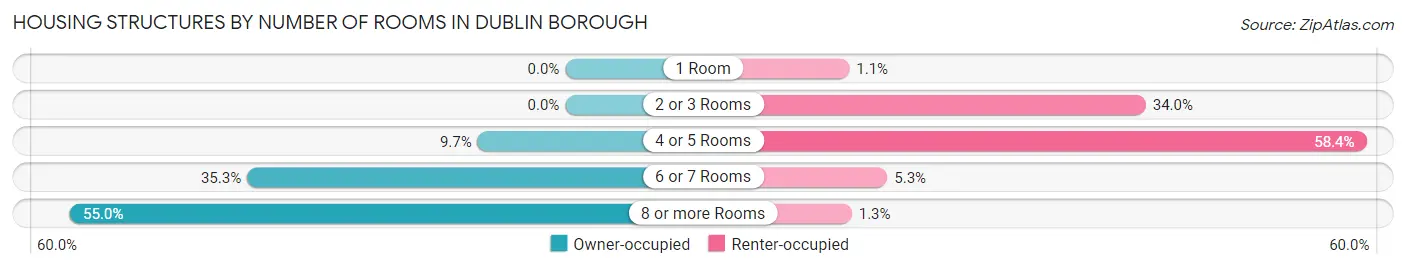
| Number of Rooms | Owner-occupied | Renter-occupied |
| 1 Room | 0 (0.0%) | 4 (1.1%) |
| 2 or 3 Rooms | 0 (0.0%) | 129 (34.0%) |
| 4 or 5 Rooms | 57 (9.7%) | 222 (58.4%) |
| 6 or 7 Rooms | 207 (35.3%) | 20 (5.3%) |
| 8 or more Rooms | 322 (54.9%) | 5 (1.3%) |
| Total | 586 (100.0%) | 380 (100.0%) |
Housing Structure by Heating Type in Dublin borough
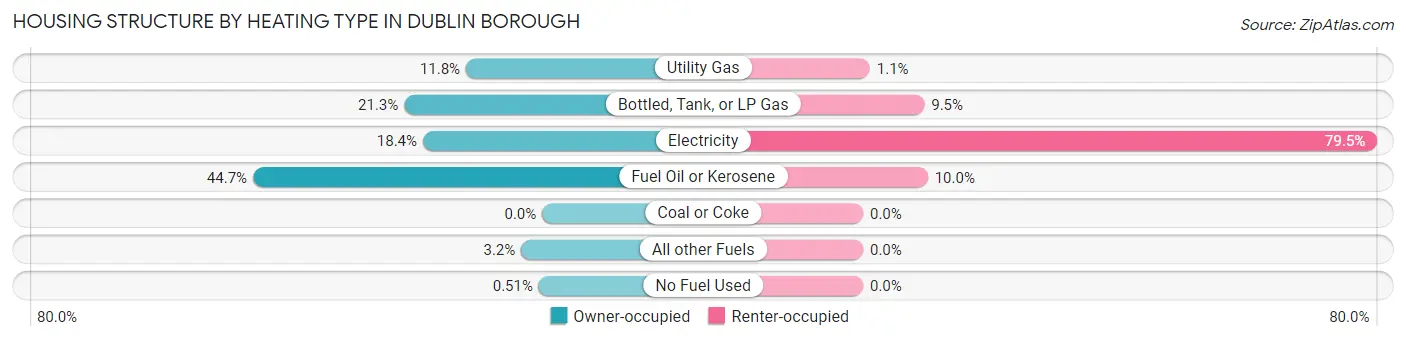
| Heating Type | Owner-occupied | Renter-occupied |
| Utility Gas | 69 (11.8%) | 4 (1.1%) |
| Bottled, Tank, or LP Gas | 125 (21.3%) | 36 (9.5%) |
| Electricity | 108 (18.4%) | 302 (79.5%) |
| Fuel Oil or Kerosene | 262 (44.7%) | 38 (10.0%) |
| Coal or Coke | 0 (0.0%) | 0 (0.0%) |
| All other Fuels | 19 (3.2%) | 0 (0.0%) |
| No Fuel Used | 3 (0.5%) | 0 (0.0%) |
| Total | 586 (100.0%) | 380 (100.0%) |
Household Vehicle Usage in Dublin borough
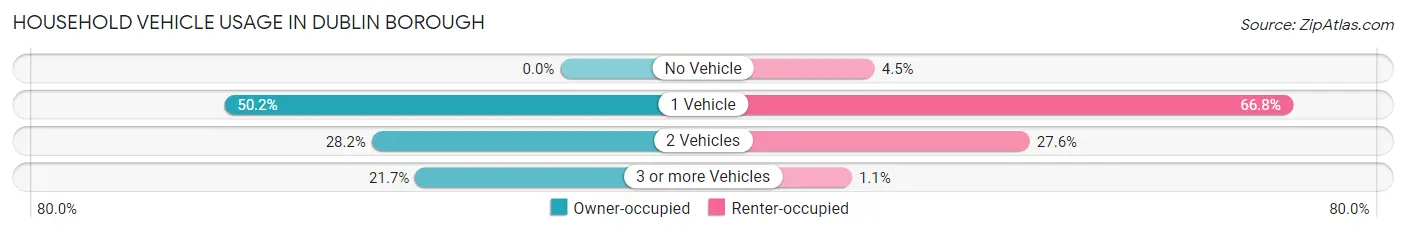
| Vehicles per Household | Owner-occupied | Renter-occupied |
| No Vehicle | 0 (0.0%) | 17 (4.5%) |
| 1 Vehicle | 294 (50.2%) | 254 (66.8%) |
| 2 Vehicles | 165 (28.2%) | 105 (27.6%) |
| 3 or more Vehicles | 127 (21.7%) | 4 (1.1%) |
| Total | 586 (100.0%) | 380 (100.0%) |
Real Estate & Mortgages in Dublin borough
Real Estate and Mortgage Overview in Dublin borough
| Characteristic | Without Mortgage | With Mortgage |
| Housing Units | 88 | 498 |
| Median Property Value | $381,600 | $310,300 |
| Median Household Income | $78,056 | $137 |
| Monthly Housing Costs | $963 | $63 |
| Real Estate Taxes | $5,735 | $0 |
Property Value by Mortgage Status in Dublin borough
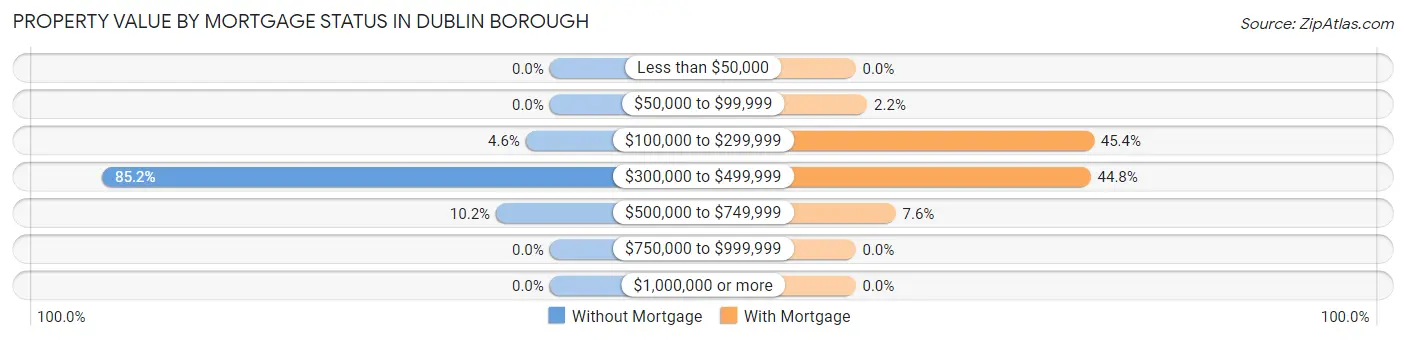
| Property Value | Without Mortgage | With Mortgage |
| Less than $50,000 | 0 (0.0%) | 0 (0.0%) |
| $50,000 to $99,999 | 0 (0.0%) | 11 (2.2%) |
| $100,000 to $299,999 | 4 (4.5%) | 226 (45.4%) |
| $300,000 to $499,999 | 75 (85.2%) | 223 (44.8%) |
| $500,000 to $749,999 | 9 (10.2%) | 38 (7.6%) |
| $750,000 to $999,999 | 0 (0.0%) | 0 (0.0%) |
| $1,000,000 or more | 0 (0.0%) | 0 (0.0%) |
| Total | 88 (100.0%) | 498 (100.0%) |
Household Income by Mortgage Status in Dublin borough
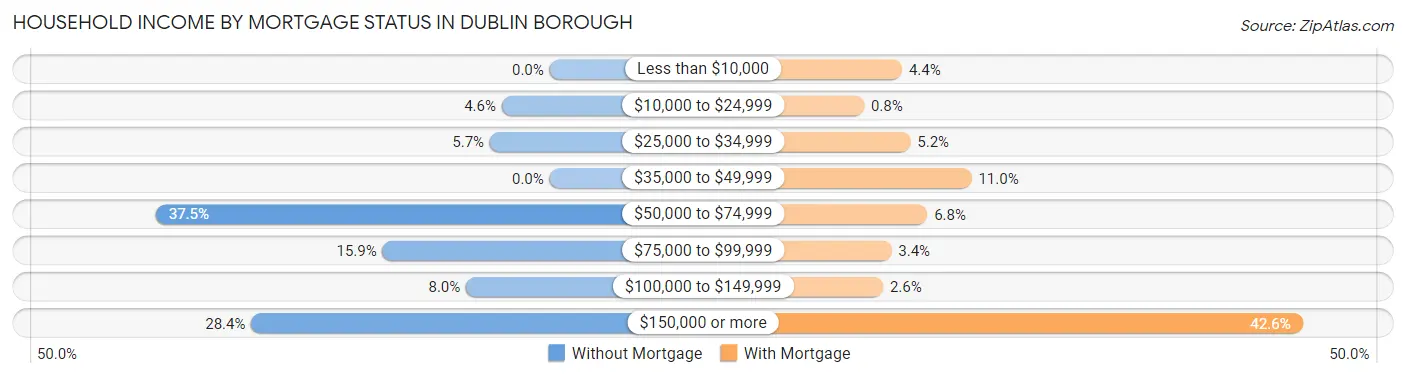
| Household Income | Without Mortgage | With Mortgage |
| Less than $10,000 | 0 (0.0%) | 22 (4.4%) |
| $10,000 to $24,999 | 4 (4.5%) | 4 (0.8%) |
| $25,000 to $34,999 | 5 (5.7%) | 26 (5.2%) |
| $35,000 to $49,999 | 0 (0.0%) | 55 (11.0%) |
| $50,000 to $74,999 | 33 (37.5%) | 34 (6.8%) |
| $75,000 to $99,999 | 14 (15.9%) | 17 (3.4%) |
| $100,000 to $149,999 | 7 (8.0%) | 13 (2.6%) |
| $150,000 or more | 25 (28.4%) | 212 (42.6%) |
| Total | 88 (100.0%) | 498 (100.0%) |
Property Value to Household Income Ratio in Dublin borough
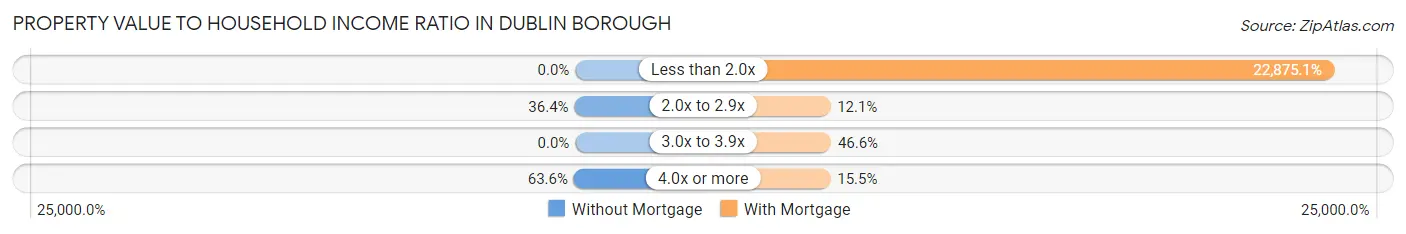
| Value-to-Income Ratio | Without Mortgage | With Mortgage |
| Less than 2.0x | 0 (0.0%) | 113,918 (22,875.1%) |
| 2.0x to 2.9x | 32 (36.4%) | 60 (12.0%) |
| 3.0x to 3.9x | 0 (0.0%) | 232 (46.6%) |
| 4.0x or more | 56 (63.6%) | 77 (15.5%) |
| Total | 88 (100.0%) | 498 (100.0%) |
Real Estate Taxes by Mortgage Status in Dublin borough
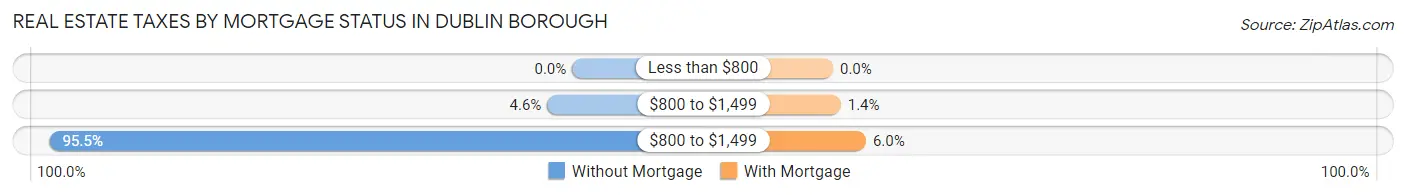
| Property Taxes | Without Mortgage | With Mortgage |
| Less than $800 | 0 (0.0%) | 0 (0.0%) |
| $800 to $1,499 | 4 (4.5%) | 7 (1.4%) |
| $800 to $1,499 | 84 (95.5%) | 30 (6.0%) |
| Total | 88 (100.0%) | 498 (100.0%) |
Health & Disability in Dublin borough
Health Insurance Coverage by Age in Dublin borough
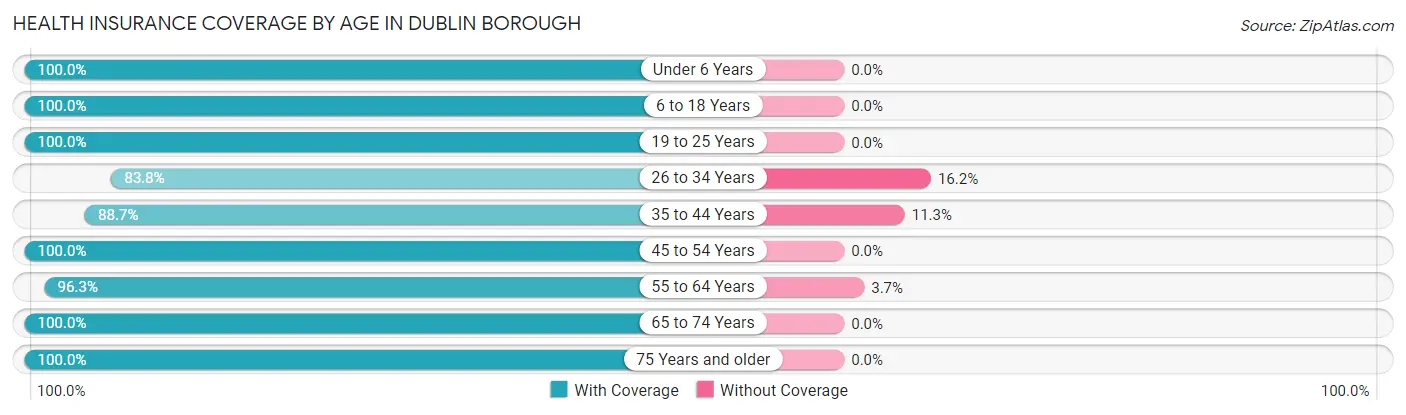
| Age Bracket | With Coverage | Without Coverage |
| Under 6 Years | 154 (100.0%) | 0 (0.0%) |
| 6 to 18 Years | 353 (100.0%) | 0 (0.0%) |
| 19 to 25 Years | 178 (100.0%) | 0 (0.0%) |
| 26 to 34 Years | 254 (83.8%) | 49 (16.2%) |
| 35 to 44 Years | 165 (88.7%) | 21 (11.3%) |
| 45 to 54 Years | 425 (100.0%) | 0 (0.0%) |
| 55 to 64 Years | 310 (96.3%) | 12 (3.7%) |
| 65 to 74 Years | 162 (100.0%) | 0 (0.0%) |
| 75 Years and older | 114 (100.0%) | 0 (0.0%) |
| Total | 2,115 (96.3%) | 82 (3.7%) |
Health Insurance Coverage by Citizenship Status in Dublin borough
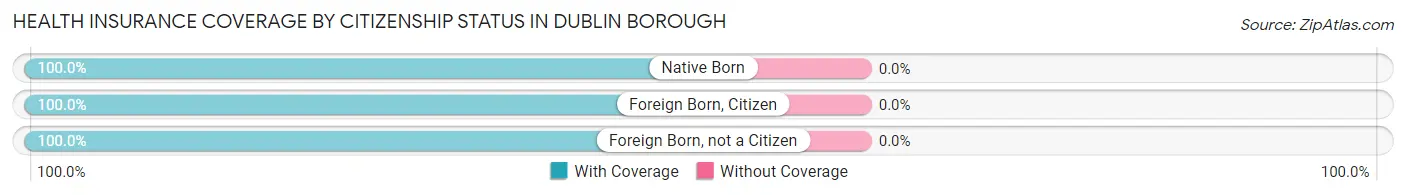
| Citizenship Status | With Coverage | Without Coverage |
| Native Born | 154 (100.0%) | 0 (0.0%) |
| Foreign Born, Citizen | 353 (100.0%) | 0 (0.0%) |
| Foreign Born, not a Citizen | 178 (100.0%) | 0 (0.0%) |
Health Insurance Coverage by Household Income in Dublin borough
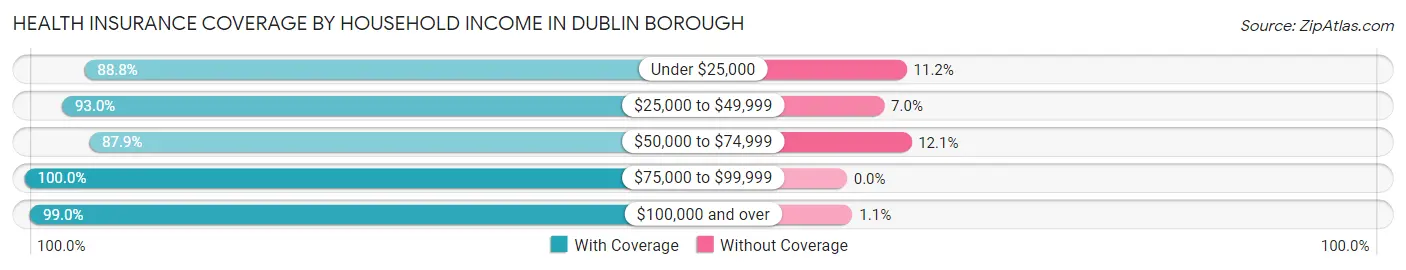
| Household Income | With Coverage | Without Coverage |
| Under $25,000 | 103 (88.8%) | 13 (11.2%) |
| $25,000 to $49,999 | 385 (93.0%) | 29 (7.0%) |
| $50,000 to $74,999 | 204 (87.9%) | 28 (12.1%) |
| $75,000 to $99,999 | 260 (100.0%) | 0 (0.0%) |
| $100,000 and over | 1,135 (99.0%) | 12 (1.1%) |
Public vs Private Health Insurance Coverage by Age in Dublin borough
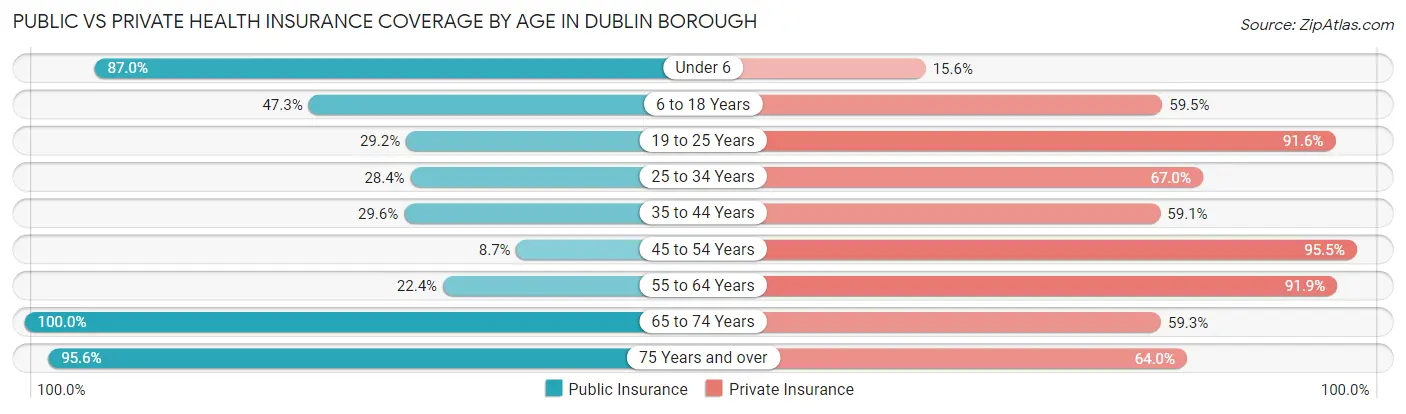
| Age Bracket | Public Insurance | Private Insurance |
| Under 6 | 134 (87.0%) | 24 (15.6%) |
| 6 to 18 Years | 167 (47.3%) | 210 (59.5%) |
| 19 to 25 Years | 52 (29.2%) | 163 (91.6%) |
| 25 to 34 Years | 86 (28.4%) | 203 (67.0%) |
| 35 to 44 Years | 55 (29.6%) | 110 (59.1%) |
| 45 to 54 Years | 37 (8.7%) | 406 (95.5%) |
| 55 to 64 Years | 72 (22.4%) | 296 (91.9%) |
| 65 to 74 Years | 162 (100.0%) | 96 (59.3%) |
| 75 Years and over | 109 (95.6%) | 73 (64.0%) |
| Total | 874 (39.8%) | 1,581 (72.0%) |
Disability Status by Sex by Age in Dublin borough
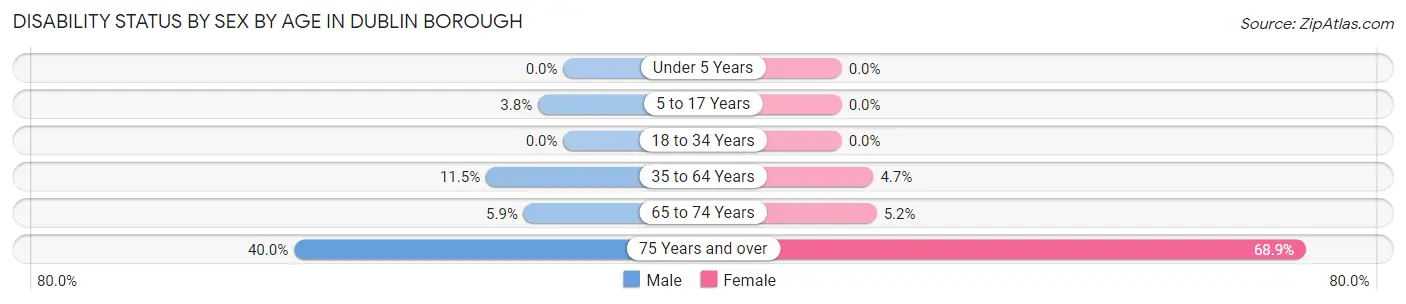
| Age Bracket | Male | Female |
| Under 5 Years | 0 (0.0%) | 0 (0.0%) |
| 5 to 17 Years | 4 (3.8%) | 0 (0.0%) |
| 18 to 34 Years | 0 (0.0%) | 0 (0.0%) |
| 35 to 64 Years | 51 (11.5%) | 23 (4.7%) |
| 65 to 74 Years | 5 (5.9%) | 4 (5.2%) |
| 75 Years and over | 16 (40.0%) | 51 (68.9%) |
Disability Class by Sex by Age in Dublin borough
Disability Class: Hearing Difficulty
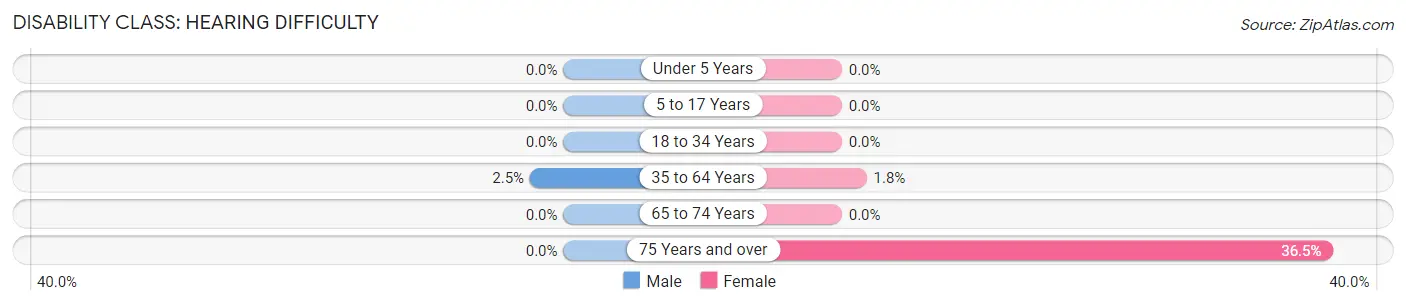
| Age Bracket | Male | Female |
| Under 5 Years | 0 (0.0%) | 0 (0.0%) |
| 5 to 17 Years | 0 (0.0%) | 0 (0.0%) |
| 18 to 34 Years | 0 (0.0%) | 0 (0.0%) |
| 35 to 64 Years | 11 (2.5%) | 9 (1.8%) |
| 65 to 74 Years | 0 (0.0%) | 0 (0.0%) |
| 75 Years and over | 0 (0.0%) | 27 (36.5%) |
Disability Class: Vision Difficulty
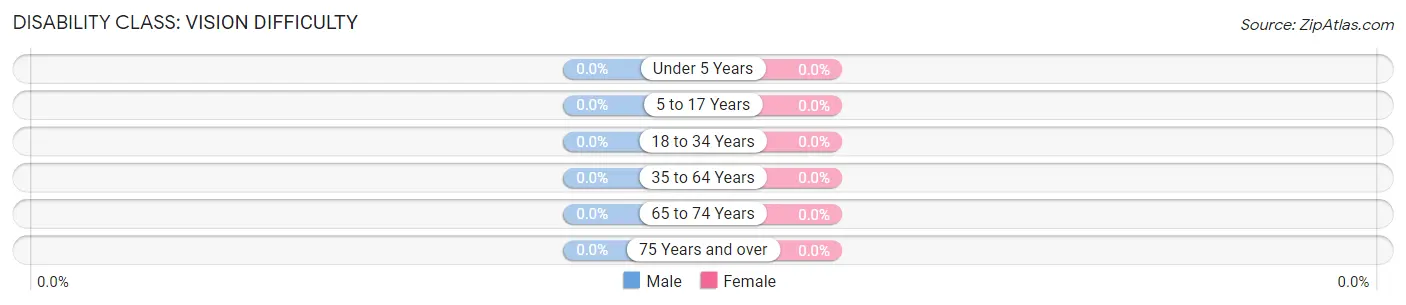
| Age Bracket | Male | Female |
| Under 5 Years | 0 (0.0%) | 0 (0.0%) |
| 5 to 17 Years | 0 (0.0%) | 0 (0.0%) |
| 18 to 34 Years | 0 (0.0%) | 0 (0.0%) |
| 35 to 64 Years | 0 (0.0%) | 0 (0.0%) |
| 65 to 74 Years | 0 (0.0%) | 0 (0.0%) |
| 75 Years and over | 0 (0.0%) | 0 (0.0%) |
Disability Class: Cognitive Difficulty
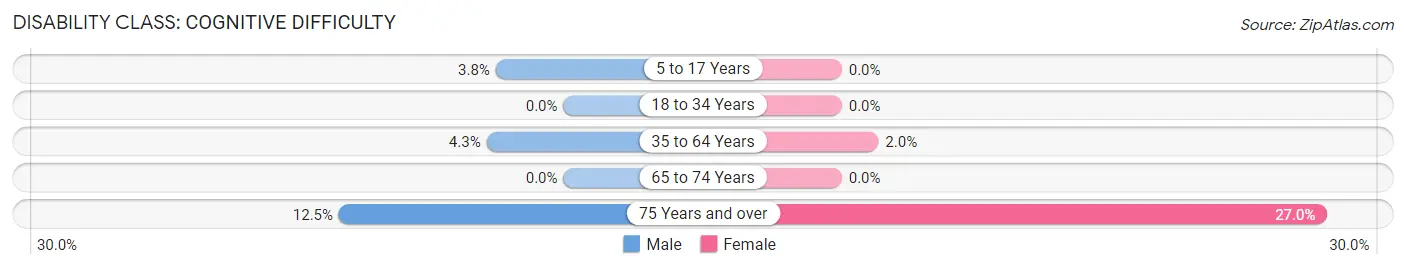
| Age Bracket | Male | Female |
| 5 to 17 Years | 4 (3.8%) | 0 (0.0%) |
| 18 to 34 Years | 0 (0.0%) | 0 (0.0%) |
| 35 to 64 Years | 19 (4.3%) | 10 (2.0%) |
| 65 to 74 Years | 0 (0.0%) | 0 (0.0%) |
| 75 Years and over | 5 (12.5%) | 20 (27.0%) |
Disability Class: Ambulatory Difficulty
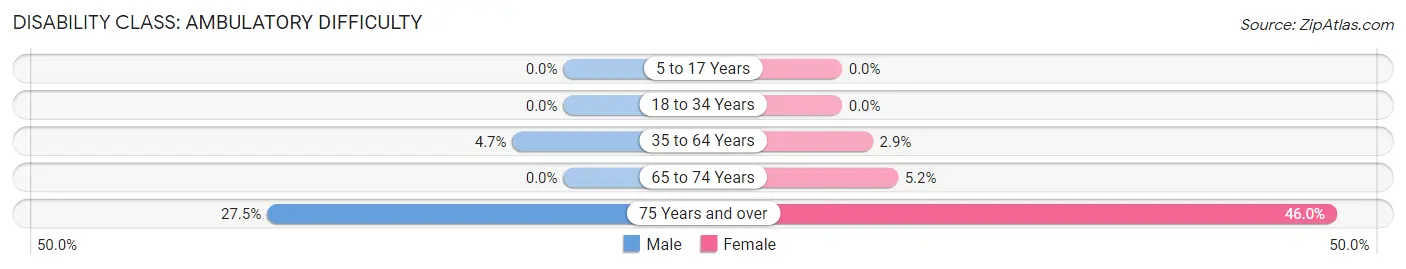
| Age Bracket | Male | Female |
| 5 to 17 Years | 0 (0.0%) | 0 (0.0%) |
| 18 to 34 Years | 0 (0.0%) | 0 (0.0%) |
| 35 to 64 Years | 21 (4.7%) | 14 (2.9%) |
| 65 to 74 Years | 0 (0.0%) | 4 (5.2%) |
| 75 Years and over | 11 (27.5%) | 34 (46.0%) |
Disability Class: Self-Care Difficulty
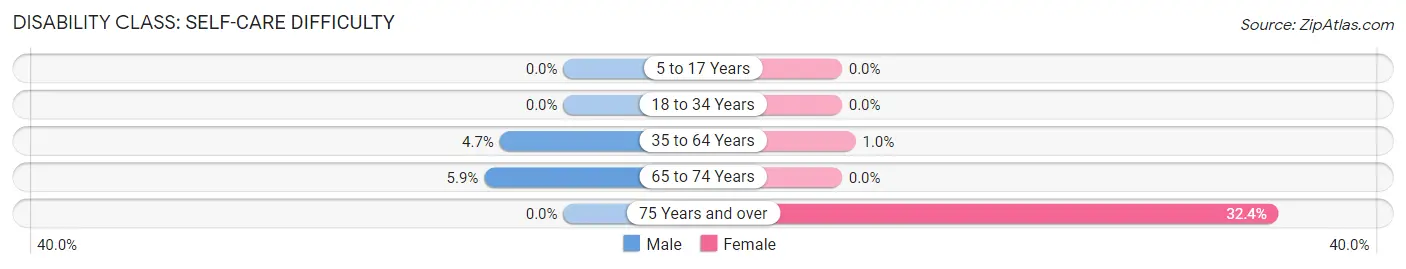
| Age Bracket | Male | Female |
| 5 to 17 Years | 0 (0.0%) | 0 (0.0%) |
| 18 to 34 Years | 0 (0.0%) | 0 (0.0%) |
| 35 to 64 Years | 21 (4.7%) | 5 (1.0%) |
| 65 to 74 Years | 5 (5.9%) | 0 (0.0%) |
| 75 Years and over | 0 (0.0%) | 24 (32.4%) |
Technology Access in Dublin borough
Computing Device Access in Dublin borough
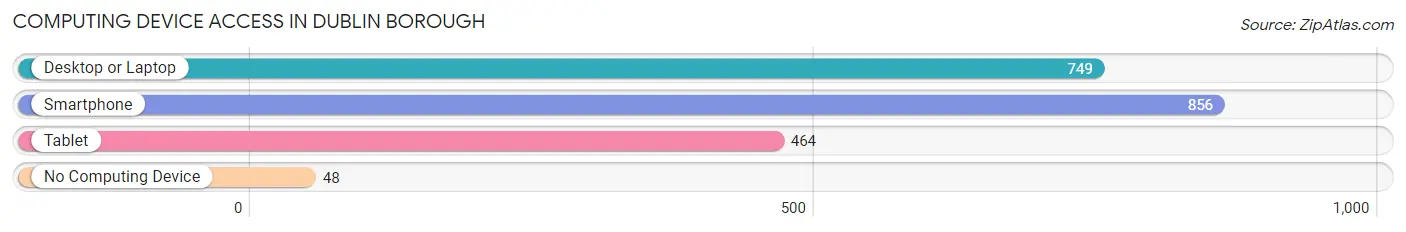
| Device Type | # Households | % Households |
| Desktop or Laptop | 749 | 77.5% |
| Smartphone | 856 | 88.6% |
| Tablet | 464 | 48.0% |
| No Computing Device | 48 | 5.0% |
| Total | 966 | 100.0% |
Internet Access in Dublin borough
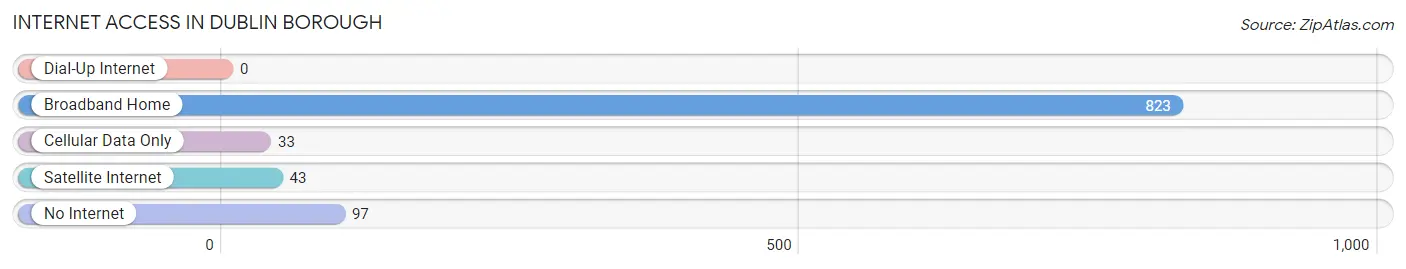
| Internet Type | # Households | % Households |
| Dial-Up Internet | 0 | 0.0% |
| Broadband Home | 823 | 85.2% |
| Cellular Data Only | 33 | 3.4% |
| Satellite Internet | 43 | 4.4% |
| No Internet | 97 | 10.0% |
| Total | 966 | 100.0% |
Dublin borough Summary
Dublin Borough is a small borough located in Bucks County, Pennsylvania. It is situated in the heart of the Delaware Valley, approximately 25 miles north of Philadelphia. The borough is bordered by the townships of Bedminster, Plumstead, and Haycock. Dublin Borough is home to a population of approximately 1,400 people, according to the 2010 census.
Geography
Dublin Borough is located in the heart of Bucks County, Pennsylvania. It is situated in the Delaware Valley, approximately 25 miles north of Philadelphia. The borough is bordered by the townships of Bedminster, Plumstead, and Haycock. Dublin Borough is located in the Central Delaware Valley AVA, a wine-growing region. The borough is situated on a plateau, with elevations ranging from 500 to 800 feet above sea level. The terrain is mostly flat, with some rolling hills. The borough is located in the Piedmont region of Pennsylvania, and is characterized by a mix of deciduous and coniferous forests.
History
Dublin Borough was founded in 1798, and was originally known as Dublinville. The borough was named after Dublin, Ireland, and was settled by Irish immigrants. The borough was incorporated in 1851. During the 19th century, Dublin Borough was a rural farming community. The borough was home to several mills, including a grist mill, a saw mill, and a paper mill. The paper mill was the largest employer in the borough, and was in operation until the early 20th century.
Economy
Dublin Borough is a small, rural community. The borough is home to several small businesses, including a few restaurants, a grocery store, and a hardware store. The borough is also home to a few small manufacturing companies. The largest employer in the borough is the Dublin Borough School District, which employs approximately 200 people.
Demographics
According to the 2010 census, Dublin Borough has a population of 1,400 people. The population is predominantly white (94.3%), with a small percentage of African Americans (2.3%), Asians (1.3%), and Hispanics (1.1%). The median household income in the borough is $60,000, and the median age is 43. The borough is home to a large number of families, with approximately 60% of households having children under the age of 18.
Conclusion
Dublin Borough is a small borough located in Bucks County, Pennsylvania. It is situated in the heart of the Delaware Valley, approximately 25 miles north of Philadelphia. The borough is bordered by the townships of Bedminster, Plumstead, and Haycock. Dublin Borough is home to a population of approximately 1,400 people, according to the 2010 census. The borough is predominantly white, with a small percentage of African Americans, Asians, and Hispanics. The borough is home to several small businesses, and the largest employer is the Dublin Borough School District.
Common Questions
What is Per Capita Income in Dublin borough?
Per Capita income in Dublin borough is $43,084.
What is the Median Family Income in Dublin borough?
Median Family Income in Dublin borough is $106,833.
What is the Median Household income in Dublin borough?
Median Household Income in Dublin borough is $87,292.
What is Income or Wage Gap in Dublin borough?
Income or Wage Gap in Dublin borough is 3.0%.
Women in Dublin borough earn 97.0 cents for every dollar earned by a man.
What is Inequality or Gini Index in Dublin borough?
Inequality or Gini Index in Dublin borough is 0.40.
What is the Total Population of Dublin borough?
Total Population of Dublin borough is 2,206.
What is the Total Male Population of Dublin borough?
Total Male Population of Dublin borough is 1,066.
What is the Total Female Population of Dublin borough?
Total Female Population of Dublin borough is 1,140.
What is the Ratio of Males per 100 Females in Dublin borough?
There are 93.51 Males per 100 Females in Dublin borough.
What is the Ratio of Females per 100 Males in Dublin borough?
There are 106.94 Females per 100 Males in Dublin borough.
What is the Median Population Age in Dublin borough?
Median Population Age in Dublin borough is 40.2 Years.
What is the Average Family Size in Dublin borough
Average Family Size in Dublin borough is 3.4 People.
What is the Average Household Size in Dublin borough
Average Household Size in Dublin borough is 2.2 People.
How Large is the Labor Force in Dublin borough?
There are 1,299 People in the Labor Forcein in Dublin borough.
What is the Percentage of People in the Labor Force in Dublin borough?
73.0% of People are in the Labor Force in Dublin borough.
What is the Unemployment Rate in Dublin borough?
Unemployment Rate in Dublin borough is 5.7%.