Portage borough, PA Map & Demographics
Portage borough Overview
$26,005
PER CAPITA INCOME
$67,813
AVG FAMILY INCOME
$47,825
AVG HOUSEHOLD INCOME
22.7%
WAGE / INCOME GAP [ % ]
77.3¢/ $1
WAGE / INCOME GAP [ $ ]
0.43
INEQUALITY / GINI INDEX
2,658
TOTAL POPULATION
1,375
MALE POPULATION
1,283
FEMALE POPULATION
107.17
MALES / 100 FEMALES
93.31
FEMALES / 100 MALES
41.4
MEDIAN AGE
3.1
AVG FAMILY SIZE
2.3
AVG HOUSEHOLD SIZE
1,095
LABOR FORCE [ PEOPLE ]
52.2%
PERCENT IN LABOR FORCE
4.0%
UNEMPLOYMENT RATE
Income in Portage borough
Income Overview in Portage borough
Per Capita Income in Portage borough is $26,005, while median incomes of families and households are $67,813 and $47,825 respectively.
| Characteristic | Number | Measure |
| Per Capita Income | 2,658 | $26,005 |
| Median Family Income | 607 | $67,813 |
| Mean Family Income | 607 | $76,815 |
| Median Household Income | 1,135 | $47,825 |
| Mean Household Income | 1,135 | $58,976 |
| Income Deficit | 607 | $0 |
| Wage / Income Gap (%) | 2,658 | 22.72% |
| Wage / Income Gap ($) | 2,658 | 77.28¢ per $1 |
| Gini / Inequality Index | 2,658 | 0.43 |
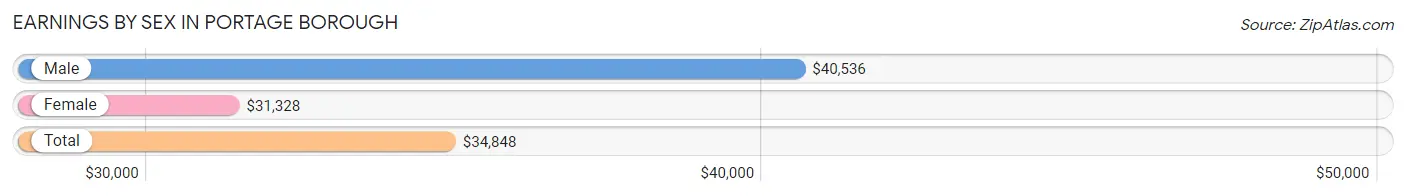
Earnings by Sex in Portage borough
Average Earnings in Portage borough are $34,848, $40,536 for men and $31,328 for women, a difference of 22.7%.
| Sex | Number | Average Earnings |
| Male | 637 (55.3%) | $40,536 |
| Female | 515 (44.7%) | $31,328 |
| Total | 1,152 (100.0%) | $34,848 |
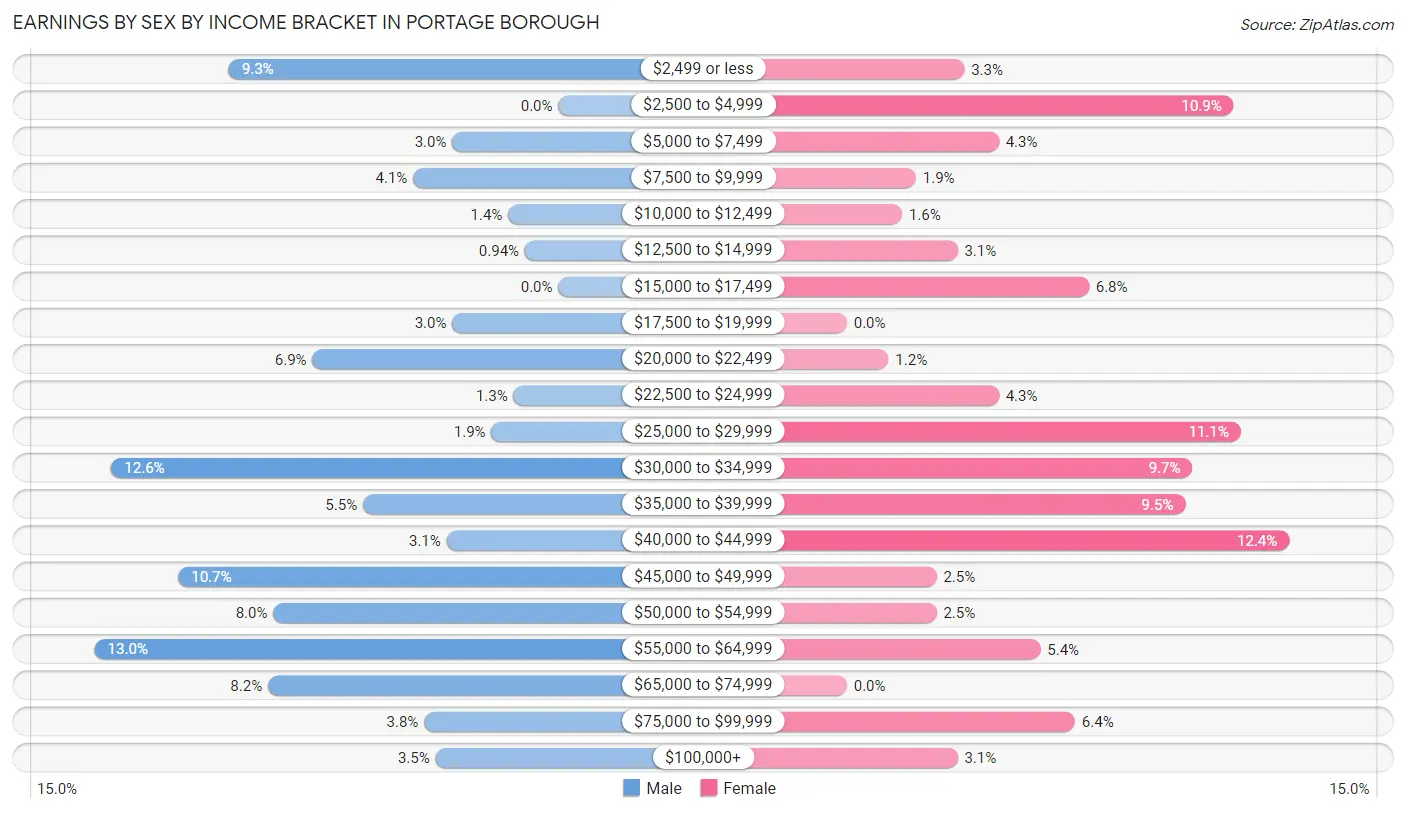
Earnings by Sex by Income Bracket in Portage borough
The most common earnings brackets in Portage borough are $55,000 to $64,999 for men (83 | 13.0%) and $40,000 to $44,999 for women (64 | 12.4%).
| Income | Male | Female |
| $2,499 or less | 59 (9.3%) | 17 (3.3%) |
| $2,500 to $4,999 | 0 (0.0%) | 56 (10.9%) |
| $5,000 to $7,499 | 19 (3.0%) | 22 (4.3%) |
| $7,500 to $9,999 | 26 (4.1%) | 10 (1.9%) |
| $10,000 to $12,499 | 9 (1.4%) | 8 (1.5%) |
| $12,500 to $14,999 | 6 (0.9%) | 16 (3.1%) |
| $15,000 to $17,499 | 0 (0.0%) | 35 (6.8%) |
| $17,500 to $19,999 | 19 (3.0%) | 0 (0.0%) |
| $20,000 to $22,499 | 44 (6.9%) | 6 (1.2%) |
| $22,500 to $24,999 | 8 (1.3%) | 22 (4.3%) |
| $25,000 to $29,999 | 12 (1.9%) | 57 (11.1%) |
| $30,000 to $34,999 | 80 (12.6%) | 50 (9.7%) |
| $35,000 to $39,999 | 35 (5.5%) | 49 (9.5%) |
| $40,000 to $44,999 | 20 (3.1%) | 64 (12.4%) |
| $45,000 to $49,999 | 68 (10.7%) | 13 (2.5%) |
| $50,000 to $54,999 | 51 (8.0%) | 13 (2.5%) |
| $55,000 to $64,999 | 83 (13.0%) | 28 (5.4%) |
| $65,000 to $74,999 | 52 (8.2%) | 0 (0.0%) |
| $75,000 to $99,999 | 24 (3.8%) | 33 (6.4%) |
| $100,000+ | 22 (3.5%) | 16 (3.1%) |
| Total | 637 (100.0%) | 515 (100.0%) |
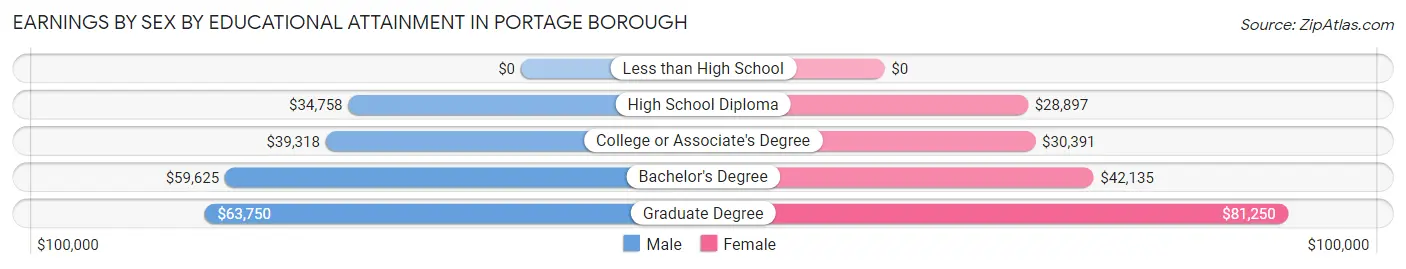
Earnings by Sex by Educational Attainment in Portage borough
Average earnings in Portage borough are $45,282 for men and $34,228 for women, a difference of 24.4%. Men with an educational attainment of graduate degree enjoy the highest average annual earnings of $63,750, while those with high school diploma education earn the least with $34,758. Women with an educational attainment of graduate degree earn the most with the average annual earnings of $81,250, while those with high school diploma education have the smallest earnings of $28,897.
| Educational Attainment | Male Income | Female Income |
| Less than High School | - | - |
| High School Diploma | $34,758 | $28,897 |
| College or Associate's Degree | $39,318 | $30,391 |
| Bachelor's Degree | $59,625 | $42,135 |
| Graduate Degree | $63,750 | $81,250 |
| Total | $45,282 | $34,228 |
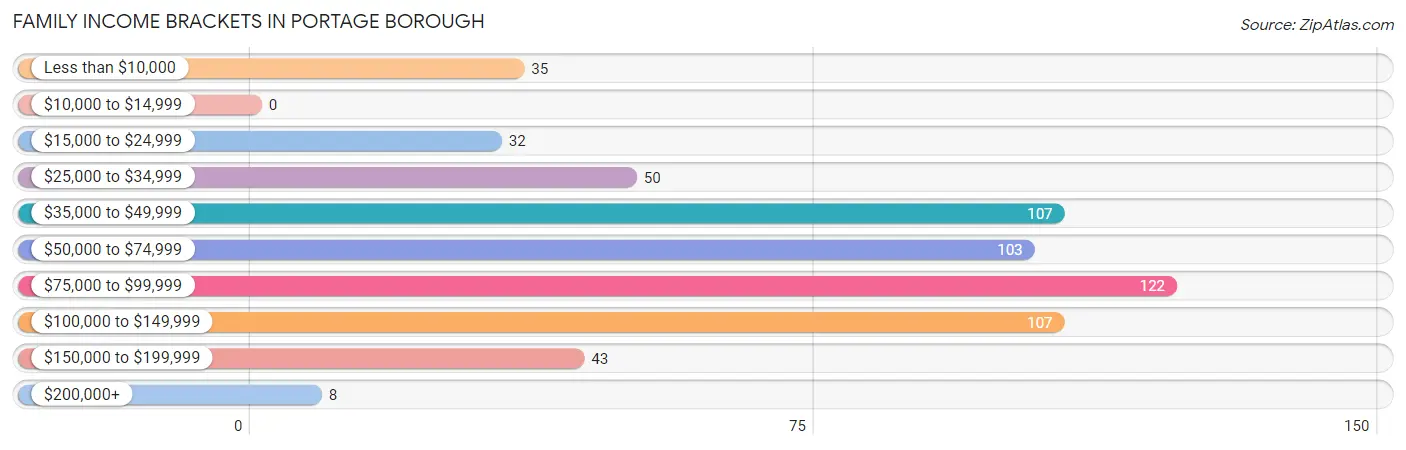
Family Income in Portage borough
Family Income Brackets in Portage borough
According to the Portage borough family income data, there are 122 families falling into the $75,000 to $99,999 income range, which is the most common income bracket and makes up 20.1% of all families.
| Income Bracket | # Families | % Families |
| Less than $10,000 | 35 | 5.8% |
| $10,000 to $14,999 | 0 | 0.0% |
| $15,000 to $24,999 | 32 | 5.3% |
| $25,000 to $34,999 | 50 | 8.2% |
| $35,000 to $49,999 | 107 | 17.6% |
| $50,000 to $74,999 | 103 | 17.0% |
| $75,000 to $99,999 | 122 | 20.1% |
| $100,000 to $149,999 | 107 | 17.6% |
| $150,000 to $199,999 | 43 | 7.1% |
| $200,000+ | 8 | 1.3% |
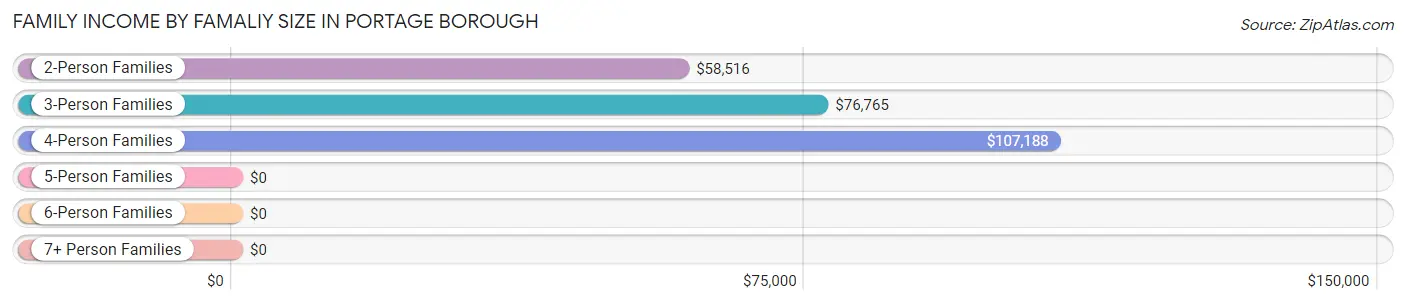
Family Income by Famaliy Size in Portage borough
4-person families (104 | 17.1%) account for the highest median family income in Portage borough with $107,188 per family, while 2-person families (319 | 52.5%) have the highest median income of $29,258 per family member.
| Income Bracket | # Families | Median Income |
| 2-Person Families | 319 (52.5%) | $58,516 |
| 3-Person Families | 110 (18.1%) | $76,765 |
| 4-Person Families | 104 (17.1%) | $107,188 |
| 5-Person Families | 50 (8.2%) | $0 |
| 6-Person Families | 24 (4.0%) | $0 |
| 7+ Person Families | 0 (0.0%) | $0 |
| Total | 607 (100.0%) | $67,813 |
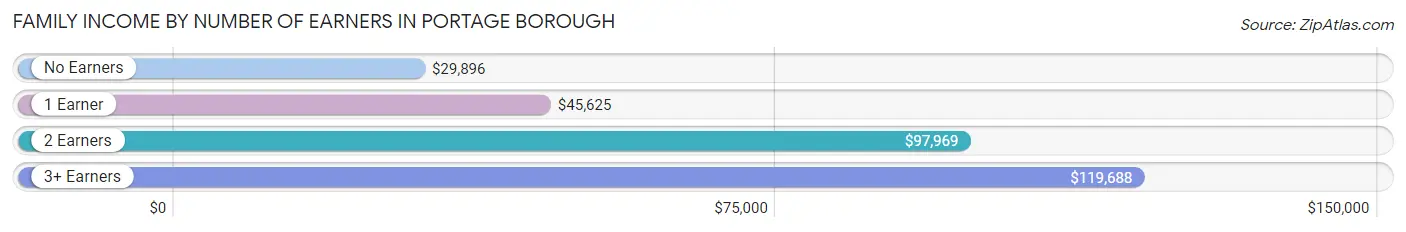
Family Income by Number of Earners in Portage borough
The median family income in Portage borough is $67,813, with families comprising 3+ earners (73) having the highest median family income of $119,688, while families with no earners (179) have the lowest median family income of $29,896, accounting for 12.0% and 29.5% of families, respectively.
| Number of Earners | # Families | Median Income |
| No Earners | 179 (29.5%) | $29,896 |
| 1 Earner | 158 (26.0%) | $45,625 |
| 2 Earners | 197 (32.5%) | $97,969 |
| 3+ Earners | 73 (12.0%) | $119,688 |
| Total | 607 (100.0%) | $67,813 |
Household Income in Portage borough
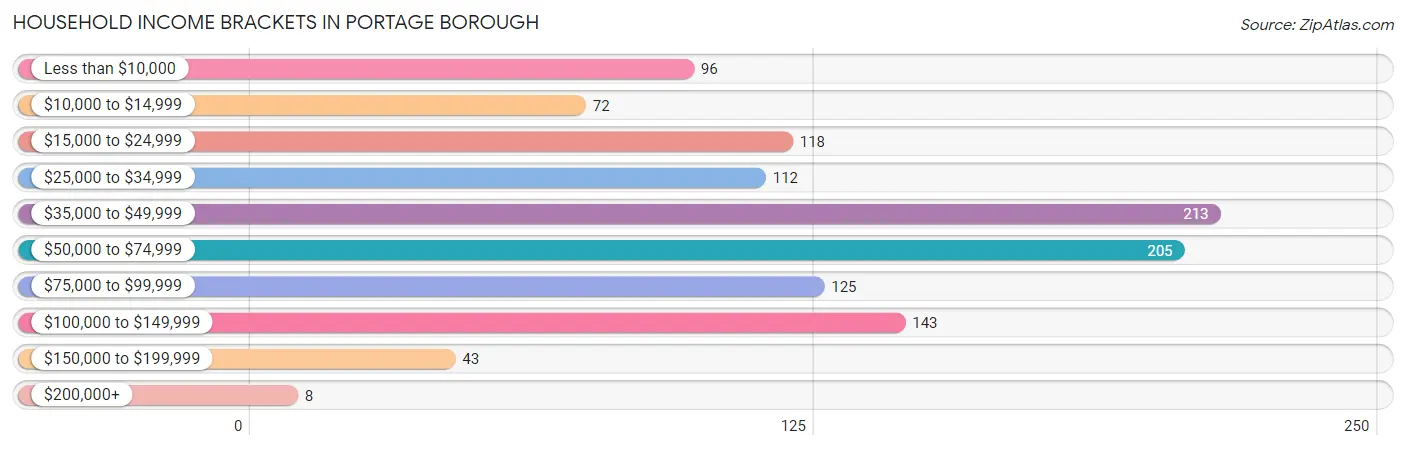
Household Income Brackets in Portage borough
With 213 households falling in the category, the $35,000 to $49,999 income range is the most frequent in Portage borough, accounting for 18.8% of all households. In contrast, only 8 households (0.7%) fall into the $200,000+ income bracket, making it the least populous group.
| Income Bracket | # Households | % Households |
| Less than $10,000 | 96 | 8.5% |
| $10,000 to $14,999 | 72 | 6.3% |
| $15,000 to $24,999 | 118 | 10.4% |
| $25,000 to $34,999 | 112 | 9.9% |
| $35,000 to $49,999 | 213 | 18.8% |
| $50,000 to $74,999 | 205 | 18.1% |
| $75,000 to $99,999 | 125 | 11.0% |
| $100,000 to $149,999 | 143 | 12.6% |
| $150,000 to $199,999 | 43 | 3.8% |
| $200,000+ | 8 | 0.7% |
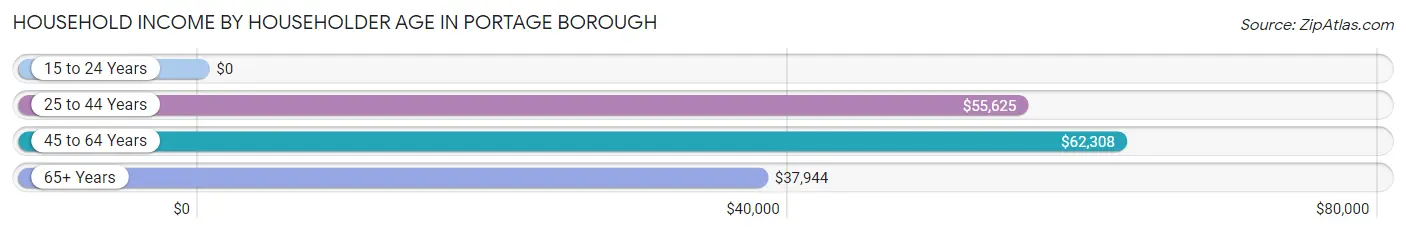
Household Income by Householder Age in Portage borough
The median household income in Portage borough is $47,825, with the highest median household income of $62,308 found in the 45 to 64 years age bracket for the primary householder. A total of 378 households (33.3%) fall into this category. Meanwhile, the 15 to 24 years age bracket for the primary householder has the lowest median household income of $0, with 21 households (1.8%) in this group.
| Income Bracket | # Households | Median Income |
| 15 to 24 Years | 21 (1.8%) | $0 |
| 25 to 44 Years | 326 (28.7%) | $55,625 |
| 45 to 64 Years | 378 (33.3%) | $62,308 |
| 65+ Years | 410 (36.1%) | $37,944 |
| Total | 1,135 (100.0%) | $47,825 |
Poverty in Portage borough
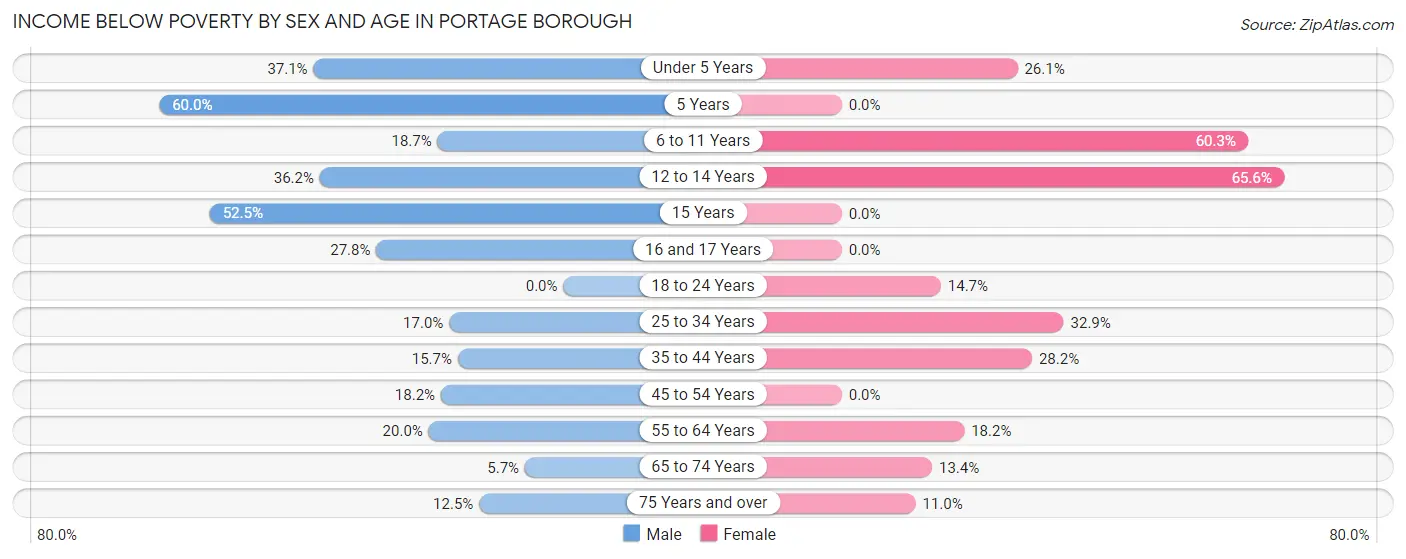
Income Below Poverty by Sex and Age in Portage borough
With 19.4% poverty level for males and 22.7% for females among the residents of Portage borough, 5 year old males and 12 to 14 year old females are the most vulnerable to poverty, with 12 males (60.0%) and 42 females (65.6%) in their respective age groups living below the poverty level.
| Age Bracket | Male | Female |
| Under 5 Years | 36 (37.1%) | 24 (26.1%) |
| 5 Years | 12 (60.0%) | 0 (0.0%) |
| 6 to 11 Years | 17 (18.7%) | 44 (60.3%) |
| 12 to 14 Years | 17 (36.2%) | 42 (65.6%) |
| 15 Years | 21 (52.5%) | 0 (0.0%) |
| 16 and 17 Years | 15 (27.8%) | 0 (0.0%) |
| 18 to 24 Years | 0 (0.0%) | 10 (14.7%) |
| 25 to 34 Years | 39 (17.0%) | 56 (32.9%) |
| 35 to 44 Years | 21 (15.7%) | 37 (28.2%) |
| 45 to 54 Years | 44 (18.2%) | 0 (0.0%) |
| 55 to 64 Years | 27 (20.0%) | 32 (18.2%) |
| 65 to 74 Years | 10 (5.7%) | 26 (13.4%) |
| 75 Years and over | 7 (12.5%) | 15 (11.0%) |
| Total | 266 (19.4%) | 286 (22.7%) |
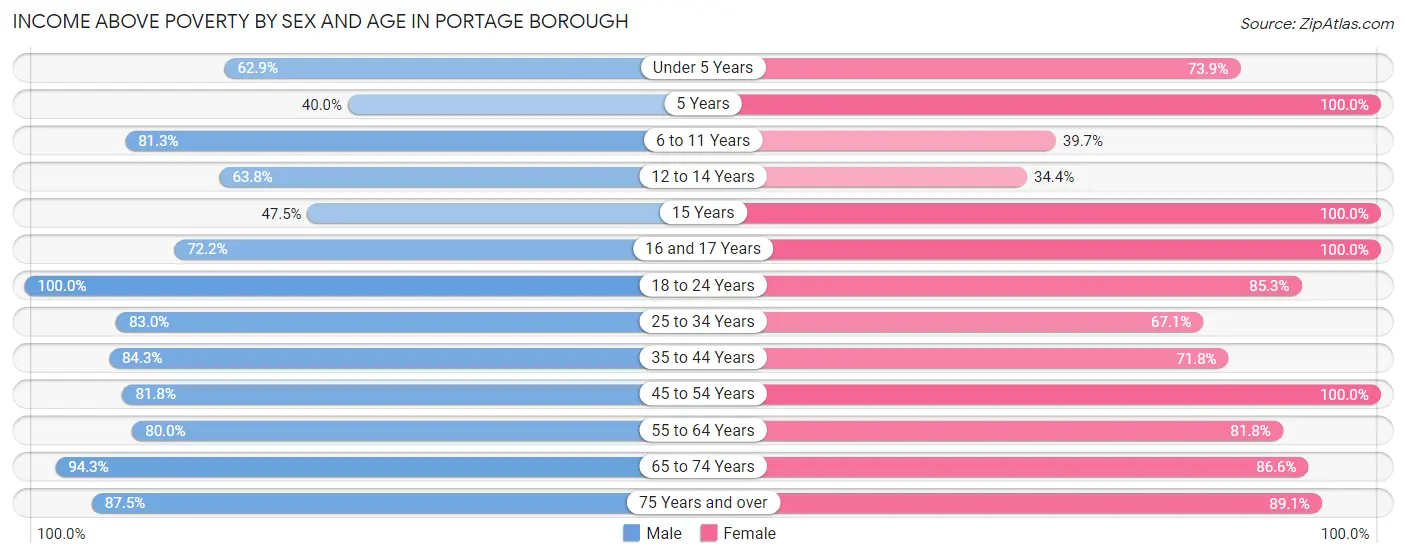
Income Above Poverty by Sex and Age in Portage borough
According to the poverty statistics in Portage borough, males aged 18 to 24 years and females aged 5 years are the age groups that are most secure financially, with 100.0% of males and 100.0% of females in these age groups living above the poverty line.
| Age Bracket | Male | Female |
| Under 5 Years | 61 (62.9%) | 68 (73.9%) |
| 5 Years | 8 (40.0%) | 7 (100.0%) |
| 6 to 11 Years | 74 (81.3%) | 29 (39.7%) |
| 12 to 14 Years | 30 (63.8%) | 22 (34.4%) |
| 15 Years | 19 (47.5%) | 4 (100.0%) |
| 16 and 17 Years | 39 (72.2%) | 7 (100.0%) |
| 18 to 24 Years | 54 (100.0%) | 58 (85.3%) |
| 25 to 34 Years | 191 (83.0%) | 114 (67.1%) |
| 35 to 44 Years | 113 (84.3%) | 94 (71.8%) |
| 45 to 54 Years | 198 (81.8%) | 135 (100.0%) |
| 55 to 64 Years | 108 (80.0%) | 144 (81.8%) |
| 65 to 74 Years | 165 (94.3%) | 168 (86.6%) |
| 75 Years and over | 49 (87.5%) | 122 (89.0%) |
| Total | 1,109 (80.6%) | 972 (77.3%) |
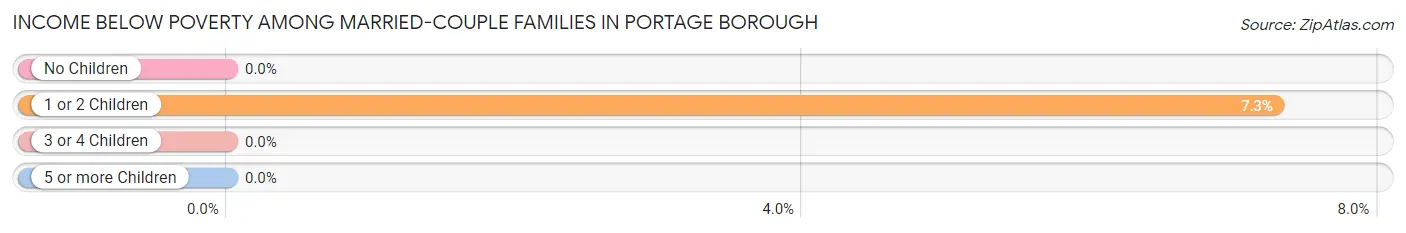
Income Below Poverty Among Married-Couple Families in Portage borough
The poverty statistics for married-couple families in Portage borough show that 1.8% or 7 of the total 393 families live below the poverty line. Families with 1 or 2 children have the highest poverty rate of 7.3%, comprising of 7 families. On the other hand, families with no children have the lowest poverty rate of 0.0%, which includes 0 families.
| Children | Above Poverty | Below Poverty |
| No Children | 274 (100.0%) | 0 (0.0%) |
| 1 or 2 Children | 89 (92.7%) | 7 (7.3%) |
| 3 or 4 Children | 23 (100.0%) | 0 (0.0%) |
| 5 or more Children | 0 (0.0%) | 0 (0.0%) |
| Total | 386 (98.2%) | 7 (1.8%) |
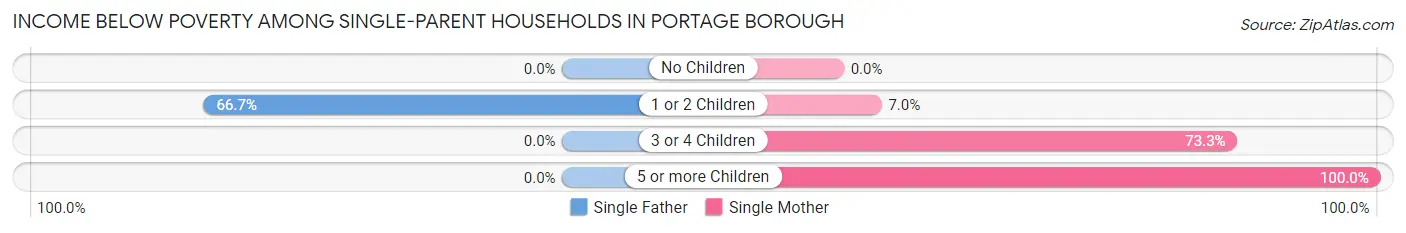
Income Below Poverty Among Single-Parent Households in Portage borough
According to the poverty data in Portage borough, 66.7% or 16 single-father households and 23.2% or 44 single-mother households are living below the poverty line. Among single-father households, those with 1 or 2 children have the highest poverty rate, with 16 households (66.7%) experiencing poverty. Likewise, among single-mother households, those with 5 or more children have the highest poverty rate, with 17 households (100.0%) falling below the poverty line.
| Children | Single Father | Single Mother |
| No Children | 0 (0.0%) | 0 (0.0%) |
| 1 or 2 Children | 16 (66.7%) | 5 (7.0%) |
| 3 or 4 Children | 0 (0.0%) | 22 (73.3%) |
| 5 or more Children | 0 (0.0%) | 17 (100.0%) |
| Total | 16 (66.7%) | 44 (23.2%) |
Income Below Poverty Among Married-Couple vs Single-Parent Households in Portage borough
The poverty data for Portage borough shows that 7 of the married-couple family households (1.8%) and 60 of the single-parent households (28.0%) are living below the poverty level. Within the married-couple family households, those with 1 or 2 children have the highest poverty rate, with 7 households (7.3%) falling below the poverty line. Among the single-parent households, those with 5 or more children have the highest poverty rate, with 17 household (100.0%) living below poverty.
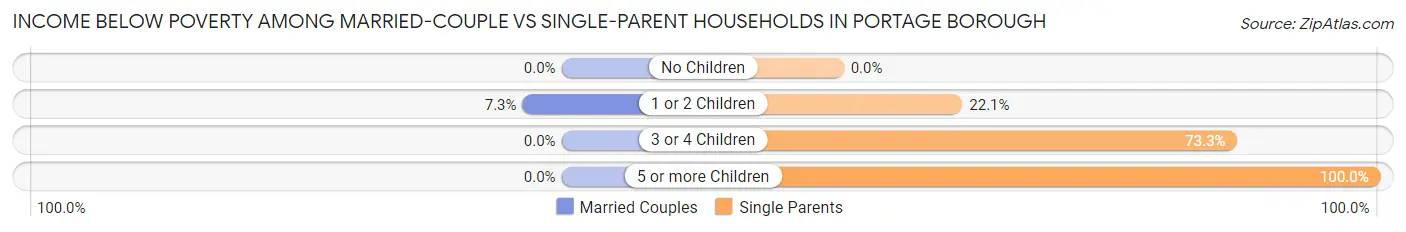
| Children | Married-Couple Families | Single-Parent Households |
| No Children | 0 (0.0%) | 0 (0.0%) |
| 1 or 2 Children | 7 (7.3%) | 21 (22.1%) |
| 3 or 4 Children | 0 (0.0%) | 22 (73.3%) |
| 5 or more Children | 0 (0.0%) | 17 (100.0%) |
| Total | 7 (1.8%) | 60 (28.0%) |
Race in Portage borough
The most populous races in Portage borough are White / Caucasian (2,581 | 97.1%), Two or more Races (58 | 2.2%), and Black / African American (11 | 0.4%).
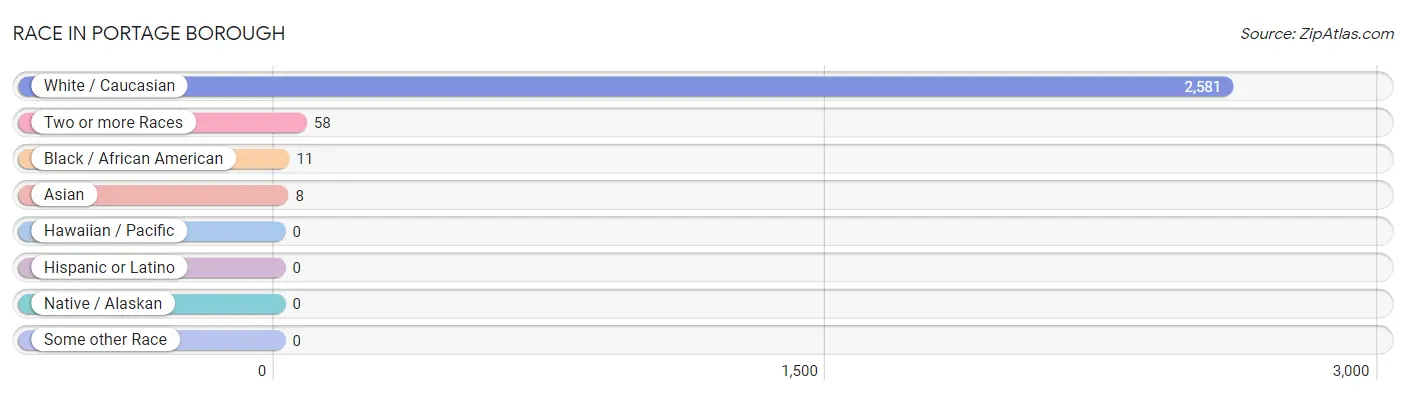
| Race | # Population | % Population |
| Asian | 8 | 0.3% |
| Black / African American | 11 | 0.4% |
| Hawaiian / Pacific | 0 | 0.0% |
| Hispanic or Latino | 0 | 0.0% |
| Native / Alaskan | 0 | 0.0% |
| White / Caucasian | 2,581 | 97.1% |
| Two or more Races | 58 | 2.2% |
| Some other Race | 0 | 0.0% |
| Total | 2,658 | 100.0% |
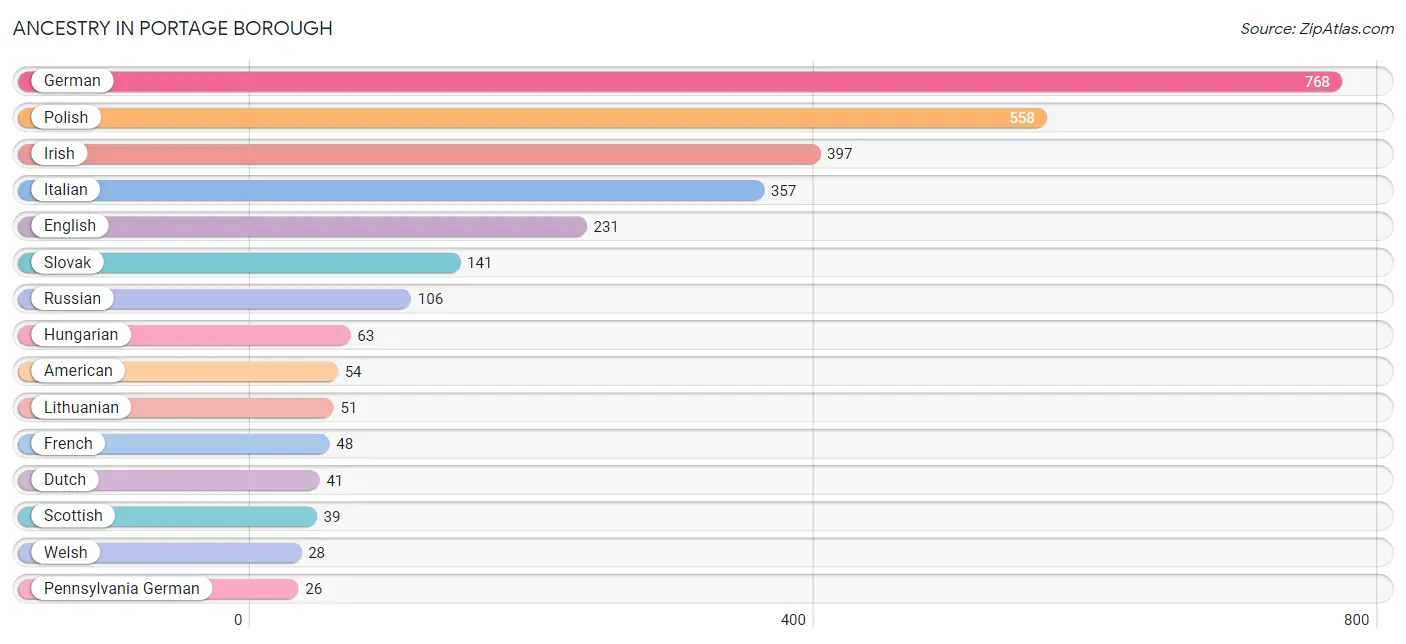
Ancestry in Portage borough
The most populous ancestries reported in Portage borough are German (768 | 28.9%), Polish (558 | 21.0%), Irish (397 | 14.9%), Italian (357 | 13.4%), and English (231 | 8.7%), together accounting for 86.9% of all Portage borough residents.
| Ancestry | # Population | % Population |
| American | 54 | 2.0% |
| Arab | 7 | 0.3% |
| Bhutanese | 8 | 0.3% |
| British | 7 | 0.3% |
| Burmese | 14 | 0.5% |
| Dutch | 41 | 1.5% |
| English | 231 | 8.7% |
| European | 6 | 0.2% |
| French | 48 | 1.8% |
| French Canadian | 7 | 0.3% |
| German | 768 | 28.9% |
| Hungarian | 63 | 2.4% |
| Irish | 397 | 14.9% |
| Italian | 357 | 13.4% |
| Jamaican | 1 | 0.0% |
| Lebanese | 7 | 0.3% |
| Lithuanian | 51 | 1.9% |
| Pennsylvania German | 26 | 1.0% |
| Polish | 558 | 21.0% |
| Russian | 106 | 4.0% |
| Scandinavian | 7 | 0.3% |
| Scotch-Irish | 12 | 0.4% |
| Scottish | 39 | 1.5% |
| Serbian | 3 | 0.1% |
| Slavic | 3 | 0.1% |
| Slovak | 141 | 5.3% |
| Swedish | 6 | 0.2% |
| Swiss | 6 | 0.2% |
| Welsh | 28 | 1.1% | View All 29 Rows |
Immigrants in Portage borough
The most numerous immigrant groups reported in Portage borough came from Europe (6 | 0.2%), Germany (6 | 0.2%), and Western Europe (6 | 0.2%), together accounting for 0.7% of all Portage borough residents.
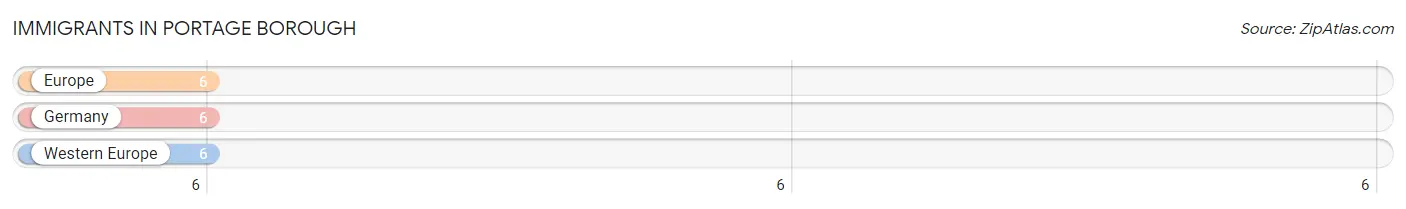
| Immigration Origin | # Population | % Population |
| Europe | 6 | 0.2% |
| Germany | 6 | 0.2% |
| Western Europe | 6 | 0.2% | View All 3 Rows |
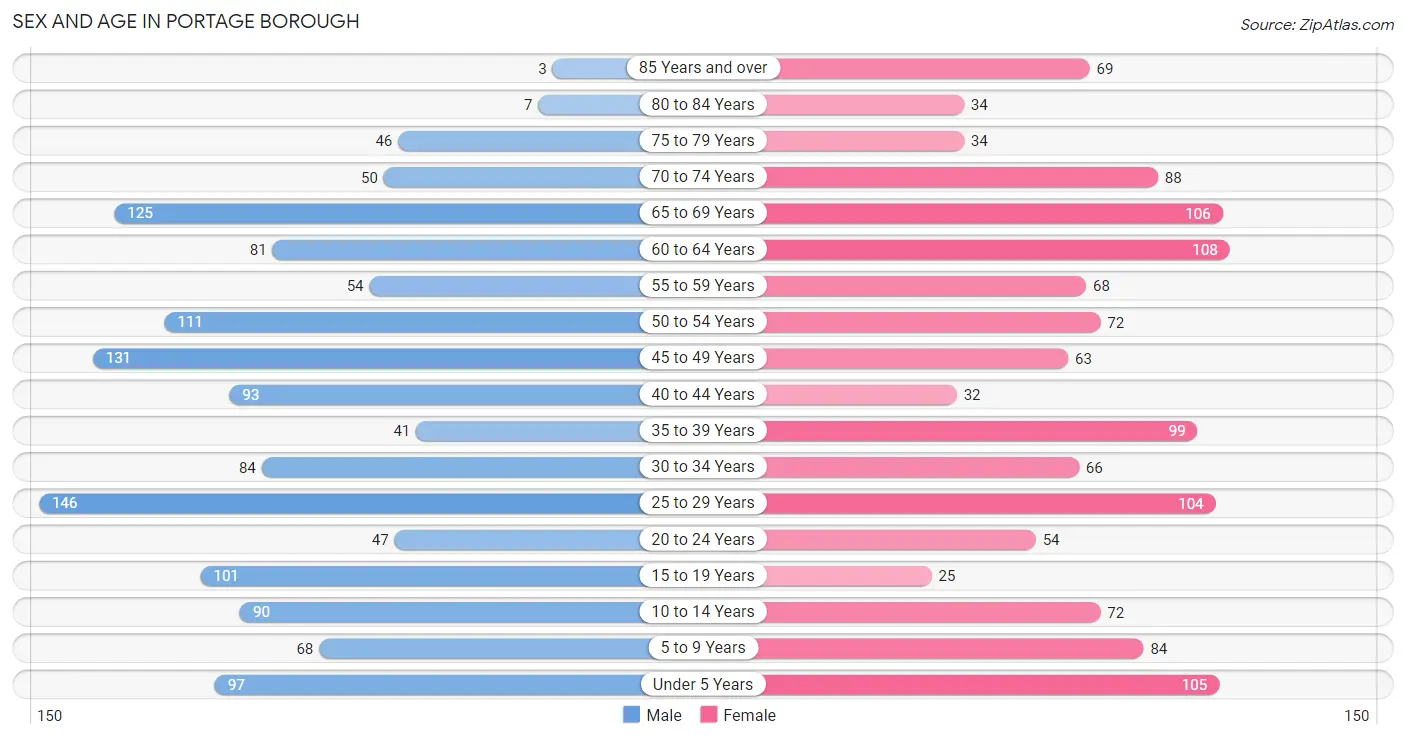
Sex and Age in Portage borough
Sex and Age in Portage borough
The most populous age groups in Portage borough are 25 to 29 Years (146 | 10.6%) for men and 60 to 64 Years (108 | 8.4%) for women.
| Age Bracket | Male | Female |
| Under 5 Years | 97 (7.0%) | 105 (8.2%) |
| 5 to 9 Years | 68 (5.0%) | 84 (6.6%) |
| 10 to 14 Years | 90 (6.6%) | 72 (5.6%) |
| 15 to 19 Years | 101 (7.3%) | 25 (1.9%) |
| 20 to 24 Years | 47 (3.4%) | 54 (4.2%) |
| 25 to 29 Years | 146 (10.6%) | 104 (8.1%) |
| 30 to 34 Years | 84 (6.1%) | 66 (5.1%) |
| 35 to 39 Years | 41 (3.0%) | 99 (7.7%) |
| 40 to 44 Years | 93 (6.8%) | 32 (2.5%) |
| 45 to 49 Years | 131 (9.5%) | 63 (4.9%) |
| 50 to 54 Years | 111 (8.1%) | 72 (5.6%) |
| 55 to 59 Years | 54 (3.9%) | 68 (5.3%) |
| 60 to 64 Years | 81 (5.9%) | 108 (8.4%) |
| 65 to 69 Years | 125 (9.1%) | 106 (8.3%) |
| 70 to 74 Years | 50 (3.6%) | 88 (6.9%) |
| 75 to 79 Years | 46 (3.4%) | 34 (2.6%) |
| 80 to 84 Years | 7 (0.5%) | 34 (2.6%) |
| 85 Years and over | 3 (0.2%) | 69 (5.4%) |
| Total | 1,375 (100.0%) | 1,283 (100.0%) |
Families and Households in Portage borough
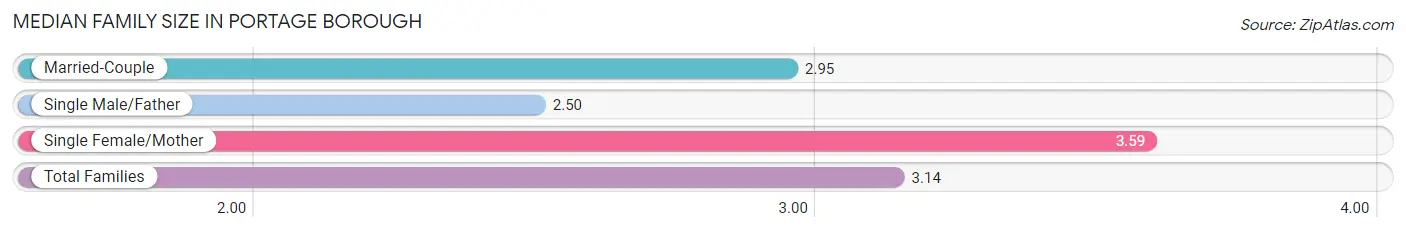
Median Family Size in Portage borough
The median family size in Portage borough is 3.14 persons per family, with single female/mother families (190 | 31.3%) accounting for the largest median family size of 3.59 persons per family. On the other hand, single male/father families (24 | 4.0%) represent the smallest median family size with 2.50 persons per family.
| Family Type | # Families | Family Size |
| Married-Couple | 393 (64.7%) | 2.95 |
| Single Male/Father | 24 (4.0%) | 2.50 |
| Single Female/Mother | 190 (31.3%) | 3.59 |
| Total Families | 607 (100.0%) | 3.14 |
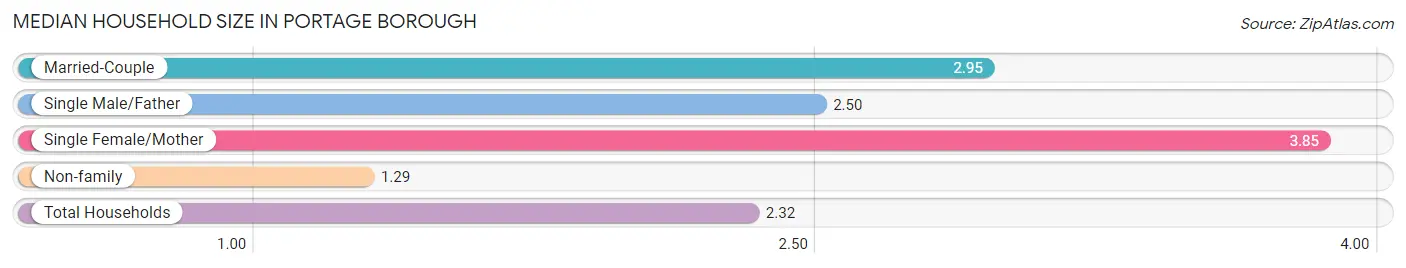
Median Household Size in Portage borough
The median household size in Portage borough is 2.32 persons per household, with single female/mother households (190 | 16.7%) accounting for the largest median household size of 3.85 persons per household. non-family households (528 | 46.5%) represent the smallest median household size with 1.29 persons per household.
| Household Type | # Households | Household Size |
| Married-Couple | 393 (34.6%) | 2.95 |
| Single Male/Father | 24 (2.1%) | 2.50 |
| Single Female/Mother | 190 (16.7%) | 3.85 |
| Non-family | 528 (46.5%) | 1.29 |
| Total Households | 1,135 (100.0%) | 2.32 |
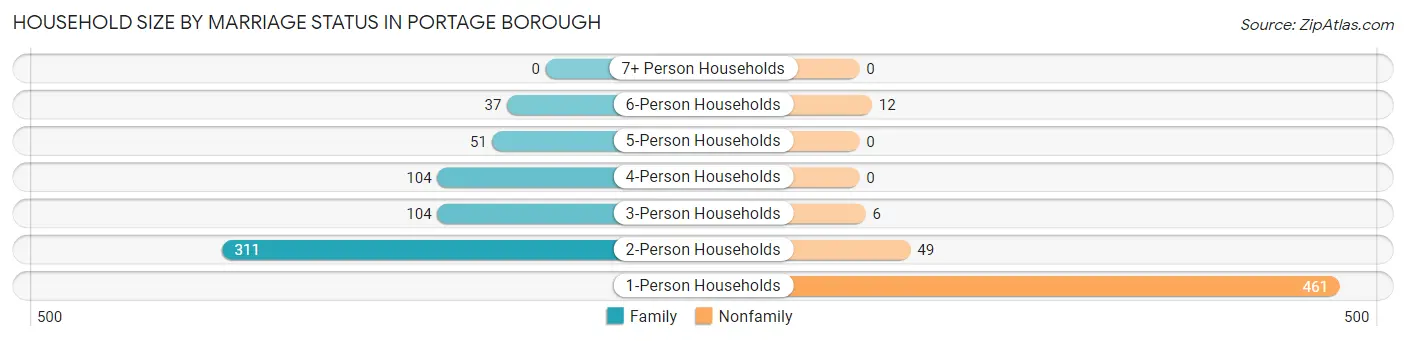
Household Size by Marriage Status in Portage borough
Out of a total of 1,135 households in Portage borough, 607 (53.5%) are family households, while 528 (46.5%) are nonfamily households. The most numerous type of family households are 2-person households, comprising 311, and the most common type of nonfamily households are 1-person households, comprising 461.
| Household Size | Family Households | Nonfamily Households |
| 1-Person Households | - | 461 (40.6%) |
| 2-Person Households | 311 (27.4%) | 49 (4.3%) |
| 3-Person Households | 104 (9.2%) | 6 (0.5%) |
| 4-Person Households | 104 (9.2%) | 0 (0.0%) |
| 5-Person Households | 51 (4.5%) | 0 (0.0%) |
| 6-Person Households | 37 (3.3%) | 12 (1.1%) |
| 7+ Person Households | 0 (0.0%) | 0 (0.0%) |
| Total | 607 (53.5%) | 528 (46.5%) |
Female Fertility in Portage borough
Fertility by Age in Portage borough
Average fertility rate in Portage borough is 70.0 births per 1,000 women. Women in the age bracket of 35 to 50 years have the highest fertility rate with 160.0 births per 1,000 women. Women in the age bracket of 35 to 50 years acount for 100.0% of all women with births.
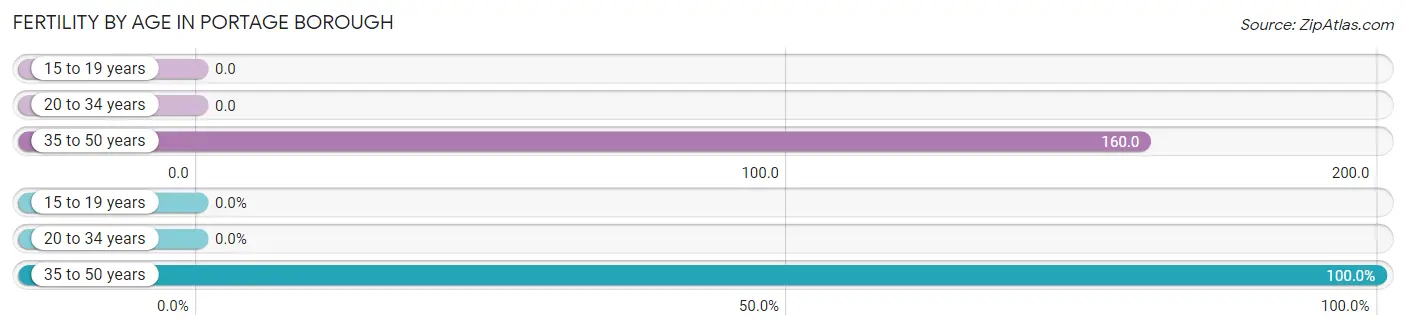
| Age Bracket | Women with Births | Births / 1,000 Women |
| 15 to 19 years | 0 (0.0%) | 0.0 |
| 20 to 34 years | 0 (0.0%) | 0.0 |
| 35 to 50 years | 31 (100.0%) | 160.0 |
| Total | 31 (100.0%) | 70.0 |
Fertility by Age by Marriage Status in Portage borough
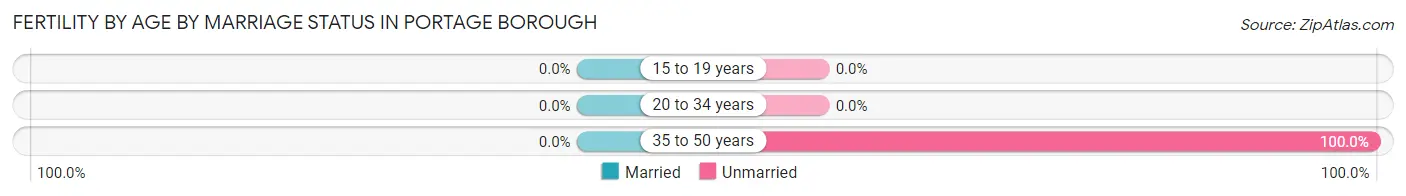
| Age Bracket | Married | Unmarried |
| 15 to 19 years | 0 (0.0%) | 0 (0.0%) |
| 20 to 34 years | 0 (0.0%) | 0 (0.0%) |
| 35 to 50 years | 0 (0.0%) | 31 (100.0%) |
| Total | 0 (0.0%) | 31 (100.0%) |
Fertility by Education in Portage borough
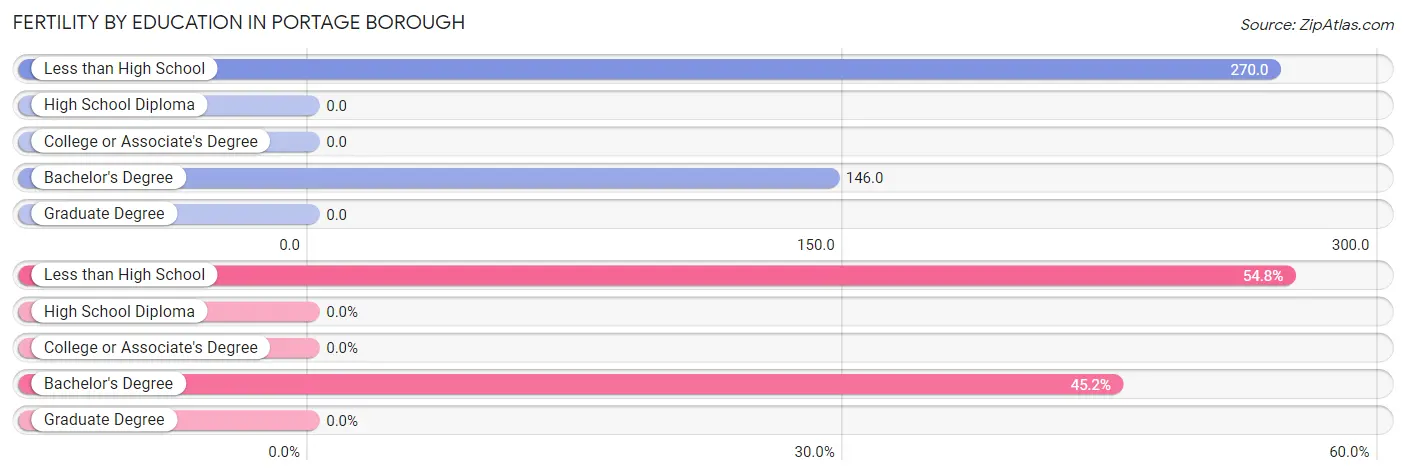
| Educational Attainment | Women with Births | Births / 1,000 Women |
| Less than High School | 17 (54.8%) | 270.0 |
| High School Diploma | 0 (0.0%) | 0.0 |
| College or Associate's Degree | 0 (0.0%) | 0.0 |
| Bachelor's Degree | 14 (45.2%) | 146.0 |
| Graduate Degree | 0 (0.0%) | 0.0 |
| Total | 31 (100.0%) | 70.0 |
Fertility by Education by Marriage Status in Portage borough
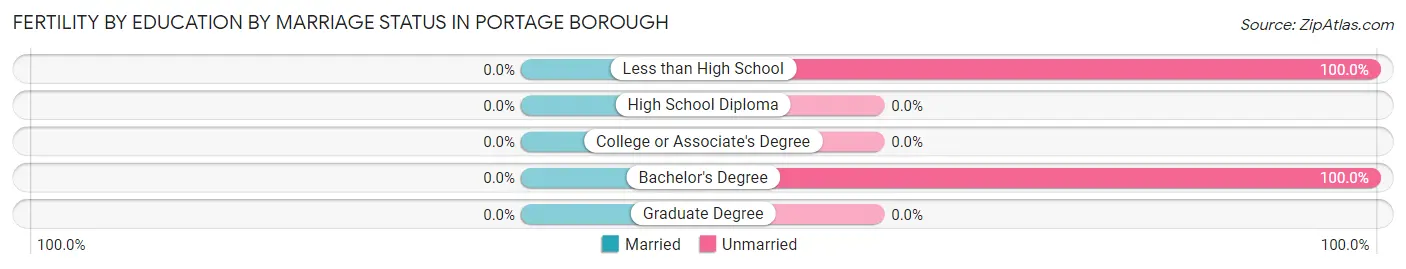
| Educational Attainment | Married | Unmarried |
| Less than High School | 0 (0.0%) | 17 (100.0%) |
| High School Diploma | 0 (0.0%) | 0 (0.0%) |
| College or Associate's Degree | 0 (0.0%) | 0 (0.0%) |
| Bachelor's Degree | 0 (0.0%) | 14 (100.0%) |
| Graduate Degree | 0 (0.0%) | 0 (0.0%) |
| Total | 0 (0.0%) | 31 (100.0%) |
Employment Characteristics in Portage borough
Employment by Class of Employer in Portage borough
Among the 1,037 employed individuals in Portage borough, private company employees (730 | 70.4%), not-for-profit organizations (127 | 12.2%), and local government employees (77 | 7.4%) make up the most common classes of employment.
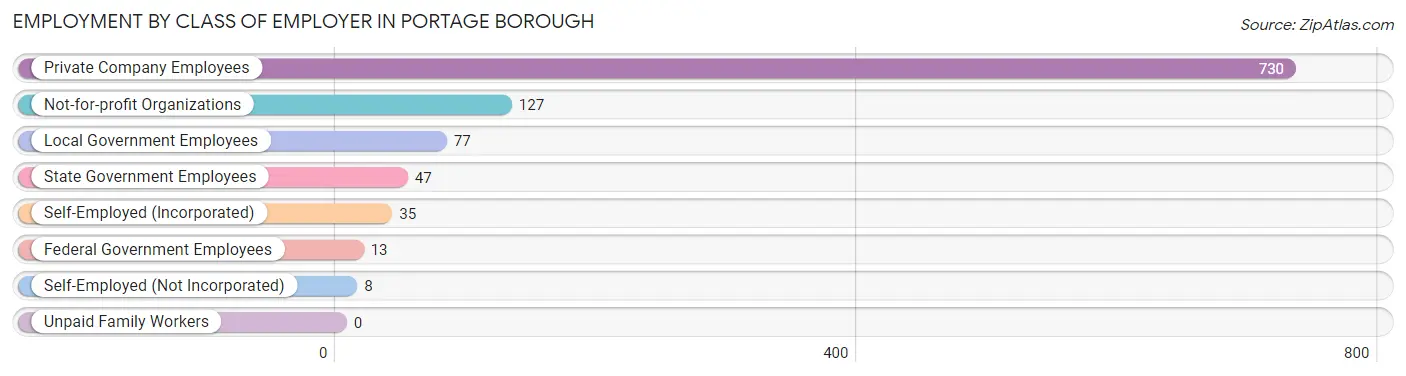
| Employer Class | # Employees | % Employees |
| Private Company Employees | 730 | 70.4% |
| Self-Employed (Incorporated) | 35 | 3.4% |
| Self-Employed (Not Incorporated) | 8 | 0.8% |
| Not-for-profit Organizations | 127 | 12.2% |
| Local Government Employees | 77 | 7.4% |
| State Government Employees | 47 | 4.5% |
| Federal Government Employees | 13 | 1.3% |
| Unpaid Family Workers | 0 | 0.0% |
| Total | 1,037 | 100.0% |
Employment Status by Age in Portage borough
According to the labor force statistics for Portage borough, out of the total population over 16 years of age (2,098), 52.2% or 1,095 individuals are in the labor force, with 4.0% or 44 of them unemployed. The age group with the highest labor force participation rate is 30 to 34 years, with 90.0% or 135 individuals in the labor force. Within the labor force, the 25 to 29 years age range has the highest percentage of unemployed individuals, with 13.1% or 27 of them being unemployed.
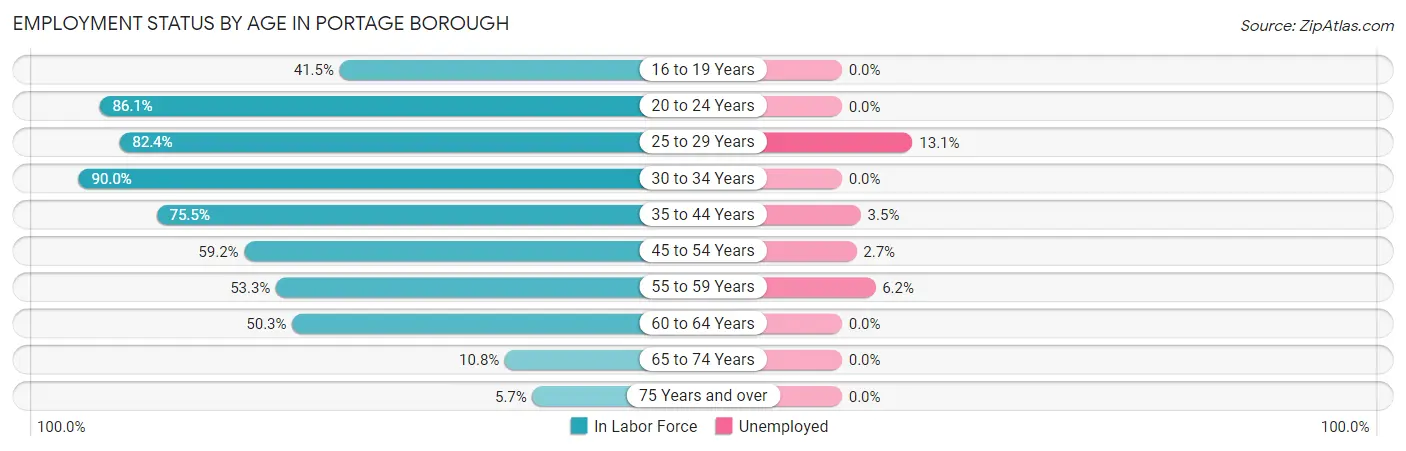
| Age Bracket | In Labor Force | Unemployed |
| 16 to 19 Years | 34 (41.5%) | 0 (0.0%) |
| 20 to 24 Years | 87 (86.1%) | 0 (0.0%) |
| 25 to 29 Years | 206 (82.4%) | 27 (13.1%) |
| 30 to 34 Years | 135 (90.0%) | 0 (0.0%) |
| 35 to 44 Years | 200 (75.5%) | 7 (3.5%) |
| 45 to 54 Years | 223 (59.2%) | 6 (2.7%) |
| 55 to 59 Years | 65 (53.3%) | 4 (6.2%) |
| 60 to 64 Years | 95 (50.3%) | 0 (0.0%) |
| 65 to 74 Years | 40 (10.8%) | 0 (0.0%) |
| 75 Years and over | 11 (5.7%) | 0 (0.0%) |
| Total | 1,095 (52.2%) | 44 (4.0%) |
Employment Status by Educational Attainment in Portage borough
According to labor force statistics for Portage borough, 68.3% of individuals (924) out of the total population between 25 and 64 years of age (1,353) are in the labor force, with 4.8% or 44 of them being unemployed. The group with the highest labor force participation rate are those with the educational attainment of bachelor's degree or higher, with 87.4% or 236 individuals in the labor force. Within the labor force, individuals with less than high school education have the highest percentage of unemployment, with 90.9% or 10 of them being unemployed.
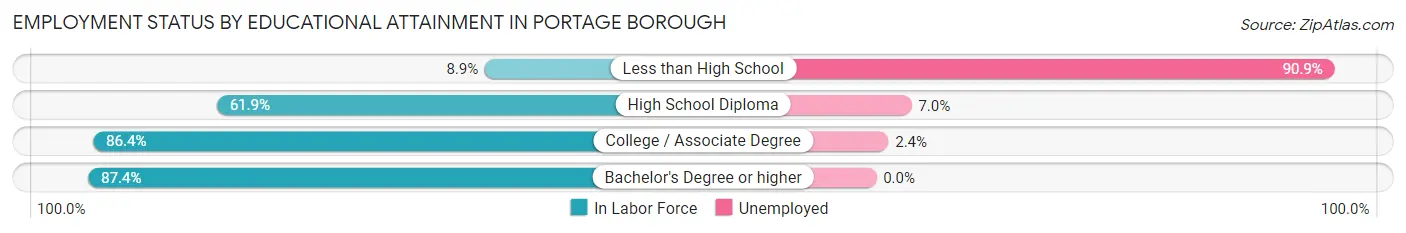
| Educational Attainment | In Labor Force | Unemployed |
| Less than High School | 11 (8.9%) | 112 (90.9%) |
| High School Diploma | 385 (61.9%) | 44 (7.0%) |
| College / Associate Degree | 292 (86.4%) | 8 (2.4%) |
| Bachelor's Degree or higher | 236 (87.4%) | 0 (0.0%) |
| Total | 924 (68.3%) | 65 (4.8%) |
Employment Occupations by Sex in Portage borough
Management, Business, Science and Arts Occupations
The most common Management, Business, Science and Arts occupations in Portage borough are Community & Social Service (148 | 14.1%), Health Diagnosing & Treating (83 | 7.9%), Education Instruction & Library (68 | 6.5%), Education, Arts & Media (46 | 4.4%), and Management (42 | 4.0%).
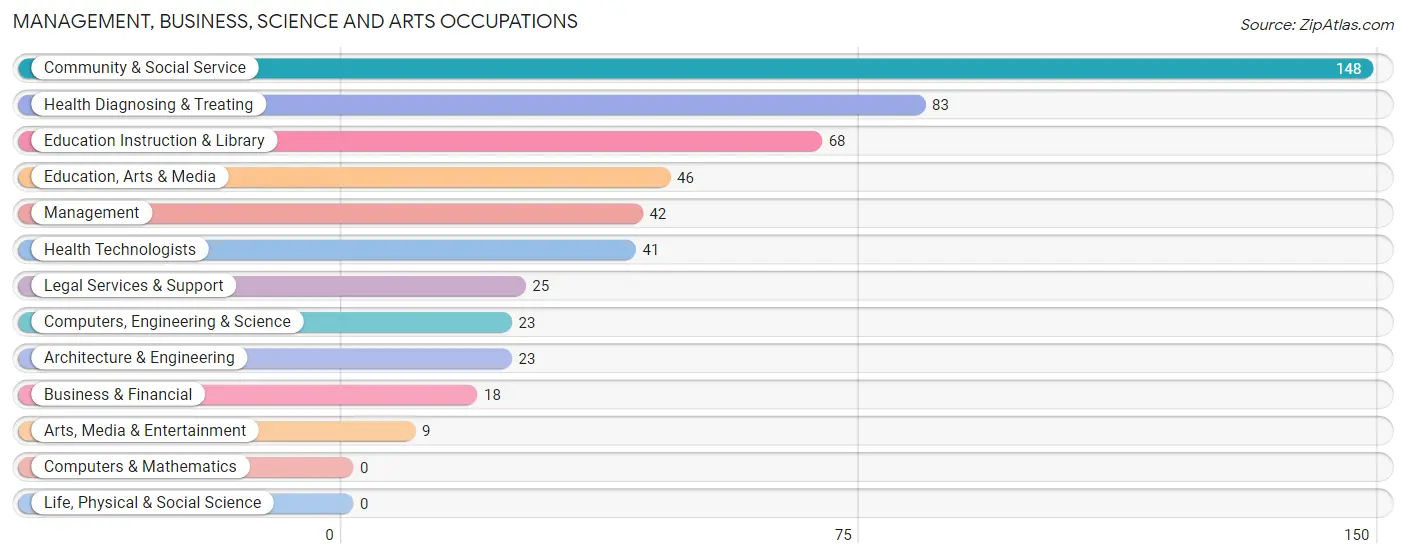
Management, Business, Science and Arts Occupations by Sex
Within the Management, Business, Science and Arts occupations in Portage borough, the most male-oriented occupations are Computers, Engineering & Science (100.0%), Architecture & Engineering (100.0%), and Arts, Media & Entertainment (100.0%), while the most female-oriented occupations are Legal Services & Support (100.0%), Health Technologists (85.4%), and Health Diagnosing & Treating (78.3%).
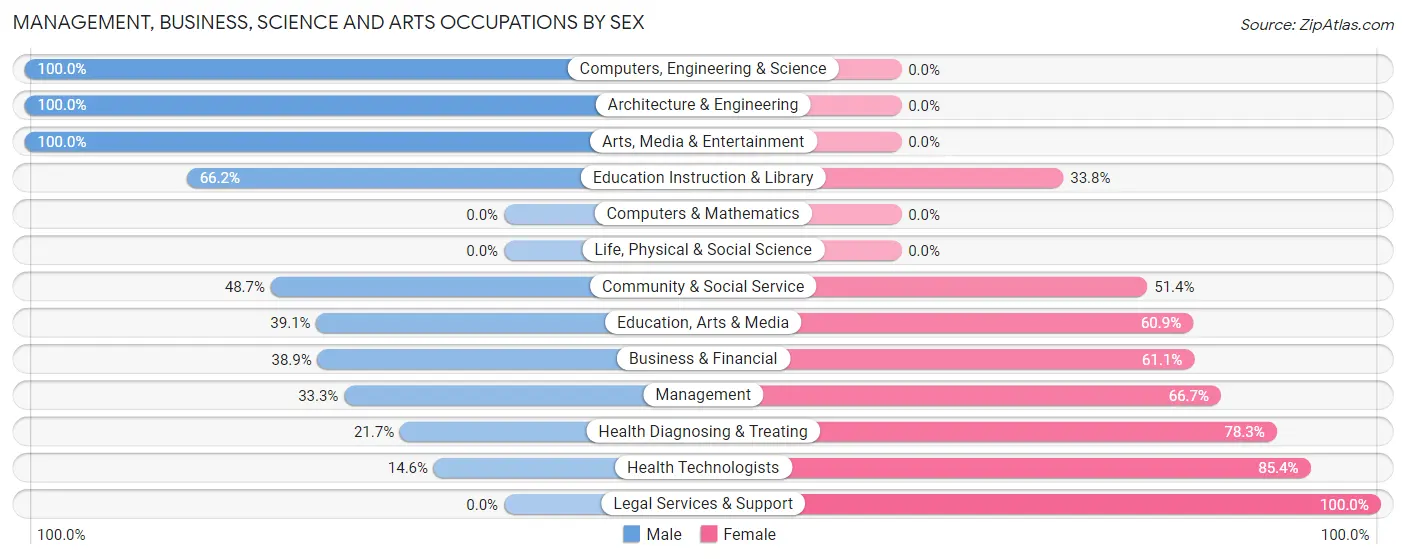
| Occupation | Male | Female |
| Management | 14 (33.3%) | 28 (66.7%) |
| Business & Financial | 7 (38.9%) | 11 (61.1%) |
| Computers, Engineering & Science | 23 (100.0%) | 0 (0.0%) |
| Computers & Mathematics | 0 (0.0%) | 0 (0.0%) |
| Architecture & Engineering | 23 (100.0%) | 0 (0.0%) |
| Life, Physical & Social Science | 0 (0.0%) | 0 (0.0%) |
| Community & Social Service | 72 (48.6%) | 76 (51.3%) |
| Education, Arts & Media | 18 (39.1%) | 28 (60.9%) |
| Legal Services & Support | 0 (0.0%) | 25 (100.0%) |
| Education Instruction & Library | 45 (66.2%) | 23 (33.8%) |
| Arts, Media & Entertainment | 9 (100.0%) | 0 (0.0%) |
| Health Diagnosing & Treating | 18 (21.7%) | 65 (78.3%) |
| Health Technologists | 6 (14.6%) | 35 (85.4%) |
| Total (Category) | 134 (42.7%) | 180 (57.3%) |
| Total (Overall) | 584 (55.8%) | 463 (44.2%) |
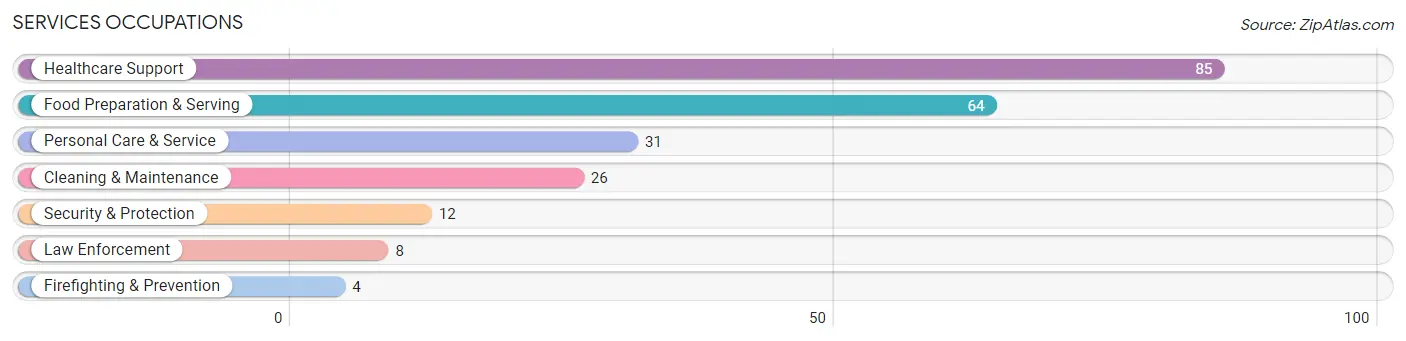
Services Occupations
The most common Services occupations in Portage borough are Healthcare Support (85 | 8.1%), Food Preparation & Serving (64 | 6.1%), Personal Care & Service (31 | 3.0%), Cleaning & Maintenance (26 | 2.5%), and Security & Protection (12 | 1.1%).
Services Occupations by Sex
Within the Services occupations in Portage borough, the most male-oriented occupations are Security & Protection (100.0%), Firefighting & Prevention (100.0%), and Law Enforcement (100.0%), while the most female-oriented occupations are Personal Care & Service (100.0%), Healthcare Support (88.2%), and Food Preparation & Serving (51.6%).
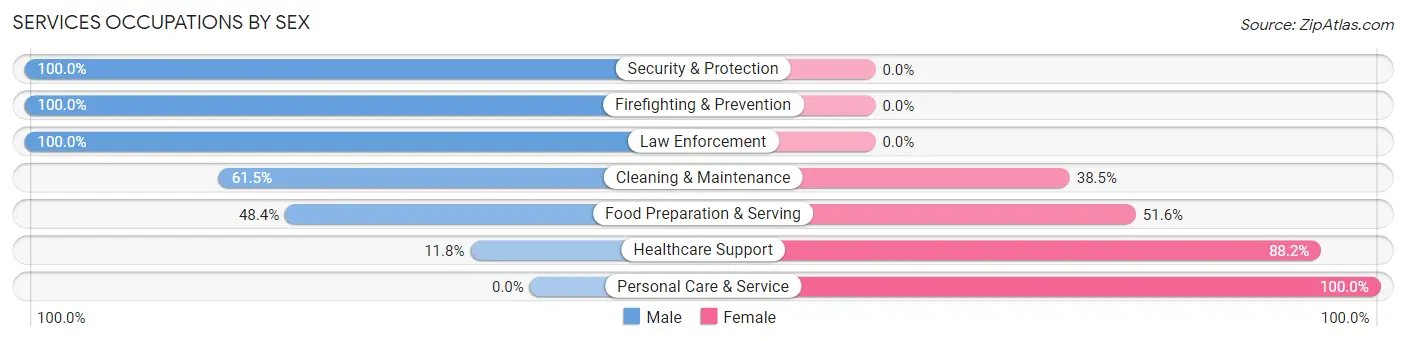
| Occupation | Male | Female |
| Healthcare Support | 10 (11.8%) | 75 (88.2%) |
| Security & Protection | 12 (100.0%) | 0 (0.0%) |
| Firefighting & Prevention | 4 (100.0%) | 0 (0.0%) |
| Law Enforcement | 8 (100.0%) | 0 (0.0%) |
| Food Preparation & Serving | 31 (48.4%) | 33 (51.6%) |
| Cleaning & Maintenance | 16 (61.5%) | 10 (38.5%) |
| Personal Care & Service | 0 (0.0%) | 31 (100.0%) |
| Total (Category) | 69 (31.7%) | 149 (68.3%) |
| Total (Overall) | 584 (55.8%) | 463 (44.2%) |
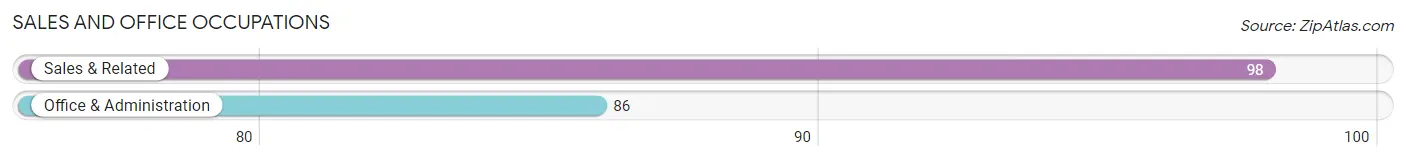
Sales and Office Occupations
The most common Sales and Office occupations in Portage borough are Sales & Related (98 | 9.4%), and Office & Administration (86 | 8.2%).
Sales and Office Occupations by Sex
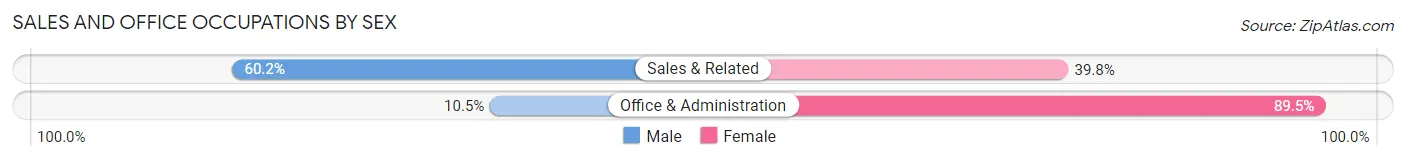
| Occupation | Male | Female |
| Sales & Related | 59 (60.2%) | 39 (39.8%) |
| Office & Administration | 9 (10.5%) | 77 (89.5%) |
| Total (Category) | 68 (37.0%) | 116 (63.0%) |
| Total (Overall) | 584 (55.8%) | 463 (44.2%) |
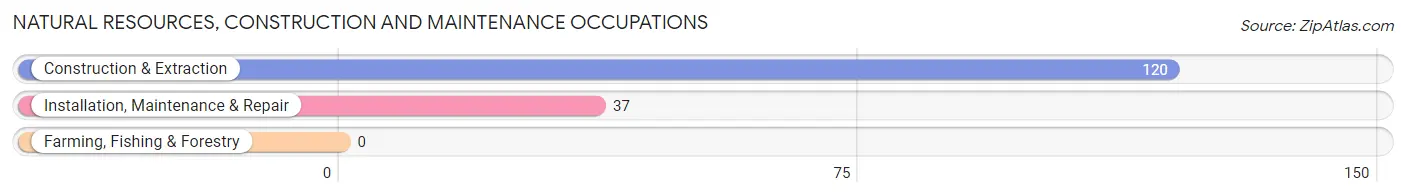
Natural Resources, Construction and Maintenance Occupations
The most common Natural Resources, Construction and Maintenance occupations in Portage borough are Construction & Extraction (120 | 11.5%), and Installation, Maintenance & Repair (37 | 3.5%).
Natural Resources, Construction and Maintenance Occupations by Sex
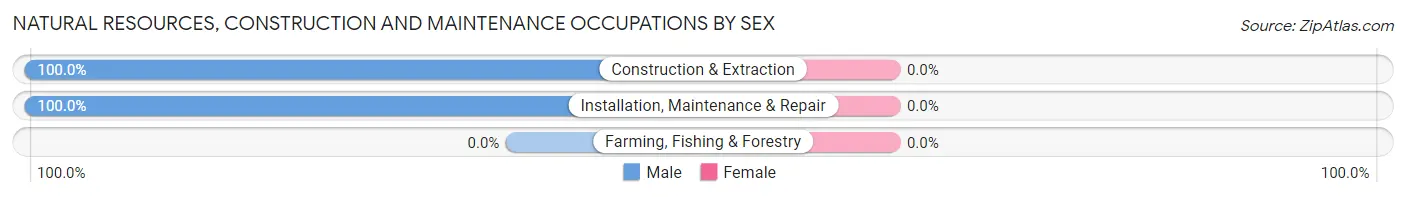
| Occupation | Male | Female |
| Farming, Fishing & Forestry | 0 (0.0%) | 0 (0.0%) |
| Construction & Extraction | 120 (100.0%) | 0 (0.0%) |
| Installation, Maintenance & Repair | 37 (100.0%) | 0 (0.0%) |
| Total (Category) | 157 (100.0%) | 0 (0.0%) |
| Total (Overall) | 584 (55.8%) | 463 (44.2%) |
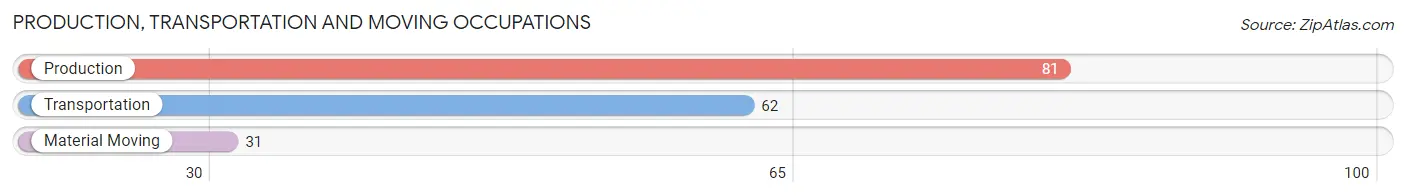
Production, Transportation and Moving Occupations
The most common Production, Transportation and Moving occupations in Portage borough are Production (81 | 7.7%), Transportation (62 | 5.9%), and Material Moving (31 | 3.0%).
Production, Transportation and Moving Occupations by Sex
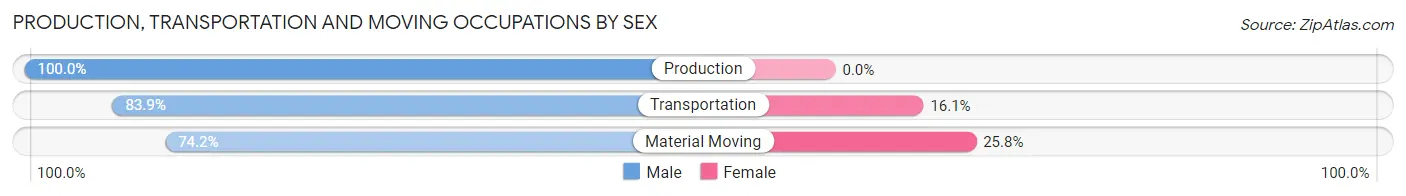
| Occupation | Male | Female |
| Production | 81 (100.0%) | 0 (0.0%) |
| Transportation | 52 (83.9%) | 10 (16.1%) |
| Material Moving | 23 (74.2%) | 8 (25.8%) |
| Total (Category) | 156 (89.7%) | 18 (10.3%) |
| Total (Overall) | 584 (55.8%) | 463 (44.2%) |
Employment Industries by Sex in Portage borough
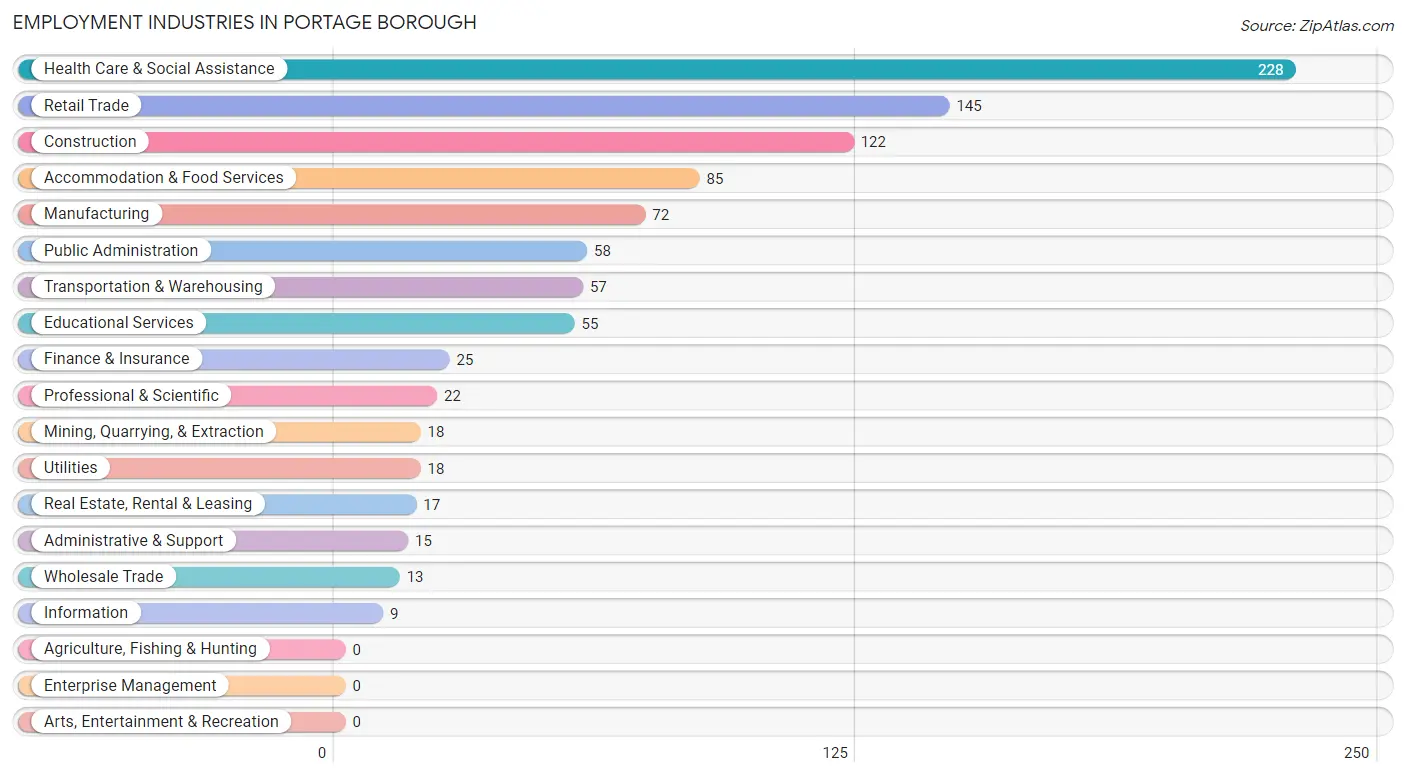
Employment Industries in Portage borough
The major employment industries in Portage borough include Health Care & Social Assistance (228 | 21.8%), Retail Trade (145 | 13.9%), Construction (122 | 11.7%), Accommodation & Food Services (85 | 8.1%), and Manufacturing (72 | 6.9%).
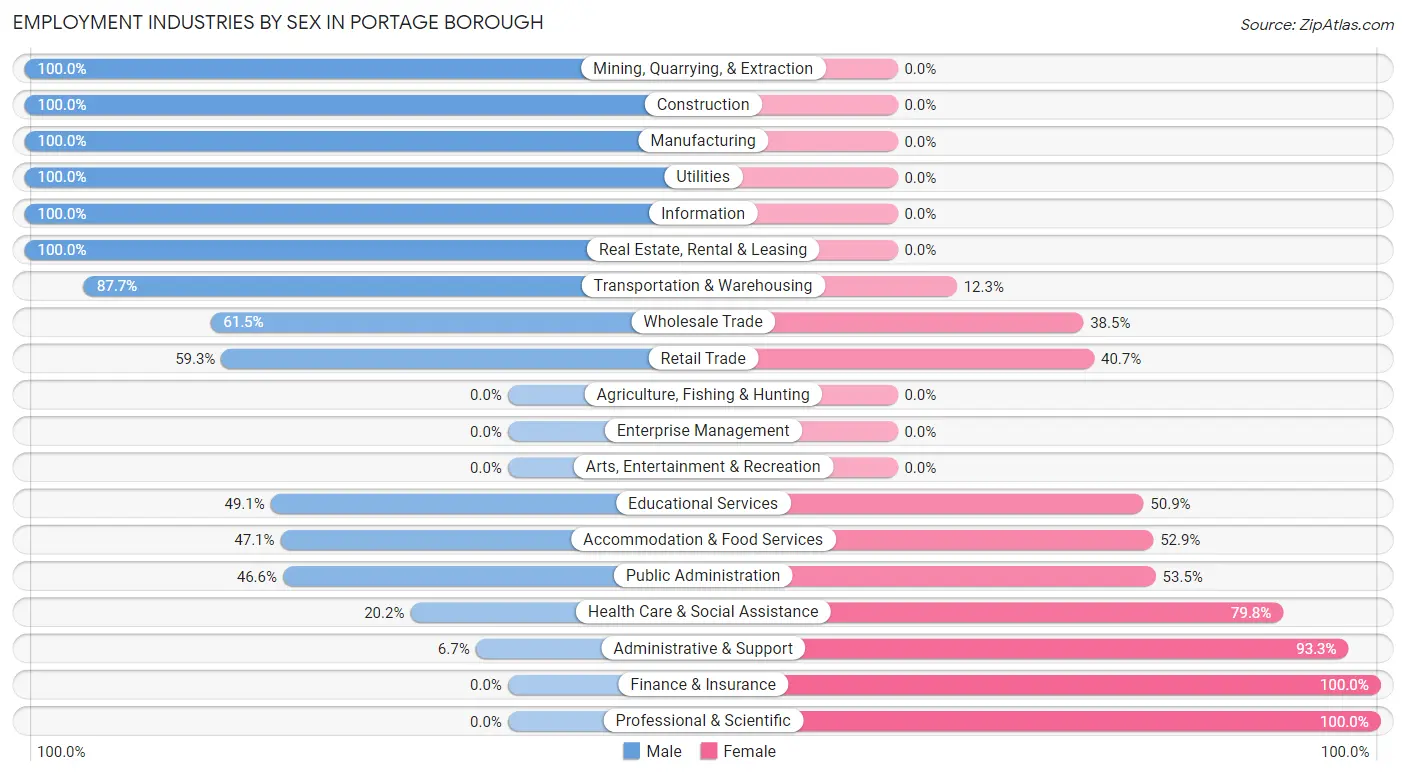
Employment Industries by Sex in Portage borough
The Portage borough industries that see more men than women are Mining, Quarrying, & Extraction (100.0%), Construction (100.0%), and Manufacturing (100.0%), whereas the industries that tend to have a higher number of women are Finance & Insurance (100.0%), Professional & Scientific (100.0%), and Administrative & Support (93.3%).
| Industry | Male | Female |
| Agriculture, Fishing & Hunting | 0 (0.0%) | 0 (0.0%) |
| Mining, Quarrying, & Extraction | 18 (100.0%) | 0 (0.0%) |
| Construction | 122 (100.0%) | 0 (0.0%) |
| Manufacturing | 72 (100.0%) | 0 (0.0%) |
| Wholesale Trade | 8 (61.5%) | 5 (38.5%) |
| Retail Trade | 86 (59.3%) | 59 (40.7%) |
| Transportation & Warehousing | 50 (87.7%) | 7 (12.3%) |
| Utilities | 18 (100.0%) | 0 (0.0%) |
| Information | 9 (100.0%) | 0 (0.0%) |
| Finance & Insurance | 0 (0.0%) | 25 (100.0%) |
| Real Estate, Rental & Leasing | 17 (100.0%) | 0 (0.0%) |
| Professional & Scientific | 0 (0.0%) | 22 (100.0%) |
| Enterprise Management | 0 (0.0%) | 0 (0.0%) |
| Administrative & Support | 1 (6.7%) | 14 (93.3%) |
| Educational Services | 27 (49.1%) | 28 (50.9%) |
| Health Care & Social Assistance | 46 (20.2%) | 182 (79.8%) |
| Arts, Entertainment & Recreation | 0 (0.0%) | 0 (0.0%) |
| Accommodation & Food Services | 40 (47.1%) | 45 (52.9%) |
| Public Administration | 27 (46.6%) | 31 (53.4%) |
| Total | 584 (55.8%) | 463 (44.2%) |
Education in Portage borough
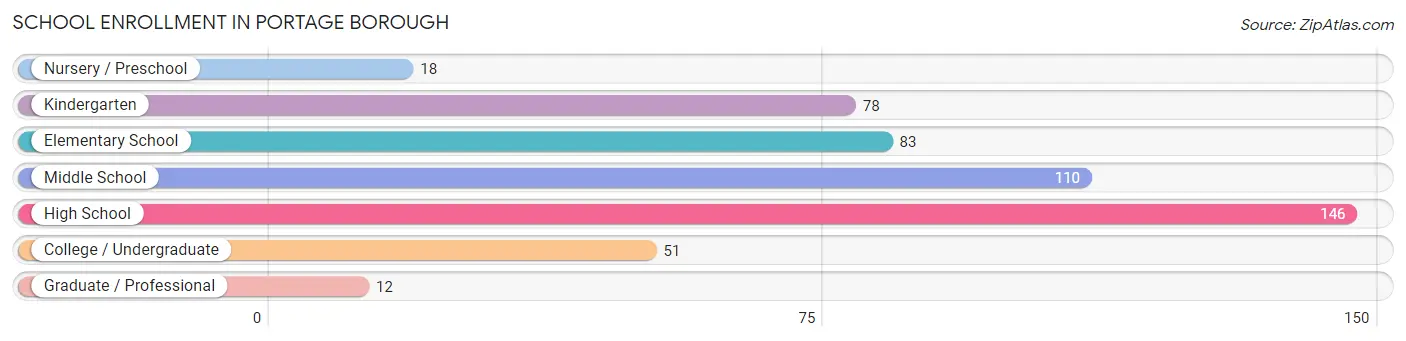
School Enrollment in Portage borough
The most common levels of schooling among the 498 students in Portage borough are high school (146 | 29.3%), middle school (110 | 22.1%), and elementary school (83 | 16.7%).
| School Level | # Students | % Students |
| Nursery / Preschool | 18 | 3.6% |
| Kindergarten | 78 | 15.7% |
| Elementary School | 83 | 16.7% |
| Middle School | 110 | 22.1% |
| High School | 146 | 29.3% |
| College / Undergraduate | 51 | 10.2% |
| Graduate / Professional | 12 | 2.4% |
| Total | 498 | 100.0% |
School Enrollment by Age by Funding Source in Portage borough
Out of a total of 498 students who are enrolled in schools in Portage borough, 22 (4.4%) attend a private institution, while the remaining 476 (95.6%) are enrolled in public schools. The age group of 35 years and over has the highest likelihood of being enrolled in private schools, with 6 (100.0% in the age bracket) enrolled. Conversely, the age group of 3 to 4 year olds has the lowest likelihood of being enrolled in a private school, with 18 (100.0% in the age bracket) attending a public institution.
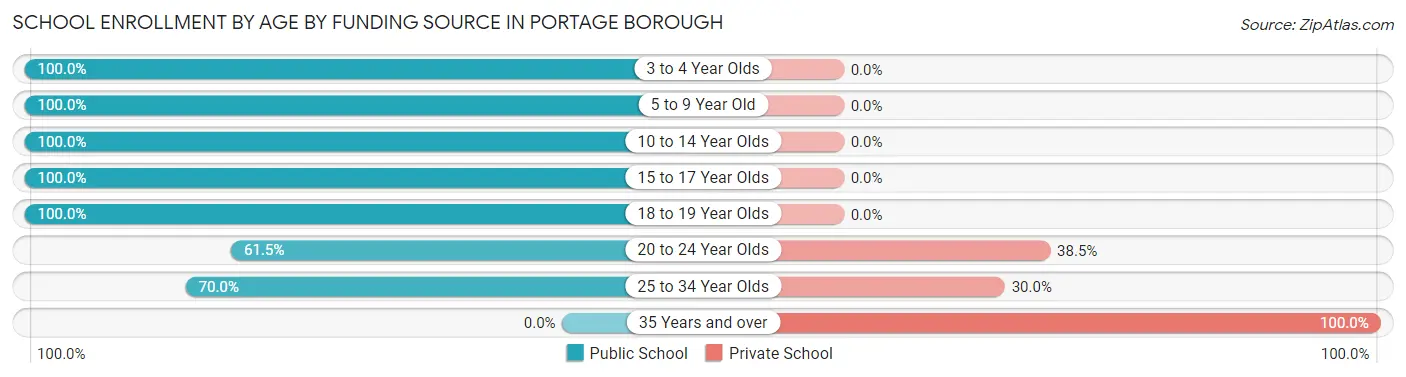
| Age Bracket | Public School | Private School |
| 3 to 4 Year Olds | 18 (100.0%) | 0 (0.0%) |
| 5 to 9 Year Old | 140 (100.0%) | 0 (0.0%) |
| 10 to 14 Year Olds | 162 (100.0%) | 0 (0.0%) |
| 15 to 17 Year Olds | 105 (100.0%) | 0 (0.0%) |
| 18 to 19 Year Olds | 21 (100.0%) | 0 (0.0%) |
| 20 to 24 Year Olds | 16 (61.5%) | 10 (38.5%) |
| 25 to 34 Year Olds | 14 (70.0%) | 6 (30.0%) |
| 35 Years and over | 0 (0.0%) | 6 (100.0%) |
| Total | 476 (95.6%) | 22 (4.4%) |
Educational Attainment by Field of Study in Portage borough
Business (106 | 28.3%), education (66 | 17.6%), science & technology (54 | 14.4%), bio, nature & agricultural (37 | 9.9%), and arts & humanities (32 | 8.5%) are the most common fields of study among 375 individuals in Portage borough who have obtained a bachelor's degree or higher.
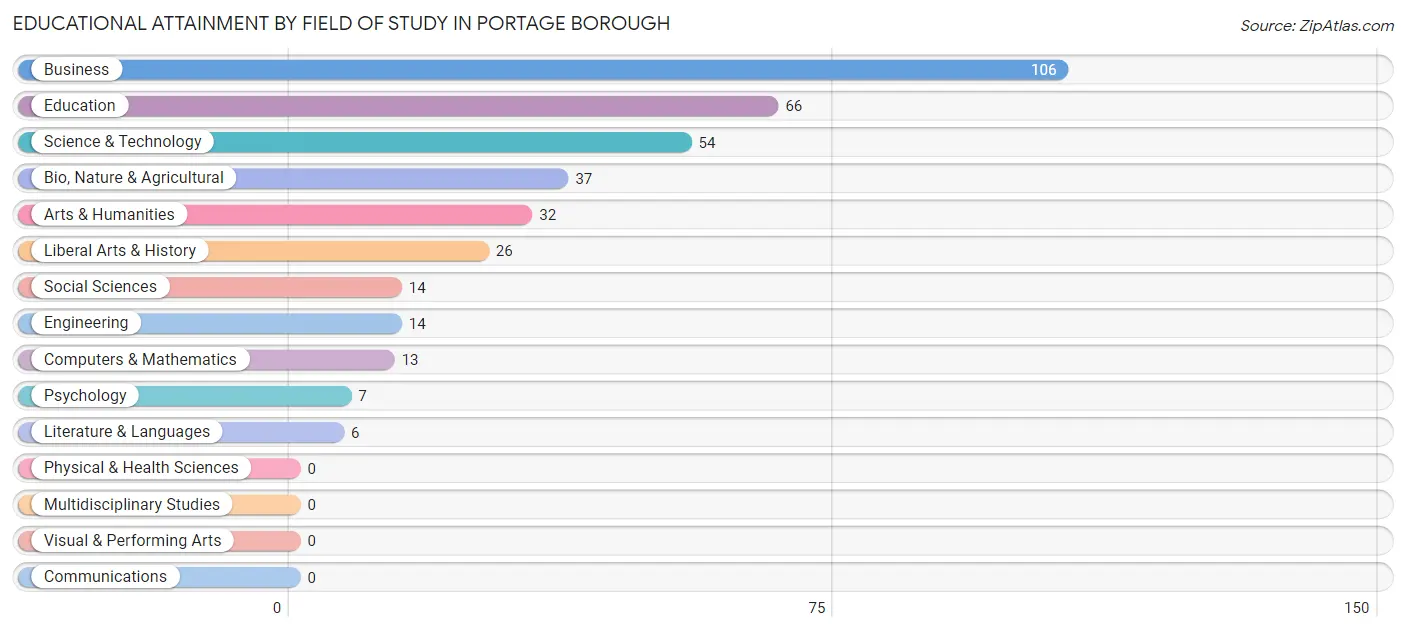
| Field of Study | # Graduates | % Graduates |
| Computers & Mathematics | 13 | 3.5% |
| Bio, Nature & Agricultural | 37 | 9.9% |
| Physical & Health Sciences | 0 | 0.0% |
| Psychology | 7 | 1.9% |
| Social Sciences | 14 | 3.7% |
| Engineering | 14 | 3.7% |
| Multidisciplinary Studies | 0 | 0.0% |
| Science & Technology | 54 | 14.4% |
| Business | 106 | 28.3% |
| Education | 66 | 17.6% |
| Literature & Languages | 6 | 1.6% |
| Liberal Arts & History | 26 | 6.9% |
| Visual & Performing Arts | 0 | 0.0% |
| Communications | 0 | 0.0% |
| Arts & Humanities | 32 | 8.5% |
| Total | 375 | 100.0% |
Transportation & Commute in Portage borough
Vehicle Availability by Sex in Portage borough
The most prevalent vehicle ownership categories in Portage borough are males with 2 vehicles (158, accounting for 27.5%) and females with 2 vehicles (149, making up 34.3%).
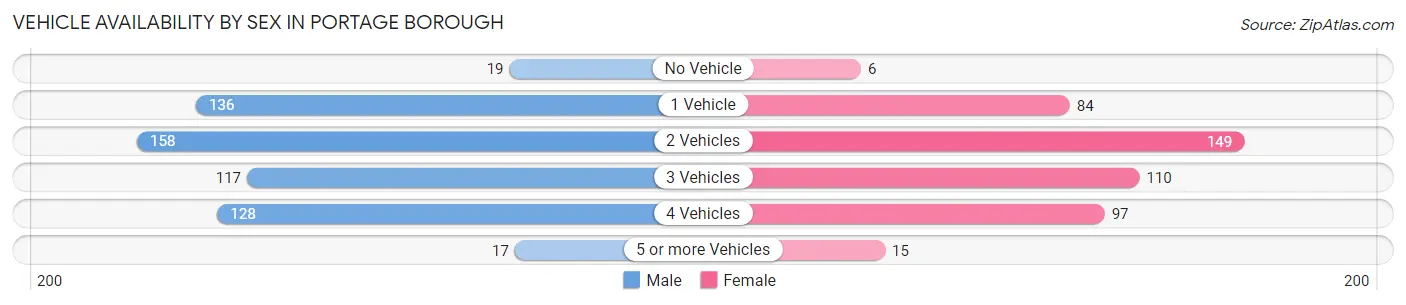
| Vehicles Available | Male | Female |
| No Vehicle | 19 (3.3%) | 6 (1.3%) |
| 1 Vehicle | 136 (23.6%) | 84 (18.2%) |
| 2 Vehicles | 158 (27.5%) | 149 (32.3%) |
| 3 Vehicles | 117 (20.3%) | 110 (23.9%) |
| 4 Vehicles | 128 (22.3%) | 97 (21.0%) |
| 5 or more Vehicles | 17 (3.0%) | 15 (3.3%) |
| Total | 575 (100.0%) | 461 (100.0%) |
Commute Time in Portage borough
The most frequently occuring commute durations in Portage borough are 30 to 34 minutes (176 commuters, 18.8%), 20 to 24 minutes (152 commuters, 16.2%), and 25 to 29 minutes (118 commuters, 12.6%).
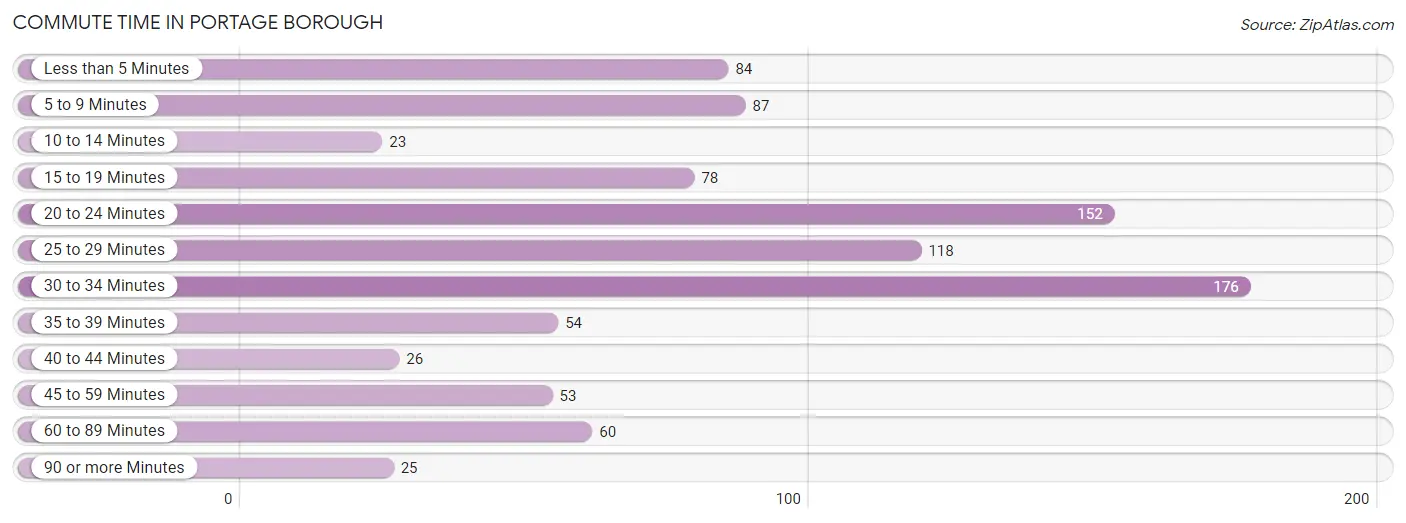
| Commute Time | # Commuters | % Commuters |
| Less than 5 Minutes | 84 | 9.0% |
| 5 to 9 Minutes | 87 | 9.3% |
| 10 to 14 Minutes | 23 | 2.5% |
| 15 to 19 Minutes | 78 | 8.3% |
| 20 to 24 Minutes | 152 | 16.2% |
| 25 to 29 Minutes | 118 | 12.6% |
| 30 to 34 Minutes | 176 | 18.8% |
| 35 to 39 Minutes | 54 | 5.8% |
| 40 to 44 Minutes | 26 | 2.8% |
| 45 to 59 Minutes | 53 | 5.7% |
| 60 to 89 Minutes | 60 | 6.4% |
| 90 or more Minutes | 25 | 2.7% |
Commute Time by Sex in Portage borough
The most common commute times in Portage borough are 25 to 29 minutes (99 commuters, 19.6%) for males and 30 to 34 minutes (108 commuters, 25.1%) for females.
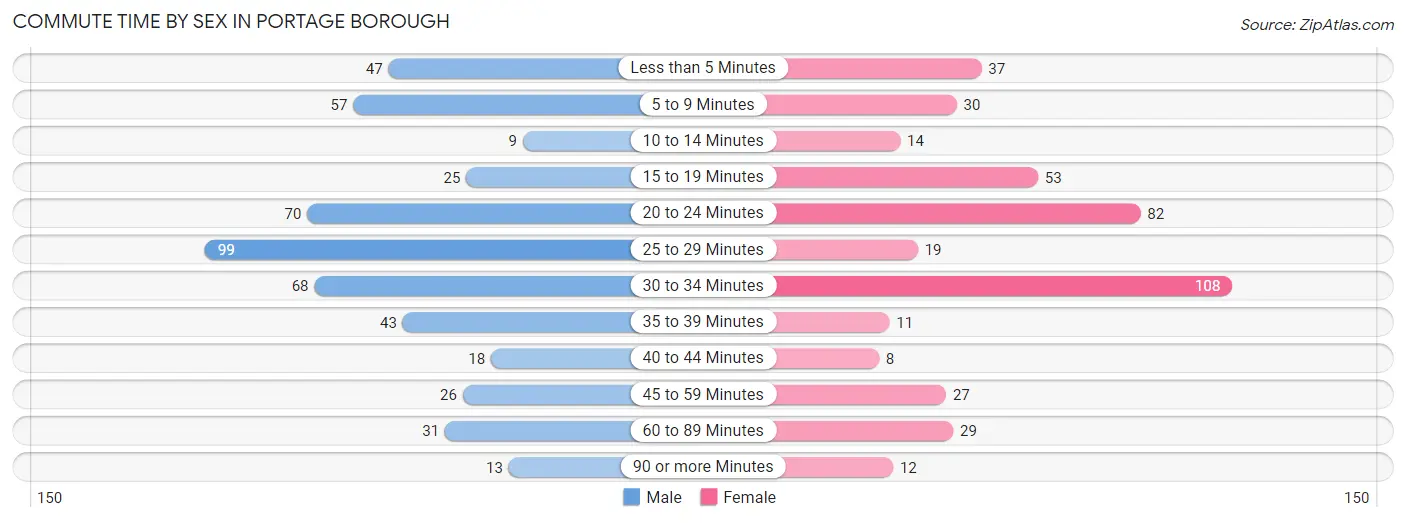
| Commute Time | Male | Female |
| Less than 5 Minutes | 47 (9.3%) | 37 (8.6%) |
| 5 to 9 Minutes | 57 (11.3%) | 30 (7.0%) |
| 10 to 14 Minutes | 9 (1.8%) | 14 (3.3%) |
| 15 to 19 Minutes | 25 (4.9%) | 53 (12.3%) |
| 20 to 24 Minutes | 70 (13.8%) | 82 (19.1%) |
| 25 to 29 Minutes | 99 (19.6%) | 19 (4.4%) |
| 30 to 34 Minutes | 68 (13.4%) | 108 (25.1%) |
| 35 to 39 Minutes | 43 (8.5%) | 11 (2.6%) |
| 40 to 44 Minutes | 18 (3.6%) | 8 (1.9%) |
| 45 to 59 Minutes | 26 (5.1%) | 27 (6.3%) |
| 60 to 89 Minutes | 31 (6.1%) | 29 (6.7%) |
| 90 or more Minutes | 13 (2.6%) | 12 (2.8%) |
Time of Departure to Work by Sex in Portage borough
The most frequent times of departure to work in Portage borough are 7:00 AM to 7:29 AM (82, 16.2%) for males and 7:00 AM to 7:29 AM (71, 16.5%) for females.
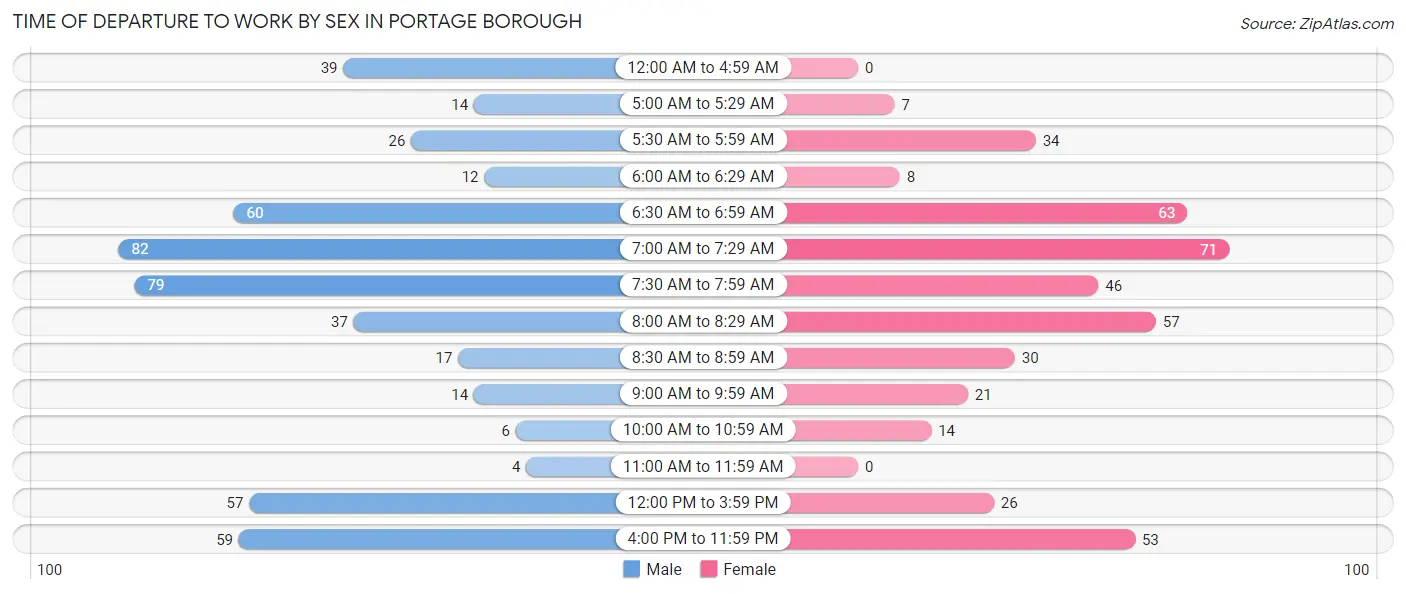
| Time of Departure | Male | Female |
| 12:00 AM to 4:59 AM | 39 (7.7%) | 0 (0.0%) |
| 5:00 AM to 5:29 AM | 14 (2.8%) | 7 (1.6%) |
| 5:30 AM to 5:59 AM | 26 (5.1%) | 34 (7.9%) |
| 6:00 AM to 6:29 AM | 12 (2.4%) | 8 (1.9%) |
| 6:30 AM to 6:59 AM | 60 (11.9%) | 63 (14.6%) |
| 7:00 AM to 7:29 AM | 82 (16.2%) | 71 (16.5%) |
| 7:30 AM to 7:59 AM | 79 (15.6%) | 46 (10.7%) |
| 8:00 AM to 8:29 AM | 37 (7.3%) | 57 (13.3%) |
| 8:30 AM to 8:59 AM | 17 (3.4%) | 30 (7.0%) |
| 9:00 AM to 9:59 AM | 14 (2.8%) | 21 (4.9%) |
| 10:00 AM to 10:59 AM | 6 (1.2%) | 14 (3.3%) |
| 11:00 AM to 11:59 AM | 4 (0.8%) | 0 (0.0%) |
| 12:00 PM to 3:59 PM | 57 (11.3%) | 26 (6.0%) |
| 4:00 PM to 11:59 PM | 59 (11.7%) | 53 (12.3%) |
| Total | 506 (100.0%) | 430 (100.0%) |
Housing Occupancy in Portage borough
Occupancy by Ownership in Portage borough
Of the total 1,135 dwellings in Portage borough, owner-occupied units account for 814 (71.7%), while renter-occupied units make up 321 (28.3%).
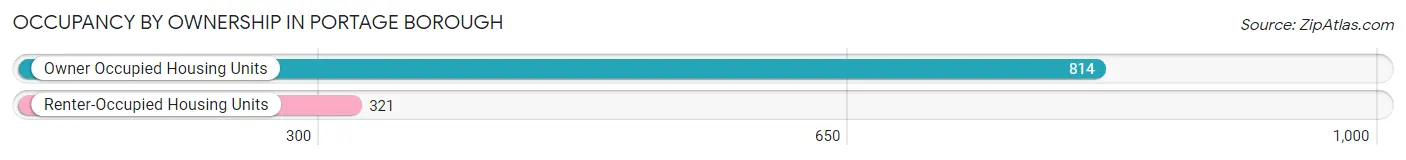
| Occupancy | # Housing Units | % Housing Units |
| Owner Occupied Housing Units | 814 | 71.7% |
| Renter-Occupied Housing Units | 321 | 28.3% |
| Total Occupied Housing Units | 1,135 | 100.0% |
Occupancy by Household Size in Portage borough
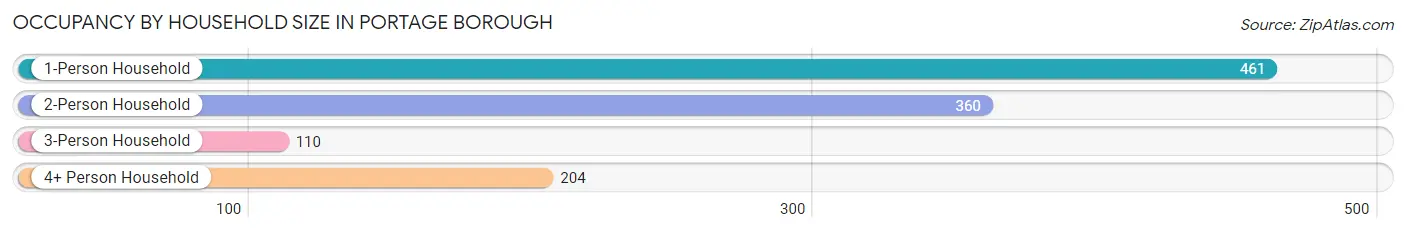
| Household Size | # Housing Units | % Housing Units |
| 1-Person Household | 461 | 40.6% |
| 2-Person Household | 360 | 31.7% |
| 3-Person Household | 110 | 9.7% |
| 4+ Person Household | 204 | 18.0% |
| Total Housing Units | 1,135 | 100.0% |
Occupancy by Ownership by Household Size in Portage borough
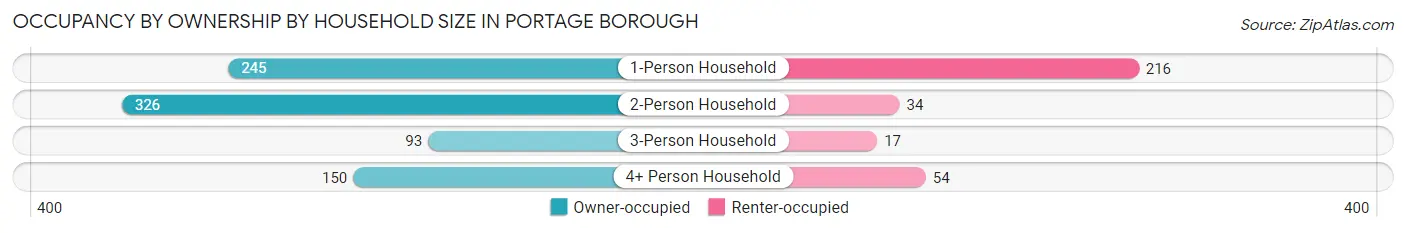
| Household Size | Owner-occupied | Renter-occupied |
| 1-Person Household | 245 (53.1%) | 216 (46.9%) |
| 2-Person Household | 326 (90.6%) | 34 (9.4%) |
| 3-Person Household | 93 (84.6%) | 17 (15.4%) |
| 4+ Person Household | 150 (73.5%) | 54 (26.5%) |
| Total Housing Units | 814 (71.7%) | 321 (28.3%) |
Occupancy by Educational Attainment in Portage borough
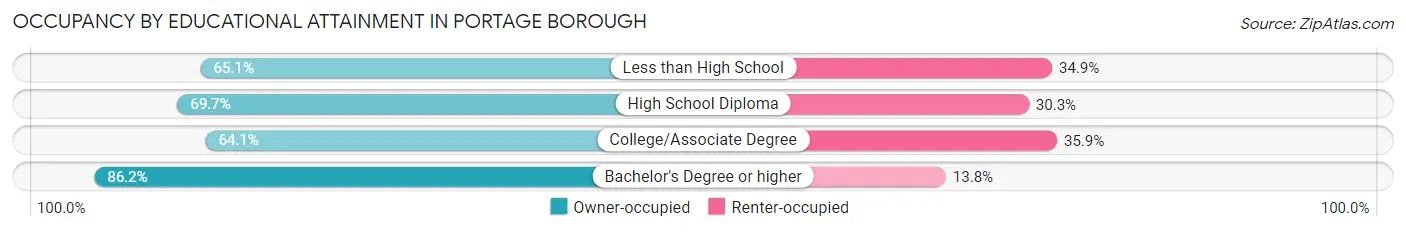
| Household Size | Owner-occupied | Renter-occupied |
| Less than High School | 28 (65.1%) | 15 (34.9%) |
| High School Diploma | 373 (69.7%) | 162 (30.3%) |
| College/Associate Degree | 195 (64.1%) | 109 (35.9%) |
| Bachelor's Degree or higher | 218 (86.2%) | 35 (13.8%) |
Occupancy by Age of Householder in Portage borough
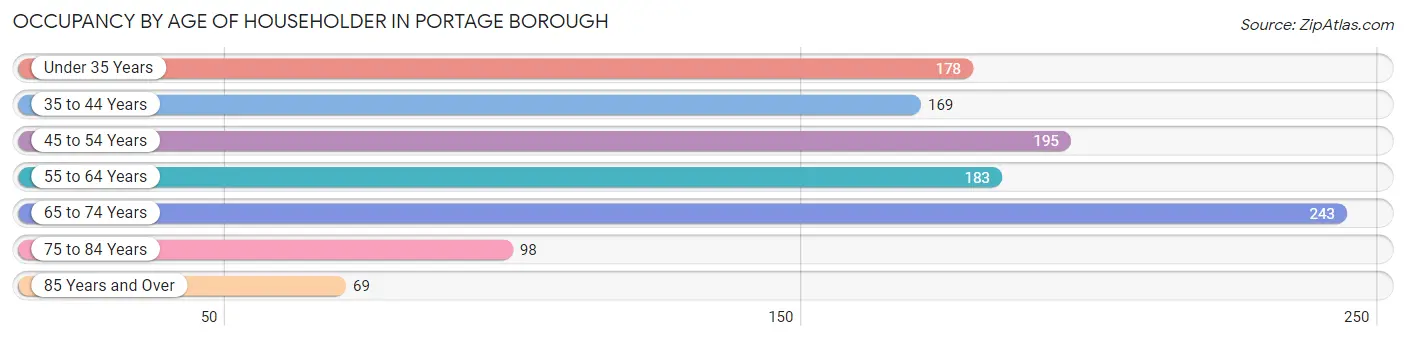
| Age Bracket | # Households | % Households |
| Under 35 Years | 178 | 15.7% |
| 35 to 44 Years | 169 | 14.9% |
| 45 to 54 Years | 195 | 17.2% |
| 55 to 64 Years | 183 | 16.1% |
| 65 to 74 Years | 243 | 21.4% |
| 75 to 84 Years | 98 | 8.6% |
| 85 Years and Over | 69 | 6.1% |
| Total | 1,135 | 100.0% |
Housing Finances in Portage borough
Median Income by Occupancy in Portage borough
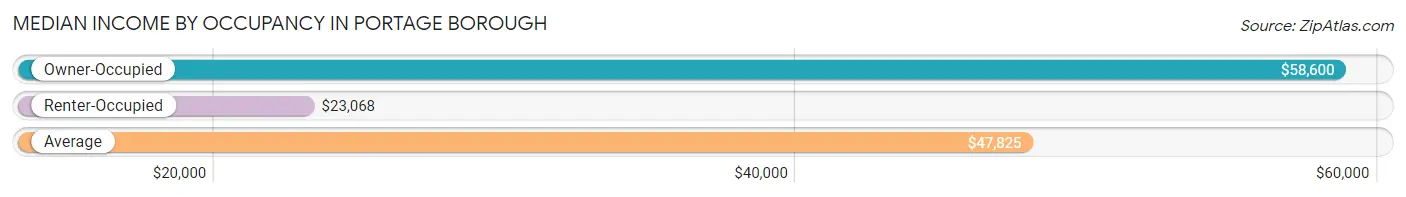
| Occupancy Type | # Households | Median Income |
| Owner-Occupied | 814 (71.7%) | $58,600 |
| Renter-Occupied | 321 (28.3%) | $23,068 |
| Average | 1,135 (100.0%) | $47,825 |
Occupancy by Householder Income Bracket in Portage borough
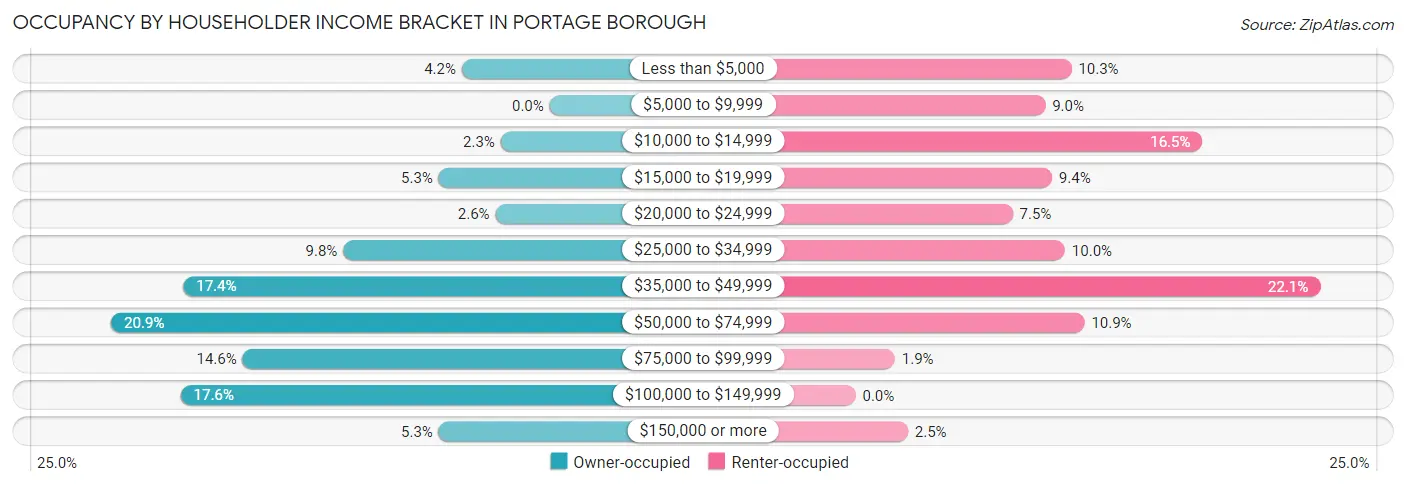
| Income Bracket | Owner-occupied | Renter-occupied |
| Less than $5,000 | 34 (4.2%) | 33 (10.3%) |
| $5,000 to $9,999 | 0 (0.0%) | 29 (9.0%) |
| $10,000 to $14,999 | 19 (2.3%) | 53 (16.5%) |
| $15,000 to $19,999 | 43 (5.3%) | 30 (9.3%) |
| $20,000 to $24,999 | 21 (2.6%) | 24 (7.5%) |
| $25,000 to $34,999 | 80 (9.8%) | 32 (10.0%) |
| $35,000 to $49,999 | 142 (17.4%) | 71 (22.1%) |
| $50,000 to $74,999 | 170 (20.9%) | 35 (10.9%) |
| $75,000 to $99,999 | 119 (14.6%) | 6 (1.9%) |
| $100,000 to $149,999 | 143 (17.6%) | 0 (0.0%) |
| $150,000 or more | 43 (5.3%) | 8 (2.5%) |
| Total | 814 (100.0%) | 321 (100.0%) |
Monthly Housing Cost Tiers in Portage borough
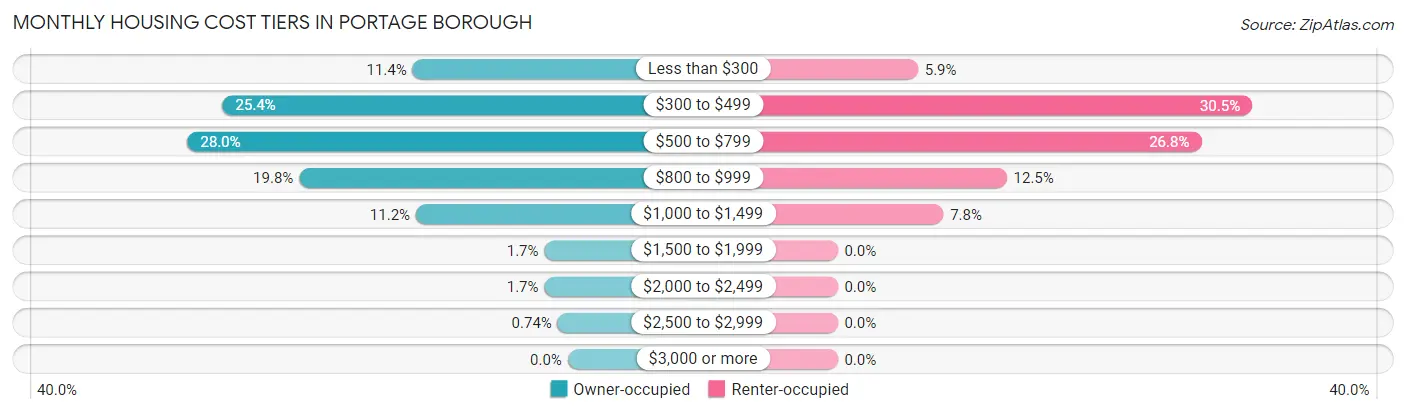
| Monthly Cost | Owner-occupied | Renter-occupied |
| Less than $300 | 93 (11.4%) | 19 (5.9%) |
| $300 to $499 | 207 (25.4%) | 98 (30.5%) |
| $500 to $799 | 228 (28.0%) | 86 (26.8%) |
| $800 to $999 | 161 (19.8%) | 40 (12.5%) |
| $1,000 to $1,499 | 91 (11.2%) | 25 (7.8%) |
| $1,500 to $1,999 | 14 (1.7%) | 0 (0.0%) |
| $2,000 to $2,499 | 14 (1.7%) | 0 (0.0%) |
| $2,500 to $2,999 | 6 (0.7%) | 0 (0.0%) |
| $3,000 or more | 0 (0.0%) | 0 (0.0%) |
| Total | 814 (100.0%) | 321 (100.0%) |
Physical Housing Characteristics in Portage borough
Housing Structures in Portage borough
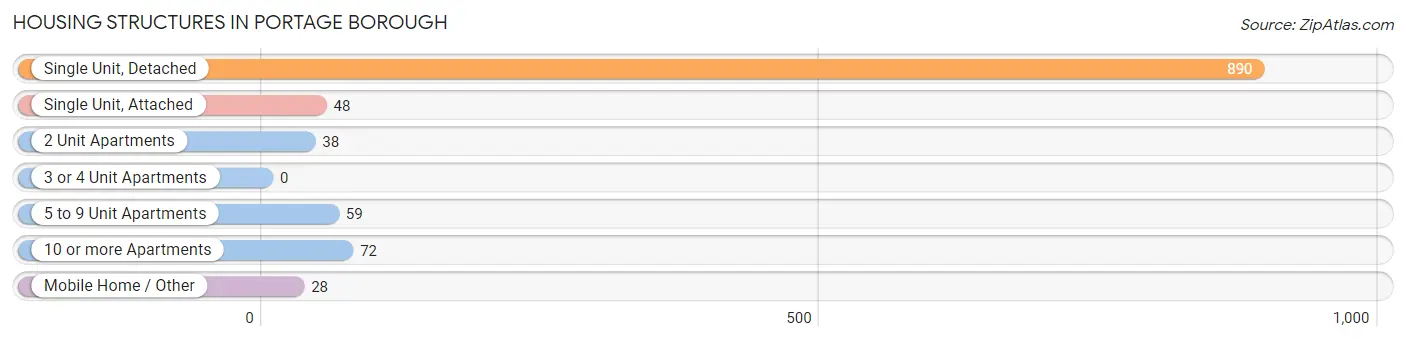
| Structure Type | # Housing Units | % Housing Units |
| Single Unit, Detached | 890 | 78.4% |
| Single Unit, Attached | 48 | 4.2% |
| 2 Unit Apartments | 38 | 3.4% |
| 3 or 4 Unit Apartments | 0 | 0.0% |
| 5 to 9 Unit Apartments | 59 | 5.2% |
| 10 or more Apartments | 72 | 6.3% |
| Mobile Home / Other | 28 | 2.5% |
| Total | 1,135 | 100.0% |
Housing Structures by Occupancy in Portage borough
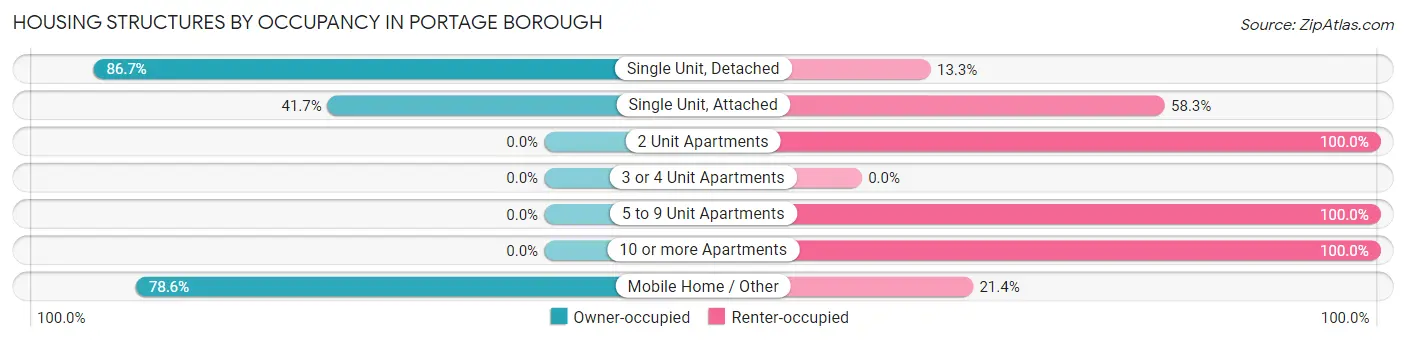
| Structure Type | Owner-occupied | Renter-occupied |
| Single Unit, Detached | 772 (86.7%) | 118 (13.3%) |
| Single Unit, Attached | 20 (41.7%) | 28 (58.3%) |
| 2 Unit Apartments | 0 (0.0%) | 38 (100.0%) |
| 3 or 4 Unit Apartments | 0 (0.0%) | 0 (0.0%) |
| 5 to 9 Unit Apartments | 0 (0.0%) | 59 (100.0%) |
| 10 or more Apartments | 0 (0.0%) | 72 (100.0%) |
| Mobile Home / Other | 22 (78.6%) | 6 (21.4%) |
| Total | 814 (71.7%) | 321 (28.3%) |
Housing Structures by Number of Rooms in Portage borough
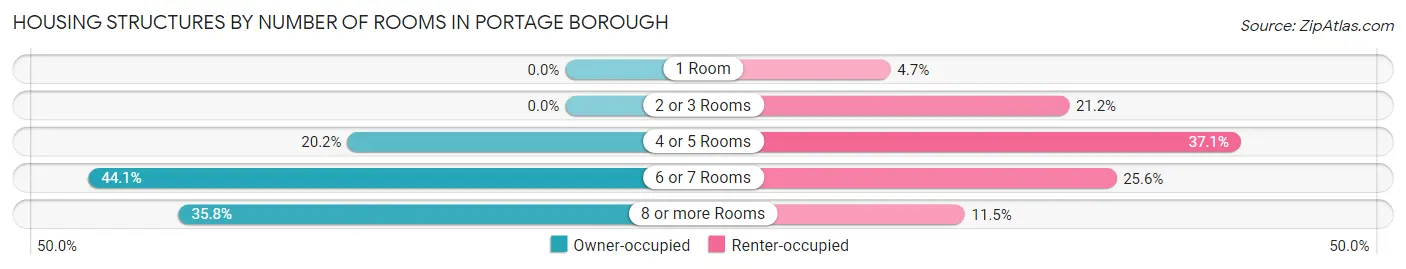
| Number of Rooms | Owner-occupied | Renter-occupied |
| 1 Room | 0 (0.0%) | 15 (4.7%) |
| 2 or 3 Rooms | 0 (0.0%) | 68 (21.2%) |
| 4 or 5 Rooms | 164 (20.2%) | 119 (37.1%) |
| 6 or 7 Rooms | 359 (44.1%) | 82 (25.6%) |
| 8 or more Rooms | 291 (35.7%) | 37 (11.5%) |
| Total | 814 (100.0%) | 321 (100.0%) |
Housing Structure by Heating Type in Portage borough
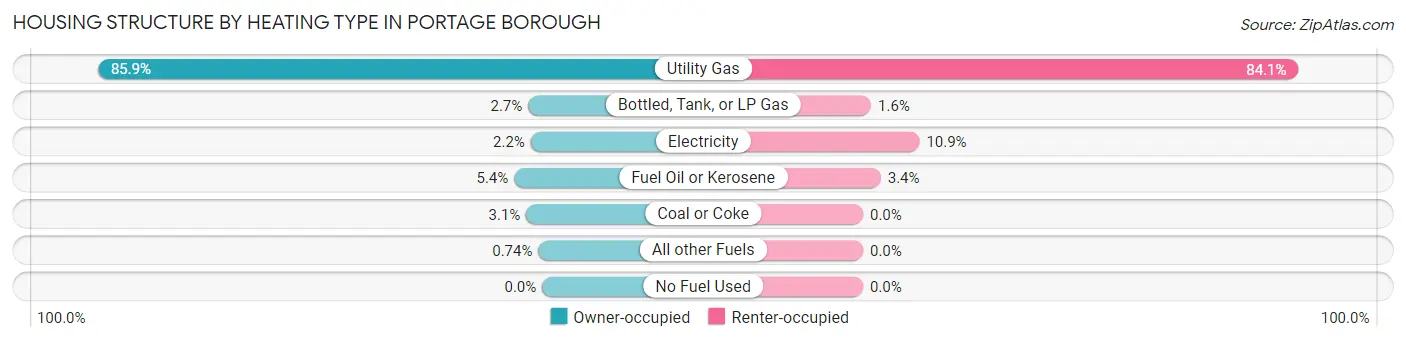
| Heating Type | Owner-occupied | Renter-occupied |
| Utility Gas | 699 (85.9%) | 270 (84.1%) |
| Bottled, Tank, or LP Gas | 22 (2.7%) | 5 (1.6%) |
| Electricity | 18 (2.2%) | 35 (10.9%) |
| Fuel Oil or Kerosene | 44 (5.4%) | 11 (3.4%) |
| Coal or Coke | 25 (3.1%) | 0 (0.0%) |
| All other Fuels | 6 (0.7%) | 0 (0.0%) |
| No Fuel Used | 0 (0.0%) | 0 (0.0%) |
| Total | 814 (100.0%) | 321 (100.0%) |
Household Vehicle Usage in Portage borough
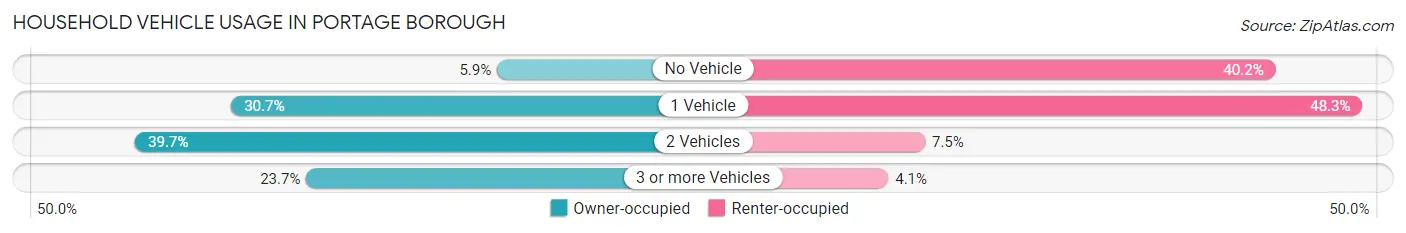
| Vehicles per Household | Owner-occupied | Renter-occupied |
| No Vehicle | 48 (5.9%) | 129 (40.2%) |
| 1 Vehicle | 250 (30.7%) | 155 (48.3%) |
| 2 Vehicles | 323 (39.7%) | 24 (7.5%) |
| 3 or more Vehicles | 193 (23.7%) | 13 (4.1%) |
| Total | 814 (100.0%) | 321 (100.0%) |
Real Estate & Mortgages in Portage borough
Real Estate and Mortgage Overview in Portage borough
| Characteristic | Without Mortgage | With Mortgage |
| Housing Units | 434 | 380 |
| Median Property Value | $99,700 | $87,200 |
| Median Household Income | $49,605 | $39 |
| Monthly Housing Costs | $428 | $0 |
| Real Estate Taxes | $905 | $0 |
Property Value by Mortgage Status in Portage borough
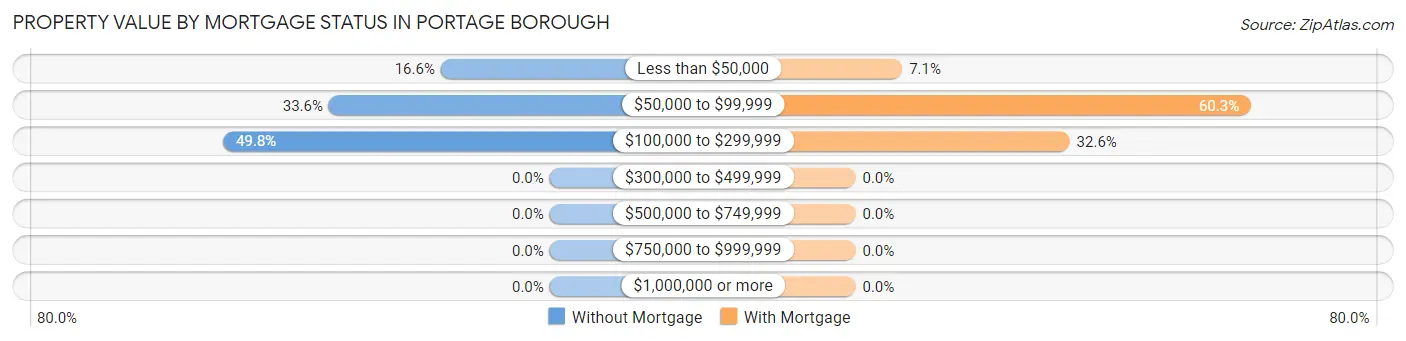
| Property Value | Without Mortgage | With Mortgage |
| Less than $50,000 | 72 (16.6%) | 27 (7.1%) |
| $50,000 to $99,999 | 146 (33.6%) | 229 (60.3%) |
| $100,000 to $299,999 | 216 (49.8%) | 124 (32.6%) |
| $300,000 to $499,999 | 0 (0.0%) | 0 (0.0%) |
| $500,000 to $749,999 | 0 (0.0%) | 0 (0.0%) |
| $750,000 to $999,999 | 0 (0.0%) | 0 (0.0%) |
| $1,000,000 or more | 0 (0.0%) | 0 (0.0%) |
| Total | 434 (100.0%) | 380 (100.0%) |
Household Income by Mortgage Status in Portage borough
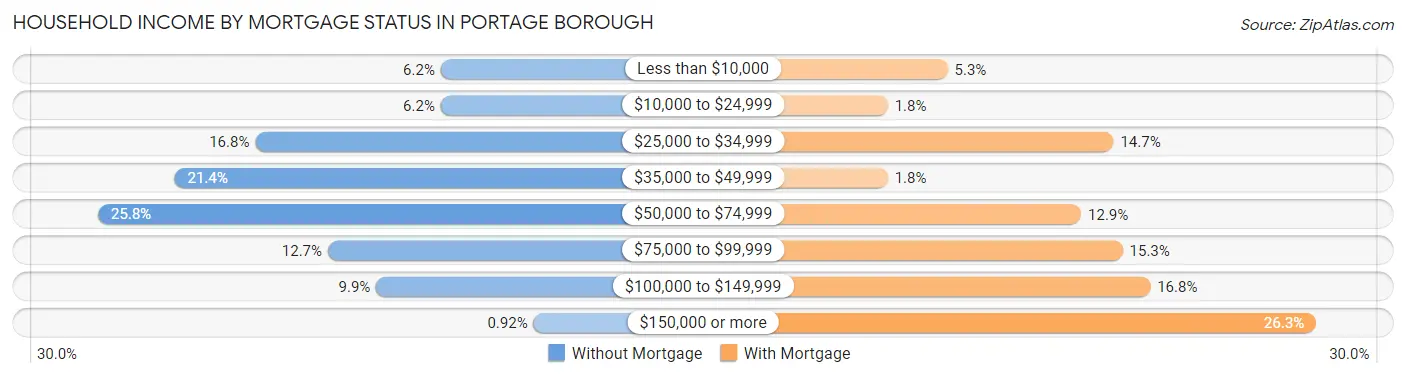
| Household Income | Without Mortgage | With Mortgage |
| Less than $10,000 | 27 (6.2%) | 20 (5.3%) |
| $10,000 to $24,999 | 27 (6.2%) | 7 (1.8%) |
| $25,000 to $34,999 | 73 (16.8%) | 56 (14.7%) |
| $35,000 to $49,999 | 93 (21.4%) | 7 (1.8%) |
| $50,000 to $74,999 | 112 (25.8%) | 49 (12.9%) |
| $75,000 to $99,999 | 55 (12.7%) | 58 (15.3%) |
| $100,000 to $149,999 | 43 (9.9%) | 64 (16.8%) |
| $150,000 or more | 4 (0.9%) | 100 (26.3%) |
| Total | 434 (100.0%) | 380 (100.0%) |
Property Value to Household Income Ratio in Portage borough
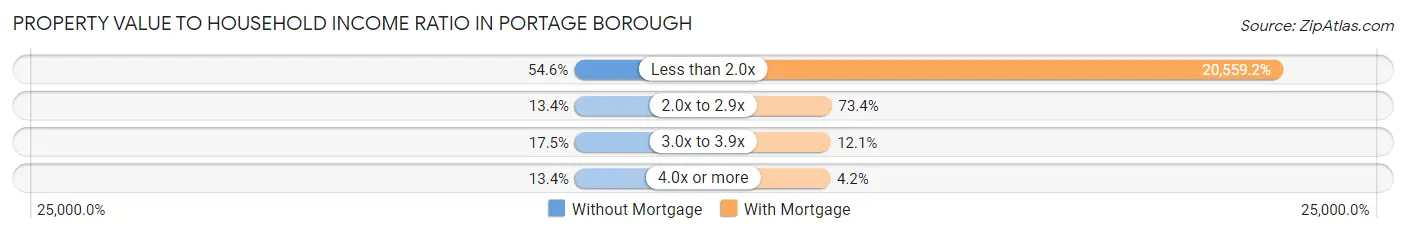
| Value-to-Income Ratio | Without Mortgage | With Mortgage |
| Less than 2.0x | 237 (54.6%) | 78,125 (20,559.2%) |
| 2.0x to 2.9x | 58 (13.4%) | 279 (73.4%) |
| 3.0x to 3.9x | 76 (17.5%) | 46 (12.1%) |
| 4.0x or more | 58 (13.4%) | 16 (4.2%) |
| Total | 434 (100.0%) | 380 (100.0%) |
Real Estate Taxes by Mortgage Status in Portage borough
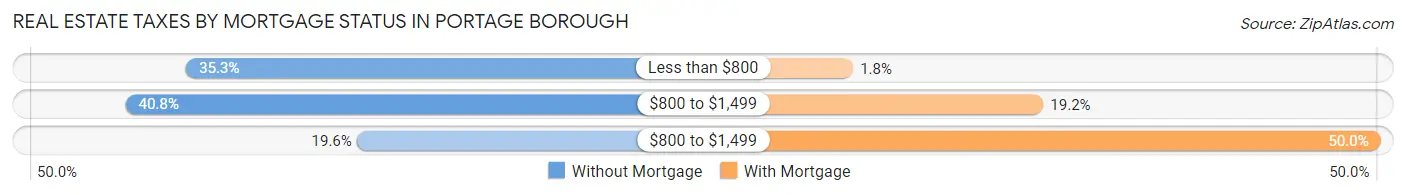
| Property Taxes | Without Mortgage | With Mortgage |
| Less than $800 | 153 (35.2%) | 7 (1.8%) |
| $800 to $1,499 | 177 (40.8%) | 73 (19.2%) |
| $800 to $1,499 | 85 (19.6%) | 190 (50.0%) |
| Total | 434 (100.0%) | 380 (100.0%) |
Health & Disability in Portage borough
Health Insurance Coverage by Age in Portage borough
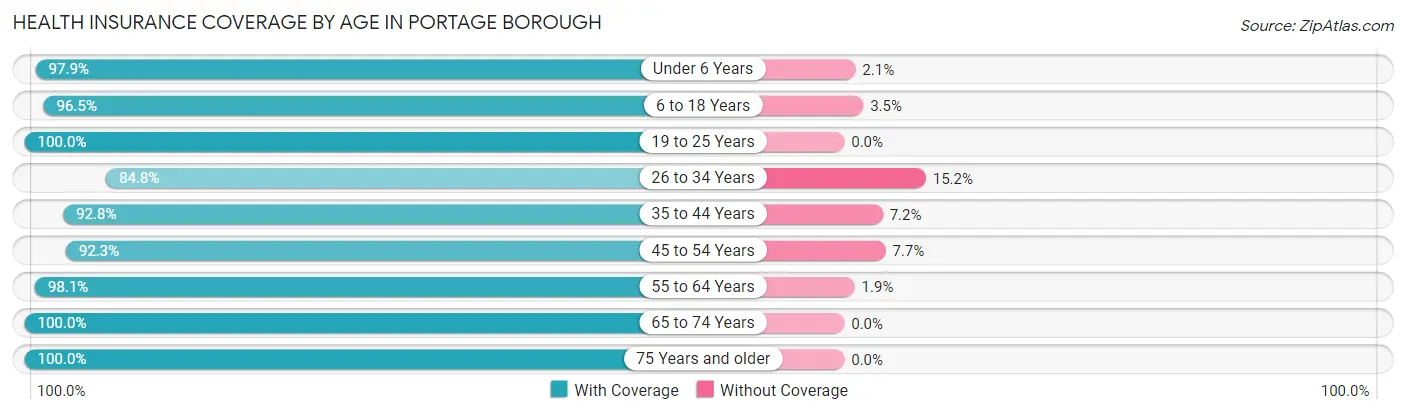
| Age Bracket | With Coverage | Without Coverage |
| Under 6 Years | 236 (97.9%) | 5 (2.1%) |
| 6 to 18 Years | 383 (96.5%) | 14 (3.5%) |
| 19 to 25 Years | 125 (100.0%) | 0 (0.0%) |
| 26 to 34 Years | 318 (84.8%) | 57 (15.2%) |
| 35 to 44 Years | 246 (92.8%) | 19 (7.2%) |
| 45 to 54 Years | 348 (92.3%) | 29 (7.7%) |
| 55 to 64 Years | 305 (98.1%) | 6 (1.9%) |
| 65 to 74 Years | 369 (100.0%) | 0 (0.0%) |
| 75 Years and older | 193 (100.0%) | 0 (0.0%) |
| Total | 2,523 (95.1%) | 130 (4.9%) |
Health Insurance Coverage by Citizenship Status in Portage borough
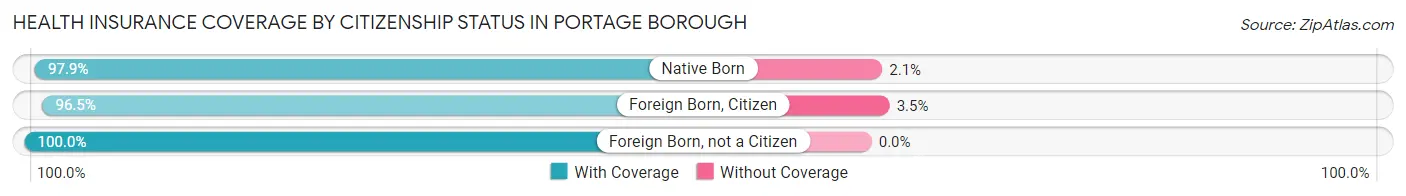
| Citizenship Status | With Coverage | Without Coverage |
| Native Born | 236 (97.9%) | 5 (2.1%) |
| Foreign Born, Citizen | 383 (96.5%) | 14 (3.5%) |
| Foreign Born, not a Citizen | 125 (100.0%) | 0 (0.0%) |
Health Insurance Coverage by Household Income in Portage borough
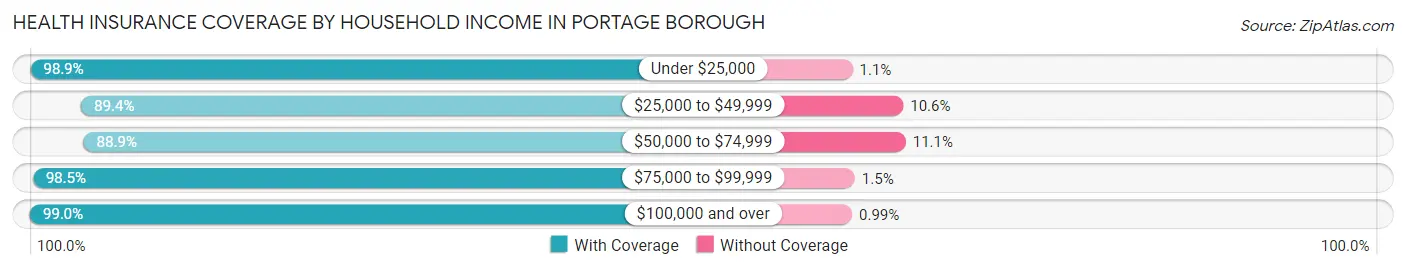
| Household Income | With Coverage | Without Coverage |
| Under $25,000 | 547 (98.9%) | 6 (1.1%) |
| $25,000 to $49,999 | 532 (89.4%) | 63 (10.6%) |
| $50,000 to $74,999 | 394 (88.9%) | 49 (11.1%) |
| $75,000 to $99,999 | 323 (98.5%) | 5 (1.5%) |
| $100,000 and over | 700 (99.0%) | 7 (1.0%) |
Public vs Private Health Insurance Coverage by Age in Portage borough
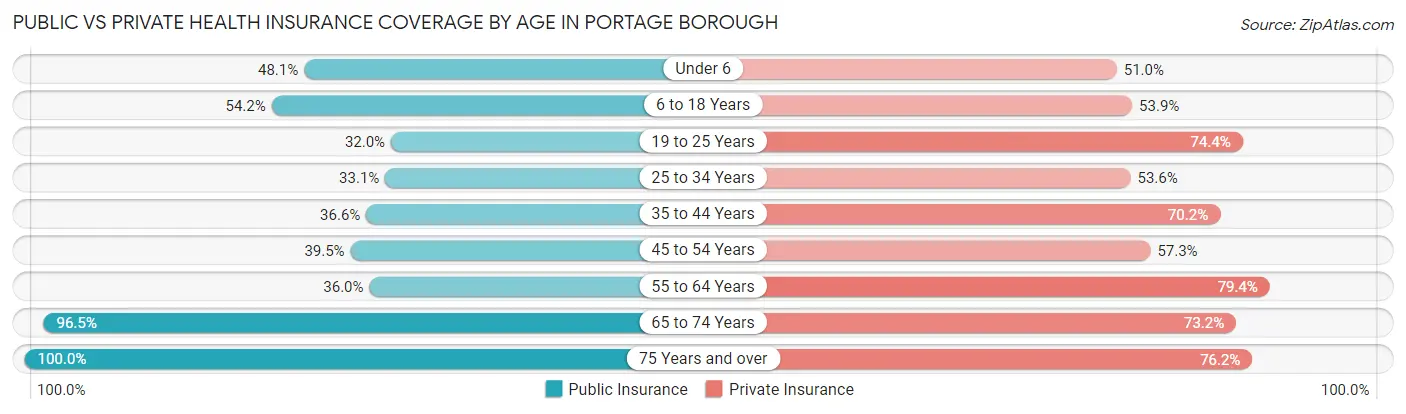
| Age Bracket | Public Insurance | Private Insurance |
| Under 6 | 116 (48.1%) | 123 (51.0%) |
| 6 to 18 Years | 215 (54.2%) | 214 (53.9%) |
| 19 to 25 Years | 40 (32.0%) | 93 (74.4%) |
| 25 to 34 Years | 124 (33.1%) | 201 (53.6%) |
| 35 to 44 Years | 97 (36.6%) | 186 (70.2%) |
| 45 to 54 Years | 149 (39.5%) | 216 (57.3%) |
| 55 to 64 Years | 112 (36.0%) | 247 (79.4%) |
| 65 to 74 Years | 356 (96.5%) | 270 (73.2%) |
| 75 Years and over | 193 (100.0%) | 147 (76.2%) |
| Total | 1,402 (52.8%) | 1,697 (64.0%) |
Disability Status by Sex by Age in Portage borough
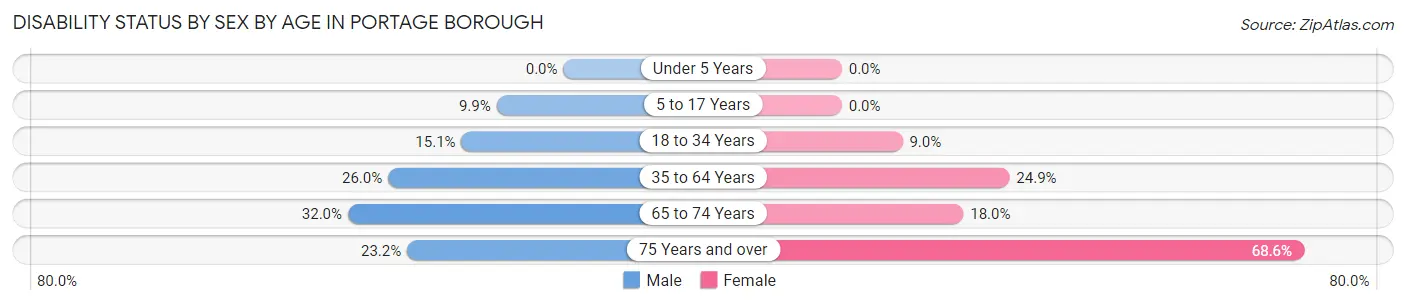
| Age Bracket | Male | Female |
| Under 5 Years | 0 (0.0%) | 0 (0.0%) |
| 5 to 17 Years | 25 (9.9%) | 0 (0.0%) |
| 18 to 34 Years | 43 (15.1%) | 21 (9.0%) |
| 35 to 64 Years | 133 (26.0%) | 110 (24.9%) |
| 65 to 74 Years | 56 (32.0%) | 35 (18.0%) |
| 75 Years and over | 13 (23.2%) | 94 (68.6%) |
Disability Class by Sex by Age in Portage borough
Disability Class: Hearing Difficulty
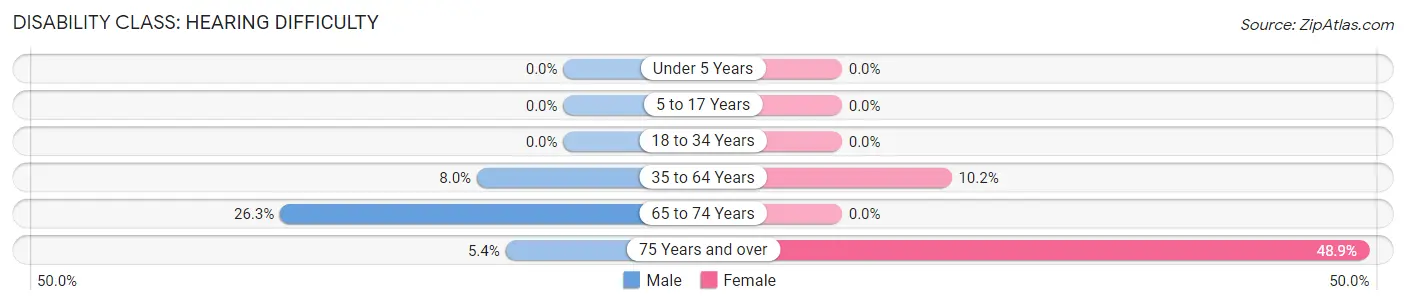
| Age Bracket | Male | Female |
| Under 5 Years | 0 (0.0%) | 0 (0.0%) |
| 5 to 17 Years | 0 (0.0%) | 0 (0.0%) |
| 18 to 34 Years | 0 (0.0%) | 0 (0.0%) |
| 35 to 64 Years | 41 (8.0%) | 45 (10.2%) |
| 65 to 74 Years | 46 (26.3%) | 0 (0.0%) |
| 75 Years and over | 3 (5.4%) | 67 (48.9%) |
Disability Class: Vision Difficulty
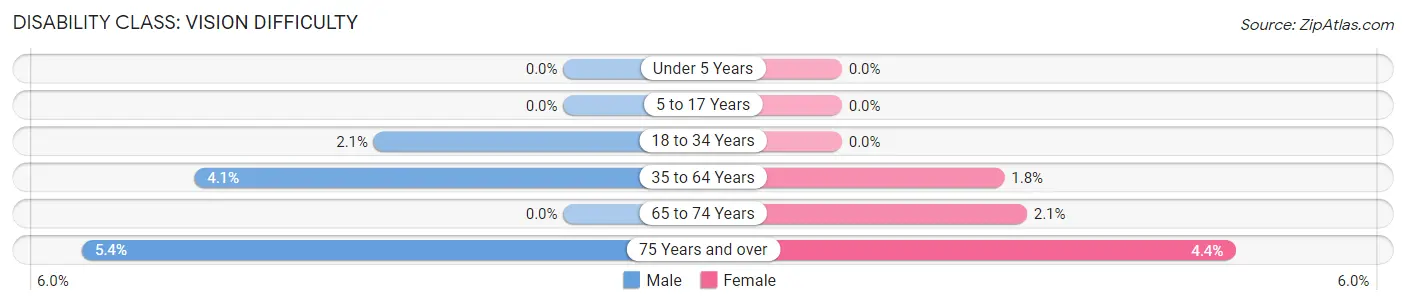
| Age Bracket | Male | Female |
| Under 5 Years | 0 (0.0%) | 0 (0.0%) |
| 5 to 17 Years | 0 (0.0%) | 0 (0.0%) |
| 18 to 34 Years | 6 (2.1%) | 0 (0.0%) |
| 35 to 64 Years | 21 (4.1%) | 8 (1.8%) |
| 65 to 74 Years | 0 (0.0%) | 4 (2.1%) |
| 75 Years and over | 3 (5.4%) | 6 (4.4%) |
Disability Class: Cognitive Difficulty
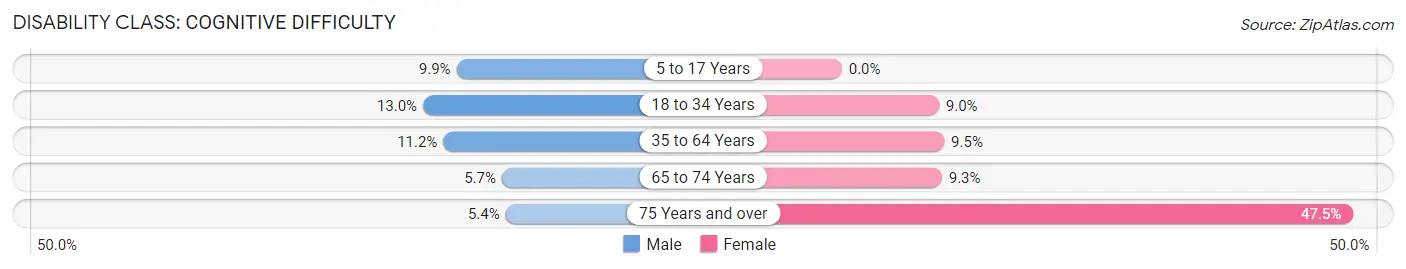
| Age Bracket | Male | Female |
| 5 to 17 Years | 25 (9.9%) | 0 (0.0%) |
| 18 to 34 Years | 37 (13.0%) | 21 (9.0%) |
| 35 to 64 Years | 57 (11.2%) | 42 (9.5%) |
| 65 to 74 Years | 10 (5.7%) | 18 (9.3%) |
| 75 Years and over | 3 (5.4%) | 65 (47.4%) |
Disability Class: Ambulatory Difficulty
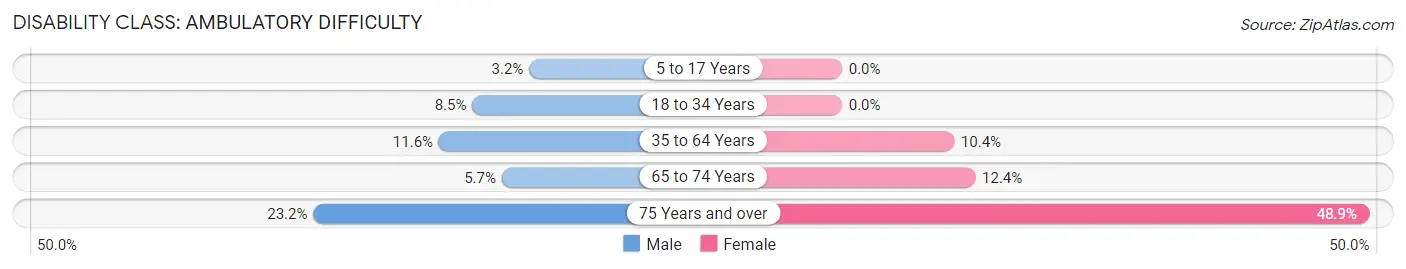
| Age Bracket | Male | Female |
| 5 to 17 Years | 8 (3.2%) | 0 (0.0%) |
| 18 to 34 Years | 24 (8.5%) | 0 (0.0%) |
| 35 to 64 Years | 59 (11.6%) | 46 (10.4%) |
| 65 to 74 Years | 10 (5.7%) | 24 (12.4%) |
| 75 Years and over | 13 (23.2%) | 67 (48.9%) |
Disability Class: Self-Care Difficulty
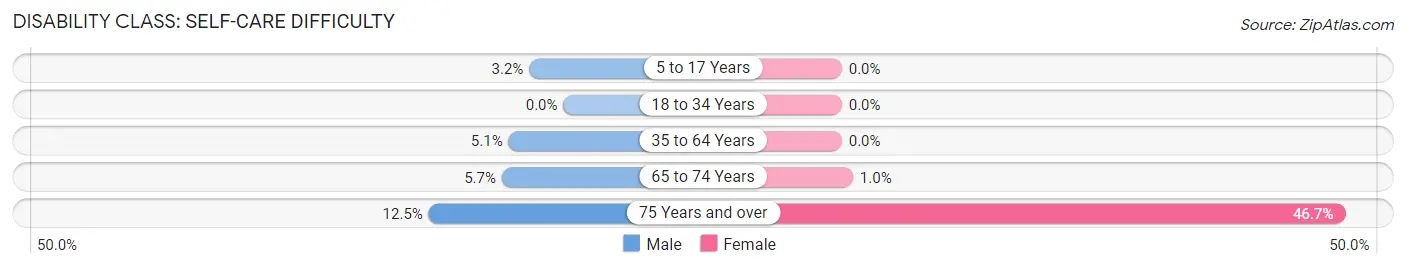
| Age Bracket | Male | Female |
| 5 to 17 Years | 8 (3.2%) | 0 (0.0%) |
| 18 to 34 Years | 0 (0.0%) | 0 (0.0%) |
| 35 to 64 Years | 26 (5.1%) | 0 (0.0%) |
| 65 to 74 Years | 10 (5.7%) | 2 (1.0%) |
| 75 Years and over | 7 (12.5%) | 64 (46.7%) |
Technology Access in Portage borough
Computing Device Access in Portage borough
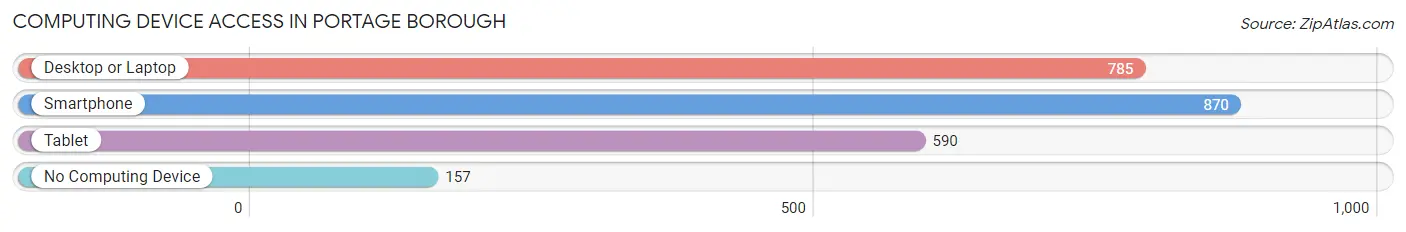
| Device Type | # Households | % Households |
| Desktop or Laptop | 785 | 69.2% |
| Smartphone | 870 | 76.6% |
| Tablet | 590 | 52.0% |
| No Computing Device | 157 | 13.8% |
| Total | 1,135 | 100.0% |
Internet Access in Portage borough
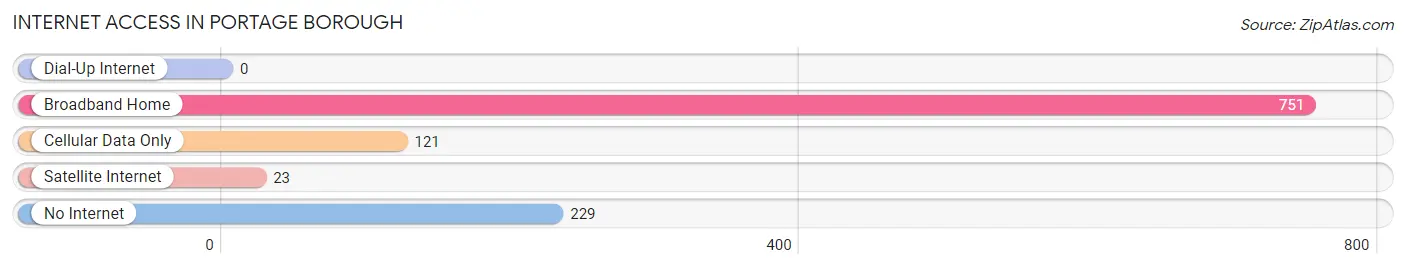
| Internet Type | # Households | % Households |
| Dial-Up Internet | 0 | 0.0% |
| Broadband Home | 751 | 66.2% |
| Cellular Data Only | 121 | 10.7% |
| Satellite Internet | 23 | 2.0% |
| No Internet | 229 | 20.2% |
| Total | 1,135 | 100.0% |
Portage borough Summary
Portage Borough is a borough located in Cambria County, Pennsylvania, United States. It is part of the Johnstown, Pennsylvania Metropolitan Statistical Area. The population was 1,845 at the 2010 census.
History
Portage Borough was founded in 1836 by a group of settlers from the nearby town of Ebensburg. The settlers were looking for a place to build a new town and chose the area around the Portage Creek. The creek was used to transport goods and people between Ebensburg and Johnstown. The town was named after the creek and was officially incorporated in 1845.
The town grew quickly and by the late 19th century it was a thriving industrial center. The town was home to several coal mines, iron works, and other industries. The town also had a large number of stores and businesses.
In the early 20th century, the town began to decline as the coal and iron industries moved away. The town was hit hard by the Great Depression and many of the businesses closed. The town was further impacted by the Johnstown Flood of 1936, which caused extensive damage to the town.
In the late 20th century, the town began to recover and the population began to grow again. The town has become a popular tourist destination due to its proximity to Johnstown and the surrounding area.
Geography
Portage Borough is located at 40 25 17 North 78 51 45 West 40 421445 78 862445
According to the United States Census Bureau, the borough has a total area of 0.7 square miles (1.8 km2), all of it land.
Demographics
As of the census of 2000, there were 1,845 people, 745 households, and 486 families residing in the borough. The population density was 2,619.3 people per square mile (1,011.2/km2). There were 809 housing units at an average density of 1,145.2 per square mile (441.2/km2). The racial makeup of the borough was 98.45% White, 0.43% African American, 0.05% Native American, 0.05% Asian, 0.05% Pacific Islander, 0.22% from other races, and 0.76% from two or more races. Hispanic or Latino of any race were 0.60% of the population.
There were 745 households, out of which 28.2% had children under the age of 18 living with them, 48.2% were married couples living together, 12.2% had a female householder with no husband present, and 34.7% were non-families. 30.7% of all households were made up of individuals, and 16.2% had someone living alone who was 65 years of age or older. The average household size was 2.45 and the average family size was 3.05.
In the borough the population was spread out, with 24.2% under the age of 18, 8.2% from 18 to 24, 28.2% from 25 to 44, 21.2% from 45 to 64, and 18.2% who were 65 years of age or older. The median age was 38 years. For every 100 females, there were 91.2 males. For every 100 females age 18 and over, there were 86.7 males.
The median income for a household in the borough was $27,917, and the median income for a family was $35,000. Males had a median income of $30,000 versus $20,000 for females. The per capita income for the borough was $14,845. About 11.2% of families and 14.2% of the population were below the poverty line, including 19.2% of those under age 18 and 11.2% of those age 65 or over.
Economy
Portage Borough is home to several businesses and industries. The town is home to a number of small businesses, including restaurants, retail stores, and service providers. The town is also home to several manufacturing companies, including a steel mill and a paper mill. The town is also home to a number of coal mines, which provide jobs for many of the town's residents.
The town is also home to a number of tourist attractions, including the Portage Railroad Museum and the Portage Historic District. The town is also home to a number of parks and recreational areas, including the Portage Creek Park and the Portage Lake Park.
Conclusion
Portage Borough is a small borough located in Cambria County, Pennsylvania. The town was founded in 1836 and has a population of 1,845 as of the 2010 census. The town has a rich history and was once a thriving industrial center. The town has since recovered and is now a popular tourist destination due to its proximity to Johnstown and the surrounding area. The town is home to several businesses and industries, including manufacturing companies, coal mines, and tourist attractions. The town is also home to a number of parks and recreational areas.
Common Questions
What is Per Capita Income in Portage borough?
Per Capita income in Portage borough is $26,005.
What is the Median Family Income in Portage borough?
Median Family Income in Portage borough is $67,813.
What is the Median Household income in Portage borough?
Median Household Income in Portage borough is $47,825.
What is Income or Wage Gap in Portage borough?
Income or Wage Gap in Portage borough is 22.7%.
Women in Portage borough earn 77.3 cents for every dollar earned by a man.
What is Inequality or Gini Index in Portage borough?
Inequality or Gini Index in Portage borough is 0.43.
What is the Total Population of Portage borough?
Total Population of Portage borough is 2,658.
What is the Total Male Population of Portage borough?
Total Male Population of Portage borough is 1,375.
What is the Total Female Population of Portage borough?
Total Female Population of Portage borough is 1,283.
What is the Ratio of Males per 100 Females in Portage borough?
There are 107.17 Males per 100 Females in Portage borough.
What is the Ratio of Females per 100 Males in Portage borough?
There are 93.31 Females per 100 Males in Portage borough.
What is the Median Population Age in Portage borough?
Median Population Age in Portage borough is 41.4 Years.
What is the Average Family Size in Portage borough
Average Family Size in Portage borough is 3.1 People.
What is the Average Household Size in Portage borough
Average Household Size in Portage borough is 2.3 People.
How Large is the Labor Force in Portage borough?
There are 1,095 People in the Labor Forcein in Portage borough.
What is the Percentage of People in the Labor Force in Portage borough?
52.2% of People are in the Labor Force in Portage borough.
What is the Unemployment Rate in Portage borough?
Unemployment Rate in Portage borough is 4.0%.