Everett borough, PA Map & Demographics
Everett borough Overview
$28,995
PER CAPITA INCOME
$61,250
AVG FAMILY INCOME
$37,708
AVG HOUSEHOLD INCOME
45.1%
WAGE / INCOME GAP [ % ]
54.9¢/ $1
WAGE / INCOME GAP [ $ ]
0.52
INEQUALITY / GINI INDEX
2,154
TOTAL POPULATION
986
MALE POPULATION
1,168
FEMALE POPULATION
84.42
MALES / 100 FEMALES
118.46
FEMALES / 100 MALES
37.2
MEDIAN AGE
3.0
AVG FAMILY SIZE
2.3
AVG HOUSEHOLD SIZE
996
LABOR FORCE [ PEOPLE ]
58.7%
PERCENT IN LABOR FORCE
6.6%
UNEMPLOYMENT RATE
Income in Everett borough
Income Overview in Everett borough
Per Capita Income in Everett borough is $28,995, while median incomes of families and households are $61,250 and $37,708 respectively.
| Characteristic | Number | Measure |
| Per Capita Income | 2,154 | $28,995 |
| Median Family Income | 530 | $61,250 |
| Mean Family Income | 530 | $71,688 |
| Median Household Income | 925 | $37,708 |
| Mean Household Income | 925 | $64,573 |
| Income Deficit | 530 | $0 |
| Wage / Income Gap (%) | 2,154 | 45.14% |
| Wage / Income Gap ($) | 2,154 | 54.86¢ per $1 |
| Gini / Inequality Index | 2,154 | 0.52 |
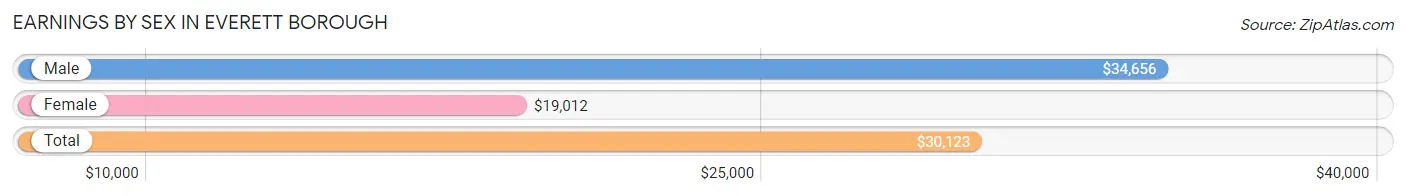
Earnings by Sex in Everett borough
Average Earnings in Everett borough are $30,123, $34,656 for men and $19,012 for women, a difference of 45.1%.
| Sex | Number | Average Earnings |
| Male | 489 (46.8%) | $34,656 |
| Female | 556 (53.2%) | $19,012 |
| Total | 1,045 (100.0%) | $30,123 |
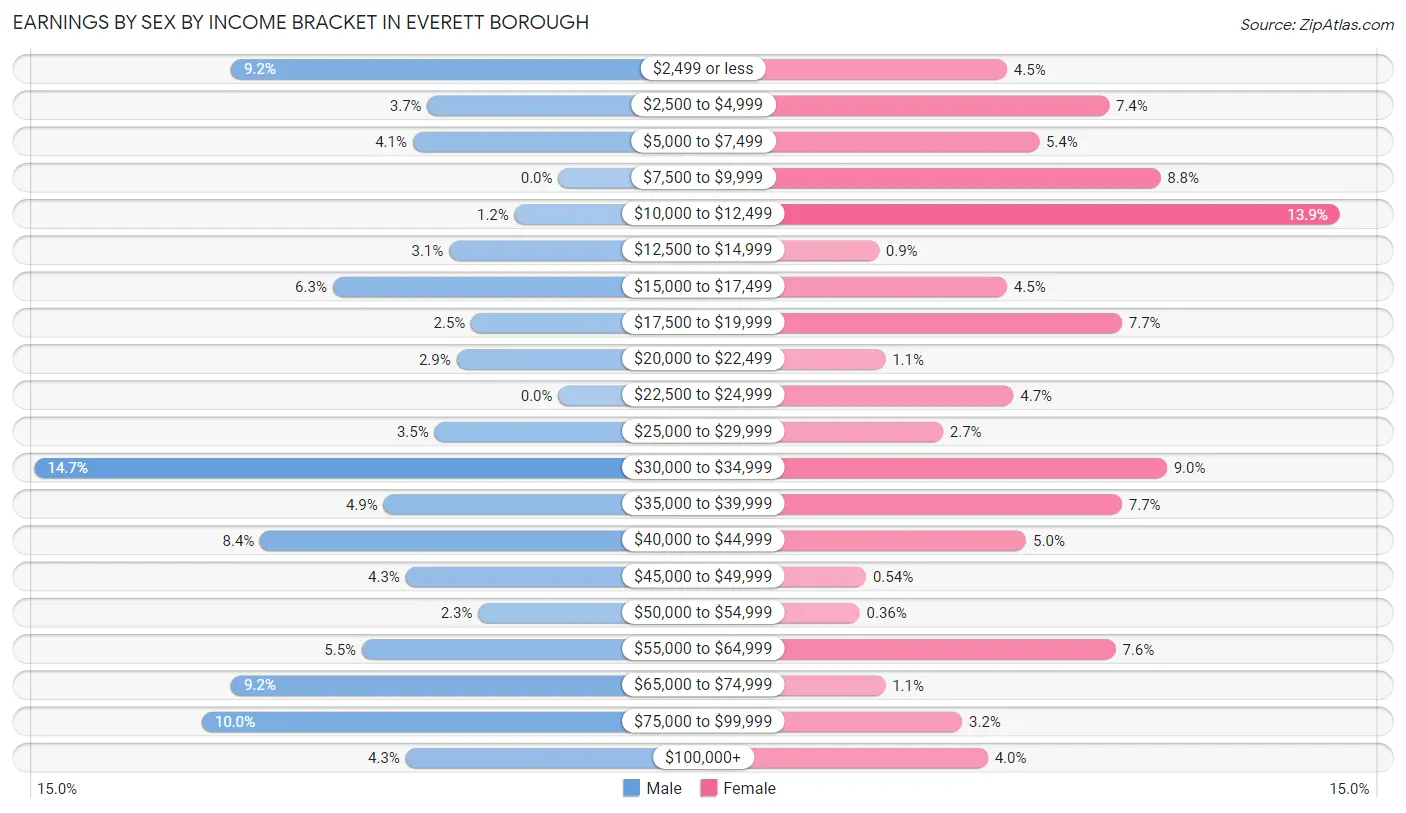
Earnings by Sex by Income Bracket in Everett borough
The most common earnings brackets in Everett borough are $30,000 to $34,999 for men (72 | 14.7%) and $10,000 to $12,499 for women (77 | 13.9%).
| Income | Male | Female |
| $2,499 or less | 45 (9.2%) | 25 (4.5%) |
| $2,500 to $4,999 | 18 (3.7%) | 41 (7.4%) |
| $5,000 to $7,499 | 20 (4.1%) | 30 (5.4%) |
| $7,500 to $9,999 | 0 (0.0%) | 49 (8.8%) |
| $10,000 to $12,499 | 6 (1.2%) | 77 (13.9%) |
| $12,500 to $14,999 | 15 (3.1%) | 5 (0.9%) |
| $15,000 to $17,499 | 31 (6.3%) | 25 (4.5%) |
| $17,500 to $19,999 | 12 (2.5%) | 43 (7.7%) |
| $20,000 to $22,499 | 14 (2.9%) | 6 (1.1%) |
| $22,500 to $24,999 | 0 (0.0%) | 26 (4.7%) |
| $25,000 to $29,999 | 17 (3.5%) | 15 (2.7%) |
| $30,000 to $34,999 | 72 (14.7%) | 50 (9.0%) |
| $35,000 to $39,999 | 24 (4.9%) | 43 (7.7%) |
| $40,000 to $44,999 | 41 (8.4%) | 28 (5.0%) |
| $45,000 to $49,999 | 21 (4.3%) | 3 (0.5%) |
| $50,000 to $54,999 | 11 (2.2%) | 2 (0.4%) |
| $55,000 to $64,999 | 27 (5.5%) | 42 (7.5%) |
| $65,000 to $74,999 | 45 (9.2%) | 6 (1.1%) |
| $75,000 to $99,999 | 49 (10.0%) | 18 (3.2%) |
| $100,000+ | 21 (4.3%) | 22 (4.0%) |
| Total | 489 (100.0%) | 556 (100.0%) |
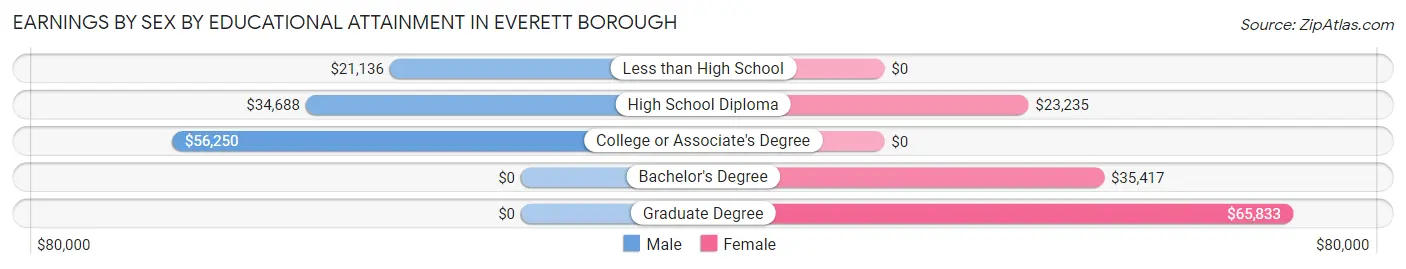
Earnings by Sex by Educational Attainment in Everett borough
Average earnings in Everett borough are $40,640 for men and $30,066 for women, a difference of 26.0%. Men with an educational attainment of college or associate's degree enjoy the highest average annual earnings of $56,250, while those with less than high school education earn the least with $21,136. Women with an educational attainment of graduate degree earn the most with the average annual earnings of $65,833, while those with high school diploma education have the smallest earnings of $23,235.
| Educational Attainment | Male Income | Female Income |
| Less than High School | $21,136 | $0 |
| High School Diploma | $34,688 | $23,235 |
| College or Associate's Degree | $56,250 | $0 |
| Bachelor's Degree | - | - |
| Graduate Degree | - | - |
| Total | $40,640 | $30,066 |
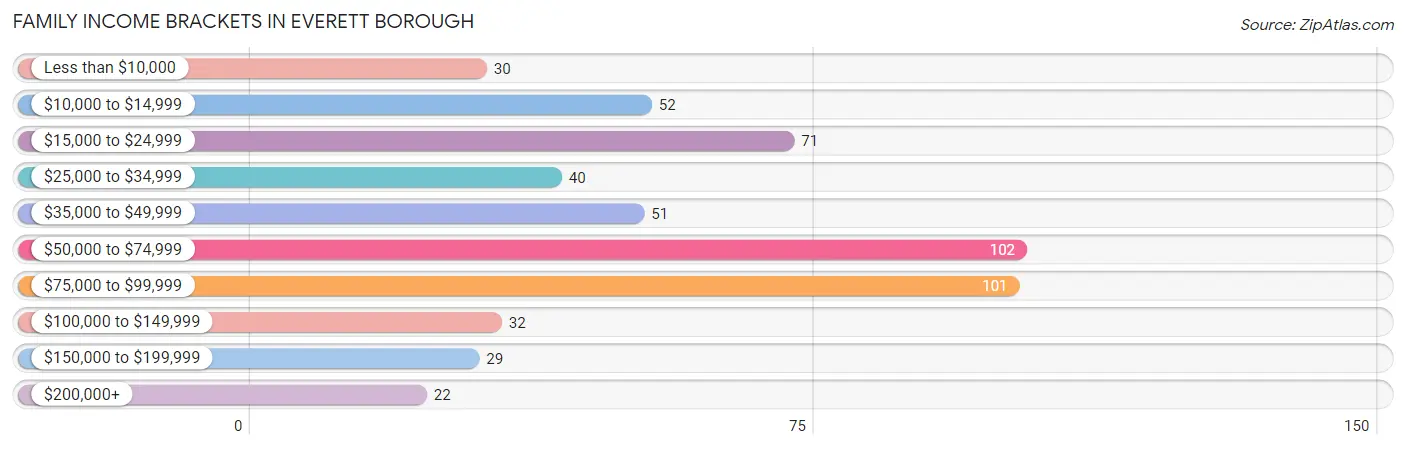
Family Income in Everett borough
Family Income Brackets in Everett borough
According to the Everett borough family income data, there are 102 families falling into the $50,000 to $74,999 income range, which is the most common income bracket and makes up 19.3% of all families. Conversely, the $200,000+ income bracket is the least frequent group with only 22 families (4.2%) belonging to this category.
| Income Bracket | # Families | % Families |
| Less than $10,000 | 30 | 5.7% |
| $10,000 to $14,999 | 52 | 9.8% |
| $15,000 to $24,999 | 71 | 13.4% |
| $25,000 to $34,999 | 40 | 7.5% |
| $35,000 to $49,999 | 51 | 9.6% |
| $50,000 to $74,999 | 102 | 19.2% |
| $75,000 to $99,999 | 101 | 19.1% |
| $100,000 to $149,999 | 32 | 6.0% |
| $150,000 to $199,999 | 29 | 5.5% |
| $200,000+ | 22 | 4.2% |
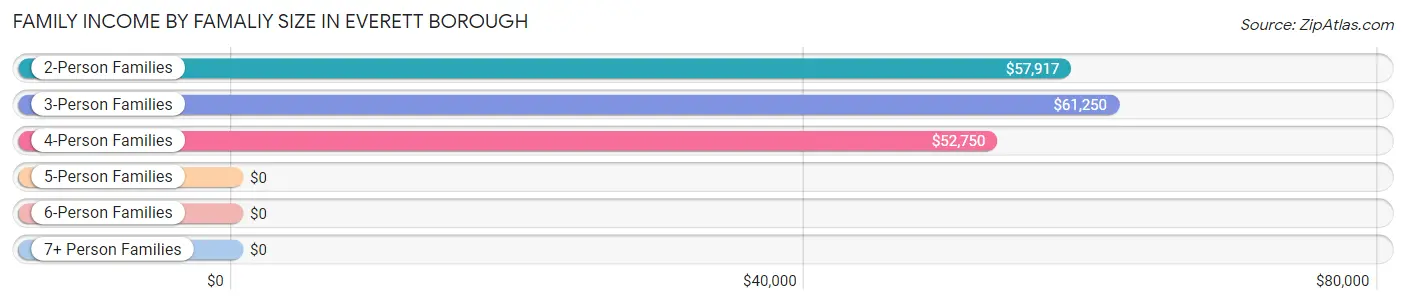
Family Income by Famaliy Size in Everett borough
3-person families (165 | 31.1%) account for the highest median family income in Everett borough with $61,250 per family, while 2-person families (248 | 46.8%) have the highest median income of $28,958 per family member.
| Income Bracket | # Families | Median Income |
| 2-Person Families | 248 (46.8%) | $57,917 |
| 3-Person Families | 165 (31.1%) | $61,250 |
| 4-Person Families | 91 (17.2%) | $52,750 |
| 5-Person Families | 3 (0.6%) | $0 |
| 6-Person Families | 0 (0.0%) | $0 |
| 7+ Person Families | 23 (4.3%) | $0 |
| Total | 530 (100.0%) | $61,250 |
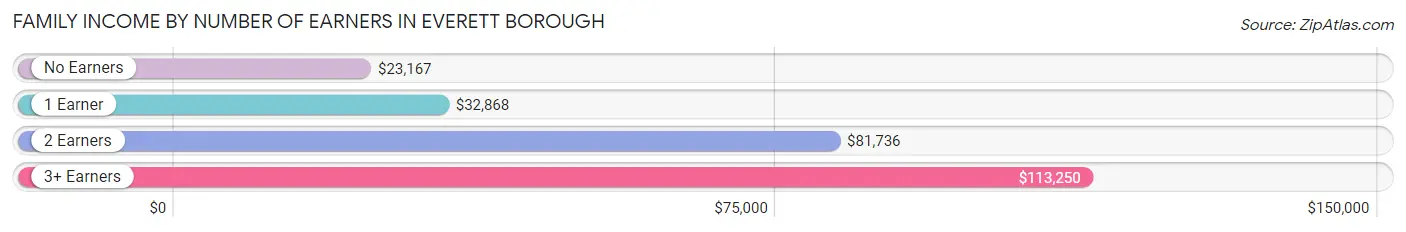
Family Income by Number of Earners in Everett borough
The median family income in Everett borough is $61,250, with families comprising 3+ earners (68) having the highest median family income of $113,250, while families with no earners (106) have the lowest median family income of $23,167, accounting for 12.8% and 20.0% of families, respectively.
| Number of Earners | # Families | Median Income |
| No Earners | 106 (20.0%) | $23,167 |
| 1 Earner | 143 (27.0%) | $32,868 |
| 2 Earners | 213 (40.2%) | $81,736 |
| 3+ Earners | 68 (12.8%) | $113,250 |
| Total | 530 (100.0%) | $61,250 |
Household Income in Everett borough
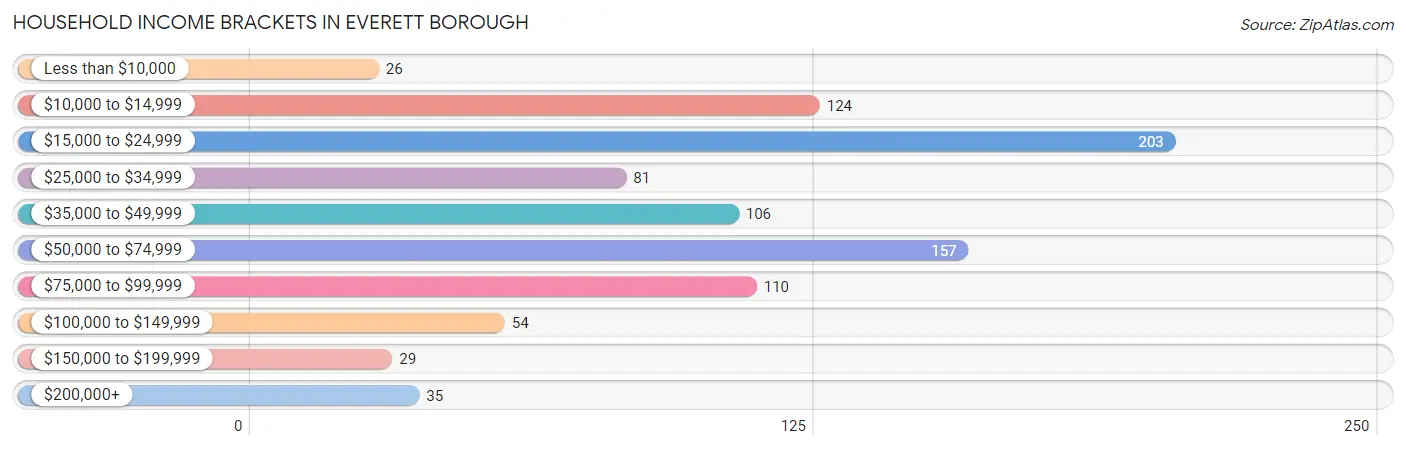
Household Income Brackets in Everett borough
With 203 households falling in the category, the $15,000 to $24,999 income range is the most frequent in Everett borough, accounting for 22.0% of all households. In contrast, only 26 households (2.8%) fall into the less than $10,000 income bracket, making it the least populous group.
| Income Bracket | # Households | % Households |
| Less than $10,000 | 26 | 2.8% |
| $10,000 to $14,999 | 124 | 13.4% |
| $15,000 to $24,999 | 203 | 21.9% |
| $25,000 to $34,999 | 81 | 8.8% |
| $35,000 to $49,999 | 106 | 11.5% |
| $50,000 to $74,999 | 157 | 17.0% |
| $75,000 to $99,999 | 110 | 11.9% |
| $100,000 to $149,999 | 54 | 5.8% |
| $150,000 to $199,999 | 29 | 3.1% |
| $200,000+ | 35 | 3.8% |
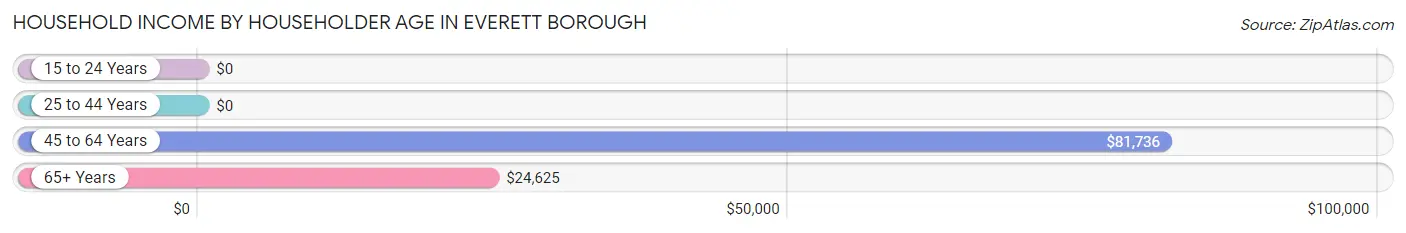
Household Income by Householder Age in Everett borough
The median household income in Everett borough is $37,708, with the highest median household income of $81,736 found in the 45 to 64 years age bracket for the primary householder. A total of 279 households (30.2%) fall into this category. Meanwhile, the 15 to 24 years age bracket for the primary householder has the lowest median household income of $0, with 47 households (5.1%) in this group.
| Income Bracket | # Households | Median Income |
| 15 to 24 Years | 47 (5.1%) | $0 |
| 25 to 44 Years | 282 (30.5%) | $0 |
| 45 to 64 Years | 279 (30.2%) | $81,736 |
| 65+ Years | 317 (34.3%) | $24,625 |
| Total | 925 (100.0%) | $37,708 |
Poverty in Everett borough
Income Below Poverty by Sex and Age in Everett borough
With 24.4% poverty level for males and 24.2% for females among the residents of Everett borough, 5 year old males and under 5 year old females are the most vulnerable to poverty, with 14 males (66.7%) and 62 females (50.0%) in their respective age groups living below the poverty level.
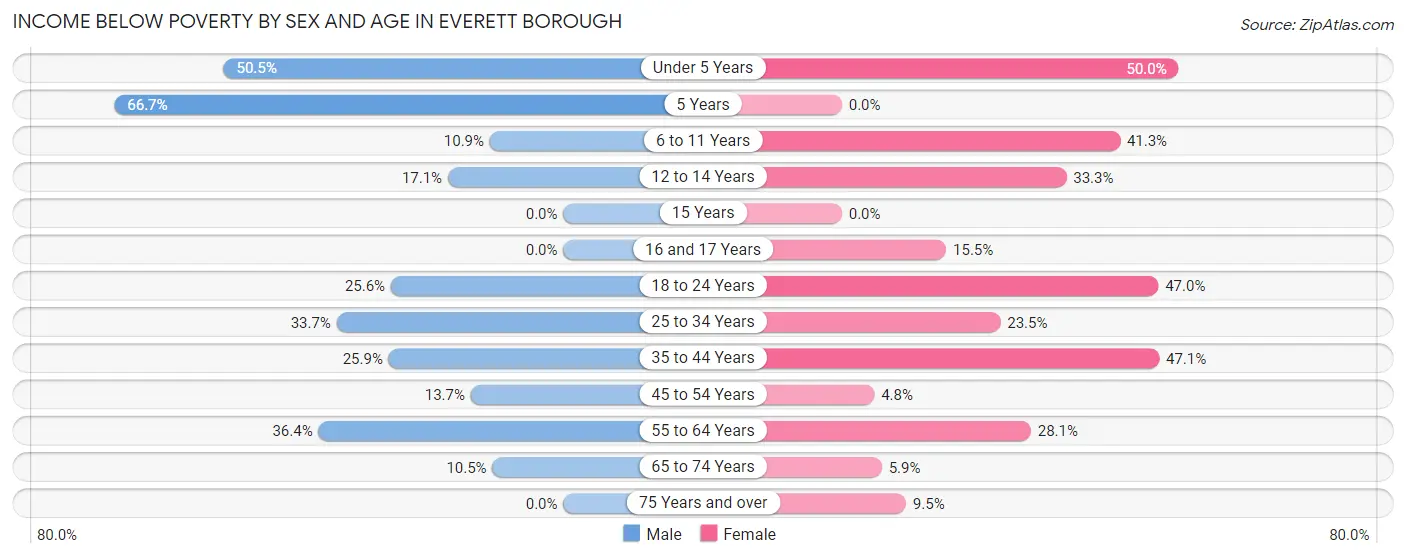
| Age Bracket | Male | Female |
| Under 5 Years | 56 (50.4%) | 62 (50.0%) |
| 5 Years | 14 (66.7%) | 0 (0.0%) |
| 6 to 11 Years | 6 (10.9%) | 19 (41.3%) |
| 12 to 14 Years | 6 (17.1%) | 11 (33.3%) |
| 15 Years | 0 (0.0%) | 0 (0.0%) |
| 16 and 17 Years | 0 (0.0%) | 11 (15.5%) |
| 18 to 24 Years | 32 (25.6%) | 39 (47.0%) |
| 25 to 34 Years | 34 (33.7%) | 40 (23.5%) |
| 35 to 44 Years | 28 (25.9%) | 57 (47.1%) |
| 45 to 54 Years | 25 (13.7%) | 9 (4.8%) |
| 55 to 64 Years | 28 (36.4%) | 16 (28.1%) |
| 65 to 74 Years | 12 (10.5%) | 7 (5.9%) |
| 75 Years and over | 0 (0.0%) | 12 (9.5%) |
| Total | 241 (24.4%) | 283 (24.2%) |
Income Above Poverty by Sex and Age in Everett borough
According to the poverty statistics in Everett borough, males aged 16 and 17 years and females aged 5 years are the age groups that are most secure financially, with 100.0% of males and 100.0% of females in these age groups living above the poverty line.
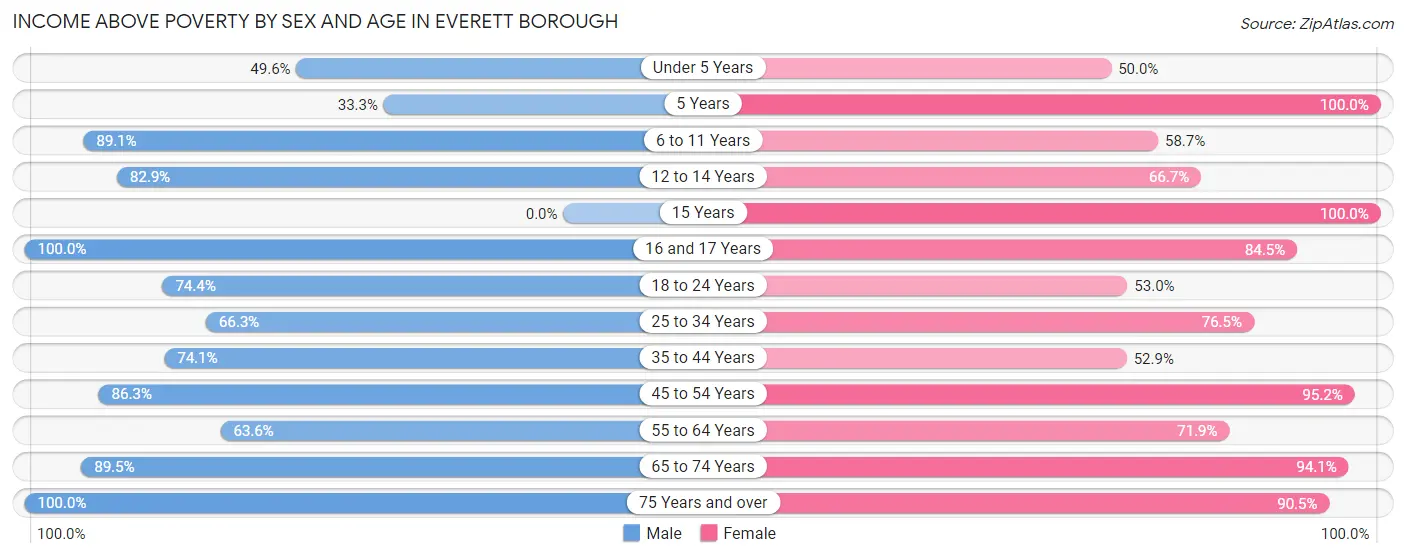
| Age Bracket | Male | Female |
| Under 5 Years | 55 (49.5%) | 62 (50.0%) |
| 5 Years | 7 (33.3%) | 9 (100.0%) |
| 6 to 11 Years | 49 (89.1%) | 27 (58.7%) |
| 12 to 14 Years | 29 (82.9%) | 22 (66.7%) |
| 15 Years | 0 (0.0%) | 23 (100.0%) |
| 16 and 17 Years | 3 (100.0%) | 60 (84.5%) |
| 18 to 24 Years | 93 (74.4%) | 44 (53.0%) |
| 25 to 34 Years | 67 (66.3%) | 130 (76.5%) |
| 35 to 44 Years | 80 (74.1%) | 64 (52.9%) |
| 45 to 54 Years | 157 (86.3%) | 178 (95.2%) |
| 55 to 64 Years | 49 (63.6%) | 41 (71.9%) |
| 65 to 74 Years | 102 (89.5%) | 111 (94.1%) |
| 75 Years and over | 54 (100.0%) | 114 (90.5%) |
| Total | 745 (75.6%) | 885 (75.8%) |
Income Below Poverty Among Married-Couple Families in Everett borough
The poverty statistics for married-couple families in Everett borough show that 14.4% or 45 of the total 312 families live below the poverty line. Families with 1 or 2 children have the highest poverty rate of 18.6%, comprising of 13 families. On the other hand, families with 5 or more children have the lowest poverty rate of 0.0%, which includes 0 families.
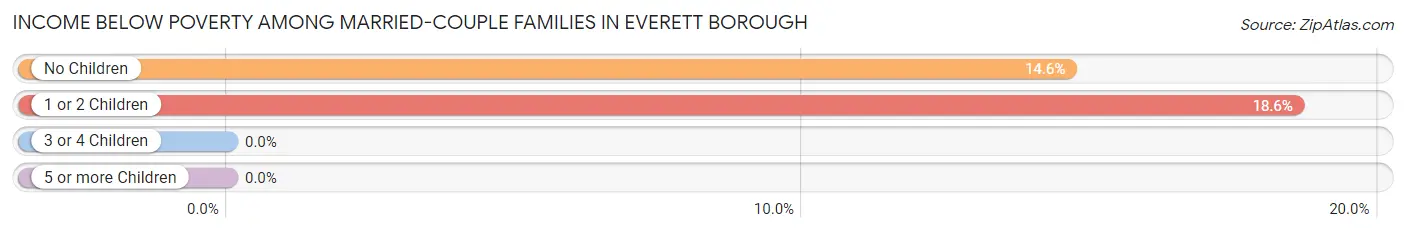
| Children | Above Poverty | Below Poverty |
| No Children | 187 (85.4%) | 32 (14.6%) |
| 1 or 2 Children | 57 (81.4%) | 13 (18.6%) |
| 3 or 4 Children | 0 (0.0%) | 0 (0.0%) |
| 5 or more Children | 23 (100.0%) | 0 (0.0%) |
| Total | 267 (85.6%) | 45 (14.4%) |
Income Below Poverty Among Single-Parent Households in Everett borough
According to the poverty data in Everett borough, 42.2% or 19 single-father households and 29.5% or 51 single-mother households are living below the poverty line. Among single-father households, those with 3 or 4 children have the highest poverty rate, with 13 households (100.0%) experiencing poverty. Likewise, among single-mother households, those with 1 or 2 children have the highest poverty rate, with 51 households (55.4%) falling below the poverty line.
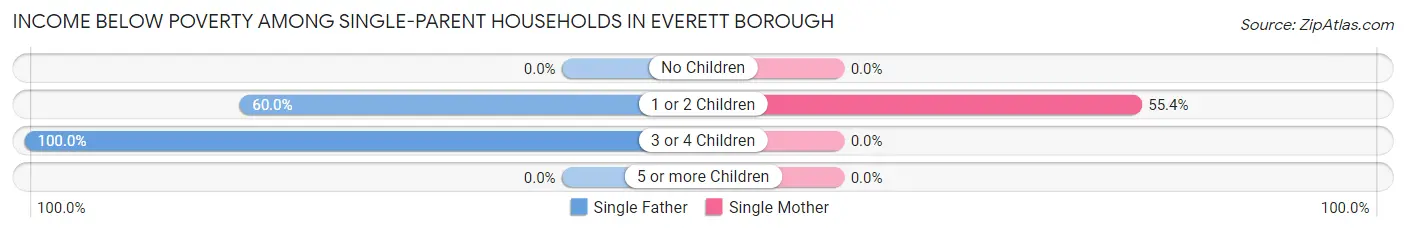
| Children | Single Father | Single Mother |
| No Children | 0 (0.0%) | 0 (0.0%) |
| 1 or 2 Children | 6 (60.0%) | 51 (55.4%) |
| 3 or 4 Children | 13 (100.0%) | 0 (0.0%) |
| 5 or more Children | 0 (0.0%) | 0 (0.0%) |
| Total | 19 (42.2%) | 51 (29.5%) |
Income Below Poverty Among Married-Couple vs Single-Parent Households in Everett borough
The poverty data for Everett borough shows that 45 of the married-couple family households (14.4%) and 70 of the single-parent households (32.1%) are living below the poverty level. Within the married-couple family households, those with 1 or 2 children have the highest poverty rate, with 13 households (18.6%) falling below the poverty line. Among the single-parent households, those with 1 or 2 children have the highest poverty rate, with 57 household (55.9%) living below poverty.
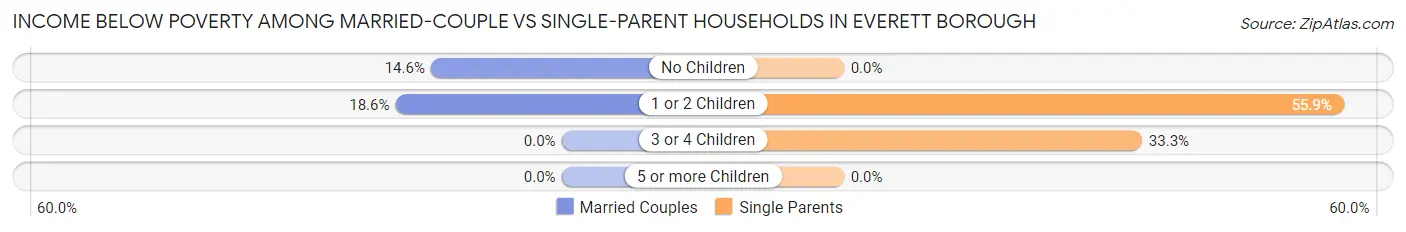
| Children | Married-Couple Families | Single-Parent Households |
| No Children | 32 (14.6%) | 0 (0.0%) |
| 1 or 2 Children | 13 (18.6%) | 57 (55.9%) |
| 3 or 4 Children | 0 (0.0%) | 13 (33.3%) |
| 5 or more Children | 0 (0.0%) | 0 (0.0%) |
| Total | 45 (14.4%) | 70 (32.1%) |
Race in Everett borough
The most populous races in Everett borough are White / Caucasian (2,059 | 95.6%), Hispanic or Latino (60 | 2.8%), and Black / African American (34 | 1.6%).
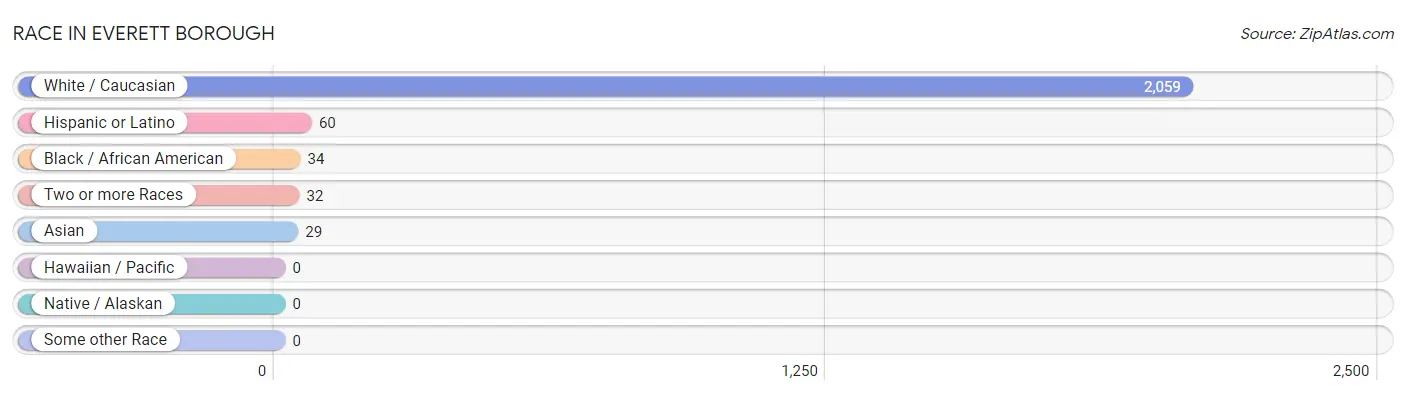
| Race | # Population | % Population |
| Asian | 29 | 1.3% |
| Black / African American | 34 | 1.6% |
| Hawaiian / Pacific | 0 | 0.0% |
| Hispanic or Latino | 60 | 2.8% |
| Native / Alaskan | 0 | 0.0% |
| White / Caucasian | 2,059 | 95.6% |
| Two or more Races | 32 | 1.5% |
| Some other Race | 0 | 0.0% |
| Total | 2,154 | 100.0% |
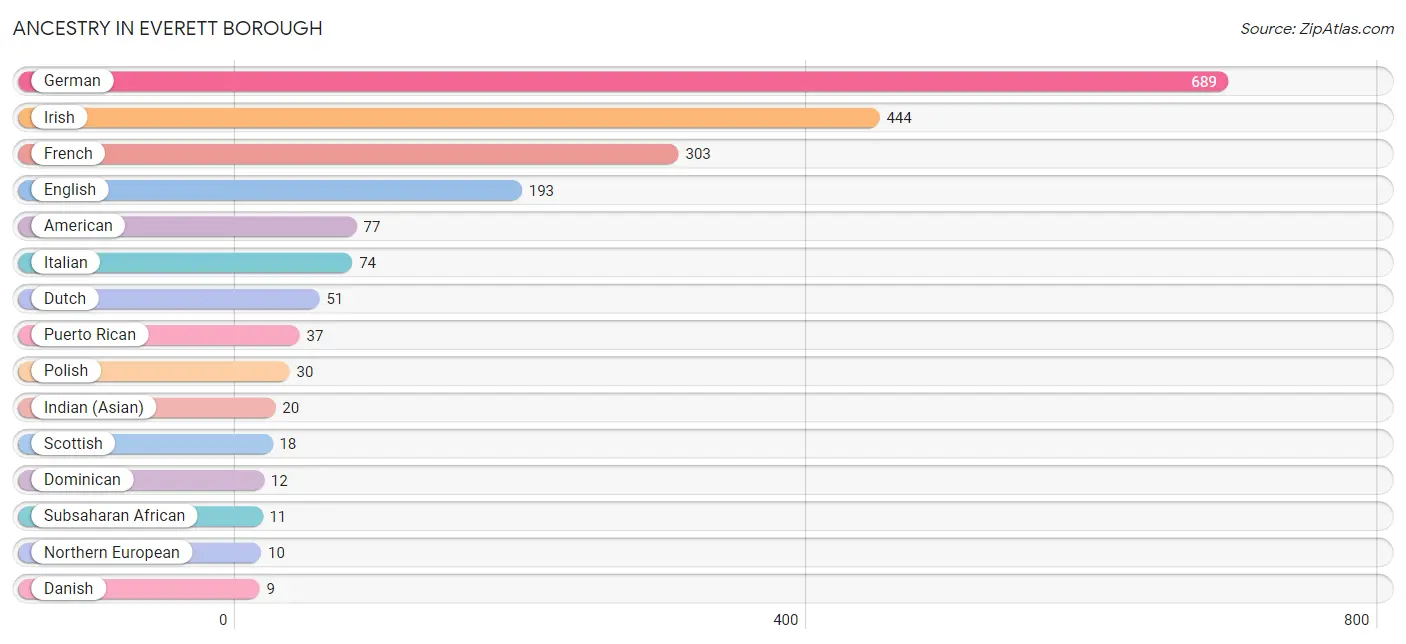
Ancestry in Everett borough
The most populous ancestries reported in Everett borough are German (689 | 32.0%), Irish (444 | 20.6%), French (303 | 14.1%), English (193 | 9.0%), and American (77 | 3.6%), together accounting for 79.2% of all Everett borough residents.
| Ancestry | # Population | % Population |
| African | 4 | 0.2% |
| American | 77 | 3.6% |
| Cuban | 6 | 0.3% |
| Czech | 7 | 0.3% |
| Danish | 9 | 0.4% |
| Dominican | 12 | 0.6% |
| Dutch | 51 | 2.4% |
| Eastern European | 4 | 0.2% |
| English | 193 | 9.0% |
| European | 6 | 0.3% |
| French | 303 | 14.1% |
| German | 689 | 32.0% |
| Indian (Asian) | 20 | 0.9% |
| Irish | 444 | 20.6% |
| Italian | 74 | 3.4% |
| Lithuanian | 6 | 0.3% |
| Mexican | 5 | 0.2% |
| Nigerian | 7 | 0.3% |
| Northern European | 10 | 0.5% |
| Pennsylvania German | 4 | 0.2% |
| Polish | 30 | 1.4% |
| Puerto Rican | 37 | 1.7% |
| Russian | 5 | 0.2% |
| Scotch-Irish | 6 | 0.3% |
| Scottish | 18 | 0.8% |
| Sri Lankan | 9 | 0.4% |
| Subsaharan African | 11 | 0.5% |
| Swedish | 5 | 0.2% |
| Swiss | 6 | 0.3% |
| Ukrainian | 7 | 0.3% |
| Welsh | 6 | 0.3% | View All 31 Rows |
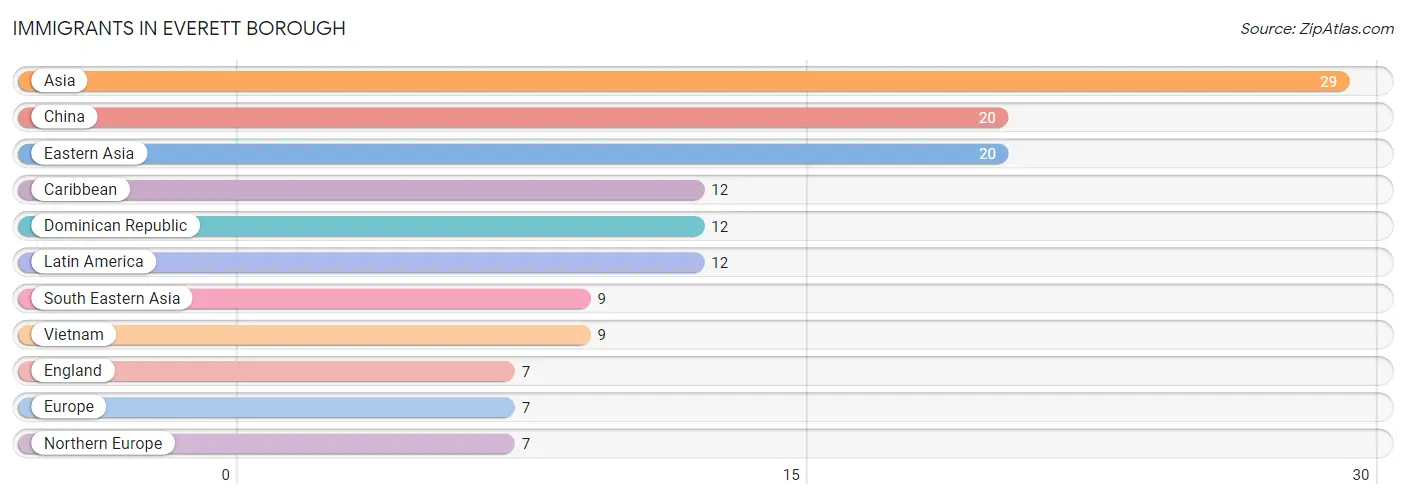
Immigrants in Everett borough
The most numerous immigrant groups reported in Everett borough came from Asia (29 | 1.3%), China (20 | 0.9%), Eastern Asia (20 | 0.9%), Caribbean (12 | 0.6%), and Dominican Republic (12 | 0.6%), together accounting for 4.3% of all Everett borough residents.
| Immigration Origin | # Population | % Population |
| Asia | 29 | 1.3% |
| Caribbean | 12 | 0.6% |
| China | 20 | 0.9% |
| Dominican Republic | 12 | 0.6% |
| Eastern Asia | 20 | 0.9% |
| England | 7 | 0.3% |
| Europe | 7 | 0.3% |
| Latin America | 12 | 0.6% |
| Northern Europe | 7 | 0.3% |
| South Eastern Asia | 9 | 0.4% |
| Vietnam | 9 | 0.4% | View All 11 Rows |
Sex and Age in Everett borough
Sex and Age in Everett borough
The most populous age groups in Everett borough are 45 to 49 Years (122 | 12.4%) for men and Under 5 Years (124 | 10.6%) for women.
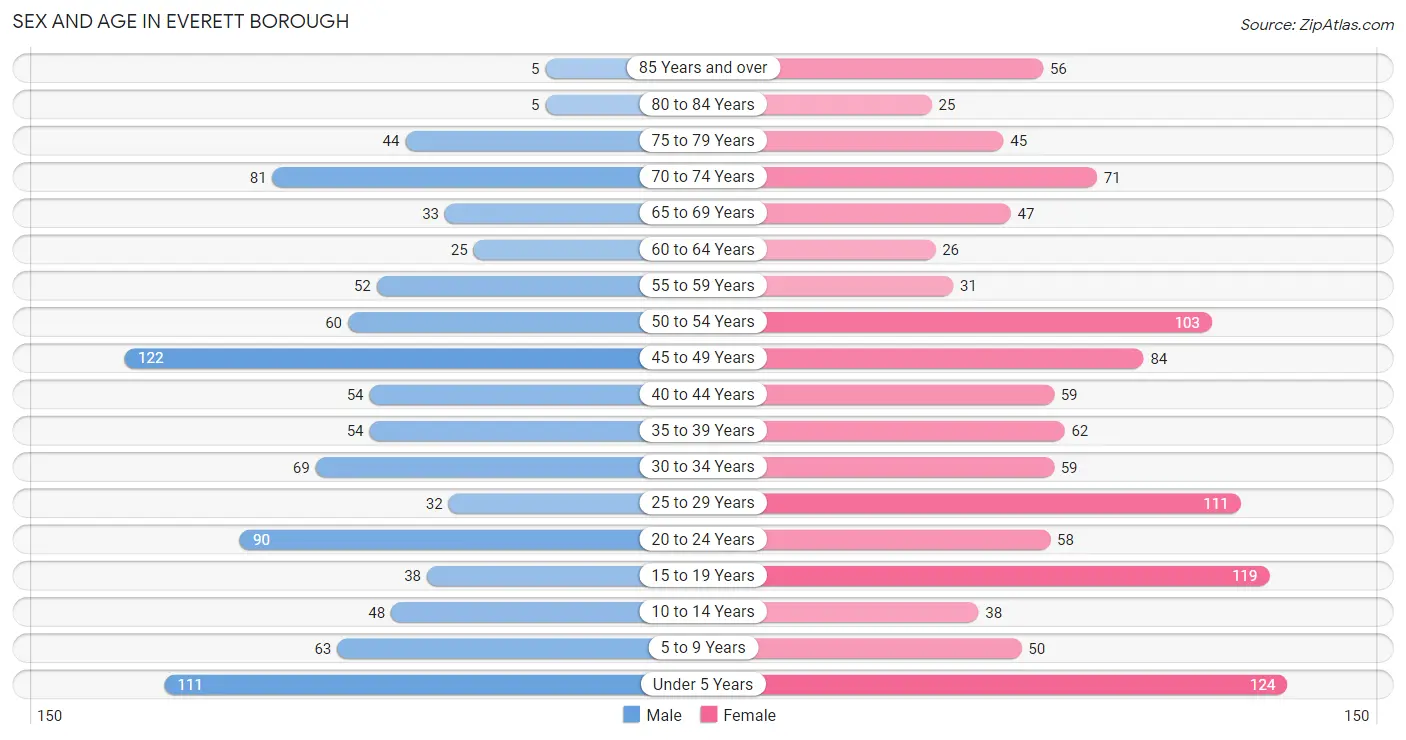
| Age Bracket | Male | Female |
| Under 5 Years | 111 (11.3%) | 124 (10.6%) |
| 5 to 9 Years | 63 (6.4%) | 50 (4.3%) |
| 10 to 14 Years | 48 (4.9%) | 38 (3.3%) |
| 15 to 19 Years | 38 (3.8%) | 119 (10.2%) |
| 20 to 24 Years | 90 (9.1%) | 58 (5.0%) |
| 25 to 29 Years | 32 (3.3%) | 111 (9.5%) |
| 30 to 34 Years | 69 (7.0%) | 59 (5.1%) |
| 35 to 39 Years | 54 (5.5%) | 62 (5.3%) |
| 40 to 44 Years | 54 (5.5%) | 59 (5.1%) |
| 45 to 49 Years | 122 (12.4%) | 84 (7.2%) |
| 50 to 54 Years | 60 (6.1%) | 103 (8.8%) |
| 55 to 59 Years | 52 (5.3%) | 31 (2.6%) |
| 60 to 64 Years | 25 (2.5%) | 26 (2.2%) |
| 65 to 69 Years | 33 (3.4%) | 47 (4.0%) |
| 70 to 74 Years | 81 (8.2%) | 71 (6.1%) |
| 75 to 79 Years | 44 (4.5%) | 45 (3.8%) |
| 80 to 84 Years | 5 (0.5%) | 25 (2.1%) |
| 85 Years and over | 5 (0.5%) | 56 (4.8%) |
| Total | 986 (100.0%) | 1,168 (100.0%) |
Families and Households in Everett borough
Median Family Size in Everett borough
The median family size in Everett borough is 3.03 persons per family, with single male/father families (45 | 8.5%) accounting for the largest median family size of 3.22 persons per family. On the other hand, married-couple families (312 | 58.9%) represent the smallest median family size with 2.97 persons per family.
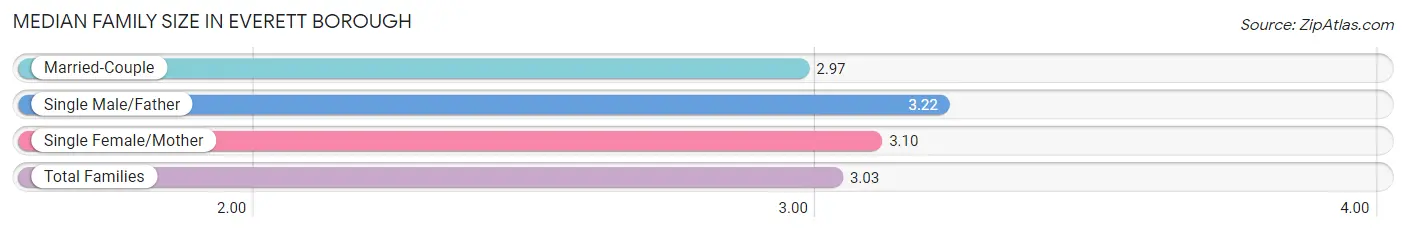
| Family Type | # Families | Family Size |
| Married-Couple | 312 (58.9%) | 2.97 |
| Single Male/Father | 45 (8.5%) | 3.22 |
| Single Female/Mother | 173 (32.6%) | 3.10 |
| Total Families | 530 (100.0%) | 3.03 |
Median Household Size in Everett borough
The median household size in Everett borough is 2.32 persons per household, with single male/father households (45 | 4.9%) accounting for the largest median household size of 3.84 persons per household. non-family households (395 | 42.7%) represent the smallest median household size with 1.13 persons per household.
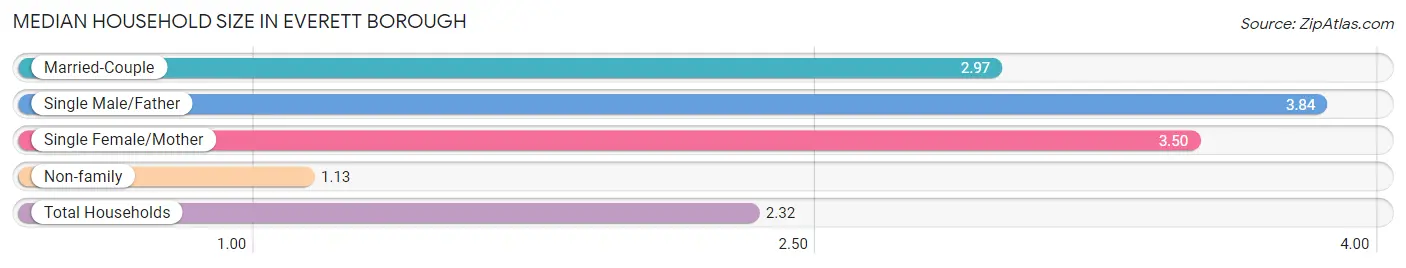
| Household Type | # Households | Household Size |
| Married-Couple | 312 (33.7%) | 2.97 |
| Single Male/Father | 45 (4.9%) | 3.84 |
| Single Female/Mother | 173 (18.7%) | 3.50 |
| Non-family | 395 (42.7%) | 1.13 |
| Total Households | 925 (100.0%) | 2.32 |
Household Size by Marriage Status in Everett borough
Out of a total of 925 households in Everett borough, 530 (57.3%) are family households, while 395 (42.7%) are nonfamily households. The most numerous type of family households are 2-person households, comprising 234, and the most common type of nonfamily households are 1-person households, comprising 366.
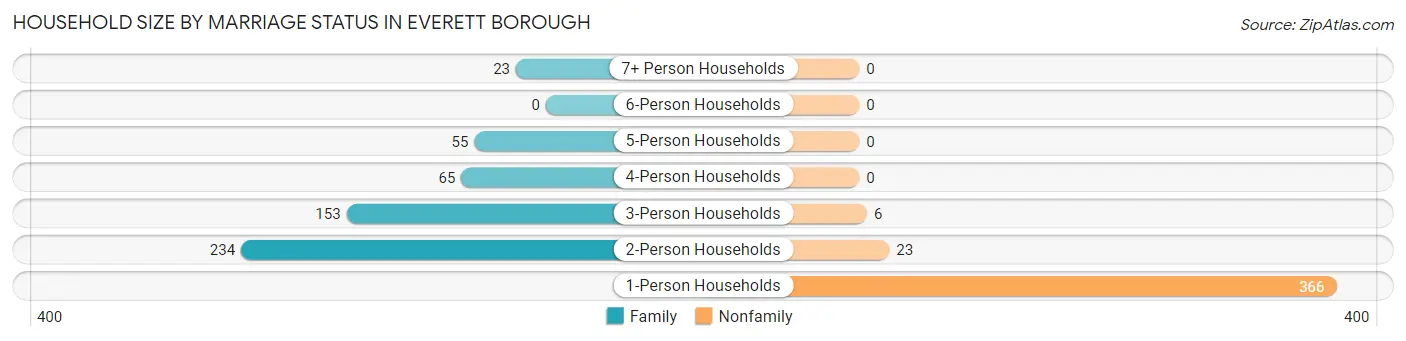
| Household Size | Family Households | Nonfamily Households |
| 1-Person Households | - | 366 (39.6%) |
| 2-Person Households | 234 (25.3%) | 23 (2.5%) |
| 3-Person Households | 153 (16.5%) | 6 (0.6%) |
| 4-Person Households | 65 (7.0%) | 0 (0.0%) |
| 5-Person Households | 55 (5.9%) | 0 (0.0%) |
| 6-Person Households | 0 (0.0%) | 0 (0.0%) |
| 7+ Person Households | 23 (2.5%) | 0 (0.0%) |
| Total | 530 (57.3%) | 395 (42.7%) |
Female Fertility in Everett borough
Fertility by Age in Everett borough
Average fertility rate in Everett borough is 82.0 births per 1,000 women. Women in the age bracket of 20 to 34 years have the highest fertility rate with 123.0 births per 1,000 women. Women in the age bracket of 20 to 34 years acount for 59.6% of all women with births.
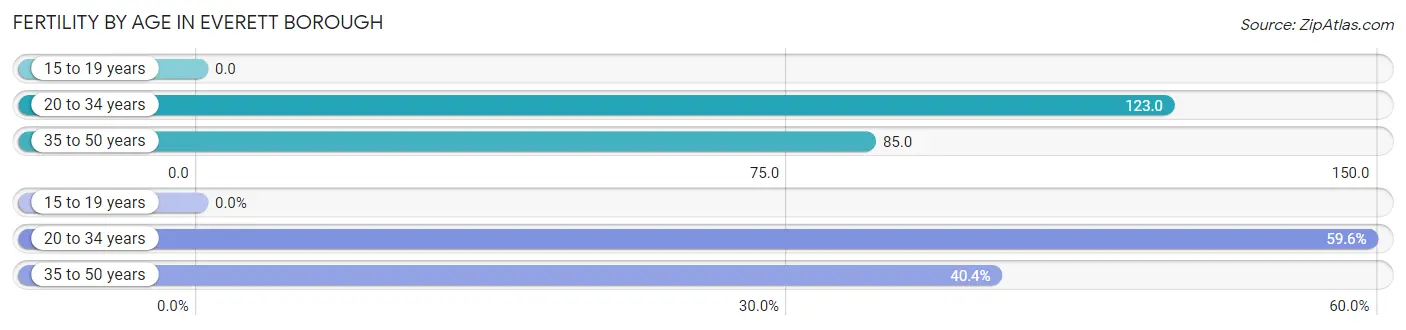
| Age Bracket | Women with Births | Births / 1,000 Women |
| 15 to 19 years | 0 (0.0%) | 0.0 |
| 20 to 34 years | 28 (59.6%) | 123.0 |
| 35 to 50 years | 19 (40.4%) | 85.0 |
| Total | 47 (100.0%) | 82.0 |
Fertility by Age by Marriage Status in Everett borough
42.6% of women with births (47) in Everett borough are married. The highest percentage of unmarried women with births falls into 35 to 50 years age bracket with 100.0% of them unmarried at the time of birth, while the lowest percentage of unmarried women with births belong to 20 to 34 years age bracket with 28.6% of them unmarried.
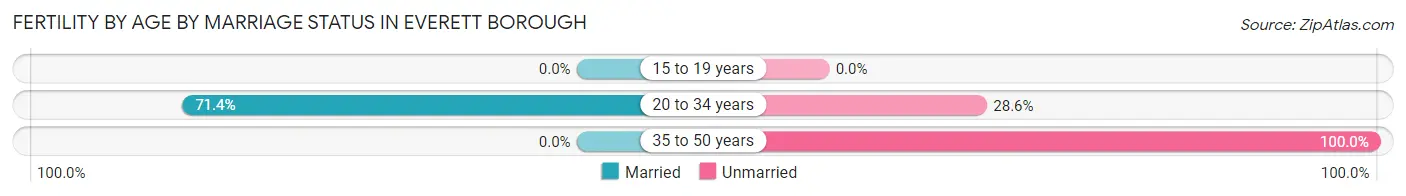
| Age Bracket | Married | Unmarried |
| 15 to 19 years | 0 (0.0%) | 0 (0.0%) |
| 20 to 34 years | 20 (71.4%) | 8 (28.6%) |
| 35 to 50 years | 0 (0.0%) | 19 (100.0%) |
| Total | 20 (42.5%) | 27 (57.5%) |
Fertility by Education in Everett borough
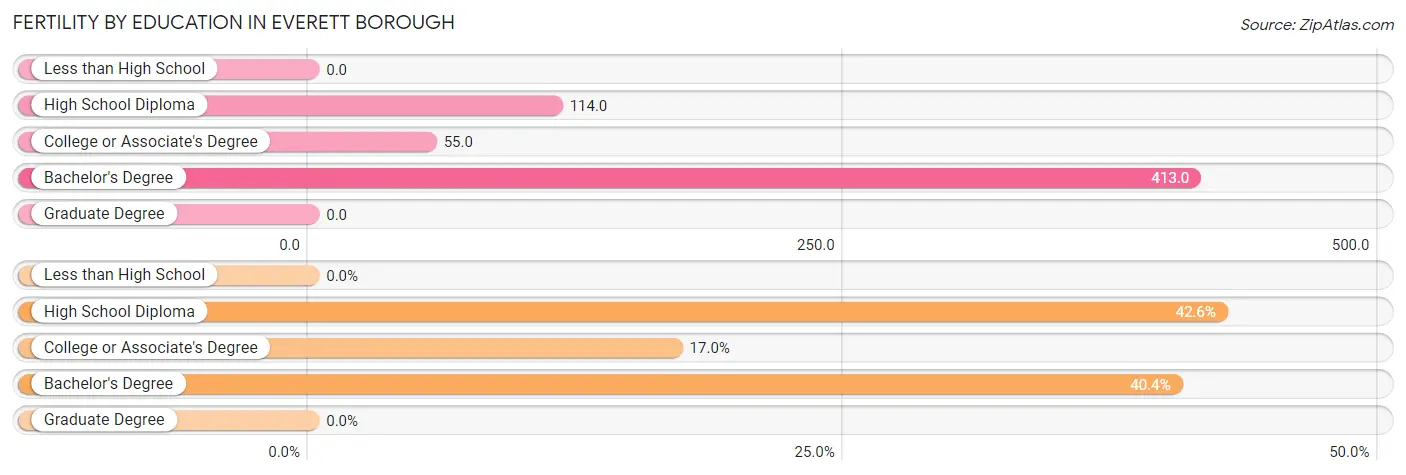
| Educational Attainment | Women with Births | Births / 1,000 Women |
| Less than High School | 0 (0.0%) | 0.0 |
| High School Diploma | 20 (42.5%) | 114.0 |
| College or Associate's Degree | 8 (17.0%) | 55.0 |
| Bachelor's Degree | 19 (40.4%) | 413.0 |
| Graduate Degree | 0 (0.0%) | 0.0 |
| Total | 47 (100.0%) | 82.0 |
Fertility by Education by Marriage Status in Everett borough
57.5% of women with births in Everett borough are unmarried. Women with the educational attainment of high school diploma are most likely to be married with 100.0% of them married at childbirth, while women with the educational attainment of college or associate's degree are least likely to be married with 100.0% of them unmarried at childbirth.
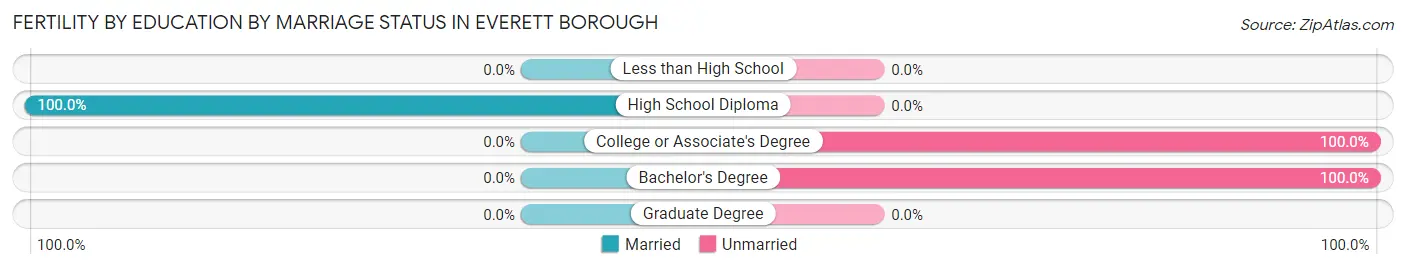
| Educational Attainment | Married | Unmarried |
| Less than High School | 0 (0.0%) | 0 (0.0%) |
| High School Diploma | 20 (100.0%) | 0 (0.0%) |
| College or Associate's Degree | 0 (0.0%) | 8 (100.0%) |
| Bachelor's Degree | 0 (0.0%) | 19 (100.0%) |
| Graduate Degree | 0 (0.0%) | 0 (0.0%) |
| Total | 20 (42.5%) | 27 (57.5%) |
Employment Characteristics in Everett borough
Employment by Class of Employer in Everett borough
Among the 926 employed individuals in Everett borough, private company employees (672 | 72.6%), not-for-profit organizations (90 | 9.7%), and local government employees (56 | 6.0%) make up the most common classes of employment.
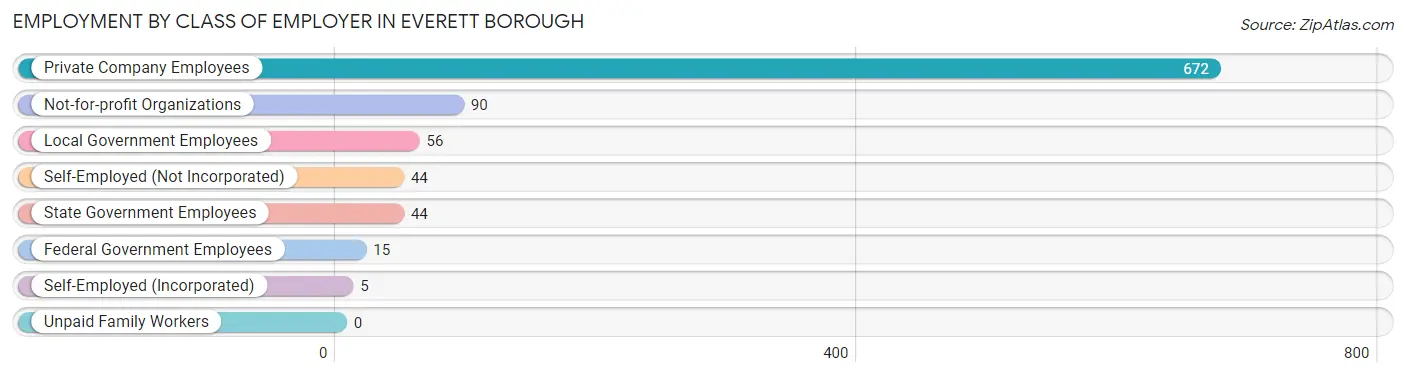
| Employer Class | # Employees | % Employees |
| Private Company Employees | 672 | 72.6% |
| Self-Employed (Incorporated) | 5 | 0.5% |
| Self-Employed (Not Incorporated) | 44 | 4.8% |
| Not-for-profit Organizations | 90 | 9.7% |
| Local Government Employees | 56 | 6.0% |
| State Government Employees | 44 | 4.8% |
| Federal Government Employees | 15 | 1.6% |
| Unpaid Family Workers | 0 | 0.0% |
| Total | 926 | 100.0% |
Employment Status by Age in Everett borough
According to the labor force statistics for Everett borough, out of the total population over 16 years of age (1,697), 58.7% or 996 individuals are in the labor force, with 6.6% or 66 of them unemployed. The age group with the highest labor force participation rate is 25 to 29 years, with 96.5% or 138 individuals in the labor force. Within the labor force, the 20 to 24 years age range has the highest percentage of unemployed individuals, with 34.6% or 36 of them being unemployed.
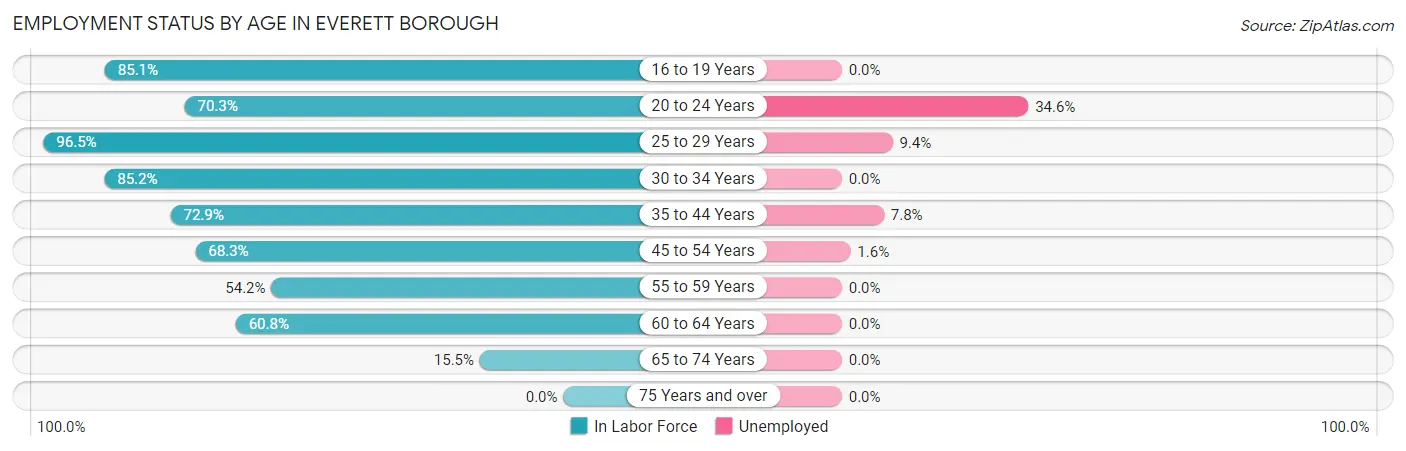
| Age Bracket | In Labor Force | Unemployed |
| 16 to 19 Years | 114 (85.1%) | 0 (0.0%) |
| 20 to 24 Years | 104 (70.3%) | 36 (34.6%) |
| 25 to 29 Years | 138 (96.5%) | 13 (9.4%) |
| 30 to 34 Years | 109 (85.2%) | 0 (0.0%) |
| 35 to 44 Years | 167 (72.9%) | 13 (7.8%) |
| 45 to 54 Years | 252 (68.3%) | 4 (1.6%) |
| 55 to 59 Years | 45 (54.2%) | 0 (0.0%) |
| 60 to 64 Years | 31 (60.8%) | 0 (0.0%) |
| 65 to 74 Years | 36 (15.5%) | 0 (0.0%) |
| 75 Years and over | 0 (0.0%) | 0 (0.0%) |
| Total | 996 (58.7%) | 66 (6.6%) |
Employment Status by Educational Attainment in Everett borough
According to labor force statistics for Everett borough, 74.0% of individuals (742) out of the total population between 25 and 64 years of age (1,003) are in the labor force, with 4.0% or 30 of them being unemployed. The group with the highest labor force participation rate are those with the educational attainment of bachelor's degree or higher, with 95.0% or 133 individuals in the labor force. Within the labor force, individuals with bachelor's degree or higher education have the highest percentage of unemployment, with 9.8% or 13 of them being unemployed.
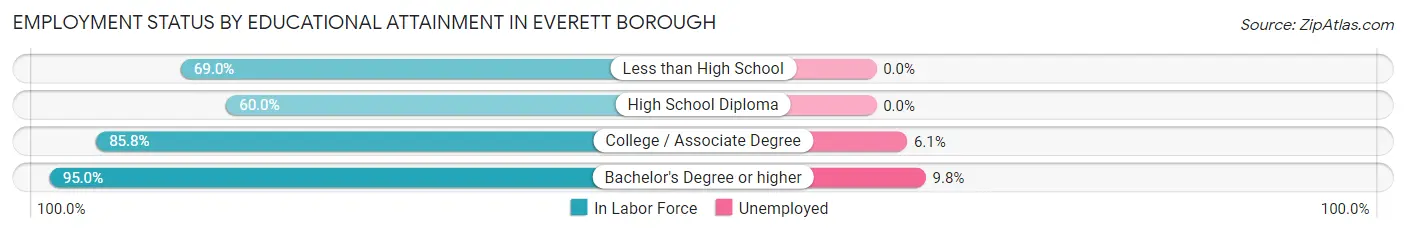
| Educational Attainment | In Labor Force | Unemployed |
| Less than High School | 58 (69.0%) | 0 (0.0%) |
| High School Diploma | 273 (60.0%) | 0 (0.0%) |
| College / Associate Degree | 278 (85.8%) | 20 (6.1%) |
| Bachelor's Degree or higher | 133 (95.0%) | 14 (9.8%) |
| Total | 742 (74.0%) | 40 (4.0%) |
Employment Occupations by Sex in Everett borough
Management, Business, Science and Arts Occupations
The most common Management, Business, Science and Arts occupations in Everett borough are Community & Social Service (99 | 10.6%), Education, Arts & Media (61 | 6.6%), Health Diagnosing & Treating (40 | 4.3%), Education Instruction & Library (33 | 3.5%), and Computers, Engineering & Science (31 | 3.3%).
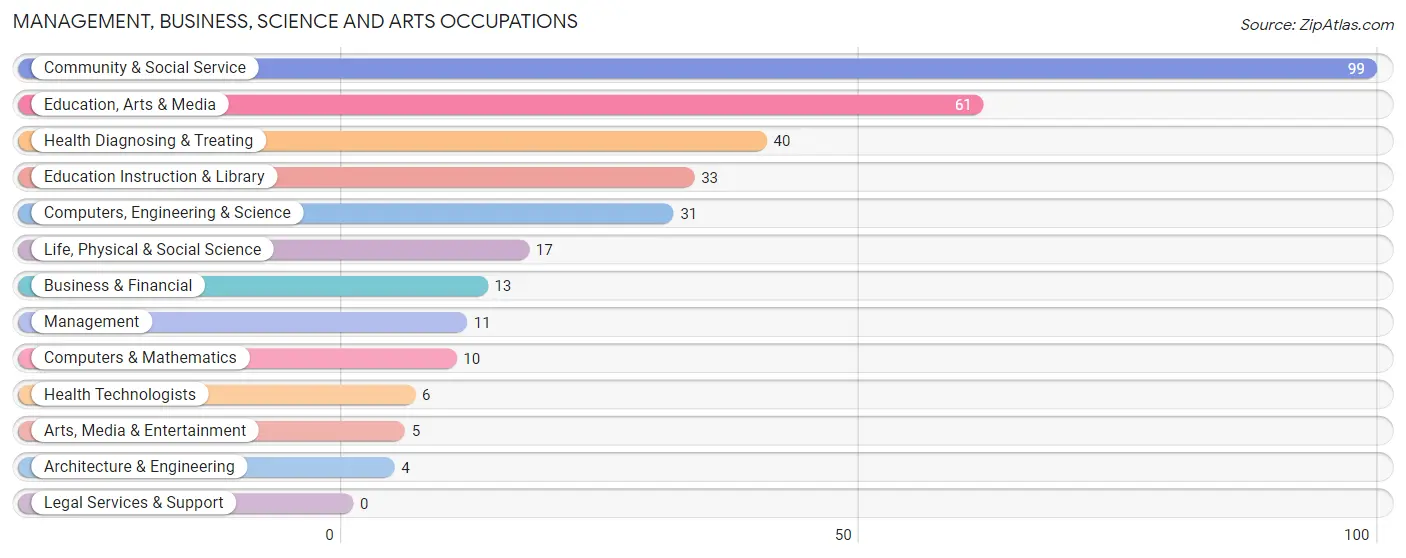
Management, Business, Science and Arts Occupations by Sex
Within the Management, Business, Science and Arts occupations in Everett borough, the most male-oriented occupations are Management (100.0%), Business & Financial (100.0%), and Architecture & Engineering (100.0%), while the most female-oriented occupations are Computers & Mathematics (100.0%), Life, Physical & Social Science (100.0%), and Education Instruction & Library (100.0%).
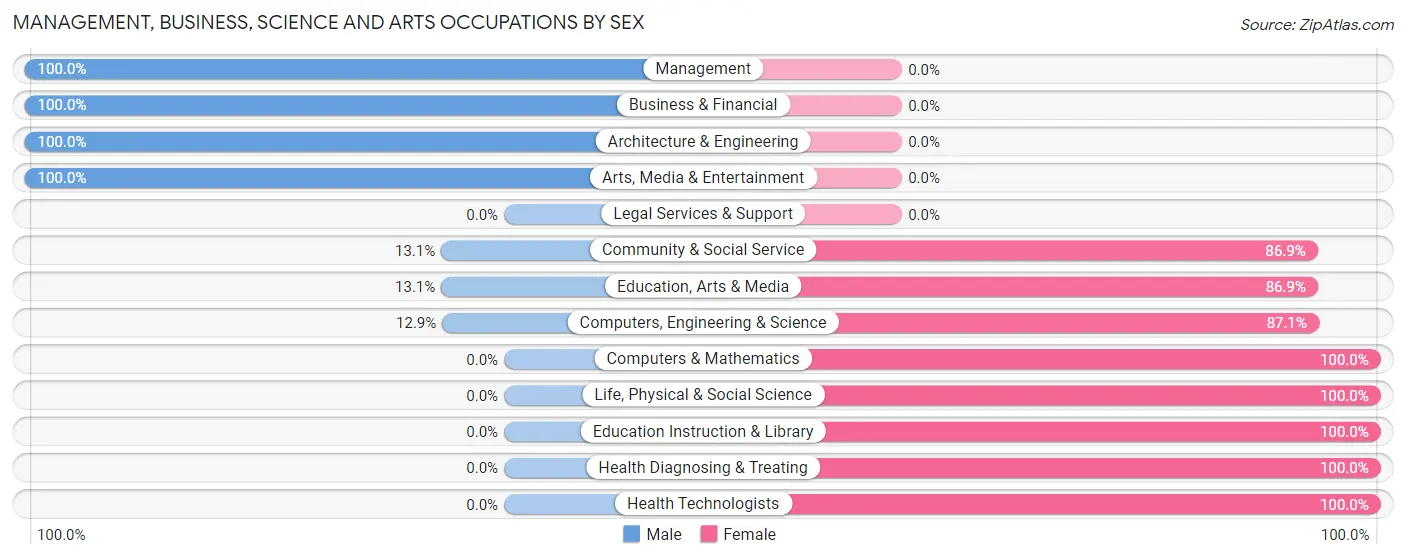
| Occupation | Male | Female |
| Management | 11 (100.0%) | 0 (0.0%) |
| Business & Financial | 13 (100.0%) | 0 (0.0%) |
| Computers, Engineering & Science | 4 (12.9%) | 27 (87.1%) |
| Computers & Mathematics | 0 (0.0%) | 10 (100.0%) |
| Architecture & Engineering | 4 (100.0%) | 0 (0.0%) |
| Life, Physical & Social Science | 0 (0.0%) | 17 (100.0%) |
| Community & Social Service | 13 (13.1%) | 86 (86.9%) |
| Education, Arts & Media | 8 (13.1%) | 53 (86.9%) |
| Legal Services & Support | 0 (0.0%) | 0 (0.0%) |
| Education Instruction & Library | 0 (0.0%) | 33 (100.0%) |
| Arts, Media & Entertainment | 5 (100.0%) | 0 (0.0%) |
| Health Diagnosing & Treating | 0 (0.0%) | 40 (100.0%) |
| Health Technologists | 0 (0.0%) | 6 (100.0%) |
| Total (Category) | 41 (21.1%) | 153 (78.9%) |
| Total (Overall) | 427 (45.9%) | 503 (54.1%) |
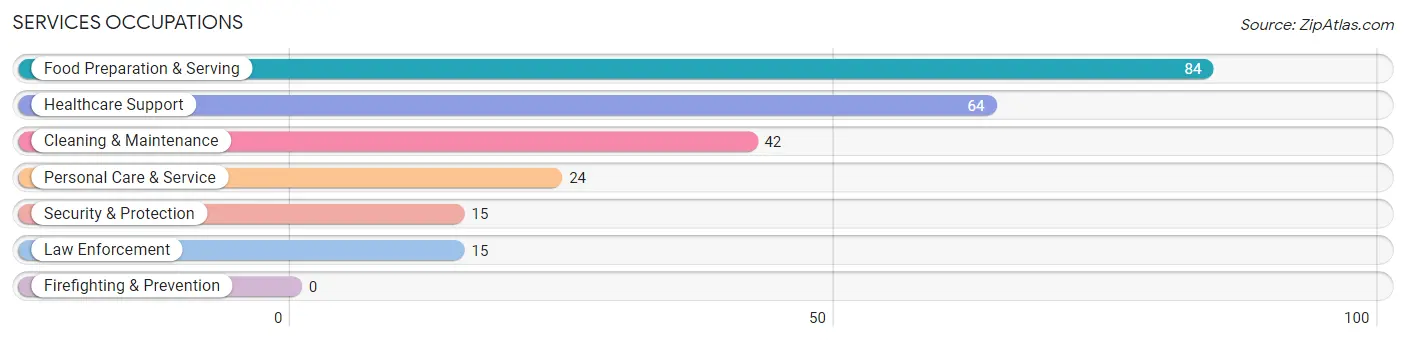
Services Occupations
The most common Services occupations in Everett borough are Food Preparation & Serving (84 | 9.0%), Healthcare Support (64 | 6.9%), Cleaning & Maintenance (42 | 4.5%), Personal Care & Service (24 | 2.6%), and Security & Protection (15 | 1.6%).
Services Occupations by Sex
Within the Services occupations in Everett borough, the most male-oriented occupations are Security & Protection (100.0%), Law Enforcement (100.0%), and Cleaning & Maintenance (64.3%), while the most female-oriented occupations are Healthcare Support (100.0%), Food Preparation & Serving (84.5%), and Personal Care & Service (54.2%).
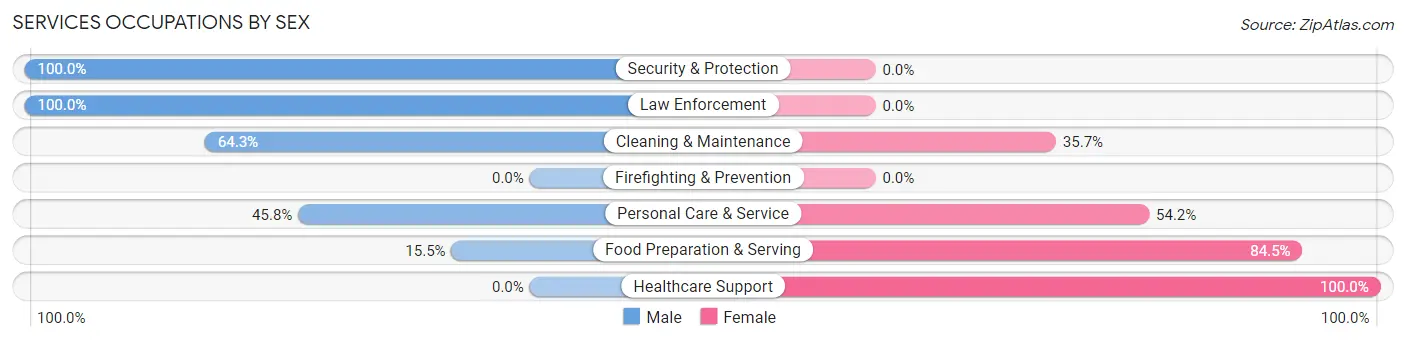
| Occupation | Male | Female |
| Healthcare Support | 0 (0.0%) | 64 (100.0%) |
| Security & Protection | 15 (100.0%) | 0 (0.0%) |
| Firefighting & Prevention | 0 (0.0%) | 0 (0.0%) |
| Law Enforcement | 15 (100.0%) | 0 (0.0%) |
| Food Preparation & Serving | 13 (15.5%) | 71 (84.5%) |
| Cleaning & Maintenance | 27 (64.3%) | 15 (35.7%) |
| Personal Care & Service | 11 (45.8%) | 13 (54.2%) |
| Total (Category) | 66 (28.8%) | 163 (71.2%) |
| Total (Overall) | 427 (45.9%) | 503 (54.1%) |
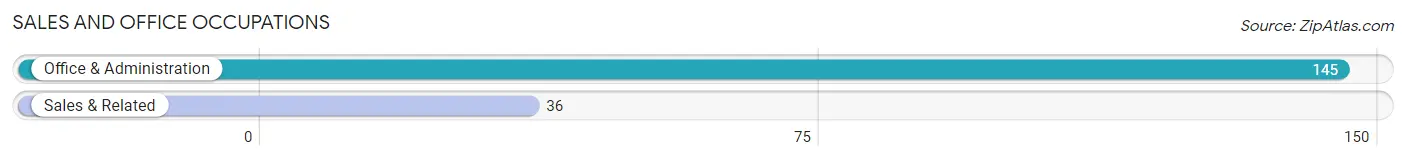
Sales and Office Occupations
The most common Sales and Office occupations in Everett borough are Office & Administration (145 | 15.6%), and Sales & Related (36 | 3.9%).
Sales and Office Occupations by Sex
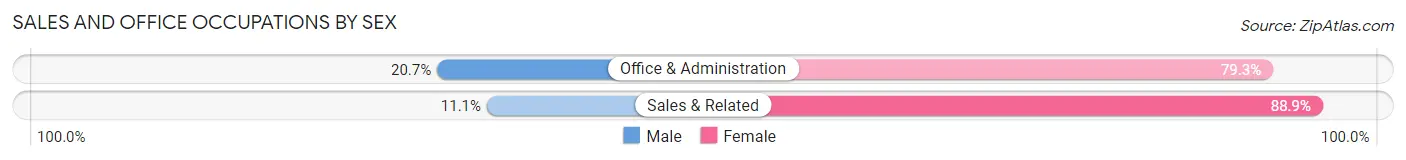
| Occupation | Male | Female |
| Sales & Related | 4 (11.1%) | 32 (88.9%) |
| Office & Administration | 30 (20.7%) | 115 (79.3%) |
| Total (Category) | 34 (18.8%) | 147 (81.2%) |
| Total (Overall) | 427 (45.9%) | 503 (54.1%) |
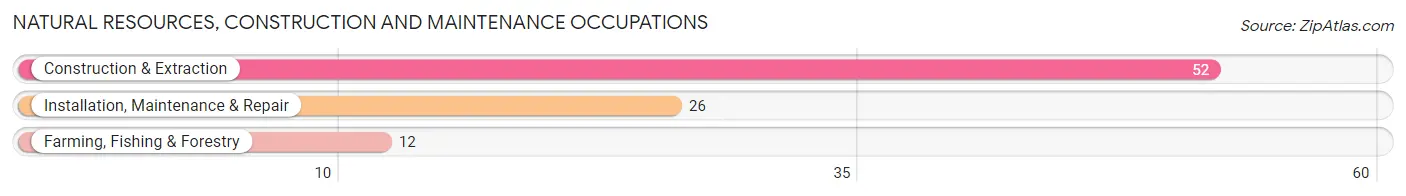
Natural Resources, Construction and Maintenance Occupations
The most common Natural Resources, Construction and Maintenance occupations in Everett borough are Construction & Extraction (52 | 5.6%), Installation, Maintenance & Repair (26 | 2.8%), and Farming, Fishing & Forestry (12 | 1.3%).
Natural Resources, Construction and Maintenance Occupations by Sex
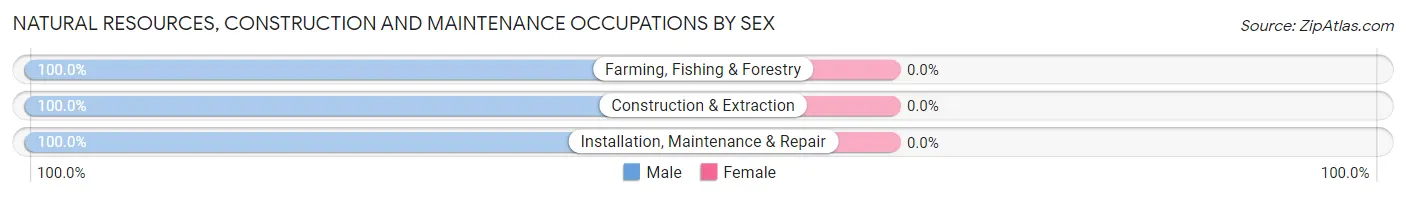
| Occupation | Male | Female |
| Farming, Fishing & Forestry | 12 (100.0%) | 0 (0.0%) |
| Construction & Extraction | 52 (100.0%) | 0 (0.0%) |
| Installation, Maintenance & Repair | 26 (100.0%) | 0 (0.0%) |
| Total (Category) | 90 (100.0%) | 0 (0.0%) |
| Total (Overall) | 427 (45.9%) | 503 (54.1%) |
Production, Transportation and Moving Occupations
The most common Production, Transportation and Moving occupations in Everett borough are Production (112 | 12.0%), Material Moving (105 | 11.3%), and Transportation (19 | 2.0%).
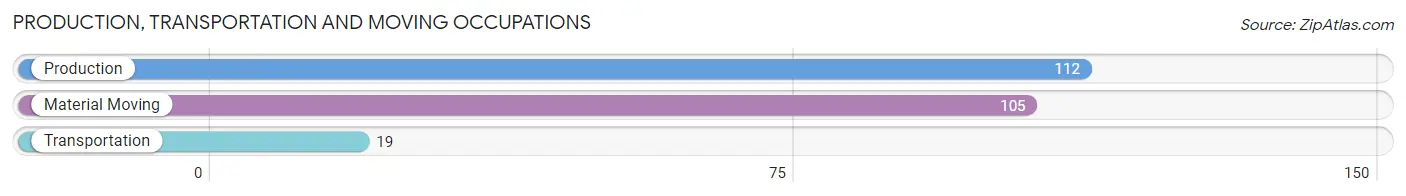
Production, Transportation and Moving Occupations by Sex
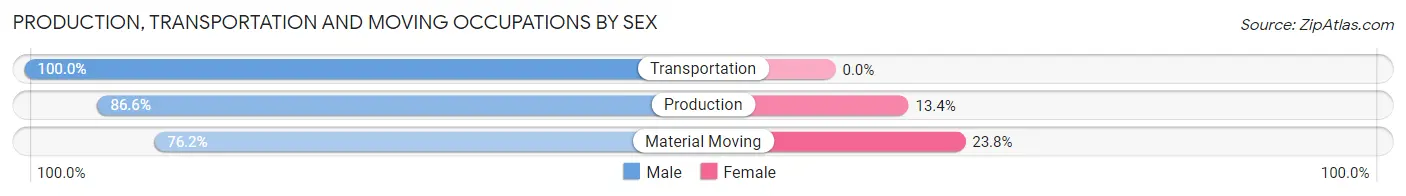
| Occupation | Male | Female |
| Production | 97 (86.6%) | 15 (13.4%) |
| Transportation | 19 (100.0%) | 0 (0.0%) |
| Material Moving | 80 (76.2%) | 25 (23.8%) |
| Total (Category) | 196 (83.1%) | 40 (17.0%) |
| Total (Overall) | 427 (45.9%) | 503 (54.1%) |
Employment Industries by Sex in Everett borough
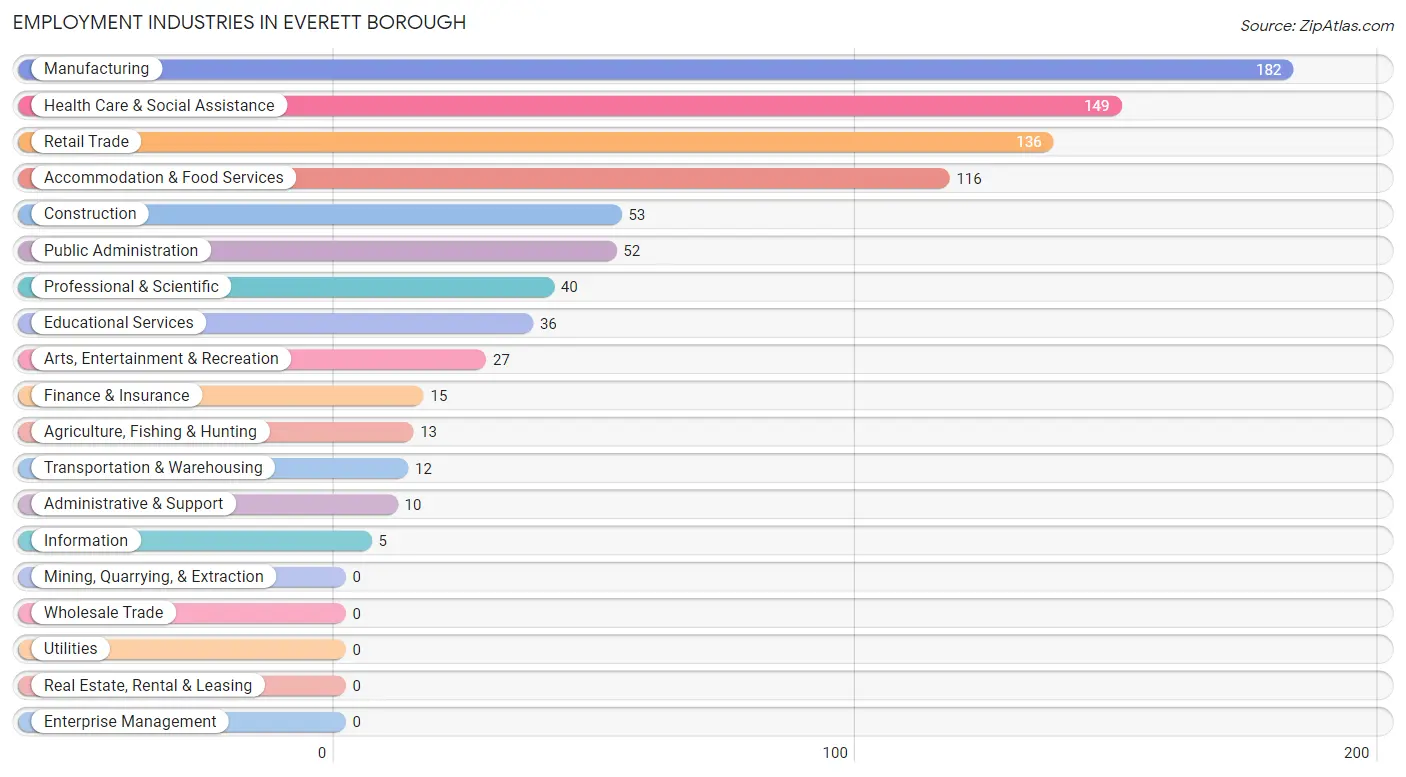
Employment Industries in Everett borough
The major employment industries in Everett borough include Manufacturing (182 | 19.6%), Health Care & Social Assistance (149 | 16.0%), Retail Trade (136 | 14.6%), Accommodation & Food Services (116 | 12.5%), and Construction (53 | 5.7%).
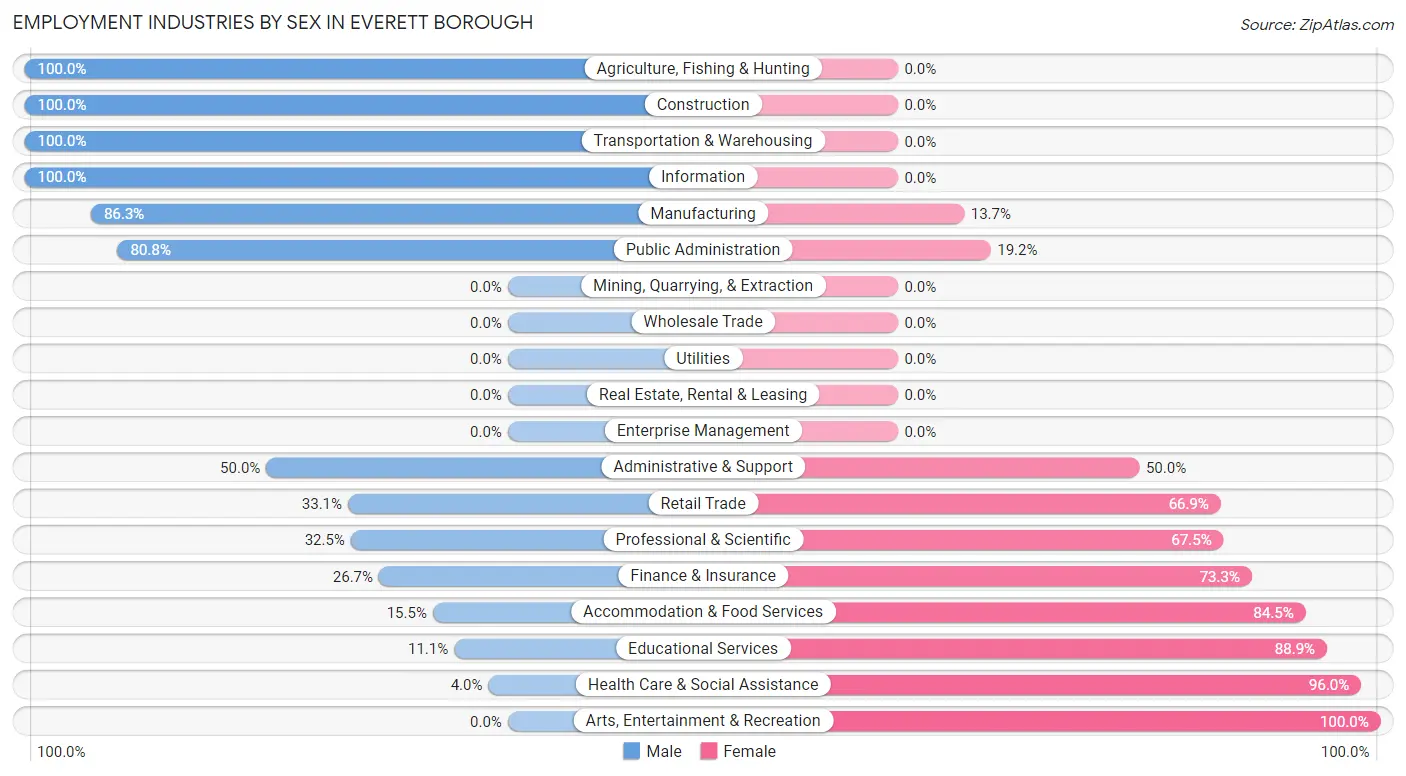
Employment Industries by Sex in Everett borough
The Everett borough industries that see more men than women are Agriculture, Fishing & Hunting (100.0%), Construction (100.0%), and Transportation & Warehousing (100.0%), whereas the industries that tend to have a higher number of women are Arts, Entertainment & Recreation (100.0%), Health Care & Social Assistance (96.0%), and Educational Services (88.9%).
| Industry | Male | Female |
| Agriculture, Fishing & Hunting | 13 (100.0%) | 0 (0.0%) |
| Mining, Quarrying, & Extraction | 0 (0.0%) | 0 (0.0%) |
| Construction | 53 (100.0%) | 0 (0.0%) |
| Manufacturing | 157 (86.3%) | 25 (13.7%) |
| Wholesale Trade | 0 (0.0%) | 0 (0.0%) |
| Retail Trade | 45 (33.1%) | 91 (66.9%) |
| Transportation & Warehousing | 12 (100.0%) | 0 (0.0%) |
| Utilities | 0 (0.0%) | 0 (0.0%) |
| Information | 5 (100.0%) | 0 (0.0%) |
| Finance & Insurance | 4 (26.7%) | 11 (73.3%) |
| Real Estate, Rental & Leasing | 0 (0.0%) | 0 (0.0%) |
| Professional & Scientific | 13 (32.5%) | 27 (67.5%) |
| Enterprise Management | 0 (0.0%) | 0 (0.0%) |
| Administrative & Support | 5 (50.0%) | 5 (50.0%) |
| Educational Services | 4 (11.1%) | 32 (88.9%) |
| Health Care & Social Assistance | 6 (4.0%) | 143 (96.0%) |
| Arts, Entertainment & Recreation | 0 (0.0%) | 27 (100.0%) |
| Accommodation & Food Services | 18 (15.5%) | 98 (84.5%) |
| Public Administration | 42 (80.8%) | 10 (19.2%) |
| Total | 427 (45.9%) | 503 (54.1%) |
Education in Everett borough
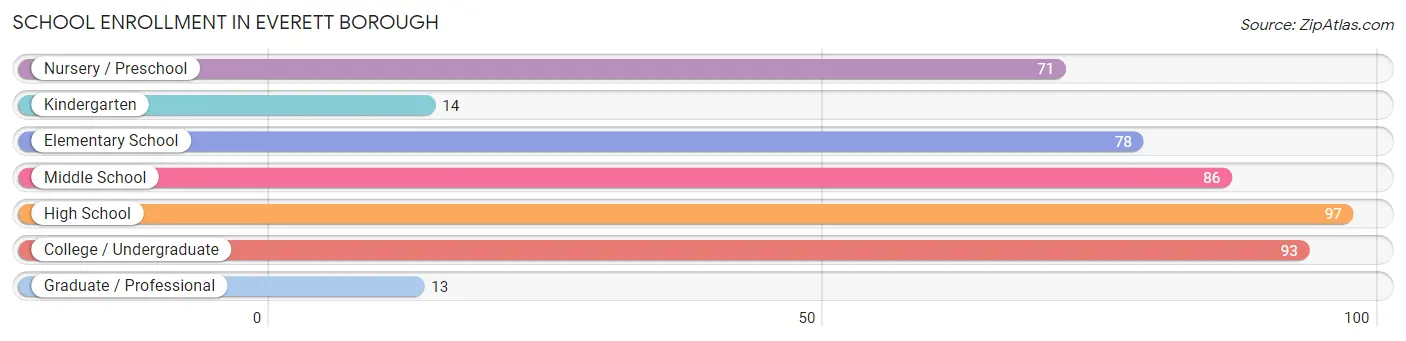
School Enrollment in Everett borough
The most common levels of schooling among the 452 students in Everett borough are high school (97 | 21.5%), college / undergraduate (93 | 20.6%), and middle school (86 | 19.0%).
| School Level | # Students | % Students |
| Nursery / Preschool | 71 | 15.7% |
| Kindergarten | 14 | 3.1% |
| Elementary School | 78 | 17.3% |
| Middle School | 86 | 19.0% |
| High School | 97 | 21.5% |
| College / Undergraduate | 93 | 20.6% |
| Graduate / Professional | 13 | 2.9% |
| Total | 452 | 100.0% |
School Enrollment by Age by Funding Source in Everett borough
Out of a total of 452 students who are enrolled in schools in Everett borough, 13 (2.9%) attend a private institution, while the remaining 439 (97.1%) are enrolled in public schools. The age group of 20 to 24 year olds has the highest likelihood of being enrolled in private schools, with 7 (16.7% in the age bracket) enrolled. Conversely, the age group of 3 to 4 year olds has the lowest likelihood of being enrolled in a private school, with 64 (100.0% in the age bracket) attending a public institution.
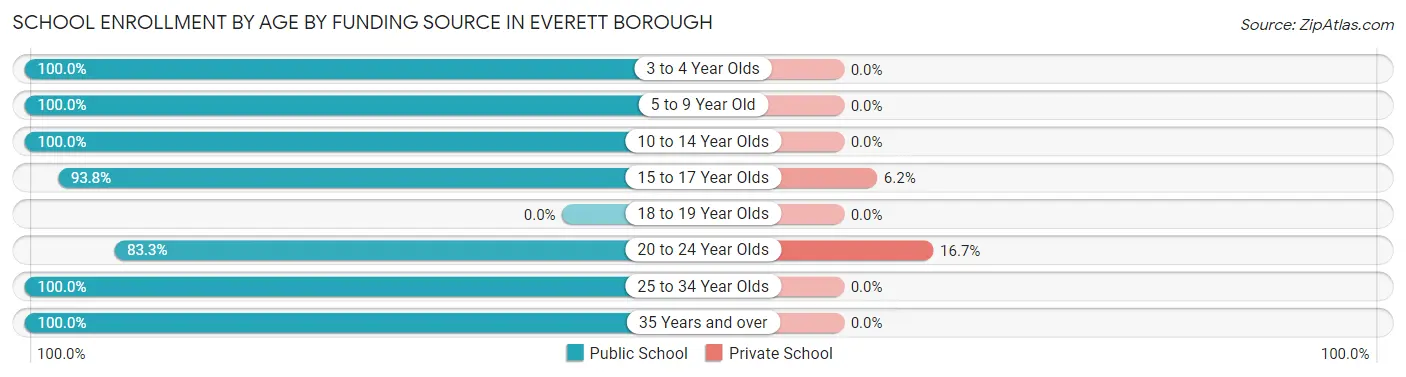
| Age Bracket | Public School | Private School |
| 3 to 4 Year Olds | 64 (100.0%) | 0 (0.0%) |
| 5 to 9 Year Old | 99 (100.0%) | 0 (0.0%) |
| 10 to 14 Year Olds | 86 (100.0%) | 0 (0.0%) |
| 15 to 17 Year Olds | 91 (93.8%) | 6 (6.2%) |
| 18 to 19 Year Olds | 0 (0.0%) | 0 (0.0%) |
| 20 to 24 Year Olds | 35 (83.3%) | 7 (16.7%) |
| 25 to 34 Year Olds | 28 (100.0%) | 0 (0.0%) |
| 35 Years and over | 36 (100.0%) | 0 (0.0%) |
| Total | 439 (97.1%) | 13 (2.9%) |
Educational Attainment by Field of Study in Everett borough
Education (45 | 26.0%), bio, nature & agricultural (26 | 15.0%), multidisciplinary studies (25 | 14.4%), science & technology (17 | 9.8%), and arts & humanities (17 | 9.8%) are the most common fields of study among 173 individuals in Everett borough who have obtained a bachelor's degree or higher.
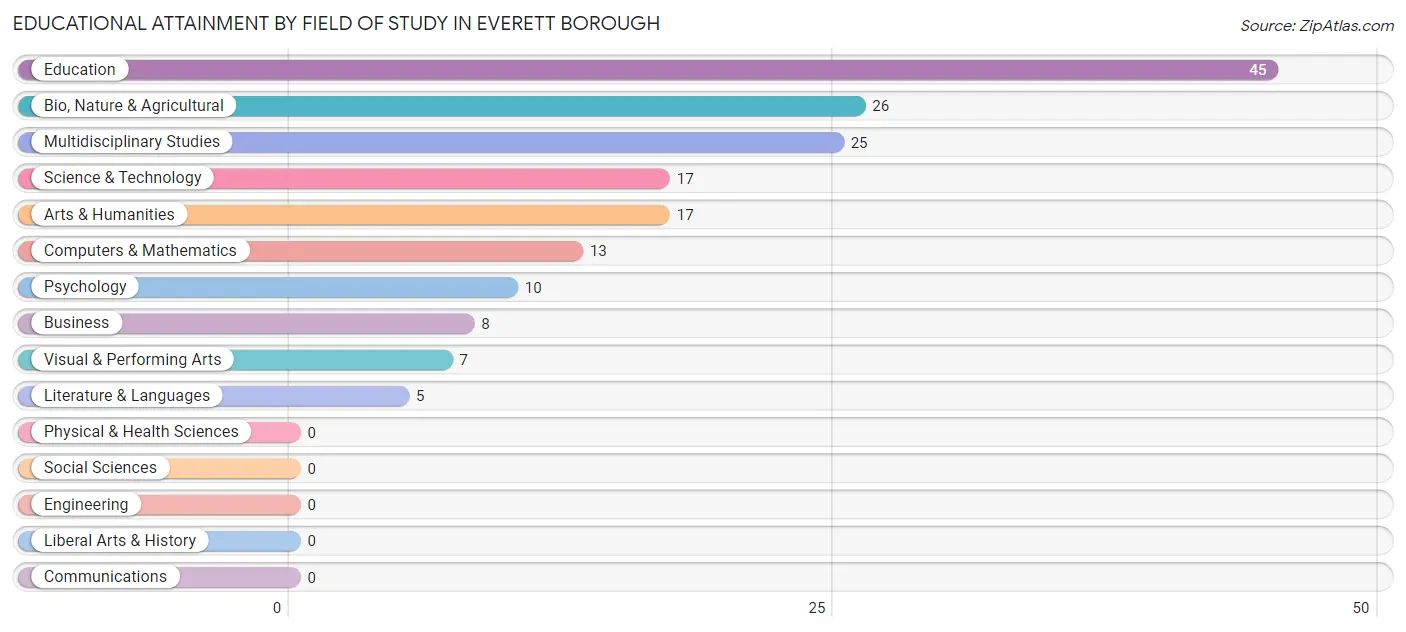
| Field of Study | # Graduates | % Graduates |
| Computers & Mathematics | 13 | 7.5% |
| Bio, Nature & Agricultural | 26 | 15.0% |
| Physical & Health Sciences | 0 | 0.0% |
| Psychology | 10 | 5.8% |
| Social Sciences | 0 | 0.0% |
| Engineering | 0 | 0.0% |
| Multidisciplinary Studies | 25 | 14.4% |
| Science & Technology | 17 | 9.8% |
| Business | 8 | 4.6% |
| Education | 45 | 26.0% |
| Literature & Languages | 5 | 2.9% |
| Liberal Arts & History | 0 | 0.0% |
| Visual & Performing Arts | 7 | 4.1% |
| Communications | 0 | 0.0% |
| Arts & Humanities | 17 | 9.8% |
| Total | 173 | 100.0% |
Transportation & Commute in Everett borough
Vehicle Availability by Sex in Everett borough
The most prevalent vehicle ownership categories in Everett borough are males with 2 vehicles (173, accounting for 40.5%) and females with 2 vehicles (174, making up 34.7%).
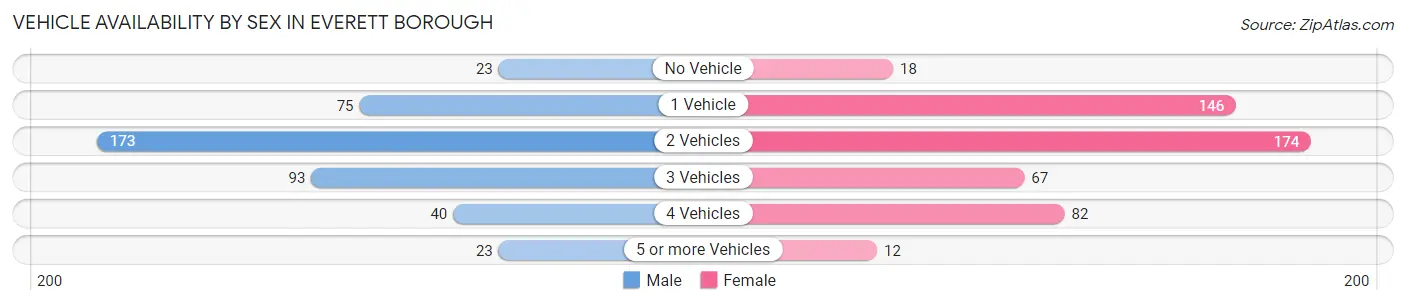
| Vehicles Available | Male | Female |
| No Vehicle | 23 (5.4%) | 18 (3.6%) |
| 1 Vehicle | 75 (17.6%) | 146 (29.3%) |
| 2 Vehicles | 173 (40.5%) | 174 (34.9%) |
| 3 Vehicles | 93 (21.8%) | 67 (13.4%) |
| 4 Vehicles | 40 (9.4%) | 82 (16.4%) |
| 5 or more Vehicles | 23 (5.4%) | 12 (2.4%) |
| Total | 427 (100.0%) | 499 (100.0%) |
Commute Time in Everett borough
The most frequently occuring commute durations in Everett borough are 10 to 14 minutes (234 commuters, 26.6%), 15 to 19 minutes (219 commuters, 24.9%), and less than 5 minutes (101 commuters, 11.5%).
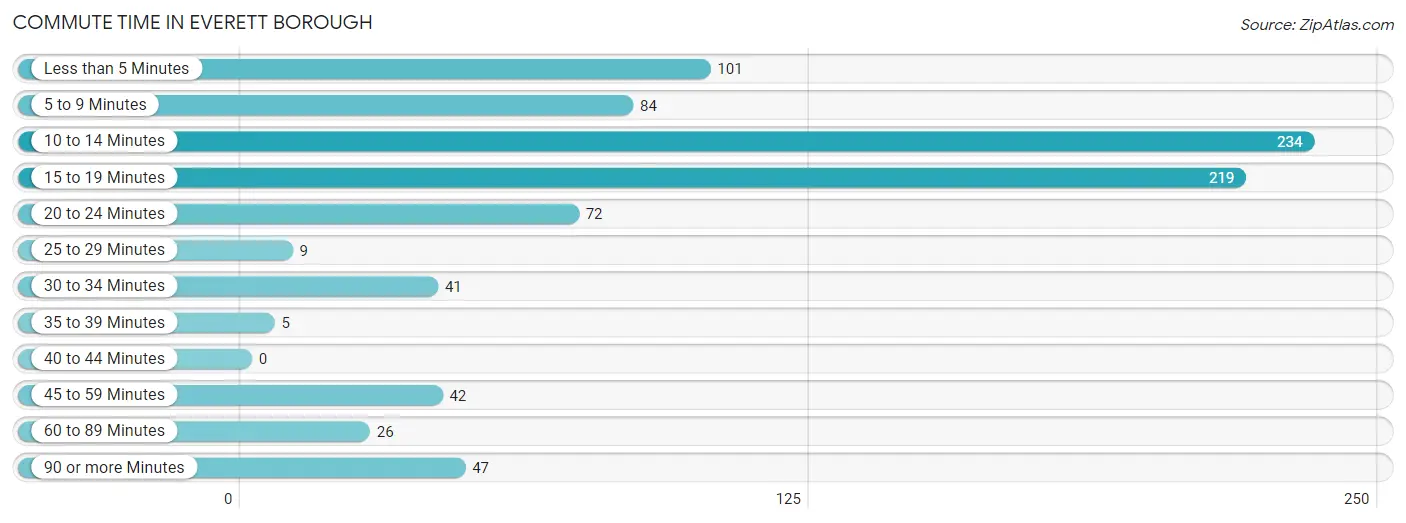
| Commute Time | # Commuters | % Commuters |
| Less than 5 Minutes | 101 | 11.5% |
| 5 to 9 Minutes | 84 | 9.6% |
| 10 to 14 Minutes | 234 | 26.6% |
| 15 to 19 Minutes | 219 | 24.9% |
| 20 to 24 Minutes | 72 | 8.2% |
| 25 to 29 Minutes | 9 | 1.0% |
| 30 to 34 Minutes | 41 | 4.7% |
| 35 to 39 Minutes | 5 | 0.6% |
| 40 to 44 Minutes | 0 | 0.0% |
| 45 to 59 Minutes | 42 | 4.8% |
| 60 to 89 Minutes | 26 | 2.9% |
| 90 or more Minutes | 47 | 5.3% |
Commute Time by Sex in Everett borough
The most common commute times in Everett borough are 15 to 19 minutes (68 commuters, 16.8%) for males and 10 to 14 minutes (172 commuters, 36.3%) for females.
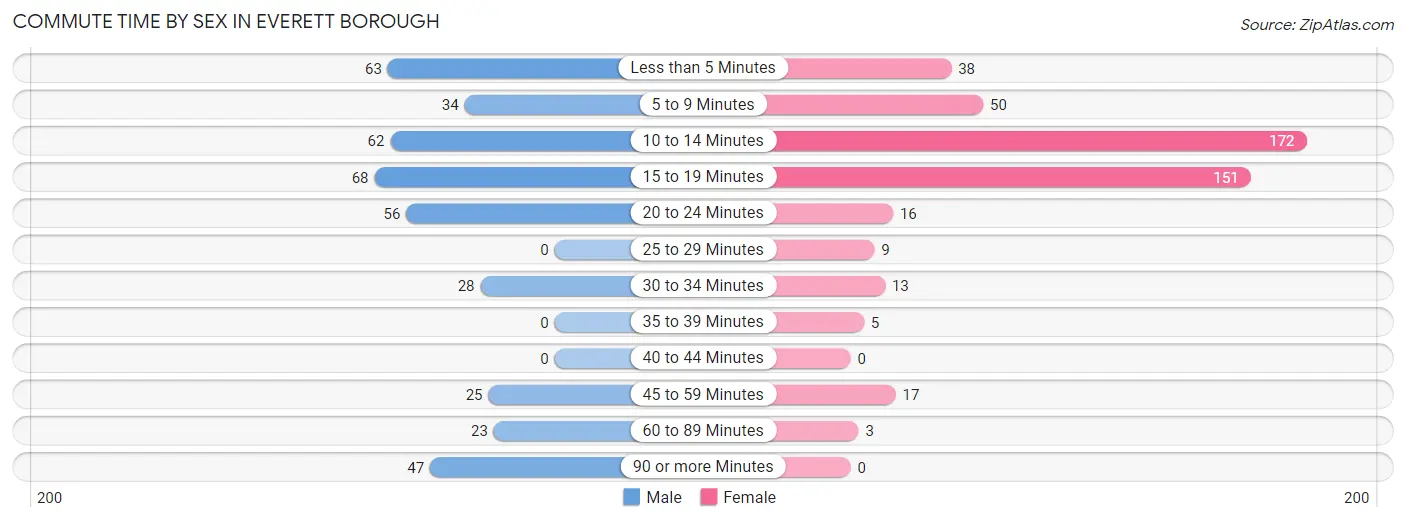
| Commute Time | Male | Female |
| Less than 5 Minutes | 63 (15.5%) | 38 (8.0%) |
| 5 to 9 Minutes | 34 (8.4%) | 50 (10.5%) |
| 10 to 14 Minutes | 62 (15.3%) | 172 (36.3%) |
| 15 to 19 Minutes | 68 (16.8%) | 151 (31.9%) |
| 20 to 24 Minutes | 56 (13.8%) | 16 (3.4%) |
| 25 to 29 Minutes | 0 (0.0%) | 9 (1.9%) |
| 30 to 34 Minutes | 28 (6.9%) | 13 (2.7%) |
| 35 to 39 Minutes | 0 (0.0%) | 5 (1.1%) |
| 40 to 44 Minutes | 0 (0.0%) | 0 (0.0%) |
| 45 to 59 Minutes | 25 (6.2%) | 17 (3.6%) |
| 60 to 89 Minutes | 23 (5.7%) | 3 (0.6%) |
| 90 or more Minutes | 47 (11.6%) | 0 (0.0%) |
Time of Departure to Work by Sex in Everett borough
The most frequent times of departure to work in Everett borough are 6:30 AM to 6:59 AM (63, 15.5%) for males and 7:30 AM to 7:59 AM (98, 20.7%) for females.
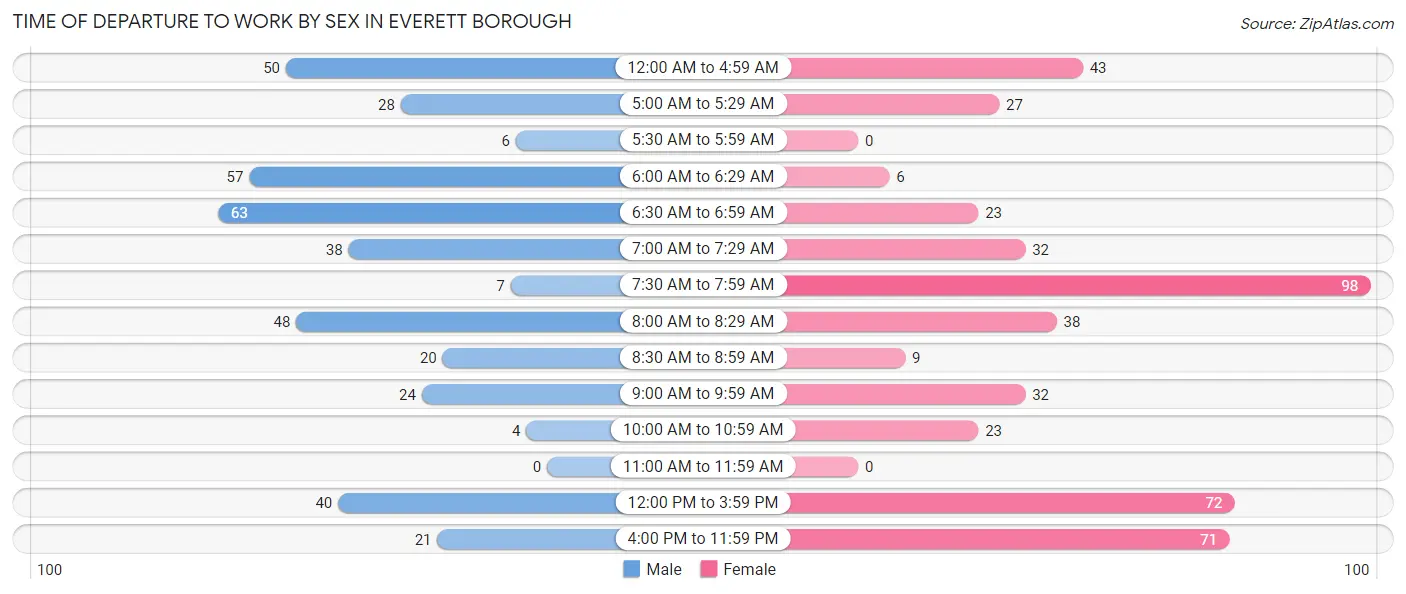
| Time of Departure | Male | Female |
| 12:00 AM to 4:59 AM | 50 (12.3%) | 43 (9.1%) |
| 5:00 AM to 5:29 AM | 28 (6.9%) | 27 (5.7%) |
| 5:30 AM to 5:59 AM | 6 (1.5%) | 0 (0.0%) |
| 6:00 AM to 6:29 AM | 57 (14.0%) | 6 (1.3%) |
| 6:30 AM to 6:59 AM | 63 (15.5%) | 23 (4.9%) |
| 7:00 AM to 7:29 AM | 38 (9.4%) | 32 (6.8%) |
| 7:30 AM to 7:59 AM | 7 (1.7%) | 98 (20.7%) |
| 8:00 AM to 8:29 AM | 48 (11.8%) | 38 (8.0%) |
| 8:30 AM to 8:59 AM | 20 (4.9%) | 9 (1.9%) |
| 9:00 AM to 9:59 AM | 24 (5.9%) | 32 (6.8%) |
| 10:00 AM to 10:59 AM | 4 (1.0%) | 23 (4.9%) |
| 11:00 AM to 11:59 AM | 0 (0.0%) | 0 (0.0%) |
| 12:00 PM to 3:59 PM | 40 (9.9%) | 72 (15.2%) |
| 4:00 PM to 11:59 PM | 21 (5.2%) | 71 (15.0%) |
| Total | 406 (100.0%) | 474 (100.0%) |
Housing Occupancy in Everett borough
Occupancy by Ownership in Everett borough
Of the total 925 dwellings in Everett borough, owner-occupied units account for 434 (46.9%), while renter-occupied units make up 491 (53.1%).
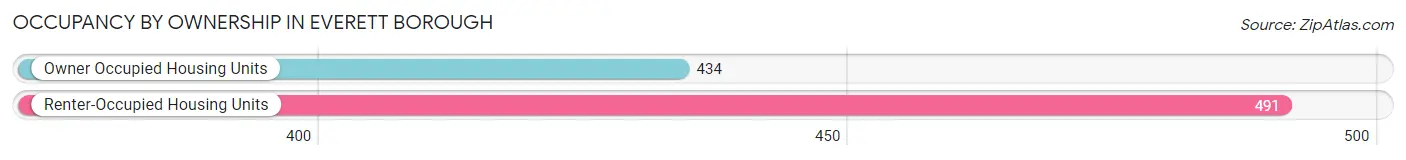
| Occupancy | # Housing Units | % Housing Units |
| Owner Occupied Housing Units | 434 | 46.9% |
| Renter-Occupied Housing Units | 491 | 53.1% |
| Total Occupied Housing Units | 925 | 100.0% |
Occupancy by Household Size in Everett borough
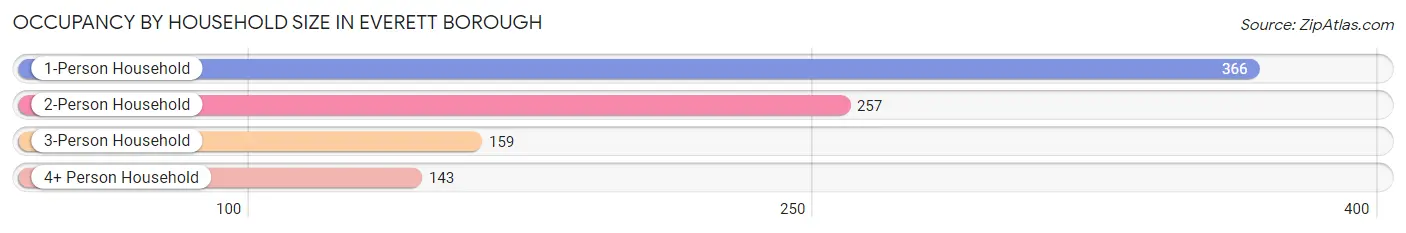
| Household Size | # Housing Units | % Housing Units |
| 1-Person Household | 366 | 39.6% |
| 2-Person Household | 257 | 27.8% |
| 3-Person Household | 159 | 17.2% |
| 4+ Person Household | 143 | 15.5% |
| Total Housing Units | 925 | 100.0% |
Occupancy by Ownership by Household Size in Everett borough
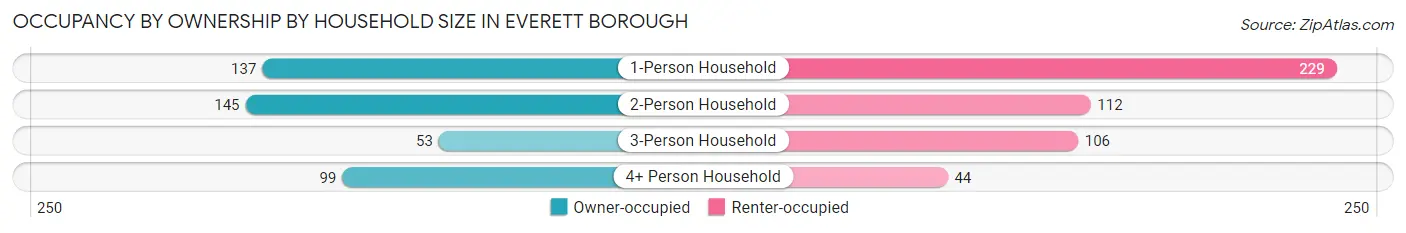
| Household Size | Owner-occupied | Renter-occupied |
| 1-Person Household | 137 (37.4%) | 229 (62.6%) |
| 2-Person Household | 145 (56.4%) | 112 (43.6%) |
| 3-Person Household | 53 (33.3%) | 106 (66.7%) |
| 4+ Person Household | 99 (69.2%) | 44 (30.8%) |
| Total Housing Units | 434 (46.9%) | 491 (53.1%) |
Occupancy by Educational Attainment in Everett borough
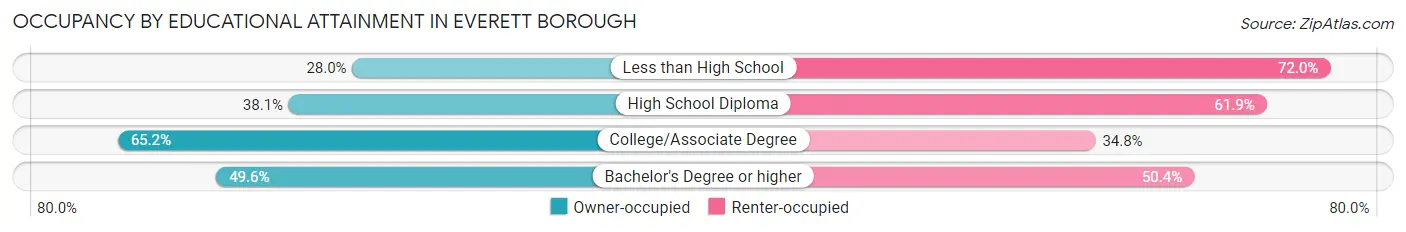
| Household Size | Owner-occupied | Renter-occupied |
| Less than High School | 21 (28.0%) | 54 (72.0%) |
| High School Diploma | 171 (38.1%) | 278 (61.9%) |
| College/Associate Degree | 180 (65.2%) | 96 (34.8%) |
| Bachelor's Degree or higher | 62 (49.6%) | 63 (50.4%) |
Occupancy by Age of Householder in Everett borough
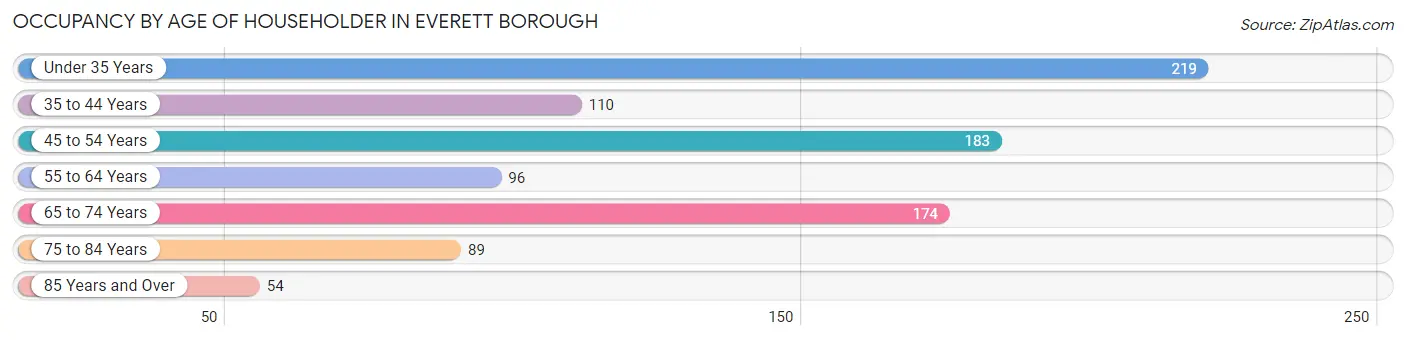
| Age Bracket | # Households | % Households |
| Under 35 Years | 219 | 23.7% |
| 35 to 44 Years | 110 | 11.9% |
| 45 to 54 Years | 183 | 19.8% |
| 55 to 64 Years | 96 | 10.4% |
| 65 to 74 Years | 174 | 18.8% |
| 75 to 84 Years | 89 | 9.6% |
| 85 Years and Over | 54 | 5.8% |
| Total | 925 | 100.0% |
Housing Finances in Everett borough
Median Income by Occupancy in Everett borough
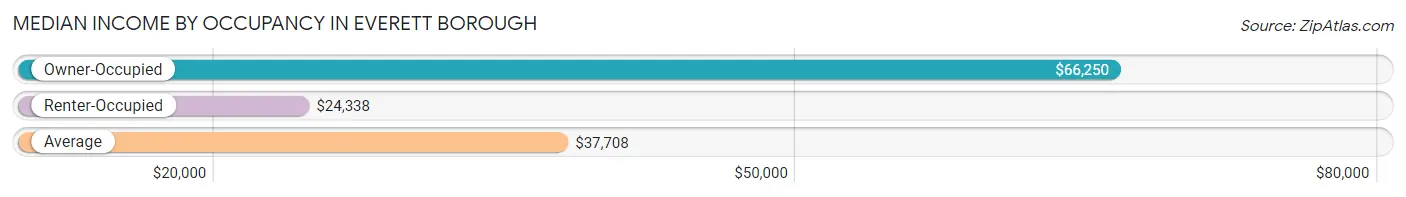
| Occupancy Type | # Households | Median Income |
| Owner-Occupied | 434 (46.9%) | $66,250 |
| Renter-Occupied | 491 (53.1%) | $24,338 |
| Average | 925 (100.0%) | $37,708 |
Occupancy by Householder Income Bracket in Everett borough
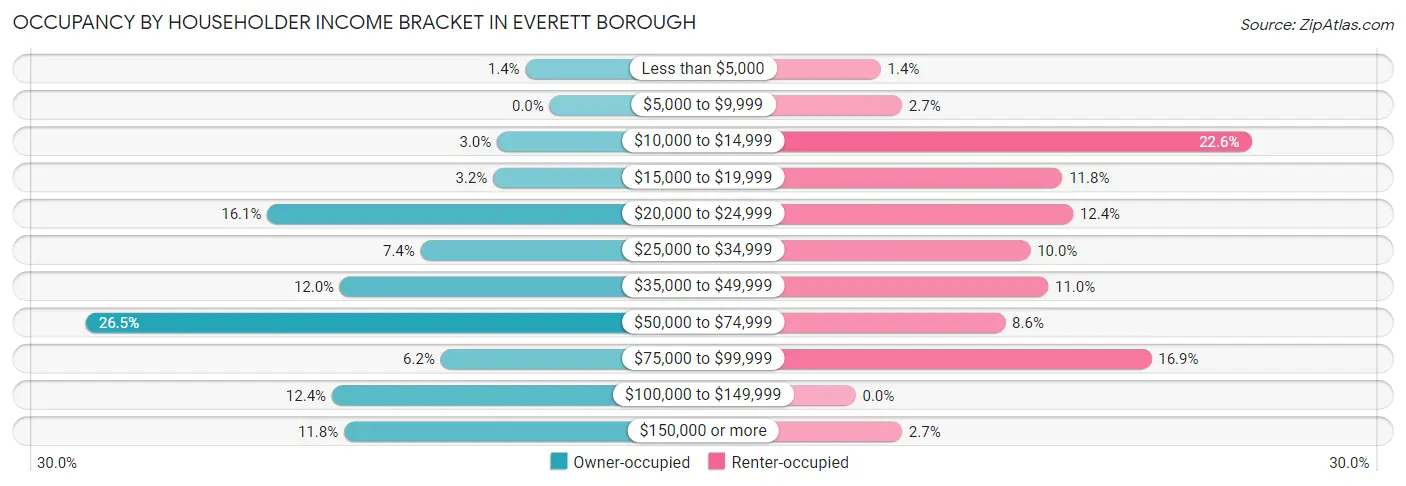
| Income Bracket | Owner-occupied | Renter-occupied |
| Less than $5,000 | 6 (1.4%) | 7 (1.4%) |
| $5,000 to $9,999 | 0 (0.0%) | 13 (2.6%) |
| $10,000 to $14,999 | 13 (3.0%) | 111 (22.6%) |
| $15,000 to $19,999 | 14 (3.2%) | 58 (11.8%) |
| $20,000 to $24,999 | 70 (16.1%) | 61 (12.4%) |
| $25,000 to $34,999 | 32 (7.4%) | 49 (10.0%) |
| $35,000 to $49,999 | 52 (12.0%) | 54 (11.0%) |
| $50,000 to $74,999 | 115 (26.5%) | 42 (8.6%) |
| $75,000 to $99,999 | 27 (6.2%) | 83 (16.9%) |
| $100,000 to $149,999 | 54 (12.4%) | 0 (0.0%) |
| $150,000 or more | 51 (11.7%) | 13 (2.6%) |
| Total | 434 (100.0%) | 491 (100.0%) |
Monthly Housing Cost Tiers in Everett borough
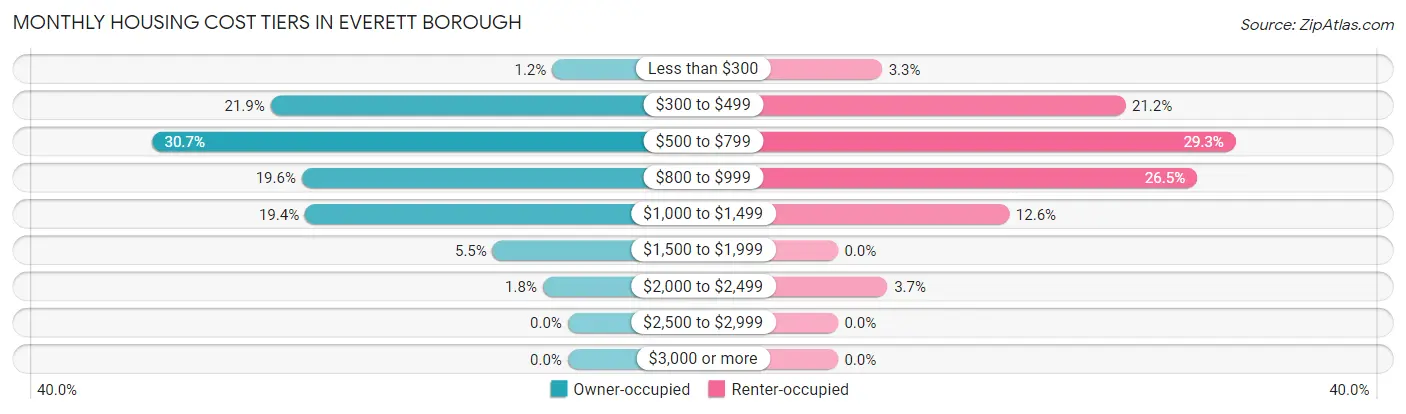
| Monthly Cost | Owner-occupied | Renter-occupied |
| Less than $300 | 5 (1.1%) | 16 (3.3%) |
| $300 to $499 | 95 (21.9%) | 104 (21.2%) |
| $500 to $799 | 133 (30.6%) | 144 (29.3%) |
| $800 to $999 | 85 (19.6%) | 130 (26.5%) |
| $1,000 to $1,499 | 84 (19.4%) | 62 (12.6%) |
| $1,500 to $1,999 | 24 (5.5%) | 0 (0.0%) |
| $2,000 to $2,499 | 8 (1.8%) | 18 (3.7%) |
| $2,500 to $2,999 | 0 (0.0%) | 0 (0.0%) |
| $3,000 or more | 0 (0.0%) | 0 (0.0%) |
| Total | 434 (100.0%) | 491 (100.0%) |
Physical Housing Characteristics in Everett borough
Housing Structures in Everett borough
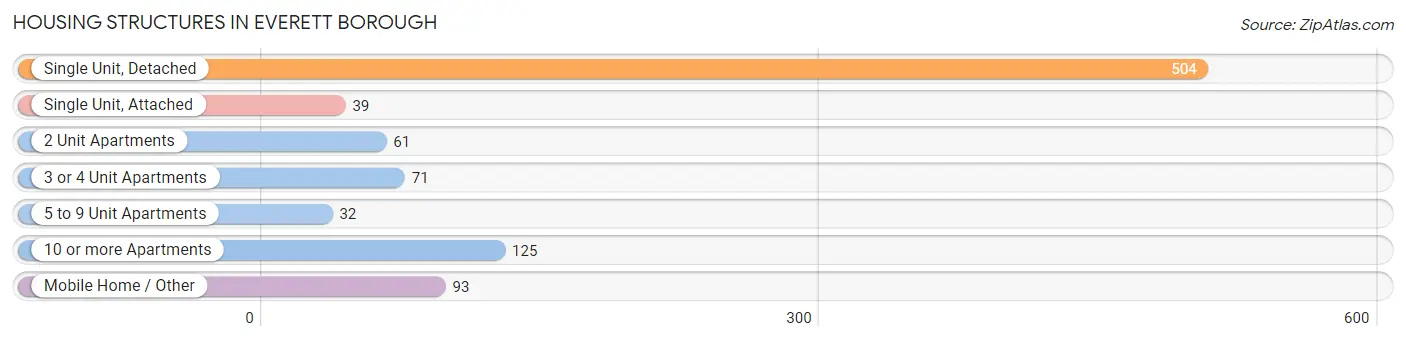
| Structure Type | # Housing Units | % Housing Units |
| Single Unit, Detached | 504 | 54.5% |
| Single Unit, Attached | 39 | 4.2% |
| 2 Unit Apartments | 61 | 6.6% |
| 3 or 4 Unit Apartments | 71 | 7.7% |
| 5 to 9 Unit Apartments | 32 | 3.5% |
| 10 or more Apartments | 125 | 13.5% |
| Mobile Home / Other | 93 | 10.1% |
| Total | 925 | 100.0% |
Housing Structures by Occupancy in Everett borough
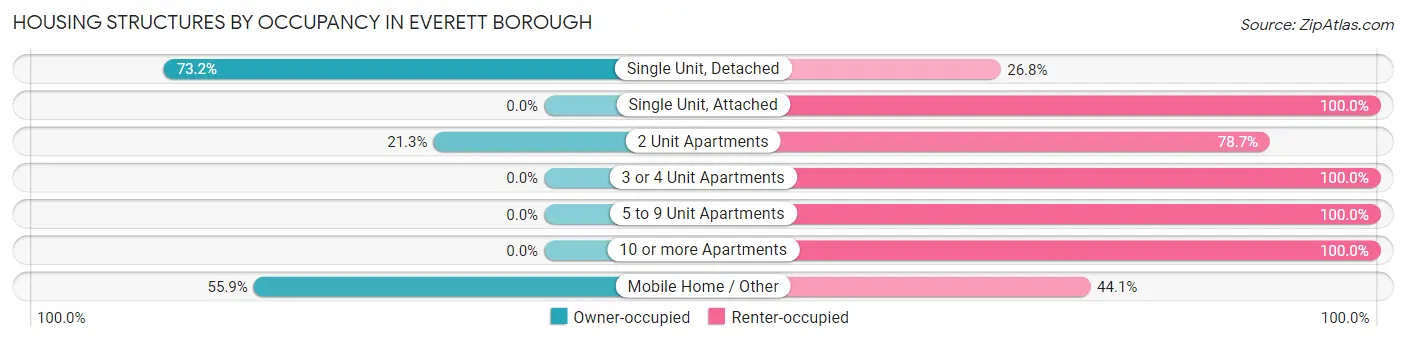
| Structure Type | Owner-occupied | Renter-occupied |
| Single Unit, Detached | 369 (73.2%) | 135 (26.8%) |
| Single Unit, Attached | 0 (0.0%) | 39 (100.0%) |
| 2 Unit Apartments | 13 (21.3%) | 48 (78.7%) |
| 3 or 4 Unit Apartments | 0 (0.0%) | 71 (100.0%) |
| 5 to 9 Unit Apartments | 0 (0.0%) | 32 (100.0%) |
| 10 or more Apartments | 0 (0.0%) | 125 (100.0%) |
| Mobile Home / Other | 52 (55.9%) | 41 (44.1%) |
| Total | 434 (46.9%) | 491 (53.1%) |
Housing Structures by Number of Rooms in Everett borough
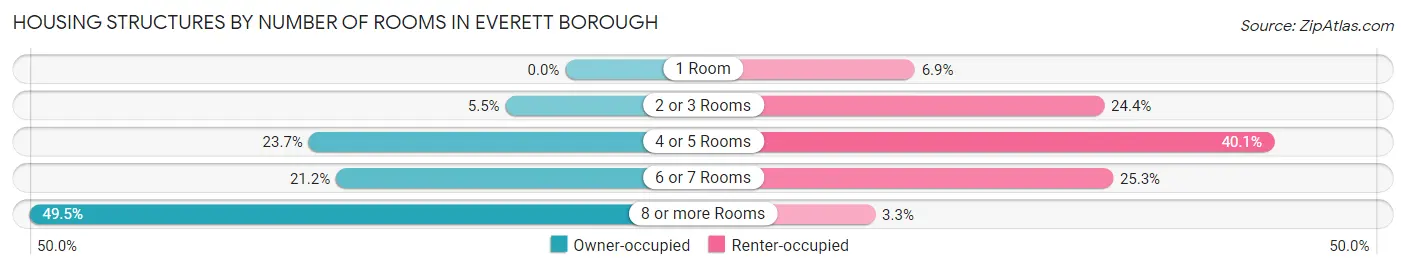
| Number of Rooms | Owner-occupied | Renter-occupied |
| 1 Room | 0 (0.0%) | 34 (6.9%) |
| 2 or 3 Rooms | 24 (5.5%) | 120 (24.4%) |
| 4 or 5 Rooms | 103 (23.7%) | 197 (40.1%) |
| 6 or 7 Rooms | 92 (21.2%) | 124 (25.3%) |
| 8 or more Rooms | 215 (49.5%) | 16 (3.3%) |
| Total | 434 (100.0%) | 491 (100.0%) |
Housing Structure by Heating Type in Everett borough
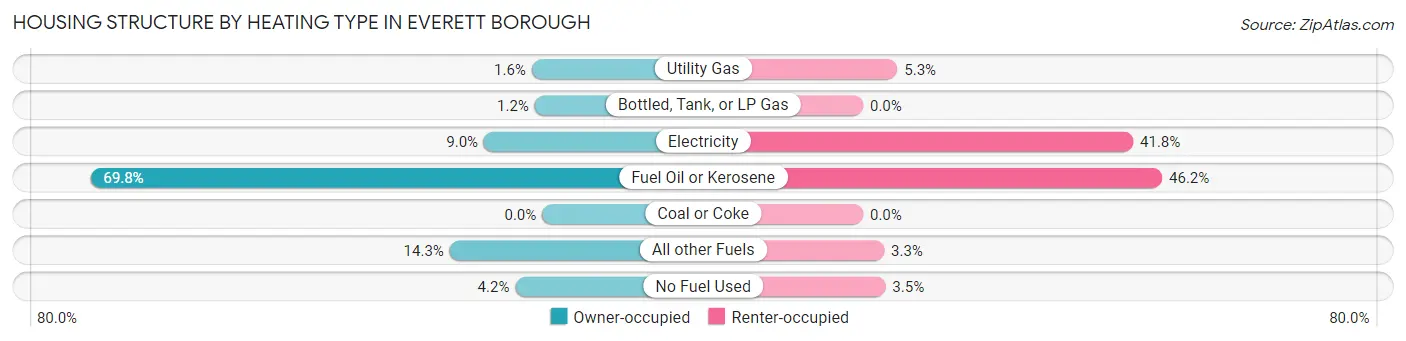
| Heating Type | Owner-occupied | Renter-occupied |
| Utility Gas | 7 (1.6%) | 26 (5.3%) |
| Bottled, Tank, or LP Gas | 5 (1.1%) | 0 (0.0%) |
| Electricity | 39 (9.0%) | 205 (41.7%) |
| Fuel Oil or Kerosene | 303 (69.8%) | 227 (46.2%) |
| Coal or Coke | 0 (0.0%) | 0 (0.0%) |
| All other Fuels | 62 (14.3%) | 16 (3.3%) |
| No Fuel Used | 18 (4.2%) | 17 (3.5%) |
| Total | 434 (100.0%) | 491 (100.0%) |
Household Vehicle Usage in Everett borough
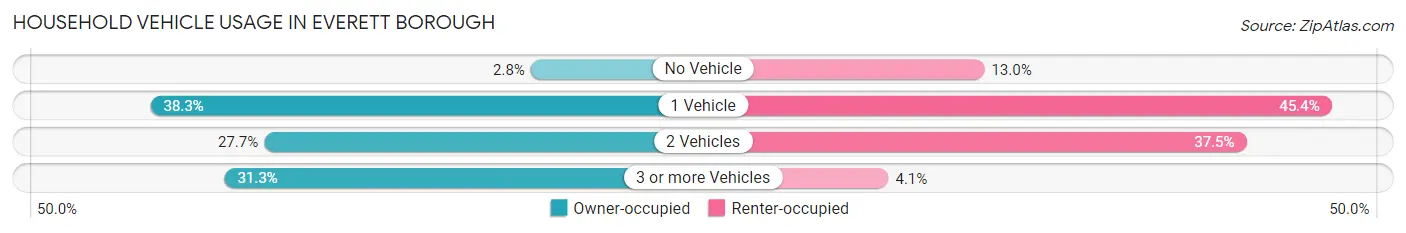
| Vehicles per Household | Owner-occupied | Renter-occupied |
| No Vehicle | 12 (2.8%) | 64 (13.0%) |
| 1 Vehicle | 166 (38.3%) | 223 (45.4%) |
| 2 Vehicles | 120 (27.7%) | 184 (37.5%) |
| 3 or more Vehicles | 136 (31.3%) | 20 (4.1%) |
| Total | 434 (100.0%) | 491 (100.0%) |
Real Estate & Mortgages in Everett borough
Real Estate and Mortgage Overview in Everett borough
| Characteristic | Without Mortgage | With Mortgage |
| Housing Units | 222 | 212 |
| Median Property Value | $115,500 | $128,700 |
| Median Household Income | $46,250 | $12 |
| Monthly Housing Costs | $519 | $0 |
| Real Estate Taxes | $1,206 | $0 |
Property Value by Mortgage Status in Everett borough
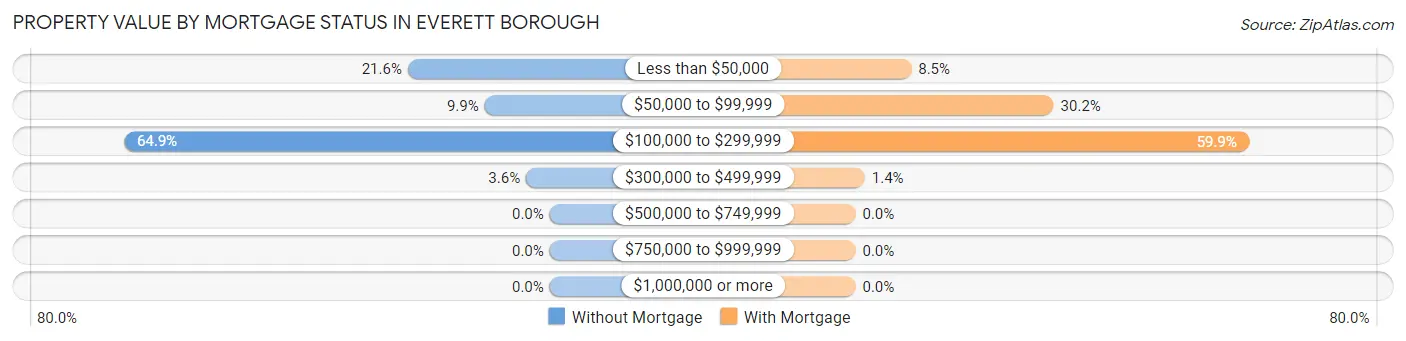
| Property Value | Without Mortgage | With Mortgage |
| Less than $50,000 | 48 (21.6%) | 18 (8.5%) |
| $50,000 to $99,999 | 22 (9.9%) | 64 (30.2%) |
| $100,000 to $299,999 | 144 (64.9%) | 127 (59.9%) |
| $300,000 to $499,999 | 8 (3.6%) | 3 (1.4%) |
| $500,000 to $749,999 | 0 (0.0%) | 0 (0.0%) |
| $750,000 to $999,999 | 0 (0.0%) | 0 (0.0%) |
| $1,000,000 or more | 0 (0.0%) | 0 (0.0%) |
| Total | 222 (100.0%) | 212 (100.0%) |
Household Income by Mortgage Status in Everett borough
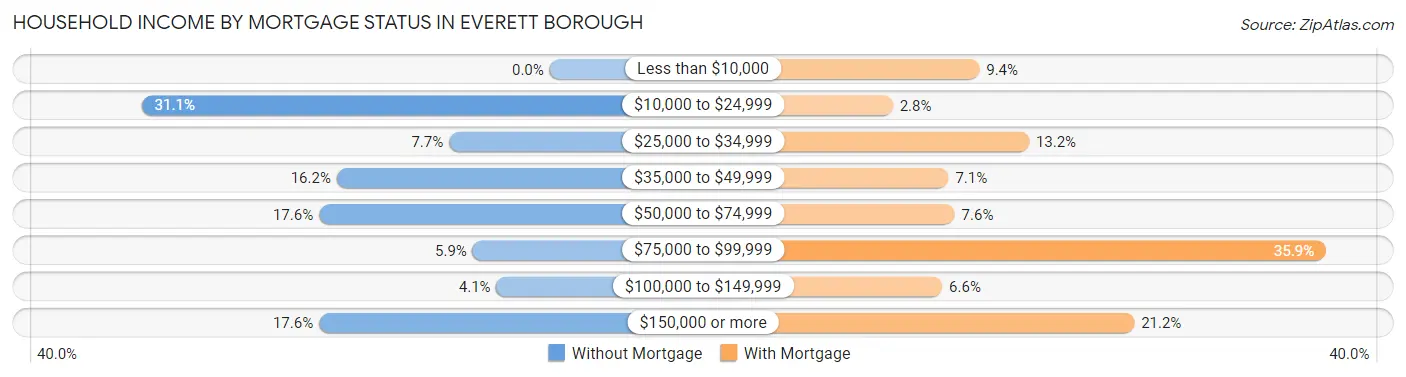
| Household Income | Without Mortgage | With Mortgage |
| Less than $10,000 | 0 (0.0%) | 20 (9.4%) |
| $10,000 to $24,999 | 69 (31.1%) | 6 (2.8%) |
| $25,000 to $34,999 | 17 (7.7%) | 28 (13.2%) |
| $35,000 to $49,999 | 36 (16.2%) | 15 (7.1%) |
| $50,000 to $74,999 | 39 (17.6%) | 16 (7.5%) |
| $75,000 to $99,999 | 13 (5.9%) | 76 (35.8%) |
| $100,000 to $149,999 | 9 (4.1%) | 14 (6.6%) |
| $150,000 or more | 39 (17.6%) | 45 (21.2%) |
| Total | 222 (100.0%) | 212 (100.0%) |
Property Value to Household Income Ratio in Everett borough

| Value-to-Income Ratio | Without Mortgage | With Mortgage |
| Less than 2.0x | 100 (45.1%) | 69,750 (32,900.9%) |
| 2.0x to 2.9x | 40 (18.0%) | 91 (42.9%) |
| 3.0x to 3.9x | 23 (10.4%) | 74 (34.9%) |
| 4.0x or more | 59 (26.6%) | 14 (6.6%) |
| Total | 222 (100.0%) | 212 (100.0%) |
Real Estate Taxes by Mortgage Status in Everett borough
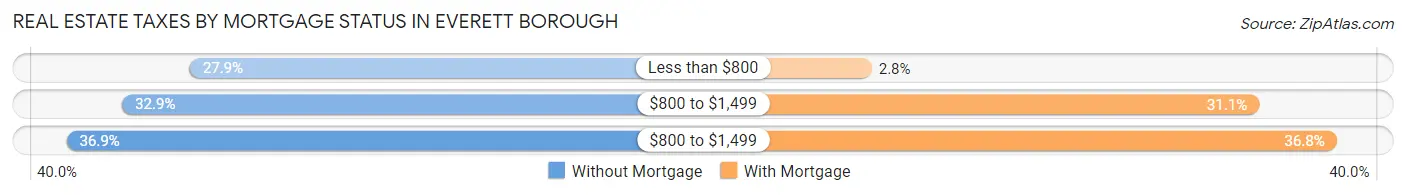
| Property Taxes | Without Mortgage | With Mortgage |
| Less than $800 | 62 (27.9%) | 6 (2.8%) |
| $800 to $1,499 | 73 (32.9%) | 66 (31.1%) |
| $800 to $1,499 | 82 (36.9%) | 78 (36.8%) |
| Total | 222 (100.0%) | 212 (100.0%) |
Health & Disability in Everett borough
Health Insurance Coverage by Age in Everett borough
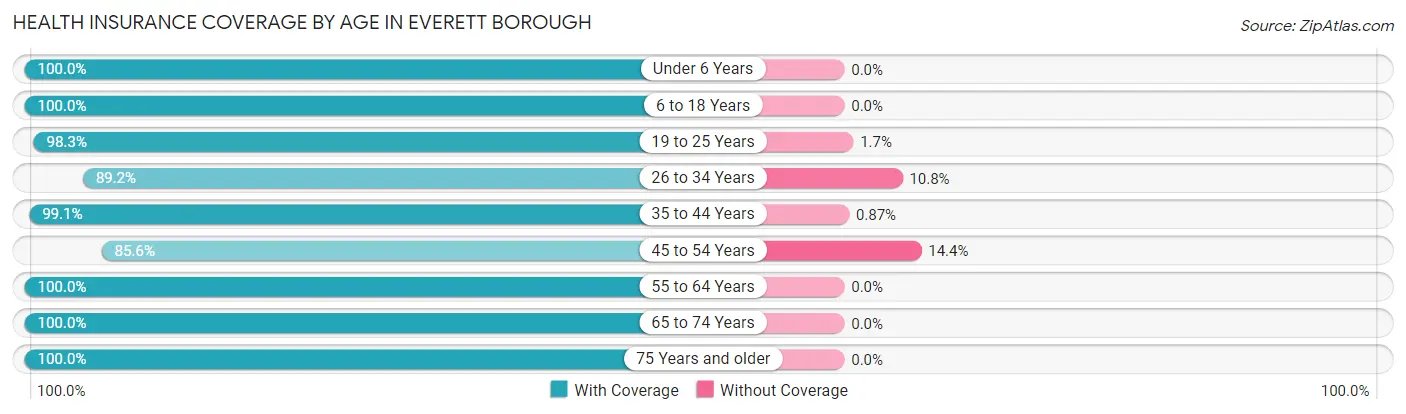
| Age Bracket | With Coverage | Without Coverage |
| Under 6 Years | 265 (100.0%) | 0 (0.0%) |
| 6 to 18 Years | 316 (100.0%) | 0 (0.0%) |
| 19 to 25 Years | 177 (98.3%) | 3 (1.7%) |
| 26 to 34 Years | 222 (89.2%) | 27 (10.8%) |
| 35 to 44 Years | 227 (99.1%) | 2 (0.9%) |
| 45 to 54 Years | 316 (85.6%) | 53 (14.4%) |
| 55 to 64 Years | 134 (100.0%) | 0 (0.0%) |
| 65 to 74 Years | 232 (100.0%) | 0 (0.0%) |
| 75 Years and older | 180 (100.0%) | 0 (0.0%) |
| Total | 2,069 (96.1%) | 85 (4.0%) |
Health Insurance Coverage by Citizenship Status in Everett borough
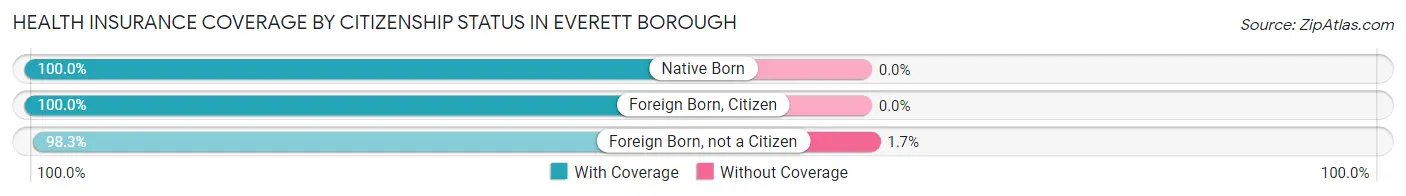
| Citizenship Status | With Coverage | Without Coverage |
| Native Born | 265 (100.0%) | 0 (0.0%) |
| Foreign Born, Citizen | 316 (100.0%) | 0 (0.0%) |
| Foreign Born, not a Citizen | 177 (98.3%) | 3 (1.7%) |
Health Insurance Coverage by Household Income in Everett borough
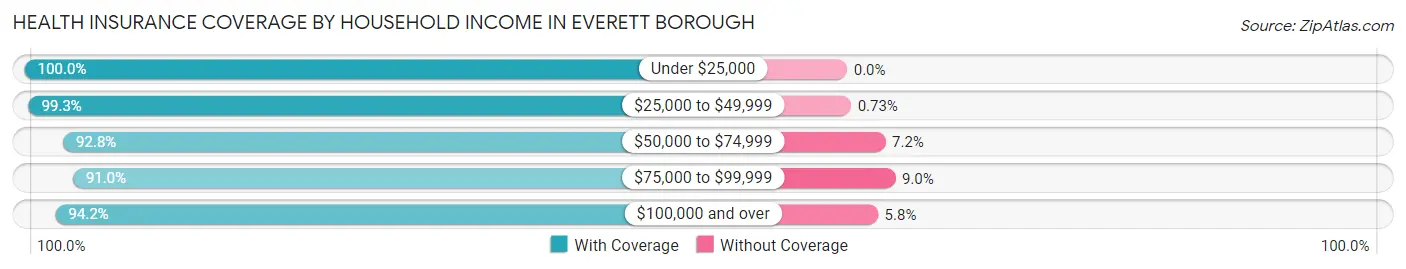
| Household Income | With Coverage | Without Coverage |
| Under $25,000 | 601 (100.0%) | 0 (0.0%) |
| $25,000 to $49,999 | 408 (99.3%) | 3 (0.7%) |
| $50,000 to $74,999 | 478 (92.8%) | 37 (7.2%) |
| $75,000 to $99,999 | 252 (91.0%) | 25 (9.0%) |
| $100,000 and over | 326 (94.2%) | 20 (5.8%) |
Public vs Private Health Insurance Coverage by Age in Everett borough
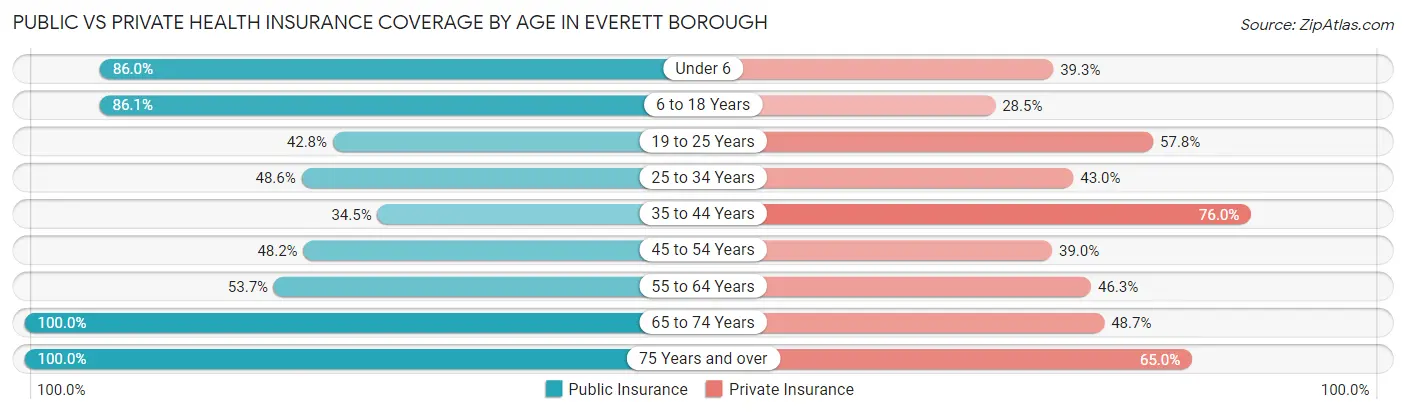
| Age Bracket | Public Insurance | Private Insurance |
| Under 6 | 228 (86.0%) | 104 (39.3%) |
| 6 to 18 Years | 272 (86.1%) | 90 (28.5%) |
| 19 to 25 Years | 77 (42.8%) | 104 (57.8%) |
| 25 to 34 Years | 121 (48.6%) | 107 (43.0%) |
| 35 to 44 Years | 79 (34.5%) | 174 (76.0%) |
| 45 to 54 Years | 178 (48.2%) | 144 (39.0%) |
| 55 to 64 Years | 72 (53.7%) | 62 (46.3%) |
| 65 to 74 Years | 232 (100.0%) | 113 (48.7%) |
| 75 Years and over | 180 (100.0%) | 117 (65.0%) |
| Total | 1,439 (66.8%) | 1,015 (47.1%) |
Disability Status by Sex by Age in Everett borough
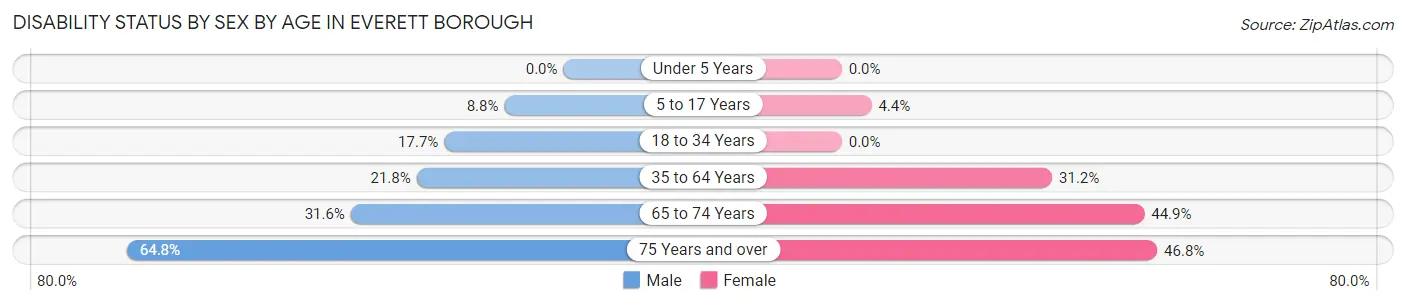
| Age Bracket | Male | Female |
| Under 5 Years | 0 (0.0%) | 0 (0.0%) |
| 5 to 17 Years | 10 (8.8%) | 8 (4.4%) |
| 18 to 34 Years | 40 (17.7%) | 0 (0.0%) |
| 35 to 64 Years | 80 (21.8%) | 114 (31.2%) |
| 65 to 74 Years | 36 (31.6%) | 53 (44.9%) |
| 75 Years and over | 35 (64.8%) | 59 (46.8%) |
Disability Class by Sex by Age in Everett borough
Disability Class: Hearing Difficulty
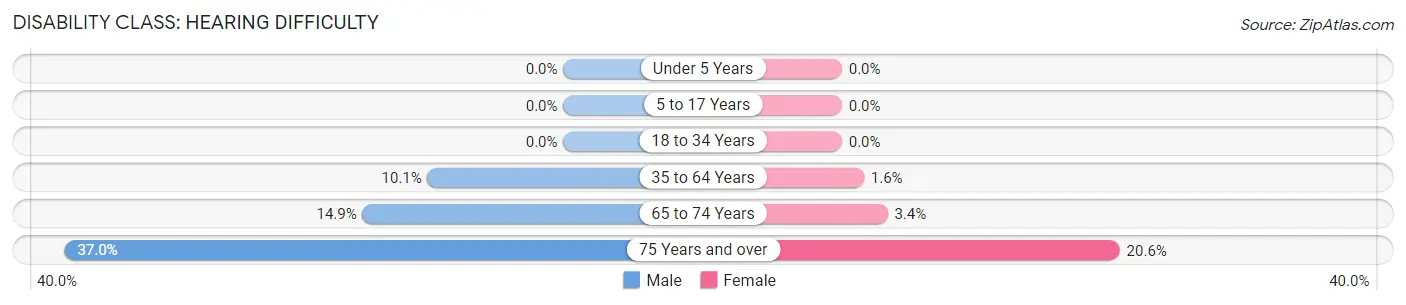
| Age Bracket | Male | Female |
| Under 5 Years | 0 (0.0%) | 0 (0.0%) |
| 5 to 17 Years | 0 (0.0%) | 0 (0.0%) |
| 18 to 34 Years | 0 (0.0%) | 0 (0.0%) |
| 35 to 64 Years | 37 (10.1%) | 6 (1.6%) |
| 65 to 74 Years | 17 (14.9%) | 4 (3.4%) |
| 75 Years and over | 20 (37.0%) | 26 (20.6%) |
Disability Class: Vision Difficulty
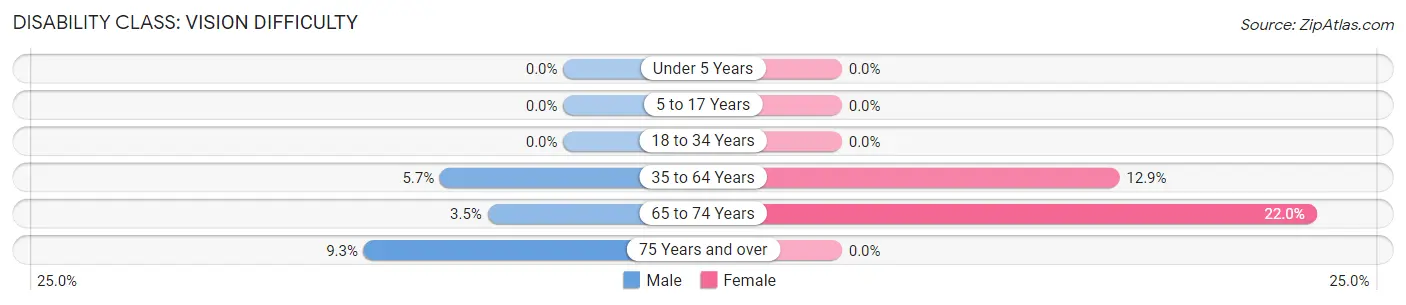
| Age Bracket | Male | Female |
| Under 5 Years | 0 (0.0%) | 0 (0.0%) |
| 5 to 17 Years | 0 (0.0%) | 0 (0.0%) |
| 18 to 34 Years | 0 (0.0%) | 0 (0.0%) |
| 35 to 64 Years | 21 (5.7%) | 47 (12.9%) |
| 65 to 74 Years | 4 (3.5%) | 26 (22.0%) |
| 75 Years and over | 5 (9.3%) | 0 (0.0%) |
Disability Class: Cognitive Difficulty
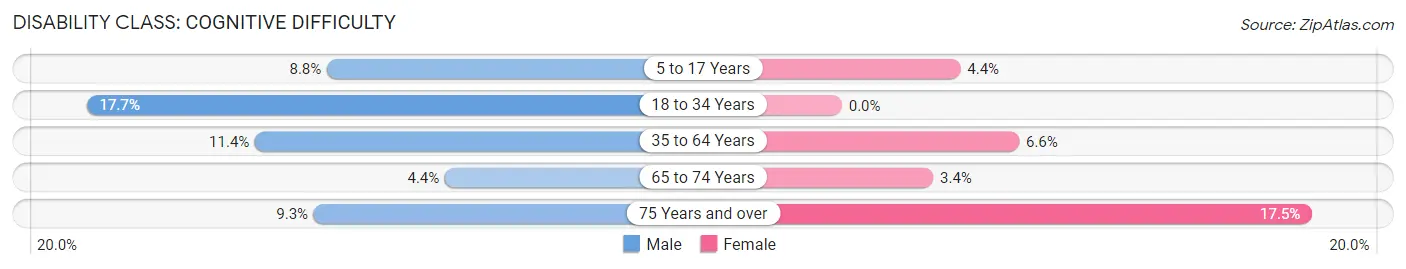
| Age Bracket | Male | Female |
| 5 to 17 Years | 10 (8.8%) | 8 (4.4%) |
| 18 to 34 Years | 40 (17.7%) | 0 (0.0%) |
| 35 to 64 Years | 42 (11.4%) | 24 (6.6%) |
| 65 to 74 Years | 5 (4.4%) | 4 (3.4%) |
| 75 Years and over | 5 (9.3%) | 22 (17.5%) |
Disability Class: Ambulatory Difficulty
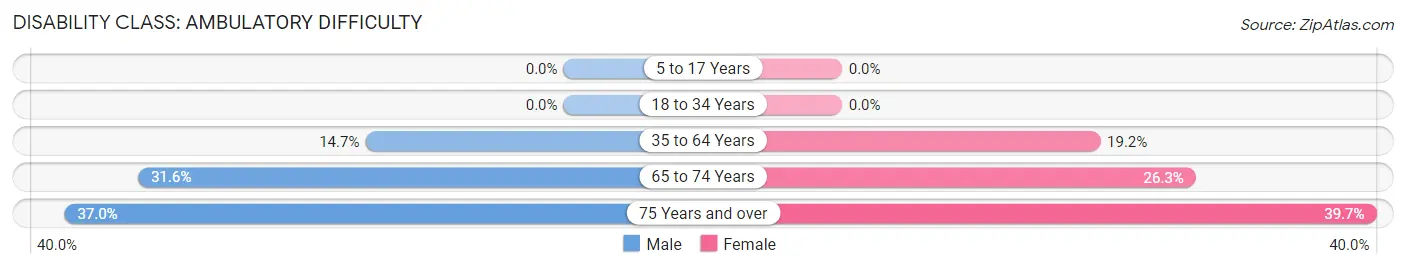
| Age Bracket | Male | Female |
| 5 to 17 Years | 0 (0.0%) | 0 (0.0%) |
| 18 to 34 Years | 0 (0.0%) | 0 (0.0%) |
| 35 to 64 Years | 54 (14.7%) | 70 (19.2%) |
| 65 to 74 Years | 36 (31.6%) | 31 (26.3%) |
| 75 Years and over | 20 (37.0%) | 50 (39.7%) |
Disability Class: Self-Care Difficulty
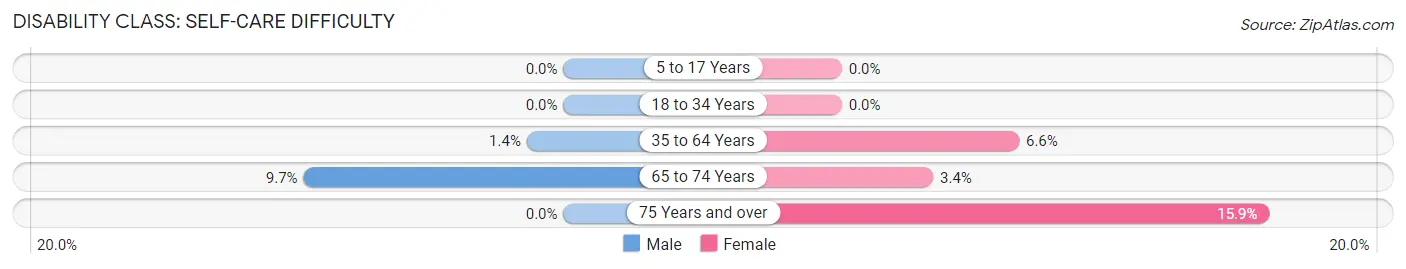
| Age Bracket | Male | Female |
| 5 to 17 Years | 0 (0.0%) | 0 (0.0%) |
| 18 to 34 Years | 0 (0.0%) | 0 (0.0%) |
| 35 to 64 Years | 5 (1.4%) | 24 (6.6%) |
| 65 to 74 Years | 11 (9.7%) | 4 (3.4%) |
| 75 Years and over | 0 (0.0%) | 20 (15.9%) |
Technology Access in Everett borough
Computing Device Access in Everett borough
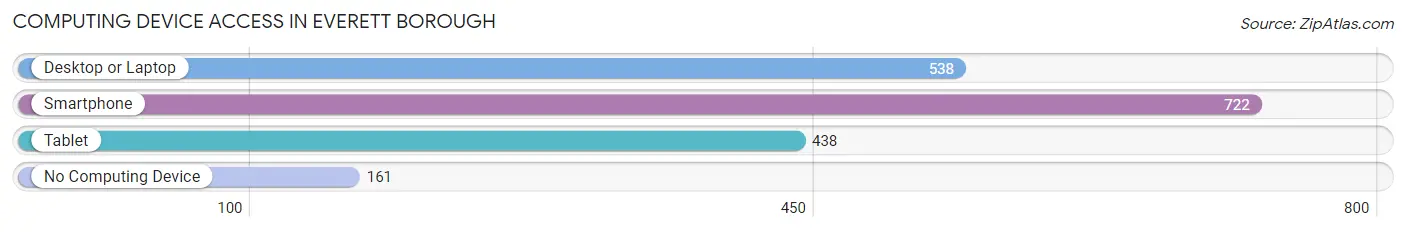
| Device Type | # Households | % Households |
| Desktop or Laptop | 538 | 58.2% |
| Smartphone | 722 | 78.0% |
| Tablet | 438 | 47.3% |
| No Computing Device | 161 | 17.4% |
| Total | 925 | 100.0% |
Internet Access in Everett borough
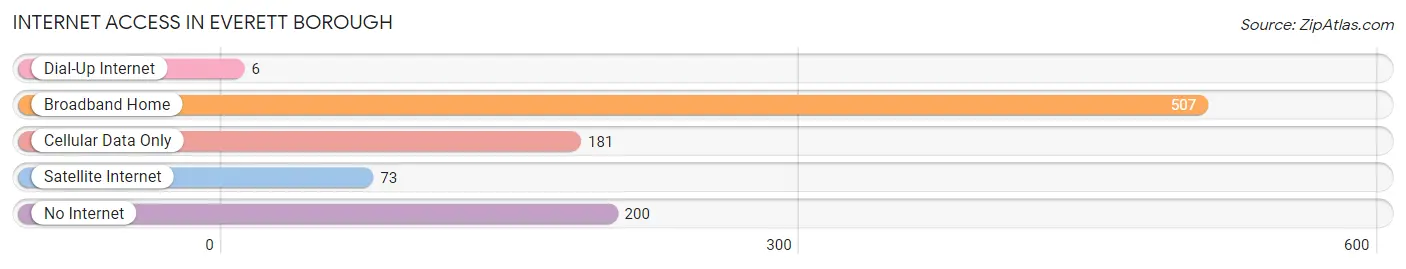
| Internet Type | # Households | % Households |
| Dial-Up Internet | 6 | 0.6% |
| Broadband Home | 507 | 54.8% |
| Cellular Data Only | 181 | 19.6% |
| Satellite Internet | 73 | 7.9% |
| No Internet | 200 | 21.6% |
| Total | 925 | 100.0% |
Everett borough Summary
Everett Borough is a small borough located in Bedford County, Pennsylvania. It is situated in the foothills of the Allegheny Mountains, approximately 50 miles east of Pittsburgh. The borough has a population of approximately 1,500 people and covers an area of 0.6 square miles.
History
Everett Borough was founded in 1845 by a group of settlers from Maryland. The town was named after the nearby Everett Creek, which was named after the local Everett family. The town was originally a farming community, but in the late 19th century, the town began to develop into a small industrial center. The Everett Tannery was established in 1876 and the Everett Iron Works was established in 1883. The town also had a number of small businesses, including a general store, a blacksmith shop, and a sawmill.
In the early 20th century, Everett Borough experienced a period of growth and development. The Everett Tannery was expanded and the Everett Iron Works was replaced by the Everett Steel Works. The town also had a number of other businesses, including a furniture factory, a brickyard, and a canning factory.
Geography
Everett Borough is located in the foothills of the Allegheny Mountains in Bedford County, Pennsylvania. The borough is situated at an elevation of 1,400 feet and covers an area of 0.6 square miles. The borough is bordered by the towns of Bedford, Cumberland, and Everett. The borough is located approximately 50 miles east of Pittsburgh.
The borough is located in a rural area and is surrounded by rolling hills and forests. The borough is home to a number of small streams, including Everett Creek, which flows through the center of town. The borough is also home to a number of parks, including Everett Park, which is located in the center of town.
Economy
Everett Borough has a small, but diverse economy. The town is home to a number of small businesses, including a general store, a hardware store, a pharmacy, and a number of restaurants. The town also has a number of manufacturing businesses, including the Everett Steel Works and the Everett Tannery. The town is also home to a number of small farms, which produce a variety of crops, including corn, soybeans, and hay.
Demographics
As of the 2010 census, Everett Borough had a population of 1,500 people. The racial makeup of the borough was 97.3% White, 0.7% African American, 0.3% Native American, 0.3% Asian, and 1.3% from other races. The median household income was $37,500 and the median family income was $45,000. The per capita income was $18,000. Approximately 10.7% of the population was below the poverty line.
Common Questions
What is Per Capita Income in Everett borough?
Per Capita income in Everett borough is $28,995.
What is the Median Family Income in Everett borough?
Median Family Income in Everett borough is $61,250.
What is the Median Household income in Everett borough?
Median Household Income in Everett borough is $37,708.
What is Income or Wage Gap in Everett borough?
Income or Wage Gap in Everett borough is 45.1%.
Women in Everett borough earn 54.9 cents for every dollar earned by a man.
What is Inequality or Gini Index in Everett borough?
Inequality or Gini Index in Everett borough is 0.52.
What is the Total Population of Everett borough?
Total Population of Everett borough is 2,154.
What is the Total Male Population of Everett borough?
Total Male Population of Everett borough is 986.
What is the Total Female Population of Everett borough?
Total Female Population of Everett borough is 1,168.
What is the Ratio of Males per 100 Females in Everett borough?
There are 84.42 Males per 100 Females in Everett borough.
What is the Ratio of Females per 100 Males in Everett borough?
There are 118.46 Females per 100 Males in Everett borough.
What is the Median Population Age in Everett borough?
Median Population Age in Everett borough is 37.2 Years.
What is the Average Family Size in Everett borough
Average Family Size in Everett borough is 3.0 People.
What is the Average Household Size in Everett borough
Average Household Size in Everett borough is 2.3 People.
How Large is the Labor Force in Everett borough?
There are 996 People in the Labor Forcein in Everett borough.
What is the Percentage of People in the Labor Force in Everett borough?
58.7% of People are in the Labor Force in Everett borough.
What is the Unemployment Rate in Everett borough?
Unemployment Rate in Everett borough is 6.6%.