Beaver Springs, PA Map & Demographics
Beaver Springs Map
Beaver Springs Overview
$30,097
PER CAPITA INCOME
$52,321
AVG FAMILY INCOME
$48,571
AVG HOUSEHOLD INCOME
17.4%
WAGE / INCOME GAP [ % ]
82.6¢/ $1
WAGE / INCOME GAP [ $ ]
0.46
INEQUALITY / GINI INDEX
730
TOTAL POPULATION
377
MALE POPULATION
353
FEMALE POPULATION
106.80
MALES / 100 FEMALES
93.63
FEMALES / 100 MALES
48.6
MEDIAN AGE
3.0
AVG FAMILY SIZE
2.2
AVG HOUSEHOLD SIZE
311
LABOR FORCE [ PEOPLE ]
53.9%
PERCENT IN LABOR FORCE
Beaver Springs Zip Codes
Income in Beaver Springs
Income Overview in Beaver Springs
Per Capita Income in Beaver Springs is $30,097, while median incomes of families and households are $52,321 and $48,571 respectively.
| Characteristic | Number | Measure |
| Per Capita Income | 730 | $30,097 |
| Median Family Income | 153 | $52,321 |
| Mean Family Income | 153 | $85,923 |
| Median Household Income | 328 | $48,571 |
| Mean Household Income | 328 | $68,346 |
| Income Deficit | 153 | $0 |
| Wage / Income Gap (%) | 730 | 17.42% |
| Wage / Income Gap ($) | 730 | 82.58¢ per $1 |
| Gini / Inequality Index | 730 | 0.46 |
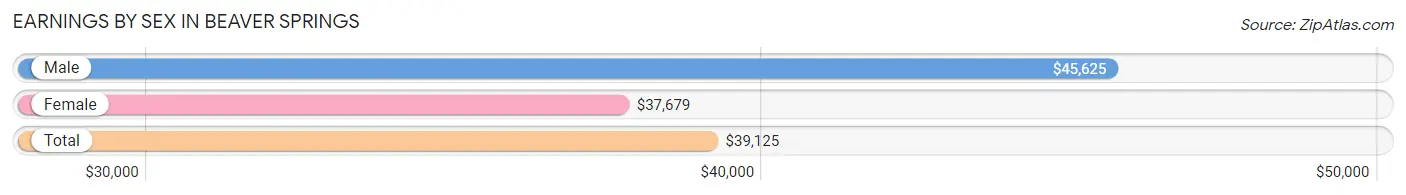
Earnings by Sex in Beaver Springs
Average Earnings in Beaver Springs are $39,125, $45,625 for men and $37,679 for women, a difference of 17.4%.
| Sex | Number | Average Earnings |
| Male | 152 (47.2%) | $45,625 |
| Female | 170 (52.8%) | $37,679 |
| Total | 322 (100.0%) | $39,125 |
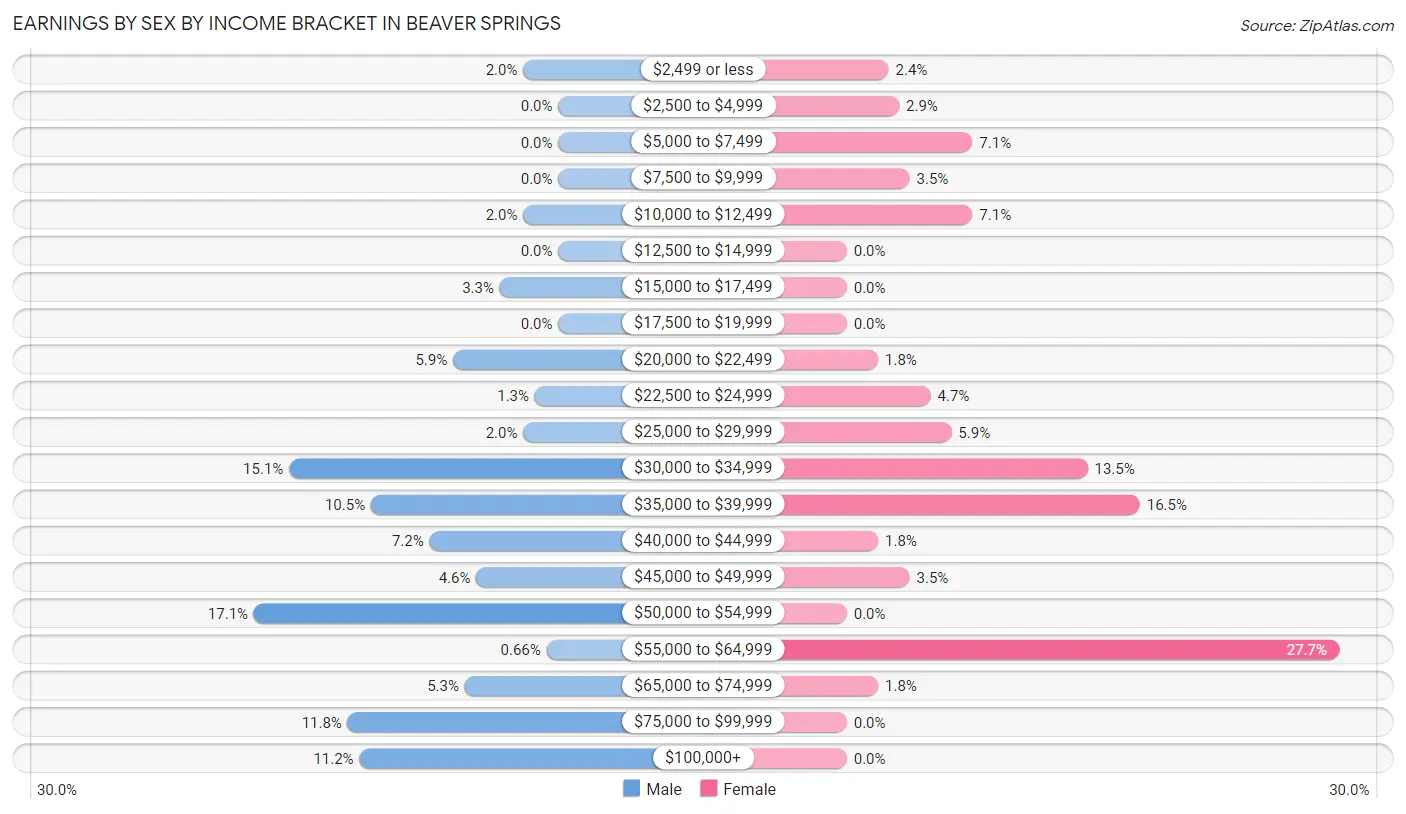
Earnings by Sex by Income Bracket in Beaver Springs
The most common earnings brackets in Beaver Springs are $50,000 to $54,999 for men (26 | 17.1%) and $55,000 to $64,999 for women (47 | 27.7%).
| Income | Male | Female |
| $2,499 or less | 3 (2.0%) | 4 (2.4%) |
| $2,500 to $4,999 | 0 (0.0%) | 5 (2.9%) |
| $5,000 to $7,499 | 0 (0.0%) | 12 (7.1%) |
| $7,500 to $9,999 | 0 (0.0%) | 6 (3.5%) |
| $10,000 to $12,499 | 3 (2.0%) | 12 (7.1%) |
| $12,500 to $14,999 | 0 (0.0%) | 0 (0.0%) |
| $15,000 to $17,499 | 5 (3.3%) | 0 (0.0%) |
| $17,500 to $19,999 | 0 (0.0%) | 0 (0.0%) |
| $20,000 to $22,499 | 9 (5.9%) | 3 (1.8%) |
| $22,500 to $24,999 | 2 (1.3%) | 8 (4.7%) |
| $25,000 to $29,999 | 3 (2.0%) | 10 (5.9%) |
| $30,000 to $34,999 | 23 (15.1%) | 23 (13.5%) |
| $35,000 to $39,999 | 16 (10.5%) | 28 (16.5%) |
| $40,000 to $44,999 | 11 (7.2%) | 3 (1.8%) |
| $45,000 to $49,999 | 7 (4.6%) | 6 (3.5%) |
| $50,000 to $54,999 | 26 (17.1%) | 0 (0.0%) |
| $55,000 to $64,999 | 1 (0.7%) | 47 (27.7%) |
| $65,000 to $74,999 | 8 (5.3%) | 3 (1.8%) |
| $75,000 to $99,999 | 18 (11.8%) | 0 (0.0%) |
| $100,000+ | 17 (11.2%) | 0 (0.0%) |
| Total | 152 (100.0%) | 170 (100.0%) |
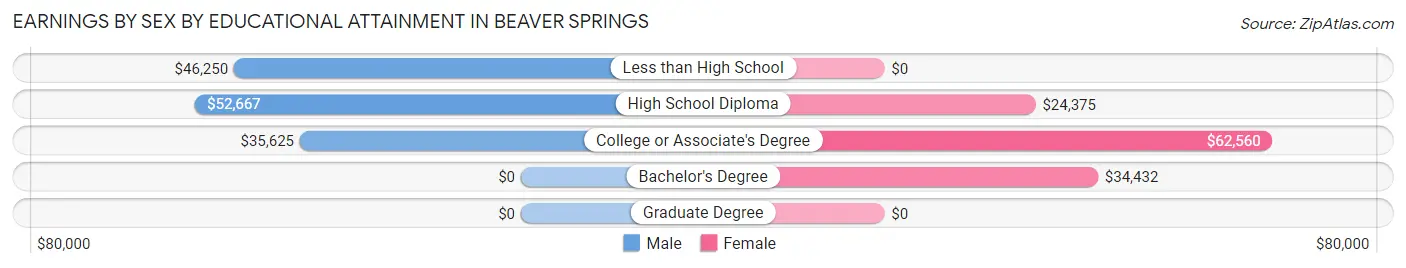
Earnings by Sex by Educational Attainment in Beaver Springs
Average earnings in Beaver Springs are $46,875 for men and $38,170 for women, a difference of 18.6%. Men with an educational attainment of high school diploma enjoy the highest average annual earnings of $52,667, while those with college or associate's degree education earn the least with $35,625. Women with an educational attainment of college or associate's degree earn the most with the average annual earnings of $62,560, while those with high school diploma education have the smallest earnings of $24,375.
| Educational Attainment | Male Income | Female Income |
| Less than High School | $46,250 | $0 |
| High School Diploma | $52,667 | $24,375 |
| College or Associate's Degree | $35,625 | $62,560 |
| Bachelor's Degree | - | - |
| Graduate Degree | - | - |
| Total | $46,875 | $38,170 |
Family Income in Beaver Springs
Family Income Brackets in Beaver Springs
According to the Beaver Springs family income data, there are 48 families falling into the $35,000 to $49,999 income range, which is the most common income bracket and makes up 31.4% of all families.
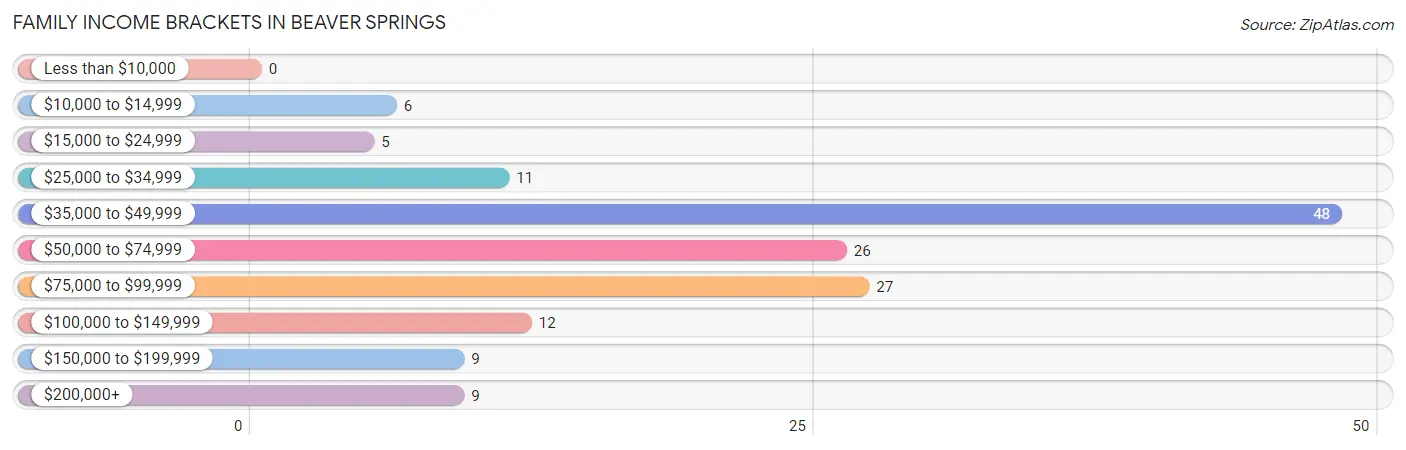
| Income Bracket | # Families | % Families |
| Less than $10,000 | 0 | 0.0% |
| $10,000 to $14,999 | 6 | 3.9% |
| $15,000 to $24,999 | 5 | 3.3% |
| $25,000 to $34,999 | 11 | 7.2% |
| $35,000 to $49,999 | 48 | 31.4% |
| $50,000 to $74,999 | 26 | 17.0% |
| $75,000 to $99,999 | 27 | 17.6% |
| $100,000 to $149,999 | 12 | 7.8% |
| $150,000 to $199,999 | 9 | 5.9% |
| $200,000+ | 9 | 5.9% |
Family Income by Famaliy Size in Beaver Springs
2-person families (84 | 54.9%) account for the highest median family income in Beaver Springs with $42,500 per family, while 2-person families (84 | 54.9%) have the highest median income of $21,250 per family member.
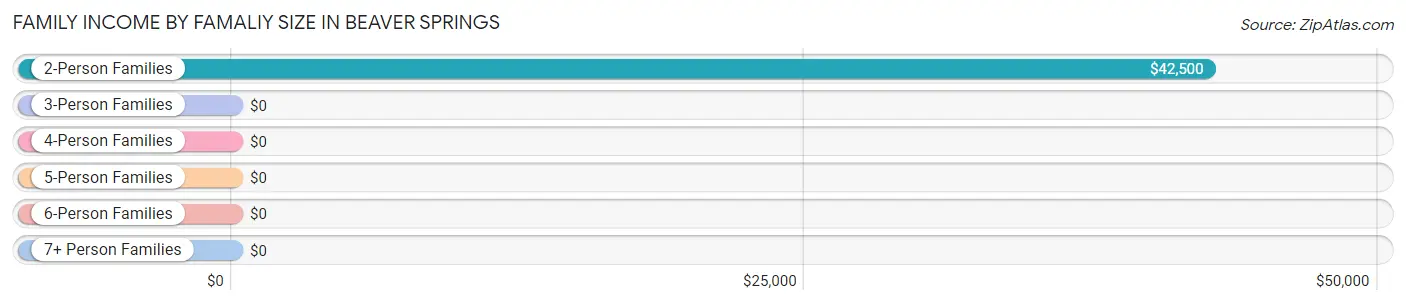
| Income Bracket | # Families | Median Income |
| 2-Person Families | 84 (54.9%) | $42,500 |
| 3-Person Families | 29 (19.0%) | $0 |
| 4-Person Families | 8 (5.2%) | $0 |
| 5-Person Families | 25 (16.3%) | $0 |
| 6-Person Families | 7 (4.6%) | $0 |
| 7+ Person Families | 0 (0.0%) | $0 |
| Total | 153 (100.0%) | $52,321 |
Family Income by Number of Earners in Beaver Springs
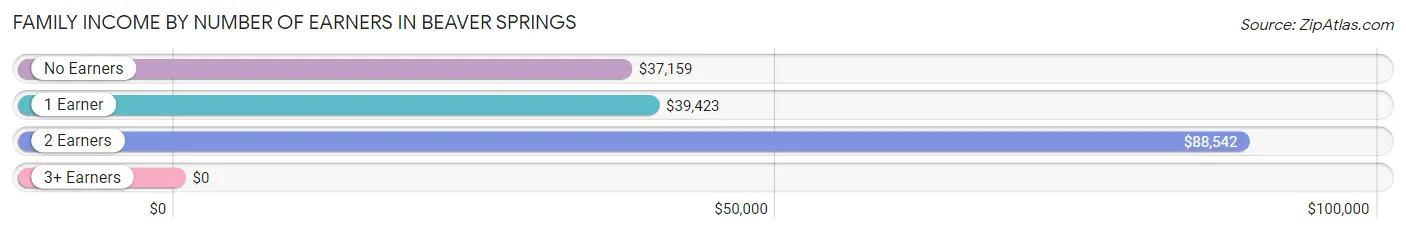
| Number of Earners | # Families | Median Income |
| No Earners | 35 (22.9%) | $37,159 |
| 1 Earner | 50 (32.7%) | $39,423 |
| 2 Earners | 62 (40.5%) | $88,542 |
| 3+ Earners | 6 (3.9%) | $0 |
| Total | 153 (100.0%) | $52,321 |
Household Income in Beaver Springs
Household Income Brackets in Beaver Springs
With 72 households falling in the category, the $15,000 to $24,999 income range is the most frequent in Beaver Springs, accounting for 22.0% of all households. In contrast, only 1 households (0.3%) fall into the less than $10,000 income bracket, making it the least populous group.
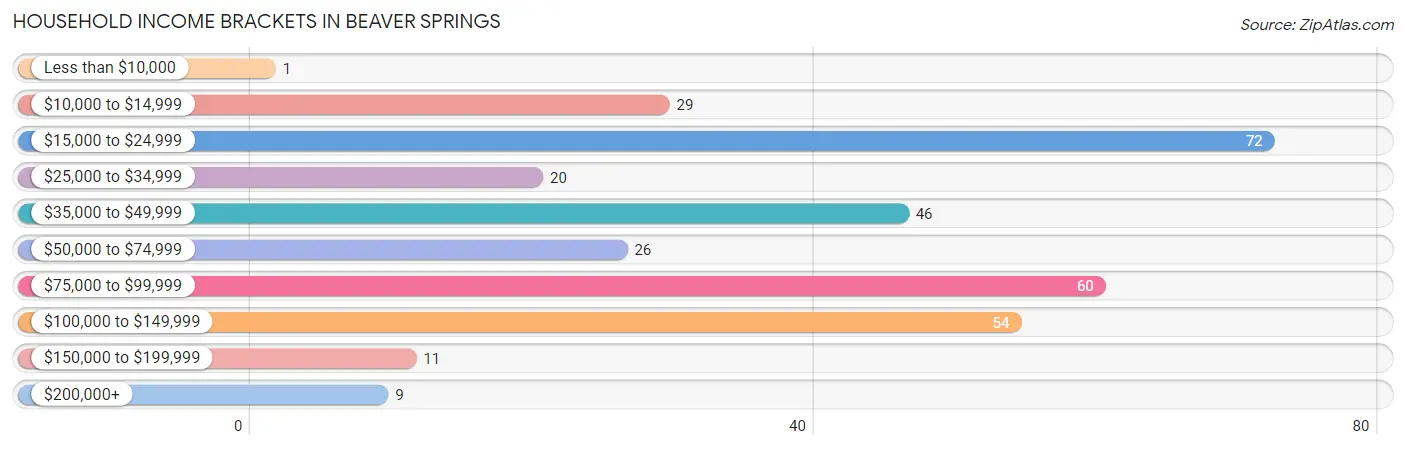
| Income Bracket | # Households | % Households |
| Less than $10,000 | 1 | 0.3% |
| $10,000 to $14,999 | 29 | 8.8% |
| $15,000 to $24,999 | 72 | 22.0% |
| $25,000 to $34,999 | 20 | 6.1% |
| $35,000 to $49,999 | 46 | 14.0% |
| $50,000 to $74,999 | 26 | 7.9% |
| $75,000 to $99,999 | 60 | 18.3% |
| $100,000 to $149,999 | 54 | 16.5% |
| $150,000 to $199,999 | 11 | 3.4% |
| $200,000+ | 9 | 2.7% |
Household Income by Householder Age in Beaver Springs
The median household income in Beaver Springs is $48,571, with the highest median household income of $89,167 found in the 45 to 64 years age bracket for the primary householder. A total of 108 households (32.9%) fall into this category. Meanwhile, the 65+ years age bracket for the primary householder has the lowest median household income of $24,688, with 143 households (43.6%) in this group.
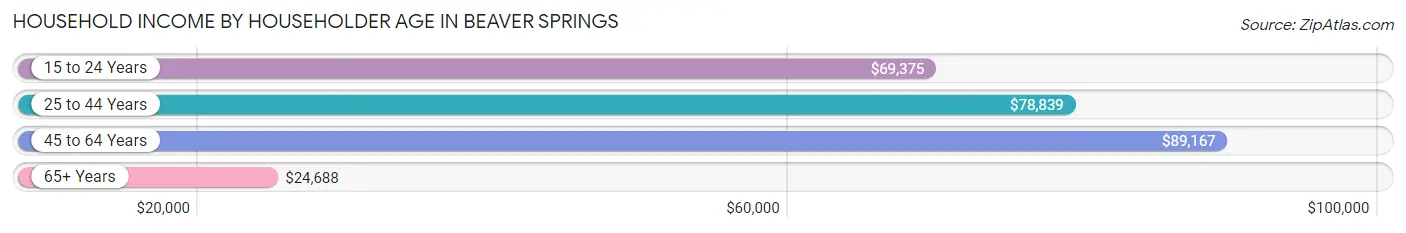
| Income Bracket | # Households | Median Income |
| 15 to 24 Years | 8 (2.4%) | $69,375 |
| 25 to 44 Years | 69 (21.0%) | $78,839 |
| 45 to 64 Years | 108 (32.9%) | $89,167 |
| 65+ Years | 143 (43.6%) | $24,688 |
| Total | 328 (100.0%) | $48,571 |
Poverty in Beaver Springs
Income Below Poverty by Sex and Age in Beaver Springs
With 11.5% poverty level for males and 9.5% for females among the residents of Beaver Springs, 18 to 24 year old males and 45 to 54 year old females are the most vulnerable to poverty, with 4 males (50.0%) and 9 females (21.4%) in their respective age groups living below the poverty level.
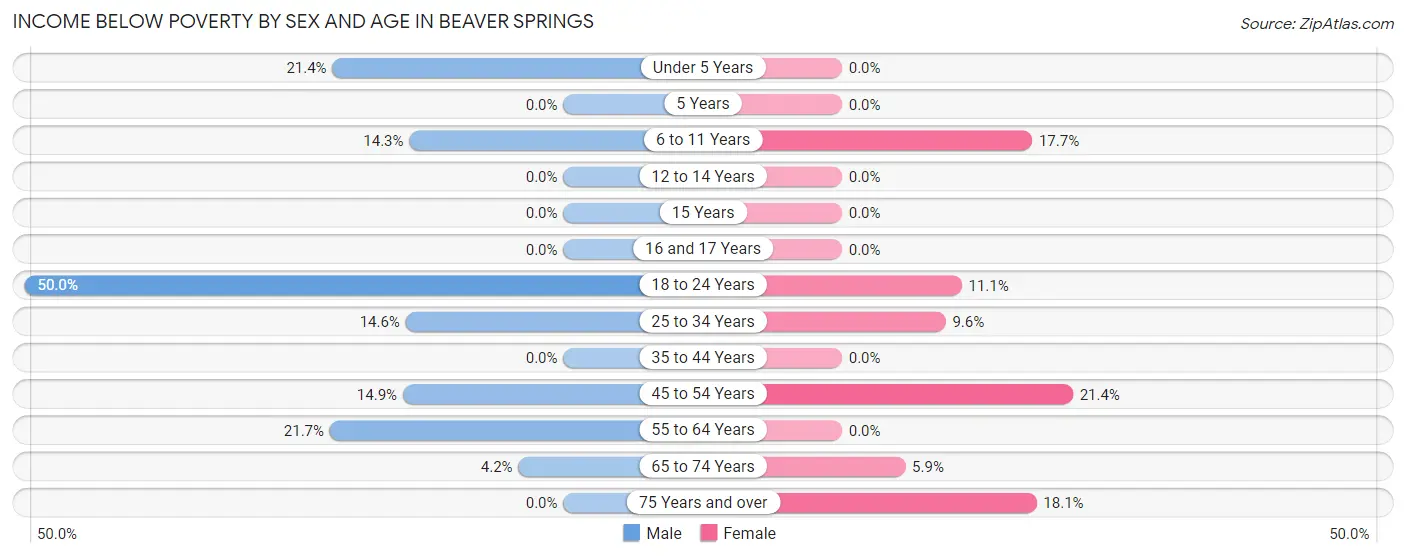
| Age Bracket | Male | Female |
| Under 5 Years | 6 (21.4%) | 0 (0.0%) |
| 5 Years | 0 (0.0%) | 0 (0.0%) |
| 6 to 11 Years | 3 (14.3%) | 3 (17.6%) |
| 12 to 14 Years | 0 (0.0%) | 0 (0.0%) |
| 15 Years | 0 (0.0%) | 0 (0.0%) |
| 16 and 17 Years | 0 (0.0%) | 0 (0.0%) |
| 18 to 24 Years | 4 (50.0%) | 1 (11.1%) |
| 25 to 34 Years | 6 (14.6%) | 5 (9.6%) |
| 35 to 44 Years | 0 (0.0%) | 0 (0.0%) |
| 45 to 54 Years | 7 (14.9%) | 9 (21.4%) |
| 55 to 64 Years | 13 (21.7%) | 0 (0.0%) |
| 65 to 74 Years | 3 (4.2%) | 2 (5.9%) |
| 75 Years and over | 0 (0.0%) | 13 (18.1%) |
| Total | 42 (11.5%) | 33 (9.5%) |
Income Above Poverty by Sex and Age in Beaver Springs
According to the poverty statistics in Beaver Springs, males aged 12 to 14 years and females aged under 5 years are the age groups that are most secure financially, with 100.0% of males and 100.0% of females in these age groups living above the poverty line.
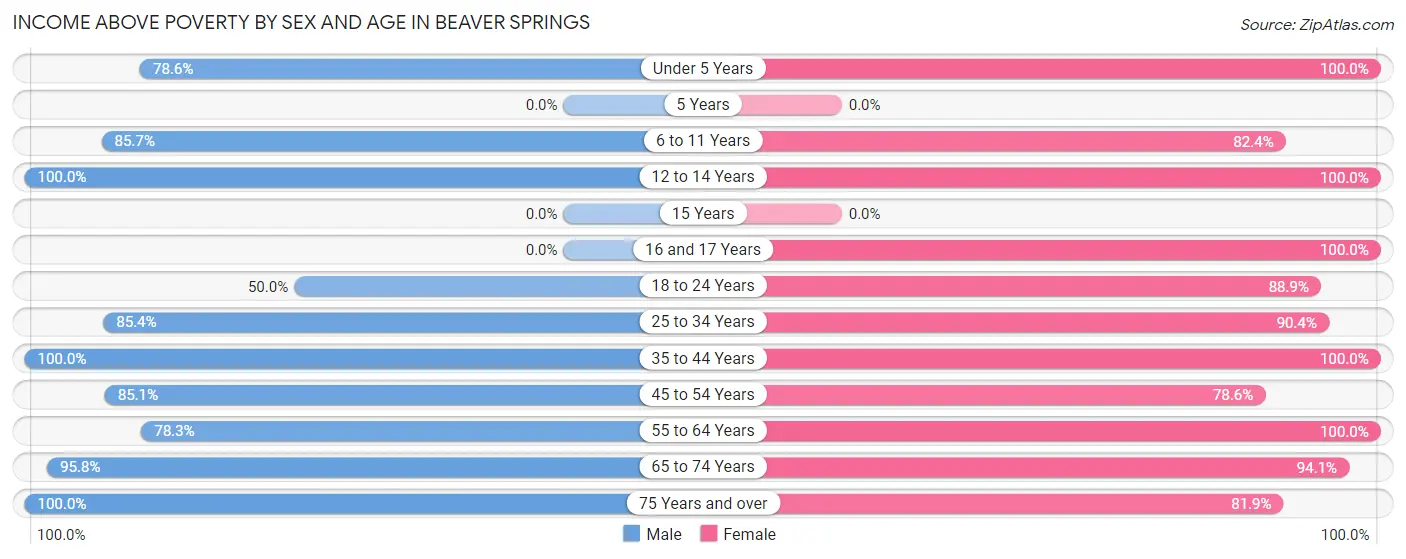
| Age Bracket | Male | Female |
| Under 5 Years | 22 (78.6%) | 12 (100.0%) |
| 5 Years | 0 (0.0%) | 0 (0.0%) |
| 6 to 11 Years | 18 (85.7%) | 14 (82.4%) |
| 12 to 14 Years | 38 (100.0%) | 20 (100.0%) |
| 15 Years | 0 (0.0%) | 0 (0.0%) |
| 16 and 17 Years | 0 (0.0%) | 18 (100.0%) |
| 18 to 24 Years | 4 (50.0%) | 8 (88.9%) |
| 25 to 34 Years | 35 (85.4%) | 47 (90.4%) |
| 35 to 44 Years | 31 (100.0%) | 24 (100.0%) |
| 45 to 54 Years | 40 (85.1%) | 33 (78.6%) |
| 55 to 64 Years | 47 (78.3%) | 48 (100.0%) |
| 65 to 74 Years | 69 (95.8%) | 32 (94.1%) |
| 75 Years and over | 19 (100.0%) | 59 (81.9%) |
| Total | 323 (88.5%) | 315 (90.5%) |
Income Below Poverty Among Married-Couple Families in Beaver Springs
The poverty statistics for married-couple families in Beaver Springs show that 8.1% or 9 of the total 111 families live below the poverty line. Families with 3 or 4 children have the highest poverty rate of 13.0%, comprising of 3 families. On the other hand, families with 1 or 2 children have the lowest poverty rate of 0.0%, which includes 0 families.
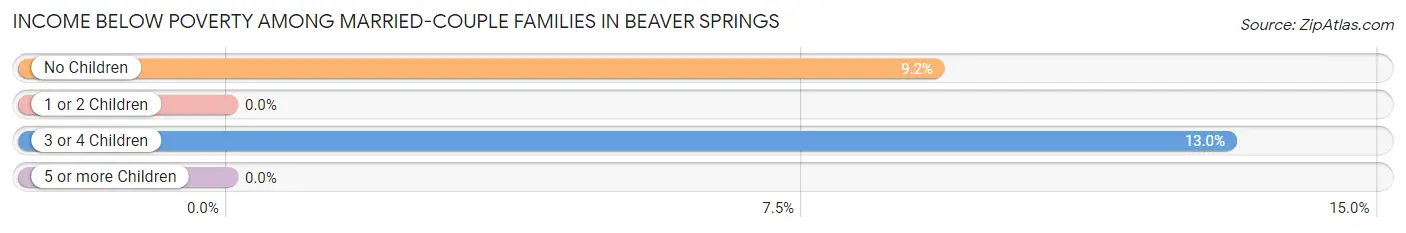
| Children | Above Poverty | Below Poverty |
| No Children | 59 (90.8%) | 6 (9.2%) |
| 1 or 2 Children | 23 (100.0%) | 0 (0.0%) |
| 3 or 4 Children | 20 (87.0%) | 3 (13.0%) |
| 5 or more Children | 0 (0.0%) | 0 (0.0%) |
| Total | 102 (91.9%) | 9 (8.1%) |
Income Below Poverty Among Single-Parent Households in Beaver Springs
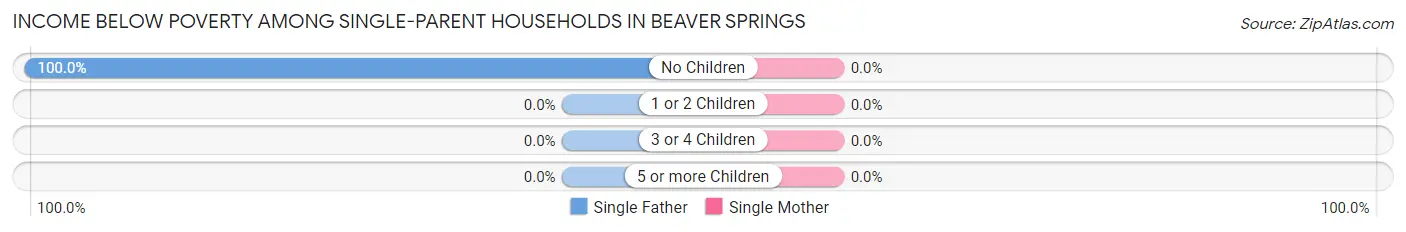
| Children | Single Father | Single Mother |
| No Children | 2 (100.0%) | 0 (0.0%) |
| 1 or 2 Children | 0 (0.0%) | 0 (0.0%) |
| 3 or 4 Children | 0 (0.0%) | 0 (0.0%) |
| 5 or more Children | 0 (0.0%) | 0 (0.0%) |
| Total | 2 (20.0%) | 0 (0.0%) |
Income Below Poverty Among Married-Couple vs Single-Parent Households in Beaver Springs
The poverty data for Beaver Springs shows that 9 of the married-couple family households (8.1%) and 2 of the single-parent households (4.8%) are living below the poverty level. Within the married-couple family households, those with 3 or 4 children have the highest poverty rate, with 3 households (13.0%) falling below the poverty line. Among the single-parent households, those with no children have the highest poverty rate, with 2 household (22.2%) living below poverty.
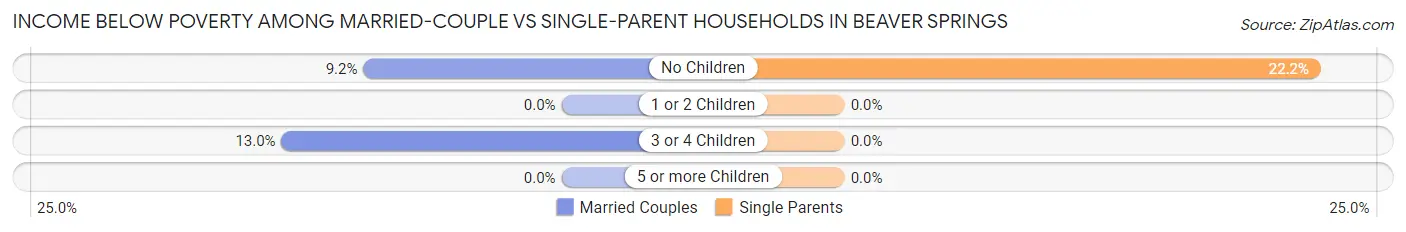
| Children | Married-Couple Families | Single-Parent Households |
| No Children | 6 (9.2%) | 2 (22.2%) |
| 1 or 2 Children | 0 (0.0%) | 0 (0.0%) |
| 3 or 4 Children | 3 (13.0%) | 0 (0.0%) |
| 5 or more Children | 0 (0.0%) | 0 (0.0%) |
| Total | 9 (8.1%) | 2 (4.8%) |
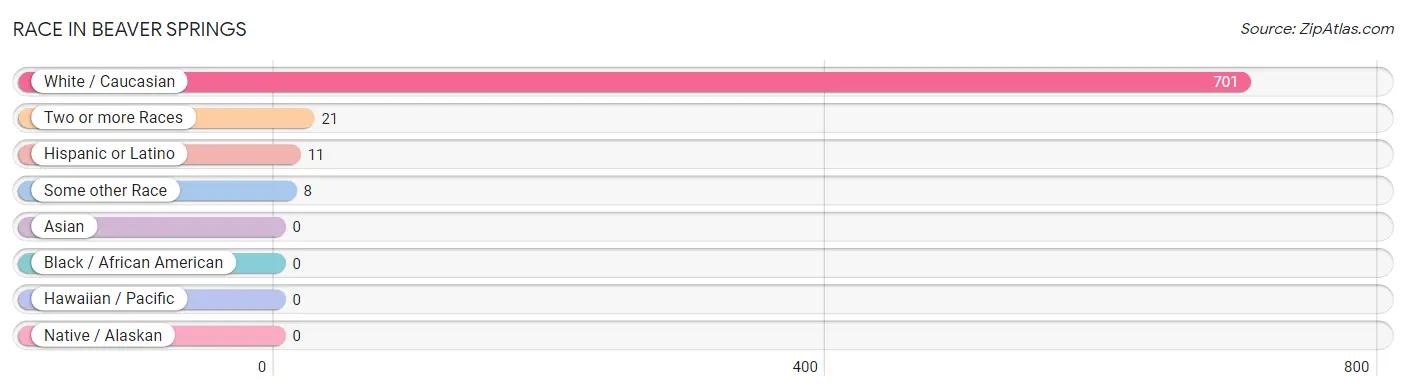
Race in Beaver Springs
The most populous races in Beaver Springs are White / Caucasian (701 | 96.0%), Two or more Races (21 | 2.9%), and Hispanic or Latino (11 | 1.5%).
| Race | # Population | % Population |
| Asian | 0 | 0.0% |
| Black / African American | 0 | 0.0% |
| Hawaiian / Pacific | 0 | 0.0% |
| Hispanic or Latino | 11 | 1.5% |
| Native / Alaskan | 0 | 0.0% |
| White / Caucasian | 701 | 96.0% |
| Two or more Races | 21 | 2.9% |
| Some other Race | 8 | 1.1% |
| Total | 730 | 100.0% |
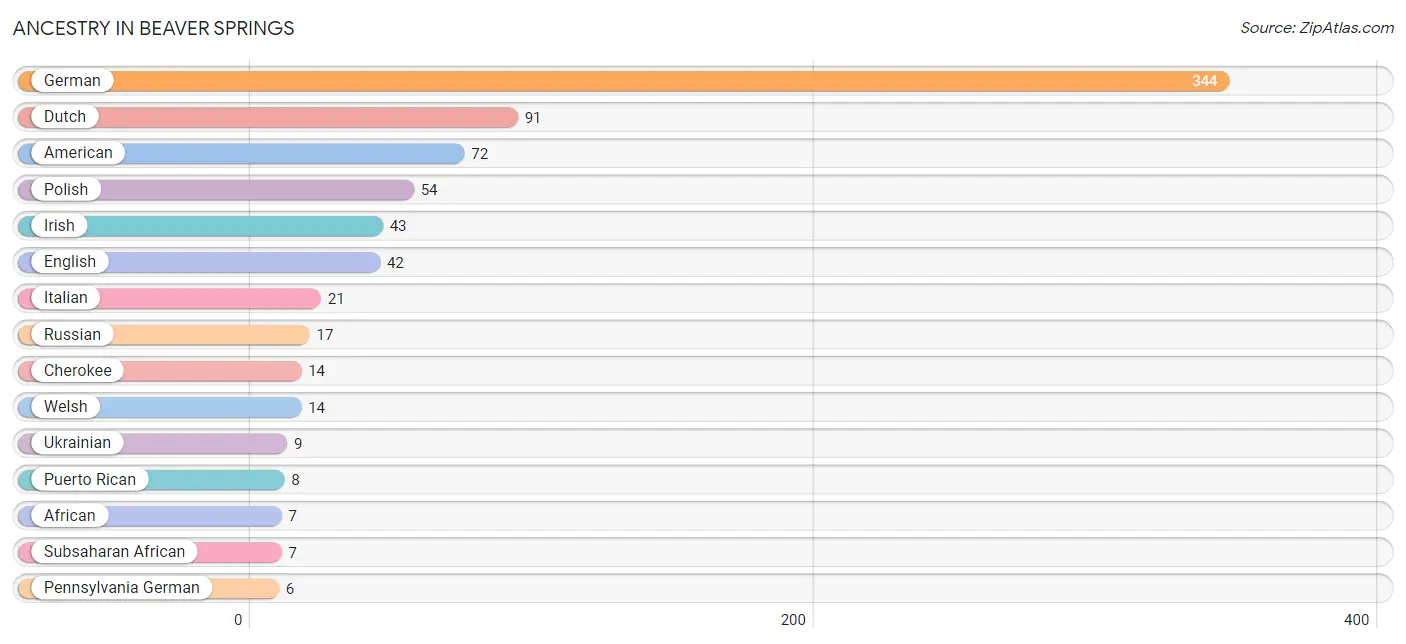
Ancestry in Beaver Springs
The most populous ancestries reported in Beaver Springs are German (344 | 47.1%), Dutch (91 | 12.5%), American (72 | 9.9%), Polish (54 | 7.4%), and Irish (43 | 5.9%), together accounting for 82.7% of all Beaver Springs residents.
| Ancestry | # Population | % Population |
| African | 7 | 1.0% |
| American | 72 | 9.9% |
| British | 3 | 0.4% |
| Central American | 2 | 0.3% |
| Cherokee | 14 | 1.9% |
| Dutch | 91 | 12.5% |
| English | 42 | 5.8% |
| German | 344 | 47.1% |
| Irish | 43 | 5.9% |
| Italian | 21 | 2.9% |
| Panamanian | 2 | 0.3% |
| Pennsylvania German | 6 | 0.8% |
| Polish | 54 | 7.4% |
| Puerto Rican | 8 | 1.1% |
| Russian | 17 | 2.3% |
| Scandinavian | 3 | 0.4% |
| Scotch-Irish | 3 | 0.4% |
| Subsaharan African | 7 | 1.0% |
| Swiss | 2 | 0.3% |
| Ukrainian | 9 | 1.2% |
| Welsh | 14 | 1.9% | View All 21 Rows |
Immigrants in Beaver Springs
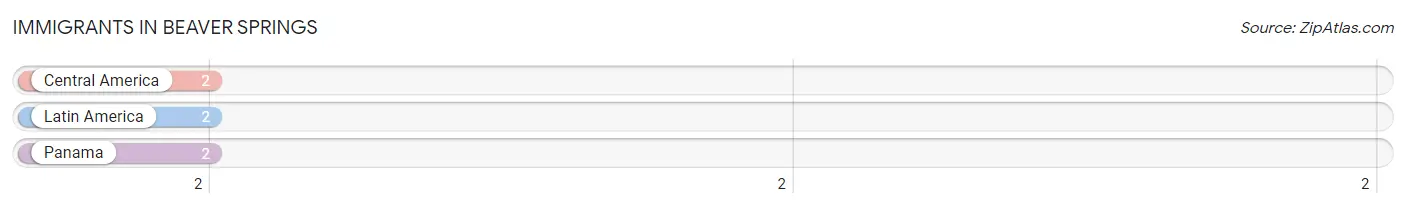
The most numerous immigrant groups reported in Beaver Springs came from Central America (2 | 0.3%), Latin America (2 | 0.3%), and Panama (2 | 0.3%), together accounting for 0.8% of all Beaver Springs residents.
| Immigration Origin | # Population | % Population |
| Central America | 2 | 0.3% |
| Latin America | 2 | 0.3% |
| Panama | 2 | 0.3% | View All 3 Rows |
Sex and Age in Beaver Springs
Sex and Age in Beaver Springs
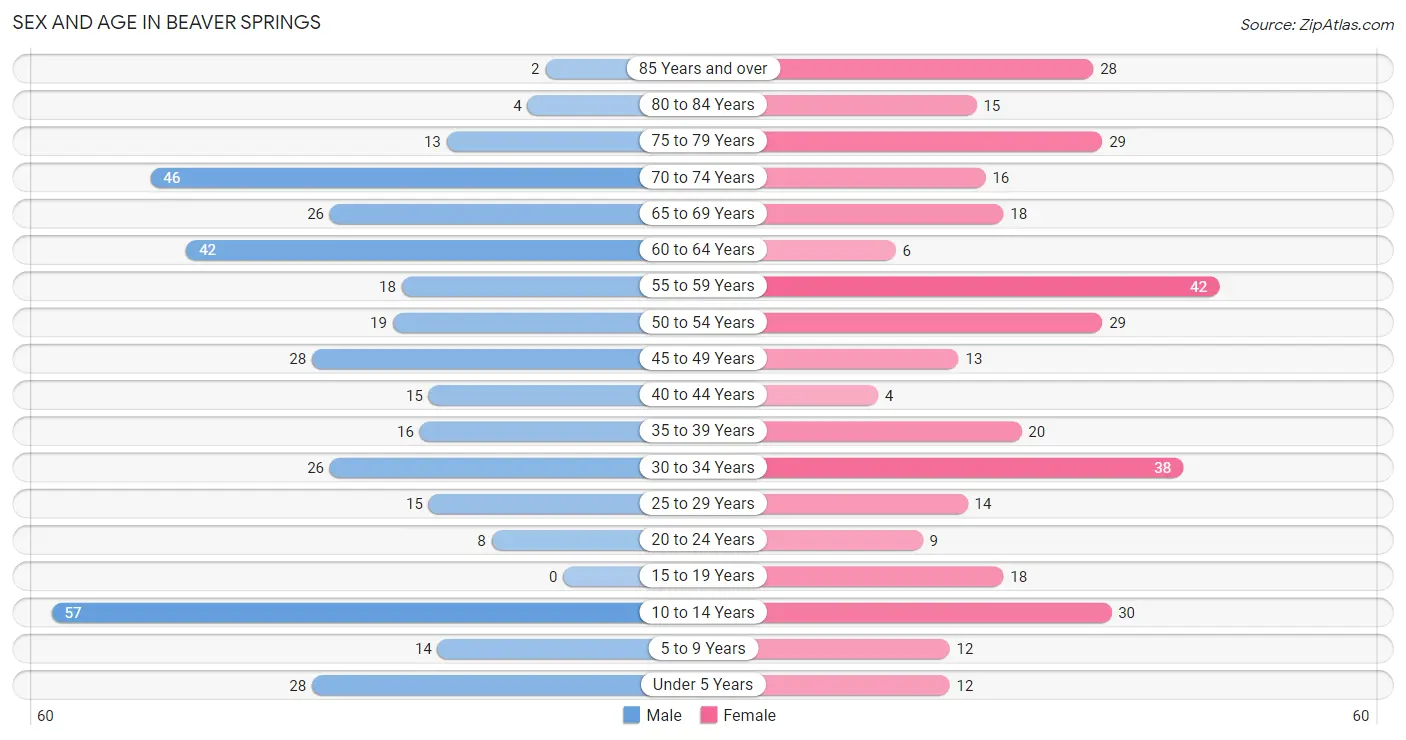
The most populous age groups in Beaver Springs are 10 to 14 Years (57 | 15.1%) for men and 55 to 59 Years (42 | 11.9%) for women.
| Age Bracket | Male | Female |
| Under 5 Years | 28 (7.4%) | 12 (3.4%) |
| 5 to 9 Years | 14 (3.7%) | 12 (3.4%) |
| 10 to 14 Years | 57 (15.1%) | 30 (8.5%) |
| 15 to 19 Years | 0 (0.0%) | 18 (5.1%) |
| 20 to 24 Years | 8 (2.1%) | 9 (2.5%) |
| 25 to 29 Years | 15 (4.0%) | 14 (4.0%) |
| 30 to 34 Years | 26 (6.9%) | 38 (10.8%) |
| 35 to 39 Years | 16 (4.2%) | 20 (5.7%) |
| 40 to 44 Years | 15 (4.0%) | 4 (1.1%) |
| 45 to 49 Years | 28 (7.4%) | 13 (3.7%) |
| 50 to 54 Years | 19 (5.0%) | 29 (8.2%) |
| 55 to 59 Years | 18 (4.8%) | 42 (11.9%) |
| 60 to 64 Years | 42 (11.1%) | 6 (1.7%) |
| 65 to 69 Years | 26 (6.9%) | 18 (5.1%) |
| 70 to 74 Years | 46 (12.2%) | 16 (4.5%) |
| 75 to 79 Years | 13 (3.5%) | 29 (8.2%) |
| 80 to 84 Years | 4 (1.1%) | 15 (4.3%) |
| 85 Years and over | 2 (0.5%) | 28 (7.9%) |
| Total | 377 (100.0%) | 353 (100.0%) |
Families and Households in Beaver Springs
Median Family Size in Beaver Springs
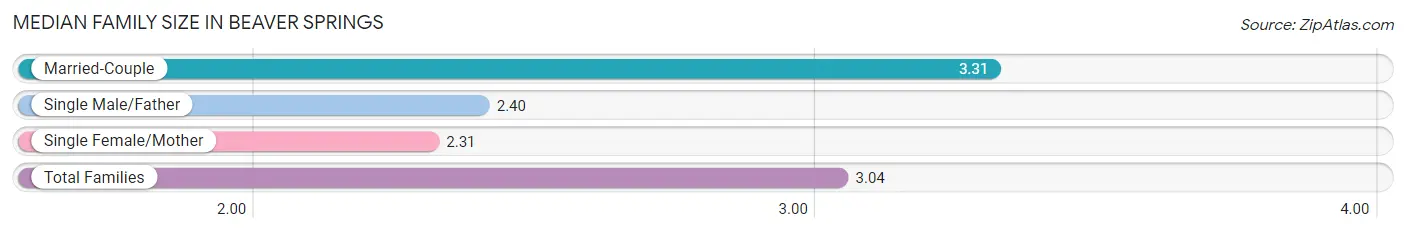
The median family size in Beaver Springs is 3.04 persons per family, with married-couple families (111 | 72.6%) accounting for the largest median family size of 3.31 persons per family. On the other hand, single female/mother families (32 | 20.9%) represent the smallest median family size with 2.31 persons per family.
| Family Type | # Families | Family Size |
| Married-Couple | 111 (72.6%) | 3.31 |
| Single Male/Father | 10 (6.5%) | 2.40 |
| Single Female/Mother | 32 (20.9%) | 2.31 |
| Total Families | 153 (100.0%) | 3.04 |
Median Household Size in Beaver Springs
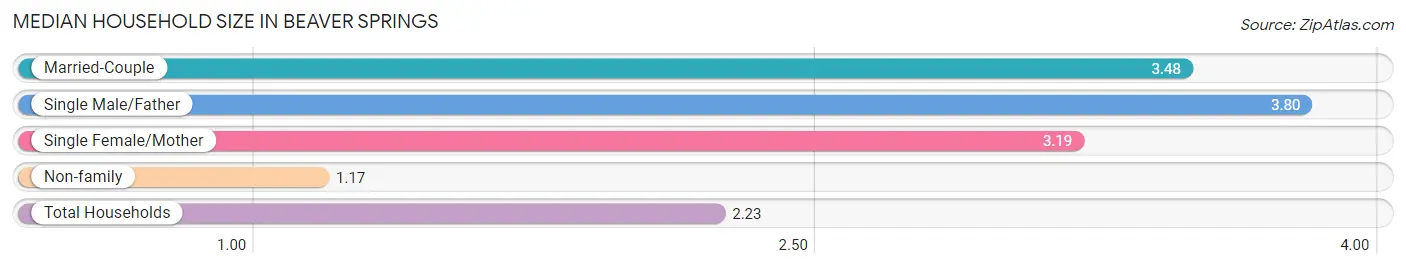
The median household size in Beaver Springs is 2.23 persons per household, with single male/father households (10 | 3.0%) accounting for the largest median household size of 3.8 persons per household. non-family households (175 | 53.3%) represent the smallest median household size with 1.17 persons per household.
| Household Type | # Households | Household Size |
| Married-Couple | 111 (33.8%) | 3.48 |
| Single Male/Father | 10 (3.0%) | 3.80 |
| Single Female/Mother | 32 (9.8%) | 3.19 |
| Non-family | 175 (53.3%) | 1.17 |
| Total Households | 328 (100.0%) | 2.23 |
Household Size by Marriage Status in Beaver Springs
Out of a total of 328 households in Beaver Springs, 153 (46.7%) are family households, while 175 (53.3%) are nonfamily households. The most numerous type of family households are 2-person households, comprising 66, and the most common type of nonfamily households are 1-person households, comprising 121.
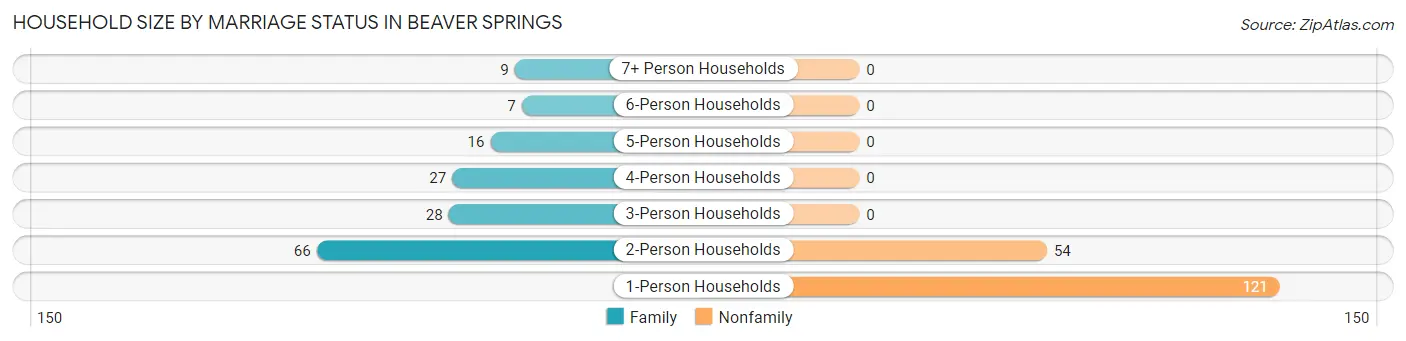
| Household Size | Family Households | Nonfamily Households |
| 1-Person Households | - | 121 (36.9%) |
| 2-Person Households | 66 (20.1%) | 54 (16.5%) |
| 3-Person Households | 28 (8.5%) | 0 (0.0%) |
| 4-Person Households | 27 (8.2%) | 0 (0.0%) |
| 5-Person Households | 16 (4.9%) | 0 (0.0%) |
| 6-Person Households | 7 (2.1%) | 0 (0.0%) |
| 7+ Person Households | 9 (2.7%) | 0 (0.0%) |
| Total | 153 (46.7%) | 175 (53.3%) |
Female Fertility in Beaver Springs
Fertility by Age in Beaver Springs
Average fertility rate in Beaver Springs is 68.0 births per 1,000 women. Women in the age bracket of 35 to 50 years have the highest fertility rate with 93.0 births per 1,000 women. Women in the age bracket of 35 to 50 years acount for 55.6% of all women with births.
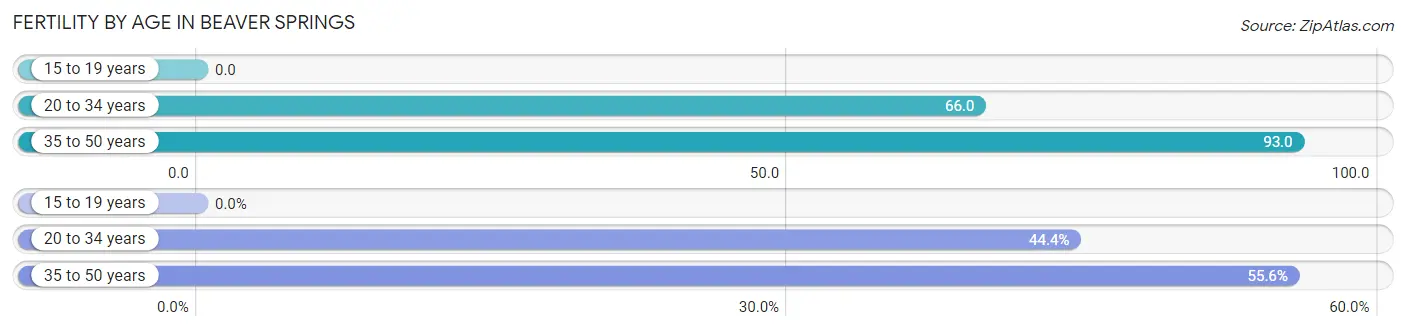
| Age Bracket | Women with Births | Births / 1,000 Women |
| 15 to 19 years | 0 (0.0%) | 0.0 |
| 20 to 34 years | 4 (44.4%) | 66.0 |
| 35 to 50 years | 5 (55.6%) | 93.0 |
| Total | 9 (100.0%) | 68.0 |
Fertility by Age by Marriage Status in Beaver Springs
44.4% of women with births (9) in Beaver Springs are married. The highest percentage of unmarried women with births falls into 35 to 50 years age bracket with 100.0% of them unmarried at the time of birth, while the lowest percentage of unmarried women with births belong to 20 to 34 years age bracket with 0.0% of them unmarried.
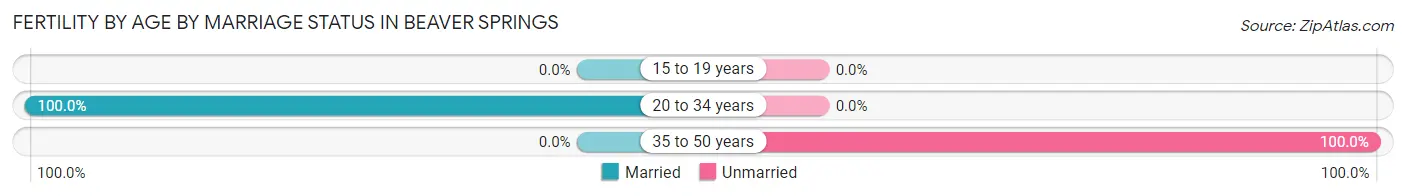
| Age Bracket | Married | Unmarried |
| 15 to 19 years | 0 (0.0%) | 0 (0.0%) |
| 20 to 34 years | 4 (100.0%) | 0 (0.0%) |
| 35 to 50 years | 0 (0.0%) | 5 (100.0%) |
| Total | 4 (44.4%) | 5 (55.6%) |
Fertility by Education in Beaver Springs
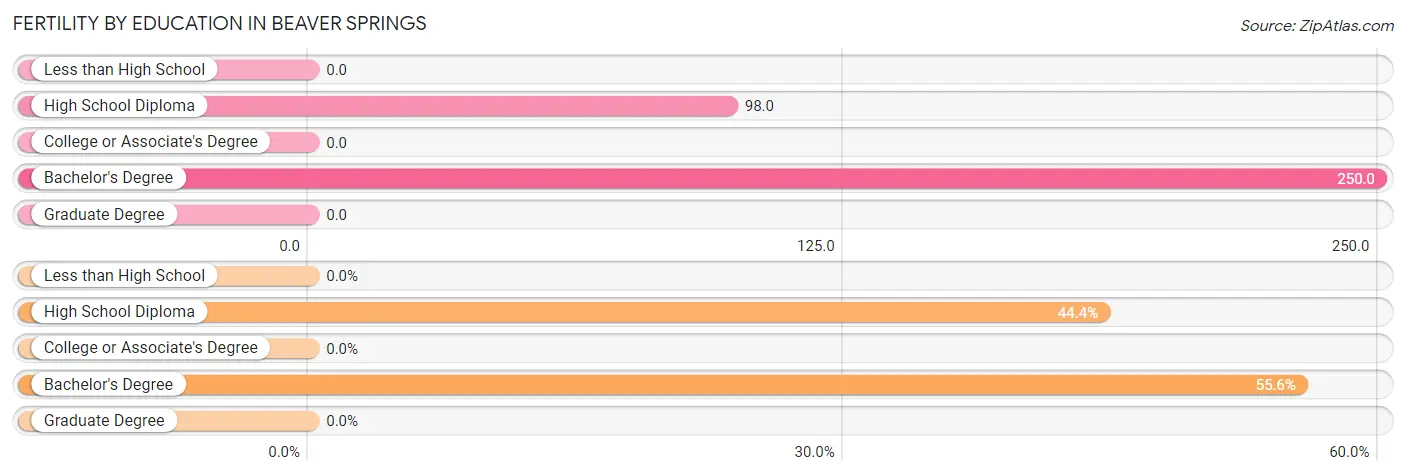
| Educational Attainment | Women with Births | Births / 1,000 Women |
| Less than High School | 0 (0.0%) | 0.0 |
| High School Diploma | 4 (44.4%) | 98.0 |
| College or Associate's Degree | 0 (0.0%) | 0.0 |
| Bachelor's Degree | 5 (55.6%) | 250.0 |
| Graduate Degree | 0 (0.0%) | 0.0 |
| Total | 9 (100.0%) | 68.0 |
Fertility by Education by Marriage Status in Beaver Springs
55.6% of women with births in Beaver Springs are unmarried. Women with the educational attainment of high school diploma are most likely to be married with 100.0% of them married at childbirth, while women with the educational attainment of bachelor's degree are least likely to be married with 100.0% of them unmarried at childbirth.
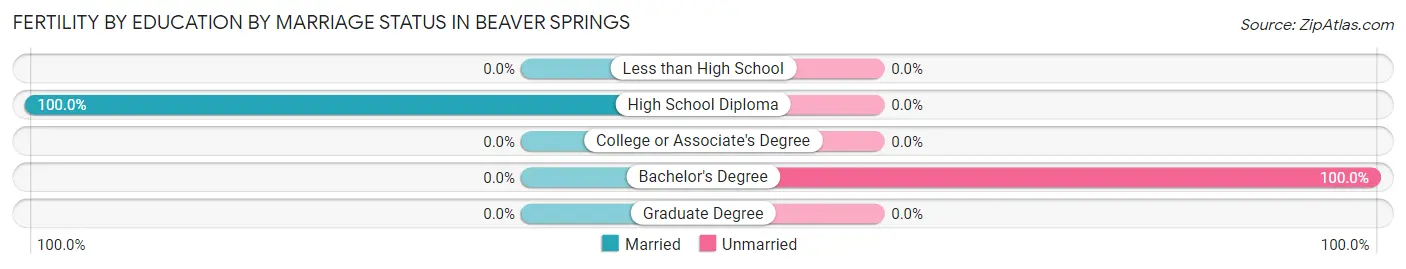
| Educational Attainment | Married | Unmarried |
| Less than High School | 0 (0.0%) | 0 (0.0%) |
| High School Diploma | 4 (100.0%) | 0 (0.0%) |
| College or Associate's Degree | 0 (0.0%) | 0 (0.0%) |
| Bachelor's Degree | 0 (0.0%) | 5 (100.0%) |
| Graduate Degree | 0 (0.0%) | 0 (0.0%) |
| Total | 4 (44.4%) | 5 (55.6%) |
Employment Characteristics in Beaver Springs
Employment by Class of Employer in Beaver Springs
Among the 301 employed individuals in Beaver Springs, private company employees (166 | 55.1%), not-for-profit organizations (68 | 22.6%), and self-employed (incorporated) (19 | 6.3%) make up the most common classes of employment.
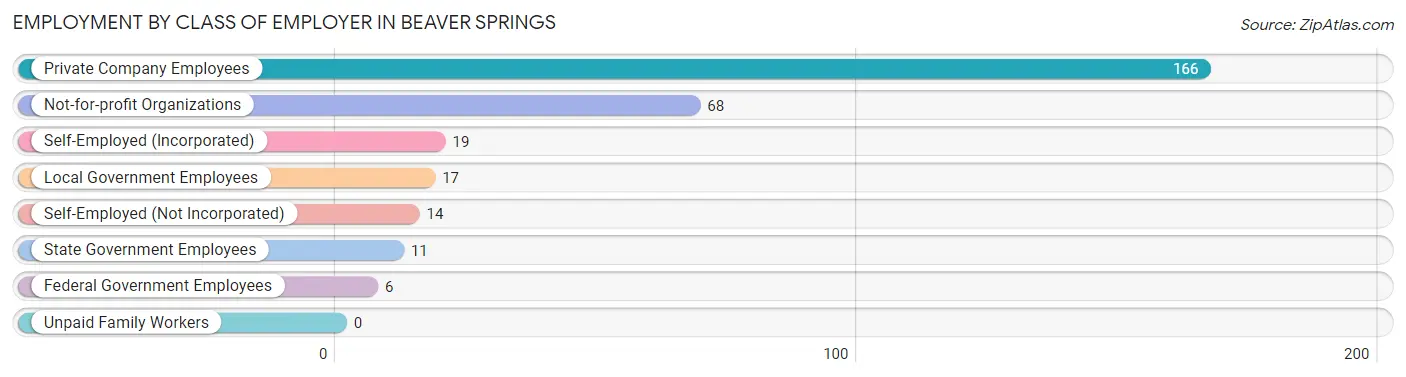
| Employer Class | # Employees | % Employees |
| Private Company Employees | 166 | 55.1% |
| Self-Employed (Incorporated) | 19 | 6.3% |
| Self-Employed (Not Incorporated) | 14 | 4.6% |
| Not-for-profit Organizations | 68 | 22.6% |
| Local Government Employees | 17 | 5.7% |
| State Government Employees | 11 | 3.6% |
| Federal Government Employees | 6 | 2.0% |
| Unpaid Family Workers | 0 | 0.0% |
| Total | 301 | 100.0% |
Employment Status by Age in Beaver Springs
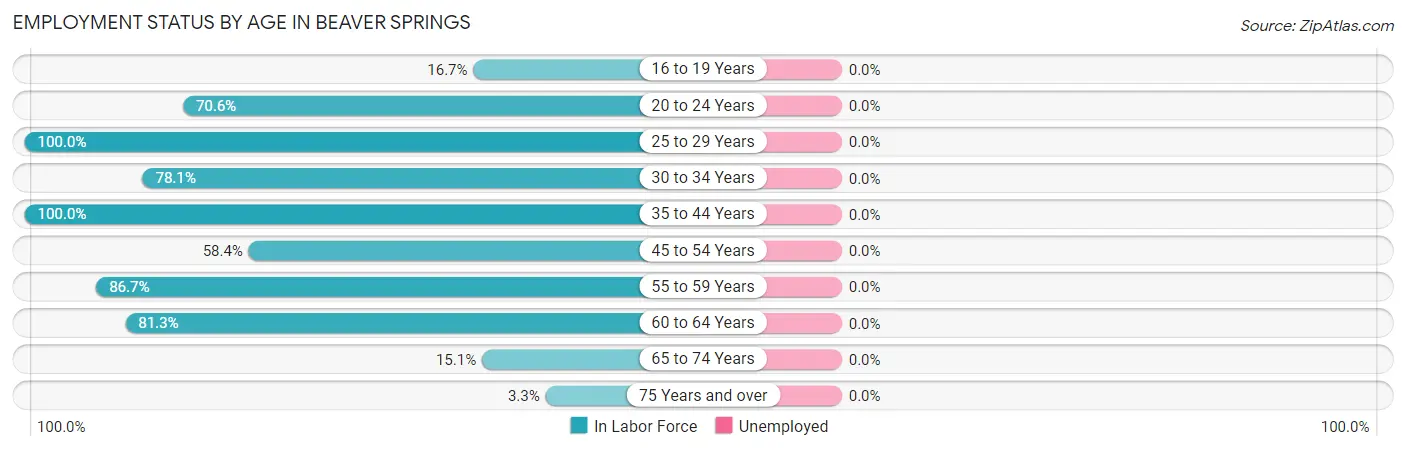
| Age Bracket | In Labor Force | Unemployed |
| 16 to 19 Years | 3 (16.7%) | 0 (0.0%) |
| 20 to 24 Years | 12 (70.6%) | 0 (0.0%) |
| 25 to 29 Years | 29 (100.0%) | 0 (0.0%) |
| 30 to 34 Years | 50 (78.1%) | 0 (0.0%) |
| 35 to 44 Years | 55 (100.0%) | 0 (0.0%) |
| 45 to 54 Years | 52 (58.4%) | 0 (0.0%) |
| 55 to 59 Years | 52 (86.7%) | 0 (0.0%) |
| 60 to 64 Years | 39 (81.3%) | 0 (0.0%) |
| 65 to 74 Years | 16 (15.1%) | 0 (0.0%) |
| 75 Years and over | 3 (3.3%) | 0 (0.0%) |
| Total | 311 (53.9%) | 0 (0.0%) |
Employment Status by Educational Attainment in Beaver Springs
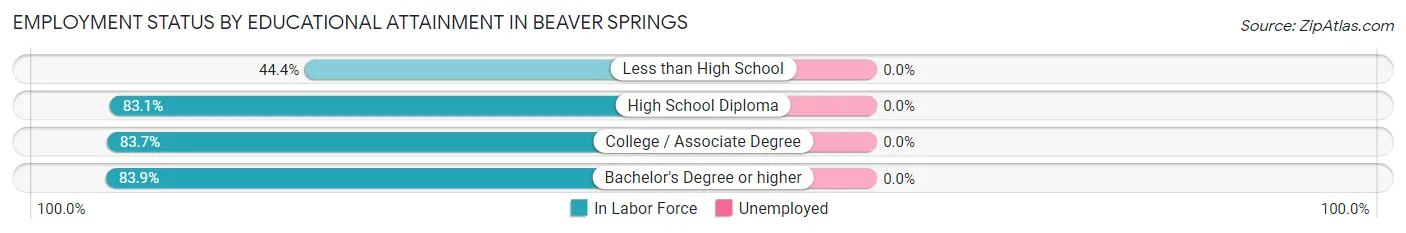
| Educational Attainment | In Labor Force | Unemployed |
| Less than High School | 12 (44.4%) | 0 (0.0%) |
| High School Diploma | 152 (83.1%) | 0 (0.0%) |
| College / Associate Degree | 87 (83.7%) | 0 (0.0%) |
| Bachelor's Degree or higher | 26 (83.9%) | 0 (0.0%) |
| Total | 277 (80.3%) | 0 (0.0%) |
Employment Occupations by Sex in Beaver Springs
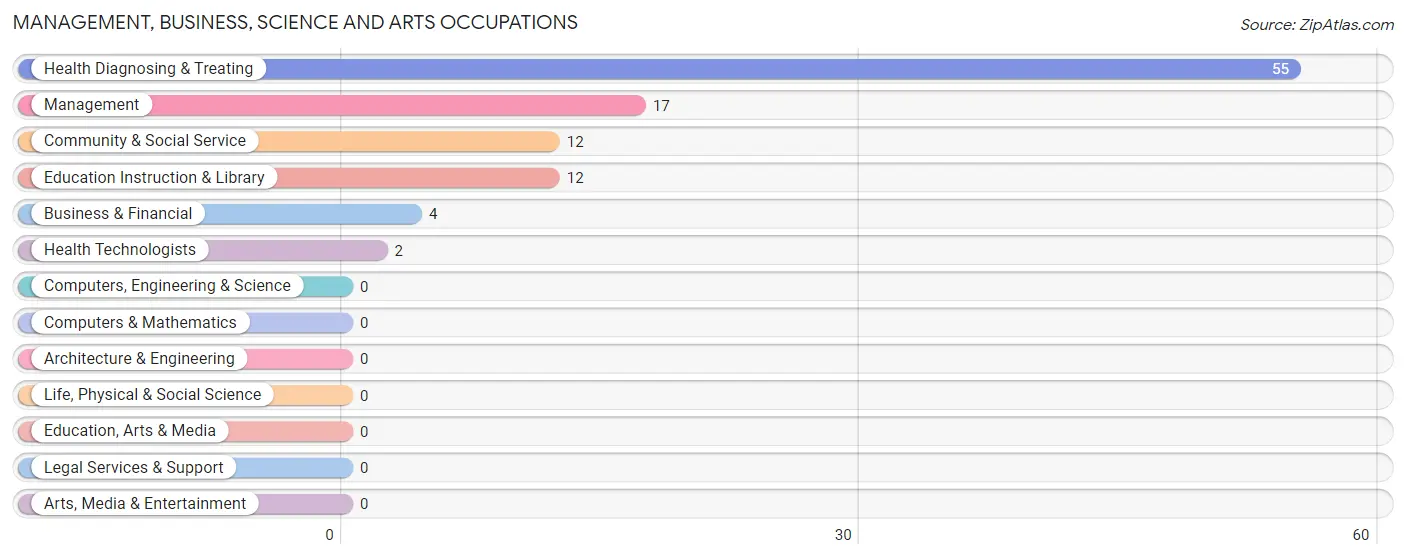
Management, Business, Science and Arts Occupations
The most common Management, Business, Science and Arts occupations in Beaver Springs are Health Diagnosing & Treating (55 | 17.9%), Management (17 | 5.5%), Community & Social Service (12 | 3.9%), Education Instruction & Library (12 | 3.9%), and Business & Financial (4 | 1.3%).
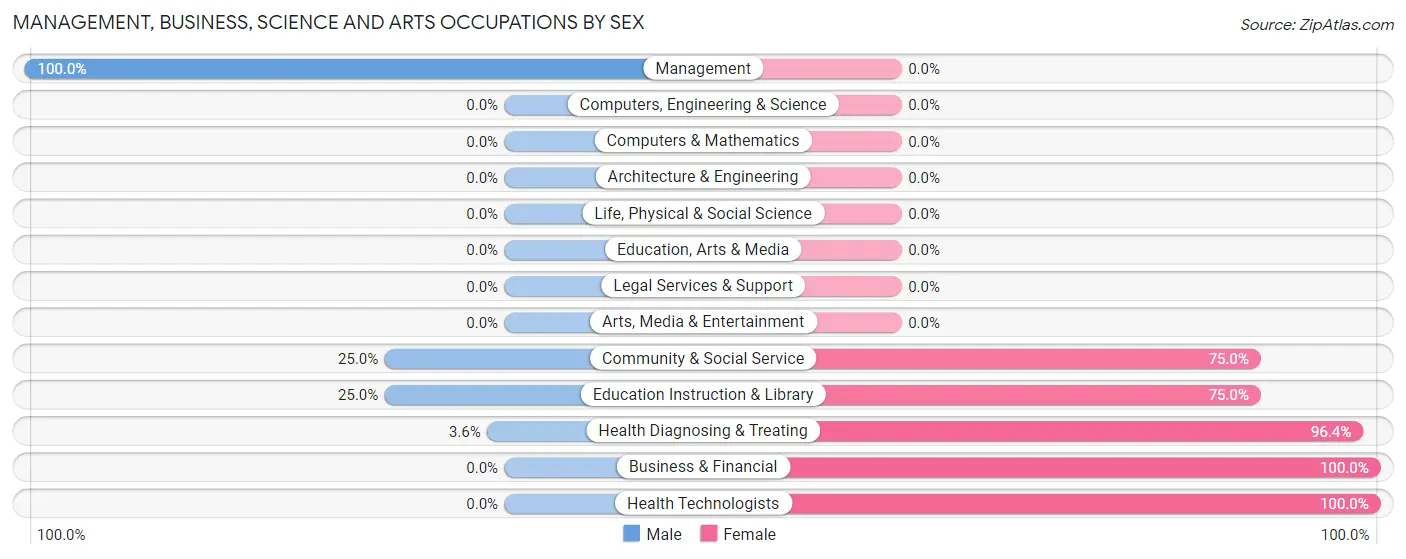
Management, Business, Science and Arts Occupations by Sex
Within the Management, Business, Science and Arts occupations in Beaver Springs, the most male-oriented occupations are Management (100.0%), Community & Social Service (25.0%), and Education Instruction & Library (25.0%), while the most female-oriented occupations are Business & Financial (100.0%), Health Technologists (100.0%), and Health Diagnosing & Treating (96.4%).
| Occupation | Male | Female |
| Management | 17 (100.0%) | 0 (0.0%) |
| Business & Financial | 0 (0.0%) | 4 (100.0%) |
| Computers, Engineering & Science | 0 (0.0%) | 0 (0.0%) |
| Computers & Mathematics | 0 (0.0%) | 0 (0.0%) |
| Architecture & Engineering | 0 (0.0%) | 0 (0.0%) |
| Life, Physical & Social Science | 0 (0.0%) | 0 (0.0%) |
| Community & Social Service | 3 (25.0%) | 9 (75.0%) |
| Education, Arts & Media | 0 (0.0%) | 0 (0.0%) |
| Legal Services & Support | 0 (0.0%) | 0 (0.0%) |
| Education Instruction & Library | 3 (25.0%) | 9 (75.0%) |
| Arts, Media & Entertainment | 0 (0.0%) | 0 (0.0%) |
| Health Diagnosing & Treating | 2 (3.6%) | 53 (96.4%) |
| Health Technologists | 0 (0.0%) | 2 (100.0%) |
| Total (Category) | 22 (25.0%) | 66 (75.0%) |
| Total (Overall) | 146 (47.4%) | 162 (52.6%) |
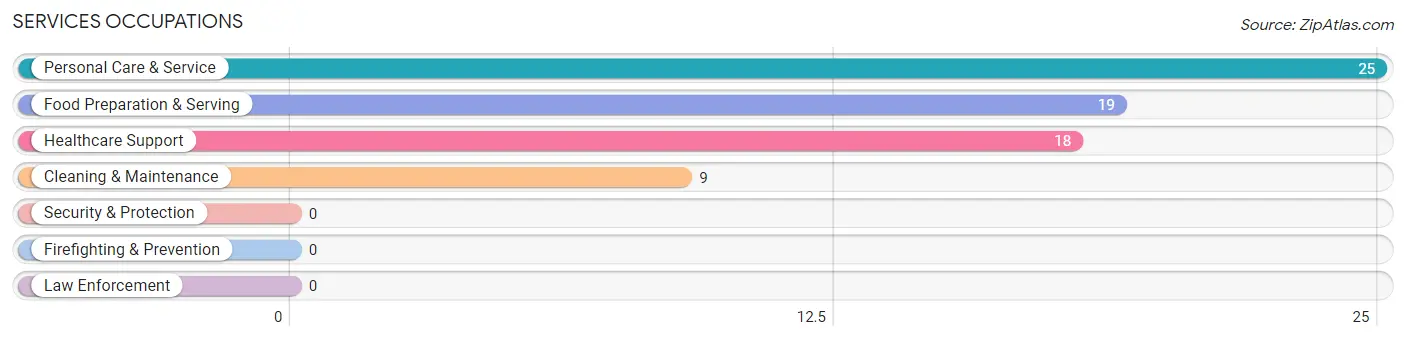
Services Occupations
The most common Services occupations in Beaver Springs are Personal Care & Service (25 | 8.1%), Food Preparation & Serving (19 | 6.2%), Healthcare Support (18 | 5.8%), and Cleaning & Maintenance (9 | 2.9%).
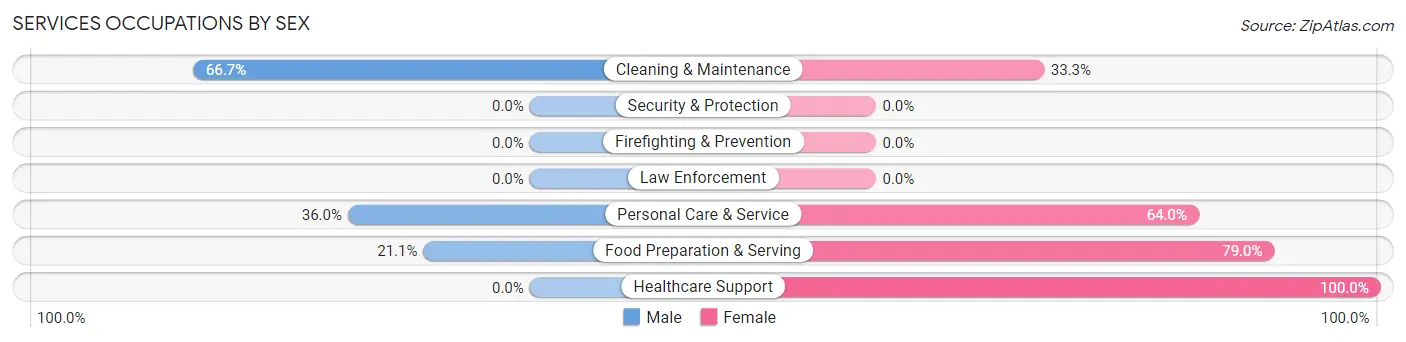
Services Occupations by Sex
Within the Services occupations in Beaver Springs, the most male-oriented occupations are Cleaning & Maintenance (66.7%), Personal Care & Service (36.0%), and Food Preparation & Serving (21.0%), while the most female-oriented occupations are Healthcare Support (100.0%), Food Preparation & Serving (78.9%), and Personal Care & Service (64.0%).
| Occupation | Male | Female |
| Healthcare Support | 0 (0.0%) | 18 (100.0%) |
| Security & Protection | 0 (0.0%) | 0 (0.0%) |
| Firefighting & Prevention | 0 (0.0%) | 0 (0.0%) |
| Law Enforcement | 0 (0.0%) | 0 (0.0%) |
| Food Preparation & Serving | 4 (21.0%) | 15 (78.9%) |
| Cleaning & Maintenance | 6 (66.7%) | 3 (33.3%) |
| Personal Care & Service | 9 (36.0%) | 16 (64.0%) |
| Total (Category) | 19 (26.8%) | 52 (73.2%) |
| Total (Overall) | 146 (47.4%) | 162 (52.6%) |
Sales and Office Occupations
The most common Sales and Office occupations in Beaver Springs are Office & Administration (28 | 9.1%), and Sales & Related (25 | 8.1%).
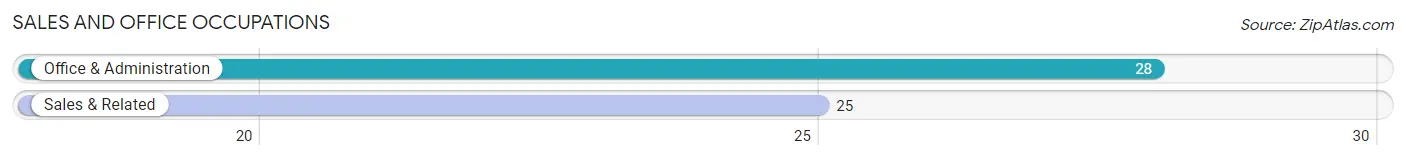
Sales and Office Occupations by Sex
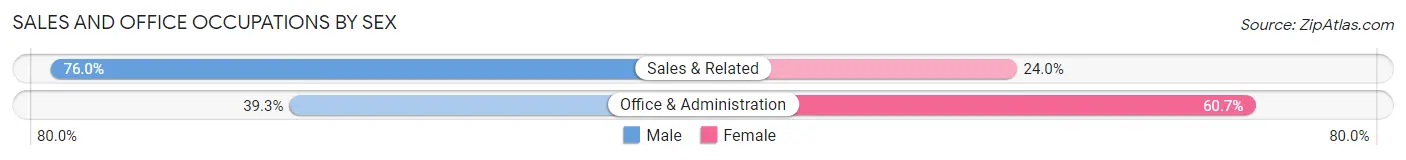
| Occupation | Male | Female |
| Sales & Related | 19 (76.0%) | 6 (24.0%) |
| Office & Administration | 11 (39.3%) | 17 (60.7%) |
| Total (Category) | 30 (56.6%) | 23 (43.4%) |
| Total (Overall) | 146 (47.4%) | 162 (52.6%) |
Natural Resources, Construction and Maintenance Occupations
The most common Natural Resources, Construction and Maintenance occupations in Beaver Springs are Construction & Extraction (23 | 7.5%), and Installation, Maintenance & Repair (3 | 1.0%).
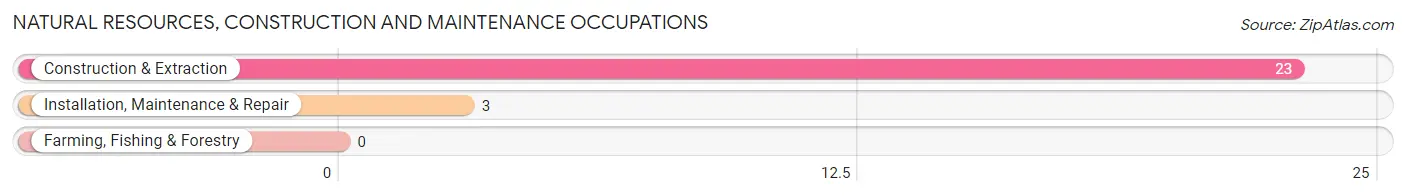
Natural Resources, Construction and Maintenance Occupations by Sex
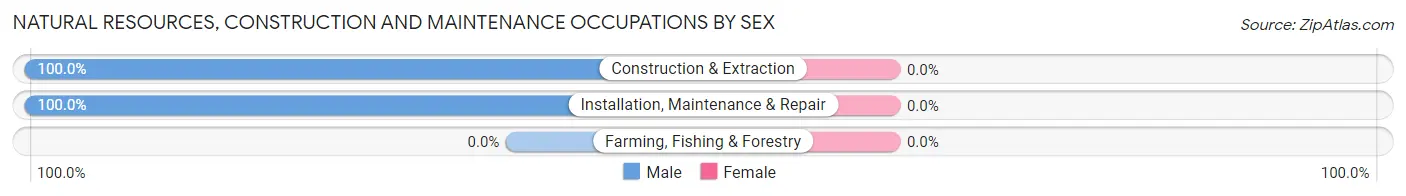
| Occupation | Male | Female |
| Farming, Fishing & Forestry | 0 (0.0%) | 0 (0.0%) |
| Construction & Extraction | 23 (100.0%) | 0 (0.0%) |
| Installation, Maintenance & Repair | 3 (100.0%) | 0 (0.0%) |
| Total (Category) | 26 (100.0%) | 0 (0.0%) |
| Total (Overall) | 146 (47.4%) | 162 (52.6%) |
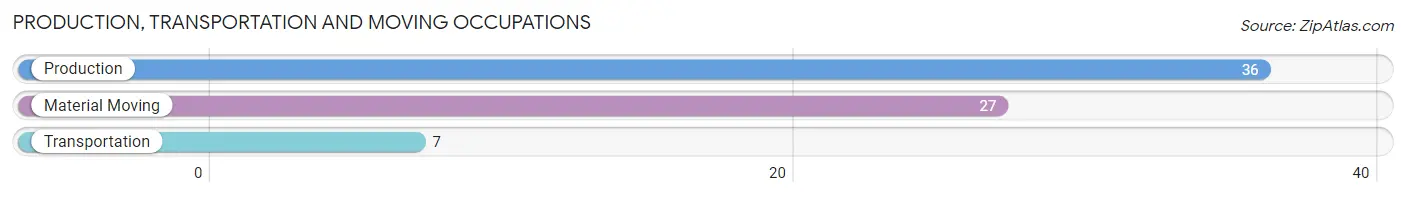
Production, Transportation and Moving Occupations
The most common Production, Transportation and Moving occupations in Beaver Springs are Production (36 | 11.7%), Material Moving (27 | 8.8%), and Transportation (7 | 2.3%).
Production, Transportation and Moving Occupations by Sex
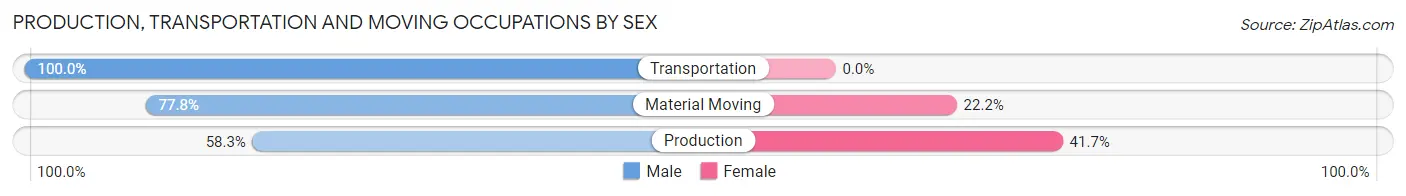
| Occupation | Male | Female |
| Production | 21 (58.3%) | 15 (41.7%) |
| Transportation | 7 (100.0%) | 0 (0.0%) |
| Material Moving | 21 (77.8%) | 6 (22.2%) |
| Total (Category) | 49 (70.0%) | 21 (30.0%) |
| Total (Overall) | 146 (47.4%) | 162 (52.6%) |
Employment Industries by Sex in Beaver Springs
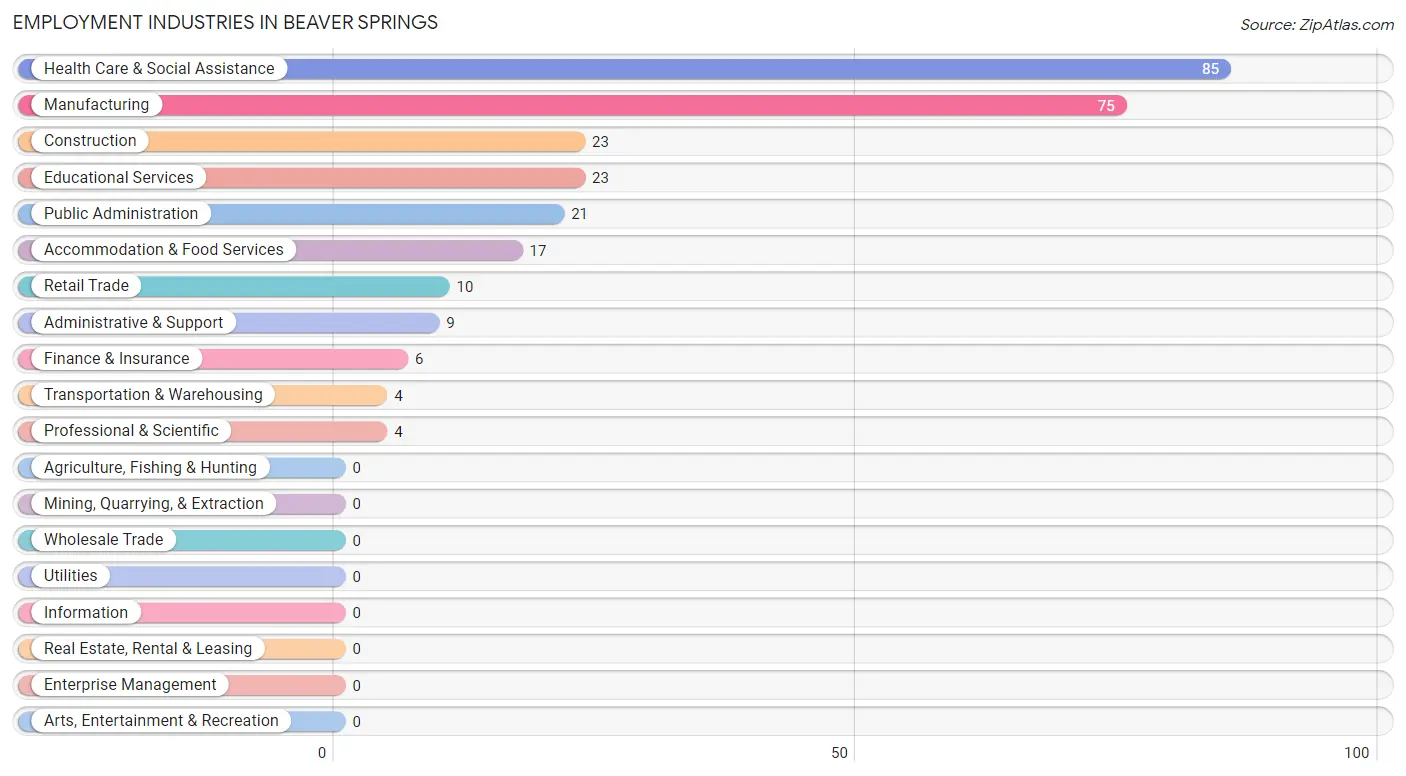
Employment Industries in Beaver Springs
The major employment industries in Beaver Springs include Health Care & Social Assistance (85 | 27.6%), Manufacturing (75 | 24.3%), Construction (23 | 7.5%), Educational Services (23 | 7.5%), and Public Administration (21 | 6.8%).
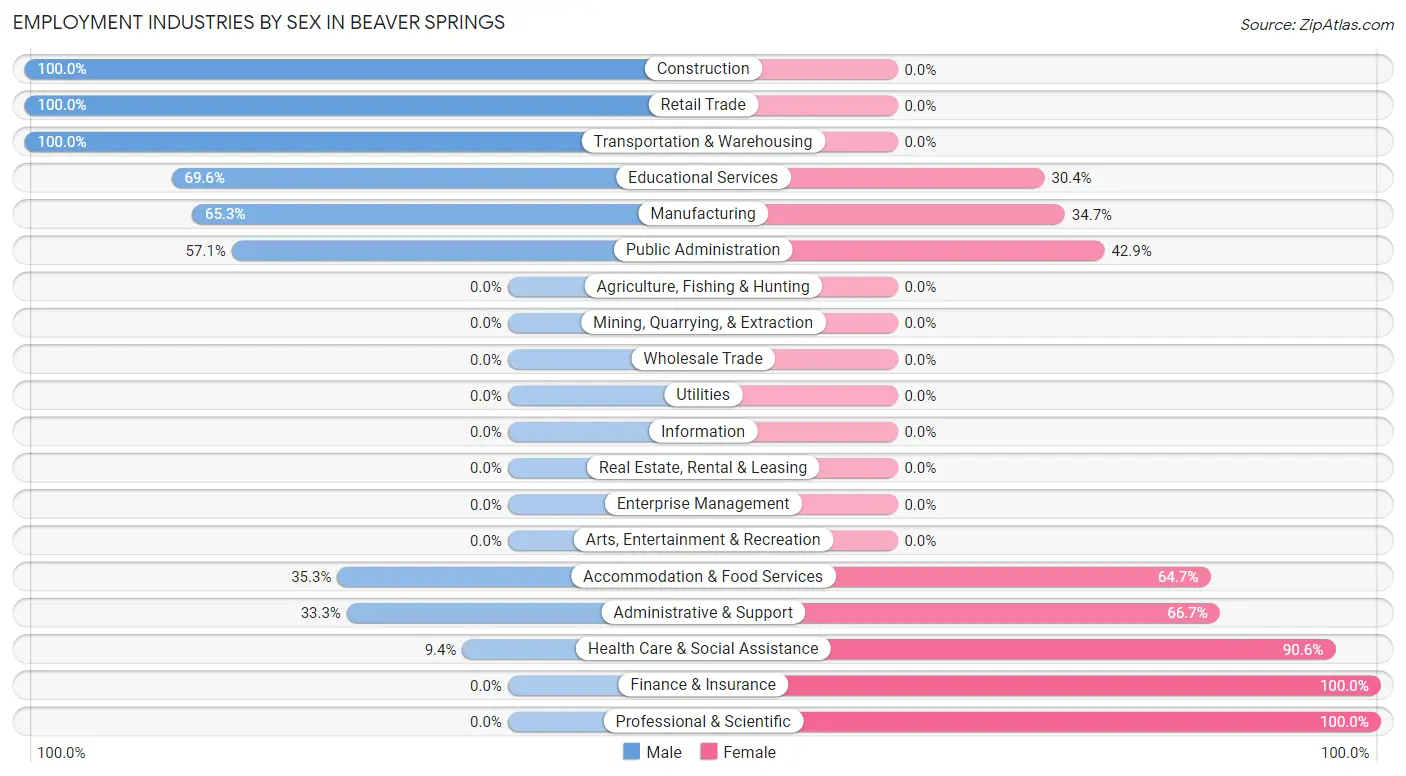
Employment Industries by Sex in Beaver Springs
The Beaver Springs industries that see more men than women are Construction (100.0%), Retail Trade (100.0%), and Transportation & Warehousing (100.0%), whereas the industries that tend to have a higher number of women are Finance & Insurance (100.0%), Professional & Scientific (100.0%), and Health Care & Social Assistance (90.6%).
| Industry | Male | Female |
| Agriculture, Fishing & Hunting | 0 (0.0%) | 0 (0.0%) |
| Mining, Quarrying, & Extraction | 0 (0.0%) | 0 (0.0%) |
| Construction | 23 (100.0%) | 0 (0.0%) |
| Manufacturing | 49 (65.3%) | 26 (34.7%) |
| Wholesale Trade | 0 (0.0%) | 0 (0.0%) |
| Retail Trade | 10 (100.0%) | 0 (0.0%) |
| Transportation & Warehousing | 4 (100.0%) | 0 (0.0%) |
| Utilities | 0 (0.0%) | 0 (0.0%) |
| Information | 0 (0.0%) | 0 (0.0%) |
| Finance & Insurance | 0 (0.0%) | 6 (100.0%) |
| Real Estate, Rental & Leasing | 0 (0.0%) | 0 (0.0%) |
| Professional & Scientific | 0 (0.0%) | 4 (100.0%) |
| Enterprise Management | 0 (0.0%) | 0 (0.0%) |
| Administrative & Support | 3 (33.3%) | 6 (66.7%) |
| Educational Services | 16 (69.6%) | 7 (30.4%) |
| Health Care & Social Assistance | 8 (9.4%) | 77 (90.6%) |
| Arts, Entertainment & Recreation | 0 (0.0%) | 0 (0.0%) |
| Accommodation & Food Services | 6 (35.3%) | 11 (64.7%) |
| Public Administration | 12 (57.1%) | 9 (42.9%) |
| Total | 146 (47.4%) | 162 (52.6%) |
Education in Beaver Springs
School Enrollment in Beaver Springs
The most common levels of schooling among the 161 students in Beaver Springs are middle school (83 | 51.5%), high school (24 | 14.9%), and elementary school (21 | 13.0%).
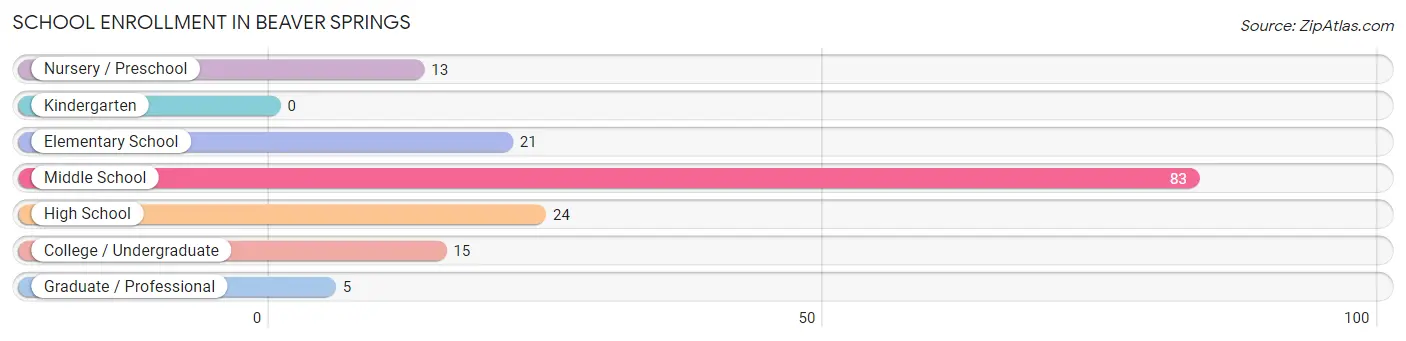
| School Level | # Students | % Students |
| Nursery / Preschool | 13 | 8.1% |
| Kindergarten | 0 | 0.0% |
| Elementary School | 21 | 13.0% |
| Middle School | 83 | 51.5% |
| High School | 24 | 14.9% |
| College / Undergraduate | 15 | 9.3% |
| Graduate / Professional | 5 | 3.1% |
| Total | 161 | 100.0% |
School Enrollment by Age by Funding Source in Beaver Springs
Out of a total of 161 students who are enrolled in schools in Beaver Springs, 30 (18.6%) attend a private institution, while the remaining 131 (81.4%) are enrolled in public schools. The age group of 35 years and over has the highest likelihood of being enrolled in private schools, with 5 (71.4% in the age bracket) enrolled. Conversely, the age group of 15 to 17 year olds has the lowest likelihood of being enrolled in a private school, with 18 (100.0% in the age bracket) attending a public institution.
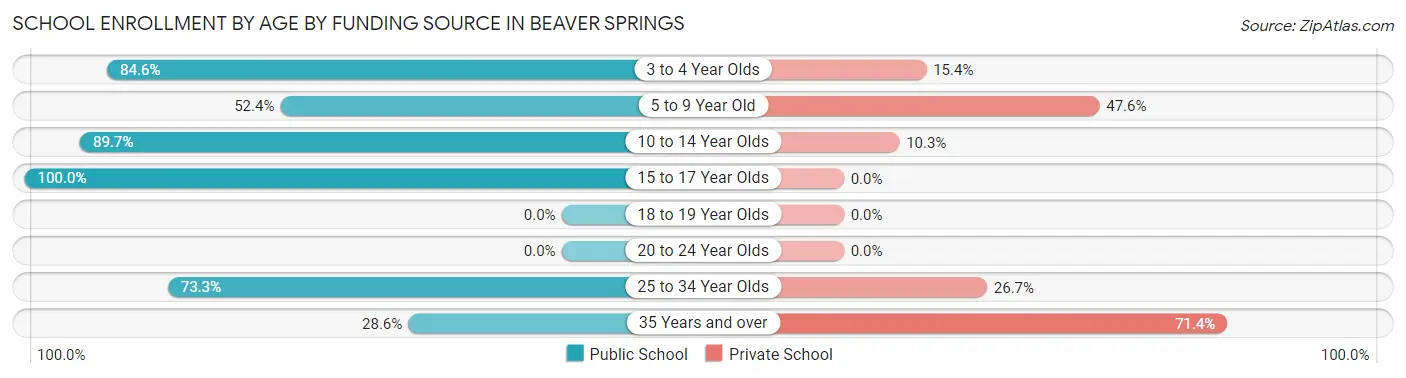
| Age Bracket | Public School | Private School |
| 3 to 4 Year Olds | 11 (84.6%) | 2 (15.4%) |
| 5 to 9 Year Old | 11 (52.4%) | 10 (47.6%) |
| 10 to 14 Year Olds | 78 (89.7%) | 9 (10.3%) |
| 15 to 17 Year Olds | 18 (100.0%) | 0 (0.0%) |
| 18 to 19 Year Olds | 0 (0.0%) | 0 (0.0%) |
| 20 to 24 Year Olds | 0 (0.0%) | 0 (0.0%) |
| 25 to 34 Year Olds | 11 (73.3%) | 4 (26.7%) |
| 35 Years and over | 2 (28.6%) | 5 (71.4%) |
| Total | 131 (81.4%) | 30 (18.6%) |
Educational Attainment by Field of Study in Beaver Springs
Psychology (32 | 40.0%), education (12 | 15.0%), liberal arts & history (9 | 11.3%), social sciences (6 | 7.5%), and communications (5 | 6.2%) are the most common fields of study among 80 individuals in Beaver Springs who have obtained a bachelor's degree or higher.
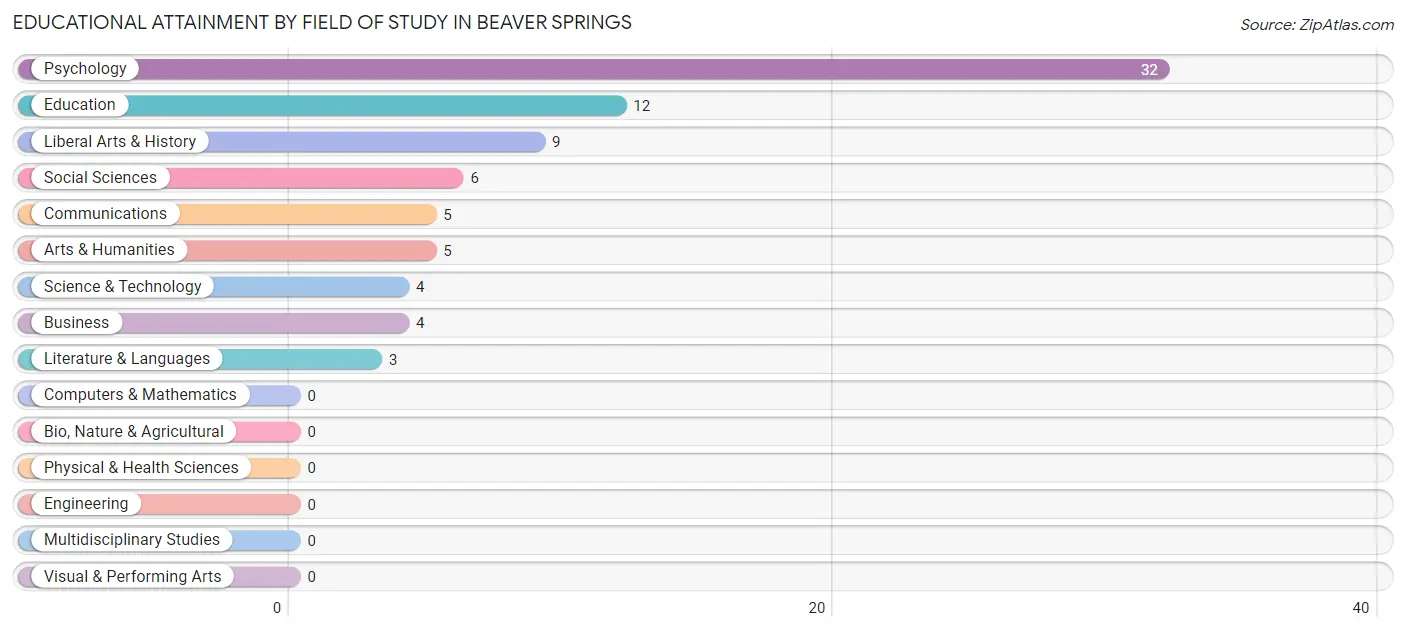
| Field of Study | # Graduates | % Graduates |
| Computers & Mathematics | 0 | 0.0% |
| Bio, Nature & Agricultural | 0 | 0.0% |
| Physical & Health Sciences | 0 | 0.0% |
| Psychology | 32 | 40.0% |
| Social Sciences | 6 | 7.5% |
| Engineering | 0 | 0.0% |
| Multidisciplinary Studies | 0 | 0.0% |
| Science & Technology | 4 | 5.0% |
| Business | 4 | 5.0% |
| Education | 12 | 15.0% |
| Literature & Languages | 3 | 3.7% |
| Liberal Arts & History | 9 | 11.3% |
| Visual & Performing Arts | 0 | 0.0% |
| Communications | 5 | 6.2% |
| Arts & Humanities | 5 | 6.2% |
| Total | 80 | 100.0% |
Transportation & Commute in Beaver Springs
Vehicle Availability by Sex in Beaver Springs
The most prevalent vehicle ownership categories in Beaver Springs are males with 2 vehicles (70, accounting for 47.9%) and females with 2 vehicles (80, making up 45.2%).
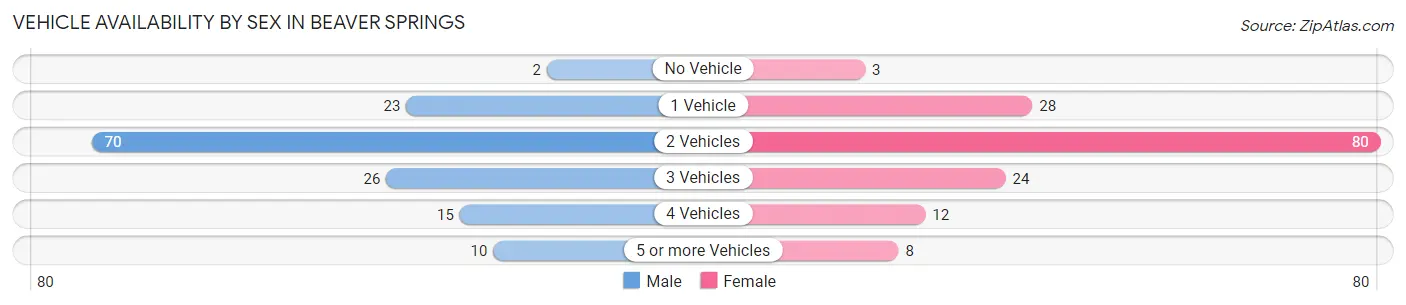
| Vehicles Available | Male | Female |
| No Vehicle | 2 (1.4%) | 3 (1.9%) |
| 1 Vehicle | 23 (15.8%) | 28 (18.1%) |
| 2 Vehicles | 70 (47.9%) | 80 (51.6%) |
| 3 Vehicles | 26 (17.8%) | 24 (15.5%) |
| 4 Vehicles | 15 (10.3%) | 12 (7.7%) |
| 5 or more Vehicles | 10 (6.9%) | 8 (5.2%) |
| Total | 146 (100.0%) | 155 (100.0%) |
Commute Time in Beaver Springs
The most frequently occuring commute durations in Beaver Springs are 25 to 29 minutes (46 commuters, 15.4%), 60 to 89 minutes (45 commuters, 15.1%), and 5 to 9 minutes (40 commuters, 13.4%).
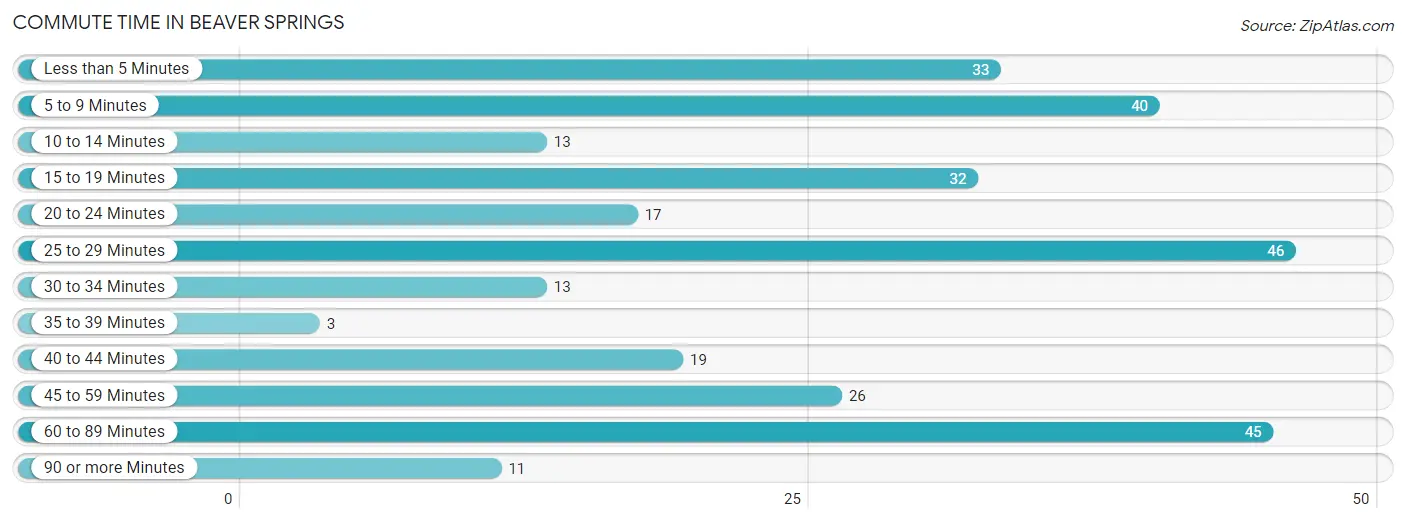
| Commute Time | # Commuters | % Commuters |
| Less than 5 Minutes | 33 | 11.1% |
| 5 to 9 Minutes | 40 | 13.4% |
| 10 to 14 Minutes | 13 | 4.4% |
| 15 to 19 Minutes | 32 | 10.7% |
| 20 to 24 Minutes | 17 | 5.7% |
| 25 to 29 Minutes | 46 | 15.4% |
| 30 to 34 Minutes | 13 | 4.4% |
| 35 to 39 Minutes | 3 | 1.0% |
| 40 to 44 Minutes | 19 | 6.4% |
| 45 to 59 Minutes | 26 | 8.7% |
| 60 to 89 Minutes | 45 | 15.1% |
| 90 or more Minutes | 11 | 3.7% |
Commute Time by Sex in Beaver Springs
The most common commute times in Beaver Springs are 25 to 29 minutes (24 commuters, 16.4%) for males and 60 to 89 minutes (42 commuters, 27.6%) for females.
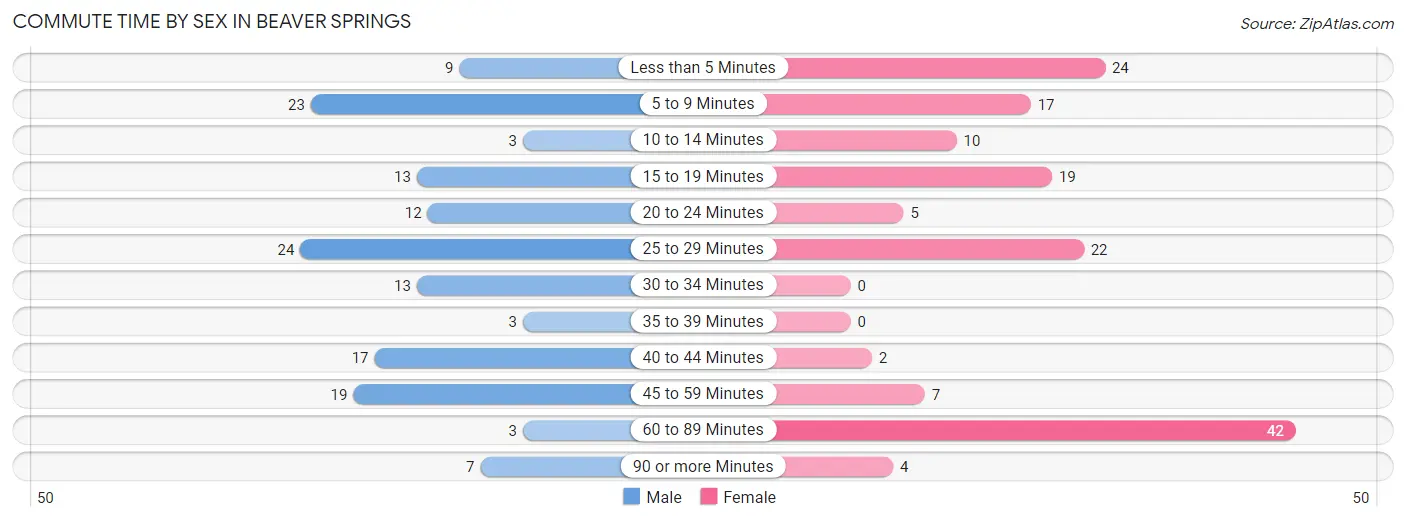
| Commute Time | Male | Female |
| Less than 5 Minutes | 9 (6.2%) | 24 (15.8%) |
| 5 to 9 Minutes | 23 (15.8%) | 17 (11.2%) |
| 10 to 14 Minutes | 3 (2.1%) | 10 (6.6%) |
| 15 to 19 Minutes | 13 (8.9%) | 19 (12.5%) |
| 20 to 24 Minutes | 12 (8.2%) | 5 (3.3%) |
| 25 to 29 Minutes | 24 (16.4%) | 22 (14.5%) |
| 30 to 34 Minutes | 13 (8.9%) | 0 (0.0%) |
| 35 to 39 Minutes | 3 (2.1%) | 0 (0.0%) |
| 40 to 44 Minutes | 17 (11.6%) | 2 (1.3%) |
| 45 to 59 Minutes | 19 (13.0%) | 7 (4.6%) |
| 60 to 89 Minutes | 3 (2.1%) | 42 (27.6%) |
| 90 or more Minutes | 7 (4.8%) | 4 (2.6%) |
Time of Departure to Work by Sex in Beaver Springs
The most frequent times of departure to work in Beaver Springs are 12:00 PM to 3:59 PM (31, 21.2%) for males and 4:00 PM to 11:59 PM (54, 35.5%) for females.
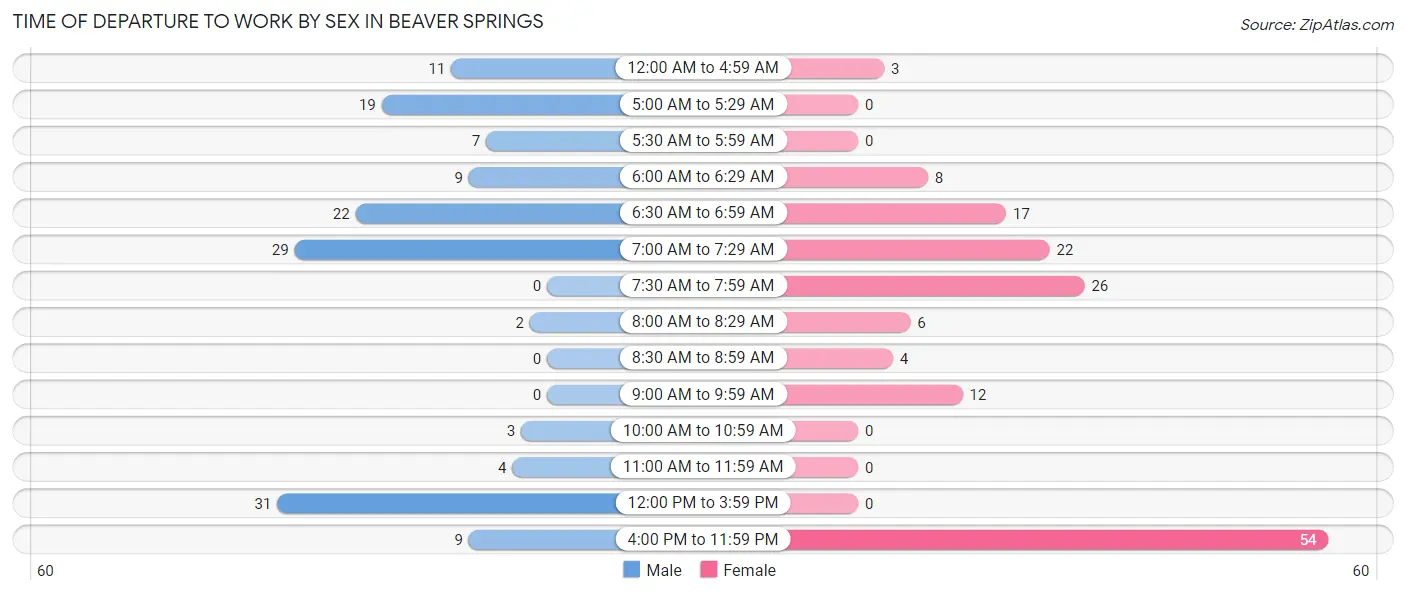
| Time of Departure | Male | Female |
| 12:00 AM to 4:59 AM | 11 (7.5%) | 3 (2.0%) |
| 5:00 AM to 5:29 AM | 19 (13.0%) | 0 (0.0%) |
| 5:30 AM to 5:59 AM | 7 (4.8%) | 0 (0.0%) |
| 6:00 AM to 6:29 AM | 9 (6.2%) | 8 (5.3%) |
| 6:30 AM to 6:59 AM | 22 (15.1%) | 17 (11.2%) |
| 7:00 AM to 7:29 AM | 29 (19.9%) | 22 (14.5%) |
| 7:30 AM to 7:59 AM | 0 (0.0%) | 26 (17.1%) |
| 8:00 AM to 8:29 AM | 2 (1.4%) | 6 (4.0%) |
| 8:30 AM to 8:59 AM | 0 (0.0%) | 4 (2.6%) |
| 9:00 AM to 9:59 AM | 0 (0.0%) | 12 (7.9%) |
| 10:00 AM to 10:59 AM | 3 (2.1%) | 0 (0.0%) |
| 11:00 AM to 11:59 AM | 4 (2.7%) | 0 (0.0%) |
| 12:00 PM to 3:59 PM | 31 (21.2%) | 0 (0.0%) |
| 4:00 PM to 11:59 PM | 9 (6.2%) | 54 (35.5%) |
| Total | 146 (100.0%) | 152 (100.0%) |
Housing Occupancy in Beaver Springs
Occupancy by Ownership in Beaver Springs
Of the total 328 dwellings in Beaver Springs, owner-occupied units account for 196 (59.8%), while renter-occupied units make up 132 (40.2%).
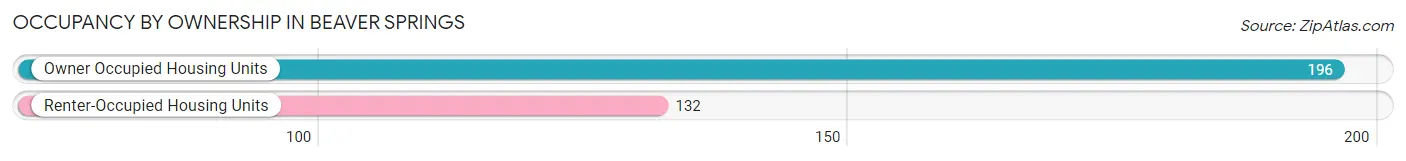
| Occupancy | # Housing Units | % Housing Units |
| Owner Occupied Housing Units | 196 | 59.8% |
| Renter-Occupied Housing Units | 132 | 40.2% |
| Total Occupied Housing Units | 328 | 100.0% |
Occupancy by Household Size in Beaver Springs
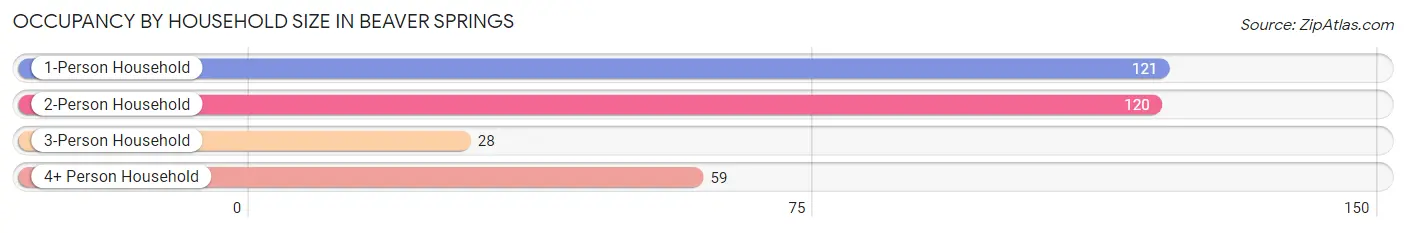
| Household Size | # Housing Units | % Housing Units |
| 1-Person Household | 121 | 36.9% |
| 2-Person Household | 120 | 36.6% |
| 3-Person Household | 28 | 8.5% |
| 4+ Person Household | 59 | 18.0% |
| Total Housing Units | 328 | 100.0% |
Occupancy by Ownership by Household Size in Beaver Springs
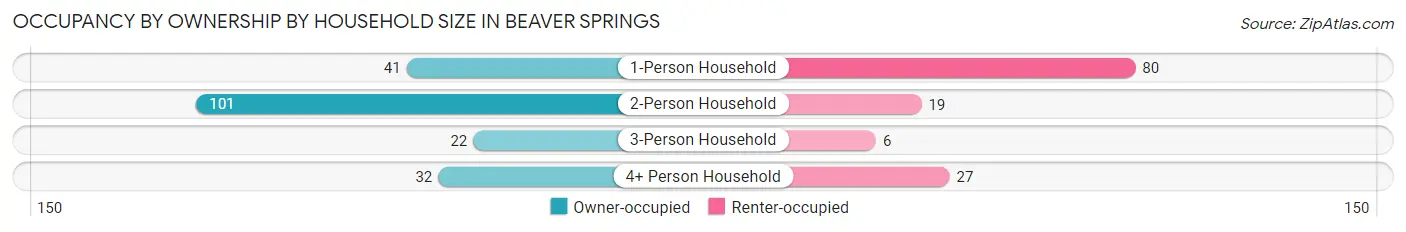
| Household Size | Owner-occupied | Renter-occupied |
| 1-Person Household | 41 (33.9%) | 80 (66.1%) |
| 2-Person Household | 101 (84.2%) | 19 (15.8%) |
| 3-Person Household | 22 (78.6%) | 6 (21.4%) |
| 4+ Person Household | 32 (54.2%) | 27 (45.8%) |
| Total Housing Units | 196 (59.8%) | 132 (40.2%) |
Occupancy by Educational Attainment in Beaver Springs
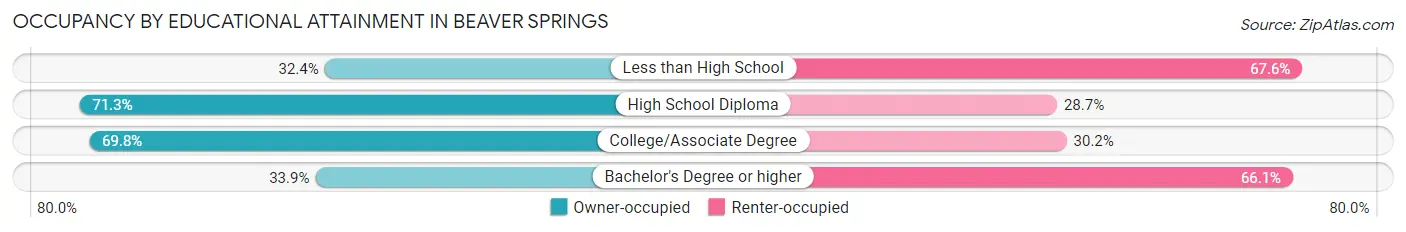
| Household Size | Owner-occupied | Renter-occupied |
| Less than High School | 12 (32.4%) | 25 (67.6%) |
| High School Diploma | 97 (71.3%) | 39 (28.7%) |
| College/Associate Degree | 67 (69.8%) | 29 (30.2%) |
| Bachelor's Degree or higher | 20 (33.9%) | 39 (66.1%) |
Occupancy by Age of Householder in Beaver Springs
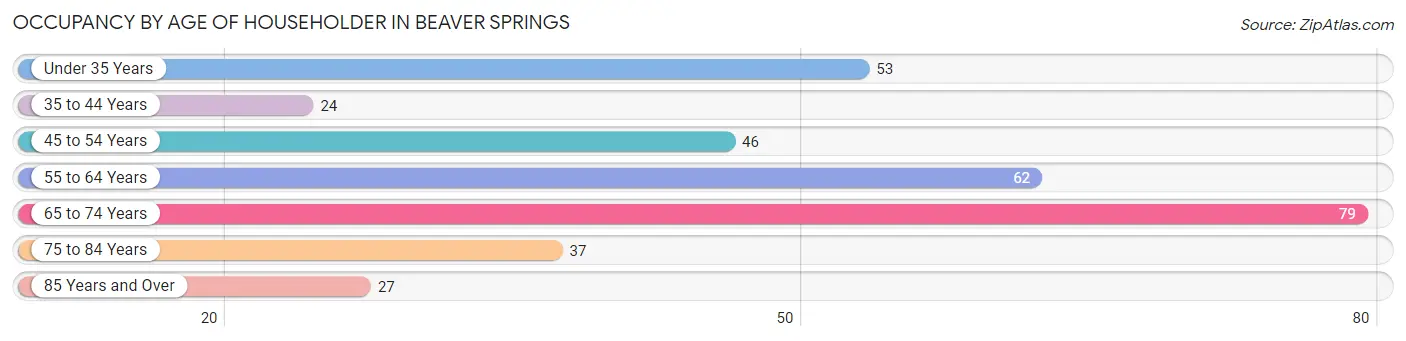
| Age Bracket | # Households | % Households |
| Under 35 Years | 53 | 16.2% |
| 35 to 44 Years | 24 | 7.3% |
| 45 to 54 Years | 46 | 14.0% |
| 55 to 64 Years | 62 | 18.9% |
| 65 to 74 Years | 79 | 24.1% |
| 75 to 84 Years | 37 | 11.3% |
| 85 Years and Over | 27 | 8.2% |
| Total | 328 | 100.0% |
Housing Finances in Beaver Springs
Median Income by Occupancy in Beaver Springs
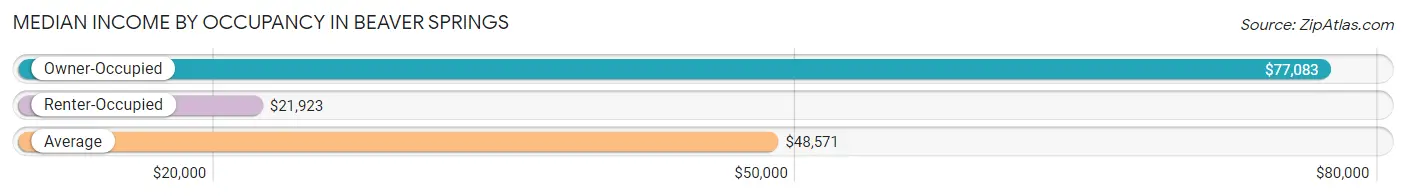
| Occupancy Type | # Households | Median Income |
| Owner-Occupied | 196 (59.8%) | $77,083 |
| Renter-Occupied | 132 (40.2%) | $21,923 |
| Average | 328 (100.0%) | $48,571 |
Occupancy by Householder Income Bracket in Beaver Springs
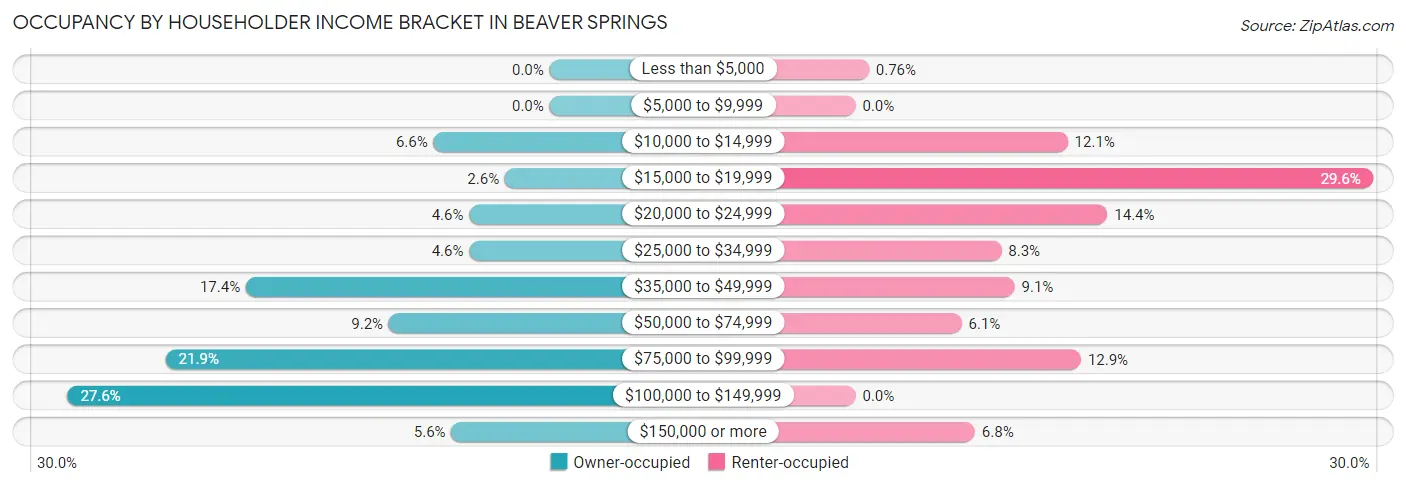
| Income Bracket | Owner-occupied | Renter-occupied |
| Less than $5,000 | 0 (0.0%) | 1 (0.8%) |
| $5,000 to $9,999 | 0 (0.0%) | 0 (0.0%) |
| $10,000 to $14,999 | 13 (6.6%) | 16 (12.1%) |
| $15,000 to $19,999 | 5 (2.5%) | 39 (29.5%) |
| $20,000 to $24,999 | 9 (4.6%) | 19 (14.4%) |
| $25,000 to $34,999 | 9 (4.6%) | 11 (8.3%) |
| $35,000 to $49,999 | 34 (17.3%) | 12 (9.1%) |
| $50,000 to $74,999 | 18 (9.2%) | 8 (6.1%) |
| $75,000 to $99,999 | 43 (21.9%) | 17 (12.9%) |
| $100,000 to $149,999 | 54 (27.6%) | 0 (0.0%) |
| $150,000 or more | 11 (5.6%) | 9 (6.8%) |
| Total | 196 (100.0%) | 132 (100.0%) |
Monthly Housing Cost Tiers in Beaver Springs
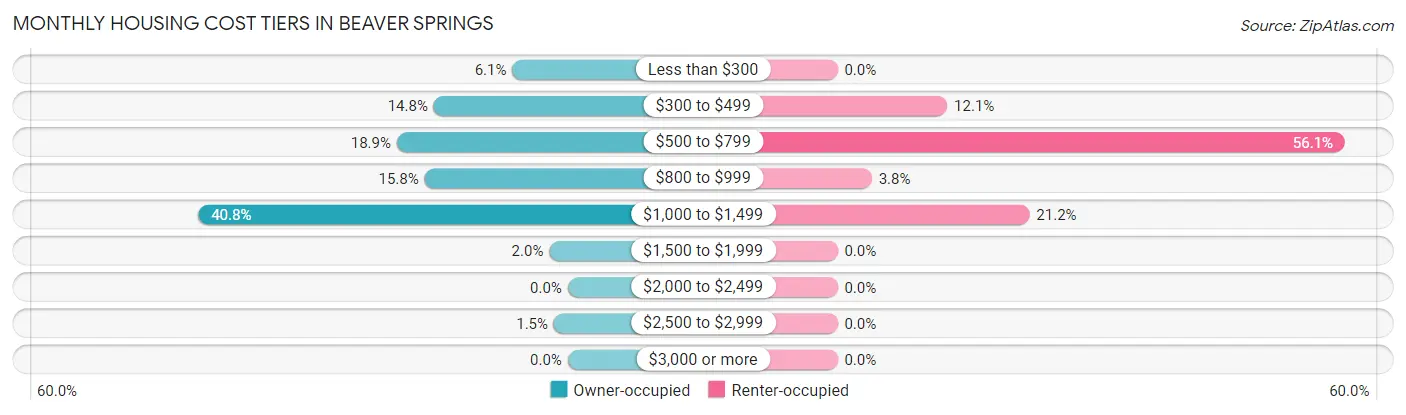
| Monthly Cost | Owner-occupied | Renter-occupied |
| Less than $300 | 12 (6.1%) | 0 (0.0%) |
| $300 to $499 | 29 (14.8%) | 16 (12.1%) |
| $500 to $799 | 37 (18.9%) | 74 (56.1%) |
| $800 to $999 | 31 (15.8%) | 5 (3.8%) |
| $1,000 to $1,499 | 80 (40.8%) | 28 (21.2%) |
| $1,500 to $1,999 | 4 (2.0%) | 0 (0.0%) |
| $2,000 to $2,499 | 0 (0.0%) | 0 (0.0%) |
| $2,500 to $2,999 | 3 (1.5%) | 0 (0.0%) |
| $3,000 or more | 0 (0.0%) | 0 (0.0%) |
| Total | 196 (100.0%) | 132 (100.0%) |
Physical Housing Characteristics in Beaver Springs
Housing Structures in Beaver Springs
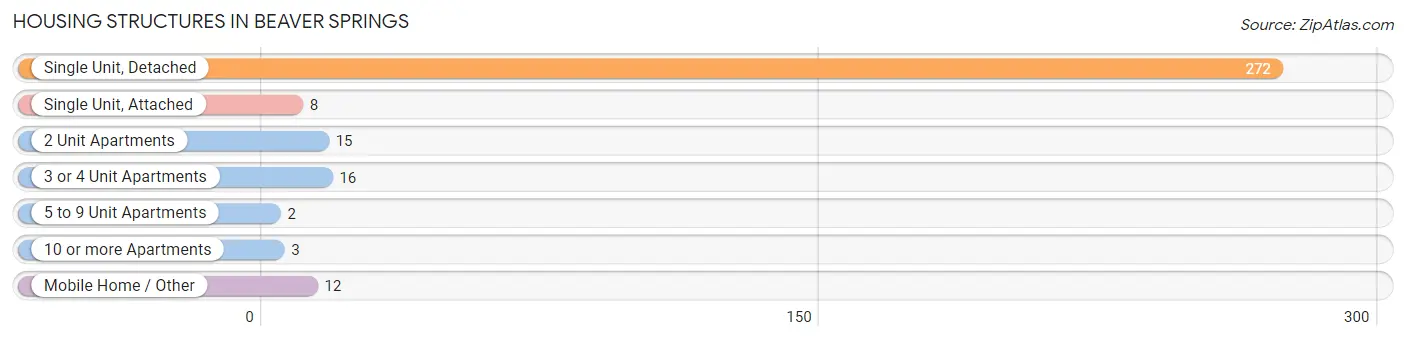
| Structure Type | # Housing Units | % Housing Units |
| Single Unit, Detached | 272 | 82.9% |
| Single Unit, Attached | 8 | 2.4% |
| 2 Unit Apartments | 15 | 4.6% |
| 3 or 4 Unit Apartments | 16 | 4.9% |
| 5 to 9 Unit Apartments | 2 | 0.6% |
| 10 or more Apartments | 3 | 0.9% |
| Mobile Home / Other | 12 | 3.7% |
| Total | 328 | 100.0% |
Housing Structures by Occupancy in Beaver Springs
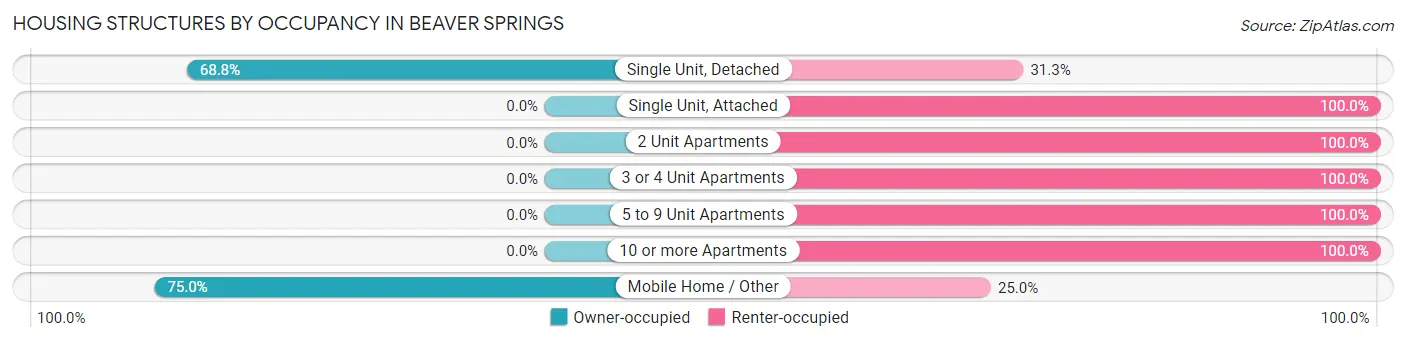
| Structure Type | Owner-occupied | Renter-occupied |
| Single Unit, Detached | 187 (68.8%) | 85 (31.2%) |
| Single Unit, Attached | 0 (0.0%) | 8 (100.0%) |
| 2 Unit Apartments | 0 (0.0%) | 15 (100.0%) |
| 3 or 4 Unit Apartments | 0 (0.0%) | 16 (100.0%) |
| 5 to 9 Unit Apartments | 0 (0.0%) | 2 (100.0%) |
| 10 or more Apartments | 0 (0.0%) | 3 (100.0%) |
| Mobile Home / Other | 9 (75.0%) | 3 (25.0%) |
| Total | 196 (59.8%) | 132 (40.2%) |
Housing Structures by Number of Rooms in Beaver Springs
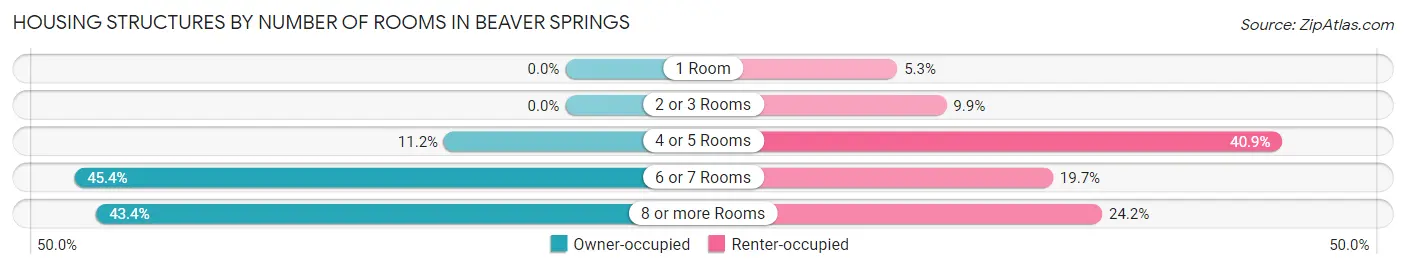
| Number of Rooms | Owner-occupied | Renter-occupied |
| 1 Room | 0 (0.0%) | 7 (5.3%) |
| 2 or 3 Rooms | 0 (0.0%) | 13 (9.9%) |
| 4 or 5 Rooms | 22 (11.2%) | 54 (40.9%) |
| 6 or 7 Rooms | 89 (45.4%) | 26 (19.7%) |
| 8 or more Rooms | 85 (43.4%) | 32 (24.2%) |
| Total | 196 (100.0%) | 132 (100.0%) |
Housing Structure by Heating Type in Beaver Springs
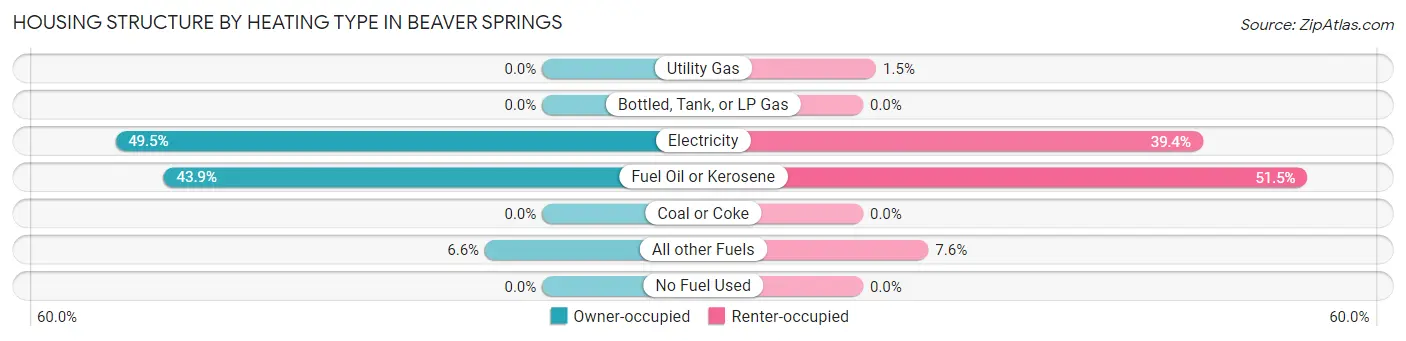
| Heating Type | Owner-occupied | Renter-occupied |
| Utility Gas | 0 (0.0%) | 2 (1.5%) |
| Bottled, Tank, or LP Gas | 0 (0.0%) | 0 (0.0%) |
| Electricity | 97 (49.5%) | 52 (39.4%) |
| Fuel Oil or Kerosene | 86 (43.9%) | 68 (51.5%) |
| Coal or Coke | 0 (0.0%) | 0 (0.0%) |
| All other Fuels | 13 (6.6%) | 10 (7.6%) |
| No Fuel Used | 0 (0.0%) | 0 (0.0%) |
| Total | 196 (100.0%) | 132 (100.0%) |
Household Vehicle Usage in Beaver Springs
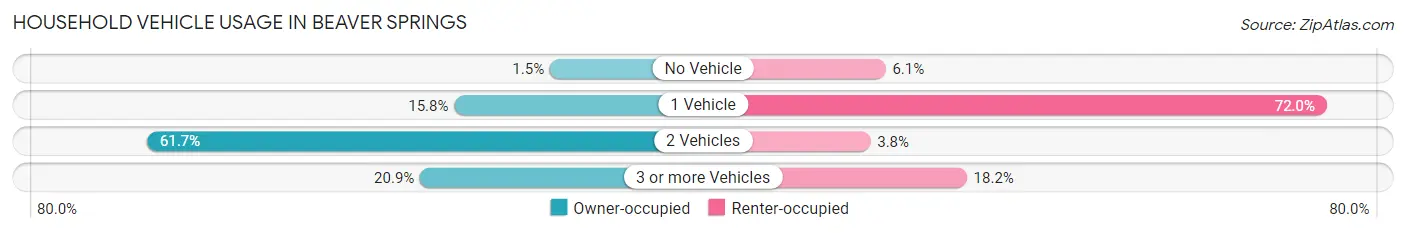
| Vehicles per Household | Owner-occupied | Renter-occupied |
| No Vehicle | 3 (1.5%) | 8 (6.1%) |
| 1 Vehicle | 31 (15.8%) | 95 (72.0%) |
| 2 Vehicles | 121 (61.7%) | 5 (3.8%) |
| 3 or more Vehicles | 41 (20.9%) | 24 (18.2%) |
| Total | 196 (100.0%) | 132 (100.0%) |
Real Estate & Mortgages in Beaver Springs
Real Estate and Mortgage Overview in Beaver Springs
| Characteristic | Without Mortgage | With Mortgage |
| Housing Units | 83 | 113 |
| Median Property Value | $151,000 | $102,000 |
| Median Household Income | $41,875 | $8 |
| Monthly Housing Costs | $561 | $0 |
| Real Estate Taxes | $2,125 | $0 |
Property Value by Mortgage Status in Beaver Springs
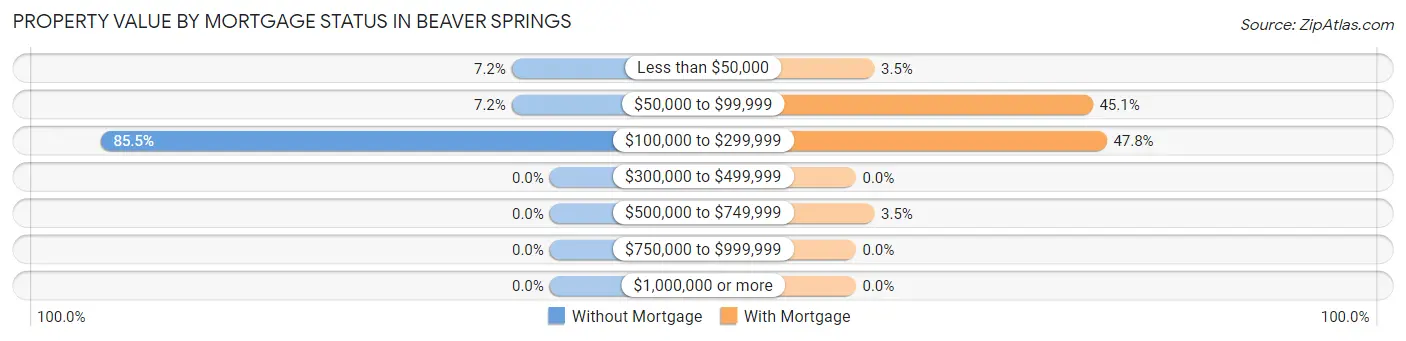
| Property Value | Without Mortgage | With Mortgage |
| Less than $50,000 | 6 (7.2%) | 4 (3.5%) |
| $50,000 to $99,999 | 6 (7.2%) | 51 (45.1%) |
| $100,000 to $299,999 | 71 (85.5%) | 54 (47.8%) |
| $300,000 to $499,999 | 0 (0.0%) | 0 (0.0%) |
| $500,000 to $749,999 | 0 (0.0%) | 4 (3.5%) |
| $750,000 to $999,999 | 0 (0.0%) | 0 (0.0%) |
| $1,000,000 or more | 0 (0.0%) | 0 (0.0%) |
| Total | 83 (100.0%) | 113 (100.0%) |
Household Income by Mortgage Status in Beaver Springs
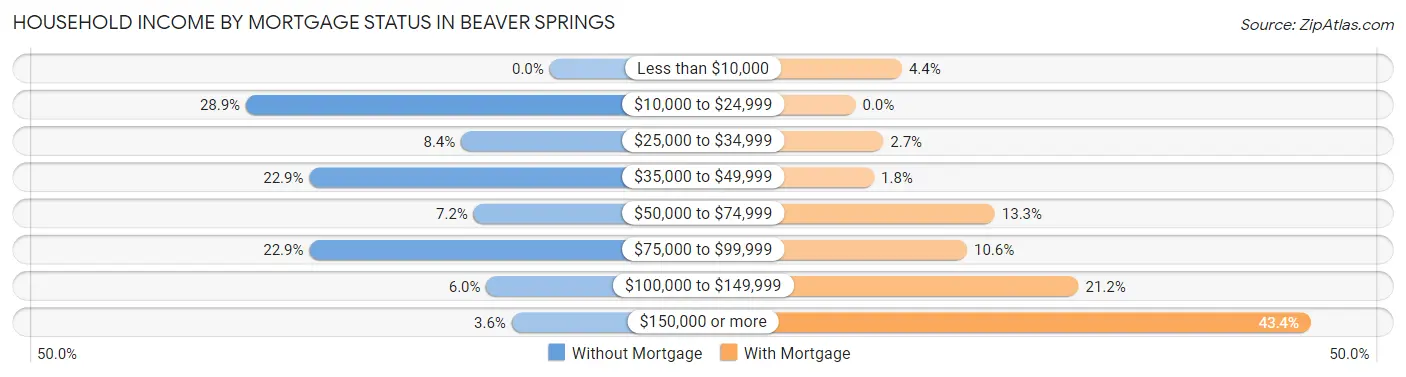
| Household Income | Without Mortgage | With Mortgage |
| Less than $10,000 | 0 (0.0%) | 5 (4.4%) |
| $10,000 to $24,999 | 24 (28.9%) | 0 (0.0%) |
| $25,000 to $34,999 | 7 (8.4%) | 3 (2.6%) |
| $35,000 to $49,999 | 19 (22.9%) | 2 (1.8%) |
| $50,000 to $74,999 | 6 (7.2%) | 15 (13.3%) |
| $75,000 to $99,999 | 19 (22.9%) | 12 (10.6%) |
| $100,000 to $149,999 | 5 (6.0%) | 24 (21.2%) |
| $150,000 or more | 3 (3.6%) | 49 (43.4%) |
| Total | 83 (100.0%) | 113 (100.0%) |
Property Value to Household Income Ratio in Beaver Springs
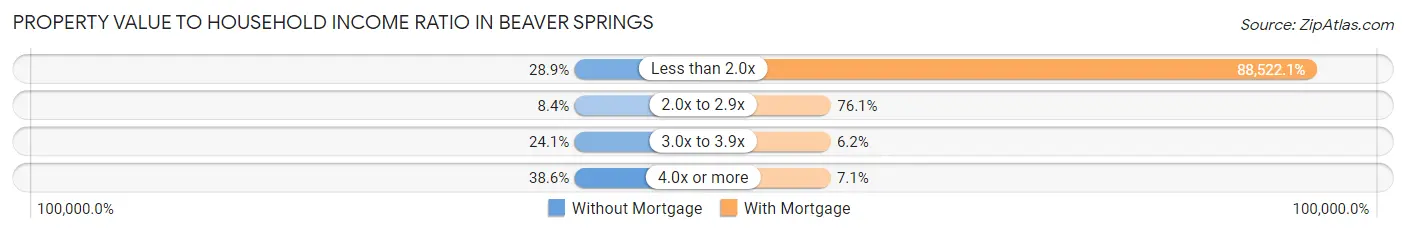
| Value-to-Income Ratio | Without Mortgage | With Mortgage |
| Less than 2.0x | 24 (28.9%) | 100,030 (88,522.1%) |
| 2.0x to 2.9x | 7 (8.4%) | 86 (76.1%) |
| 3.0x to 3.9x | 20 (24.1%) | 7 (6.2%) |
| 4.0x or more | 32 (38.6%) | 8 (7.1%) |
| Total | 83 (100.0%) | 113 (100.0%) |
Real Estate Taxes by Mortgage Status in Beaver Springs
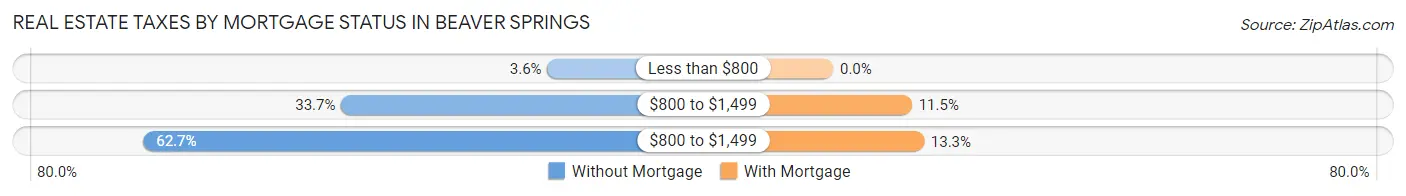
| Property Taxes | Without Mortgage | With Mortgage |
| Less than $800 | 3 (3.6%) | 0 (0.0%) |
| $800 to $1,499 | 28 (33.7%) | 13 (11.5%) |
| $800 to $1,499 | 52 (62.6%) | 15 (13.3%) |
| Total | 83 (100.0%) | 113 (100.0%) |
Health & Disability in Beaver Springs
Health Insurance Coverage by Age in Beaver Springs
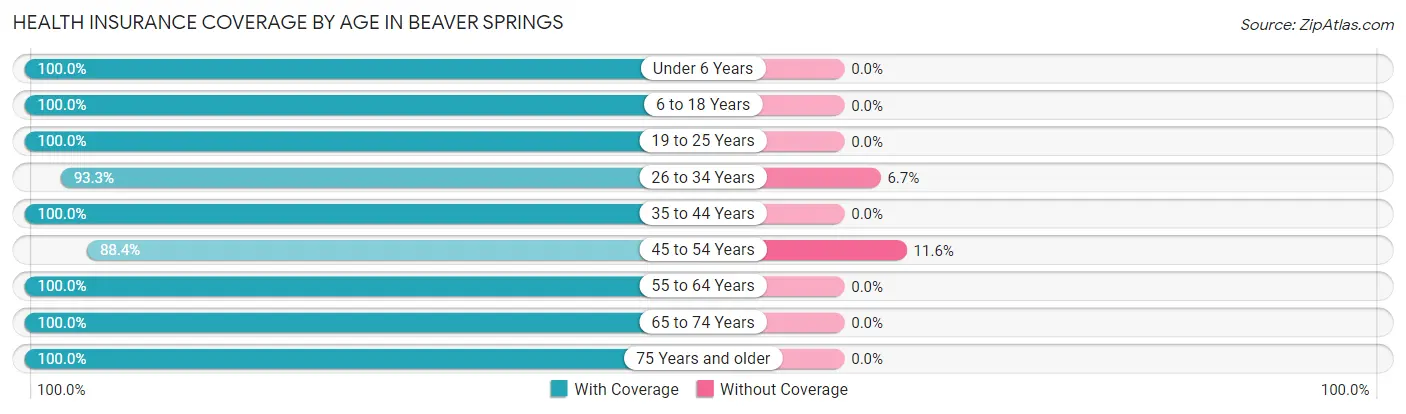
| Age Bracket | With Coverage | Without Coverage |
| Under 6 Years | 40 (100.0%) | 0 (0.0%) |
| 6 to 18 Years | 131 (100.0%) | 0 (0.0%) |
| 19 to 25 Years | 21 (100.0%) | 0 (0.0%) |
| 26 to 34 Years | 83 (93.3%) | 6 (6.7%) |
| 35 to 44 Years | 55 (100.0%) | 0 (0.0%) |
| 45 to 54 Years | 76 (88.4%) | 10 (11.6%) |
| 55 to 64 Years | 108 (100.0%) | 0 (0.0%) |
| 65 to 74 Years | 106 (100.0%) | 0 (0.0%) |
| 75 Years and older | 91 (100.0%) | 0 (0.0%) |
| Total | 711 (97.8%) | 16 (2.2%) |
Health Insurance Coverage by Citizenship Status in Beaver Springs
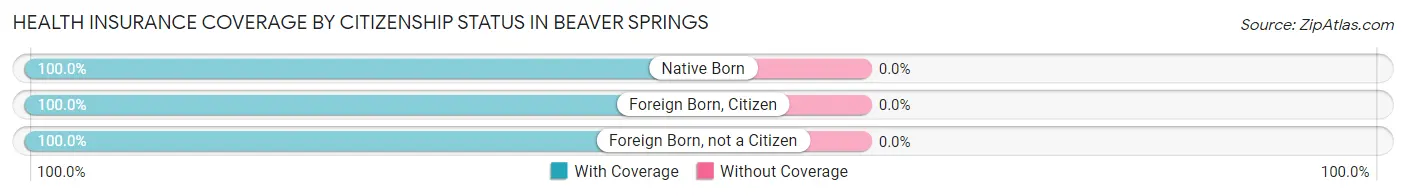
| Citizenship Status | With Coverage | Without Coverage |
| Native Born | 40 (100.0%) | 0 (0.0%) |
| Foreign Born, Citizen | 131 (100.0%) | 0 (0.0%) |
| Foreign Born, not a Citizen | 21 (100.0%) | 0 (0.0%) |
Health Insurance Coverage by Household Income in Beaver Springs
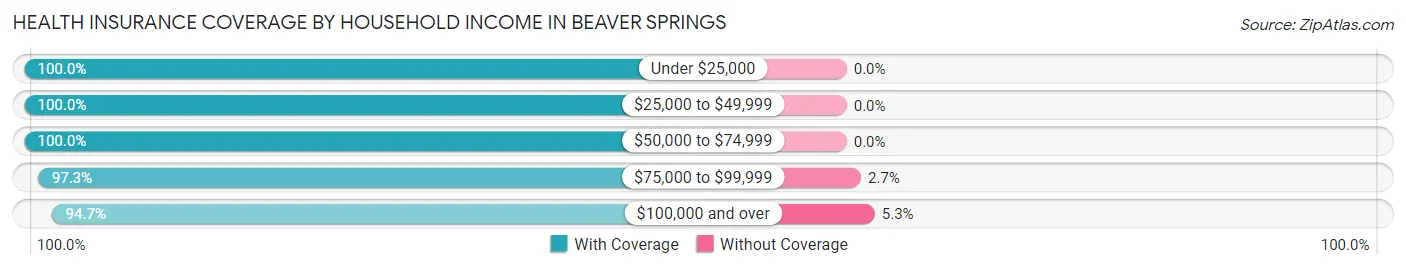
| Household Income | With Coverage | Without Coverage |
| Under $25,000 | 136 (100.0%) | 0 (0.0%) |
| $25,000 to $49,999 | 111 (100.0%) | 0 (0.0%) |
| $50,000 to $74,999 | 66 (100.0%) | 0 (0.0%) |
| $75,000 to $99,999 | 218 (97.3%) | 6 (2.7%) |
| $100,000 and over | 180 (94.7%) | 10 (5.3%) |
Public vs Private Health Insurance Coverage by Age in Beaver Springs
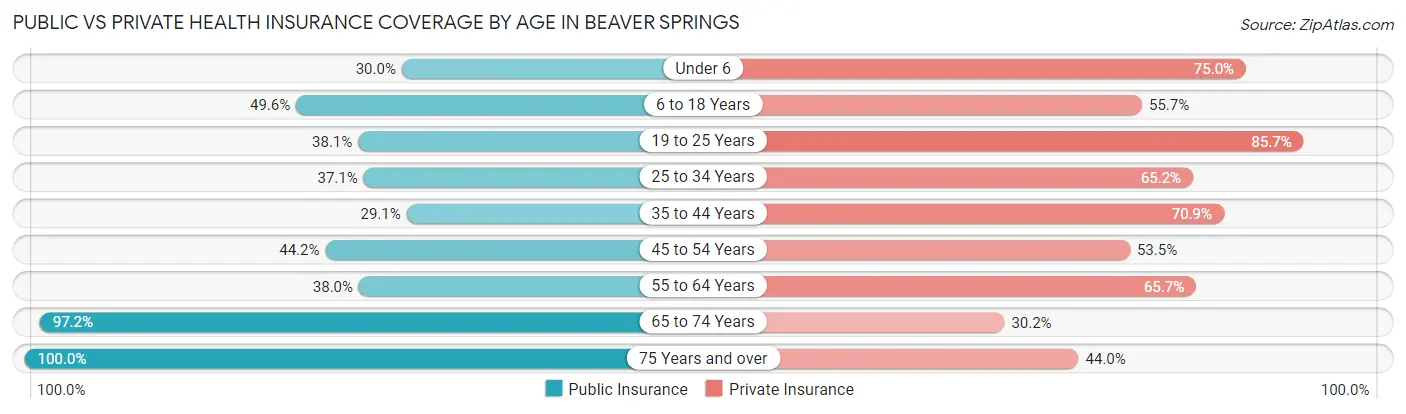
| Age Bracket | Public Insurance | Private Insurance |
| Under 6 | 12 (30.0%) | 30 (75.0%) |
| 6 to 18 Years | 65 (49.6%) | 73 (55.7%) |
| 19 to 25 Years | 8 (38.1%) | 18 (85.7%) |
| 25 to 34 Years | 33 (37.1%) | 58 (65.2%) |
| 35 to 44 Years | 16 (29.1%) | 39 (70.9%) |
| 45 to 54 Years | 38 (44.2%) | 46 (53.5%) |
| 55 to 64 Years | 41 (38.0%) | 71 (65.7%) |
| 65 to 74 Years | 103 (97.2%) | 32 (30.2%) |
| 75 Years and over | 91 (100.0%) | 40 (44.0%) |
| Total | 407 (56.0%) | 407 (56.0%) |
Disability Status by Sex by Age in Beaver Springs
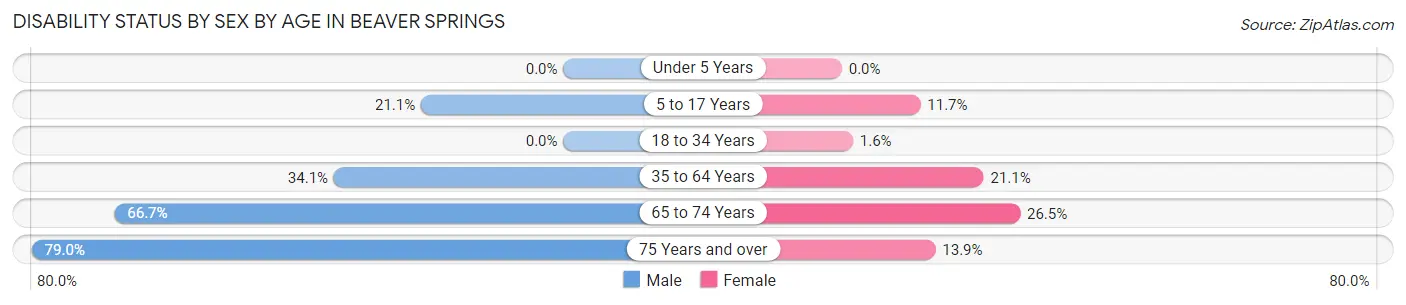
| Age Bracket | Male | Female |
| Under 5 Years | 0 (0.0%) | 0 (0.0%) |
| 5 to 17 Years | 15 (21.1%) | 7 (11.7%) |
| 18 to 34 Years | 0 (0.0%) | 1 (1.6%) |
| 35 to 64 Years | 46 (34.1%) | 24 (21.0%) |
| 65 to 74 Years | 48 (66.7%) | 9 (26.5%) |
| 75 Years and over | 15 (78.9%) | 10 (13.9%) |
Disability Class by Sex by Age in Beaver Springs
Disability Class: Hearing Difficulty
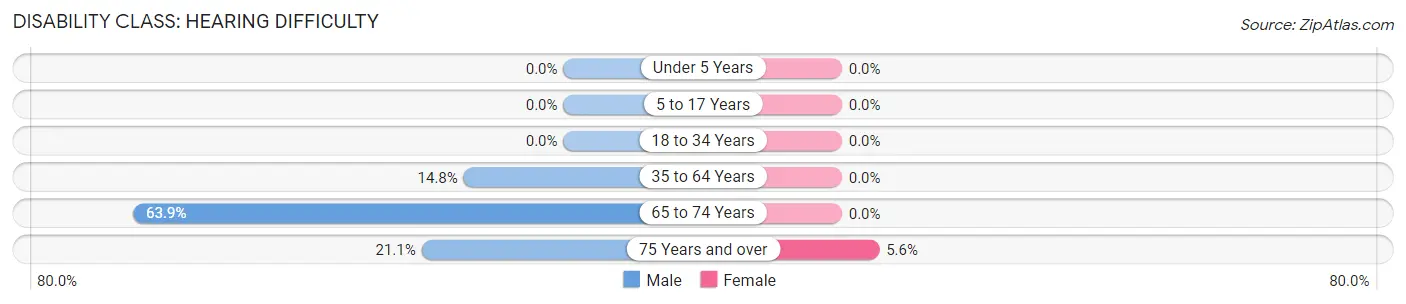
| Age Bracket | Male | Female |
| Under 5 Years | 0 (0.0%) | 0 (0.0%) |
| 5 to 17 Years | 0 (0.0%) | 0 (0.0%) |
| 18 to 34 Years | 0 (0.0%) | 0 (0.0%) |
| 35 to 64 Years | 20 (14.8%) | 0 (0.0%) |
| 65 to 74 Years | 46 (63.9%) | 0 (0.0%) |
| 75 Years and over | 4 (21.0%) | 4 (5.6%) |
Disability Class: Vision Difficulty
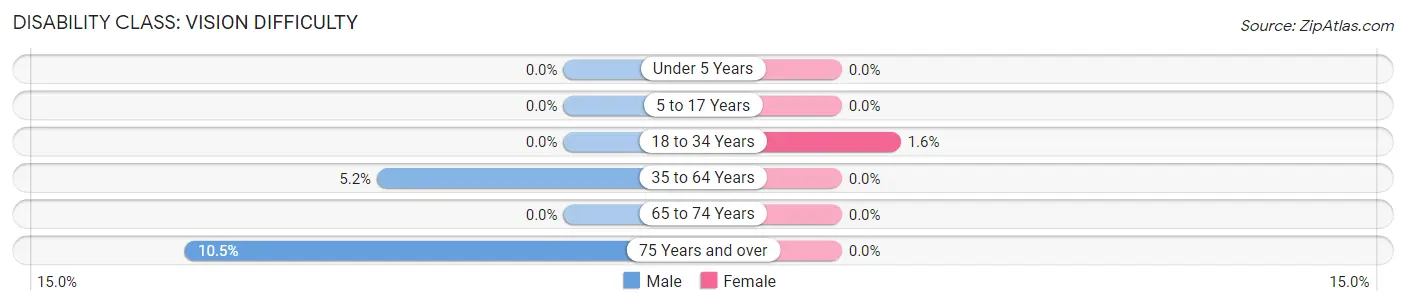
| Age Bracket | Male | Female |
| Under 5 Years | 0 (0.0%) | 0 (0.0%) |
| 5 to 17 Years | 0 (0.0%) | 0 (0.0%) |
| 18 to 34 Years | 0 (0.0%) | 1 (1.6%) |
| 35 to 64 Years | 7 (5.2%) | 0 (0.0%) |
| 65 to 74 Years | 0 (0.0%) | 0 (0.0%) |
| 75 Years and over | 2 (10.5%) | 0 (0.0%) |
Disability Class: Cognitive Difficulty
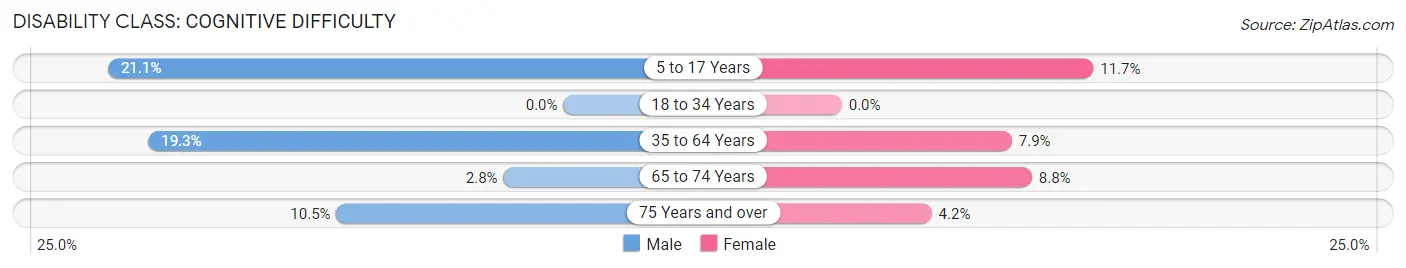
| Age Bracket | Male | Female |
| 5 to 17 Years | 15 (21.1%) | 7 (11.7%) |
| 18 to 34 Years | 0 (0.0%) | 0 (0.0%) |
| 35 to 64 Years | 26 (19.3%) | 9 (7.9%) |
| 65 to 74 Years | 2 (2.8%) | 3 (8.8%) |
| 75 Years and over | 2 (10.5%) | 3 (4.2%) |
Disability Class: Ambulatory Difficulty
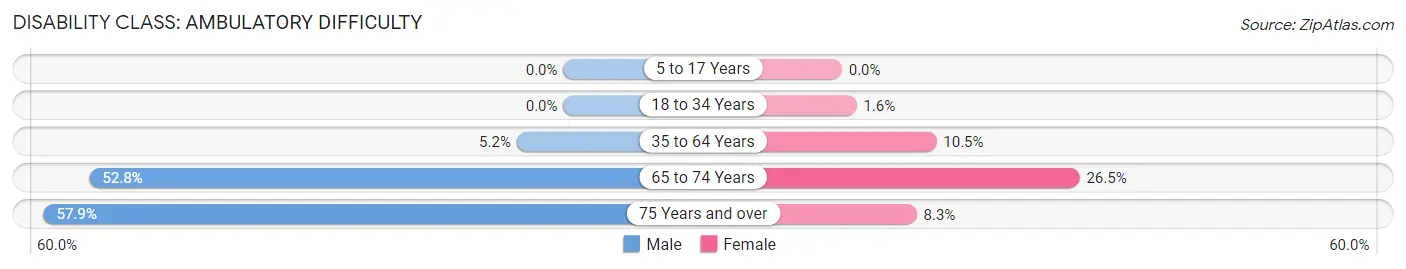
| Age Bracket | Male | Female |
| 5 to 17 Years | 0 (0.0%) | 0 (0.0%) |
| 18 to 34 Years | 0 (0.0%) | 1 (1.6%) |
| 35 to 64 Years | 7 (5.2%) | 12 (10.5%) |
| 65 to 74 Years | 38 (52.8%) | 9 (26.5%) |
| 75 Years and over | 11 (57.9%) | 6 (8.3%) |
Disability Class: Self-Care Difficulty
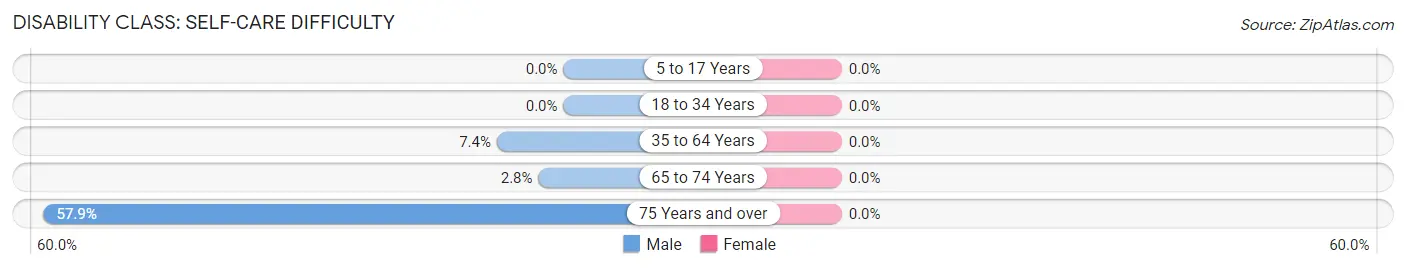
| Age Bracket | Male | Female |
| 5 to 17 Years | 0 (0.0%) | 0 (0.0%) |
| 18 to 34 Years | 0 (0.0%) | 0 (0.0%) |
| 35 to 64 Years | 10 (7.4%) | 0 (0.0%) |
| 65 to 74 Years | 2 (2.8%) | 0 (0.0%) |
| 75 Years and over | 11 (57.9%) | 0 (0.0%) |
Technology Access in Beaver Springs
Computing Device Access in Beaver Springs
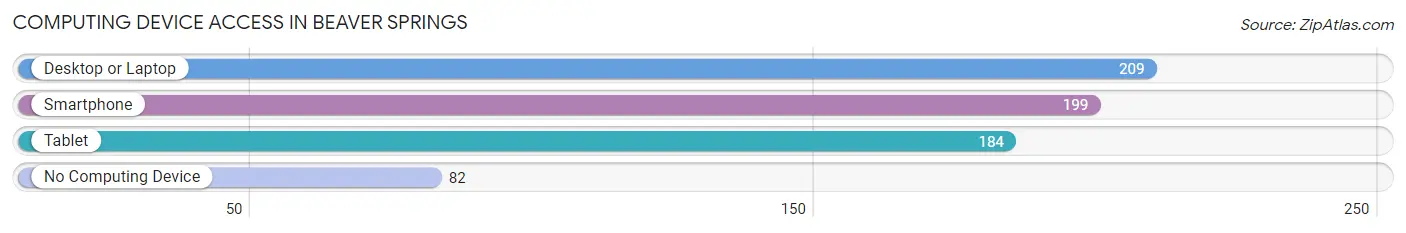
| Device Type | # Households | % Households |
| Desktop or Laptop | 209 | 63.7% |
| Smartphone | 199 | 60.7% |
| Tablet | 184 | 56.1% |
| No Computing Device | 82 | 25.0% |
| Total | 328 | 100.0% |
Internet Access in Beaver Springs
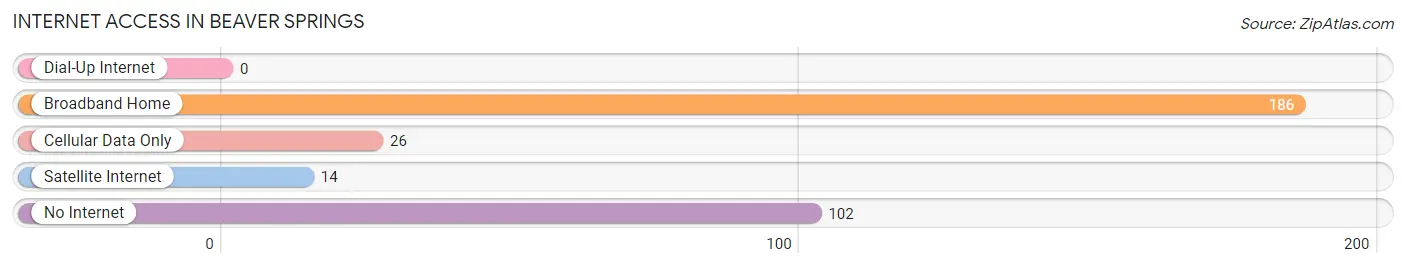
| Internet Type | # Households | % Households |
| Dial-Up Internet | 0 | 0.0% |
| Broadband Home | 186 | 56.7% |
| Cellular Data Only | 26 | 7.9% |
| Satellite Internet | 14 | 4.3% |
| No Internet | 102 | 31.1% |
| Total | 328 | 100.0% |
Beaver Springs Summary
Beaver Springs is a small borough located in Snyder County, Pennsylvania. It is situated in the Susquehanna Valley, approximately 10 miles east of Selinsgrove and 15 miles west of Sunbury. The population of Beaver Springs was 545 at the 2010 census.
Geography
Beaver Springs is located at 40°45'45" North, 76°51'45" West (40.7625, -76.8625). According to the United States Census Bureau, the borough has a total area of 0.3 square miles (0.8 km2), all of it land.
History
Beaver Springs was founded in 1820 by John Beaver, a local landowner. The town was originally known as Beaversville, but the name was changed to Beaver Springs in 1845. The town was incorporated as a borough in 1875.
The town was a popular destination for tourists in the late 19th and early 20th centuries, due to its natural springs and mineral baths. The town was also known for its many hotels and resorts.
Economy
Beaver Springs is a small, rural community with a limited economy. The town is home to several small businesses, including a grocery store, a hardware store, a pharmacy, and a few restaurants. The town also has a post office and a bank.
The town is also home to several manufacturing companies, including a furniture factory, a plastics factory, and a metal fabrication plant.
Demographics
As of the 2010 census, the population of Beaver Springs was 545. The racial makeup of the town was 97.3% White, 0.7% African American, 0.2% Native American, 0.2% Asian, 0.2% from other races, and 1.6% from two or more races. Hispanic or Latino of any race were 0.7% of the population.
The median income for a household in the town was $37,500, and the median income for a family was $45,000. The per capita income for the town was $18,845. About 8.3% of families and 10.2% of the population were below the poverty line, including 14.3% of those under age 18 and 8.3% of those age 65 or over.
Conclusion
Beaver Springs is a small borough located in Snyder County, Pennsylvania. It is situated in the Susquehanna Valley, approximately 10 miles east of Selinsgrove and 15 miles west of Sunbury. The population of Beaver Springs was 545 at the 2010 census. The town was founded in 1820 by John Beaver, and was originally known as Beaversville. The town was incorporated as a borough in 1875. Beaver Springs is a small, rural community with a limited economy. The town is home to several small businesses, manufacturing companies, and a post office. The racial makeup of the town was 97.3% White, 0.7% African American, 0.2% Native American, 0.2% Asian, 0.2% from other races, and 1.6% from two or more races. The median income for a household in the town was $37,500, and the median income for a family was $45,000. About 8.3% of families and 10.2% of the population were below the poverty line.
Common Questions
What is Per Capita Income in Beaver Springs?
Per Capita income in Beaver Springs is $30,097.
What is the Median Family Income in Beaver Springs?
Median Family Income in Beaver Springs is $52,321.
What is the Median Household income in Beaver Springs?
Median Household Income in Beaver Springs is $48,571.
What is Income or Wage Gap in Beaver Springs?
Income or Wage Gap in Beaver Springs is 17.4%.
Women in Beaver Springs earn 82.6 cents for every dollar earned by a man.
What is Inequality or Gini Index in Beaver Springs?
Inequality or Gini Index in Beaver Springs is 0.46.
What is the Total Population of Beaver Springs?
Total Population of Beaver Springs is 730.
What is the Total Male Population of Beaver Springs?
Total Male Population of Beaver Springs is 377.
What is the Total Female Population of Beaver Springs?
Total Female Population of Beaver Springs is 353.
What is the Ratio of Males per 100 Females in Beaver Springs?
There are 106.80 Males per 100 Females in Beaver Springs.
What is the Ratio of Females per 100 Males in Beaver Springs?
There are 93.63 Females per 100 Males in Beaver Springs.
What is the Median Population Age in Beaver Springs?
Median Population Age in Beaver Springs is 48.6 Years.
What is the Average Family Size in Beaver Springs
Average Family Size in Beaver Springs is 3.0 People.
What is the Average Household Size in Beaver Springs
Average Household Size in Beaver Springs is 2.2 People.
How Large is the Labor Force in Beaver Springs?
There are 311 People in the Labor Forcein in Beaver Springs.
What is the Percentage of People in the Labor Force in Beaver Springs?
53.9% of People are in the Labor Force in Beaver Springs.