Littlestown borough, PA Map & Demographics
Littlestown borough Overview
$30,868
PER CAPITA INCOME
$80,125
AVG FAMILY INCOME
$62,857
AVG HOUSEHOLD INCOME
32.6%
WAGE / INCOME GAP [ % ]
67.4¢/ $1
WAGE / INCOME GAP [ $ ]
0.38
INEQUALITY / GINI INDEX
4,779
TOTAL POPULATION
2,296
MALE POPULATION
2,483
FEMALE POPULATION
92.47
MALES / 100 FEMALES
108.14
FEMALES / 100 MALES
39.4
MEDIAN AGE
3.2
AVG FAMILY SIZE
2.5
AVG HOUSEHOLD SIZE
2,252
LABOR FORCE [ PEOPLE ]
59.9%
PERCENT IN LABOR FORCE
2.4%
UNEMPLOYMENT RATE
Income in Littlestown borough
Income Overview in Littlestown borough
Per Capita Income in Littlestown borough is $30,868, while median incomes of families and households are $80,125 and $62,857 respectively.
| Characteristic | Number | Measure |
| Per Capita Income | 4,779 | $30,868 |
| Median Family Income | 1,251 | $80,125 |
| Mean Family Income | 1,251 | $89,769 |
| Median Household Income | 1,878 | $62,857 |
| Mean Household Income | 1,878 | $77,498 |
| Income Deficit | 1,251 | $0 |
| Wage / Income Gap (%) | 4,779 | 32.62% |
| Wage / Income Gap ($) | 4,779 | 67.38¢ per $1 |
| Gini / Inequality Index | 4,779 | 0.38 |
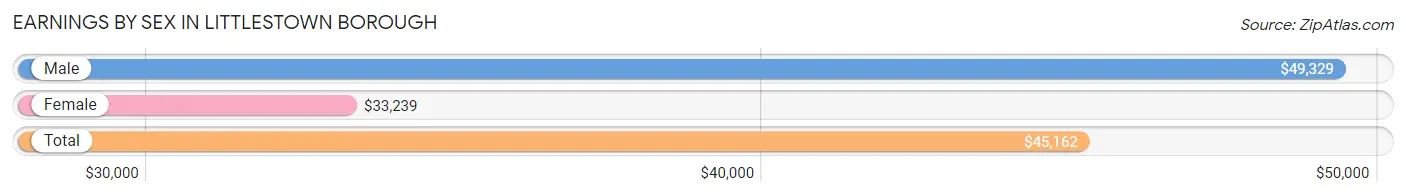
Earnings by Sex in Littlestown borough
Average Earnings in Littlestown borough are $45,162, $49,329 for men and $33,239 for women, a difference of 32.6%.
| Sex | Number | Average Earnings |
| Male | 1,226 (50.8%) | $49,329 |
| Female | 1,187 (49.2%) | $33,239 |
| Total | 2,413 (100.0%) | $45,162 |
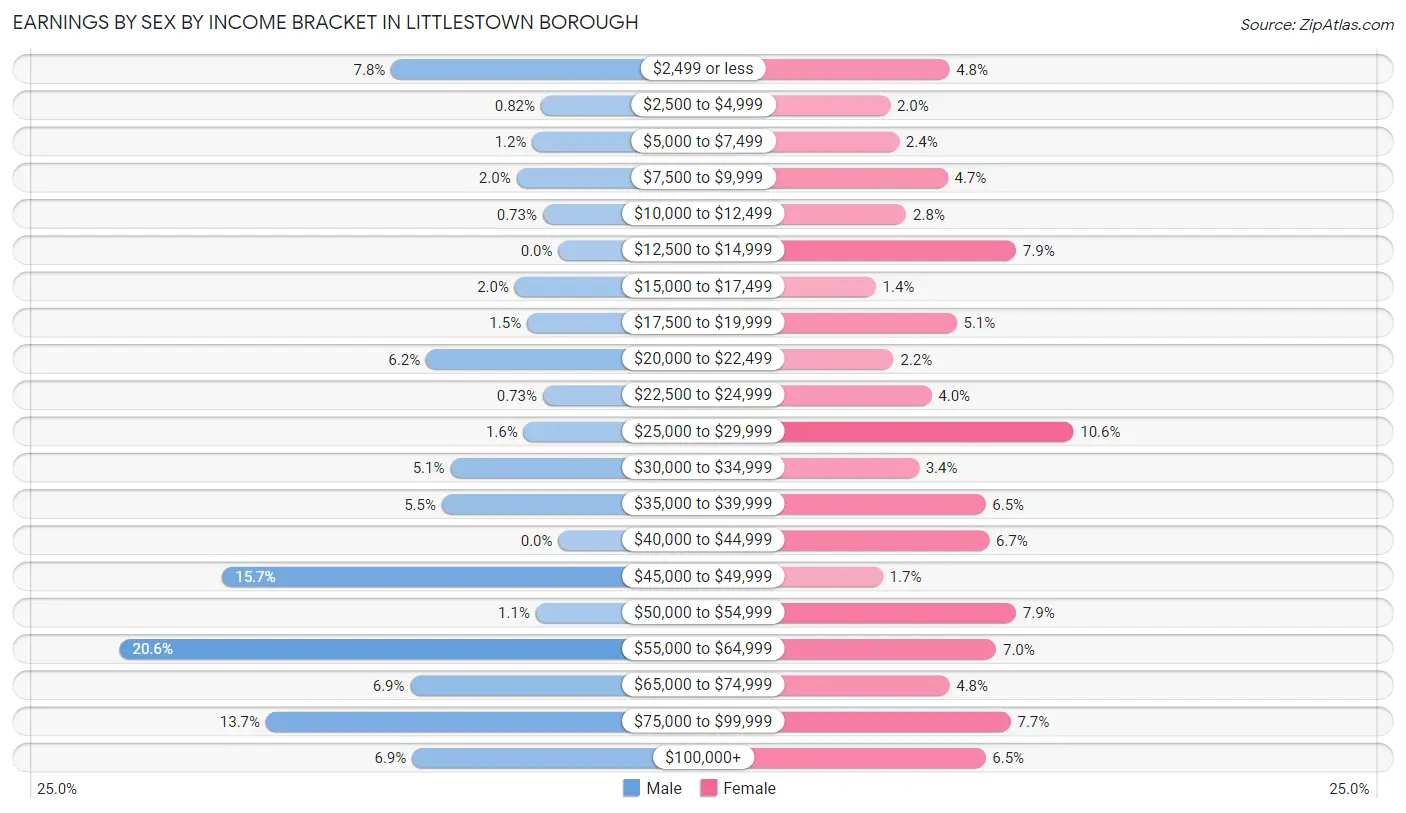
Earnings by Sex by Income Bracket in Littlestown borough
The most common earnings brackets in Littlestown borough are $55,000 to $64,999 for men (252 | 20.5%) and $25,000 to $29,999 for women (126 | 10.6%).
| Income | Male | Female |
| $2,499 or less | 96 (7.8%) | 57 (4.8%) |
| $2,500 to $4,999 | 10 (0.8%) | 24 (2.0%) |
| $5,000 to $7,499 | 15 (1.2%) | 29 (2.4%) |
| $7,500 to $9,999 | 24 (2.0%) | 56 (4.7%) |
| $10,000 to $12,499 | 9 (0.7%) | 33 (2.8%) |
| $12,500 to $14,999 | 0 (0.0%) | 94 (7.9%) |
| $15,000 to $17,499 | 25 (2.0%) | 16 (1.3%) |
| $17,500 to $19,999 | 18 (1.5%) | 61 (5.1%) |
| $20,000 to $22,499 | 76 (6.2%) | 26 (2.2%) |
| $22,500 to $24,999 | 9 (0.7%) | 47 (4.0%) |
| $25,000 to $29,999 | 20 (1.6%) | 126 (10.6%) |
| $30,000 to $34,999 | 62 (5.1%) | 40 (3.4%) |
| $35,000 to $39,999 | 67 (5.5%) | 77 (6.5%) |
| $40,000 to $44,999 | 0 (0.0%) | 79 (6.7%) |
| $45,000 to $49,999 | 193 (15.7%) | 20 (1.7%) |
| $50,000 to $54,999 | 13 (1.1%) | 94 (7.9%) |
| $55,000 to $64,999 | 252 (20.5%) | 83 (7.0%) |
| $65,000 to $74,999 | 85 (6.9%) | 57 (4.8%) |
| $75,000 to $99,999 | 168 (13.7%) | 91 (7.7%) |
| $100,000+ | 84 (6.9%) | 77 (6.5%) |
| Total | 1,226 (100.0%) | 1,187 (100.0%) |
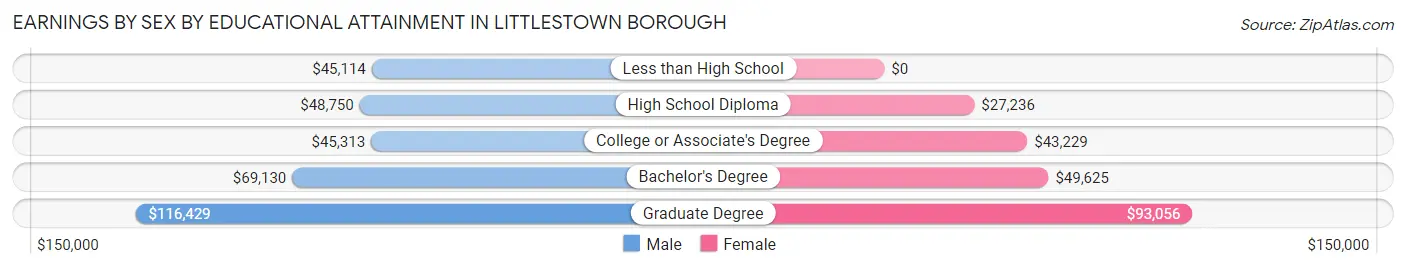
Earnings by Sex by Educational Attainment in Littlestown borough
Average earnings in Littlestown borough are $57,564 for men and $38,221 for women, a difference of 33.6%. Men with an educational attainment of graduate degree enjoy the highest average annual earnings of $116,429, while those with less than high school education earn the least with $45,114. Women with an educational attainment of graduate degree earn the most with the average annual earnings of $93,056, while those with high school diploma education have the smallest earnings of $27,236.
| Educational Attainment | Male Income | Female Income |
| Less than High School | $45,114 | $0 |
| High School Diploma | $48,750 | $27,236 |
| College or Associate's Degree | $45,313 | $43,229 |
| Bachelor's Degree | $69,130 | $49,625 |
| Graduate Degree | $116,429 | $93,056 |
| Total | $57,564 | $38,221 |
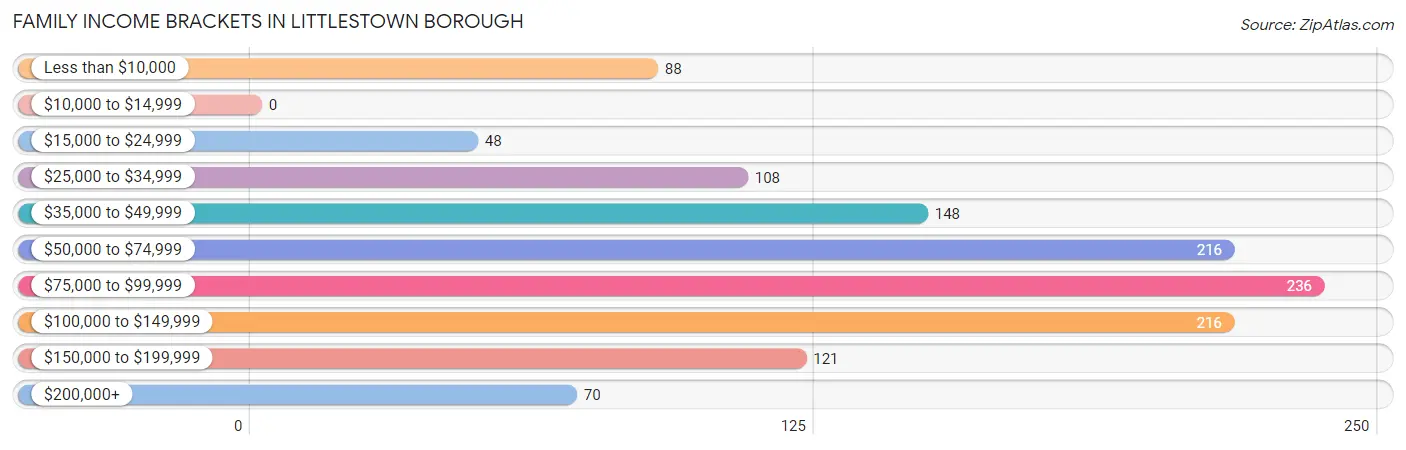
Family Income in Littlestown borough
Family Income Brackets in Littlestown borough
According to the Littlestown borough family income data, there are 236 families falling into the $75,000 to $99,999 income range, which is the most common income bracket and makes up 18.9% of all families.
| Income Bracket | # Families | % Families |
| Less than $10,000 | 88 | 7.0% |
| $10,000 to $14,999 | 0 | 0.0% |
| $15,000 to $24,999 | 48 | 3.8% |
| $25,000 to $34,999 | 108 | 8.6% |
| $35,000 to $49,999 | 148 | 11.8% |
| $50,000 to $74,999 | 216 | 17.3% |
| $75,000 to $99,999 | 236 | 18.9% |
| $100,000 to $149,999 | 216 | 17.3% |
| $150,000 to $199,999 | 121 | 9.7% |
| $200,000+ | 70 | 5.6% |
Family Income by Famaliy Size in Littlestown borough
4-person families (246 | 19.7%) account for the highest median family income in Littlestown borough with $113,421 per family, while 2-person families (611 | 48.8%) have the highest median income of $32,634 per family member.
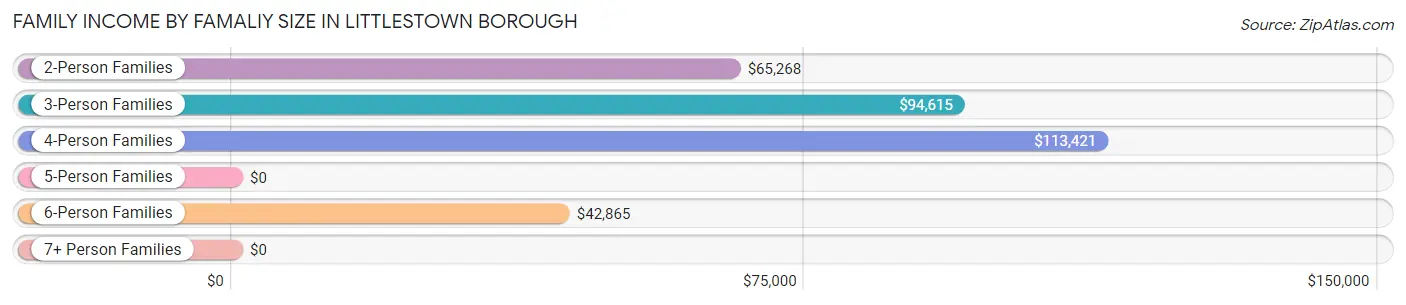
| Income Bracket | # Families | Median Income |
| 2-Person Families | 611 (48.8%) | $65,268 |
| 3-Person Families | 214 (17.1%) | $94,615 |
| 4-Person Families | 246 (19.7%) | $113,421 |
| 5-Person Families | 67 (5.4%) | $0 |
| 6-Person Families | 77 (6.2%) | $42,865 |
| 7+ Person Families | 36 (2.9%) | $0 |
| Total | 1,251 (100.0%) | $80,125 |
Family Income by Number of Earners in Littlestown borough
The median family income in Littlestown borough is $80,125, with families comprising 3+ earners (214) having the highest median family income of $154,653, while families with no earners (365) have the lowest median family income of $46,385, accounting for 17.1% and 29.2% of families, respectively.
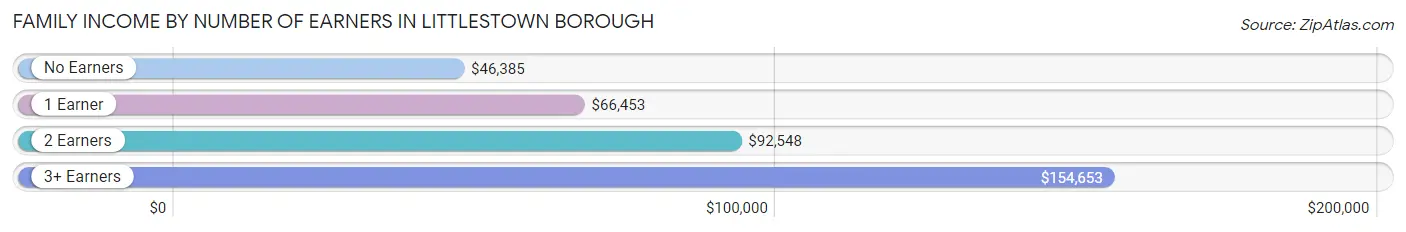
| Number of Earners | # Families | Median Income |
| No Earners | 365 (29.2%) | $46,385 |
| 1 Earner | 273 (21.8%) | $66,453 |
| 2 Earners | 399 (31.9%) | $92,548 |
| 3+ Earners | 214 (17.1%) | $154,653 |
| Total | 1,251 (100.0%) | $80,125 |
Household Income in Littlestown borough
Household Income Brackets in Littlestown borough
With 404 households falling in the category, the $50,000 to $74,999 income range is the most frequent in Littlestown borough, accounting for 21.5% of all households. In contrast, only 8 households (0.4%) fall into the $10,000 to $14,999 income bracket, making it the least populous group.
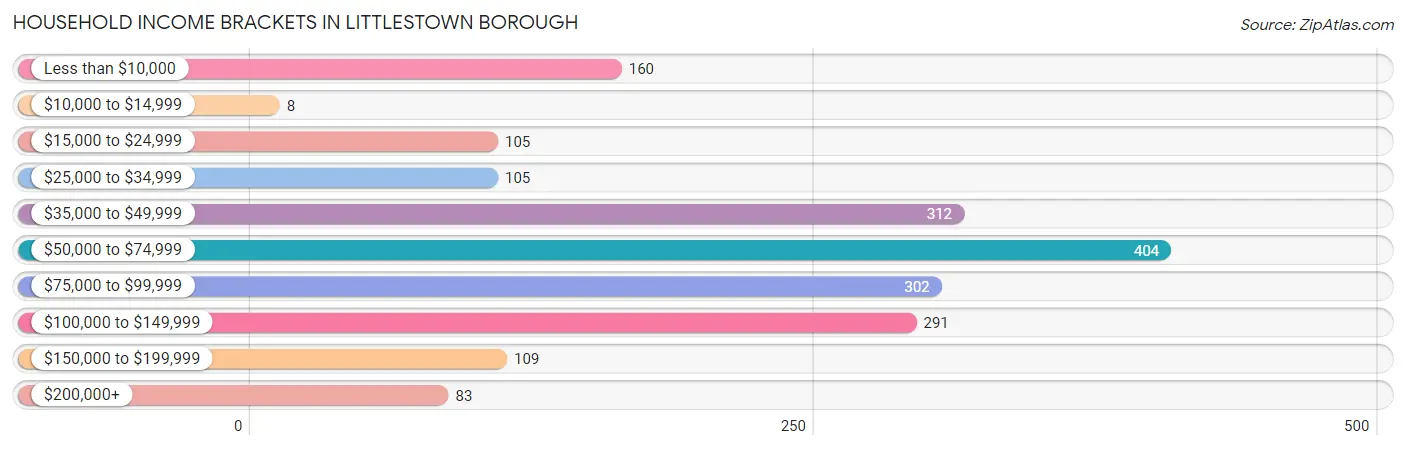
| Income Bracket | # Households | % Households |
| Less than $10,000 | 160 | 8.5% |
| $10,000 to $14,999 | 8 | 0.4% |
| $15,000 to $24,999 | 105 | 5.6% |
| $25,000 to $34,999 | 105 | 5.6% |
| $35,000 to $49,999 | 312 | 16.6% |
| $50,000 to $74,999 | 404 | 21.5% |
| $75,000 to $99,999 | 302 | 16.1% |
| $100,000 to $149,999 | 291 | 15.5% |
| $150,000 to $199,999 | 109 | 5.8% |
| $200,000+ | 83 | 4.4% |
Household Income by Householder Age in Littlestown borough
The median household income in Littlestown borough is $62,857, with the highest median household income of $80,000 found in the 45 to 64 years age bracket for the primary householder. A total of 770 households (41.0%) fall into this category. Meanwhile, the 15 to 24 years age bracket for the primary householder has the lowest median household income of $58,021, with 73 households (3.9%) in this group.
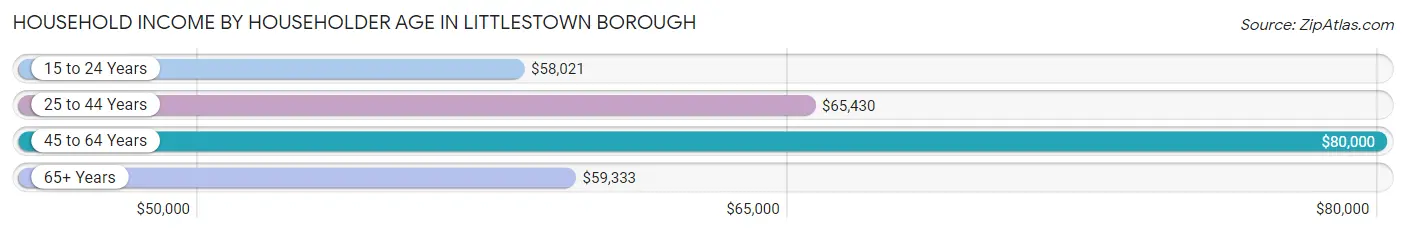
| Income Bracket | # Households | Median Income |
| 15 to 24 Years | 73 (3.9%) | $58,021 |
| 25 to 44 Years | 583 (31.0%) | $65,430 |
| 45 to 64 Years | 770 (41.0%) | $80,000 |
| 65+ Years | 452 (24.1%) | $59,333 |
| Total | 1,878 (100.0%) | $62,857 |
Poverty in Littlestown borough
Income Below Poverty by Sex and Age in Littlestown borough
With 9.9% poverty level for males and 19.7% for females among the residents of Littlestown borough, 5 year old males and 6 to 11 year old females are the most vulnerable to poverty, with 31 males (66.0%) and 94 females (46.3%) in their respective age groups living below the poverty level.
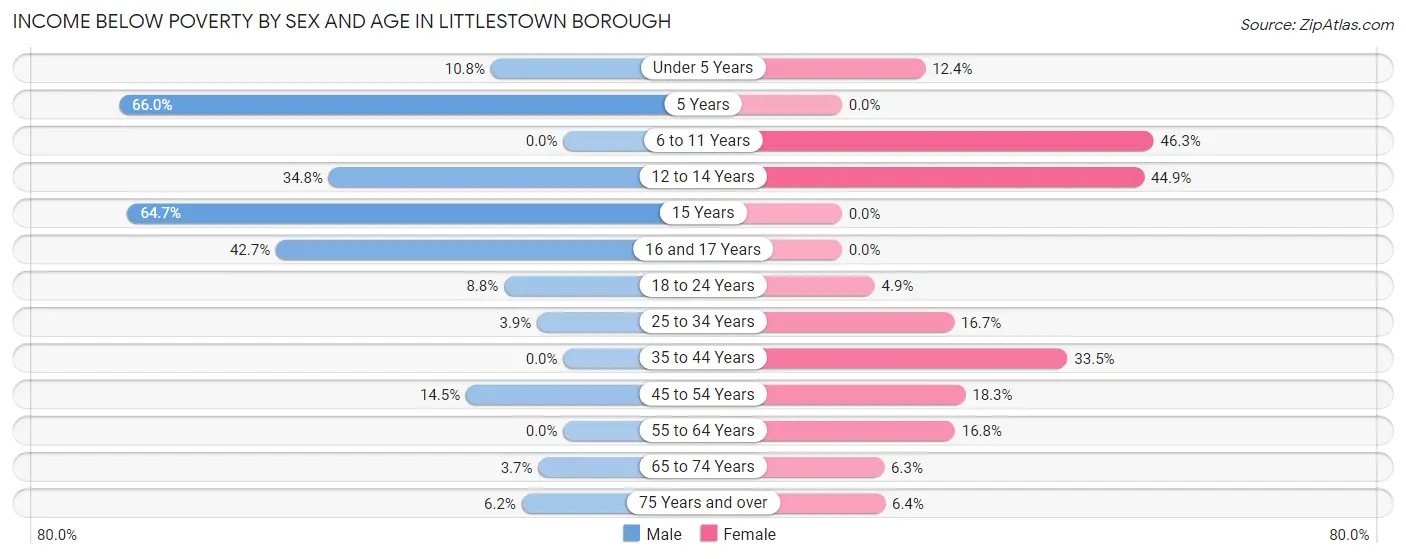
| Age Bracket | Male | Female |
| Under 5 Years | 18 (10.8%) | 14 (12.4%) |
| 5 Years | 31 (66.0%) | 0 (0.0%) |
| 6 to 11 Years | 0 (0.0%) | 94 (46.3%) |
| 12 to 14 Years | 31 (34.8%) | 44 (44.9%) |
| 15 Years | 33 (64.7%) | 0 (0.0%) |
| 16 and 17 Years | 32 (42.7%) | 0 (0.0%) |
| 18 to 24 Years | 17 (8.8%) | 8 (4.9%) |
| 25 to 34 Years | 14 (3.9%) | 42 (16.7%) |
| 35 to 44 Years | 0 (0.0%) | 134 (33.5%) |
| 45 to 54 Years | 35 (14.5%) | 31 (18.3%) |
| 55 to 64 Years | 0 (0.0%) | 95 (16.8%) |
| 65 to 74 Years | 8 (3.7%) | 18 (6.3%) |
| 75 Years and over | 7 (6.2%) | 7 (6.4%) |
| Total | 226 (9.9%) | 487 (19.7%) |
Income Above Poverty by Sex and Age in Littlestown borough
According to the poverty statistics in Littlestown borough, males aged 6 to 11 years and females aged 5 years are the age groups that are most secure financially, with 100.0% of males and 100.0% of females in these age groups living above the poverty line.
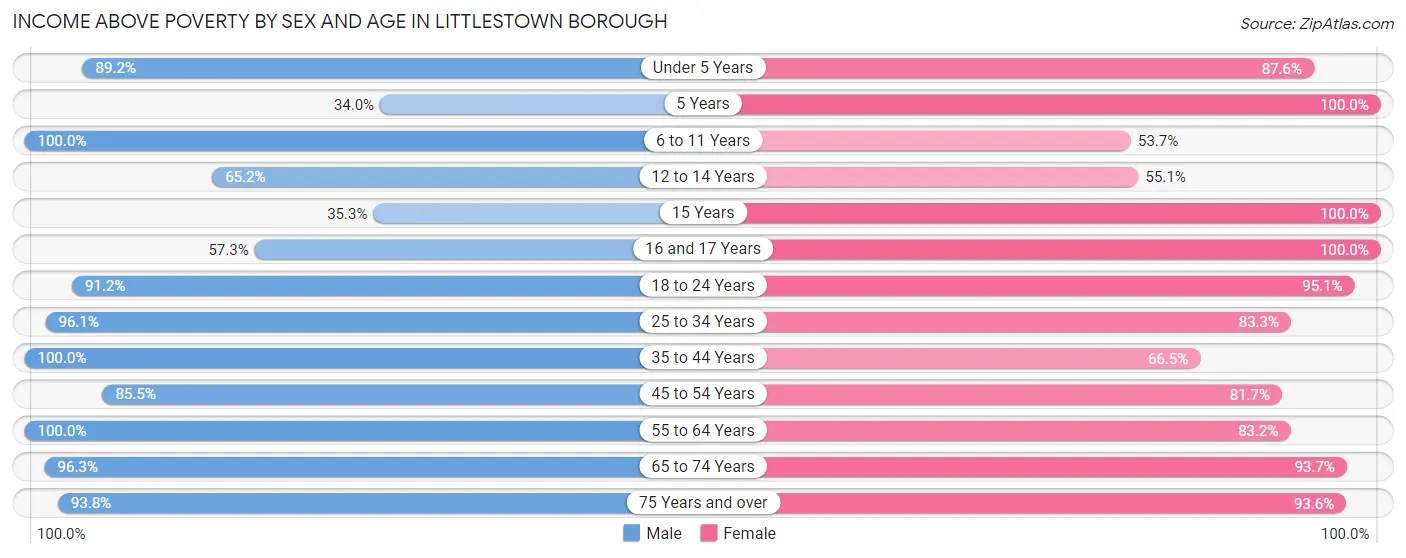
| Age Bracket | Male | Female |
| Under 5 Years | 149 (89.2%) | 99 (87.6%) |
| 5 Years | 16 (34.0%) | 34 (100.0%) |
| 6 to 11 Years | 166 (100.0%) | 109 (53.7%) |
| 12 to 14 Years | 58 (65.2%) | 54 (55.1%) |
| 15 Years | 18 (35.3%) | 29 (100.0%) |
| 16 and 17 Years | 43 (57.3%) | 48 (100.0%) |
| 18 to 24 Years | 176 (91.2%) | 156 (95.1%) |
| 25 to 34 Years | 345 (96.1%) | 210 (83.3%) |
| 35 to 44 Years | 183 (100.0%) | 266 (66.5%) |
| 45 to 54 Years | 207 (85.5%) | 138 (81.7%) |
| 55 to 64 Years | 385 (100.0%) | 471 (83.2%) |
| 65 to 74 Years | 207 (96.3%) | 268 (93.7%) |
| 75 Years and over | 106 (93.8%) | 102 (93.6%) |
| Total | 2,059 (90.1%) | 1,984 (80.3%) |
Income Below Poverty Among Married-Couple Families in Littlestown borough
The poverty statistics for married-couple families in Littlestown borough show that 2.2% or 19 of the total 853 families live below the poverty line. Families with 3 or 4 children have the highest poverty rate of 8.5%, comprising of 4 families. On the other hand, families with no children have the lowest poverty rate of 1.5%, which includes 7 families.
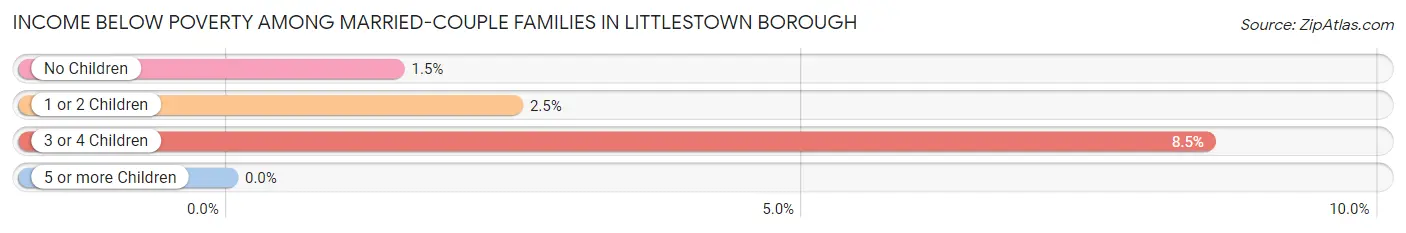
| Children | Above Poverty | Below Poverty |
| No Children | 476 (98.6%) | 7 (1.5%) |
| 1 or 2 Children | 315 (97.5%) | 8 (2.5%) |
| 3 or 4 Children | 43 (91.5%) | 4 (8.5%) |
| 5 or more Children | 0 (0.0%) | 0 (0.0%) |
| Total | 834 (97.8%) | 19 (2.2%) |
Income Below Poverty Among Single-Parent Households in Littlestown borough
According to the poverty data in Littlestown borough, 28.2% or 35 single-father households and 40.5% or 111 single-mother households are living below the poverty line. Among single-father households, those with 3 or 4 children have the highest poverty rate, with 35 households (100.0%) experiencing poverty. Likewise, among single-mother households, those with 3 or 4 children have the highest poverty rate, with 31 households (67.4%) falling below the poverty line.
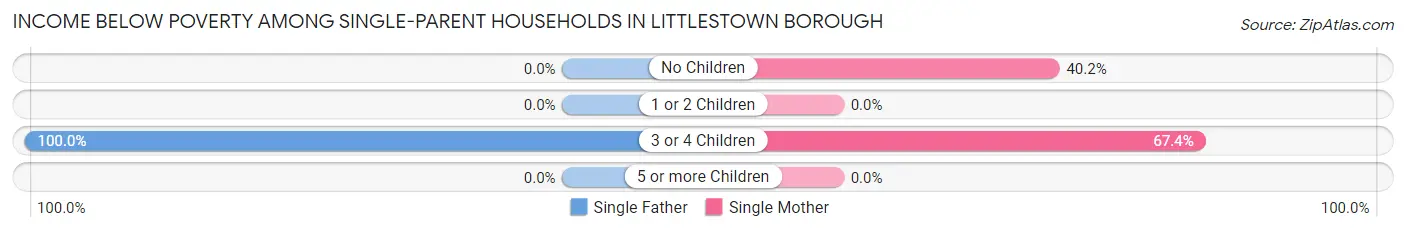
| Children | Single Father | Single Mother |
| No Children | 0 (0.0%) | 80 (40.2%) |
| 1 or 2 Children | 0 (0.0%) | 0 (0.0%) |
| 3 or 4 Children | 35 (100.0%) | 31 (67.4%) |
| 5 or more Children | 0 (0.0%) | 0 (0.0%) |
| Total | 35 (28.2%) | 111 (40.5%) |
Income Below Poverty Among Married-Couple vs Single-Parent Households in Littlestown borough
The poverty data for Littlestown borough shows that 19 of the married-couple family households (2.2%) and 146 of the single-parent households (36.7%) are living below the poverty level. Within the married-couple family households, those with 3 or 4 children have the highest poverty rate, with 4 households (8.5%) falling below the poverty line. Among the single-parent households, those with 3 or 4 children have the highest poverty rate, with 66 household (81.5%) living below poverty.
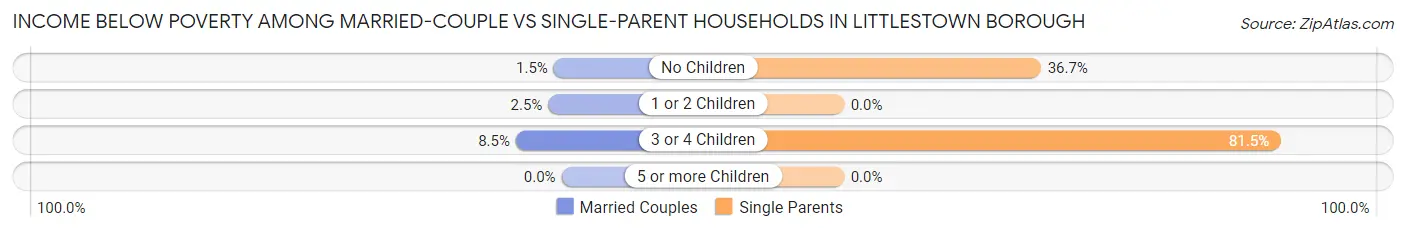
| Children | Married-Couple Families | Single-Parent Households |
| No Children | 7 (1.5%) | 80 (36.7%) |
| 1 or 2 Children | 8 (2.5%) | 0 (0.0%) |
| 3 or 4 Children | 4 (8.5%) | 66 (81.5%) |
| 5 or more Children | 0 (0.0%) | 0 (0.0%) |
| Total | 19 (2.2%) | 146 (36.7%) |
Race in Littlestown borough
The most populous races in Littlestown borough are White / Caucasian (4,562 | 95.5%), Two or more Races (114 | 2.4%), and Black / African American (89 | 1.9%).
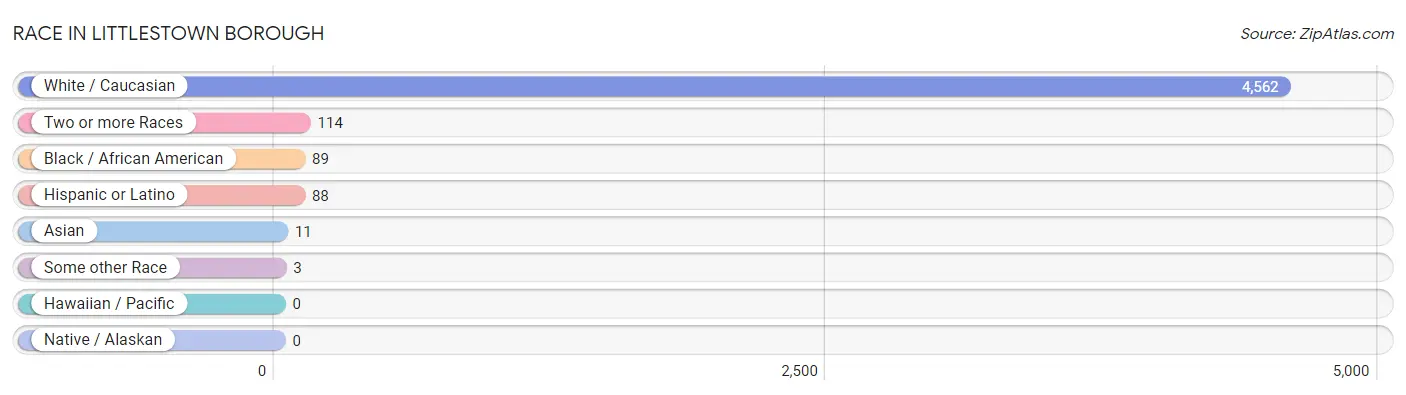
| Race | # Population | % Population |
| Asian | 11 | 0.2% |
| Black / African American | 89 | 1.9% |
| Hawaiian / Pacific | 0 | 0.0% |
| Hispanic or Latino | 88 | 1.8% |
| Native / Alaskan | 0 | 0.0% |
| White / Caucasian | 4,562 | 95.5% |
| Two or more Races | 114 | 2.4% |
| Some other Race | 3 | 0.1% |
| Total | 4,779 | 100.0% |
Ancestry in Littlestown borough
The most populous ancestries reported in Littlestown borough are German (1,379 | 28.9%), American (721 | 15.1%), Irish (697 | 14.6%), English (417 | 8.7%), and Italian (307 | 6.4%), together accounting for 73.7% of all Littlestown borough residents.
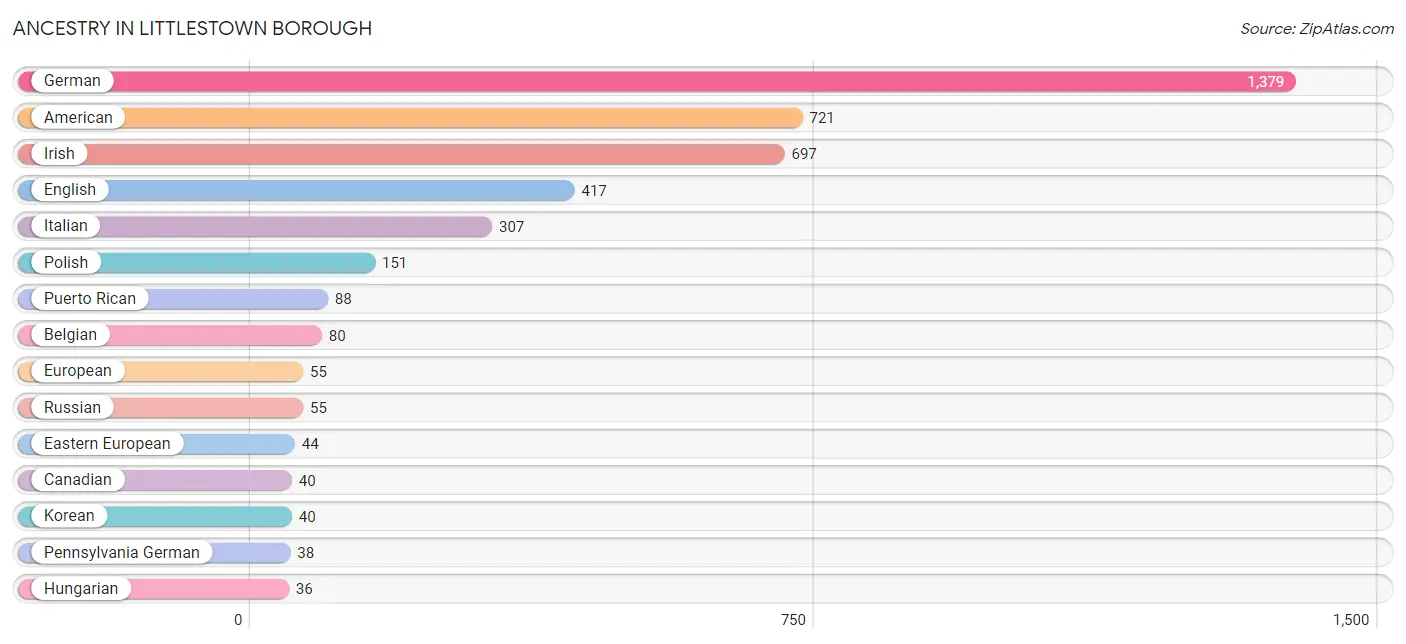
| Ancestry | # Population | % Population |
| American | 721 | 15.1% |
| Arab | 8 | 0.2% |
| Belgian | 80 | 1.7% |
| British | 14 | 0.3% |
| Canadian | 40 | 0.8% |
| Croatian | 11 | 0.2% |
| Czech | 8 | 0.2% |
| Danish | 10 | 0.2% |
| Dutch | 5 | 0.1% |
| Eastern European | 44 | 0.9% |
| English | 417 | 8.7% |
| European | 55 | 1.1% |
| French | 26 | 0.5% |
| French Canadian | 7 | 0.2% |
| German | 1,379 | 28.9% |
| Hungarian | 36 | 0.7% |
| Irish | 697 | 14.6% |
| Italian | 307 | 6.4% |
| Korean | 40 | 0.8% |
| Lebanese | 8 | 0.2% |
| Native Hawaiian | 1 | 0.0% |
| Norwegian | 9 | 0.2% |
| Pennsylvania German | 38 | 0.8% |
| Polish | 151 | 3.2% |
| Puerto Rican | 88 | 1.8% |
| Russian | 55 | 1.1% |
| Scottish | 20 | 0.4% |
| Thai | 14 | 0.3% | View All 28 Rows |
Immigrants in Littlestown borough
The most numerous immigrant groups reported in Littlestown borough came from Asia (11 | 0.2%), Philippines (11 | 0.2%), and South Eastern Asia (11 | 0.2%), together accounting for 0.7% of all Littlestown borough residents.
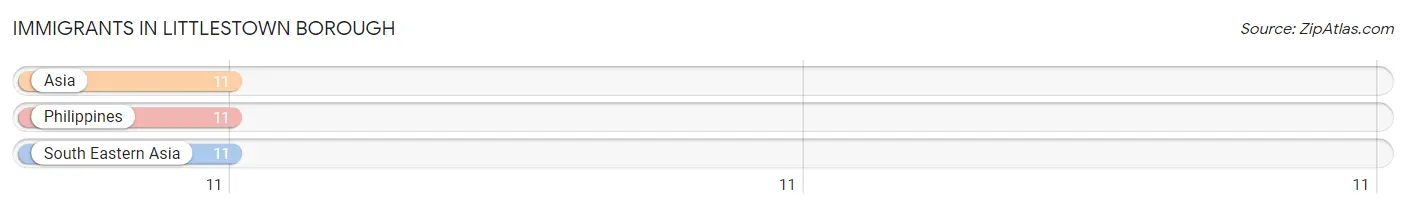
| Immigration Origin | # Population | % Population |
| Asia | 11 | 0.2% |
| Philippines | 11 | 0.2% |
| South Eastern Asia | 11 | 0.2% | View All 3 Rows |
Sex and Age in Littlestown borough
Sex and Age in Littlestown borough
The most populous age groups in Littlestown borough are 55 to 59 Years (240 | 10.4%) for men and 60 to 64 Years (424 | 17.1%) for women.
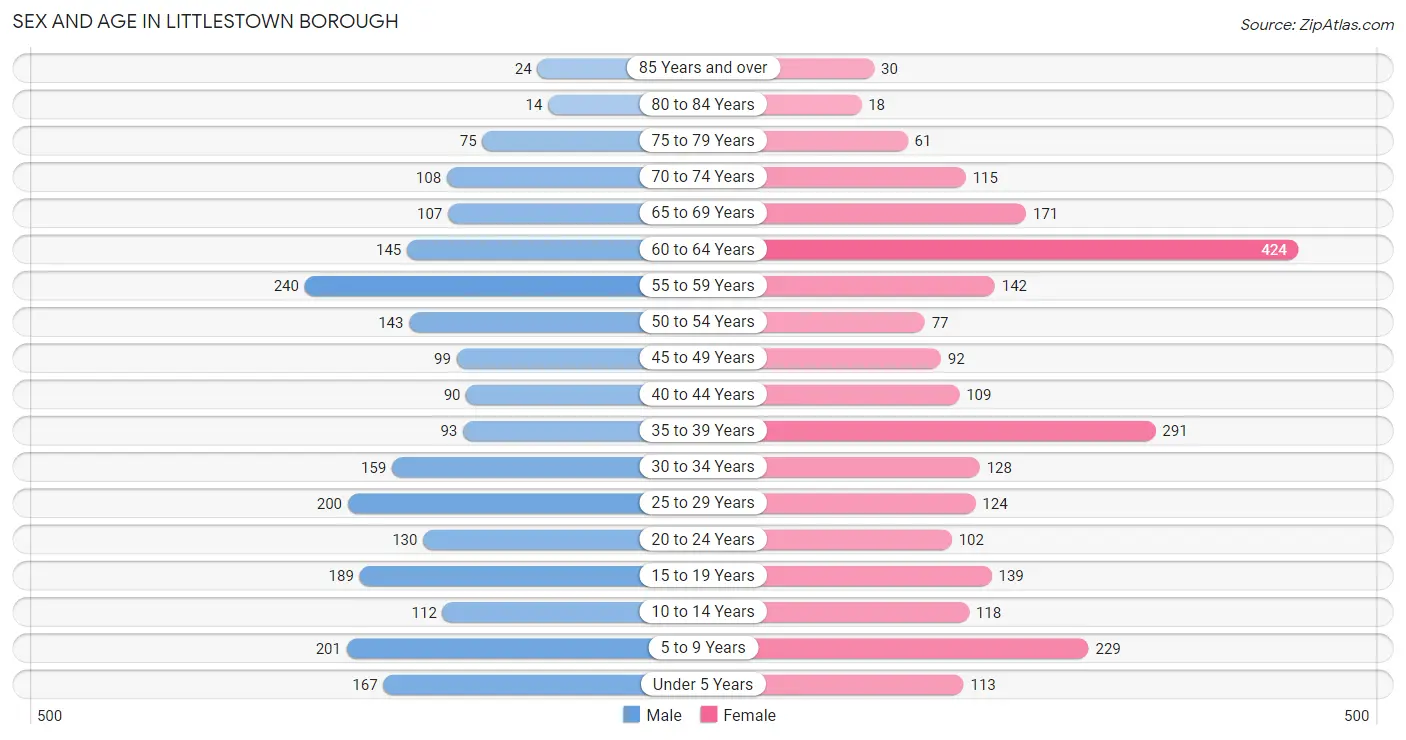
| Age Bracket | Male | Female |
| Under 5 Years | 167 (7.3%) | 113 (4.5%) |
| 5 to 9 Years | 201 (8.7%) | 229 (9.2%) |
| 10 to 14 Years | 112 (4.9%) | 118 (4.8%) |
| 15 to 19 Years | 189 (8.2%) | 139 (5.6%) |
| 20 to 24 Years | 130 (5.7%) | 102 (4.1%) |
| 25 to 29 Years | 200 (8.7%) | 124 (5.0%) |
| 30 to 34 Years | 159 (6.9%) | 128 (5.2%) |
| 35 to 39 Years | 93 (4.1%) | 291 (11.7%) |
| 40 to 44 Years | 90 (3.9%) | 109 (4.4%) |
| 45 to 49 Years | 99 (4.3%) | 92 (3.7%) |
| 50 to 54 Years | 143 (6.2%) | 77 (3.1%) |
| 55 to 59 Years | 240 (10.4%) | 142 (5.7%) |
| 60 to 64 Years | 145 (6.3%) | 424 (17.1%) |
| 65 to 69 Years | 107 (4.7%) | 171 (6.9%) |
| 70 to 74 Years | 108 (4.7%) | 115 (4.6%) |
| 75 to 79 Years | 75 (3.3%) | 61 (2.5%) |
| 80 to 84 Years | 14 (0.6%) | 18 (0.7%) |
| 85 Years and over | 24 (1.1%) | 30 (1.2%) |
| Total | 2,296 (100.0%) | 2,483 (100.0%) |
Families and Households in Littlestown borough
Median Family Size in Littlestown borough
The median family size in Littlestown borough is 3.19 persons per family, with single male/father families (124 | 9.9%) accounting for the largest median family size of 3.94 persons per family. On the other hand, single female/mother families (274 | 21.9%) represent the smallest median family size with 2.64 persons per family.
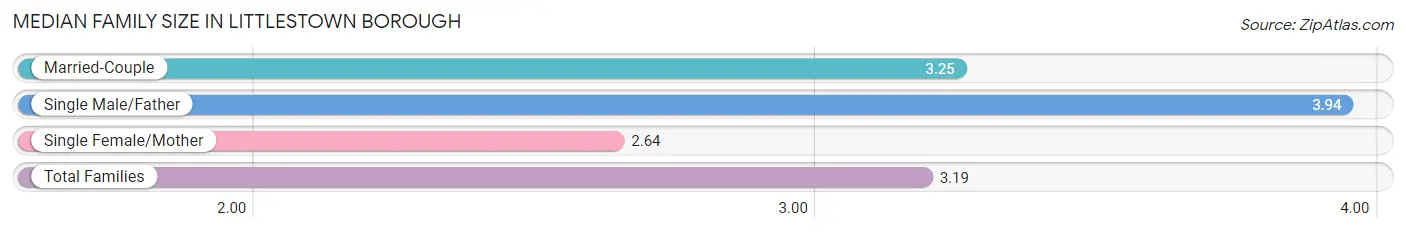
| Family Type | # Families | Family Size |
| Married-Couple | 853 (68.2%) | 3.25 |
| Single Male/Father | 124 (9.9%) | 3.94 |
| Single Female/Mother | 274 (21.9%) | 2.64 |
| Total Families | 1,251 (100.0%) | 3.19 |
Median Household Size in Littlestown borough
The median household size in Littlestown borough is 2.54 persons per household, with single male/father households (124 | 6.6%) accounting for the largest median household size of 4.3 persons per household. non-family households (627 | 33.4%) represent the smallest median household size with 1.10 persons per household.
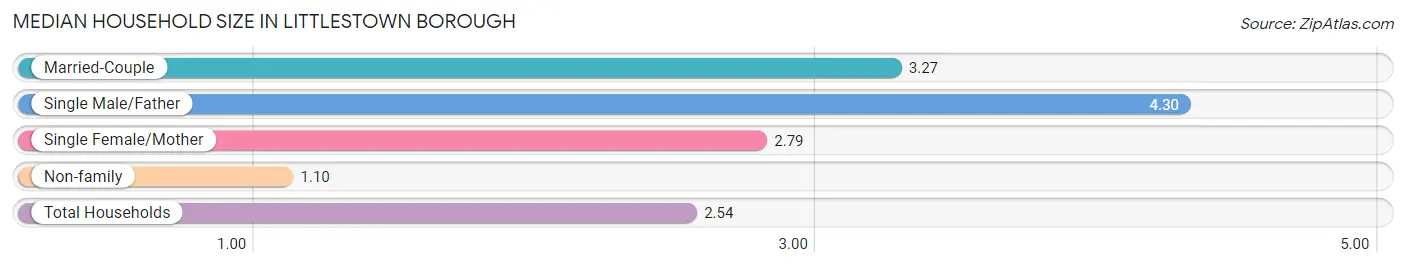
| Household Type | # Households | Household Size |
| Married-Couple | 853 (45.4%) | 3.27 |
| Single Male/Father | 124 (6.6%) | 4.30 |
| Single Female/Mother | 274 (14.6%) | 2.79 |
| Non-family | 627 (33.4%) | 1.10 |
| Total Households | 1,878 (100.0%) | 2.54 |
Household Size by Marriage Status in Littlestown borough
Out of a total of 1,878 households in Littlestown borough, 1,251 (66.6%) are family households, while 627 (33.4%) are nonfamily households. The most numerous type of family households are 2-person households, comprising 611, and the most common type of nonfamily households are 1-person households, comprising 603.
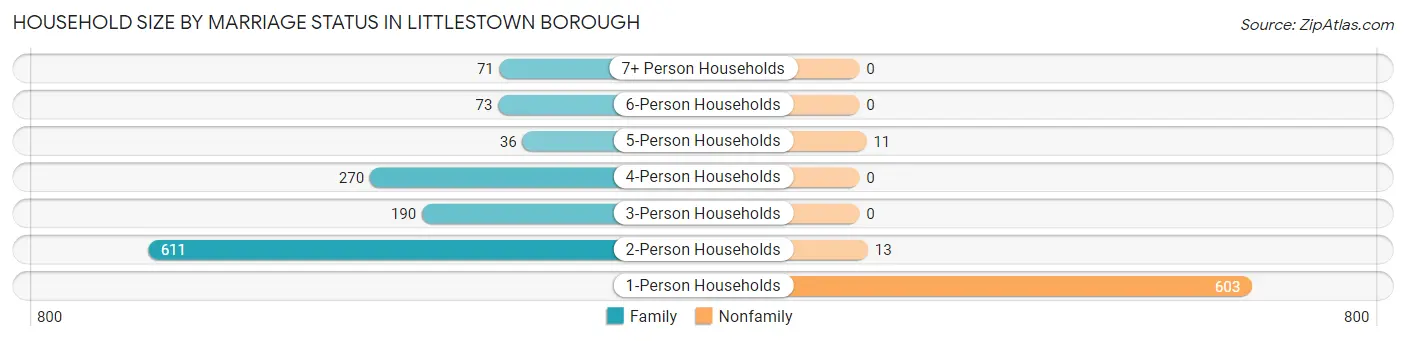
| Household Size | Family Households | Nonfamily Households |
| 1-Person Households | - | 603 (32.1%) |
| 2-Person Households | 611 (32.5%) | 13 (0.7%) |
| 3-Person Households | 190 (10.1%) | 0 (0.0%) |
| 4-Person Households | 270 (14.4%) | 0 (0.0%) |
| 5-Person Households | 36 (1.9%) | 11 (0.6%) |
| 6-Person Households | 73 (3.9%) | 0 (0.0%) |
| 7+ Person Households | 71 (3.8%) | 0 (0.0%) |
| Total | 1,251 (66.6%) | 627 (33.4%) |
Female Fertility in Littlestown borough
Fertility by Age in Littlestown borough
Average fertility rate in Littlestown borough is 117.0 births per 1,000 women. Women in the age bracket of 20 to 34 years have the highest fertility rate with 243.0 births per 1,000 women. Women in the age bracket of 20 to 34 years acount for 73.5% of all women with births.
| Age Bracket | Women with Births | Births / 1,000 Women |
| 15 to 19 years | 0 (0.0%) | 0.0 |
| 20 to 34 years | 86 (73.5%) | 243.0 |
| 35 to 50 years | 31 (26.5%) | 62.0 |
| Total | 117 (100.0%) | 117.0 |
Fertility by Age by Marriage Status in Littlestown borough
73.5% of women with births (117) in Littlestown borough are married. The highest percentage of unmarried women with births falls into 35 to 50 years age bracket with 100.0% of them unmarried at the time of birth, while the lowest percentage of unmarried women with births belong to 20 to 34 years age bracket with 0.0% of them unmarried.
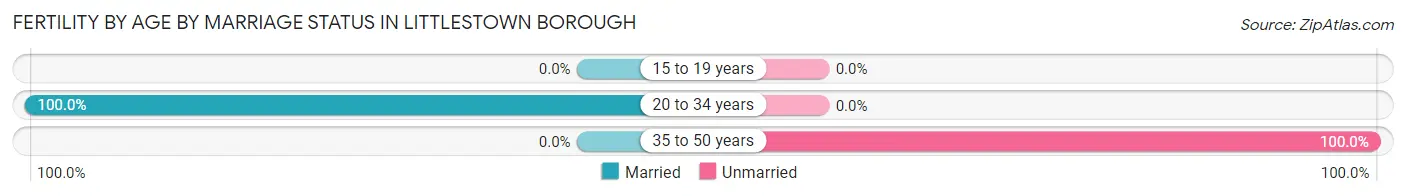
| Age Bracket | Married | Unmarried |
| 15 to 19 years | 0 (0.0%) | 0 (0.0%) |
| 20 to 34 years | 86 (100.0%) | 0 (0.0%) |
| 35 to 50 years | 0 (0.0%) | 31 (100.0%) |
| Total | 86 (73.5%) | 31 (26.5%) |
Fertility by Education in Littlestown borough
| Educational Attainment | Women with Births | Births / 1,000 Women |
| Less than High School | 0 (0.0%) | 0.0 |
| High School Diploma | 29 (24.8%) | 79.0 |
| College or Associate's Degree | 88 (75.2%) | 240.0 |
| Bachelor's Degree | 0 (0.0%) | 0.0 |
| Graduate Degree | 0 (0.0%) | 0.0 |
| Total | 117 (100.0%) | 117.0 |
Fertility by Education by Marriage Status in Littlestown borough
26.5% of women with births in Littlestown borough are unmarried. Women with the educational attainment of high school diploma are most likely to be married with 100.0% of them married at childbirth, while women with the educational attainment of college or associate's degree are least likely to be married with 35.2% of them unmarried at childbirth.
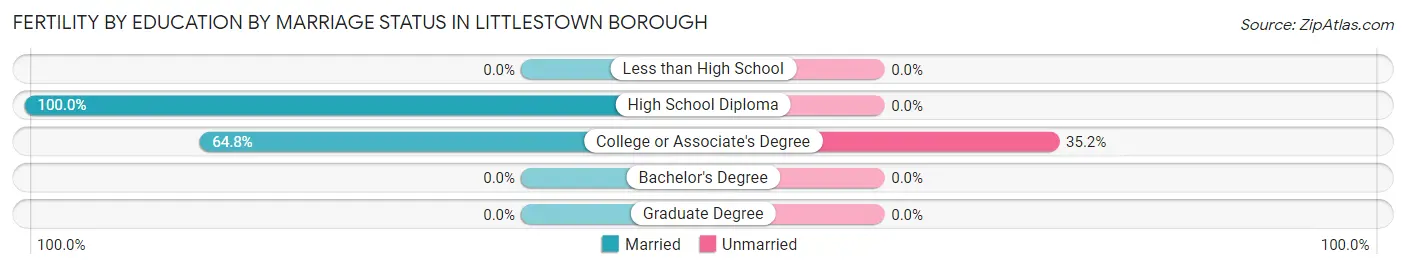
| Educational Attainment | Married | Unmarried |
| Less than High School | 0 (0.0%) | 0 (0.0%) |
| High School Diploma | 29 (100.0%) | 0 (0.0%) |
| College or Associate's Degree | 57 (64.8%) | 31 (35.2%) |
| Bachelor's Degree | 0 (0.0%) | 0 (0.0%) |
| Graduate Degree | 0 (0.0%) | 0 (0.0%) |
| Total | 86 (73.5%) | 31 (26.5%) |
Employment Characteristics in Littlestown borough
Employment by Class of Employer in Littlestown borough
Among the 2,072 employed individuals in Littlestown borough, private company employees (1,430 | 69.0%), not-for-profit organizations (228 | 11.0%), and local government employees (203 | 9.8%) make up the most common classes of employment.
| Employer Class | # Employees | % Employees |
| Private Company Employees | 1,430 | 69.0% |
| Self-Employed (Incorporated) | 55 | 2.6% |
| Self-Employed (Not Incorporated) | 75 | 3.6% |
| Not-for-profit Organizations | 228 | 11.0% |
| Local Government Employees | 203 | 9.8% |
| State Government Employees | 38 | 1.8% |
| Federal Government Employees | 43 | 2.1% |
| Unpaid Family Workers | 0 | 0.0% |
| Total | 2,072 | 100.0% |
Employment Status by Age in Littlestown borough
According to the labor force statistics for Littlestown borough, out of the total population over 16 years of age (3,759), 59.9% or 2,252 individuals are in the labor force, with 2.4% or 54 of them unemployed. The age group with the highest labor force participation rate is 25 to 29 years, with 92.9% or 301 individuals in the labor force. Within the labor force, the 16 to 19 years age range has the highest percentage of unemployed individuals, with 42.5% or 51 of them being unemployed.
| Age Bracket | In Labor Force | Unemployed |
| 16 to 19 Years | 120 (48.4%) | 51 (42.5%) |
| 20 to 24 Years | 186 (80.2%) | 0 (0.0%) |
| 25 to 29 Years | 301 (92.9%) | 0 (0.0%) |
| 30 to 34 Years | 182 (63.4%) | 4 (2.2%) |
| 35 to 44 Years | 393 (67.4%) | 0 (0.0%) |
| 45 to 54 Years | 316 (76.9%) | 0 (0.0%) |
| 55 to 59 Years | 253 (66.2%) | 0 (0.0%) |
| 60 to 64 Years | 287 (50.4%) | 0 (0.0%) |
| 65 to 74 Years | 173 (34.5%) | 0 (0.0%) |
| 75 Years and over | 40 (18.0%) | 0 (0.0%) |
| Total | 2,252 (59.9%) | 54 (2.4%) |
Employment Status by Educational Attainment in Littlestown borough
According to labor force statistics for Littlestown borough, 67.8% of individuals (1,733) out of the total population between 25 and 64 years of age (2,556) are in the labor force, with 0.2% or 3 of them being unemployed. The group with the highest labor force participation rate are those with the educational attainment of high school diploma, with 79.2% or 958 individuals in the labor force. Within the labor force, individuals with college / associate degree education have the highest percentage of unemployment, with 0.8% or 4 of them being unemployed.
| Educational Attainment | In Labor Force | Unemployed |
| Less than High School | 40 (24.7%) | 0 (0.0%) |
| High School Diploma | 958 (79.2%) | 0 (0.0%) |
| College / Associate Degree | 505 (68.6%) | 6 (0.8%) |
| Bachelor's Degree or higher | 229 (51.1%) | 0 (0.0%) |
| Total | 1,733 (67.8%) | 5 (0.2%) |
Employment Occupations by Sex in Littlestown borough
Management, Business, Science and Arts Occupations
The most common Management, Business, Science and Arts occupations in Littlestown borough are Management (154 | 7.0%), Health Diagnosing & Treating (153 | 7.0%), Community & Social Service (127 | 5.8%), Education Instruction & Library (71 | 3.2%), and Business & Financial (39 | 1.8%).
Management, Business, Science and Arts Occupations by Sex
Within the Management, Business, Science and Arts occupations in Littlestown borough, the most male-oriented occupations are Computers, Engineering & Science (100.0%), Computers & Mathematics (100.0%), and Architecture & Engineering (100.0%), while the most female-oriented occupations are Business & Financial (100.0%), Education, Arts & Media (100.0%), and Legal Services & Support (100.0%).
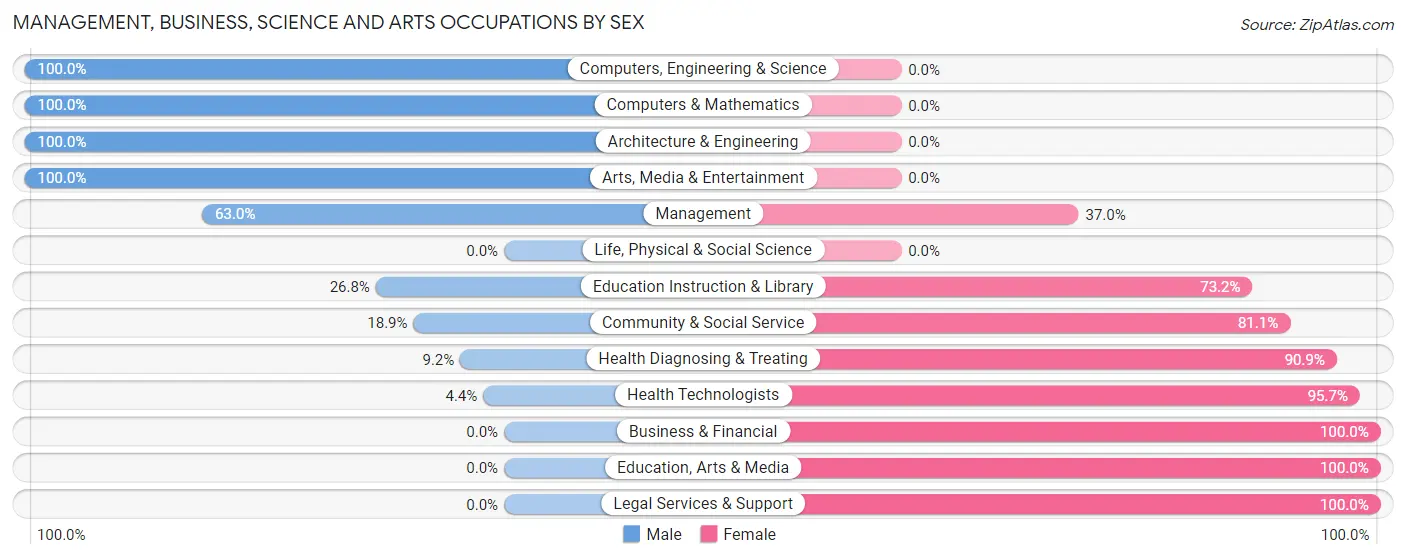
| Occupation | Male | Female |
| Management | 97 (63.0%) | 57 (37.0%) |
| Business & Financial | 0 (0.0%) | 39 (100.0%) |
| Computers, Engineering & Science | 28 (100.0%) | 0 (0.0%) |
| Computers & Mathematics | 16 (100.0%) | 0 (0.0%) |
| Architecture & Engineering | 12 (100.0%) | 0 (0.0%) |
| Life, Physical & Social Science | 0 (0.0%) | 0 (0.0%) |
| Community & Social Service | 24 (18.9%) | 103 (81.1%) |
| Education, Arts & Media | 0 (0.0%) | 31 (100.0%) |
| Legal Services & Support | 0 (0.0%) | 20 (100.0%) |
| Education Instruction & Library | 19 (26.8%) | 52 (73.2%) |
| Arts, Media & Entertainment | 5 (100.0%) | 0 (0.0%) |
| Health Diagnosing & Treating | 14 (9.1%) | 139 (90.8%) |
| Health Technologists | 1 (4.3%) | 22 (95.7%) |
| Total (Category) | 163 (32.5%) | 338 (67.5%) |
| Total (Overall) | 1,133 (51.6%) | 1,063 (48.4%) |
Services Occupations
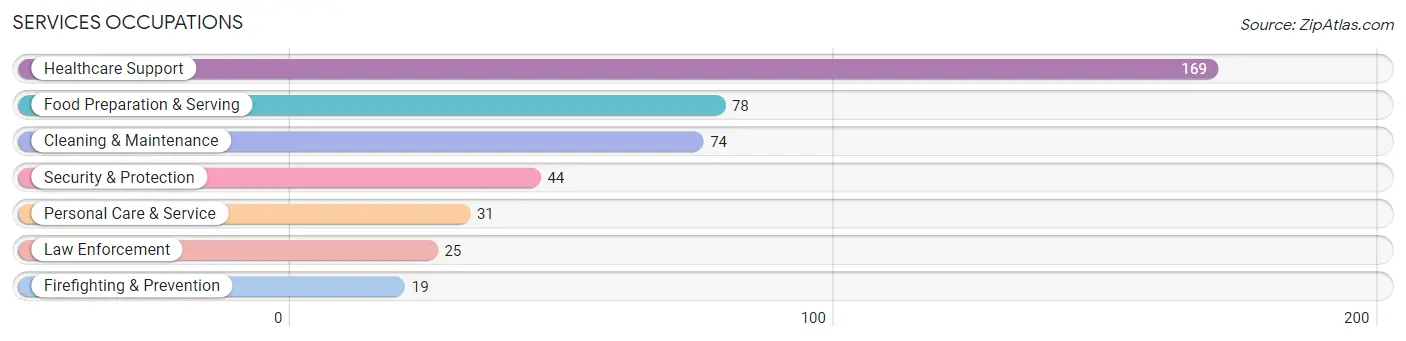
The most common Services occupations in Littlestown borough are Healthcare Support (169 | 7.7%), Food Preparation & Serving (78 | 3.5%), Cleaning & Maintenance (74 | 3.4%), Security & Protection (44 | 2.0%), and Personal Care & Service (31 | 1.4%).
Services Occupations by Sex
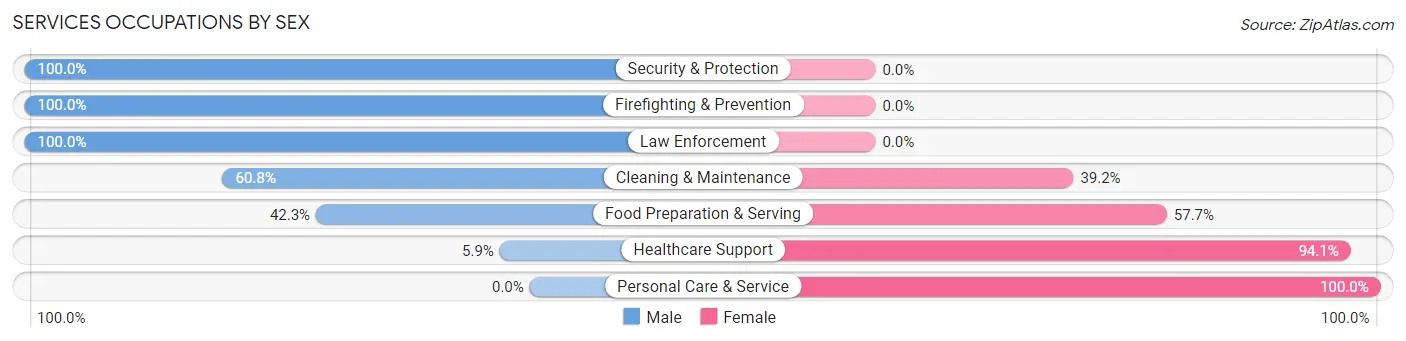
Within the Services occupations in Littlestown borough, the most male-oriented occupations are Security & Protection (100.0%), Firefighting & Prevention (100.0%), and Law Enforcement (100.0%), while the most female-oriented occupations are Personal Care & Service (100.0%), Healthcare Support (94.1%), and Food Preparation & Serving (57.7%).
| Occupation | Male | Female |
| Healthcare Support | 10 (5.9%) | 159 (94.1%) |
| Security & Protection | 44 (100.0%) | 0 (0.0%) |
| Firefighting & Prevention | 19 (100.0%) | 0 (0.0%) |
| Law Enforcement | 25 (100.0%) | 0 (0.0%) |
| Food Preparation & Serving | 33 (42.3%) | 45 (57.7%) |
| Cleaning & Maintenance | 45 (60.8%) | 29 (39.2%) |
| Personal Care & Service | 0 (0.0%) | 31 (100.0%) |
| Total (Category) | 132 (33.3%) | 264 (66.7%) |
| Total (Overall) | 1,133 (51.6%) | 1,063 (48.4%) |
Sales and Office Occupations
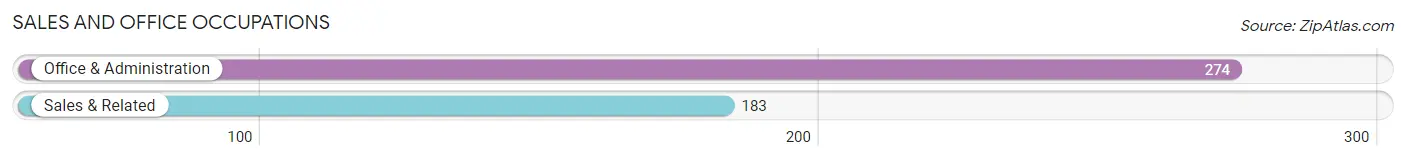
The most common Sales and Office occupations in Littlestown borough are Office & Administration (274 | 12.5%), and Sales & Related (183 | 8.3%).
Sales and Office Occupations by Sex
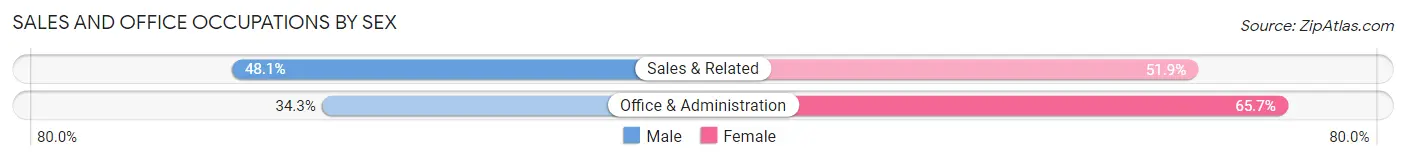
| Occupation | Male | Female |
| Sales & Related | 88 (48.1%) | 95 (51.9%) |
| Office & Administration | 94 (34.3%) | 180 (65.7%) |
| Total (Category) | 182 (39.8%) | 275 (60.2%) |
| Total (Overall) | 1,133 (51.6%) | 1,063 (48.4%) |
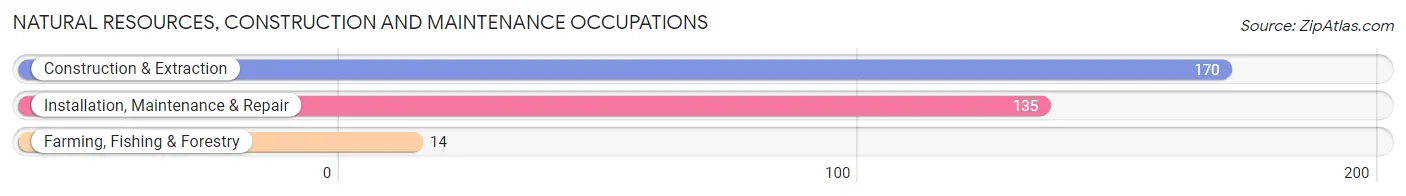
Natural Resources, Construction and Maintenance Occupations
The most common Natural Resources, Construction and Maintenance occupations in Littlestown borough are Construction & Extraction (170 | 7.7%), Installation, Maintenance & Repair (135 | 6.1%), and Farming, Fishing & Forestry (14 | 0.6%).
Natural Resources, Construction and Maintenance Occupations by Sex
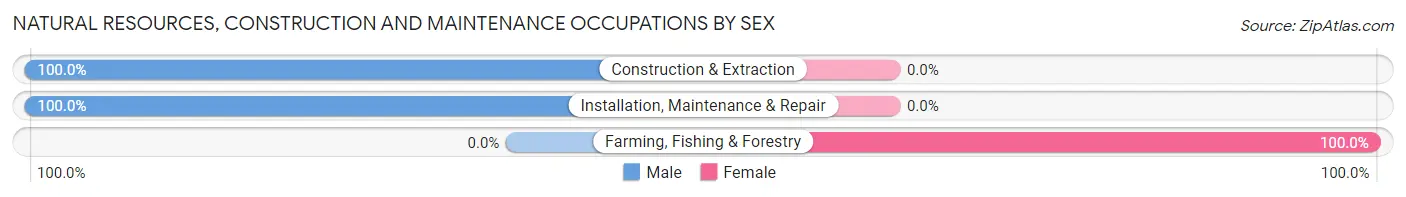
| Occupation | Male | Female |
| Farming, Fishing & Forestry | 0 (0.0%) | 14 (100.0%) |
| Construction & Extraction | 170 (100.0%) | 0 (0.0%) |
| Installation, Maintenance & Repair | 135 (100.0%) | 0 (0.0%) |
| Total (Category) | 305 (95.6%) | 14 (4.4%) |
| Total (Overall) | 1,133 (51.6%) | 1,063 (48.4%) |
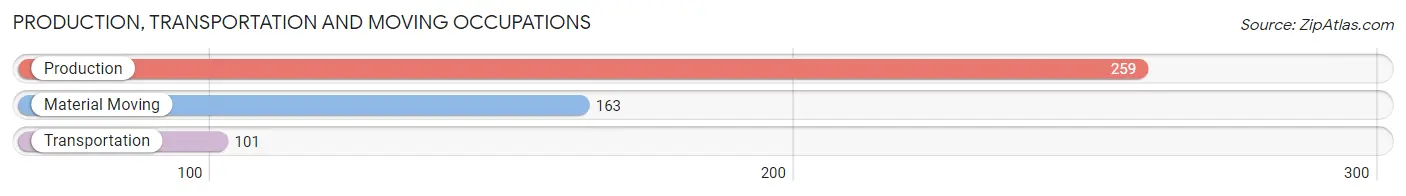
Production, Transportation and Moving Occupations
The most common Production, Transportation and Moving occupations in Littlestown borough are Production (259 | 11.8%), Material Moving (163 | 7.4%), and Transportation (101 | 4.6%).
Production, Transportation and Moving Occupations by Sex
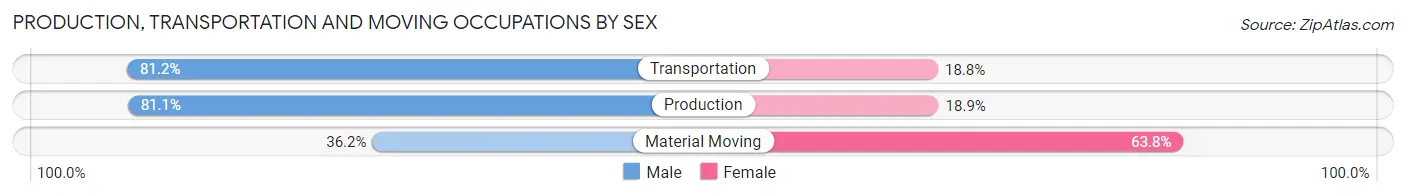
| Occupation | Male | Female |
| Production | 210 (81.1%) | 49 (18.9%) |
| Transportation | 82 (81.2%) | 19 (18.8%) |
| Material Moving | 59 (36.2%) | 104 (63.8%) |
| Total (Category) | 351 (67.1%) | 172 (32.9%) |
| Total (Overall) | 1,133 (51.6%) | 1,063 (48.4%) |
Employment Industries by Sex in Littlestown borough
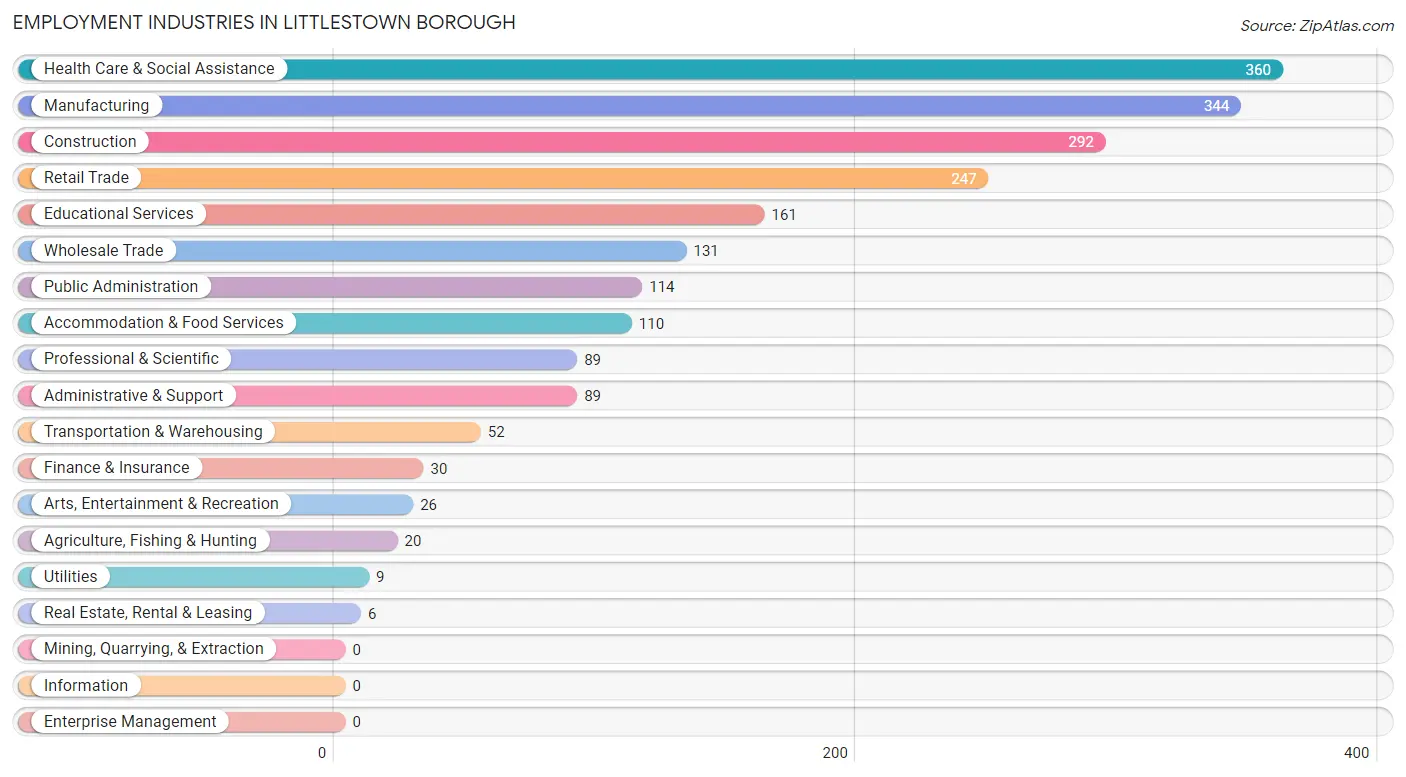
Employment Industries in Littlestown borough
The major employment industries in Littlestown borough include Health Care & Social Assistance (360 | 16.4%), Manufacturing (344 | 15.7%), Construction (292 | 13.3%), Retail Trade (247 | 11.3%), and Educational Services (161 | 7.3%).
Employment Industries by Sex in Littlestown borough
The Littlestown borough industries that see more men than women are Utilities (100.0%), Real Estate, Rental & Leasing (100.0%), and Administrative & Support (84.3%), whereas the industries that tend to have a higher number of women are Agriculture, Fishing & Hunting (100.0%), Arts, Entertainment & Recreation (100.0%), and Health Care & Social Assistance (90.6%).
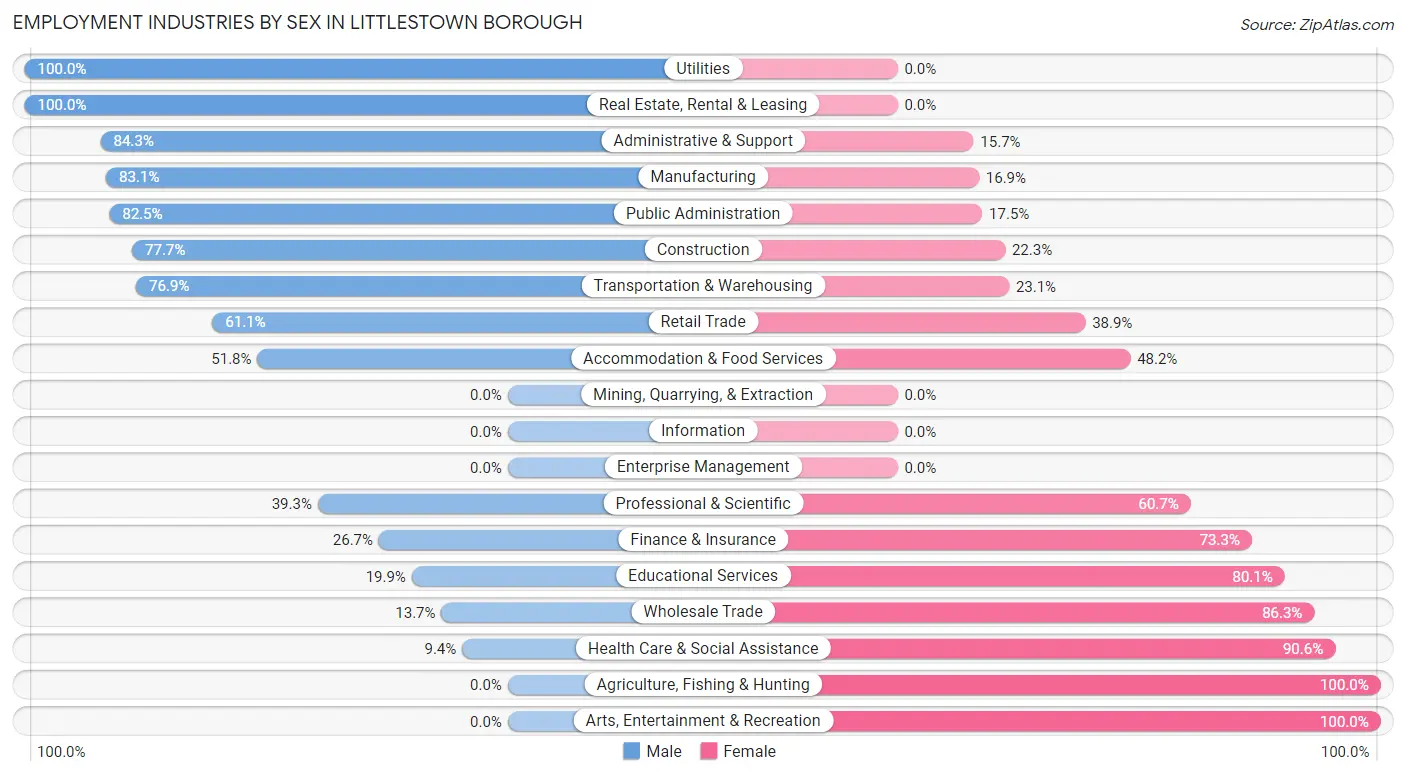
| Industry | Male | Female |
| Agriculture, Fishing & Hunting | 0 (0.0%) | 20 (100.0%) |
| Mining, Quarrying, & Extraction | 0 (0.0%) | 0 (0.0%) |
| Construction | 227 (77.7%) | 65 (22.3%) |
| Manufacturing | 286 (83.1%) | 58 (16.9%) |
| Wholesale Trade | 18 (13.7%) | 113 (86.3%) |
| Retail Trade | 151 (61.1%) | 96 (38.9%) |
| Transportation & Warehousing | 40 (76.9%) | 12 (23.1%) |
| Utilities | 9 (100.0%) | 0 (0.0%) |
| Information | 0 (0.0%) | 0 (0.0%) |
| Finance & Insurance | 8 (26.7%) | 22 (73.3%) |
| Real Estate, Rental & Leasing | 6 (100.0%) | 0 (0.0%) |
| Professional & Scientific | 35 (39.3%) | 54 (60.7%) |
| Enterprise Management | 0 (0.0%) | 0 (0.0%) |
| Administrative & Support | 75 (84.3%) | 14 (15.7%) |
| Educational Services | 32 (19.9%) | 129 (80.1%) |
| Health Care & Social Assistance | 34 (9.4%) | 326 (90.6%) |
| Arts, Entertainment & Recreation | 0 (0.0%) | 26 (100.0%) |
| Accommodation & Food Services | 57 (51.8%) | 53 (48.2%) |
| Public Administration | 94 (82.5%) | 20 (17.5%) |
| Total | 1,133 (51.6%) | 1,063 (48.4%) |
Education in Littlestown borough
School Enrollment in Littlestown borough
The most common levels of schooling among the 1,060 students in Littlestown borough are high school (317 | 29.9%), elementary school (310 | 29.2%), and middle school (180 | 17.0%).
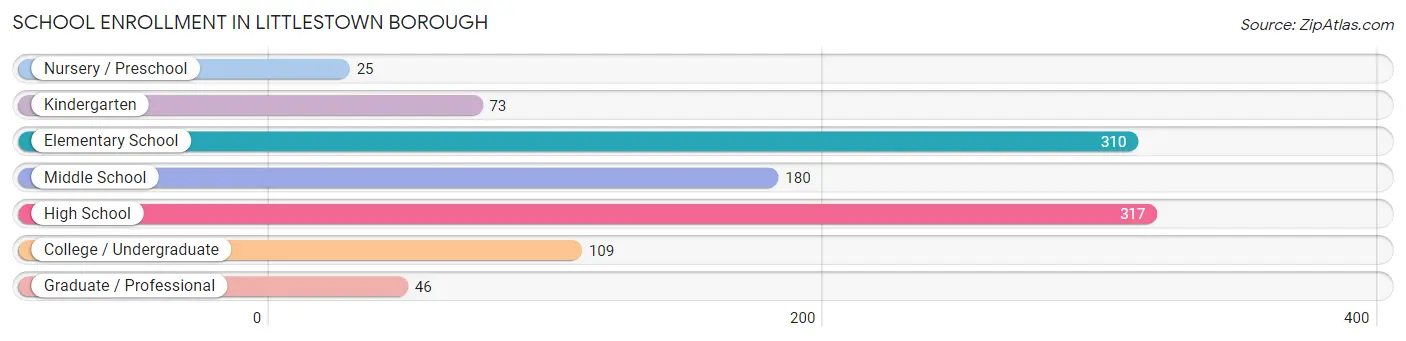
| School Level | # Students | % Students |
| Nursery / Preschool | 25 | 2.4% |
| Kindergarten | 73 | 6.9% |
| Elementary School | 310 | 29.2% |
| Middle School | 180 | 17.0% |
| High School | 317 | 29.9% |
| College / Undergraduate | 109 | 10.3% |
| Graduate / Professional | 46 | 4.3% |
| Total | 1,060 | 100.0% |
School Enrollment by Age by Funding Source in Littlestown borough
Out of a total of 1,060 students who are enrolled in schools in Littlestown borough, 92 (8.7%) attend a private institution, while the remaining 968 (91.3%) are enrolled in public schools. The age group of 35 years and over has the highest likelihood of being enrolled in private schools, with 52 (100.0% in the age bracket) enrolled. Conversely, the age group of 5 to 9 year old has the lowest likelihood of being enrolled in a private school, with 389 (100.0% in the age bracket) attending a public institution.
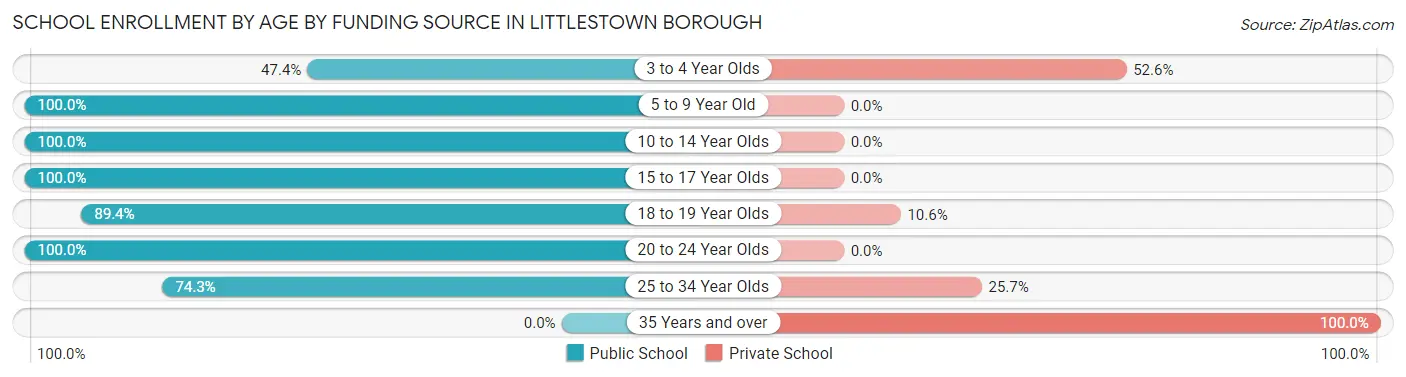
| Age Bracket | Public School | Private School |
| 3 to 4 Year Olds | 9 (47.4%) | 10 (52.6%) |
| 5 to 9 Year Old | 389 (100.0%) | 0 (0.0%) |
| 10 to 14 Year Olds | 204 (100.0%) | 0 (0.0%) |
| 15 to 17 Year Olds | 203 (100.0%) | 0 (0.0%) |
| 18 to 19 Year Olds | 93 (89.4%) | 11 (10.6%) |
| 20 to 24 Year Olds | 15 (100.0%) | 0 (0.0%) |
| 25 to 34 Year Olds | 55 (74.3%) | 19 (25.7%) |
| 35 Years and over | 0 (0.0%) | 52 (100.0%) |
| Total | 968 (91.3%) | 92 (8.7%) |
Educational Attainment by Field of Study in Littlestown borough
Education (176 | 29.3%), business (104 | 17.3%), computers & mathematics (61 | 10.2%), science & technology (48 | 8.0%), and social sciences (47 | 7.8%) are the most common fields of study among 601 individuals in Littlestown borough who have obtained a bachelor's degree or higher.
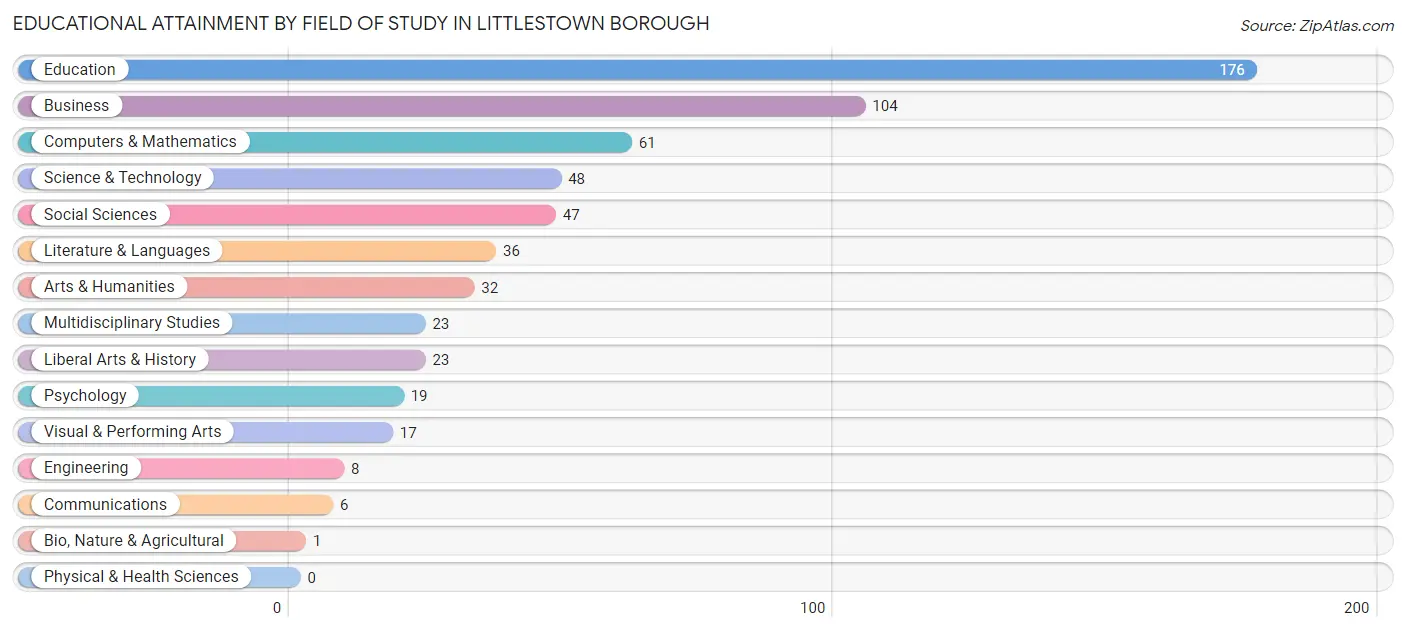
| Field of Study | # Graduates | % Graduates |
| Computers & Mathematics | 61 | 10.2% |
| Bio, Nature & Agricultural | 1 | 0.2% |
| Physical & Health Sciences | 0 | 0.0% |
| Psychology | 19 | 3.2% |
| Social Sciences | 47 | 7.8% |
| Engineering | 8 | 1.3% |
| Multidisciplinary Studies | 23 | 3.8% |
| Science & Technology | 48 | 8.0% |
| Business | 104 | 17.3% |
| Education | 176 | 29.3% |
| Literature & Languages | 36 | 6.0% |
| Liberal Arts & History | 23 | 3.8% |
| Visual & Performing Arts | 17 | 2.8% |
| Communications | 6 | 1.0% |
| Arts & Humanities | 32 | 5.3% |
| Total | 601 | 100.0% |
Transportation & Commute in Littlestown borough
Vehicle Availability by Sex in Littlestown borough
The most prevalent vehicle ownership categories in Littlestown borough are males with 2 vehicles (361, accounting for 34.3%) and females with 2 vehicles (323, making up 35.4%).
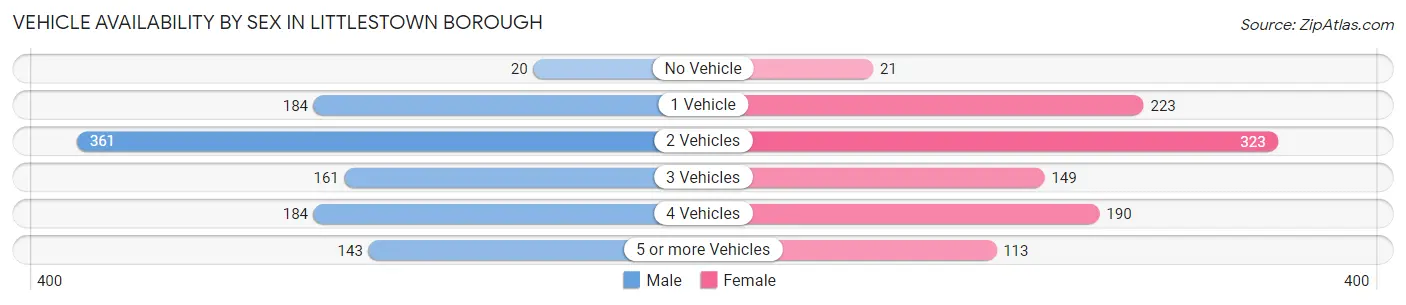
| Vehicles Available | Male | Female |
| No Vehicle | 20 (1.9%) | 21 (2.1%) |
| 1 Vehicle | 184 (17.5%) | 223 (21.9%) |
| 2 Vehicles | 361 (34.3%) | 323 (31.7%) |
| 3 Vehicles | 161 (15.3%) | 149 (14.6%) |
| 4 Vehicles | 184 (17.5%) | 190 (18.6%) |
| 5 or more Vehicles | 143 (13.6%) | 113 (11.1%) |
| Total | 1,053 (100.0%) | 1,019 (100.0%) |
Commute Time in Littlestown borough
The most frequently occuring commute durations in Littlestown borough are 15 to 19 minutes (330 commuters, 17.8%), 60 to 89 minutes (273 commuters, 14.8%), and 45 to 59 minutes (252 commuters, 13.6%).
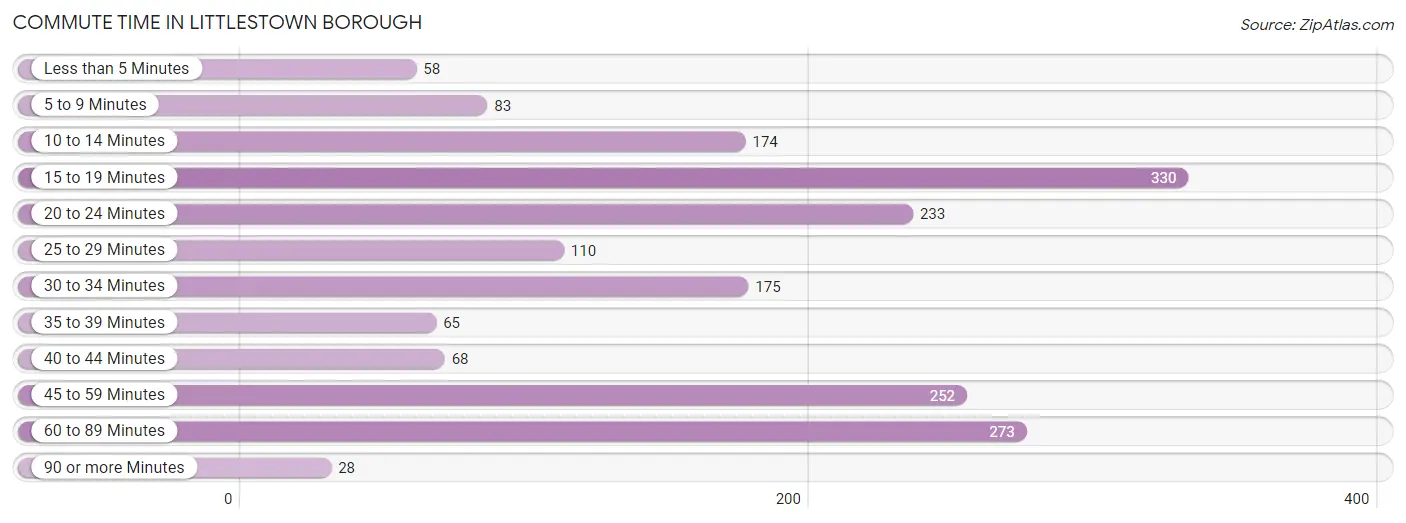
| Commute Time | # Commuters | % Commuters |
| Less than 5 Minutes | 58 | 3.1% |
| 5 to 9 Minutes | 83 | 4.5% |
| 10 to 14 Minutes | 174 | 9.4% |
| 15 to 19 Minutes | 330 | 17.8% |
| 20 to 24 Minutes | 233 | 12.6% |
| 25 to 29 Minutes | 110 | 5.9% |
| 30 to 34 Minutes | 175 | 9.5% |
| 35 to 39 Minutes | 65 | 3.5% |
| 40 to 44 Minutes | 68 | 3.7% |
| 45 to 59 Minutes | 252 | 13.6% |
| 60 to 89 Minutes | 273 | 14.8% |
| 90 or more Minutes | 28 | 1.5% |
Commute Time by Sex in Littlestown borough
The most common commute times in Littlestown borough are 15 to 19 minutes (189 commuters, 19.2%) for males and 20 to 24 minutes (145 commuters, 16.8%) for females.
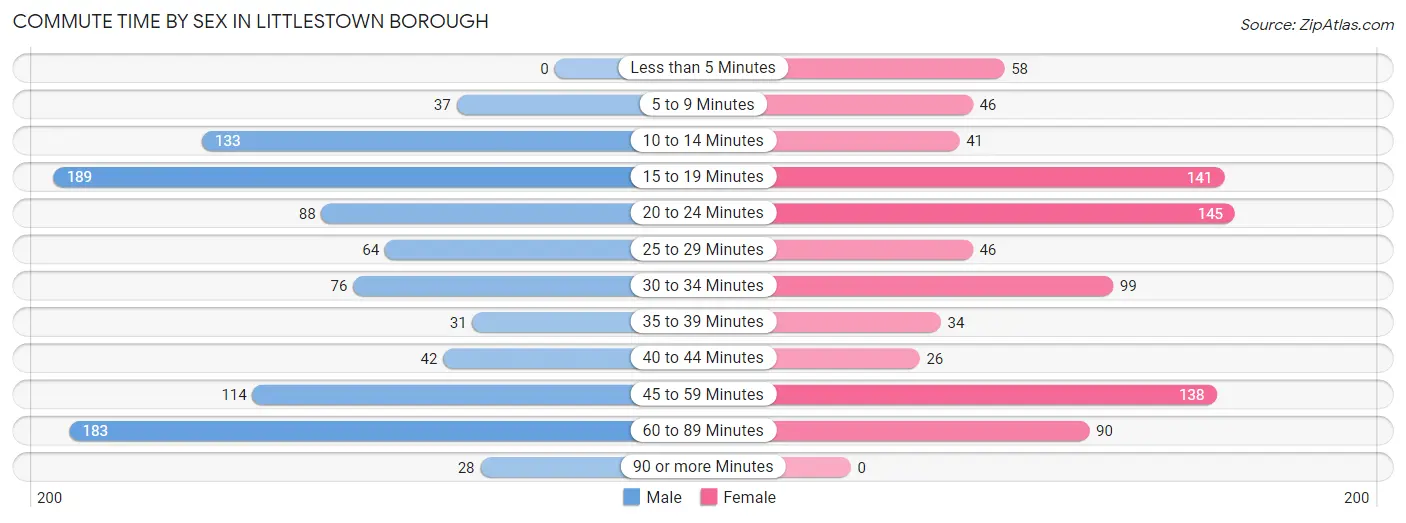
| Commute Time | Male | Female |
| Less than 5 Minutes | 0 (0.0%) | 58 (6.7%) |
| 5 to 9 Minutes | 37 (3.8%) | 46 (5.3%) |
| 10 to 14 Minutes | 133 (13.5%) | 41 (4.8%) |
| 15 to 19 Minutes | 189 (19.2%) | 141 (16.3%) |
| 20 to 24 Minutes | 88 (8.9%) | 145 (16.8%) |
| 25 to 29 Minutes | 64 (6.5%) | 46 (5.3%) |
| 30 to 34 Minutes | 76 (7.7%) | 99 (11.5%) |
| 35 to 39 Minutes | 31 (3.2%) | 34 (3.9%) |
| 40 to 44 Minutes | 42 (4.3%) | 26 (3.0%) |
| 45 to 59 Minutes | 114 (11.6%) | 138 (16.0%) |
| 60 to 89 Minutes | 183 (18.6%) | 90 (10.4%) |
| 90 or more Minutes | 28 (2.8%) | 0 (0.0%) |
Time of Departure to Work by Sex in Littlestown borough
The most frequent times of departure to work in Littlestown borough are 12:00 AM to 4:59 AM (197, 20.0%) for males and 12:00 PM to 3:59 PM (165, 19.1%) for females.
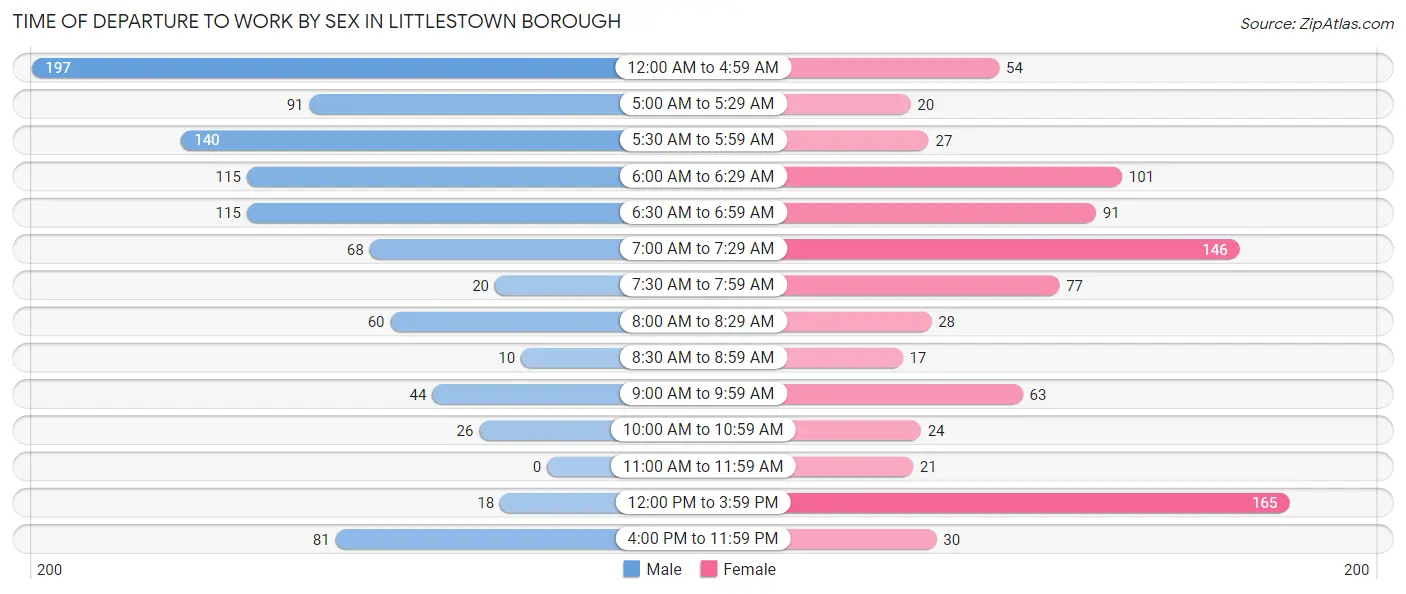
| Time of Departure | Male | Female |
| 12:00 AM to 4:59 AM | 197 (20.0%) | 54 (6.2%) |
| 5:00 AM to 5:29 AM | 91 (9.2%) | 20 (2.3%) |
| 5:30 AM to 5:59 AM | 140 (14.2%) | 27 (3.1%) |
| 6:00 AM to 6:29 AM | 115 (11.7%) | 101 (11.7%) |
| 6:30 AM to 6:59 AM | 115 (11.7%) | 91 (10.5%) |
| 7:00 AM to 7:29 AM | 68 (6.9%) | 146 (16.9%) |
| 7:30 AM to 7:59 AM | 20 (2.0%) | 77 (8.9%) |
| 8:00 AM to 8:29 AM | 60 (6.1%) | 28 (3.2%) |
| 8:30 AM to 8:59 AM | 10 (1.0%) | 17 (2.0%) |
| 9:00 AM to 9:59 AM | 44 (4.5%) | 63 (7.3%) |
| 10:00 AM to 10:59 AM | 26 (2.6%) | 24 (2.8%) |
| 11:00 AM to 11:59 AM | 0 (0.0%) | 21 (2.4%) |
| 12:00 PM to 3:59 PM | 18 (1.8%) | 165 (19.1%) |
| 4:00 PM to 11:59 PM | 81 (8.2%) | 30 (3.5%) |
| Total | 985 (100.0%) | 864 (100.0%) |
Housing Occupancy in Littlestown borough
Occupancy by Ownership in Littlestown borough
Of the total 1,878 dwellings in Littlestown borough, owner-occupied units account for 1,322 (70.4%), while renter-occupied units make up 556 (29.6%).
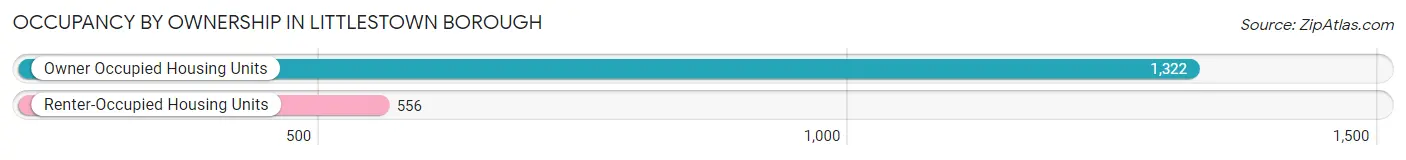
| Occupancy | # Housing Units | % Housing Units |
| Owner Occupied Housing Units | 1,322 | 70.4% |
| Renter-Occupied Housing Units | 556 | 29.6% |
| Total Occupied Housing Units | 1,878 | 100.0% |
Occupancy by Household Size in Littlestown borough
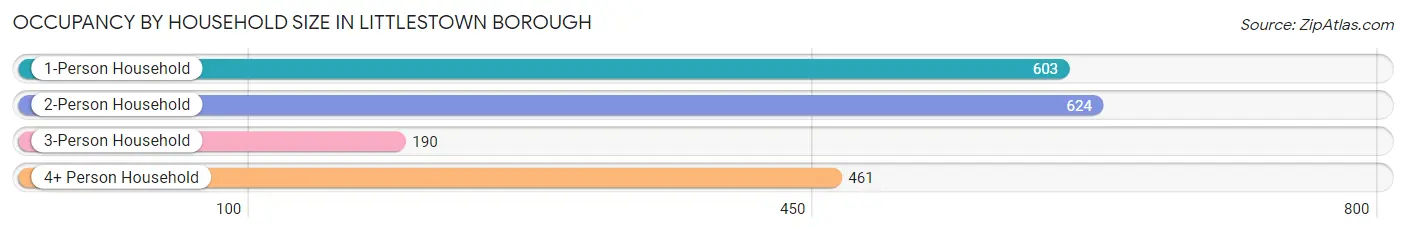
| Household Size | # Housing Units | % Housing Units |
| 1-Person Household | 603 | 32.1% |
| 2-Person Household | 624 | 33.2% |
| 3-Person Household | 190 | 10.1% |
| 4+ Person Household | 461 | 24.5% |
| Total Housing Units | 1,878 | 100.0% |
Occupancy by Ownership by Household Size in Littlestown borough
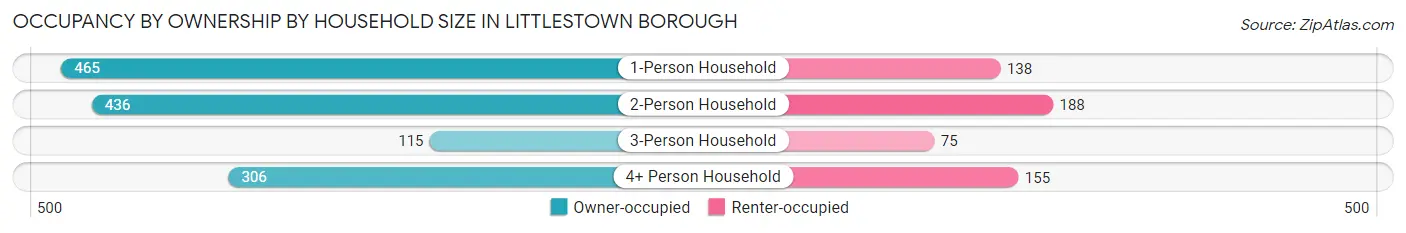
| Household Size | Owner-occupied | Renter-occupied |
| 1-Person Household | 465 (77.1%) | 138 (22.9%) |
| 2-Person Household | 436 (69.9%) | 188 (30.1%) |
| 3-Person Household | 115 (60.5%) | 75 (39.5%) |
| 4+ Person Household | 306 (66.4%) | 155 (33.6%) |
| Total Housing Units | 1,322 (70.4%) | 556 (29.6%) |
Occupancy by Educational Attainment in Littlestown borough
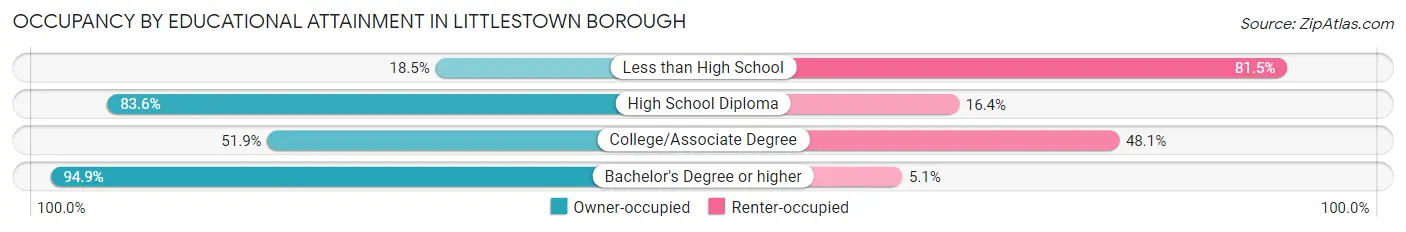
| Household Size | Owner-occupied | Renter-occupied |
| Less than High School | 20 (18.5%) | 88 (81.5%) |
| High School Diploma | 658 (83.6%) | 129 (16.4%) |
| College/Associate Degree | 348 (51.9%) | 323 (48.1%) |
| Bachelor's Degree or higher | 296 (94.9%) | 16 (5.1%) |
Occupancy by Age of Householder in Littlestown borough
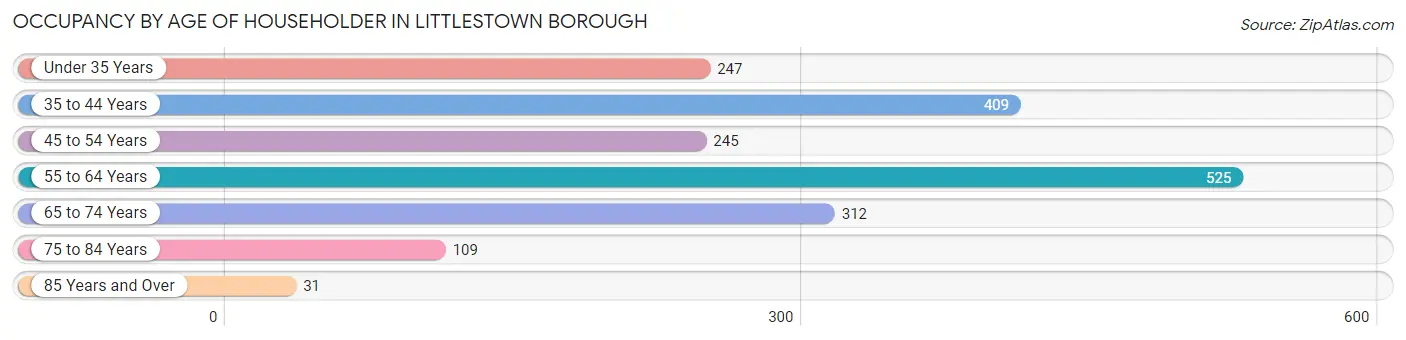
| Age Bracket | # Households | % Households |
| Under 35 Years | 247 | 13.2% |
| 35 to 44 Years | 409 | 21.8% |
| 45 to 54 Years | 245 | 13.1% |
| 55 to 64 Years | 525 | 28.0% |
| 65 to 74 Years | 312 | 16.6% |
| 75 to 84 Years | 109 | 5.8% |
| 85 Years and Over | 31 | 1.7% |
| Total | 1,878 | 100.0% |
Housing Finances in Littlestown borough
Median Income by Occupancy in Littlestown borough
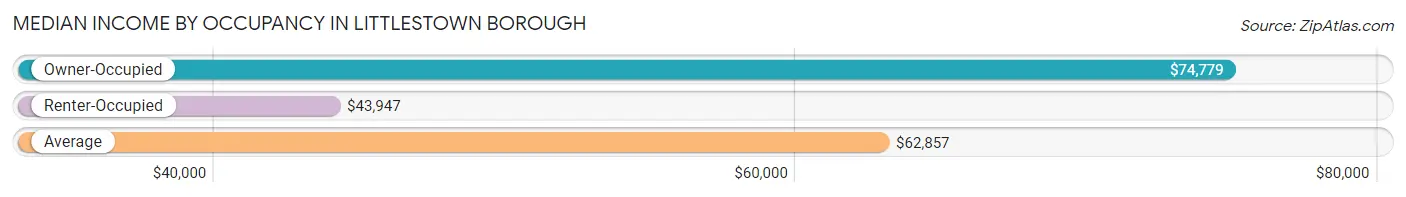
| Occupancy Type | # Households | Median Income |
| Owner-Occupied | 1,322 (70.4%) | $74,779 |
| Renter-Occupied | 556 (29.6%) | $43,947 |
| Average | 1,878 (100.0%) | $62,857 |
Occupancy by Householder Income Bracket in Littlestown borough
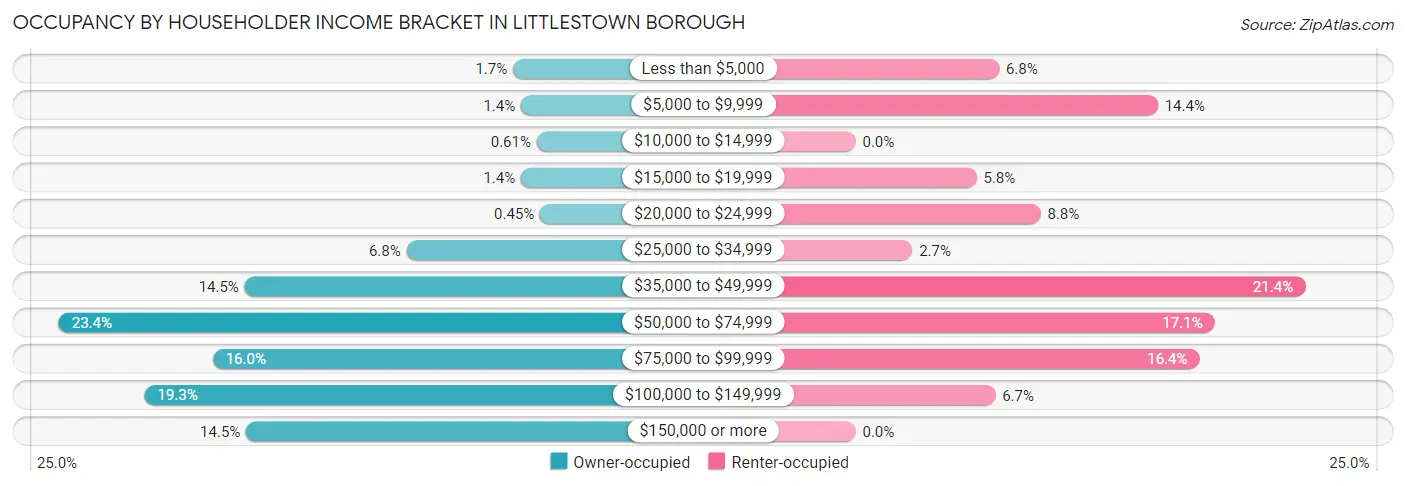
| Income Bracket | Owner-occupied | Renter-occupied |
| Less than $5,000 | 23 (1.7%) | 38 (6.8%) |
| $5,000 to $9,999 | 18 (1.4%) | 80 (14.4%) |
| $10,000 to $14,999 | 8 (0.6%) | 0 (0.0%) |
| $15,000 to $19,999 | 18 (1.4%) | 32 (5.8%) |
| $20,000 to $24,999 | 6 (0.4%) | 49 (8.8%) |
| $25,000 to $34,999 | 90 (6.8%) | 15 (2.7%) |
| $35,000 to $49,999 | 192 (14.5%) | 119 (21.4%) |
| $50,000 to $74,999 | 309 (23.4%) | 95 (17.1%) |
| $75,000 to $99,999 | 212 (16.0%) | 91 (16.4%) |
| $100,000 to $149,999 | 255 (19.3%) | 37 (6.7%) |
| $150,000 or more | 191 (14.4%) | 0 (0.0%) |
| Total | 1,322 (100.0%) | 556 (100.0%) |
Monthly Housing Cost Tiers in Littlestown borough
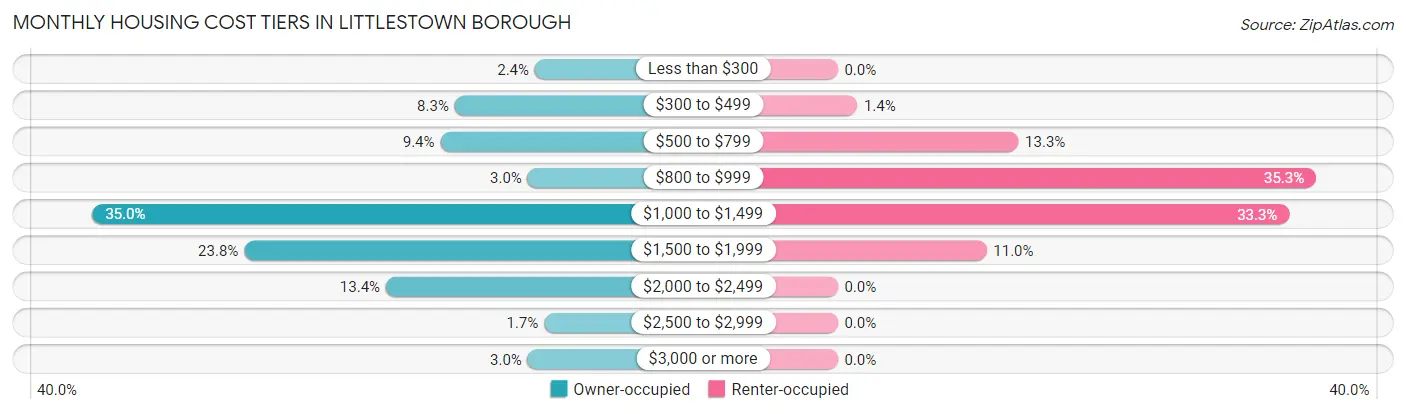
| Monthly Cost | Owner-occupied | Renter-occupied |
| Less than $300 | 32 (2.4%) | 0 (0.0%) |
| $300 to $499 | 110 (8.3%) | 8 (1.4%) |
| $500 to $799 | 124 (9.4%) | 74 (13.3%) |
| $800 to $999 | 39 (2.9%) | 196 (35.2%) |
| $1,000 to $1,499 | 463 (35.0%) | 185 (33.3%) |
| $1,500 to $1,999 | 315 (23.8%) | 61 (11.0%) |
| $2,000 to $2,499 | 177 (13.4%) | 0 (0.0%) |
| $2,500 to $2,999 | 23 (1.7%) | 0 (0.0%) |
| $3,000 or more | 39 (2.9%) | 0 (0.0%) |
| Total | 1,322 (100.0%) | 556 (100.0%) |
Physical Housing Characteristics in Littlestown borough
Housing Structures in Littlestown borough
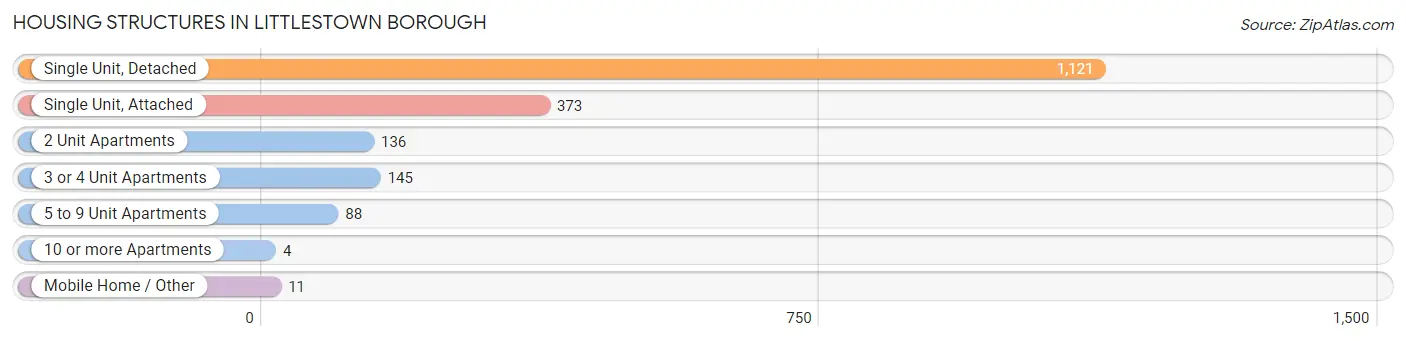
| Structure Type | # Housing Units | % Housing Units |
| Single Unit, Detached | 1,121 | 59.7% |
| Single Unit, Attached | 373 | 19.9% |
| 2 Unit Apartments | 136 | 7.2% |
| 3 or 4 Unit Apartments | 145 | 7.7% |
| 5 to 9 Unit Apartments | 88 | 4.7% |
| 10 or more Apartments | 4 | 0.2% |
| Mobile Home / Other | 11 | 0.6% |
| Total | 1,878 | 100.0% |
Housing Structures by Occupancy in Littlestown borough
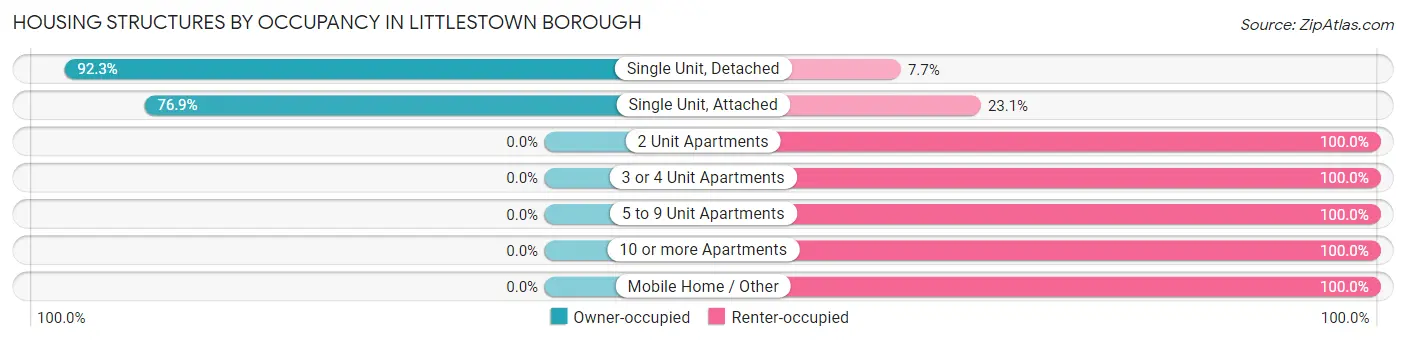
| Structure Type | Owner-occupied | Renter-occupied |
| Single Unit, Detached | 1,035 (92.3%) | 86 (7.7%) |
| Single Unit, Attached | 287 (76.9%) | 86 (23.1%) |
| 2 Unit Apartments | 0 (0.0%) | 136 (100.0%) |
| 3 or 4 Unit Apartments | 0 (0.0%) | 145 (100.0%) |
| 5 to 9 Unit Apartments | 0 (0.0%) | 88 (100.0%) |
| 10 or more Apartments | 0 (0.0%) | 4 (100.0%) |
| Mobile Home / Other | 0 (0.0%) | 11 (100.0%) |
| Total | 1,322 (70.4%) | 556 (29.6%) |
Housing Structures by Number of Rooms in Littlestown borough
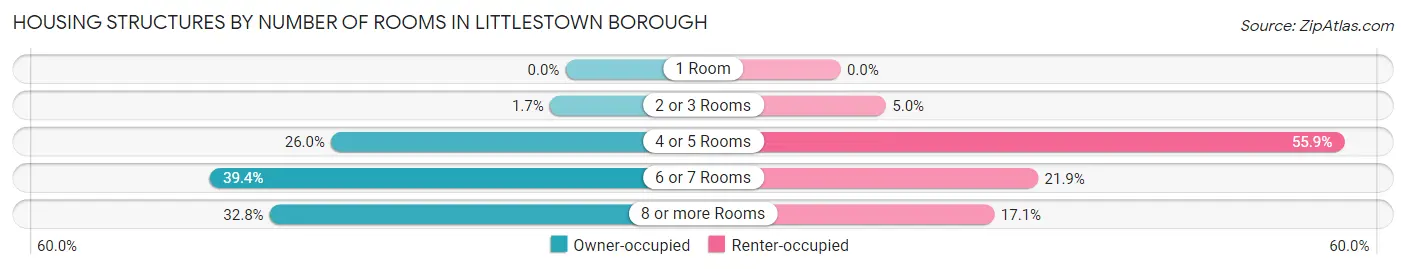
| Number of Rooms | Owner-occupied | Renter-occupied |
| 1 Room | 0 (0.0%) | 0 (0.0%) |
| 2 or 3 Rooms | 23 (1.7%) | 28 (5.0%) |
| 4 or 5 Rooms | 344 (26.0%) | 311 (55.9%) |
| 6 or 7 Rooms | 521 (39.4%) | 122 (21.9%) |
| 8 or more Rooms | 434 (32.8%) | 95 (17.1%) |
| Total | 1,322 (100.0%) | 556 (100.0%) |
Housing Structure by Heating Type in Littlestown borough
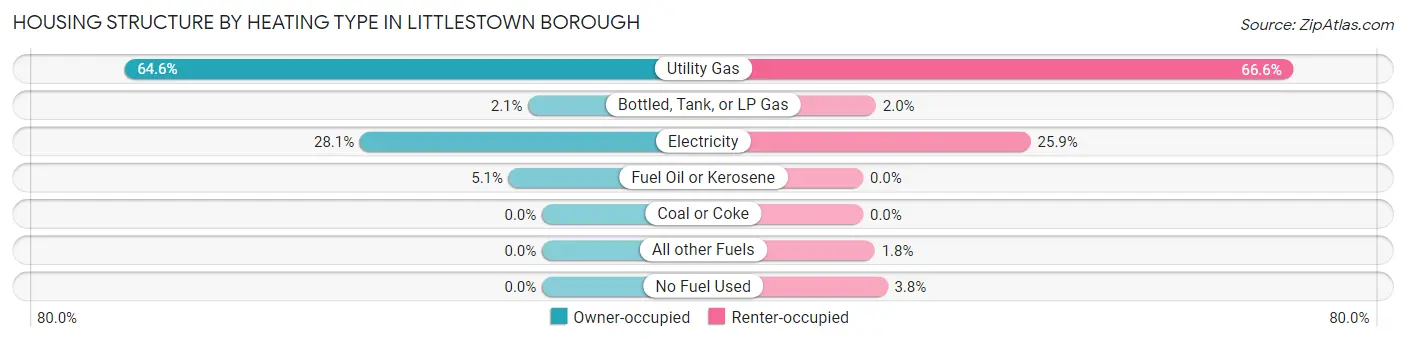
| Heating Type | Owner-occupied | Renter-occupied |
| Utility Gas | 854 (64.6%) | 370 (66.5%) |
| Bottled, Tank, or LP Gas | 28 (2.1%) | 11 (2.0%) |
| Electricity | 372 (28.1%) | 144 (25.9%) |
| Fuel Oil or Kerosene | 68 (5.1%) | 0 (0.0%) |
| Coal or Coke | 0 (0.0%) | 0 (0.0%) |
| All other Fuels | 0 (0.0%) | 10 (1.8%) |
| No Fuel Used | 0 (0.0%) | 21 (3.8%) |
| Total | 1,322 (100.0%) | 556 (100.0%) |
Household Vehicle Usage in Littlestown borough
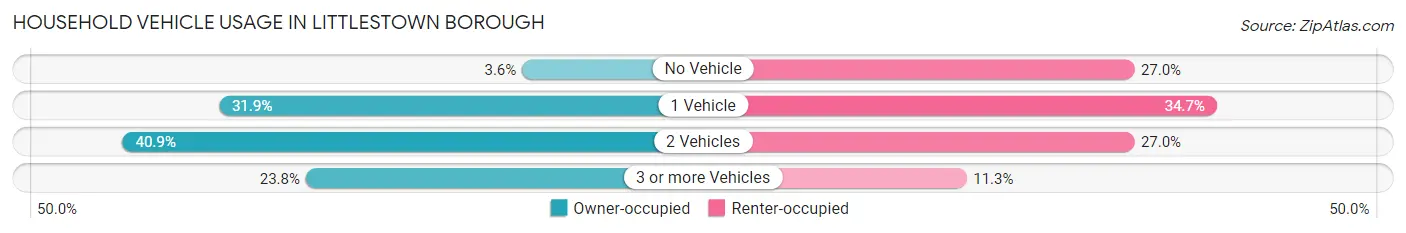
| Vehicles per Household | Owner-occupied | Renter-occupied |
| No Vehicle | 47 (3.6%) | 150 (27.0%) |
| 1 Vehicle | 421 (31.9%) | 193 (34.7%) |
| 2 Vehicles | 540 (40.8%) | 150 (27.0%) |
| 3 or more Vehicles | 314 (23.7%) | 63 (11.3%) |
| Total | 1,322 (100.0%) | 556 (100.0%) |
Real Estate & Mortgages in Littlestown borough
Real Estate and Mortgage Overview in Littlestown borough
| Characteristic | Without Mortgage | With Mortgage |
| Housing Units | 278 | 1,044 |
| Median Property Value | $233,700 | $226,000 |
| Median Household Income | $53,438 | $182 |
| Monthly Housing Costs | $577 | $39 |
| Real Estate Taxes | $3,339 | $7 |
Property Value by Mortgage Status in Littlestown borough
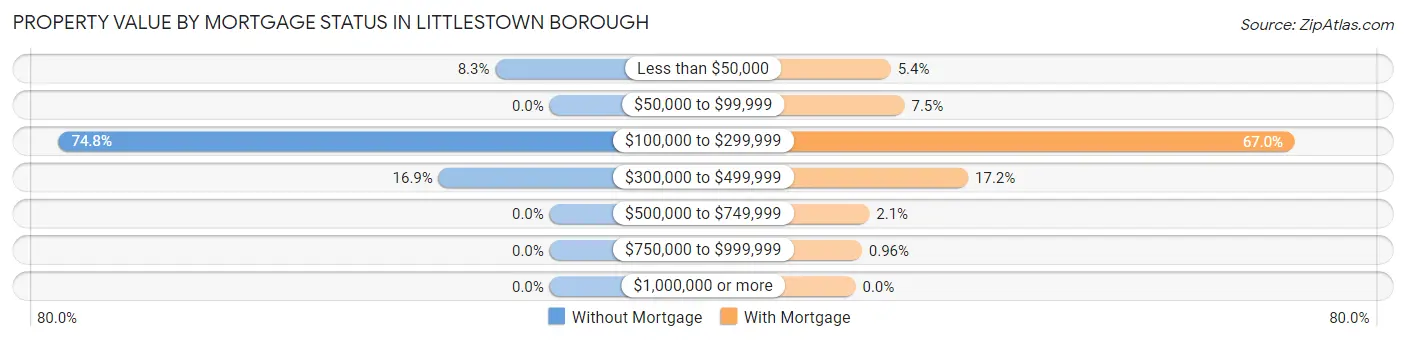
| Property Value | Without Mortgage | With Mortgage |
| Less than $50,000 | 23 (8.3%) | 56 (5.4%) |
| $50,000 to $99,999 | 0 (0.0%) | 78 (7.5%) |
| $100,000 to $299,999 | 208 (74.8%) | 699 (66.9%) |
| $300,000 to $499,999 | 47 (16.9%) | 179 (17.2%) |
| $500,000 to $749,999 | 0 (0.0%) | 22 (2.1%) |
| $750,000 to $999,999 | 0 (0.0%) | 10 (1.0%) |
| $1,000,000 or more | 0 (0.0%) | 0 (0.0%) |
| Total | 278 (100.0%) | 1,044 (100.0%) |
Household Income by Mortgage Status in Littlestown borough
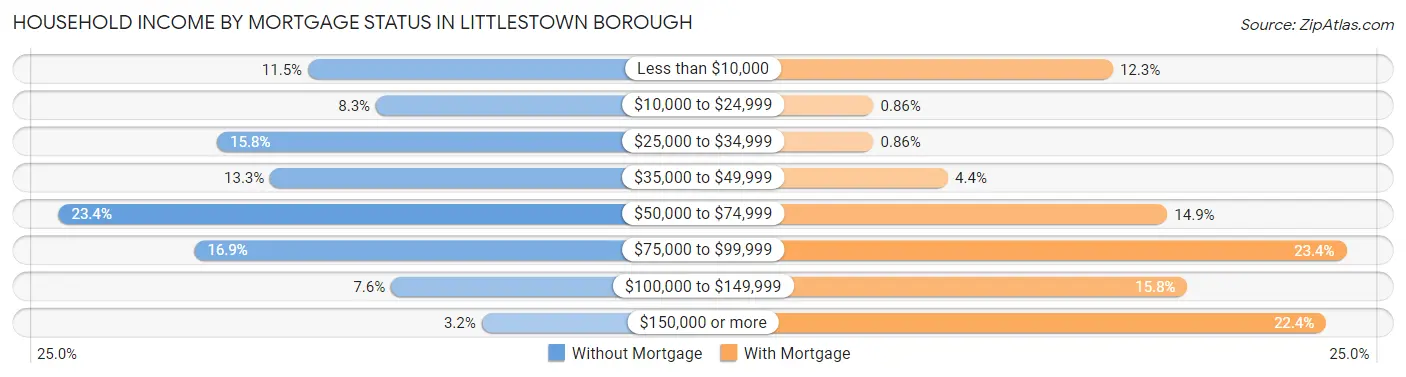
| Household Income | Without Mortgage | With Mortgage |
| Less than $10,000 | 32 (11.5%) | 128 (12.3%) |
| $10,000 to $24,999 | 23 (8.3%) | 9 (0.9%) |
| $25,000 to $34,999 | 44 (15.8%) | 9 (0.9%) |
| $35,000 to $49,999 | 37 (13.3%) | 46 (4.4%) |
| $50,000 to $74,999 | 65 (23.4%) | 155 (14.8%) |
| $75,000 to $99,999 | 47 (16.9%) | 244 (23.4%) |
| $100,000 to $149,999 | 21 (7.5%) | 165 (15.8%) |
| $150,000 or more | 9 (3.2%) | 234 (22.4%) |
| Total | 278 (100.0%) | 1,044 (100.0%) |
Property Value to Household Income Ratio in Littlestown borough
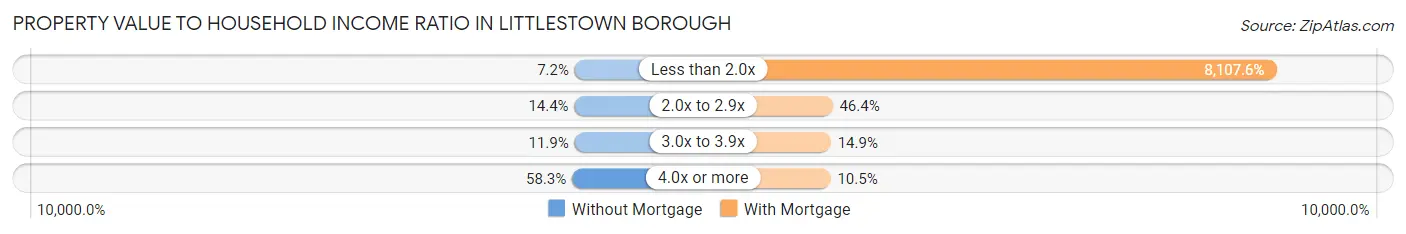
| Value-to-Income Ratio | Without Mortgage | With Mortgage |
| Less than 2.0x | 20 (7.2%) | 84,643 (8,107.6%) |
| 2.0x to 2.9x | 40 (14.4%) | 484 (46.4%) |
| 3.0x to 3.9x | 33 (11.9%) | 156 (14.9%) |
| 4.0x or more | 162 (58.3%) | 110 (10.5%) |
| Total | 278 (100.0%) | 1,044 (100.0%) |
Real Estate Taxes by Mortgage Status in Littlestown borough
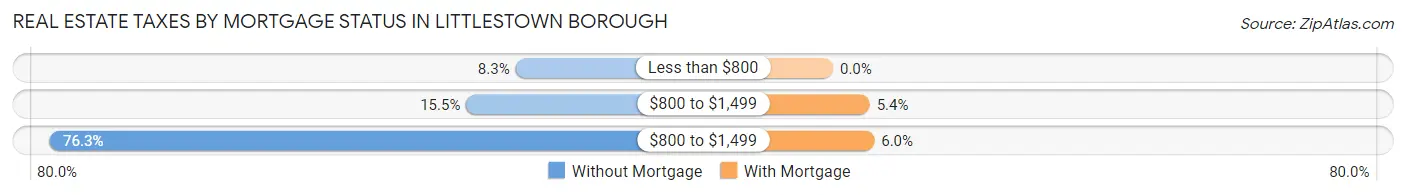
| Property Taxes | Without Mortgage | With Mortgage |
| Less than $800 | 23 (8.3%) | 0 (0.0%) |
| $800 to $1,499 | 43 (15.5%) | 56 (5.4%) |
| $800 to $1,499 | 212 (76.3%) | 63 (6.0%) |
| Total | 278 (100.0%) | 1,044 (100.0%) |
Health & Disability in Littlestown borough
Health Insurance Coverage by Age in Littlestown borough
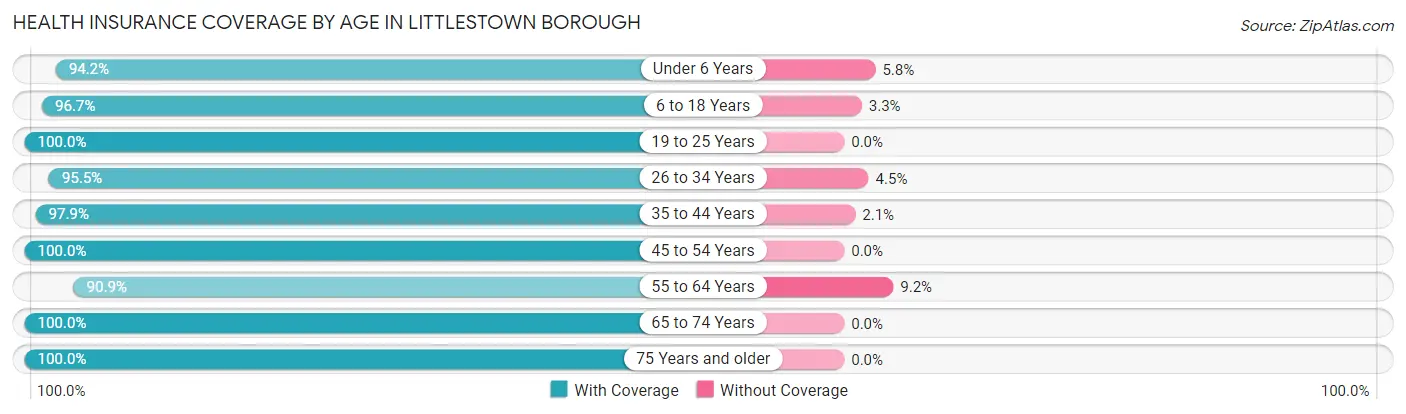
| Age Bracket | With Coverage | Without Coverage |
| Under 6 Years | 340 (94.2%) | 21 (5.8%) |
| 6 to 18 Years | 857 (96.7%) | 29 (3.3%) |
| 19 to 25 Years | 291 (100.0%) | 0 (0.0%) |
| 26 to 34 Years | 547 (95.5%) | 26 (4.5%) |
| 35 to 44 Years | 571 (97.9%) | 12 (2.1%) |
| 45 to 54 Years | 411 (100.0%) | 0 (0.0%) |
| 55 to 64 Years | 864 (90.8%) | 87 (9.1%) |
| 65 to 74 Years | 501 (100.0%) | 0 (0.0%) |
| 75 Years and older | 222 (100.0%) | 0 (0.0%) |
| Total | 4,604 (96.3%) | 175 (3.7%) |
Health Insurance Coverage by Citizenship Status in Littlestown borough
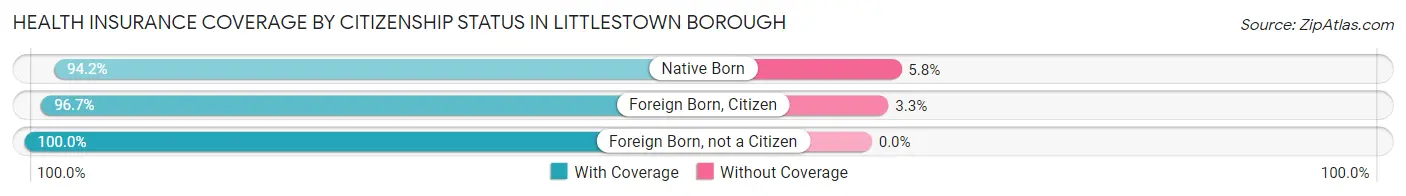
| Citizenship Status | With Coverage | Without Coverage |
| Native Born | 340 (94.2%) | 21 (5.8%) |
| Foreign Born, Citizen | 857 (96.7%) | 29 (3.3%) |
| Foreign Born, not a Citizen | 291 (100.0%) | 0 (0.0%) |
Health Insurance Coverage by Household Income in Littlestown borough
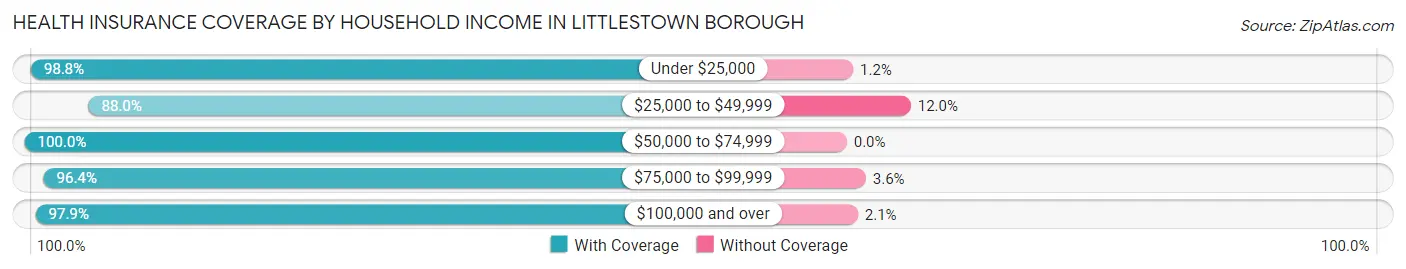
| Household Income | With Coverage | Without Coverage |
| Under $25,000 | 420 (98.8%) | 5 (1.2%) |
| $25,000 to $49,999 | 793 (88.0%) | 108 (12.0%) |
| $50,000 to $74,999 | 1,007 (100.0%) | 0 (0.0%) |
| $75,000 to $99,999 | 729 (96.4%) | 27 (3.6%) |
| $100,000 and over | 1,655 (97.9%) | 35 (2.1%) |
Public vs Private Health Insurance Coverage by Age in Littlestown borough
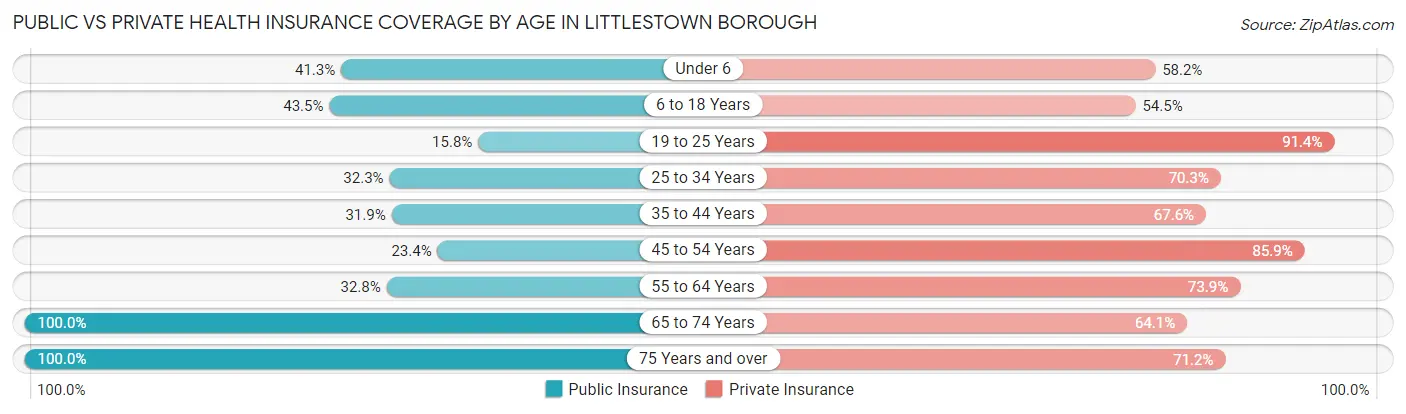
| Age Bracket | Public Insurance | Private Insurance |
| Under 6 | 149 (41.3%) | 210 (58.2%) |
| 6 to 18 Years | 385 (43.4%) | 483 (54.5%) |
| 19 to 25 Years | 46 (15.8%) | 266 (91.4%) |
| 25 to 34 Years | 185 (32.3%) | 403 (70.3%) |
| 35 to 44 Years | 186 (31.9%) | 394 (67.6%) |
| 45 to 54 Years | 96 (23.4%) | 353 (85.9%) |
| 55 to 64 Years | 312 (32.8%) | 703 (73.9%) |
| 65 to 74 Years | 501 (100.0%) | 321 (64.1%) |
| 75 Years and over | 222 (100.0%) | 158 (71.2%) |
| Total | 2,082 (43.6%) | 3,291 (68.9%) |
Disability Status by Sex by Age in Littlestown borough
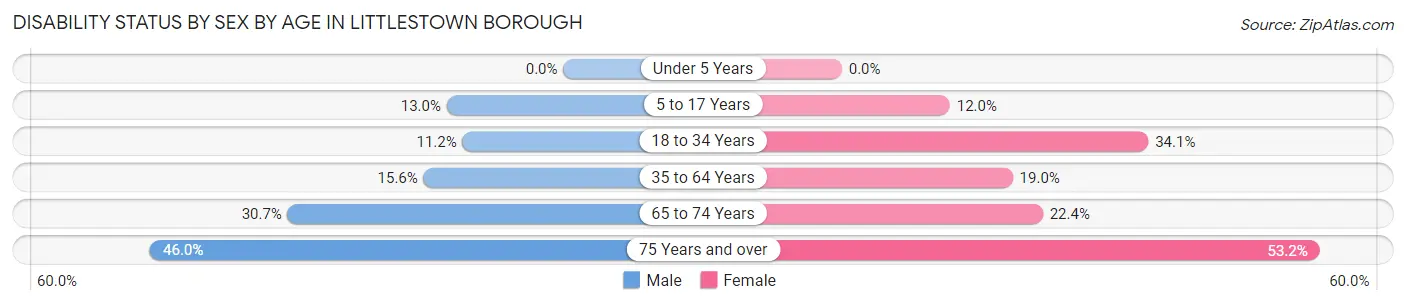
| Age Bracket | Male | Female |
| Under 5 Years | 0 (0.0%) | 0 (0.0%) |
| 5 to 17 Years | 57 (13.0%) | 51 (12.0%) |
| 18 to 34 Years | 62 (11.2%) | 142 (34.1%) |
| 35 to 64 Years | 126 (15.6%) | 216 (19.0%) |
| 65 to 74 Years | 66 (30.7%) | 64 (22.4%) |
| 75 Years and over | 52 (46.0%) | 58 (53.2%) |
Disability Class by Sex by Age in Littlestown borough
Disability Class: Hearing Difficulty
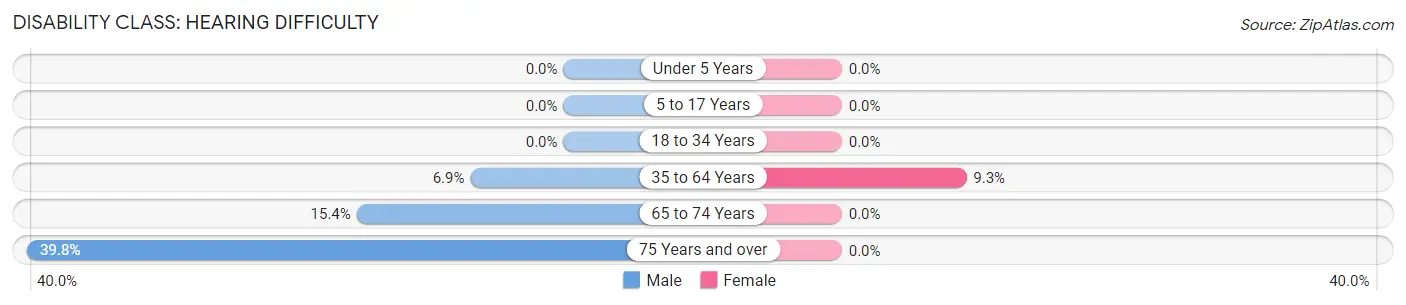
| Age Bracket | Male | Female |
| Under 5 Years | 0 (0.0%) | 0 (0.0%) |
| 5 to 17 Years | 0 (0.0%) | 0 (0.0%) |
| 18 to 34 Years | 0 (0.0%) | 0 (0.0%) |
| 35 to 64 Years | 56 (6.9%) | 105 (9.2%) |
| 65 to 74 Years | 33 (15.3%) | 0 (0.0%) |
| 75 Years and over | 45 (39.8%) | 0 (0.0%) |
Disability Class: Vision Difficulty
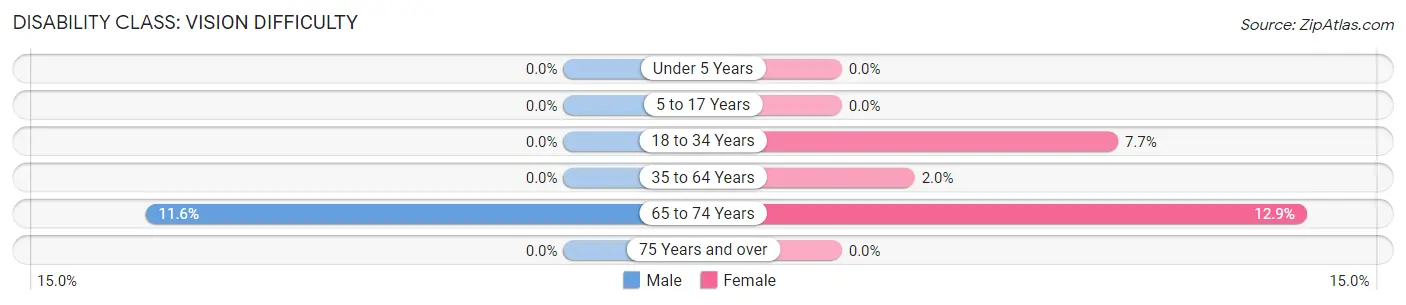
| Age Bracket | Male | Female |
| Under 5 Years | 0 (0.0%) | 0 (0.0%) |
| 5 to 17 Years | 0 (0.0%) | 0 (0.0%) |
| 18 to 34 Years | 0 (0.0%) | 32 (7.7%) |
| 35 to 64 Years | 0 (0.0%) | 23 (2.0%) |
| 65 to 74 Years | 25 (11.6%) | 37 (12.9%) |
| 75 Years and over | 0 (0.0%) | 0 (0.0%) |
Disability Class: Cognitive Difficulty
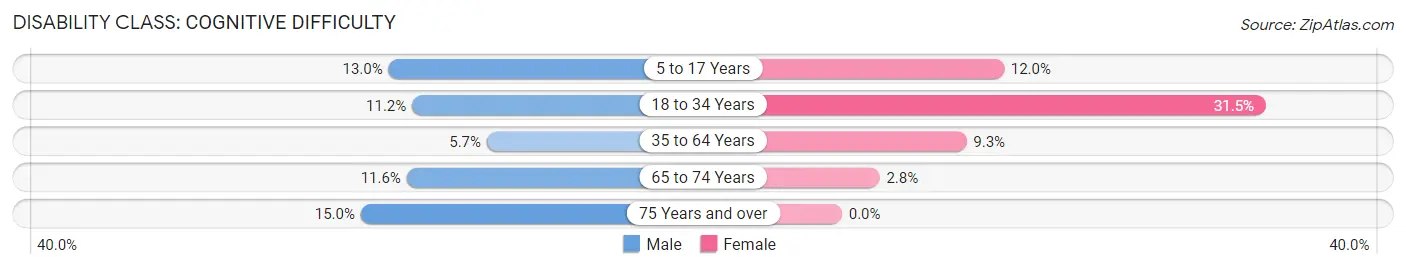
| Age Bracket | Male | Female |
| 5 to 17 Years | 57 (13.0%) | 51 (12.0%) |
| 18 to 34 Years | 62 (11.2%) | 131 (31.5%) |
| 35 to 64 Years | 46 (5.7%) | 105 (9.2%) |
| 65 to 74 Years | 25 (11.6%) | 8 (2.8%) |
| 75 Years and over | 17 (15.0%) | 0 (0.0%) |
Disability Class: Ambulatory Difficulty
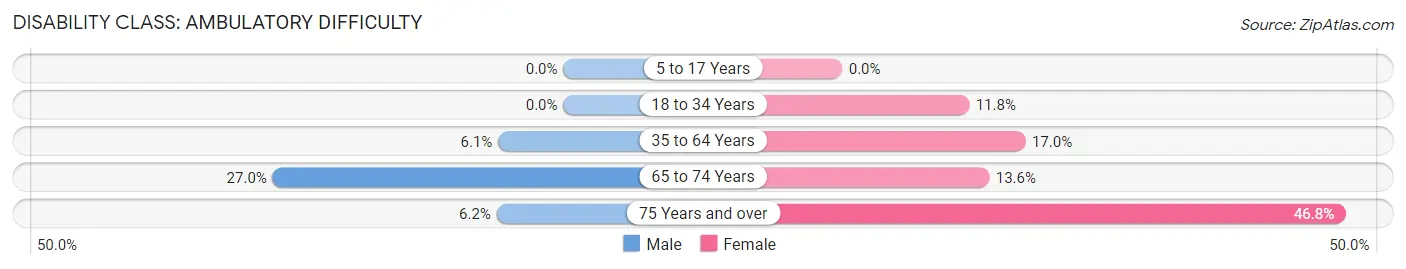
| Age Bracket | Male | Female |
| 5 to 17 Years | 0 (0.0%) | 0 (0.0%) |
| 18 to 34 Years | 0 (0.0%) | 49 (11.8%) |
| 35 to 64 Years | 49 (6.0%) | 193 (17.0%) |
| 65 to 74 Years | 58 (27.0%) | 39 (13.6%) |
| 75 Years and over | 7 (6.2%) | 51 (46.8%) |
Disability Class: Self-Care Difficulty
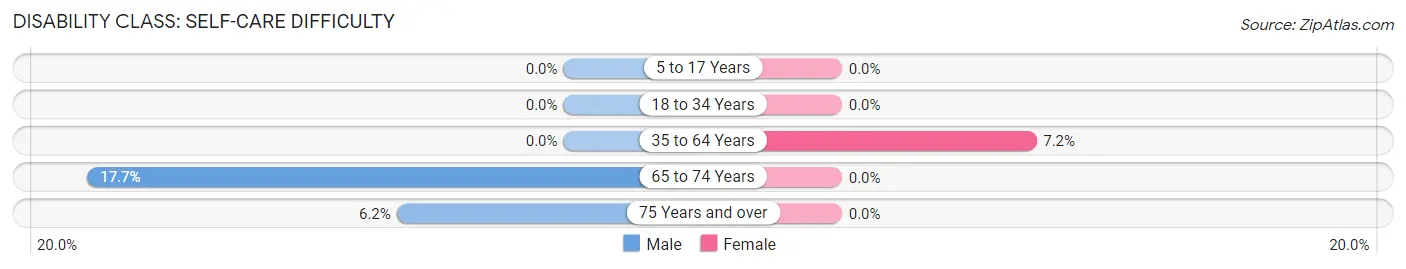
| Age Bracket | Male | Female |
| 5 to 17 Years | 0 (0.0%) | 0 (0.0%) |
| 18 to 34 Years | 0 (0.0%) | 0 (0.0%) |
| 35 to 64 Years | 0 (0.0%) | 82 (7.2%) |
| 65 to 74 Years | 38 (17.7%) | 0 (0.0%) |
| 75 Years and over | 7 (6.2%) | 0 (0.0%) |
Technology Access in Littlestown borough
Computing Device Access in Littlestown borough
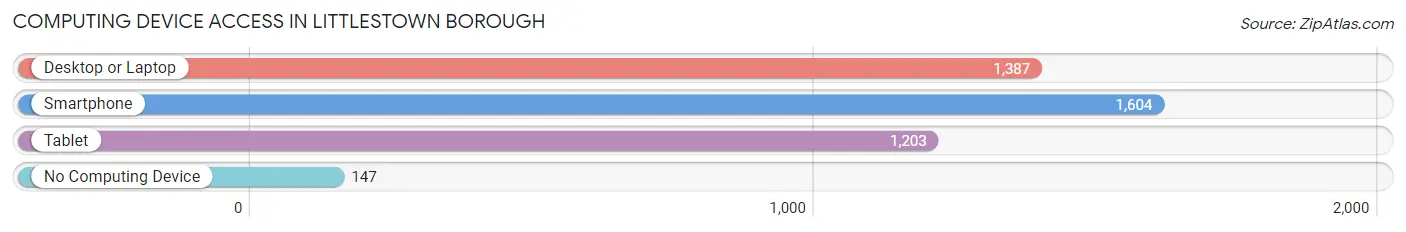
| Device Type | # Households | % Households |
| Desktop or Laptop | 1,387 | 73.9% |
| Smartphone | 1,604 | 85.4% |
| Tablet | 1,203 | 64.1% |
| No Computing Device | 147 | 7.8% |
| Total | 1,878 | 100.0% |
Internet Access in Littlestown borough
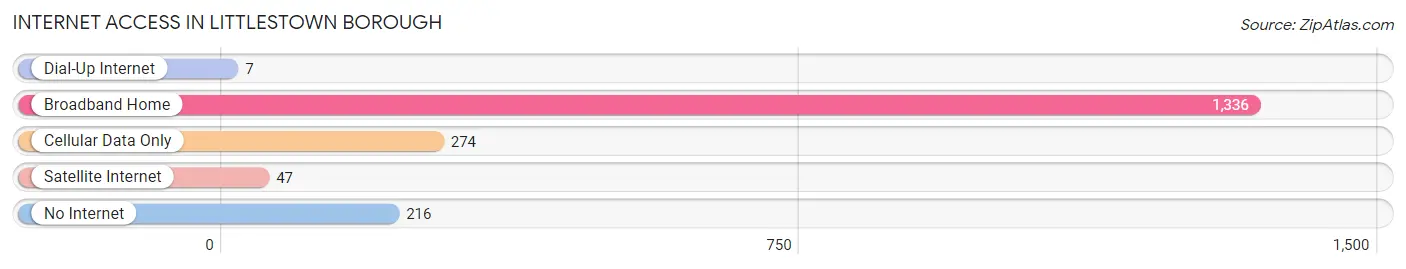
| Internet Type | # Households | % Households |
| Dial-Up Internet | 7 | 0.4% |
| Broadband Home | 1,336 | 71.1% |
| Cellular Data Only | 274 | 14.6% |
| Satellite Internet | 47 | 2.5% |
| No Internet | 216 | 11.5% |
| Total | 1,878 | 100.0% |
Littlestown borough Summary
Littlestown Borough is a small borough located in Adams County, Pennsylvania. It is situated in the south-central part of the state, approximately 25 miles south of Harrisburg and about 50 miles west of Baltimore, Maryland. The borough is bordered by the townships of Germany, Tyrone, and Mount Joy. As of the 2010 census, the population of Littlestown was 4,434.
History
Littlestown was founded in 1760 by a group of German settlers led by John Littel. The town was originally known as Littel's Town, but the name was eventually shortened to Littlestown. The town was incorporated as a borough in 1845.
In the 19th century, Littlestown was a major center of industry, with several factories producing textiles, furniture, and other goods. The town was also home to several foundries and machine shops. The town's economy was further bolstered by the arrival of the Western Maryland Railway in 1872.
Geography
Littlestown is located at 39°45'N 77°2'W (39.75, -77.03). According to the United States Census Bureau, the borough has a total area of 1.2 square miles (3.1 km2), all of it land.
The borough is situated in the rolling hills of south-central Pennsylvania. The town is located in the Piedmont region of the state, and is surrounded by farmland. The town is bisected by the Conewago Creek, which flows southward into the Susquehanna River.
Economy
Littlestown's economy is largely based on manufacturing and agriculture. The town is home to several factories, including a furniture factory, a textile mill, and a machine shop. The town is also home to several farms, which produce a variety of crops, including corn, soybeans, and hay.
The town is also home to several small businesses, including restaurants, retail stores, and service providers. The town is also home to several banks and financial institutions.
Demographics
As of the 2010 census, there were 4,434 people, 1,845 households, and 1,179 families residing in the borough. The population density was 3,717.3 people per square mile (1,433.2/km2). There were 1,945 housing units at an average density of 1,619.2 per square mile (625.2/km2). The racial makeup of the borough was 97.2% White, 0.7% African American, 0.2% Native American, 0.4% Asian, 0.2% from other races, and 1.3% from two or more races. Hispanic or Latino of any race were 1.2% of the population.
There were 1,845 households, out of which 28.2% had children under the age of 18 living with them, 46.2% were married couples living together, 12.2% had a female householder with no husband present, and 36.7% were non-families. 32.2% of all households were made up of individuals, and 15.2% had someone living alone who was 65 years of age or older. The average household size was 2.35 and the average family size was 2.94.
In the borough, the population was spread out, with 23.2% under the age of 18, 7.2% from 18 to 24, 28.2% from 25 to 44, 22.7% from 45 to 64, and 18.7% who were 65 years of age or older. The median age was 39 years. For every 100 females, there were 91.2 males. For every 100 females age 18 and over, there were 87.2 males.
The median income for a household in the borough was $37,917, and the median income for a family was $45,938. Males had a median income of $35,000 versus $25,000 for females. The per capita income for the borough was $19,945. About 6.2% of families and 8.2% of the population were below the poverty line, including 10.2% of those under age 18 and 8.2% of those age 65 or over.
Common Questions
What is Per Capita Income in Littlestown borough?
Per Capita income in Littlestown borough is $30,868.
What is the Median Family Income in Littlestown borough?
Median Family Income in Littlestown borough is $80,125.
What is the Median Household income in Littlestown borough?
Median Household Income in Littlestown borough is $62,857.
What is Income or Wage Gap in Littlestown borough?
Income or Wage Gap in Littlestown borough is 32.6%.
Women in Littlestown borough earn 67.4 cents for every dollar earned by a man.
What is Inequality or Gini Index in Littlestown borough?
Inequality or Gini Index in Littlestown borough is 0.38.
What is the Total Population of Littlestown borough?
Total Population of Littlestown borough is 4,779.
What is the Total Male Population of Littlestown borough?
Total Male Population of Littlestown borough is 2,296.
What is the Total Female Population of Littlestown borough?
Total Female Population of Littlestown borough is 2,483.
What is the Ratio of Males per 100 Females in Littlestown borough?
There are 92.47 Males per 100 Females in Littlestown borough.
What is the Ratio of Females per 100 Males in Littlestown borough?
There are 108.14 Females per 100 Males in Littlestown borough.
What is the Median Population Age in Littlestown borough?
Median Population Age in Littlestown borough is 39.4 Years.
What is the Average Family Size in Littlestown borough
Average Family Size in Littlestown borough is 3.2 People.
What is the Average Household Size in Littlestown borough
Average Household Size in Littlestown borough is 2.5 People.
How Large is the Labor Force in Littlestown borough?
There are 2,252 People in the Labor Forcein in Littlestown borough.
What is the Percentage of People in the Labor Force in Littlestown borough?
59.9% of People are in the Labor Force in Littlestown borough.
What is the Unemployment Rate in Littlestown borough?
Unemployment Rate in Littlestown borough is 2.4%.