New Florence borough, PA Map & Demographics
New Florence borough Overview
$30,545
PER CAPITA INCOME
$78,906
AVG FAMILY INCOME
$61,500
AVG HOUSEHOLD INCOME
39.9%
WAGE / INCOME GAP [ % ]
60.1¢/ $1
WAGE / INCOME GAP [ $ ]
0.43
INEQUALITY / GINI INDEX
703
TOTAL POPULATION
337
MALE POPULATION
366
FEMALE POPULATION
92.08
MALES / 100 FEMALES
108.61
FEMALES / 100 MALES
39.3
MEDIAN AGE
3.0
AVG FAMILY SIZE
2.5
AVG HOUSEHOLD SIZE
323
LABOR FORCE [ PEOPLE ]
55.5%
PERCENT IN LABOR FORCE
10.2%
UNEMPLOYMENT RATE
Income in New Florence borough
Income Overview in New Florence borough
Per Capita Income in New Florence borough is $30,545, while median incomes of families and households are $78,906 and $61,500 respectively.
| Characteristic | Number | Measure |
| Per Capita Income | 703 | $30,545 |
| Median Family Income | 185 | $78,906 |
| Mean Family Income | 185 | $91,483 |
| Median Household Income | 280 | $61,500 |
| Mean Household Income | 280 | $73,963 |
| Income Deficit | 185 | $0 |
| Wage / Income Gap (%) | 703 | 39.86% |
| Wage / Income Gap ($) | 703 | 60.14¢ per $1 |
| Gini / Inequality Index | 703 | 0.43 |
Earnings by Sex in New Florence borough
Average Earnings in New Florence borough are $32,266, $41,250 for men and $24,808 for women, a difference of 39.9%.
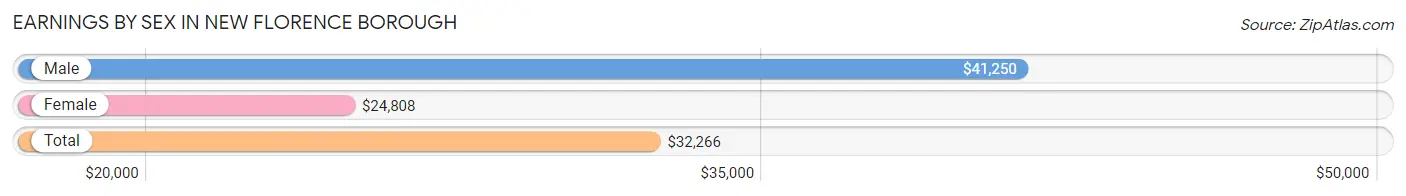
| Sex | Number | Average Earnings |
| Male | 173 (50.4%) | $41,250 |
| Female | 170 (49.6%) | $24,808 |
| Total | 343 (100.0%) | $32,266 |
Earnings by Sex by Income Bracket in New Florence borough
The most common earnings brackets in New Florence borough are $75,000 to $99,999 for men (21 | 12.1%) and $5,000 to $7,499 for women (26 | 15.3%).
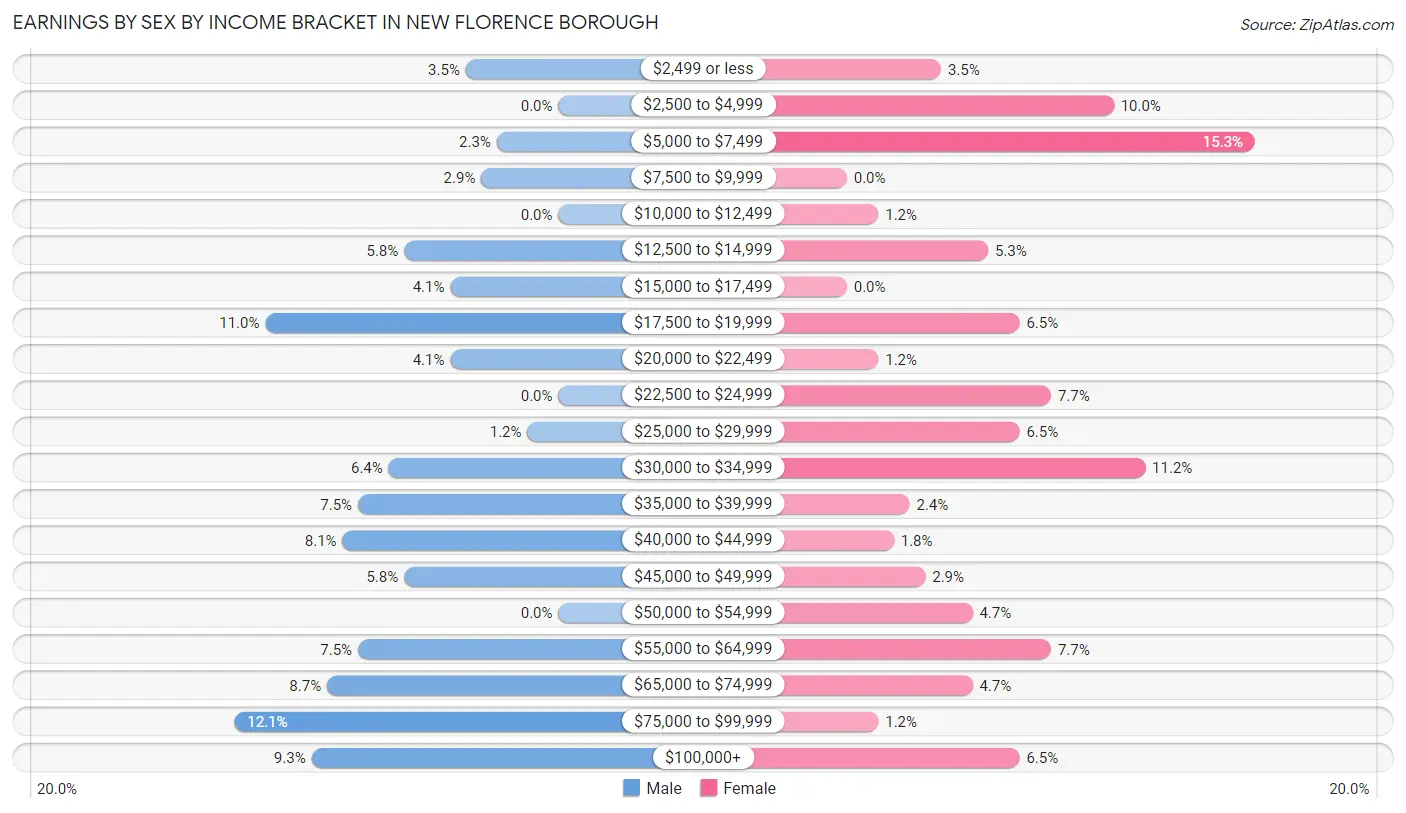
| Income | Male | Female |
| $2,499 or less | 6 (3.5%) | 6 (3.5%) |
| $2,500 to $4,999 | 0 (0.0%) | 17 (10.0%) |
| $5,000 to $7,499 | 4 (2.3%) | 26 (15.3%) |
| $7,500 to $9,999 | 5 (2.9%) | 0 (0.0%) |
| $10,000 to $12,499 | 0 (0.0%) | 2 (1.2%) |
| $12,500 to $14,999 | 10 (5.8%) | 9 (5.3%) |
| $15,000 to $17,499 | 7 (4.1%) | 0 (0.0%) |
| $17,500 to $19,999 | 19 (11.0%) | 11 (6.5%) |
| $20,000 to $22,499 | 7 (4.1%) | 2 (1.2%) |
| $22,500 to $24,999 | 0 (0.0%) | 13 (7.6%) |
| $25,000 to $29,999 | 2 (1.2%) | 11 (6.5%) |
| $30,000 to $34,999 | 11 (6.4%) | 19 (11.2%) |
| $35,000 to $39,999 | 13 (7.5%) | 4 (2.4%) |
| $40,000 to $44,999 | 14 (8.1%) | 3 (1.8%) |
| $45,000 to $49,999 | 10 (5.8%) | 5 (2.9%) |
| $50,000 to $54,999 | 0 (0.0%) | 8 (4.7%) |
| $55,000 to $64,999 | 13 (7.5%) | 13 (7.6%) |
| $65,000 to $74,999 | 15 (8.7%) | 8 (4.7%) |
| $75,000 to $99,999 | 21 (12.1%) | 2 (1.2%) |
| $100,000+ | 16 (9.2%) | 11 (6.5%) |
| Total | 173 (100.0%) | 170 (100.0%) |
Earnings by Sex by Educational Attainment in New Florence borough
Average earnings in New Florence borough are $48,036 for men and $25,500 for women, a difference of 46.9%. Men with an educational attainment of college or associate's degree enjoy the highest average annual earnings of $47,679, while those with high school diploma education earn the least with $40,500. Women with an educational attainment of high school diploma earn the most with the average annual earnings of $28,750, while those with less than high school education have the smallest earnings of $19,107.
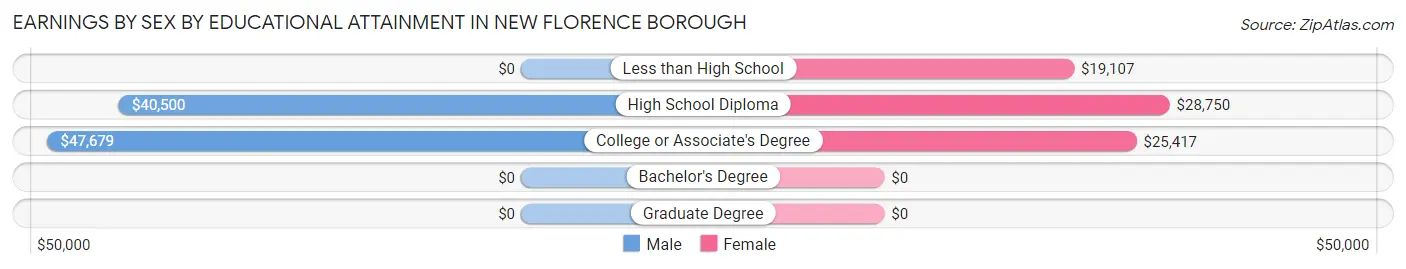
| Educational Attainment | Male Income | Female Income |
| Less than High School | - | - |
| High School Diploma | $40,500 | $28,750 |
| College or Associate's Degree | $47,679 | $25,417 |
| Bachelor's Degree | - | - |
| Graduate Degree | - | - |
| Total | $48,036 | $25,500 |
Family Income in New Florence borough
Family Income Brackets in New Florence borough
According to the New Florence borough family income data, there are 37 families falling into the $100,000 to $149,999 income range, which is the most common income bracket and makes up 20.0% of all families. Conversely, the $10,000 to $14,999 income bracket is the least frequent group with only 3 families (1.6%) belonging to this category.
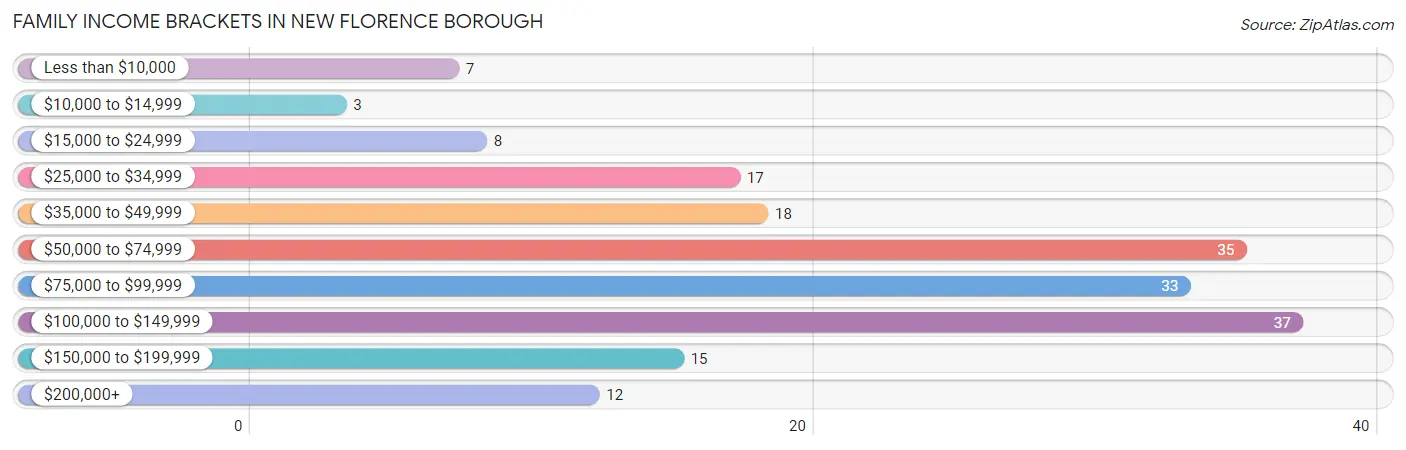
| Income Bracket | # Families | % Families |
| Less than $10,000 | 7 | 3.8% |
| $10,000 to $14,999 | 3 | 1.6% |
| $15,000 to $24,999 | 8 | 4.3% |
| $25,000 to $34,999 | 17 | 9.2% |
| $35,000 to $49,999 | 18 | 9.7% |
| $50,000 to $74,999 | 35 | 18.9% |
| $75,000 to $99,999 | 33 | 17.8% |
| $100,000 to $149,999 | 37 | 20.0% |
| $150,000 to $199,999 | 15 | 8.1% |
| $200,000+ | 12 | 6.5% |
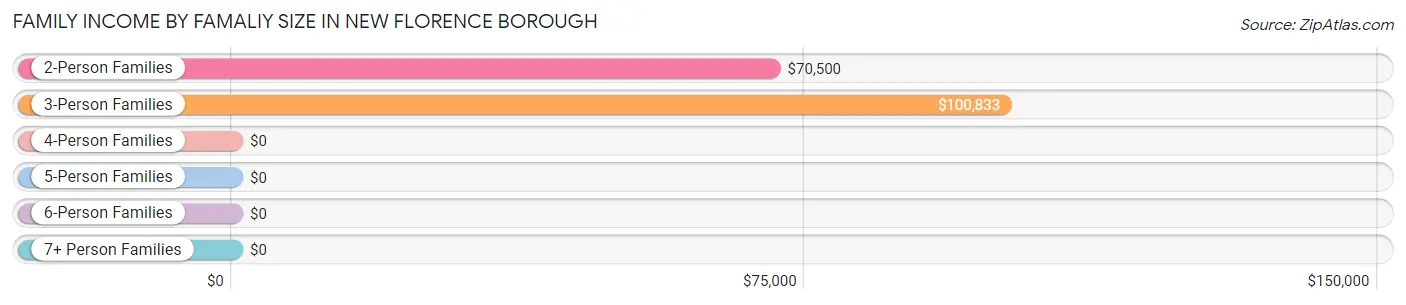
Family Income by Famaliy Size in New Florence borough
3-person families (50 | 27.0%) account for the highest median family income in New Florence borough with $100,833 per family, while 2-person families (98 | 53.0%) have the highest median income of $35,250 per family member.
| Income Bracket | # Families | Median Income |
| 2-Person Families | 98 (53.0%) | $70,500 |
| 3-Person Families | 50 (27.0%) | $100,833 |
| 4-Person Families | 30 (16.2%) | $0 |
| 5-Person Families | 2 (1.1%) | $0 |
| 6-Person Families | 5 (2.7%) | $0 |
| 7+ Person Families | 0 (0.0%) | $0 |
| Total | 185 (100.0%) | $78,906 |
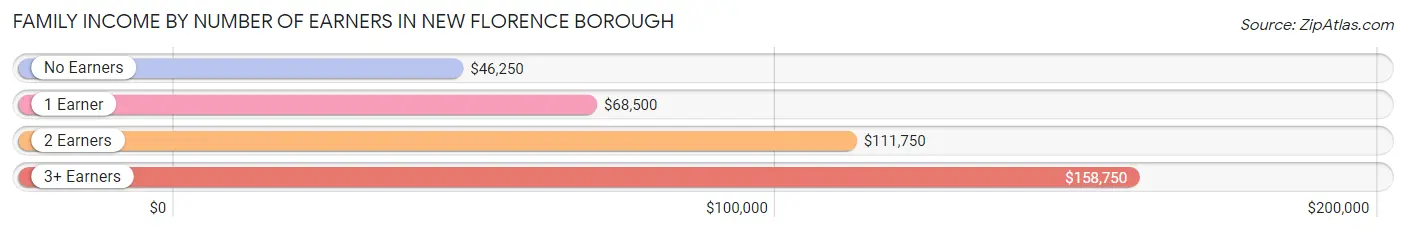
Family Income by Number of Earners in New Florence borough
The median family income in New Florence borough is $78,906, with families comprising 3+ earners (16) having the highest median family income of $158,750, while families with no earners (36) have the lowest median family income of $46,250, accounting for 8.6% and 19.5% of families, respectively.
| Number of Earners | # Families | Median Income |
| No Earners | 36 (19.5%) | $46,250 |
| 1 Earner | 62 (33.5%) | $68,500 |
| 2 Earners | 71 (38.4%) | $111,750 |
| 3+ Earners | 16 (8.6%) | $158,750 |
| Total | 185 (100.0%) | $78,906 |
Household Income in New Florence borough
Household Income Brackets in New Florence borough
With 53 households falling in the category, the $75,000 to $99,999 income range is the most frequent in New Florence borough, accounting for 18.9% of all households. In contrast, only 12 households (4.3%) fall into the $200,000+ income bracket, making it the least populous group.
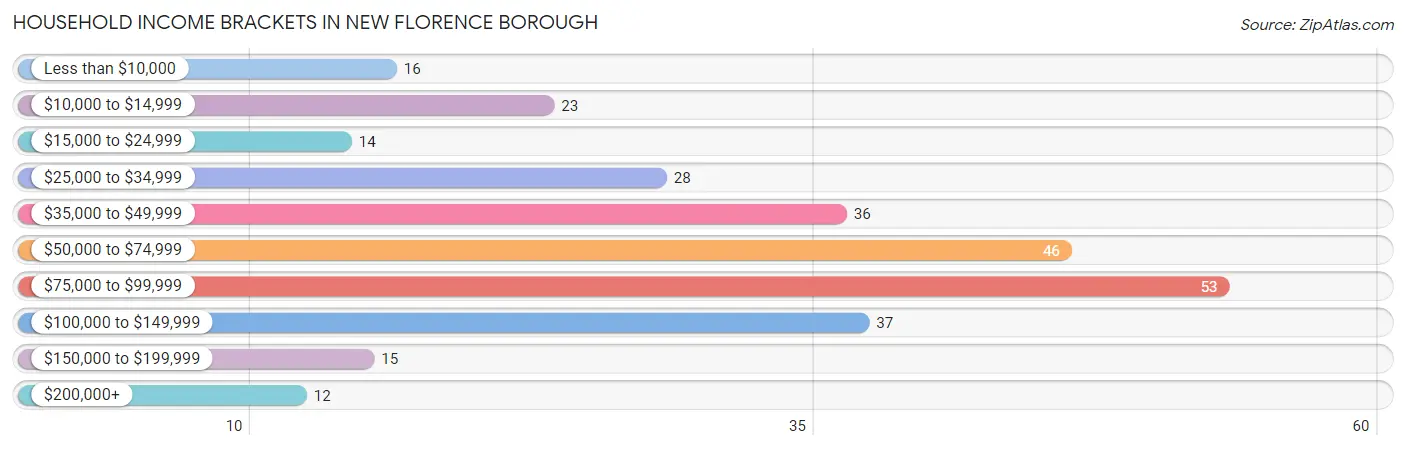
| Income Bracket | # Households | % Households |
| Less than $10,000 | 16 | 5.7% |
| $10,000 to $14,999 | 23 | 8.2% |
| $15,000 to $24,999 | 14 | 5.0% |
| $25,000 to $34,999 | 28 | 10.0% |
| $35,000 to $49,999 | 36 | 12.9% |
| $50,000 to $74,999 | 46 | 16.4% |
| $75,000 to $99,999 | 53 | 18.9% |
| $100,000 to $149,999 | 37 | 13.2% |
| $150,000 to $199,999 | 15 | 5.4% |
| $200,000+ | 12 | 4.3% |
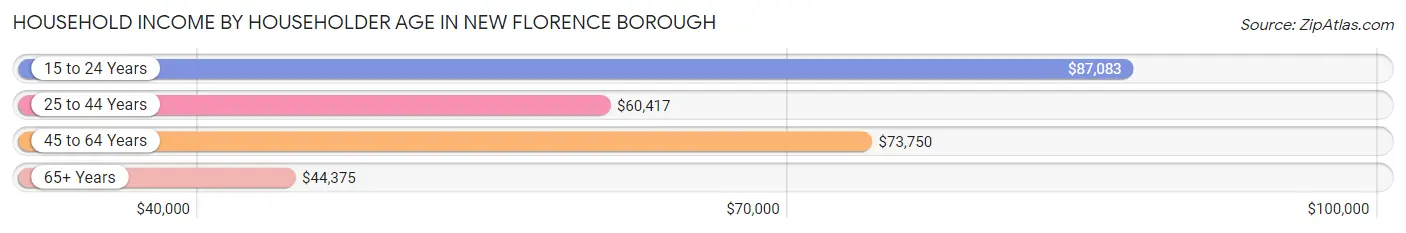
Household Income by Householder Age in New Florence borough
The median household income in New Florence borough is $61,500, with the highest median household income of $87,083 found in the 15 to 24 years age bracket for the primary householder. A total of 14 households (5.0%) fall into this category. Meanwhile, the 65+ years age bracket for the primary householder has the lowest median household income of $44,375, with 87 households (31.1%) in this group.
| Income Bracket | # Households | Median Income |
| 15 to 24 Years | 14 (5.0%) | $87,083 |
| 25 to 44 Years | 85 (30.4%) | $60,417 |
| 45 to 64 Years | 94 (33.6%) | $73,750 |
| 65+ Years | 87 (31.1%) | $44,375 |
| Total | 280 (100.0%) | $61,500 |
Poverty in New Florence borough
Income Below Poverty by Sex and Age in New Florence borough
With 12.5% poverty level for males and 15.9% for females among the residents of New Florence borough, 5 year old males and under 5 year old females are the most vulnerable to poverty, with 3 males (37.5%) and 14 females (60.9%) in their respective age groups living below the poverty level.
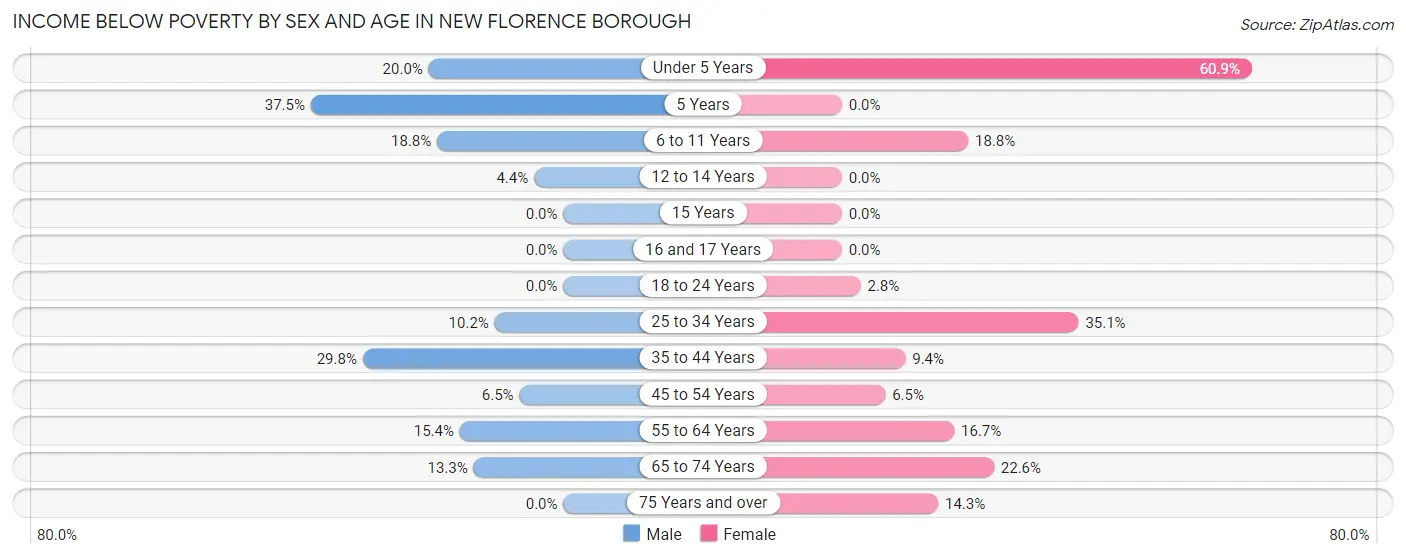
| Age Bracket | Male | Female |
| Under 5 Years | 3 (20.0%) | 14 (60.9%) |
| 5 Years | 3 (37.5%) | 0 (0.0%) |
| 6 to 11 Years | 3 (18.8%) | 3 (18.8%) |
| 12 to 14 Years | 1 (4.3%) | 0 (0.0%) |
| 15 Years | 0 (0.0%) | 0 (0.0%) |
| 16 and 17 Years | 0 (0.0%) | 0 (0.0%) |
| 18 to 24 Years | 0 (0.0%) | 1 (2.8%) |
| 25 to 34 Years | 5 (10.2%) | 13 (35.1%) |
| 35 to 44 Years | 14 (29.8%) | 5 (9.4%) |
| 45 to 54 Years | 3 (6.5%) | 2 (6.5%) |
| 55 to 64 Years | 6 (15.4%) | 9 (16.7%) |
| 65 to 74 Years | 4 (13.3%) | 7 (22.6%) |
| 75 Years and over | 0 (0.0%) | 4 (14.3%) |
| Total | 42 (12.5%) | 58 (15.9%) |
Income Above Poverty by Sex and Age in New Florence borough
According to the poverty statistics in New Florence borough, males aged 16 and 17 years and females aged 12 to 14 years are the age groups that are most secure financially, with 100.0% of males and 100.0% of females in these age groups living above the poverty line.
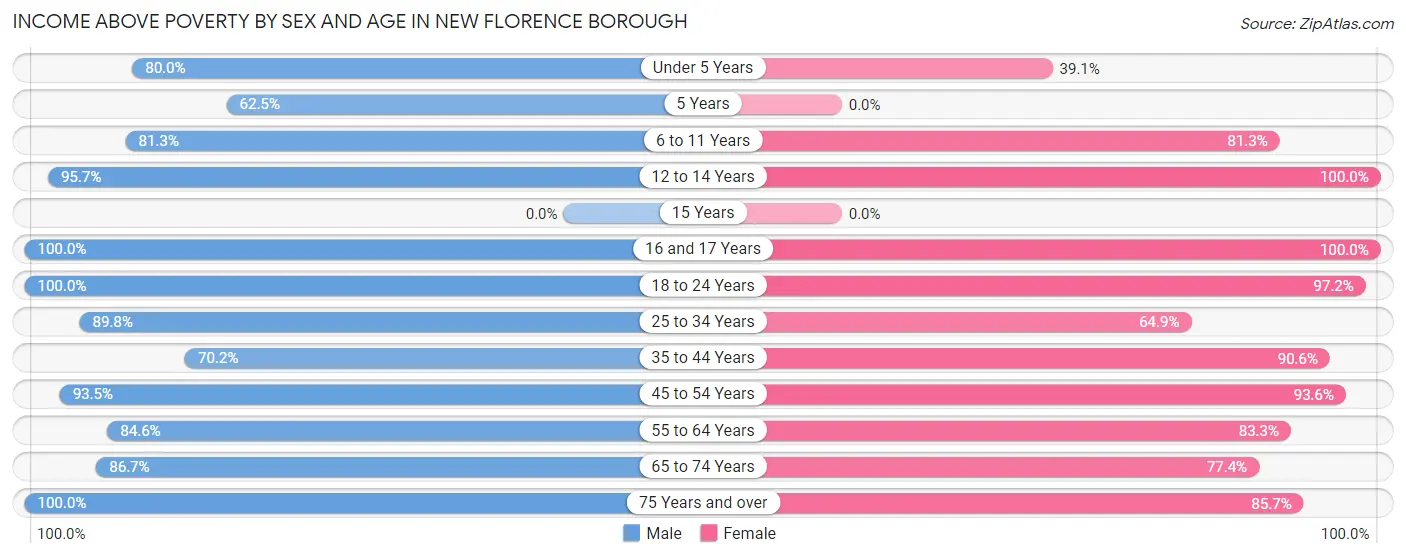
| Age Bracket | Male | Female |
| Under 5 Years | 12 (80.0%) | 9 (39.1%) |
| 5 Years | 5 (62.5%) | 0 (0.0%) |
| 6 to 11 Years | 13 (81.2%) | 13 (81.2%) |
| 12 to 14 Years | 22 (95.7%) | 20 (100.0%) |
| 15 Years | 0 (0.0%) | 0 (0.0%) |
| 16 and 17 Years | 3 (100.0%) | 37 (100.0%) |
| 18 to 24 Years | 38 (100.0%) | 35 (97.2%) |
| 25 to 34 Years | 44 (89.8%) | 24 (64.9%) |
| 35 to 44 Years | 33 (70.2%) | 48 (90.6%) |
| 45 to 54 Years | 43 (93.5%) | 29 (93.5%) |
| 55 to 64 Years | 33 (84.6%) | 45 (83.3%) |
| 65 to 74 Years | 26 (86.7%) | 24 (77.4%) |
| 75 Years and over | 23 (100.0%) | 24 (85.7%) |
| Total | 295 (87.5%) | 308 (84.2%) |
Income Below Poverty Among Married-Couple Families in New Florence borough
The poverty statistics for married-couple families in New Florence borough show that 1.5% or 2 of the total 130 families live below the poverty line. Families with 1 or 2 children have the highest poverty rate of 4.2%, comprising of 2 families. On the other hand, families with no children have the lowest poverty rate of 0.0%, which includes 0 families.
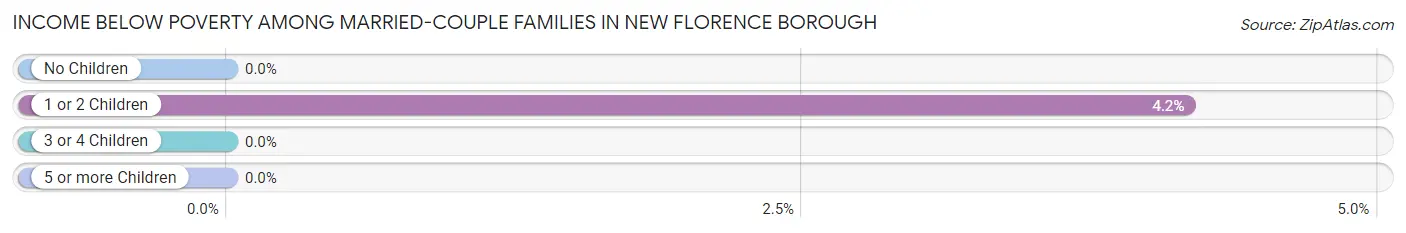
| Children | Above Poverty | Below Poverty |
| No Children | 80 (100.0%) | 0 (0.0%) |
| 1 or 2 Children | 46 (95.8%) | 2 (4.2%) |
| 3 or 4 Children | 2 (100.0%) | 0 (0.0%) |
| 5 or more Children | 0 (0.0%) | 0 (0.0%) |
| Total | 128 (98.5%) | 2 (1.5%) |
Income Below Poverty Among Single-Parent Households in New Florence borough
According to the poverty data in New Florence borough, 30.4% or 7 single-father households and 25.0% or 8 single-mother households are living below the poverty line. Among single-father households, those with 1 or 2 children have the highest poverty rate, with 7 households (77.8%) experiencing poverty. Likewise, among single-mother households, those with 3 or 4 children have the highest poverty rate, with 3 households (100.0%) falling below the poverty line.
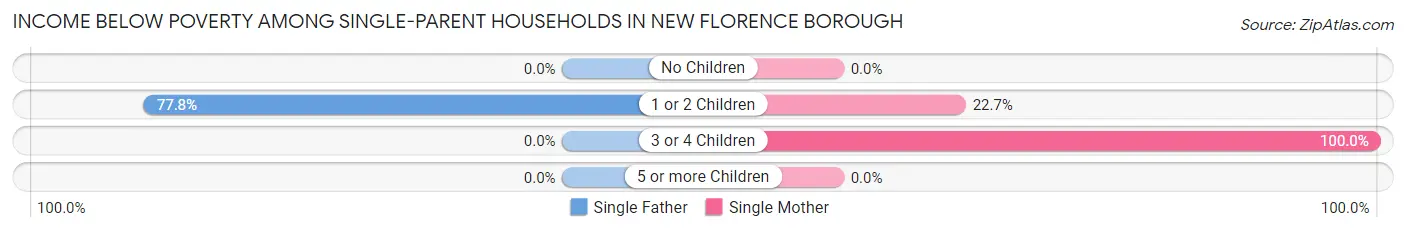
| Children | Single Father | Single Mother |
| No Children | 0 (0.0%) | 0 (0.0%) |
| 1 or 2 Children | 7 (77.8%) | 5 (22.7%) |
| 3 or 4 Children | 0 (0.0%) | 3 (100.0%) |
| 5 or more Children | 0 (0.0%) | 0 (0.0%) |
| Total | 7 (30.4%) | 8 (25.0%) |
Income Below Poverty Among Married-Couple vs Single-Parent Households in New Florence borough
The poverty data for New Florence borough shows that 2 of the married-couple family households (1.5%) and 15 of the single-parent households (27.3%) are living below the poverty level. Within the married-couple family households, those with 1 or 2 children have the highest poverty rate, with 2 households (4.2%) falling below the poverty line. Among the single-parent households, those with 3 or 4 children have the highest poverty rate, with 3 household (50.0%) living below poverty.
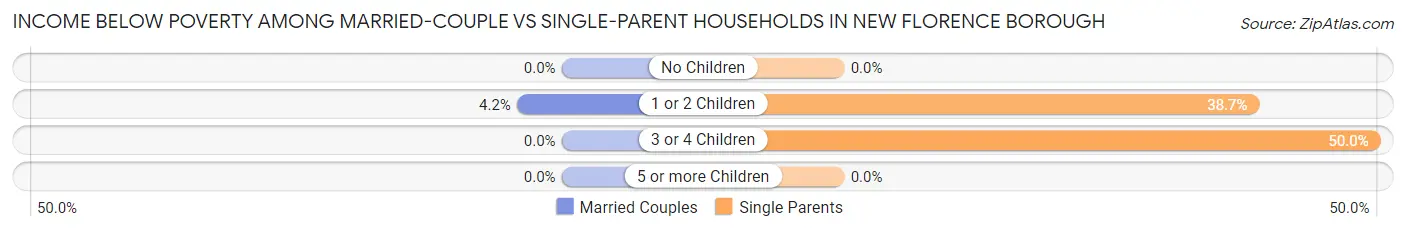
| Children | Married-Couple Families | Single-Parent Households |
| No Children | 0 (0.0%) | 0 (0.0%) |
| 1 or 2 Children | 2 (4.2%) | 12 (38.7%) |
| 3 or 4 Children | 0 (0.0%) | 3 (50.0%) |
| 5 or more Children | 0 (0.0%) | 0 (0.0%) |
| Total | 2 (1.5%) | 15 (27.3%) |
Race in New Florence borough
The most populous races in New Florence borough are White / Caucasian (637 | 90.6%), Two or more Races (63 | 9.0%), and Hispanic or Latino (53 | 7.5%).
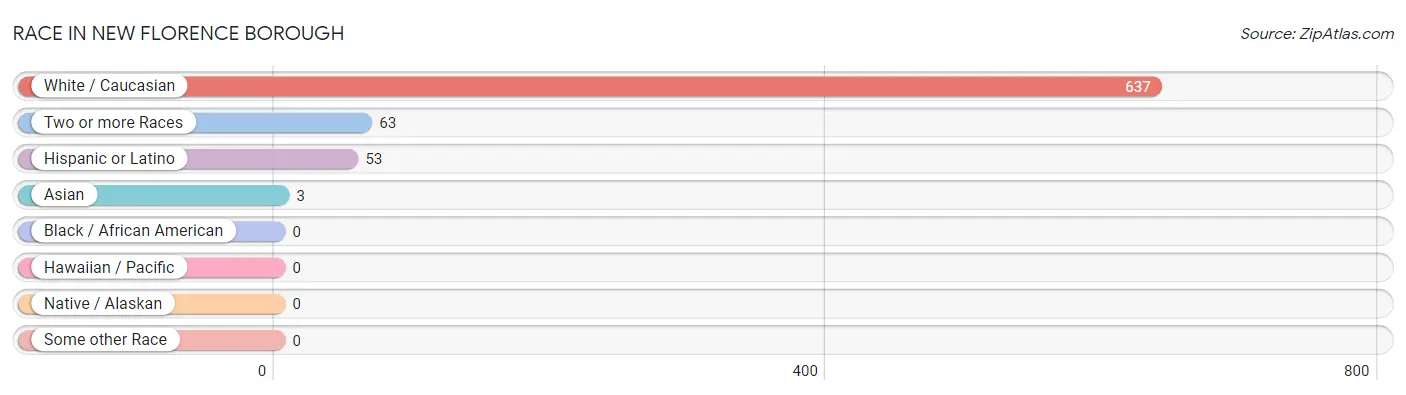
| Race | # Population | % Population |
| Asian | 3 | 0.4% |
| Black / African American | 0 | 0.0% |
| Hawaiian / Pacific | 0 | 0.0% |
| Hispanic or Latino | 53 | 7.5% |
| Native / Alaskan | 0 | 0.0% |
| White / Caucasian | 637 | 90.6% |
| Two or more Races | 63 | 9.0% |
| Some other Race | 0 | 0.0% |
| Total | 703 | 100.0% |
Ancestry in New Florence borough
The most populous ancestries reported in New Florence borough are German (294 | 41.8%), Italian (129 | 18.3%), Irish (105 | 14.9%), English (74 | 10.5%), and Scotch-Irish (52 | 7.4%), together accounting for 93.0% of all New Florence borough residents.
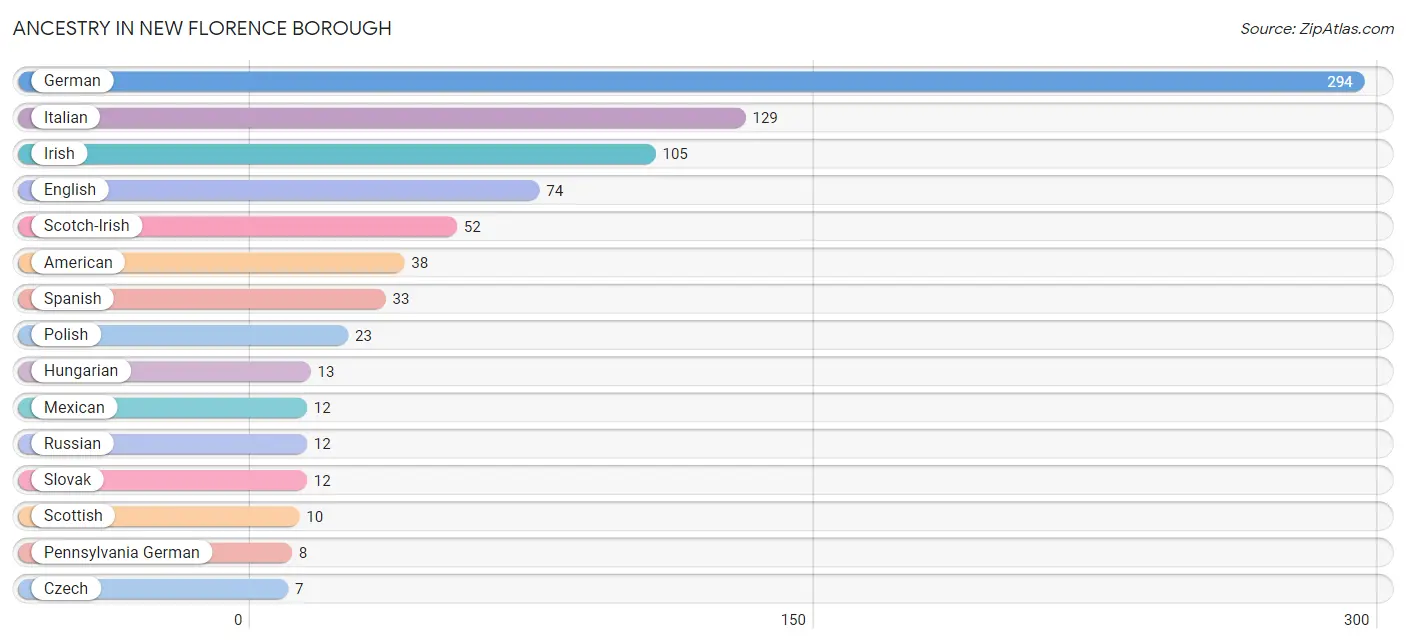
| Ancestry | # Population | % Population |
| American | 38 | 5.4% |
| Austrian | 5 | 0.7% |
| Belgian | 3 | 0.4% |
| Bhutanese | 1 | 0.1% |
| Czech | 7 | 1.0% |
| Czechoslovakian | 2 | 0.3% |
| Dutch | 6 | 0.9% |
| Eastern European | 1 | 0.1% |
| English | 74 | 10.5% |
| European | 2 | 0.3% |
| French | 3 | 0.4% |
| German | 294 | 41.8% |
| Hungarian | 13 | 1.8% |
| Irish | 105 | 14.9% |
| Italian | 129 | 18.3% |
| Korean | 6 | 0.9% |
| Mexican | 12 | 1.7% |
| Pennsylvania German | 8 | 1.1% |
| Polish | 23 | 3.3% |
| Puerto Rican | 2 | 0.3% |
| Russian | 12 | 1.7% |
| Scotch-Irish | 52 | 7.4% |
| Scottish | 10 | 1.4% |
| Serbian | 3 | 0.4% |
| Slovak | 12 | 1.7% |
| Slovene | 3 | 0.4% |
| Spaniard | 6 | 0.9% |
| Spanish | 33 | 4.7% |
| Swedish | 4 | 0.6% |
| Welsh | 1 | 0.1% | View All 30 Rows |
Immigrants in New Florence borough
The most numerous immigrant groups reported in New Florence borough came from Asia (3 | 0.4%), Philippines (3 | 0.4%), and South Eastern Asia (3 | 0.4%), together accounting for 1.3% of all New Florence borough residents.
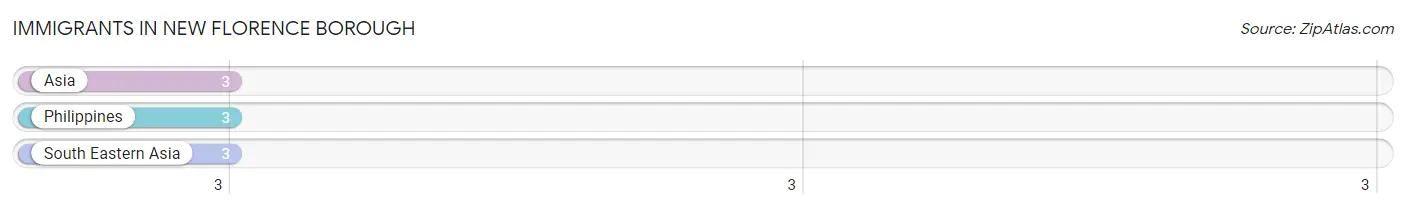
| Immigration Origin | # Population | % Population |
| Asia | 3 | 0.4% |
| Philippines | 3 | 0.4% |
| South Eastern Asia | 3 | 0.4% | View All 3 Rows |
Sex and Age in New Florence borough
Sex and Age in New Florence borough
The most populous age groups in New Florence borough are 10 to 14 Years (34 | 10.1%) for men and 15 to 19 Years (52 | 14.2%) for women.
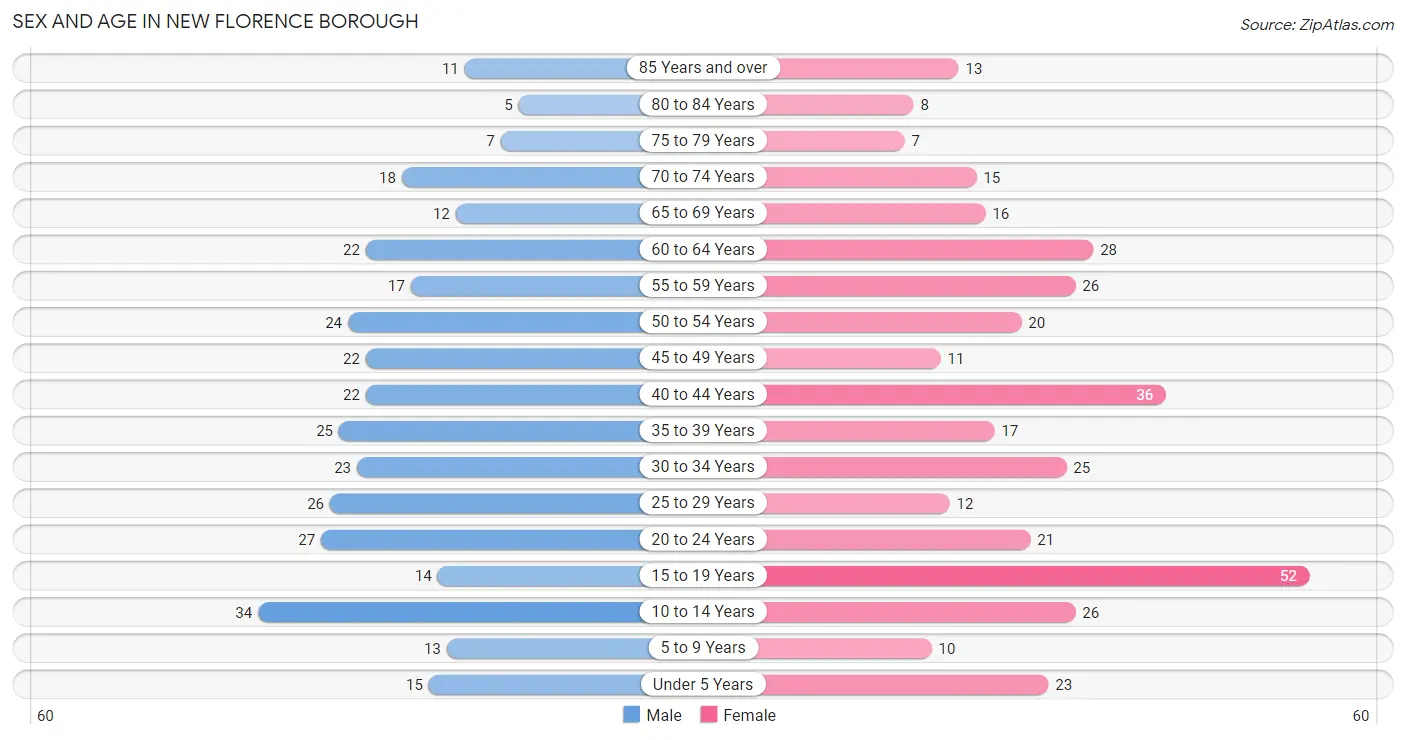
| Age Bracket | Male | Female |
| Under 5 Years | 15 (4.4%) | 23 (6.3%) |
| 5 to 9 Years | 13 (3.9%) | 10 (2.7%) |
| 10 to 14 Years | 34 (10.1%) | 26 (7.1%) |
| 15 to 19 Years | 14 (4.2%) | 52 (14.2%) |
| 20 to 24 Years | 27 (8.0%) | 21 (5.7%) |
| 25 to 29 Years | 26 (7.7%) | 12 (3.3%) |
| 30 to 34 Years | 23 (6.8%) | 25 (6.8%) |
| 35 to 39 Years | 25 (7.4%) | 17 (4.6%) |
| 40 to 44 Years | 22 (6.5%) | 36 (9.8%) |
| 45 to 49 Years | 22 (6.5%) | 11 (3.0%) |
| 50 to 54 Years | 24 (7.1%) | 20 (5.5%) |
| 55 to 59 Years | 17 (5.0%) | 26 (7.1%) |
| 60 to 64 Years | 22 (6.5%) | 28 (7.6%) |
| 65 to 69 Years | 12 (3.6%) | 16 (4.4%) |
| 70 to 74 Years | 18 (5.3%) | 15 (4.1%) |
| 75 to 79 Years | 7 (2.1%) | 7 (1.9%) |
| 80 to 84 Years | 5 (1.5%) | 8 (2.2%) |
| 85 Years and over | 11 (3.3%) | 13 (3.5%) |
| Total | 337 (100.0%) | 366 (100.0%) |
Families and Households in New Florence borough
Median Family Size in New Florence borough
The median family size in New Florence borough is 3.04 persons per family, with single female/mother families (32 | 17.3%) accounting for the largest median family size of 3.5 persons per family. On the other hand, single male/father families (23 | 12.4%) represent the smallest median family size with 2.48 persons per family.
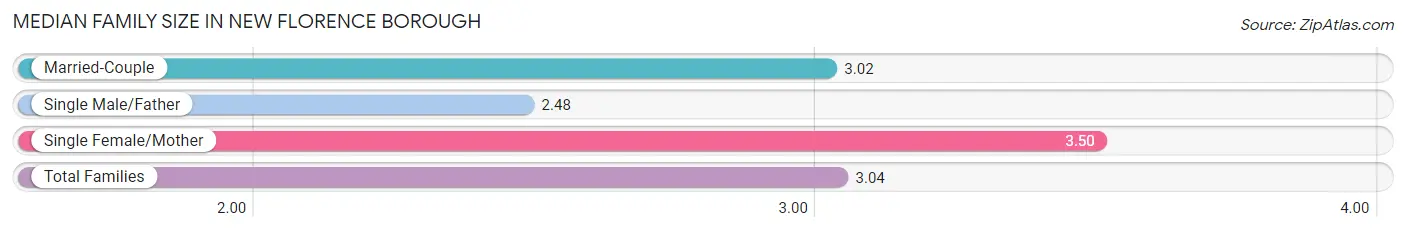
| Family Type | # Families | Family Size |
| Married-Couple | 130 (70.3%) | 3.02 |
| Single Male/Father | 23 (12.4%) | 2.48 |
| Single Female/Mother | 32 (17.3%) | 3.50 |
| Total Families | 185 (100.0%) | 3.04 |
Median Household Size in New Florence borough
The median household size in New Florence borough is 2.51 persons per household, with single female/mother households (32 | 11.4%) accounting for the largest median household size of 3.75 persons per household. non-family households (95 | 33.9%) represent the smallest median household size with 1.28 persons per household.
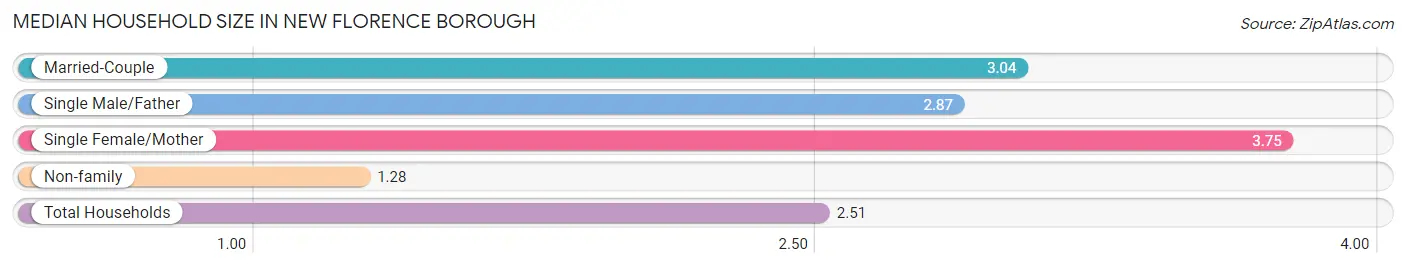
| Household Type | # Households | Household Size |
| Married-Couple | 130 (46.4%) | 3.04 |
| Single Male/Father | 23 (8.2%) | 2.87 |
| Single Female/Mother | 32 (11.4%) | 3.75 |
| Non-family | 95 (33.9%) | 1.28 |
| Total Households | 280 (100.0%) | 2.51 |
Household Size by Marriage Status in New Florence borough
Out of a total of 280 households in New Florence borough, 185 (66.1%) are family households, while 95 (33.9%) are nonfamily households. The most numerous type of family households are 2-person households, comprising 95, and the most common type of nonfamily households are 1-person households, comprising 75.
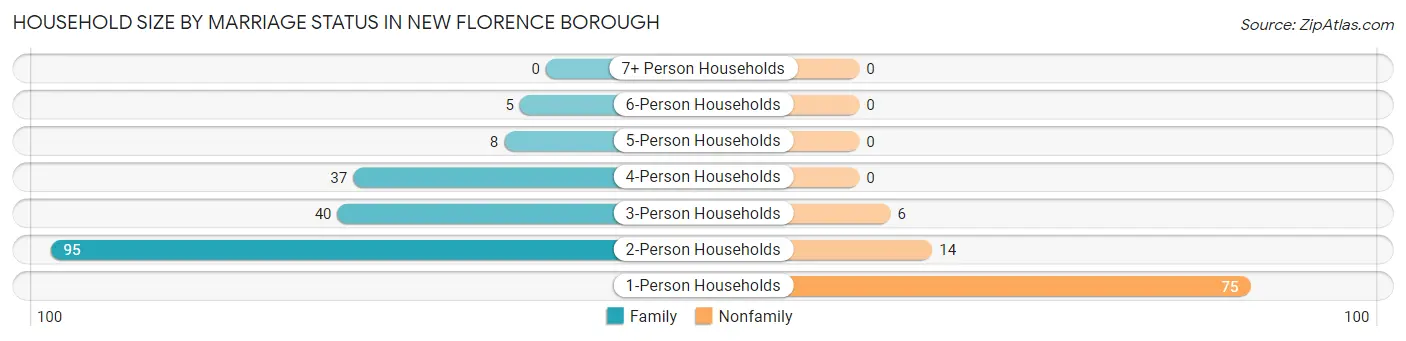
| Household Size | Family Households | Nonfamily Households |
| 1-Person Households | - | 75 (26.8%) |
| 2-Person Households | 95 (33.9%) | 14 (5.0%) |
| 3-Person Households | 40 (14.3%) | 6 (2.1%) |
| 4-Person Households | 37 (13.2%) | 0 (0.0%) |
| 5-Person Households | 8 (2.9%) | 0 (0.0%) |
| 6-Person Households | 5 (1.8%) | 0 (0.0%) |
| 7+ Person Households | 0 (0.0%) | 0 (0.0%) |
| Total | 185 (66.1%) | 95 (33.9%) |
Female Fertility in New Florence borough
Fertility by Age in New Florence borough
Average fertility rate in New Florence borough is 47.0 births per 1,000 women. Women in the age bracket of 20 to 34 years have the highest fertility rate with 103.0 births per 1,000 women. Women in the age bracket of 20 to 34 years acount for 66.7% of all women with births.
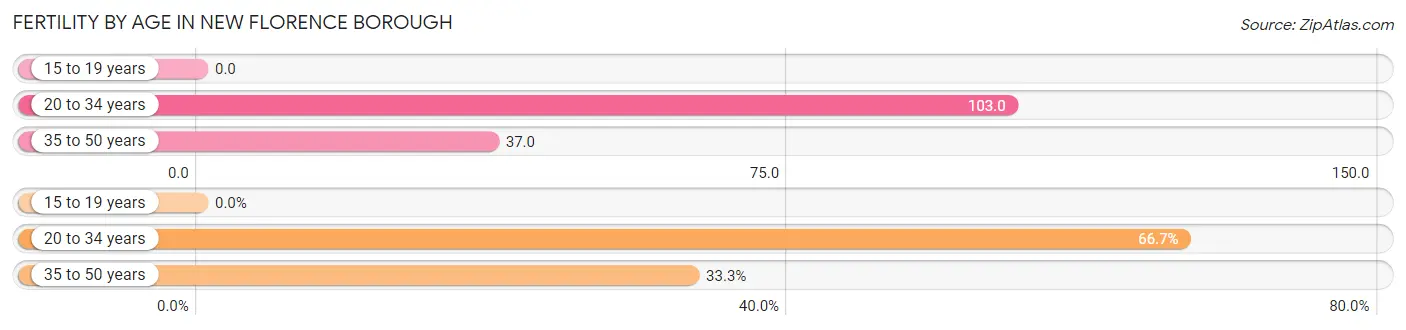
| Age Bracket | Women with Births | Births / 1,000 Women |
| 15 to 19 years | 0 (0.0%) | 0.0 |
| 20 to 34 years | 6 (66.7%) | 103.0 |
| 35 to 50 years | 3 (33.3%) | 37.0 |
| Total | 9 (100.0%) | 47.0 |
Fertility by Age by Marriage Status in New Florence borough
66.7% of women with births (9) in New Florence borough are married. The highest percentage of unmarried women with births falls into 35 to 50 years age bracket with 100.0% of them unmarried at the time of birth, while the lowest percentage of unmarried women with births belong to 20 to 34 years age bracket with 0.0% of them unmarried.
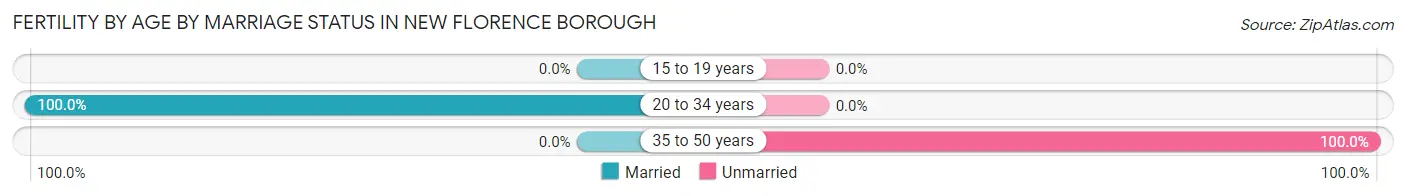
| Age Bracket | Married | Unmarried |
| 15 to 19 years | 0 (0.0%) | 0 (0.0%) |
| 20 to 34 years | 6 (100.0%) | 0 (0.0%) |
| 35 to 50 years | 0 (0.0%) | 3 (100.0%) |
| Total | 6 (66.7%) | 3 (33.3%) |
Fertility by Education in New Florence borough
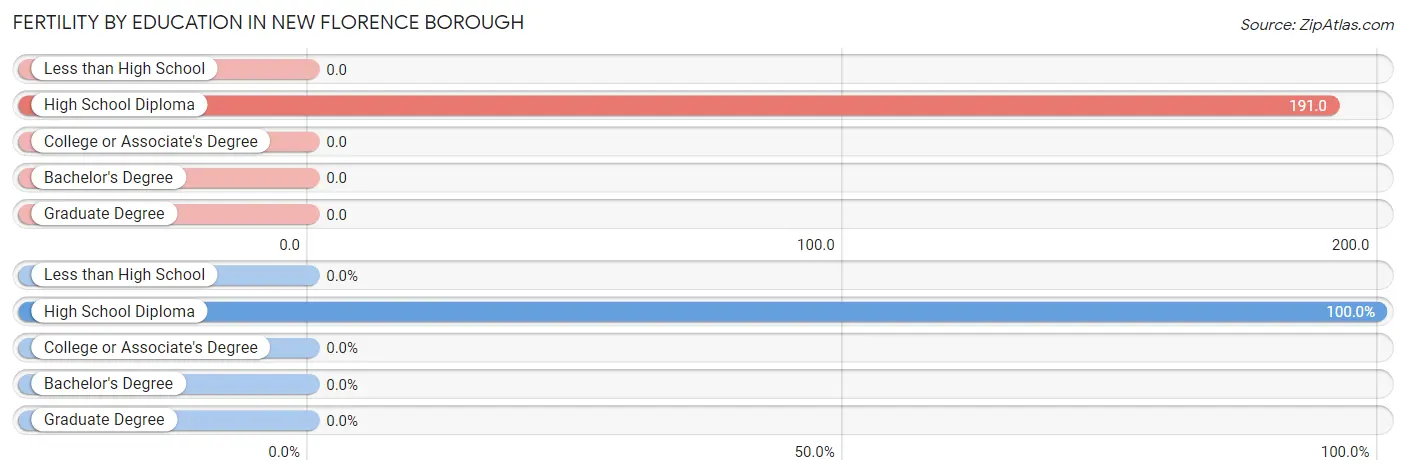
| Educational Attainment | Women with Births | Births / 1,000 Women |
| Less than High School | 0 (0.0%) | 0.0 |
| High School Diploma | 9 (100.0%) | 191.0 |
| College or Associate's Degree | 0 (0.0%) | 0.0 |
| Bachelor's Degree | 0 (0.0%) | 0.0 |
| Graduate Degree | 0 (0.0%) | 0.0 |
| Total | 9 (100.0%) | 47.0 |
Fertility by Education by Marriage Status in New Florence borough
33.3% of women with births in New Florence borough are unmarried. Women with the educational attainment of high school diploma are most likely to be married with 66.7% of them married at childbirth, while women with the educational attainment of high school diploma are least likely to be married with 33.3% of them unmarried at childbirth.
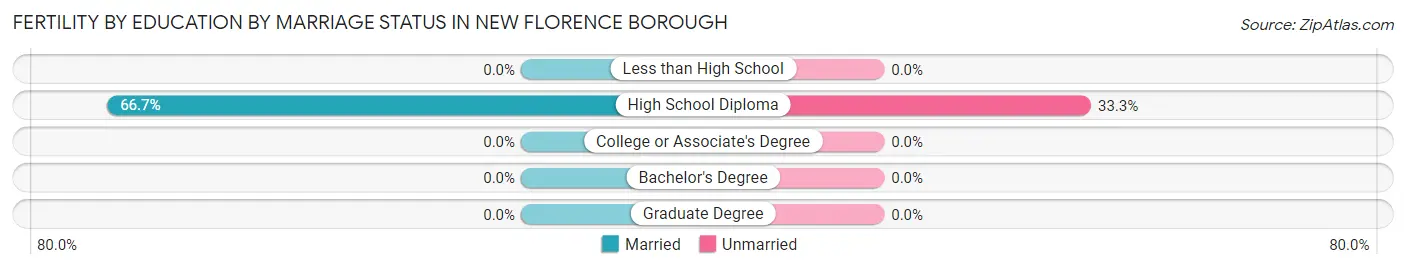
| Educational Attainment | Married | Unmarried |
| Less than High School | 0 (0.0%) | 0 (0.0%) |
| High School Diploma | 6 (66.7%) | 3 (33.3%) |
| College or Associate's Degree | 0 (0.0%) | 0 (0.0%) |
| Bachelor's Degree | 0 (0.0%) | 0 (0.0%) |
| Graduate Degree | 0 (0.0%) | 0 (0.0%) |
| Total | 6 (66.7%) | 3 (33.3%) |
Employment Characteristics in New Florence borough
Employment by Class of Employer in New Florence borough
Among the 279 employed individuals in New Florence borough, private company employees (183 | 65.6%), not-for-profit organizations (31 | 11.1%), and self-employed (not incorporated) (24 | 8.6%) make up the most common classes of employment.
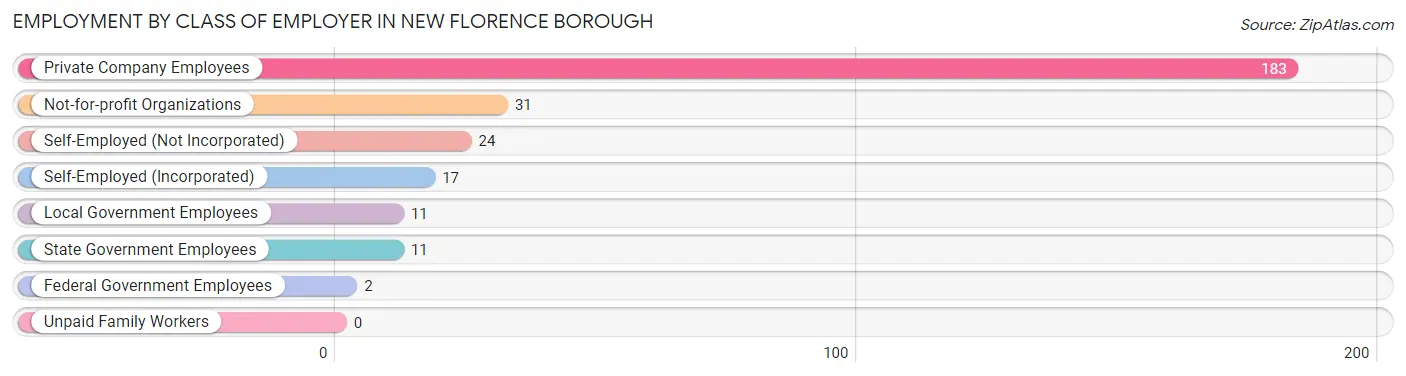
| Employer Class | # Employees | % Employees |
| Private Company Employees | 183 | 65.6% |
| Self-Employed (Incorporated) | 17 | 6.1% |
| Self-Employed (Not Incorporated) | 24 | 8.6% |
| Not-for-profit Organizations | 31 | 11.1% |
| Local Government Employees | 11 | 3.9% |
| State Government Employees | 11 | 3.9% |
| Federal Government Employees | 2 | 0.7% |
| Unpaid Family Workers | 0 | 0.0% |
| Total | 279 | 100.0% |
Employment Status by Age in New Florence borough
According to the labor force statistics for New Florence borough, out of the total population over 16 years of age (582), 55.5% or 323 individuals are in the labor force, with 10.2% or 33 of them unemployed. The age group with the highest labor force participation rate is 45 to 54 years, with 94.8% or 73 individuals in the labor force. Within the labor force, the 16 to 19 years age range has the highest percentage of unemployed individuals, with 22.2% or 2 of them being unemployed.
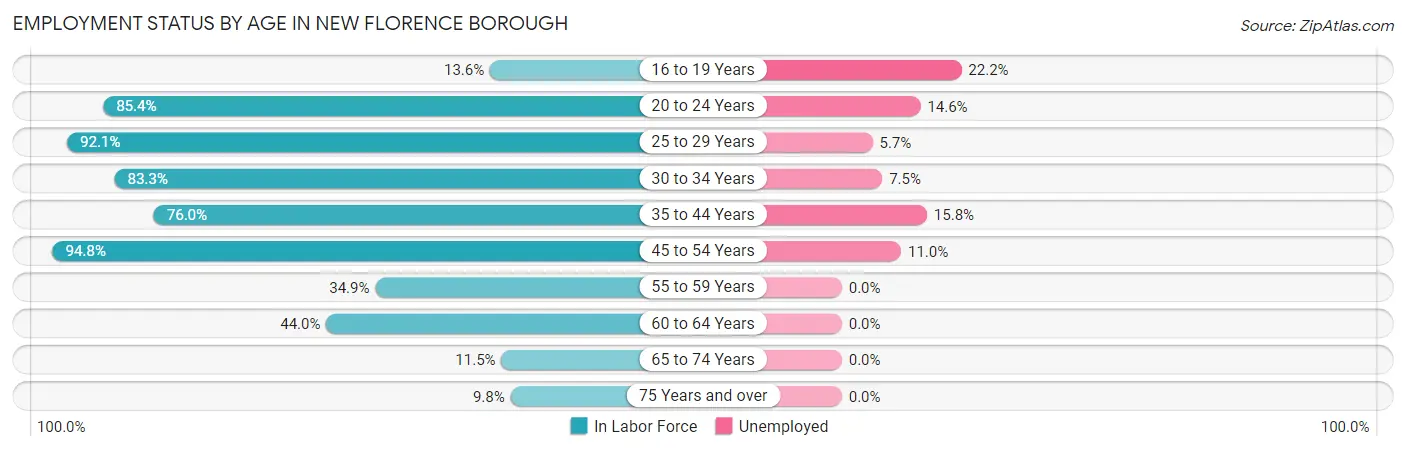
| Age Bracket | In Labor Force | Unemployed |
| 16 to 19 Years | 9 (13.6%) | 2 (22.2%) |
| 20 to 24 Years | 41 (85.4%) | 6 (14.6%) |
| 25 to 29 Years | 35 (92.1%) | 2 (5.7%) |
| 30 to 34 Years | 40 (83.3%) | 3 (7.5%) |
| 35 to 44 Years | 76 (76.0%) | 12 (15.8%) |
| 45 to 54 Years | 73 (94.8%) | 8 (11.0%) |
| 55 to 59 Years | 15 (34.9%) | 0 (0.0%) |
| 60 to 64 Years | 22 (44.0%) | 0 (0.0%) |
| 65 to 74 Years | 7 (11.5%) | 0 (0.0%) |
| 75 Years and over | 5 (9.8%) | 0 (0.0%) |
| Total | 323 (55.5%) | 33 (10.2%) |
Employment Status by Educational Attainment in New Florence borough
According to labor force statistics for New Florence borough, 73.3% of individuals (261) out of the total population between 25 and 64 years of age (356) are in the labor force, with 9.6% or 25 of them being unemployed. The group with the highest labor force participation rate are those with the educational attainment of bachelor's degree or higher, with 89.1% or 41 individuals in the labor force. Within the labor force, individuals with bachelor's degree or higher education have the highest percentage of unemployment, with 22.0% or 9 of them being unemployed.
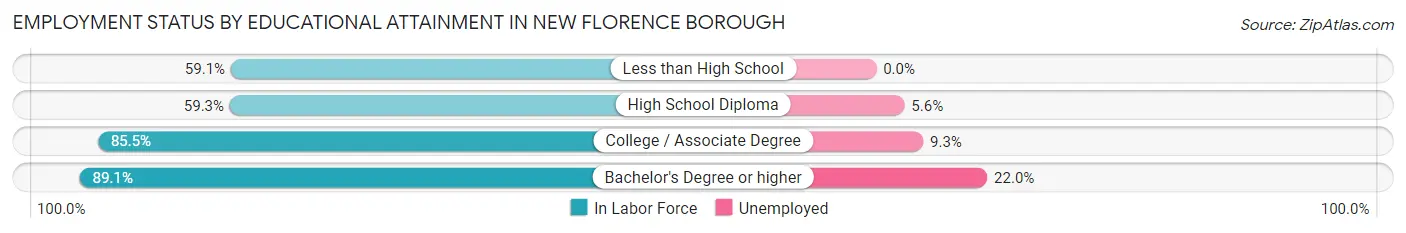
| Educational Attainment | In Labor Force | Unemployed |
| Less than High School | 13 (59.1%) | 0 (0.0%) |
| High School Diploma | 89 (59.3%) | 8 (5.6%) |
| College / Associate Degree | 118 (85.5%) | 13 (9.3%) |
| Bachelor's Degree or higher | 41 (89.1%) | 10 (22.0%) |
| Total | 261 (73.3%) | 34 (9.6%) |
Employment Occupations by Sex in New Florence borough
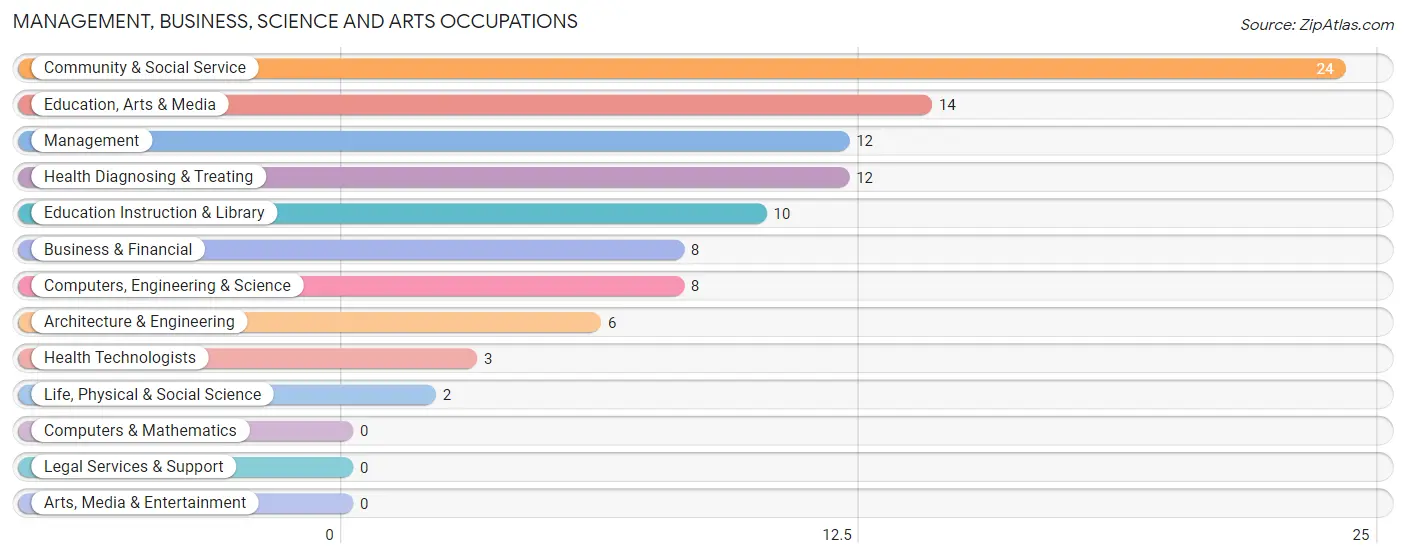
Management, Business, Science and Arts Occupations
The most common Management, Business, Science and Arts occupations in New Florence borough are Community & Social Service (24 | 8.3%), Education, Arts & Media (14 | 4.8%), Management (12 | 4.1%), Health Diagnosing & Treating (12 | 4.1%), and Education Instruction & Library (10 | 3.5%).
Management, Business, Science and Arts Occupations by Sex
Within the Management, Business, Science and Arts occupations in New Florence borough, the most male-oriented occupations are Architecture & Engineering (100.0%), Management (83.3%), and Business & Financial (75.0%), while the most female-oriented occupations are Life, Physical & Social Science (100.0%), Health Diagnosing & Treating (100.0%), and Health Technologists (100.0%).
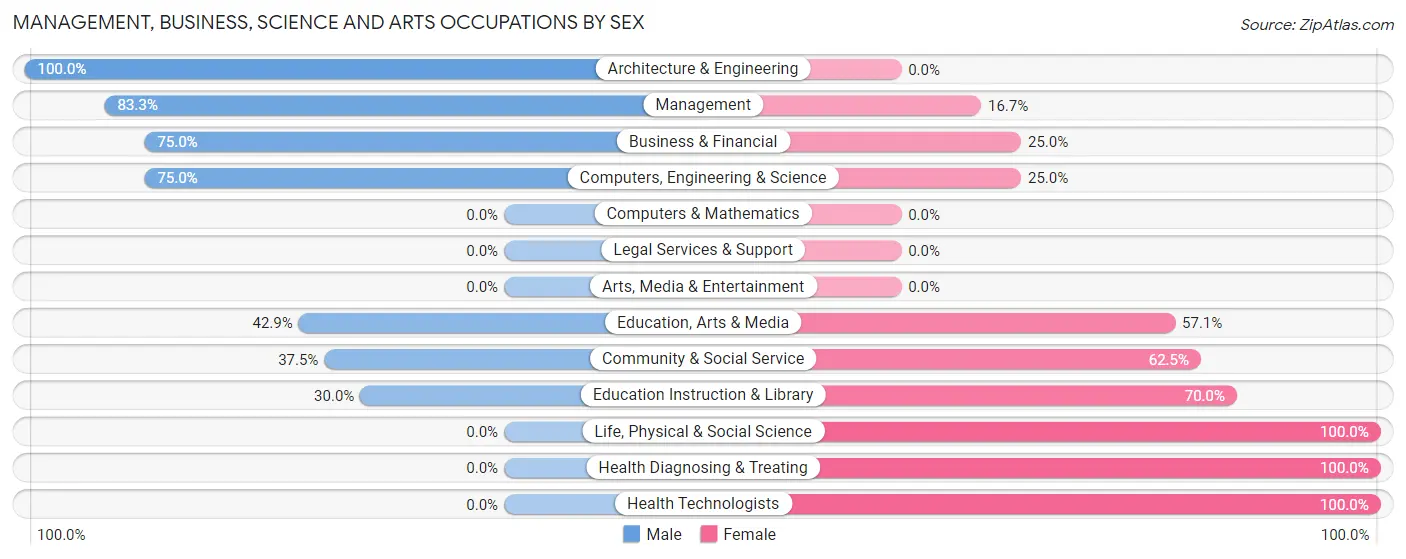
| Occupation | Male | Female |
| Management | 10 (83.3%) | 2 (16.7%) |
| Business & Financial | 6 (75.0%) | 2 (25.0%) |
| Computers, Engineering & Science | 6 (75.0%) | 2 (25.0%) |
| Computers & Mathematics | 0 (0.0%) | 0 (0.0%) |
| Architecture & Engineering | 6 (100.0%) | 0 (0.0%) |
| Life, Physical & Social Science | 0 (0.0%) | 2 (100.0%) |
| Community & Social Service | 9 (37.5%) | 15 (62.5%) |
| Education, Arts & Media | 6 (42.9%) | 8 (57.1%) |
| Legal Services & Support | 0 (0.0%) | 0 (0.0%) |
| Education Instruction & Library | 3 (30.0%) | 7 (70.0%) |
| Arts, Media & Entertainment | 0 (0.0%) | 0 (0.0%) |
| Health Diagnosing & Treating | 0 (0.0%) | 12 (100.0%) |
| Health Technologists | 0 (0.0%) | 3 (100.0%) |
| Total (Category) | 31 (48.4%) | 33 (51.6%) |
| Total (Overall) | 160 (55.2%) | 130 (44.8%) |
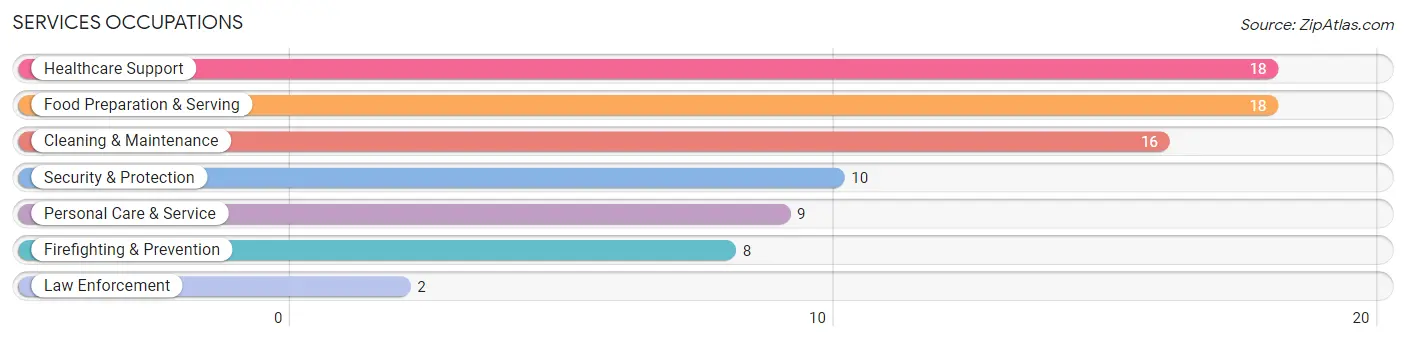
Services Occupations
The most common Services occupations in New Florence borough are Healthcare Support (18 | 6.2%), Food Preparation & Serving (18 | 6.2%), Cleaning & Maintenance (16 | 5.5%), Security & Protection (10 | 3.5%), and Personal Care & Service (9 | 3.1%).
Services Occupations by Sex
Within the Services occupations in New Florence borough, the most male-oriented occupations are Security & Protection (100.0%), Firefighting & Prevention (100.0%), and Law Enforcement (100.0%), while the most female-oriented occupations are Healthcare Support (100.0%), Personal Care & Service (100.0%), and Cleaning & Maintenance (56.2%).
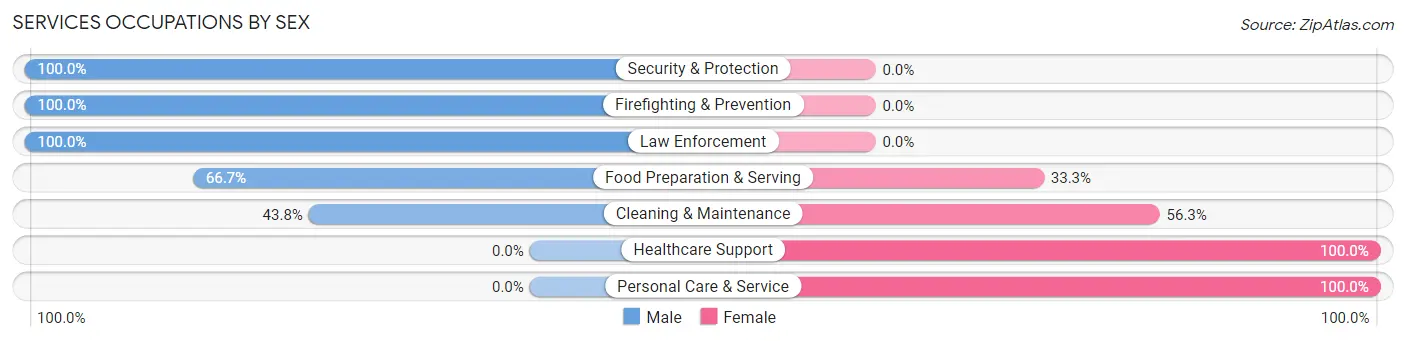
| Occupation | Male | Female |
| Healthcare Support | 0 (0.0%) | 18 (100.0%) |
| Security & Protection | 10 (100.0%) | 0 (0.0%) |
| Firefighting & Prevention | 8 (100.0%) | 0 (0.0%) |
| Law Enforcement | 2 (100.0%) | 0 (0.0%) |
| Food Preparation & Serving | 12 (66.7%) | 6 (33.3%) |
| Cleaning & Maintenance | 7 (43.8%) | 9 (56.2%) |
| Personal Care & Service | 0 (0.0%) | 9 (100.0%) |
| Total (Category) | 29 (40.8%) | 42 (59.2%) |
| Total (Overall) | 160 (55.2%) | 130 (44.8%) |
Sales and Office Occupations
The most common Sales and Office occupations in New Florence borough are Sales & Related (34 | 11.7%), and Office & Administration (18 | 6.2%).

Sales and Office Occupations by Sex

| Occupation | Male | Female |
| Sales & Related | 15 (44.1%) | 19 (55.9%) |
| Office & Administration | 0 (0.0%) | 18 (100.0%) |
| Total (Category) | 15 (28.8%) | 37 (71.2%) |
| Total (Overall) | 160 (55.2%) | 130 (44.8%) |
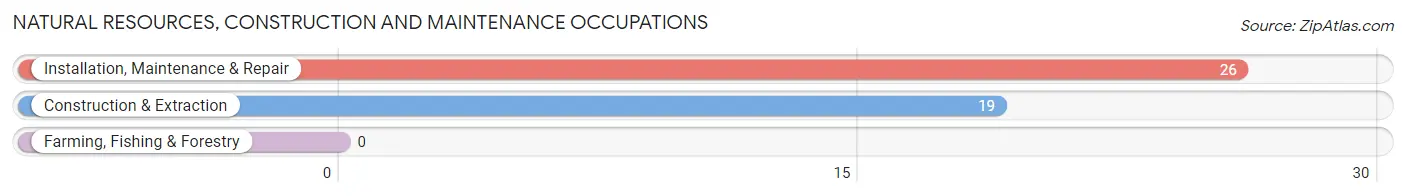
Natural Resources, Construction and Maintenance Occupations
The most common Natural Resources, Construction and Maintenance occupations in New Florence borough are Installation, Maintenance & Repair (26 | 9.0%), and Construction & Extraction (19 | 6.6%).
Natural Resources, Construction and Maintenance Occupations by Sex

| Occupation | Male | Female |
| Farming, Fishing & Forestry | 0 (0.0%) | 0 (0.0%) |
| Construction & Extraction | 19 (100.0%) | 0 (0.0%) |
| Installation, Maintenance & Repair | 24 (92.3%) | 2 (7.7%) |
| Total (Category) | 43 (95.6%) | 2 (4.4%) |
| Total (Overall) | 160 (55.2%) | 130 (44.8%) |
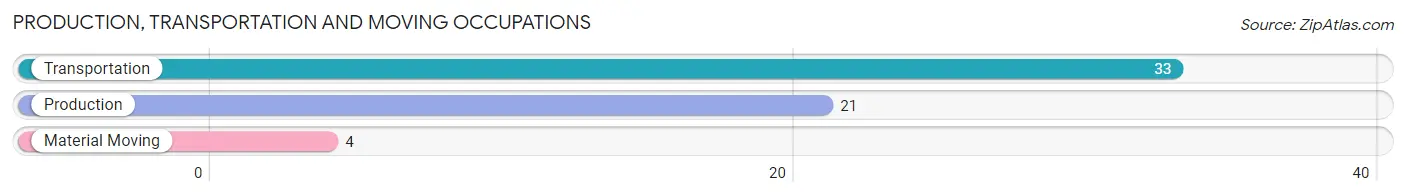
Production, Transportation and Moving Occupations
The most common Production, Transportation and Moving occupations in New Florence borough are Transportation (33 | 11.4%), Production (21 | 7.2%), and Material Moving (4 | 1.4%).
Production, Transportation and Moving Occupations by Sex
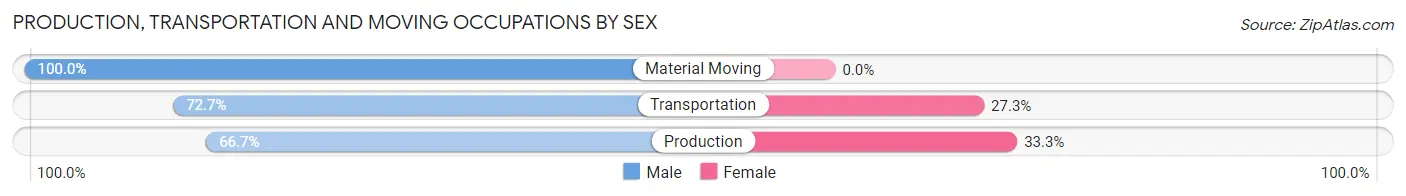
| Occupation | Male | Female |
| Production | 14 (66.7%) | 7 (33.3%) |
| Transportation | 24 (72.7%) | 9 (27.3%) |
| Material Moving | 4 (100.0%) | 0 (0.0%) |
| Total (Category) | 42 (72.4%) | 16 (27.6%) |
| Total (Overall) | 160 (55.2%) | 130 (44.8%) |
Employment Industries by Sex in New Florence borough
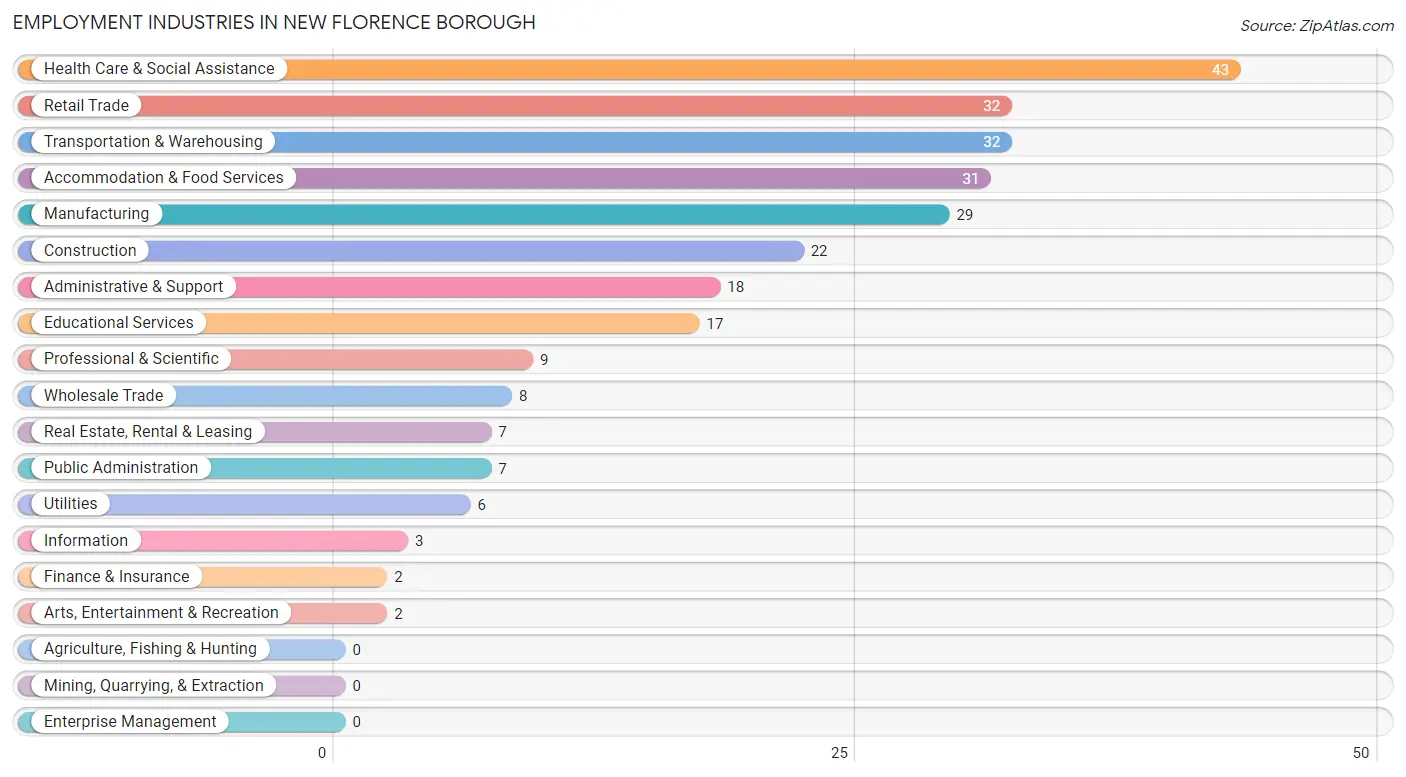
Employment Industries in New Florence borough
The major employment industries in New Florence borough include Health Care & Social Assistance (43 | 14.8%), Retail Trade (32 | 11.0%), Transportation & Warehousing (32 | 11.0%), Accommodation & Food Services (31 | 10.7%), and Manufacturing (29 | 10.0%).
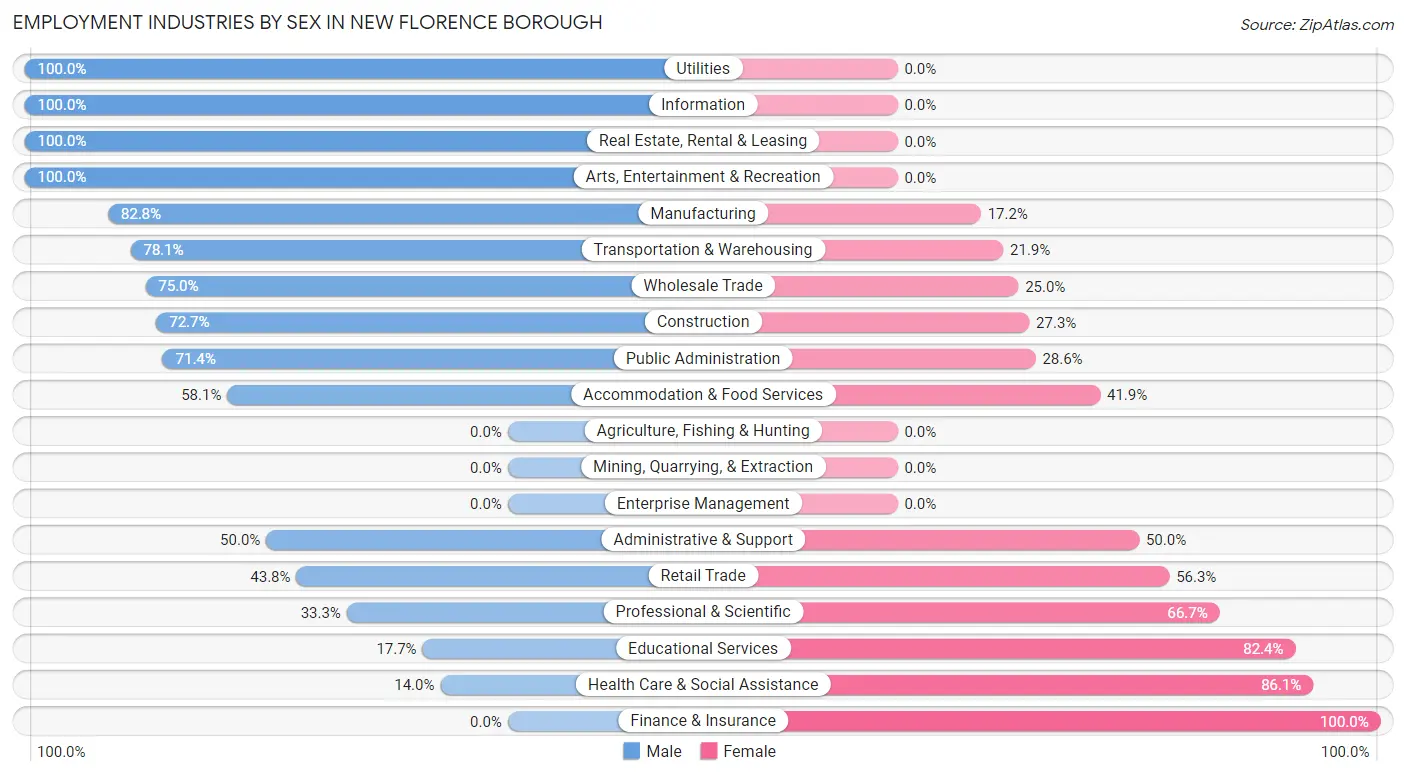
Employment Industries by Sex in New Florence borough
The New Florence borough industries that see more men than women are Utilities (100.0%), Information (100.0%), and Real Estate, Rental & Leasing (100.0%), whereas the industries that tend to have a higher number of women are Finance & Insurance (100.0%), Health Care & Social Assistance (86.1%), and Educational Services (82.4%).
| Industry | Male | Female |
| Agriculture, Fishing & Hunting | 0 (0.0%) | 0 (0.0%) |
| Mining, Quarrying, & Extraction | 0 (0.0%) | 0 (0.0%) |
| Construction | 16 (72.7%) | 6 (27.3%) |
| Manufacturing | 24 (82.8%) | 5 (17.2%) |
| Wholesale Trade | 6 (75.0%) | 2 (25.0%) |
| Retail Trade | 14 (43.8%) | 18 (56.2%) |
| Transportation & Warehousing | 25 (78.1%) | 7 (21.9%) |
| Utilities | 6 (100.0%) | 0 (0.0%) |
| Information | 3 (100.0%) | 0 (0.0%) |
| Finance & Insurance | 0 (0.0%) | 2 (100.0%) |
| Real Estate, Rental & Leasing | 7 (100.0%) | 0 (0.0%) |
| Professional & Scientific | 3 (33.3%) | 6 (66.7%) |
| Enterprise Management | 0 (0.0%) | 0 (0.0%) |
| Administrative & Support | 9 (50.0%) | 9 (50.0%) |
| Educational Services | 3 (17.6%) | 14 (82.4%) |
| Health Care & Social Assistance | 6 (14.0%) | 37 (86.1%) |
| Arts, Entertainment & Recreation | 2 (100.0%) | 0 (0.0%) |
| Accommodation & Food Services | 18 (58.1%) | 13 (41.9%) |
| Public Administration | 5 (71.4%) | 2 (28.6%) |
| Total | 160 (55.2%) | 130 (44.8%) |
Education in New Florence borough
School Enrollment in New Florence borough
The most common levels of schooling among the 168 students in New Florence borough are high school (63 | 37.5%), middle school (38 | 22.6%), and college / undergraduate (32 | 19.1%).
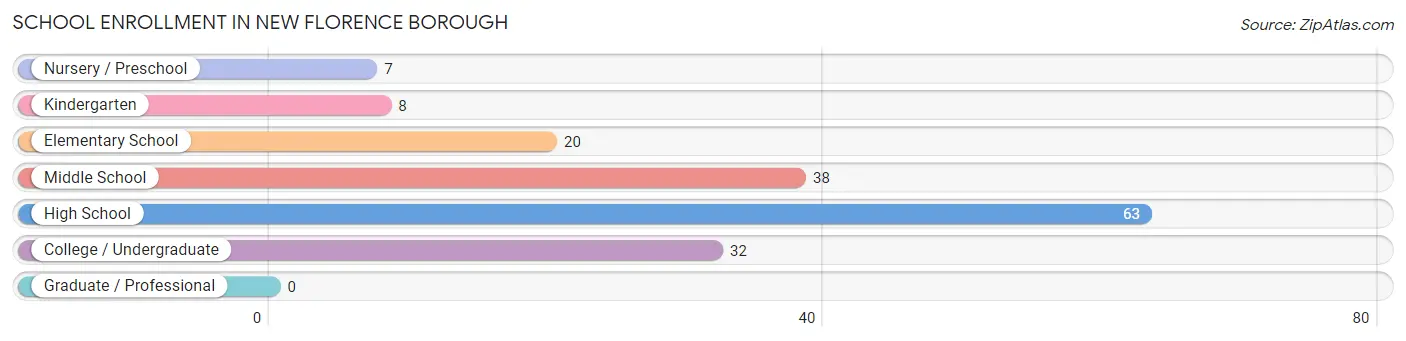
| School Level | # Students | % Students |
| Nursery / Preschool | 7 | 4.2% |
| Kindergarten | 8 | 4.8% |
| Elementary School | 20 | 11.9% |
| Middle School | 38 | 22.6% |
| High School | 63 | 37.5% |
| College / Undergraduate | 32 | 19.1% |
| Graduate / Professional | 0 | 0.0% |
| Total | 168 | 100.0% |
School Enrollment by Age by Funding Source in New Florence borough
Out of a total of 168 students who are enrolled in schools in New Florence borough, 12 (7.1%) attend a private institution, while the remaining 156 (92.9%) are enrolled in public schools. The age group of 35 years and over has the highest likelihood of being enrolled in private schools, with 9 (47.4% in the age bracket) enrolled. Conversely, the age group of 3 to 4 year olds has the lowest likelihood of being enrolled in a private school, with 7 (100.0% in the age bracket) attending a public institution.
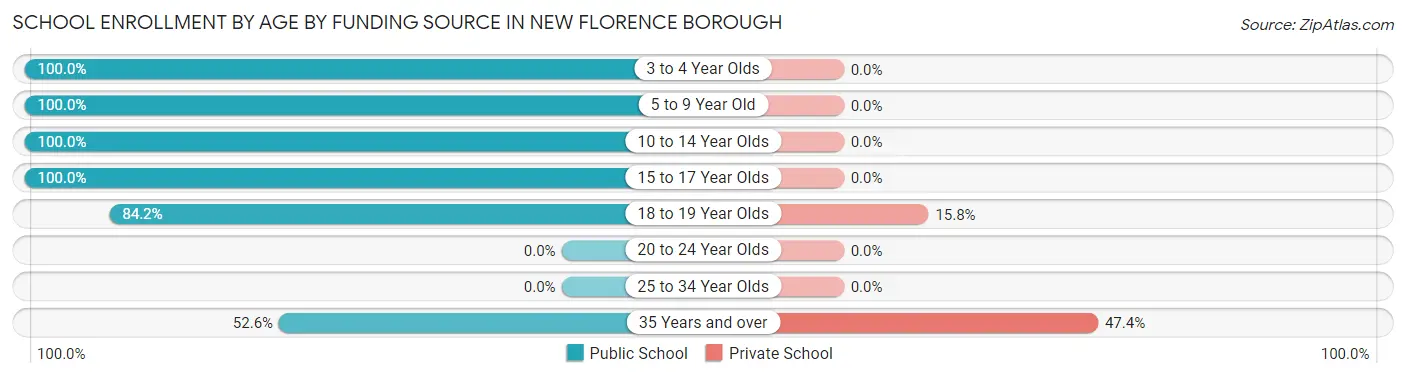
| Age Bracket | Public School | Private School |
| 3 to 4 Year Olds | 7 (100.0%) | 0 (0.0%) |
| 5 to 9 Year Old | 23 (100.0%) | 0 (0.0%) |
| 10 to 14 Year Olds | 60 (100.0%) | 0 (0.0%) |
| 15 to 17 Year Olds | 40 (100.0%) | 0 (0.0%) |
| 18 to 19 Year Olds | 16 (84.2%) | 3 (15.8%) |
| 20 to 24 Year Olds | 0 (0.0%) | 0 (0.0%) |
| 25 to 34 Year Olds | 0 (0.0%) | 0 (0.0%) |
| 35 Years and over | 10 (52.6%) | 9 (47.4%) |
| Total | 156 (92.9%) | 12 (7.1%) |
Educational Attainment by Field of Study in New Florence borough
Education (26 | 33.8%), science & technology (15 | 19.5%), engineering (10 | 13.0%), liberal arts & history (8 | 10.4%), and psychology (4 | 5.2%) are the most common fields of study among 77 individuals in New Florence borough who have obtained a bachelor's degree or higher.
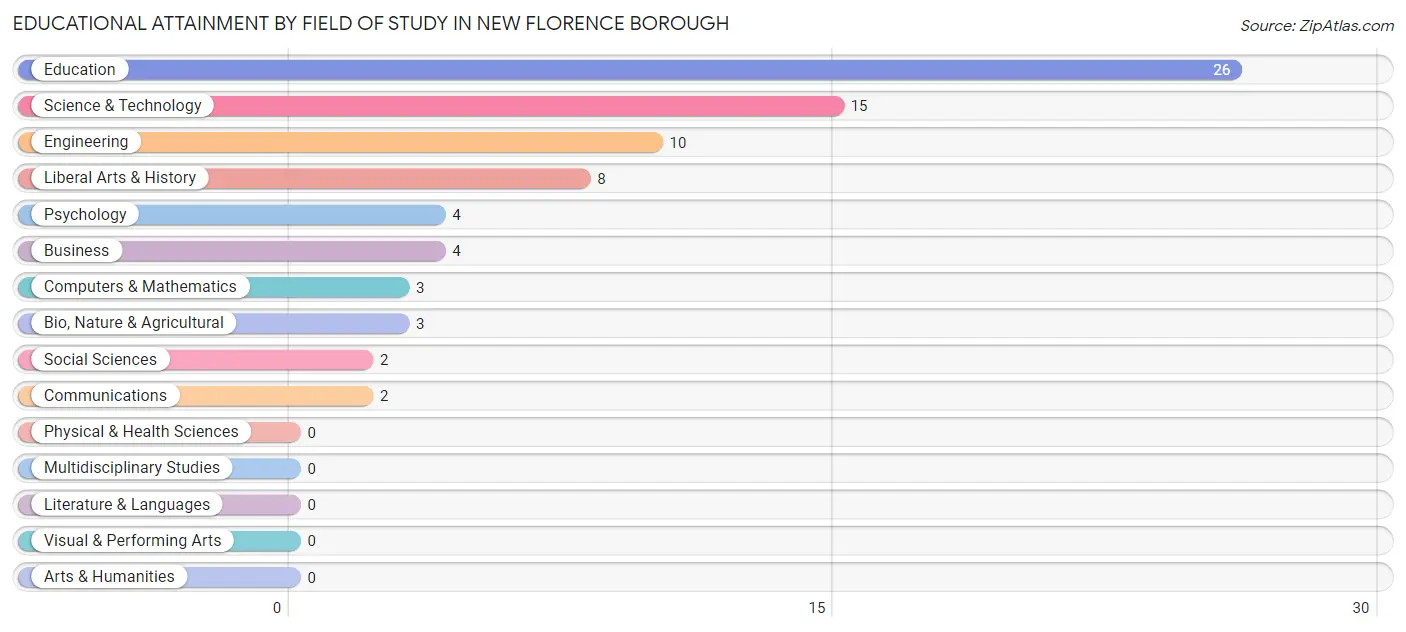
| Field of Study | # Graduates | % Graduates |
| Computers & Mathematics | 3 | 3.9% |
| Bio, Nature & Agricultural | 3 | 3.9% |
| Physical & Health Sciences | 0 | 0.0% |
| Psychology | 4 | 5.2% |
| Social Sciences | 2 | 2.6% |
| Engineering | 10 | 13.0% |
| Multidisciplinary Studies | 0 | 0.0% |
| Science & Technology | 15 | 19.5% |
| Business | 4 | 5.2% |
| Education | 26 | 33.8% |
| Literature & Languages | 0 | 0.0% |
| Liberal Arts & History | 8 | 10.4% |
| Visual & Performing Arts | 0 | 0.0% |
| Communications | 2 | 2.6% |
| Arts & Humanities | 0 | 0.0% |
| Total | 77 | 100.0% |
Transportation & Commute in New Florence borough
Vehicle Availability by Sex in New Florence borough
The most prevalent vehicle ownership categories in New Florence borough are males with 2 vehicles (58, accounting for 36.2%) and females with 2 vehicles (53, making up 48.7%).
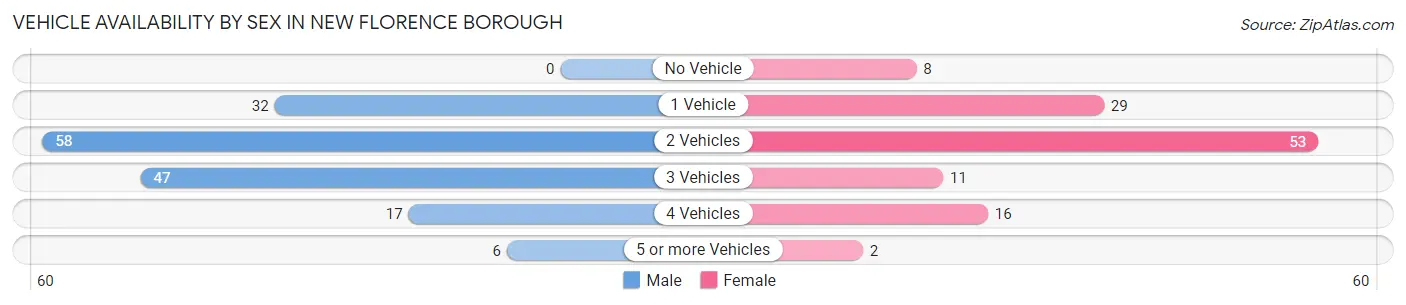
| Vehicles Available | Male | Female |
| No Vehicle | 0 (0.0%) | 8 (6.7%) |
| 1 Vehicle | 32 (20.0%) | 29 (24.4%) |
| 2 Vehicles | 58 (36.2%) | 53 (44.5%) |
| 3 Vehicles | 47 (29.4%) | 11 (9.2%) |
| 4 Vehicles | 17 (10.6%) | 16 (13.5%) |
| 5 or more Vehicles | 6 (3.7%) | 2 (1.7%) |
| Total | 160 (100.0%) | 119 (100.0%) |
Commute Time in New Florence borough
The most frequently occuring commute durations in New Florence borough are 30 to 34 minutes (46 commuters, 16.9%), 20 to 24 minutes (38 commuters, 13.9%), and 25 to 29 minutes (26 commuters, 9.5%).
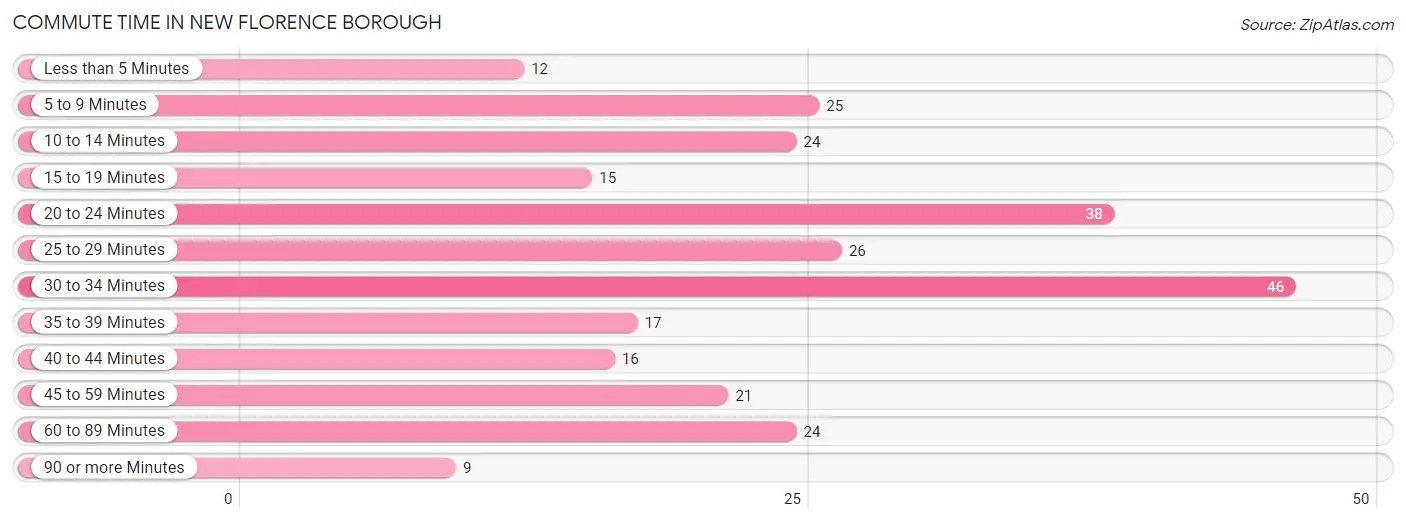
| Commute Time | # Commuters | % Commuters |
| Less than 5 Minutes | 12 | 4.4% |
| 5 to 9 Minutes | 25 | 9.2% |
| 10 to 14 Minutes | 24 | 8.8% |
| 15 to 19 Minutes | 15 | 5.5% |
| 20 to 24 Minutes | 38 | 13.9% |
| 25 to 29 Minutes | 26 | 9.5% |
| 30 to 34 Minutes | 46 | 16.9% |
| 35 to 39 Minutes | 17 | 6.2% |
| 40 to 44 Minutes | 16 | 5.9% |
| 45 to 59 Minutes | 21 | 7.7% |
| 60 to 89 Minutes | 24 | 8.8% |
| 90 or more Minutes | 9 | 3.3% |
Commute Time by Sex in New Florence borough
The most common commute times in New Florence borough are 30 to 34 minutes (26 commuters, 16.6%) for males and 30 to 34 minutes (20 commuters, 17.2%) for females.
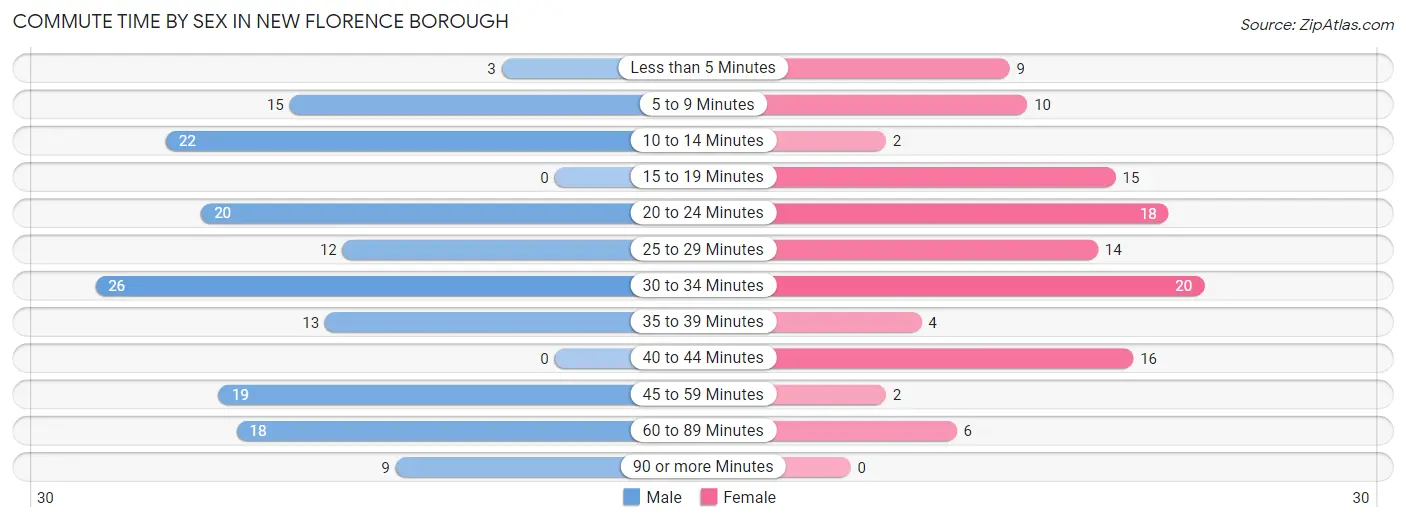
| Commute Time | Male | Female |
| Less than 5 Minutes | 3 (1.9%) | 9 (7.8%) |
| 5 to 9 Minutes | 15 (9.6%) | 10 (8.6%) |
| 10 to 14 Minutes | 22 (14.0%) | 2 (1.7%) |
| 15 to 19 Minutes | 0 (0.0%) | 15 (12.9%) |
| 20 to 24 Minutes | 20 (12.7%) | 18 (15.5%) |
| 25 to 29 Minutes | 12 (7.6%) | 14 (12.1%) |
| 30 to 34 Minutes | 26 (16.6%) | 20 (17.2%) |
| 35 to 39 Minutes | 13 (8.3%) | 4 (3.5%) |
| 40 to 44 Minutes | 0 (0.0%) | 16 (13.8%) |
| 45 to 59 Minutes | 19 (12.1%) | 2 (1.7%) |
| 60 to 89 Minutes | 18 (11.5%) | 6 (5.2%) |
| 90 or more Minutes | 9 (5.7%) | 0 (0.0%) |
Time of Departure to Work by Sex in New Florence borough
The most frequent times of departure to work in New Florence borough are 4:00 PM to 11:59 PM (25, 15.9%) for males and 6:00 AM to 6:29 AM (42, 36.2%) for females.
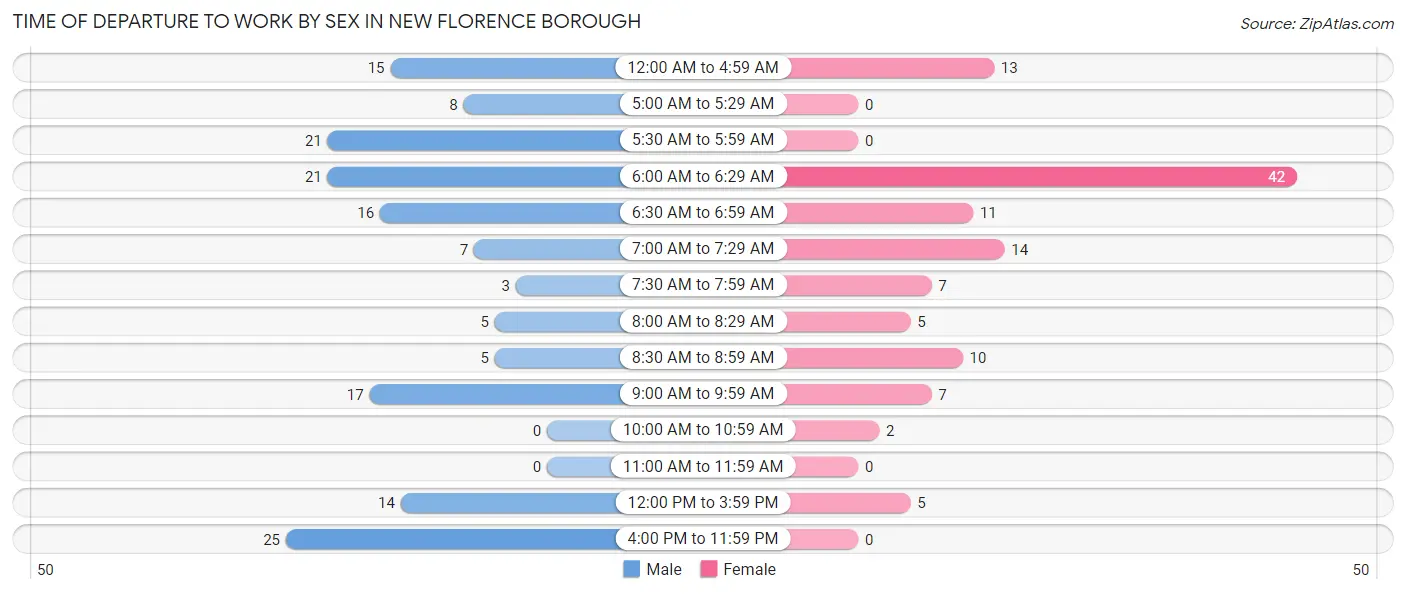
| Time of Departure | Male | Female |
| 12:00 AM to 4:59 AM | 15 (9.6%) | 13 (11.2%) |
| 5:00 AM to 5:29 AM | 8 (5.1%) | 0 (0.0%) |
| 5:30 AM to 5:59 AM | 21 (13.4%) | 0 (0.0%) |
| 6:00 AM to 6:29 AM | 21 (13.4%) | 42 (36.2%) |
| 6:30 AM to 6:59 AM | 16 (10.2%) | 11 (9.5%) |
| 7:00 AM to 7:29 AM | 7 (4.5%) | 14 (12.1%) |
| 7:30 AM to 7:59 AM | 3 (1.9%) | 7 (6.0%) |
| 8:00 AM to 8:29 AM | 5 (3.2%) | 5 (4.3%) |
| 8:30 AM to 8:59 AM | 5 (3.2%) | 10 (8.6%) |
| 9:00 AM to 9:59 AM | 17 (10.8%) | 7 (6.0%) |
| 10:00 AM to 10:59 AM | 0 (0.0%) | 2 (1.7%) |
| 11:00 AM to 11:59 AM | 0 (0.0%) | 0 (0.0%) |
| 12:00 PM to 3:59 PM | 14 (8.9%) | 5 (4.3%) |
| 4:00 PM to 11:59 PM | 25 (15.9%) | 0 (0.0%) |
| Total | 157 (100.0%) | 116 (100.0%) |
Housing Occupancy in New Florence borough
Occupancy by Ownership in New Florence borough
Of the total 280 dwellings in New Florence borough, owner-occupied units account for 208 (74.3%), while renter-occupied units make up 72 (25.7%).
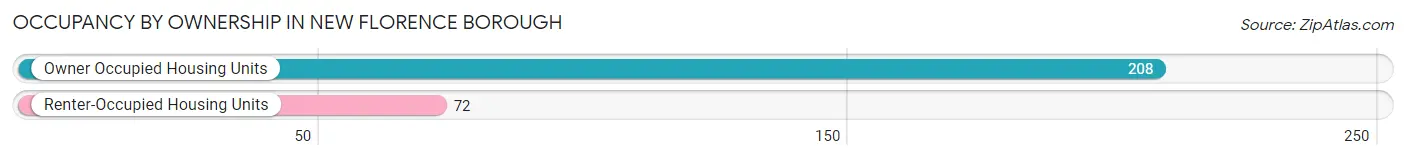
| Occupancy | # Housing Units | % Housing Units |
| Owner Occupied Housing Units | 208 | 74.3% |
| Renter-Occupied Housing Units | 72 | 25.7% |
| Total Occupied Housing Units | 280 | 100.0% |
Occupancy by Household Size in New Florence borough
| Household Size | # Housing Units | % Housing Units |
| 1-Person Household | 75 | 26.8% |
| 2-Person Household | 109 | 38.9% |
| 3-Person Household | 46 | 16.4% |
| 4+ Person Household | 50 | 17.9% |
| Total Housing Units | 280 | 100.0% |
Occupancy by Ownership by Household Size in New Florence borough
| Household Size | Owner-occupied | Renter-occupied |
| 1-Person Household | 51 (68.0%) | 24 (32.0%) |
| 2-Person Household | 87 (79.8%) | 22 (20.2%) |
| 3-Person Household | 35 (76.1%) | 11 (23.9%) |
| 4+ Person Household | 35 (70.0%) | 15 (30.0%) |
| Total Housing Units | 208 (74.3%) | 72 (25.7%) |
Occupancy by Educational Attainment in New Florence borough
| Household Size | Owner-occupied | Renter-occupied |
| Less than High School | 10 (41.7%) | 14 (58.3%) |
| High School Diploma | 91 (79.1%) | 24 (20.9%) |
| College/Associate Degree | 70 (73.7%) | 25 (26.3%) |
| Bachelor's Degree or higher | 37 (80.4%) | 9 (19.6%) |
Occupancy by Age of Householder in New Florence borough
| Age Bracket | # Households | % Households |
| Under 35 Years | 59 | 21.1% |
| 35 to 44 Years | 40 | 14.3% |
| 45 to 54 Years | 45 | 16.1% |
| 55 to 64 Years | 49 | 17.5% |
| 65 to 74 Years | 45 | 16.1% |
| 75 to 84 Years | 21 | 7.5% |
| 85 Years and Over | 21 | 7.5% |
| Total | 280 | 100.0% |
Housing Finances in New Florence borough
Median Income by Occupancy in New Florence borough
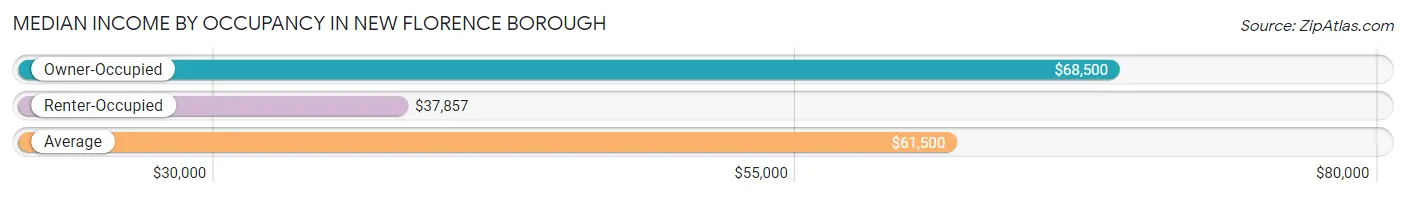
| Occupancy Type | # Households | Median Income |
| Owner-Occupied | 208 (74.3%) | $68,500 |
| Renter-Occupied | 72 (25.7%) | $37,857 |
| Average | 280 (100.0%) | $61,500 |
Occupancy by Householder Income Bracket in New Florence borough
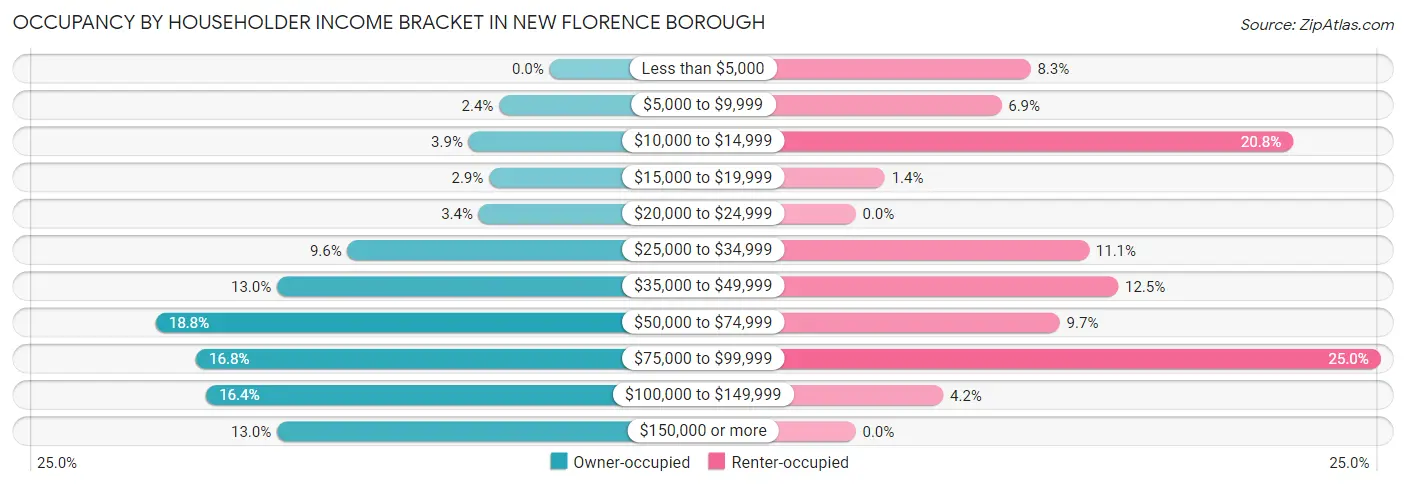
| Income Bracket | Owner-occupied | Renter-occupied |
| Less than $5,000 | 0 (0.0%) | 6 (8.3%) |
| $5,000 to $9,999 | 5 (2.4%) | 5 (6.9%) |
| $10,000 to $14,999 | 8 (3.8%) | 15 (20.8%) |
| $15,000 to $19,999 | 6 (2.9%) | 1 (1.4%) |
| $20,000 to $24,999 | 7 (3.4%) | 0 (0.0%) |
| $25,000 to $34,999 | 20 (9.6%) | 8 (11.1%) |
| $35,000 to $49,999 | 27 (13.0%) | 9 (12.5%) |
| $50,000 to $74,999 | 39 (18.8%) | 7 (9.7%) |
| $75,000 to $99,999 | 35 (16.8%) | 18 (25.0%) |
| $100,000 to $149,999 | 34 (16.4%) | 3 (4.2%) |
| $150,000 or more | 27 (13.0%) | 0 (0.0%) |
| Total | 208 (100.0%) | 72 (100.0%) |
Monthly Housing Cost Tiers in New Florence borough
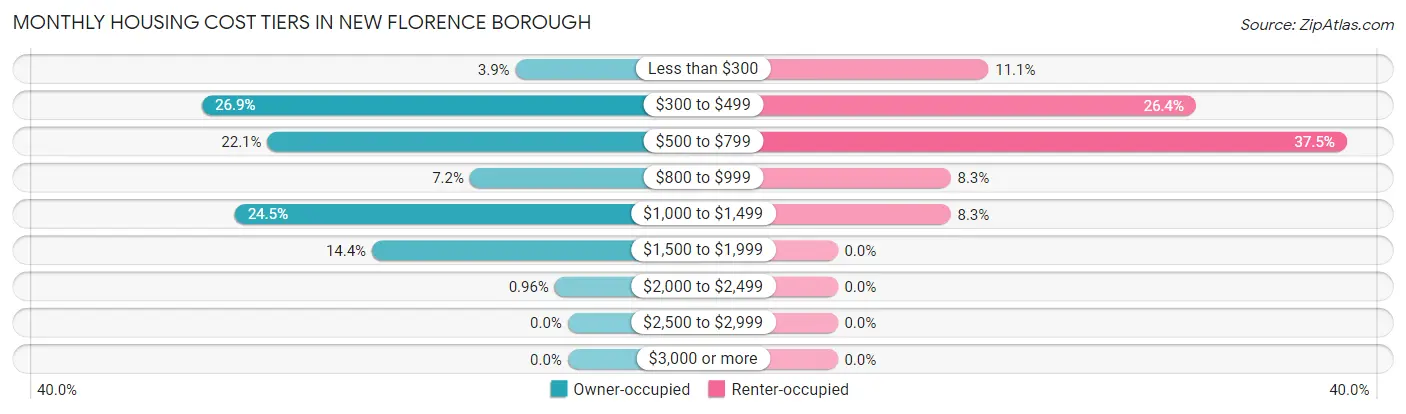
| Monthly Cost | Owner-occupied | Renter-occupied |
| Less than $300 | 8 (3.8%) | 8 (11.1%) |
| $300 to $499 | 56 (26.9%) | 19 (26.4%) |
| $500 to $799 | 46 (22.1%) | 27 (37.5%) |
| $800 to $999 | 15 (7.2%) | 6 (8.3%) |
| $1,000 to $1,499 | 51 (24.5%) | 6 (8.3%) |
| $1,500 to $1,999 | 30 (14.4%) | 0 (0.0%) |
| $2,000 to $2,499 | 2 (1.0%) | 0 (0.0%) |
| $2,500 to $2,999 | 0 (0.0%) | 0 (0.0%) |
| $3,000 or more | 0 (0.0%) | 0 (0.0%) |
| Total | 208 (100.0%) | 72 (100.0%) |
Physical Housing Characteristics in New Florence borough
Housing Structures in New Florence borough
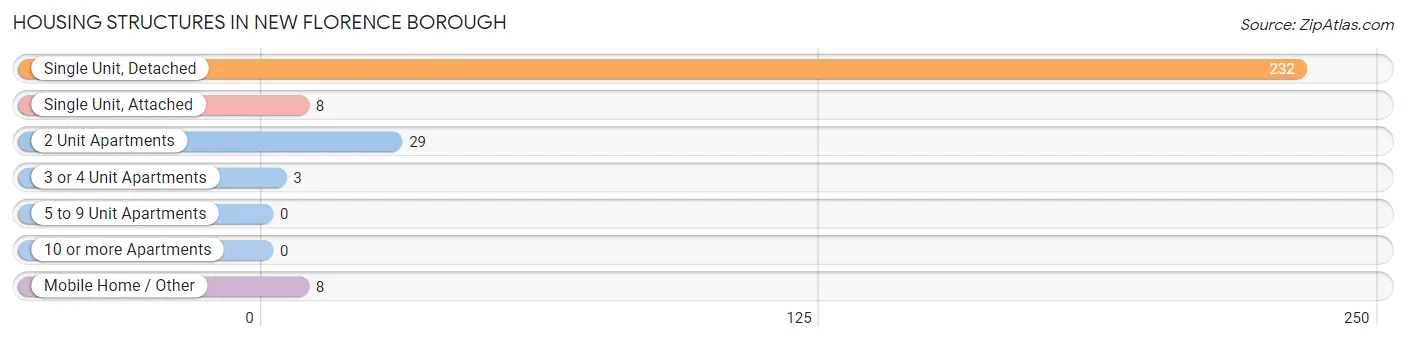
| Structure Type | # Housing Units | % Housing Units |
| Single Unit, Detached | 232 | 82.9% |
| Single Unit, Attached | 8 | 2.9% |
| 2 Unit Apartments | 29 | 10.4% |
| 3 or 4 Unit Apartments | 3 | 1.1% |
| 5 to 9 Unit Apartments | 0 | 0.0% |
| 10 or more Apartments | 0 | 0.0% |
| Mobile Home / Other | 8 | 2.9% |
| Total | 280 | 100.0% |
Housing Structures by Occupancy in New Florence borough
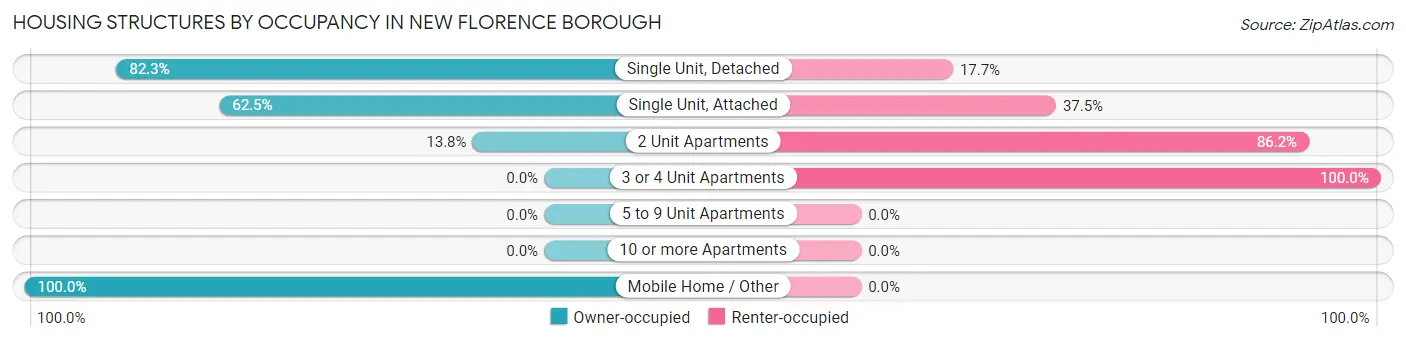
| Structure Type | Owner-occupied | Renter-occupied |
| Single Unit, Detached | 191 (82.3%) | 41 (17.7%) |
| Single Unit, Attached | 5 (62.5%) | 3 (37.5%) |
| 2 Unit Apartments | 4 (13.8%) | 25 (86.2%) |
| 3 or 4 Unit Apartments | 0 (0.0%) | 3 (100.0%) |
| 5 to 9 Unit Apartments | 0 (0.0%) | 0 (0.0%) |
| 10 or more Apartments | 0 (0.0%) | 0 (0.0%) |
| Mobile Home / Other | 8 (100.0%) | 0 (0.0%) |
| Total | 208 (74.3%) | 72 (25.7%) |
Housing Structures by Number of Rooms in New Florence borough
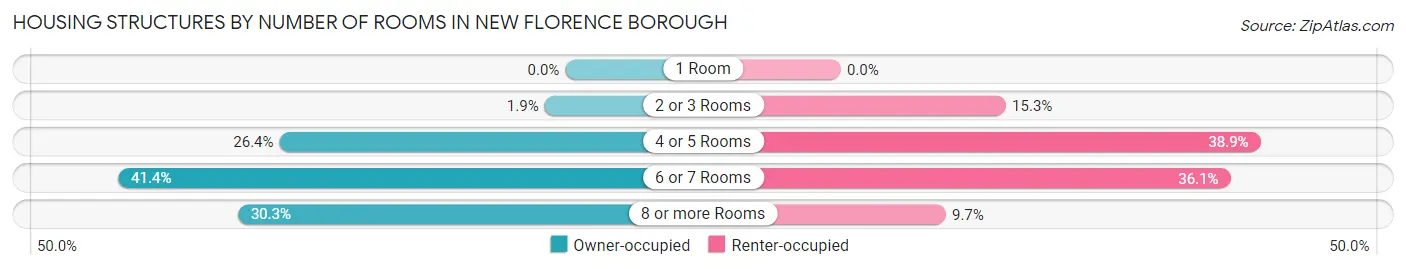
| Number of Rooms | Owner-occupied | Renter-occupied |
| 1 Room | 0 (0.0%) | 0 (0.0%) |
| 2 or 3 Rooms | 4 (1.9%) | 11 (15.3%) |
| 4 or 5 Rooms | 55 (26.4%) | 28 (38.9%) |
| 6 or 7 Rooms | 86 (41.3%) | 26 (36.1%) |
| 8 or more Rooms | 63 (30.3%) | 7 (9.7%) |
| Total | 208 (100.0%) | 72 (100.0%) |
Housing Structure by Heating Type in New Florence borough
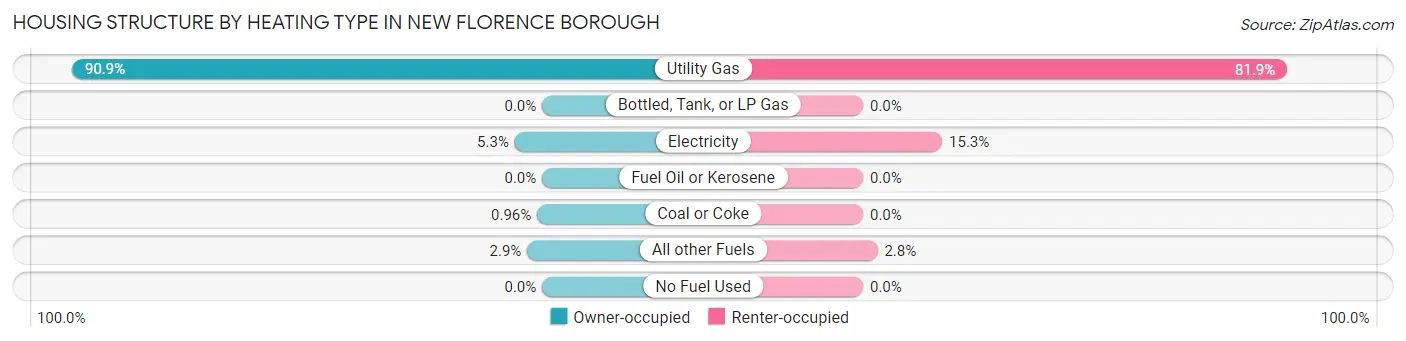
| Heating Type | Owner-occupied | Renter-occupied |
| Utility Gas | 189 (90.9%) | 59 (81.9%) |
| Bottled, Tank, or LP Gas | 0 (0.0%) | 0 (0.0%) |
| Electricity | 11 (5.3%) | 11 (15.3%) |
| Fuel Oil or Kerosene | 0 (0.0%) | 0 (0.0%) |
| Coal or Coke | 2 (1.0%) | 0 (0.0%) |
| All other Fuels | 6 (2.9%) | 2 (2.8%) |
| No Fuel Used | 0 (0.0%) | 0 (0.0%) |
| Total | 208 (100.0%) | 72 (100.0%) |
Household Vehicle Usage in New Florence borough
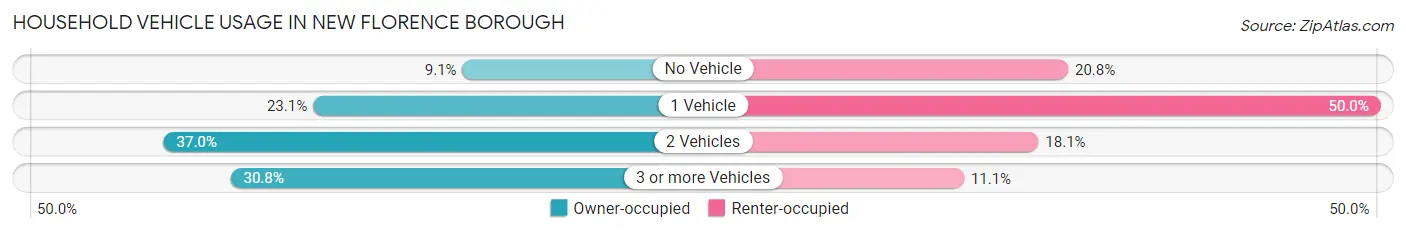
| Vehicles per Household | Owner-occupied | Renter-occupied |
| No Vehicle | 19 (9.1%) | 15 (20.8%) |
| 1 Vehicle | 48 (23.1%) | 36 (50.0%) |
| 2 Vehicles | 77 (37.0%) | 13 (18.1%) |
| 3 or more Vehicles | 64 (30.8%) | 8 (11.1%) |
| Total | 208 (100.0%) | 72 (100.0%) |
Real Estate & Mortgages in New Florence borough
Real Estate and Mortgage Overview in New Florence borough
| Characteristic | Without Mortgage | With Mortgage |
| Housing Units | 99 | 109 |
| Median Property Value | $83,200 | $123,400 |
| Median Household Income | $48,958 | $27 |
| Monthly Housing Costs | $455 | $0 |
| Real Estate Taxes | $1,295 | $0 |
Property Value by Mortgage Status in New Florence borough
| Property Value | Without Mortgage | With Mortgage |
| Less than $50,000 | 29 (29.3%) | 2 (1.8%) |
| $50,000 to $99,999 | 39 (39.4%) | 30 (27.5%) |
| $100,000 to $299,999 | 31 (31.3%) | 70 (64.2%) |
| $300,000 to $499,999 | 0 (0.0%) | 5 (4.6%) |
| $500,000 to $749,999 | 0 (0.0%) | 0 (0.0%) |
| $750,000 to $999,999 | 0 (0.0%) | 0 (0.0%) |
| $1,000,000 or more | 0 (0.0%) | 2 (1.8%) |
| Total | 99 (100.0%) | 109 (100.0%) |
Household Income by Mortgage Status in New Florence borough
| Household Income | Without Mortgage | With Mortgage |
| Less than $10,000 | 5 (5.1%) | 0 (0.0%) |
| $10,000 to $24,999 | 13 (13.1%) | 0 (0.0%) |
| $25,000 to $34,999 | 18 (18.2%) | 8 (7.3%) |
| $35,000 to $49,999 | 16 (16.2%) | 2 (1.8%) |
| $50,000 to $74,999 | 11 (11.1%) | 11 (10.1%) |
| $75,000 to $99,999 | 28 (28.3%) | 28 (25.7%) |
| $100,000 to $149,999 | 8 (8.1%) | 7 (6.4%) |
| $150,000 or more | 0 (0.0%) | 26 (23.8%) |
| Total | 99 (100.0%) | 109 (100.0%) |
Property Value to Household Income Ratio in New Florence borough
| Value-to-Income Ratio | Without Mortgage | With Mortgage |
| Less than 2.0x | 68 (68.7%) | 91,250 (83,715.6%) |
| 2.0x to 2.9x | 13 (13.1%) | 76 (69.7%) |
| 3.0x to 3.9x | 5 (5.1%) | 20 (18.3%) |
| 4.0x or more | 13 (13.1%) | 0 (0.0%) |
| Total | 99 (100.0%) | 109 (100.0%) |
Real Estate Taxes by Mortgage Status in New Florence borough
| Property Taxes | Without Mortgage | With Mortgage |
| Less than $800 | 8 (8.1%) | 0 (0.0%) |
| $800 to $1,499 | 56 (56.6%) | 4 (3.7%) |
| $800 to $1,499 | 32 (32.3%) | 21 (19.3%) |
| Total | 99 (100.0%) | 109 (100.0%) |
Health & Disability in New Florence borough
Health Insurance Coverage by Age in New Florence borough
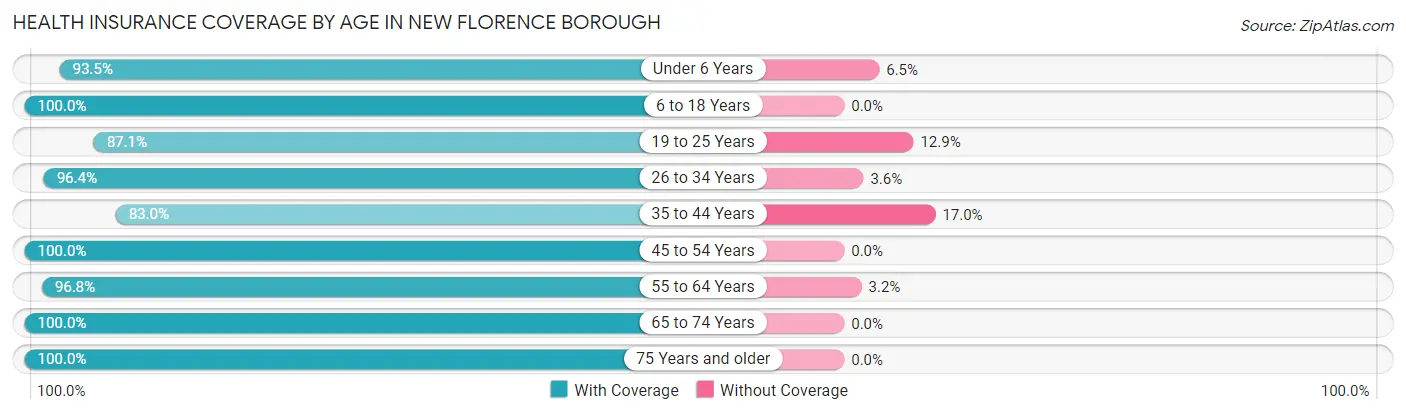
| Age Bracket | With Coverage | Without Coverage |
| Under 6 Years | 43 (93.5%) | 3 (6.5%) |
| 6 to 18 Years | 129 (100.0%) | 0 (0.0%) |
| 19 to 25 Years | 54 (87.1%) | 8 (12.9%) |
| 26 to 34 Years | 81 (96.4%) | 3 (3.6%) |
| 35 to 44 Years | 83 (83.0%) | 17 (17.0%) |
| 45 to 54 Years | 77 (100.0%) | 0 (0.0%) |
| 55 to 64 Years | 90 (96.8%) | 3 (3.2%) |
| 65 to 74 Years | 61 (100.0%) | 0 (0.0%) |
| 75 Years and older | 51 (100.0%) | 0 (0.0%) |
| Total | 669 (95.2%) | 34 (4.8%) |
Health Insurance Coverage by Citizenship Status in New Florence borough
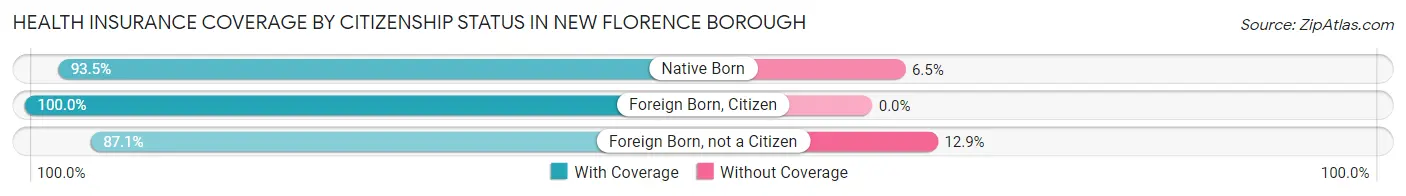
| Citizenship Status | With Coverage | Without Coverage |
| Native Born | 43 (93.5%) | 3 (6.5%) |
| Foreign Born, Citizen | 129 (100.0%) | 0 (0.0%) |
| Foreign Born, not a Citizen | 54 (87.1%) | 8 (12.9%) |
Health Insurance Coverage by Household Income in New Florence borough
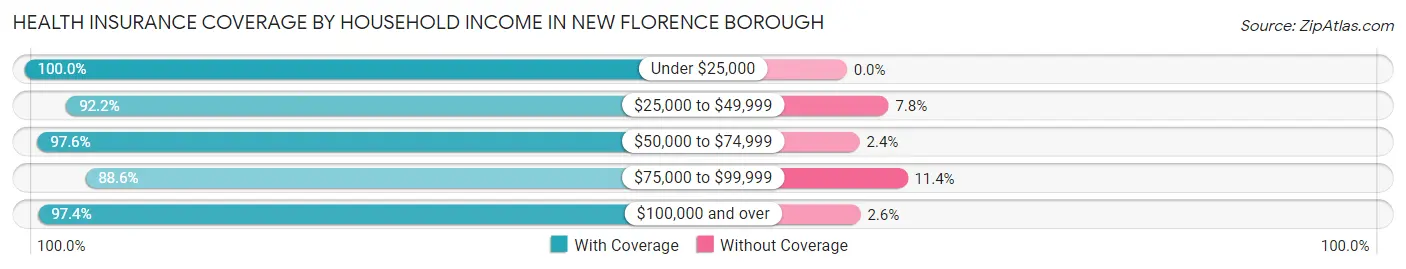
| Household Income | With Coverage | Without Coverage |
| Under $25,000 | 84 (100.0%) | 0 (0.0%) |
| $25,000 to $49,999 | 118 (92.2%) | 10 (7.8%) |
| $50,000 to $74,999 | 122 (97.6%) | 3 (2.4%) |
| $75,000 to $99,999 | 117 (88.6%) | 15 (11.4%) |
| $100,000 and over | 228 (97.4%) | 6 (2.6%) |
Public vs Private Health Insurance Coverage by Age in New Florence borough
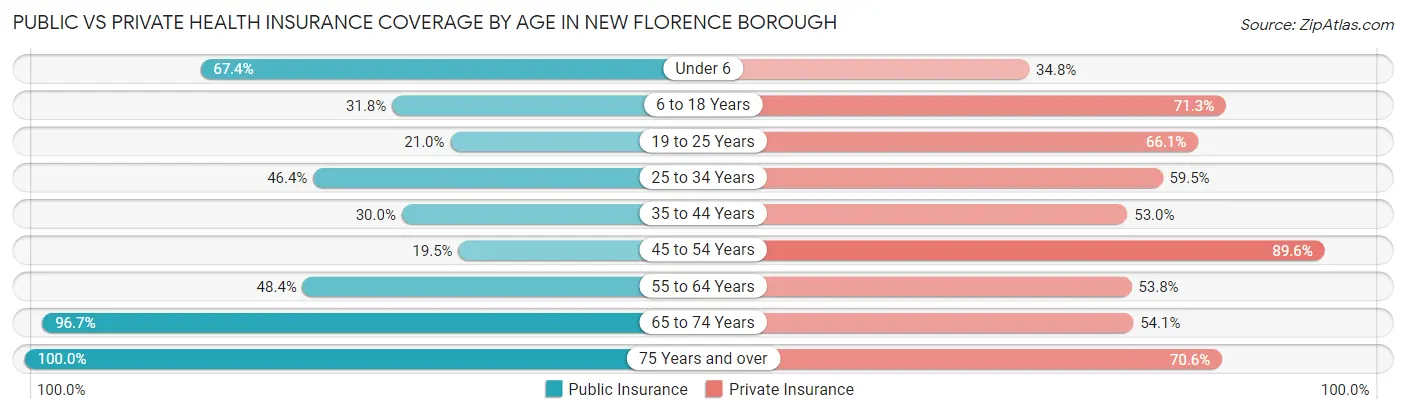
| Age Bracket | Public Insurance | Private Insurance |
| Under 6 | 31 (67.4%) | 16 (34.8%) |
| 6 to 18 Years | 41 (31.8%) | 92 (71.3%) |
| 19 to 25 Years | 13 (21.0%) | 41 (66.1%) |
| 25 to 34 Years | 39 (46.4%) | 50 (59.5%) |
| 35 to 44 Years | 30 (30.0%) | 53 (53.0%) |
| 45 to 54 Years | 15 (19.5%) | 69 (89.6%) |
| 55 to 64 Years | 45 (48.4%) | 50 (53.8%) |
| 65 to 74 Years | 59 (96.7%) | 33 (54.1%) |
| 75 Years and over | 51 (100.0%) | 36 (70.6%) |
| Total | 324 (46.1%) | 440 (62.6%) |
Disability Status by Sex by Age in New Florence borough
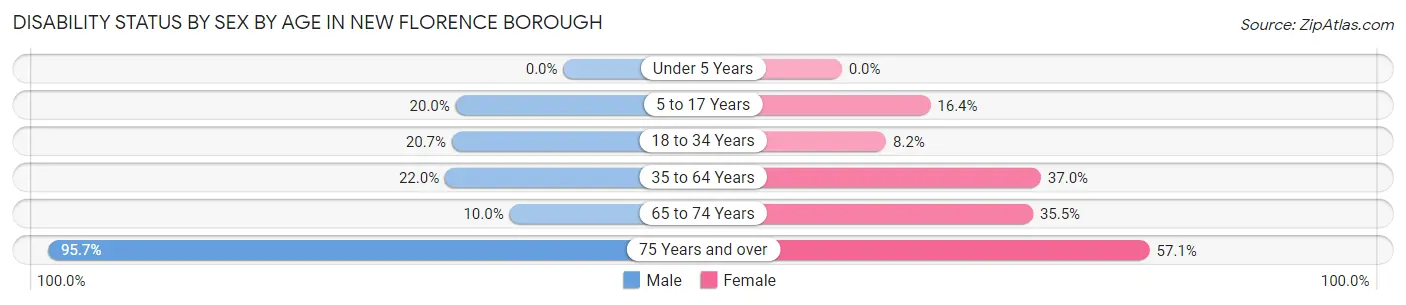
| Age Bracket | Male | Female |
| Under 5 Years | 0 (0.0%) | 0 (0.0%) |
| 5 to 17 Years | 10 (20.0%) | 12 (16.4%) |
| 18 to 34 Years | 18 (20.7%) | 6 (8.2%) |
| 35 to 64 Years | 29 (22.0%) | 51 (37.0%) |
| 65 to 74 Years | 3 (10.0%) | 11 (35.5%) |
| 75 Years and over | 22 (95.7%) | 16 (57.1%) |
Disability Class by Sex by Age in New Florence borough
Disability Class: Hearing Difficulty
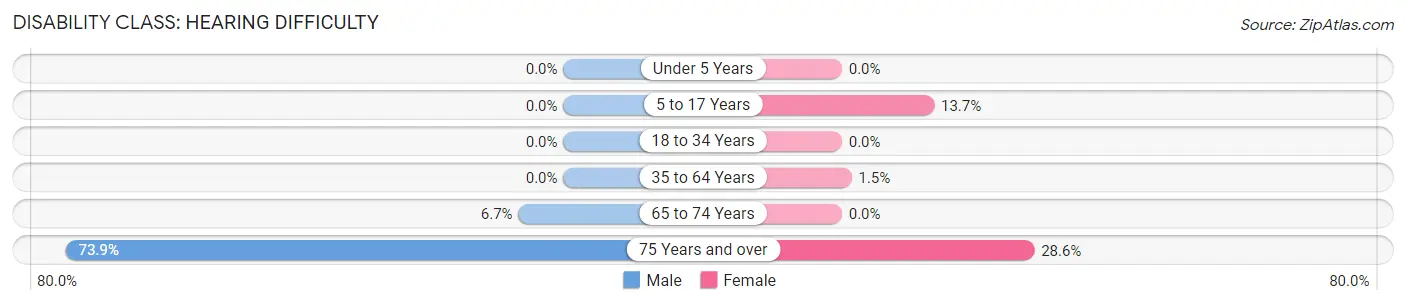
| Age Bracket | Male | Female |
| Under 5 Years | 0 (0.0%) | 0 (0.0%) |
| 5 to 17 Years | 0 (0.0%) | 10 (13.7%) |
| 18 to 34 Years | 0 (0.0%) | 0 (0.0%) |
| 35 to 64 Years | 0 (0.0%) | 2 (1.5%) |
| 65 to 74 Years | 2 (6.7%) | 0 (0.0%) |
| 75 Years and over | 17 (73.9%) | 8 (28.6%) |
Disability Class: Vision Difficulty
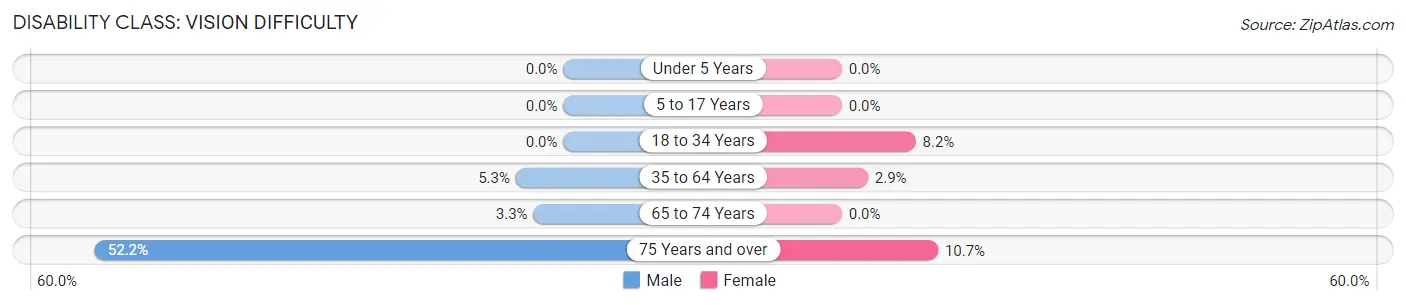
| Age Bracket | Male | Female |
| Under 5 Years | 0 (0.0%) | 0 (0.0%) |
| 5 to 17 Years | 0 (0.0%) | 0 (0.0%) |
| 18 to 34 Years | 0 (0.0%) | 6 (8.2%) |
| 35 to 64 Years | 7 (5.3%) | 4 (2.9%) |
| 65 to 74 Years | 1 (3.3%) | 0 (0.0%) |
| 75 Years and over | 12 (52.2%) | 3 (10.7%) |
Disability Class: Cognitive Difficulty
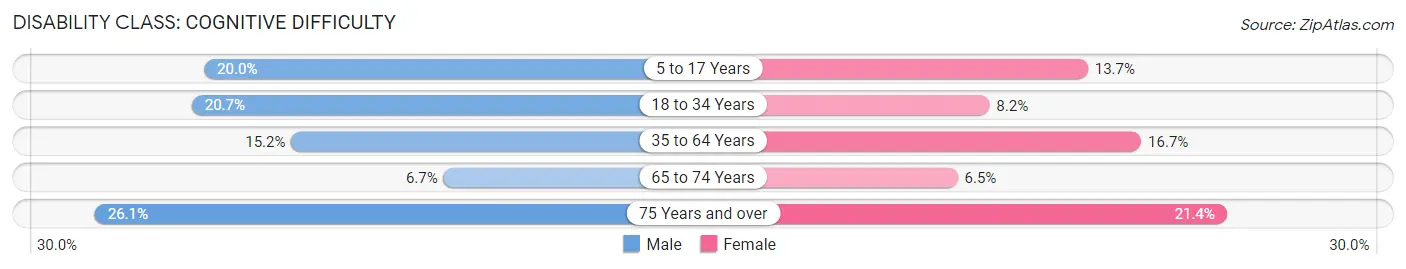
| Age Bracket | Male | Female |
| 5 to 17 Years | 10 (20.0%) | 10 (13.7%) |
| 18 to 34 Years | 18 (20.7%) | 6 (8.2%) |
| 35 to 64 Years | 20 (15.1%) | 23 (16.7%) |
| 65 to 74 Years | 2 (6.7%) | 2 (6.5%) |
| 75 Years and over | 6 (26.1%) | 6 (21.4%) |
Disability Class: Ambulatory Difficulty
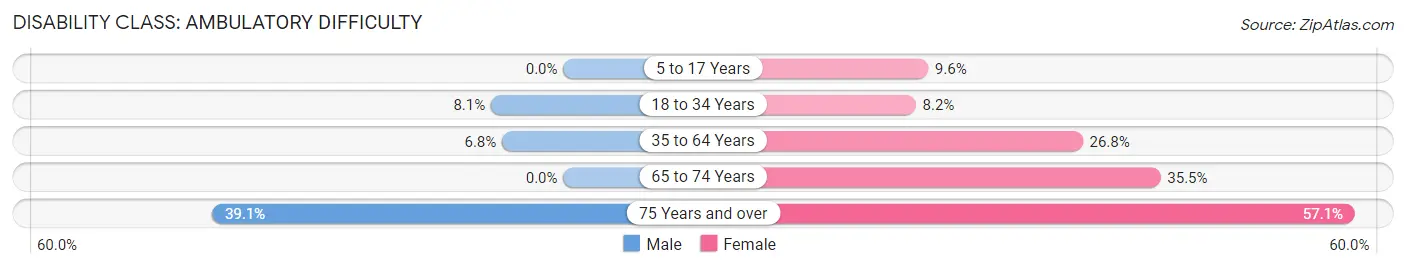
| Age Bracket | Male | Female |
| 5 to 17 Years | 0 (0.0%) | 7 (9.6%) |
| 18 to 34 Years | 7 (8.1%) | 6 (8.2%) |
| 35 to 64 Years | 9 (6.8%) | 37 (26.8%) |
| 65 to 74 Years | 0 (0.0%) | 11 (35.5%) |
| 75 Years and over | 9 (39.1%) | 16 (57.1%) |
Disability Class: Self-Care Difficulty
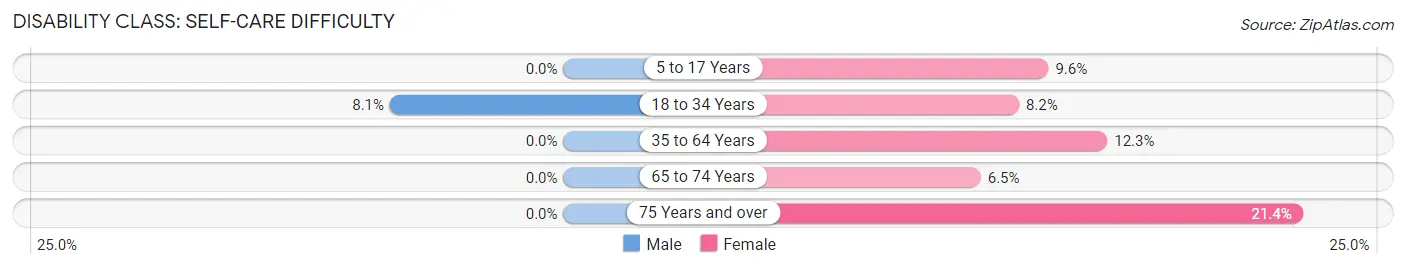
| Age Bracket | Male | Female |
| 5 to 17 Years | 0 (0.0%) | 7 (9.6%) |
| 18 to 34 Years | 7 (8.1%) | 6 (8.2%) |
| 35 to 64 Years | 0 (0.0%) | 17 (12.3%) |
| 65 to 74 Years | 0 (0.0%) | 2 (6.5%) |
| 75 Years and over | 0 (0.0%) | 6 (21.4%) |
Technology Access in New Florence borough
Computing Device Access in New Florence borough
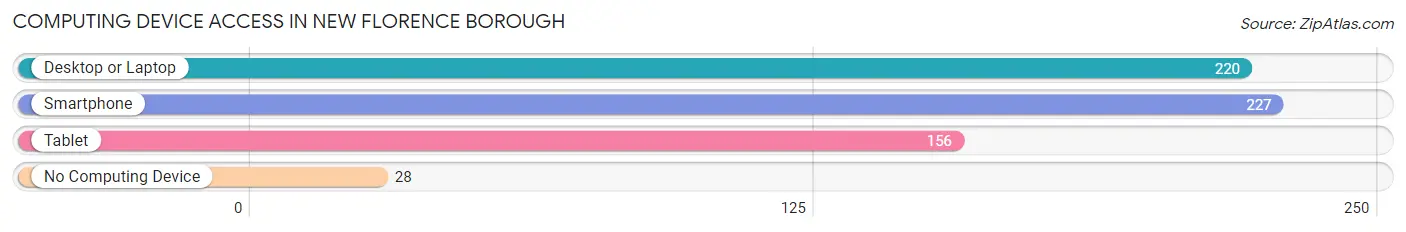
| Device Type | # Households | % Households |
| Desktop or Laptop | 220 | 78.6% |
| Smartphone | 227 | 81.1% |
| Tablet | 156 | 55.7% |
| No Computing Device | 28 | 10.0% |
| Total | 280 | 100.0% |
Internet Access in New Florence borough
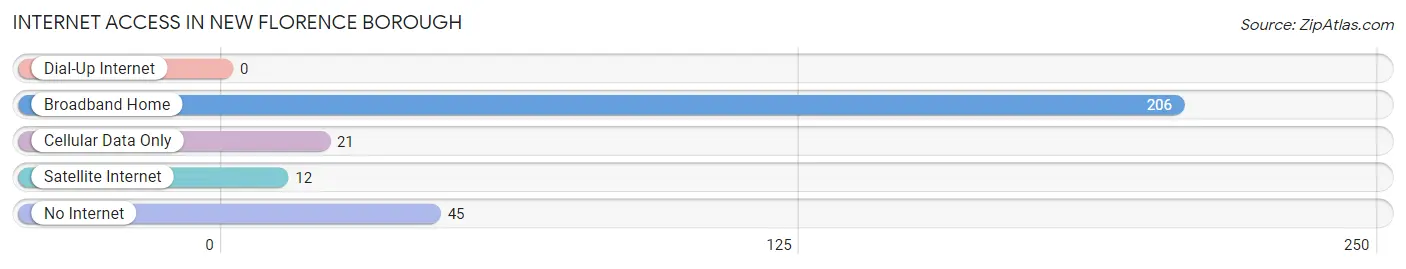
| Internet Type | # Households | % Households |
| Dial-Up Internet | 0 | 0.0% |
| Broadband Home | 206 | 73.6% |
| Cellular Data Only | 21 | 7.5% |
| Satellite Internet | 12 | 4.3% |
| No Internet | 45 | 16.1% |
| Total | 280 | 100.0% |
New Florence borough Summary
New Florence Borough is a small borough located in Westmoreland County, Pennsylvania. It is situated in the Laurel Highlands region of the state, approximately 40 miles southeast of Pittsburgh. The borough was incorporated in 1891 and has a population of approximately 1,000 people.
History
The area that is now New Florence Borough was first settled in the late 1700s by a group of German immigrants. The town was originally known as “New Florence” after the city of Florence, Italy. The town was officially incorporated in 1891 and was named after the nearby town of Florence, Pennsylvania.
The town was originally a farming community, but in the early 1900s, the coal industry began to take off in the area. The coal industry provided jobs and economic stability to the town, and it quickly grew in size and population. By the mid-1900s, the town had become a bustling community with a variety of businesses and services.
Geography
New Florence Borough is located in Westmoreland County, Pennsylvania. It is situated in the Laurel Highlands region of the state, approximately 40 miles southeast of Pittsburgh. The borough is bordered by the towns of Derry, Ligonier, and Donegal. The borough is situated in a valley surrounded by rolling hills and mountains. The area is known for its scenic beauty and is a popular destination for outdoor recreation.
The borough is located along the Conemaugh River, which provides a variety of recreational opportunities. The river is a popular spot for fishing, boating, and swimming. The area is also home to several parks and trails, including the Conemaugh River Trail and the Ligonier Valley Rail Trail.
Economy
The economy of New Florence Borough is largely based on the coal industry. The town is home to several coal mines, which provide jobs and economic stability to the area. The town is also home to several small businesses, including restaurants, shops, and services.
The town is also home to a variety of tourist attractions, including the Ligonier Valley Rail Trail, the Conemaugh River Trail, and the Ligonier Valley Museum. These attractions bring in visitors from all over the region and provide an economic boost to the town.
Demographics
As of the 2010 census, the population of New Florence Borough was 1,000 people. The racial makeup of the borough was 97.2% White, 0.7% African American, 0.2% Native American, 0.2% Asian, and 1.7% from two or more races. The median household income was $37,500 and the median family income was $45,000.
The town is home to a variety of religious denominations, including Catholic, Lutheran, and Methodist. The town is also home to a variety of cultural and recreational activities, including festivals, concerts, and sporting events.
Conclusion
New Florence Borough is a small borough located in Westmoreland County, Pennsylvania. It is situated in the Laurel Highlands region of the state, approximately 40 miles southeast of Pittsburgh. The borough was incorporated in 1891 and has a population of approximately 1,000 people. The economy of the borough is largely based on the coal industry, but it is also home to a variety of small businesses and tourist attractions. The town is home to a variety of religious denominations and cultural and recreational activities.
Common Questions
What is Per Capita Income in New Florence borough?
Per Capita income in New Florence borough is $30,545.
What is the Median Family Income in New Florence borough?
Median Family Income in New Florence borough is $78,906.
What is the Median Household income in New Florence borough?
Median Household Income in New Florence borough is $61,500.
What is Income or Wage Gap in New Florence borough?
Income or Wage Gap in New Florence borough is 39.9%.
Women in New Florence borough earn 60.1 cents for every dollar earned by a man.
What is Inequality or Gini Index in New Florence borough?
Inequality or Gini Index in New Florence borough is 0.43.
What is the Total Population of New Florence borough?
Total Population of New Florence borough is 703.
What is the Total Male Population of New Florence borough?
Total Male Population of New Florence borough is 337.
What is the Total Female Population of New Florence borough?
Total Female Population of New Florence borough is 366.
What is the Ratio of Males per 100 Females in New Florence borough?
There are 92.08 Males per 100 Females in New Florence borough.
What is the Ratio of Females per 100 Males in New Florence borough?
There are 108.61 Females per 100 Males in New Florence borough.
What is the Median Population Age in New Florence borough?
Median Population Age in New Florence borough is 39.3 Years.
What is the Average Family Size in New Florence borough
Average Family Size in New Florence borough is 3.0 People.
What is the Average Household Size in New Florence borough
Average Household Size in New Florence borough is 2.5 People.
How Large is the Labor Force in New Florence borough?
There are 323 People in the Labor Forcein in New Florence borough.
What is the Percentage of People in the Labor Force in New Florence borough?
55.5% of People are in the Labor Force in New Florence borough.
What is the Unemployment Rate in New Florence borough?
Unemployment Rate in New Florence borough is 10.2%.