Bath borough, PA Map & Demographics
Bath borough Overview
$29,541
PER CAPITA INCOME
$69,112
AVG FAMILY INCOME
$56,813
AVG HOUSEHOLD INCOME
37.8%
WAGE / INCOME GAP [ % ]
62.2¢/ $1
WAGE / INCOME GAP [ $ ]
$8,522
FAMILY INCOME DEFICIT
0.44
INEQUALITY / GINI INDEX
2,814
TOTAL POPULATION
1,395
MALE POPULATION
1,419
FEMALE POPULATION
98.31
MALES / 100 FEMALES
101.72
FEMALES / 100 MALES
32.3
MEDIAN AGE
3.4
AVG FAMILY SIZE
2.6
AVG HOUSEHOLD SIZE
1,348
LABOR FORCE [ PEOPLE ]
64.0%
PERCENT IN LABOR FORCE
5.9%
UNEMPLOYMENT RATE
Income in Bath borough
Income Overview in Bath borough
Per Capita Income in Bath borough is $29,541, while median incomes of families and households are $69,112 and $56,813 respectively.
| Characteristic | Number | Measure |
| Per Capita Income | 2,814 | $29,541 |
| Median Family Income | 645 | $69,112 |
| Mean Family Income | 645 | $89,116 |
| Median Household Income | 1,063 | $56,813 |
| Mean Household Income | 1,063 | $76,860 |
| Income Deficit | 645 | $8,522 |
| Wage / Income Gap (%) | 2,814 | 37.83% |
| Wage / Income Gap ($) | 2,814 | 62.17¢ per $1 |
| Gini / Inequality Index | 2,814 | 0.44 |
Earnings by Sex in Bath borough
Average Earnings in Bath borough are $40,239, $47,077 for men and $29,268 for women, a difference of 37.8%.
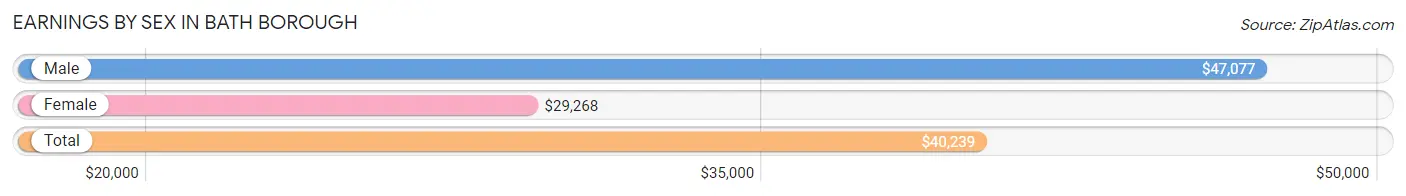
| Sex | Number | Average Earnings |
| Male | 689 (51.1%) | $47,077 |
| Female | 660 (48.9%) | $29,268 |
| Total | 1,349 (100.0%) | $40,239 |
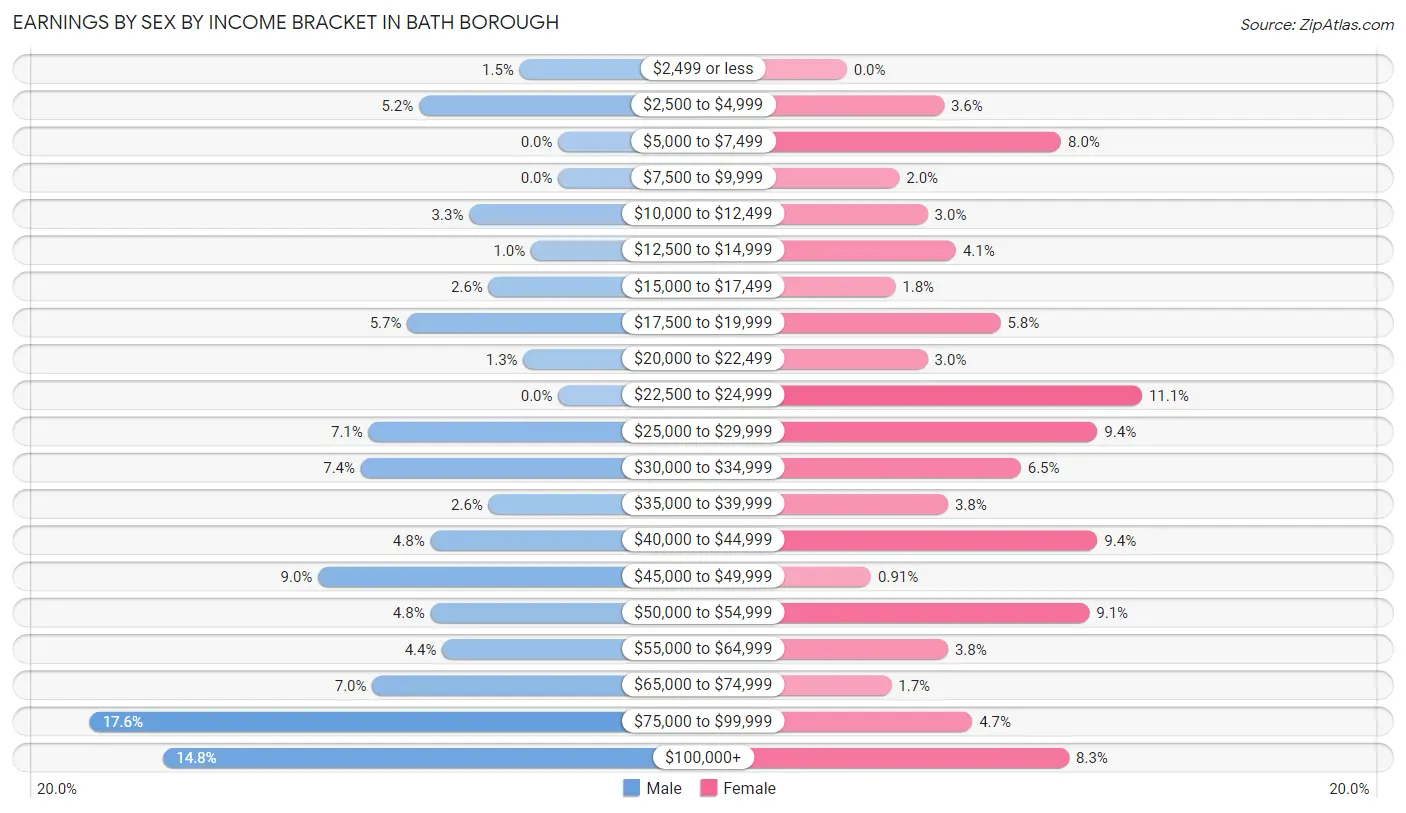
Earnings by Sex by Income Bracket in Bath borough
The most common earnings brackets in Bath borough are $75,000 to $99,999 for men (121 | 17.6%) and $22,500 to $24,999 for women (73 | 11.1%).
| Income | Male | Female |
| $2,499 or less | 10 (1.5%) | 0 (0.0%) |
| $2,500 to $4,999 | 36 (5.2%) | 24 (3.6%) |
| $5,000 to $7,499 | 0 (0.0%) | 53 (8.0%) |
| $7,500 to $9,999 | 0 (0.0%) | 13 (2.0%) |
| $10,000 to $12,499 | 23 (3.3%) | 20 (3.0%) |
| $12,500 to $14,999 | 7 (1.0%) | 27 (4.1%) |
| $15,000 to $17,499 | 18 (2.6%) | 12 (1.8%) |
| $17,500 to $19,999 | 39 (5.7%) | 38 (5.8%) |
| $20,000 to $22,499 | 9 (1.3%) | 20 (3.0%) |
| $22,500 to $24,999 | 0 (0.0%) | 73 (11.1%) |
| $25,000 to $29,999 | 49 (7.1%) | 62 (9.4%) |
| $30,000 to $34,999 | 51 (7.4%) | 43 (6.5%) |
| $35,000 to $39,999 | 18 (2.6%) | 25 (3.8%) |
| $40,000 to $44,999 | 33 (4.8%) | 62 (9.4%) |
| $45,000 to $49,999 | 62 (9.0%) | 6 (0.9%) |
| $50,000 to $54,999 | 33 (4.8%) | 60 (9.1%) |
| $55,000 to $64,999 | 30 (4.3%) | 25 (3.8%) |
| $65,000 to $74,999 | 48 (7.0%) | 11 (1.7%) |
| $75,000 to $99,999 | 121 (17.6%) | 31 (4.7%) |
| $100,000+ | 102 (14.8%) | 55 (8.3%) |
| Total | 689 (100.0%) | 660 (100.0%) |
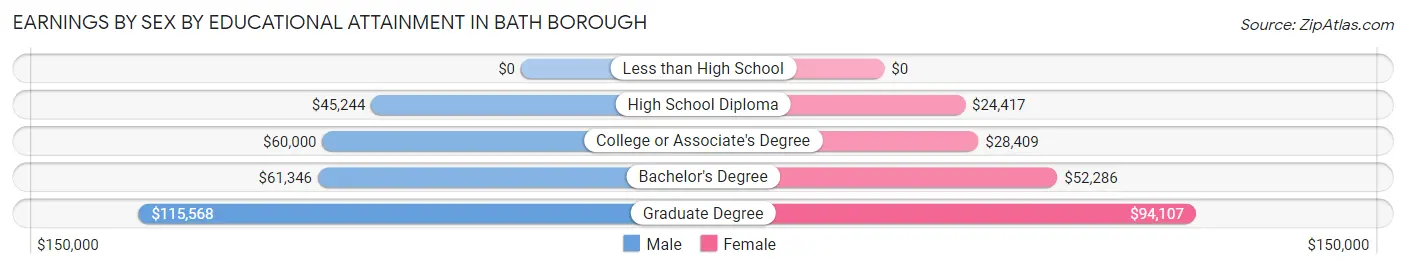
Earnings by Sex by Educational Attainment in Bath borough
Average earnings in Bath borough are $51,500 for men and $33,106 for women, a difference of 35.7%. Men with an educational attainment of graduate degree enjoy the highest average annual earnings of $115,568, while those with high school diploma education earn the least with $45,244. Women with an educational attainment of graduate degree earn the most with the average annual earnings of $94,107, while those with high school diploma education have the smallest earnings of $24,417.
| Educational Attainment | Male Income | Female Income |
| Less than High School | - | - |
| High School Diploma | $45,244 | $24,417 |
| College or Associate's Degree | $60,000 | $28,409 |
| Bachelor's Degree | $61,346 | $52,286 |
| Graduate Degree | $115,568 | $94,107 |
| Total | $51,500 | $33,106 |
Family Income in Bath borough
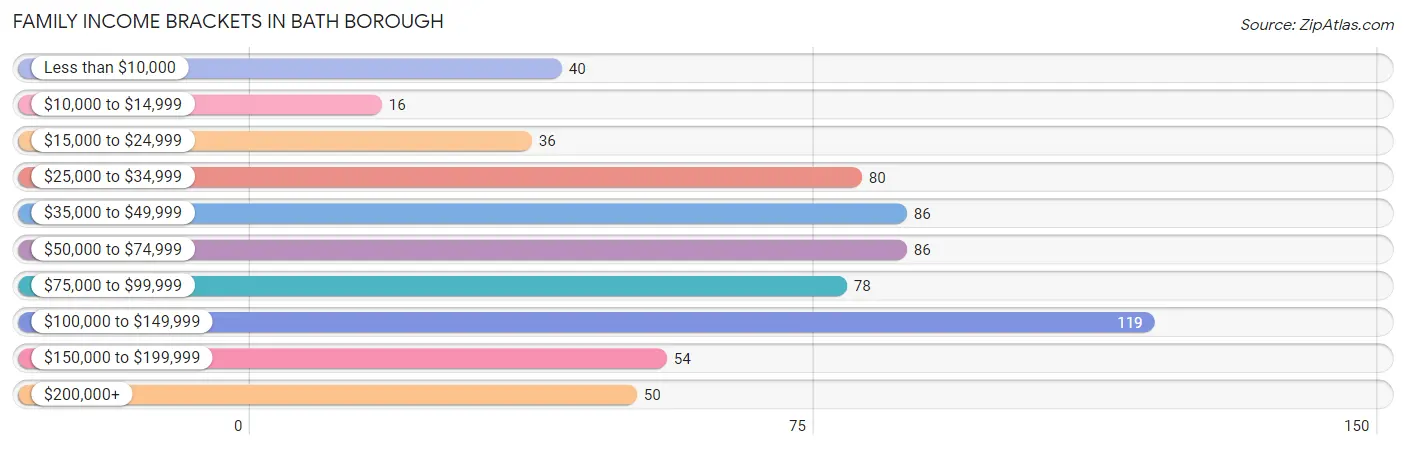
Family Income Brackets in Bath borough
According to the Bath borough family income data, there are 119 families falling into the $100,000 to $149,999 income range, which is the most common income bracket and makes up 18.4% of all families. Conversely, the $10,000 to $14,999 income bracket is the least frequent group with only 16 families (2.5%) belonging to this category.
| Income Bracket | # Families | % Families |
| Less than $10,000 | 40 | 6.2% |
| $10,000 to $14,999 | 16 | 2.5% |
| $15,000 to $24,999 | 36 | 5.6% |
| $25,000 to $34,999 | 80 | 12.4% |
| $35,000 to $49,999 | 86 | 13.3% |
| $50,000 to $74,999 | 86 | 13.3% |
| $75,000 to $99,999 | 78 | 12.1% |
| $100,000 to $149,999 | 119 | 18.4% |
| $150,000 to $199,999 | 54 | 8.4% |
| $200,000+ | 50 | 7.8% |
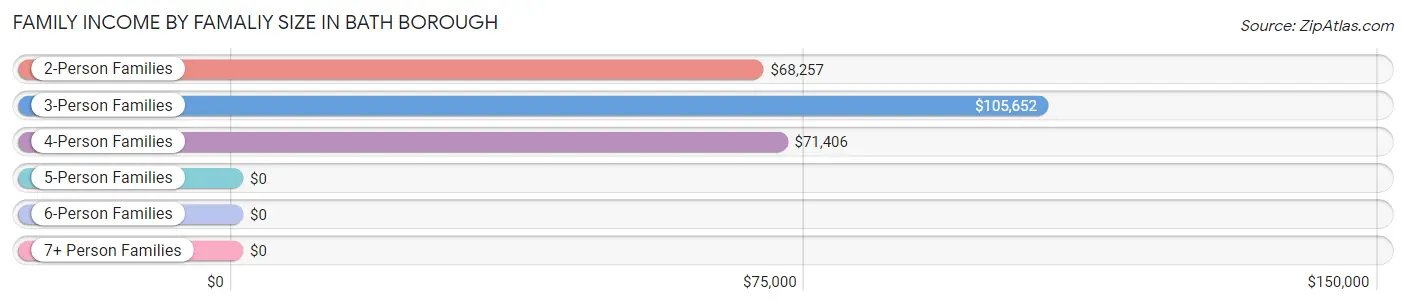
Family Income by Famaliy Size in Bath borough
3-person families (118 | 18.3%) account for the highest median family income in Bath borough with $105,652 per family, while 3-person families (118 | 18.3%) have the highest median income of $35,217 per family member.
| Income Bracket | # Families | Median Income |
| 2-Person Families | 293 (45.4%) | $68,257 |
| 3-Person Families | 118 (18.3%) | $105,652 |
| 4-Person Families | 129 (20.0%) | $71,406 |
| 5-Person Families | 81 (12.6%) | $0 |
| 6-Person Families | 24 (3.7%) | $0 |
| 7+ Person Families | 0 (0.0%) | $0 |
| Total | 645 (100.0%) | $69,112 |
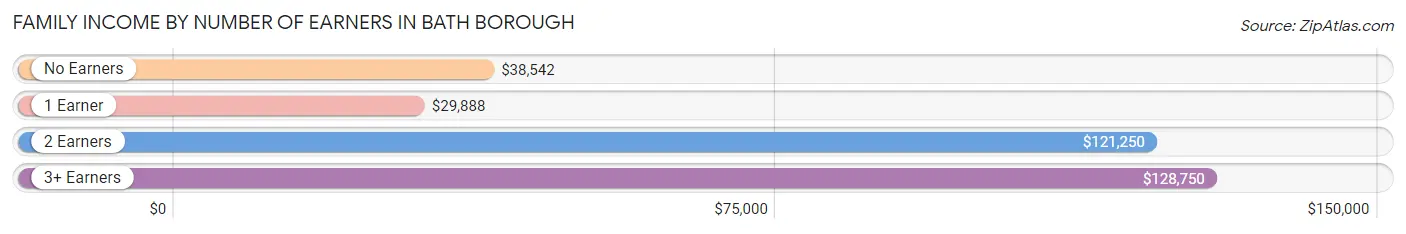
Family Income by Number of Earners in Bath borough
The median family income in Bath borough is $69,112, with families comprising 3+ earners (40) having the highest median family income of $128,750, while families with 1 earner (268) have the lowest median family income of $29,888, accounting for 6.2% and 41.5% of families, respectively.
| Number of Earners | # Families | Median Income |
| No Earners | 65 (10.1%) | $38,542 |
| 1 Earner | 268 (41.5%) | $29,888 |
| 2 Earners | 272 (42.2%) | $121,250 |
| 3+ Earners | 40 (6.2%) | $128,750 |
| Total | 645 (100.0%) | $69,112 |
Household Income in Bath borough
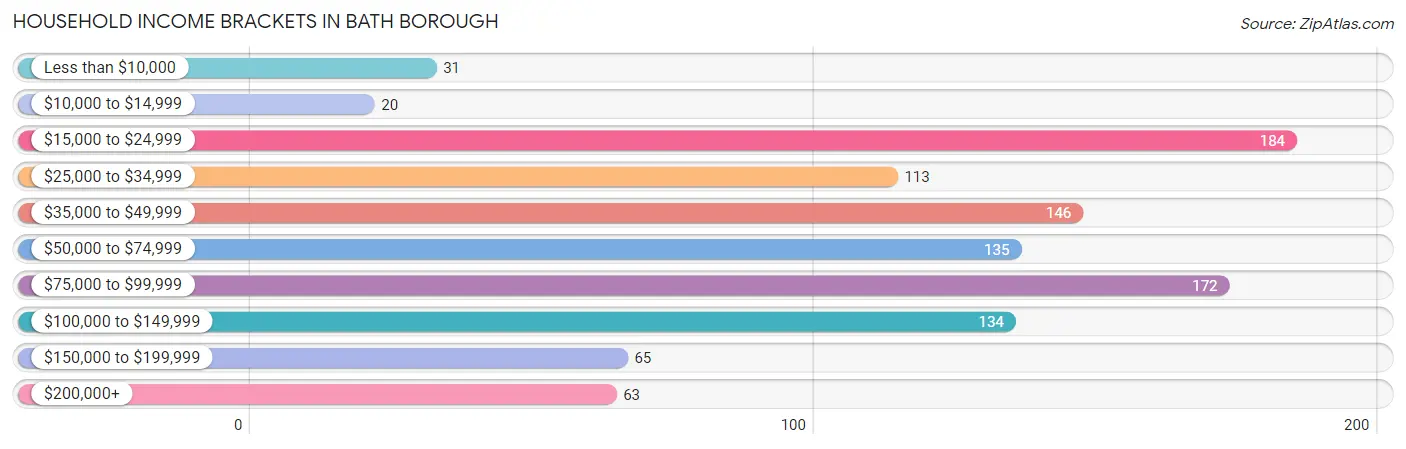
Household Income Brackets in Bath borough
With 184 households falling in the category, the $15,000 to $24,999 income range is the most frequent in Bath borough, accounting for 17.3% of all households. In contrast, only 20 households (1.9%) fall into the $10,000 to $14,999 income bracket, making it the least populous group.
| Income Bracket | # Households | % Households |
| Less than $10,000 | 31 | 2.9% |
| $10,000 to $14,999 | 20 | 1.9% |
| $15,000 to $24,999 | 184 | 17.3% |
| $25,000 to $34,999 | 113 | 10.6% |
| $35,000 to $49,999 | 146 | 13.7% |
| $50,000 to $74,999 | 135 | 12.7% |
| $75,000 to $99,999 | 172 | 16.2% |
| $100,000 to $149,999 | 134 | 12.6% |
| $150,000 to $199,999 | 65 | 6.1% |
| $200,000+ | 63 | 5.9% |
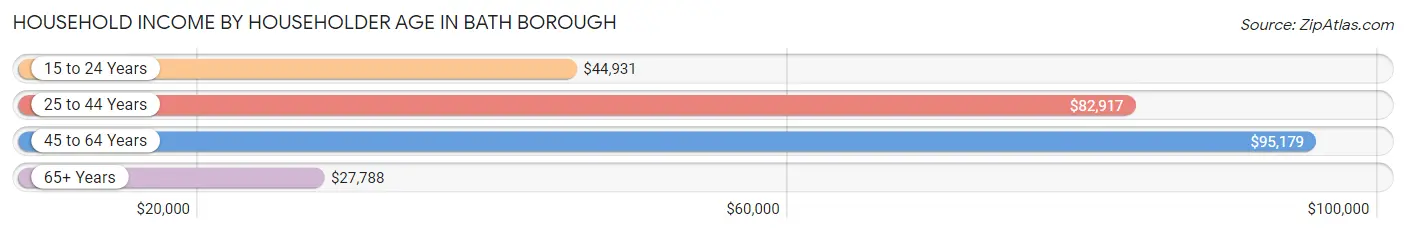
Household Income by Householder Age in Bath borough
The median household income in Bath borough is $56,813, with the highest median household income of $95,179 found in the 45 to 64 years age bracket for the primary householder. A total of 321 households (30.2%) fall into this category. Meanwhile, the 65+ years age bracket for the primary householder has the lowest median household income of $27,788, with 301 households (28.3%) in this group.
| Income Bracket | # Households | Median Income |
| 15 to 24 Years | 35 (3.3%) | $44,931 |
| 25 to 44 Years | 406 (38.2%) | $82,917 |
| 45 to 64 Years | 321 (30.2%) | $95,179 |
| 65+ Years | 301 (28.3%) | $27,788 |
| Total | 1,063 (100.0%) | $56,813 |
Poverty in Bath borough
Income Below Poverty by Sex and Age in Bath borough
With 19.7% poverty level for males and 21.6% for females among the residents of Bath borough, 5 year old males and under 5 year old females are the most vulnerable to poverty, with 18 males (100.0%) and 76 females (91.6%) in their respective age groups living below the poverty level.
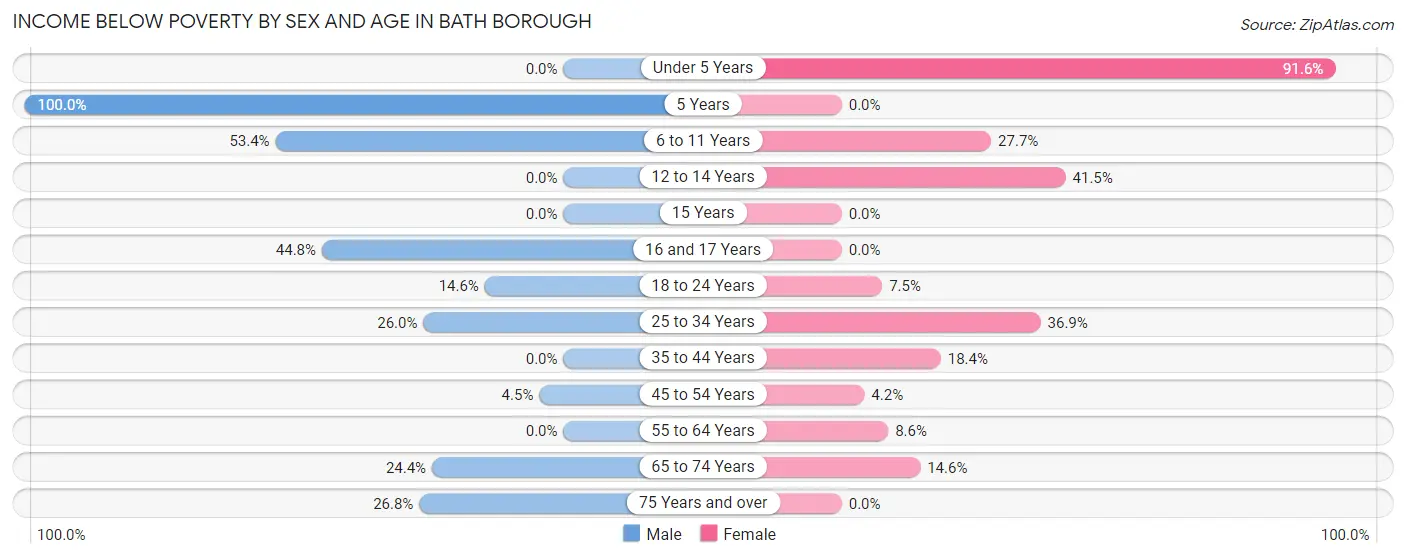
| Age Bracket | Male | Female |
| Under 5 Years | 0 (0.0%) | 76 (91.6%) |
| 5 Years | 18 (100.0%) | 0 (0.0%) |
| 6 to 11 Years | 101 (53.4%) | 28 (27.7%) |
| 12 to 14 Years | 0 (0.0%) | 54 (41.5%) |
| 15 Years | 0 (0.0%) | 0 (0.0%) |
| 16 and 17 Years | 39 (44.8%) | 0 (0.0%) |
| 18 to 24 Years | 20 (14.6%) | 12 (7.5%) |
| 25 to 34 Years | 52 (26.0%) | 69 (36.9%) |
| 35 to 44 Years | 0 (0.0%) | 36 (18.4%) |
| 45 to 54 Years | 6 (4.5%) | 6 (4.2%) |
| 55 to 64 Years | 0 (0.0%) | 10 (8.6%) |
| 65 to 74 Years | 20 (24.4%) | 15 (14.6%) |
| 75 Years and over | 19 (26.8%) | 0 (0.0%) |
| Total | 275 (19.7%) | 306 (21.6%) |
Income Above Poverty by Sex and Age in Bath borough
According to the poverty statistics in Bath borough, males aged under 5 years and females aged 5 years are the age groups that are most secure financially, with 100.0% of males and 100.0% of females in these age groups living above the poverty line.
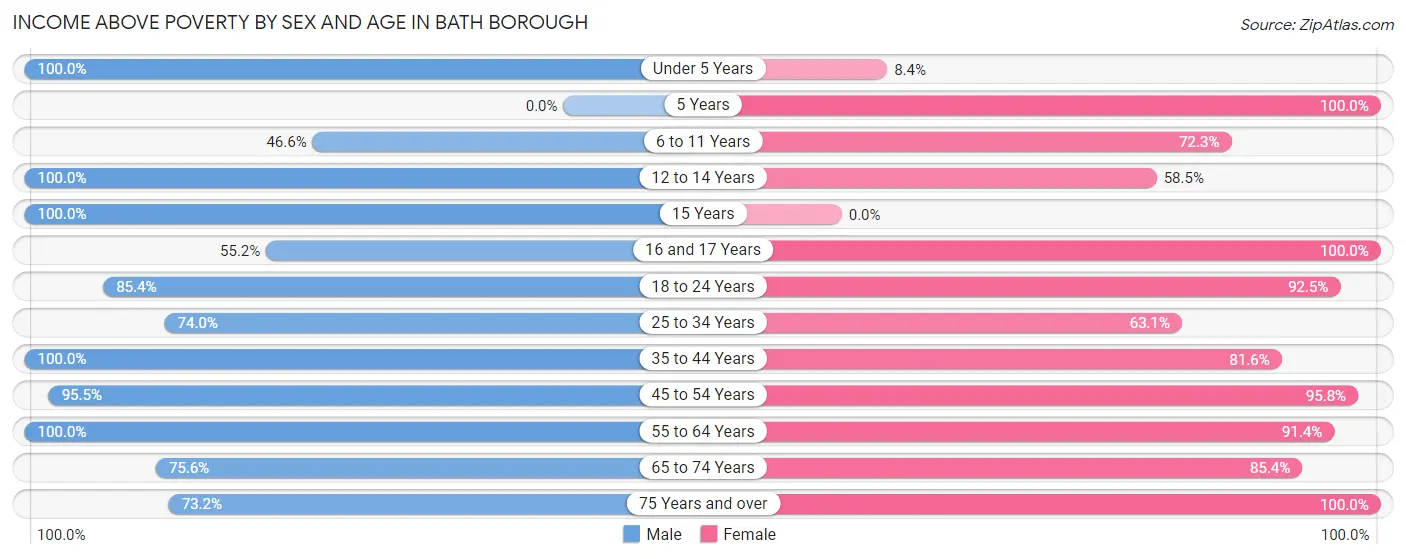
| Age Bracket | Male | Female |
| Under 5 Years | 23 (100.0%) | 7 (8.4%) |
| 5 Years | 0 (0.0%) | 9 (100.0%) |
| 6 to 11 Years | 88 (46.6%) | 73 (72.3%) |
| 12 to 14 Years | 135 (100.0%) | 76 (58.5%) |
| 15 Years | 19 (100.0%) | 0 (0.0%) |
| 16 and 17 Years | 48 (55.2%) | 38 (100.0%) |
| 18 to 24 Years | 117 (85.4%) | 148 (92.5%) |
| 25 to 34 Years | 148 (74.0%) | 118 (63.1%) |
| 35 to 44 Years | 192 (100.0%) | 160 (81.6%) |
| 45 to 54 Years | 128 (95.5%) | 137 (95.8%) |
| 55 to 64 Years | 108 (100.0%) | 106 (91.4%) |
| 65 to 74 Years | 62 (75.6%) | 88 (85.4%) |
| 75 Years and over | 52 (73.2%) | 153 (100.0%) |
| Total | 1,120 (80.3%) | 1,113 (78.4%) |
Income Below Poverty Among Married-Couple Families in Bath borough
The poverty statistics for married-couple families in Bath borough show that 13.3% or 51 of the total 385 families live below the poverty line. Families with 1 or 2 children have the highest poverty rate of 20.0%, comprising of 29 families. On the other hand, families with no children have the lowest poverty rate of 7.9%, which includes 16 families.
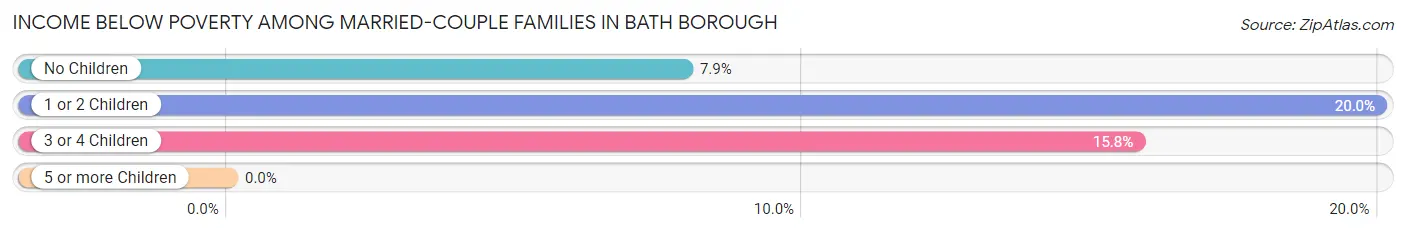
| Children | Above Poverty | Below Poverty |
| No Children | 186 (92.1%) | 16 (7.9%) |
| 1 or 2 Children | 116 (80.0%) | 29 (20.0%) |
| 3 or 4 Children | 32 (84.2%) | 6 (15.8%) |
| 5 or more Children | 0 (0.0%) | 0 (0.0%) |
| Total | 334 (86.8%) | 51 (13.3%) |
Income Below Poverty Among Single-Parent Households in Bath borough
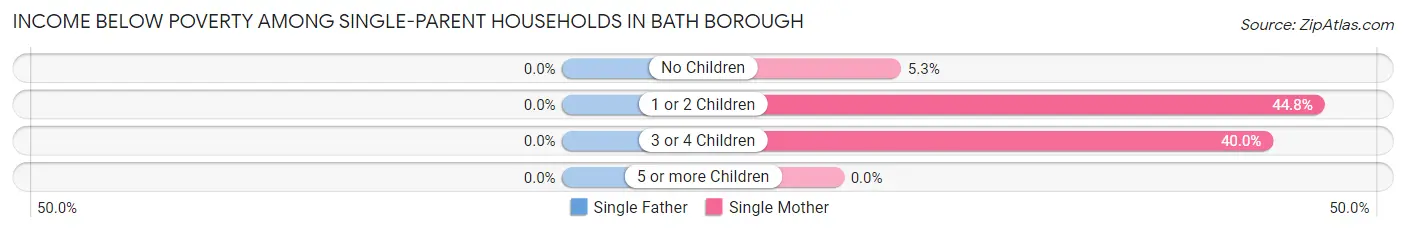
| Children | Single Father | Single Mother |
| No Children | 0 (0.0%) | 4 (5.3%) |
| 1 or 2 Children | 0 (0.0%) | 30 (44.8%) |
| 3 or 4 Children | 0 (0.0%) | 26 (40.0%) |
| 5 or more Children | 0 (0.0%) | 0 (0.0%) |
| Total | 0 (0.0%) | 60 (29.0%) |
Income Below Poverty Among Married-Couple vs Single-Parent Households in Bath borough
The poverty data for Bath borough shows that 51 of the married-couple family households (13.3%) and 60 of the single-parent households (23.1%) are living below the poverty level. Within the married-couple family households, those with 1 or 2 children have the highest poverty rate, with 29 households (20.0%) falling below the poverty line. Among the single-parent households, those with 3 or 4 children have the highest poverty rate, with 26 household (40.0%) living below poverty.
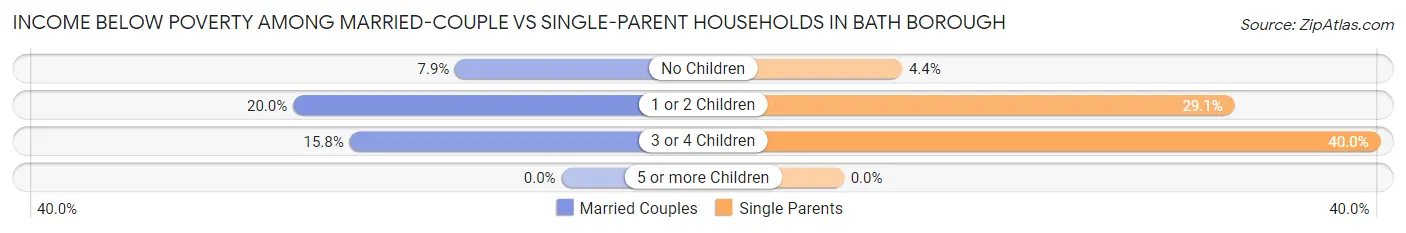
| Children | Married-Couple Families | Single-Parent Households |
| No Children | 16 (7.9%) | 4 (4.3%) |
| 1 or 2 Children | 29 (20.0%) | 30 (29.1%) |
| 3 or 4 Children | 6 (15.8%) | 26 (40.0%) |
| 5 or more Children | 0 (0.0%) | 0 (0.0%) |
| Total | 51 (13.3%) | 60 (23.1%) |
Race in Bath borough
The most populous races in Bath borough are White / Caucasian (2,144 | 76.2%), Hispanic or Latino (398 | 14.1%), and Black / African American (326 | 11.6%).
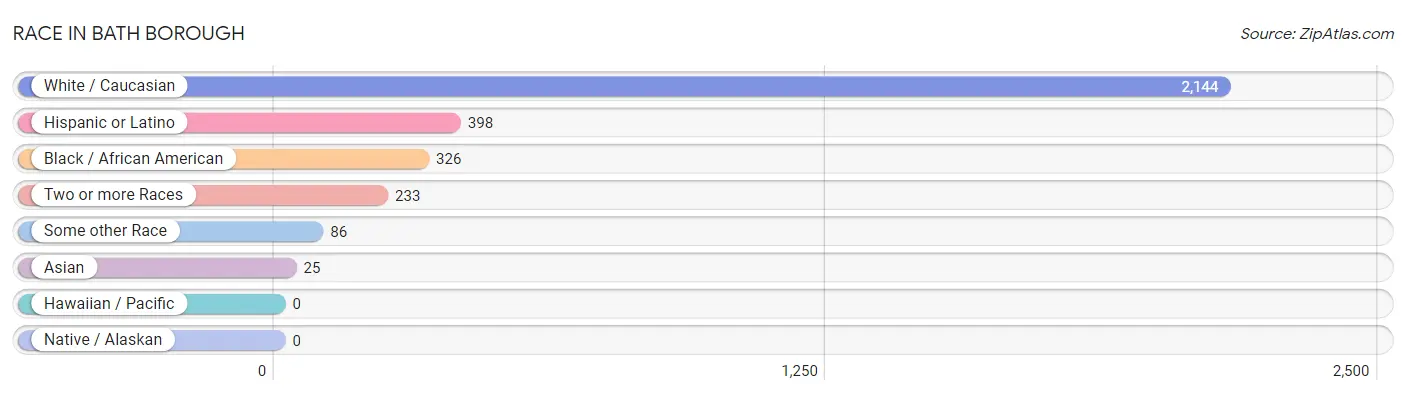
| Race | # Population | % Population |
| Asian | 25 | 0.9% |
| Black / African American | 326 | 11.6% |
| Hawaiian / Pacific | 0 | 0.0% |
| Hispanic or Latino | 398 | 14.1% |
| Native / Alaskan | 0 | 0.0% |
| White / Caucasian | 2,144 | 76.2% |
| Two or more Races | 233 | 8.3% |
| Some other Race | 86 | 3.1% |
| Total | 2,814 | 100.0% |
Ancestry in Bath borough
The most populous ancestries reported in Bath borough are German (534 | 19.0%), Puerto Rican (355 | 12.6%), Irish (233 | 8.3%), Italian (217 | 7.7%), and American (187 | 6.7%), together accounting for 54.2% of all Bath borough residents.
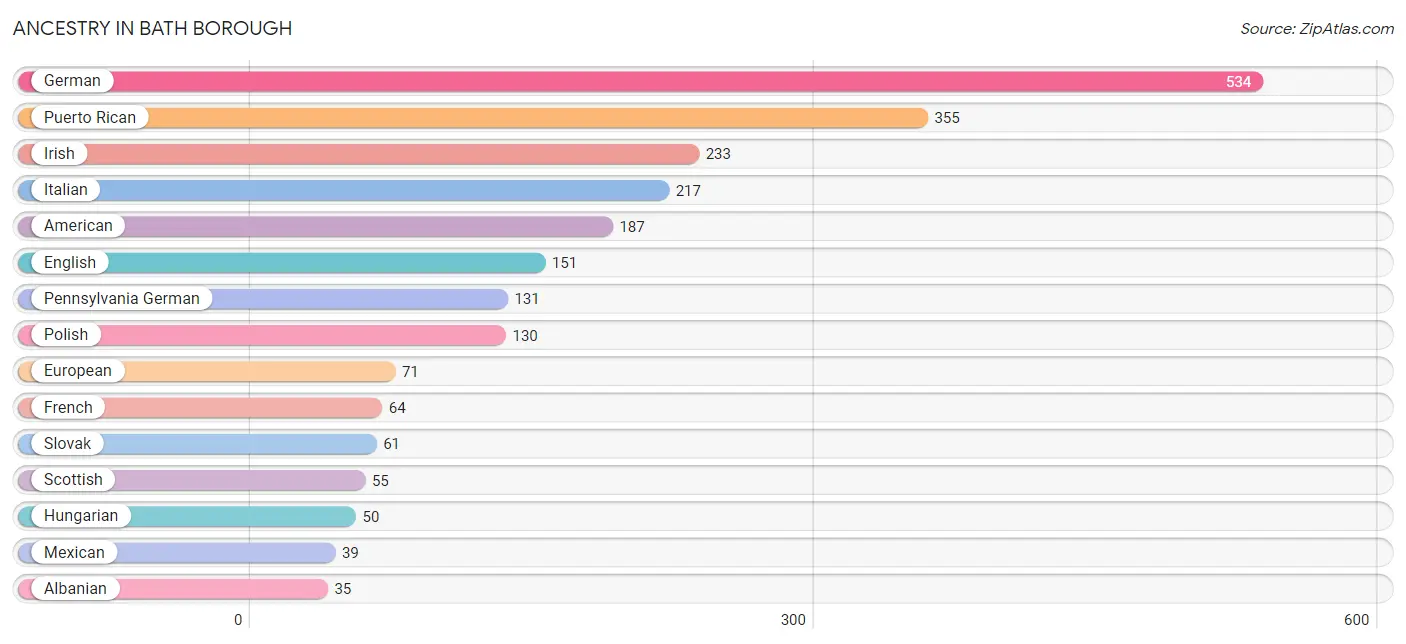
| Ancestry | # Population | % Population |
| Albanian | 35 | 1.2% |
| American | 187 | 6.7% |
| Argentinean | 4 | 0.1% |
| Austrian | 31 | 1.1% |
| Danish | 4 | 0.1% |
| Dutch | 29 | 1.0% |
| Eastern European | 6 | 0.2% |
| English | 151 | 5.4% |
| European | 71 | 2.5% |
| French | 64 | 2.3% |
| French Canadian | 29 | 1.0% |
| German | 534 | 19.0% |
| Greek | 4 | 0.1% |
| Hungarian | 50 | 1.8% |
| Indian (Asian) | 3 | 0.1% |
| Irish | 233 | 8.3% |
| Italian | 217 | 7.7% |
| Korean | 8 | 0.3% |
| Lithuanian | 19 | 0.7% |
| Mexican | 39 | 1.4% |
| Norwegian | 8 | 0.3% |
| Pennsylvania German | 131 | 4.7% |
| Polish | 130 | 4.6% |
| Portuguese | 15 | 0.5% |
| Puerto Rican | 355 | 12.6% |
| Russian | 21 | 0.7% |
| Scotch-Irish | 21 | 0.7% |
| Scottish | 55 | 1.9% |
| Slavic | 4 | 0.1% |
| Slovak | 61 | 2.2% |
| South American | 4 | 0.1% |
| Swedish | 4 | 0.1% |
| Swiss | 4 | 0.1% |
| Trinidadian and Tobagonian | 3 | 0.1% |
| Ukrainian | 14 | 0.5% |
| Welsh | 6 | 0.2% |
| West Indian | 9 | 0.3% |
| Yugoslavian | 4 | 0.1% | View All 38 Rows |
Immigrants in Bath borough
The most numerous immigrant groups reported in Bath borough came from Europe (53 | 1.9%), Latin America (44 | 1.6%), France (25 | 0.9%), Western Europe (25 | 0.9%), and Italy (23 | 0.8%), together accounting for 6.0% of all Bath borough residents.
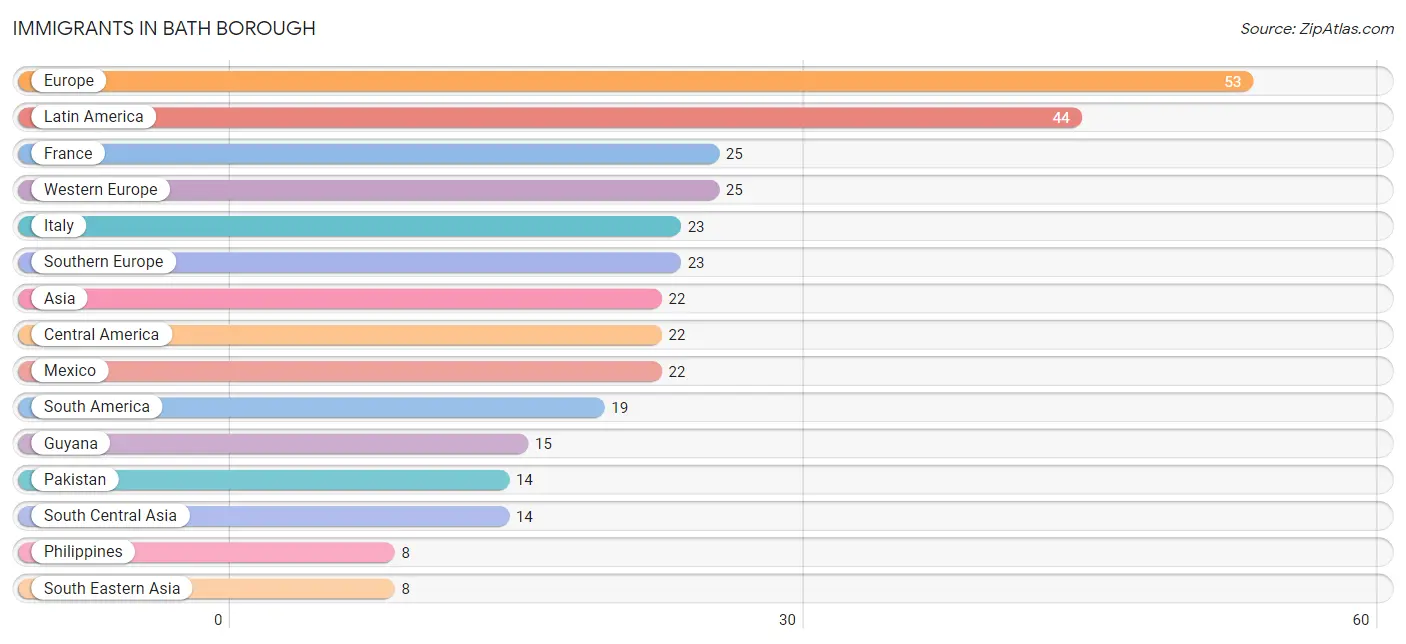
| Immigration Origin | # Population | % Population |
| Argentina | 4 | 0.1% |
| Asia | 22 | 0.8% |
| Canada | 7 | 0.3% |
| Caribbean | 3 | 0.1% |
| Central America | 22 | 0.8% |
| Europe | 53 | 1.9% |
| France | 25 | 0.9% |
| Guyana | 15 | 0.5% |
| Italy | 23 | 0.8% |
| Latin America | 44 | 1.6% |
| Mexico | 22 | 0.8% |
| Northern Europe | 5 | 0.2% |
| Pakistan | 14 | 0.5% |
| Philippines | 8 | 0.3% |
| South America | 19 | 0.7% |
| South Central Asia | 14 | 0.5% |
| South Eastern Asia | 8 | 0.3% |
| Southern Europe | 23 | 0.8% |
| Trinidad and Tobago | 3 | 0.1% |
| Western Europe | 25 | 0.9% | View All 20 Rows |
Sex and Age in Bath borough
Sex and Age in Bath borough
The most populous age groups in Bath borough are 10 to 14 Years (182 | 13.1%) for men and 10 to 14 Years (142 | 10.0%) for women.
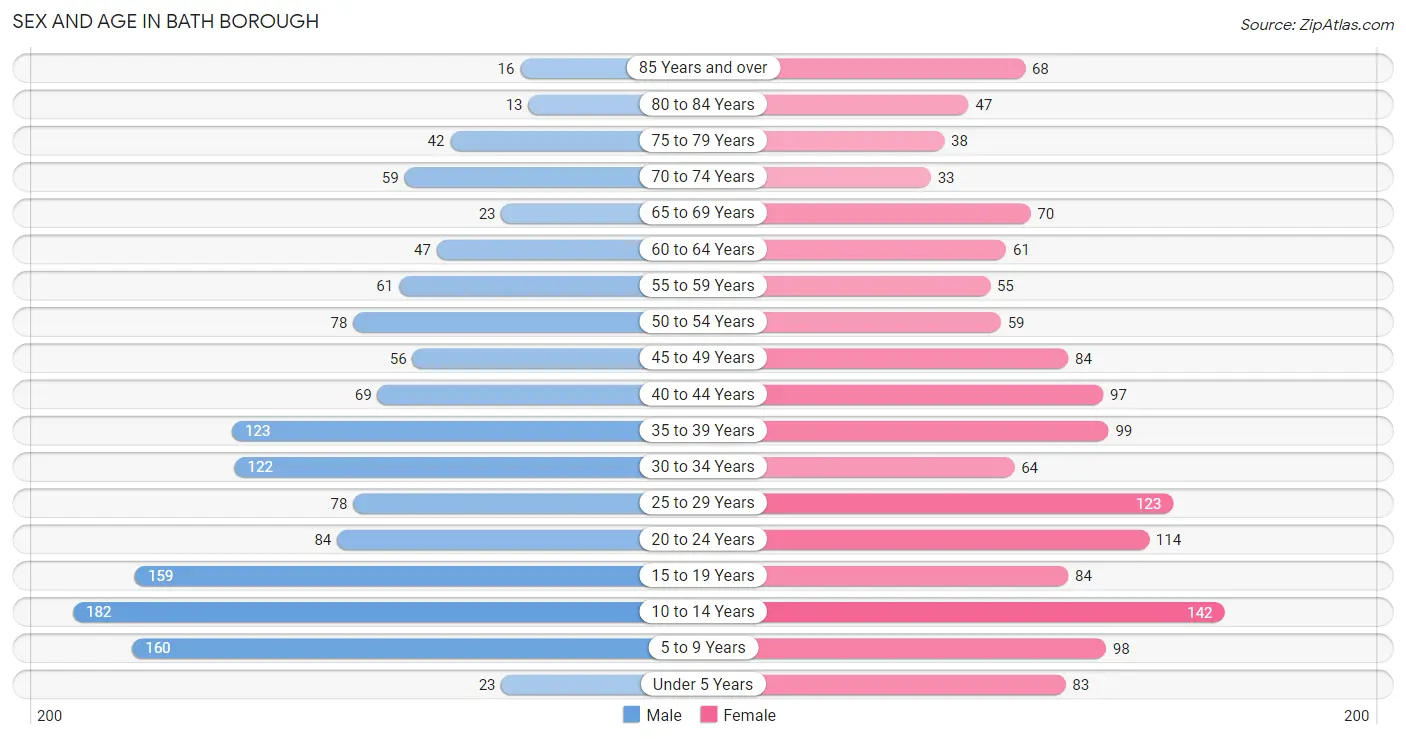
| Age Bracket | Male | Female |
| Under 5 Years | 23 (1.7%) | 83 (5.9%) |
| 5 to 9 Years | 160 (11.5%) | 98 (6.9%) |
| 10 to 14 Years | 182 (13.1%) | 142 (10.0%) |
| 15 to 19 Years | 159 (11.4%) | 84 (5.9%) |
| 20 to 24 Years | 84 (6.0%) | 114 (8.0%) |
| 25 to 29 Years | 78 (5.6%) | 123 (8.7%) |
| 30 to 34 Years | 122 (8.7%) | 64 (4.5%) |
| 35 to 39 Years | 123 (8.8%) | 99 (7.0%) |
| 40 to 44 Years | 69 (5.0%) | 97 (6.8%) |
| 45 to 49 Years | 56 (4.0%) | 84 (5.9%) |
| 50 to 54 Years | 78 (5.6%) | 59 (4.2%) |
| 55 to 59 Years | 61 (4.4%) | 55 (3.9%) |
| 60 to 64 Years | 47 (3.4%) | 61 (4.3%) |
| 65 to 69 Years | 23 (1.7%) | 70 (4.9%) |
| 70 to 74 Years | 59 (4.2%) | 33 (2.3%) |
| 75 to 79 Years | 42 (3.0%) | 38 (2.7%) |
| 80 to 84 Years | 13 (0.9%) | 47 (3.3%) |
| 85 Years and over | 16 (1.1%) | 68 (4.8%) |
| Total | 1,395 (100.0%) | 1,419 (100.0%) |
Families and Households in Bath borough
Median Family Size in Bath borough
The median family size in Bath borough is 3.37 persons per family, with single female/mother families (207 | 32.1%) accounting for the largest median family size of 3.68 persons per family. On the other hand, single male/father families (53 | 8.2%) represent the smallest median family size with 2.28 persons per family.
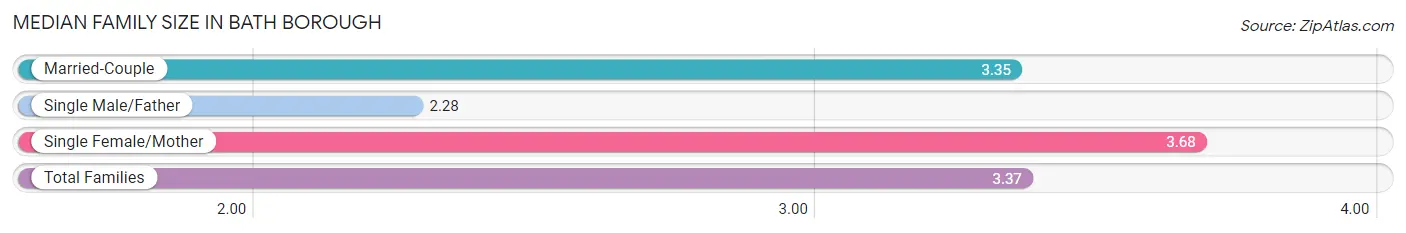
| Family Type | # Families | Family Size |
| Married-Couple | 385 (59.7%) | 3.35 |
| Single Male/Father | 53 (8.2%) | 2.28 |
| Single Female/Mother | 207 (32.1%) | 3.68 |
| Total Families | 645 (100.0%) | 3.37 |
Median Household Size in Bath borough
The median household size in Bath borough is 2.64 persons per household, with single female/mother households (207 | 19.5%) accounting for the largest median household size of 4.17 persons per household. non-family households (418 | 39.3%) represent the smallest median household size with 1.25 persons per household.
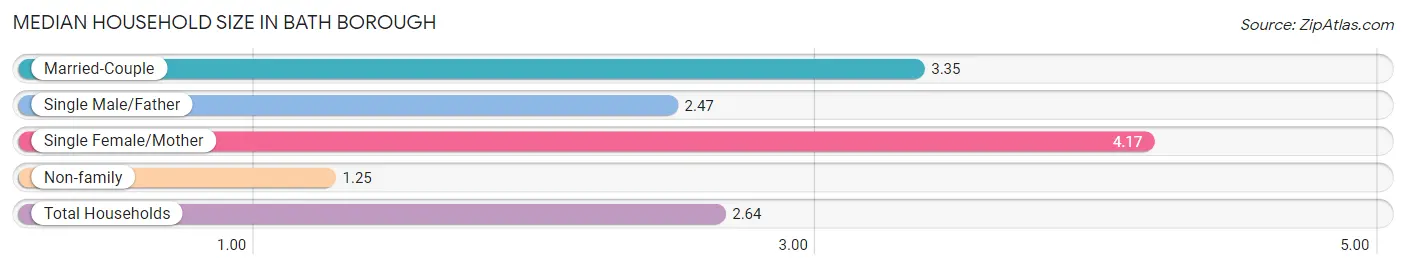
| Household Type | # Households | Household Size |
| Married-Couple | 385 (36.2%) | 3.35 |
| Single Male/Father | 53 (5.0%) | 2.47 |
| Single Female/Mother | 207 (19.5%) | 4.17 |
| Non-family | 418 (39.3%) | 1.25 |
| Total Households | 1,063 (100.0%) | 2.64 |
Household Size by Marriage Status in Bath borough
Out of a total of 1,063 households in Bath borough, 645 (60.7%) are family households, while 418 (39.3%) are nonfamily households. The most numerous type of family households are 2-person households, comprising 232, and the most common type of nonfamily households are 1-person households, comprising 321.
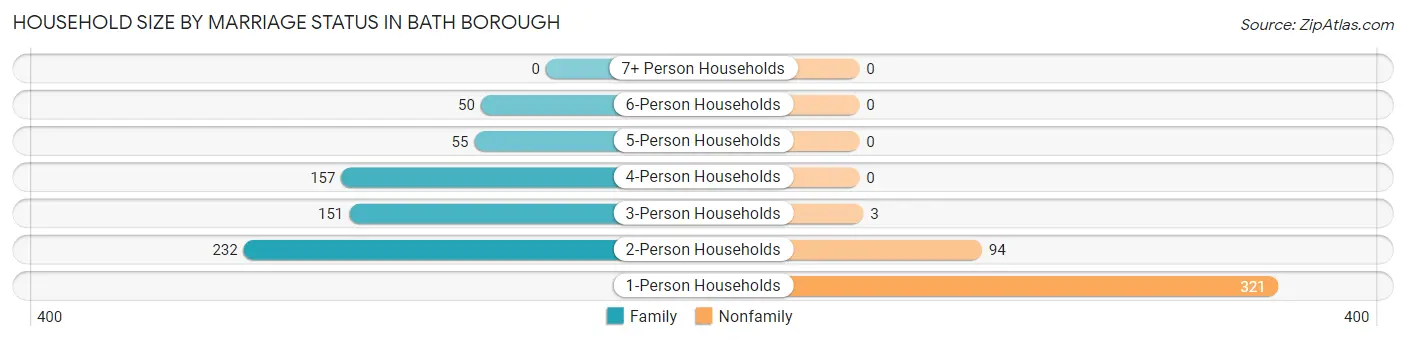
| Household Size | Family Households | Nonfamily Households |
| 1-Person Households | - | 321 (30.2%) |
| 2-Person Households | 232 (21.8%) | 94 (8.8%) |
| 3-Person Households | 151 (14.2%) | 3 (0.3%) |
| 4-Person Households | 157 (14.8%) | 0 (0.0%) |
| 5-Person Households | 55 (5.2%) | 0 (0.0%) |
| 6-Person Households | 50 (4.7%) | 0 (0.0%) |
| 7+ Person Households | 0 (0.0%) | 0 (0.0%) |
| Total | 645 (60.7%) | 418 (39.3%) |
Female Fertility in Bath borough
Fertility by Age in Bath borough
Average fertility rate in Bath borough is 58.0 births per 1,000 women. Women in the age bracket of 20 to 34 years have the highest fertility rate with 130.0 births per 1,000 women. Women in the age bracket of 20 to 34 years acount for 100.0% of all women with births.
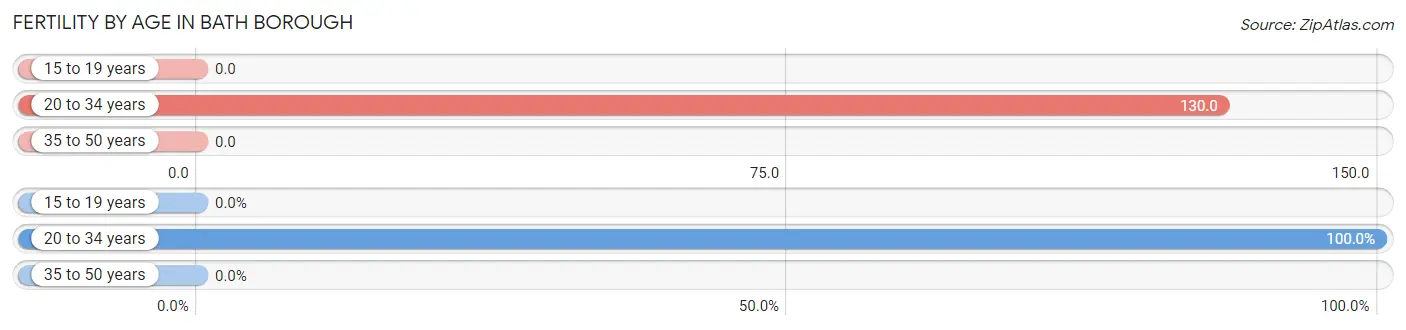
| Age Bracket | Women with Births | Births / 1,000 Women |
| 15 to 19 years | 0 (0.0%) | 0.0 |
| 20 to 34 years | 39 (100.0%) | 130.0 |
| 35 to 50 years | 0 (0.0%) | 0.0 |
| Total | 39 (100.0%) | 58.0 |
Fertility by Age by Marriage Status in Bath borough
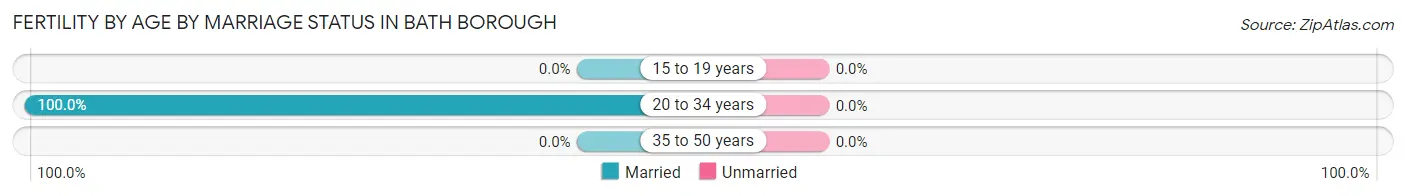
| Age Bracket | Married | Unmarried |
| 15 to 19 years | 0 (0.0%) | 0 (0.0%) |
| 20 to 34 years | 39 (100.0%) | 0 (0.0%) |
| 35 to 50 years | 0 (0.0%) | 0 (0.0%) |
| Total | 39 (100.0%) | 0 (0.0%) |
Fertility by Education in Bath borough
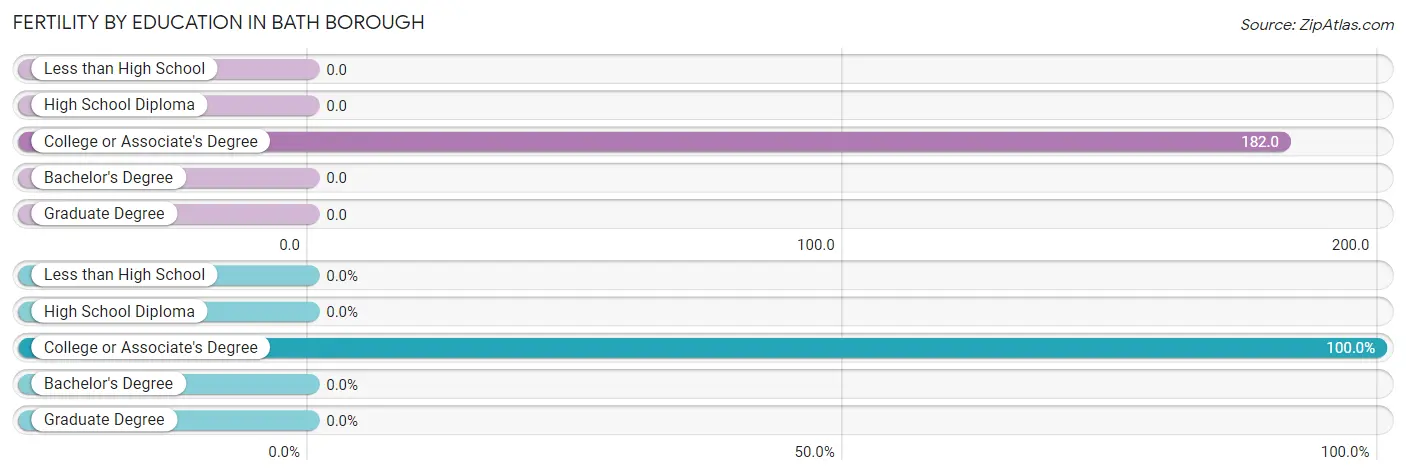
| Educational Attainment | Women with Births | Births / 1,000 Women |
| Less than High School | 0 (0.0%) | 0.0 |
| High School Diploma | 0 (0.0%) | 0.0 |
| College or Associate's Degree | 39 (100.0%) | 182.0 |
| Bachelor's Degree | 0 (0.0%) | 0.0 |
| Graduate Degree | 0 (0.0%) | 0.0 |
| Total | 39 (100.0%) | 58.0 |
Fertility by Education by Marriage Status in Bath borough
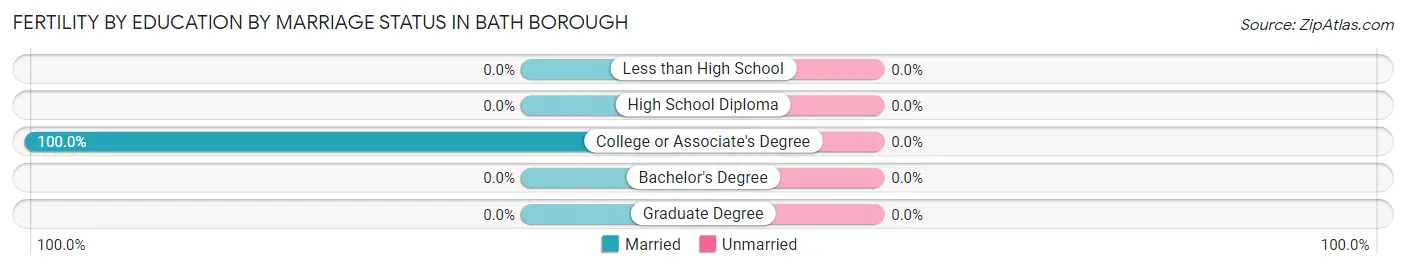
| Educational Attainment | Married | Unmarried |
| Less than High School | 0 (0.0%) | 0 (0.0%) |
| High School Diploma | 0 (0.0%) | 0 (0.0%) |
| College or Associate's Degree | 39 (100.0%) | 0 (0.0%) |
| Bachelor's Degree | 0 (0.0%) | 0 (0.0%) |
| Graduate Degree | 0 (0.0%) | 0 (0.0%) |
| Total | 39 (100.0%) | 0 (0.0%) |
Employment Characteristics in Bath borough
Employment by Class of Employer in Bath borough
Among the 1,270 employed individuals in Bath borough, private company employees (906 | 71.3%), local government employees (134 | 10.5%), and not-for-profit organizations (122 | 9.6%) make up the most common classes of employment.
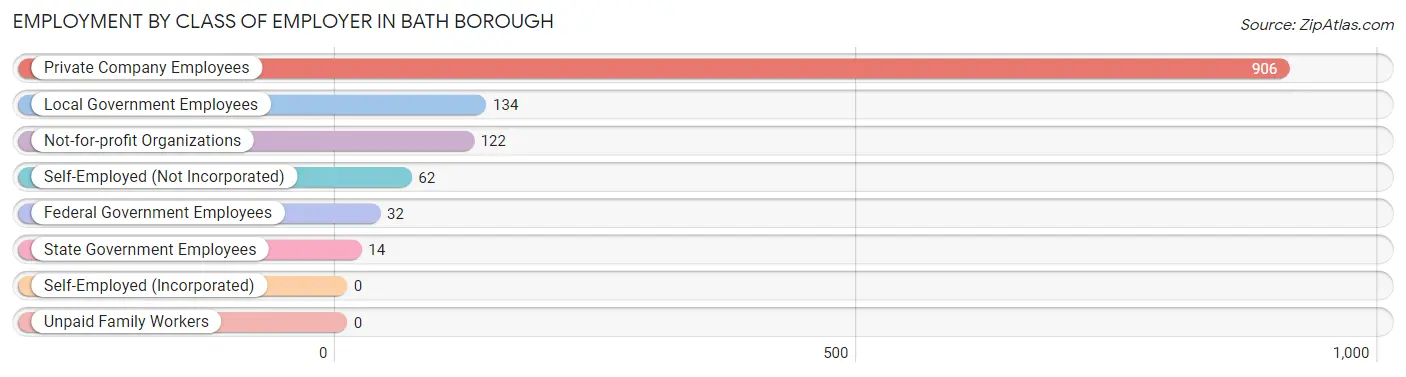
| Employer Class | # Employees | % Employees |
| Private Company Employees | 906 | 71.3% |
| Self-Employed (Incorporated) | 0 | 0.0% |
| Self-Employed (Not Incorporated) | 62 | 4.9% |
| Not-for-profit Organizations | 122 | 9.6% |
| Local Government Employees | 134 | 10.5% |
| State Government Employees | 14 | 1.1% |
| Federal Government Employees | 32 | 2.5% |
| Unpaid Family Workers | 0 | 0.0% |
| Total | 1,270 | 100.0% |
Employment Status by Age in Bath borough
According to the labor force statistics for Bath borough, out of the total population over 16 years of age (2,107), 64.0% or 1,348 individuals are in the labor force, with 5.9% or 80 of them unemployed. The age group with the highest labor force participation rate is 45 to 54 years, with 91.0% or 252 individuals in the labor force. Within the labor force, the 16 to 19 years age range has the highest percentage of unemployed individuals, with 39.3% or 35 of them being unemployed.
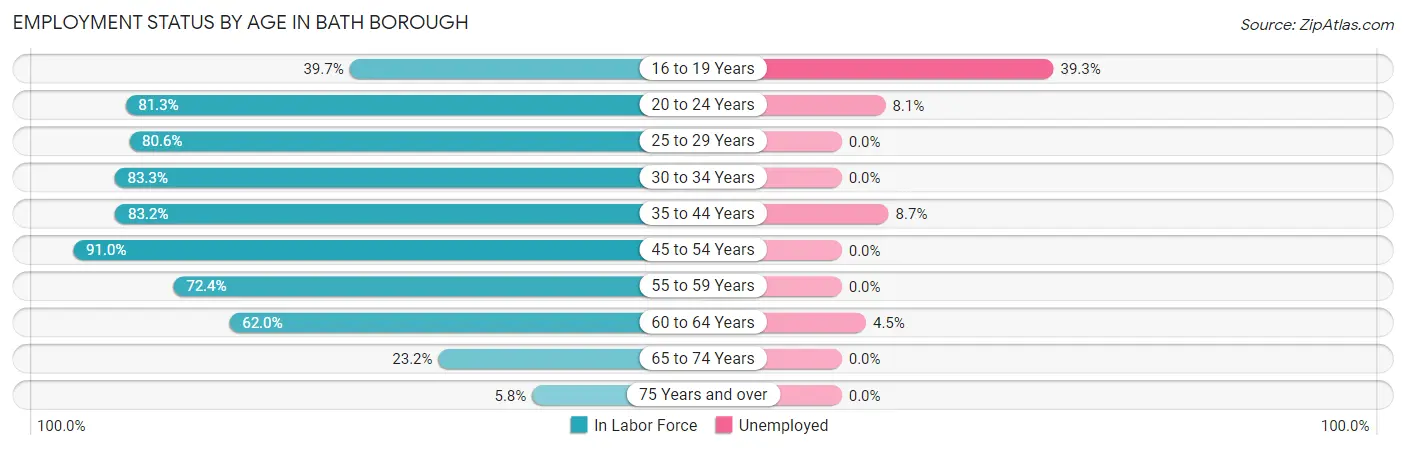
| Age Bracket | In Labor Force | Unemployed |
| 16 to 19 Years | 89 (39.7%) | 35 (39.3%) |
| 20 to 24 Years | 161 (81.3%) | 13 (8.1%) |
| 25 to 29 Years | 162 (80.6%) | 0 (0.0%) |
| 30 to 34 Years | 155 (83.3%) | 0 (0.0%) |
| 35 to 44 Years | 323 (83.2%) | 28 (8.7%) |
| 45 to 54 Years | 252 (91.0%) | 0 (0.0%) |
| 55 to 59 Years | 84 (72.4%) | 0 (0.0%) |
| 60 to 64 Years | 67 (62.0%) | 3 (4.5%) |
| 65 to 74 Years | 43 (23.2%) | 0 (0.0%) |
| 75 Years and over | 13 (5.8%) | 0 (0.0%) |
| Total | 1,348 (64.0%) | 80 (5.9%) |
Employment Status by Educational Attainment in Bath borough
According to labor force statistics for Bath borough, 81.7% of individuals (1,042) out of the total population between 25 and 64 years of age (1,276) are in the labor force, with 3.0% or 31 of them being unemployed. The group with the highest labor force participation rate are those with the educational attainment of bachelor's degree or higher, with 94.7% or 302 individuals in the labor force. Within the labor force, individuals with less than high school education have the highest percentage of unemployment, with 34.9% or 15 of them being unemployed.
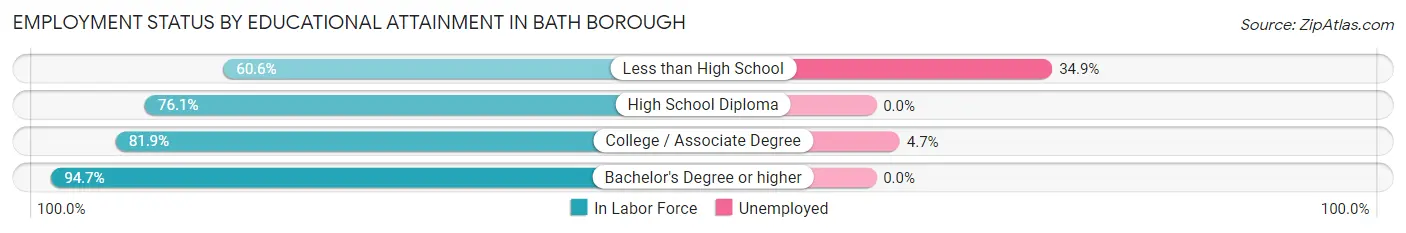
| Educational Attainment | In Labor Force | Unemployed |
| Less than High School | 43 (60.6%) | 25 (34.9%) |
| High School Diploma | 359 (76.1%) | 0 (0.0%) |
| College / Associate Degree | 339 (81.9%) | 19 (4.7%) |
| Bachelor's Degree or higher | 302 (94.7%) | 0 (0.0%) |
| Total | 1,042 (81.7%) | 38 (3.0%) |
Employment Occupations by Sex in Bath borough
Management, Business, Science and Arts Occupations
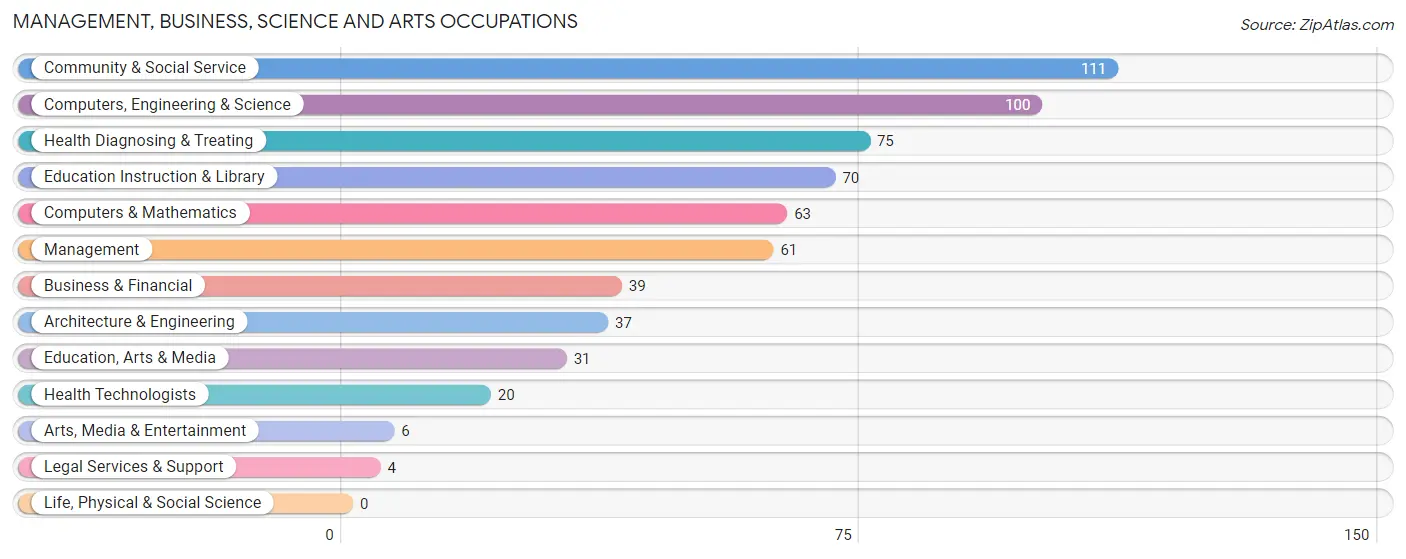
The most common Management, Business, Science and Arts occupations in Bath borough are Community & Social Service (111 | 8.7%), Computers, Engineering & Science (100 | 7.9%), Health Diagnosing & Treating (75 | 5.9%), Education Instruction & Library (70 | 5.5%), and Computers & Mathematics (63 | 5.0%).
Management, Business, Science and Arts Occupations by Sex
Within the Management, Business, Science and Arts occupations in Bath borough, the most male-oriented occupations are Architecture & Engineering (100.0%), Arts, Media & Entertainment (100.0%), and Computers, Engineering & Science (96.0%), while the most female-oriented occupations are Legal Services & Support (100.0%), Health Technologists (100.0%), and Health Diagnosing & Treating (88.0%).
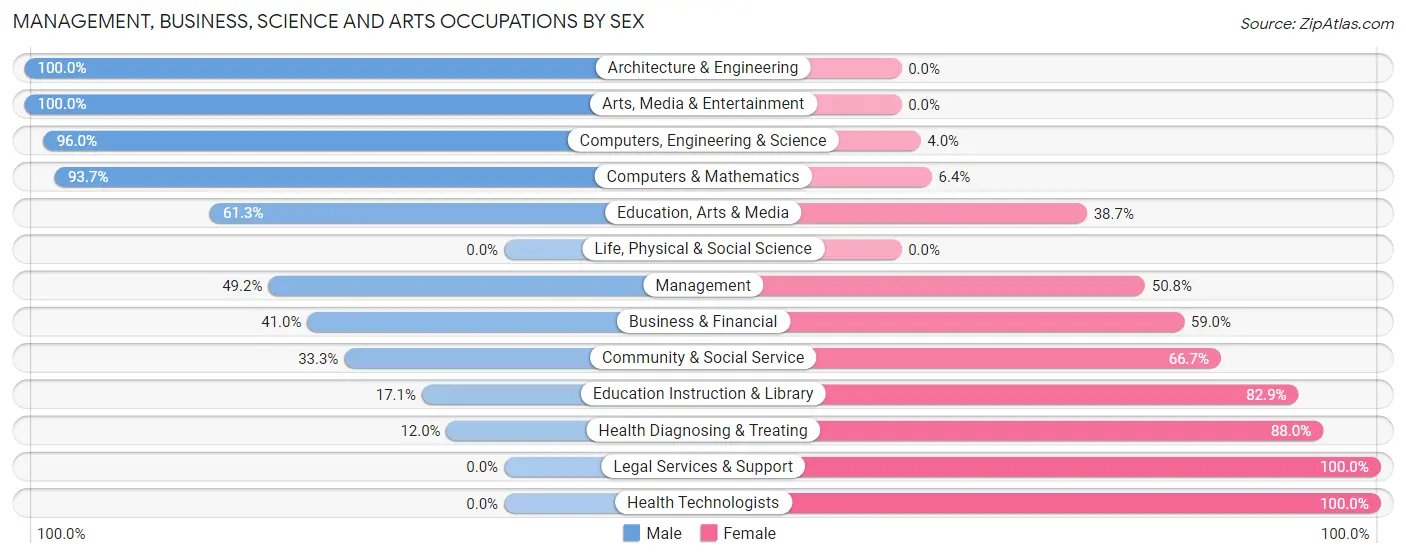
| Occupation | Male | Female |
| Management | 30 (49.2%) | 31 (50.8%) |
| Business & Financial | 16 (41.0%) | 23 (59.0%) |
| Computers, Engineering & Science | 96 (96.0%) | 4 (4.0%) |
| Computers & Mathematics | 59 (93.6%) | 4 (6.4%) |
| Architecture & Engineering | 37 (100.0%) | 0 (0.0%) |
| Life, Physical & Social Science | 0 (0.0%) | 0 (0.0%) |
| Community & Social Service | 37 (33.3%) | 74 (66.7%) |
| Education, Arts & Media | 19 (61.3%) | 12 (38.7%) |
| Legal Services & Support | 0 (0.0%) | 4 (100.0%) |
| Education Instruction & Library | 12 (17.1%) | 58 (82.9%) |
| Arts, Media & Entertainment | 6 (100.0%) | 0 (0.0%) |
| Health Diagnosing & Treating | 9 (12.0%) | 66 (88.0%) |
| Health Technologists | 0 (0.0%) | 20 (100.0%) |
| Total (Category) | 188 (48.7%) | 198 (51.3%) |
| Total (Overall) | 657 (51.7%) | 613 (48.3%) |
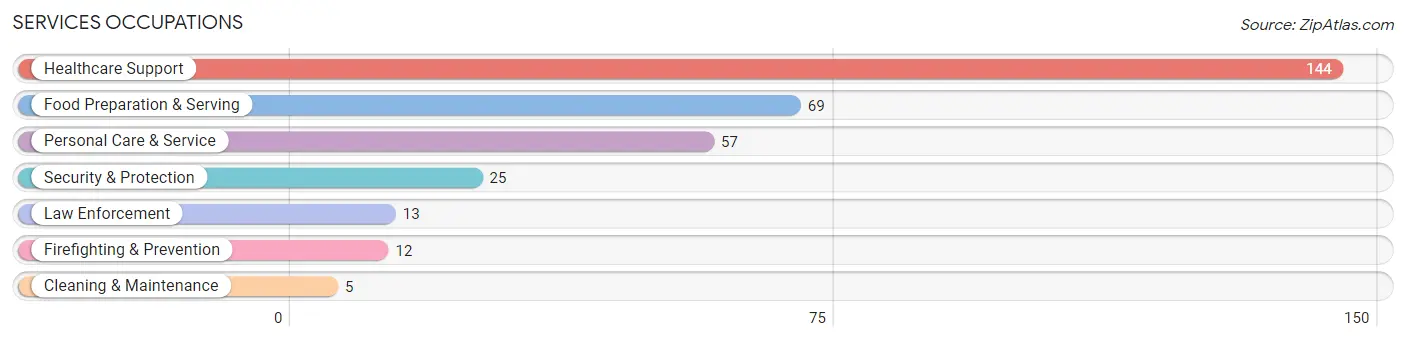
Services Occupations
The most common Services occupations in Bath borough are Healthcare Support (144 | 11.3%), Food Preparation & Serving (69 | 5.4%), Personal Care & Service (57 | 4.5%), Security & Protection (25 | 2.0%), and Law Enforcement (13 | 1.0%).
Services Occupations by Sex
Within the Services occupations in Bath borough, the most male-oriented occupations are Security & Protection (100.0%), Firefighting & Prevention (100.0%), and Law Enforcement (100.0%), while the most female-oriented occupations are Cleaning & Maintenance (100.0%), Healthcare Support (84.7%), and Personal Care & Service (54.4%).
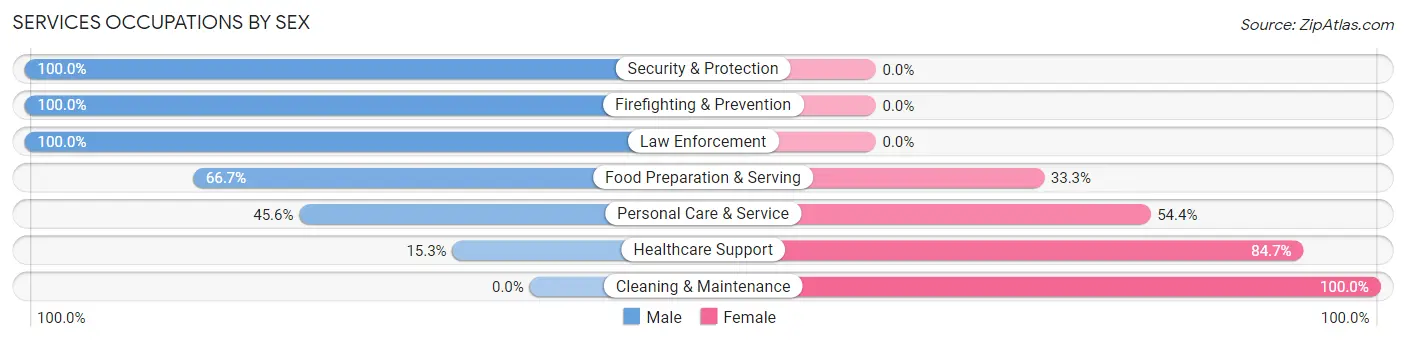
| Occupation | Male | Female |
| Healthcare Support | 22 (15.3%) | 122 (84.7%) |
| Security & Protection | 25 (100.0%) | 0 (0.0%) |
| Firefighting & Prevention | 12 (100.0%) | 0 (0.0%) |
| Law Enforcement | 13 (100.0%) | 0 (0.0%) |
| Food Preparation & Serving | 46 (66.7%) | 23 (33.3%) |
| Cleaning & Maintenance | 0 (0.0%) | 5 (100.0%) |
| Personal Care & Service | 26 (45.6%) | 31 (54.4%) |
| Total (Category) | 119 (39.7%) | 181 (60.3%) |
| Total (Overall) | 657 (51.7%) | 613 (48.3%) |
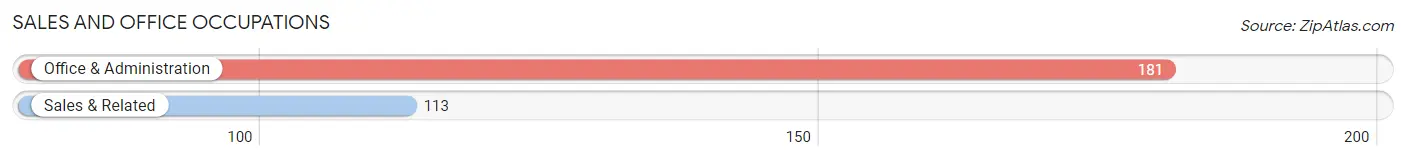
Sales and Office Occupations
The most common Sales and Office occupations in Bath borough are Office & Administration (181 | 14.2%), and Sales & Related (113 | 8.9%).
Sales and Office Occupations by Sex
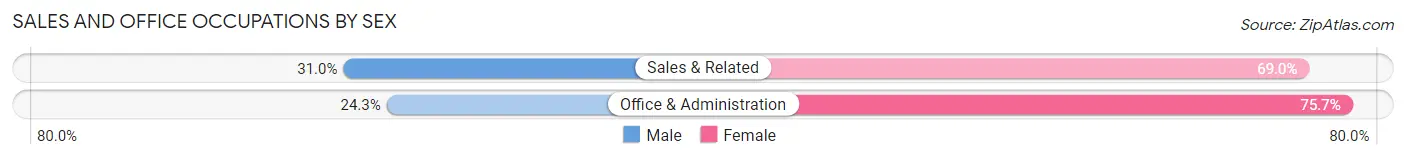
| Occupation | Male | Female |
| Sales & Related | 35 (31.0%) | 78 (69.0%) |
| Office & Administration | 44 (24.3%) | 137 (75.7%) |
| Total (Category) | 79 (26.9%) | 215 (73.1%) |
| Total (Overall) | 657 (51.7%) | 613 (48.3%) |
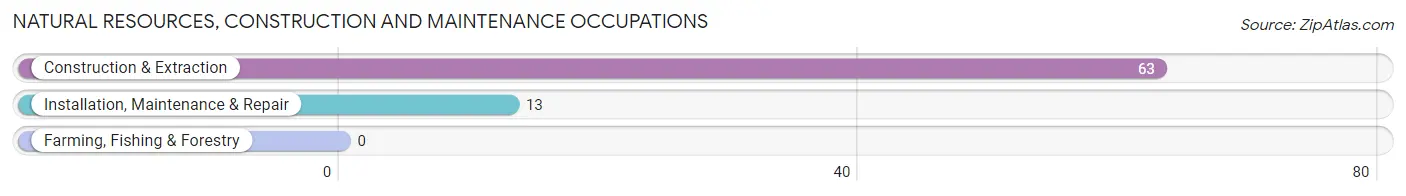
Natural Resources, Construction and Maintenance Occupations
The most common Natural Resources, Construction and Maintenance occupations in Bath borough are Construction & Extraction (63 | 5.0%), and Installation, Maintenance & Repair (13 | 1.0%).
Natural Resources, Construction and Maintenance Occupations by Sex
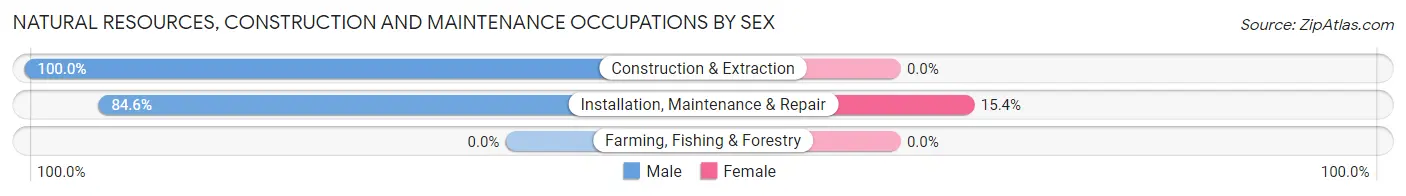
| Occupation | Male | Female |
| Farming, Fishing & Forestry | 0 (0.0%) | 0 (0.0%) |
| Construction & Extraction | 63 (100.0%) | 0 (0.0%) |
| Installation, Maintenance & Repair | 11 (84.6%) | 2 (15.4%) |
| Total (Category) | 74 (97.4%) | 2 (2.6%) |
| Total (Overall) | 657 (51.7%) | 613 (48.3%) |
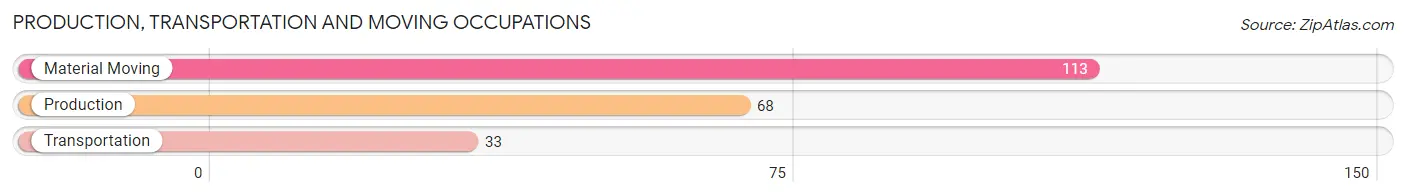
Production, Transportation and Moving Occupations
The most common Production, Transportation and Moving occupations in Bath borough are Material Moving (113 | 8.9%), Production (68 | 5.3%), and Transportation (33 | 2.6%).
Production, Transportation and Moving Occupations by Sex
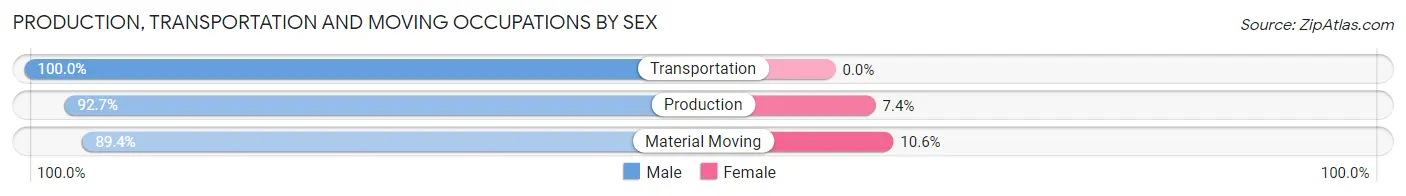
| Occupation | Male | Female |
| Production | 63 (92.6%) | 5 (7.3%) |
| Transportation | 33 (100.0%) | 0 (0.0%) |
| Material Moving | 101 (89.4%) | 12 (10.6%) |
| Total (Category) | 197 (92.1%) | 17 (7.9%) |
| Total (Overall) | 657 (51.7%) | 613 (48.3%) |
Employment Industries by Sex in Bath borough
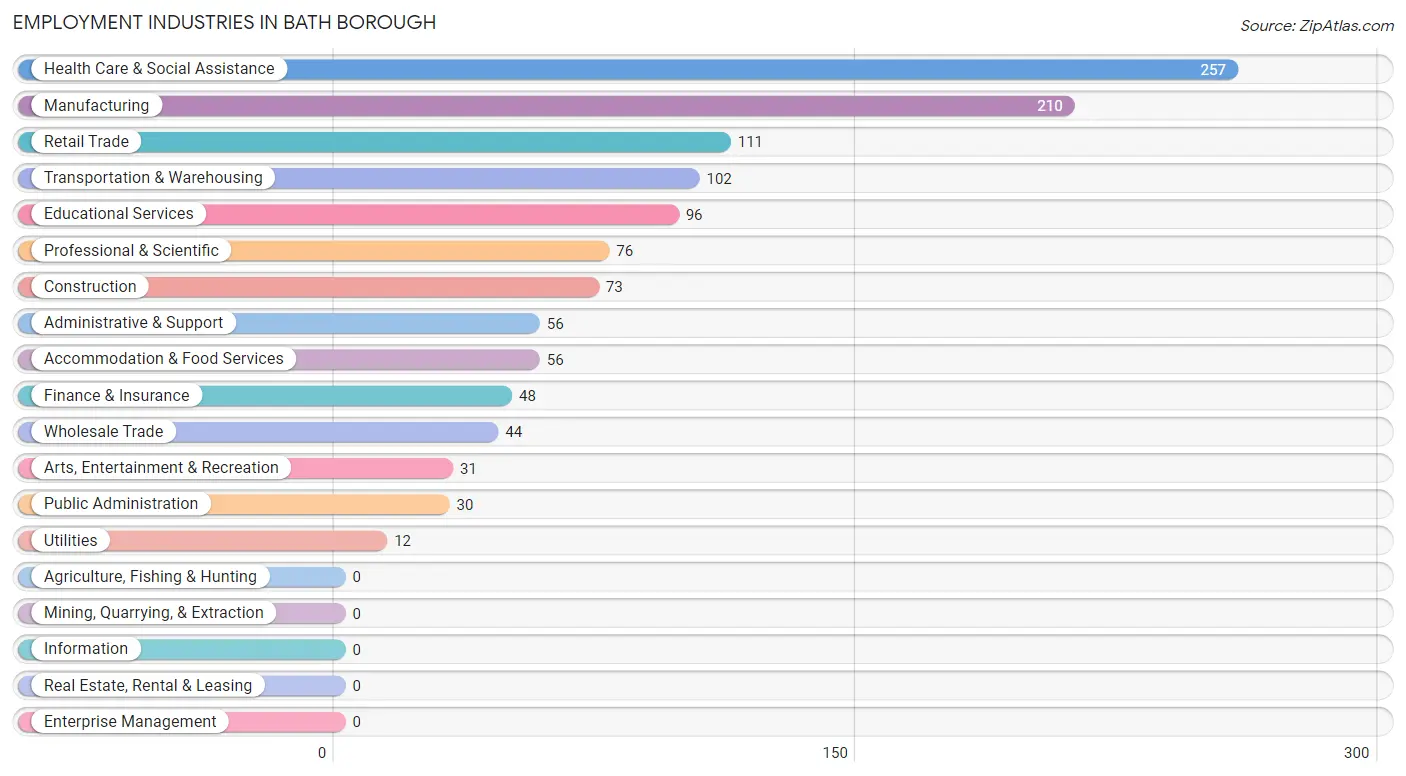
Employment Industries in Bath borough
The major employment industries in Bath borough include Health Care & Social Assistance (257 | 20.2%), Manufacturing (210 | 16.5%), Retail Trade (111 | 8.7%), Transportation & Warehousing (102 | 8.0%), and Educational Services (96 | 7.6%).
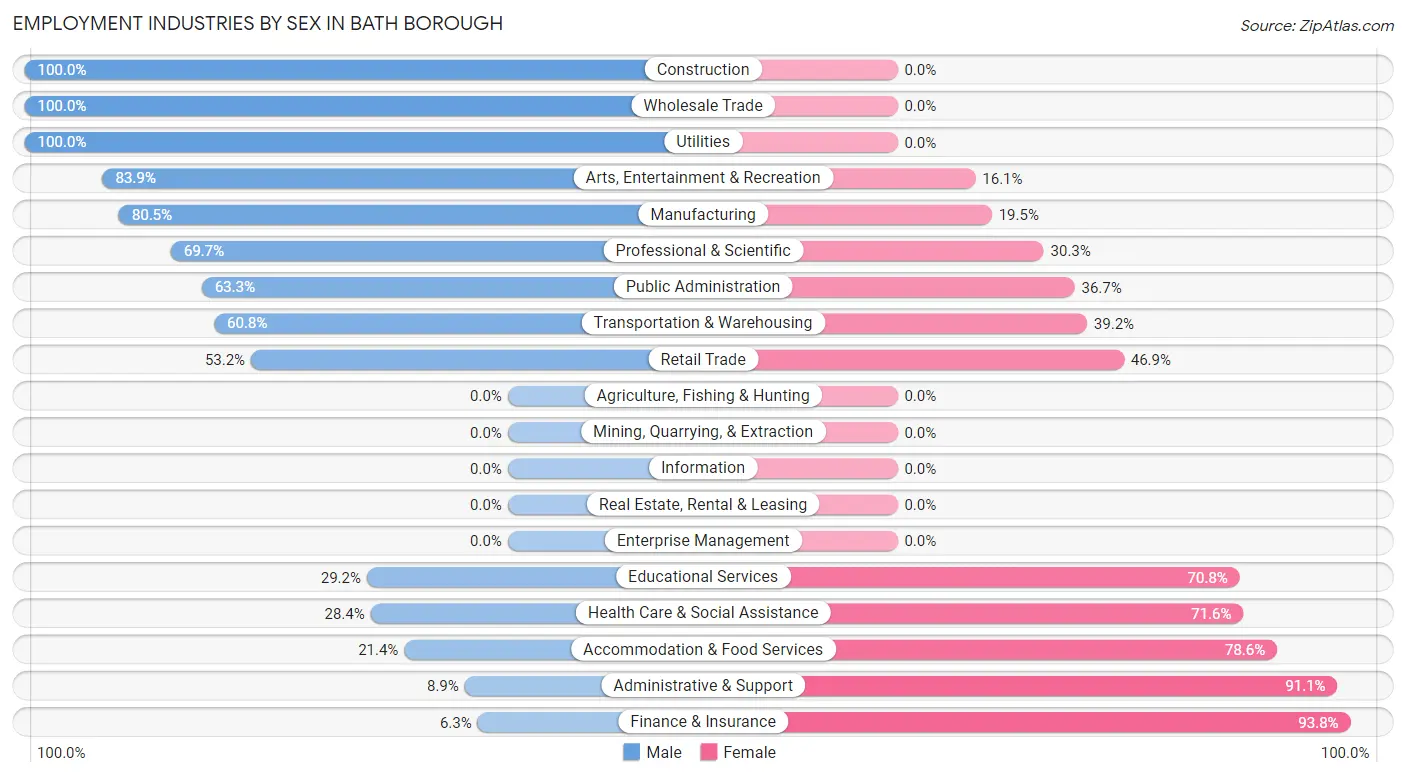
Employment Industries by Sex in Bath borough
The Bath borough industries that see more men than women are Construction (100.0%), Wholesale Trade (100.0%), and Utilities (100.0%), whereas the industries that tend to have a higher number of women are Finance & Insurance (93.8%), Administrative & Support (91.1%), and Accommodation & Food Services (78.6%).
| Industry | Male | Female |
| Agriculture, Fishing & Hunting | 0 (0.0%) | 0 (0.0%) |
| Mining, Quarrying, & Extraction | 0 (0.0%) | 0 (0.0%) |
| Construction | 73 (100.0%) | 0 (0.0%) |
| Manufacturing | 169 (80.5%) | 41 (19.5%) |
| Wholesale Trade | 44 (100.0%) | 0 (0.0%) |
| Retail Trade | 59 (53.1%) | 52 (46.9%) |
| Transportation & Warehousing | 62 (60.8%) | 40 (39.2%) |
| Utilities | 12 (100.0%) | 0 (0.0%) |
| Information | 0 (0.0%) | 0 (0.0%) |
| Finance & Insurance | 3 (6.2%) | 45 (93.8%) |
| Real Estate, Rental & Leasing | 0 (0.0%) | 0 (0.0%) |
| Professional & Scientific | 53 (69.7%) | 23 (30.3%) |
| Enterprise Management | 0 (0.0%) | 0 (0.0%) |
| Administrative & Support | 5 (8.9%) | 51 (91.1%) |
| Educational Services | 28 (29.2%) | 68 (70.8%) |
| Health Care & Social Assistance | 73 (28.4%) | 184 (71.6%) |
| Arts, Entertainment & Recreation | 26 (83.9%) | 5 (16.1%) |
| Accommodation & Food Services | 12 (21.4%) | 44 (78.6%) |
| Public Administration | 19 (63.3%) | 11 (36.7%) |
| Total | 657 (51.7%) | 613 (48.3%) |
Education in Bath borough
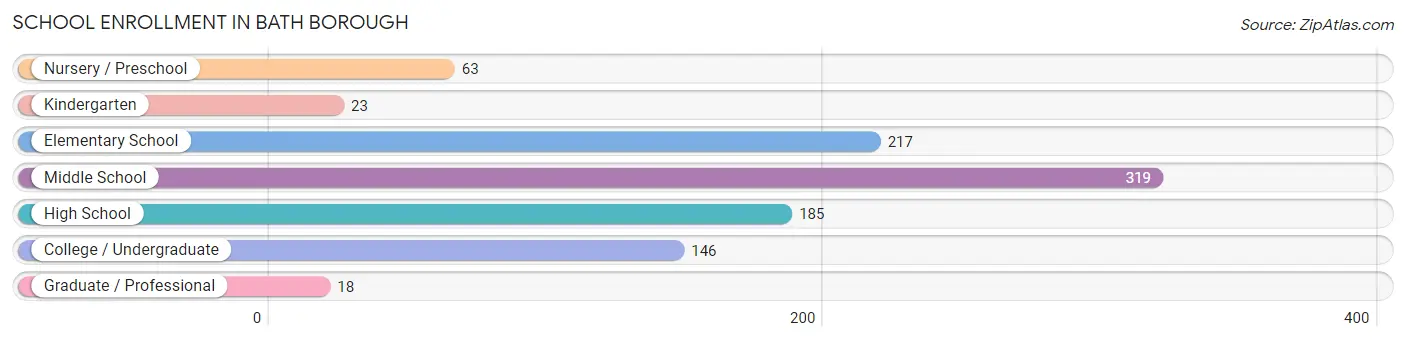
School Enrollment in Bath borough
The most common levels of schooling among the 971 students in Bath borough are middle school (319 | 32.9%), elementary school (217 | 22.4%), and high school (185 | 19.1%).
| School Level | # Students | % Students |
| Nursery / Preschool | 63 | 6.5% |
| Kindergarten | 23 | 2.4% |
| Elementary School | 217 | 22.4% |
| Middle School | 319 | 32.9% |
| High School | 185 | 19.1% |
| College / Undergraduate | 146 | 15.0% |
| Graduate / Professional | 18 | 1.8% |
| Total | 971 | 100.0% |
School Enrollment by Age by Funding Source in Bath borough
Out of a total of 971 students who are enrolled in schools in Bath borough, 84 (8.7%) attend a private institution, while the remaining 887 (91.3%) are enrolled in public schools. The age group of 3 to 4 year olds has the highest likelihood of being enrolled in private schools, with 38 (84.4% in the age bracket) enrolled. Conversely, the age group of 18 to 19 year olds has the lowest likelihood of being enrolled in a private school, with 46 (100.0% in the age bracket) attending a public institution.
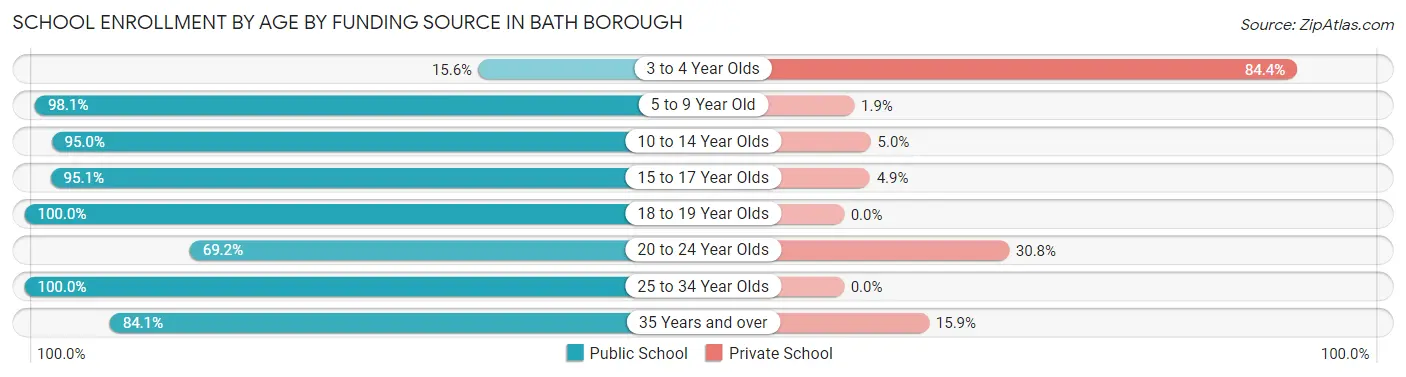
| Age Bracket | Public School | Private School |
| 3 to 4 Year Olds | 7 (15.6%) | 38 (84.4%) |
| 5 to 9 Year Old | 253 (98.1%) | 5 (1.9%) |
| 10 to 14 Year Olds | 303 (95.0%) | 16 (5.0%) |
| 15 to 17 Year Olds | 137 (95.1%) | 7 (4.9%) |
| 18 to 19 Year Olds | 46 (100.0%) | 0 (0.0%) |
| 20 to 24 Year Olds | 18 (69.2%) | 8 (30.8%) |
| 25 to 34 Year Olds | 70 (100.0%) | 0 (0.0%) |
| 35 Years and over | 53 (84.1%) | 10 (15.9%) |
| Total | 887 (91.3%) | 84 (8.7%) |
Educational Attainment by Field of Study in Bath borough
Bio, nature & agricultural (92 | 21.6%), engineering (59 | 13.9%), business (54 | 12.7%), science & technology (49 | 11.5%), and education (35 | 8.2%) are the most common fields of study among 426 individuals in Bath borough who have obtained a bachelor's degree or higher.
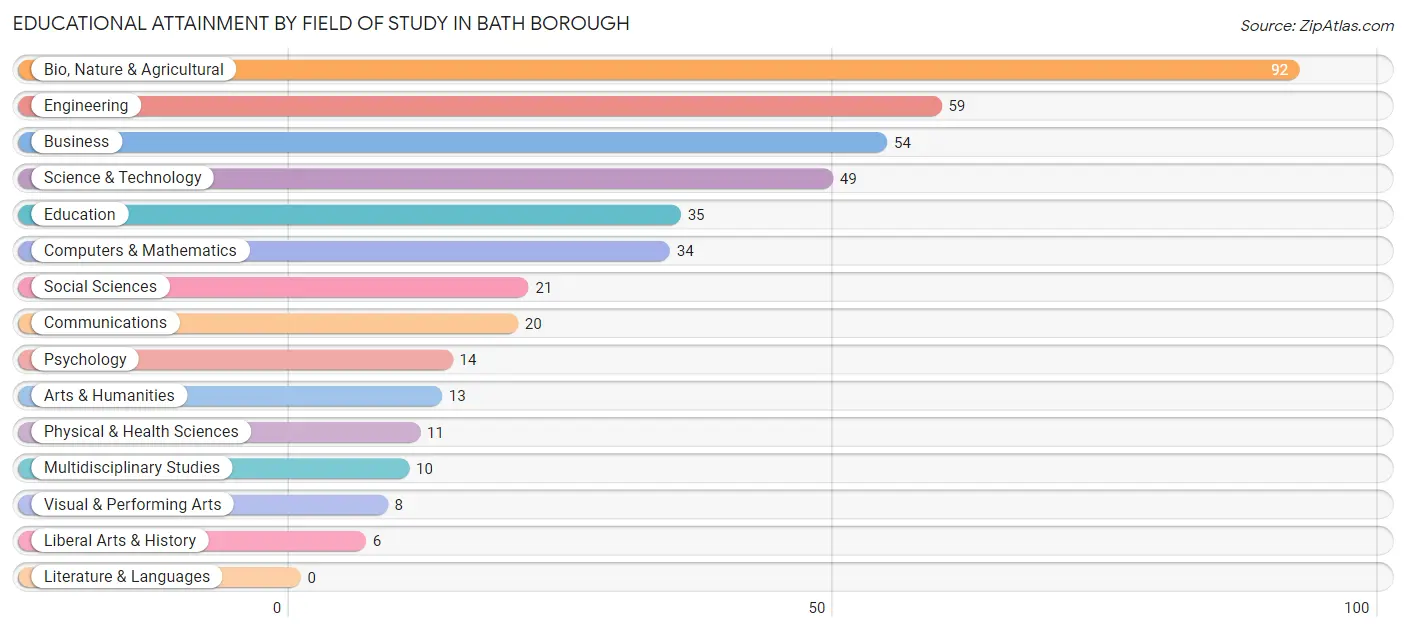
| Field of Study | # Graduates | % Graduates |
| Computers & Mathematics | 34 | 8.0% |
| Bio, Nature & Agricultural | 92 | 21.6% |
| Physical & Health Sciences | 11 | 2.6% |
| Psychology | 14 | 3.3% |
| Social Sciences | 21 | 4.9% |
| Engineering | 59 | 13.9% |
| Multidisciplinary Studies | 10 | 2.4% |
| Science & Technology | 49 | 11.5% |
| Business | 54 | 12.7% |
| Education | 35 | 8.2% |
| Literature & Languages | 0 | 0.0% |
| Liberal Arts & History | 6 | 1.4% |
| Visual & Performing Arts | 8 | 1.9% |
| Communications | 20 | 4.7% |
| Arts & Humanities | 13 | 3.0% |
| Total | 426 | 100.0% |
Transportation & Commute in Bath borough
Vehicle Availability by Sex in Bath borough
The most prevalent vehicle ownership categories in Bath borough are males with 2 vehicles (301, accounting for 45.8%) and females with 2 vehicles (375, making up 49.1%).
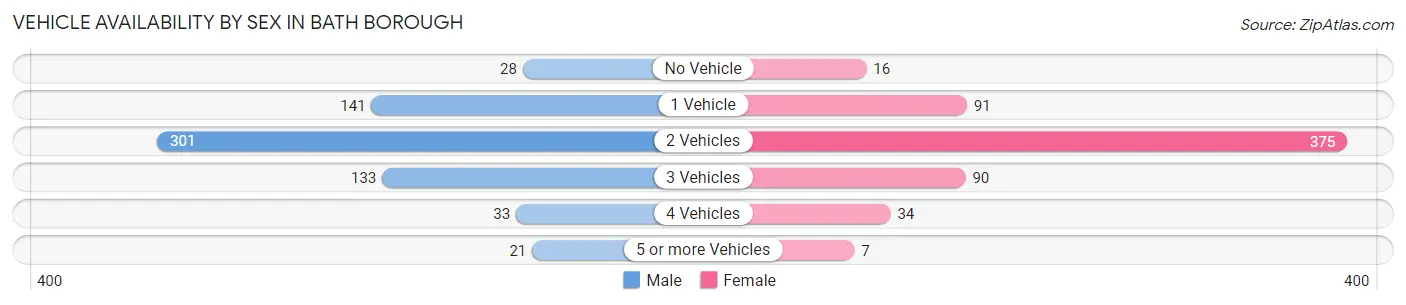
| Vehicles Available | Male | Female |
| No Vehicle | 28 (4.3%) | 16 (2.6%) |
| 1 Vehicle | 141 (21.5%) | 91 (14.8%) |
| 2 Vehicles | 301 (45.8%) | 375 (61.2%) |
| 3 Vehicles | 133 (20.2%) | 90 (14.7%) |
| 4 Vehicles | 33 (5.0%) | 34 (5.6%) |
| 5 or more Vehicles | 21 (3.2%) | 7 (1.1%) |
| Total | 657 (100.0%) | 613 (100.0%) |
Commute Time in Bath borough
The most frequently occuring commute durations in Bath borough are 20 to 24 minutes (220 commuters, 18.7%), 5 to 9 minutes (176 commuters, 15.0%), and 30 to 34 minutes (150 commuters, 12.8%).
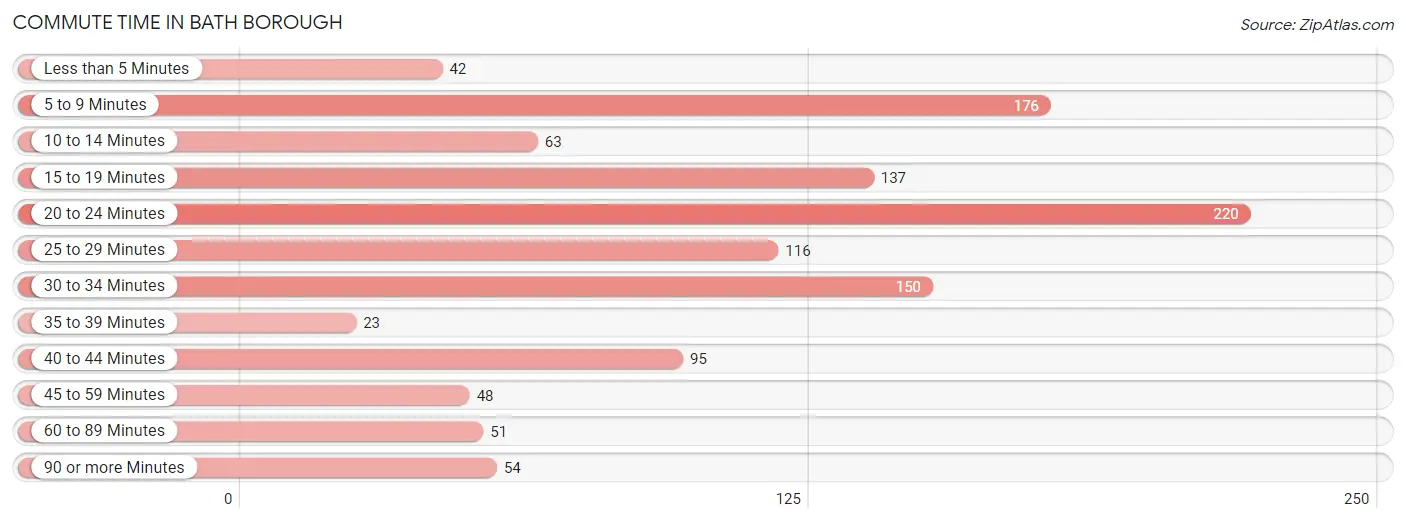
| Commute Time | # Commuters | % Commuters |
| Less than 5 Minutes | 42 | 3.6% |
| 5 to 9 Minutes | 176 | 15.0% |
| 10 to 14 Minutes | 63 | 5.4% |
| 15 to 19 Minutes | 137 | 11.7% |
| 20 to 24 Minutes | 220 | 18.7% |
| 25 to 29 Minutes | 116 | 9.9% |
| 30 to 34 Minutes | 150 | 12.8% |
| 35 to 39 Minutes | 23 | 2.0% |
| 40 to 44 Minutes | 95 | 8.1% |
| 45 to 59 Minutes | 48 | 4.1% |
| 60 to 89 Minutes | 51 | 4.3% |
| 90 or more Minutes | 54 | 4.6% |
Commute Time by Sex in Bath borough
The most common commute times in Bath borough are 20 to 24 minutes (113 commuters, 18.7%) for males and 20 to 24 minutes (107 commuters, 18.8%) for females.
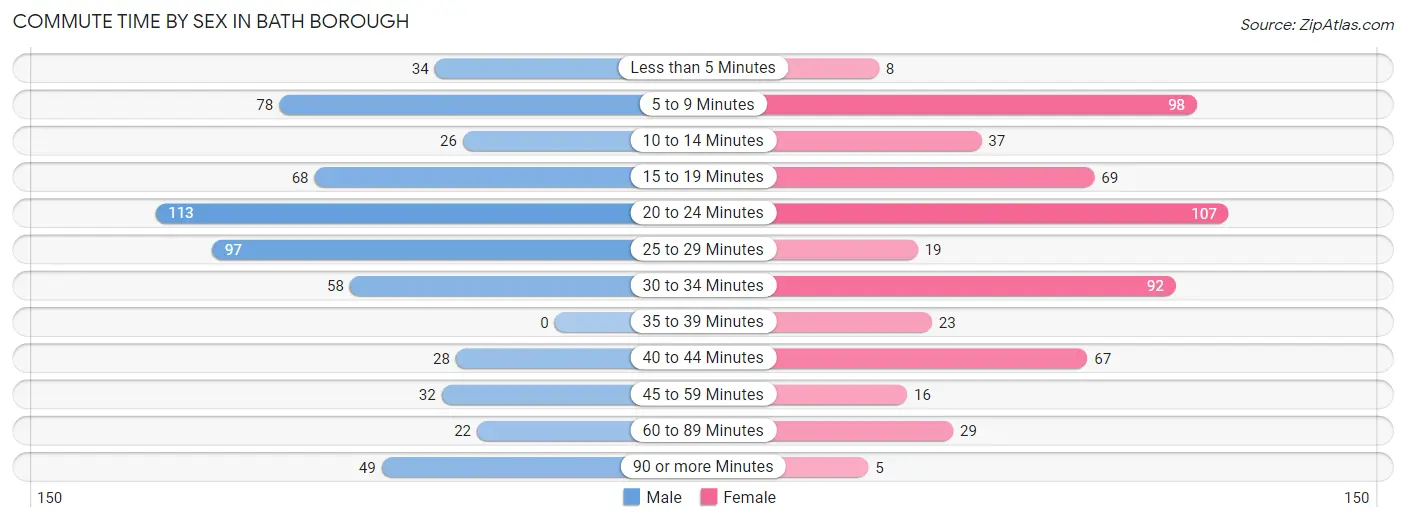
| Commute Time | Male | Female |
| Less than 5 Minutes | 34 (5.6%) | 8 (1.4%) |
| 5 to 9 Minutes | 78 (12.9%) | 98 (17.2%) |
| 10 to 14 Minutes | 26 (4.3%) | 37 (6.5%) |
| 15 to 19 Minutes | 68 (11.2%) | 69 (12.1%) |
| 20 to 24 Minutes | 113 (18.7%) | 107 (18.8%) |
| 25 to 29 Minutes | 97 (16.0%) | 19 (3.3%) |
| 30 to 34 Minutes | 58 (9.6%) | 92 (16.1%) |
| 35 to 39 Minutes | 0 (0.0%) | 23 (4.0%) |
| 40 to 44 Minutes | 28 (4.6%) | 67 (11.7%) |
| 45 to 59 Minutes | 32 (5.3%) | 16 (2.8%) |
| 60 to 89 Minutes | 22 (3.6%) | 29 (5.1%) |
| 90 or more Minutes | 49 (8.1%) | 5 (0.9%) |
Time of Departure to Work by Sex in Bath borough
The most frequent times of departure to work in Bath borough are 7:00 AM to 7:29 AM (152, 25.1%) for males and 6:30 AM to 6:59 AM (83, 14.6%) for females.
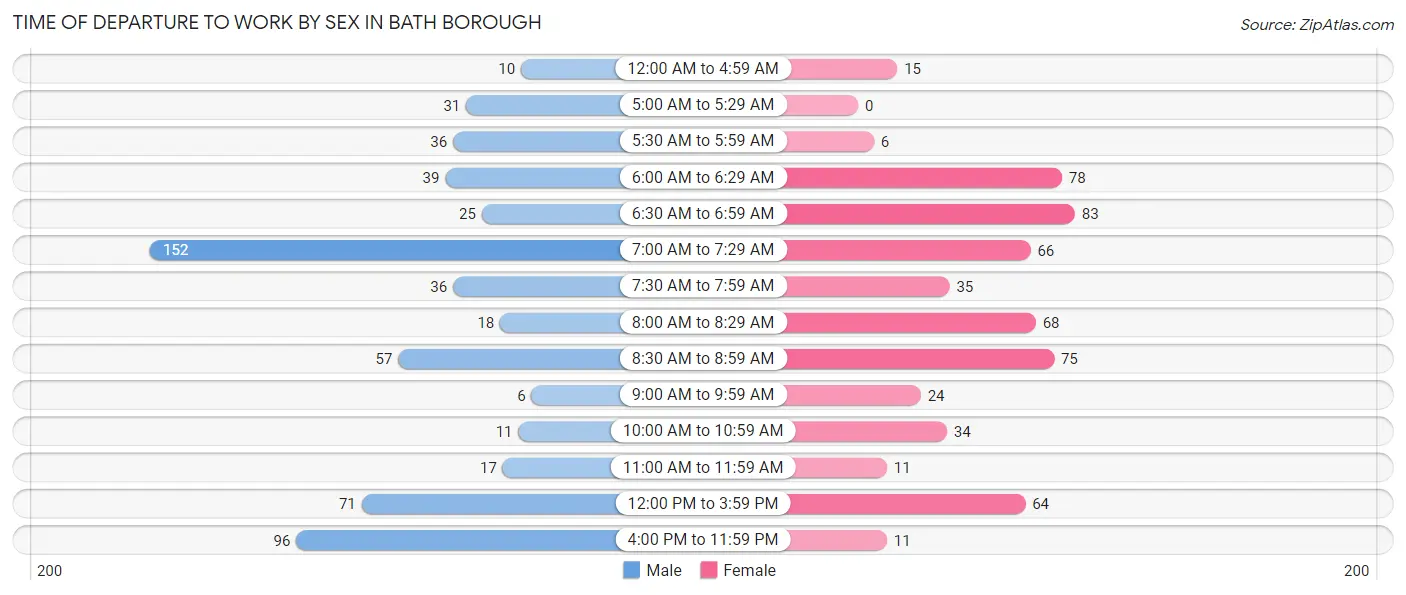
| Time of Departure | Male | Female |
| 12:00 AM to 4:59 AM | 10 (1.7%) | 15 (2.6%) |
| 5:00 AM to 5:29 AM | 31 (5.1%) | 0 (0.0%) |
| 5:30 AM to 5:59 AM | 36 (5.9%) | 6 (1.1%) |
| 6:00 AM to 6:29 AM | 39 (6.5%) | 78 (13.7%) |
| 6:30 AM to 6:59 AM | 25 (4.1%) | 83 (14.6%) |
| 7:00 AM to 7:29 AM | 152 (25.1%) | 66 (11.6%) |
| 7:30 AM to 7:59 AM | 36 (5.9%) | 35 (6.1%) |
| 8:00 AM to 8:29 AM | 18 (3.0%) | 68 (11.9%) |
| 8:30 AM to 8:59 AM | 57 (9.4%) | 75 (13.2%) |
| 9:00 AM to 9:59 AM | 6 (1.0%) | 24 (4.2%) |
| 10:00 AM to 10:59 AM | 11 (1.8%) | 34 (6.0%) |
| 11:00 AM to 11:59 AM | 17 (2.8%) | 11 (1.9%) |
| 12:00 PM to 3:59 PM | 71 (11.7%) | 64 (11.2%) |
| 4:00 PM to 11:59 PM | 96 (15.9%) | 11 (1.9%) |
| Total | 605 (100.0%) | 570 (100.0%) |
Housing Occupancy in Bath borough
Occupancy by Ownership in Bath borough
Of the total 1,063 dwellings in Bath borough, owner-occupied units account for 598 (56.3%), while renter-occupied units make up 465 (43.7%).
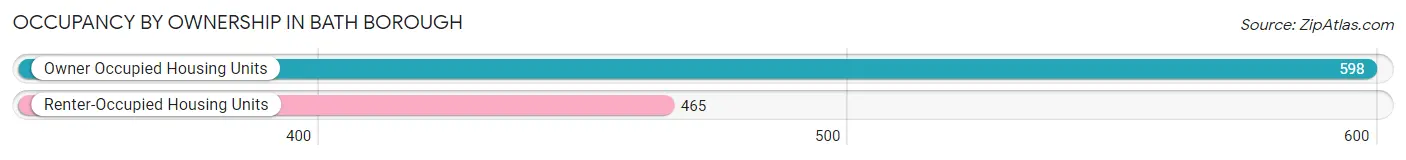
| Occupancy | # Housing Units | % Housing Units |
| Owner Occupied Housing Units | 598 | 56.3% |
| Renter-Occupied Housing Units | 465 | 43.7% |
| Total Occupied Housing Units | 1,063 | 100.0% |
Occupancy by Household Size in Bath borough
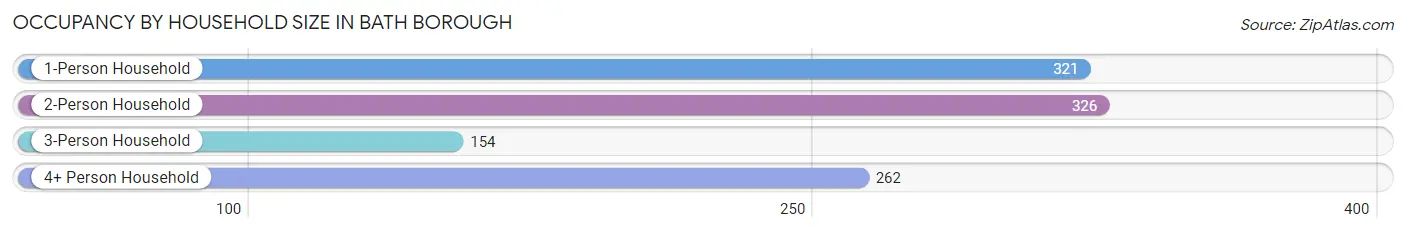
| Household Size | # Housing Units | % Housing Units |
| 1-Person Household | 321 | 30.2% |
| 2-Person Household | 326 | 30.7% |
| 3-Person Household | 154 | 14.5% |
| 4+ Person Household | 262 | 24.6% |
| Total Housing Units | 1,063 | 100.0% |
Occupancy by Ownership by Household Size in Bath borough
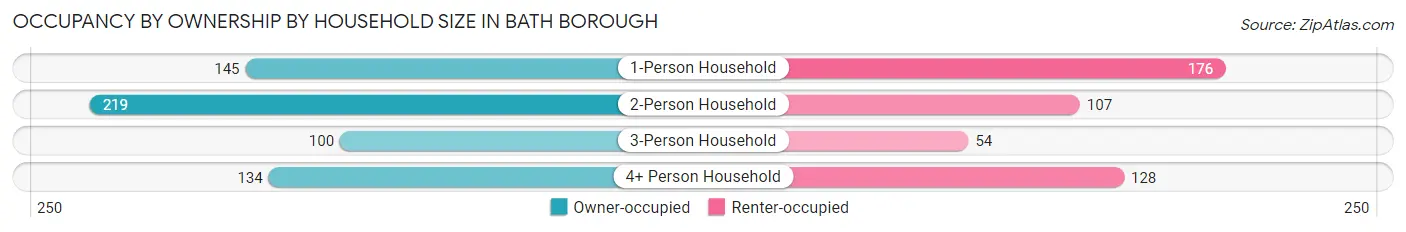
| Household Size | Owner-occupied | Renter-occupied |
| 1-Person Household | 145 (45.2%) | 176 (54.8%) |
| 2-Person Household | 219 (67.2%) | 107 (32.8%) |
| 3-Person Household | 100 (64.9%) | 54 (35.1%) |
| 4+ Person Household | 134 (51.1%) | 128 (48.8%) |
| Total Housing Units | 598 (56.3%) | 465 (43.7%) |
Occupancy by Educational Attainment in Bath borough
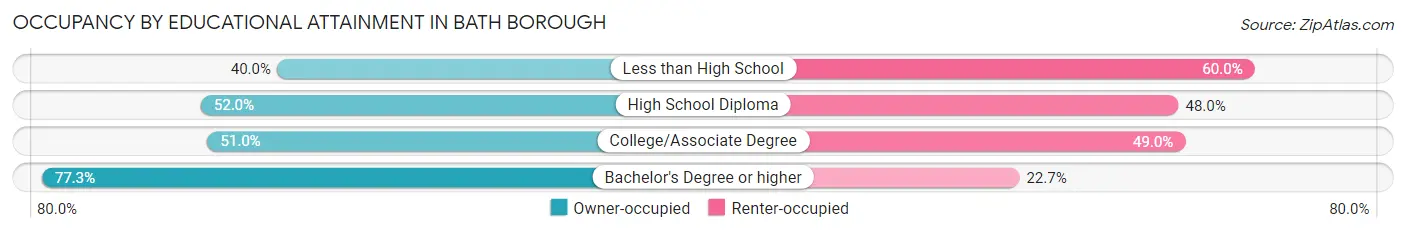
| Household Size | Owner-occupied | Renter-occupied |
| Less than High School | 42 (40.0%) | 63 (60.0%) |
| High School Diploma | 191 (52.0%) | 176 (48.0%) |
| College/Associate Degree | 178 (51.0%) | 171 (49.0%) |
| Bachelor's Degree or higher | 187 (77.3%) | 55 (22.7%) |
Occupancy by Age of Householder in Bath borough
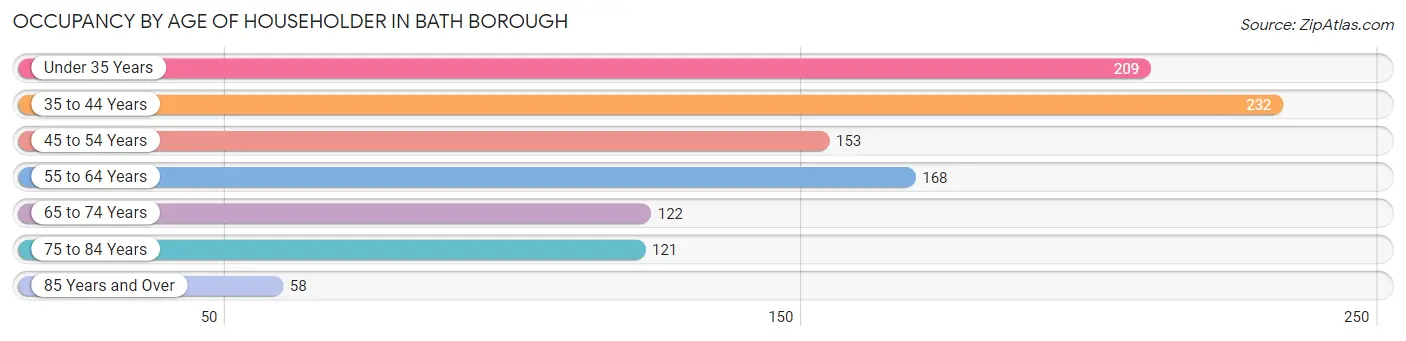
| Age Bracket | # Households | % Households |
| Under 35 Years | 209 | 19.7% |
| 35 to 44 Years | 232 | 21.8% |
| 45 to 54 Years | 153 | 14.4% |
| 55 to 64 Years | 168 | 15.8% |
| 65 to 74 Years | 122 | 11.5% |
| 75 to 84 Years | 121 | 11.4% |
| 85 Years and Over | 58 | 5.5% |
| Total | 1,063 | 100.0% |
Housing Finances in Bath borough
Median Income by Occupancy in Bath borough
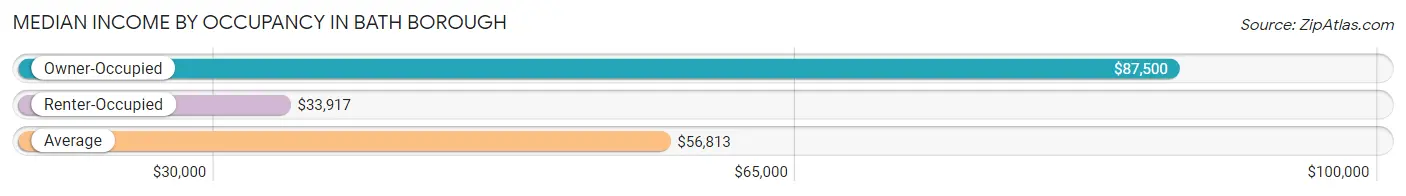
| Occupancy Type | # Households | Median Income |
| Owner-Occupied | 598 (56.3%) | $87,500 |
| Renter-Occupied | 465 (43.7%) | $33,917 |
| Average | 1,063 (100.0%) | $56,813 |
Occupancy by Householder Income Bracket in Bath borough
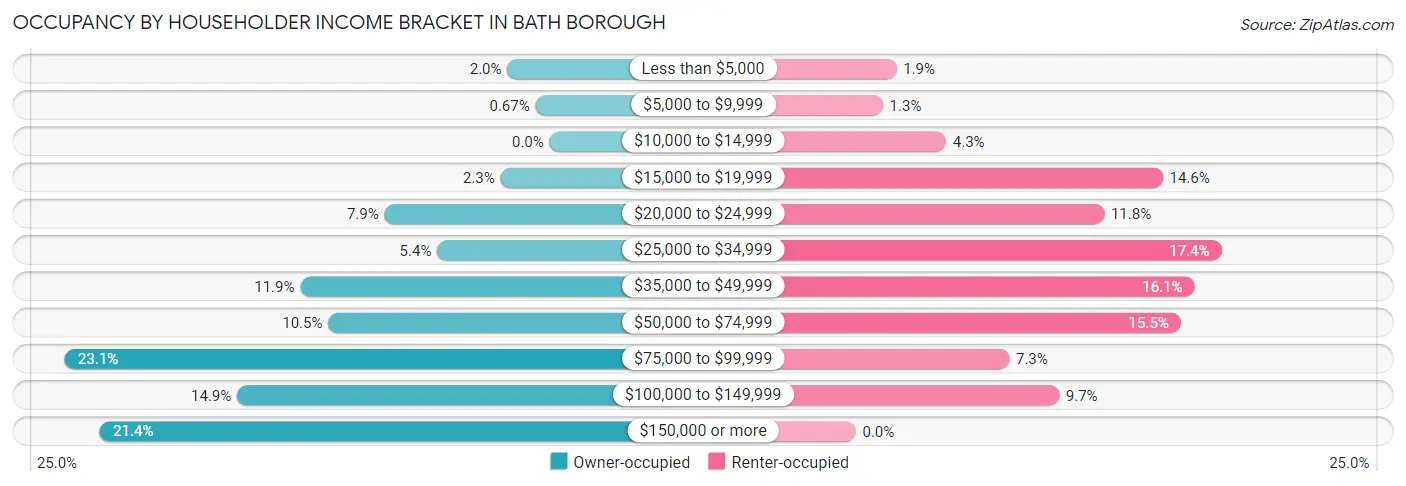
| Income Bracket | Owner-occupied | Renter-occupied |
| Less than $5,000 | 12 (2.0%) | 9 (1.9%) |
| $5,000 to $9,999 | 4 (0.7%) | 6 (1.3%) |
| $10,000 to $14,999 | 0 (0.0%) | 20 (4.3%) |
| $15,000 to $19,999 | 14 (2.3%) | 68 (14.6%) |
| $20,000 to $24,999 | 47 (7.9%) | 55 (11.8%) |
| $25,000 to $34,999 | 32 (5.3%) | 81 (17.4%) |
| $35,000 to $49,999 | 71 (11.9%) | 75 (16.1%) |
| $50,000 to $74,999 | 63 (10.5%) | 72 (15.5%) |
| $75,000 to $99,999 | 138 (23.1%) | 34 (7.3%) |
| $100,000 to $149,999 | 89 (14.9%) | 45 (9.7%) |
| $150,000 or more | 128 (21.4%) | 0 (0.0%) |
| Total | 598 (100.0%) | 465 (100.0%) |
Monthly Housing Cost Tiers in Bath borough
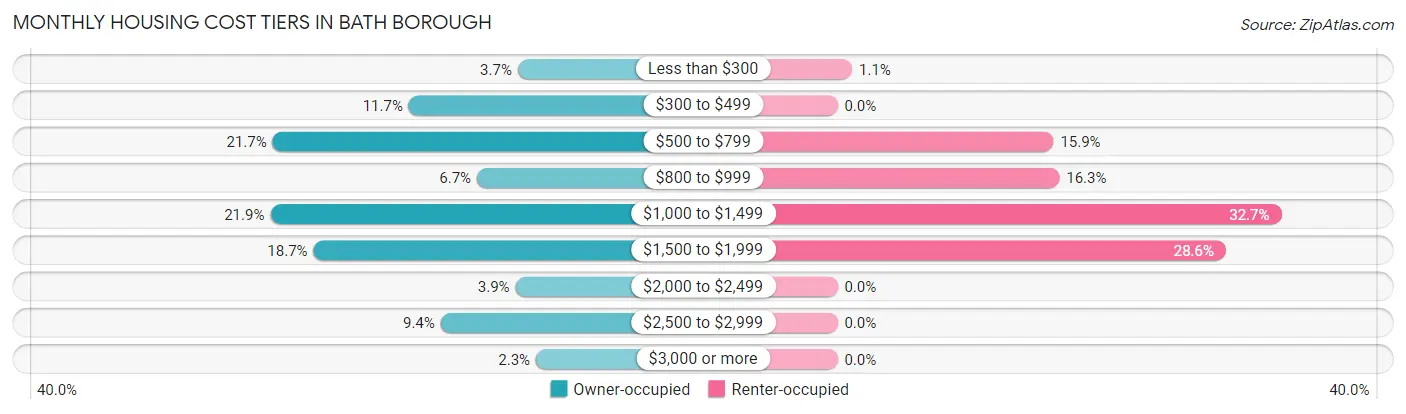
| Monthly Cost | Owner-occupied | Renter-occupied |
| Less than $300 | 22 (3.7%) | 5 (1.1%) |
| $300 to $499 | 70 (11.7%) | 0 (0.0%) |
| $500 to $799 | 130 (21.7%) | 74 (15.9%) |
| $800 to $999 | 40 (6.7%) | 76 (16.3%) |
| $1,000 to $1,499 | 131 (21.9%) | 152 (32.7%) |
| $1,500 to $1,999 | 112 (18.7%) | 133 (28.6%) |
| $2,000 to $2,499 | 23 (3.8%) | 0 (0.0%) |
| $2,500 to $2,999 | 56 (9.4%) | 0 (0.0%) |
| $3,000 or more | 14 (2.3%) | 0 (0.0%) |
| Total | 598 (100.0%) | 465 (100.0%) |
Physical Housing Characteristics in Bath borough
Housing Structures in Bath borough
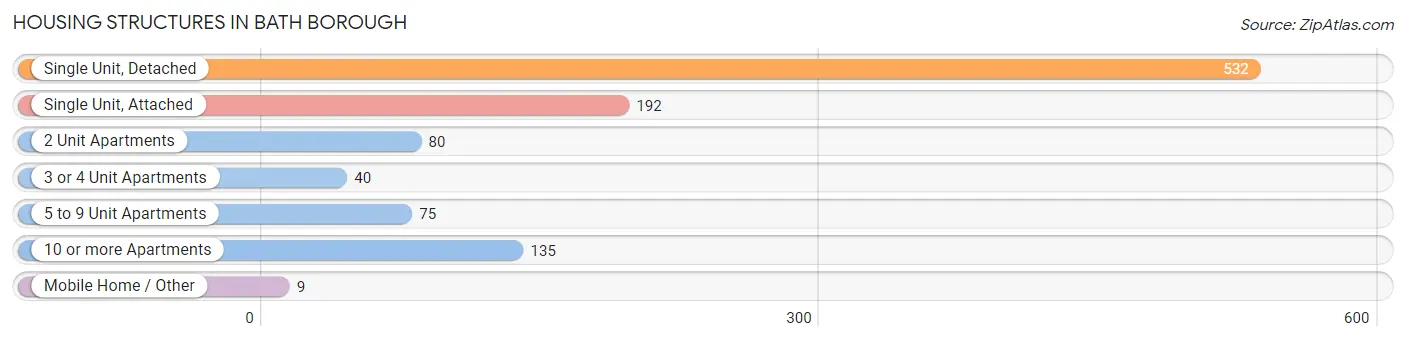
| Structure Type | # Housing Units | % Housing Units |
| Single Unit, Detached | 532 | 50.0% |
| Single Unit, Attached | 192 | 18.1% |
| 2 Unit Apartments | 80 | 7.5% |
| 3 or 4 Unit Apartments | 40 | 3.8% |
| 5 to 9 Unit Apartments | 75 | 7.1% |
| 10 or more Apartments | 135 | 12.7% |
| Mobile Home / Other | 9 | 0.9% |
| Total | 1,063 | 100.0% |
Housing Structures by Occupancy in Bath borough
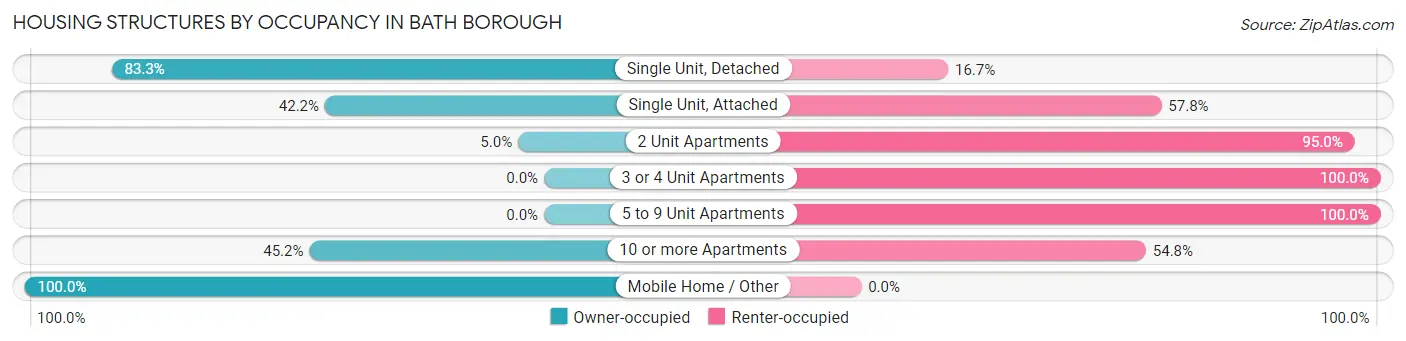
| Structure Type | Owner-occupied | Renter-occupied |
| Single Unit, Detached | 443 (83.3%) | 89 (16.7%) |
| Single Unit, Attached | 81 (42.2%) | 111 (57.8%) |
| 2 Unit Apartments | 4 (5.0%) | 76 (95.0%) |
| 3 or 4 Unit Apartments | 0 (0.0%) | 40 (100.0%) |
| 5 to 9 Unit Apartments | 0 (0.0%) | 75 (100.0%) |
| 10 or more Apartments | 61 (45.2%) | 74 (54.8%) |
| Mobile Home / Other | 9 (100.0%) | 0 (0.0%) |
| Total | 598 (56.3%) | 465 (43.7%) |
Housing Structures by Number of Rooms in Bath borough
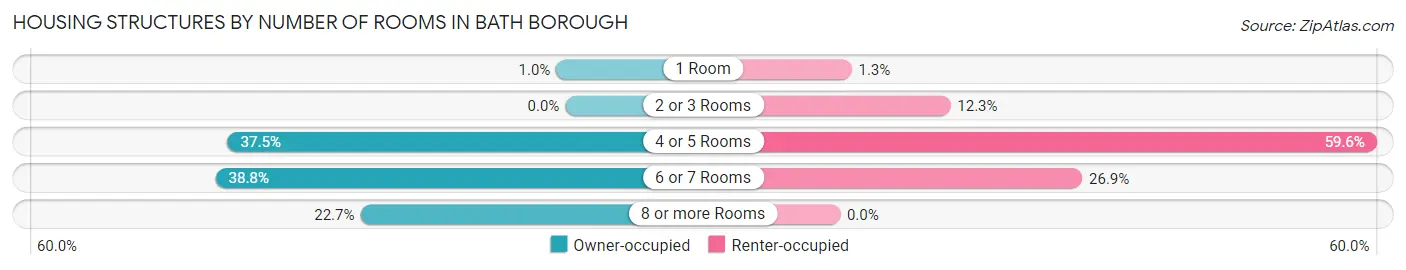
| Number of Rooms | Owner-occupied | Renter-occupied |
| 1 Room | 6 (1.0%) | 6 (1.3%) |
| 2 or 3 Rooms | 0 (0.0%) | 57 (12.3%) |
| 4 or 5 Rooms | 224 (37.5%) | 277 (59.6%) |
| 6 or 7 Rooms | 232 (38.8%) | 125 (26.9%) |
| 8 or more Rooms | 136 (22.7%) | 0 (0.0%) |
| Total | 598 (100.0%) | 465 (100.0%) |
Housing Structure by Heating Type in Bath borough
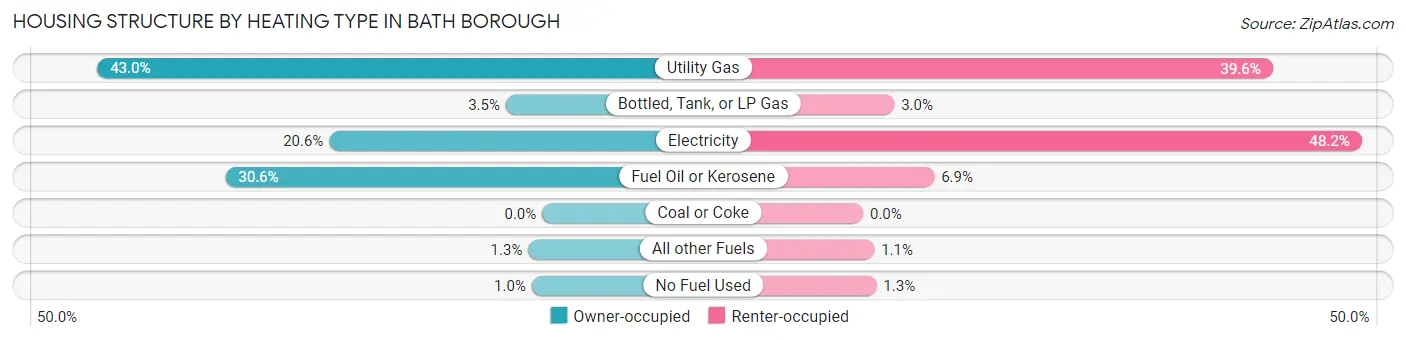
| Heating Type | Owner-occupied | Renter-occupied |
| Utility Gas | 257 (43.0%) | 184 (39.6%) |
| Bottled, Tank, or LP Gas | 21 (3.5%) | 14 (3.0%) |
| Electricity | 123 (20.6%) | 224 (48.2%) |
| Fuel Oil or Kerosene | 183 (30.6%) | 32 (6.9%) |
| Coal or Coke | 0 (0.0%) | 0 (0.0%) |
| All other Fuels | 8 (1.3%) | 5 (1.1%) |
| No Fuel Used | 6 (1.0%) | 6 (1.3%) |
| Total | 598 (100.0%) | 465 (100.0%) |
Household Vehicle Usage in Bath borough
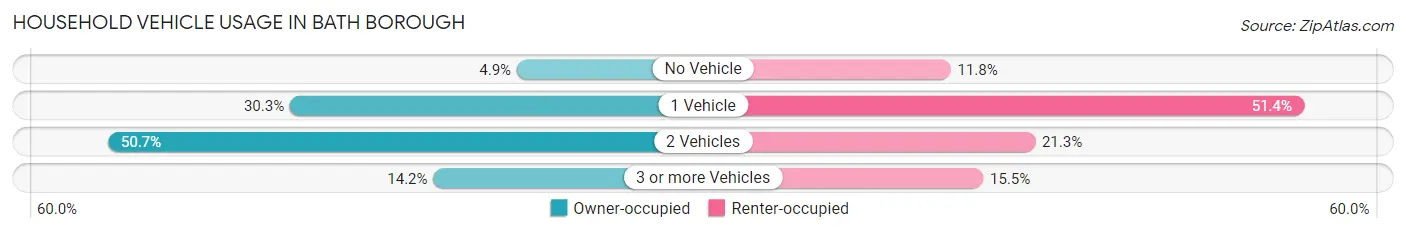
| Vehicles per Household | Owner-occupied | Renter-occupied |
| No Vehicle | 29 (4.9%) | 55 (11.8%) |
| 1 Vehicle | 181 (30.3%) | 239 (51.4%) |
| 2 Vehicles | 303 (50.7%) | 99 (21.3%) |
| 3 or more Vehicles | 85 (14.2%) | 72 (15.5%) |
| Total | 598 (100.0%) | 465 (100.0%) |
Real Estate & Mortgages in Bath borough
Real Estate and Mortgage Overview in Bath borough
| Characteristic | Without Mortgage | With Mortgage |
| Housing Units | 257 | 341 |
| Median Property Value | $173,500 | $233,200 |
| Median Household Income | $45,694 | $91 |
| Monthly Housing Costs | $575 | $14 |
| Real Estate Taxes | $2,790 | $0 |
Property Value by Mortgage Status in Bath borough
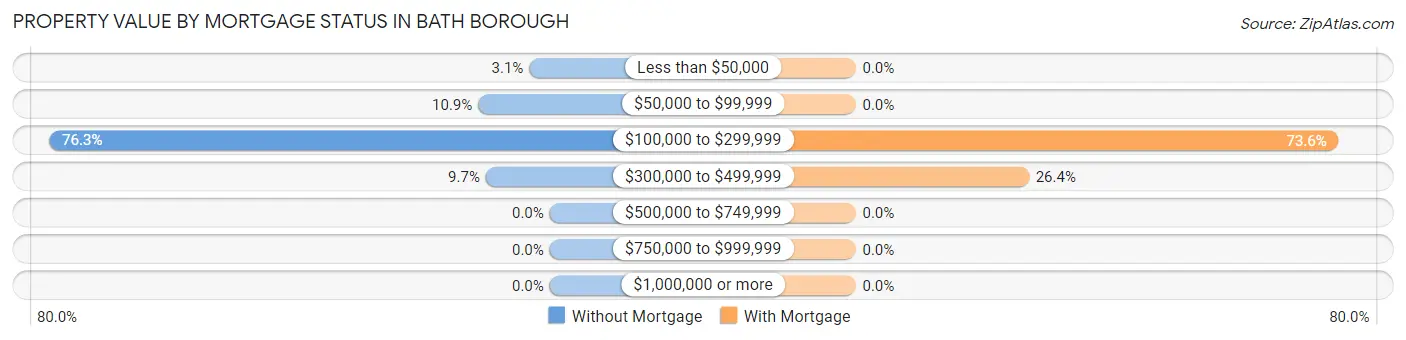
| Property Value | Without Mortgage | With Mortgage |
| Less than $50,000 | 8 (3.1%) | 0 (0.0%) |
| $50,000 to $99,999 | 28 (10.9%) | 0 (0.0%) |
| $100,000 to $299,999 | 196 (76.3%) | 251 (73.6%) |
| $300,000 to $499,999 | 25 (9.7%) | 90 (26.4%) |
| $500,000 to $749,999 | 0 (0.0%) | 0 (0.0%) |
| $750,000 to $999,999 | 0 (0.0%) | 0 (0.0%) |
| $1,000,000 or more | 0 (0.0%) | 0 (0.0%) |
| Total | 257 (100.0%) | 341 (100.0%) |
Household Income by Mortgage Status in Bath borough
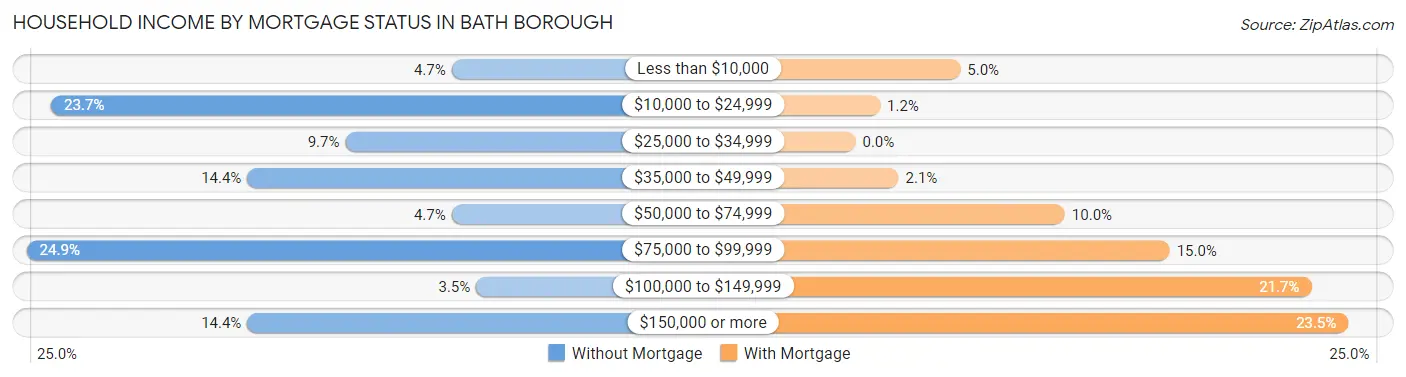
| Household Income | Without Mortgage | With Mortgage |
| Less than $10,000 | 12 (4.7%) | 17 (5.0%) |
| $10,000 to $24,999 | 61 (23.7%) | 4 (1.2%) |
| $25,000 to $34,999 | 25 (9.7%) | 0 (0.0%) |
| $35,000 to $49,999 | 37 (14.4%) | 7 (2.1%) |
| $50,000 to $74,999 | 12 (4.7%) | 34 (10.0%) |
| $75,000 to $99,999 | 64 (24.9%) | 51 (15.0%) |
| $100,000 to $149,999 | 9 (3.5%) | 74 (21.7%) |
| $150,000 or more | 37 (14.4%) | 80 (23.5%) |
| Total | 257 (100.0%) | 341 (100.0%) |
Property Value to Household Income Ratio in Bath borough
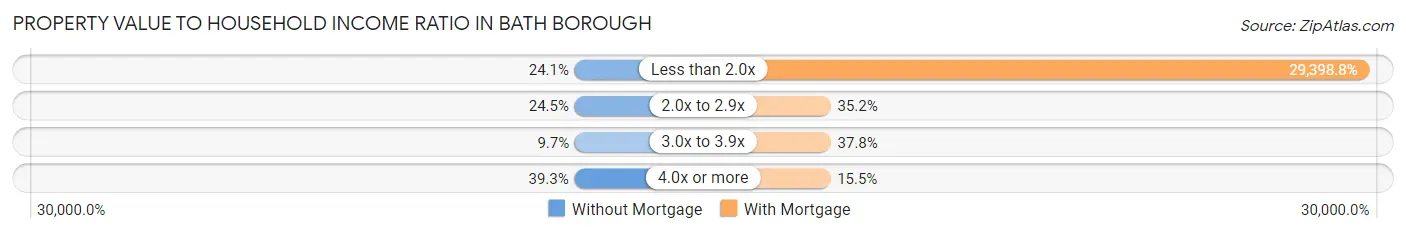
| Value-to-Income Ratio | Without Mortgage | With Mortgage |
| Less than 2.0x | 62 (24.1%) | 100,250 (29,398.8%) |
| 2.0x to 2.9x | 63 (24.5%) | 120 (35.2%) |
| 3.0x to 3.9x | 25 (9.7%) | 129 (37.8%) |
| 4.0x or more | 101 (39.3%) | 53 (15.5%) |
| Total | 257 (100.0%) | 341 (100.0%) |
Real Estate Taxes by Mortgage Status in Bath borough
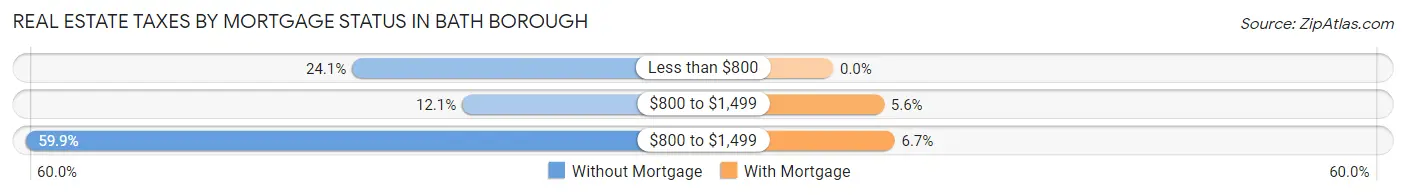
| Property Taxes | Without Mortgage | With Mortgage |
| Less than $800 | 62 (24.1%) | 0 (0.0%) |
| $800 to $1,499 | 31 (12.1%) | 19 (5.6%) |
| $800 to $1,499 | 154 (59.9%) | 23 (6.7%) |
| Total | 257 (100.0%) | 341 (100.0%) |
Health & Disability in Bath borough
Health Insurance Coverage by Age in Bath borough
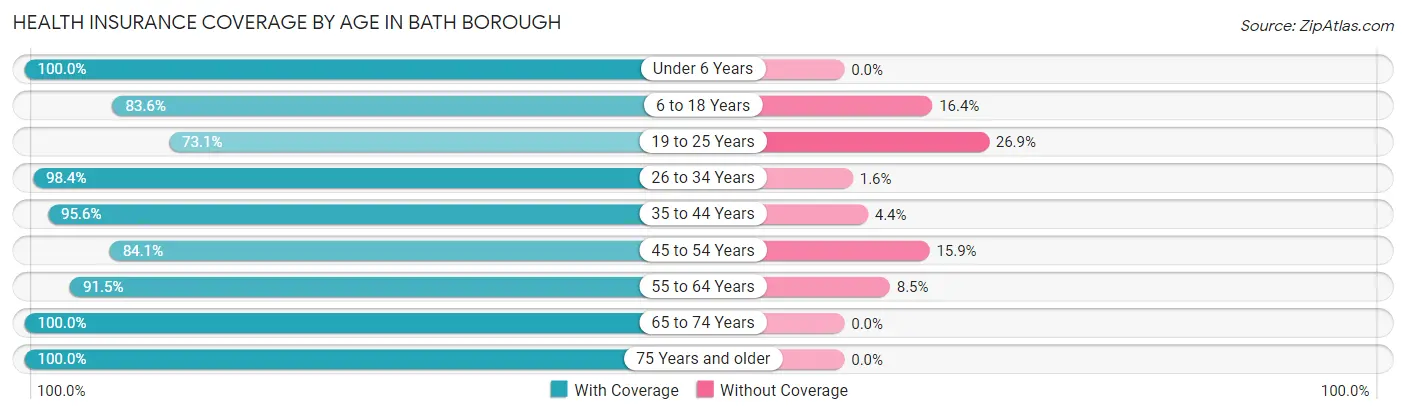
| Age Bracket | With Coverage | Without Coverage |
| Under 6 Years | 133 (100.0%) | 0 (0.0%) |
| 6 to 18 Years | 612 (83.6%) | 120 (16.4%) |
| 19 to 25 Years | 198 (73.1%) | 73 (26.9%) |
| 26 to 34 Years | 374 (98.4%) | 6 (1.6%) |
| 35 to 44 Years | 371 (95.6%) | 17 (4.4%) |
| 45 to 54 Years | 233 (84.1%) | 44 (15.9%) |
| 55 to 64 Years | 205 (91.5%) | 19 (8.5%) |
| 65 to 74 Years | 185 (100.0%) | 0 (0.0%) |
| 75 Years and older | 224 (100.0%) | 0 (0.0%) |
| Total | 2,535 (90.1%) | 279 (9.9%) |
Health Insurance Coverage by Citizenship Status in Bath borough
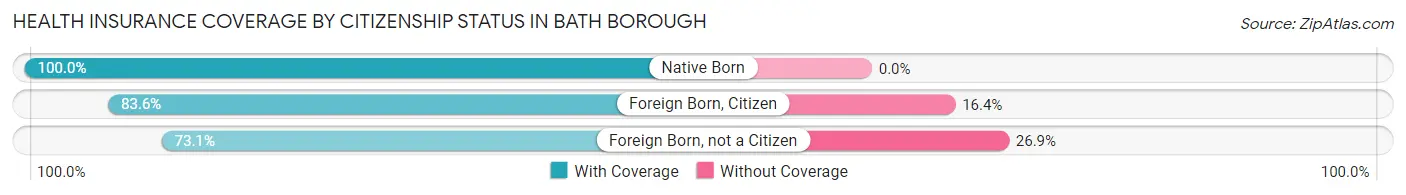
| Citizenship Status | With Coverage | Without Coverage |
| Native Born | 133 (100.0%) | 0 (0.0%) |
| Foreign Born, Citizen | 612 (83.6%) | 120 (16.4%) |
| Foreign Born, not a Citizen | 198 (73.1%) | 73 (26.9%) |
Health Insurance Coverage by Household Income in Bath borough
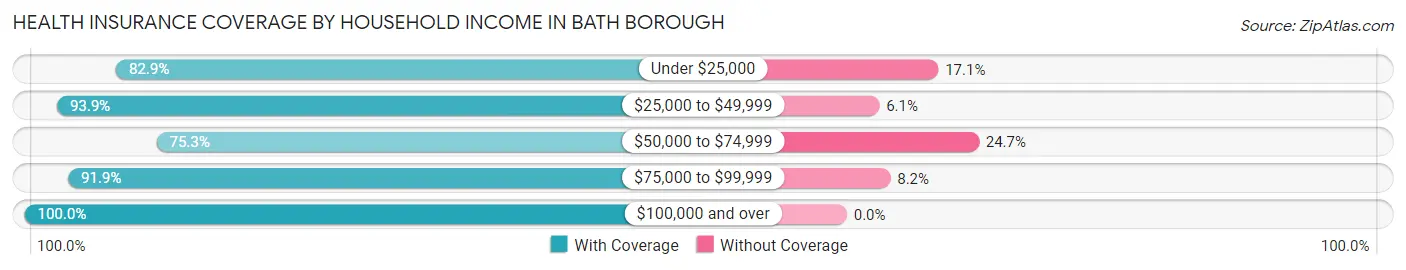
| Household Income | With Coverage | Without Coverage |
| Under $25,000 | 329 (82.9%) | 68 (17.1%) |
| $25,000 to $49,999 | 588 (93.9%) | 38 (6.1%) |
| $50,000 to $74,999 | 423 (75.3%) | 139 (24.7%) |
| $75,000 to $99,999 | 383 (91.8%) | 34 (8.2%) |
| $100,000 and over | 804 (100.0%) | 0 (0.0%) |
Public vs Private Health Insurance Coverage by Age in Bath borough
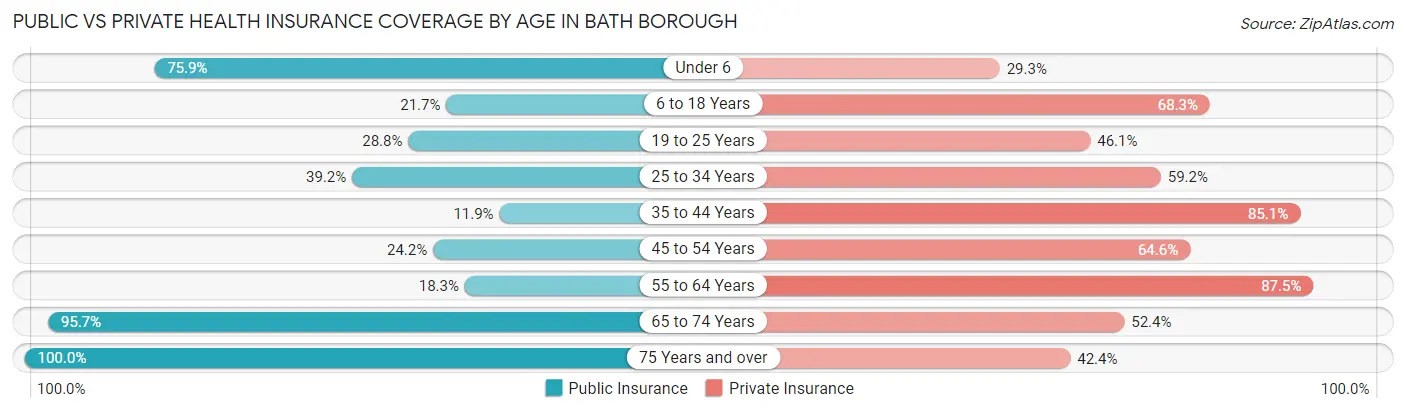
| Age Bracket | Public Insurance | Private Insurance |
| Under 6 | 101 (75.9%) | 39 (29.3%) |
| 6 to 18 Years | 159 (21.7%) | 500 (68.3%) |
| 19 to 25 Years | 78 (28.8%) | 125 (46.1%) |
| 25 to 34 Years | 149 (39.2%) | 225 (59.2%) |
| 35 to 44 Years | 46 (11.9%) | 330 (85.1%) |
| 45 to 54 Years | 67 (24.2%) | 179 (64.6%) |
| 55 to 64 Years | 41 (18.3%) | 196 (87.5%) |
| 65 to 74 Years | 177 (95.7%) | 97 (52.4%) |
| 75 Years and over | 224 (100.0%) | 95 (42.4%) |
| Total | 1,042 (37.0%) | 1,786 (63.5%) |
Disability Status by Sex by Age in Bath borough
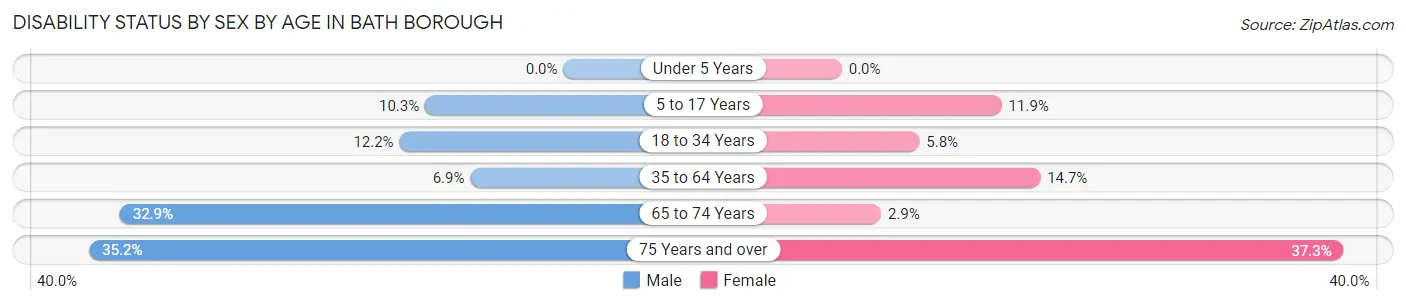
| Age Bracket | Male | Female |
| Under 5 Years | 0 (0.0%) | 0 (0.0%) |
| 5 to 17 Years | 46 (10.3%) | 33 (11.9%) |
| 18 to 34 Years | 41 (12.2%) | 20 (5.8%) |
| 35 to 64 Years | 30 (6.9%) | 67 (14.7%) |
| 65 to 74 Years | 27 (32.9%) | 3 (2.9%) |
| 75 Years and over | 25 (35.2%) | 57 (37.2%) |
Disability Class by Sex by Age in Bath borough
Disability Class: Hearing Difficulty
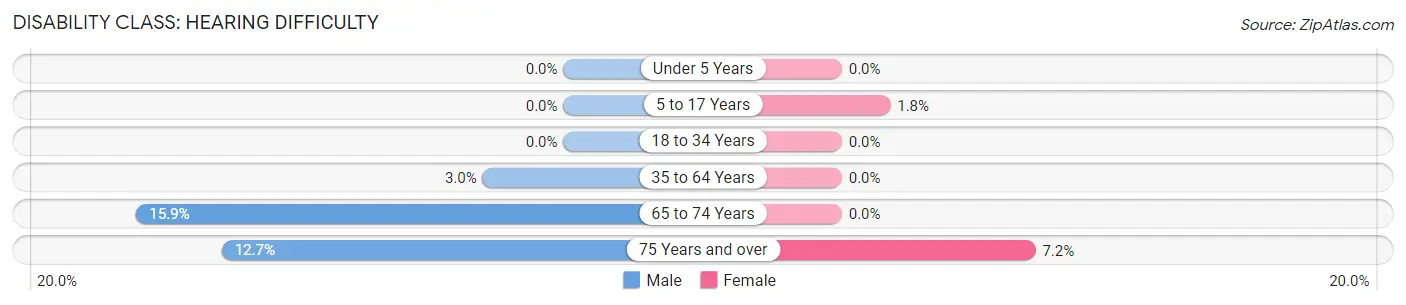
| Age Bracket | Male | Female |
| Under 5 Years | 0 (0.0%) | 0 (0.0%) |
| 5 to 17 Years | 0 (0.0%) | 5 (1.8%) |
| 18 to 34 Years | 0 (0.0%) | 0 (0.0%) |
| 35 to 64 Years | 13 (3.0%) | 0 (0.0%) |
| 65 to 74 Years | 13 (15.9%) | 0 (0.0%) |
| 75 Years and over | 9 (12.7%) | 11 (7.2%) |
Disability Class: Vision Difficulty
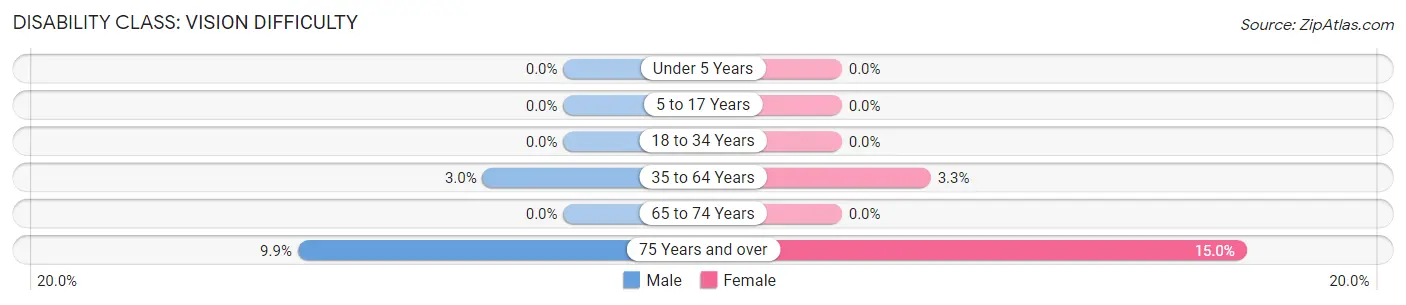
| Age Bracket | Male | Female |
| Under 5 Years | 0 (0.0%) | 0 (0.0%) |
| 5 to 17 Years | 0 (0.0%) | 0 (0.0%) |
| 18 to 34 Years | 0 (0.0%) | 0 (0.0%) |
| 35 to 64 Years | 13 (3.0%) | 15 (3.3%) |
| 65 to 74 Years | 0 (0.0%) | 0 (0.0%) |
| 75 Years and over | 7 (9.9%) | 23 (15.0%) |
Disability Class: Cognitive Difficulty
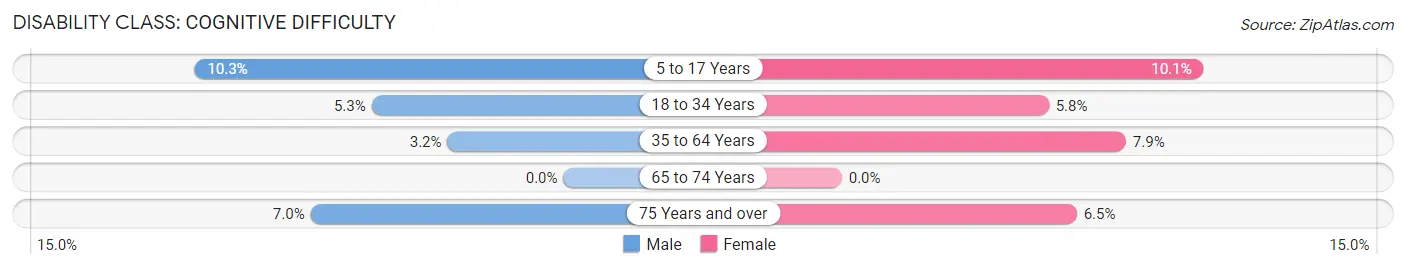
| Age Bracket | Male | Female |
| 5 to 17 Years | 46 (10.3%) | 28 (10.1%) |
| 18 to 34 Years | 18 (5.3%) | 20 (5.8%) |
| 35 to 64 Years | 14 (3.2%) | 36 (7.9%) |
| 65 to 74 Years | 0 (0.0%) | 0 (0.0%) |
| 75 Years and over | 5 (7.0%) | 10 (6.5%) |
Disability Class: Ambulatory Difficulty
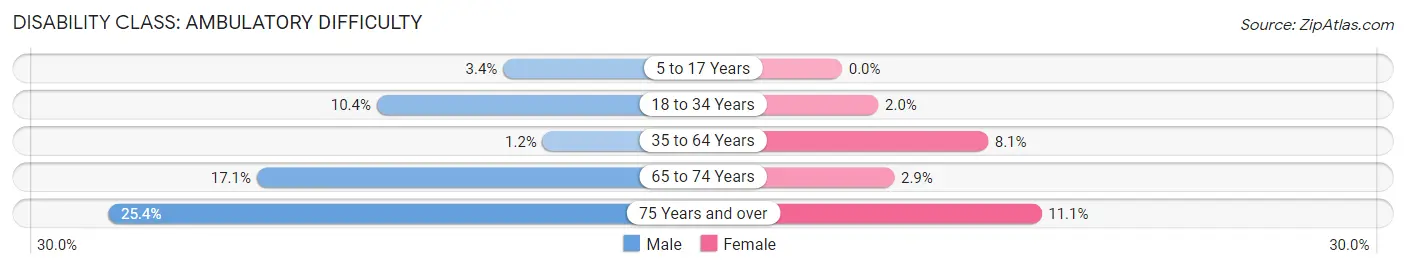
| Age Bracket | Male | Female |
| 5 to 17 Years | 15 (3.4%) | 0 (0.0%) |
| 18 to 34 Years | 35 (10.4%) | 7 (2.0%) |
| 35 to 64 Years | 5 (1.1%) | 37 (8.1%) |
| 65 to 74 Years | 14 (17.1%) | 3 (2.9%) |
| 75 Years and over | 18 (25.4%) | 17 (11.1%) |
Disability Class: Self-Care Difficulty
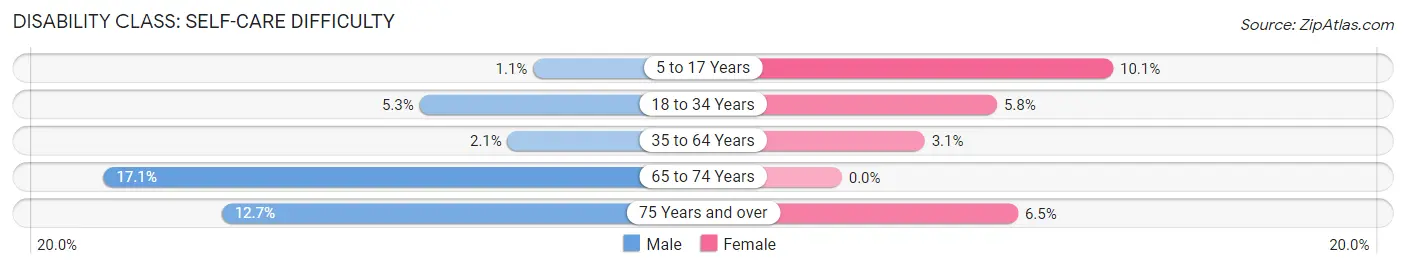
| Age Bracket | Male | Female |
| 5 to 17 Years | 5 (1.1%) | 28 (10.1%) |
| 18 to 34 Years | 18 (5.3%) | 20 (5.8%) |
| 35 to 64 Years | 9 (2.1%) | 14 (3.1%) |
| 65 to 74 Years | 14 (17.1%) | 0 (0.0%) |
| 75 Years and over | 9 (12.7%) | 10 (6.5%) |
Technology Access in Bath borough
Computing Device Access in Bath borough
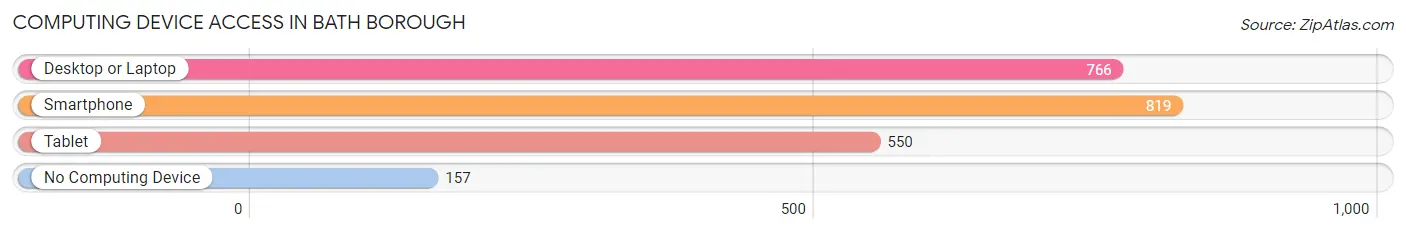
| Device Type | # Households | % Households |
| Desktop or Laptop | 766 | 72.1% |
| Smartphone | 819 | 77.0% |
| Tablet | 550 | 51.7% |
| No Computing Device | 157 | 14.8% |
| Total | 1,063 | 100.0% |
Internet Access in Bath borough
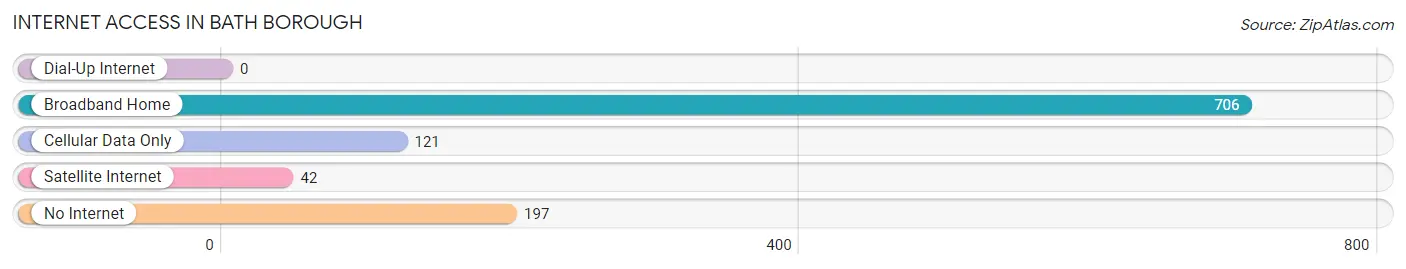
| Internet Type | # Households | % Households |
| Dial-Up Internet | 0 | 0.0% |
| Broadband Home | 706 | 66.4% |
| Cellular Data Only | 121 | 11.4% |
| Satellite Internet | 42 | 4.0% |
| No Internet | 197 | 18.5% |
| Total | 1,063 | 100.0% |
Bath borough Summary
Bath Borough is a small borough located in Northampton County, Pennsylvania. It is situated in the Lehigh Valley region of the state, and is part of the Allentown-Bethlehem-Easton metropolitan area. The borough has a population of approximately 2,000 people, and is home to a variety of businesses, including a number of small shops and restaurants.
History
Bath Borough was founded in 1741 by a group of German settlers. The town was originally known as “Bethlehem,” but was later changed to “Bath” in honor of the nearby town of Bath, England. The town was incorporated in 1845, and has remained relatively unchanged since then.
Geography
Bath Borough is located in Northampton County, Pennsylvania. It is situated in the Lehigh Valley region of the state, and is part of the Allentown-Bethlehem-Easton metropolitan area. The borough is bordered by the townships of Allen, East Allen, and Moore, as well as the boroughs of Nazareth and Northampton. The borough covers an area of 1.2 square miles, and is located at an elevation of 441 feet above sea level.
Economy
Bath Borough has a diverse economy, with a variety of businesses located in the area. The borough is home to a number of small shops and restaurants, as well as a few larger businesses. The borough also has a number of industrial and manufacturing businesses, including a paper mill and a printing company. The borough is also home to a number of medical and health care facilities, including a hospital and a number of doctor’s offices.
Demographics
As of the 2010 census, the population of Bath Borough was 2,039. The racial makeup of the borough was 94.3% White, 1.3% African American, 0.2% Native American, 0.7% Asian, 0.1% Pacific Islander, 1.2% from other races, and 2.3% from two or more races. Hispanic or Latino of any race were 4.2% of the population.
The median household income in Bath Borough was $45,938, and the median family income was $54,917. The per capita income for the borough was $21,945. About 8.2% of families and 10.2% of the population were below the poverty line, including 14.2% of those under age 18 and 5.2% of those age 65 or over.
Bath Borough is a small borough with a rich history and a diverse economy. The borough is home to a variety of businesses, including a number of small shops and restaurants, as well as a few larger businesses. The borough also has a number of medical and health care facilities, and has a population of approximately 2,000 people.
Common Questions
What is Per Capita Income in Bath borough?
Per Capita income in Bath borough is $29,541.
What is the Median Family Income in Bath borough?
Median Family Income in Bath borough is $69,112.
What is the Median Household income in Bath borough?
Median Household Income in Bath borough is $56,813.
What is Income or Wage Gap in Bath borough?
Income or Wage Gap in Bath borough is 37.8%.
Women in Bath borough earn 62.2 cents for every dollar earned by a man.
What is Family Income Deficit in Bath borough?
Family Income Deficit in Bath borough is $8,522.
Families that are below poverty line in Bath borough earn $8,522 less on average than the poverty threshold level.
What is Inequality or Gini Index in Bath borough?
Inequality or Gini Index in Bath borough is 0.44.
What is the Total Population of Bath borough?
Total Population of Bath borough is 2,814.
What is the Total Male Population of Bath borough?
Total Male Population of Bath borough is 1,395.
What is the Total Female Population of Bath borough?
Total Female Population of Bath borough is 1,419.
What is the Ratio of Males per 100 Females in Bath borough?
There are 98.31 Males per 100 Females in Bath borough.
What is the Ratio of Females per 100 Males in Bath borough?
There are 101.72 Females per 100 Males in Bath borough.
What is the Median Population Age in Bath borough?
Median Population Age in Bath borough is 32.3 Years.
What is the Average Family Size in Bath borough
Average Family Size in Bath borough is 3.4 People.
What is the Average Household Size in Bath borough
Average Household Size in Bath borough is 2.6 People.
How Large is the Labor Force in Bath borough?
There are 1,348 People in the Labor Forcein in Bath borough.
What is the Percentage of People in the Labor Force in Bath borough?
64.0% of People are in the Labor Force in Bath borough.
What is the Unemployment Rate in Bath borough?
Unemployment Rate in Bath borough is 5.9%.