Albertson, NY Map & Demographics
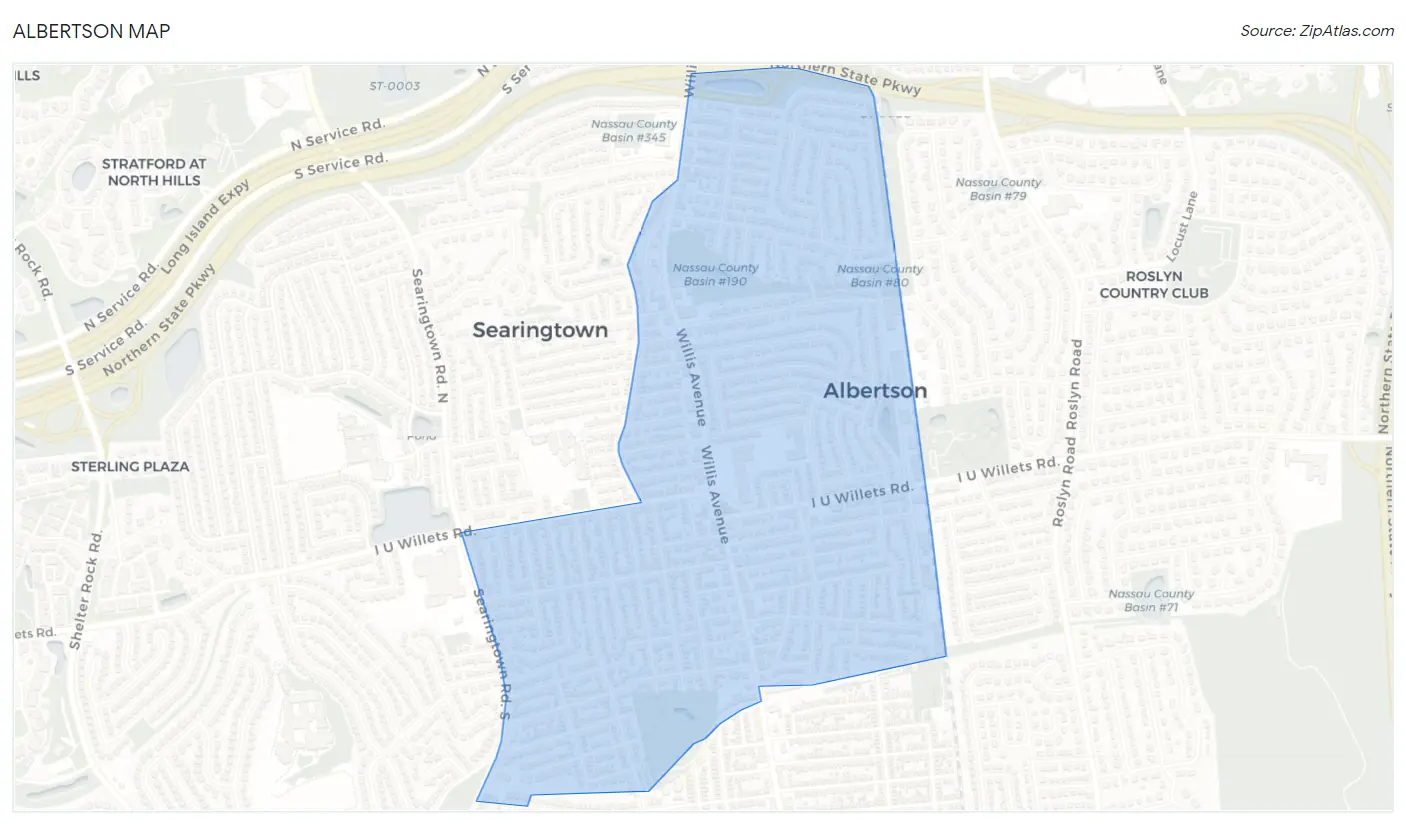
Albertson Map
Albertson Overview
$62,078
PER CAPITA INCOME
$147,045
AVG FAMILY INCOME
$129,563
AVG HOUSEHOLD INCOME
18.3%
WAGE / INCOME GAP [ % ]
81.7¢/ $1
WAGE / INCOME GAP [ $ ]
0.43
INEQUALITY / GINI INDEX
5,095
TOTAL POPULATION
2,553
MALE POPULATION
2,542
FEMALE POPULATION
100.43
MALES / 100 FEMALES
99.57
FEMALES / 100 MALES
46.9
MEDIAN AGE
3.5
AVG FAMILY SIZE
2.9
AVG HOUSEHOLD SIZE
2,815
LABOR FORCE [ PEOPLE ]
64.6%
PERCENT IN LABOR FORCE
3.0%
UNEMPLOYMENT RATE
Albertson Zip Codes
Income in Albertson
Income Overview in Albertson
Per Capita Income in Albertson is $62,078, while median incomes of families and households are $147,045 and $129,563 respectively.
| Characteristic | Number | Measure |
| Per Capita Income | 5,095 | $62,078 |
| Median Family Income | 1,340 | $147,045 |
| Mean Family Income | 1,340 | $192,677 |
| Median Household Income | 1,727 | $129,563 |
| Mean Household Income | 1,727 | $173,655 |
| Income Deficit | 1,340 | $0 |
| Wage / Income Gap (%) | 5,095 | 18.26% |
| Wage / Income Gap ($) | 5,095 | 81.74¢ per $1 |
| Gini / Inequality Index | 5,095 | 0.43 |
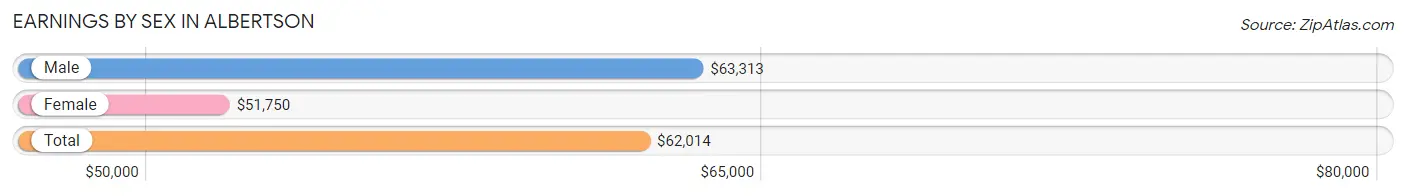
Earnings by Sex in Albertson
Average Earnings in Albertson are $62,014, $63,313 for men and $51,750 for women, a difference of 18.3%.
| Sex | Number | Average Earnings |
| Male | 1,383 (48.9%) | $63,313 |
| Female | 1,444 (51.1%) | $51,750 |
| Total | 2,827 (100.0%) | $62,014 |
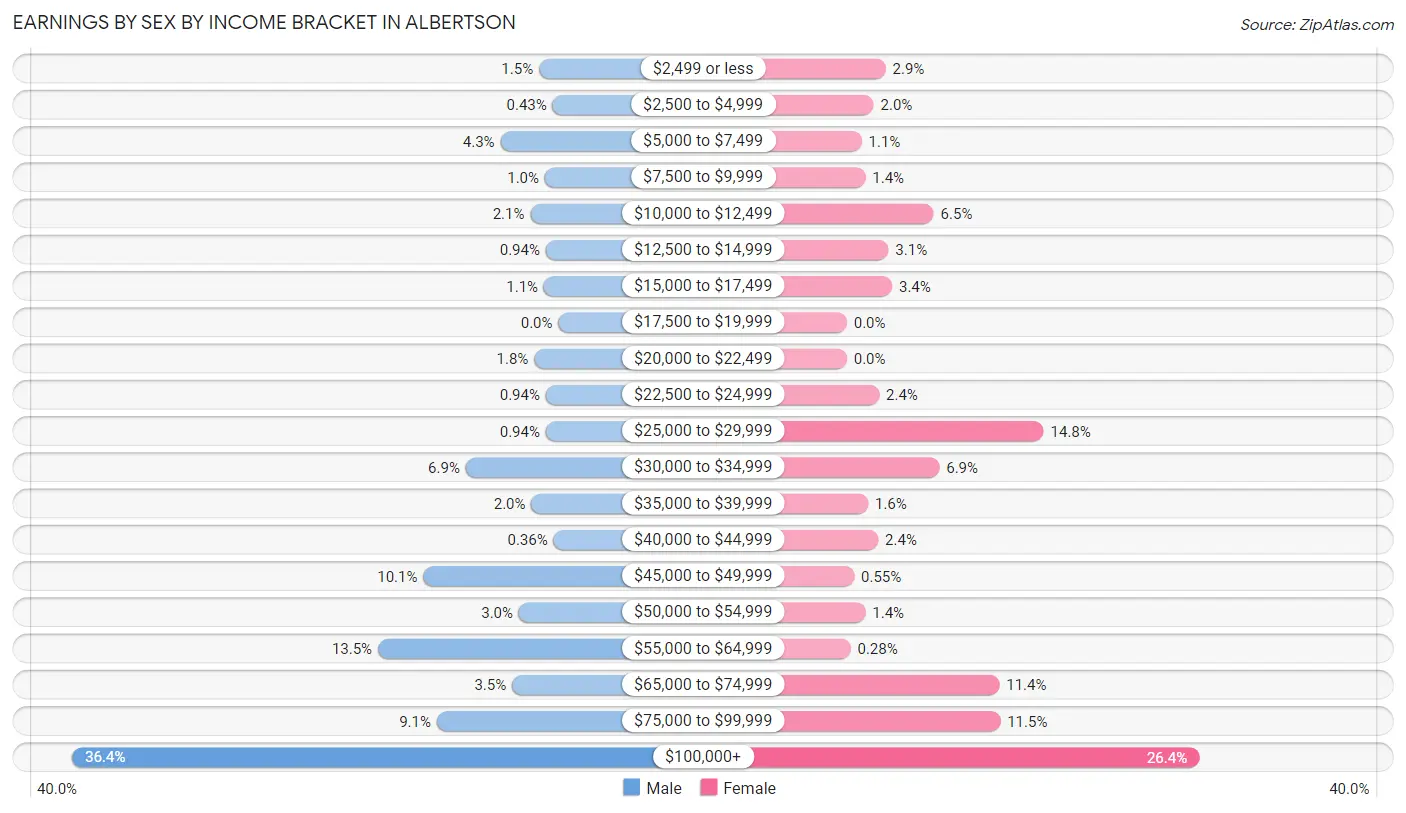
Earnings by Sex by Income Bracket in Albertson
The most common earnings brackets in Albertson are $100,000+ for men (504 | 36.4%) and $100,000+ for women (381 | 26.4%).
| Income | Male | Female |
| $2,499 or less | 20 (1.5%) | 42 (2.9%) |
| $2,500 to $4,999 | 6 (0.4%) | 29 (2.0%) |
| $5,000 to $7,499 | 60 (4.3%) | 16 (1.1%) |
| $7,500 to $9,999 | 14 (1.0%) | 20 (1.4%) |
| $10,000 to $12,499 | 29 (2.1%) | 94 (6.5%) |
| $12,500 to $14,999 | 13 (0.9%) | 45 (3.1%) |
| $15,000 to $17,499 | 15 (1.1%) | 49 (3.4%) |
| $17,500 to $19,999 | 0 (0.0%) | 0 (0.0%) |
| $20,000 to $22,499 | 25 (1.8%) | 0 (0.0%) |
| $22,500 to $24,999 | 13 (0.9%) | 35 (2.4%) |
| $25,000 to $29,999 | 13 (0.9%) | 213 (14.7%) |
| $30,000 to $34,999 | 96 (6.9%) | 100 (6.9%) |
| $35,000 to $39,999 | 28 (2.0%) | 23 (1.6%) |
| $40,000 to $44,999 | 5 (0.4%) | 34 (2.4%) |
| $45,000 to $49,999 | 140 (10.1%) | 8 (0.5%) |
| $50,000 to $54,999 | 41 (3.0%) | 20 (1.4%) |
| $55,000 to $64,999 | 187 (13.5%) | 4 (0.3%) |
| $65,000 to $74,999 | 48 (3.5%) | 165 (11.4%) |
| $75,000 to $99,999 | 126 (9.1%) | 166 (11.5%) |
| $100,000+ | 504 (36.4%) | 381 (26.4%) |
| Total | 1,383 (100.0%) | 1,444 (100.0%) |
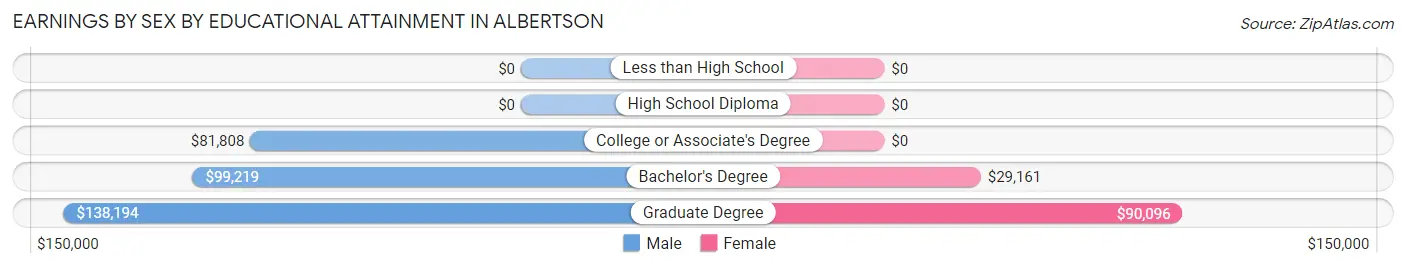
Earnings by Sex by Educational Attainment in Albertson
Average earnings in Albertson are $81,825 for men and $66,455 for women, a difference of 18.8%. Men with an educational attainment of graduate degree enjoy the highest average annual earnings of $138,194, while those with college or associate's degree education earn the least with $81,808. Women with an educational attainment of graduate degree earn the most with the average annual earnings of $90,096, while those with bachelor's degree education have the smallest earnings of $29,161.
| Educational Attainment | Male Income | Female Income |
| Less than High School | - | - |
| High School Diploma | - | - |
| College or Associate's Degree | $81,808 | $0 |
| Bachelor's Degree | $99,219 | $29,161 |
| Graduate Degree | $138,194 | $90,096 |
| Total | $81,825 | $66,455 |
Family Income in Albertson
Family Income Brackets in Albertson
According to the Albertson family income data, there are 385 families falling into the $200,000+ income range, which is the most common income bracket and makes up 28.7% of all families.
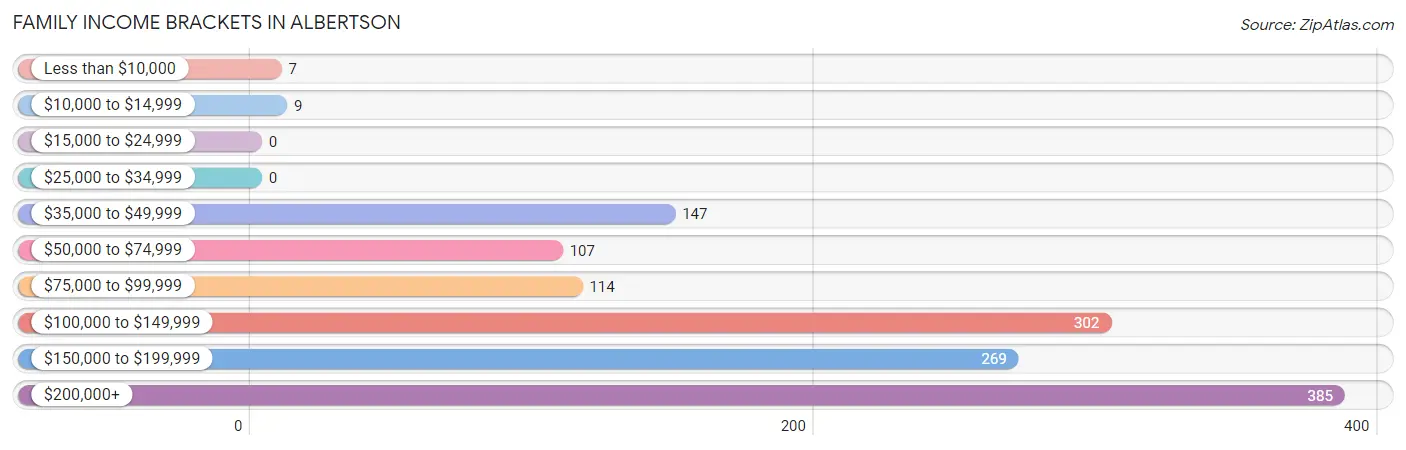
| Income Bracket | # Families | % Families |
| Less than $10,000 | 7 | 0.5% |
| $10,000 to $14,999 | 9 | 0.7% |
| $15,000 to $24,999 | 0 | 0.0% |
| $25,000 to $34,999 | 0 | 0.0% |
| $35,000 to $49,999 | 147 | 11.0% |
| $50,000 to $74,999 | 107 | 8.0% |
| $75,000 to $99,999 | 114 | 8.5% |
| $100,000 to $149,999 | 302 | 22.5% |
| $150,000 to $199,999 | 269 | 20.1% |
| $200,000+ | 385 | 28.7% |
Family Income by Famaliy Size in Albertson
4-person families (319 | 23.8%) account for the highest median family income in Albertson with $208,295 per family, while 2-person families (570 | 42.5%) have the highest median income of $55,132 per family member.
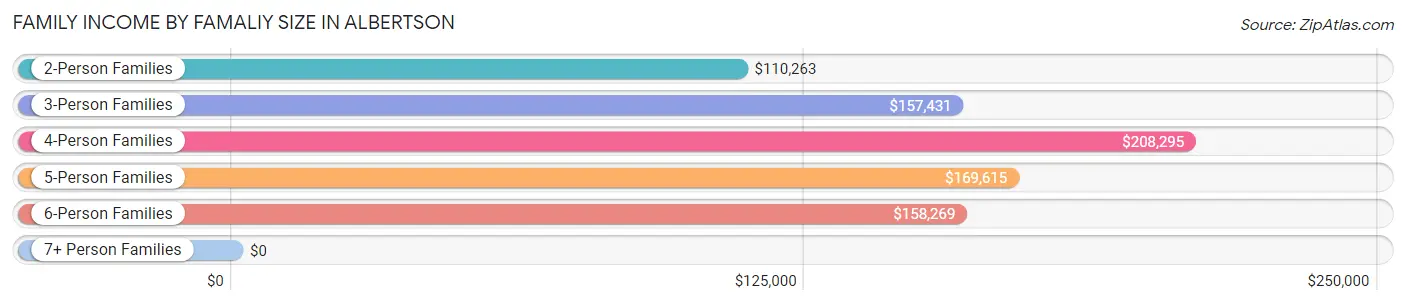
| Income Bracket | # Families | Median Income |
| 2-Person Families | 570 (42.5%) | $110,263 |
| 3-Person Families | 243 (18.1%) | $157,431 |
| 4-Person Families | 319 (23.8%) | $208,295 |
| 5-Person Families | 142 (10.6%) | $169,615 |
| 6-Person Families | 48 (3.6%) | $158,269 |
| 7+ Person Families | 18 (1.3%) | $0 |
| Total | 1,340 (100.0%) | $147,045 |
Family Income by Number of Earners in Albertson
The median family income in Albertson is $147,045, with families comprising 3+ earners (157) having the highest median family income of $214,583, while families with no earners (185) have the lowest median family income of $59,335, accounting for 11.7% and 13.8% of families, respectively.
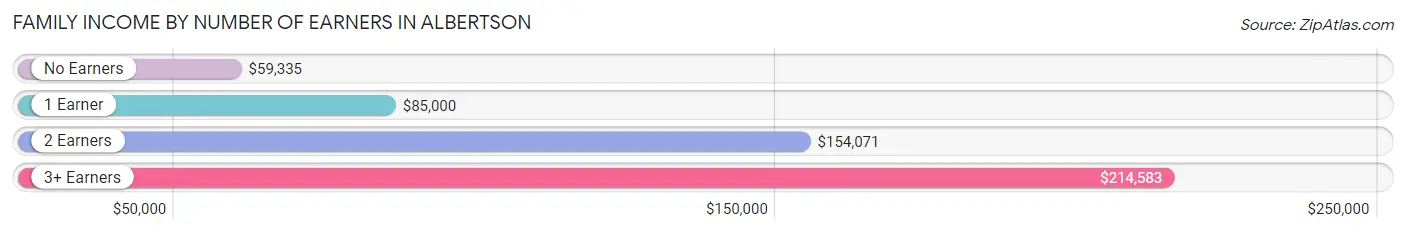
| Number of Earners | # Families | Median Income |
| No Earners | 185 (13.8%) | $59,335 |
| 1 Earner | 288 (21.5%) | $85,000 |
| 2 Earners | 710 (53.0%) | $154,071 |
| 3+ Earners | 157 (11.7%) | $214,583 |
| Total | 1,340 (100.0%) | $147,045 |
Household Income in Albertson
Household Income Brackets in Albertson
With 406 households falling in the category, the $200,000+ income range is the most frequent in Albertson, accounting for 23.5% of all households. In contrast, only 7 households (0.4%) fall into the less than $10,000 income bracket, making it the least populous group.
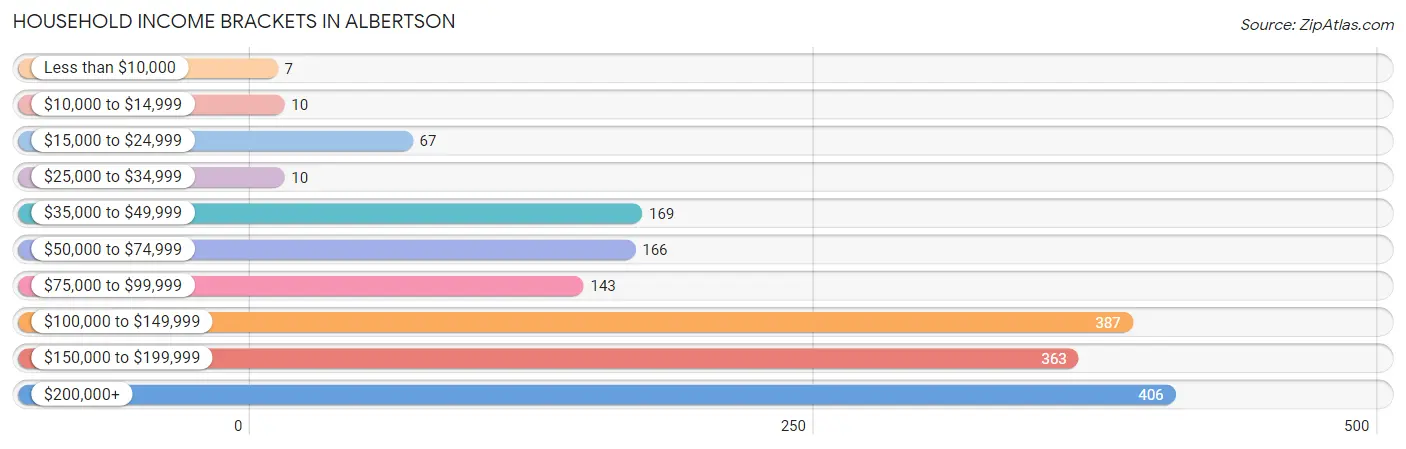
| Income Bracket | # Households | % Households |
| Less than $10,000 | 7 | 0.4% |
| $10,000 to $14,999 | 10 | 0.6% |
| $15,000 to $24,999 | 67 | 3.9% |
| $25,000 to $34,999 | 10 | 0.6% |
| $35,000 to $49,999 | 169 | 9.8% |
| $50,000 to $74,999 | 166 | 9.6% |
| $75,000 to $99,999 | 143 | 8.3% |
| $100,000 to $149,999 | 387 | 22.4% |
| $150,000 to $199,999 | 363 | 21.0% |
| $200,000+ | 406 | 23.5% |
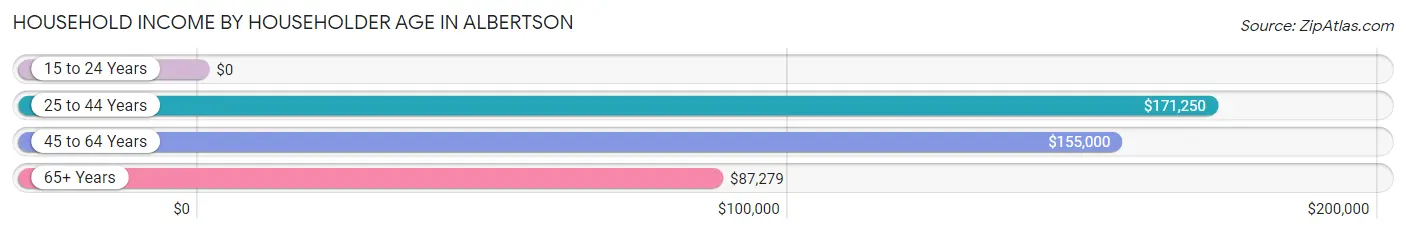
Household Income by Householder Age in Albertson
The median household income in Albertson is $129,563, with the highest median household income of $171,250 found in the 25 to 44 years age bracket for the primary householder. A total of 300 households (17.4%) fall into this category.
| Income Bracket | # Households | Median Income |
| 15 to 24 Years | 0 (0.0%) | $0 |
| 25 to 44 Years | 300 (17.4%) | $171,250 |
| 45 to 64 Years | 778 (45.1%) | $155,000 |
| 65+ Years | 649 (37.6%) | $87,279 |
| Total | 1,727 (100.0%) | $129,563 |
Poverty in Albertson
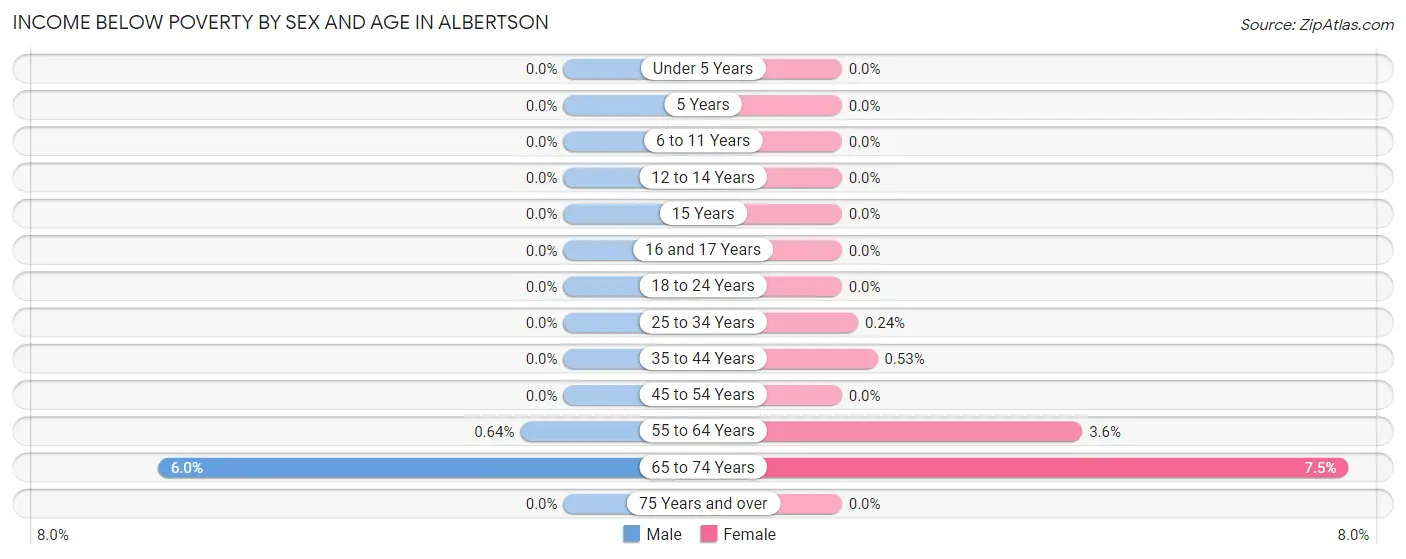
Income Below Poverty by Sex and Age in Albertson
With 0.8% poverty level for males and 1.2% for females among the residents of Albertson, 65 to 74 year old males and 65 to 74 year old females are the most vulnerable to poverty, with 18 males (6.0%) and 17 females (7.5%) in their respective age groups living below the poverty level.
| Age Bracket | Male | Female |
| Under 5 Years | 0 (0.0%) | 0 (0.0%) |
| 5 Years | 0 (0.0%) | 0 (0.0%) |
| 6 to 11 Years | 0 (0.0%) | 0 (0.0%) |
| 12 to 14 Years | 0 (0.0%) | 0 (0.0%) |
| 15 Years | 0 (0.0%) | 0 (0.0%) |
| 16 and 17 Years | 0 (0.0%) | 0 (0.0%) |
| 18 to 24 Years | 0 (0.0%) | 0 (0.0%) |
| 25 to 34 Years | 0 (0.0%) | 1 (0.2%) |
| 35 to 44 Years | 0 (0.0%) | 1 (0.5%) |
| 45 to 54 Years | 0 (0.0%) | 0 (0.0%) |
| 55 to 64 Years | 2 (0.6%) | 12 (3.6%) |
| 65 to 74 Years | 18 (6.0%) | 17 (7.5%) |
| 75 Years and over | 0 (0.0%) | 0 (0.0%) |
| Total | 20 (0.8%) | 31 (1.2%) |
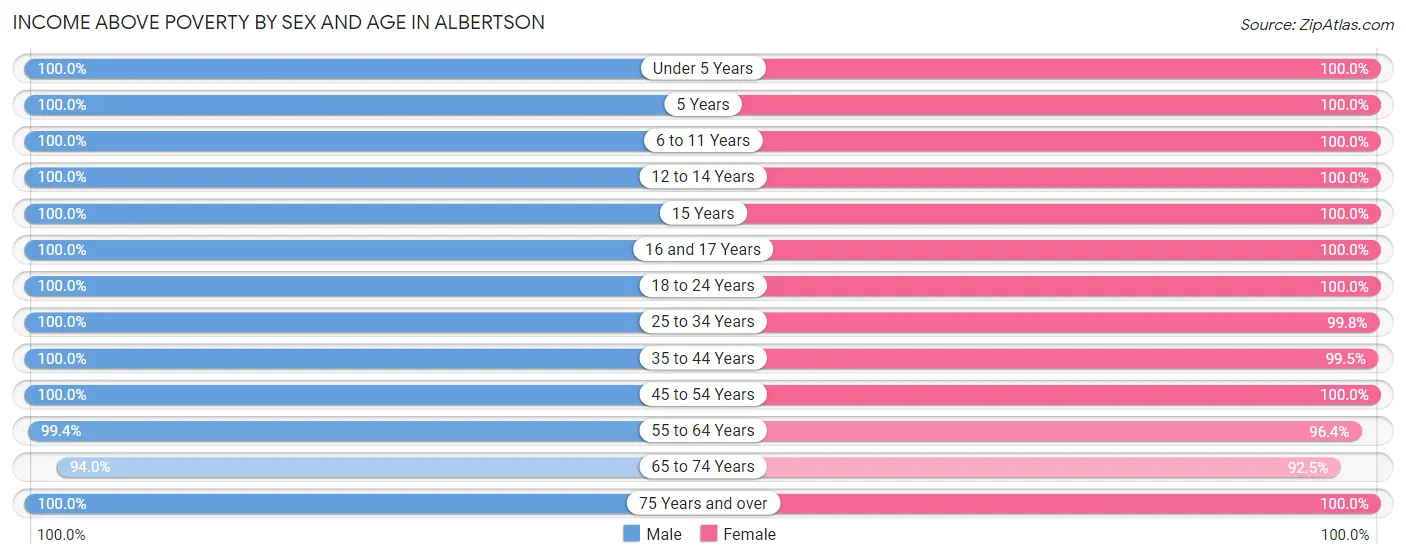
Income Above Poverty by Sex and Age in Albertson
According to the poverty statistics in Albertson, males aged under 5 years and females aged under 5 years are the age groups that are most secure financially, with 100.0% of males and 100.0% of females in these age groups living above the poverty line.
| Age Bracket | Male | Female |
| Under 5 Years | 98 (100.0%) | 33 (100.0%) |
| 5 Years | 13 (100.0%) | 17 (100.0%) |
| 6 to 11 Years | 215 (100.0%) | 126 (100.0%) |
| 12 to 14 Years | 96 (100.0%) | 18 (100.0%) |
| 15 Years | 78 (100.0%) | 44 (100.0%) |
| 16 and 17 Years | 82 (100.0%) | 46 (100.0%) |
| 18 to 24 Years | 353 (100.0%) | 224 (100.0%) |
| 25 to 34 Years | 210 (100.0%) | 423 (99.8%) |
| 35 to 44 Years | 258 (100.0%) | 186 (99.5%) |
| 45 to 54 Years | 324 (100.0%) | 435 (100.0%) |
| 55 to 64 Years | 309 (99.4%) | 324 (96.4%) |
| 65 to 74 Years | 281 (94.0%) | 209 (92.5%) |
| 75 Years and over | 216 (100.0%) | 426 (100.0%) |
| Total | 2,533 (99.2%) | 2,511 (98.8%) |
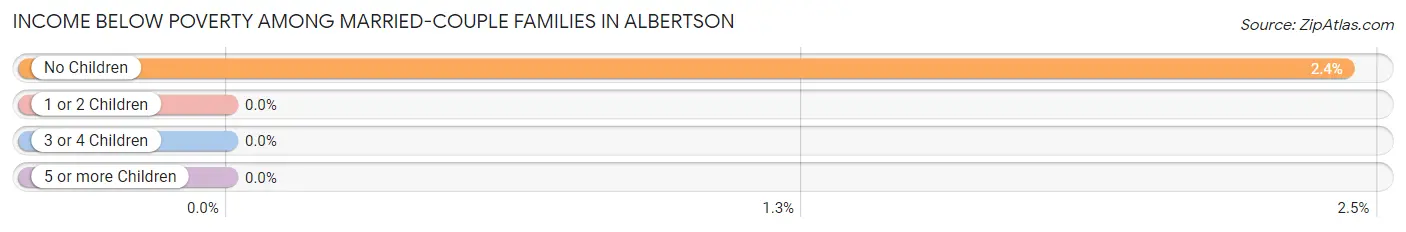
Income Below Poverty Among Married-Couple Families in Albertson
The poverty statistics for married-couple families in Albertson show that 1.5% or 17 of the total 1,146 families live below the poverty line. Families with no children have the highest poverty rate of 2.4%, comprising of 17 families. On the other hand, families with 1 or 2 children have the lowest poverty rate of 0.0%, which includes 0 families.
| Children | Above Poverty | Below Poverty |
| No Children | 682 (97.6%) | 17 (2.4%) |
| 1 or 2 Children | 380 (100.0%) | 0 (0.0%) |
| 3 or 4 Children | 67 (100.0%) | 0 (0.0%) |
| 5 or more Children | 0 (0.0%) | 0 (0.0%) |
| Total | 1,129 (98.5%) | 17 (1.5%) |
Income Below Poverty Among Single-Parent Households in Albertson
| Children | Single Father | Single Mother |
| No Children | 0 (0.0%) | 0 (0.0%) |
| 1 or 2 Children | 0 (0.0%) | 0 (0.0%) |
| 3 or 4 Children | 0 (0.0%) | 0 (0.0%) |
| 5 or more Children | 0 (0.0%) | 0 (0.0%) |
| Total | 0 (0.0%) | 0 (0.0%) |
Income Below Poverty Among Married-Couple vs Single-Parent Households in Albertson
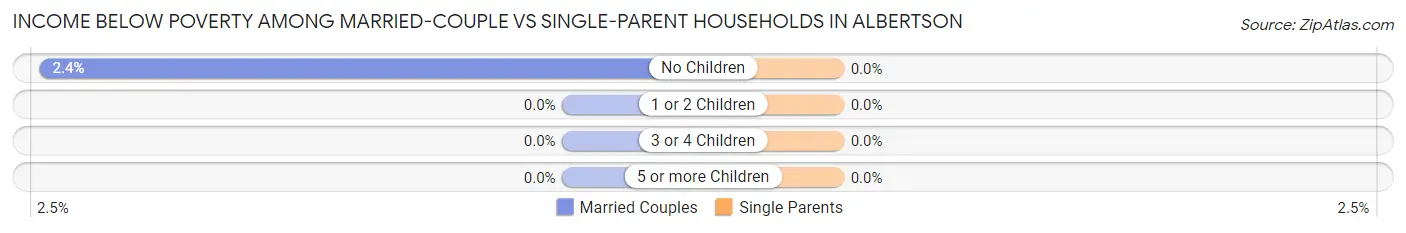
| Children | Married-Couple Families | Single-Parent Households |
| No Children | 17 (2.4%) | 0 (0.0%) |
| 1 or 2 Children | 0 (0.0%) | 0 (0.0%) |
| 3 or 4 Children | 0 (0.0%) | 0 (0.0%) |
| 5 or more Children | 0 (0.0%) | 0 (0.0%) |
| Total | 17 (1.5%) | 0 (0.0%) |
Race in Albertson
The most populous races in Albertson are White / Caucasian (3,195 | 62.7%), Asian (1,640 | 32.2%), and Hispanic or Latino (229 | 4.5%).
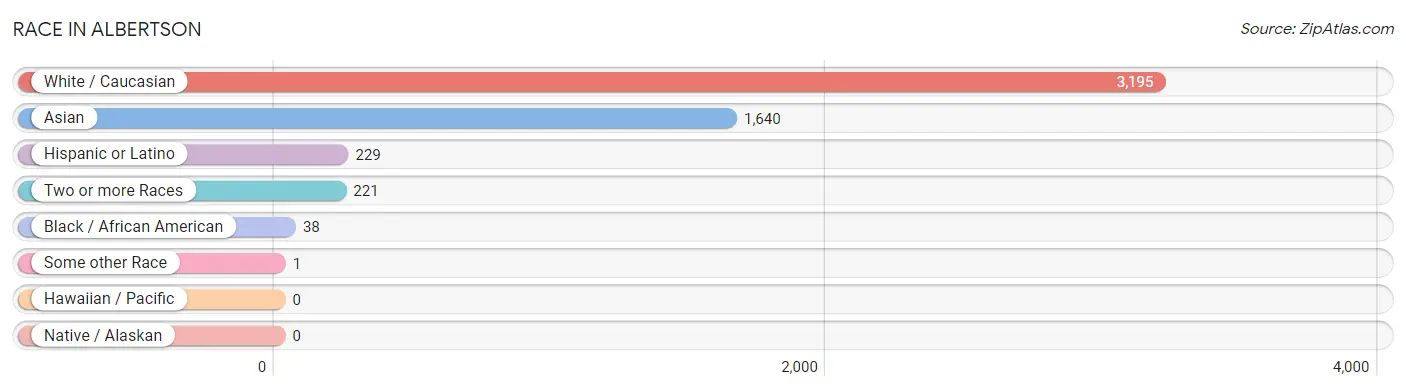
| Race | # Population | % Population |
| Asian | 1,640 | 32.2% |
| Black / African American | 38 | 0.7% |
| Hawaiian / Pacific | 0 | 0.0% |
| Hispanic or Latino | 229 | 4.5% |
| Native / Alaskan | 0 | 0.0% |
| White / Caucasian | 3,195 | 62.7% |
| Two or more Races | 221 | 4.3% |
| Some other Race | 1 | 0.0% |
| Total | 5,095 | 100.0% |
Ancestry in Albertson
The most populous ancestries reported in Albertson are Italian (988 | 19.4%), Thai (575 | 11.3%), Korean (431 | 8.5%), Indian (Asian) (388 | 7.6%), and Irish (358 | 7.0%), together accounting for 53.8% of all Albertson residents.
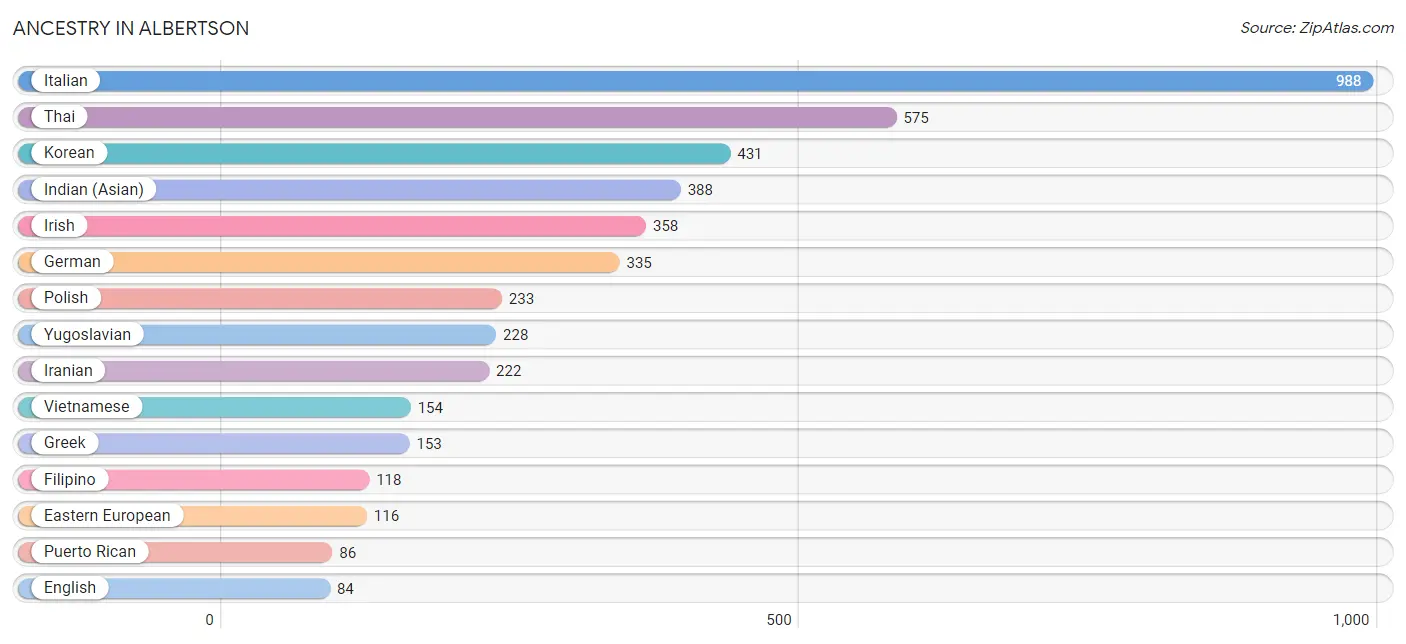
| Ancestry | # Population | % Population |
| American | 82 | 1.6% |
| Arab | 11 | 0.2% |
| Argentinean | 7 | 0.1% |
| Bhutanese | 75 | 1.5% |
| British | 25 | 0.5% |
| Burmese | 20 | 0.4% |
| Canadian | 34 | 0.7% |
| Central American | 68 | 1.3% |
| Costa Rican | 24 | 0.5% |
| Croatian | 69 | 1.3% |
| Cuban | 36 | 0.7% |
| Czech | 17 | 0.3% |
| Danish | 10 | 0.2% |
| Eastern European | 116 | 2.3% |
| English | 84 | 1.7% |
| European | 31 | 0.6% |
| Filipino | 118 | 2.3% |
| French | 16 | 0.3% |
| German | 335 | 6.6% |
| Greek | 153 | 3.0% |
| Indian (Asian) | 388 | 7.6% |
| Iranian | 222 | 4.4% |
| Iraqi | 11 | 0.2% |
| Irish | 358 | 7.0% |
| Israeli | 55 | 1.1% |
| Italian | 988 | 19.4% |
| Korean | 431 | 8.5% |
| Latvian | 16 | 0.3% |
| Lithuanian | 8 | 0.2% |
| Peruvian | 10 | 0.2% |
| Polish | 233 | 4.6% |
| Portuguese | 11 | 0.2% |
| Puerto Rican | 86 | 1.7% |
| Russian | 36 | 0.7% |
| Salvadoran | 44 | 0.9% |
| Scandinavian | 35 | 0.7% |
| Scotch-Irish | 9 | 0.2% |
| Slavic | 14 | 0.3% |
| Slovak | 13 | 0.3% |
| South American | 17 | 0.3% |
| Spaniard | 21 | 0.4% |
| Swiss | 33 | 0.6% |
| Thai | 575 | 11.3% |
| Ukrainian | 21 | 0.4% |
| Vietnamese | 154 | 3.0% |
| Welsh | 12 | 0.2% |
| Yugoslavian | 228 | 4.5% | View All 47 Rows |
Immigrants in Albertson
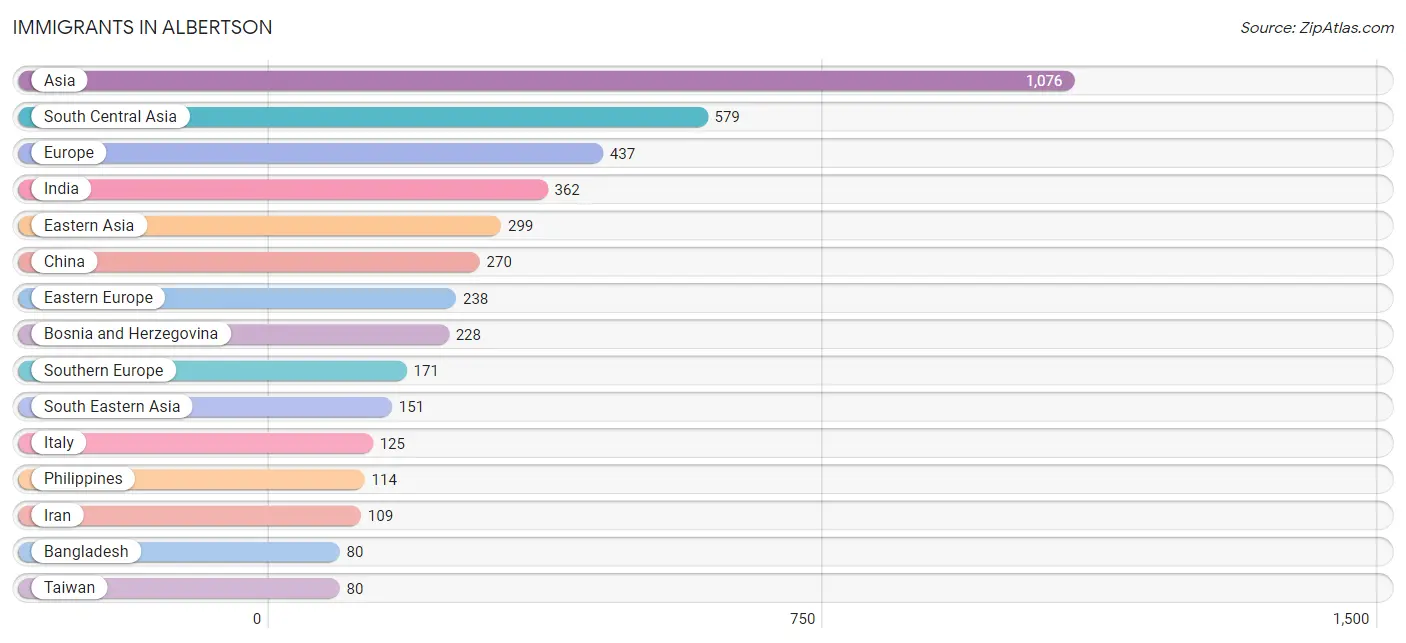
The most numerous immigrant groups reported in Albertson came from Asia (1,076 | 21.1%), South Central Asia (579 | 11.4%), Europe (437 | 8.6%), India (362 | 7.1%), and Eastern Asia (299 | 5.9%), together accounting for 54.0% of all Albertson residents.
| Immigration Origin | # Population | % Population |
| Asia | 1,076 | 21.1% |
| Bangladesh | 80 | 1.6% |
| Bosnia and Herzegovina | 228 | 4.5% |
| Canada | 62 | 1.2% |
| China | 270 | 5.3% |
| Eastern Asia | 299 | 5.9% |
| Eastern Europe | 238 | 4.7% |
| Europe | 437 | 8.6% |
| Greece | 35 | 0.7% |
| Hong Kong | 11 | 0.2% |
| India | 362 | 7.1% |
| Iran | 109 | 2.1% |
| Ireland | 28 | 0.5% |
| Israel | 47 | 0.9% |
| Italy | 125 | 2.5% |
| Japan | 9 | 0.2% |
| Korea | 20 | 0.4% |
| Latin America | 10 | 0.2% |
| Malaysia | 37 | 0.7% |
| Northern Europe | 28 | 0.5% |
| Pakistan | 7 | 0.1% |
| Peru | 10 | 0.2% |
| Philippines | 114 | 2.2% |
| Poland | 10 | 0.2% |
| Portugal | 11 | 0.2% |
| South America | 10 | 0.2% |
| South Central Asia | 579 | 11.4% |
| South Eastern Asia | 151 | 3.0% |
| Southern Europe | 171 | 3.4% |
| Taiwan | 80 | 1.6% |
| Uzbekistan | 21 | 0.4% |
| Western Asia | 47 | 0.9% | View All 32 Rows |
Sex and Age in Albertson
Sex and Age in Albertson
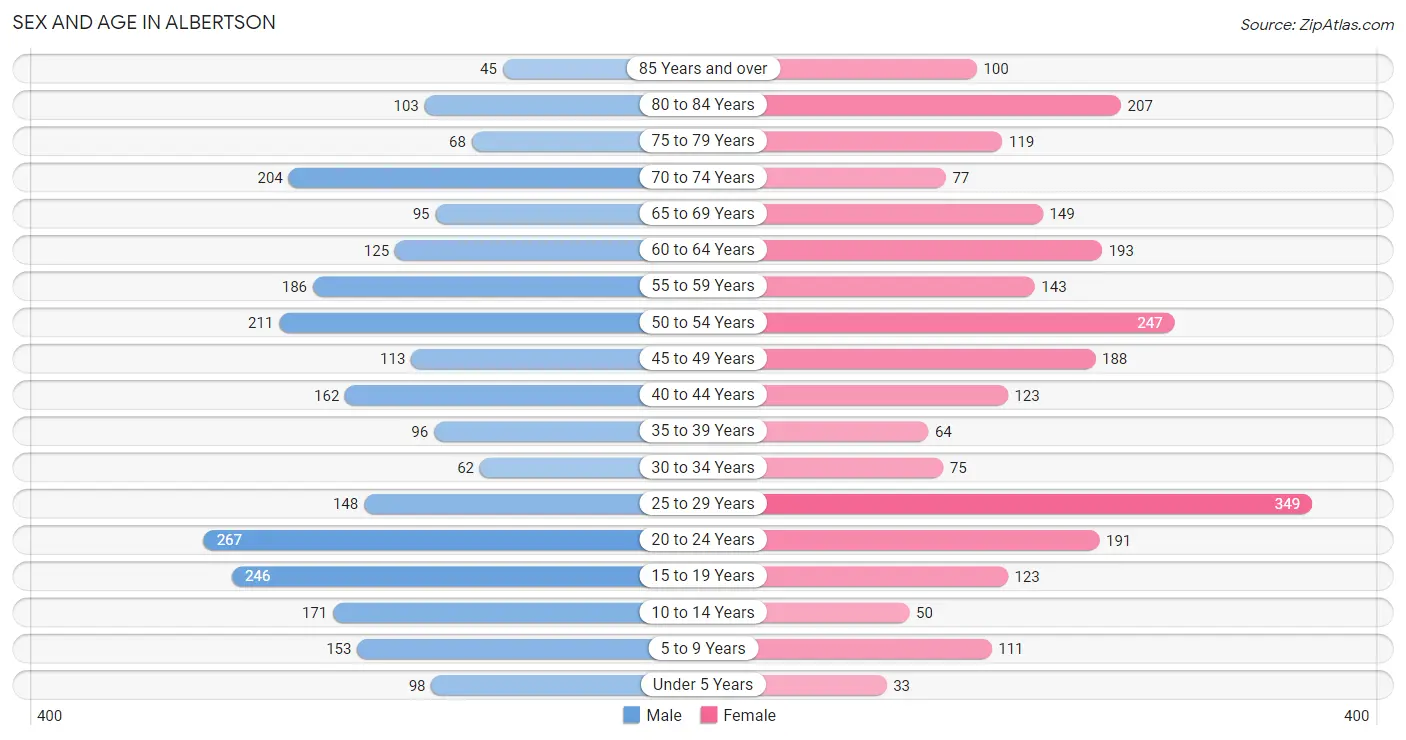
The most populous age groups in Albertson are 20 to 24 Years (267 | 10.5%) for men and 25 to 29 Years (349 | 13.7%) for women.
| Age Bracket | Male | Female |
| Under 5 Years | 98 (3.8%) | 33 (1.3%) |
| 5 to 9 Years | 153 (6.0%) | 111 (4.4%) |
| 10 to 14 Years | 171 (6.7%) | 50 (2.0%) |
| 15 to 19 Years | 246 (9.6%) | 123 (4.8%) |
| 20 to 24 Years | 267 (10.5%) | 191 (7.5%) |
| 25 to 29 Years | 148 (5.8%) | 349 (13.7%) |
| 30 to 34 Years | 62 (2.4%) | 75 (2.9%) |
| 35 to 39 Years | 96 (3.8%) | 64 (2.5%) |
| 40 to 44 Years | 162 (6.4%) | 123 (4.8%) |
| 45 to 49 Years | 113 (4.4%) | 188 (7.4%) |
| 50 to 54 Years | 211 (8.3%) | 247 (9.7%) |
| 55 to 59 Years | 186 (7.3%) | 143 (5.6%) |
| 60 to 64 Years | 125 (4.9%) | 193 (7.6%) |
| 65 to 69 Years | 95 (3.7%) | 149 (5.9%) |
| 70 to 74 Years | 204 (8.0%) | 77 (3.0%) |
| 75 to 79 Years | 68 (2.7%) | 119 (4.7%) |
| 80 to 84 Years | 103 (4.0%) | 207 (8.1%) |
| 85 Years and over | 45 (1.8%) | 100 (3.9%) |
| Total | 2,553 (100.0%) | 2,542 (100.0%) |
Families and Households in Albertson
Median Family Size in Albertson
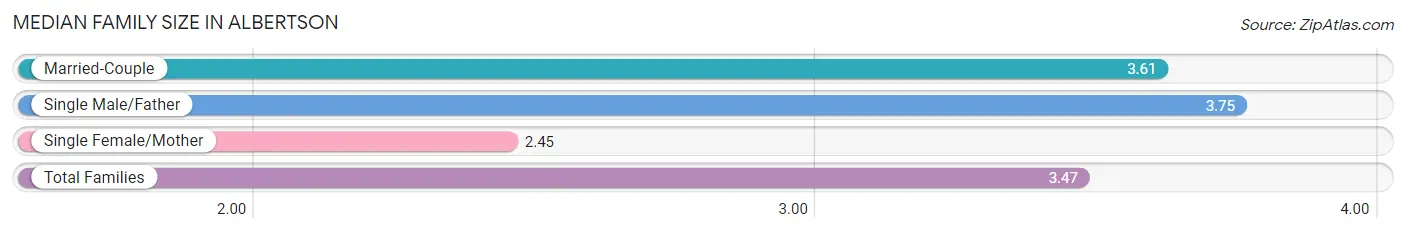
The median family size in Albertson is 3.47 persons per family, with single male/father families (28 | 2.1%) accounting for the largest median family size of 3.75 persons per family. On the other hand, single female/mother families (166 | 12.4%) represent the smallest median family size with 2.45 persons per family.
| Family Type | # Families | Family Size |
| Married-Couple | 1,146 (85.5%) | 3.61 |
| Single Male/Father | 28 (2.1%) | 3.75 |
| Single Female/Mother | 166 (12.4%) | 2.45 |
| Total Families | 1,340 (100.0%) | 3.47 |
Median Household Size in Albertson
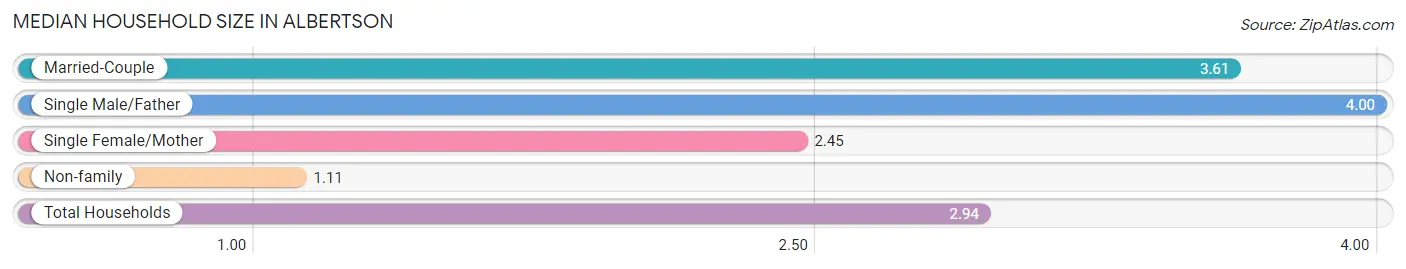
The median household size in Albertson is 2.94 persons per household, with single male/father households (28 | 1.6%) accounting for the largest median household size of 4 persons per household. non-family households (387 | 22.4%) represent the smallest median household size with 1.11 persons per household.
| Household Type | # Households | Household Size |
| Married-Couple | 1,146 (66.4%) | 3.61 |
| Single Male/Father | 28 (1.6%) | 4.00 |
| Single Female/Mother | 166 (9.6%) | 2.45 |
| Non-family | 387 (22.4%) | 1.11 |
| Total Households | 1,727 (100.0%) | 2.94 |
Household Size by Marriage Status in Albertson
Out of a total of 1,727 households in Albertson, 1,340 (77.6%) are family households, while 387 (22.4%) are nonfamily households. The most numerous type of family households are 2-person households, comprising 564, and the most common type of nonfamily households are 1-person households, comprising 361.
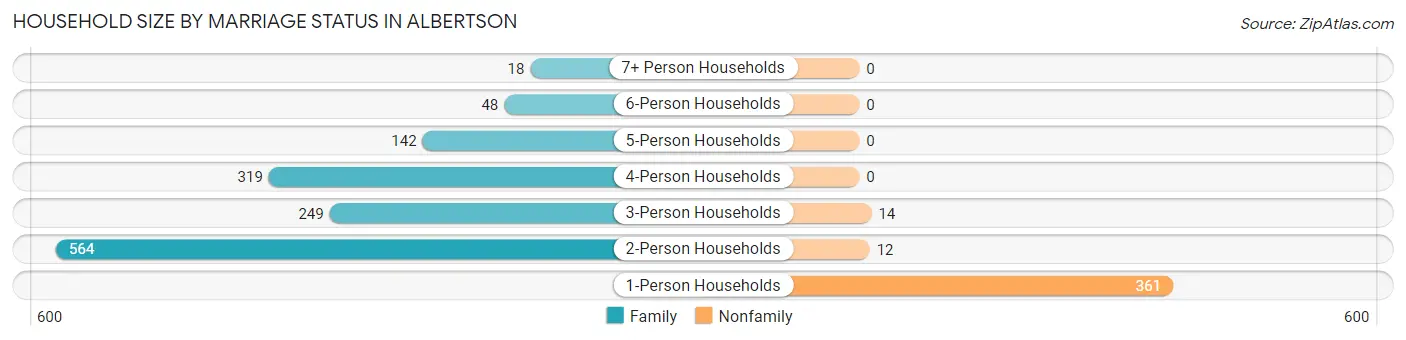
| Household Size | Family Households | Nonfamily Households |
| 1-Person Households | - | 361 (20.9%) |
| 2-Person Households | 564 (32.7%) | 12 (0.7%) |
| 3-Person Households | 249 (14.4%) | 14 (0.8%) |
| 4-Person Households | 319 (18.5%) | 0 (0.0%) |
| 5-Person Households | 142 (8.2%) | 0 (0.0%) |
| 6-Person Households | 48 (2.8%) | 0 (0.0%) |
| 7+ Person Households | 18 (1.0%) | 0 (0.0%) |
| Total | 1,340 (77.6%) | 387 (22.4%) |
Female Fertility in Albertson
Fertility by Age in Albertson
Average fertility rate in Albertson is 34.0 births per 1,000 women. Women in the age bracket of 35 to 50 years have the highest fertility rate with 54.0 births per 1,000 women. Women in the age bracket of 35 to 50 years acount for 55.3% of all women with births.
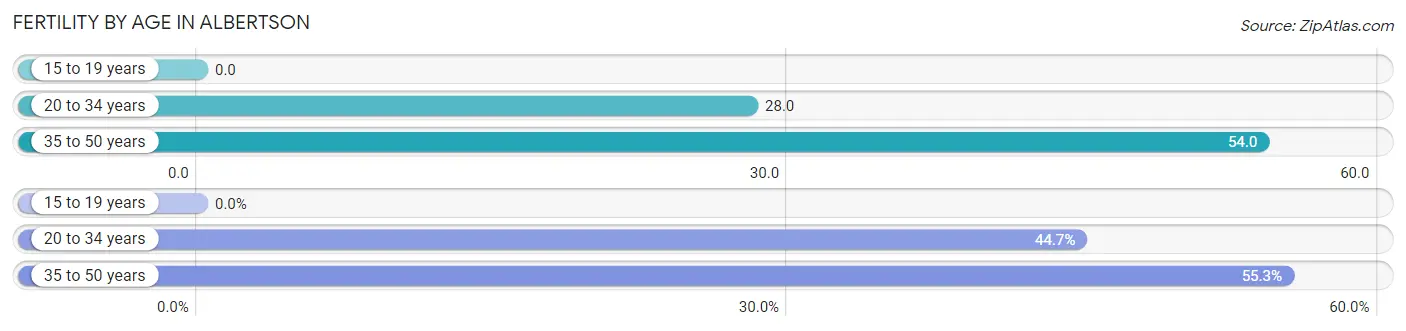
| Age Bracket | Women with Births | Births / 1,000 Women |
| 15 to 19 years | 0 (0.0%) | 0.0 |
| 20 to 34 years | 17 (44.7%) | 28.0 |
| 35 to 50 years | 21 (55.3%) | 54.0 |
| Total | 38 (100.0%) | 34.0 |
Fertility by Age by Marriage Status in Albertson
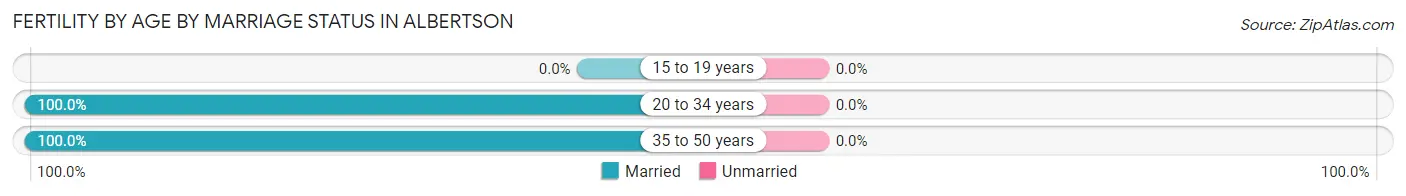
| Age Bracket | Married | Unmarried |
| 15 to 19 years | 0 (0.0%) | 0 (0.0%) |
| 20 to 34 years | 17 (100.0%) | 0 (0.0%) |
| 35 to 50 years | 21 (100.0%) | 0 (0.0%) |
| Total | 38 (100.0%) | 0 (0.0%) |
Fertility by Education in Albertson
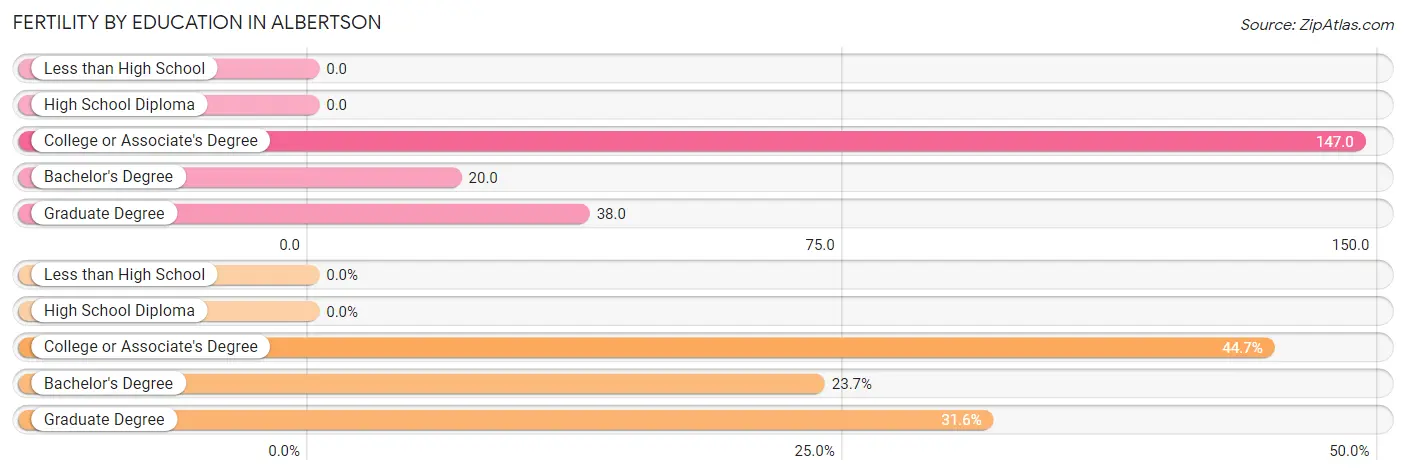
| Educational Attainment | Women with Births | Births / 1,000 Women |
| Less than High School | 0 (0.0%) | 0.0 |
| High School Diploma | 0 (0.0%) | 0.0 |
| College or Associate's Degree | 17 (44.7%) | 147.0 |
| Bachelor's Degree | 9 (23.7%) | 20.0 |
| Graduate Degree | 12 (31.6%) | 38.0 |
| Total | 38 (100.0%) | 34.0 |
Fertility by Education by Marriage Status in Albertson
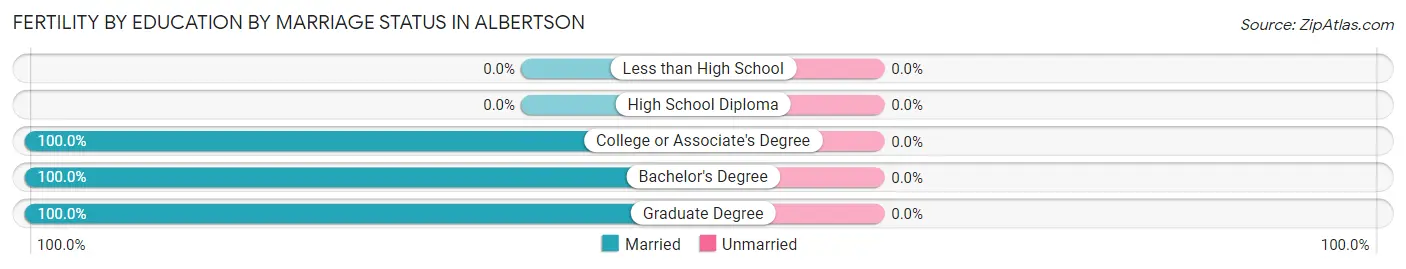
| Educational Attainment | Married | Unmarried |
| Less than High School | 0 (0.0%) | 0 (0.0%) |
| High School Diploma | 0 (0.0%) | 0 (0.0%) |
| College or Associate's Degree | 17 (100.0%) | 0 (0.0%) |
| Bachelor's Degree | 9 (100.0%) | 0 (0.0%) |
| Graduate Degree | 12 (100.0%) | 0 (0.0%) |
| Total | 38 (100.0%) | 0 (0.0%) |
Employment Characteristics in Albertson
Employment by Class of Employer in Albertson
Among the 2,730 employed individuals in Albertson, private company employees (1,827 | 66.9%), local government employees (384 | 14.1%), and not-for-profit organizations (199 | 7.3%) make up the most common classes of employment.
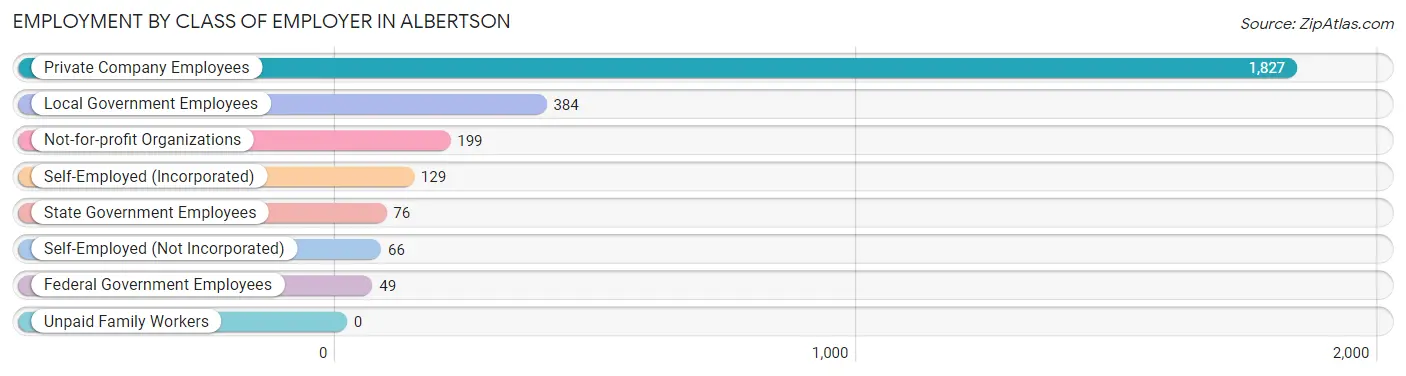
| Employer Class | # Employees | % Employees |
| Private Company Employees | 1,827 | 66.9% |
| Self-Employed (Incorporated) | 129 | 4.7% |
| Self-Employed (Not Incorporated) | 66 | 2.4% |
| Not-for-profit Organizations | 199 | 7.3% |
| Local Government Employees | 384 | 14.1% |
| State Government Employees | 76 | 2.8% |
| Federal Government Employees | 49 | 1.8% |
| Unpaid Family Workers | 0 | 0.0% |
| Total | 2,730 | 100.0% |
Employment Status by Age in Albertson
According to the labor force statistics for Albertson, out of the total population over 16 years of age (4,357), 64.6% or 2,815 individuals are in the labor force, with 3.0% or 84 of them unemployed. The age group with the highest labor force participation rate is 25 to 29 years, with 100.0% or 497 individuals in the labor force. Within the labor force, the 30 to 34 years age range has the highest percentage of unemployed individuals, with 12.5% or 16 of them being unemployed.
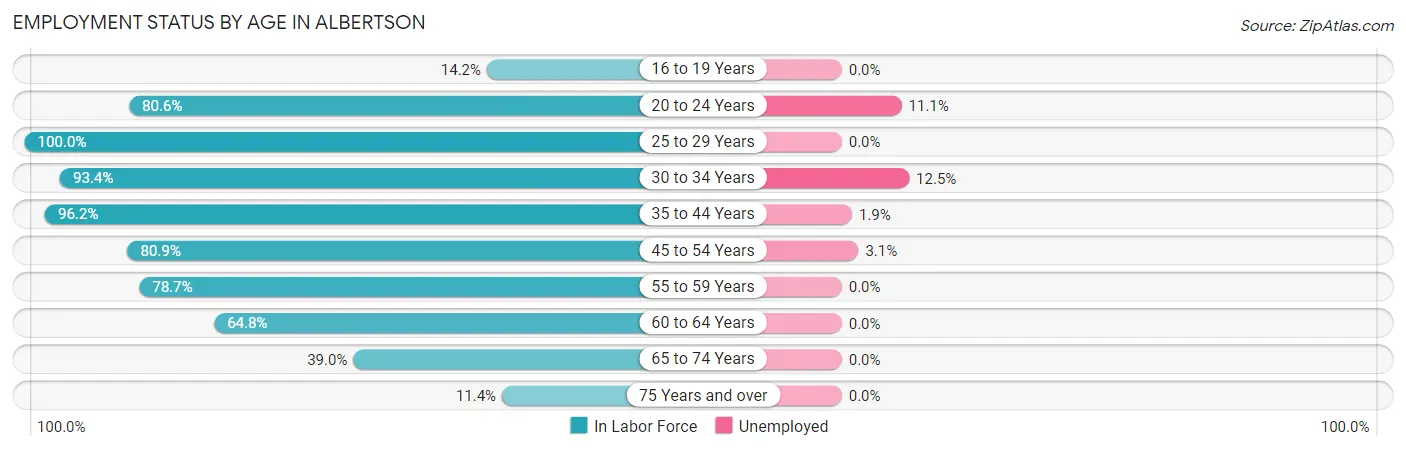
| Age Bracket | In Labor Force | Unemployed |
| 16 to 19 Years | 35 (14.2%) | 0 (0.0%) |
| 20 to 24 Years | 369 (80.6%) | 41 (11.1%) |
| 25 to 29 Years | 497 (100.0%) | 0 (0.0%) |
| 30 to 34 Years | 128 (93.4%) | 16 (12.5%) |
| 35 to 44 Years | 428 (96.2%) | 8 (1.9%) |
| 45 to 54 Years | 614 (80.9%) | 19 (3.1%) |
| 55 to 59 Years | 259 (78.7%) | 0 (0.0%) |
| 60 to 64 Years | 206 (64.8%) | 0 (0.0%) |
| 65 to 74 Years | 205 (39.0%) | 0 (0.0%) |
| 75 Years and over | 73 (11.4%) | 0 (0.0%) |
| Total | 2,815 (64.6%) | 84 (3.0%) |
Employment Status by Educational Attainment in Albertson
According to labor force statistics for Albertson, 85.8% of individuals (2,132) out of the total population between 25 and 64 years of age (2,485) are in the labor force, with 2.0% or 43 of them being unemployed. The group with the highest labor force participation rate are those with the educational attainment of bachelor's degree or higher, with 91.9% or 1,620 individuals in the labor force. Within the labor force, individuals with college / associate degree education have the highest percentage of unemployment, with 6.0% or 16 of them being unemployed.
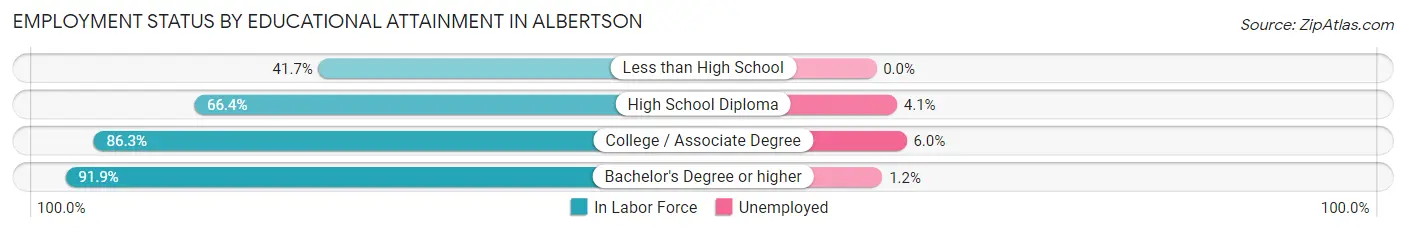
| Educational Attainment | In Labor Force | Unemployed |
| Less than High School | 50 (41.7%) | 0 (0.0%) |
| High School Diploma | 196 (66.4%) | 12 (4.1%) |
| College / Associate Degree | 265 (86.3%) | 18 (6.0%) |
| Bachelor's Degree or higher | 1,620 (91.9%) | 21 (1.2%) |
| Total | 2,132 (85.8%) | 50 (2.0%) |
Employment Occupations by Sex in Albertson
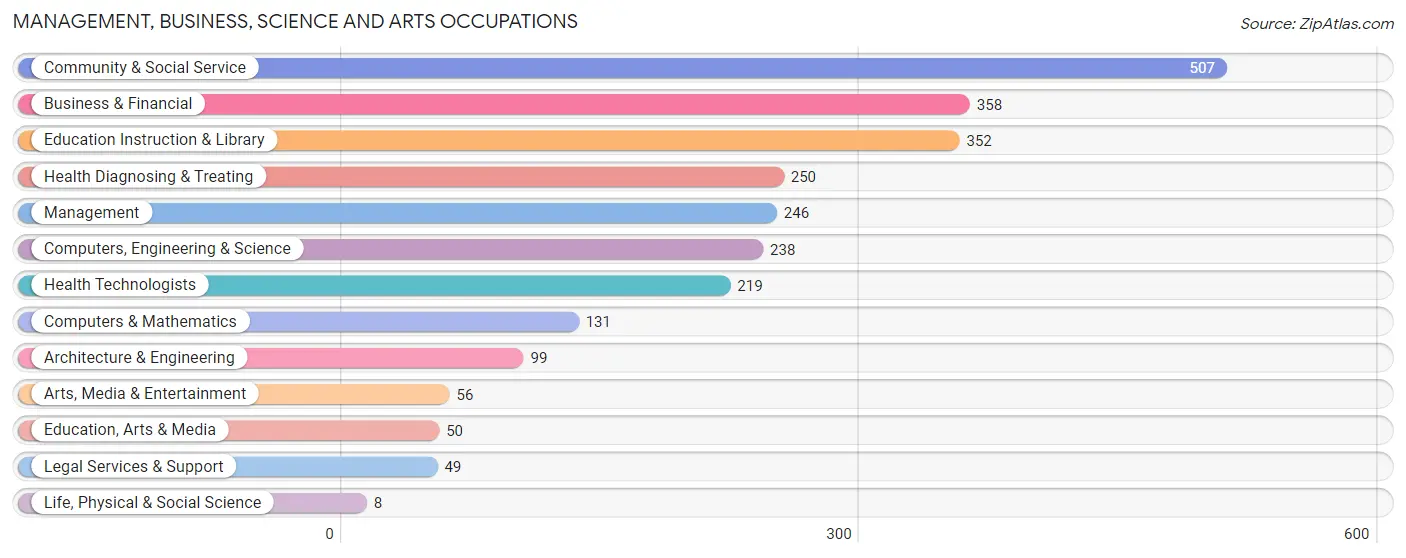
Management, Business, Science and Arts Occupations
The most common Management, Business, Science and Arts occupations in Albertson are Community & Social Service (507 | 18.6%), Business & Financial (358 | 13.1%), Education Instruction & Library (352 | 12.9%), Health Diagnosing & Treating (250 | 9.2%), and Management (246 | 9.0%).
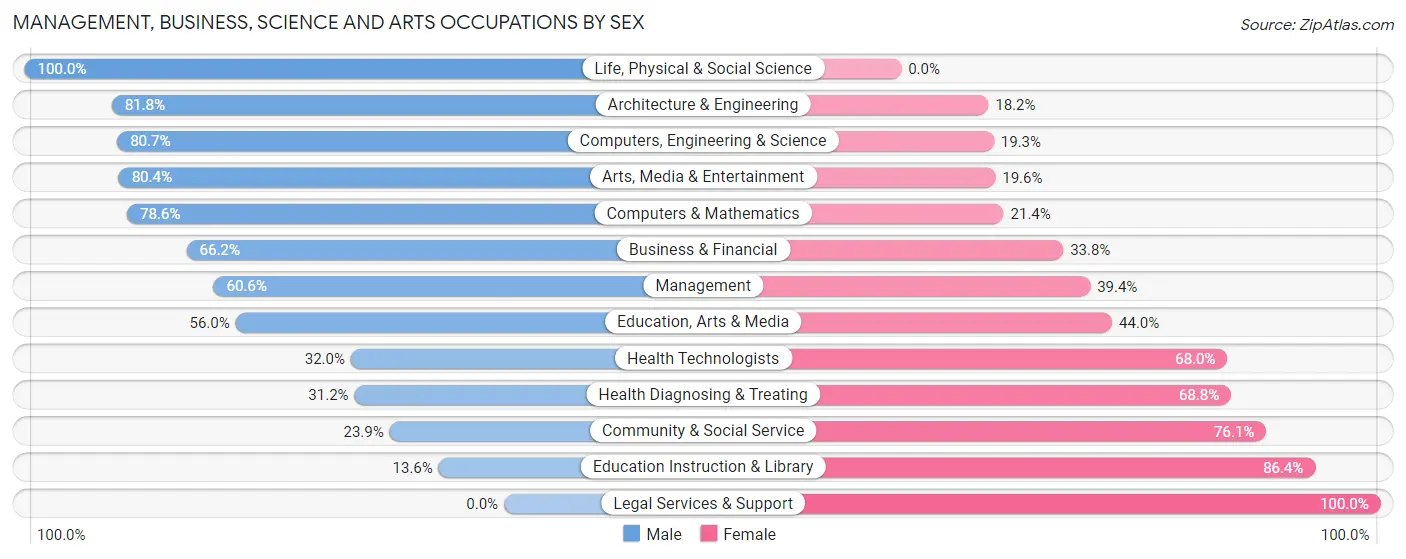
Management, Business, Science and Arts Occupations by Sex
Within the Management, Business, Science and Arts occupations in Albertson, the most male-oriented occupations are Life, Physical & Social Science (100.0%), Architecture & Engineering (81.8%), and Computers, Engineering & Science (80.7%), while the most female-oriented occupations are Legal Services & Support (100.0%), Education Instruction & Library (86.4%), and Community & Social Service (76.1%).
| Occupation | Male | Female |
| Management | 149 (60.6%) | 97 (39.4%) |
| Business & Financial | 237 (66.2%) | 121 (33.8%) |
| Computers, Engineering & Science | 192 (80.7%) | 46 (19.3%) |
| Computers & Mathematics | 103 (78.6%) | 28 (21.4%) |
| Architecture & Engineering | 81 (81.8%) | 18 (18.2%) |
| Life, Physical & Social Science | 8 (100.0%) | 0 (0.0%) |
| Community & Social Service | 121 (23.9%) | 386 (76.1%) |
| Education, Arts & Media | 28 (56.0%) | 22 (44.0%) |
| Legal Services & Support | 0 (0.0%) | 49 (100.0%) |
| Education Instruction & Library | 48 (13.6%) | 304 (86.4%) |
| Arts, Media & Entertainment | 45 (80.4%) | 11 (19.6%) |
| Health Diagnosing & Treating | 78 (31.2%) | 172 (68.8%) |
| Health Technologists | 70 (32.0%) | 149 (68.0%) |
| Total (Category) | 777 (48.6%) | 822 (51.4%) |
| Total (Overall) | 1,328 (48.6%) | 1,402 (51.4%) |
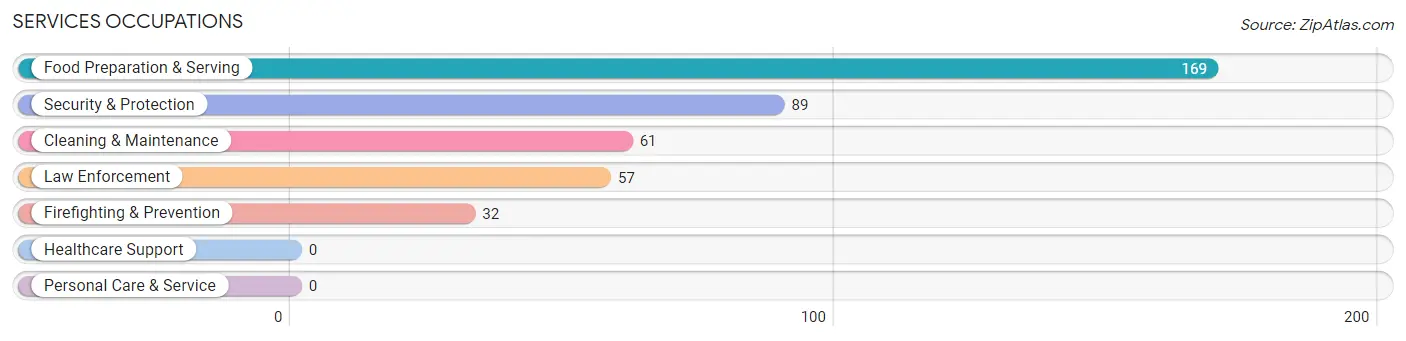
Services Occupations
The most common Services occupations in Albertson are Food Preparation & Serving (169 | 6.2%), Security & Protection (89 | 3.3%), Cleaning & Maintenance (61 | 2.2%), Law Enforcement (57 | 2.1%), and Firefighting & Prevention (32 | 1.2%).
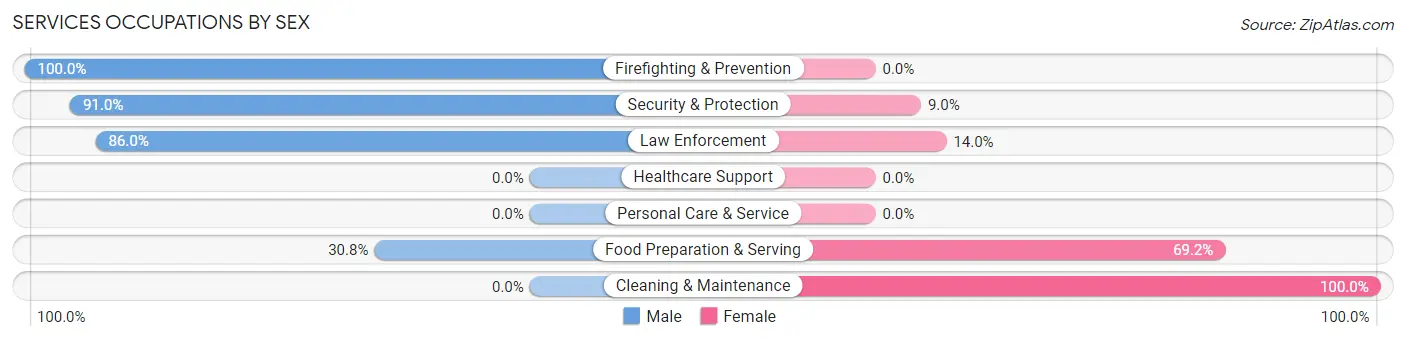
Services Occupations by Sex
Within the Services occupations in Albertson, the most male-oriented occupations are Firefighting & Prevention (100.0%), Security & Protection (91.0%), and Law Enforcement (86.0%), while the most female-oriented occupations are Cleaning & Maintenance (100.0%), Food Preparation & Serving (69.2%), and Law Enforcement (14.0%).
| Occupation | Male | Female |
| Healthcare Support | 0 (0.0%) | 0 (0.0%) |
| Security & Protection | 81 (91.0%) | 8 (9.0%) |
| Firefighting & Prevention | 32 (100.0%) | 0 (0.0%) |
| Law Enforcement | 49 (86.0%) | 8 (14.0%) |
| Food Preparation & Serving | 52 (30.8%) | 117 (69.2%) |
| Cleaning & Maintenance | 0 (0.0%) | 61 (100.0%) |
| Personal Care & Service | 0 (0.0%) | 0 (0.0%) |
| Total (Category) | 133 (41.7%) | 186 (58.3%) |
| Total (Overall) | 1,328 (48.6%) | 1,402 (51.4%) |
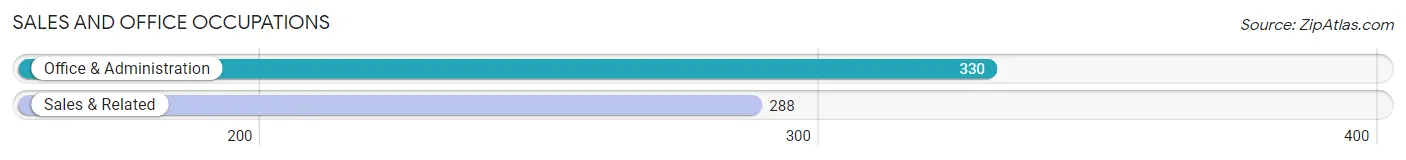
Sales and Office Occupations
The most common Sales and Office occupations in Albertson are Office & Administration (330 | 12.1%), and Sales & Related (288 | 10.5%).
Sales and Office Occupations by Sex
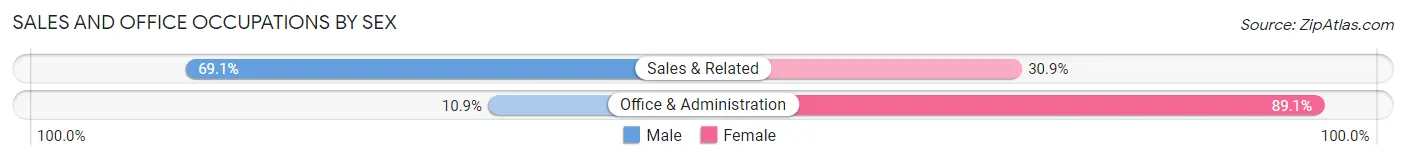
| Occupation | Male | Female |
| Sales & Related | 199 (69.1%) | 89 (30.9%) |
| Office & Administration | 36 (10.9%) | 294 (89.1%) |
| Total (Category) | 235 (38.0%) | 383 (62.0%) |
| Total (Overall) | 1,328 (48.6%) | 1,402 (51.4%) |
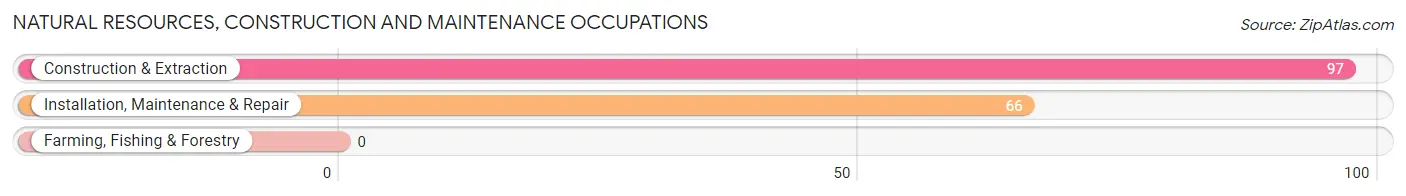
Natural Resources, Construction and Maintenance Occupations
The most common Natural Resources, Construction and Maintenance occupations in Albertson are Construction & Extraction (97 | 3.5%), and Installation, Maintenance & Repair (66 | 2.4%).
Natural Resources, Construction and Maintenance Occupations by Sex
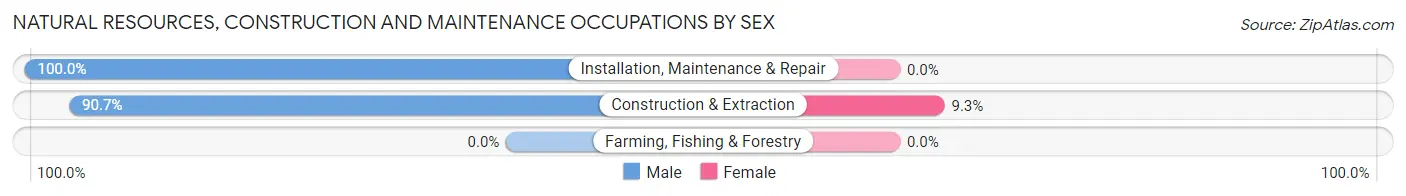
| Occupation | Male | Female |
| Farming, Fishing & Forestry | 0 (0.0%) | 0 (0.0%) |
| Construction & Extraction | 88 (90.7%) | 9 (9.3%) |
| Installation, Maintenance & Repair | 66 (100.0%) | 0 (0.0%) |
| Total (Category) | 154 (94.5%) | 9 (5.5%) |
| Total (Overall) | 1,328 (48.6%) | 1,402 (51.4%) |
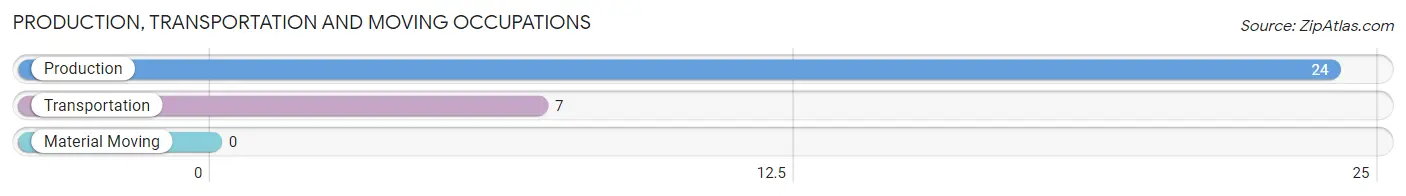
Production, Transportation and Moving Occupations
The most common Production, Transportation and Moving occupations in Albertson are Production (24 | 0.9%), and Transportation (7 | 0.3%).
Production, Transportation and Moving Occupations by Sex
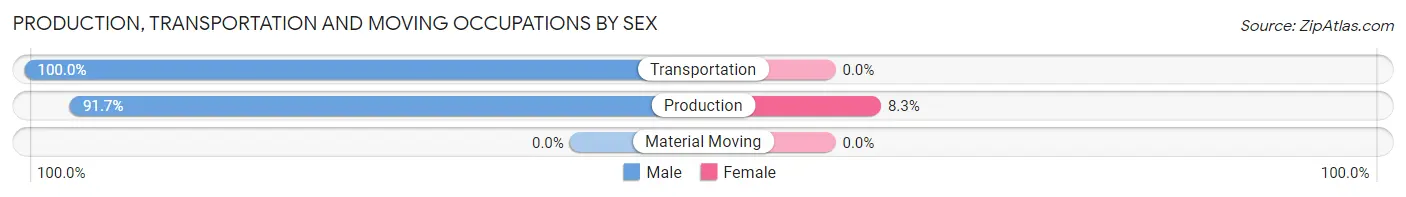
| Occupation | Male | Female |
| Production | 22 (91.7%) | 2 (8.3%) |
| Transportation | 7 (100.0%) | 0 (0.0%) |
| Material Moving | 0 (0.0%) | 0 (0.0%) |
| Total (Category) | 29 (93.5%) | 2 (6.5%) |
| Total (Overall) | 1,328 (48.6%) | 1,402 (51.4%) |
Employment Industries by Sex in Albertson
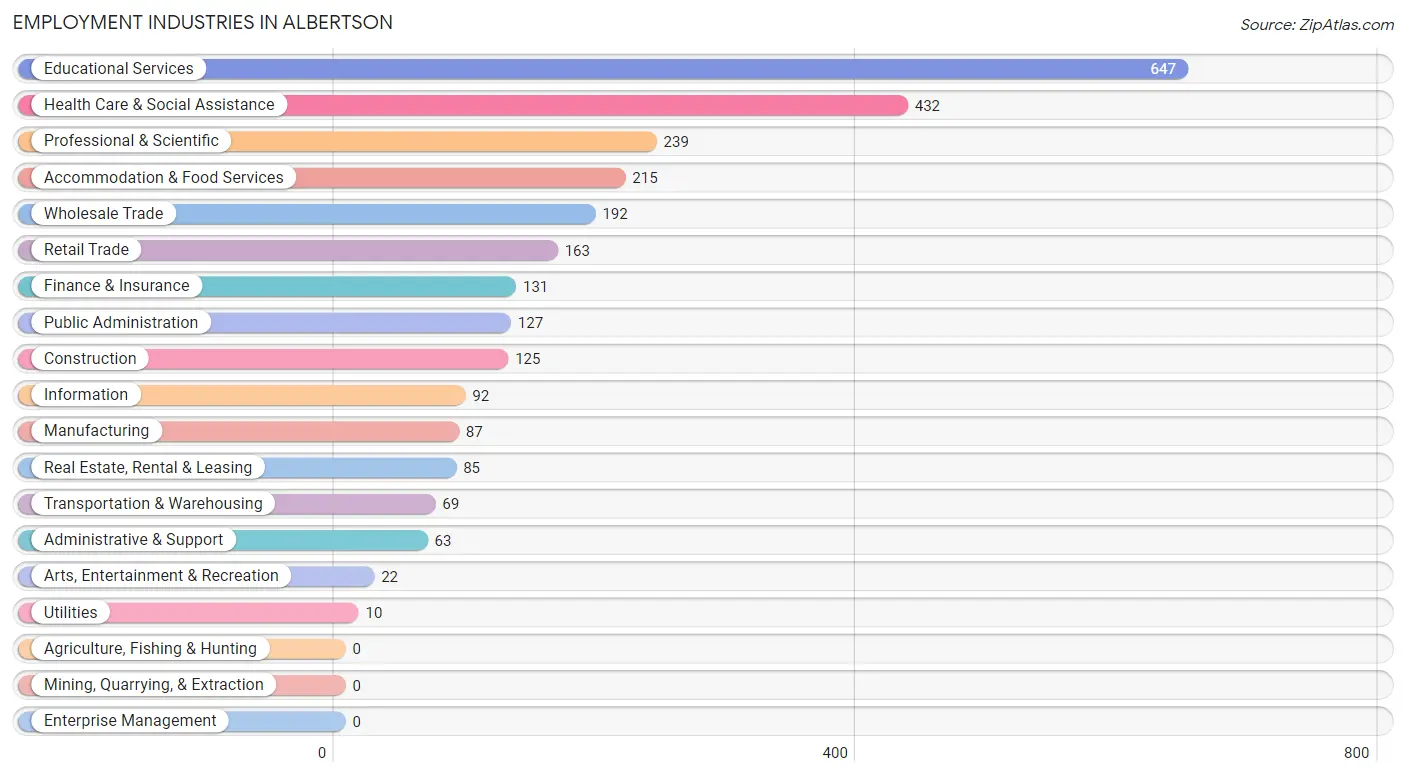
Employment Industries in Albertson
The major employment industries in Albertson include Educational Services (647 | 23.7%), Health Care & Social Assistance (432 | 15.8%), Professional & Scientific (239 | 8.7%), Accommodation & Food Services (215 | 7.9%), and Wholesale Trade (192 | 7.0%).
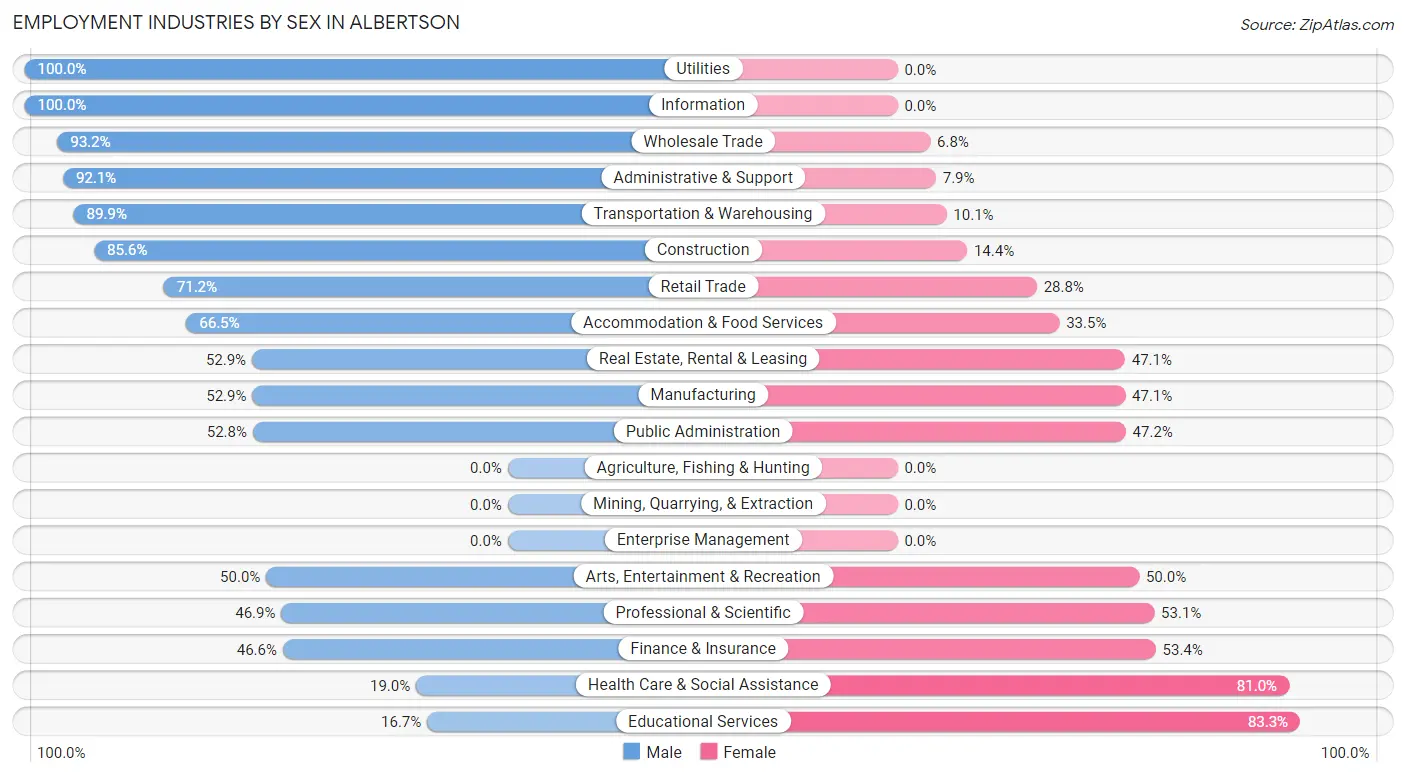
Employment Industries by Sex in Albertson
The Albertson industries that see more men than women are Utilities (100.0%), Information (100.0%), and Wholesale Trade (93.2%), whereas the industries that tend to have a higher number of women are Educational Services (83.3%), Health Care & Social Assistance (81.0%), and Finance & Insurance (53.4%).
| Industry | Male | Female |
| Agriculture, Fishing & Hunting | 0 (0.0%) | 0 (0.0%) |
| Mining, Quarrying, & Extraction | 0 (0.0%) | 0 (0.0%) |
| Construction | 107 (85.6%) | 18 (14.4%) |
| Manufacturing | 46 (52.9%) | 41 (47.1%) |
| Wholesale Trade | 179 (93.2%) | 13 (6.8%) |
| Retail Trade | 116 (71.2%) | 47 (28.8%) |
| Transportation & Warehousing | 62 (89.9%) | 7 (10.1%) |
| Utilities | 10 (100.0%) | 0 (0.0%) |
| Information | 92 (100.0%) | 0 (0.0%) |
| Finance & Insurance | 61 (46.6%) | 70 (53.4%) |
| Real Estate, Rental & Leasing | 45 (52.9%) | 40 (47.1%) |
| Professional & Scientific | 112 (46.9%) | 127 (53.1%) |
| Enterprise Management | 0 (0.0%) | 0 (0.0%) |
| Administrative & Support | 58 (92.1%) | 5 (7.9%) |
| Educational Services | 108 (16.7%) | 539 (83.3%) |
| Health Care & Social Assistance | 82 (19.0%) | 350 (81.0%) |
| Arts, Entertainment & Recreation | 11 (50.0%) | 11 (50.0%) |
| Accommodation & Food Services | 143 (66.5%) | 72 (33.5%) |
| Public Administration | 67 (52.8%) | 60 (47.2%) |
| Total | 1,328 (48.6%) | 1,402 (51.4%) |
Education in Albertson
School Enrollment in Albertson
The most common levels of schooling among the 1,365 students in Albertson are high school (390 | 28.6%), graduate / professional (259 | 19.0%), and college / undergraduate (242 | 17.7%).
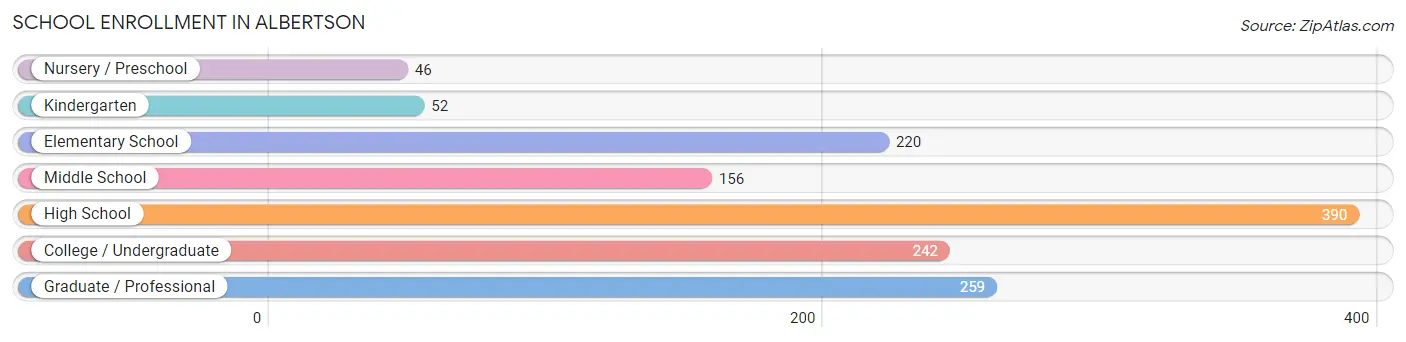
| School Level | # Students | % Students |
| Nursery / Preschool | 46 | 3.4% |
| Kindergarten | 52 | 3.8% |
| Elementary School | 220 | 16.1% |
| Middle School | 156 | 11.4% |
| High School | 390 | 28.6% |
| College / Undergraduate | 242 | 17.7% |
| Graduate / Professional | 259 | 19.0% |
| Total | 1,365 | 100.0% |
School Enrollment by Age by Funding Source in Albertson
Out of a total of 1,365 students who are enrolled in schools in Albertson, 405 (29.7%) attend a private institution, while the remaining 960 (70.3%) are enrolled in public schools. The age group of 25 to 34 year olds has the highest likelihood of being enrolled in private schools, with 222 (86.4% in the age bracket) enrolled. Conversely, the age group of 10 to 14 year olds has the lowest likelihood of being enrolled in a private school, with 221 (100.0% in the age bracket) attending a public institution.
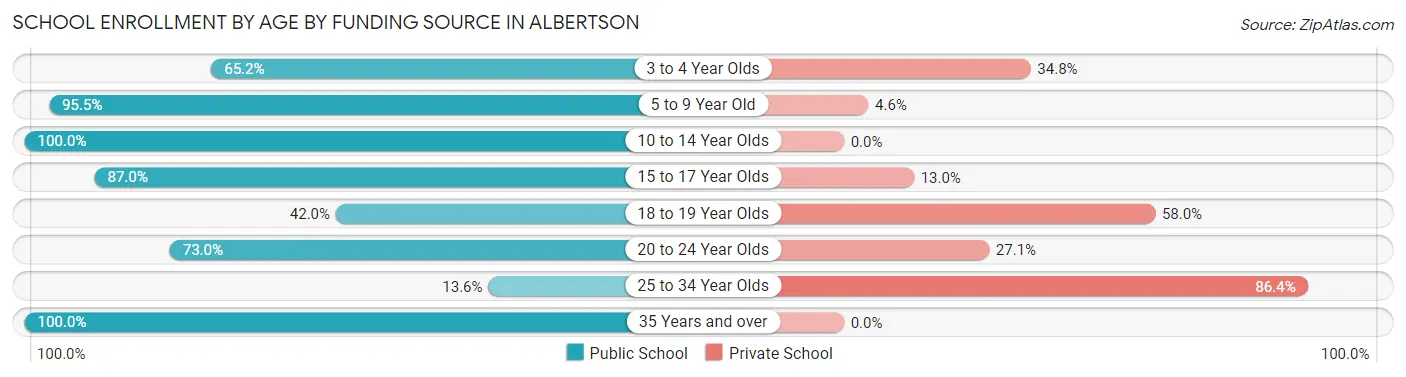
| Age Bracket | Public School | Private School |
| 3 to 4 Year Olds | 30 (65.2%) | 16 (34.8%) |
| 5 to 9 Year Old | 252 (95.5%) | 12 (4.5%) |
| 10 to 14 Year Olds | 221 (100.0%) | 0 (0.0%) |
| 15 to 17 Year Olds | 200 (87.0%) | 30 (13.0%) |
| 18 to 19 Year Olds | 50 (42.0%) | 69 (58.0%) |
| 20 to 24 Year Olds | 151 (73.0%) | 56 (27.1%) |
| 25 to 34 Year Olds | 35 (13.6%) | 222 (86.4%) |
| 35 Years and over | 21 (100.0%) | 0 (0.0%) |
| Total | 960 (70.3%) | 405 (29.7%) |
Educational Attainment by Field of Study in Albertson
Business (477 | 20.8%), education (302 | 13.2%), literature & languages (296 | 12.9%), science & technology (242 | 10.6%), and computers & mathematics (182 | 7.9%) are the most common fields of study among 2,291 individuals in Albertson who have obtained a bachelor's degree or higher.
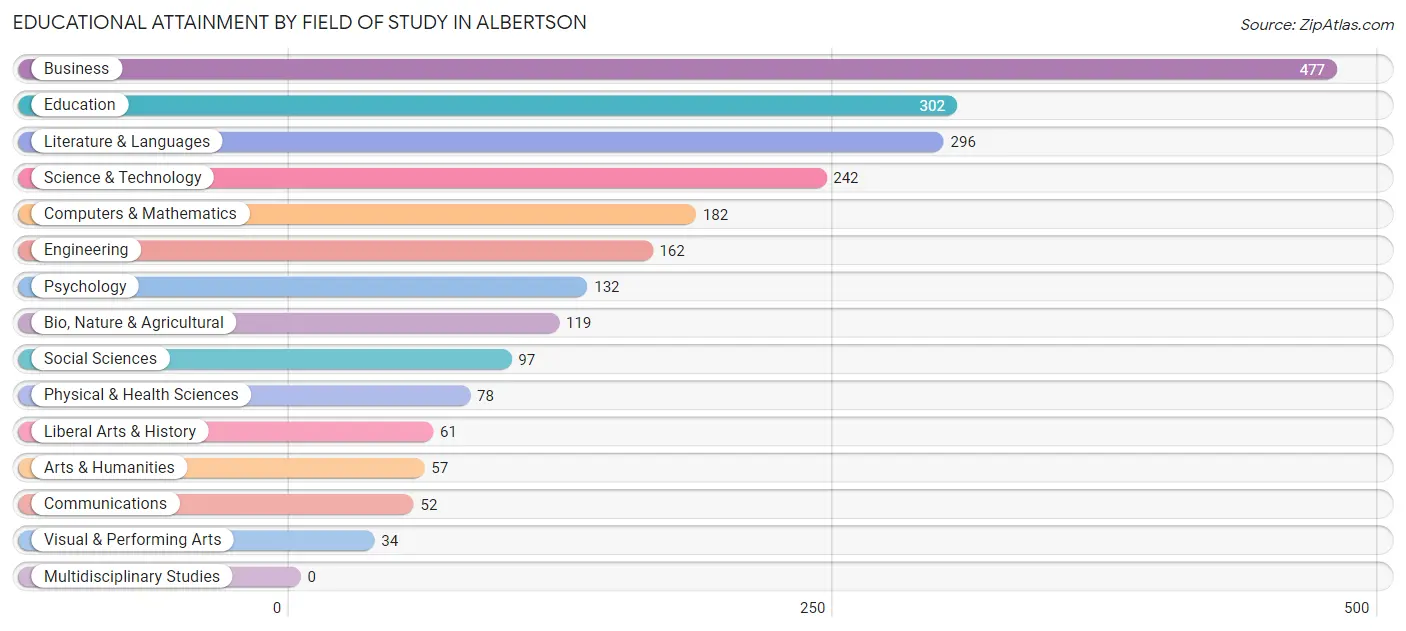
| Field of Study | # Graduates | % Graduates |
| Computers & Mathematics | 182 | 7.9% |
| Bio, Nature & Agricultural | 119 | 5.2% |
| Physical & Health Sciences | 78 | 3.4% |
| Psychology | 132 | 5.8% |
| Social Sciences | 97 | 4.2% |
| Engineering | 162 | 7.1% |
| Multidisciplinary Studies | 0 | 0.0% |
| Science & Technology | 242 | 10.6% |
| Business | 477 | 20.8% |
| Education | 302 | 13.2% |
| Literature & Languages | 296 | 12.9% |
| Liberal Arts & History | 61 | 2.7% |
| Visual & Performing Arts | 34 | 1.5% |
| Communications | 52 | 2.3% |
| Arts & Humanities | 57 | 2.5% |
| Total | 2,291 | 100.0% |
Transportation & Commute in Albertson
Vehicle Availability by Sex in Albertson
The most prevalent vehicle ownership categories in Albertson are males with 2 vehicles (590, accounting for 44.4%) and females with 2 vehicles (451, making up 42.1%).
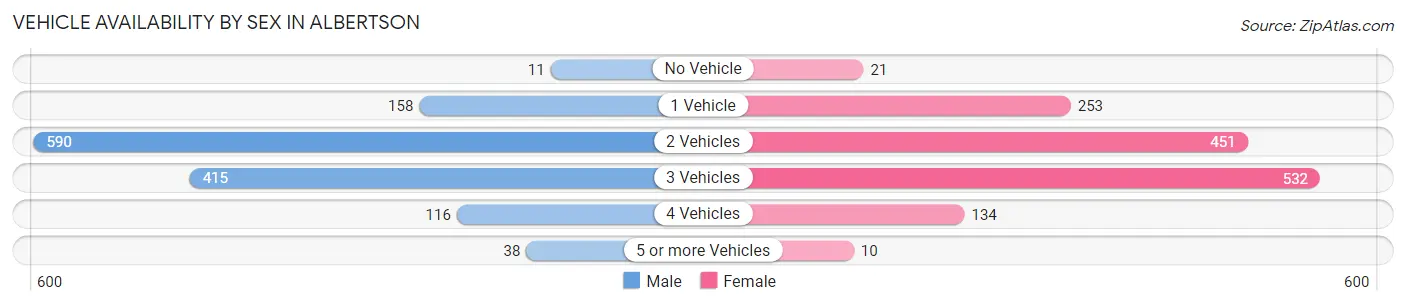
| Vehicles Available | Male | Female |
| No Vehicle | 11 (0.8%) | 21 (1.5%) |
| 1 Vehicle | 158 (11.9%) | 253 (18.1%) |
| 2 Vehicles | 590 (44.4%) | 451 (32.2%) |
| 3 Vehicles | 415 (31.2%) | 532 (38.0%) |
| 4 Vehicles | 116 (8.7%) | 134 (9.6%) |
| 5 or more Vehicles | 38 (2.9%) | 10 (0.7%) |
| Total | 1,328 (100.0%) | 1,401 (100.0%) |
Commute Time in Albertson
The most frequently occuring commute durations in Albertson are 30 to 34 minutes (529 commuters, 20.6%), 60 to 89 minutes (491 commuters, 19.2%), and 20 to 24 minutes (325 commuters, 12.7%).
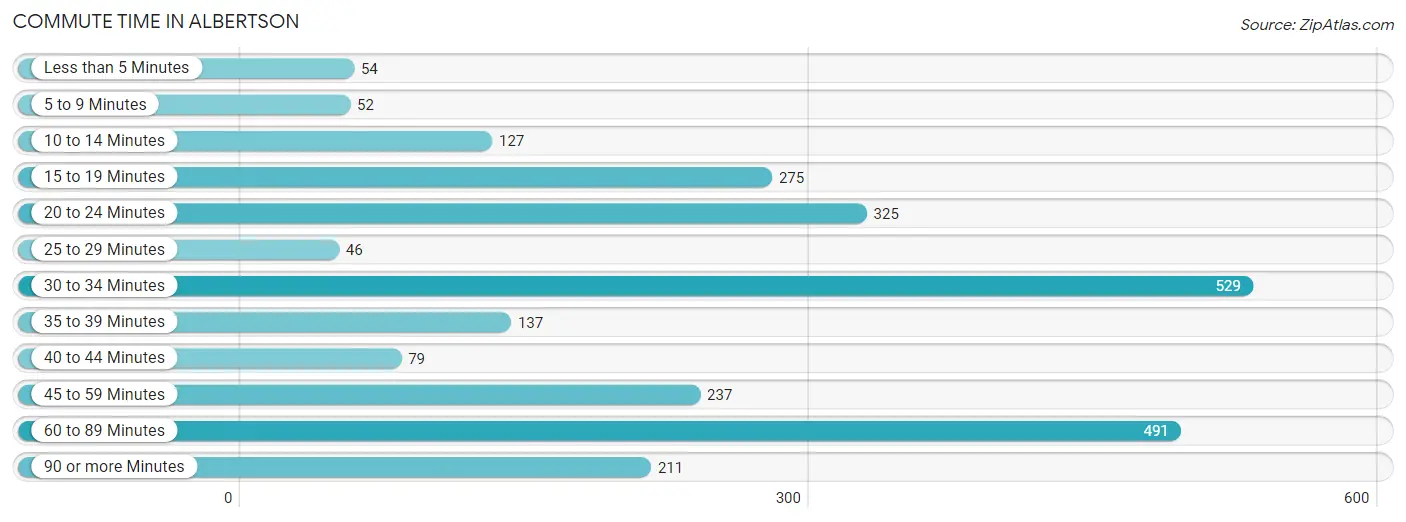
| Commute Time | # Commuters | % Commuters |
| Less than 5 Minutes | 54 | 2.1% |
| 5 to 9 Minutes | 52 | 2.0% |
| 10 to 14 Minutes | 127 | 5.0% |
| 15 to 19 Minutes | 275 | 10.7% |
| 20 to 24 Minutes | 325 | 12.7% |
| 25 to 29 Minutes | 46 | 1.8% |
| 30 to 34 Minutes | 529 | 20.6% |
| 35 to 39 Minutes | 137 | 5.3% |
| 40 to 44 Minutes | 79 | 3.1% |
| 45 to 59 Minutes | 237 | 9.2% |
| 60 to 89 Minutes | 491 | 19.2% |
| 90 or more Minutes | 211 | 8.2% |
Commute Time by Sex in Albertson
The most common commute times in Albertson are 60 to 89 minutes (406 commuters, 32.2%) for males and 30 to 34 minutes (365 commuters, 28.0%) for females.
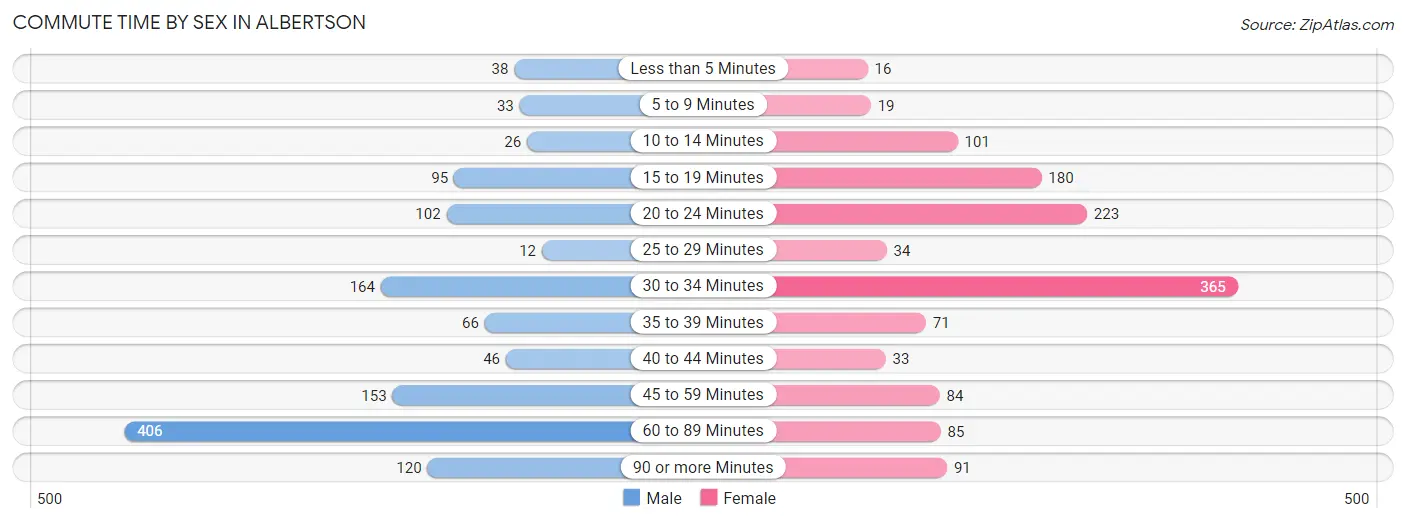
| Commute Time | Male | Female |
| Less than 5 Minutes | 38 (3.0%) | 16 (1.2%) |
| 5 to 9 Minutes | 33 (2.6%) | 19 (1.5%) |
| 10 to 14 Minutes | 26 (2.1%) | 101 (7.8%) |
| 15 to 19 Minutes | 95 (7.5%) | 180 (13.8%) |
| 20 to 24 Minutes | 102 (8.1%) | 223 (17.1%) |
| 25 to 29 Minutes | 12 (0.9%) | 34 (2.6%) |
| 30 to 34 Minutes | 164 (13.0%) | 365 (28.0%) |
| 35 to 39 Minutes | 66 (5.2%) | 71 (5.4%) |
| 40 to 44 Minutes | 46 (3.6%) | 33 (2.5%) |
| 45 to 59 Minutes | 153 (12.1%) | 84 (6.5%) |
| 60 to 89 Minutes | 406 (32.2%) | 85 (6.5%) |
| 90 or more Minutes | 120 (9.5%) | 91 (7.0%) |
Time of Departure to Work by Sex in Albertson
The most frequent times of departure to work in Albertson are 6:00 AM to 6:29 AM (295, 23.4%) for males and 9:00 AM to 9:59 AM (319, 24.5%) for females.
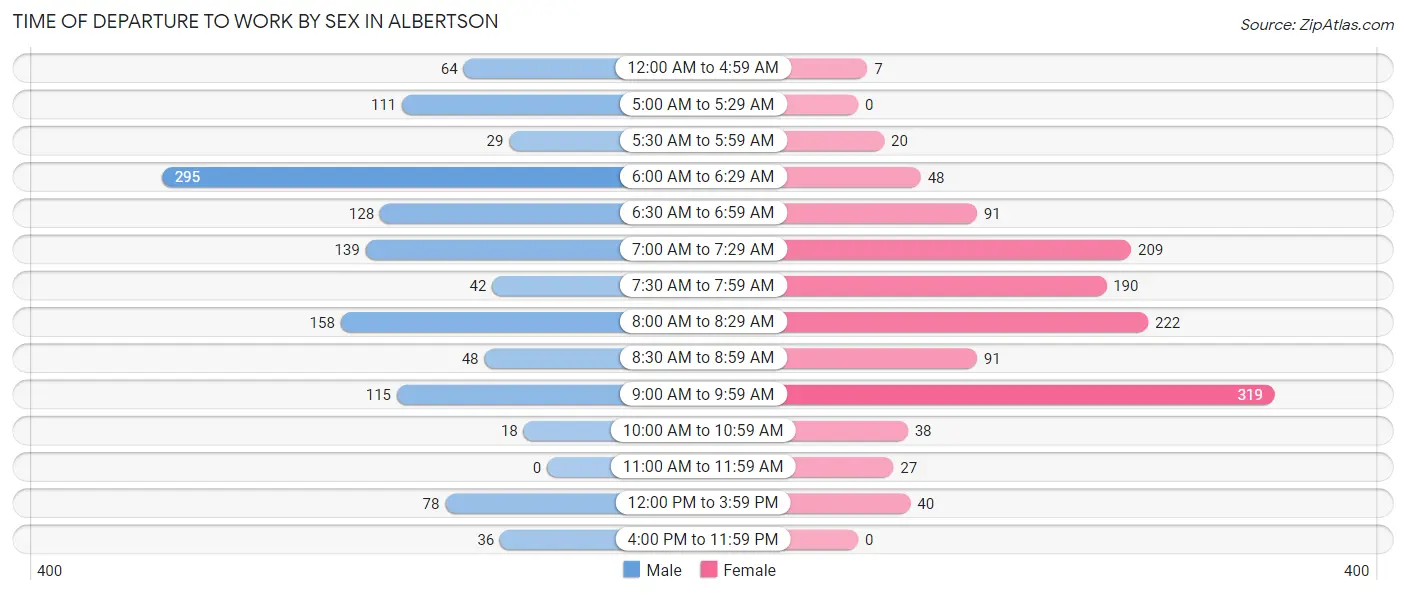
| Time of Departure | Male | Female |
| 12:00 AM to 4:59 AM | 64 (5.1%) | 7 (0.5%) |
| 5:00 AM to 5:29 AM | 111 (8.8%) | 0 (0.0%) |
| 5:30 AM to 5:59 AM | 29 (2.3%) | 20 (1.5%) |
| 6:00 AM to 6:29 AM | 295 (23.4%) | 48 (3.7%) |
| 6:30 AM to 6:59 AM | 128 (10.2%) | 91 (7.0%) |
| 7:00 AM to 7:29 AM | 139 (11.0%) | 209 (16.1%) |
| 7:30 AM to 7:59 AM | 42 (3.3%) | 190 (14.6%) |
| 8:00 AM to 8:29 AM | 158 (12.5%) | 222 (17.1%) |
| 8:30 AM to 8:59 AM | 48 (3.8%) | 91 (7.0%) |
| 9:00 AM to 9:59 AM | 115 (9.1%) | 319 (24.5%) |
| 10:00 AM to 10:59 AM | 18 (1.4%) | 38 (2.9%) |
| 11:00 AM to 11:59 AM | 0 (0.0%) | 27 (2.1%) |
| 12:00 PM to 3:59 PM | 78 (6.2%) | 40 (3.1%) |
| 4:00 PM to 11:59 PM | 36 (2.9%) | 0 (0.0%) |
| Total | 1,261 (100.0%) | 1,302 (100.0%) |
Housing Occupancy in Albertson
Occupancy by Ownership in Albertson
Of the total 1,727 dwellings in Albertson, owner-occupied units account for 1,613 (93.4%), while renter-occupied units make up 114 (6.6%).
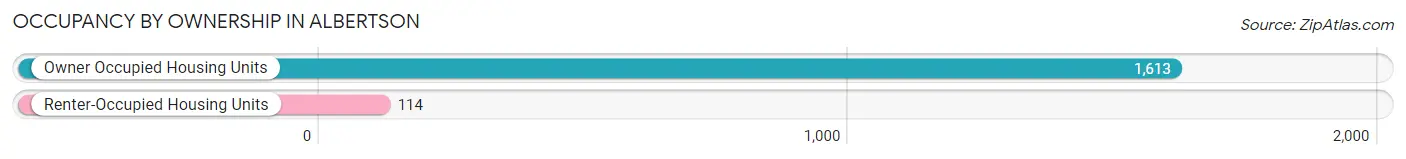
| Occupancy | # Housing Units | % Housing Units |
| Owner Occupied Housing Units | 1,613 | 93.4% |
| Renter-Occupied Housing Units | 114 | 6.6% |
| Total Occupied Housing Units | 1,727 | 100.0% |
Occupancy by Household Size in Albertson
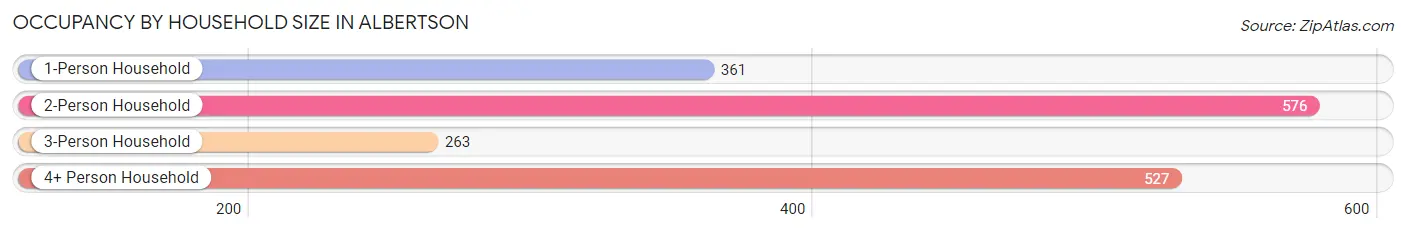
| Household Size | # Housing Units | % Housing Units |
| 1-Person Household | 361 | 20.9% |
| 2-Person Household | 576 | 33.4% |
| 3-Person Household | 263 | 15.2% |
| 4+ Person Household | 527 | 30.5% |
| Total Housing Units | 1,727 | 100.0% |
Occupancy by Ownership by Household Size in Albertson
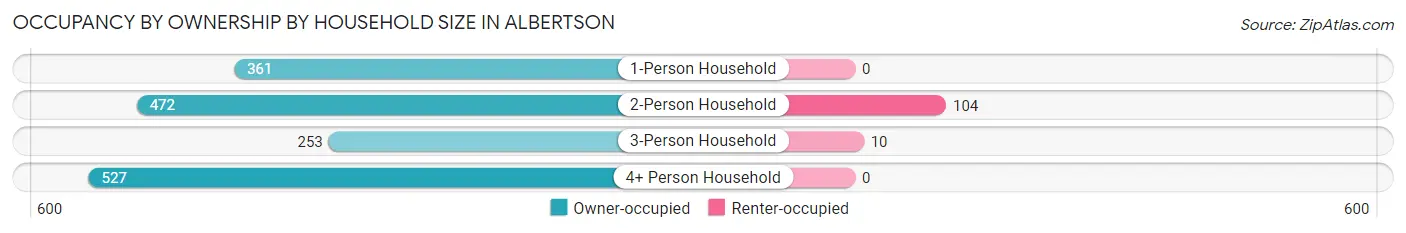
| Household Size | Owner-occupied | Renter-occupied |
| 1-Person Household | 361 (100.0%) | 0 (0.0%) |
| 2-Person Household | 472 (81.9%) | 104 (18.1%) |
| 3-Person Household | 253 (96.2%) | 10 (3.8%) |
| 4+ Person Household | 527 (100.0%) | 0 (0.0%) |
| Total Housing Units | 1,613 (93.4%) | 114 (6.6%) |
Occupancy by Educational Attainment in Albertson
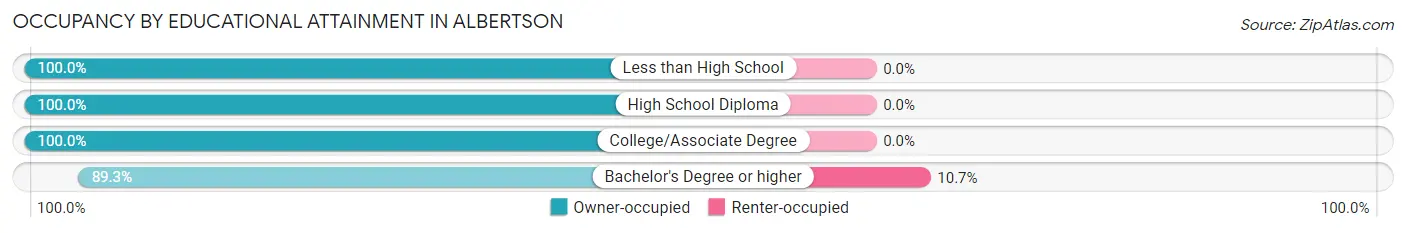
| Household Size | Owner-occupied | Renter-occupied |
| Less than High School | 165 (100.0%) | 0 (0.0%) |
| High School Diploma | 186 (100.0%) | 0 (0.0%) |
| College/Associate Degree | 315 (100.0%) | 0 (0.0%) |
| Bachelor's Degree or higher | 947 (89.3%) | 114 (10.7%) |
Occupancy by Age of Householder in Albertson
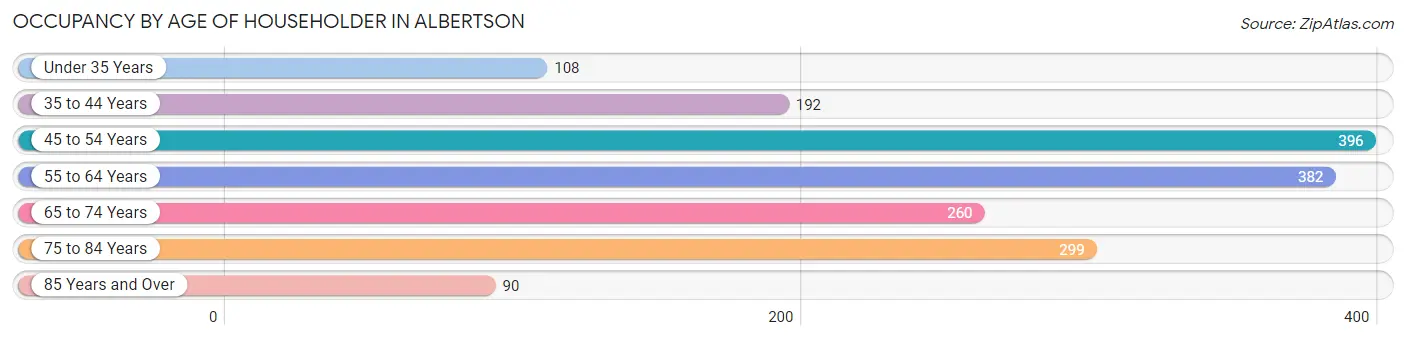
| Age Bracket | # Households | % Households |
| Under 35 Years | 108 | 6.2% |
| 35 to 44 Years | 192 | 11.1% |
| 45 to 54 Years | 396 | 22.9% |
| 55 to 64 Years | 382 | 22.1% |
| 65 to 74 Years | 260 | 15.1% |
| 75 to 84 Years | 299 | 17.3% |
| 85 Years and Over | 90 | 5.2% |
| Total | 1,727 | 100.0% |
Housing Finances in Albertson
Median Income by Occupancy in Albertson
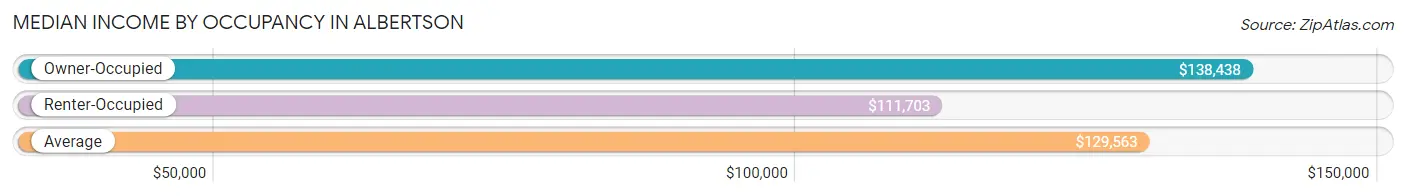
| Occupancy Type | # Households | Median Income |
| Owner-Occupied | 1,613 (93.4%) | $138,438 |
| Renter-Occupied | 114 (6.6%) | $111,703 |
| Average | 1,727 (100.0%) | $129,563 |
Occupancy by Householder Income Bracket in Albertson
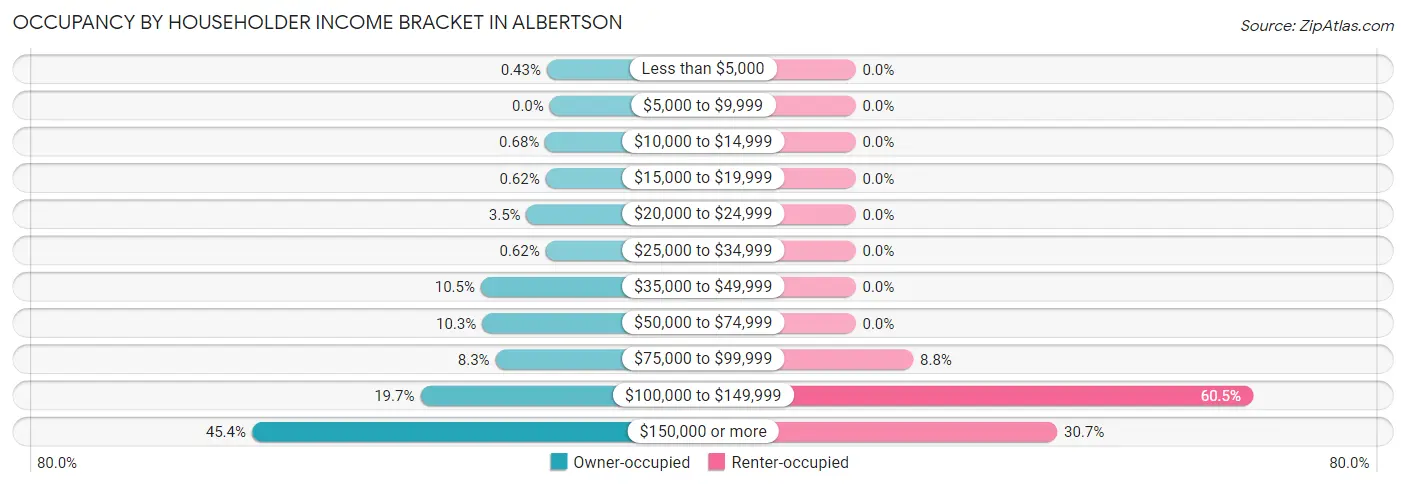
| Income Bracket | Owner-occupied | Renter-occupied |
| Less than $5,000 | 7 (0.4%) | 0 (0.0%) |
| $5,000 to $9,999 | 0 (0.0%) | 0 (0.0%) |
| $10,000 to $14,999 | 11 (0.7%) | 0 (0.0%) |
| $15,000 to $19,999 | 10 (0.6%) | 0 (0.0%) |
| $20,000 to $24,999 | 57 (3.5%) | 0 (0.0%) |
| $25,000 to $34,999 | 10 (0.6%) | 0 (0.0%) |
| $35,000 to $49,999 | 169 (10.5%) | 0 (0.0%) |
| $50,000 to $74,999 | 166 (10.3%) | 0 (0.0%) |
| $75,000 to $99,999 | 133 (8.3%) | 10 (8.8%) |
| $100,000 to $149,999 | 318 (19.7%) | 69 (60.5%) |
| $150,000 or more | 732 (45.4%) | 35 (30.7%) |
| Total | 1,613 (100.0%) | 114 (100.0%) |
Monthly Housing Cost Tiers in Albertson
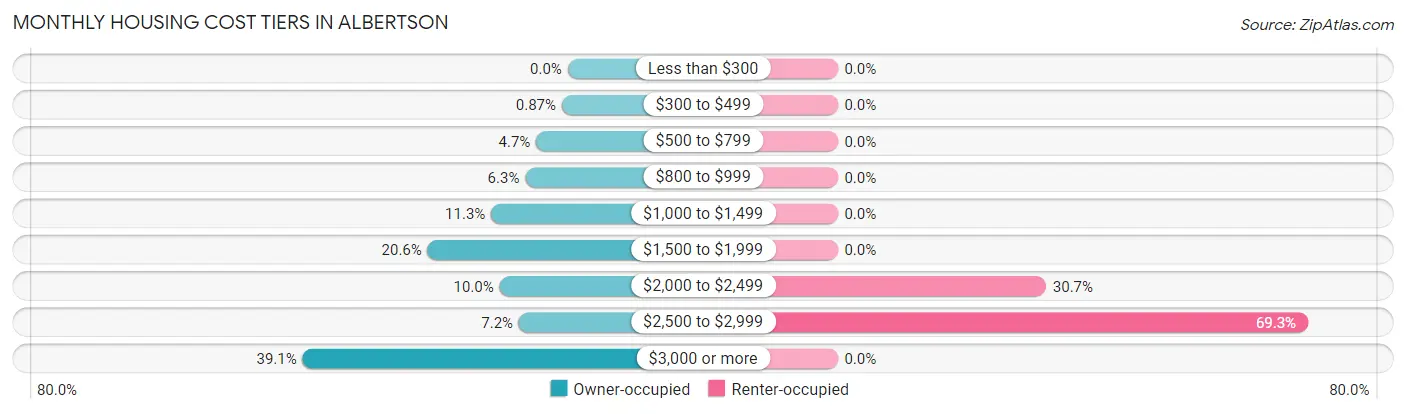
| Monthly Cost | Owner-occupied | Renter-occupied |
| Less than $300 | 0 (0.0%) | 0 (0.0%) |
| $300 to $499 | 14 (0.9%) | 0 (0.0%) |
| $500 to $799 | 75 (4.6%) | 0 (0.0%) |
| $800 to $999 | 101 (6.3%) | 0 (0.0%) |
| $1,000 to $1,499 | 182 (11.3%) | 0 (0.0%) |
| $1,500 to $1,999 | 333 (20.6%) | 0 (0.0%) |
| $2,000 to $2,499 | 162 (10.0%) | 35 (30.7%) |
| $2,500 to $2,999 | 116 (7.2%) | 79 (69.3%) |
| $3,000 or more | 630 (39.1%) | 0 (0.0%) |
| Total | 1,613 (100.0%) | 114 (100.0%) |
Physical Housing Characteristics in Albertson
Housing Structures in Albertson
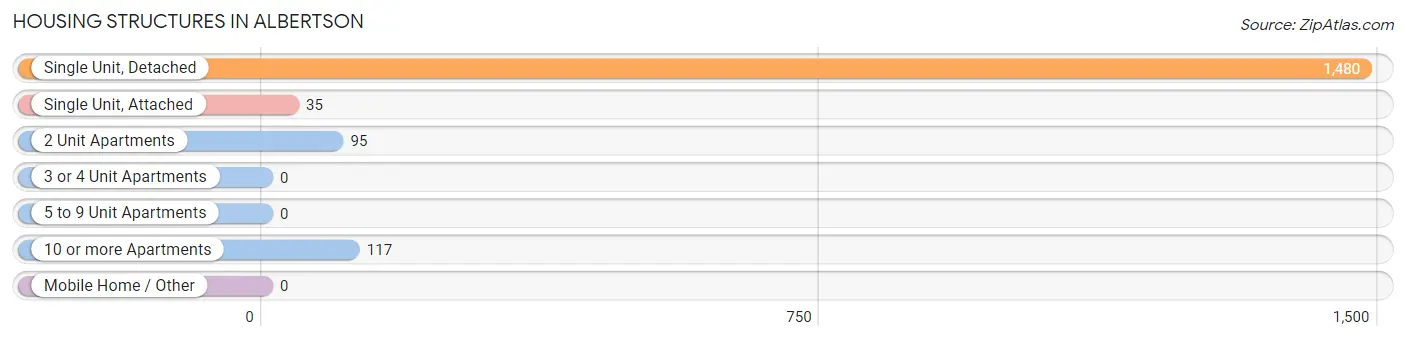
| Structure Type | # Housing Units | % Housing Units |
| Single Unit, Detached | 1,480 | 85.7% |
| Single Unit, Attached | 35 | 2.0% |
| 2 Unit Apartments | 95 | 5.5% |
| 3 or 4 Unit Apartments | 0 | 0.0% |
| 5 to 9 Unit Apartments | 0 | 0.0% |
| 10 or more Apartments | 117 | 6.8% |
| Mobile Home / Other | 0 | 0.0% |
| Total | 1,727 | 100.0% |
Housing Structures by Occupancy in Albertson
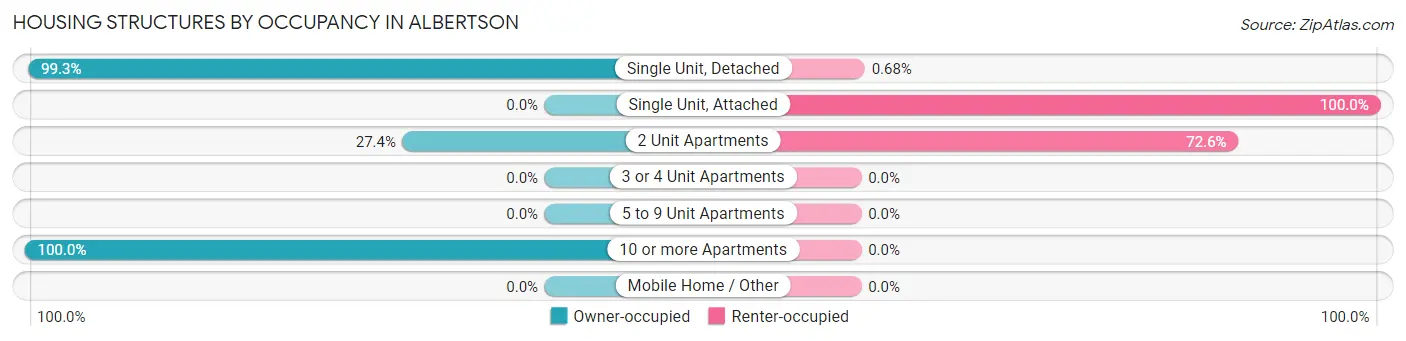
| Structure Type | Owner-occupied | Renter-occupied |
| Single Unit, Detached | 1,470 (99.3%) | 10 (0.7%) |
| Single Unit, Attached | 0 (0.0%) | 35 (100.0%) |
| 2 Unit Apartments | 26 (27.4%) | 69 (72.6%) |
| 3 or 4 Unit Apartments | 0 (0.0%) | 0 (0.0%) |
| 5 to 9 Unit Apartments | 0 (0.0%) | 0 (0.0%) |
| 10 or more Apartments | 117 (100.0%) | 0 (0.0%) |
| Mobile Home / Other | 0 (0.0%) | 0 (0.0%) |
| Total | 1,613 (93.4%) | 114 (6.6%) |
Housing Structures by Number of Rooms in Albertson
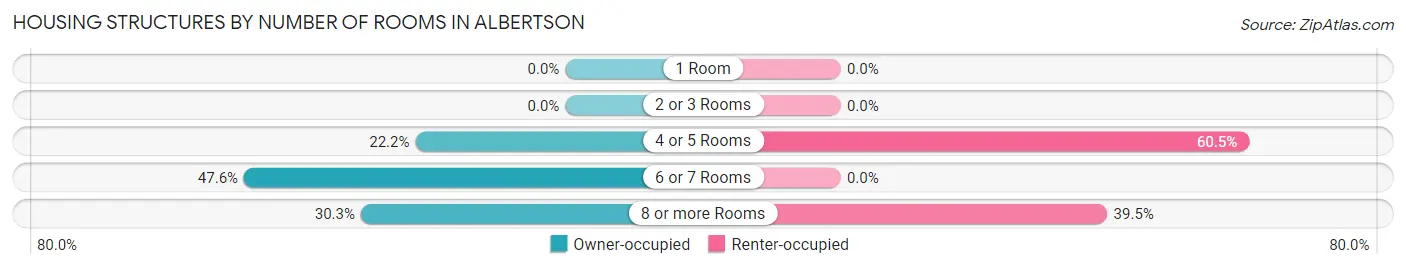
| Number of Rooms | Owner-occupied | Renter-occupied |
| 1 Room | 0 (0.0%) | 0 (0.0%) |
| 2 or 3 Rooms | 0 (0.0%) | 0 (0.0%) |
| 4 or 5 Rooms | 358 (22.2%) | 69 (60.5%) |
| 6 or 7 Rooms | 767 (47.5%) | 0 (0.0%) |
| 8 or more Rooms | 488 (30.2%) | 45 (39.5%) |
| Total | 1,613 (100.0%) | 114 (100.0%) |
Housing Structure by Heating Type in Albertson
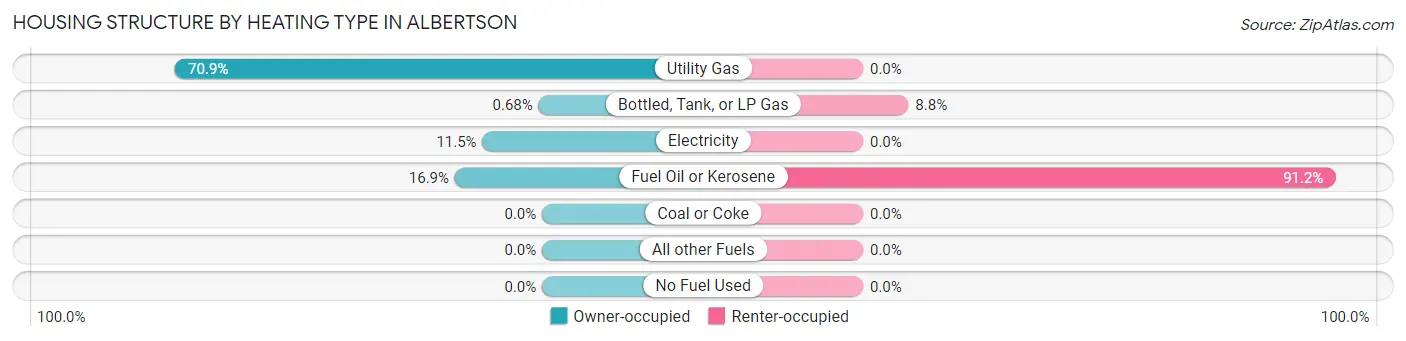
| Heating Type | Owner-occupied | Renter-occupied |
| Utility Gas | 1,144 (70.9%) | 0 (0.0%) |
| Bottled, Tank, or LP Gas | 11 (0.7%) | 10 (8.8%) |
| Electricity | 186 (11.5%) | 0 (0.0%) |
| Fuel Oil or Kerosene | 272 (16.9%) | 104 (91.2%) |
| Coal or Coke | 0 (0.0%) | 0 (0.0%) |
| All other Fuels | 0 (0.0%) | 0 (0.0%) |
| No Fuel Used | 0 (0.0%) | 0 (0.0%) |
| Total | 1,613 (100.0%) | 114 (100.0%) |
Household Vehicle Usage in Albertson
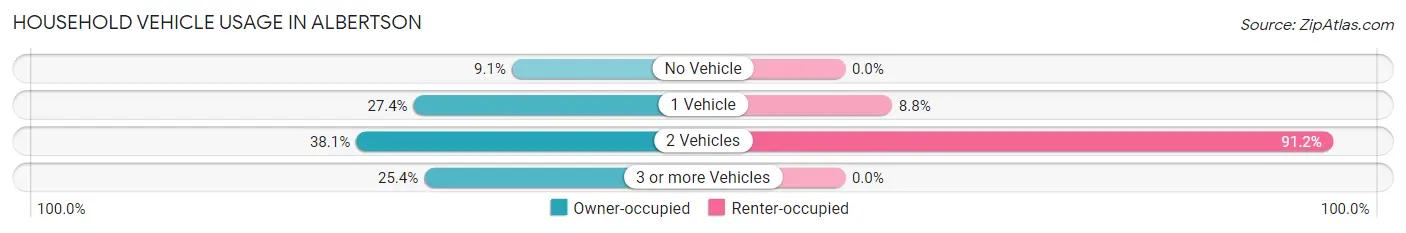
| Vehicles per Household | Owner-occupied | Renter-occupied |
| No Vehicle | 146 (9.0%) | 0 (0.0%) |
| 1 Vehicle | 442 (27.4%) | 10 (8.8%) |
| 2 Vehicles | 615 (38.1%) | 104 (91.2%) |
| 3 or more Vehicles | 410 (25.4%) | 0 (0.0%) |
| Total | 1,613 (100.0%) | 114 (100.0%) |
Real Estate & Mortgages in Albertson
Real Estate and Mortgage Overview in Albertson
| Characteristic | Without Mortgage | With Mortgage |
| Housing Units | 707 | 906 |
| Median Property Value | $737,600 | $724,900 |
| Median Household Income | $111,964 | $510 |
| Monthly Housing Costs | $1,501 | $630 |
| Real Estate Taxes | $10,001 | $0 |
Property Value by Mortgage Status in Albertson
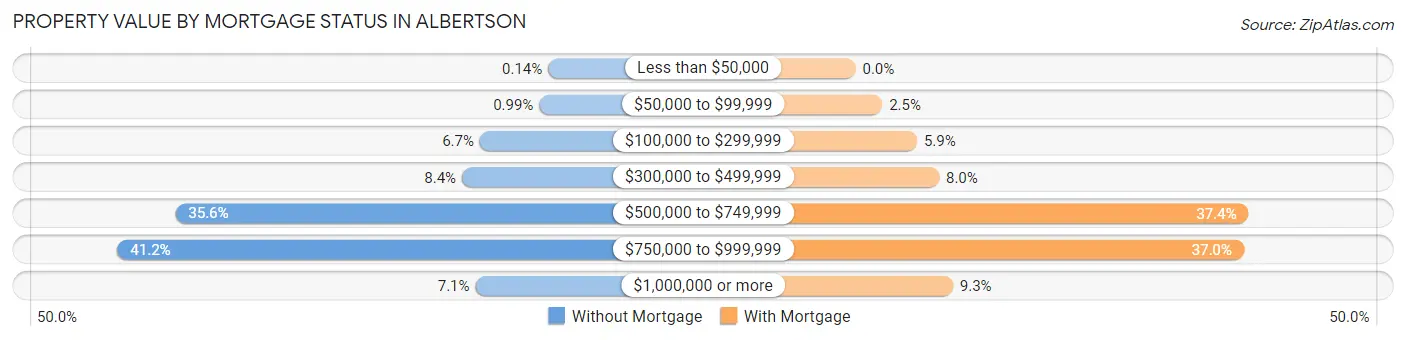
| Property Value | Without Mortgage | With Mortgage |
| Less than $50,000 | 1 (0.1%) | 0 (0.0%) |
| $50,000 to $99,999 | 7 (1.0%) | 23 (2.5%) |
| $100,000 to $299,999 | 47 (6.7%) | 53 (5.9%) |
| $300,000 to $499,999 | 59 (8.4%) | 72 (8.0%) |
| $500,000 to $749,999 | 252 (35.6%) | 339 (37.4%) |
| $750,000 to $999,999 | 291 (41.2%) | 335 (37.0%) |
| $1,000,000 or more | 50 (7.1%) | 84 (9.3%) |
| Total | 707 (100.0%) | 906 (100.0%) |
Household Income by Mortgage Status in Albertson
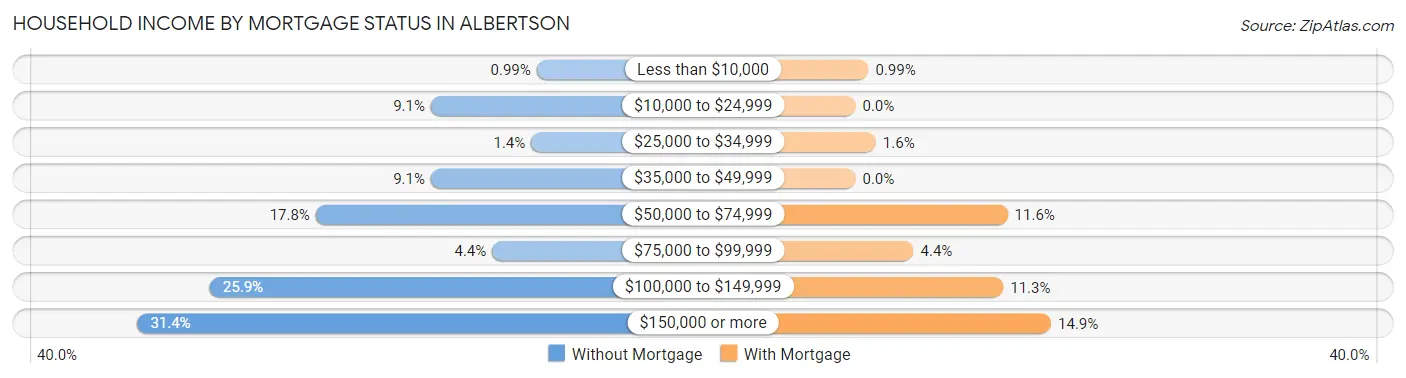
| Household Income | Without Mortgage | With Mortgage |
| Less than $10,000 | 7 (1.0%) | 9 (1.0%) |
| $10,000 to $24,999 | 64 (9.0%) | 0 (0.0%) |
| $25,000 to $34,999 | 10 (1.4%) | 14 (1.5%) |
| $35,000 to $49,999 | 64 (9.0%) | 0 (0.0%) |
| $50,000 to $74,999 | 126 (17.8%) | 105 (11.6%) |
| $75,000 to $99,999 | 31 (4.4%) | 40 (4.4%) |
| $100,000 to $149,999 | 183 (25.9%) | 102 (11.3%) |
| $150,000 or more | 222 (31.4%) | 135 (14.9%) |
| Total | 707 (100.0%) | 906 (100.0%) |
Property Value to Household Income Ratio in Albertson
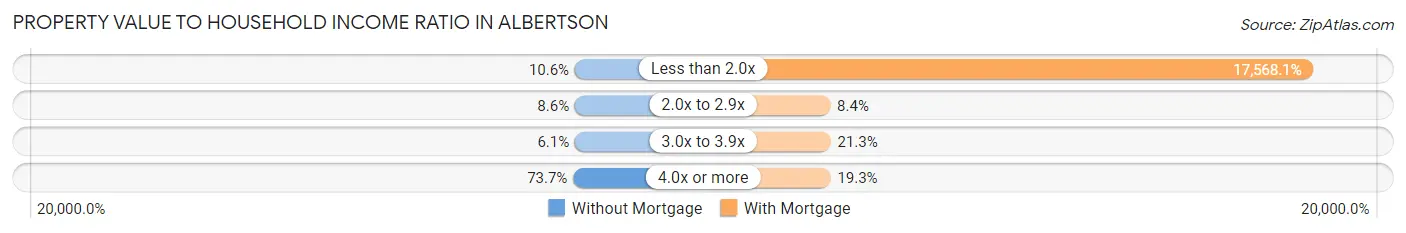
| Value-to-Income Ratio | Without Mortgage | With Mortgage |
| Less than 2.0x | 75 (10.6%) | 159,167 (17,568.1%) |
| 2.0x to 2.9x | 61 (8.6%) | 76 (8.4%) |
| 3.0x to 3.9x | 43 (6.1%) | 193 (21.3%) |
| 4.0x or more | 521 (73.7%) | 175 (19.3%) |
| Total | 707 (100.0%) | 906 (100.0%) |
Real Estate Taxes by Mortgage Status in Albertson
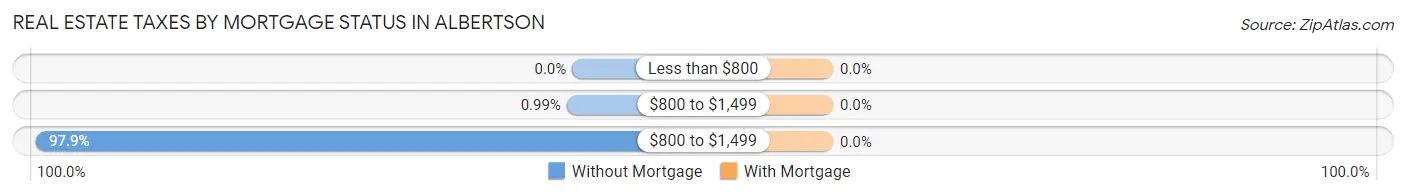
| Property Taxes | Without Mortgage | With Mortgage |
| Less than $800 | 0 (0.0%) | 0 (0.0%) |
| $800 to $1,499 | 7 (1.0%) | 0 (0.0%) |
| $800 to $1,499 | 692 (97.9%) | 0 (0.0%) |
| Total | 707 (100.0%) | 906 (100.0%) |
Health & Disability in Albertson
Health Insurance Coverage by Age in Albertson
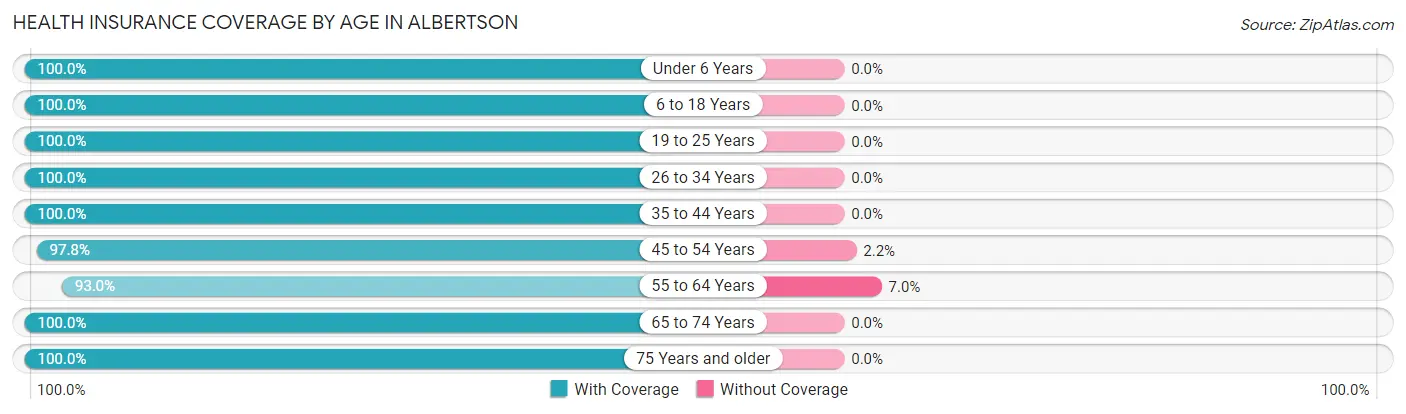
| Age Bracket | With Coverage | Without Coverage |
| Under 6 Years | 161 (100.0%) | 0 (0.0%) |
| 6 to 18 Years | 738 (100.0%) | 0 (0.0%) |
| 19 to 25 Years | 587 (100.0%) | 0 (0.0%) |
| 26 to 34 Years | 591 (100.0%) | 0 (0.0%) |
| 35 to 44 Years | 445 (100.0%) | 0 (0.0%) |
| 45 to 54 Years | 742 (97.8%) | 17 (2.2%) |
| 55 to 64 Years | 602 (93.0%) | 45 (7.0%) |
| 65 to 74 Years | 525 (100.0%) | 0 (0.0%) |
| 75 Years and older | 642 (100.0%) | 0 (0.0%) |
| Total | 5,033 (98.8%) | 62 (1.2%) |
Health Insurance Coverage by Citizenship Status in Albertson
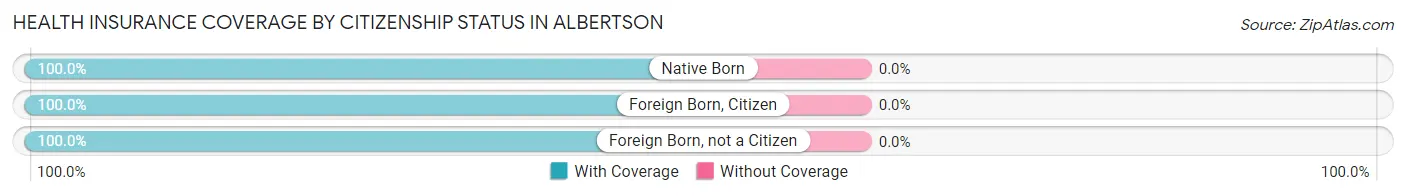
| Citizenship Status | With Coverage | Without Coverage |
| Native Born | 161 (100.0%) | 0 (0.0%) |
| Foreign Born, Citizen | 738 (100.0%) | 0 (0.0%) |
| Foreign Born, not a Citizen | 587 (100.0%) | 0 (0.0%) |
Health Insurance Coverage by Household Income in Albertson
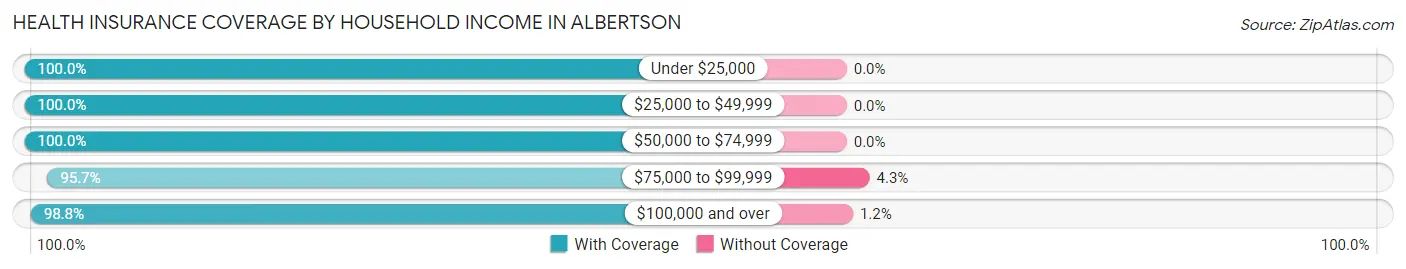
| Household Income | With Coverage | Without Coverage |
| Under $25,000 | 102 (100.0%) | 0 (0.0%) |
| $25,000 to $49,999 | 453 (100.0%) | 0 (0.0%) |
| $50,000 to $74,999 | 300 (100.0%) | 0 (0.0%) |
| $75,000 to $99,999 | 404 (95.7%) | 18 (4.3%) |
| $100,000 and over | 3,763 (98.8%) | 44 (1.2%) |
Public vs Private Health Insurance Coverage by Age in Albertson
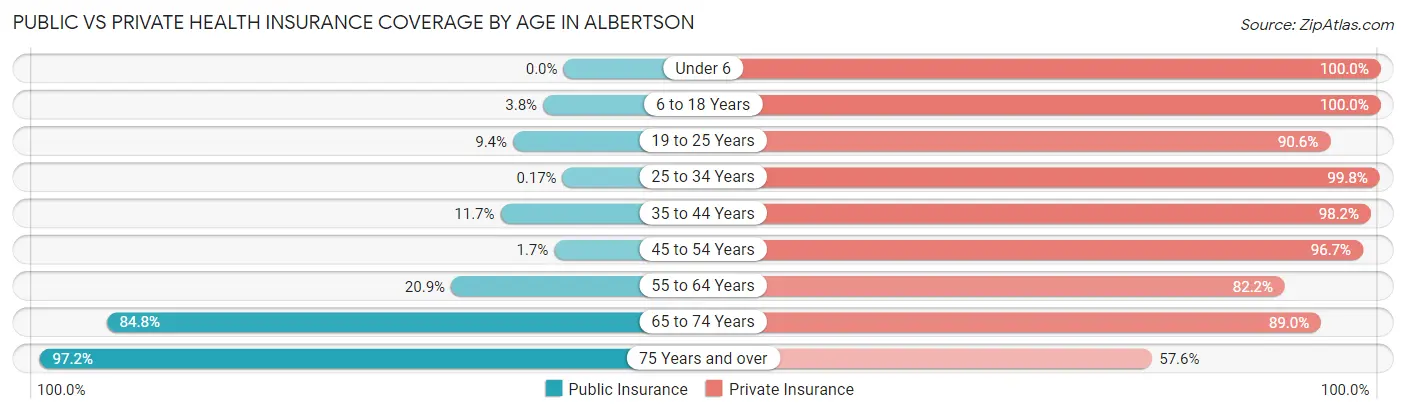
| Age Bracket | Public Insurance | Private Insurance |
| Under 6 | 0 (0.0%) | 161 (100.0%) |
| 6 to 18 Years | 28 (3.8%) | 738 (100.0%) |
| 19 to 25 Years | 55 (9.4%) | 532 (90.6%) |
| 25 to 34 Years | 1 (0.2%) | 590 (99.8%) |
| 35 to 44 Years | 52 (11.7%) | 437 (98.2%) |
| 45 to 54 Years | 13 (1.7%) | 734 (96.7%) |
| 55 to 64 Years | 135 (20.9%) | 532 (82.2%) |
| 65 to 74 Years | 445 (84.8%) | 467 (88.9%) |
| 75 Years and over | 624 (97.2%) | 370 (57.6%) |
| Total | 1,353 (26.6%) | 4,561 (89.5%) |
Disability Status by Sex by Age in Albertson
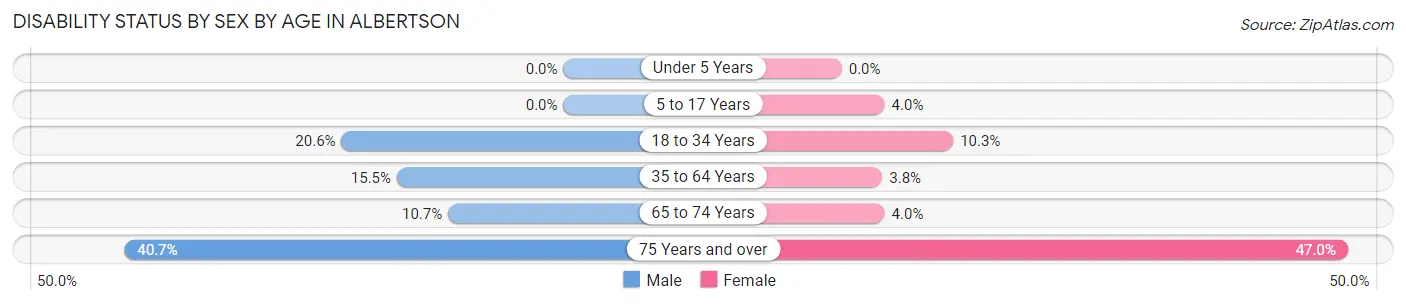
| Age Bracket | Male | Female |
| Under 5 Years | 0 (0.0%) | 0 (0.0%) |
| 5 to 17 Years | 0 (0.0%) | 10 (4.0%) |
| 18 to 34 Years | 116 (20.6%) | 67 (10.3%) |
| 35 to 64 Years | 138 (15.4%) | 36 (3.8%) |
| 65 to 74 Years | 32 (10.7%) | 9 (4.0%) |
| 75 Years and over | 88 (40.7%) | 200 (46.9%) |
Disability Class by Sex by Age in Albertson
Disability Class: Hearing Difficulty
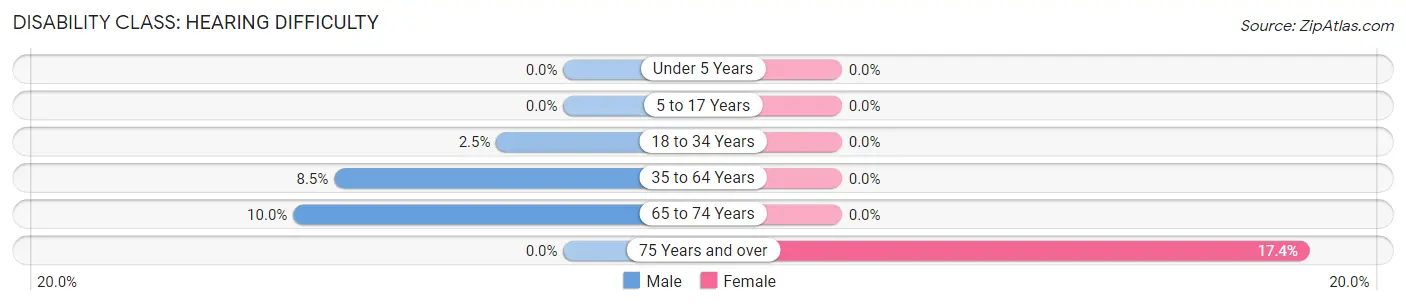
| Age Bracket | Male | Female |
| Under 5 Years | 0 (0.0%) | 0 (0.0%) |
| 5 to 17 Years | 0 (0.0%) | 0 (0.0%) |
| 18 to 34 Years | 14 (2.5%) | 0 (0.0%) |
| 35 to 64 Years | 76 (8.5%) | 0 (0.0%) |
| 65 to 74 Years | 30 (10.0%) | 0 (0.0%) |
| 75 Years and over | 0 (0.0%) | 74 (17.4%) |
Disability Class: Vision Difficulty
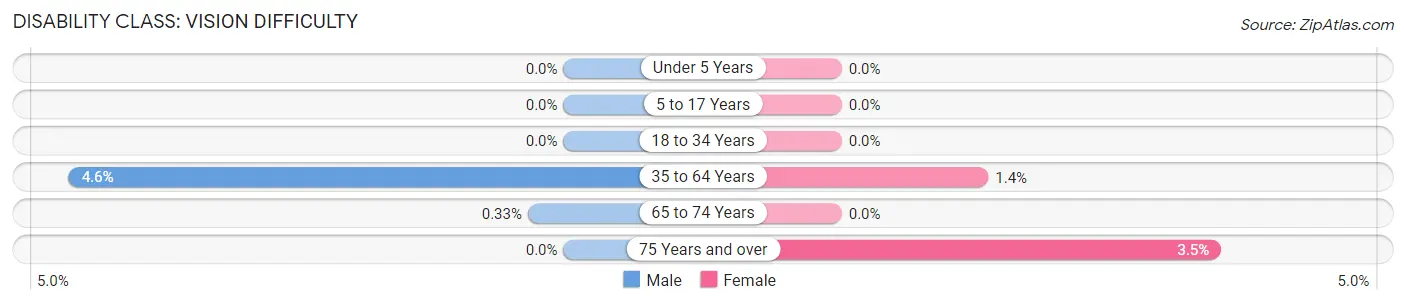
| Age Bracket | Male | Female |
| Under 5 Years | 0 (0.0%) | 0 (0.0%) |
| 5 to 17 Years | 0 (0.0%) | 0 (0.0%) |
| 18 to 34 Years | 0 (0.0%) | 0 (0.0%) |
| 35 to 64 Years | 41 (4.6%) | 13 (1.4%) |
| 65 to 74 Years | 1 (0.3%) | 0 (0.0%) |
| 75 Years and over | 0 (0.0%) | 15 (3.5%) |
Disability Class: Cognitive Difficulty
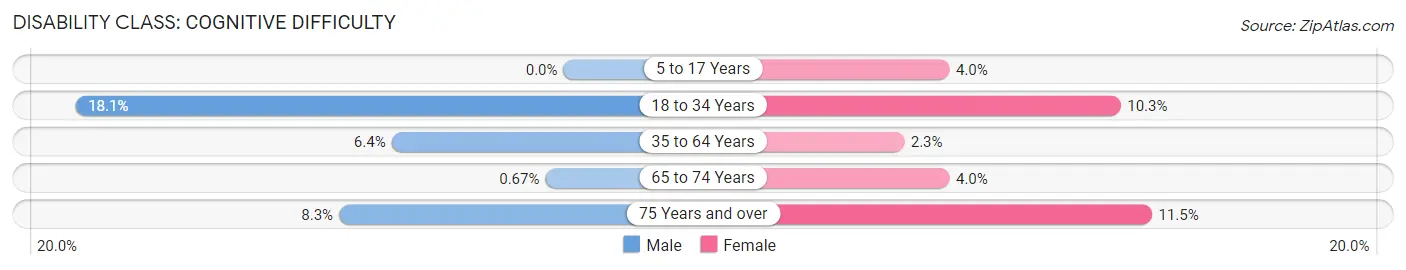
| Age Bracket | Male | Female |
| 5 to 17 Years | 0 (0.0%) | 10 (4.0%) |
| 18 to 34 Years | 102 (18.1%) | 67 (10.3%) |
| 35 to 64 Years | 57 (6.4%) | 22 (2.3%) |
| 65 to 74 Years | 2 (0.7%) | 9 (4.0%) |
| 75 Years and over | 18 (8.3%) | 49 (11.5%) |
Disability Class: Ambulatory Difficulty
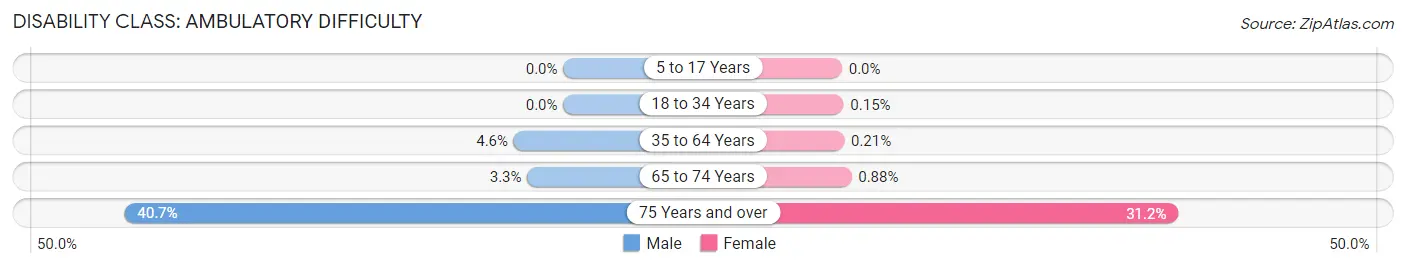
| Age Bracket | Male | Female |
| 5 to 17 Years | 0 (0.0%) | 0 (0.0%) |
| 18 to 34 Years | 0 (0.0%) | 1 (0.2%) |
| 35 to 64 Years | 41 (4.6%) | 2 (0.2%) |
| 65 to 74 Years | 10 (3.3%) | 2 (0.9%) |
| 75 Years and over | 88 (40.7%) | 133 (31.2%) |
Disability Class: Self-Care Difficulty
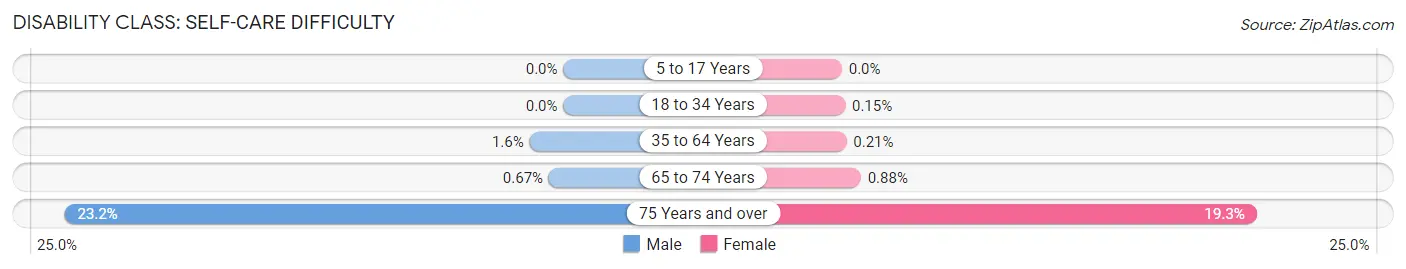
| Age Bracket | Male | Female |
| 5 to 17 Years | 0 (0.0%) | 0 (0.0%) |
| 18 to 34 Years | 0 (0.0%) | 1 (0.2%) |
| 35 to 64 Years | 14 (1.6%) | 2 (0.2%) |
| 65 to 74 Years | 2 (0.7%) | 2 (0.9%) |
| 75 Years and over | 50 (23.2%) | 82 (19.3%) |
Technology Access in Albertson
Computing Device Access in Albertson
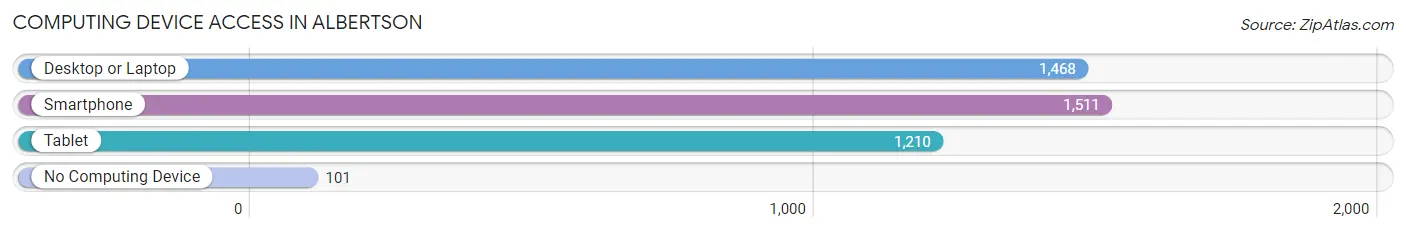
| Device Type | # Households | % Households |
| Desktop or Laptop | 1,468 | 85.0% |
| Smartphone | 1,511 | 87.5% |
| Tablet | 1,210 | 70.1% |
| No Computing Device | 101 | 5.9% |
| Total | 1,727 | 100.0% |
Internet Access in Albertson
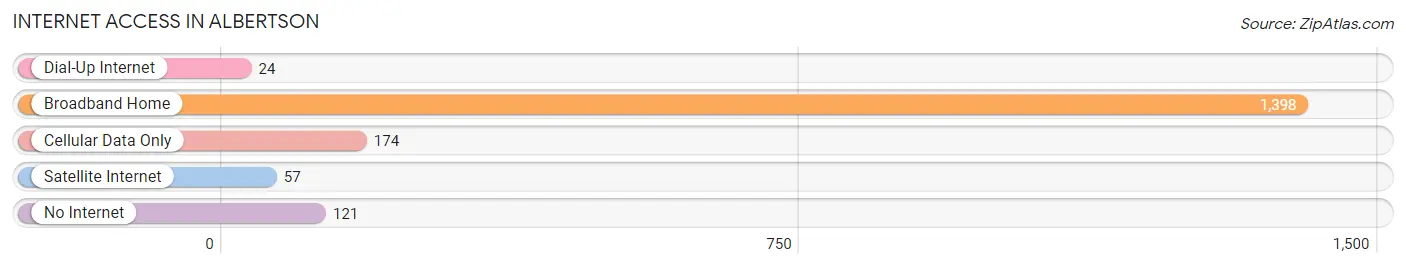
| Internet Type | # Households | % Households |
| Dial-Up Internet | 24 | 1.4% |
| Broadband Home | 1,398 | 80.9% |
| Cellular Data Only | 174 | 10.1% |
| Satellite Internet | 57 | 3.3% |
| No Internet | 121 | 7.0% |
| Total | 1,727 | 100.0% |
Albertson Summary
Albertson is a hamlet located in the Town of North Hempstead in Nassau County, New York. It is situated on the north shore of Long Island, approximately 20 miles east of Manhattan. The hamlet is bordered by Roslyn to the east, Williston Park to the south, and East Williston to the west. Albertson is a small, residential community with a population of approximately 4,000 people.
History
Albertson was originally part of the Town of Hempstead, which was established in 1644. The area was first settled by the Dutch in the mid-17th century and was known as “Old Hempstead”. In 1784, the Town of North Hempstead was created from the northern part of Hempstead. Albertson was established in 1845 when the area was divided into two parts: North Hempstead and South Hempstead. The hamlet was named after the Albertson family, who were among the first settlers in the area.
Geography
Albertson is located on the north shore of Long Island, approximately 20 miles east of Manhattan. The hamlet is bordered by Roslyn to the east, Williston Park to the south, and East Williston to the west. Albertson is a small, residential community with a population of approximately 4,000 people. The hamlet is situated on a plateau, with an elevation of approximately 100 feet above sea level. The area is characterized by rolling hills and wooded areas.
Economy
Albertson is a primarily residential community, with no major industries or businesses. The hamlet is home to several small businesses, including restaurants, retail stores, and professional services. The local economy is largely driven by the surrounding communities, as many residents commute to nearby towns and cities for work.
Demographics
As of the 2010 census, Albertson had a population of 4,000 people. The racial makeup of the hamlet was 87.3% White, 5.2% African American, 0.7% Asian, 0.3% Native American, and 6.5% from other races. The median household income was $90,000, and the median age was 43. The majority of residents (90%) were homeowners.
Albertson is a small, residential community with a diverse population. The hamlet is home to a variety of cultures and backgrounds, and is a popular destination for families and young professionals. Albertson is a safe and welcoming community, with a strong sense of community and pride.
Common Questions
What is Per Capita Income in Albertson?
Per Capita income in Albertson is $62,078.
What is the Median Family Income in Albertson?
Median Family Income in Albertson is $147,045.
What is the Median Household income in Albertson?
Median Household Income in Albertson is $129,563.
What is Income or Wage Gap in Albertson?
Income or Wage Gap in Albertson is 18.3%.
Women in Albertson earn 81.7 cents for every dollar earned by a man.
What is Inequality or Gini Index in Albertson?
Inequality or Gini Index in Albertson is 0.43.
What is the Total Population of Albertson?
Total Population of Albertson is 5,095.
What is the Total Male Population of Albertson?
Total Male Population of Albertson is 2,553.
What is the Total Female Population of Albertson?
Total Female Population of Albertson is 2,542.
What is the Ratio of Males per 100 Females in Albertson?
There are 100.43 Males per 100 Females in Albertson.
What is the Ratio of Females per 100 Males in Albertson?
There are 99.57 Females per 100 Males in Albertson.
What is the Median Population Age in Albertson?
Median Population Age in Albertson is 46.9 Years.
What is the Average Family Size in Albertson
Average Family Size in Albertson is 3.5 People.
What is the Average Household Size in Albertson
Average Household Size in Albertson is 2.9 People.
How Large is the Labor Force in Albertson?
There are 2,815 People in the Labor Forcein in Albertson.
What is the Percentage of People in the Labor Force in Albertson?
64.6% of People are in the Labor Force in Albertson.
What is the Unemployment Rate in Albertson?
Unemployment Rate in Albertson is 3.0%.