Town Line, NY Map & Demographics
Town Line Map
Town Line Overview
$41,012
PER CAPITA INCOME
$97,188
AVG FAMILY INCOME
$95,089
AVG HOUSEHOLD INCOME
23.3%
WAGE / INCOME GAP [ % ]
76.7¢/ $1
WAGE / INCOME GAP [ $ ]
0.30
INEQUALITY / GINI INDEX
1,951
TOTAL POPULATION
916
MALE POPULATION
1,035
FEMALE POPULATION
88.50
MALES / 100 FEMALES
112.99
FEMALES / 100 MALES
48.3
MEDIAN AGE
2.7
AVG FAMILY SIZE
2.4
AVG HOUSEHOLD SIZE
947
LABOR FORCE [ PEOPLE ]
55.9%
PERCENT IN LABOR FORCE
1.7%
UNEMPLOYMENT RATE
Income in Town Line
Income Overview in Town Line
Per Capita Income in Town Line is $41,012, while median incomes of families and households are $97,188 and $95,089 respectively.
| Characteristic | Number | Measure |
| Per Capita Income | 1,951 | $41,012 |
| Median Family Income | 603 | $97,188 |
| Mean Family Income | 603 | $108,721 |
| Median Household Income | 810 | $95,089 |
| Mean Household Income | 810 | $98,130 |
| Income Deficit | 603 | $0 |
| Wage / Income Gap (%) | 1,951 | 23.27% |
| Wage / Income Gap ($) | 1,951 | 76.73¢ per $1 |
| Gini / Inequality Index | 1,951 | 0.30 |
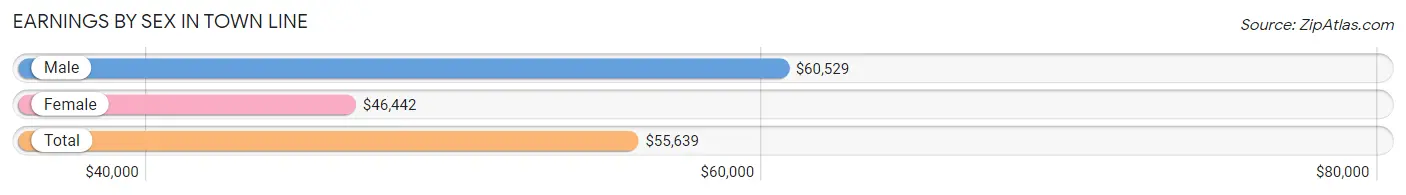
Earnings by Sex in Town Line
Average Earnings in Town Line are $55,639, $60,529 for men and $46,442 for women, a difference of 23.3%.
| Sex | Number | Average Earnings |
| Male | 530 (54.8%) | $60,529 |
| Female | 437 (45.2%) | $46,442 |
| Total | 967 (100.0%) | $55,639 |
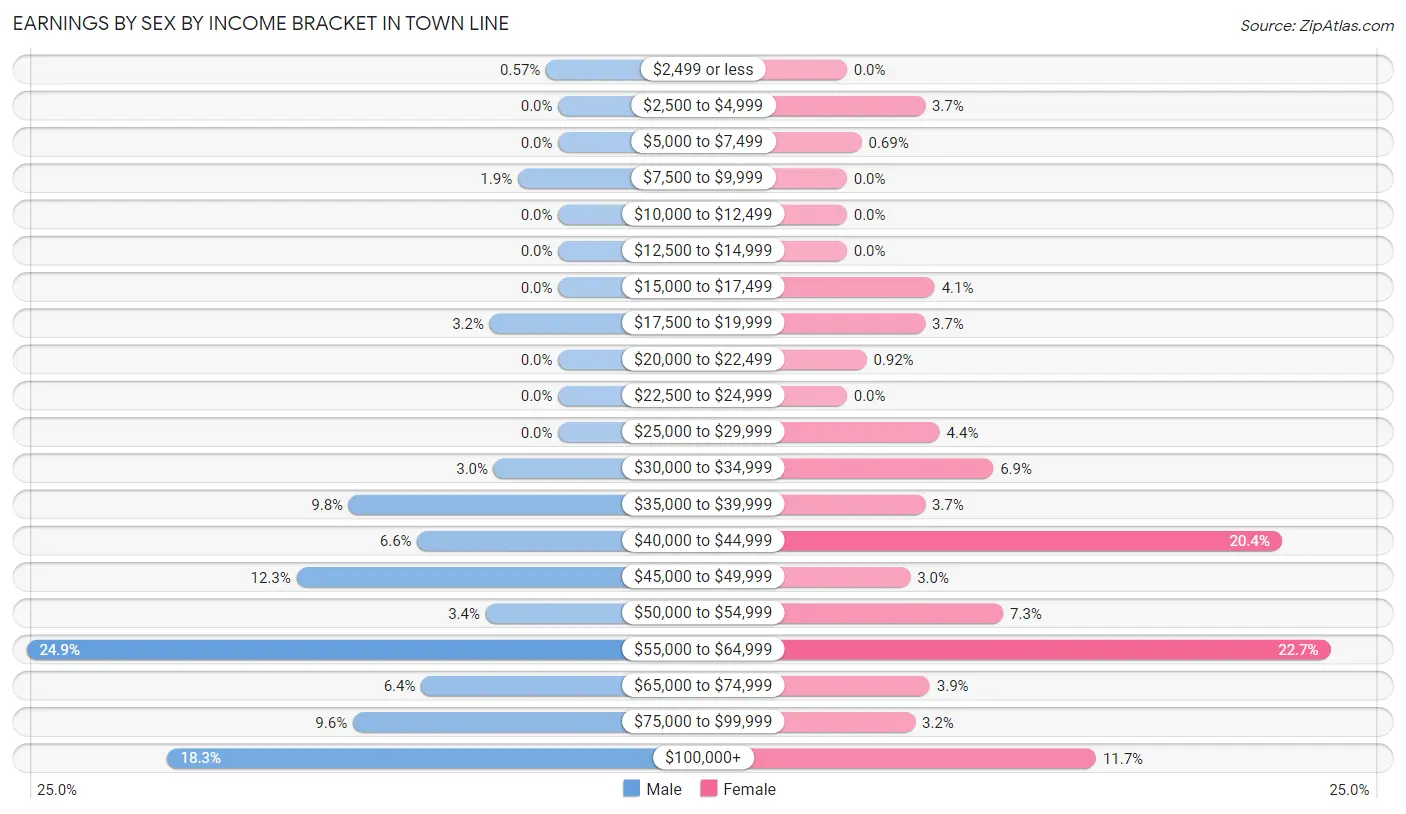
Earnings by Sex by Income Bracket in Town Line
The most common earnings brackets in Town Line are $55,000 to $64,999 for men (132 | 24.9%) and $55,000 to $64,999 for women (99 | 22.7%).
| Income | Male | Female |
| $2,499 or less | 3 (0.6%) | 0 (0.0%) |
| $2,500 to $4,999 | 0 (0.0%) | 16 (3.7%) |
| $5,000 to $7,499 | 0 (0.0%) | 3 (0.7%) |
| $7,500 to $9,999 | 10 (1.9%) | 0 (0.0%) |
| $10,000 to $12,499 | 0 (0.0%) | 0 (0.0%) |
| $12,500 to $14,999 | 0 (0.0%) | 0 (0.0%) |
| $15,000 to $17,499 | 0 (0.0%) | 18 (4.1%) |
| $17,500 to $19,999 | 17 (3.2%) | 16 (3.7%) |
| $20,000 to $22,499 | 0 (0.0%) | 4 (0.9%) |
| $22,500 to $24,999 | 0 (0.0%) | 0 (0.0%) |
| $25,000 to $29,999 | 0 (0.0%) | 19 (4.3%) |
| $30,000 to $34,999 | 16 (3.0%) | 30 (6.9%) |
| $35,000 to $39,999 | 52 (9.8%) | 16 (3.7%) |
| $40,000 to $44,999 | 35 (6.6%) | 89 (20.4%) |
| $45,000 to $49,999 | 65 (12.3%) | 13 (3.0%) |
| $50,000 to $54,999 | 18 (3.4%) | 32 (7.3%) |
| $55,000 to $64,999 | 132 (24.9%) | 99 (22.7%) |
| $65,000 to $74,999 | 34 (6.4%) | 17 (3.9%) |
| $75,000 to $99,999 | 51 (9.6%) | 14 (3.2%) |
| $100,000+ | 97 (18.3%) | 51 (11.7%) |
| Total | 530 (100.0%) | 437 (100.0%) |
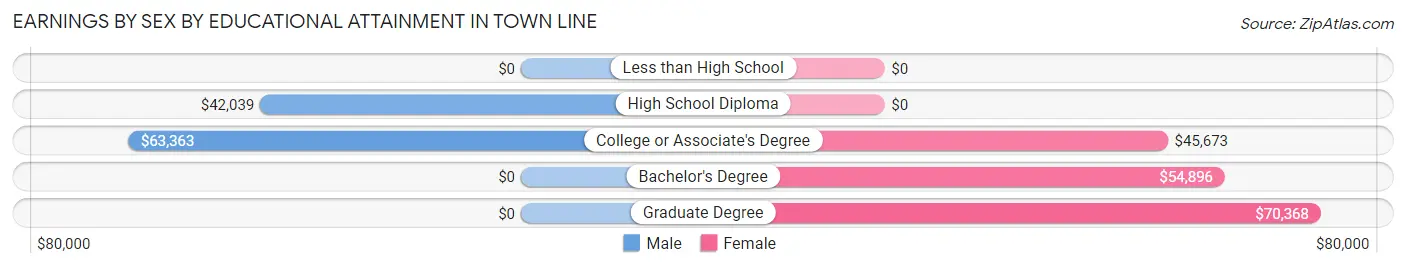
Earnings by Sex by Educational Attainment in Town Line
Average earnings in Town Line are $61,707 for men and $52,500 for women, a difference of 14.9%. Men with an educational attainment of college or associate's degree enjoy the highest average annual earnings of $63,363, while those with high school diploma education earn the least with $42,039. Women with an educational attainment of graduate degree earn the most with the average annual earnings of $70,368, while those with college or associate's degree education have the smallest earnings of $45,673.
| Educational Attainment | Male Income | Female Income |
| Less than High School | - | - |
| High School Diploma | $42,039 | $0 |
| College or Associate's Degree | $63,363 | $45,673 |
| Bachelor's Degree | - | - |
| Graduate Degree | - | - |
| Total | $61,707 | $52,500 |
Family Income in Town Line
Family Income Brackets in Town Line
According to the Town Line family income data, there are 232 families falling into the $50,000 to $74,999 income range, which is the most common income bracket and makes up 38.5% of all families.
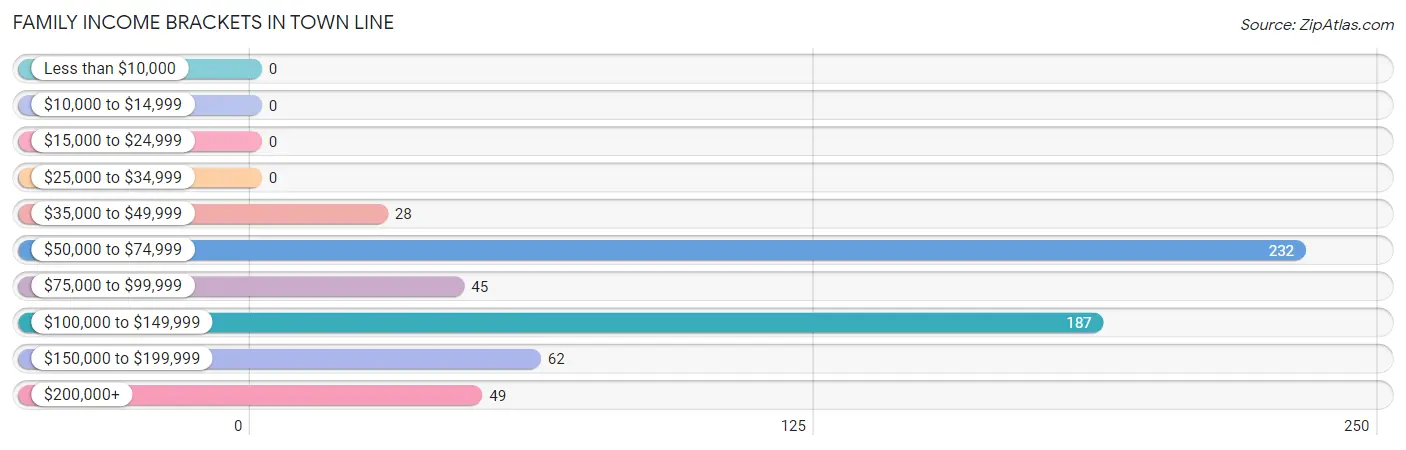
| Income Bracket | # Families | % Families |
| Less than $10,000 | 0 | 0.0% |
| $10,000 to $14,999 | 0 | 0.0% |
| $15,000 to $24,999 | 0 | 0.0% |
| $25,000 to $34,999 | 0 | 0.0% |
| $35,000 to $49,999 | 28 | 4.6% |
| $50,000 to $74,999 | 232 | 38.5% |
| $75,000 to $99,999 | 45 | 7.5% |
| $100,000 to $149,999 | 187 | 31.0% |
| $150,000 to $199,999 | 62 | 10.3% |
| $200,000+ | 49 | 8.1% |
Family Income by Famaliy Size in Town Line
3-person families (75 | 12.4%) account for the highest median family income in Town Line with $171,838 per family, while 3-person families (75 | 12.4%) have the highest median income of $57,279 per family member.
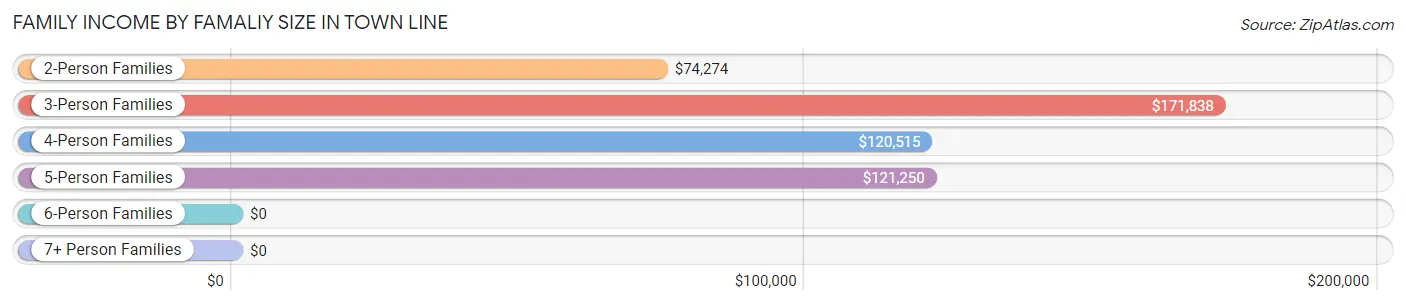
| Income Bracket | # Families | Median Income |
| 2-Person Families | 390 (64.7%) | $74,274 |
| 3-Person Families | 75 (12.4%) | $171,838 |
| 4-Person Families | 83 (13.8%) | $120,515 |
| 5-Person Families | 55 (9.1%) | $121,250 |
| 6-Person Families | 0 (0.0%) | $0 |
| 7+ Person Families | 0 (0.0%) | $0 |
| Total | 603 (100.0%) | $97,188 |
Family Income by Number of Earners in Town Line
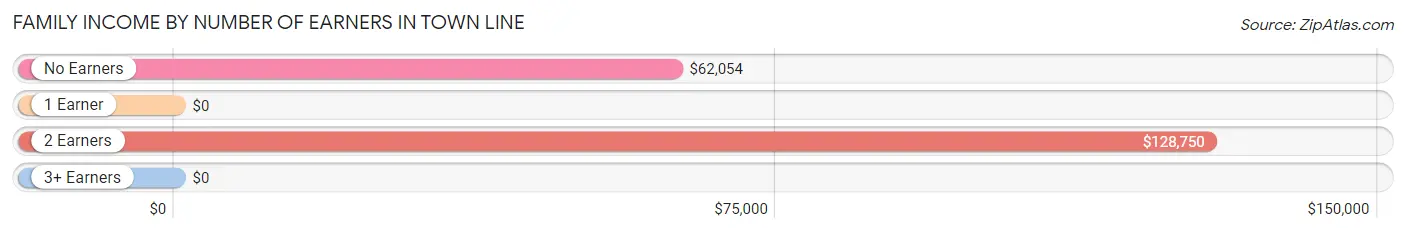
| Number of Earners | # Families | Median Income |
| No Earners | 143 (23.7%) | $62,054 |
| 1 Earner | 218 (36.1%) | $0 |
| 2 Earners | 210 (34.8%) | $128,750 |
| 3+ Earners | 32 (5.3%) | $0 |
| Total | 603 (100.0%) | $97,188 |
Household Income in Town Line
Household Income Brackets in Town Line
With 271 households falling in the category, the $50,000 to $74,999 income range is the most frequent in Town Line, accounting for 33.5% of all households.
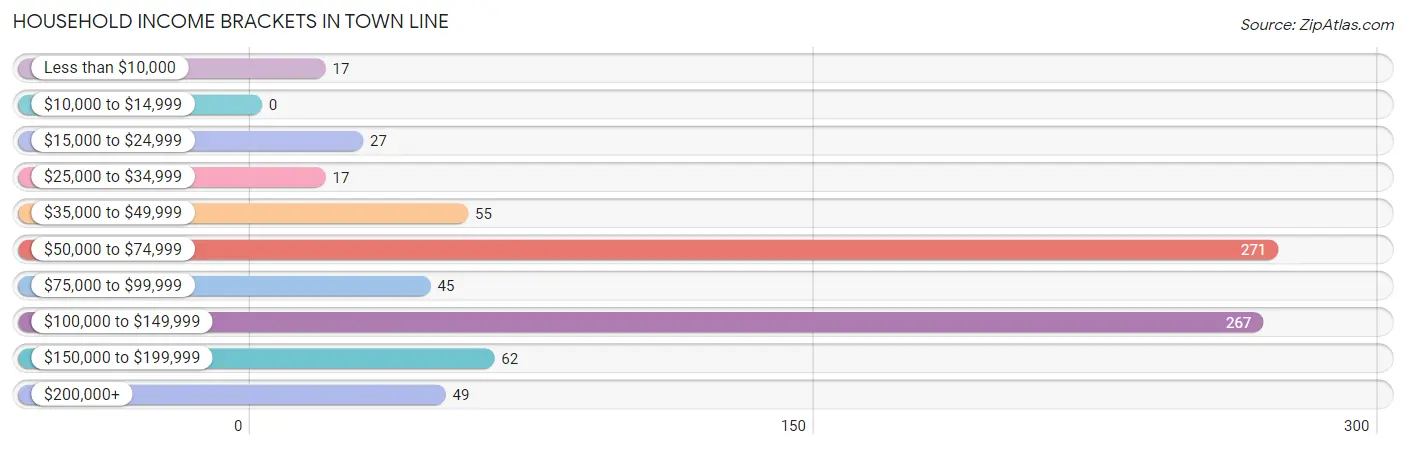
| Income Bracket | # Households | % Households |
| Less than $10,000 | 17 | 2.1% |
| $10,000 to $14,999 | 0 | 0.0% |
| $15,000 to $24,999 | 27 | 3.3% |
| $25,000 to $34,999 | 17 | 2.1% |
| $35,000 to $49,999 | 55 | 6.8% |
| $50,000 to $74,999 | 271 | 33.5% |
| $75,000 to $99,999 | 45 | 5.6% |
| $100,000 to $149,999 | 267 | 33.0% |
| $150,000 to $199,999 | 62 | 7.7% |
| $200,000+ | 49 | 6.0% |
Household Income by Householder Age in Town Line
The median household income in Town Line is $95,089, with the highest median household income of $112,941 found in the 45 to 64 years age bracket for the primary householder. A total of 258 households (31.9%) fall into this category.
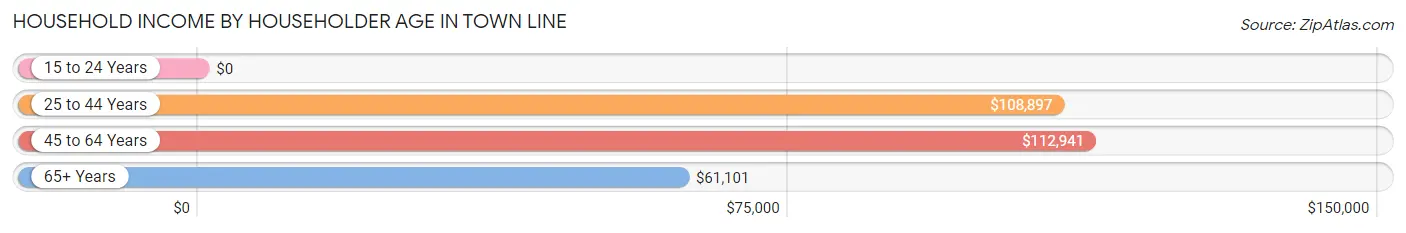
| Income Bracket | # Households | Median Income |
| 15 to 24 Years | 0 (0.0%) | $0 |
| 25 to 44 Years | 237 (29.3%) | $108,897 |
| 45 to 64 Years | 258 (31.9%) | $112,941 |
| 65+ Years | 315 (38.9%) | $61,101 |
| Total | 810 (100.0%) | $95,089 |
Poverty in Town Line
Income Below Poverty by Sex and Age in Town Line
With 0.4% poverty level for males and 2.3% for females among the residents of Town Line, 18 to 24 year old males and 75 year old and over females are the most vulnerable to poverty, with 4 males (7.5%) and 17 females (8.0%) in their respective age groups living below the poverty level.
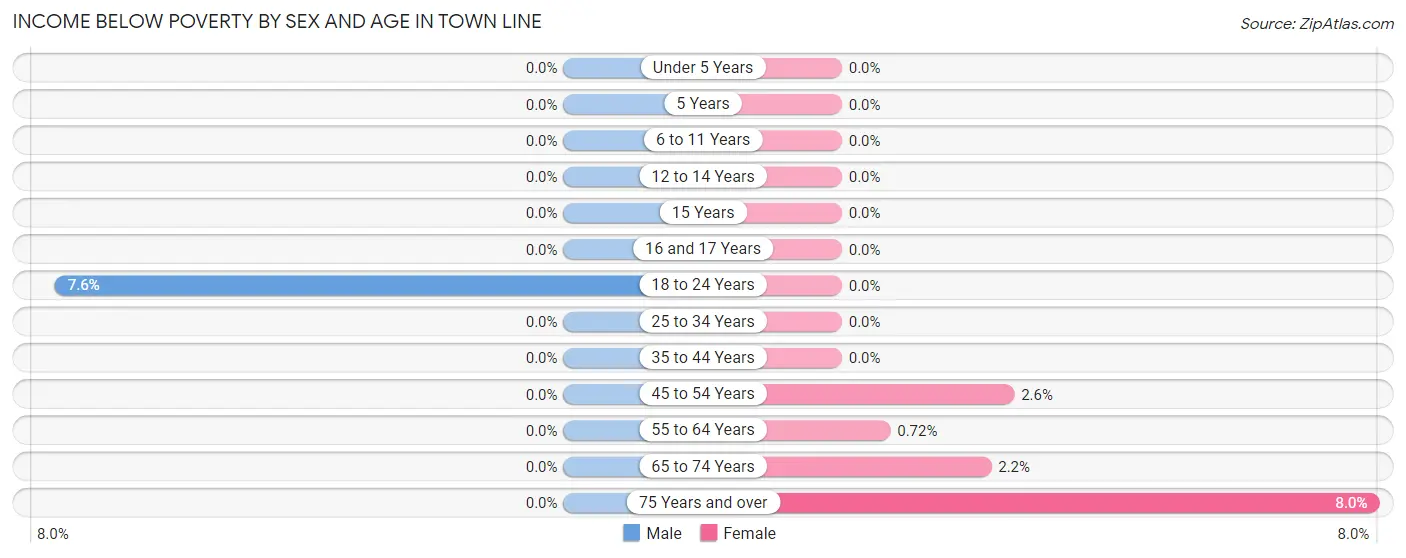
| Age Bracket | Male | Female |
| Under 5 Years | 0 (0.0%) | 0 (0.0%) |
| 5 Years | 0 (0.0%) | 0 (0.0%) |
| 6 to 11 Years | 0 (0.0%) | 0 (0.0%) |
| 12 to 14 Years | 0 (0.0%) | 0 (0.0%) |
| 15 Years | 0 (0.0%) | 0 (0.0%) |
| 16 and 17 Years | 0 (0.0%) | 0 (0.0%) |
| 18 to 24 Years | 4 (7.5%) | 0 (0.0%) |
| 25 to 34 Years | 0 (0.0%) | 0 (0.0%) |
| 35 to 44 Years | 0 (0.0%) | 0 (0.0%) |
| 45 to 54 Years | 0 (0.0%) | 3 (2.6%) |
| 55 to 64 Years | 0 (0.0%) | 1 (0.7%) |
| 65 to 74 Years | 0 (0.0%) | 2 (2.2%) |
| 75 Years and over | 0 (0.0%) | 17 (8.0%) |
| Total | 4 (0.4%) | 23 (2.3%) |
Income Above Poverty by Sex and Age in Town Line
According to the poverty statistics in Town Line, males aged under 5 years and females aged under 5 years are the age groups that are most secure financially, with 100.0% of males and 100.0% of females in these age groups living above the poverty line.
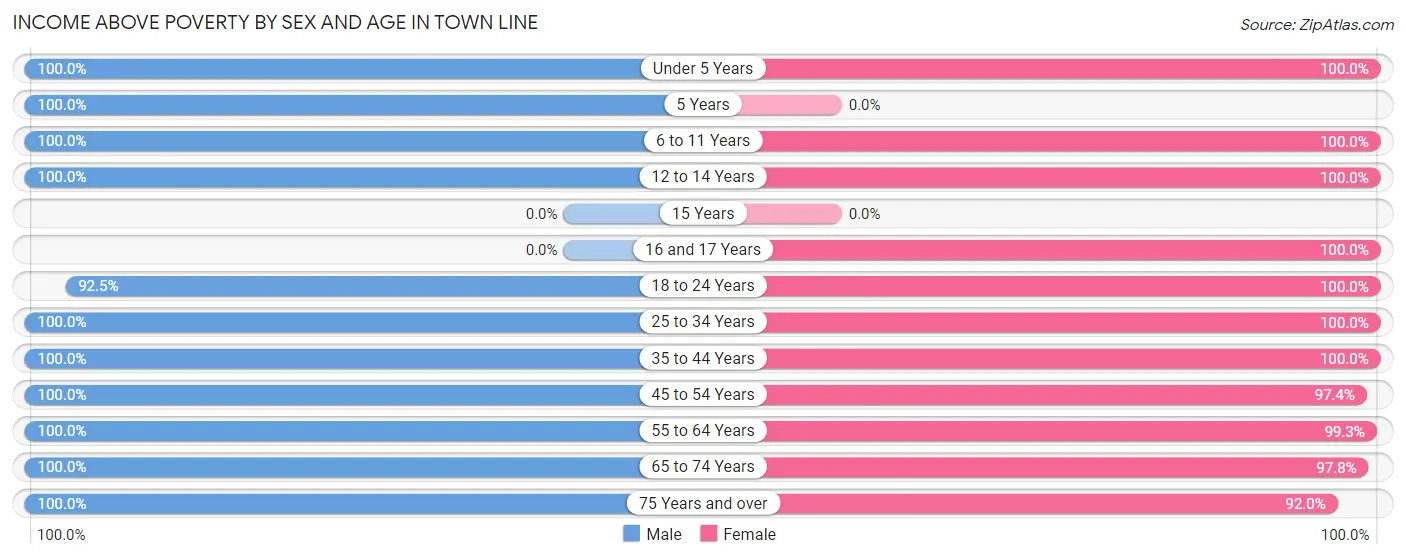
| Age Bracket | Male | Female |
| Under 5 Years | 65 (100.0%) | 37 (100.0%) |
| 5 Years | 16 (100.0%) | 0 (0.0%) |
| 6 to 11 Years | 36 (100.0%) | 34 (100.0%) |
| 12 to 14 Years | 17 (100.0%) | 18 (100.0%) |
| 15 Years | 0 (0.0%) | 0 (0.0%) |
| 16 and 17 Years | 0 (0.0%) | 56 (100.0%) |
| 18 to 24 Years | 49 (92.4%) | 69 (100.0%) |
| 25 to 34 Years | 82 (100.0%) | 143 (100.0%) |
| 35 to 44 Years | 172 (100.0%) | 86 (100.0%) |
| 45 to 54 Years | 98 (100.0%) | 114 (97.4%) |
| 55 to 64 Years | 129 (100.0%) | 137 (99.3%) |
| 65 to 74 Years | 105 (100.0%) | 88 (97.8%) |
| 75 Years and over | 143 (100.0%) | 196 (92.0%) |
| Total | 912 (99.6%) | 978 (97.7%) |
Income Below Poverty Among Married-Couple Families in Town Line
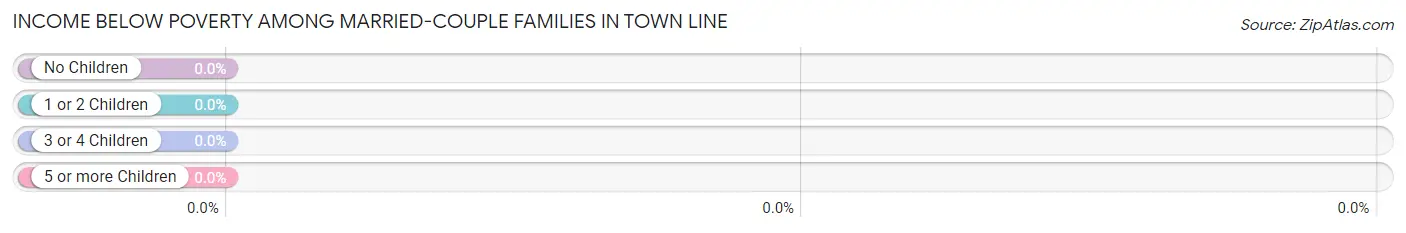
| Children | Above Poverty | Below Poverty |
| No Children | 367 (100.0%) | 0 (0.0%) |
| 1 or 2 Children | 129 (100.0%) | 0 (0.0%) |
| 3 or 4 Children | 37 (100.0%) | 0 (0.0%) |
| 5 or more Children | 0 (0.0%) | 0 (0.0%) |
| Total | 533 (100.0%) | 0 (0.0%) |
Income Below Poverty Among Single-Parent Households in Town Line
| Children | Single Father | Single Mother |
| No Children | 0 (0.0%) | 0 (0.0%) |
| 1 or 2 Children | 0 (0.0%) | 0 (0.0%) |
| 3 or 4 Children | 0 (0.0%) | 0 (0.0%) |
| 5 or more Children | 0 (0.0%) | 0 (0.0%) |
| Total | 0 (0.0%) | 0 (0.0%) |
Income Below Poverty Among Married-Couple vs Single-Parent Households in Town Line
| Children | Married-Couple Families | Single-Parent Households |
| No Children | 0 (0.0%) | 0 (0.0%) |
| 1 or 2 Children | 0 (0.0%) | 0 (0.0%) |
| 3 or 4 Children | 0 (0.0%) | 0 (0.0%) |
| 5 or more Children | 0 (0.0%) | 0 (0.0%) |
| Total | 0 (0.0%) | 0 (0.0%) |
Race in Town Line
The most populous races in Town Line are White / Caucasian (1,830 | 93.8%), Asian (72 | 3.7%), and Black / African American (29 | 1.5%).
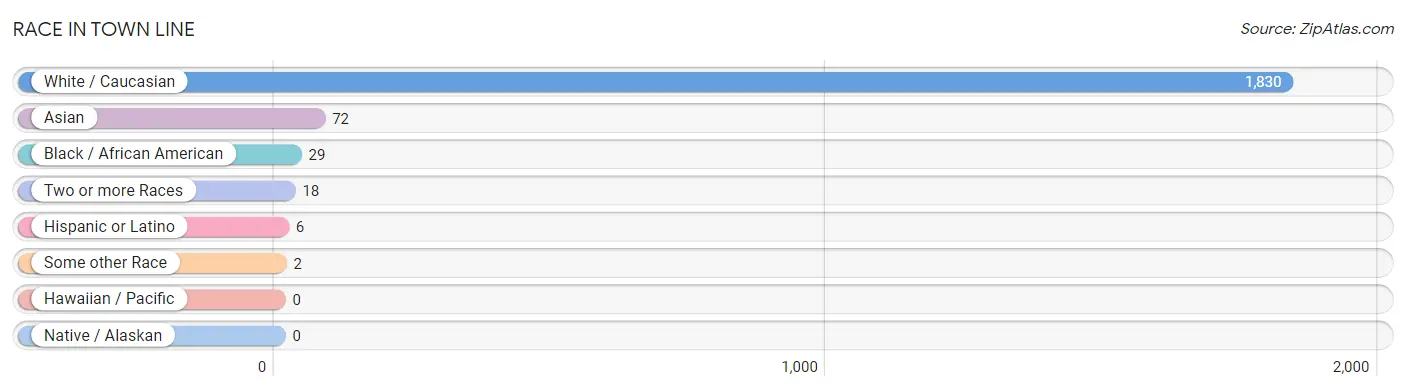
| Race | # Population | % Population |
| Asian | 72 | 3.7% |
| Black / African American | 29 | 1.5% |
| Hawaiian / Pacific | 0 | 0.0% |
| Hispanic or Latino | 6 | 0.3% |
| Native / Alaskan | 0 | 0.0% |
| White / Caucasian | 1,830 | 93.8% |
| Two or more Races | 18 | 0.9% |
| Some other Race | 2 | 0.1% |
| Total | 1,951 | 100.0% |
Ancestry in Town Line
The most populous ancestries reported in Town Line are Polish (605 | 31.0%), German (589 | 30.2%), Italian (361 | 18.5%), English (287 | 14.7%), and Guyanese (72 | 3.7%), together accounting for 98.1% of all Town Line residents.
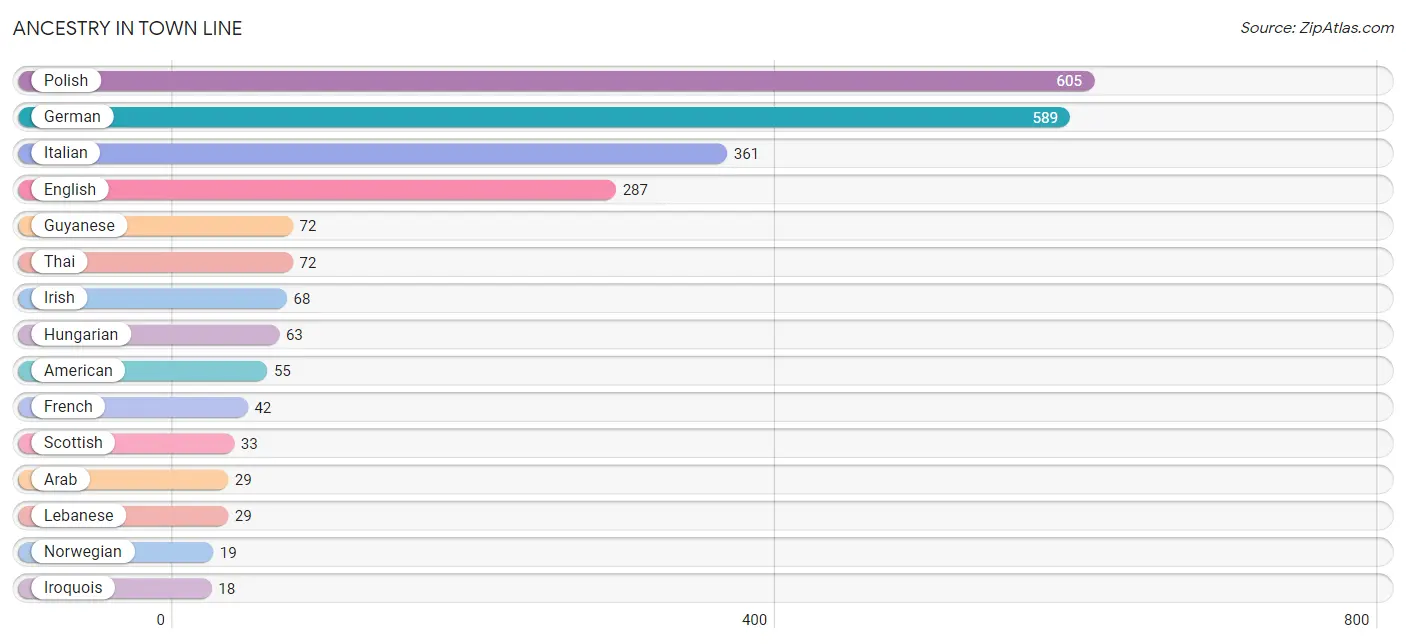
| Ancestry | # Population | % Population |
| American | 55 | 2.8% |
| Arab | 29 | 1.5% |
| Canadian | 17 | 0.9% |
| English | 287 | 14.7% |
| French | 42 | 2.1% |
| German | 589 | 30.2% |
| Guyanese | 72 | 3.7% |
| Hungarian | 63 | 3.2% |
| Irish | 68 | 3.5% |
| Iroquois | 18 | 0.9% |
| Italian | 361 | 18.5% |
| Lebanese | 29 | 1.5% |
| Norwegian | 19 | 1.0% |
| Polish | 605 | 31.0% |
| Puerto Rican | 4 | 0.2% |
| Russian | 17 | 0.9% |
| Scottish | 33 | 1.7% |
| Thai | 72 | 3.7% |
| Welsh | 18 | 0.9% | View All 19 Rows |
Immigrants in Town Line
The most numerous immigrant groups reported in Town Line came from Guyana (72 | 3.7%), Latin America (72 | 3.7%), and South America (72 | 3.7%), together accounting for 11.1% of all Town Line residents.
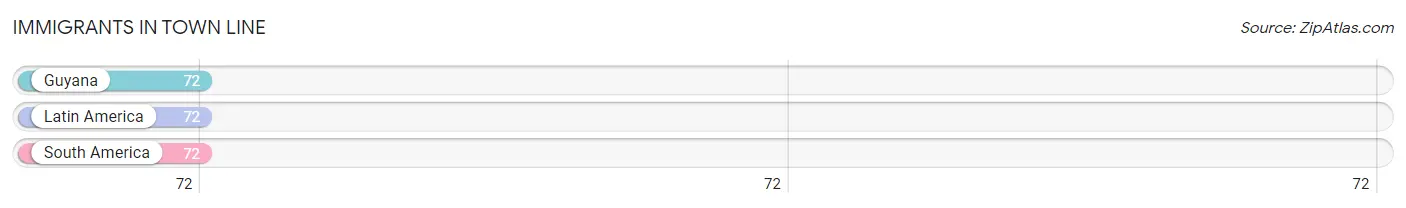
| Immigration Origin | # Population | % Population |
| Guyana | 72 | 3.7% |
| Latin America | 72 | 3.7% |
| South America | 72 | 3.7% | View All 3 Rows |
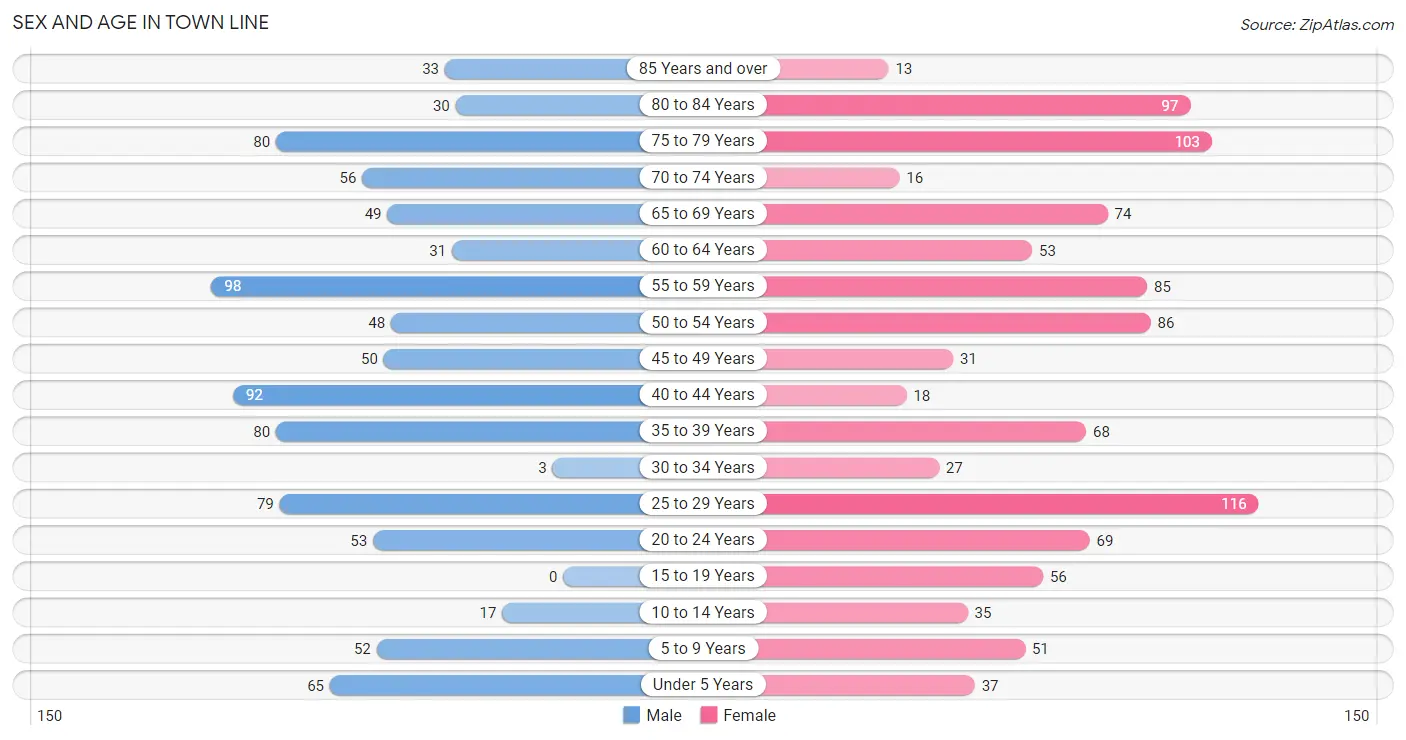
Sex and Age in Town Line
Sex and Age in Town Line
The most populous age groups in Town Line are 55 to 59 Years (98 | 10.7%) for men and 25 to 29 Years (116 | 11.2%) for women.
| Age Bracket | Male | Female |
| Under 5 Years | 65 (7.1%) | 37 (3.6%) |
| 5 to 9 Years | 52 (5.7%) | 51 (4.9%) |
| 10 to 14 Years | 17 (1.9%) | 35 (3.4%) |
| 15 to 19 Years | 0 (0.0%) | 56 (5.4%) |
| 20 to 24 Years | 53 (5.8%) | 69 (6.7%) |
| 25 to 29 Years | 79 (8.6%) | 116 (11.2%) |
| 30 to 34 Years | 3 (0.3%) | 27 (2.6%) |
| 35 to 39 Years | 80 (8.7%) | 68 (6.6%) |
| 40 to 44 Years | 92 (10.0%) | 18 (1.7%) |
| 45 to 49 Years | 50 (5.5%) | 31 (3.0%) |
| 50 to 54 Years | 48 (5.2%) | 86 (8.3%) |
| 55 to 59 Years | 98 (10.7%) | 85 (8.2%) |
| 60 to 64 Years | 31 (3.4%) | 53 (5.1%) |
| 65 to 69 Years | 49 (5.3%) | 74 (7.1%) |
| 70 to 74 Years | 56 (6.1%) | 16 (1.5%) |
| 75 to 79 Years | 80 (8.7%) | 103 (10.0%) |
| 80 to 84 Years | 30 (3.3%) | 97 (9.4%) |
| 85 Years and over | 33 (3.6%) | 13 (1.3%) |
| Total | 916 (100.0%) | 1,035 (100.0%) |
Families and Households in Town Line
Median Family Size in Town Line
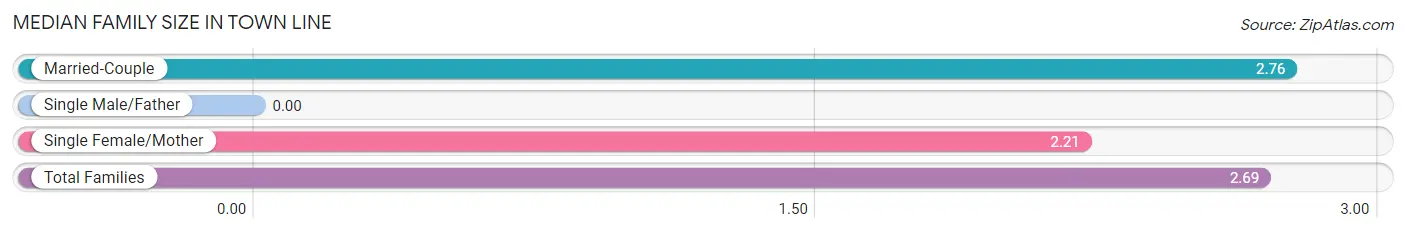
| Family Type | # Families | Family Size |
| Married-Couple | 533 (88.4%) | 2.76 |
| Single Male/Father | 0 (0.0%) | - |
| Single Female/Mother | 70 (11.6%) | 2.21 |
| Total Families | 603 (100.0%) | 2.69 |
Median Household Size in Town Line
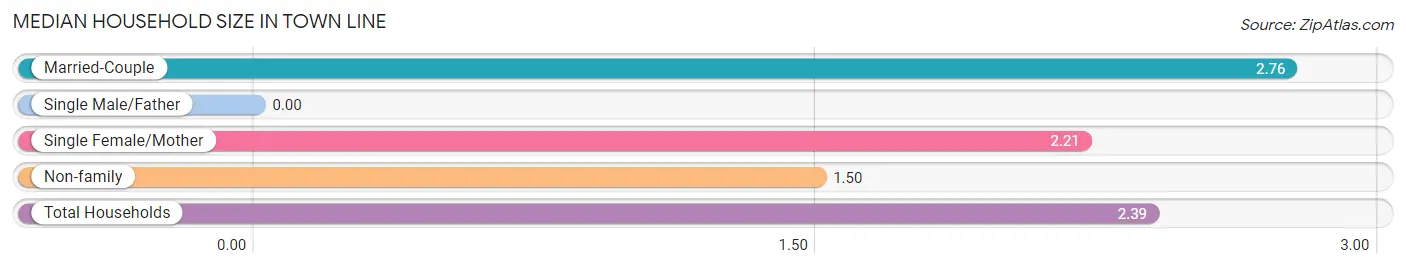
| Household Type | # Households | Household Size |
| Married-Couple | 533 (65.8%) | 2.76 |
| Single Male/Father | 0 (0.0%) | - |
| Single Female/Mother | 70 (8.6%) | 2.21 |
| Non-family | 207 (25.6%) | 1.50 |
| Total Households | 810 (100.0%) | 2.39 |
Household Size by Marriage Status in Town Line
Out of a total of 810 households in Town Line, 603 (74.4%) are family households, while 207 (25.6%) are nonfamily households. The most numerous type of family households are 2-person households, comprising 390, and the most common type of nonfamily households are 1-person households, comprising 127.
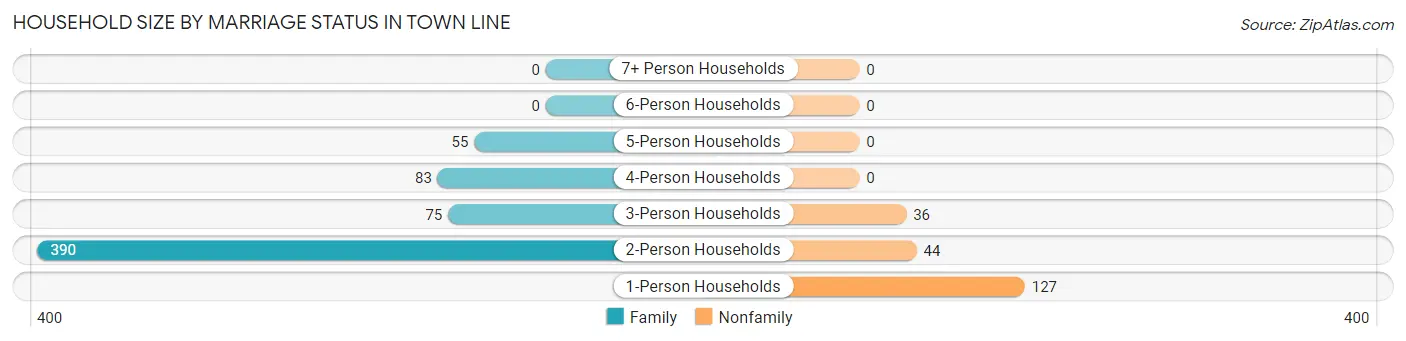
| Household Size | Family Households | Nonfamily Households |
| 1-Person Households | - | 127 (15.7%) |
| 2-Person Households | 390 (48.1%) | 44 (5.4%) |
| 3-Person Households | 75 (9.3%) | 36 (4.4%) |
| 4-Person Households | 83 (10.2%) | 0 (0.0%) |
| 5-Person Households | 55 (6.8%) | 0 (0.0%) |
| 6-Person Households | 0 (0.0%) | 0 (0.0%) |
| 7+ Person Households | 0 (0.0%) | 0 (0.0%) |
| Total | 603 (74.4%) | 207 (25.6%) |
Female Fertility in Town Line
Fertility by Age in Town Line
Average fertility rate in Town Line is 40.0 births per 1,000 women. Women in the age bracket of 35 to 50 years have the highest fertility rate with 90.0 births per 1,000 women. Women in the age bracket of 35 to 50 years acount for 75.0% of all women with births.
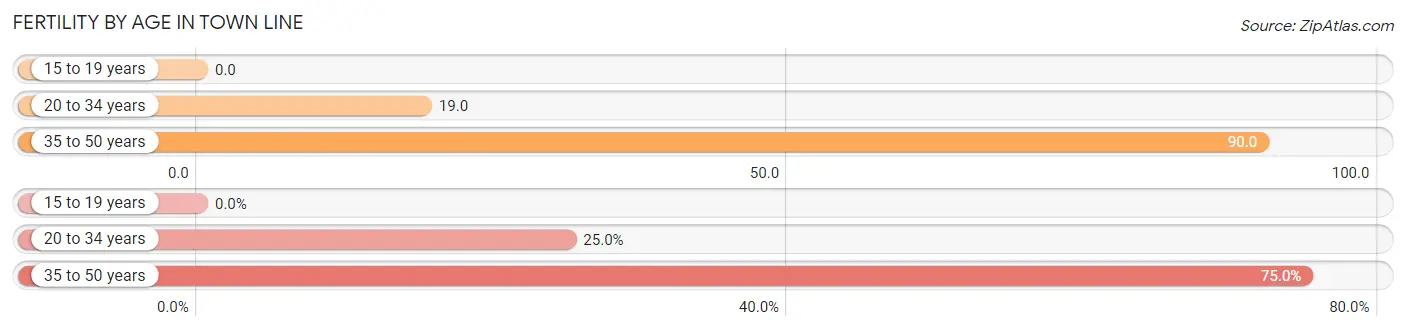
| Age Bracket | Women with Births | Births / 1,000 Women |
| 15 to 19 years | 0 (0.0%) | 0.0 |
| 20 to 34 years | 4 (25.0%) | 19.0 |
| 35 to 50 years | 12 (75.0%) | 90.0 |
| Total | 16 (100.0%) | 40.0 |
Fertility by Age by Marriage Status in Town Line
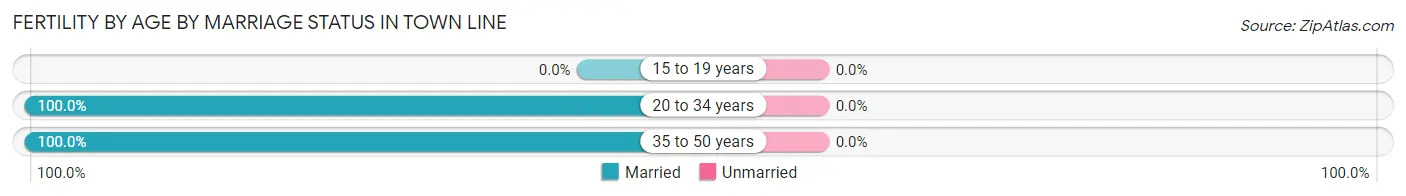
| Age Bracket | Married | Unmarried |
| 15 to 19 years | 0 (0.0%) | 0 (0.0%) |
| 20 to 34 years | 4 (100.0%) | 0 (0.0%) |
| 35 to 50 years | 12 (100.0%) | 0 (0.0%) |
| Total | 16 (100.0%) | 0 (0.0%) |
Fertility by Education in Town Line
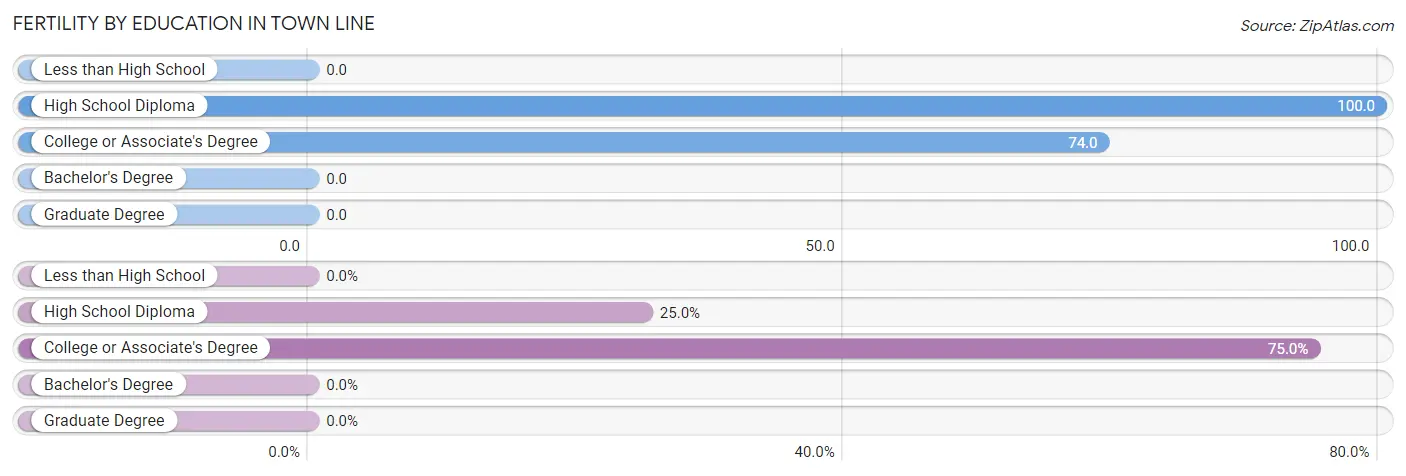
| Educational Attainment | Women with Births | Births / 1,000 Women |
| Less than High School | 0 (0.0%) | 0.0 |
| High School Diploma | 4 (25.0%) | 100.0 |
| College or Associate's Degree | 12 (75.0%) | 74.0 |
| Bachelor's Degree | 0 (0.0%) | 0.0 |
| Graduate Degree | 0 (0.0%) | 0.0 |
| Total | 16 (100.0%) | 40.0 |
Fertility by Education by Marriage Status in Town Line
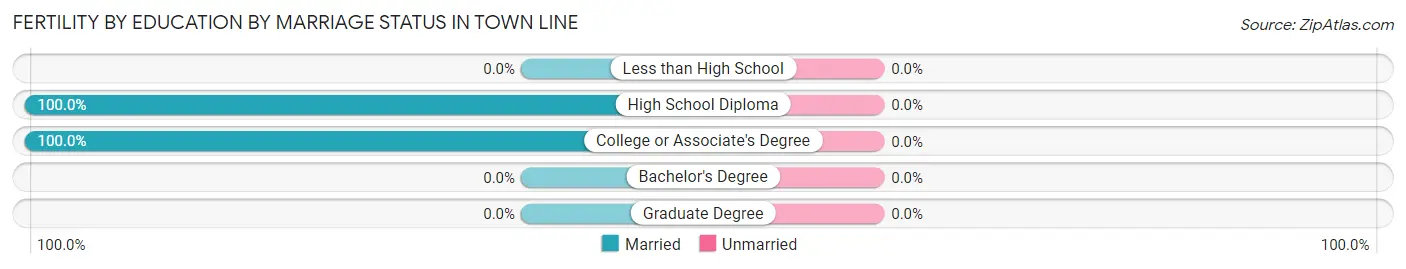
| Educational Attainment | Married | Unmarried |
| Less than High School | 0 (0.0%) | 0 (0.0%) |
| High School Diploma | 4 (100.0%) | 0 (0.0%) |
| College or Associate's Degree | 12 (100.0%) | 0 (0.0%) |
| Bachelor's Degree | 0 (0.0%) | 0 (0.0%) |
| Graduate Degree | 0 (0.0%) | 0 (0.0%) |
| Total | 16 (100.0%) | 0 (0.0%) |
Employment Characteristics in Town Line
Employment by Class of Employer in Town Line
Among the 898 employed individuals in Town Line, private company employees (667 | 74.3%), state government employees (65 | 7.2%), and local government employees (55 | 6.1%) make up the most common classes of employment.
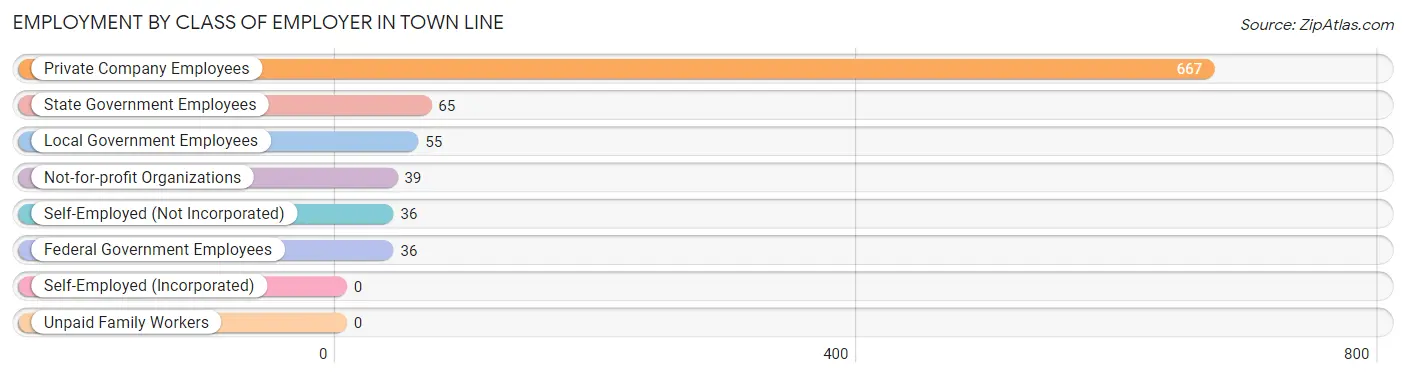
| Employer Class | # Employees | % Employees |
| Private Company Employees | 667 | 74.3% |
| Self-Employed (Incorporated) | 0 | 0.0% |
| Self-Employed (Not Incorporated) | 36 | 4.0% |
| Not-for-profit Organizations | 39 | 4.3% |
| Local Government Employees | 55 | 6.1% |
| State Government Employees | 65 | 7.2% |
| Federal Government Employees | 36 | 4.0% |
| Unpaid Family Workers | 0 | 0.0% |
| Total | 898 | 100.0% |
Employment Status by Age in Town Line
According to the labor force statistics for Town Line, out of the total population over 16 years of age (1,694), 55.9% or 947 individuals are in the labor force, with 1.7% or 16 of them unemployed. The age group with the highest labor force participation rate is 30 to 34 years, with 100.0% or 30 individuals in the labor force. Within the labor force, the 20 to 24 years age range has the highest percentage of unemployed individuals, with 16.0% or 16 of them being unemployed.
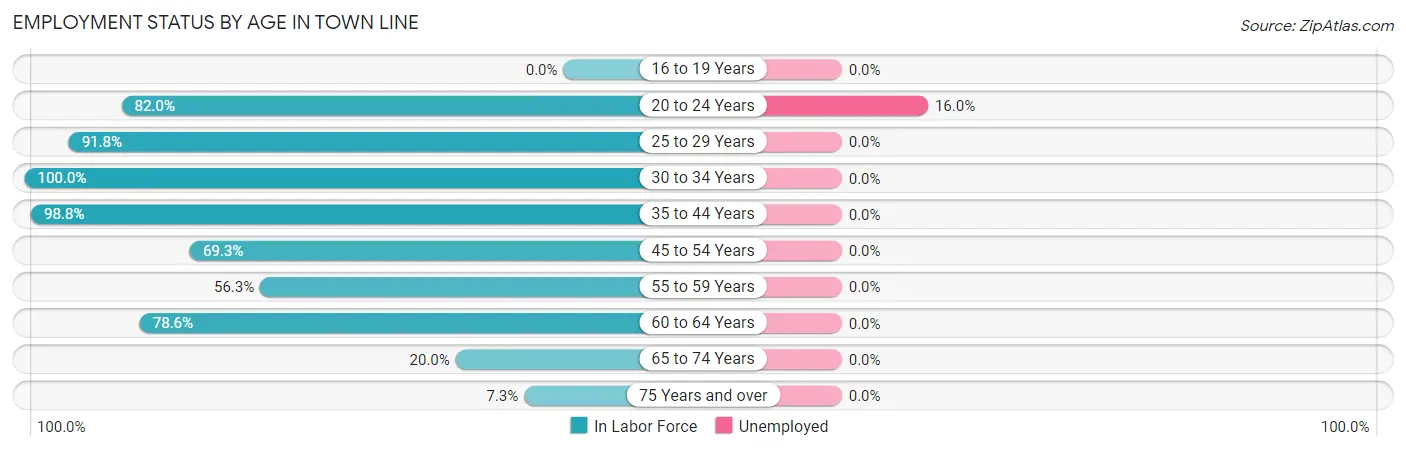
| Age Bracket | In Labor Force | Unemployed |
| 16 to 19 Years | 0 (0.0%) | 0 (0.0%) |
| 20 to 24 Years | 100 (82.0%) | 16 (16.0%) |
| 25 to 29 Years | 179 (91.8%) | 0 (0.0%) |
| 30 to 34 Years | 30 (100.0%) | 0 (0.0%) |
| 35 to 44 Years | 255 (98.8%) | 0 (0.0%) |
| 45 to 54 Years | 149 (69.3%) | 0 (0.0%) |
| 55 to 59 Years | 103 (56.3%) | 0 (0.0%) |
| 60 to 64 Years | 66 (78.6%) | 0 (0.0%) |
| 65 to 74 Years | 39 (20.0%) | 0 (0.0%) |
| 75 Years and over | 26 (7.3%) | 0 (0.0%) |
| Total | 947 (55.9%) | 16 (1.7%) |
Employment Status by Educational Attainment in Town Line
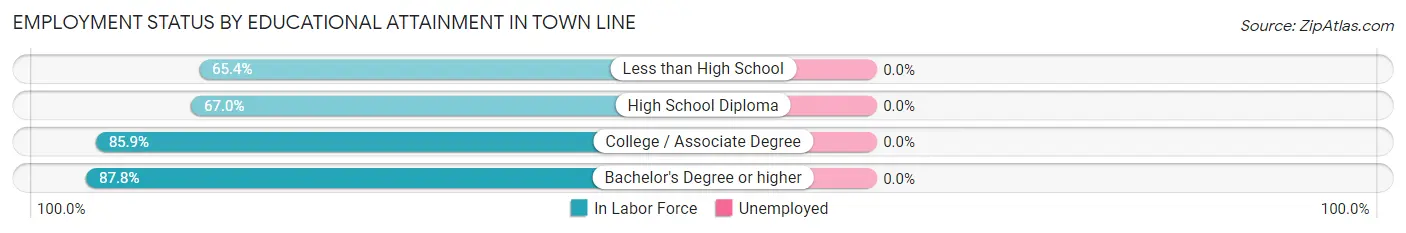
| Educational Attainment | In Labor Force | Unemployed |
| Less than High School | 34 (65.4%) | 0 (0.0%) |
| High School Diploma | 144 (67.0%) | 0 (0.0%) |
| College / Associate Degree | 389 (85.9%) | 0 (0.0%) |
| Bachelor's Degree or higher | 215 (87.8%) | 0 (0.0%) |
| Total | 782 (81.0%) | 0 (0.0%) |
Employment Occupations by Sex in Town Line
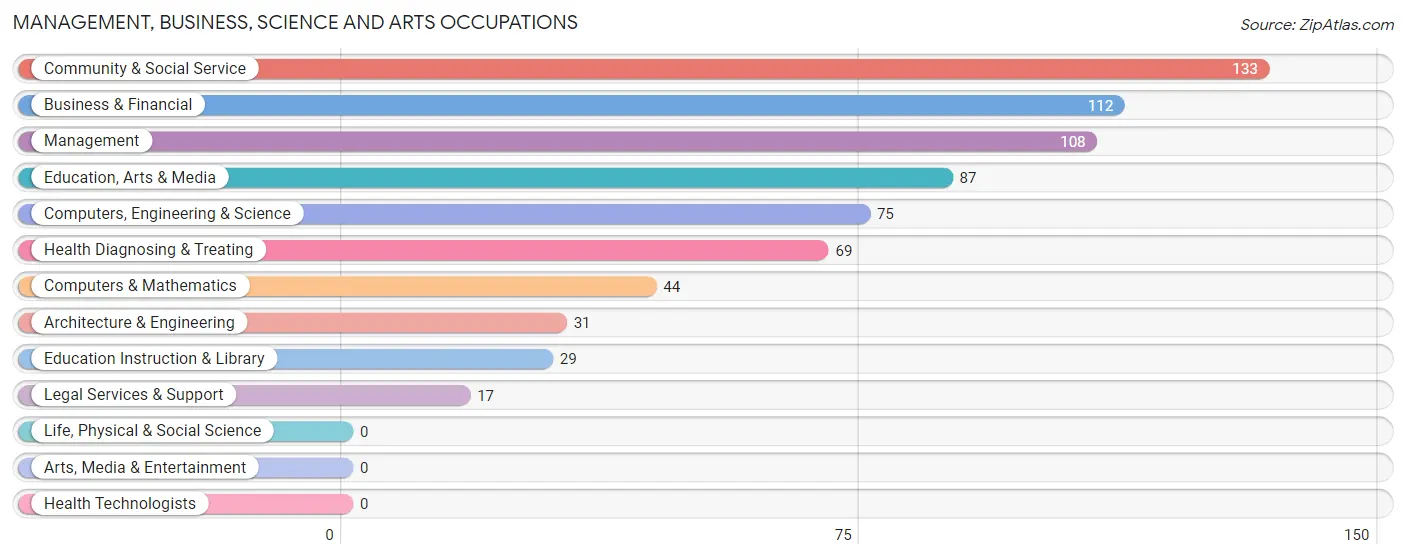
Management, Business, Science and Arts Occupations
The most common Management, Business, Science and Arts occupations in Town Line are Community & Social Service (133 | 14.3%), Business & Financial (112 | 12.0%), Management (108 | 11.6%), Education, Arts & Media (87 | 9.3%), and Computers, Engineering & Science (75 | 8.1%).
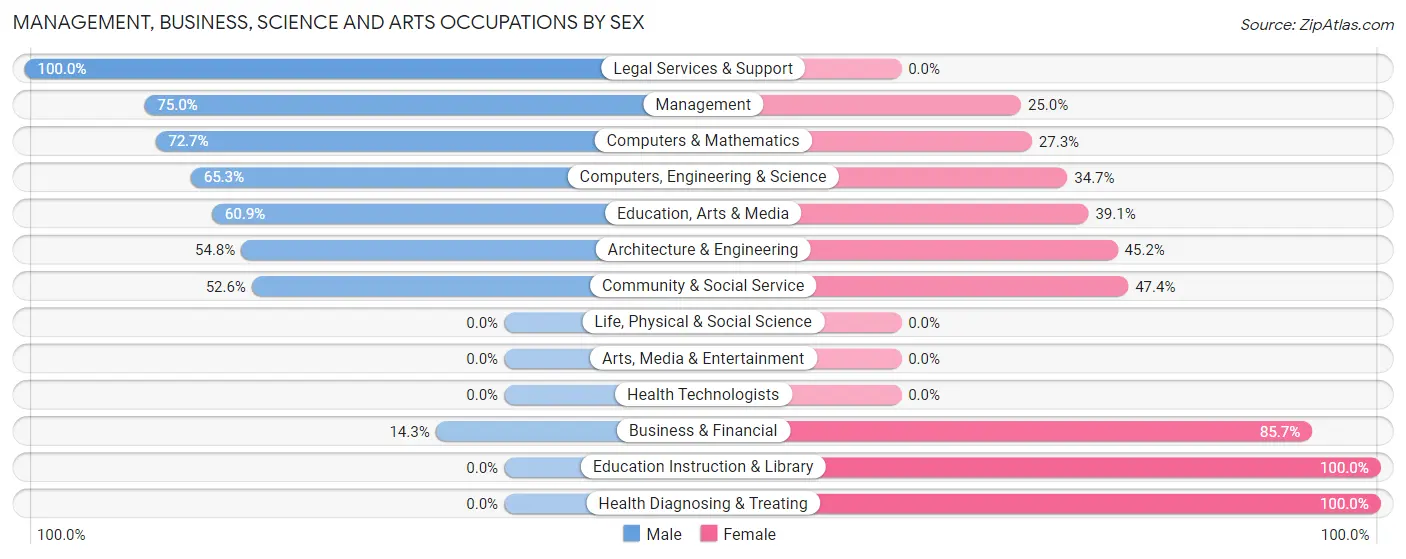
Management, Business, Science and Arts Occupations by Sex
Within the Management, Business, Science and Arts occupations in Town Line, the most male-oriented occupations are Legal Services & Support (100.0%), Management (75.0%), and Computers & Mathematics (72.7%), while the most female-oriented occupations are Education Instruction & Library (100.0%), Health Diagnosing & Treating (100.0%), and Business & Financial (85.7%).
| Occupation | Male | Female |
| Management | 81 (75.0%) | 27 (25.0%) |
| Business & Financial | 16 (14.3%) | 96 (85.7%) |
| Computers, Engineering & Science | 49 (65.3%) | 26 (34.7%) |
| Computers & Mathematics | 32 (72.7%) | 12 (27.3%) |
| Architecture & Engineering | 17 (54.8%) | 14 (45.2%) |
| Life, Physical & Social Science | 0 (0.0%) | 0 (0.0%) |
| Community & Social Service | 70 (52.6%) | 63 (47.4%) |
| Education, Arts & Media | 53 (60.9%) | 34 (39.1%) |
| Legal Services & Support | 17 (100.0%) | 0 (0.0%) |
| Education Instruction & Library | 0 (0.0%) | 29 (100.0%) |
| Arts, Media & Entertainment | 0 (0.0%) | 0 (0.0%) |
| Health Diagnosing & Treating | 0 (0.0%) | 69 (100.0%) |
| Health Technologists | 0 (0.0%) | 0 (0.0%) |
| Total (Category) | 216 (43.5%) | 281 (56.5%) |
| Total (Overall) | 513 (55.1%) | 418 (44.9%) |
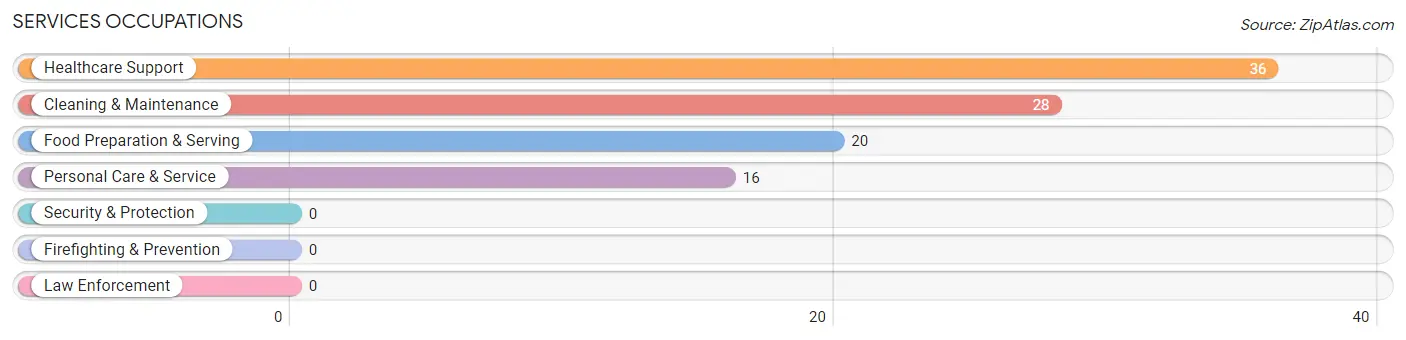
Services Occupations
The most common Services occupations in Town Line are Healthcare Support (36 | 3.9%), Cleaning & Maintenance (28 | 3.0%), Food Preparation & Serving (20 | 2.1%), and Personal Care & Service (16 | 1.7%).
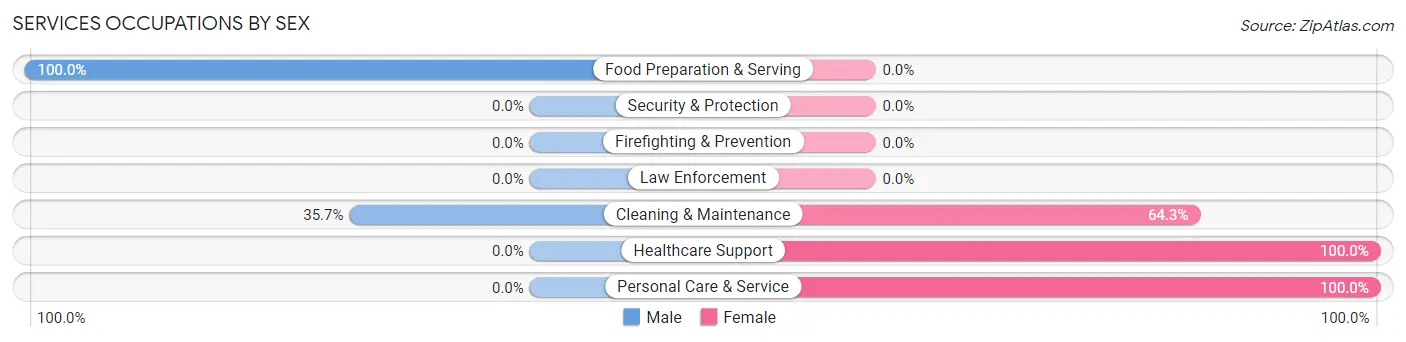
Services Occupations by Sex
Within the Services occupations in Town Line, the most male-oriented occupations are Food Preparation & Serving (100.0%), and Cleaning & Maintenance (35.7%), while the most female-oriented occupations are Healthcare Support (100.0%), Personal Care & Service (100.0%), and Cleaning & Maintenance (64.3%).
| Occupation | Male | Female |
| Healthcare Support | 0 (0.0%) | 36 (100.0%) |
| Security & Protection | 0 (0.0%) | 0 (0.0%) |
| Firefighting & Prevention | 0 (0.0%) | 0 (0.0%) |
| Law Enforcement | 0 (0.0%) | 0 (0.0%) |
| Food Preparation & Serving | 20 (100.0%) | 0 (0.0%) |
| Cleaning & Maintenance | 10 (35.7%) | 18 (64.3%) |
| Personal Care & Service | 0 (0.0%) | 16 (100.0%) |
| Total (Category) | 30 (30.0%) | 70 (70.0%) |
| Total (Overall) | 513 (55.1%) | 418 (44.9%) |
Sales and Office Occupations
The most common Sales and Office occupations in Town Line are Sales & Related (72 | 7.7%), and Office & Administration (67 | 7.2%).
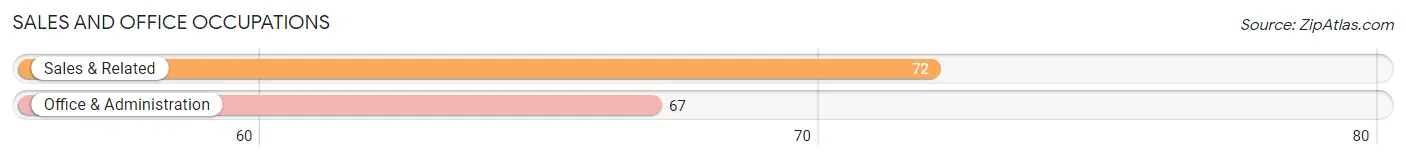
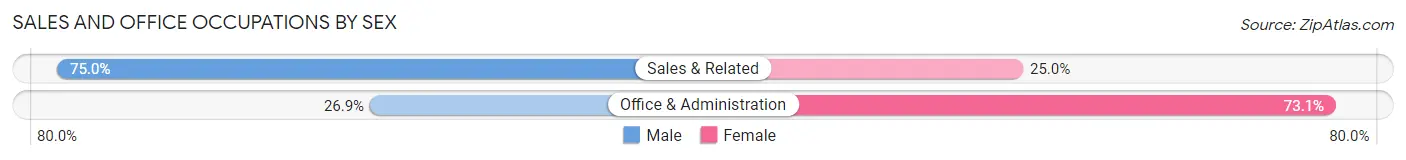
Sales and Office Occupations by Sex
| Occupation | Male | Female |
| Sales & Related | 54 (75.0%) | 18 (25.0%) |
| Office & Administration | 18 (26.9%) | 49 (73.1%) |
| Total (Category) | 72 (51.8%) | 67 (48.2%) |
| Total (Overall) | 513 (55.1%) | 418 (44.9%) |
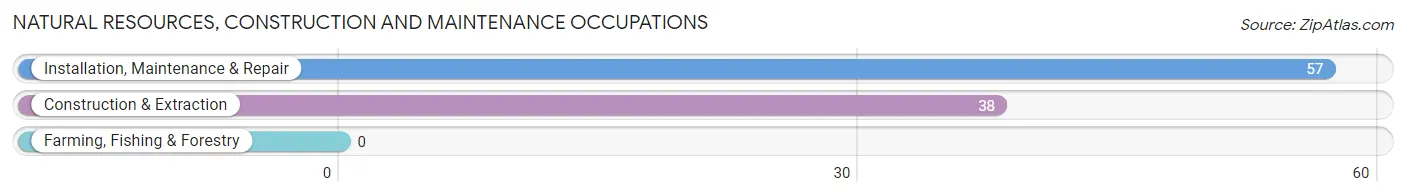
Natural Resources, Construction and Maintenance Occupations
The most common Natural Resources, Construction and Maintenance occupations in Town Line are Installation, Maintenance & Repair (57 | 6.1%), and Construction & Extraction (38 | 4.1%).
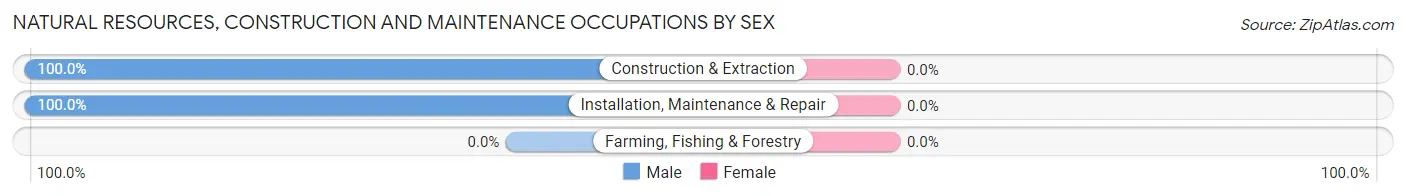
Natural Resources, Construction and Maintenance Occupations by Sex
| Occupation | Male | Female |
| Farming, Fishing & Forestry | 0 (0.0%) | 0 (0.0%) |
| Construction & Extraction | 38 (100.0%) | 0 (0.0%) |
| Installation, Maintenance & Repair | 57 (100.0%) | 0 (0.0%) |
| Total (Category) | 95 (100.0%) | 0 (0.0%) |
| Total (Overall) | 513 (55.1%) | 418 (44.9%) |
Production, Transportation and Moving Occupations
The most common Production, Transportation and Moving occupations in Town Line are Production (47 | 5.1%), Transportation (34 | 3.6%), and Material Moving (19 | 2.0%).
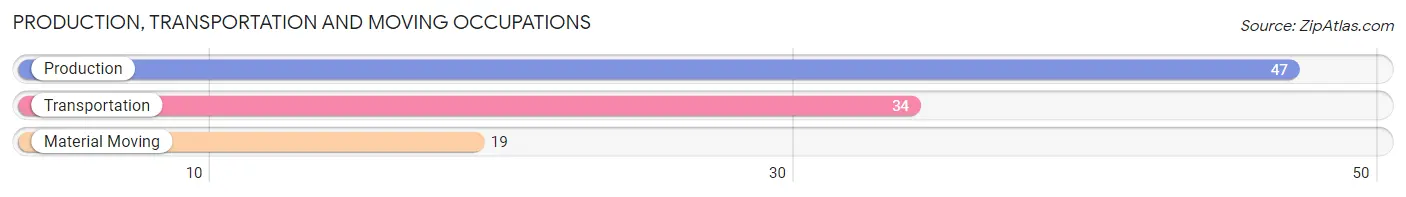
Production, Transportation and Moving Occupations by Sex
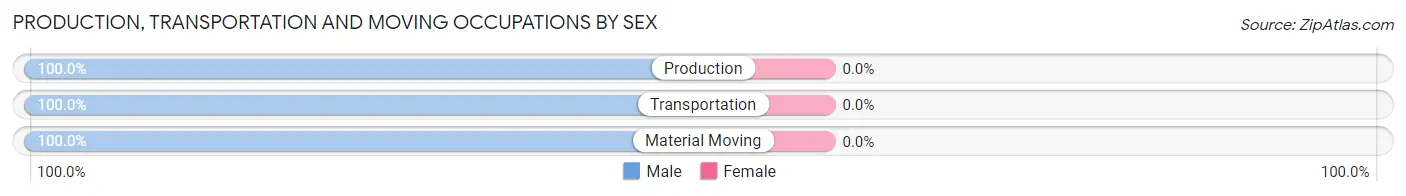
| Occupation | Male | Female |
| Production | 47 (100.0%) | 0 (0.0%) |
| Transportation | 34 (100.0%) | 0 (0.0%) |
| Material Moving | 19 (100.0%) | 0 (0.0%) |
| Total (Category) | 100 (100.0%) | 0 (0.0%) |
| Total (Overall) | 513 (55.1%) | 418 (44.9%) |
Employment Industries by Sex in Town Line
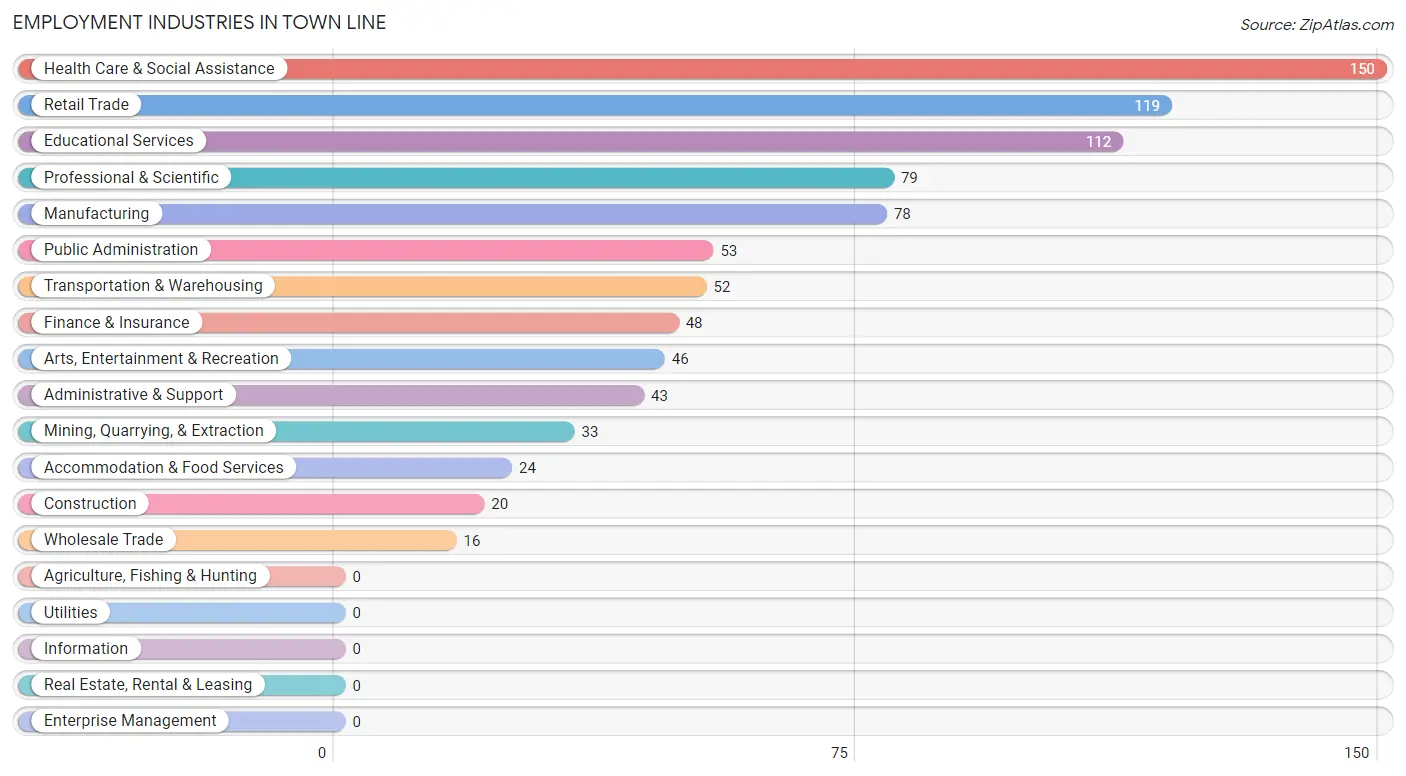
Employment Industries in Town Line
The major employment industries in Town Line include Health Care & Social Assistance (150 | 16.1%), Retail Trade (119 | 12.8%), Educational Services (112 | 12.0%), Professional & Scientific (79 | 8.5%), and Manufacturing (78 | 8.4%).
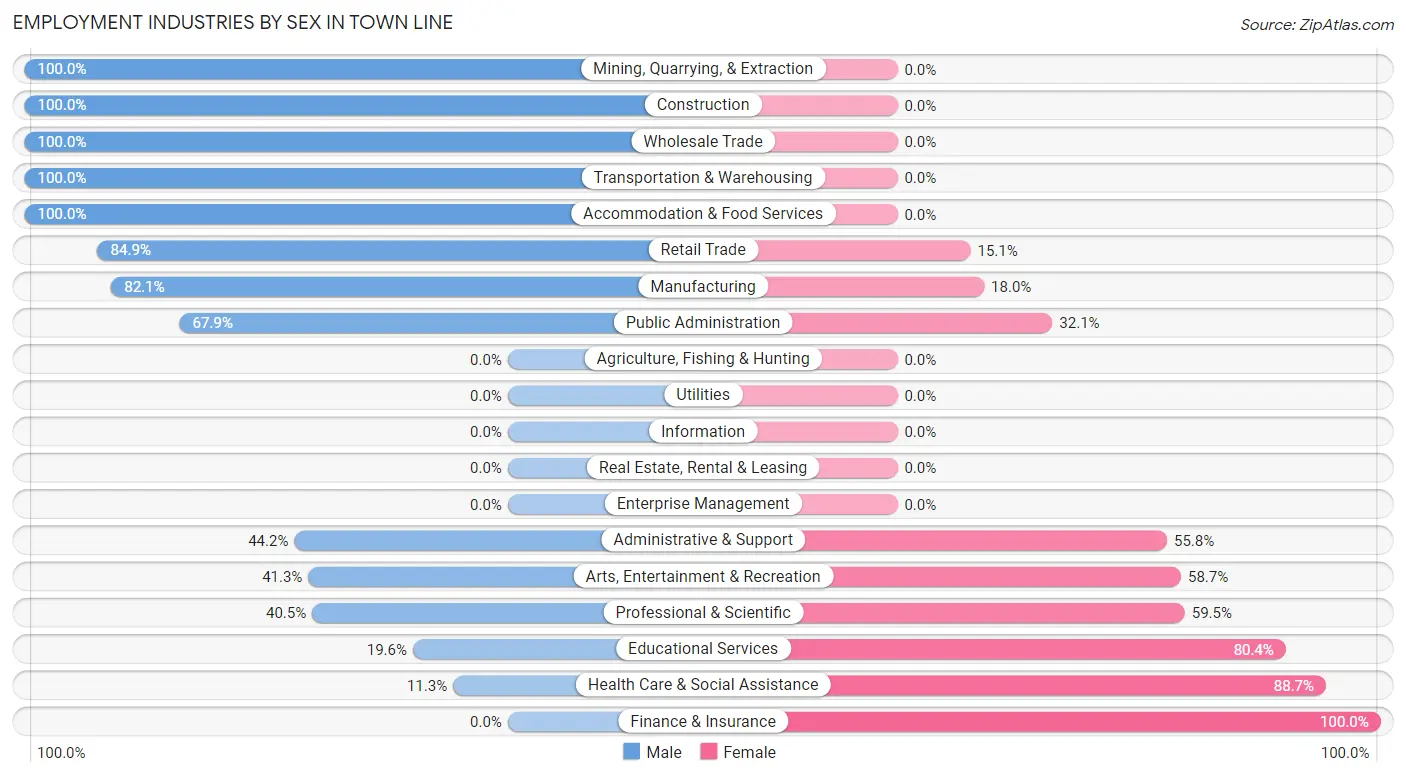
Employment Industries by Sex in Town Line
The Town Line industries that see more men than women are Mining, Quarrying, & Extraction (100.0%), Construction (100.0%), and Wholesale Trade (100.0%), whereas the industries that tend to have a higher number of women are Finance & Insurance (100.0%), Health Care & Social Assistance (88.7%), and Educational Services (80.4%).
| Industry | Male | Female |
| Agriculture, Fishing & Hunting | 0 (0.0%) | 0 (0.0%) |
| Mining, Quarrying, & Extraction | 33 (100.0%) | 0 (0.0%) |
| Construction | 20 (100.0%) | 0 (0.0%) |
| Manufacturing | 64 (82.1%) | 14 (17.9%) |
| Wholesale Trade | 16 (100.0%) | 0 (0.0%) |
| Retail Trade | 101 (84.9%) | 18 (15.1%) |
| Transportation & Warehousing | 52 (100.0%) | 0 (0.0%) |
| Utilities | 0 (0.0%) | 0 (0.0%) |
| Information | 0 (0.0%) | 0 (0.0%) |
| Finance & Insurance | 0 (0.0%) | 48 (100.0%) |
| Real Estate, Rental & Leasing | 0 (0.0%) | 0 (0.0%) |
| Professional & Scientific | 32 (40.5%) | 47 (59.5%) |
| Enterprise Management | 0 (0.0%) | 0 (0.0%) |
| Administrative & Support | 19 (44.2%) | 24 (55.8%) |
| Educational Services | 22 (19.6%) | 90 (80.4%) |
| Health Care & Social Assistance | 17 (11.3%) | 133 (88.7%) |
| Arts, Entertainment & Recreation | 19 (41.3%) | 27 (58.7%) |
| Accommodation & Food Services | 24 (100.0%) | 0 (0.0%) |
| Public Administration | 36 (67.9%) | 17 (32.1%) |
| Total | 513 (55.1%) | 418 (44.9%) |
Education in Town Line
School Enrollment in Town Line
The most common levels of schooling among the 264 students in Town Line are high school (56 | 21.2%), elementary school (53 | 20.1%), and middle school (52 | 19.7%).
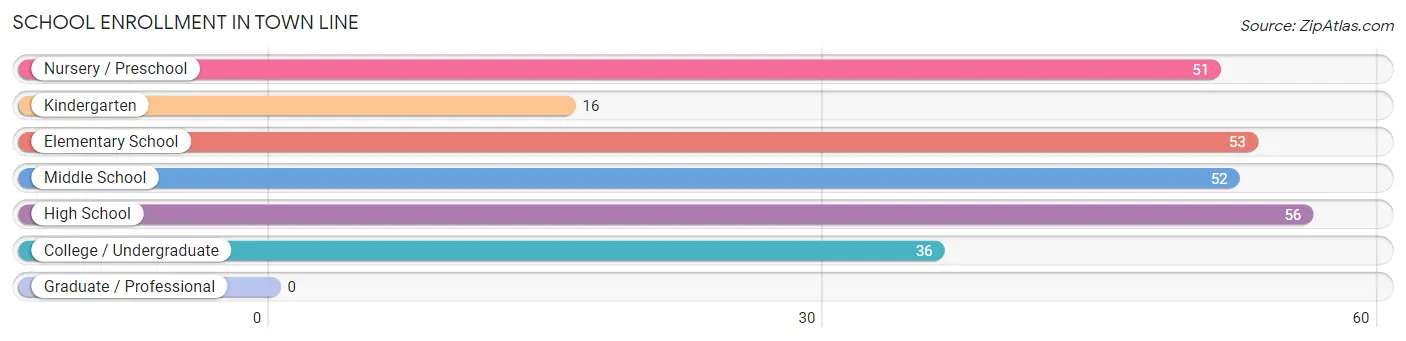
| School Level | # Students | % Students |
| Nursery / Preschool | 51 | 19.3% |
| Kindergarten | 16 | 6.1% |
| Elementary School | 53 | 20.1% |
| Middle School | 52 | 19.7% |
| High School | 56 | 21.2% |
| College / Undergraduate | 36 | 13.6% |
| Graduate / Professional | 0 | 0.0% |
| Total | 264 | 100.0% |
School Enrollment by Age by Funding Source in Town Line
Out of a total of 264 students who are enrolled in schools in Town Line, 52 (19.7%) attend a private institution, while the remaining 212 (80.3%) are enrolled in public schools. The age group of 20 to 24 year olds has the highest likelihood of being enrolled in private schools, with 18 (50.0% in the age bracket) enrolled. Conversely, the age group of 3 to 4 year olds has the lowest likelihood of being enrolled in a private school, with 17 (100.0% in the age bracket) attending a public institution.
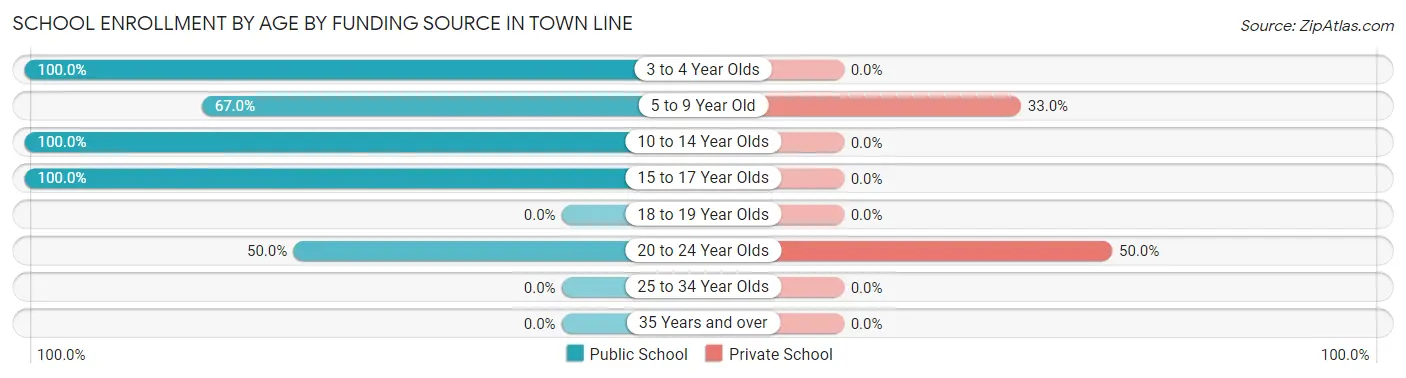
| Age Bracket | Public School | Private School |
| 3 to 4 Year Olds | 17 (100.0%) | 0 (0.0%) |
| 5 to 9 Year Old | 69 (67.0%) | 34 (33.0%) |
| 10 to 14 Year Olds | 52 (100.0%) | 0 (0.0%) |
| 15 to 17 Year Olds | 56 (100.0%) | 0 (0.0%) |
| 18 to 19 Year Olds | 0 (0.0%) | 0 (0.0%) |
| 20 to 24 Year Olds | 18 (50.0%) | 18 (50.0%) |
| 25 to 34 Year Olds | 0 (0.0%) | 0 (0.0%) |
| 35 Years and over | 0 (0.0%) | 0 (0.0%) |
| Total | 212 (80.3%) | 52 (19.7%) |
Educational Attainment by Field of Study in Town Line
Education (89 | 28.6%), business (44 | 14.1%), arts & humanities (36 | 11.6%), visual & performing arts (33 | 10.6%), and liberal arts & history (29 | 9.3%) are the most common fields of study among 311 individuals in Town Line who have obtained a bachelor's degree or higher.
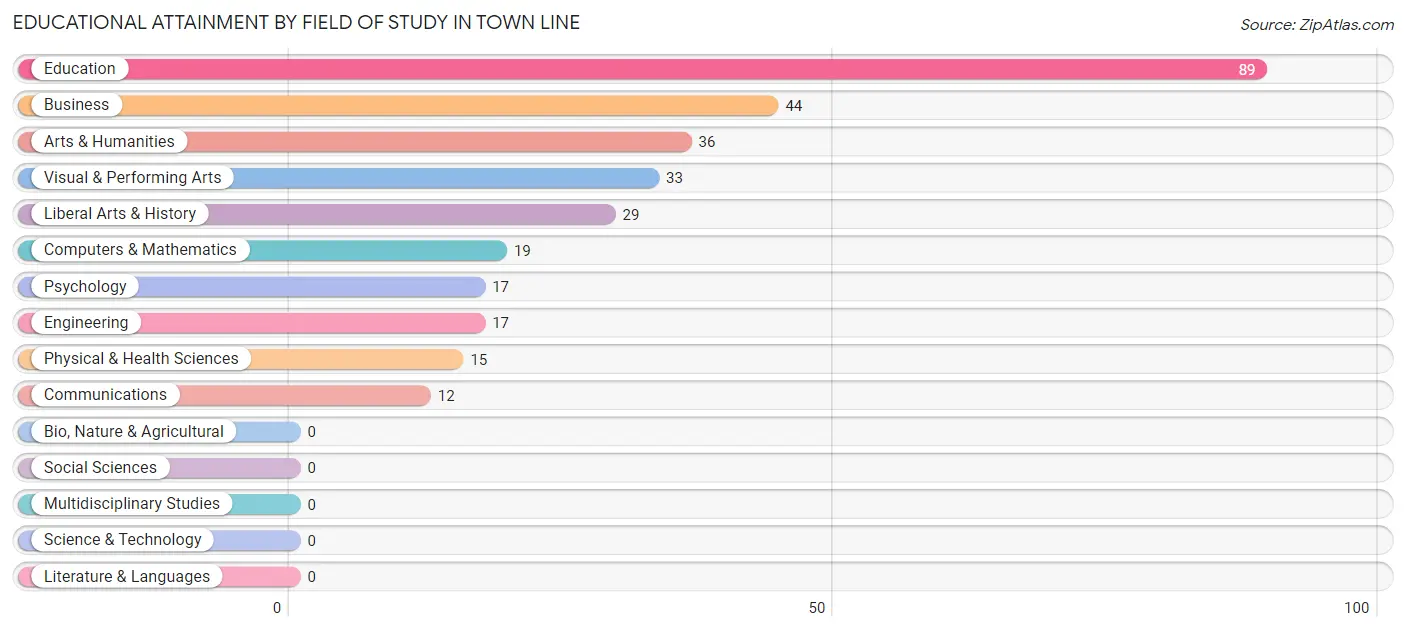
| Field of Study | # Graduates | % Graduates |
| Computers & Mathematics | 19 | 6.1% |
| Bio, Nature & Agricultural | 0 | 0.0% |
| Physical & Health Sciences | 15 | 4.8% |
| Psychology | 17 | 5.5% |
| Social Sciences | 0 | 0.0% |
| Engineering | 17 | 5.5% |
| Multidisciplinary Studies | 0 | 0.0% |
| Science & Technology | 0 | 0.0% |
| Business | 44 | 14.1% |
| Education | 89 | 28.6% |
| Literature & Languages | 0 | 0.0% |
| Liberal Arts & History | 29 | 9.3% |
| Visual & Performing Arts | 33 | 10.6% |
| Communications | 12 | 3.9% |
| Arts & Humanities | 36 | 11.6% |
| Total | 311 | 100.0% |
Transportation & Commute in Town Line
Vehicle Availability by Sex in Town Line
The most prevalent vehicle ownership categories in Town Line are males with 2 vehicles (247, accounting for 49.8%) and females with 2 vehicles (238, making up 61.4%).
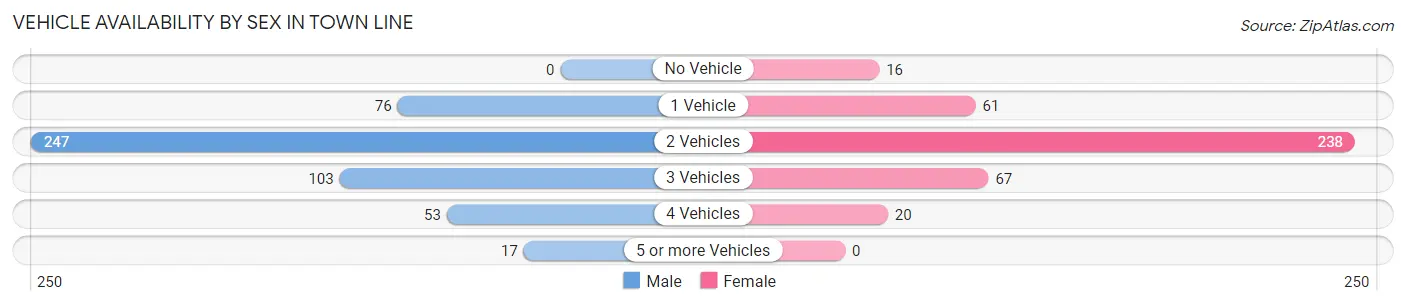
| Vehicles Available | Male | Female |
| No Vehicle | 0 (0.0%) | 16 (4.0%) |
| 1 Vehicle | 76 (15.3%) | 61 (15.2%) |
| 2 Vehicles | 247 (49.8%) | 238 (59.2%) |
| 3 Vehicles | 103 (20.8%) | 67 (16.7%) |
| 4 Vehicles | 53 (10.7%) | 20 (5.0%) |
| 5 or more Vehicles | 17 (3.4%) | 0 (0.0%) |
| Total | 496 (100.0%) | 402 (100.0%) |
Commute Time in Town Line
The most frequently occuring commute durations in Town Line are 20 to 24 minutes (166 commuters, 19.2%), 30 to 34 minutes (156 commuters, 18.0%), and 15 to 19 minutes (118 commuters, 13.6%).
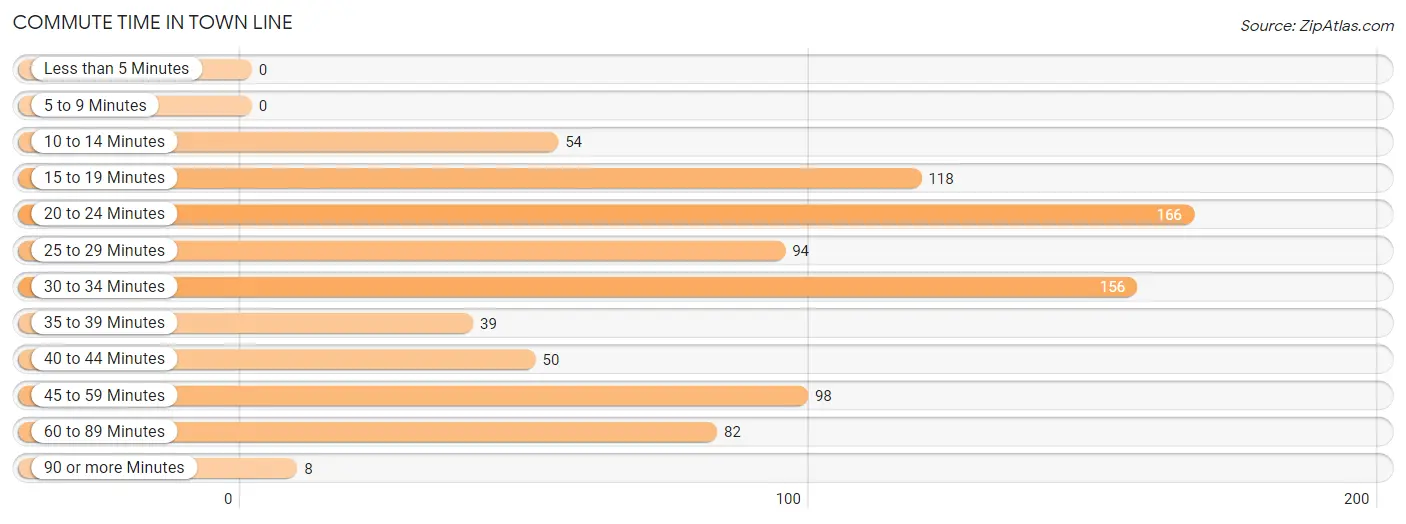
| Commute Time | # Commuters | % Commuters |
| Less than 5 Minutes | 0 | 0.0% |
| 5 to 9 Minutes | 0 | 0.0% |
| 10 to 14 Minutes | 54 | 6.2% |
| 15 to 19 Minutes | 118 | 13.6% |
| 20 to 24 Minutes | 166 | 19.2% |
| 25 to 29 Minutes | 94 | 10.9% |
| 30 to 34 Minutes | 156 | 18.0% |
| 35 to 39 Minutes | 39 | 4.5% |
| 40 to 44 Minutes | 50 | 5.8% |
| 45 to 59 Minutes | 98 | 11.3% |
| 60 to 89 Minutes | 82 | 9.5% |
| 90 or more Minutes | 8 | 0.9% |
Commute Time by Sex in Town Line
The most common commute times in Town Line are 20 to 24 minutes (139 commuters, 29.0%) for males and 30 to 34 minutes (98 commuters, 25.4%) for females.
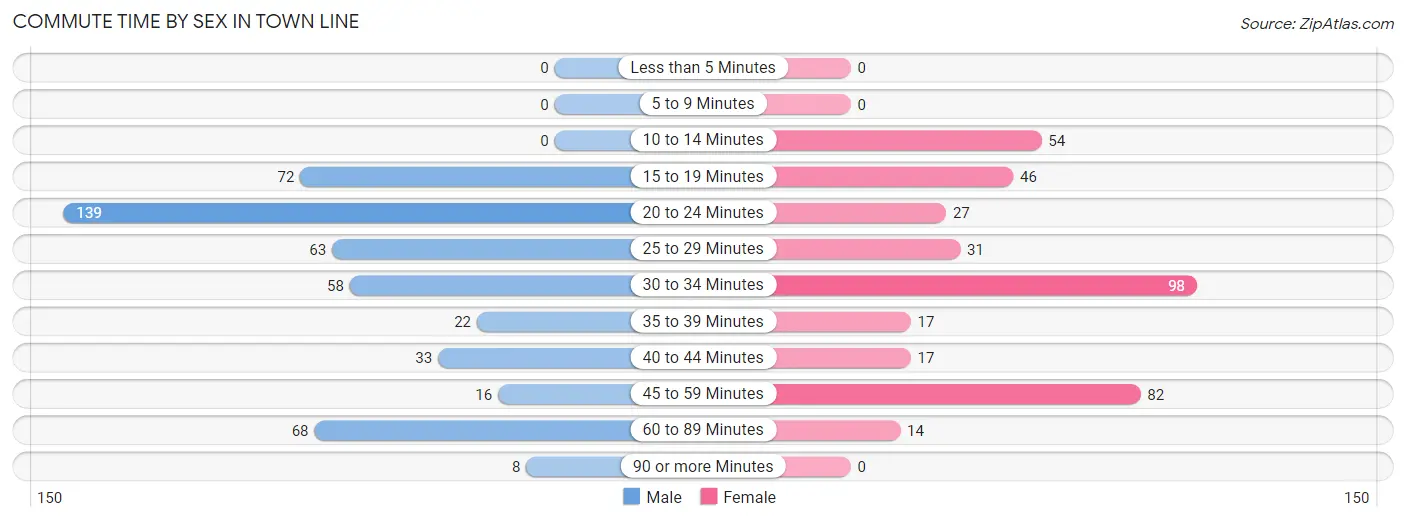
| Commute Time | Male | Female |
| Less than 5 Minutes | 0 (0.0%) | 0 (0.0%) |
| 5 to 9 Minutes | 0 (0.0%) | 0 (0.0%) |
| 10 to 14 Minutes | 0 (0.0%) | 54 (14.0%) |
| 15 to 19 Minutes | 72 (15.0%) | 46 (11.9%) |
| 20 to 24 Minutes | 139 (29.0%) | 27 (7.0%) |
| 25 to 29 Minutes | 63 (13.2%) | 31 (8.0%) |
| 30 to 34 Minutes | 58 (12.1%) | 98 (25.4%) |
| 35 to 39 Minutes | 22 (4.6%) | 17 (4.4%) |
| 40 to 44 Minutes | 33 (6.9%) | 17 (4.4%) |
| 45 to 59 Minutes | 16 (3.3%) | 82 (21.2%) |
| 60 to 89 Minutes | 68 (14.2%) | 14 (3.6%) |
| 90 or more Minutes | 8 (1.7%) | 0 (0.0%) |
Time of Departure to Work by Sex in Town Line
The most frequent times of departure to work in Town Line are 6:00 AM to 6:29 AM (93, 19.4%) for males and 7:00 AM to 7:29 AM (180, 46.6%) for females.
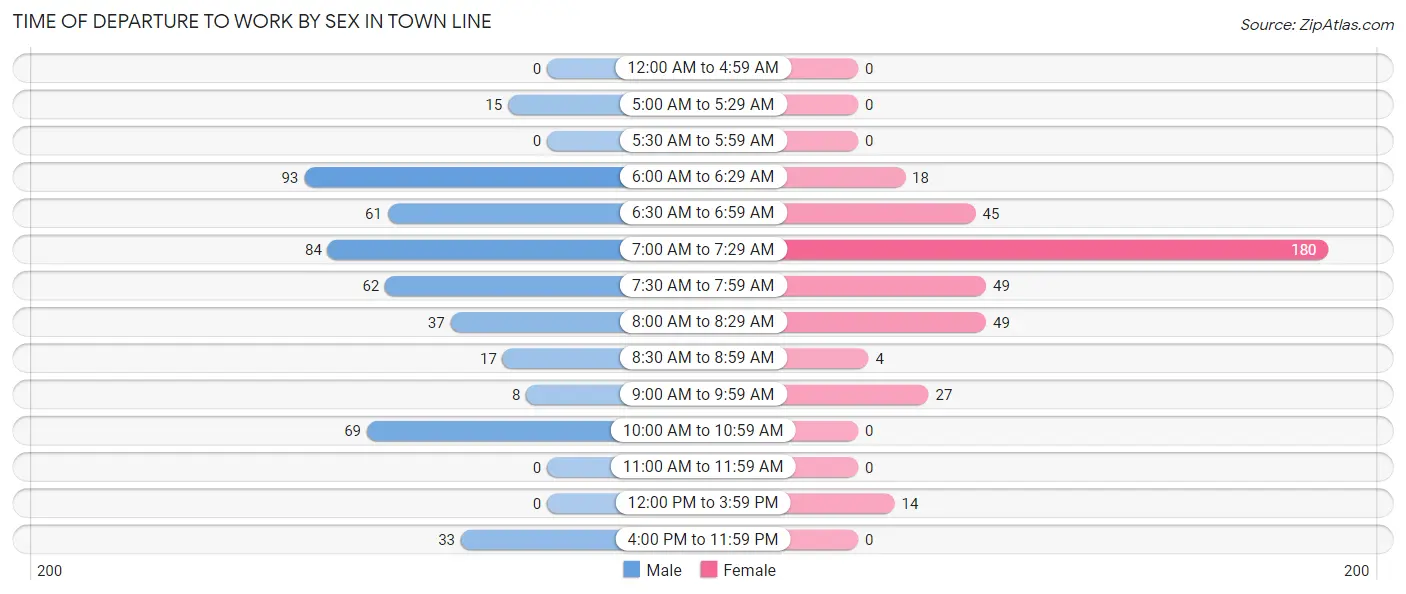
| Time of Departure | Male | Female |
| 12:00 AM to 4:59 AM | 0 (0.0%) | 0 (0.0%) |
| 5:00 AM to 5:29 AM | 15 (3.1%) | 0 (0.0%) |
| 5:30 AM to 5:59 AM | 0 (0.0%) | 0 (0.0%) |
| 6:00 AM to 6:29 AM | 93 (19.4%) | 18 (4.7%) |
| 6:30 AM to 6:59 AM | 61 (12.7%) | 45 (11.7%) |
| 7:00 AM to 7:29 AM | 84 (17.5%) | 180 (46.6%) |
| 7:30 AM to 7:59 AM | 62 (12.9%) | 49 (12.7%) |
| 8:00 AM to 8:29 AM | 37 (7.7%) | 49 (12.7%) |
| 8:30 AM to 8:59 AM | 17 (3.5%) | 4 (1.0%) |
| 9:00 AM to 9:59 AM | 8 (1.7%) | 27 (7.0%) |
| 10:00 AM to 10:59 AM | 69 (14.4%) | 0 (0.0%) |
| 11:00 AM to 11:59 AM | 0 (0.0%) | 0 (0.0%) |
| 12:00 PM to 3:59 PM | 0 (0.0%) | 14 (3.6%) |
| 4:00 PM to 11:59 PM | 33 (6.9%) | 0 (0.0%) |
| Total | 479 (100.0%) | 386 (100.0%) |
Housing Occupancy in Town Line
Occupancy by Ownership in Town Line
Of the total 810 dwellings in Town Line, owner-occupied units account for 736 (90.9%), while renter-occupied units make up 74 (9.1%).
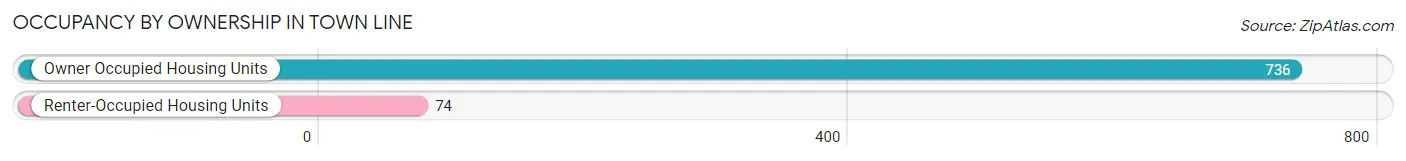
| Occupancy | # Housing Units | % Housing Units |
| Owner Occupied Housing Units | 736 | 90.9% |
| Renter-Occupied Housing Units | 74 | 9.1% |
| Total Occupied Housing Units | 810 | 100.0% |
Occupancy by Household Size in Town Line
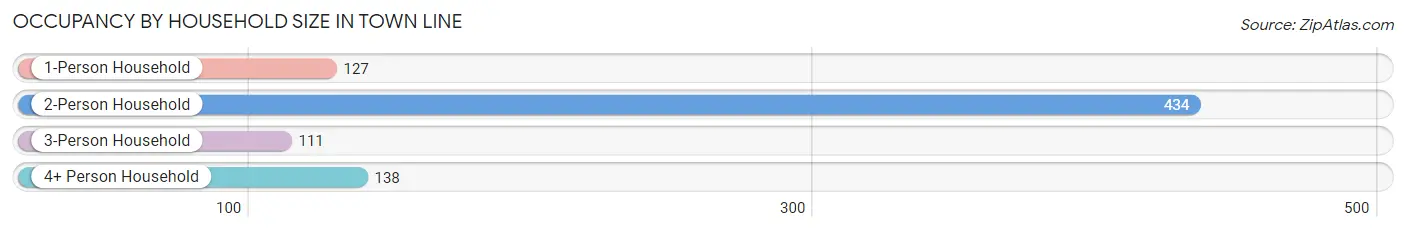
| Household Size | # Housing Units | % Housing Units |
| 1-Person Household | 127 | 15.7% |
| 2-Person Household | 434 | 53.6% |
| 3-Person Household | 111 | 13.7% |
| 4+ Person Household | 138 | 17.0% |
| Total Housing Units | 810 | 100.0% |
Occupancy by Ownership by Household Size in Town Line
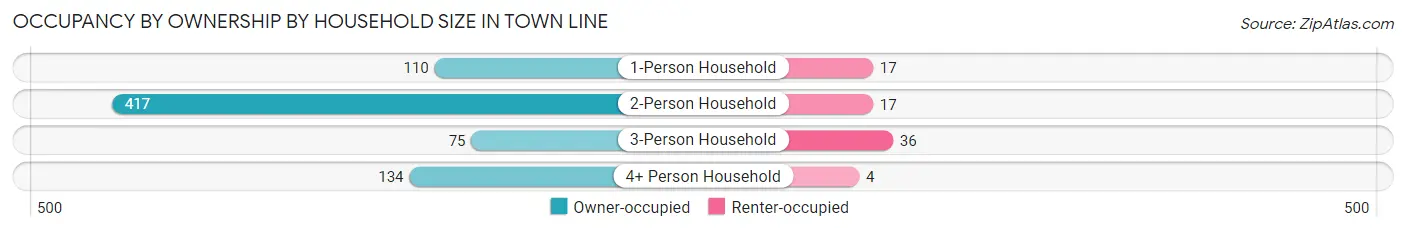
| Household Size | Owner-occupied | Renter-occupied |
| 1-Person Household | 110 (86.6%) | 17 (13.4%) |
| 2-Person Household | 417 (96.1%) | 17 (3.9%) |
| 3-Person Household | 75 (67.6%) | 36 (32.4%) |
| 4+ Person Household | 134 (97.1%) | 4 (2.9%) |
| Total Housing Units | 736 (90.9%) | 74 (9.1%) |
Occupancy by Educational Attainment in Town Line
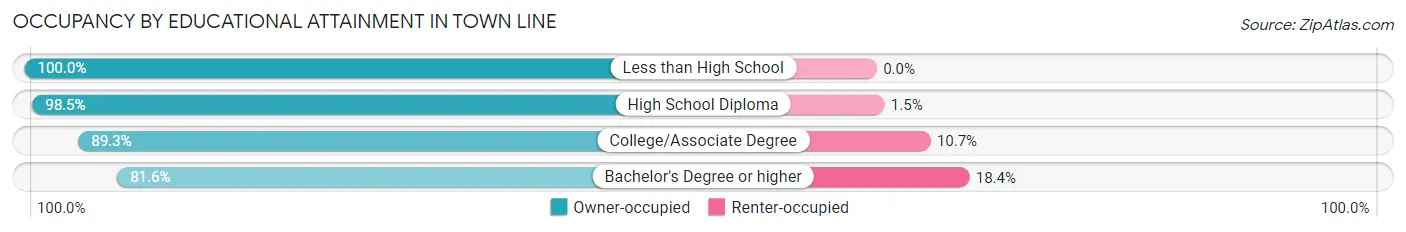
| Household Size | Owner-occupied | Renter-occupied |
| Less than High School | 33 (100.0%) | 0 (0.0%) |
| High School Diploma | 258 (98.5%) | 4 (1.5%) |
| College/Associate Degree | 285 (89.3%) | 34 (10.7%) |
| Bachelor's Degree or higher | 160 (81.6%) | 36 (18.4%) |
Occupancy by Age of Householder in Town Line
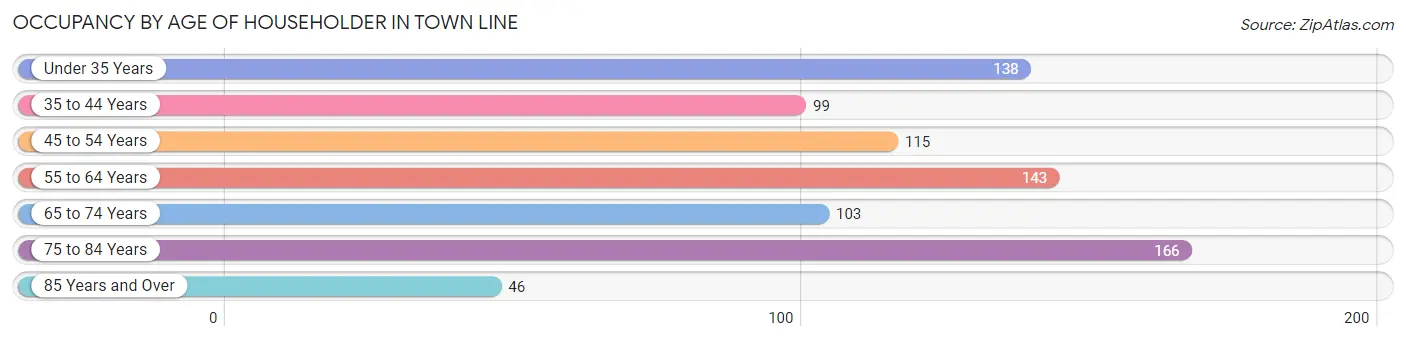
| Age Bracket | # Households | % Households |
| Under 35 Years | 138 | 17.0% |
| 35 to 44 Years | 99 | 12.2% |
| 45 to 54 Years | 115 | 14.2% |
| 55 to 64 Years | 143 | 17.6% |
| 65 to 74 Years | 103 | 12.7% |
| 75 to 84 Years | 166 | 20.5% |
| 85 Years and Over | 46 | 5.7% |
| Total | 810 | 100.0% |
Housing Finances in Town Line
Median Income by Occupancy in Town Line
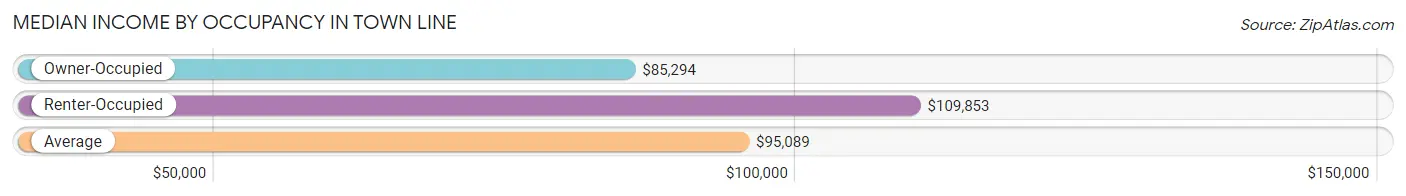
| Occupancy Type | # Households | Median Income |
| Owner-Occupied | 736 (90.9%) | $85,294 |
| Renter-Occupied | 74 (9.1%) | $109,853 |
| Average | 810 (100.0%) | $95,089 |
Occupancy by Householder Income Bracket in Town Line
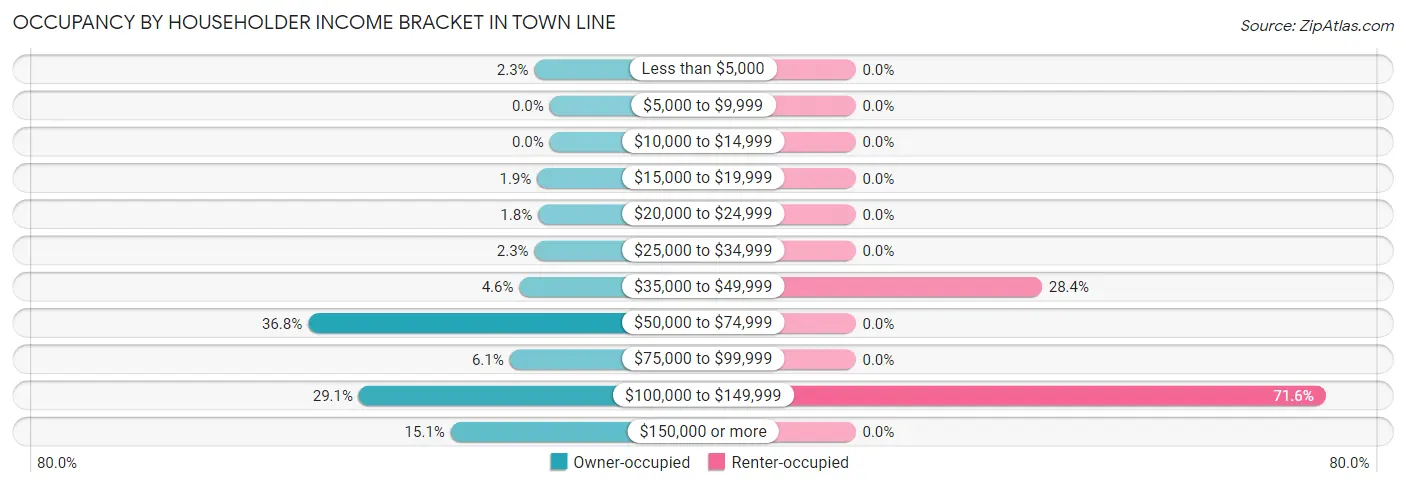
| Income Bracket | Owner-occupied | Renter-occupied |
| Less than $5,000 | 17 (2.3%) | 0 (0.0%) |
| $5,000 to $9,999 | 0 (0.0%) | 0 (0.0%) |
| $10,000 to $14,999 | 0 (0.0%) | 0 (0.0%) |
| $15,000 to $19,999 | 14 (1.9%) | 0 (0.0%) |
| $20,000 to $24,999 | 13 (1.8%) | 0 (0.0%) |
| $25,000 to $34,999 | 17 (2.3%) | 0 (0.0%) |
| $35,000 to $49,999 | 34 (4.6%) | 21 (28.4%) |
| $50,000 to $74,999 | 271 (36.8%) | 0 (0.0%) |
| $75,000 to $99,999 | 45 (6.1%) | 0 (0.0%) |
| $100,000 to $149,999 | 214 (29.1%) | 53 (71.6%) |
| $150,000 or more | 111 (15.1%) | 0 (0.0%) |
| Total | 736 (100.0%) | 74 (100.0%) |
Monthly Housing Cost Tiers in Town Line
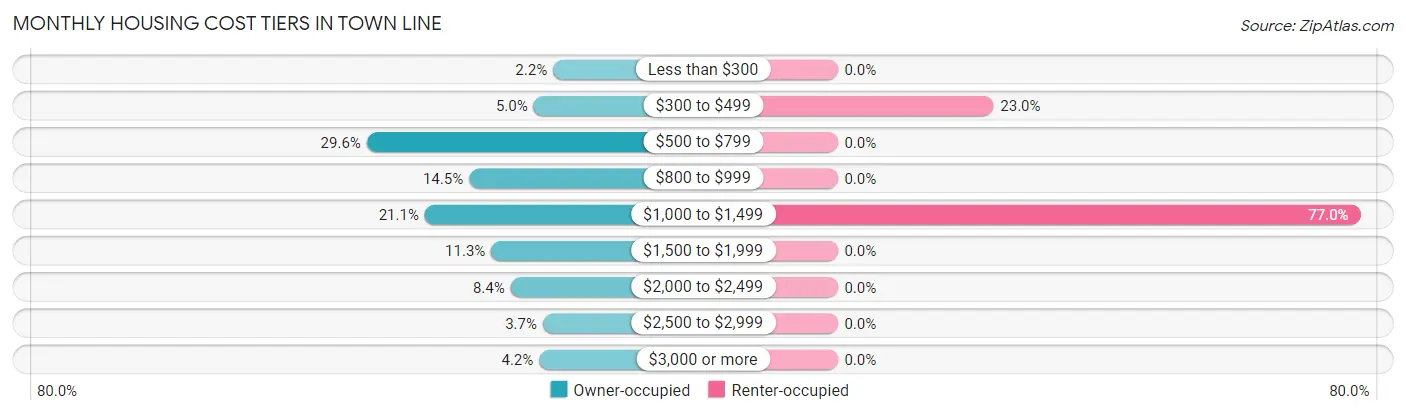
| Monthly Cost | Owner-occupied | Renter-occupied |
| Less than $300 | 16 (2.2%) | 0 (0.0%) |
| $300 to $499 | 37 (5.0%) | 17 (23.0%) |
| $500 to $799 | 218 (29.6%) | 0 (0.0%) |
| $800 to $999 | 107 (14.5%) | 0 (0.0%) |
| $1,000 to $1,499 | 155 (21.1%) | 57 (77.0%) |
| $1,500 to $1,999 | 83 (11.3%) | 0 (0.0%) |
| $2,000 to $2,499 | 62 (8.4%) | 0 (0.0%) |
| $2,500 to $2,999 | 27 (3.7%) | 0 (0.0%) |
| $3,000 or more | 31 (4.2%) | 0 (0.0%) |
| Total | 736 (100.0%) | 74 (100.0%) |
Physical Housing Characteristics in Town Line
Housing Structures in Town Line
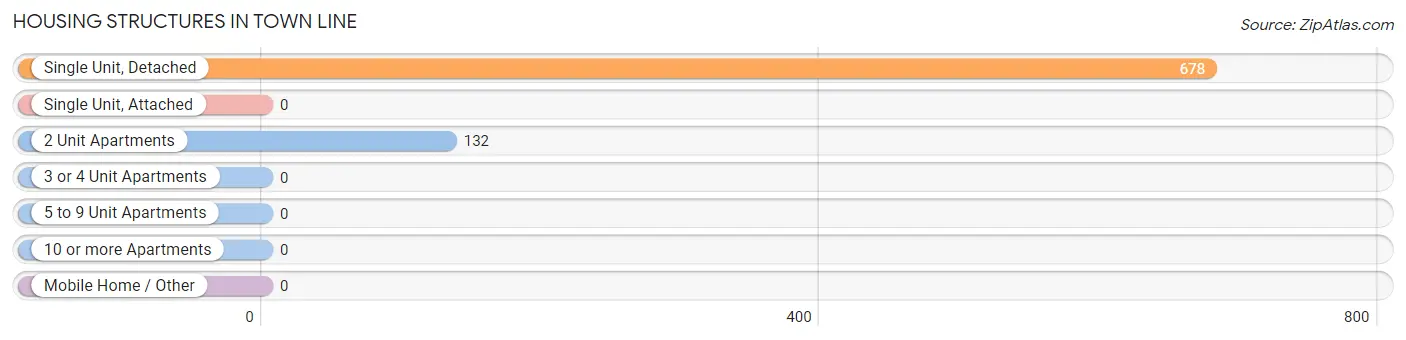
| Structure Type | # Housing Units | % Housing Units |
| Single Unit, Detached | 678 | 83.7% |
| Single Unit, Attached | 0 | 0.0% |
| 2 Unit Apartments | 132 | 16.3% |
| 3 or 4 Unit Apartments | 0 | 0.0% |
| 5 to 9 Unit Apartments | 0 | 0.0% |
| 10 or more Apartments | 0 | 0.0% |
| Mobile Home / Other | 0 | 0.0% |
| Total | 810 | 100.0% |
Housing Structures by Occupancy in Town Line
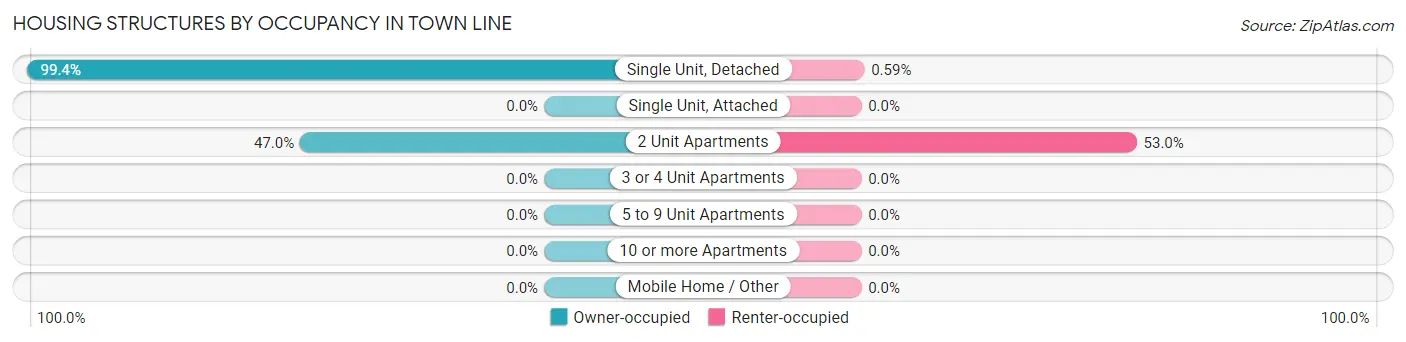
| Structure Type | Owner-occupied | Renter-occupied |
| Single Unit, Detached | 674 (99.4%) | 4 (0.6%) |
| Single Unit, Attached | 0 (0.0%) | 0 (0.0%) |
| 2 Unit Apartments | 62 (47.0%) | 70 (53.0%) |
| 3 or 4 Unit Apartments | 0 (0.0%) | 0 (0.0%) |
| 5 to 9 Unit Apartments | 0 (0.0%) | 0 (0.0%) |
| 10 or more Apartments | 0 (0.0%) | 0 (0.0%) |
| Mobile Home / Other | 0 (0.0%) | 0 (0.0%) |
| Total | 736 (90.9%) | 74 (9.1%) |
Housing Structures by Number of Rooms in Town Line
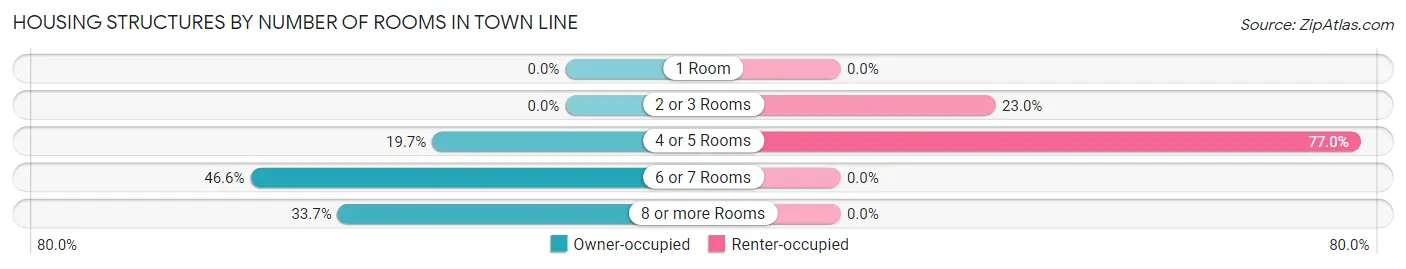
| Number of Rooms | Owner-occupied | Renter-occupied |
| 1 Room | 0 (0.0%) | 0 (0.0%) |
| 2 or 3 Rooms | 0 (0.0%) | 17 (23.0%) |
| 4 or 5 Rooms | 145 (19.7%) | 57 (77.0%) |
| 6 or 7 Rooms | 343 (46.6%) | 0 (0.0%) |
| 8 or more Rooms | 248 (33.7%) | 0 (0.0%) |
| Total | 736 (100.0%) | 74 (100.0%) |
Housing Structure by Heating Type in Town Line
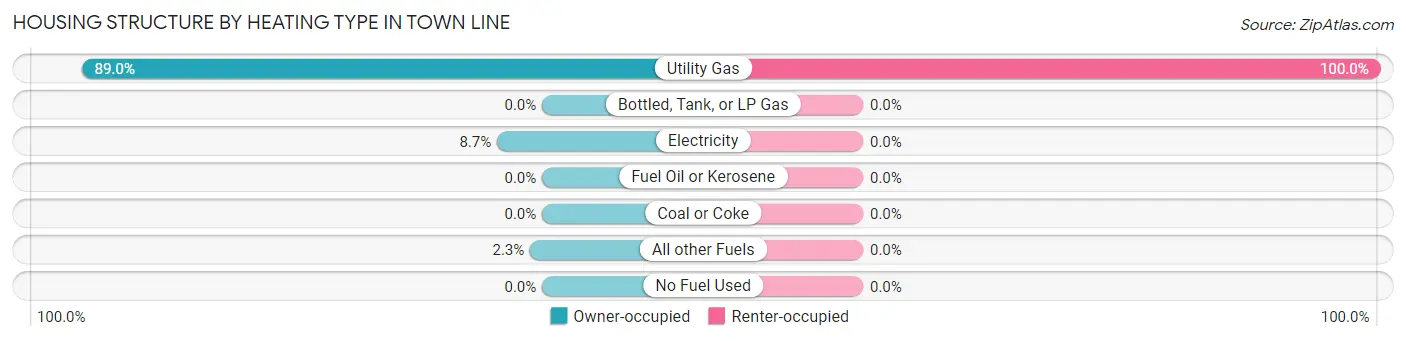
| Heating Type | Owner-occupied | Renter-occupied |
| Utility Gas | 655 (89.0%) | 74 (100.0%) |
| Bottled, Tank, or LP Gas | 0 (0.0%) | 0 (0.0%) |
| Electricity | 64 (8.7%) | 0 (0.0%) |
| Fuel Oil or Kerosene | 0 (0.0%) | 0 (0.0%) |
| Coal or Coke | 0 (0.0%) | 0 (0.0%) |
| All other Fuels | 17 (2.3%) | 0 (0.0%) |
| No Fuel Used | 0 (0.0%) | 0 (0.0%) |
| Total | 736 (100.0%) | 74 (100.0%) |
Household Vehicle Usage in Town Line
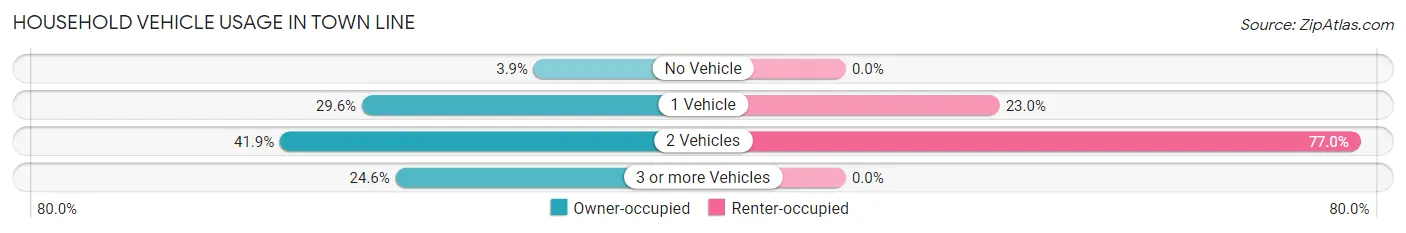
| Vehicles per Household | Owner-occupied | Renter-occupied |
| No Vehicle | 29 (3.9%) | 0 (0.0%) |
| 1 Vehicle | 218 (29.6%) | 17 (23.0%) |
| 2 Vehicles | 308 (41.8%) | 57 (77.0%) |
| 3 or more Vehicles | 181 (24.6%) | 0 (0.0%) |
| Total | 736 (100.0%) | 74 (100.0%) |
Real Estate & Mortgages in Town Line
Real Estate and Mortgage Overview in Town Line
| Characteristic | Without Mortgage | With Mortgage |
| Housing Units | 364 | 372 |
| Median Property Value | $191,400 | $250,000 |
| Median Household Income | $73,629 | $78 |
| Monthly Housing Costs | $669 | $31 |
| Real Estate Taxes | $4,351 | $0 |
Property Value by Mortgage Status in Town Line
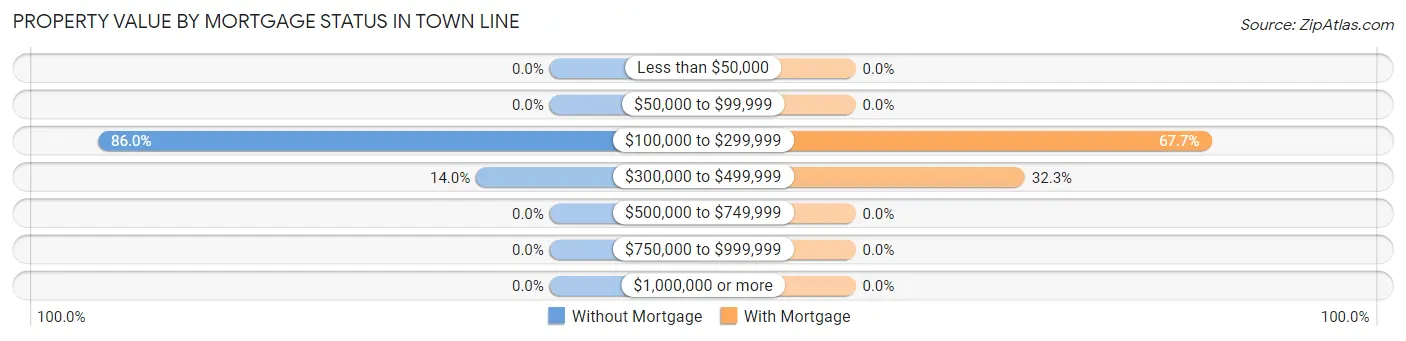
| Property Value | Without Mortgage | With Mortgage |
| Less than $50,000 | 0 (0.0%) | 0 (0.0%) |
| $50,000 to $99,999 | 0 (0.0%) | 0 (0.0%) |
| $100,000 to $299,999 | 313 (86.0%) | 252 (67.7%) |
| $300,000 to $499,999 | 51 (14.0%) | 120 (32.3%) |
| $500,000 to $749,999 | 0 (0.0%) | 0 (0.0%) |
| $750,000 to $999,999 | 0 (0.0%) | 0 (0.0%) |
| $1,000,000 or more | 0 (0.0%) | 0 (0.0%) |
| Total | 364 (100.0%) | 372 (100.0%) |
Household Income by Mortgage Status in Town Line
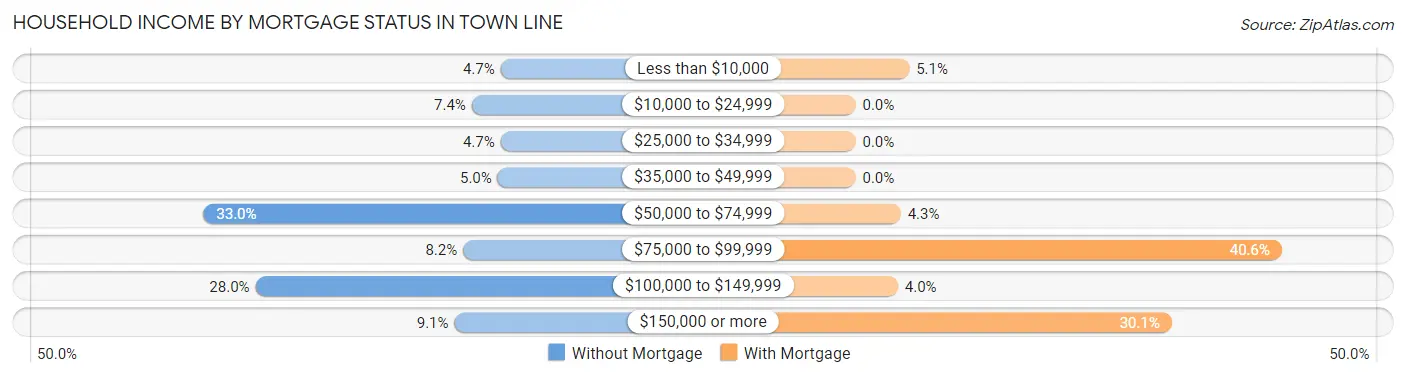
| Household Income | Without Mortgage | With Mortgage |
| Less than $10,000 | 17 (4.7%) | 19 (5.1%) |
| $10,000 to $24,999 | 27 (7.4%) | 0 (0.0%) |
| $25,000 to $34,999 | 17 (4.7%) | 0 (0.0%) |
| $35,000 to $49,999 | 18 (5.0%) | 0 (0.0%) |
| $50,000 to $74,999 | 120 (33.0%) | 16 (4.3%) |
| $75,000 to $99,999 | 30 (8.2%) | 151 (40.6%) |
| $100,000 to $149,999 | 102 (28.0%) | 15 (4.0%) |
| $150,000 or more | 33 (9.1%) | 112 (30.1%) |
| Total | 364 (100.0%) | 372 (100.0%) |
Property Value to Household Income Ratio in Town Line
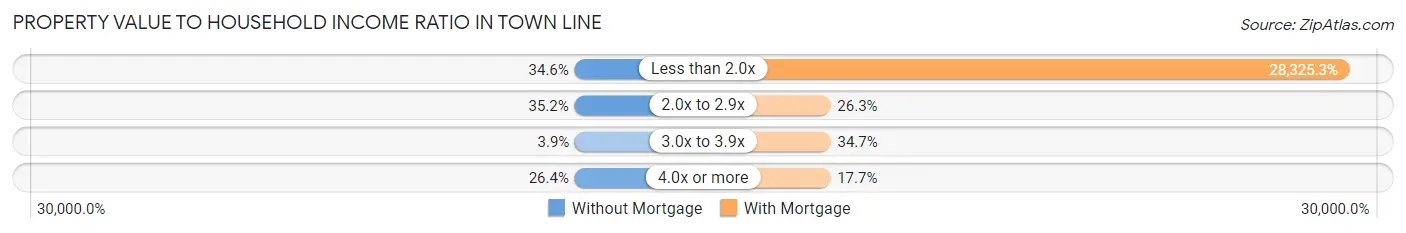
| Value-to-Income Ratio | Without Mortgage | With Mortgage |
| Less than 2.0x | 126 (34.6%) | 105,370 (28,325.3%) |
| 2.0x to 2.9x | 128 (35.2%) | 98 (26.3%) |
| 3.0x to 3.9x | 14 (3.8%) | 129 (34.7%) |
| 4.0x or more | 96 (26.4%) | 66 (17.7%) |
| Total | 364 (100.0%) | 372 (100.0%) |
Real Estate Taxes by Mortgage Status in Town Line
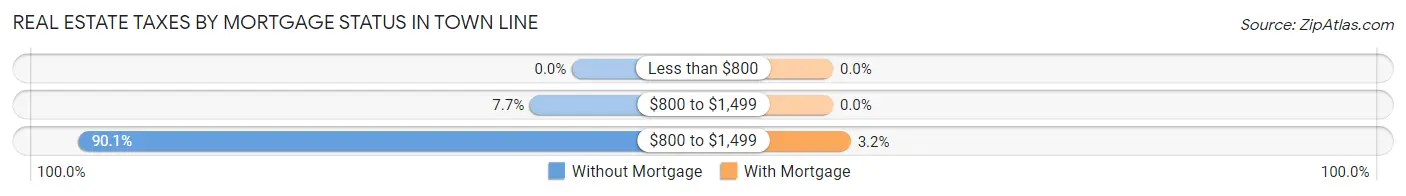
| Property Taxes | Without Mortgage | With Mortgage |
| Less than $800 | 0 (0.0%) | 0 (0.0%) |
| $800 to $1,499 | 28 (7.7%) | 0 (0.0%) |
| $800 to $1,499 | 328 (90.1%) | 12 (3.2%) |
| Total | 364 (100.0%) | 372 (100.0%) |
Health & Disability in Town Line
Health Insurance Coverage by Age in Town Line
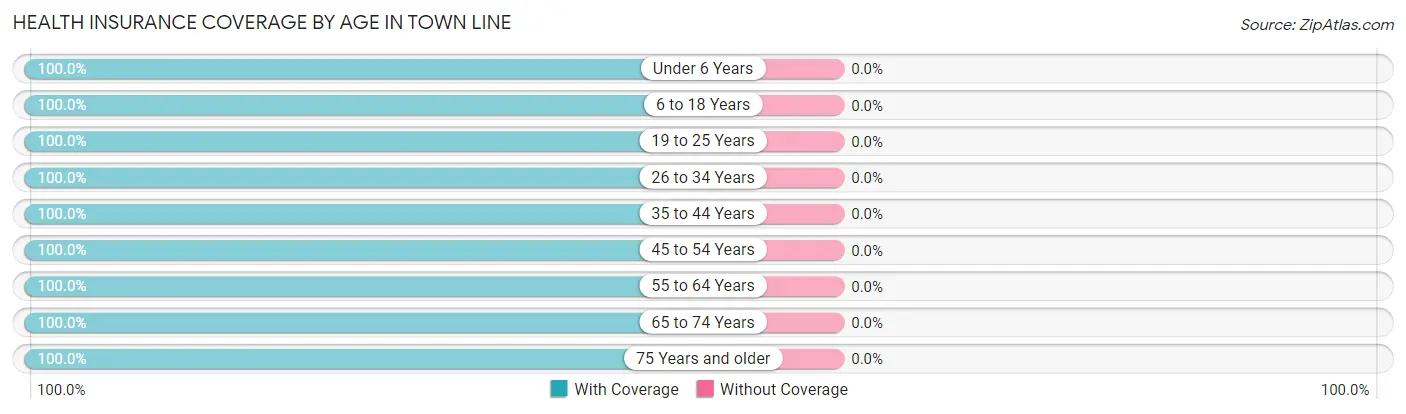
| Age Bracket | With Coverage | Without Coverage |
| Under 6 Years | 152 (100.0%) | 0 (0.0%) |
| 6 to 18 Years | 161 (100.0%) | 0 (0.0%) |
| 19 to 25 Years | 138 (100.0%) | 0 (0.0%) |
| 26 to 34 Years | 209 (100.0%) | 0 (0.0%) |
| 35 to 44 Years | 258 (100.0%) | 0 (0.0%) |
| 45 to 54 Years | 215 (100.0%) | 0 (0.0%) |
| 55 to 64 Years | 267 (100.0%) | 0 (0.0%) |
| 65 to 74 Years | 195 (100.0%) | 0 (0.0%) |
| 75 Years and older | 356 (100.0%) | 0 (0.0%) |
| Total | 1,951 (100.0%) | 0 (0.0%) |
Health Insurance Coverage by Citizenship Status in Town Line
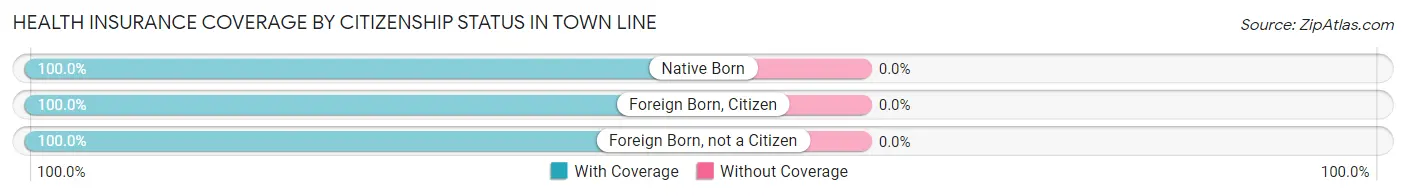
| Citizenship Status | With Coverage | Without Coverage |
| Native Born | 152 (100.0%) | 0 (0.0%) |
| Foreign Born, Citizen | 161 (100.0%) | 0 (0.0%) |
| Foreign Born, not a Citizen | 138 (100.0%) | 0 (0.0%) |
Health Insurance Coverage by Household Income in Town Line
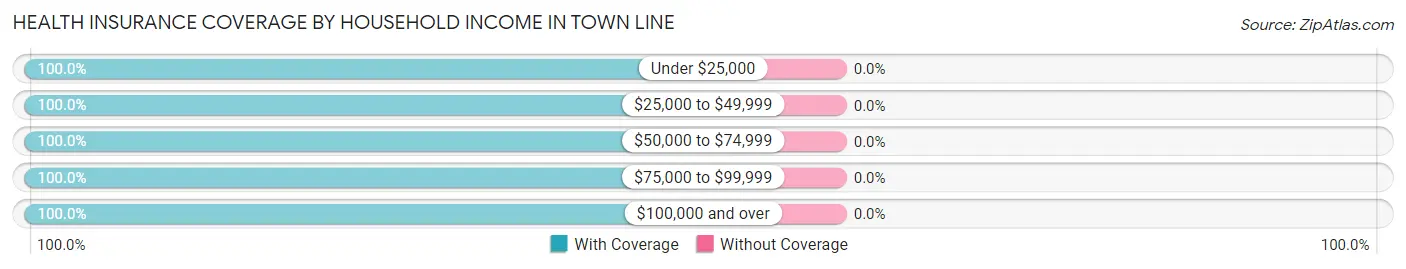
| Household Income | With Coverage | Without Coverage |
| Under $25,000 | 44 (100.0%) | 0 (0.0%) |
| $25,000 to $49,999 | 113 (100.0%) | 0 (0.0%) |
| $50,000 to $74,999 | 634 (100.0%) | 0 (0.0%) |
| $75,000 to $99,999 | 90 (100.0%) | 0 (0.0%) |
| $100,000 and over | 1,055 (100.0%) | 0 (0.0%) |
Public vs Private Health Insurance Coverage by Age in Town Line
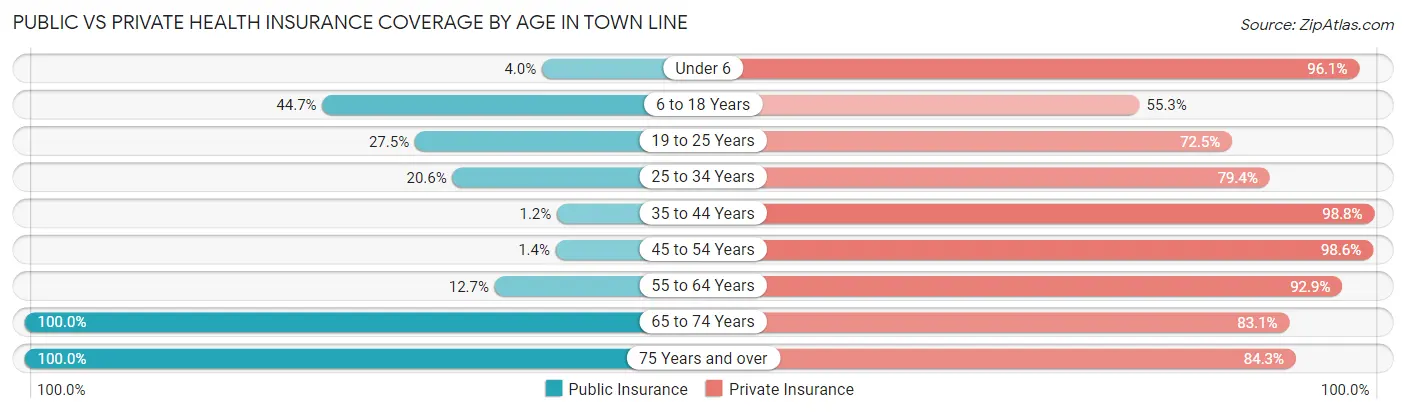
| Age Bracket | Public Insurance | Private Insurance |
| Under 6 | 6 (4.0%) | 146 (96.1%) |
| 6 to 18 Years | 72 (44.7%) | 89 (55.3%) |
| 19 to 25 Years | 38 (27.5%) | 100 (72.5%) |
| 25 to 34 Years | 43 (20.6%) | 166 (79.4%) |
| 35 to 44 Years | 3 (1.2%) | 255 (98.8%) |
| 45 to 54 Years | 3 (1.4%) | 212 (98.6%) |
| 55 to 64 Years | 34 (12.7%) | 248 (92.9%) |
| 65 to 74 Years | 195 (100.0%) | 162 (83.1%) |
| 75 Years and over | 356 (100.0%) | 300 (84.3%) |
| Total | 750 (38.4%) | 1,678 (86.0%) |
Disability Status by Sex by Age in Town Line
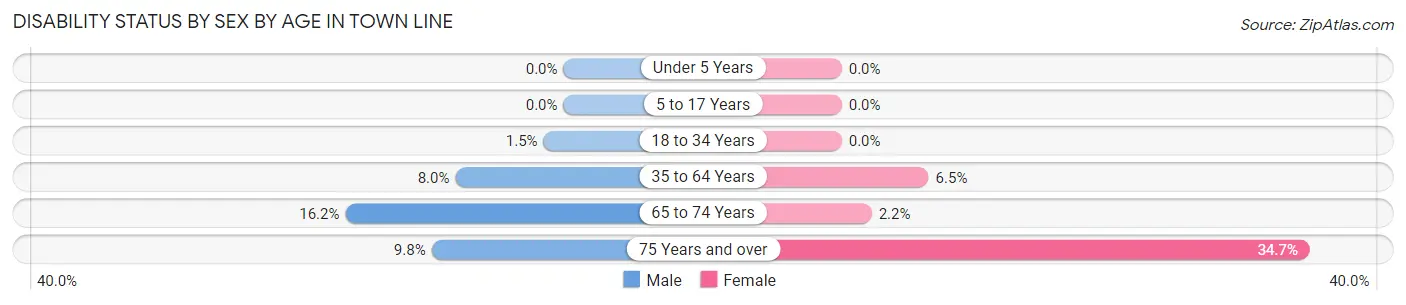
| Age Bracket | Male | Female |
| Under 5 Years | 0 (0.0%) | 0 (0.0%) |
| 5 to 17 Years | 0 (0.0%) | 0 (0.0%) |
| 18 to 34 Years | 2 (1.5%) | 0 (0.0%) |
| 35 to 64 Years | 32 (8.0%) | 22 (6.5%) |
| 65 to 74 Years | 17 (16.2%) | 2 (2.2%) |
| 75 Years and over | 14 (9.8%) | 74 (34.7%) |
Disability Class by Sex by Age in Town Line
Disability Class: Hearing Difficulty
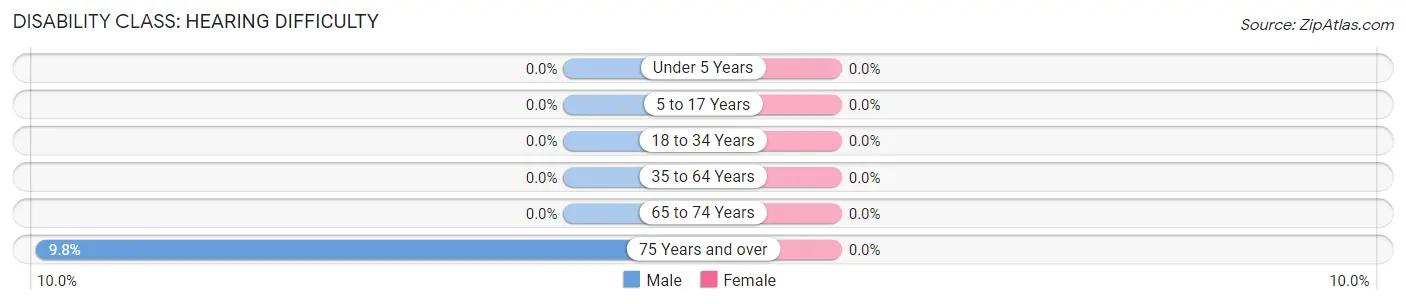
| Age Bracket | Male | Female |
| Under 5 Years | 0 (0.0%) | 0 (0.0%) |
| 5 to 17 Years | 0 (0.0%) | 0 (0.0%) |
| 18 to 34 Years | 0 (0.0%) | 0 (0.0%) |
| 35 to 64 Years | 0 (0.0%) | 0 (0.0%) |
| 65 to 74 Years | 0 (0.0%) | 0 (0.0%) |
| 75 Years and over | 14 (9.8%) | 0 (0.0%) |
Disability Class: Vision Difficulty
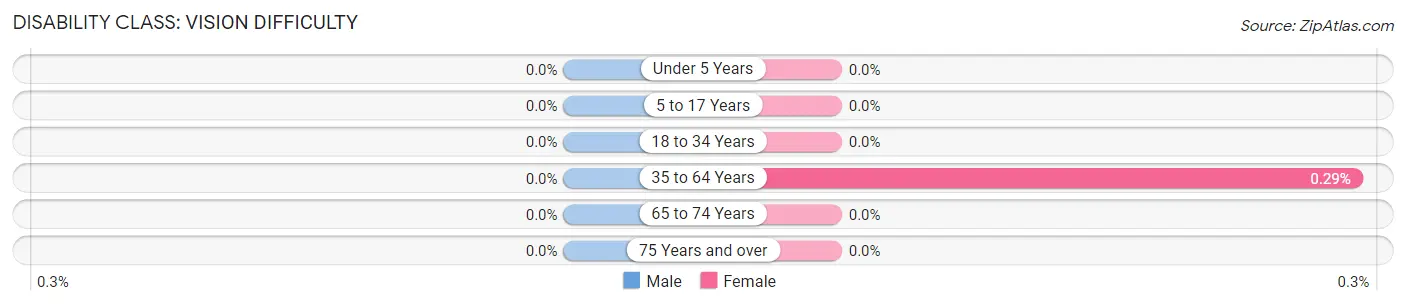
| Age Bracket | Male | Female |
| Under 5 Years | 0 (0.0%) | 0 (0.0%) |
| 5 to 17 Years | 0 (0.0%) | 0 (0.0%) |
| 18 to 34 Years | 0 (0.0%) | 0 (0.0%) |
| 35 to 64 Years | 0 (0.0%) | 1 (0.3%) |
| 65 to 74 Years | 0 (0.0%) | 0 (0.0%) |
| 75 Years and over | 0 (0.0%) | 0 (0.0%) |
Disability Class: Cognitive Difficulty
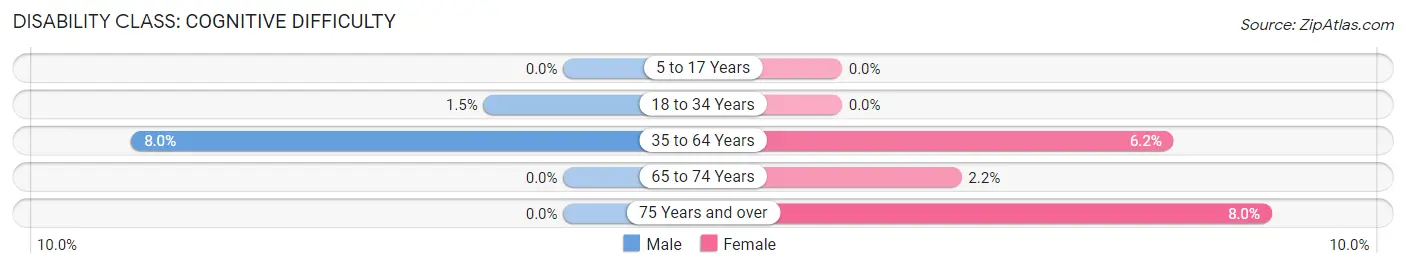
| Age Bracket | Male | Female |
| 5 to 17 Years | 0 (0.0%) | 0 (0.0%) |
| 18 to 34 Years | 2 (1.5%) | 0 (0.0%) |
| 35 to 64 Years | 32 (8.0%) | 21 (6.2%) |
| 65 to 74 Years | 0 (0.0%) | 2 (2.2%) |
| 75 Years and over | 0 (0.0%) | 17 (8.0%) |
Disability Class: Ambulatory Difficulty
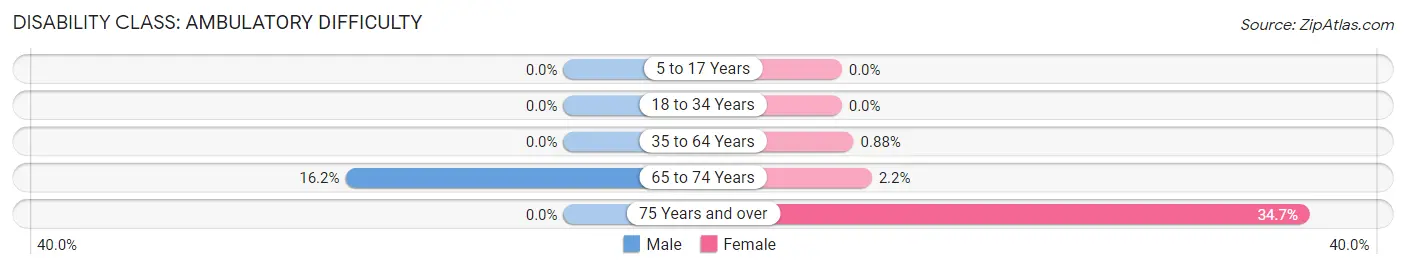
| Age Bracket | Male | Female |
| 5 to 17 Years | 0 (0.0%) | 0 (0.0%) |
| 18 to 34 Years | 0 (0.0%) | 0 (0.0%) |
| 35 to 64 Years | 0 (0.0%) | 3 (0.9%) |
| 65 to 74 Years | 17 (16.2%) | 2 (2.2%) |
| 75 Years and over | 0 (0.0%) | 74 (34.7%) |
Disability Class: Self-Care Difficulty
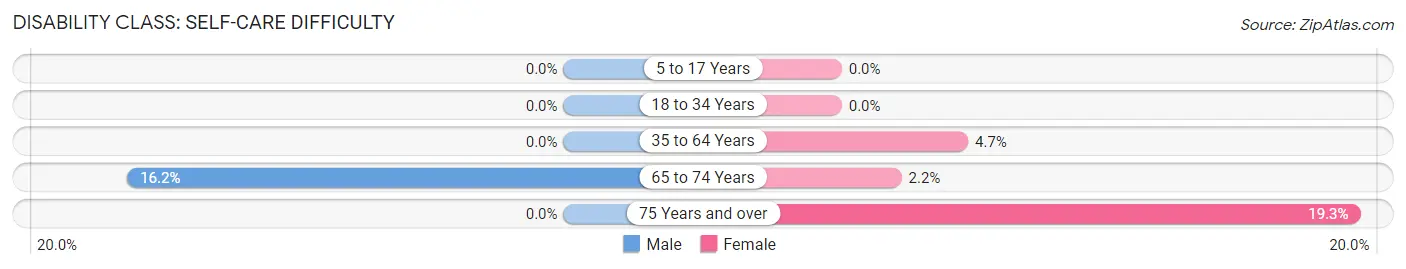
| Age Bracket | Male | Female |
| 5 to 17 Years | 0 (0.0%) | 0 (0.0%) |
| 18 to 34 Years | 0 (0.0%) | 0 (0.0%) |
| 35 to 64 Years | 0 (0.0%) | 16 (4.7%) |
| 65 to 74 Years | 17 (16.2%) | 2 (2.2%) |
| 75 Years and over | 0 (0.0%) | 41 (19.3%) |
Technology Access in Town Line
Computing Device Access in Town Line
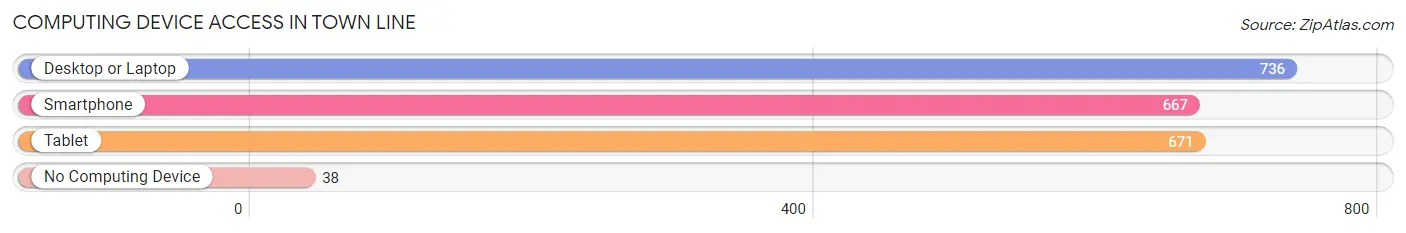
| Device Type | # Households | % Households |
| Desktop or Laptop | 736 | 90.9% |
| Smartphone | 667 | 82.4% |
| Tablet | 671 | 82.8% |
| No Computing Device | 38 | 4.7% |
| Total | 810 | 100.0% |
Internet Access in Town Line
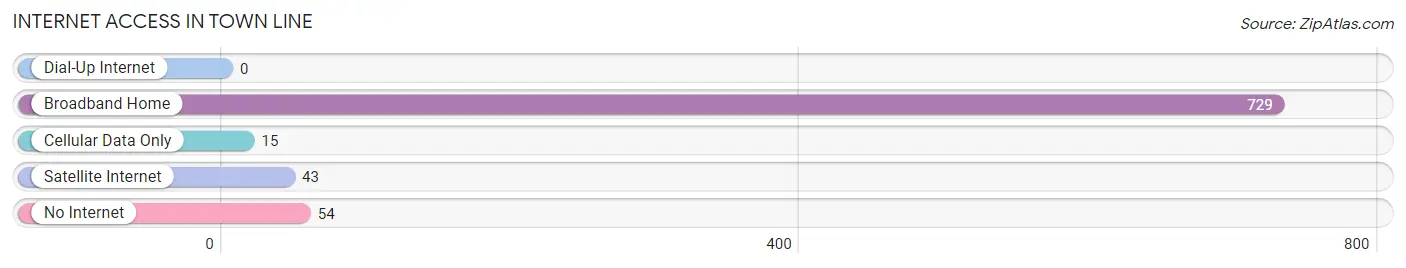
| Internet Type | # Households | % Households |
| Dial-Up Internet | 0 | 0.0% |
| Broadband Home | 729 | 90.0% |
| Cellular Data Only | 15 | 1.8% |
| Satellite Internet | 43 | 5.3% |
| No Internet | 54 | 6.7% |
| Total | 810 | 100.0% |
Town Line Summary
Town Line is a small town located in the western part of New York State, in the county of Erie. It is situated on the border of the towns of Hamburg and Eden, and is part of the Buffalo-Niagara Falls metropolitan area. The town has a population of approximately 1,500 people, and is home to a variety of businesses, including a few small manufacturing companies.
History
The area that is now Town Line was first settled in the early 1800s by a group of German immigrants. The town was originally known as “Hamburg Line”, and was part of the town of Hamburg. In 1845, the town was officially incorporated as “Town Line”.
The town was primarily an agricultural community for much of its history, with the main crops being wheat, corn, and potatoes. In the late 1800s, the town began to develop a small manufacturing industry, with several small factories producing furniture, clothing, and other goods.
In the early 1900s, the town began to experience a population boom, as many people moved to the area to take advantage of the growing manufacturing industry. This population growth continued until the mid-1900s, when the manufacturing industry began to decline.
Geography
Town Line is located in the western part of New York State, in the county of Erie. It is situated on the border of the towns of Hamburg and Eden, and is part of the Buffalo-Niagara Falls metropolitan area. The town is located on the banks of the Buffalo River, and is surrounded by rolling hills and farmland.
The town has a total area of 2.2 square miles, all of which is land. The town is located at an elevation of 890 feet above sea level.
Economy
The economy of Town Line is primarily based on agriculture and manufacturing. The town is home to several small manufacturing companies, which produce a variety of goods, including furniture, clothing, and other items.
The town also has a few small businesses, including a few restaurants, a grocery store, and a few other retail stores. The town also has a few small farms, which produce a variety of crops, including wheat, corn, and potatoes.
Demographics
As of the 2010 census, the population of Town Line was 1,500 people. The racial makeup of the town was 97.3% White, 0.7% African American, 0.3% Native American, 0.3% Asian, and 1.3% from other races.
The median household income in Town Line was $45,000, and the median family income was $50,000. The per capita income in Town Line was $20,000. About 8.3% of the population was below the poverty line.
Conclusion
Town Line is a small town located in the western part of New York State, in the county of Erie. It is situated on the border of the towns of Hamburg and Eden, and is part of the Buffalo-Niagara Falls metropolitan area. The town has a population of approximately 1,500 people, and is home to a variety of businesses, including a few small manufacturing companies. The economy of Town Line is primarily based on agriculture and manufacturing, and the town has a median household income of $45,000.
Common Questions
What is Per Capita Income in Town Line?
Per Capita income in Town Line is $41,012.
What is the Median Family Income in Town Line?
Median Family Income in Town Line is $97,188.
What is the Median Household income in Town Line?
Median Household Income in Town Line is $95,089.
What is Income or Wage Gap in Town Line?
Income or Wage Gap in Town Line is 23.3%.
Women in Town Line earn 76.7 cents for every dollar earned by a man.
What is Inequality or Gini Index in Town Line?
Inequality or Gini Index in Town Line is 0.30.
What is the Total Population of Town Line?
Total Population of Town Line is 1,951.
What is the Total Male Population of Town Line?
Total Male Population of Town Line is 916.
What is the Total Female Population of Town Line?
Total Female Population of Town Line is 1,035.
What is the Ratio of Males per 100 Females in Town Line?
There are 88.50 Males per 100 Females in Town Line.
What is the Ratio of Females per 100 Males in Town Line?
There are 112.99 Females per 100 Males in Town Line.
What is the Median Population Age in Town Line?
Median Population Age in Town Line is 48.3 Years.
What is the Average Family Size in Town Line
Average Family Size in Town Line is 2.7 People.
What is the Average Household Size in Town Line
Average Household Size in Town Line is 2.4 People.
How Large is the Labor Force in Town Line?
There are 947 People in the Labor Forcein in Town Line.
What is the Percentage of People in the Labor Force in Town Line?
55.9% of People are in the Labor Force in Town Line.
What is the Unemployment Rate in Town Line?
Unemployment Rate in Town Line is 1.7%.