South Nyack, NY Map & Demographics
South Nyack Map
South Nyack Overview
$57,269
PER CAPITA INCOME
$118,750
AVG FAMILY INCOME
$113,558
AVG HOUSEHOLD INCOME
4.9%
WAGE / INCOME GAP [ % ]
95.1¢/ $1
WAGE / INCOME GAP [ $ ]
0.46
INEQUALITY / GINI INDEX
2,745
TOTAL POPULATION
1,070
MALE POPULATION
1,675
FEMALE POPULATION
63.88
MALES / 100 FEMALES
156.54
FEMALES / 100 MALES
38.2
MEDIAN AGE
2.5
AVG FAMILY SIZE
2.1
AVG HOUSEHOLD SIZE
1,676
LABOR FORCE [ PEOPLE ]
68.6%
PERCENT IN LABOR FORCE
9.7%
UNEMPLOYMENT RATE
Income in South Nyack
Income Overview in South Nyack
Per Capita Income in South Nyack is $57,269, while median incomes of families and households are $118,750 and $113,558 respectively.
| Characteristic | Number | Measure |
| Per Capita Income | 2,745 | $57,269 |
| Median Family Income | 645 | $118,750 |
| Mean Family Income | 645 | $162,140 |
| Median Household Income | 1,032 | $113,558 |
| Mean Household Income | 1,032 | $149,867 |
| Income Deficit | 645 | $0 |
| Wage / Income Gap (%) | 2,745 | 4.92% |
| Wage / Income Gap ($) | 2,745 | 95.08¢ per $1 |
| Gini / Inequality Index | 2,745 | 0.46 |
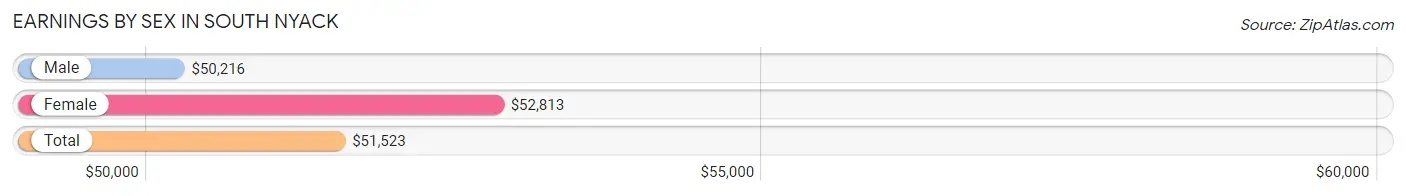
Earnings by Sex in South Nyack
Average Earnings in South Nyack are $51,523, $50,216 for men and $52,813 for women, a difference of 4.9%.
| Sex | Number | Average Earnings |
| Male | 765 (41.3%) | $50,216 |
| Female | 1,089 (58.7%) | $52,813 |
| Total | 1,854 (100.0%) | $51,523 |
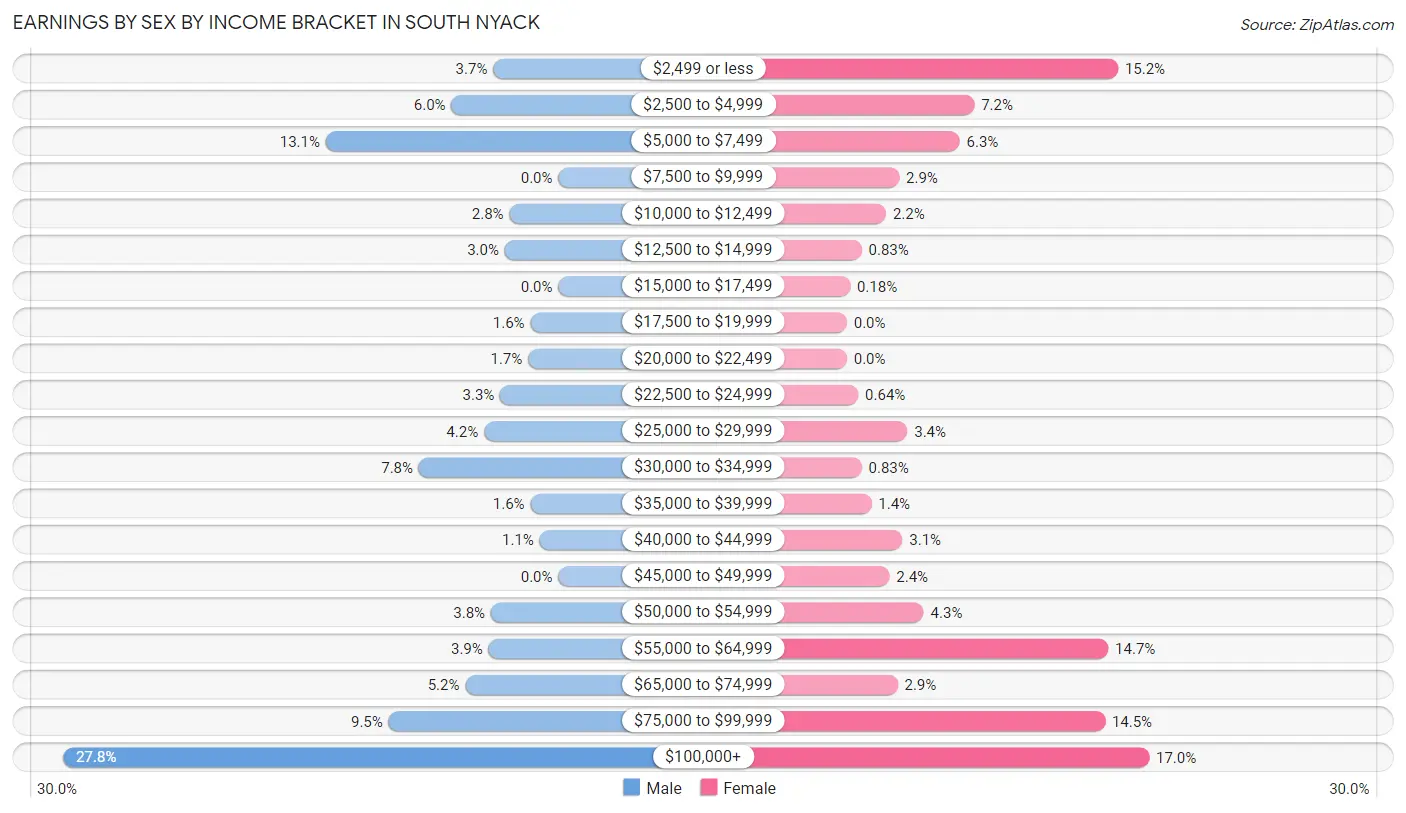
Earnings by Sex by Income Bracket in South Nyack
The most common earnings brackets in South Nyack are $100,000+ for men (213 | 27.8%) and $100,000+ for women (185 | 17.0%).
| Income | Male | Female |
| $2,499 or less | 28 (3.7%) | 166 (15.2%) |
| $2,500 to $4,999 | 46 (6.0%) | 78 (7.2%) |
| $5,000 to $7,499 | 100 (13.1%) | 69 (6.3%) |
| $7,500 to $9,999 | 0 (0.0%) | 32 (2.9%) |
| $10,000 to $12,499 | 21 (2.8%) | 24 (2.2%) |
| $12,500 to $14,999 | 23 (3.0%) | 9 (0.8%) |
| $15,000 to $17,499 | 0 (0.0%) | 2 (0.2%) |
| $17,500 to $19,999 | 12 (1.6%) | 0 (0.0%) |
| $20,000 to $22,499 | 13 (1.7%) | 0 (0.0%) |
| $22,500 to $24,999 | 25 (3.3%) | 7 (0.6%) |
| $25,000 to $29,999 | 32 (4.2%) | 37 (3.4%) |
| $30,000 to $34,999 | 60 (7.8%) | 9 (0.8%) |
| $35,000 to $39,999 | 12 (1.6%) | 15 (1.4%) |
| $40,000 to $44,999 | 8 (1.1%) | 34 (3.1%) |
| $45,000 to $49,999 | 0 (0.0%) | 26 (2.4%) |
| $50,000 to $54,999 | 29 (3.8%) | 47 (4.3%) |
| $55,000 to $64,999 | 30 (3.9%) | 160 (14.7%) |
| $65,000 to $74,999 | 40 (5.2%) | 31 (2.9%) |
| $75,000 to $99,999 | 73 (9.5%) | 158 (14.5%) |
| $100,000+ | 213 (27.8%) | 185 (17.0%) |
| Total | 765 (100.0%) | 1,089 (100.0%) |
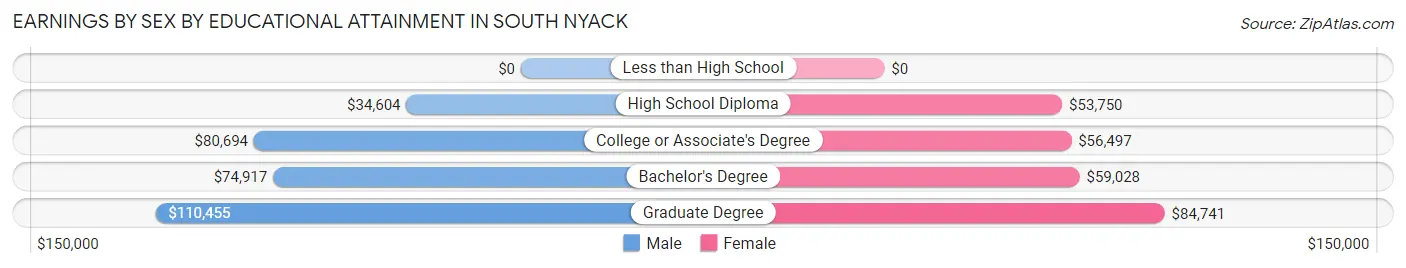
Earnings by Sex by Educational Attainment in South Nyack
Average earnings in South Nyack are $76,389 for men and $62,670 for women, a difference of 18.0%. Men with an educational attainment of graduate degree enjoy the highest average annual earnings of $110,455, while those with high school diploma education earn the least with $34,604. Women with an educational attainment of graduate degree earn the most with the average annual earnings of $84,741, while those with high school diploma education have the smallest earnings of $53,750.
| Educational Attainment | Male Income | Female Income |
| Less than High School | - | - |
| High School Diploma | $34,604 | $53,750 |
| College or Associate's Degree | $80,694 | $56,497 |
| Bachelor's Degree | $74,917 | $59,028 |
| Graduate Degree | $110,455 | $84,741 |
| Total | $76,389 | $62,670 |
Family Income in South Nyack
Family Income Brackets in South Nyack
According to the South Nyack family income data, there are 150 families falling into the $200,000+ income range, which is the most common income bracket and makes up 23.3% of all families.
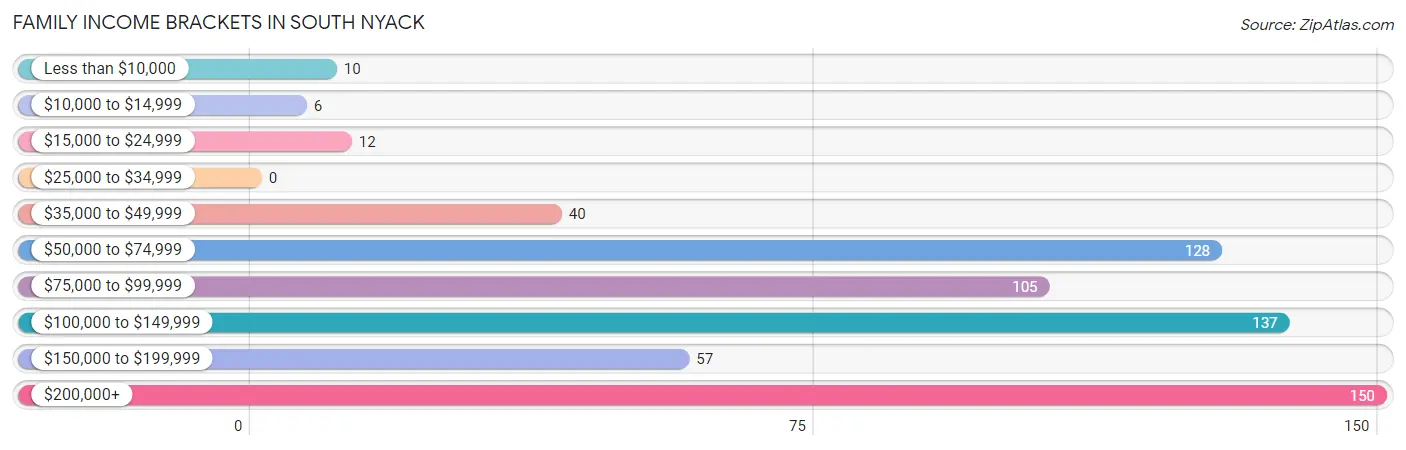
| Income Bracket | # Families | % Families |
| Less than $10,000 | 10 | 1.6% |
| $10,000 to $14,999 | 6 | 0.9% |
| $15,000 to $24,999 | 12 | 1.9% |
| $25,000 to $34,999 | 0 | 0.0% |
| $35,000 to $49,999 | 40 | 6.2% |
| $50,000 to $74,999 | 128 | 19.8% |
| $75,000 to $99,999 | 105 | 16.3% |
| $100,000 to $149,999 | 137 | 21.2% |
| $150,000 to $199,999 | 57 | 8.8% |
| $200,000+ | 150 | 23.3% |
Family Income by Famaliy Size in South Nyack
4-person families (87 | 13.5%) account for the highest median family income in South Nyack with $176,250 per family, while 3-person families (91 | 14.1%) have the highest median income of $48,109 per family member.
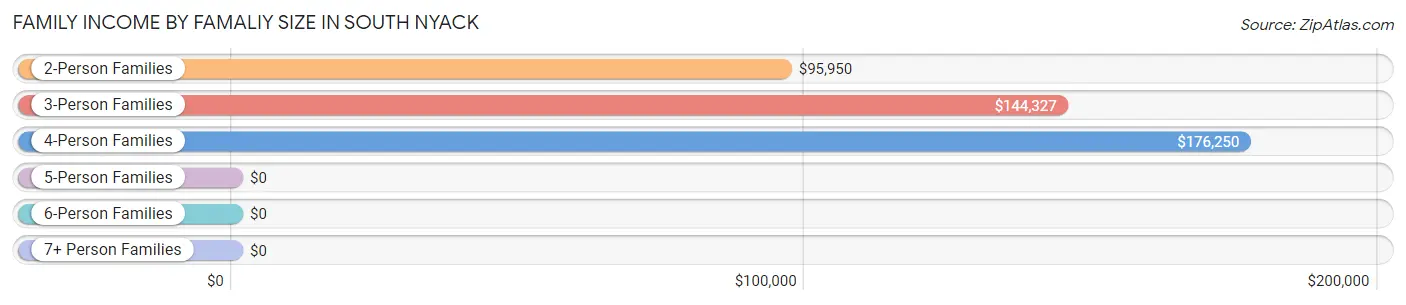
| Income Bracket | # Families | Median Income |
| 2-Person Families | 455 (70.5%) | $95,950 |
| 3-Person Families | 91 (14.1%) | $144,327 |
| 4-Person Families | 87 (13.5%) | $176,250 |
| 5-Person Families | 12 (1.9%) | $0 |
| 6-Person Families | 0 (0.0%) | $0 |
| 7+ Person Families | 0 (0.0%) | $0 |
| Total | 645 (100.0%) | $118,750 |
Family Income by Number of Earners in South Nyack
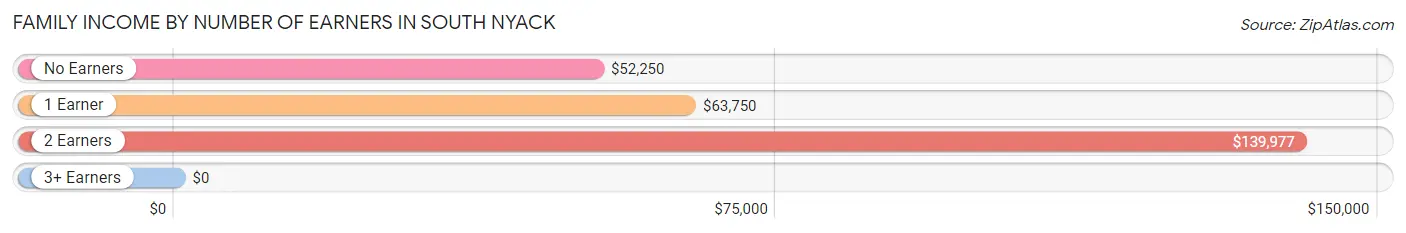
| Number of Earners | # Families | Median Income |
| No Earners | 95 (14.7%) | $52,250 |
| 1 Earner | 218 (33.8%) | $63,750 |
| 2 Earners | 317 (49.1%) | $139,977 |
| 3+ Earners | 15 (2.3%) | $0 |
| Total | 645 (100.0%) | $118,750 |
Household Income in South Nyack
Household Income Brackets in South Nyack
With 239 households falling in the category, the $200,000+ income range is the most frequent in South Nyack, accounting for 23.2% of all households. In contrast, only 1 households (0.1%) fall into the less than $10,000 income bracket, making it the least populous group.
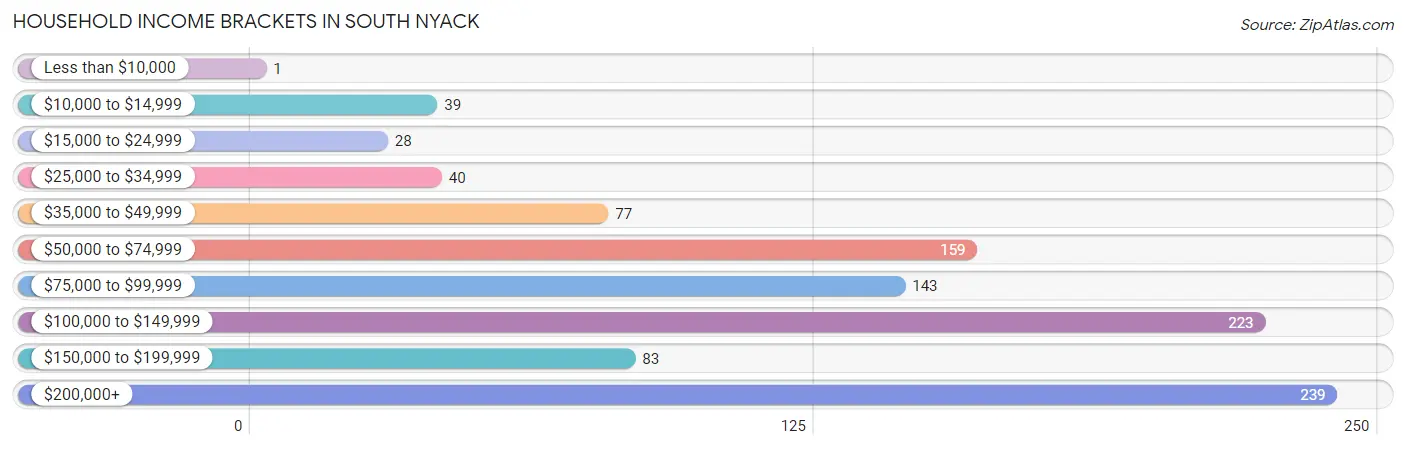
| Income Bracket | # Households | % Households |
| Less than $10,000 | 1 | 0.1% |
| $10,000 to $14,999 | 39 | 3.8% |
| $15,000 to $24,999 | 28 | 2.7% |
| $25,000 to $34,999 | 40 | 3.9% |
| $35,000 to $49,999 | 77 | 7.5% |
| $50,000 to $74,999 | 159 | 15.4% |
| $75,000 to $99,999 | 143 | 13.9% |
| $100,000 to $149,999 | 223 | 21.6% |
| $150,000 to $199,999 | 83 | 8.0% |
| $200,000+ | 239 | 23.2% |
Household Income by Householder Age in South Nyack
The median household income in South Nyack is $113,558, with the highest median household income of $138,636 found in the 45 to 64 years age bracket for the primary householder. A total of 416 households (40.3%) fall into this category.
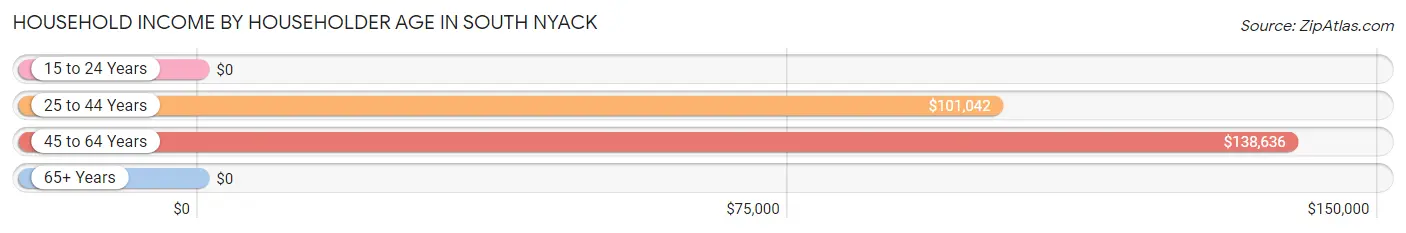
| Income Bracket | # Households | Median Income |
| 15 to 24 Years | 0 (0.0%) | $0 |
| 25 to 44 Years | 339 (32.9%) | $101,042 |
| 45 to 64 Years | 416 (40.3%) | $138,636 |
| 65+ Years | 277 (26.8%) | $0 |
| Total | 1,032 (100.0%) | $113,558 |
Poverty in South Nyack
Income Below Poverty by Sex and Age in South Nyack
With 2.4% poverty level for males and 5.2% for females among the residents of South Nyack, 18 to 24 year old males and under 5 year old females are the most vulnerable to poverty, with 7 males (22.6%) and 12 females (20.7%) in their respective age groups living below the poverty level.
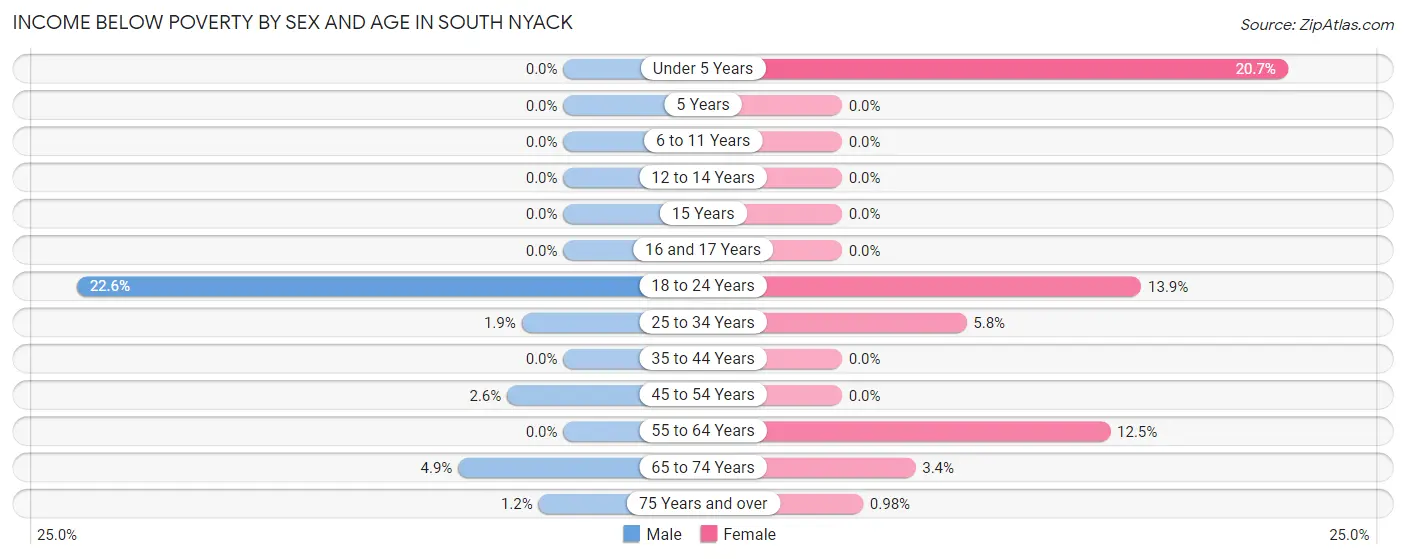
| Age Bracket | Male | Female |
| Under 5 Years | 0 (0.0%) | 12 (20.7%) |
| 5 Years | 0 (0.0%) | 0 (0.0%) |
| 6 to 11 Years | 0 (0.0%) | 0 (0.0%) |
| 12 to 14 Years | 0 (0.0%) | 0 (0.0%) |
| 15 Years | 0 (0.0%) | 0 (0.0%) |
| 16 and 17 Years | 0 (0.0%) | 0 (0.0%) |
| 18 to 24 Years | 7 (22.6%) | 10 (13.9%) |
| 25 to 34 Years | 2 (1.9%) | 10 (5.8%) |
| 35 to 44 Years | 0 (0.0%) | 0 (0.0%) |
| 45 to 54 Years | 3 (2.6%) | 0 (0.0%) |
| 55 to 64 Years | 0 (0.0%) | 33 (12.4%) |
| 65 to 74 Years | 6 (4.9%) | 6 (3.4%) |
| 75 Years and over | 1 (1.1%) | 1 (1.0%) |
| Total | 19 (2.4%) | 72 (5.2%) |
Income Above Poverty by Sex and Age in South Nyack
According to the poverty statistics in South Nyack, males aged under 5 years and females aged 5 years are the age groups that are most secure financially, with 100.0% of males and 100.0% of females in these age groups living above the poverty line.
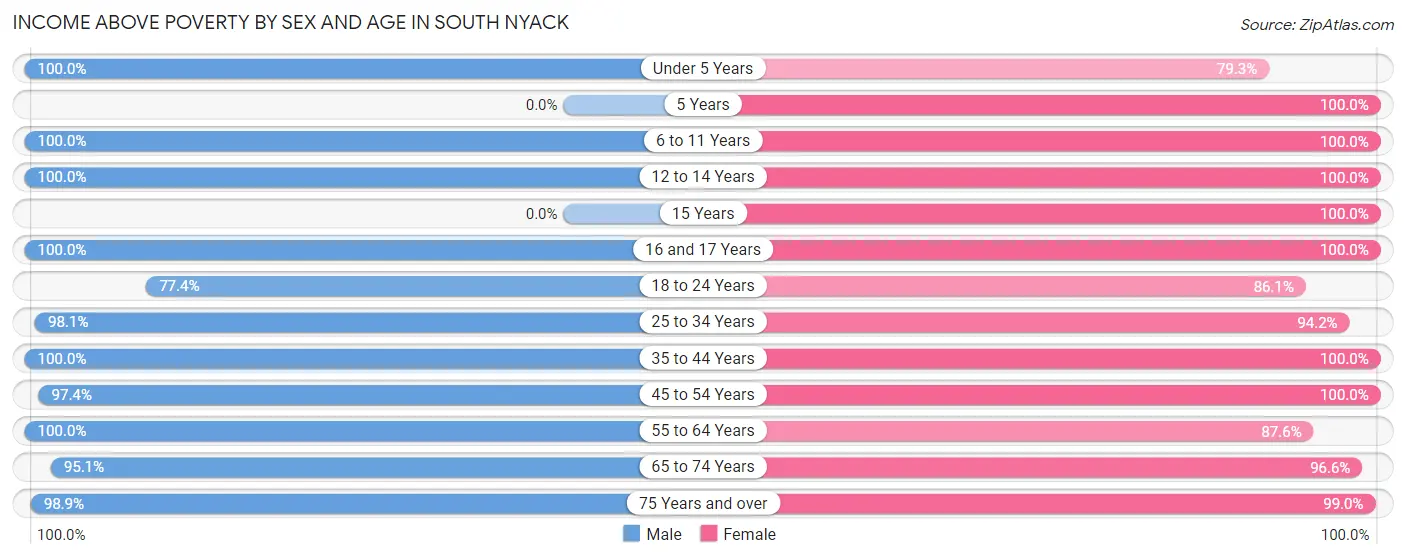
| Age Bracket | Male | Female |
| Under 5 Years | 43 (100.0%) | 46 (79.3%) |
| 5 Years | 0 (0.0%) | 80 (100.0%) |
| 6 to 11 Years | 26 (100.0%) | 51 (100.0%) |
| 12 to 14 Years | 16 (100.0%) | 14 (100.0%) |
| 15 Years | 0 (0.0%) | 5 (100.0%) |
| 16 and 17 Years | 5 (100.0%) | 10 (100.0%) |
| 18 to 24 Years | 24 (77.4%) | 62 (86.1%) |
| 25 to 34 Years | 101 (98.1%) | 163 (94.2%) |
| 35 to 44 Years | 141 (100.0%) | 225 (100.0%) |
| 45 to 54 Years | 112 (97.4%) | 163 (100.0%) |
| 55 to 64 Years | 97 (100.0%) | 232 (87.5%) |
| 65 to 74 Years | 117 (95.1%) | 170 (96.6%) |
| 75 Years and over | 86 (98.9%) | 101 (99.0%) |
| Total | 768 (97.6%) | 1,322 (94.8%) |
Income Below Poverty Among Married-Couple Families in South Nyack
The poverty statistics for married-couple families in South Nyack show that 1.5% or 6 of the total 394 families live below the poverty line. Families with no children have the highest poverty rate of 2.4%, comprising of 6 families. On the other hand, families with 1 or 2 children have the lowest poverty rate of 0.0%, which includes 0 families.
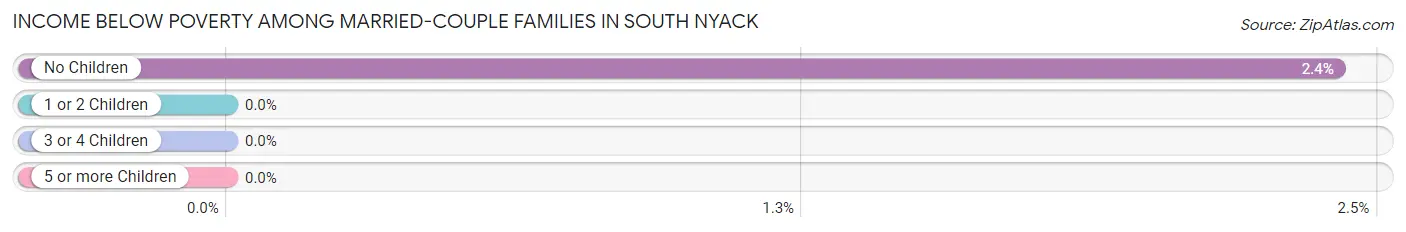
| Children | Above Poverty | Below Poverty |
| No Children | 243 (97.6%) | 6 (2.4%) |
| 1 or 2 Children | 133 (100.0%) | 0 (0.0%) |
| 3 or 4 Children | 12 (100.0%) | 0 (0.0%) |
| 5 or more Children | 0 (0.0%) | 0 (0.0%) |
| Total | 388 (98.5%) | 6 (1.5%) |
Income Below Poverty Among Single-Parent Households in South Nyack
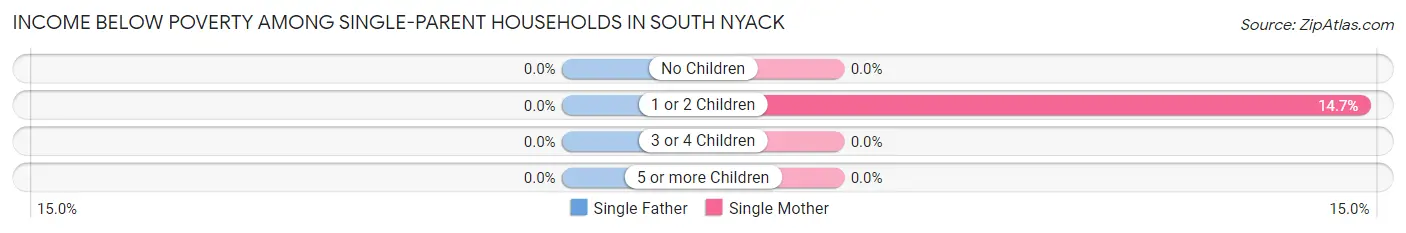
| Children | Single Father | Single Mother |
| No Children | 0 (0.0%) | 0 (0.0%) |
| 1 or 2 Children | 0 (0.0%) | 10 (14.7%) |
| 3 or 4 Children | 0 (0.0%) | 0 (0.0%) |
| 5 or more Children | 0 (0.0%) | 0 (0.0%) |
| Total | 0 (0.0%) | 10 (4.2%) |
Income Below Poverty Among Married-Couple vs Single-Parent Households in South Nyack
The poverty data for South Nyack shows that 6 of the married-couple family households (1.5%) and 10 of the single-parent households (4.0%) are living below the poverty level. Within the married-couple family households, those with no children have the highest poverty rate, with 6 households (2.4%) falling below the poverty line. Among the single-parent households, those with 1 or 2 children have the highest poverty rate, with 10 household (14.7%) living below poverty.
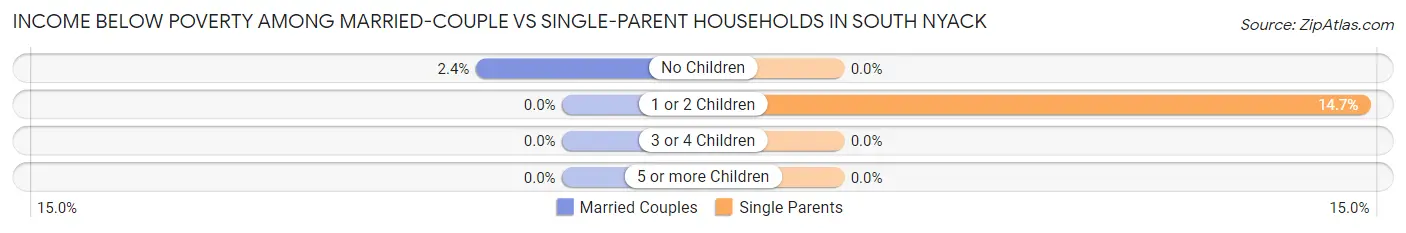
| Children | Married-Couple Families | Single-Parent Households |
| No Children | 6 (2.4%) | 0 (0.0%) |
| 1 or 2 Children | 0 (0.0%) | 10 (14.7%) |
| 3 or 4 Children | 0 (0.0%) | 0 (0.0%) |
| 5 or more Children | 0 (0.0%) | 0 (0.0%) |
| Total | 6 (1.5%) | 10 (4.0%) |
Race in South Nyack
The most populous races in South Nyack are White / Caucasian (1,645 | 59.9%), Black / African American (516 | 18.8%), and Hispanic or Latino (437 | 15.9%).
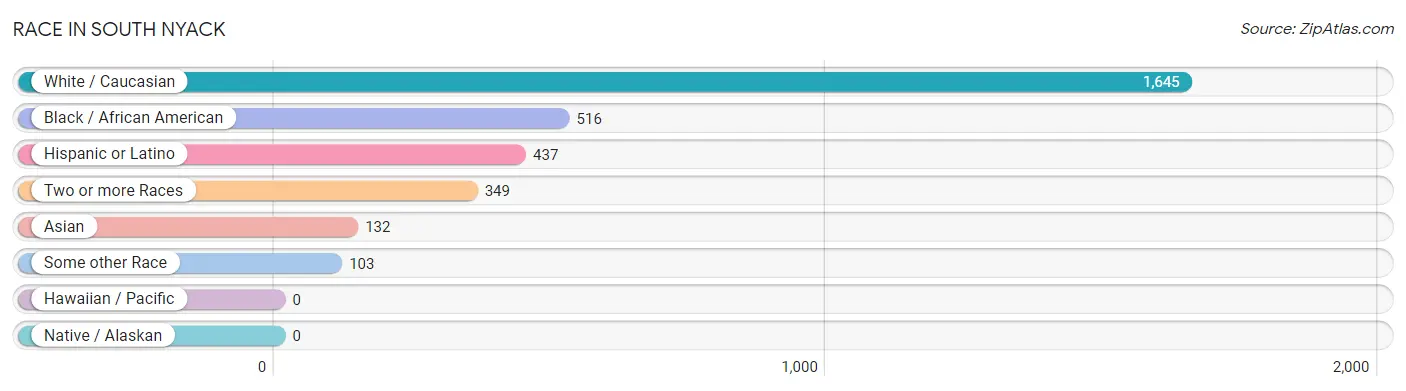
| Race | # Population | % Population |
| Asian | 132 | 4.8% |
| Black / African American | 516 | 18.8% |
| Hawaiian / Pacific | 0 | 0.0% |
| Hispanic or Latino | 437 | 15.9% |
| Native / Alaskan | 0 | 0.0% |
| White / Caucasian | 1,645 | 59.9% |
| Two or more Races | 349 | 12.7% |
| Some other Race | 103 | 3.7% |
| Total | 2,745 | 100.0% |
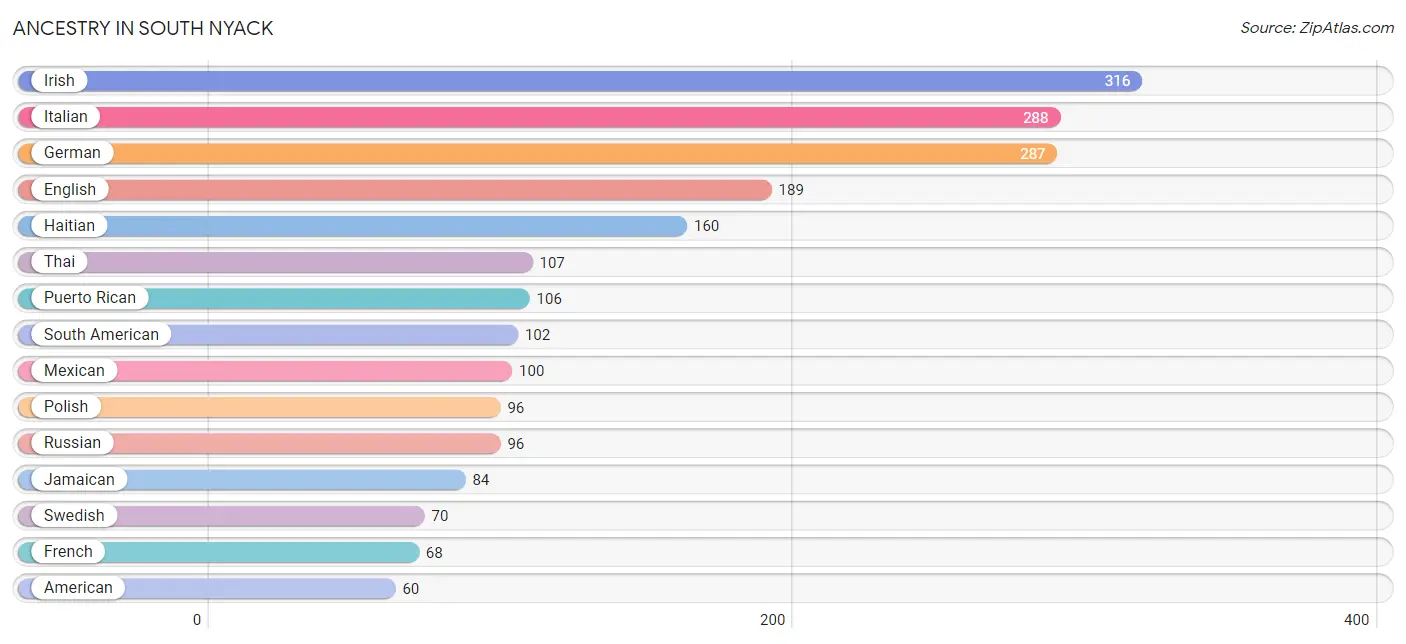
Ancestry in South Nyack
The most populous ancestries reported in South Nyack are Irish (316 | 11.5%), Italian (288 | 10.5%), German (287 | 10.5%), English (189 | 6.9%), and Haitian (160 | 5.8%), together accounting for 45.2% of all South Nyack residents.
| Ancestry | # Population | % Population |
| African | 12 | 0.4% |
| American | 60 | 2.2% |
| Austrian | 25 | 0.9% |
| Bahamian | 20 | 0.7% |
| Bhutanese | 16 | 0.6% |
| Brazilian | 3 | 0.1% |
| British | 31 | 1.1% |
| Bulgarian | 13 | 0.5% |
| Burmese | 13 | 0.5% |
| Canadian | 6 | 0.2% |
| Carpatho Rusyn | 4 | 0.2% |
| Central American | 41 | 1.5% |
| Cherokee | 55 | 2.0% |
| Colombian | 7 | 0.3% |
| Cuban | 10 | 0.4% |
| Czech | 31 | 1.1% |
| Danish | 13 | 0.5% |
| Dominican | 31 | 1.1% |
| Dutch | 53 | 1.9% |
| Eastern European | 23 | 0.8% |
| English | 189 | 6.9% |
| European | 46 | 1.7% |
| Filipino | 3 | 0.1% |
| French | 68 | 2.5% |
| French Canadian | 8 | 0.3% |
| German | 287 | 10.5% |
| Greek | 9 | 0.3% |
| Guyanese | 2 | 0.1% |
| Haitian | 160 | 5.8% |
| Hungarian | 54 | 2.0% |
| Indian (Asian) | 12 | 0.4% |
| Irish | 316 | 11.5% |
| Israeli | 2 | 0.1% |
| Italian | 288 | 10.5% |
| Jamaican | 84 | 3.1% |
| Korean | 19 | 0.7% |
| Latvian | 18 | 0.7% |
| Lithuanian | 18 | 0.7% |
| Mexican | 100 | 3.6% |
| Northern European | 5 | 0.2% |
| Norwegian | 7 | 0.3% |
| Panamanian | 6 | 0.2% |
| Paraguayan | 6 | 0.2% |
| Peruvian | 41 | 1.5% |
| Polish | 96 | 3.5% |
| Portuguese | 21 | 0.8% |
| Puerto Rican | 106 | 3.9% |
| Romanian | 7 | 0.3% |
| Russian | 96 | 3.5% |
| Salvadoran | 35 | 1.3% |
| Scottish | 33 | 1.2% |
| Serbian | 4 | 0.2% |
| Slovak | 13 | 0.5% |
| South African | 7 | 0.3% |
| South American | 102 | 3.7% |
| Spaniard | 4 | 0.2% |
| Subsaharan African | 19 | 0.7% |
| Swedish | 70 | 2.5% |
| Thai | 107 | 3.9% |
| West Indian | 7 | 0.3% | View All 60 Rows |
Immigrants in South Nyack
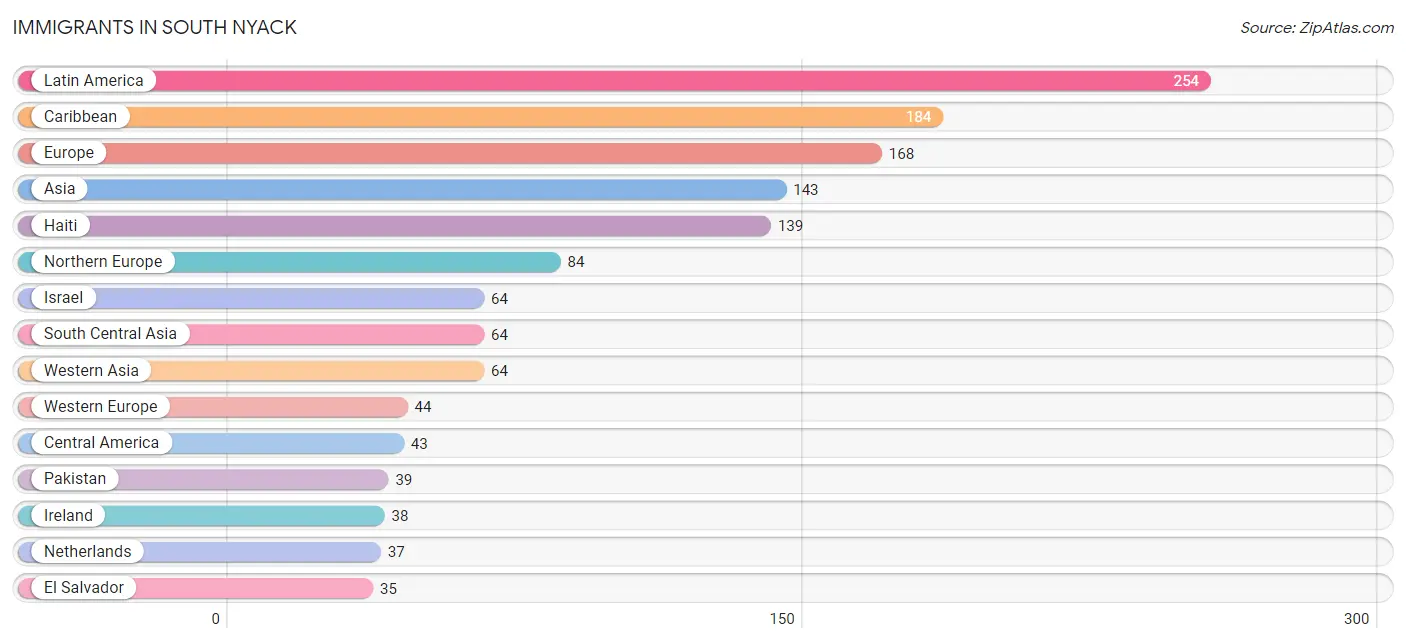
The most numerous immigrant groups reported in South Nyack came from Latin America (254 | 9.2%), Caribbean (184 | 6.7%), Europe (168 | 6.1%), Asia (143 | 5.2%), and Haiti (139 | 5.1%), together accounting for 32.3% of all South Nyack residents.
| Immigration Origin | # Population | % Population |
| Africa | 3 | 0.1% |
| Asia | 143 | 5.2% |
| Bangladesh | 17 | 0.6% |
| Canada | 2 | 0.1% |
| Caribbean | 184 | 6.7% |
| Central America | 43 | 1.6% |
| Colombia | 7 | 0.3% |
| Czechoslovakia | 13 | 0.5% |
| Denmark | 7 | 0.3% |
| Dominican Republic | 7 | 0.3% |
| Eastern Africa | 3 | 0.1% |
| Eastern Asia | 13 | 0.5% |
| Eastern Europe | 27 | 1.0% |
| El Salvador | 35 | 1.3% |
| England | 6 | 0.2% |
| Europe | 168 | 6.1% |
| France | 7 | 0.3% |
| Guyana | 17 | 0.6% |
| Haiti | 139 | 5.1% |
| Honduras | 8 | 0.3% |
| India | 8 | 0.3% |
| Ireland | 38 | 1.4% |
| Israel | 64 | 2.3% |
| Italy | 6 | 0.2% |
| Jamaica | 27 | 1.0% |
| Korea | 13 | 0.5% |
| Latin America | 254 | 9.2% |
| Latvia | 5 | 0.2% |
| Netherlands | 37 | 1.3% |
| Northern Europe | 84 | 3.1% |
| Pakistan | 39 | 1.4% |
| Peru | 3 | 0.1% |
| Philippines | 2 | 0.1% |
| Poland | 9 | 0.3% |
| South America | 27 | 1.0% |
| South Central Asia | 64 | 2.3% |
| South Eastern Asia | 2 | 0.1% |
| Southern Europe | 13 | 0.5% |
| Spain | 7 | 0.3% |
| West Indies | 11 | 0.4% |
| Western Asia | 64 | 2.3% |
| Western Europe | 44 | 1.6% | View All 42 Rows |
Sex and Age in South Nyack
Sex and Age in South Nyack
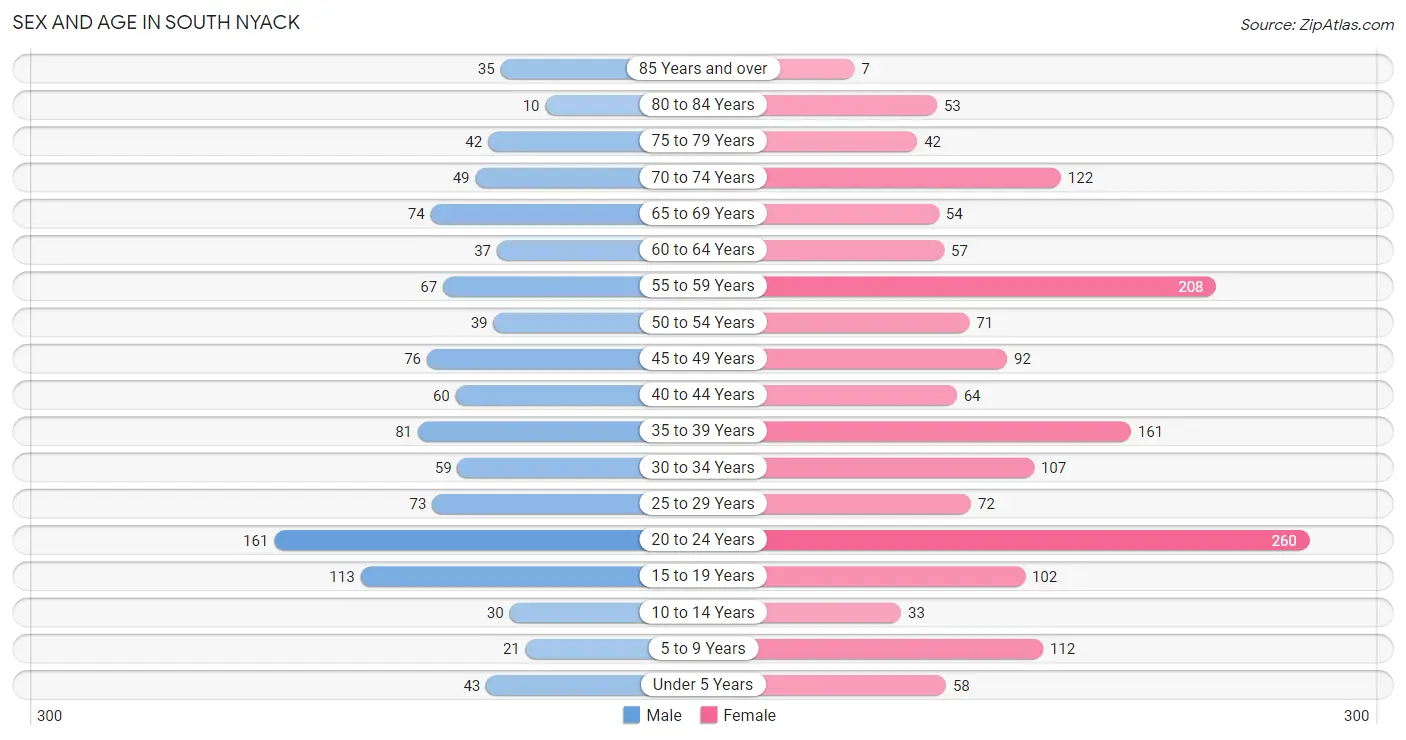
The most populous age groups in South Nyack are 20 to 24 Years (161 | 15.0%) for men and 20 to 24 Years (260 | 15.5%) for women.
| Age Bracket | Male | Female |
| Under 5 Years | 43 (4.0%) | 58 (3.5%) |
| 5 to 9 Years | 21 (2.0%) | 112 (6.7%) |
| 10 to 14 Years | 30 (2.8%) | 33 (2.0%) |
| 15 to 19 Years | 113 (10.6%) | 102 (6.1%) |
| 20 to 24 Years | 161 (15.0%) | 260 (15.5%) |
| 25 to 29 Years | 73 (6.8%) | 72 (4.3%) |
| 30 to 34 Years | 59 (5.5%) | 107 (6.4%) |
| 35 to 39 Years | 81 (7.6%) | 161 (9.6%) |
| 40 to 44 Years | 60 (5.6%) | 64 (3.8%) |
| 45 to 49 Years | 76 (7.1%) | 92 (5.5%) |
| 50 to 54 Years | 39 (3.6%) | 71 (4.2%) |
| 55 to 59 Years | 67 (6.3%) | 208 (12.4%) |
| 60 to 64 Years | 37 (3.5%) | 57 (3.4%) |
| 65 to 69 Years | 74 (6.9%) | 54 (3.2%) |
| 70 to 74 Years | 49 (4.6%) | 122 (7.3%) |
| 75 to 79 Years | 42 (3.9%) | 42 (2.5%) |
| 80 to 84 Years | 10 (0.9%) | 53 (3.2%) |
| 85 Years and over | 35 (3.3%) | 7 (0.4%) |
| Total | 1,070 (100.0%) | 1,675 (100.0%) |
Families and Households in South Nyack
Median Family Size in South Nyack
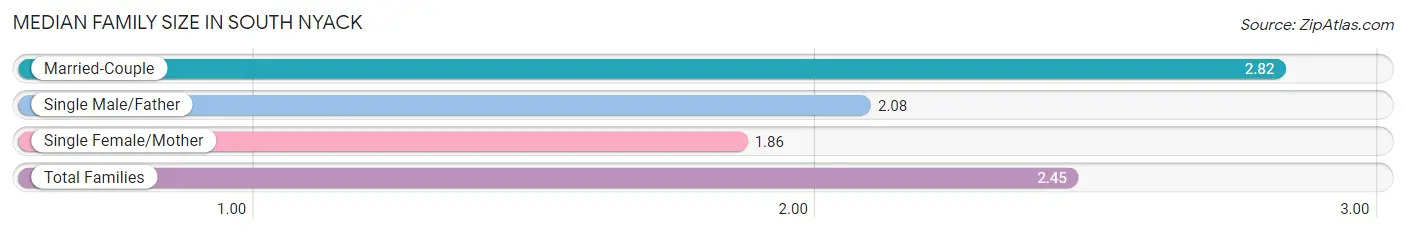
The median family size in South Nyack is 2.45 persons per family, with married-couple families (394 | 61.1%) accounting for the largest median family size of 2.82 persons per family. On the other hand, single female/mother families (239 | 37.0%) represent the smallest median family size with 1.86 persons per family.
| Family Type | # Families | Family Size |
| Married-Couple | 394 (61.1%) | 2.82 |
| Single Male/Father | 12 (1.9%) | 2.08 |
| Single Female/Mother | 239 (37.0%) | 1.86 |
| Total Families | 645 (100.0%) | 2.45 |
Median Household Size in South Nyack
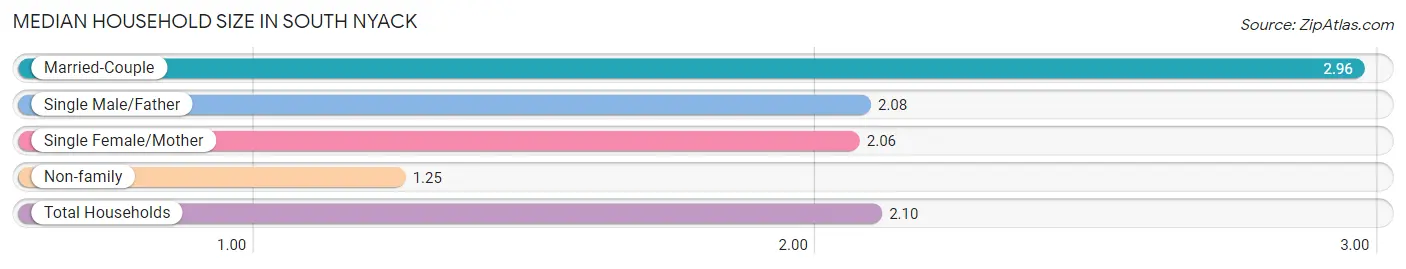
The median household size in South Nyack is 2.10 persons per household, with married-couple households (394 | 38.2%) accounting for the largest median household size of 2.96 persons per household. non-family households (387 | 37.5%) represent the smallest median household size with 1.25 persons per household.
| Household Type | # Households | Household Size |
| Married-Couple | 394 (38.2%) | 2.96 |
| Single Male/Father | 12 (1.2%) | 2.08 |
| Single Female/Mother | 239 (23.2%) | 2.06 |
| Non-family | 387 (37.5%) | 1.25 |
| Total Households | 1,032 (100.0%) | 2.10 |
Household Size by Marriage Status in South Nyack
Out of a total of 1,032 households in South Nyack, 645 (62.5%) are family households, while 387 (37.5%) are nonfamily households. The most numerous type of family households are 2-person households, comprising 412, and the most common type of nonfamily households are 1-person households, comprising 289.
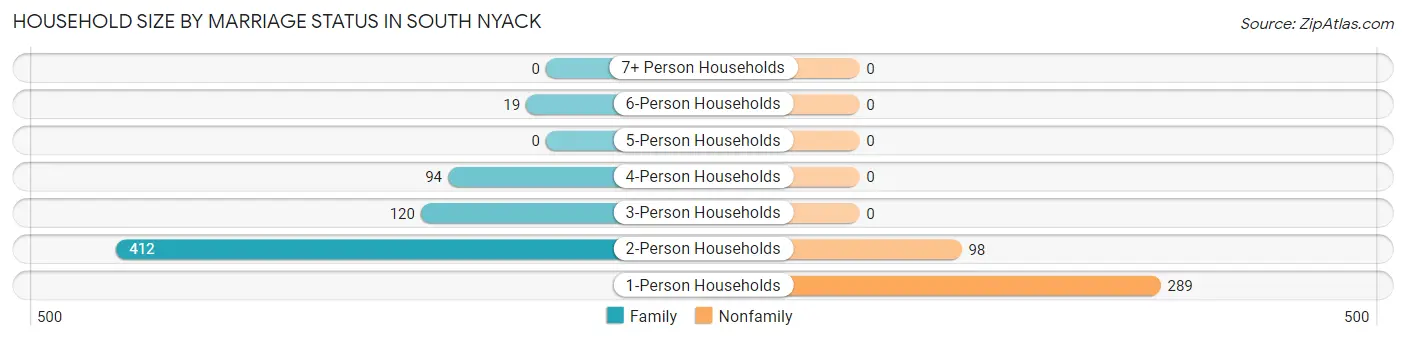
| Household Size | Family Households | Nonfamily Households |
| 1-Person Households | - | 289 (28.0%) |
| 2-Person Households | 412 (39.9%) | 98 (9.5%) |
| 3-Person Households | 120 (11.6%) | 0 (0.0%) |
| 4-Person Households | 94 (9.1%) | 0 (0.0%) |
| 5-Person Households | 0 (0.0%) | 0 (0.0%) |
| 6-Person Households | 19 (1.8%) | 0 (0.0%) |
| 7+ Person Households | 0 (0.0%) | 0 (0.0%) |
| Total | 645 (62.5%) | 387 (37.5%) |
Female Fertility in South Nyack
Fertility by Age in South Nyack
Average fertility rate in South Nyack is 36.0 births per 1,000 women. Women in the age bracket of 20 to 34 years have the highest fertility rate with 41.0 births per 1,000 women. Women in the age bracket of 20 to 34 years acount for 58.1% of all women with births.
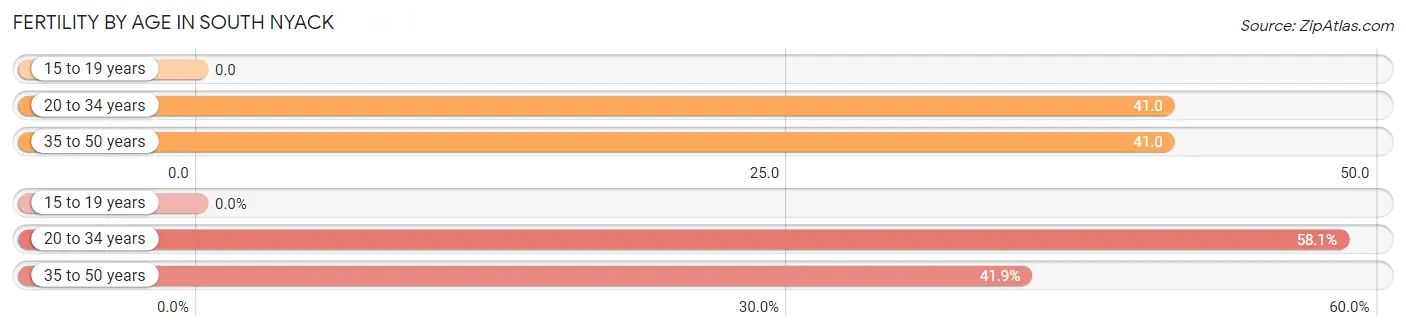
| Age Bracket | Women with Births | Births / 1,000 Women |
| 15 to 19 years | 0 (0.0%) | 0.0 |
| 20 to 34 years | 18 (58.1%) | 41.0 |
| 35 to 50 years | 13 (41.9%) | 41.0 |
| Total | 31 (100.0%) | 36.0 |
Fertility by Age by Marriage Status in South Nyack
67.7% of women with births (31) in South Nyack are married. The highest percentage of unmarried women with births falls into 20 to 34 years age bracket with 55.6% of them unmarried at the time of birth, while the lowest percentage of unmarried women with births belong to 35 to 50 years age bracket with 0.0% of them unmarried.
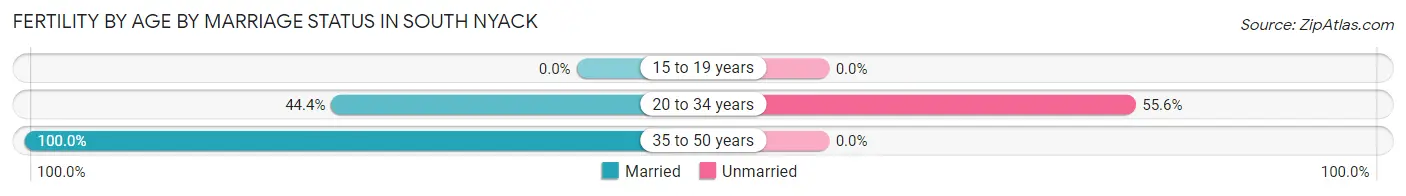
| Age Bracket | Married | Unmarried |
| 15 to 19 years | 0 (0.0%) | 0 (0.0%) |
| 20 to 34 years | 8 (44.4%) | 10 (55.6%) |
| 35 to 50 years | 13 (100.0%) | 0 (0.0%) |
| Total | 21 (67.7%) | 10 (32.3%) |
Fertility by Education in South Nyack
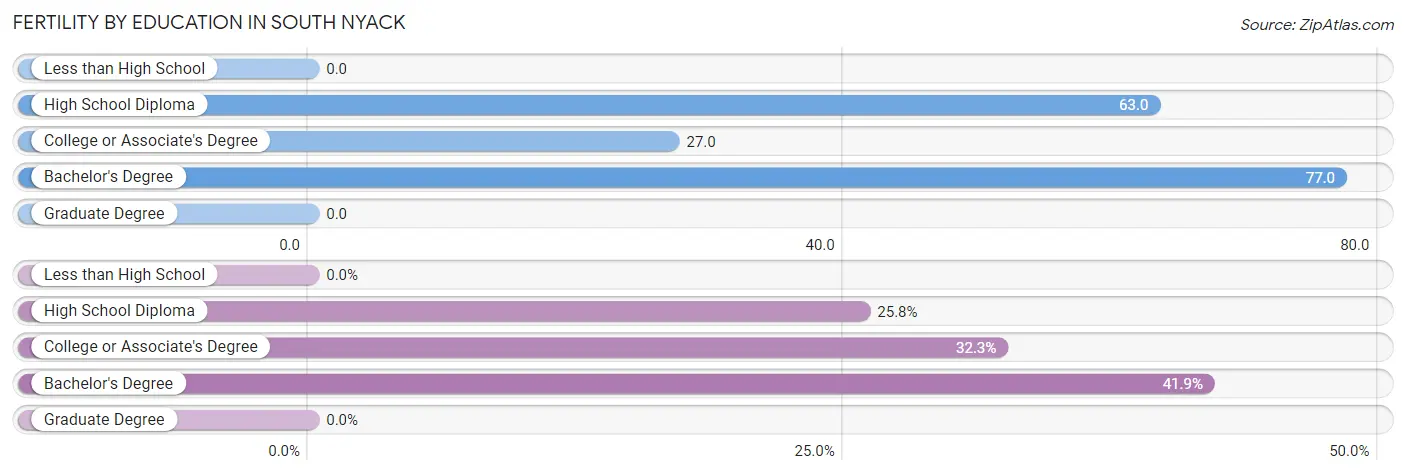
| Educational Attainment | Women with Births | Births / 1,000 Women |
| Less than High School | 0 (0.0%) | 0.0 |
| High School Diploma | 8 (25.8%) | 63.0 |
| College or Associate's Degree | 10 (32.3%) | 27.0 |
| Bachelor's Degree | 13 (41.9%) | 77.0 |
| Graduate Degree | 0 (0.0%) | 0.0 |
| Total | 31 (100.0%) | 36.0 |
Fertility by Education by Marriage Status in South Nyack
32.3% of women with births in South Nyack are unmarried. Women with the educational attainment of high school diploma are most likely to be married with 100.0% of them married at childbirth, while women with the educational attainment of college or associate's degree are least likely to be married with 100.0% of them unmarried at childbirth.
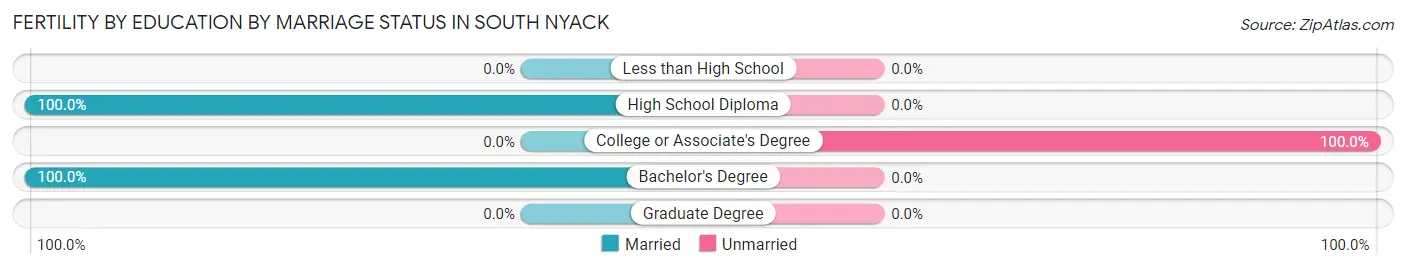
| Educational Attainment | Married | Unmarried |
| Less than High School | 0 (0.0%) | 0 (0.0%) |
| High School Diploma | 8 (100.0%) | 0 (0.0%) |
| College or Associate's Degree | 0 (0.0%) | 10 (100.0%) |
| Bachelor's Degree | 13 (100.0%) | 0 (0.0%) |
| Graduate Degree | 0 (0.0%) | 0 (0.0%) |
| Total | 21 (67.7%) | 10 (32.3%) |
Employment Characteristics in South Nyack
Employment by Class of Employer in South Nyack
Among the 1,496 employed individuals in South Nyack, private company employees (912 | 61.0%), not-for-profit organizations (235 | 15.7%), and local government employees (129 | 8.6%) make up the most common classes of employment.
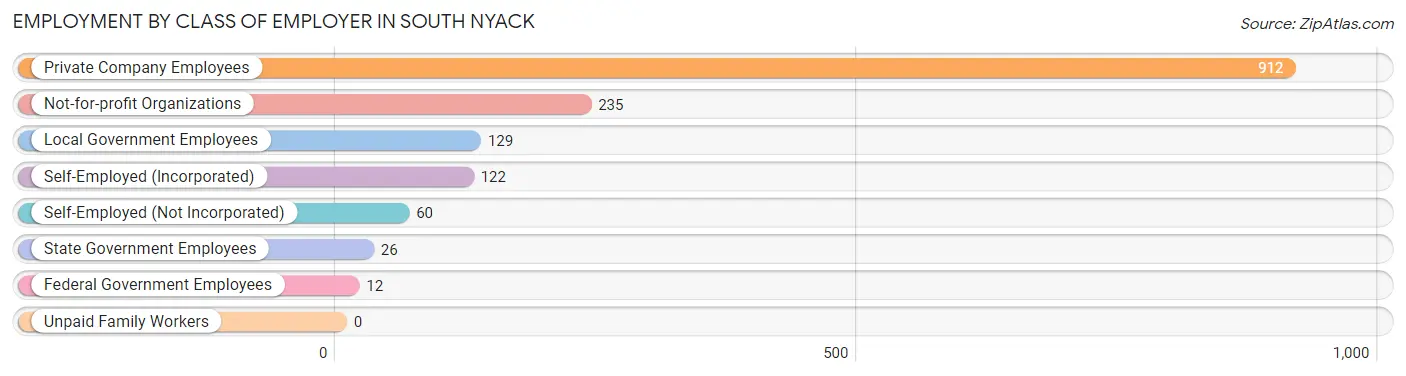
| Employer Class | # Employees | % Employees |
| Private Company Employees | 912 | 61.0% |
| Self-Employed (Incorporated) | 122 | 8.2% |
| Self-Employed (Not Incorporated) | 60 | 4.0% |
| Not-for-profit Organizations | 235 | 15.7% |
| Local Government Employees | 129 | 8.6% |
| State Government Employees | 26 | 1.7% |
| Federal Government Employees | 12 | 0.8% |
| Unpaid Family Workers | 0 | 0.0% |
| Total | 1,496 | 100.0% |
Employment Status by Age in South Nyack
According to the labor force statistics for South Nyack, out of the total population over 16 years of age (2,443), 68.6% or 1,676 individuals are in the labor force, with 9.7% or 163 of them unemployed. The age group with the highest labor force participation rate is 35 to 44 years, with 97.0% or 355 individuals in the labor force. Within the labor force, the 20 to 24 years age range has the highest percentage of unemployed individuals, with 19.1% or 47 of them being unemployed.
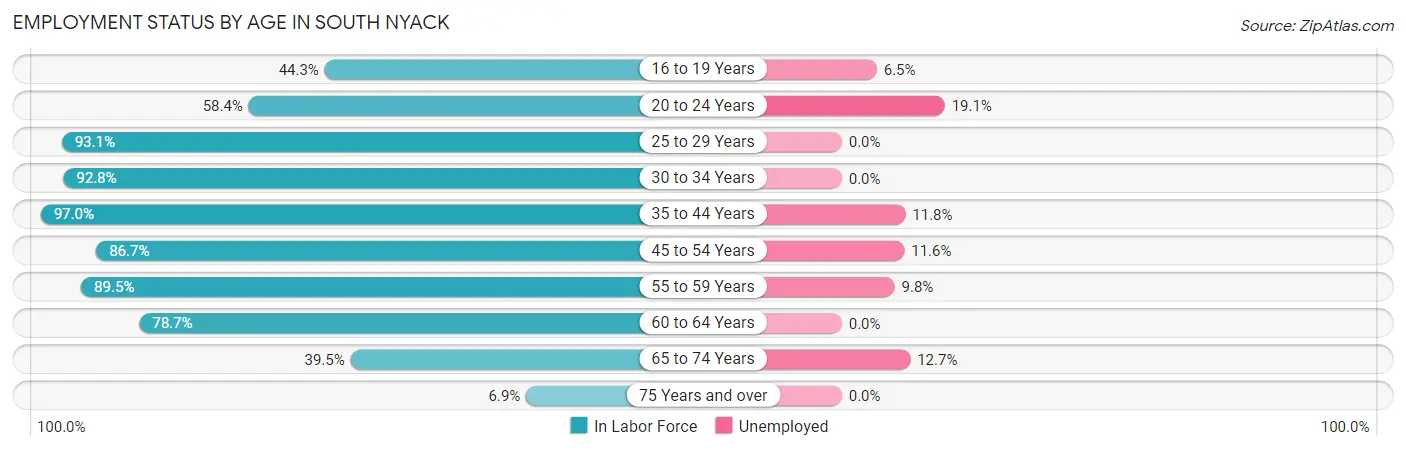
| Age Bracket | In Labor Force | Unemployed |
| 16 to 19 Years | 93 (44.3%) | 6 (6.5%) |
| 20 to 24 Years | 246 (58.4%) | 47 (19.1%) |
| 25 to 29 Years | 135 (93.1%) | 0 (0.0%) |
| 30 to 34 Years | 154 (92.8%) | 0 (0.0%) |
| 35 to 44 Years | 355 (97.0%) | 42 (11.8%) |
| 45 to 54 Years | 241 (86.7%) | 28 (11.6%) |
| 55 to 59 Years | 246 (89.5%) | 24 (9.8%) |
| 60 to 64 Years | 74 (78.7%) | 0 (0.0%) |
| 65 to 74 Years | 118 (39.5%) | 15 (12.7%) |
| 75 Years and over | 13 (6.9%) | 0 (0.0%) |
| Total | 1,676 (68.6%) | 163 (9.7%) |
Employment Status by Educational Attainment in South Nyack
According to labor force statistics for South Nyack, 91.0% of individuals (1,205) out of the total population between 25 and 64 years of age (1,324) are in the labor force, with 7.8% or 94 of them being unemployed. The group with the highest labor force participation rate are those with the educational attainment of bachelor's degree or higher, with 94.1% or 698 individuals in the labor force. Within the labor force, individuals with bachelor's degree or higher education have the highest percentage of unemployment, with 9.7% or 68 of them being unemployed.
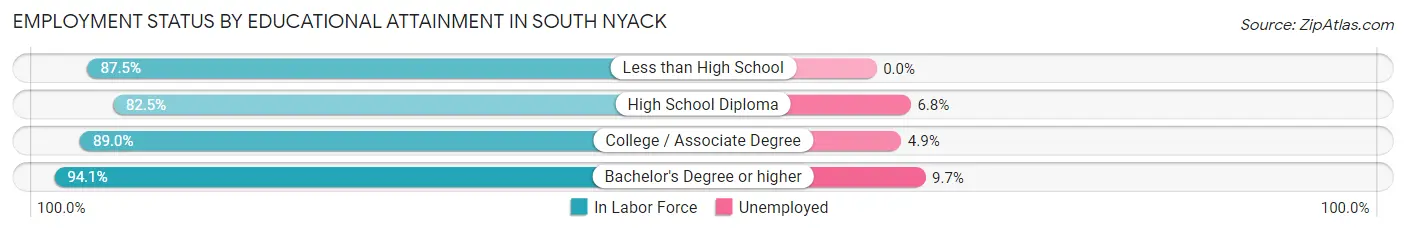
| Educational Attainment | In Labor Force | Unemployed |
| Less than High School | 28 (87.5%) | 0 (0.0%) |
| High School Diploma | 132 (82.5%) | 11 (6.8%) |
| College / Associate Degree | 347 (89.0%) | 19 (4.9%) |
| Bachelor's Degree or higher | 698 (94.1%) | 72 (9.7%) |
| Total | 1,205 (91.0%) | 103 (7.8%) |
Employment Occupations by Sex in South Nyack
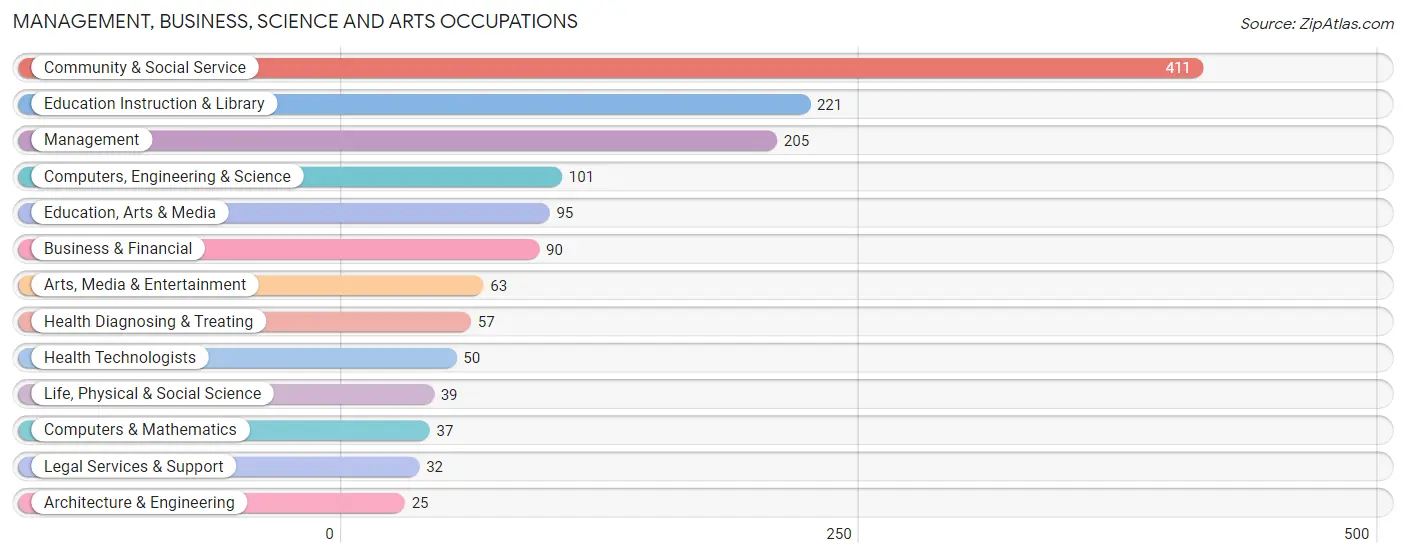
Management, Business, Science and Arts Occupations
The most common Management, Business, Science and Arts occupations in South Nyack are Community & Social Service (411 | 27.2%), Education Instruction & Library (221 | 14.6%), Management (205 | 13.6%), Computers, Engineering & Science (101 | 6.7%), and Education, Arts & Media (95 | 6.3%).
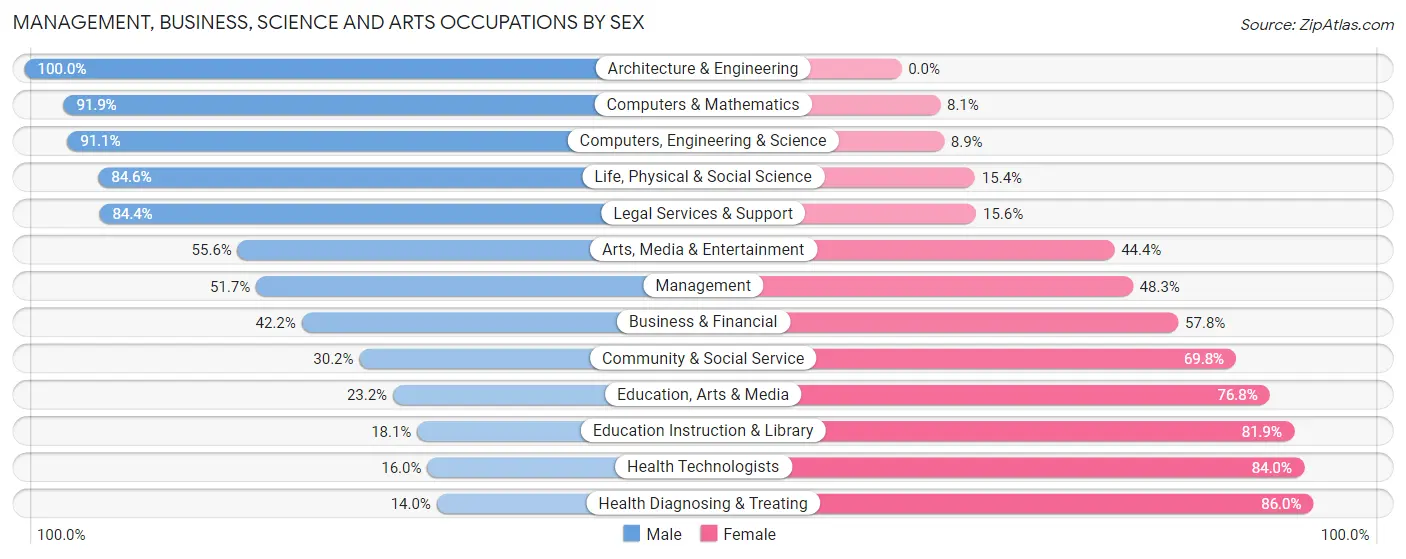
Management, Business, Science and Arts Occupations by Sex
Within the Management, Business, Science and Arts occupations in South Nyack, the most male-oriented occupations are Architecture & Engineering (100.0%), Computers & Mathematics (91.9%), and Computers, Engineering & Science (91.1%), while the most female-oriented occupations are Health Diagnosing & Treating (86.0%), Health Technologists (84.0%), and Education Instruction & Library (81.9%).
| Occupation | Male | Female |
| Management | 106 (51.7%) | 99 (48.3%) |
| Business & Financial | 38 (42.2%) | 52 (57.8%) |
| Computers, Engineering & Science | 92 (91.1%) | 9 (8.9%) |
| Computers & Mathematics | 34 (91.9%) | 3 (8.1%) |
| Architecture & Engineering | 25 (100.0%) | 0 (0.0%) |
| Life, Physical & Social Science | 33 (84.6%) | 6 (15.4%) |
| Community & Social Service | 124 (30.2%) | 287 (69.8%) |
| Education, Arts & Media | 22 (23.2%) | 73 (76.8%) |
| Legal Services & Support | 27 (84.4%) | 5 (15.6%) |
| Education Instruction & Library | 40 (18.1%) | 181 (81.9%) |
| Arts, Media & Entertainment | 35 (55.6%) | 28 (44.4%) |
| Health Diagnosing & Treating | 8 (14.0%) | 49 (86.0%) |
| Health Technologists | 8 (16.0%) | 42 (84.0%) |
| Total (Category) | 368 (42.6%) | 496 (57.4%) |
| Total (Overall) | 640 (42.3%) | 873 (57.7%) |
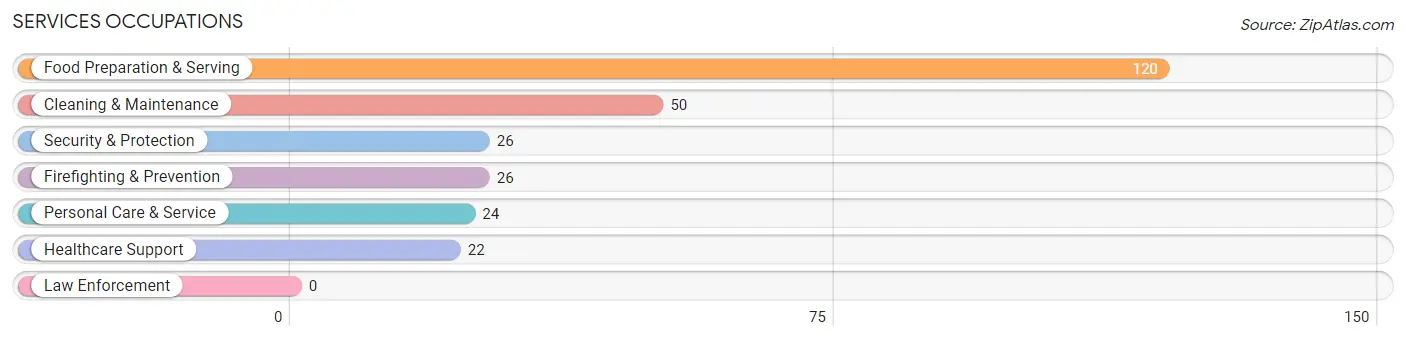
Services Occupations
The most common Services occupations in South Nyack are Food Preparation & Serving (120 | 7.9%), Cleaning & Maintenance (50 | 3.3%), Security & Protection (26 | 1.7%), Firefighting & Prevention (26 | 1.7%), and Personal Care & Service (24 | 1.6%).
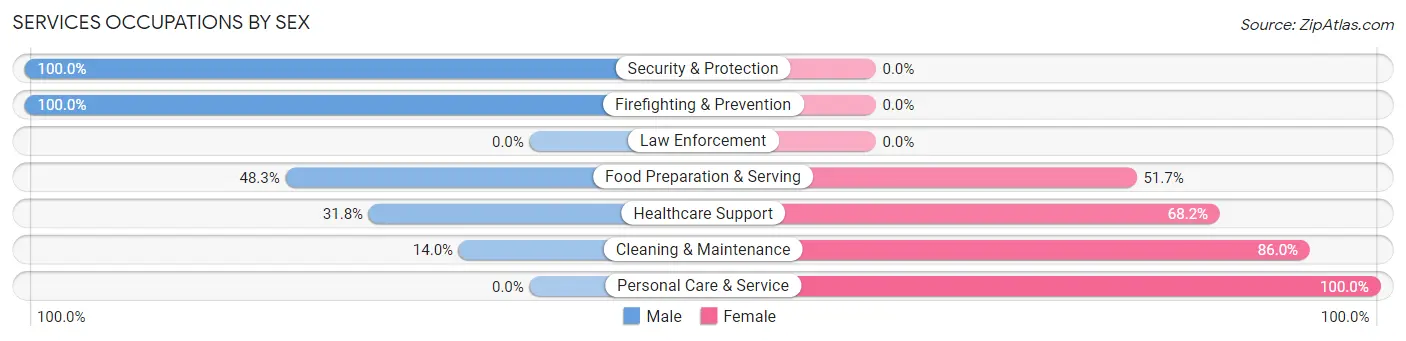
Services Occupations by Sex
Within the Services occupations in South Nyack, the most male-oriented occupations are Security & Protection (100.0%), Firefighting & Prevention (100.0%), and Food Preparation & Serving (48.3%), while the most female-oriented occupations are Personal Care & Service (100.0%), Cleaning & Maintenance (86.0%), and Healthcare Support (68.2%).
| Occupation | Male | Female |
| Healthcare Support | 7 (31.8%) | 15 (68.2%) |
| Security & Protection | 26 (100.0%) | 0 (0.0%) |
| Firefighting & Prevention | 26 (100.0%) | 0 (0.0%) |
| Law Enforcement | 0 (0.0%) | 0 (0.0%) |
| Food Preparation & Serving | 58 (48.3%) | 62 (51.7%) |
| Cleaning & Maintenance | 7 (14.0%) | 43 (86.0%) |
| Personal Care & Service | 0 (0.0%) | 24 (100.0%) |
| Total (Category) | 98 (40.5%) | 144 (59.5%) |
| Total (Overall) | 640 (42.3%) | 873 (57.7%) |
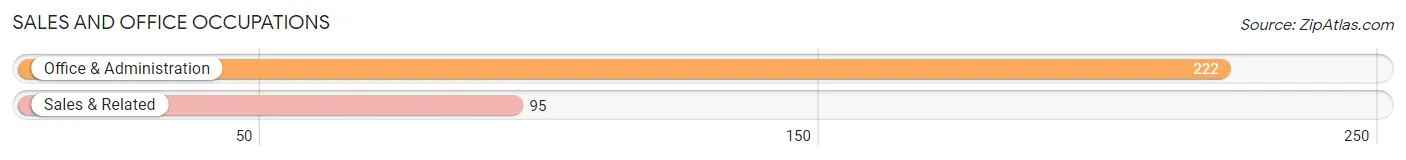
Sales and Office Occupations
The most common Sales and Office occupations in South Nyack are Office & Administration (222 | 14.7%), and Sales & Related (95 | 6.3%).
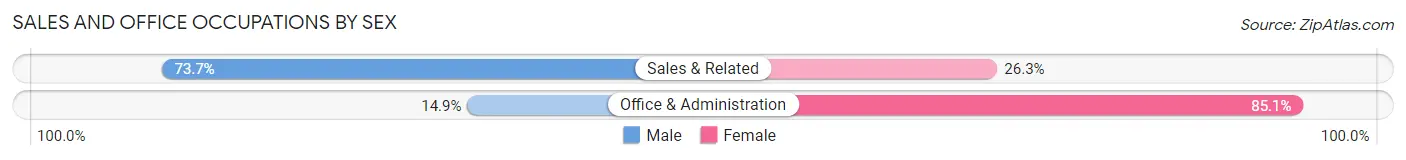
Sales and Office Occupations by Sex
| Occupation | Male | Female |
| Sales & Related | 70 (73.7%) | 25 (26.3%) |
| Office & Administration | 33 (14.9%) | 189 (85.1%) |
| Total (Category) | 103 (32.5%) | 214 (67.5%) |
| Total (Overall) | 640 (42.3%) | 873 (57.7%) |
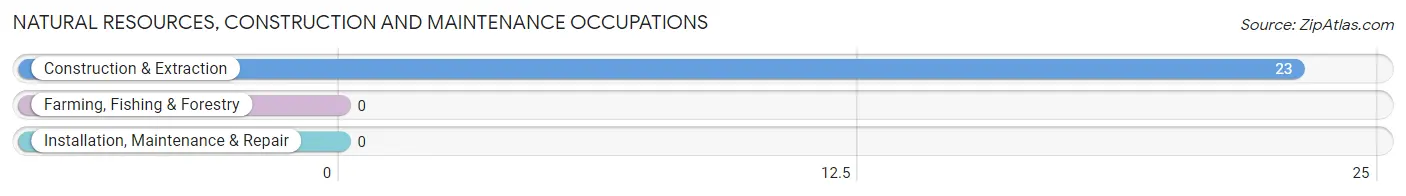
Natural Resources, Construction and Maintenance Occupations
The most common Natural Resources, Construction and Maintenance occupations in South Nyack are , and Construction & Extraction (23 | 1.5%).
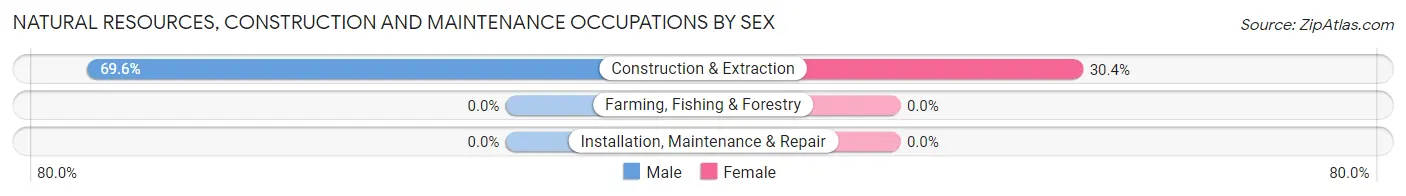
Natural Resources, Construction and Maintenance Occupations by Sex
| Occupation | Male | Female |
| Farming, Fishing & Forestry | 0 (0.0%) | 0 (0.0%) |
| Construction & Extraction | 16 (69.6%) | 7 (30.4%) |
| Installation, Maintenance & Repair | 0 (0.0%) | 0 (0.0%) |
| Total (Category) | 16 (69.6%) | 7 (30.4%) |
| Total (Overall) | 640 (42.3%) | 873 (57.7%) |
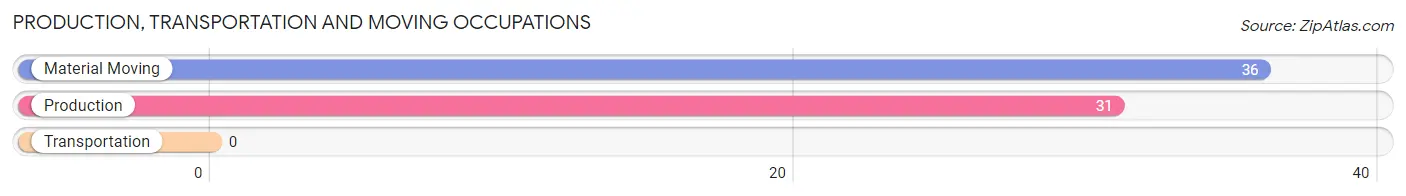
Production, Transportation and Moving Occupations
The most common Production, Transportation and Moving occupations in South Nyack are Material Moving (36 | 2.4%), and Production (31 | 2.1%).
Production, Transportation and Moving Occupations by Sex
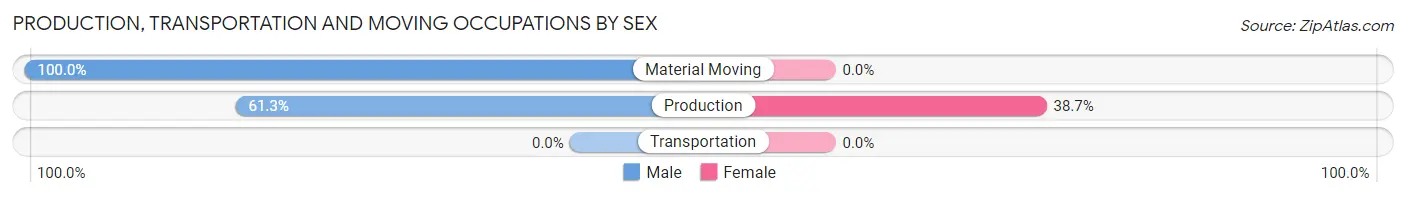
| Occupation | Male | Female |
| Production | 19 (61.3%) | 12 (38.7%) |
| Transportation | 0 (0.0%) | 0 (0.0%) |
| Material Moving | 36 (100.0%) | 0 (0.0%) |
| Total (Category) | 55 (82.1%) | 12 (17.9%) |
| Total (Overall) | 640 (42.3%) | 873 (57.7%) |
Employment Industries by Sex in South Nyack
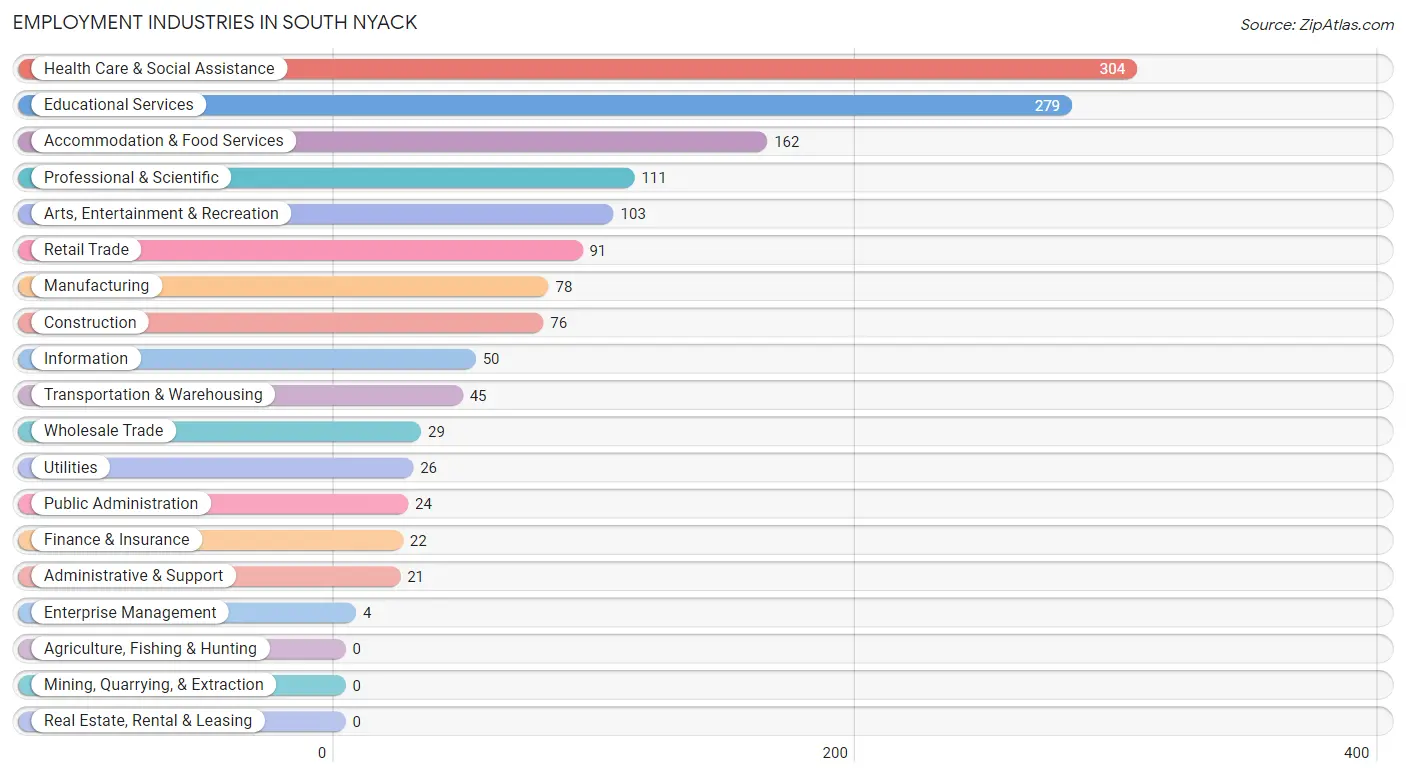
Employment Industries in South Nyack
The major employment industries in South Nyack include Health Care & Social Assistance (304 | 20.1%), Educational Services (279 | 18.4%), Accommodation & Food Services (162 | 10.7%), Professional & Scientific (111 | 7.3%), and Arts, Entertainment & Recreation (103 | 6.8%).
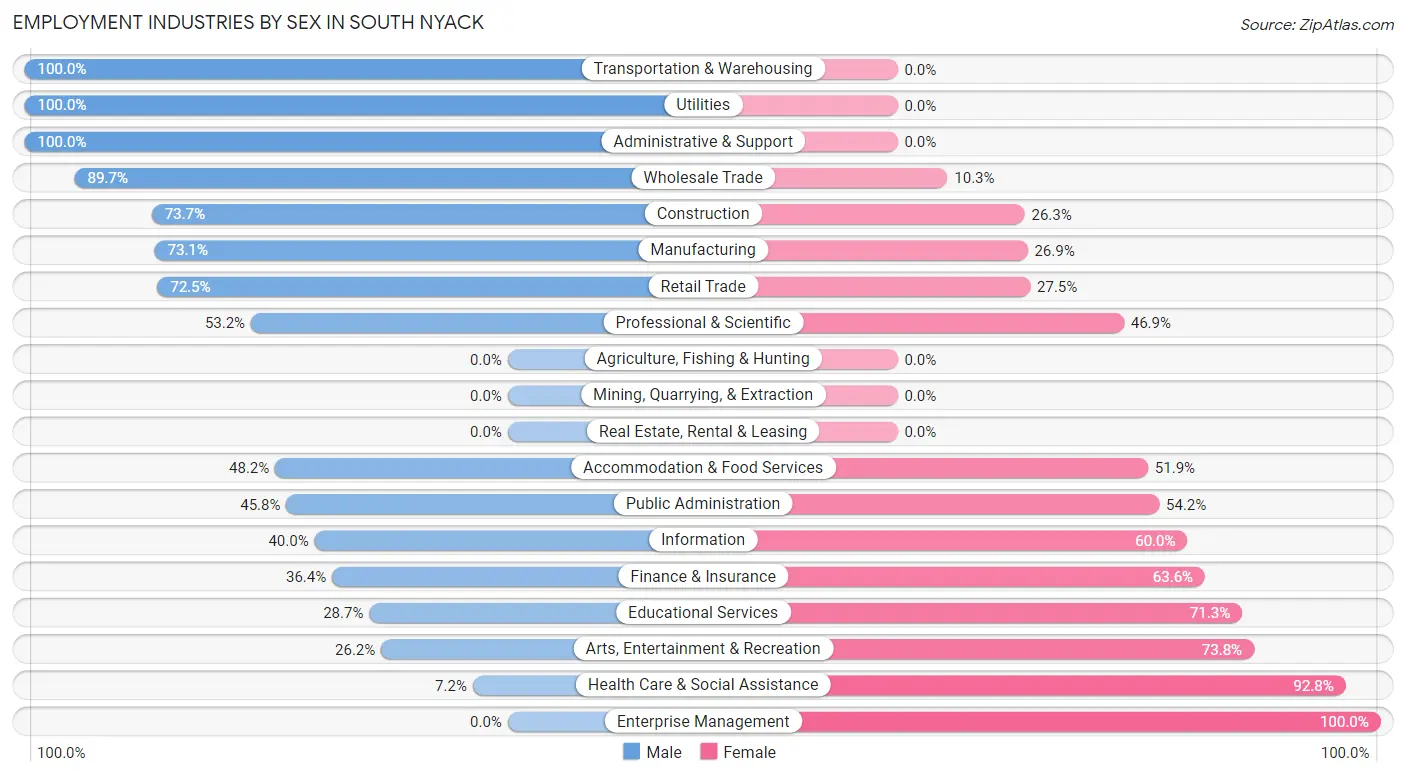
Employment Industries by Sex in South Nyack
The South Nyack industries that see more men than women are Transportation & Warehousing (100.0%), Utilities (100.0%), and Administrative & Support (100.0%), whereas the industries that tend to have a higher number of women are Enterprise Management (100.0%), Health Care & Social Assistance (92.8%), and Arts, Entertainment & Recreation (73.8%).
| Industry | Male | Female |
| Agriculture, Fishing & Hunting | 0 (0.0%) | 0 (0.0%) |
| Mining, Quarrying, & Extraction | 0 (0.0%) | 0 (0.0%) |
| Construction | 56 (73.7%) | 20 (26.3%) |
| Manufacturing | 57 (73.1%) | 21 (26.9%) |
| Wholesale Trade | 26 (89.7%) | 3 (10.3%) |
| Retail Trade | 66 (72.5%) | 25 (27.5%) |
| Transportation & Warehousing | 45 (100.0%) | 0 (0.0%) |
| Utilities | 26 (100.0%) | 0 (0.0%) |
| Information | 20 (40.0%) | 30 (60.0%) |
| Finance & Insurance | 8 (36.4%) | 14 (63.6%) |
| Real Estate, Rental & Leasing | 0 (0.0%) | 0 (0.0%) |
| Professional & Scientific | 59 (53.1%) | 52 (46.9%) |
| Enterprise Management | 0 (0.0%) | 4 (100.0%) |
| Administrative & Support | 21 (100.0%) | 0 (0.0%) |
| Educational Services | 80 (28.7%) | 199 (71.3%) |
| Health Care & Social Assistance | 22 (7.2%) | 282 (92.8%) |
| Arts, Entertainment & Recreation | 27 (26.2%) | 76 (73.8%) |
| Accommodation & Food Services | 78 (48.1%) | 84 (51.8%) |
| Public Administration | 11 (45.8%) | 13 (54.2%) |
| Total | 640 (42.3%) | 873 (57.7%) |
Education in South Nyack
School Enrollment in South Nyack
The most common levels of schooling among the 826 students in South Nyack are college / undergraduate (576 | 69.7%), elementary school (62 | 7.5%), and middle school (50 | 6.0%).
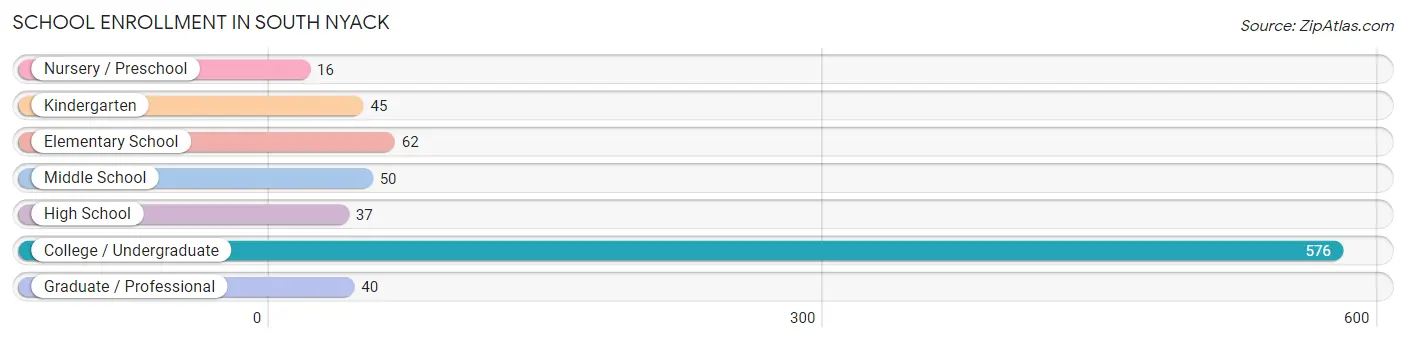
| School Level | # Students | % Students |
| Nursery / Preschool | 16 | 1.9% |
| Kindergarten | 45 | 5.4% |
| Elementary School | 62 | 7.5% |
| Middle School | 50 | 6.0% |
| High School | 37 | 4.5% |
| College / Undergraduate | 576 | 69.7% |
| Graduate / Professional | 40 | 4.8% |
| Total | 826 | 100.0% |
School Enrollment by Age by Funding Source in South Nyack
Out of a total of 826 students who are enrolled in schools in South Nyack, 480 (58.1%) attend a private institution, while the remaining 346 (41.9%) are enrolled in public schools. The age group of 25 to 34 year olds has the highest likelihood of being enrolled in private schools, with 33 (100.0% in the age bracket) enrolled. Conversely, the age group of 5 to 9 year old has the lowest likelihood of being enrolled in a private school, with 98 (100.0% in the age bracket) attending a public institution.
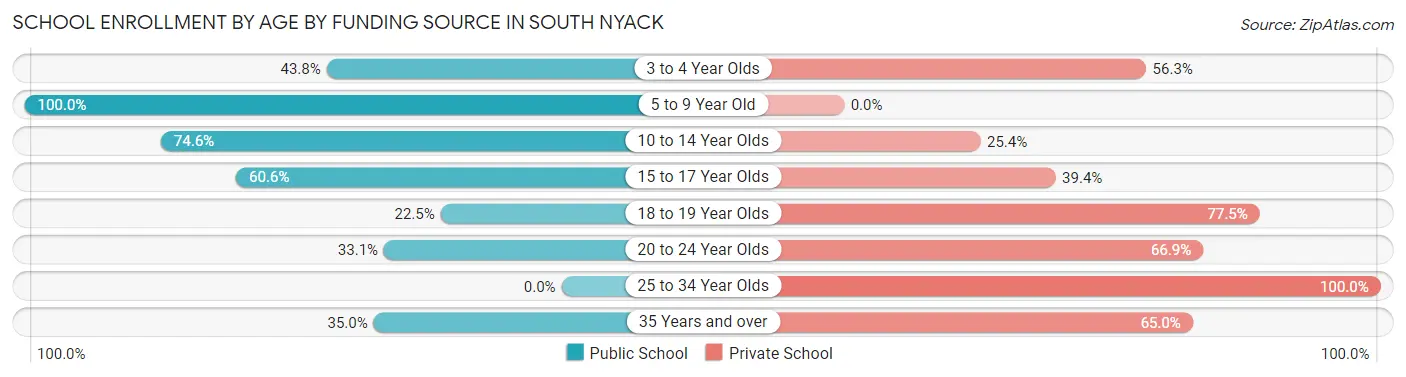
| Age Bracket | Public School | Private School |
| 3 to 4 Year Olds | 7 (43.8%) | 9 (56.2%) |
| 5 to 9 Year Old | 98 (100.0%) | 0 (0.0%) |
| 10 to 14 Year Olds | 47 (74.6%) | 16 (25.4%) |
| 15 to 17 Year Olds | 20 (60.6%) | 13 (39.4%) |
| 18 to 19 Year Olds | 41 (22.5%) | 141 (77.5%) |
| 20 to 24 Year Olds | 126 (33.1%) | 255 (66.9%) |
| 25 to 34 Year Olds | 0 (0.0%) | 33 (100.0%) |
| 35 Years and over | 7 (35.0%) | 13 (65.0%) |
| Total | 346 (41.9%) | 480 (58.1%) |
Educational Attainment by Field of Study in South Nyack
Visual & performing arts (171 | 15.6%), business (162 | 14.8%), social sciences (136 | 12.4%), science & technology (124 | 11.3%), and literature & languages (102 | 9.3%) are the most common fields of study among 1,096 individuals in South Nyack who have obtained a bachelor's degree or higher.
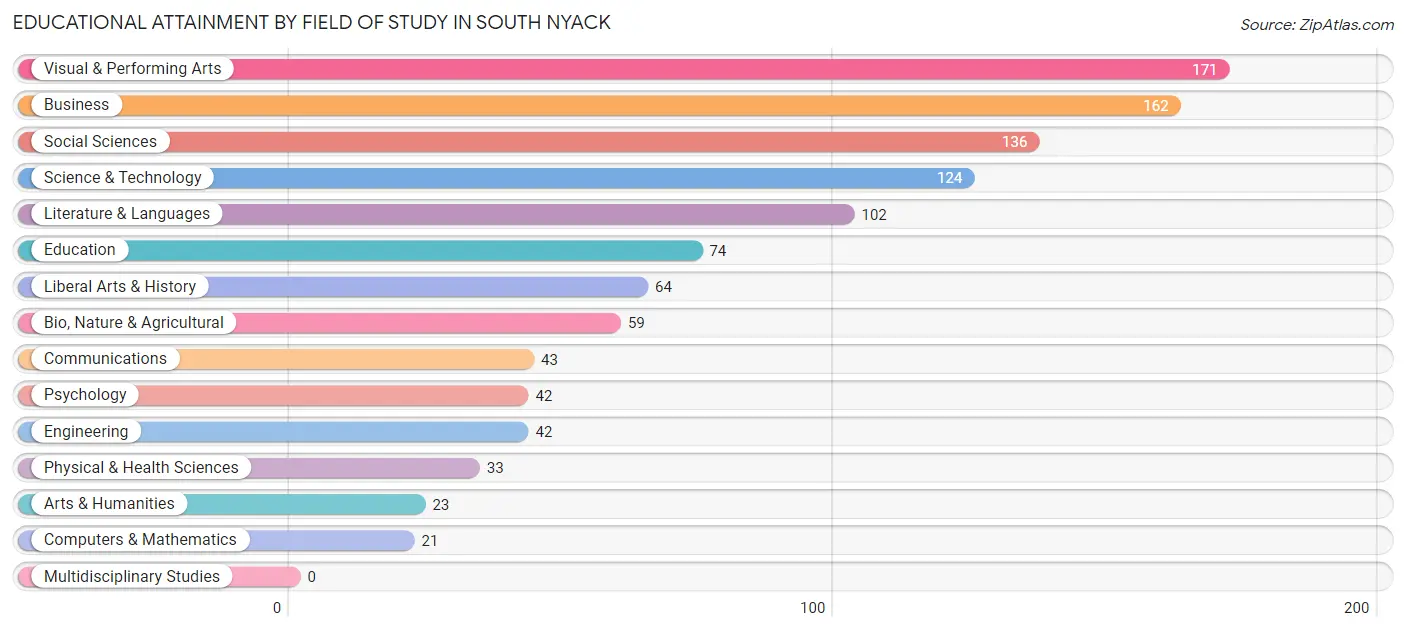
| Field of Study | # Graduates | % Graduates |
| Computers & Mathematics | 21 | 1.9% |
| Bio, Nature & Agricultural | 59 | 5.4% |
| Physical & Health Sciences | 33 | 3.0% |
| Psychology | 42 | 3.8% |
| Social Sciences | 136 | 12.4% |
| Engineering | 42 | 3.8% |
| Multidisciplinary Studies | 0 | 0.0% |
| Science & Technology | 124 | 11.3% |
| Business | 162 | 14.8% |
| Education | 74 | 6.8% |
| Literature & Languages | 102 | 9.3% |
| Liberal Arts & History | 64 | 5.8% |
| Visual & Performing Arts | 171 | 15.6% |
| Communications | 43 | 3.9% |
| Arts & Humanities | 23 | 2.1% |
| Total | 1,096 | 100.0% |
Transportation & Commute in South Nyack
Vehicle Availability by Sex in South Nyack
The most prevalent vehicle ownership categories in South Nyack are males with 2 vehicles (305, accounting for 58.3%) and females with 2 vehicles (339, making up 40.9%).
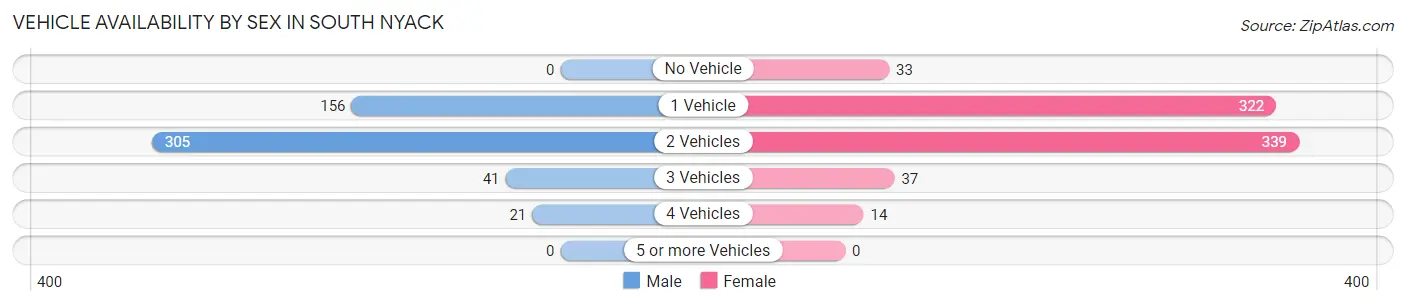
| Vehicles Available | Male | Female |
| No Vehicle | 0 (0.0%) | 33 (4.4%) |
| 1 Vehicle | 156 (29.8%) | 322 (43.2%) |
| 2 Vehicles | 305 (58.3%) | 339 (45.5%) |
| 3 Vehicles | 41 (7.8%) | 37 (5.0%) |
| 4 Vehicles | 21 (4.0%) | 14 (1.9%) |
| 5 or more Vehicles | 0 (0.0%) | 0 (0.0%) |
| Total | 523 (100.0%) | 745 (100.0%) |
Commute Time in South Nyack
The most frequently occuring commute durations in South Nyack are 5 to 9 minutes (200 commuters, 16.0%), 60 to 89 minutes (187 commuters, 15.0%), and 15 to 19 minutes (154 commuters, 12.3%).
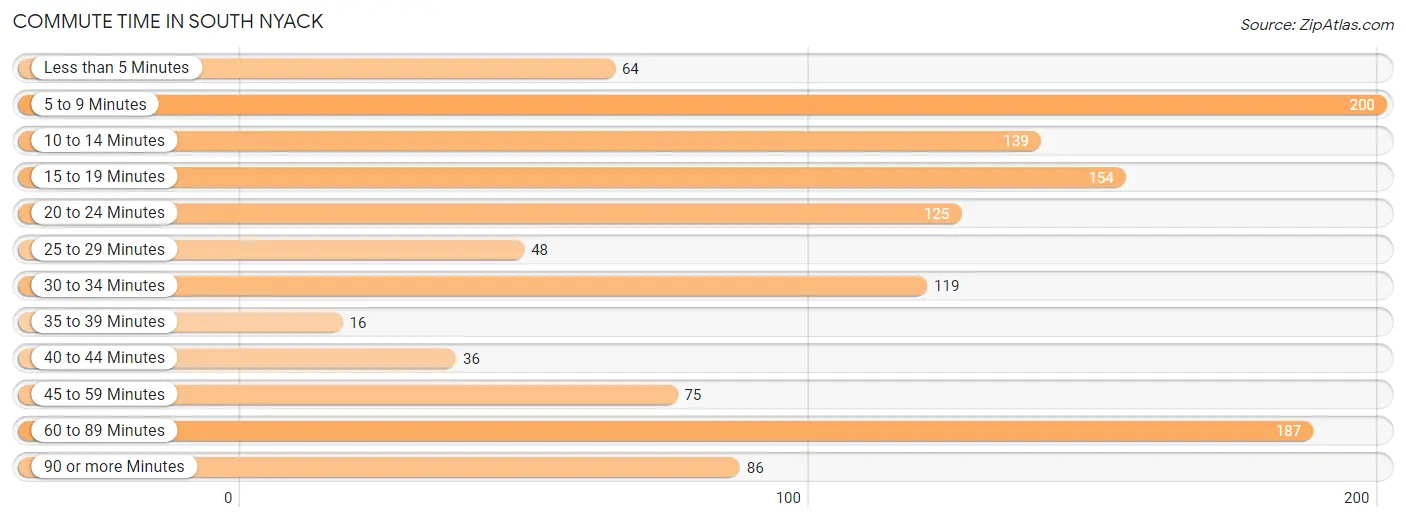
| Commute Time | # Commuters | % Commuters |
| Less than 5 Minutes | 64 | 5.1% |
| 5 to 9 Minutes | 200 | 16.0% |
| 10 to 14 Minutes | 139 | 11.1% |
| 15 to 19 Minutes | 154 | 12.3% |
| 20 to 24 Minutes | 125 | 10.0% |
| 25 to 29 Minutes | 48 | 3.8% |
| 30 to 34 Minutes | 119 | 9.5% |
| 35 to 39 Minutes | 16 | 1.3% |
| 40 to 44 Minutes | 36 | 2.9% |
| 45 to 59 Minutes | 75 | 6.0% |
| 60 to 89 Minutes | 187 | 15.0% |
| 90 or more Minutes | 86 | 6.9% |
Commute Time by Sex in South Nyack
The most common commute times in South Nyack are 10 to 14 minutes (94 commuters, 18.9%) for males and 60 to 89 minutes (187 commuters, 24.9%) for females.
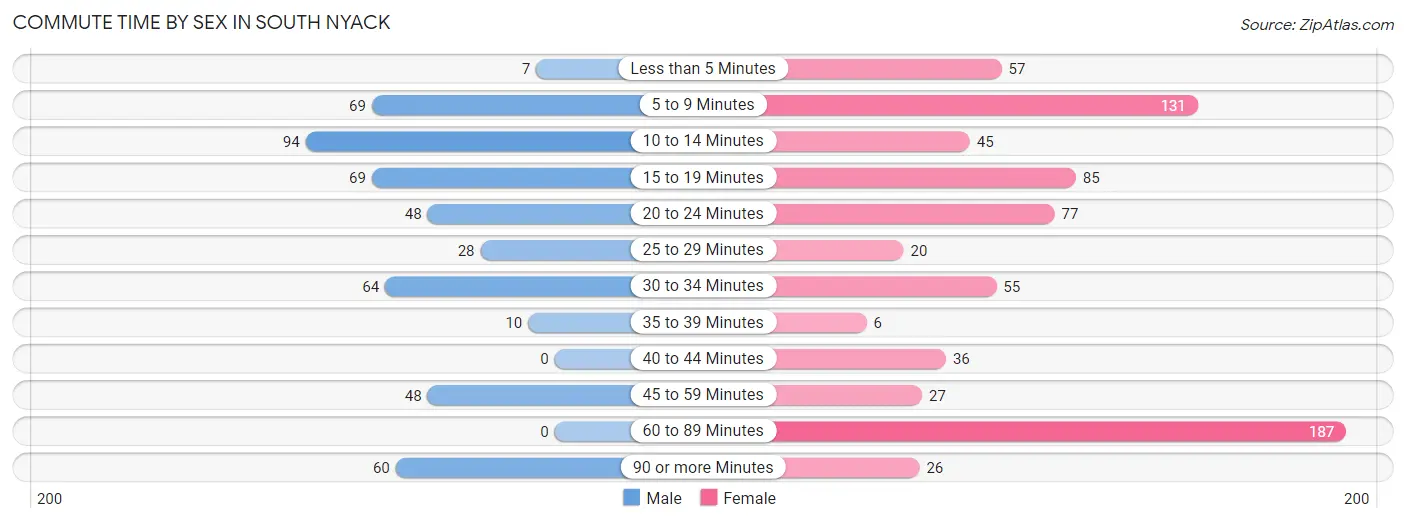
| Commute Time | Male | Female |
| Less than 5 Minutes | 7 (1.4%) | 57 (7.6%) |
| 5 to 9 Minutes | 69 (13.9%) | 131 (17.4%) |
| 10 to 14 Minutes | 94 (18.9%) | 45 (6.0%) |
| 15 to 19 Minutes | 69 (13.9%) | 85 (11.3%) |
| 20 to 24 Minutes | 48 (9.7%) | 77 (10.2%) |
| 25 to 29 Minutes | 28 (5.6%) | 20 (2.7%) |
| 30 to 34 Minutes | 64 (12.9%) | 55 (7.3%) |
| 35 to 39 Minutes | 10 (2.0%) | 6 (0.8%) |
| 40 to 44 Minutes | 0 (0.0%) | 36 (4.8%) |
| 45 to 59 Minutes | 48 (9.7%) | 27 (3.6%) |
| 60 to 89 Minutes | 0 (0.0%) | 187 (24.9%) |
| 90 or more Minutes | 60 (12.1%) | 26 (3.5%) |
Time of Departure to Work by Sex in South Nyack
The most frequent times of departure to work in South Nyack are 7:30 AM to 7:59 AM (87, 17.5%) for males and 9:00 AM to 9:59 AM (178, 23.7%) for females.
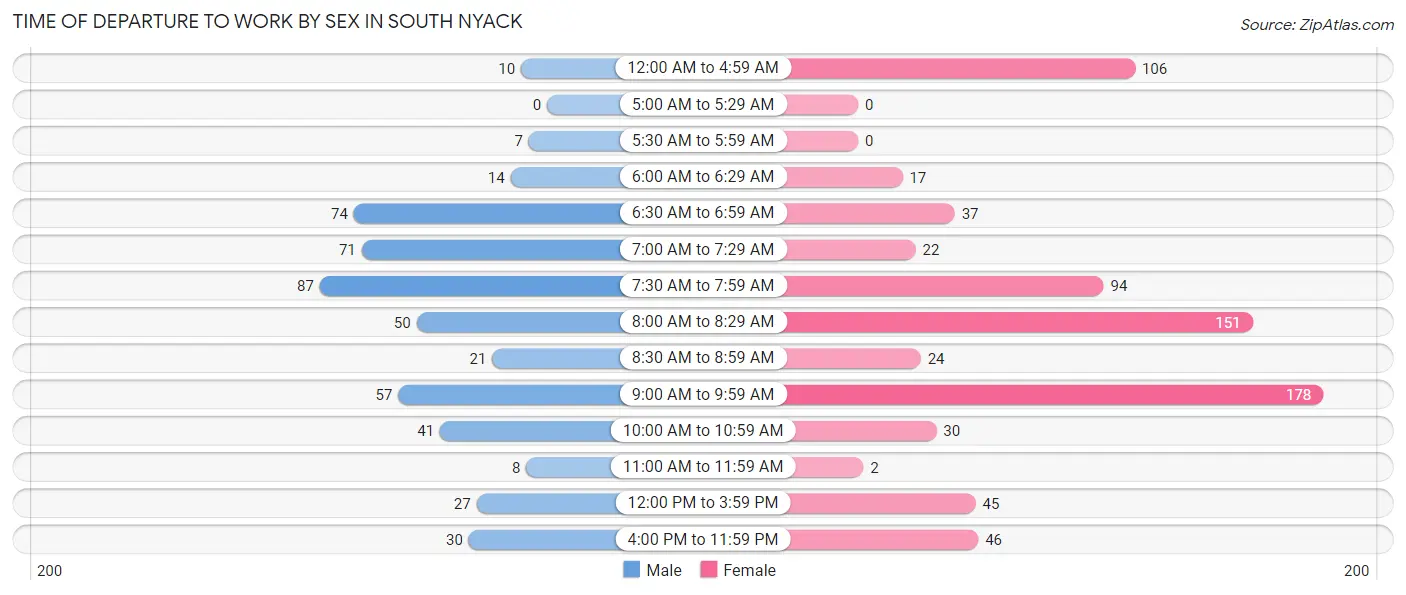
| Time of Departure | Male | Female |
| 12:00 AM to 4:59 AM | 10 (2.0%) | 106 (14.1%) |
| 5:00 AM to 5:29 AM | 0 (0.0%) | 0 (0.0%) |
| 5:30 AM to 5:59 AM | 7 (1.4%) | 0 (0.0%) |
| 6:00 AM to 6:29 AM | 14 (2.8%) | 17 (2.3%) |
| 6:30 AM to 6:59 AM | 74 (14.9%) | 37 (4.9%) |
| 7:00 AM to 7:29 AM | 71 (14.3%) | 22 (2.9%) |
| 7:30 AM to 7:59 AM | 87 (17.5%) | 94 (12.5%) |
| 8:00 AM to 8:29 AM | 50 (10.1%) | 151 (20.1%) |
| 8:30 AM to 8:59 AM | 21 (4.2%) | 24 (3.2%) |
| 9:00 AM to 9:59 AM | 57 (11.5%) | 178 (23.7%) |
| 10:00 AM to 10:59 AM | 41 (8.3%) | 30 (4.0%) |
| 11:00 AM to 11:59 AM | 8 (1.6%) | 2 (0.3%) |
| 12:00 PM to 3:59 PM | 27 (5.4%) | 45 (6.0%) |
| 4:00 PM to 11:59 PM | 30 (6.0%) | 46 (6.1%) |
| Total | 497 (100.0%) | 752 (100.0%) |
Housing Occupancy in South Nyack
Occupancy by Ownership in South Nyack
Of the total 1,032 dwellings in South Nyack, owner-occupied units account for 664 (64.3%), while renter-occupied units make up 368 (35.7%).
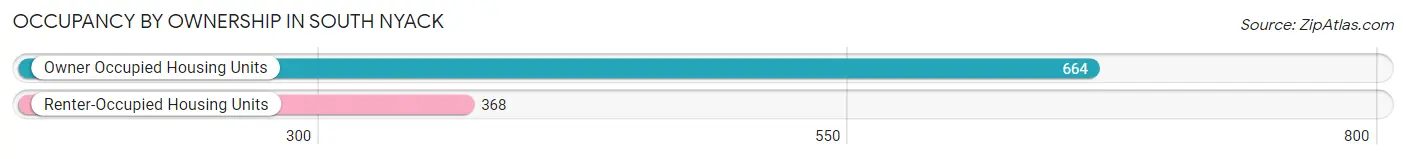
| Occupancy | # Housing Units | % Housing Units |
| Owner Occupied Housing Units | 664 | 64.3% |
| Renter-Occupied Housing Units | 368 | 35.7% |
| Total Occupied Housing Units | 1,032 | 100.0% |
Occupancy by Household Size in South Nyack
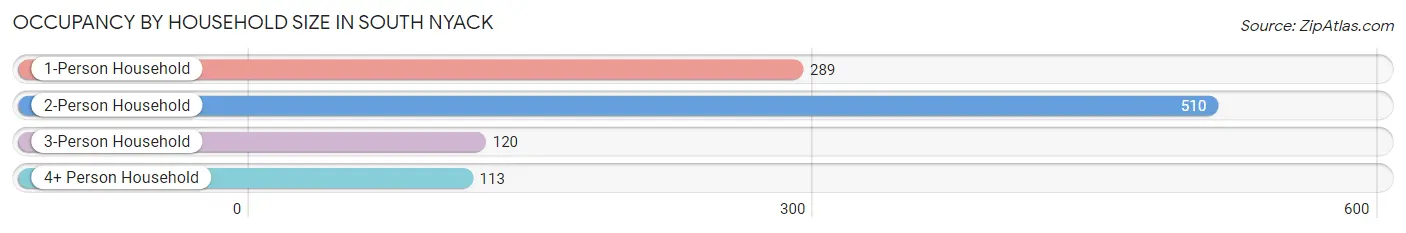
| Household Size | # Housing Units | % Housing Units |
| 1-Person Household | 289 | 28.0% |
| 2-Person Household | 510 | 49.4% |
| 3-Person Household | 120 | 11.6% |
| 4+ Person Household | 113 | 11.0% |
| Total Housing Units | 1,032 | 100.0% |
Occupancy by Ownership by Household Size in South Nyack
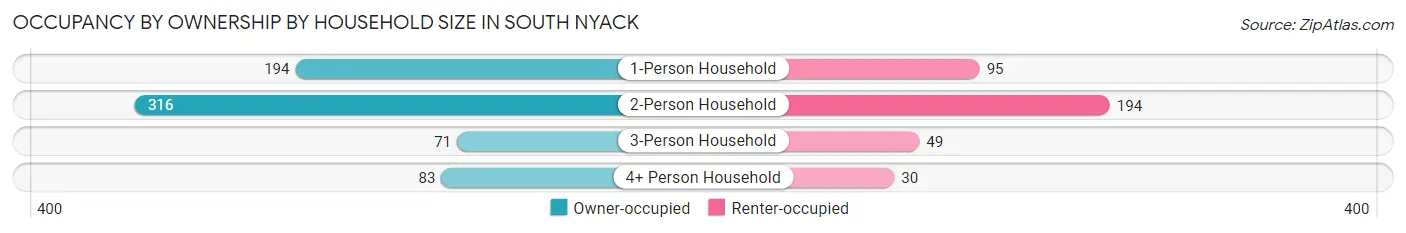
| Household Size | Owner-occupied | Renter-occupied |
| 1-Person Household | 194 (67.1%) | 95 (32.9%) |
| 2-Person Household | 316 (62.0%) | 194 (38.0%) |
| 3-Person Household | 71 (59.2%) | 49 (40.8%) |
| 4+ Person Household | 83 (73.5%) | 30 (26.6%) |
| Total Housing Units | 664 (64.3%) | 368 (35.7%) |
Occupancy by Educational Attainment in South Nyack
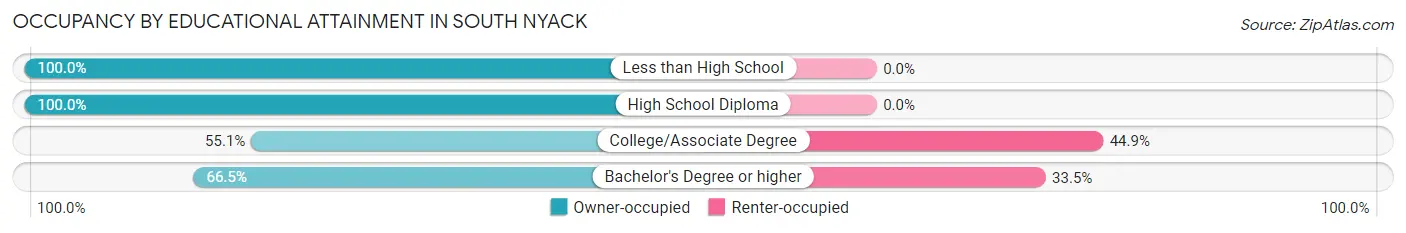
| Household Size | Owner-occupied | Renter-occupied |
| Less than High School | 25 (100.0%) | 0 (0.0%) |
| High School Diploma | 36 (100.0%) | 0 (0.0%) |
| College/Associate Degree | 206 (55.1%) | 168 (44.9%) |
| Bachelor's Degree or higher | 397 (66.5%) | 200 (33.5%) |
Occupancy by Age of Householder in South Nyack
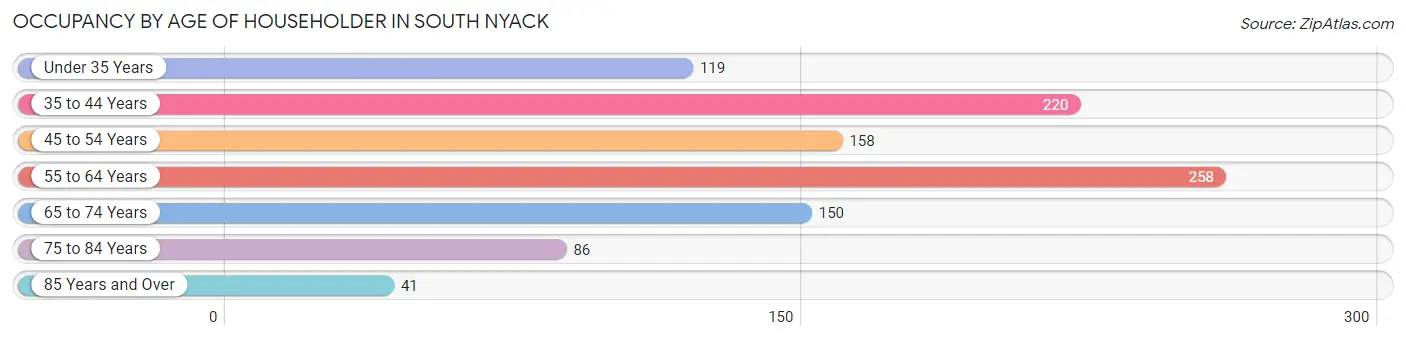
| Age Bracket | # Households | % Households |
| Under 35 Years | 119 | 11.5% |
| 35 to 44 Years | 220 | 21.3% |
| 45 to 54 Years | 158 | 15.3% |
| 55 to 64 Years | 258 | 25.0% |
| 65 to 74 Years | 150 | 14.5% |
| 75 to 84 Years | 86 | 8.3% |
| 85 Years and Over | 41 | 4.0% |
| Total | 1,032 | 100.0% |
Housing Finances in South Nyack
Median Income by Occupancy in South Nyack
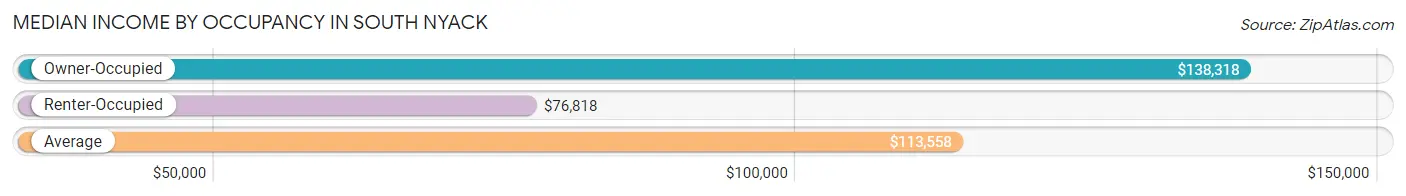
| Occupancy Type | # Households | Median Income |
| Owner-Occupied | 664 (64.3%) | $138,318 |
| Renter-Occupied | 368 (35.7%) | $76,818 |
| Average | 1,032 (100.0%) | $113,558 |
Occupancy by Householder Income Bracket in South Nyack
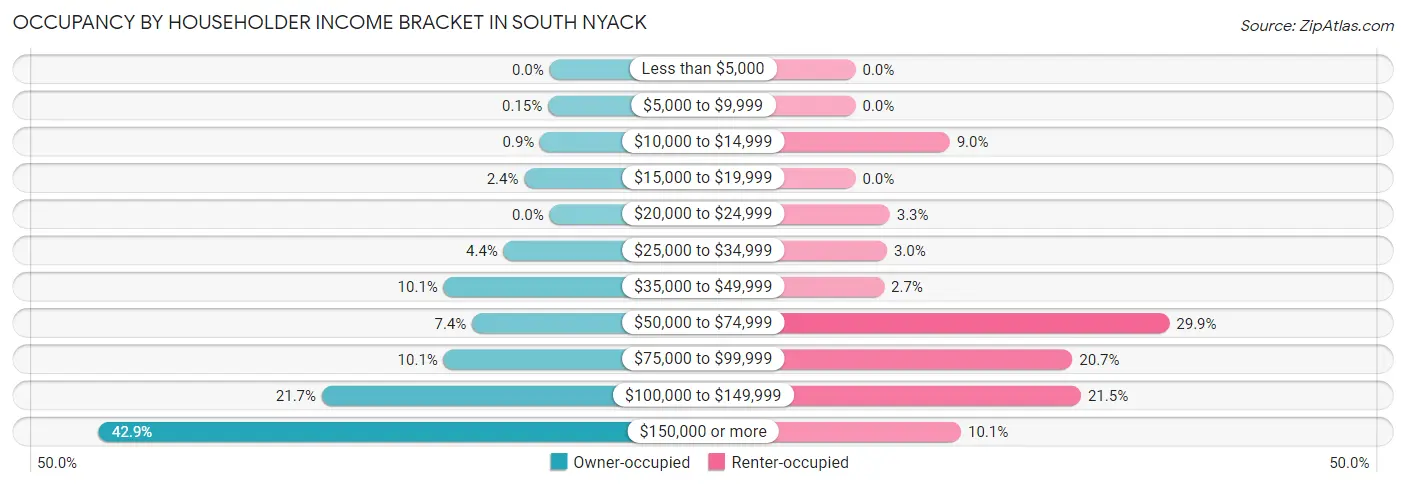
| Income Bracket | Owner-occupied | Renter-occupied |
| Less than $5,000 | 0 (0.0%) | 0 (0.0%) |
| $5,000 to $9,999 | 1 (0.2%) | 0 (0.0%) |
| $10,000 to $14,999 | 6 (0.9%) | 33 (9.0%) |
| $15,000 to $19,999 | 16 (2.4%) | 0 (0.0%) |
| $20,000 to $24,999 | 0 (0.0%) | 12 (3.3%) |
| $25,000 to $34,999 | 29 (4.4%) | 11 (3.0%) |
| $35,000 to $49,999 | 67 (10.1%) | 10 (2.7%) |
| $50,000 to $74,999 | 49 (7.4%) | 110 (29.9%) |
| $75,000 to $99,999 | 67 (10.1%) | 76 (20.6%) |
| $100,000 to $149,999 | 144 (21.7%) | 79 (21.5%) |
| $150,000 or more | 285 (42.9%) | 37 (10.1%) |
| Total | 664 (100.0%) | 368 (100.0%) |
Monthly Housing Cost Tiers in South Nyack
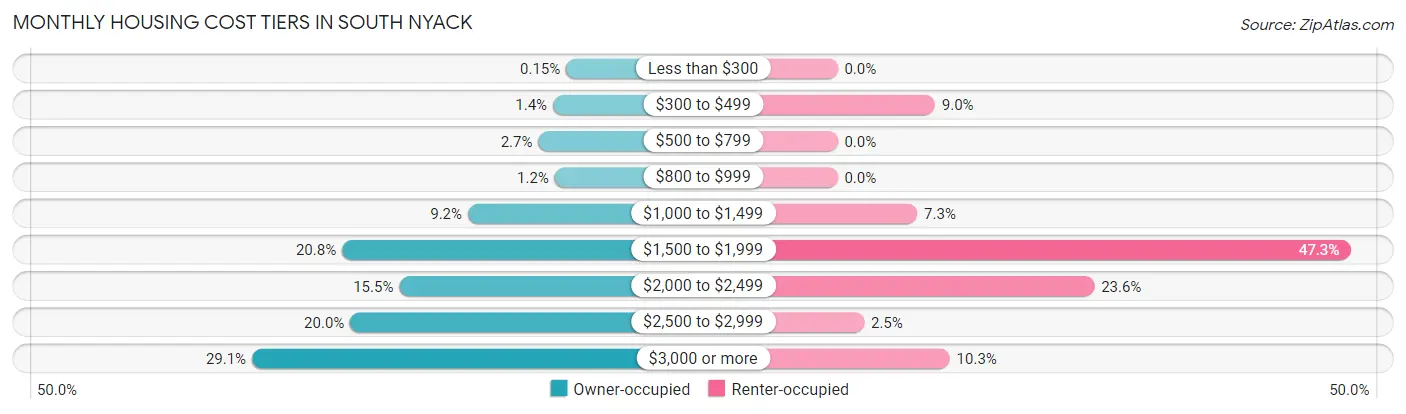
| Monthly Cost | Owner-occupied | Renter-occupied |
| Less than $300 | 1 (0.2%) | 0 (0.0%) |
| $300 to $499 | 9 (1.4%) | 33 (9.0%) |
| $500 to $799 | 18 (2.7%) | 0 (0.0%) |
| $800 to $999 | 8 (1.2%) | 0 (0.0%) |
| $1,000 to $1,499 | 61 (9.2%) | 27 (7.3%) |
| $1,500 to $1,999 | 138 (20.8%) | 174 (47.3%) |
| $2,000 to $2,499 | 103 (15.5%) | 87 (23.6%) |
| $2,500 to $2,999 | 133 (20.0%) | 9 (2.5%) |
| $3,000 or more | 193 (29.1%) | 38 (10.3%) |
| Total | 664 (100.0%) | 368 (100.0%) |
Physical Housing Characteristics in South Nyack
Housing Structures in South Nyack
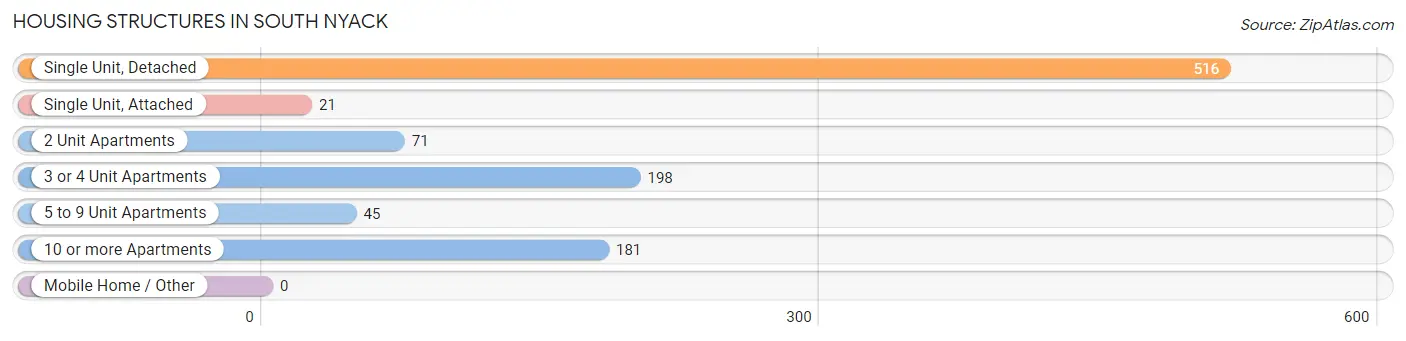
| Structure Type | # Housing Units | % Housing Units |
| Single Unit, Detached | 516 | 50.0% |
| Single Unit, Attached | 21 | 2.0% |
| 2 Unit Apartments | 71 | 6.9% |
| 3 or 4 Unit Apartments | 198 | 19.2% |
| 5 to 9 Unit Apartments | 45 | 4.4% |
| 10 or more Apartments | 181 | 17.5% |
| Mobile Home / Other | 0 | 0.0% |
| Total | 1,032 | 100.0% |
Housing Structures by Occupancy in South Nyack
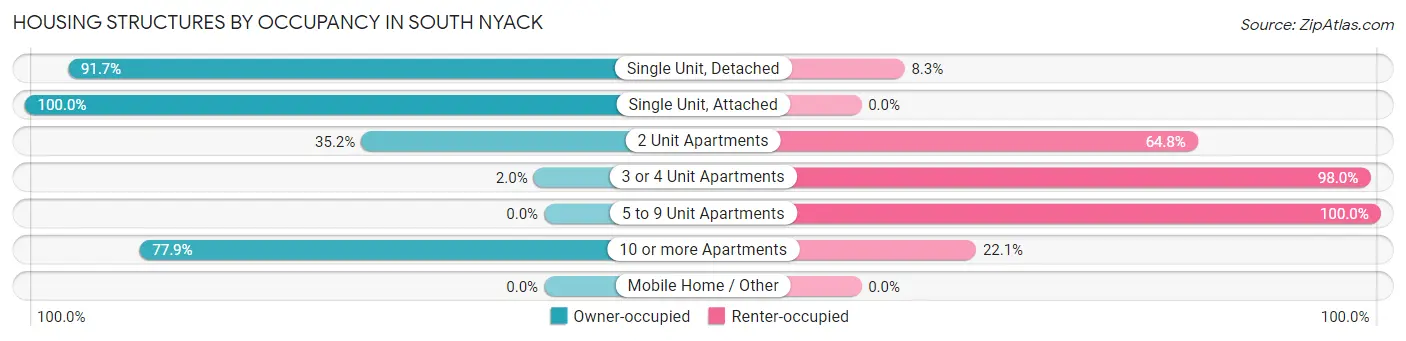
| Structure Type | Owner-occupied | Renter-occupied |
| Single Unit, Detached | 473 (91.7%) | 43 (8.3%) |
| Single Unit, Attached | 21 (100.0%) | 0 (0.0%) |
| 2 Unit Apartments | 25 (35.2%) | 46 (64.8%) |
| 3 or 4 Unit Apartments | 4 (2.0%) | 194 (98.0%) |
| 5 to 9 Unit Apartments | 0 (0.0%) | 45 (100.0%) |
| 10 or more Apartments | 141 (77.9%) | 40 (22.1%) |
| Mobile Home / Other | 0 (0.0%) | 0 (0.0%) |
| Total | 664 (64.3%) | 368 (35.7%) |
Housing Structures by Number of Rooms in South Nyack
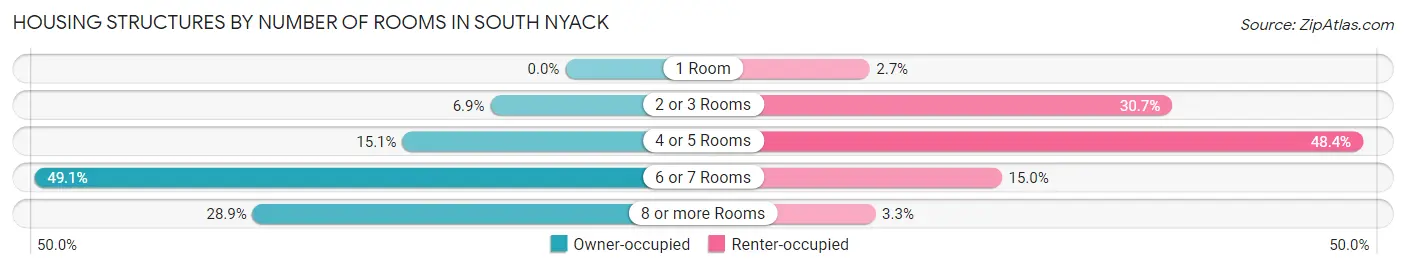
| Number of Rooms | Owner-occupied | Renter-occupied |
| 1 Room | 0 (0.0%) | 10 (2.7%) |
| 2 or 3 Rooms | 46 (6.9%) | 113 (30.7%) |
| 4 or 5 Rooms | 100 (15.1%) | 178 (48.4%) |
| 6 or 7 Rooms | 326 (49.1%) | 55 (14.9%) |
| 8 or more Rooms | 192 (28.9%) | 12 (3.3%) |
| Total | 664 (100.0%) | 368 (100.0%) |
Housing Structure by Heating Type in South Nyack
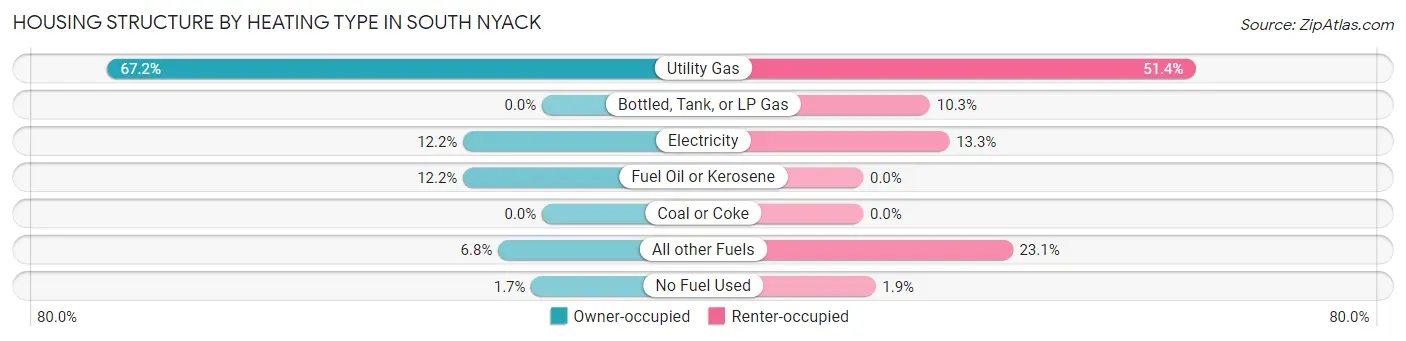
| Heating Type | Owner-occupied | Renter-occupied |
| Utility Gas | 446 (67.2%) | 189 (51.4%) |
| Bottled, Tank, or LP Gas | 0 (0.0%) | 38 (10.3%) |
| Electricity | 81 (12.2%) | 49 (13.3%) |
| Fuel Oil or Kerosene | 81 (12.2%) | 0 (0.0%) |
| Coal or Coke | 0 (0.0%) | 0 (0.0%) |
| All other Fuels | 45 (6.8%) | 85 (23.1%) |
| No Fuel Used | 11 (1.7%) | 7 (1.9%) |
| Total | 664 (100.0%) | 368 (100.0%) |
Household Vehicle Usage in South Nyack
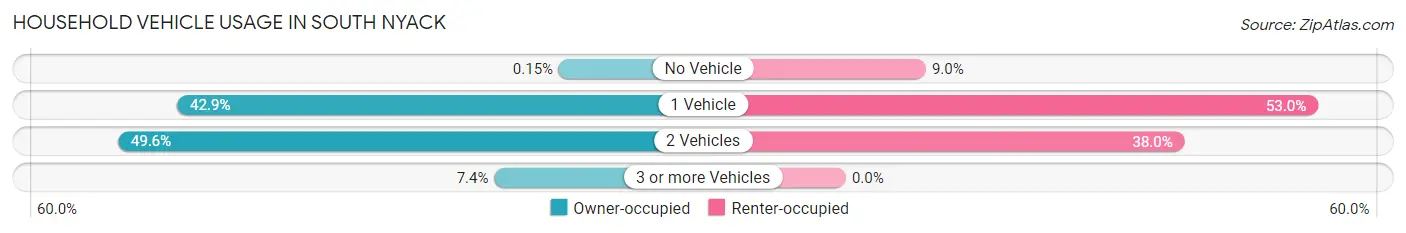
| Vehicles per Household | Owner-occupied | Renter-occupied |
| No Vehicle | 1 (0.2%) | 33 (9.0%) |
| 1 Vehicle | 285 (42.9%) | 195 (53.0%) |
| 2 Vehicles | 329 (49.5%) | 140 (38.0%) |
| 3 or more Vehicles | 49 (7.4%) | 0 (0.0%) |
| Total | 664 (100.0%) | 368 (100.0%) |
Real Estate & Mortgages in South Nyack
Real Estate and Mortgage Overview in South Nyack
| Characteristic | Without Mortgage | With Mortgage |
| Housing Units | 255 | 409 |
| Median Property Value | $599,700 | $580,400 |
| Median Household Income | $113,661 | $194 |
| Monthly Housing Costs | $1,501 | $176 |
| Real Estate Taxes | $10,001 | $23 |
Property Value by Mortgage Status in South Nyack
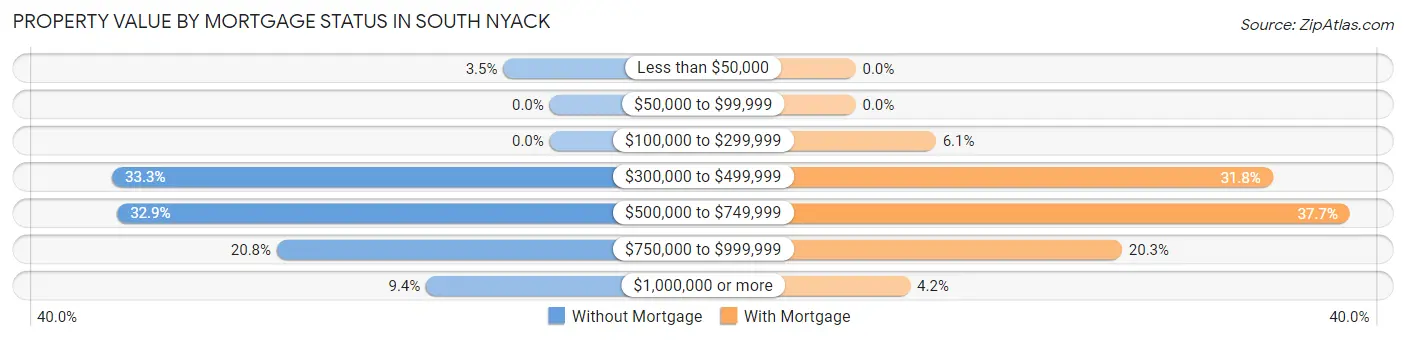
| Property Value | Without Mortgage | With Mortgage |
| Less than $50,000 | 9 (3.5%) | 0 (0.0%) |
| $50,000 to $99,999 | 0 (0.0%) | 0 (0.0%) |
| $100,000 to $299,999 | 0 (0.0%) | 25 (6.1%) |
| $300,000 to $499,999 | 85 (33.3%) | 130 (31.8%) |
| $500,000 to $749,999 | 84 (32.9%) | 154 (37.7%) |
| $750,000 to $999,999 | 53 (20.8%) | 83 (20.3%) |
| $1,000,000 or more | 24 (9.4%) | 17 (4.2%) |
| Total | 255 (100.0%) | 409 (100.0%) |
Household Income by Mortgage Status in South Nyack
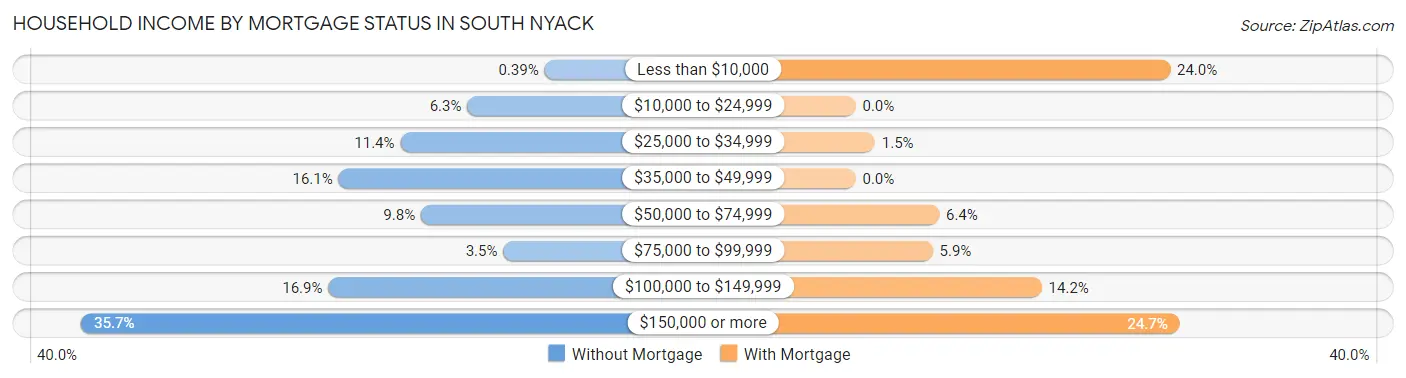
| Household Income | Without Mortgage | With Mortgage |
| Less than $10,000 | 1 (0.4%) | 98 (24.0%) |
| $10,000 to $24,999 | 16 (6.3%) | 0 (0.0%) |
| $25,000 to $34,999 | 29 (11.4%) | 6 (1.5%) |
| $35,000 to $49,999 | 41 (16.1%) | 0 (0.0%) |
| $50,000 to $74,999 | 25 (9.8%) | 26 (6.4%) |
| $75,000 to $99,999 | 9 (3.5%) | 24 (5.9%) |
| $100,000 to $149,999 | 43 (16.9%) | 58 (14.2%) |
| $150,000 or more | 91 (35.7%) | 101 (24.7%) |
| Total | 255 (100.0%) | 409 (100.0%) |
Property Value to Household Income Ratio in South Nyack
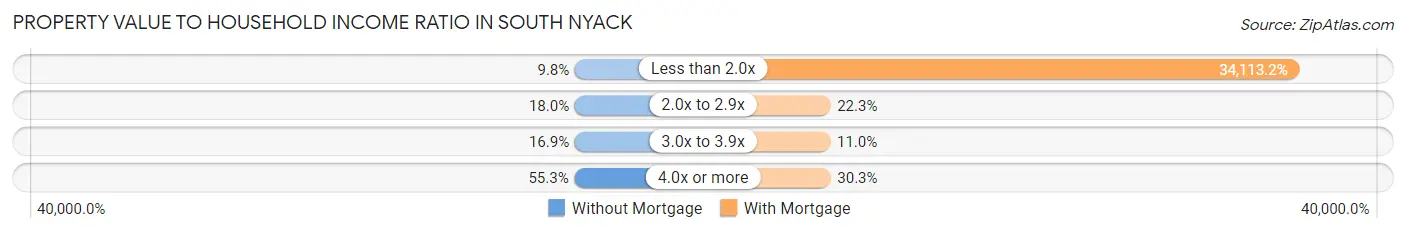
| Value-to-Income Ratio | Without Mortgage | With Mortgage |
| Less than 2.0x | 25 (9.8%) | 139,523 (34,113.2%) |
| 2.0x to 2.9x | 46 (18.0%) | 91 (22.3%) |
| 3.0x to 3.9x | 43 (16.9%) | 45 (11.0%) |
| 4.0x or more | 141 (55.3%) | 124 (30.3%) |
| Total | 255 (100.0%) | 409 (100.0%) |
Real Estate Taxes by Mortgage Status in South Nyack
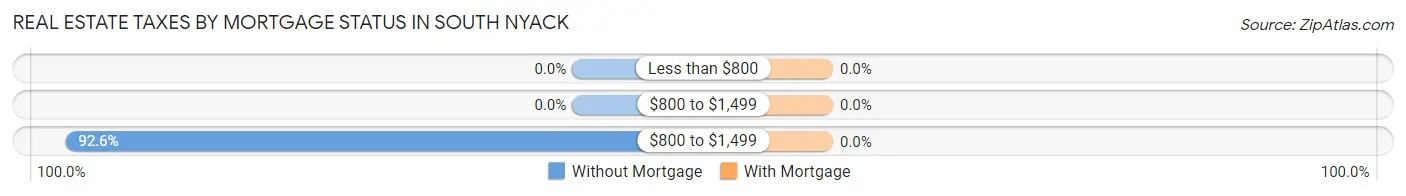
| Property Taxes | Without Mortgage | With Mortgage |
| Less than $800 | 0 (0.0%) | 0 (0.0%) |
| $800 to $1,499 | 0 (0.0%) | 0 (0.0%) |
| $800 to $1,499 | 236 (92.5%) | 0 (0.0%) |
| Total | 255 (100.0%) | 409 (100.0%) |
Health & Disability in South Nyack
Health Insurance Coverage by Age in South Nyack
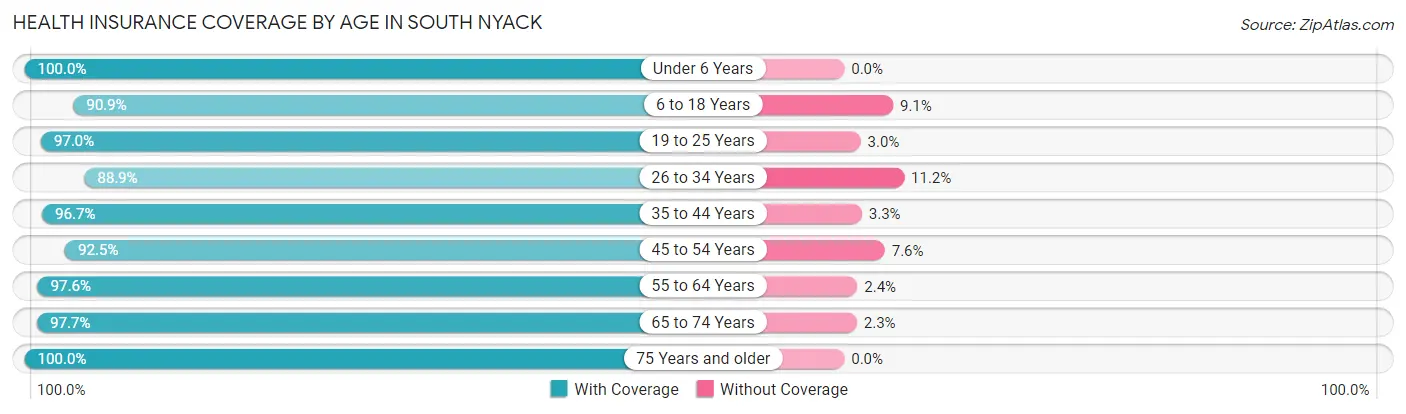
| Age Bracket | With Coverage | Without Coverage |
| Under 6 Years | 181 (100.0%) | 0 (0.0%) |
| 6 to 18 Years | 210 (90.9%) | 21 (9.1%) |
| 19 to 25 Years | 542 (97.0%) | 17 (3.0%) |
| 26 to 34 Years | 239 (88.8%) | 30 (11.2%) |
| 35 to 44 Years | 354 (96.7%) | 12 (3.3%) |
| 45 to 54 Years | 257 (92.4%) | 21 (7.5%) |
| 55 to 64 Years | 360 (97.6%) | 9 (2.4%) |
| 65 to 74 Years | 292 (97.7%) | 7 (2.3%) |
| 75 Years and older | 189 (100.0%) | 0 (0.0%) |
| Total | 2,624 (95.7%) | 117 (4.3%) |
Health Insurance Coverage by Citizenship Status in South Nyack
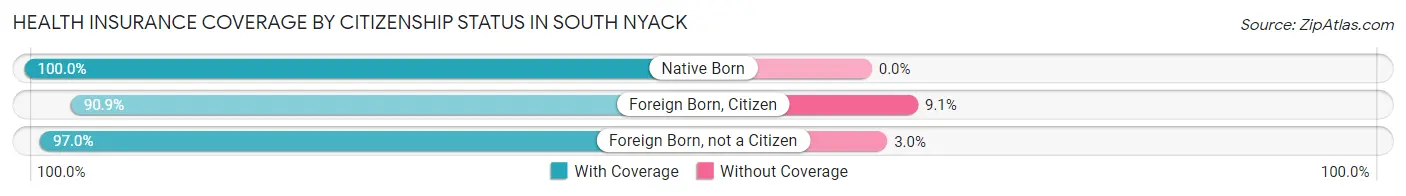
| Citizenship Status | With Coverage | Without Coverage |
| Native Born | 181 (100.0%) | 0 (0.0%) |
| Foreign Born, Citizen | 210 (90.9%) | 21 (9.1%) |
| Foreign Born, not a Citizen | 542 (97.0%) | 17 (3.0%) |
Health Insurance Coverage by Household Income in South Nyack
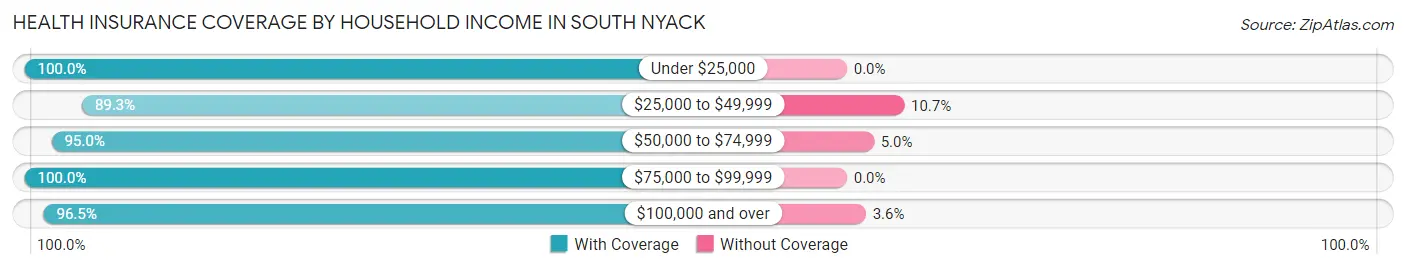
| Household Income | With Coverage | Without Coverage |
| Under $25,000 | 88 (100.0%) | 0 (0.0%) |
| $25,000 to $49,999 | 183 (89.3%) | 22 (10.7%) |
| $50,000 to $74,999 | 226 (95.0%) | 12 (5.0%) |
| $75,000 to $99,999 | 286 (100.0%) | 0 (0.0%) |
| $100,000 and over | 1,303 (96.5%) | 48 (3.5%) |
Public vs Private Health Insurance Coverage by Age in South Nyack
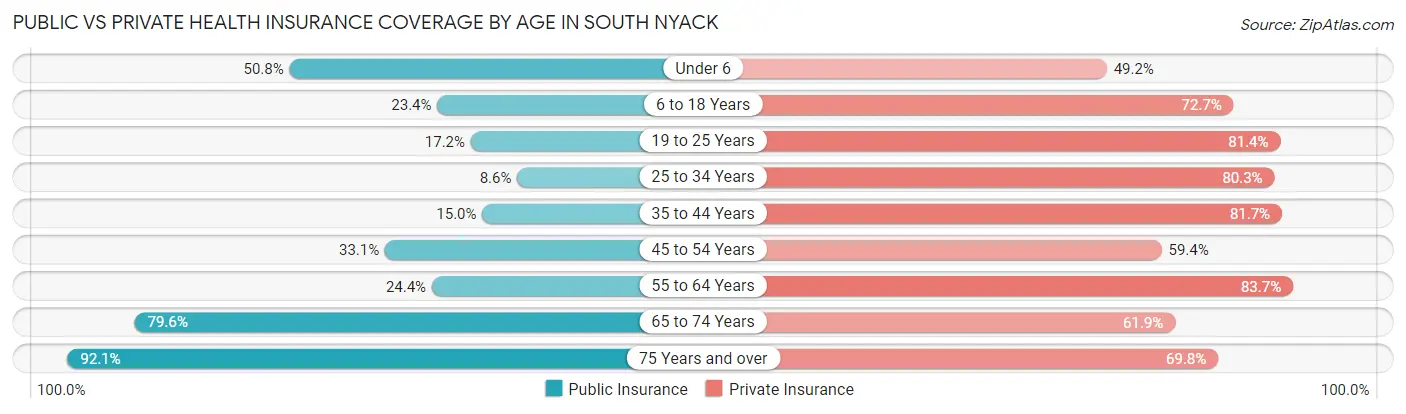
| Age Bracket | Public Insurance | Private Insurance |
| Under 6 | 92 (50.8%) | 89 (49.2%) |
| 6 to 18 Years | 54 (23.4%) | 168 (72.7%) |
| 19 to 25 Years | 96 (17.2%) | 455 (81.4%) |
| 25 to 34 Years | 23 (8.6%) | 216 (80.3%) |
| 35 to 44 Years | 55 (15.0%) | 299 (81.7%) |
| 45 to 54 Years | 92 (33.1%) | 165 (59.4%) |
| 55 to 64 Years | 90 (24.4%) | 309 (83.7%) |
| 65 to 74 Years | 238 (79.6%) | 185 (61.9%) |
| 75 Years and over | 174 (92.1%) | 132 (69.8%) |
| Total | 914 (33.4%) | 2,018 (73.6%) |
Disability Status by Sex by Age in South Nyack
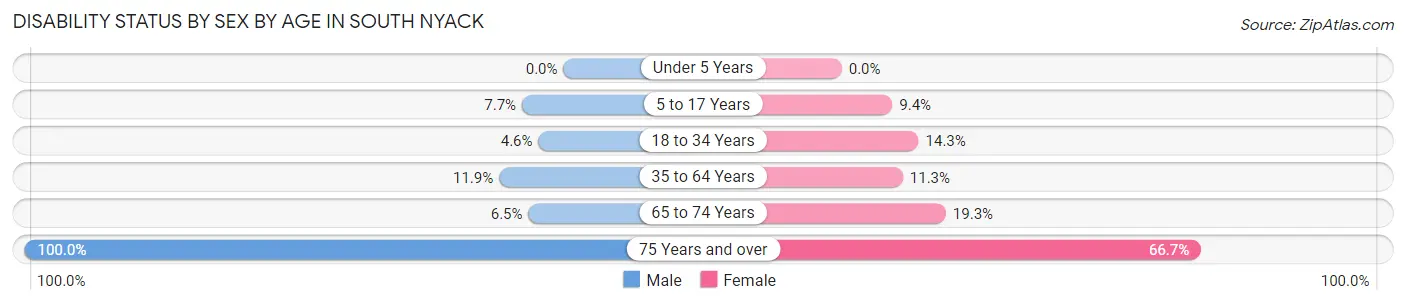
| Age Bracket | Male | Female |
| Under 5 Years | 0 (0.0%) | 0 (0.0%) |
| 5 to 17 Years | 5 (7.7%) | 15 (9.4%) |
| 18 to 34 Years | 18 (4.6%) | 75 (14.3%) |
| 35 to 64 Years | 43 (11.9%) | 74 (11.3%) |
| 65 to 74 Years | 8 (6.5%) | 34 (19.3%) |
| 75 Years and over | 87 (100.0%) | 68 (66.7%) |
Disability Class by Sex by Age in South Nyack
Disability Class: Hearing Difficulty
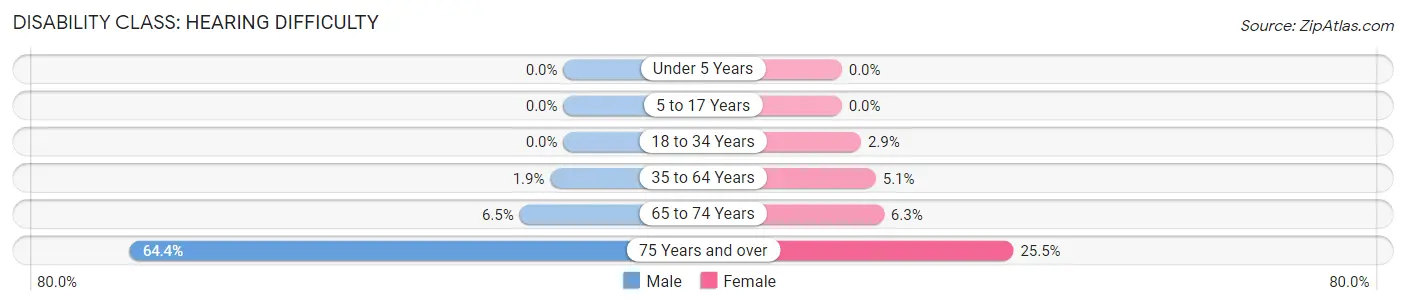
| Age Bracket | Male | Female |
| Under 5 Years | 0 (0.0%) | 0 (0.0%) |
| 5 to 17 Years | 0 (0.0%) | 0 (0.0%) |
| 18 to 34 Years | 0 (0.0%) | 15 (2.9%) |
| 35 to 64 Years | 7 (1.9%) | 33 (5.1%) |
| 65 to 74 Years | 8 (6.5%) | 11 (6.2%) |
| 75 Years and over | 56 (64.4%) | 26 (25.5%) |
Disability Class: Vision Difficulty
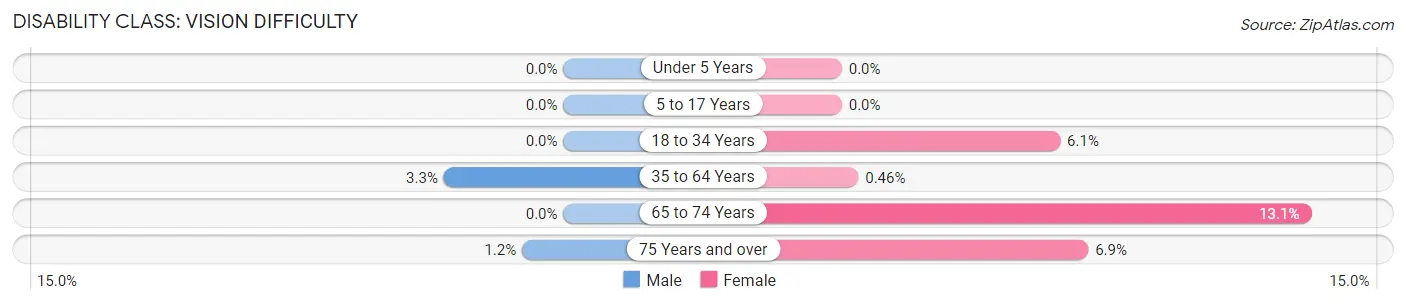
| Age Bracket | Male | Female |
| Under 5 Years | 0 (0.0%) | 0 (0.0%) |
| 5 to 17 Years | 0 (0.0%) | 0 (0.0%) |
| 18 to 34 Years | 0 (0.0%) | 32 (6.1%) |
| 35 to 64 Years | 12 (3.3%) | 3 (0.5%) |
| 65 to 74 Years | 0 (0.0%) | 23 (13.1%) |
| 75 Years and over | 1 (1.1%) | 7 (6.9%) |
Disability Class: Cognitive Difficulty
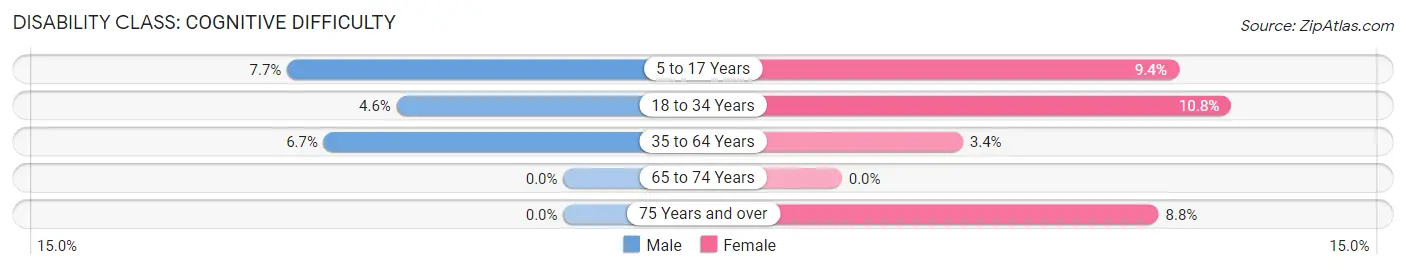
| Age Bracket | Male | Female |
| 5 to 17 Years | 5 (7.7%) | 15 (9.4%) |
| 18 to 34 Years | 18 (4.6%) | 57 (10.8%) |
| 35 to 64 Years | 24 (6.7%) | 22 (3.4%) |
| 65 to 74 Years | 0 (0.0%) | 0 (0.0%) |
| 75 Years and over | 0 (0.0%) | 9 (8.8%) |
Disability Class: Ambulatory Difficulty
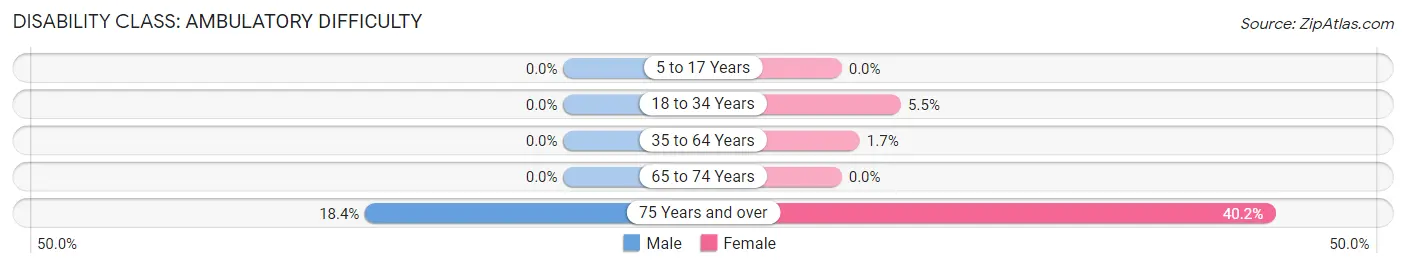
| Age Bracket | Male | Female |
| 5 to 17 Years | 0 (0.0%) | 0 (0.0%) |
| 18 to 34 Years | 0 (0.0%) | 29 (5.5%) |
| 35 to 64 Years | 0 (0.0%) | 11 (1.7%) |
| 65 to 74 Years | 0 (0.0%) | 0 (0.0%) |
| 75 Years and over | 16 (18.4%) | 41 (40.2%) |
Disability Class: Self-Care Difficulty
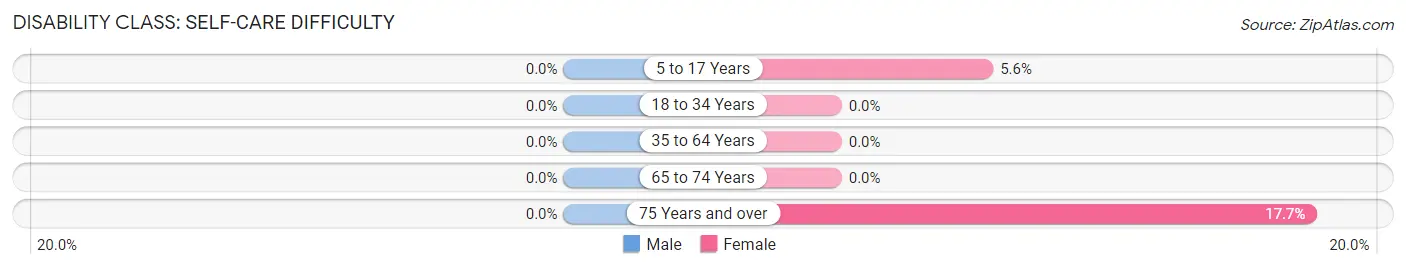
| Age Bracket | Male | Female |
| 5 to 17 Years | 0 (0.0%) | 9 (5.6%) |
| 18 to 34 Years | 0 (0.0%) | 0 (0.0%) |
| 35 to 64 Years | 0 (0.0%) | 0 (0.0%) |
| 65 to 74 Years | 0 (0.0%) | 0 (0.0%) |
| 75 Years and over | 0 (0.0%) | 18 (17.6%) |
Technology Access in South Nyack
Computing Device Access in South Nyack
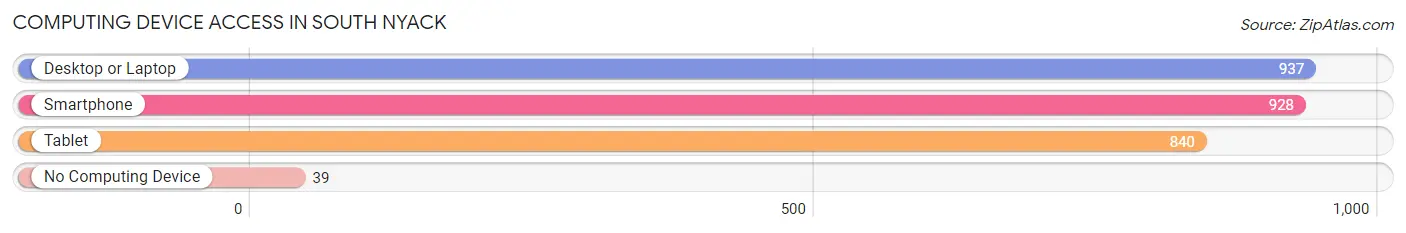
| Device Type | # Households | % Households |
| Desktop or Laptop | 937 | 90.8% |
| Smartphone | 928 | 89.9% |
| Tablet | 840 | 81.4% |
| No Computing Device | 39 | 3.8% |
| Total | 1,032 | 100.0% |
Internet Access in South Nyack
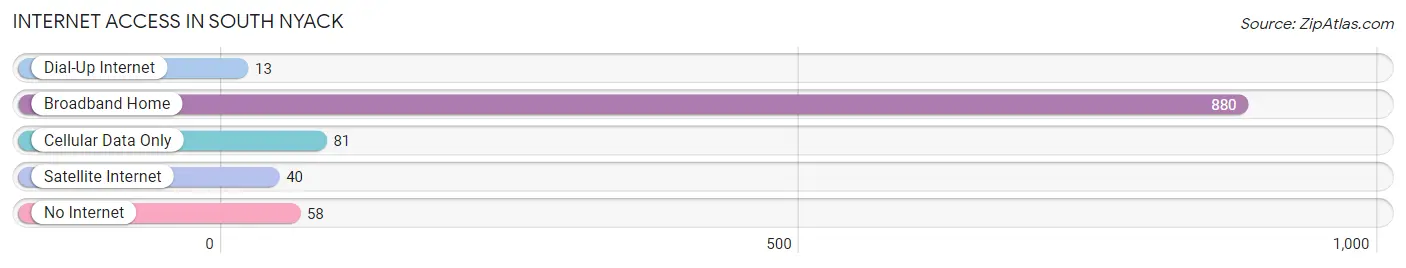
| Internet Type | # Households | % Households |
| Dial-Up Internet | 13 | 1.3% |
| Broadband Home | 880 | 85.3% |
| Cellular Data Only | 81 | 7.9% |
| Satellite Internet | 40 | 3.9% |
| No Internet | 58 | 5.6% |
| Total | 1,032 | 100.0% |
South Nyack Summary
Nestled in the Hudson Valley, the village of South Nyack is a small community located in Rockland County, New York. With a population of 3,412 as of the 2010 census, South Nyack is a small but vibrant community with a rich history and a bright future.
History
The area that is now South Nyack was originally inhabited by the Munsee-speaking Lenape Native Americans. The first European settlers arrived in the area in the late 17th century, and the village was officially incorporated in 1872.
The village was originally known as “Nyack Landing”, and was a popular stop for steamboats traveling up and down the Hudson River. In the late 19th century, the village was renamed “South Nyack” to distinguish it from the nearby village of Nyack.
The village was home to a number of prominent industries in the 19th and early 20th centuries, including a brickyard, a paper mill, and a quarry. The village was also home to a number of prominent families, including the Blauvelt family, who owned a large estate in the area.
Geography
South Nyack is located in the Hudson Valley region of New York, approximately 25 miles north of New York City. The village is situated on the west bank of the Hudson River, and is bordered by the villages of Nyack and Grand View-on-Hudson to the north, and the towns of Orangetown and Clarkstown to the east and south, respectively.
The village covers an area of 1.2 square miles, and is home to a number of parks and recreational areas, including Memorial Park, which is located on the banks of the Hudson River.
Economy
South Nyack is primarily a residential community, and the village’s economy is largely driven by the service sector. The village is home to a number of small businesses, including restaurants, retail stores, and professional services.
The village is also home to a number of corporate offices, including the headquarters of the New York State Thruway Authority.
Demographics
As of the 2010 census, South Nyack had a population of 3,412. The population is predominantly white (90.2%), with small percentages of African American (3.2%), Asian (2.2%), and Hispanic (2.1%) residents.
The median household income in South Nyack is $90,945, and the median home value is $541,400. The village has a high rate of homeownership (83.2%), and the unemployment rate is 3.2%.
Conclusion
South Nyack is a small but vibrant community located in the Hudson Valley region of New York. With a rich history and a bright future, South Nyack is a great place to live, work, and play. The village is home to a number of small businesses, corporate offices, and recreational areas, and the population is predominantly white. With a median household income of $90,945 and a median home value of $541,400, South Nyack is an attractive place to live and work.
Common Questions
What is Per Capita Income in South Nyack?
Per Capita income in South Nyack is $57,269.
What is the Median Family Income in South Nyack?
Median Family Income in South Nyack is $118,750.
What is the Median Household income in South Nyack?
Median Household Income in South Nyack is $113,558.
What is Income or Wage Gap in South Nyack?
Income or Wage Gap in South Nyack is 4.9%.
Women in South Nyack earn 95.1 cents for every dollar earned by a man.
What is Inequality or Gini Index in South Nyack?
Inequality or Gini Index in South Nyack is 0.46.
What is the Total Population of South Nyack?
Total Population of South Nyack is 2,745.
What is the Total Male Population of South Nyack?
Total Male Population of South Nyack is 1,070.
What is the Total Female Population of South Nyack?
Total Female Population of South Nyack is 1,675.
What is the Ratio of Males per 100 Females in South Nyack?
There are 63.88 Males per 100 Females in South Nyack.
What is the Ratio of Females per 100 Males in South Nyack?
There are 156.54 Females per 100 Males in South Nyack.
What is the Median Population Age in South Nyack?
Median Population Age in South Nyack is 38.2 Years.
What is the Average Family Size in South Nyack
Average Family Size in South Nyack is 2.5 People.
What is the Average Household Size in South Nyack
Average Household Size in South Nyack is 2.1 People.
How Large is the Labor Force in South Nyack?
There are 1,676 People in the Labor Forcein in South Nyack.
What is the Percentage of People in the Labor Force in South Nyack?
68.6% of People are in the Labor Force in South Nyack.
What is the Unemployment Rate in South Nyack?
Unemployment Rate in South Nyack is 9.7%.