Bardonia, NY Map & Demographics
Bardonia Map
Bardonia Overview
$57,632
PER CAPITA INCOME
$163,125
AVG FAMILY INCOME
$131,406
AVG HOUSEHOLD INCOME
9.1%
WAGE / INCOME GAP [ % ]
90.9¢/ $1
WAGE / INCOME GAP [ $ ]
$6,797
FAMILY INCOME DEFICIT
0.41
INEQUALITY / GINI INDEX
3,503
TOTAL POPULATION
1,648
MALE POPULATION
1,855
FEMALE POPULATION
88.84
MALES / 100 FEMALES
112.56
FEMALES / 100 MALES
54.2
MEDIAN AGE
2.8
AVG FAMILY SIZE
2.4
AVG HOUSEHOLD SIZE
1,837
LABOR FORCE [ PEOPLE ]
61.0%
PERCENT IN LABOR FORCE
4.3%
UNEMPLOYMENT RATE
Income in Bardonia
Income Overview in Bardonia
Per Capita Income in Bardonia is $57,632, while median incomes of families and households are $163,125 and $131,406 respectively.
| Characteristic | Number | Measure |
| Per Capita Income | 3,503 | $57,632 |
| Median Family Income | 1,062 | $163,125 |
| Mean Family Income | 1,062 | $162,987 |
| Median Household Income | 1,444 | $131,406 |
| Mean Household Income | 1,444 | $136,985 |
| Income Deficit | 1,062 | $6,797 |
| Wage / Income Gap (%) | 3,503 | 9.05% |
| Wage / Income Gap ($) | 3,503 | 90.95¢ per $1 |
| Gini / Inequality Index | 3,503 | 0.41 |
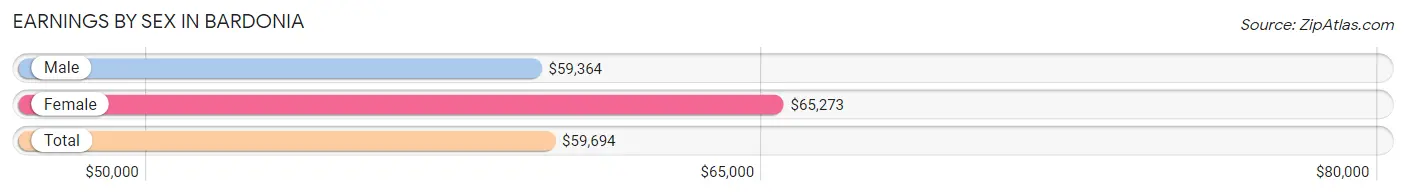
Earnings by Sex in Bardonia
Average Earnings in Bardonia are $59,694, $59,364 for men and $65,273 for women, a difference of 9.0%.
| Sex | Number | Average Earnings |
| Male | 937 (49.6%) | $59,364 |
| Female | 951 (50.4%) | $65,273 |
| Total | 1,888 (100.0%) | $59,694 |
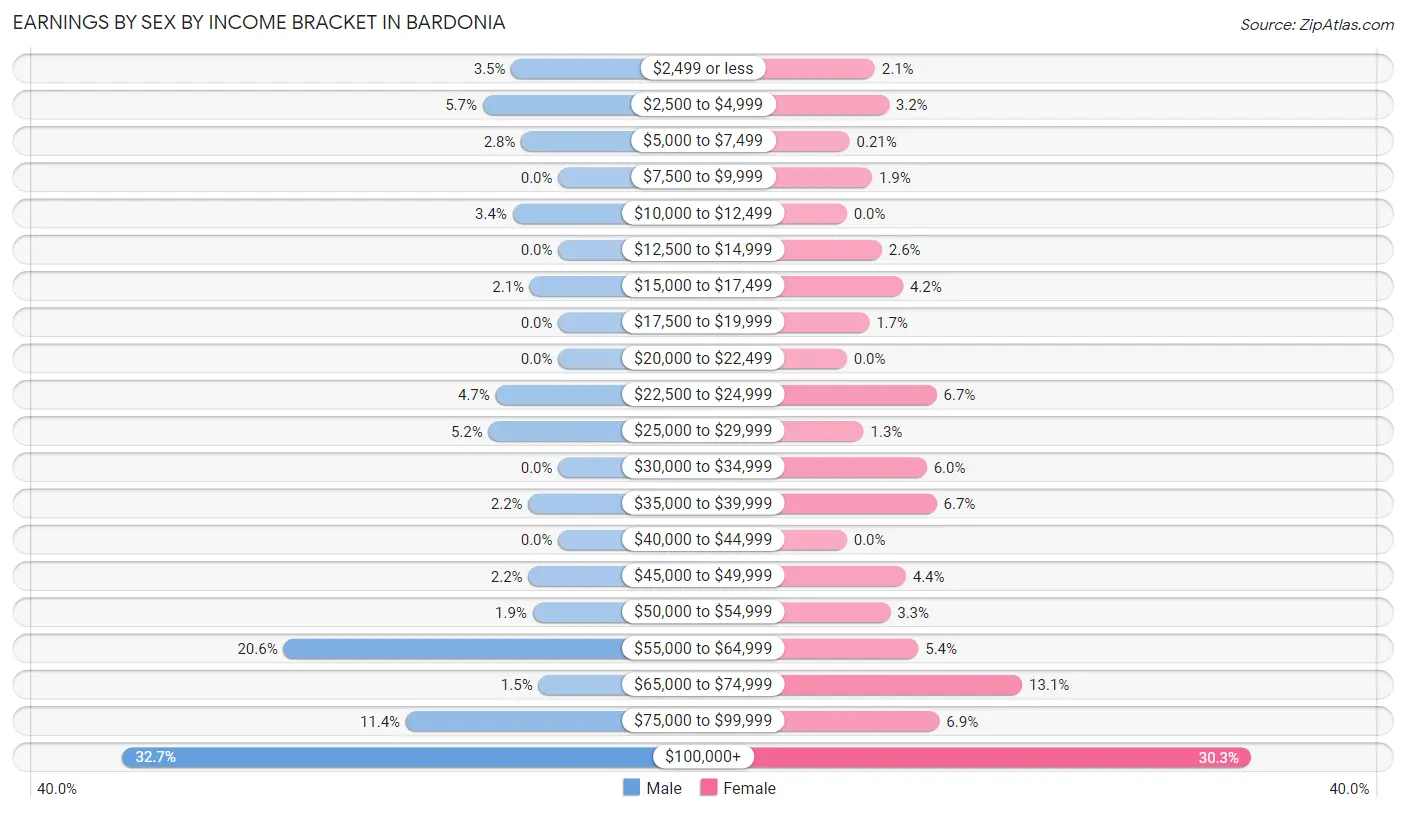
Earnings by Sex by Income Bracket in Bardonia
The most common earnings brackets in Bardonia are $100,000+ for men (306 | 32.7%) and $100,000+ for women (288 | 30.3%).
| Income | Male | Female |
| $2,499 or less | 33 (3.5%) | 20 (2.1%) |
| $2,500 to $4,999 | 53 (5.7%) | 30 (3.2%) |
| $5,000 to $7,499 | 26 (2.8%) | 2 (0.2%) |
| $7,500 to $9,999 | 0 (0.0%) | 18 (1.9%) |
| $10,000 to $12,499 | 32 (3.4%) | 0 (0.0%) |
| $12,500 to $14,999 | 0 (0.0%) | 25 (2.6%) |
| $15,000 to $17,499 | 20 (2.1%) | 40 (4.2%) |
| $17,500 to $19,999 | 0 (0.0%) | 16 (1.7%) |
| $20,000 to $22,499 | 0 (0.0%) | 0 (0.0%) |
| $22,500 to $24,999 | 44 (4.7%) | 64 (6.7%) |
| $25,000 to $29,999 | 49 (5.2%) | 12 (1.3%) |
| $30,000 to $34,999 | 0 (0.0%) | 57 (6.0%) |
| $35,000 to $39,999 | 21 (2.2%) | 64 (6.7%) |
| $40,000 to $44,999 | 0 (0.0%) | 0 (0.0%) |
| $45,000 to $49,999 | 21 (2.2%) | 42 (4.4%) |
| $50,000 to $54,999 | 18 (1.9%) | 31 (3.3%) |
| $55,000 to $64,999 | 193 (20.6%) | 51 (5.4%) |
| $65,000 to $74,999 | 14 (1.5%) | 125 (13.1%) |
| $75,000 to $99,999 | 107 (11.4%) | 66 (6.9%) |
| $100,000+ | 306 (32.7%) | 288 (30.3%) |
| Total | 937 (100.0%) | 951 (100.0%) |
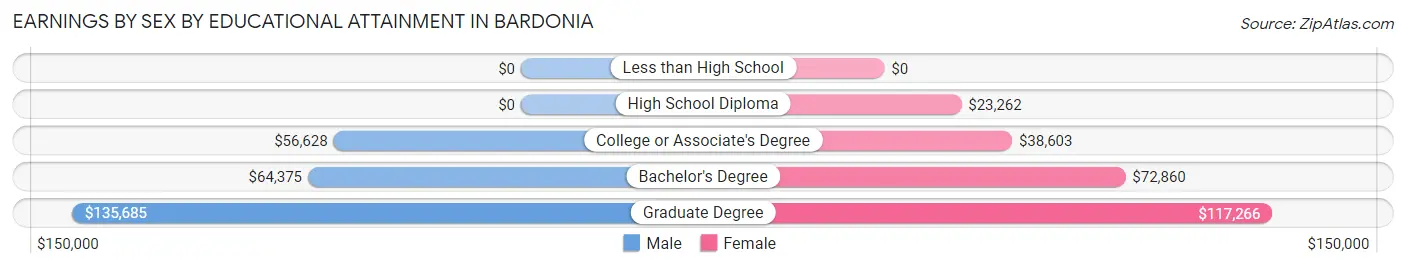
Earnings by Sex by Educational Attainment in Bardonia
Average earnings in Bardonia are $64,491 for men and $59,015 for women, a difference of 8.5%. Men with an educational attainment of graduate degree enjoy the highest average annual earnings of $135,685, while those with college or associate's degree education earn the least with $56,628. Women with an educational attainment of graduate degree earn the most with the average annual earnings of $117,266, while those with high school diploma education have the smallest earnings of $23,262.
| Educational Attainment | Male Income | Female Income |
| Less than High School | - | - |
| High School Diploma | - | - |
| College or Associate's Degree | $56,628 | $38,603 |
| Bachelor's Degree | $64,375 | $72,860 |
| Graduate Degree | $135,685 | $117,266 |
| Total | $64,491 | $59,015 |
Family Income in Bardonia
Family Income Brackets in Bardonia
According to the Bardonia family income data, there are 326 families falling into the $150,000 to $199,999 income range, which is the most common income bracket and makes up 30.7% of all families.
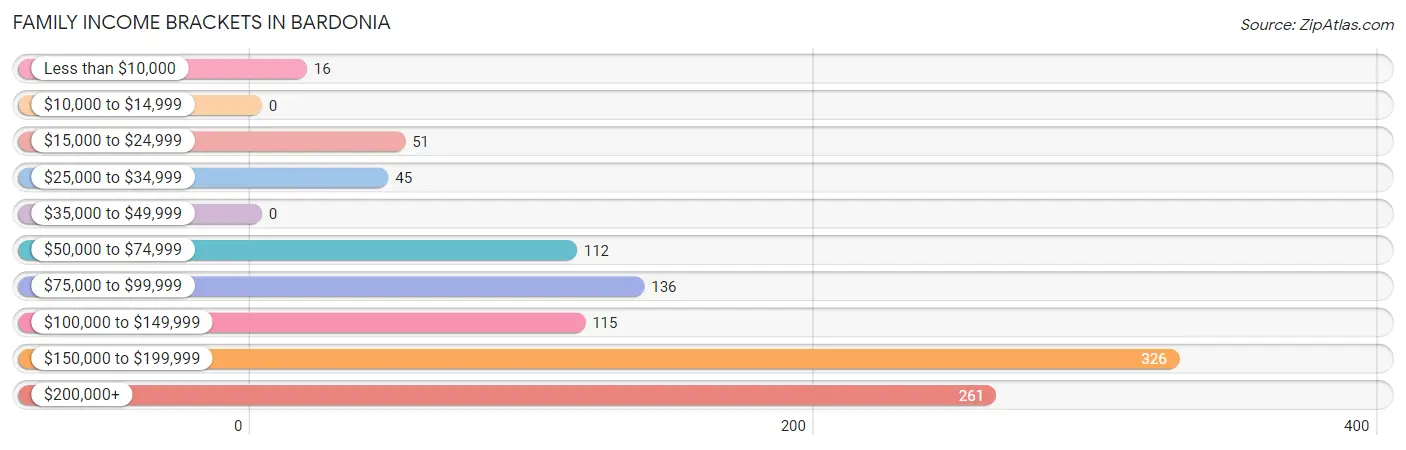
| Income Bracket | # Families | % Families |
| Less than $10,000 | 16 | 1.5% |
| $10,000 to $14,999 | 0 | 0.0% |
| $15,000 to $24,999 | 51 | 4.8% |
| $25,000 to $34,999 | 45 | 4.2% |
| $35,000 to $49,999 | 0 | 0.0% |
| $50,000 to $74,999 | 112 | 10.5% |
| $75,000 to $99,999 | 136 | 12.8% |
| $100,000 to $149,999 | 115 | 10.8% |
| $150,000 to $199,999 | 326 | 30.7% |
| $200,000+ | 261 | 24.6% |
Family Income by Famaliy Size in Bardonia
4-person families (339 | 31.9%) account for the highest median family income in Bardonia with $164,347 per family, while 2-person families (437 | 41.1%) have the highest median income of $67,910 per family member.
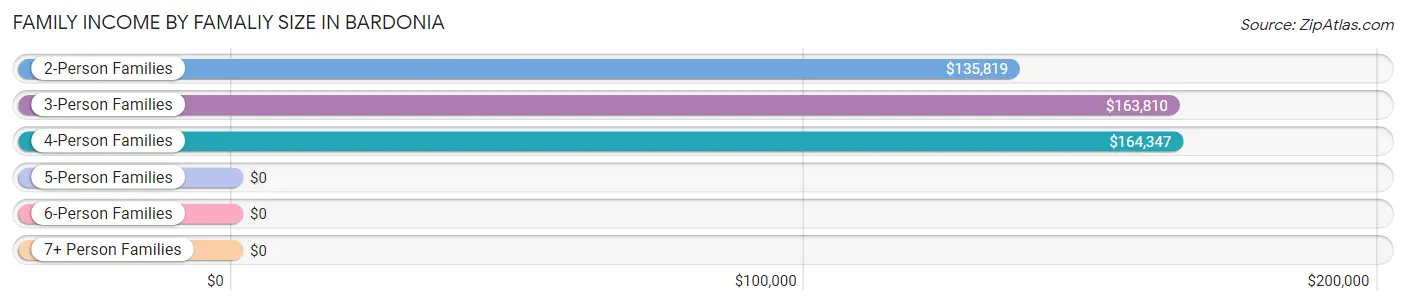
| Income Bracket | # Families | Median Income |
| 2-Person Families | 437 (41.1%) | $135,819 |
| 3-Person Families | 224 (21.1%) | $163,810 |
| 4-Person Families | 339 (31.9%) | $164,347 |
| 5-Person Families | 33 (3.1%) | $0 |
| 6-Person Families | 5 (0.5%) | $0 |
| 7+ Person Families | 24 (2.3%) | $0 |
| Total | 1,062 (100.0%) | $163,125 |
Family Income by Number of Earners in Bardonia
The median family income in Bardonia is $163,125, with families comprising 2 earners (529) having the highest median family income of $198,208, while families with no earners (160) have the lowest median family income of $58,214, accounting for 49.8% and 15.1% of families, respectively.
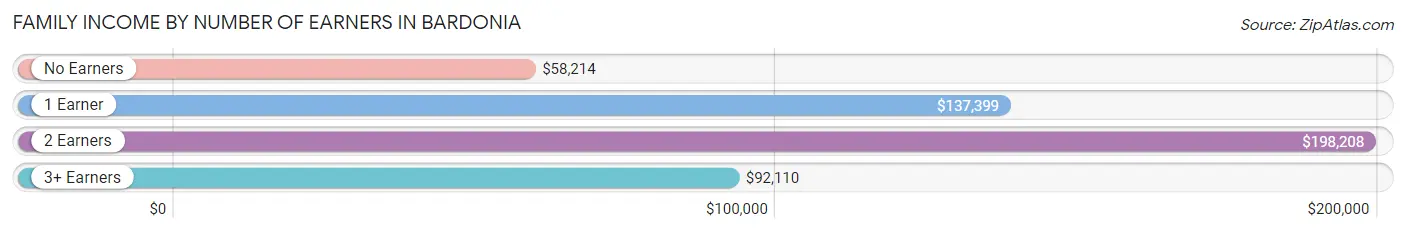
| Number of Earners | # Families | Median Income |
| No Earners | 160 (15.1%) | $58,214 |
| 1 Earner | 189 (17.8%) | $137,399 |
| 2 Earners | 529 (49.8%) | $198,208 |
| 3+ Earners | 184 (17.3%) | $92,110 |
| Total | 1,062 (100.0%) | $163,125 |
Household Income in Bardonia
Household Income Brackets in Bardonia
With 339 households falling in the category, the $150,000 to $199,999 income range is the most frequent in Bardonia, accounting for 23.5% of all households. In contrast, only 27 households (1.9%) fall into the $10,000 to $14,999 income bracket, making it the least populous group.
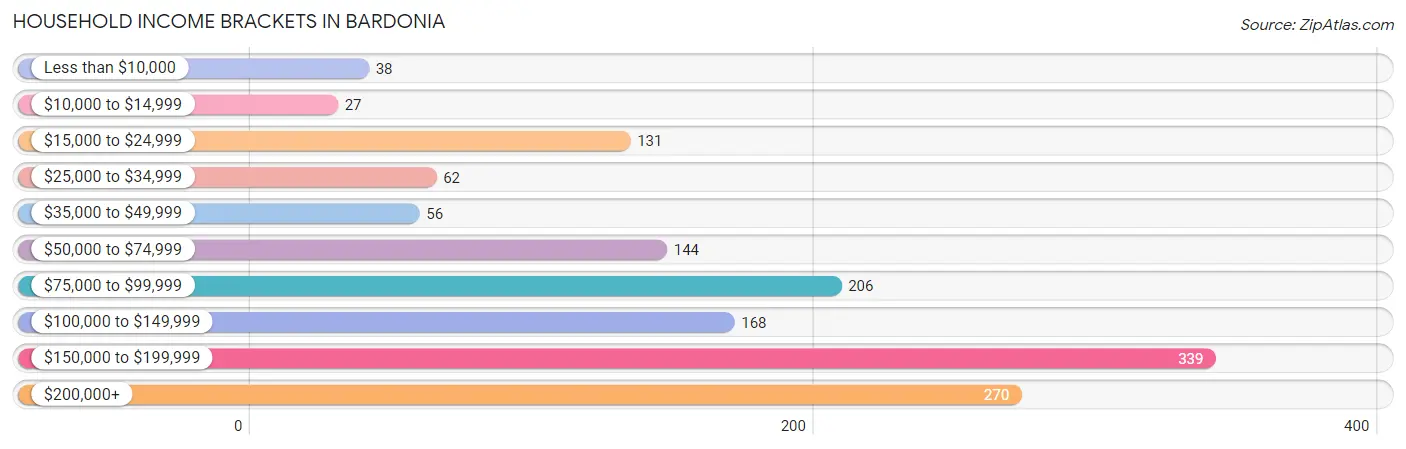
| Income Bracket | # Households | % Households |
| Less than $10,000 | 38 | 2.6% |
| $10,000 to $14,999 | 27 | 1.9% |
| $15,000 to $24,999 | 131 | 9.1% |
| $25,000 to $34,999 | 62 | 4.3% |
| $35,000 to $49,999 | 56 | 3.9% |
| $50,000 to $74,999 | 144 | 10.0% |
| $75,000 to $99,999 | 206 | 14.3% |
| $100,000 to $149,999 | 168 | 11.6% |
| $150,000 to $199,999 | 339 | 23.5% |
| $200,000+ | 270 | 18.7% |
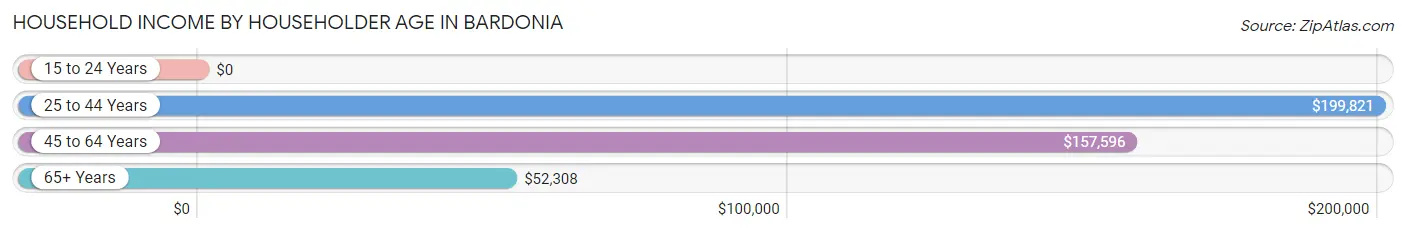
Household Income by Householder Age in Bardonia
The median household income in Bardonia is $131,406, with the highest median household income of $199,821 found in the 25 to 44 years age bracket for the primary householder. A total of 286 households (19.8%) fall into this category.
| Income Bracket | # Households | Median Income |
| 15 to 24 Years | 0 (0.0%) | $0 |
| 25 to 44 Years | 286 (19.8%) | $199,821 |
| 45 to 64 Years | 570 (39.5%) | $157,596 |
| 65+ Years | 588 (40.7%) | $52,308 |
| Total | 1,444 (100.0%) | $131,406 |
Poverty in Bardonia
Income Below Poverty by Sex and Age in Bardonia
With 4.4% poverty level for males and 10.7% for females among the residents of Bardonia, 75 year old and over males and 18 to 24 year old females are the most vulnerable to poverty, with 28 males (15.8%) and 28 females (23.7%) in their respective age groups living below the poverty level.
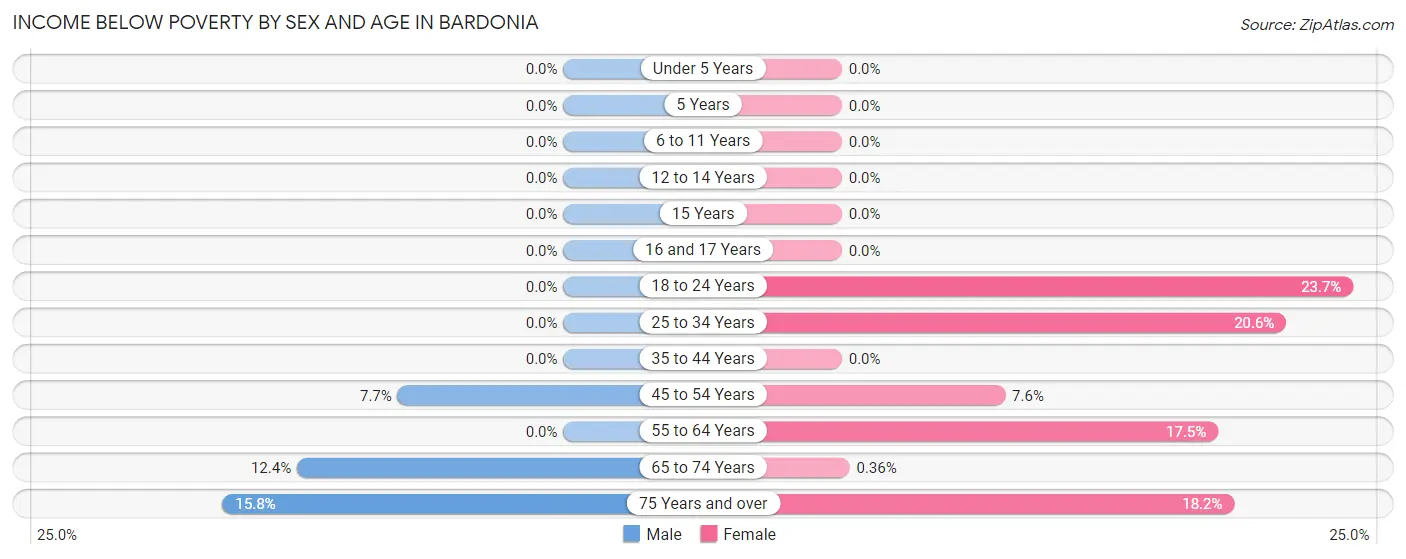
| Age Bracket | Male | Female |
| Under 5 Years | 0 (0.0%) | 0 (0.0%) |
| 5 Years | 0 (0.0%) | 0 (0.0%) |
| 6 to 11 Years | 0 (0.0%) | 0 (0.0%) |
| 12 to 14 Years | 0 (0.0%) | 0 (0.0%) |
| 15 Years | 0 (0.0%) | 0 (0.0%) |
| 16 and 17 Years | 0 (0.0%) | 0 (0.0%) |
| 18 to 24 Years | 0 (0.0%) | 28 (23.7%) |
| 25 to 34 Years | 0 (0.0%) | 20 (20.6%) |
| 35 to 44 Years | 0 (0.0%) | 0 (0.0%) |
| 45 to 54 Years | 22 (7.7%) | 21 (7.6%) |
| 55 to 64 Years | 0 (0.0%) | 66 (17.5%) |
| 65 to 74 Years | 22 (12.4%) | 1 (0.4%) |
| 75 Years and over | 28 (15.8%) | 63 (18.2%) |
| Total | 72 (4.4%) | 199 (10.7%) |
Income Above Poverty by Sex and Age in Bardonia
According to the poverty statistics in Bardonia, males aged under 5 years and females aged under 5 years are the age groups that are most secure financially, with 100.0% of males and 100.0% of females in these age groups living above the poverty line.
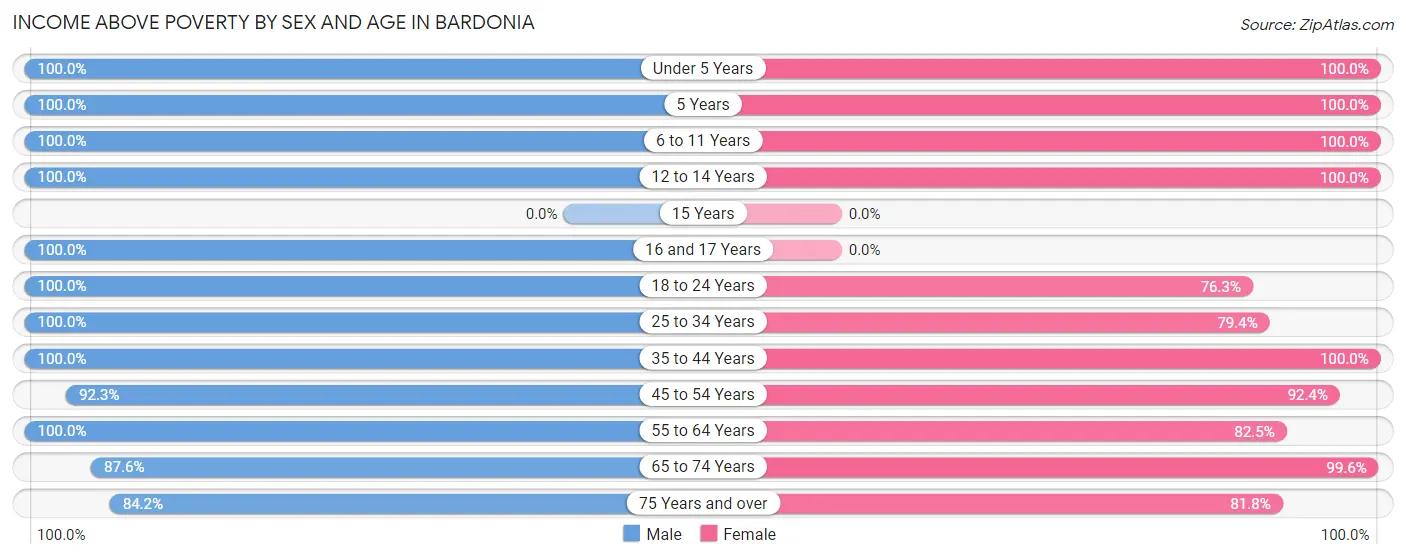
| Age Bracket | Male | Female |
| Under 5 Years | 126 (100.0%) | 27 (100.0%) |
| 5 Years | 17 (100.0%) | 16 (100.0%) |
| 6 to 11 Years | 113 (100.0%) | 81 (100.0%) |
| 12 to 14 Years | 66 (100.0%) | 46 (100.0%) |
| 15 Years | 0 (0.0%) | 0 (0.0%) |
| 16 and 17 Years | 29 (100.0%) | 0 (0.0%) |
| 18 to 24 Years | 60 (100.0%) | 90 (76.3%) |
| 25 to 34 Years | 144 (100.0%) | 77 (79.4%) |
| 35 to 44 Years | 241 (100.0%) | 190 (100.0%) |
| 45 to 54 Years | 264 (92.3%) | 256 (92.4%) |
| 55 to 64 Years | 211 (100.0%) | 312 (82.5%) |
| 65 to 74 Years | 156 (87.6%) | 278 (99.6%) |
| 75 Years and over | 149 (84.2%) | 283 (81.8%) |
| Total | 1,576 (95.6%) | 1,656 (89.3%) |
Income Below Poverty Among Married-Couple Families in Bardonia
The poverty statistics for married-couple families in Bardonia show that 7.1% or 67 of the total 946 families live below the poverty line. Families with no children have the highest poverty rate of 10.0%, comprising of 67 families. On the other hand, families with 1 or 2 children have the lowest poverty rate of 0.0%, which includes 0 families.
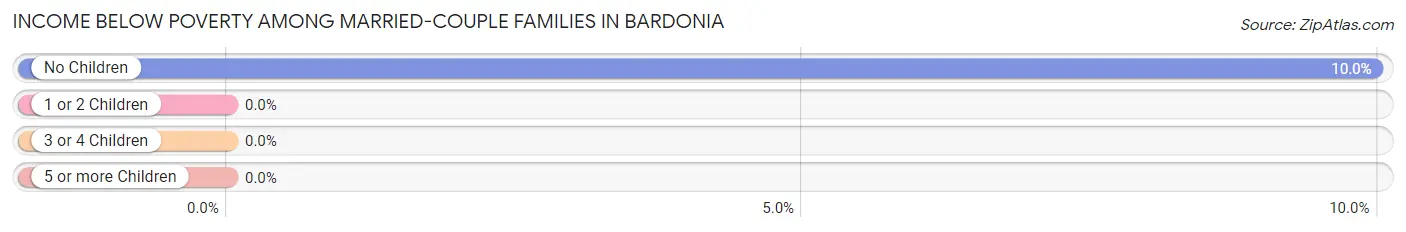
| Children | Above Poverty | Below Poverty |
| No Children | 605 (90.0%) | 67 (10.0%) |
| 1 or 2 Children | 217 (100.0%) | 0 (0.0%) |
| 3 or 4 Children | 57 (100.0%) | 0 (0.0%) |
| 5 or more Children | 0 (0.0%) | 0 (0.0%) |
| Total | 879 (92.9%) | 67 (7.1%) |
Income Below Poverty Among Single-Parent Households in Bardonia
| Children | Single Father | Single Mother |
| No Children | 0 (0.0%) | 0 (0.0%) |
| 1 or 2 Children | 0 (0.0%) | 0 (0.0%) |
| 3 or 4 Children | 0 (0.0%) | 0 (0.0%) |
| 5 or more Children | 0 (0.0%) | 0 (0.0%) |
| Total | 0 (0.0%) | 0 (0.0%) |
Income Below Poverty Among Married-Couple vs Single-Parent Households in Bardonia
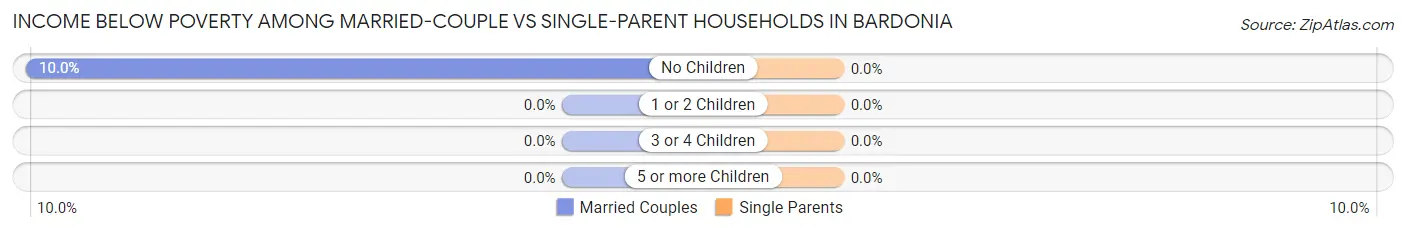
| Children | Married-Couple Families | Single-Parent Households |
| No Children | 67 (10.0%) | 0 (0.0%) |
| 1 or 2 Children | 0 (0.0%) | 0 (0.0%) |
| 3 or 4 Children | 0 (0.0%) | 0 (0.0%) |
| 5 or more Children | 0 (0.0%) | 0 (0.0%) |
| Total | 67 (7.1%) | 0 (0.0%) |
Race in Bardonia
The most populous races in Bardonia are White / Caucasian (2,559 | 73.1%), Asian (705 | 20.1%), and Hispanic or Latino (324 | 9.2%).
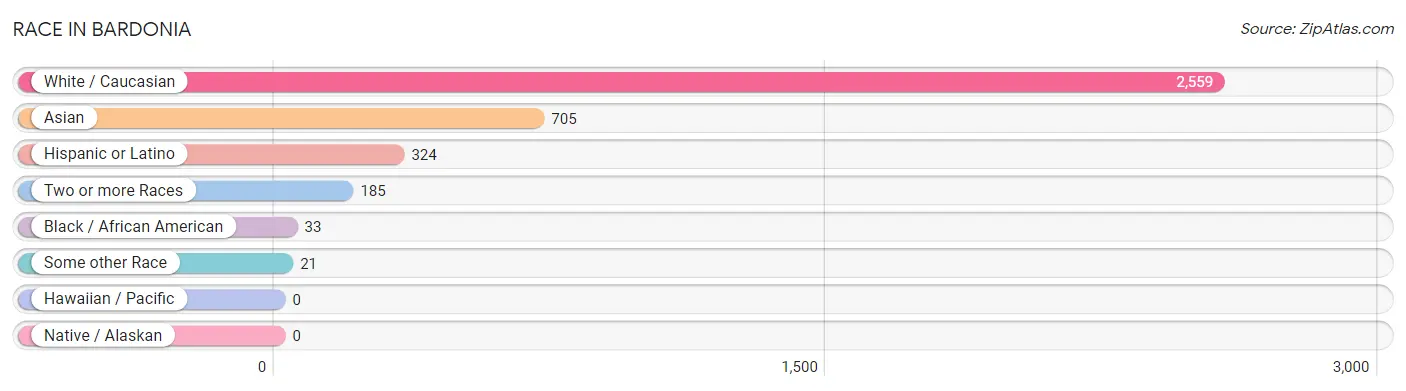
| Race | # Population | % Population |
| Asian | 705 | 20.1% |
| Black / African American | 33 | 0.9% |
| Hawaiian / Pacific | 0 | 0.0% |
| Hispanic or Latino | 324 | 9.2% |
| Native / Alaskan | 0 | 0.0% |
| White / Caucasian | 2,559 | 73.1% |
| Two or more Races | 185 | 5.3% |
| Some other Race | 21 | 0.6% |
| Total | 3,503 | 100.0% |
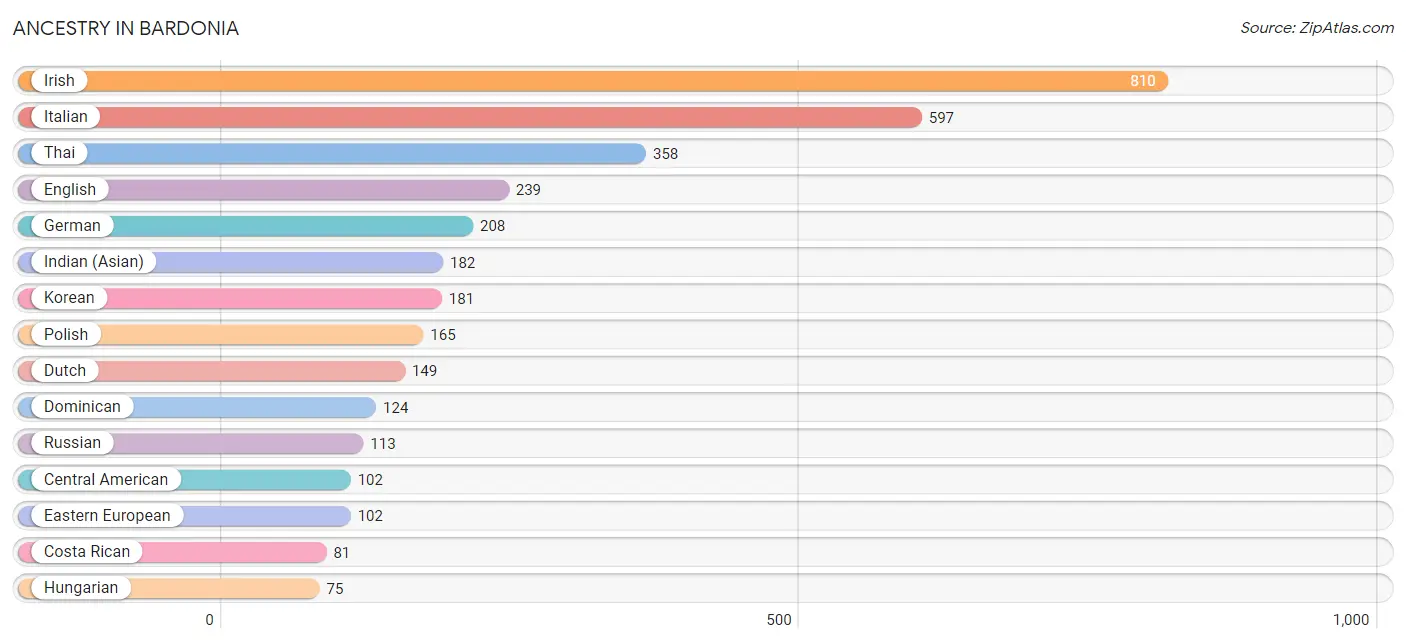
Ancestry in Bardonia
The most populous ancestries reported in Bardonia are Irish (810 | 23.1%), Italian (597 | 17.0%), Thai (358 | 10.2%), English (239 | 6.8%), and German (208 | 5.9%), together accounting for 63.1% of all Bardonia residents.
| Ancestry | # Population | % Population |
| American | 43 | 1.2% |
| Arab | 12 | 0.3% |
| Armenian | 56 | 1.6% |
| Austrian | 63 | 1.8% |
| Burmese | 2 | 0.1% |
| Canadian | 22 | 0.6% |
| Central American | 102 | 2.9% |
| Costa Rican | 81 | 2.3% |
| Dominican | 124 | 3.5% |
| Dutch | 149 | 4.3% |
| Eastern European | 102 | 2.9% |
| Ecuadorian | 27 | 0.8% |
| English | 239 | 6.8% |
| European | 21 | 0.6% |
| French | 61 | 1.7% |
| French Canadian | 13 | 0.4% |
| German | 208 | 5.9% |
| Greek | 32 | 0.9% |
| Honduran | 21 | 0.6% |
| Hungarian | 75 | 2.1% |
| Indian (Asian) | 182 | 5.2% |
| Irish | 810 | 23.1% |
| Italian | 597 | 17.0% |
| Korean | 181 | 5.2% |
| Lebanese | 12 | 0.3% |
| Lithuanian | 14 | 0.4% |
| Nigerian | 33 | 0.9% |
| Norwegian | 17 | 0.5% |
| Polish | 165 | 4.7% |
| Puerto Rican | 56 | 1.6% |
| Romanian | 22 | 0.6% |
| Russian | 113 | 3.2% |
| Scottish | 22 | 0.6% |
| Slavic | 16 | 0.5% |
| South American | 27 | 0.8% |
| Spaniard | 13 | 0.4% |
| Subsaharan African | 33 | 0.9% |
| Thai | 358 | 10.2% | View All 38 Rows |
Immigrants in Bardonia
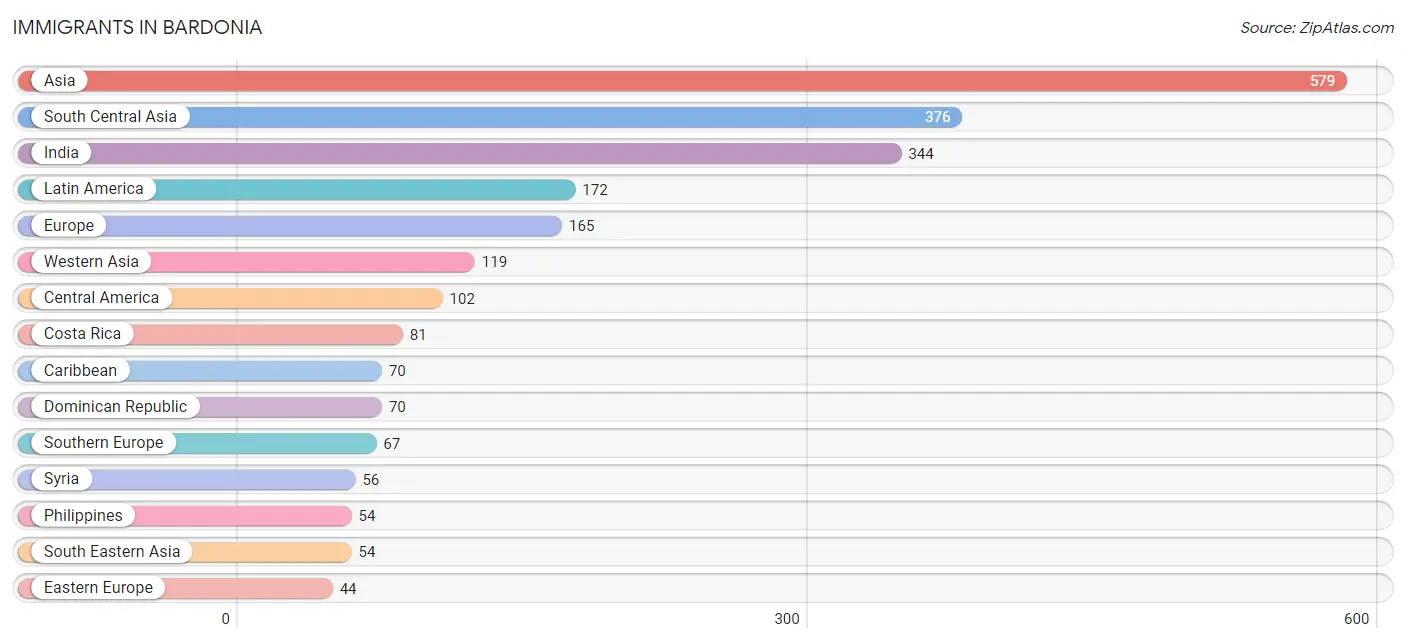
The most numerous immigrant groups reported in Bardonia came from Asia (579 | 16.5%), South Central Asia (376 | 10.7%), India (344 | 9.8%), Latin America (172 | 4.9%), and Europe (165 | 4.7%), together accounting for 46.7% of all Bardonia residents.
| Immigration Origin | # Population | % Population |
| Africa | 35 | 1.0% |
| Asia | 579 | 16.5% |
| Canada | 22 | 0.6% |
| Caribbean | 70 | 2.0% |
| Central America | 102 | 2.9% |
| China | 28 | 0.8% |
| Costa Rica | 81 | 2.3% |
| Dominican Republic | 70 | 2.0% |
| Eastern Asia | 30 | 0.9% |
| Eastern Europe | 44 | 1.3% |
| England | 10 | 0.3% |
| Europe | 165 | 4.7% |
| Honduras | 21 | 0.6% |
| India | 344 | 9.8% |
| Ireland | 21 | 0.6% |
| Italy | 37 | 1.1% |
| Korea | 2 | 0.1% |
| Latin America | 172 | 4.9% |
| Lebanon | 12 | 0.3% |
| Netherlands | 23 | 0.7% |
| Nigeria | 19 | 0.5% |
| Northern Africa | 16 | 0.5% |
| Northern Europe | 31 | 0.9% |
| Pakistan | 32 | 0.9% |
| Philippines | 54 | 1.5% |
| Russia | 44 | 1.3% |
| South Central Asia | 376 | 10.7% |
| South Eastern Asia | 54 | 1.5% |
| Southern Europe | 67 | 1.9% |
| Spain | 13 | 0.4% |
| Syria | 56 | 1.6% |
| Taiwan | 8 | 0.2% |
| Western Africa | 19 | 0.5% |
| Western Asia | 119 | 3.4% |
| Western Europe | 23 | 0.7% | View All 35 Rows |
Sex and Age in Bardonia
Sex and Age in Bardonia
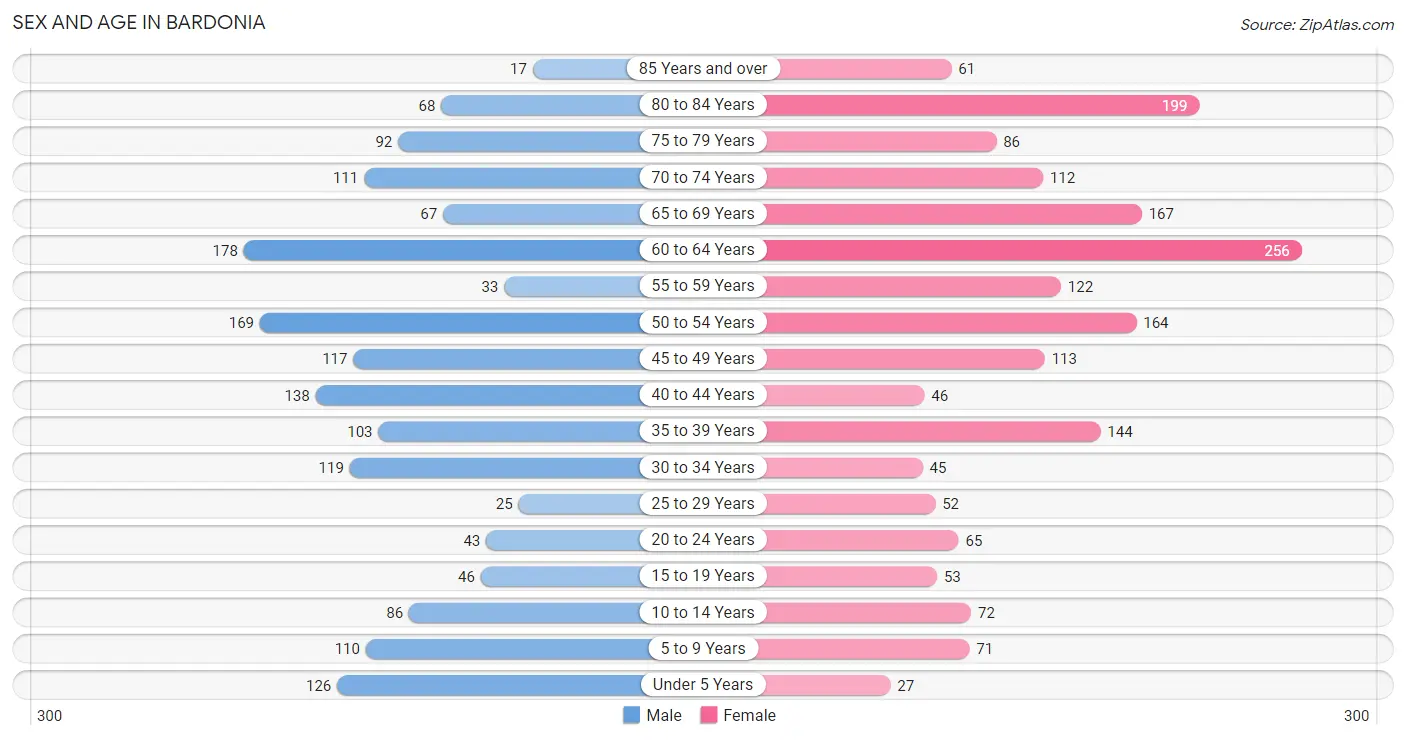
The most populous age groups in Bardonia are 60 to 64 Years (178 | 10.8%) for men and 60 to 64 Years (256 | 13.8%) for women.
| Age Bracket | Male | Female |
| Under 5 Years | 126 (7.6%) | 27 (1.5%) |
| 5 to 9 Years | 110 (6.7%) | 71 (3.8%) |
| 10 to 14 Years | 86 (5.2%) | 72 (3.9%) |
| 15 to 19 Years | 46 (2.8%) | 53 (2.9%) |
| 20 to 24 Years | 43 (2.6%) | 65 (3.5%) |
| 25 to 29 Years | 25 (1.5%) | 52 (2.8%) |
| 30 to 34 Years | 119 (7.2%) | 45 (2.4%) |
| 35 to 39 Years | 103 (6.2%) | 144 (7.8%) |
| 40 to 44 Years | 138 (8.4%) | 46 (2.5%) |
| 45 to 49 Years | 117 (7.1%) | 113 (6.1%) |
| 50 to 54 Years | 169 (10.2%) | 164 (8.8%) |
| 55 to 59 Years | 33 (2.0%) | 122 (6.6%) |
| 60 to 64 Years | 178 (10.8%) | 256 (13.8%) |
| 65 to 69 Years | 67 (4.1%) | 167 (9.0%) |
| 70 to 74 Years | 111 (6.7%) | 112 (6.0%) |
| 75 to 79 Years | 92 (5.6%) | 86 (4.6%) |
| 80 to 84 Years | 68 (4.1%) | 199 (10.7%) |
| 85 Years and over | 17 (1.0%) | 61 (3.3%) |
| Total | 1,648 (100.0%) | 1,855 (100.0%) |
Families and Households in Bardonia
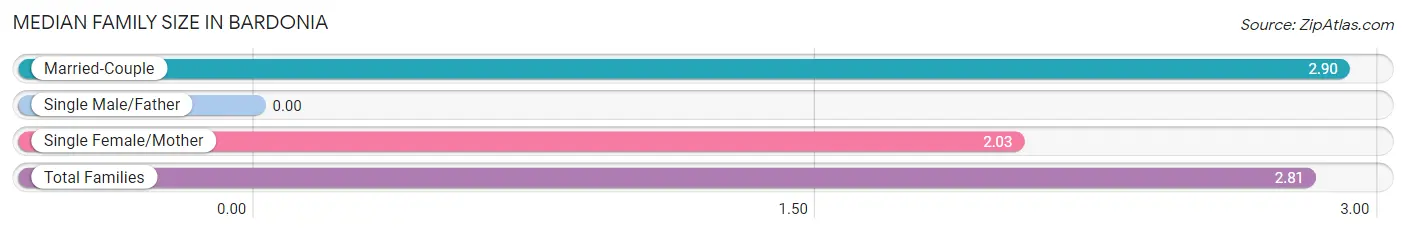
Median Family Size in Bardonia
| Family Type | # Families | Family Size |
| Married-Couple | 946 (89.1%) | 2.90 |
| Single Male/Father | 0 (0.0%) | - |
| Single Female/Mother | 116 (10.9%) | 2.03 |
| Total Families | 1,062 (100.0%) | 2.81 |
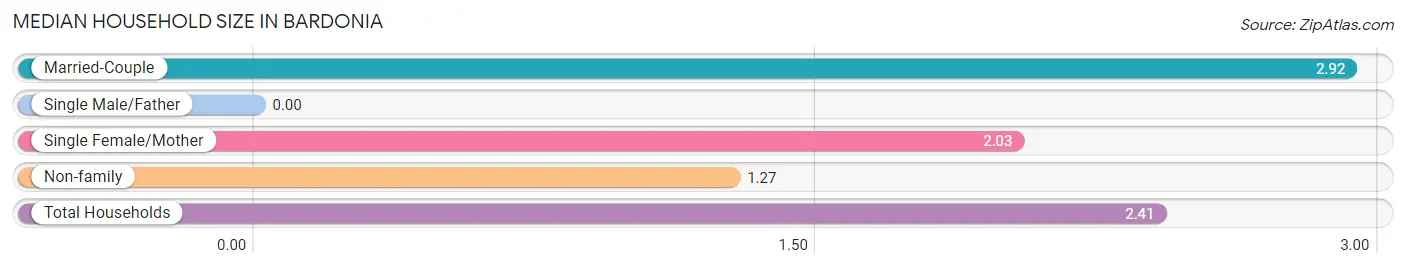
Median Household Size in Bardonia
| Household Type | # Households | Household Size |
| Married-Couple | 946 (65.5%) | 2.92 |
| Single Male/Father | 0 (0.0%) | - |
| Single Female/Mother | 116 (8.0%) | 2.03 |
| Non-family | 382 (26.5%) | 1.27 |
| Total Households | 1,444 (100.0%) | 2.41 |
Household Size by Marriage Status in Bardonia
Out of a total of 1,444 households in Bardonia, 1,062 (73.6%) are family households, while 382 (26.5%) are nonfamily households. The most numerous type of family households are 2-person households, comprising 416, and the most common type of nonfamily households are 1-person households, comprising 286.
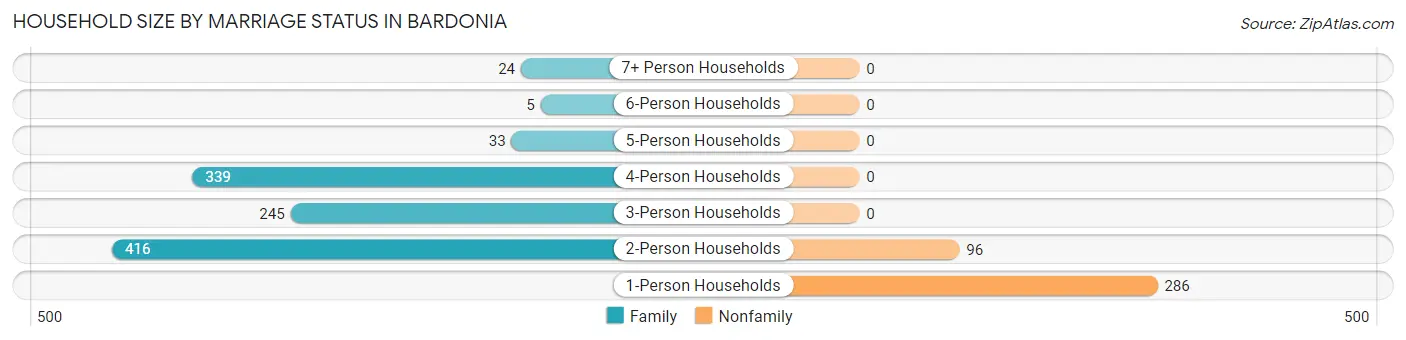
| Household Size | Family Households | Nonfamily Households |
| 1-Person Households | - | 286 (19.8%) |
| 2-Person Households | 416 (28.8%) | 96 (6.7%) |
| 3-Person Households | 245 (17.0%) | 0 (0.0%) |
| 4-Person Households | 339 (23.5%) | 0 (0.0%) |
| 5-Person Households | 33 (2.3%) | 0 (0.0%) |
| 6-Person Households | 5 (0.4%) | 0 (0.0%) |
| 7+ Person Households | 24 (1.7%) | 0 (0.0%) |
| Total | 1,062 (73.6%) | 382 (26.5%) |
Female Fertility in Bardonia
Fertility by Age in Bardonia
Average fertility rate in Bardonia is 34.0 births per 1,000 women. Women in the age bracket of 35 to 50 years have the highest fertility rate with 58.0 births per 1,000 women. Women in the age bracket of 35 to 50 years acount for 100.0% of all women with births.
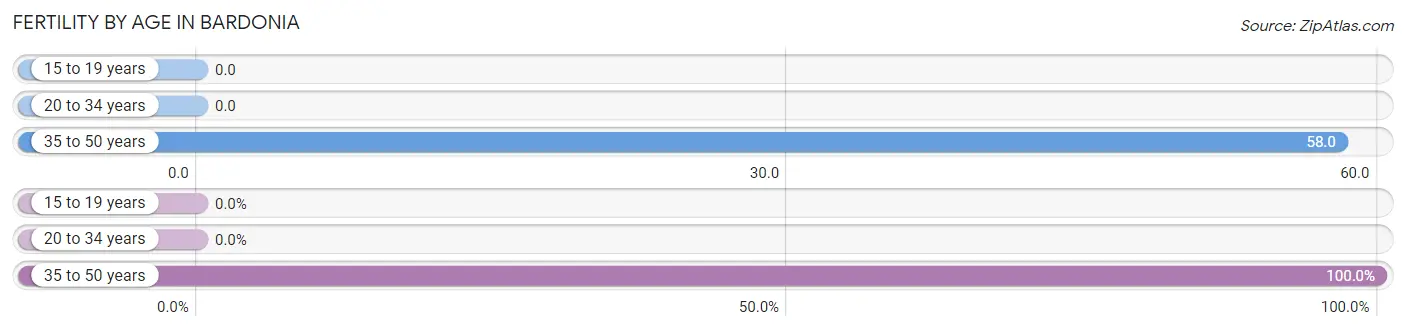
| Age Bracket | Women with Births | Births / 1,000 Women |
| 15 to 19 years | 0 (0.0%) | 0.0 |
| 20 to 34 years | 0 (0.0%) | 0.0 |
| 35 to 50 years | 18 (100.0%) | 58.0 |
| Total | 18 (100.0%) | 34.0 |
Fertility by Age by Marriage Status in Bardonia
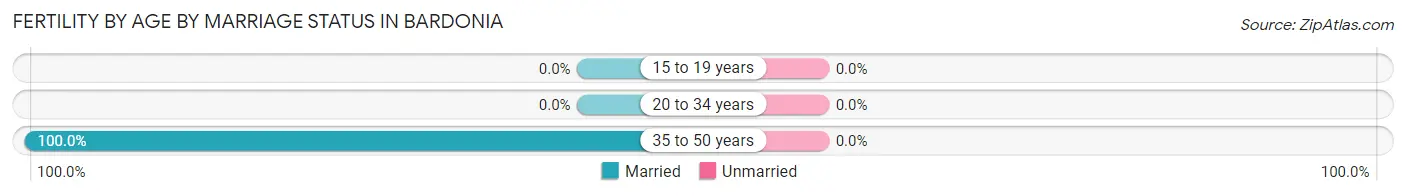
| Age Bracket | Married | Unmarried |
| 15 to 19 years | 0 (0.0%) | 0 (0.0%) |
| 20 to 34 years | 0 (0.0%) | 0 (0.0%) |
| 35 to 50 years | 18 (100.0%) | 0 (0.0%) |
| Total | 18 (100.0%) | 0 (0.0%) |
Fertility by Education in Bardonia
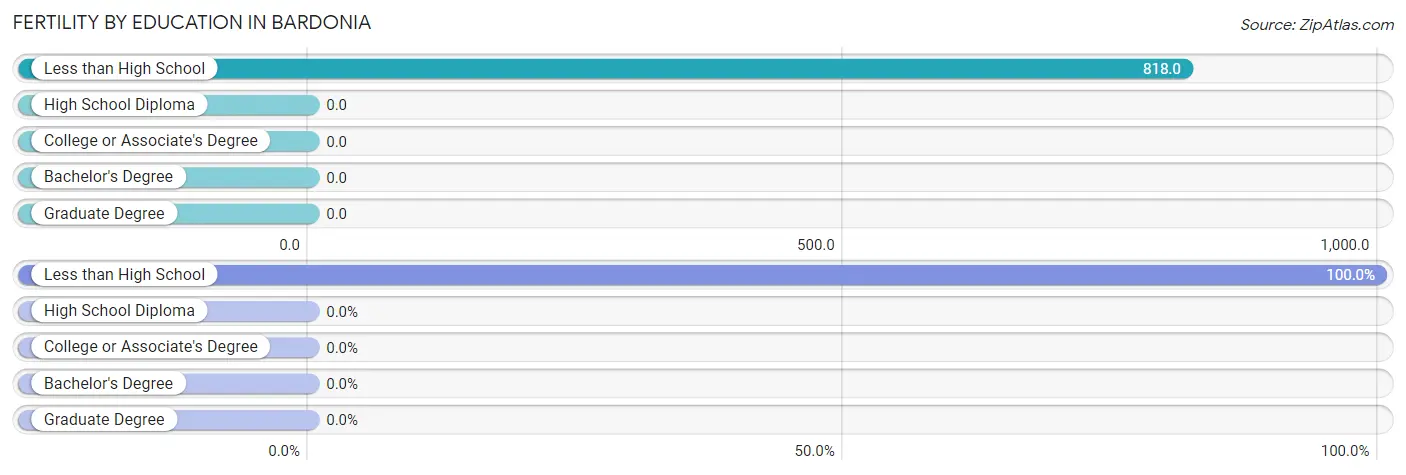
| Educational Attainment | Women with Births | Births / 1,000 Women |
| Less than High School | 18 (100.0%) | 818.0 |
| High School Diploma | 0 (0.0%) | 0.0 |
| College or Associate's Degree | 0 (0.0%) | 0.0 |
| Bachelor's Degree | 0 (0.0%) | 0.0 |
| Graduate Degree | 0 (0.0%) | 0.0 |
| Total | 18 (100.0%) | 34.0 |
Fertility by Education by Marriage Status in Bardonia
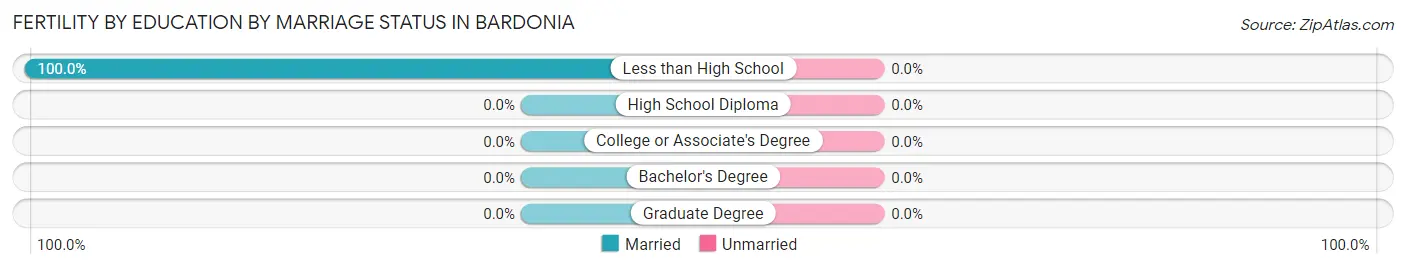
| Educational Attainment | Married | Unmarried |
| Less than High School | 18 (100.0%) | 0 (0.0%) |
| High School Diploma | 0 (0.0%) | 0 (0.0%) |
| College or Associate's Degree | 0 (0.0%) | 0 (0.0%) |
| Bachelor's Degree | 0 (0.0%) | 0 (0.0%) |
| Graduate Degree | 0 (0.0%) | 0 (0.0%) |
| Total | 18 (100.0%) | 0 (0.0%) |
Employment Characteristics in Bardonia
Employment by Class of Employer in Bardonia
Among the 1,738 employed individuals in Bardonia, private company employees (960 | 55.2%), not-for-profit organizations (278 | 16.0%), and local government employees (274 | 15.8%) make up the most common classes of employment.
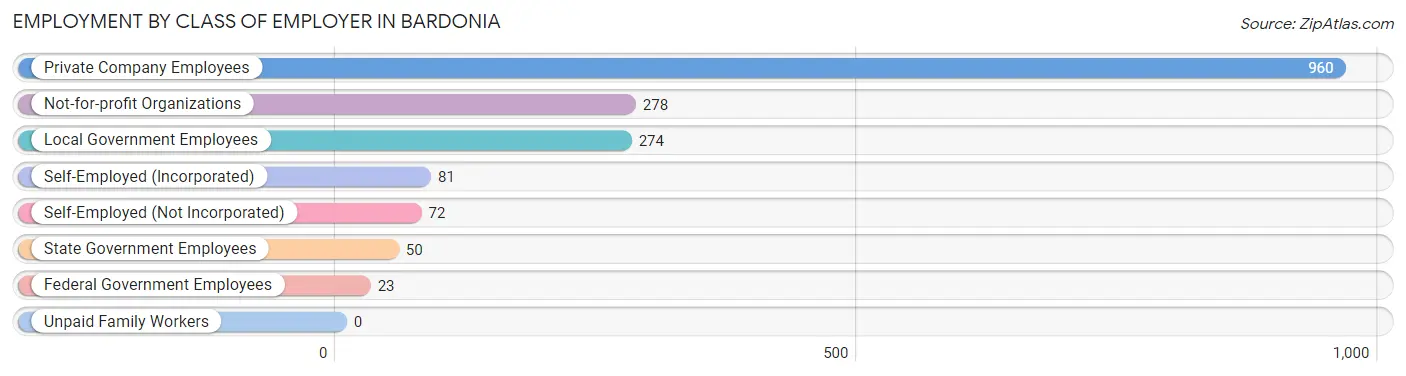
| Employer Class | # Employees | % Employees |
| Private Company Employees | 960 | 55.2% |
| Self-Employed (Incorporated) | 81 | 4.7% |
| Self-Employed (Not Incorporated) | 72 | 4.1% |
| Not-for-profit Organizations | 278 | 16.0% |
| Local Government Employees | 274 | 15.8% |
| State Government Employees | 50 | 2.9% |
| Federal Government Employees | 23 | 1.3% |
| Unpaid Family Workers | 0 | 0.0% |
| Total | 1,738 | 100.0% |
Employment Status by Age in Bardonia
According to the labor force statistics for Bardonia, out of the total population over 16 years of age (3,011), 61.0% or 1,837 individuals are in the labor force, with 4.3% or 79 of them unemployed. The age group with the highest labor force participation rate is 35 to 44 years, with 94.4% or 407 individuals in the labor force. Within the labor force, the 65 to 74 years age range has the highest percentage of unemployed individuals, with 19.0% or 28 of them being unemployed.
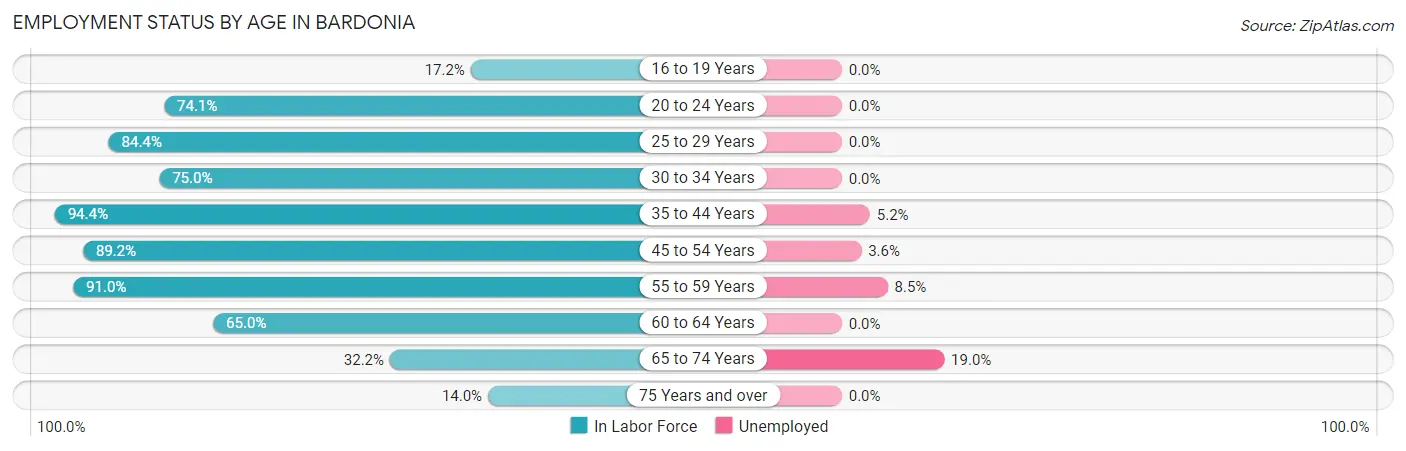
| Age Bracket | In Labor Force | Unemployed |
| 16 to 19 Years | 17 (17.2%) | 0 (0.0%) |
| 20 to 24 Years | 80 (74.1%) | 0 (0.0%) |
| 25 to 29 Years | 65 (84.4%) | 0 (0.0%) |
| 30 to 34 Years | 123 (75.0%) | 0 (0.0%) |
| 35 to 44 Years | 407 (94.4%) | 21 (5.2%) |
| 45 to 54 Years | 502 (89.2%) | 18 (3.6%) |
| 55 to 59 Years | 141 (91.0%) | 12 (8.5%) |
| 60 to 64 Years | 282 (65.0%) | 0 (0.0%) |
| 65 to 74 Years | 147 (32.2%) | 28 (19.0%) |
| 75 Years and over | 73 (14.0%) | 0 (0.0%) |
| Total | 1,837 (61.0%) | 79 (4.3%) |
Employment Status by Educational Attainment in Bardonia
According to labor force statistics for Bardonia, 83.3% of individuals (1,519) out of the total population between 25 and 64 years of age (1,824) are in the labor force, with 3.4% or 52 of them being unemployed. The group with the highest labor force participation rate are those with the educational attainment of college / associate degree, with 92.2% or 353 individuals in the labor force. Within the labor force, individuals with high school diploma education have the highest percentage of unemployment, with 10.7% or 21 of them being unemployed.
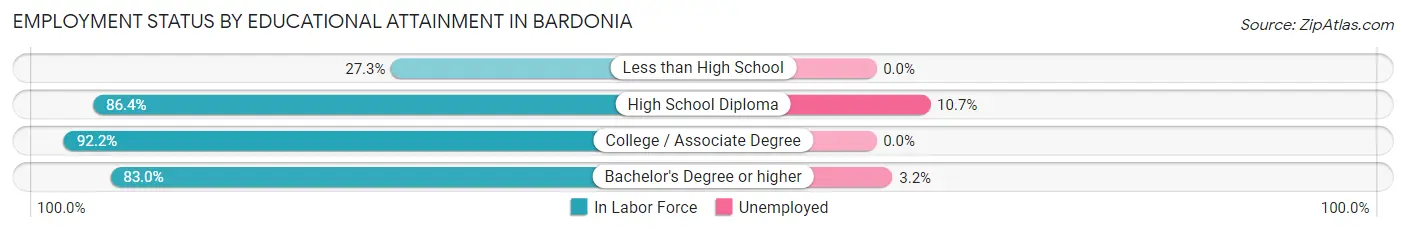
| Educational Attainment | In Labor Force | Unemployed |
| Less than High School | 18 (27.3%) | 0 (0.0%) |
| High School Diploma | 197 (86.4%) | 24 (10.7%) |
| College / Associate Degree | 353 (92.2%) | 0 (0.0%) |
| Bachelor's Degree or higher | 952 (83.0%) | 37 (3.2%) |
| Total | 1,519 (83.3%) | 62 (3.4%) |
Employment Occupations by Sex in Bardonia
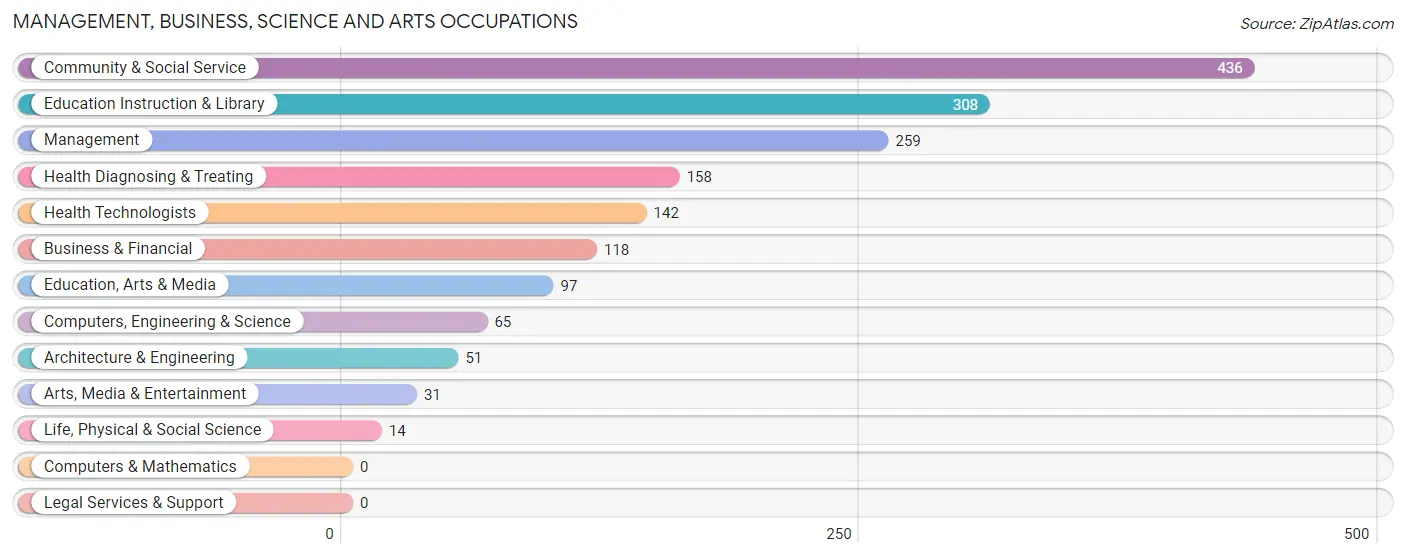
Management, Business, Science and Arts Occupations
The most common Management, Business, Science and Arts occupations in Bardonia are Community & Social Service (436 | 24.8%), Education Instruction & Library (308 | 17.5%), Management (259 | 14.7%), Health Diagnosing & Treating (158 | 9.0%), and Health Technologists (142 | 8.1%).
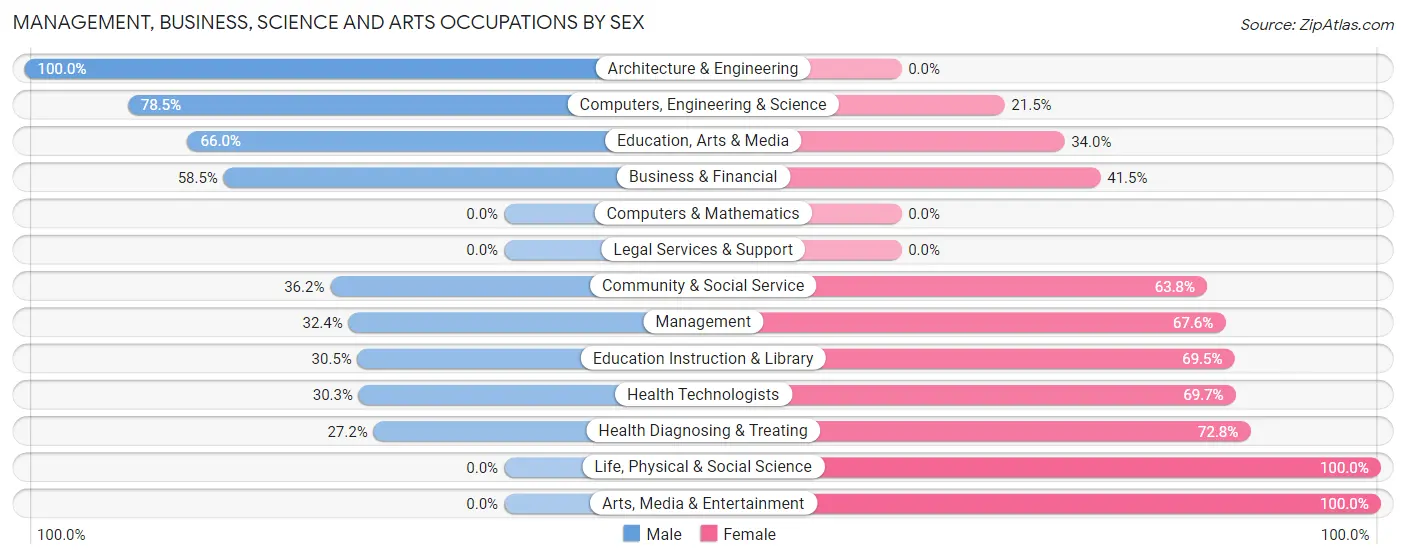
Management, Business, Science and Arts Occupations by Sex
Within the Management, Business, Science and Arts occupations in Bardonia, the most male-oriented occupations are Architecture & Engineering (100.0%), Computers, Engineering & Science (78.5%), and Education, Arts & Media (66.0%), while the most female-oriented occupations are Life, Physical & Social Science (100.0%), Arts, Media & Entertainment (100.0%), and Health Diagnosing & Treating (72.8%).
| Occupation | Male | Female |
| Management | 84 (32.4%) | 175 (67.6%) |
| Business & Financial | 69 (58.5%) | 49 (41.5%) |
| Computers, Engineering & Science | 51 (78.5%) | 14 (21.5%) |
| Computers & Mathematics | 0 (0.0%) | 0 (0.0%) |
| Architecture & Engineering | 51 (100.0%) | 0 (0.0%) |
| Life, Physical & Social Science | 0 (0.0%) | 14 (100.0%) |
| Community & Social Service | 158 (36.2%) | 278 (63.8%) |
| Education, Arts & Media | 64 (66.0%) | 33 (34.0%) |
| Legal Services & Support | 0 (0.0%) | 0 (0.0%) |
| Education Instruction & Library | 94 (30.5%) | 214 (69.5%) |
| Arts, Media & Entertainment | 0 (0.0%) | 31 (100.0%) |
| Health Diagnosing & Treating | 43 (27.2%) | 115 (72.8%) |
| Health Technologists | 43 (30.3%) | 99 (69.7%) |
| Total (Category) | 405 (39.1%) | 631 (60.9%) |
| Total (Overall) | 839 (47.7%) | 919 (52.3%) |
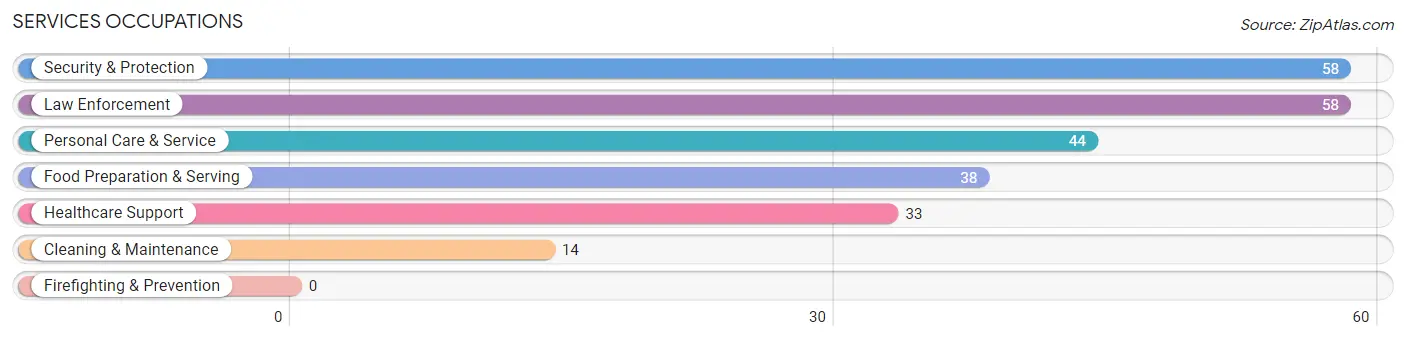
Services Occupations
The most common Services occupations in Bardonia are Security & Protection (58 | 3.3%), Law Enforcement (58 | 3.3%), Personal Care & Service (44 | 2.5%), Food Preparation & Serving (38 | 2.2%), and Healthcare Support (33 | 1.9%).
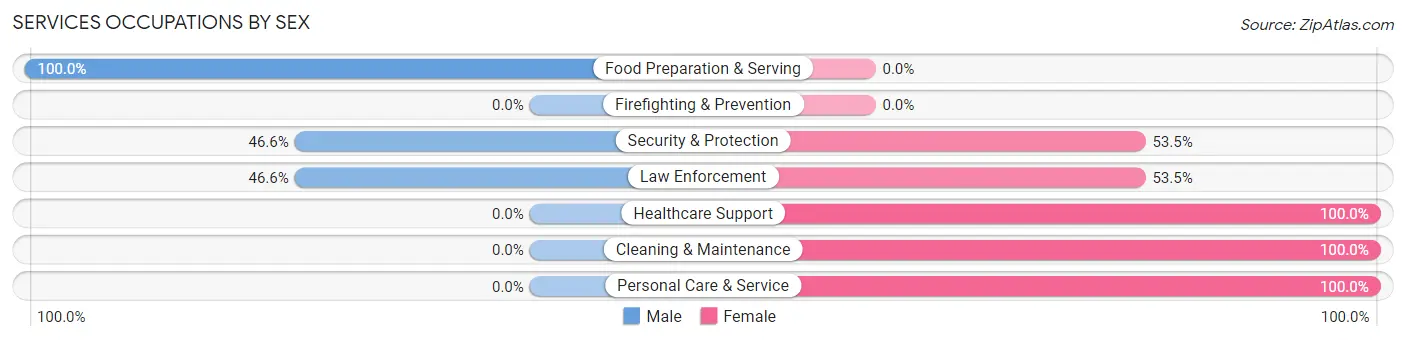
Services Occupations by Sex
Within the Services occupations in Bardonia, the most male-oriented occupations are Food Preparation & Serving (100.0%), Security & Protection (46.6%), and Law Enforcement (46.6%), while the most female-oriented occupations are Healthcare Support (100.0%), Cleaning & Maintenance (100.0%), and Personal Care & Service (100.0%).
| Occupation | Male | Female |
| Healthcare Support | 0 (0.0%) | 33 (100.0%) |
| Security & Protection | 27 (46.6%) | 31 (53.4%) |
| Firefighting & Prevention | 0 (0.0%) | 0 (0.0%) |
| Law Enforcement | 27 (46.6%) | 31 (53.4%) |
| Food Preparation & Serving | 38 (100.0%) | 0 (0.0%) |
| Cleaning & Maintenance | 0 (0.0%) | 14 (100.0%) |
| Personal Care & Service | 0 (0.0%) | 44 (100.0%) |
| Total (Category) | 65 (34.8%) | 122 (65.2%) |
| Total (Overall) | 839 (47.7%) | 919 (52.3%) |
Sales and Office Occupations
The most common Sales and Office occupations in Bardonia are Office & Administration (117 | 6.7%), and Sales & Related (98 | 5.6%).

Sales and Office Occupations by Sex

| Occupation | Male | Female |
| Sales & Related | 97 (99.0%) | 1 (1.0%) |
| Office & Administration | 28 (23.9%) | 89 (76.1%) |
| Total (Category) | 125 (58.1%) | 90 (41.9%) |
| Total (Overall) | 839 (47.7%) | 919 (52.3%) |
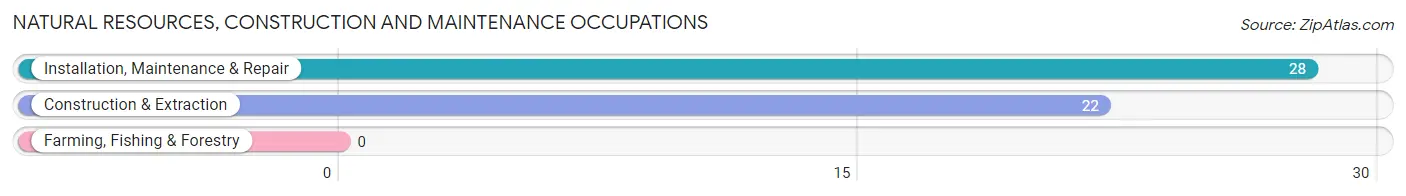
Natural Resources, Construction and Maintenance Occupations
The most common Natural Resources, Construction and Maintenance occupations in Bardonia are Installation, Maintenance & Repair (28 | 1.6%), and Construction & Extraction (22 | 1.3%).
Natural Resources, Construction and Maintenance Occupations by Sex
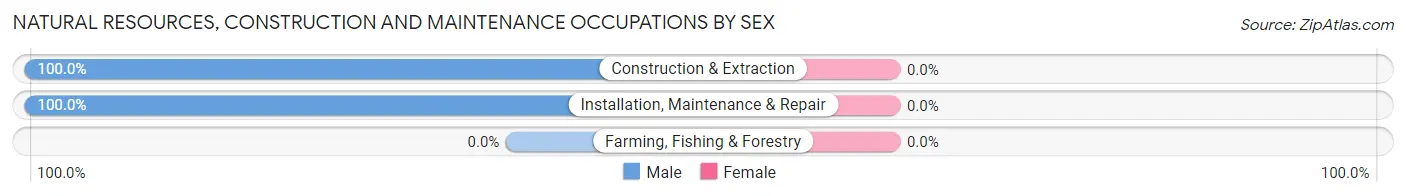
| Occupation | Male | Female |
| Farming, Fishing & Forestry | 0 (0.0%) | 0 (0.0%) |
| Construction & Extraction | 22 (100.0%) | 0 (0.0%) |
| Installation, Maintenance & Repair | 28 (100.0%) | 0 (0.0%) |
| Total (Category) | 50 (100.0%) | 0 (0.0%) |
| Total (Overall) | 839 (47.7%) | 919 (52.3%) |
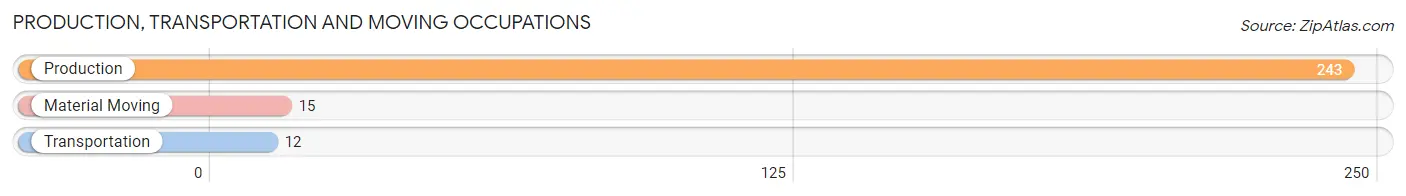
Production, Transportation and Moving Occupations
The most common Production, Transportation and Moving occupations in Bardonia are Production (243 | 13.8%), Material Moving (15 | 0.9%), and Transportation (12 | 0.7%).
Production, Transportation and Moving Occupations by Sex
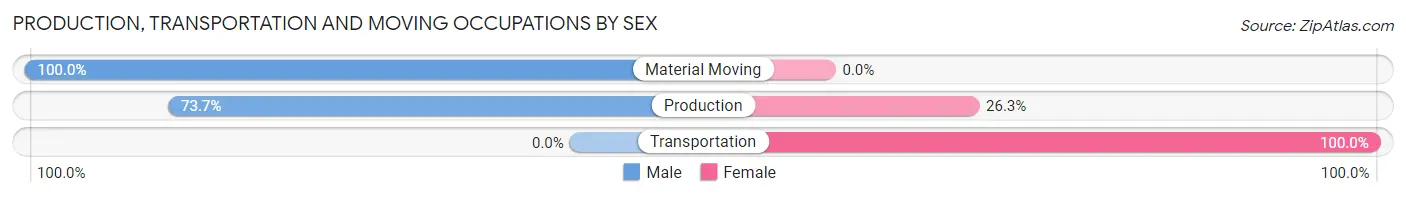
| Occupation | Male | Female |
| Production | 179 (73.7%) | 64 (26.3%) |
| Transportation | 0 (0.0%) | 12 (100.0%) |
| Material Moving | 15 (100.0%) | 0 (0.0%) |
| Total (Category) | 194 (71.9%) | 76 (28.1%) |
| Total (Overall) | 839 (47.7%) | 919 (52.3%) |
Employment Industries by Sex in Bardonia
Employment Industries in Bardonia
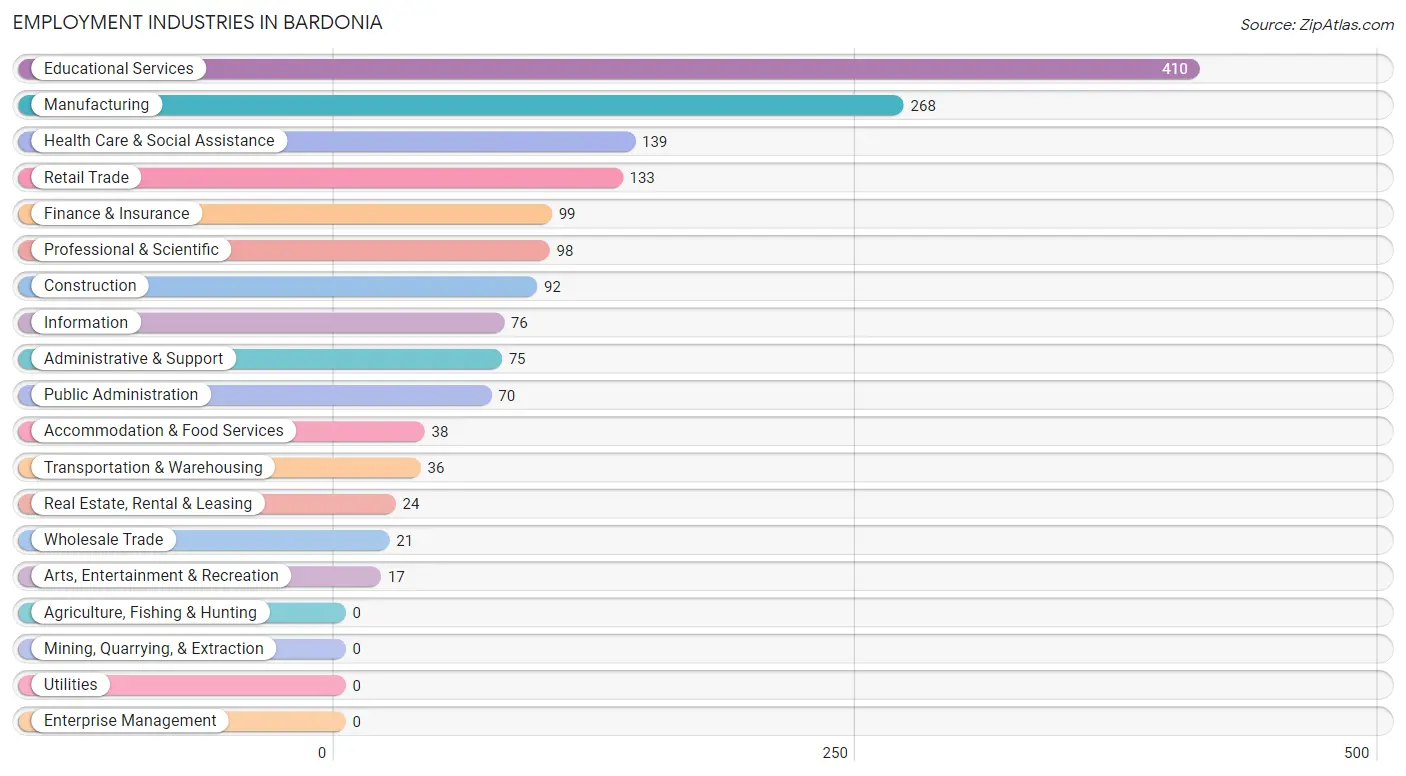
The major employment industries in Bardonia include Educational Services (410 | 23.3%), Manufacturing (268 | 15.2%), Health Care & Social Assistance (139 | 7.9%), Retail Trade (133 | 7.6%), and Finance & Insurance (99 | 5.6%).
Employment Industries by Sex in Bardonia
The Bardonia industries that see more men than women are Real Estate, Rental & Leasing (100.0%), Accommodation & Food Services (100.0%), and Professional & Scientific (82.7%), whereas the industries that tend to have a higher number of women are Wholesale Trade (100.0%), Arts, Entertainment & Recreation (100.0%), and Educational Services (77.1%).
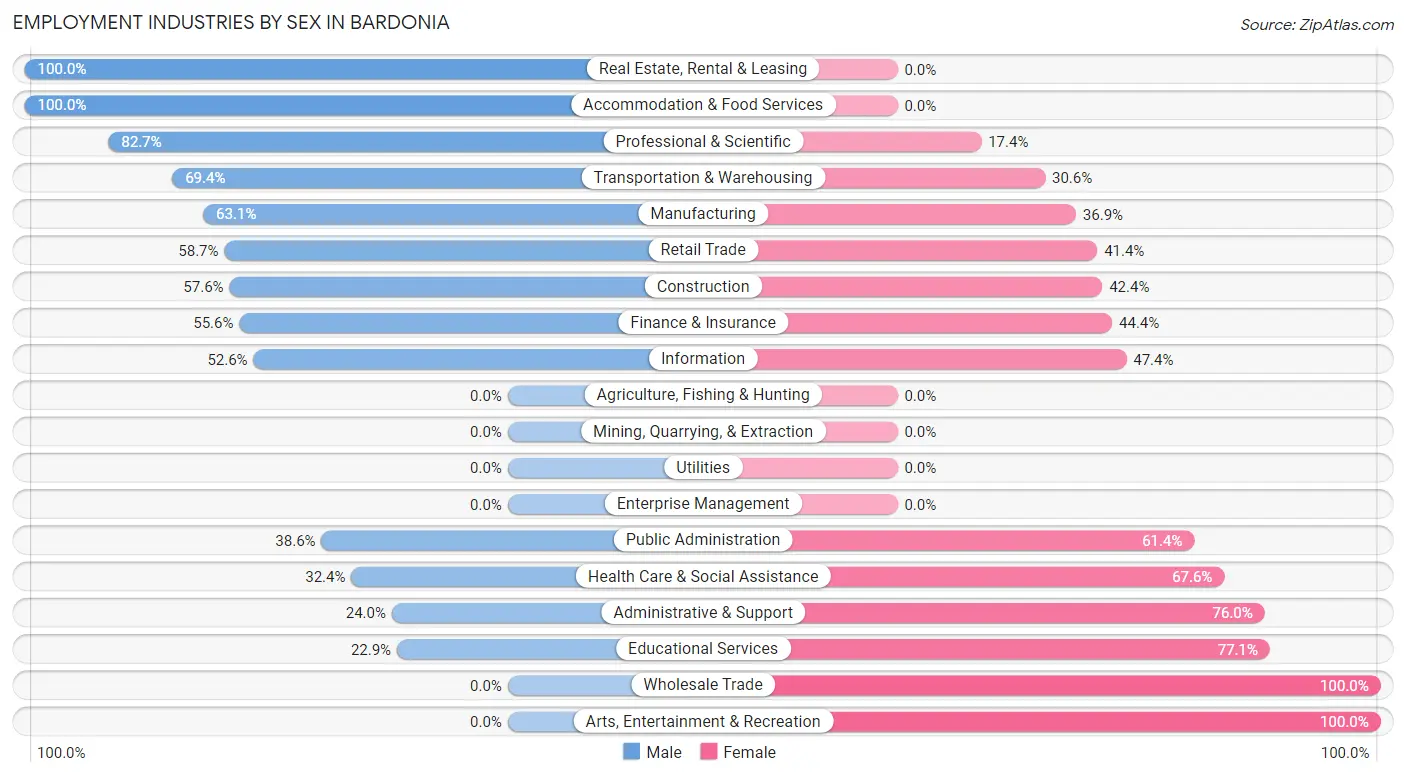
| Industry | Male | Female |
| Agriculture, Fishing & Hunting | 0 (0.0%) | 0 (0.0%) |
| Mining, Quarrying, & Extraction | 0 (0.0%) | 0 (0.0%) |
| Construction | 53 (57.6%) | 39 (42.4%) |
| Manufacturing | 169 (63.1%) | 99 (36.9%) |
| Wholesale Trade | 0 (0.0%) | 21 (100.0%) |
| Retail Trade | 78 (58.7%) | 55 (41.3%) |
| Transportation & Warehousing | 25 (69.4%) | 11 (30.6%) |
| Utilities | 0 (0.0%) | 0 (0.0%) |
| Information | 40 (52.6%) | 36 (47.4%) |
| Finance & Insurance | 55 (55.6%) | 44 (44.4%) |
| Real Estate, Rental & Leasing | 24 (100.0%) | 0 (0.0%) |
| Professional & Scientific | 81 (82.7%) | 17 (17.3%) |
| Enterprise Management | 0 (0.0%) | 0 (0.0%) |
| Administrative & Support | 18 (24.0%) | 57 (76.0%) |
| Educational Services | 94 (22.9%) | 316 (77.1%) |
| Health Care & Social Assistance | 45 (32.4%) | 94 (67.6%) |
| Arts, Entertainment & Recreation | 0 (0.0%) | 17 (100.0%) |
| Accommodation & Food Services | 38 (100.0%) | 0 (0.0%) |
| Public Administration | 27 (38.6%) | 43 (61.4%) |
| Total | 839 (47.7%) | 919 (52.3%) |
Education in Bardonia
School Enrollment in Bardonia
The most common levels of schooling among the 591 students in Bardonia are college / undergraduate (143 | 24.2%), elementary school (140 | 23.7%), and middle school (107 | 18.1%).
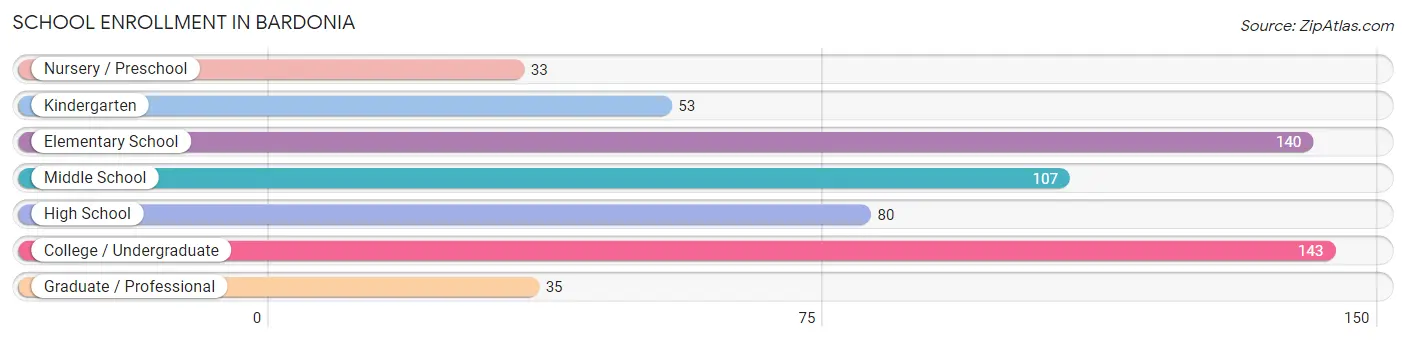
| School Level | # Students | % Students |
| Nursery / Preschool | 33 | 5.6% |
| Kindergarten | 53 | 9.0% |
| Elementary School | 140 | 23.7% |
| Middle School | 107 | 18.1% |
| High School | 80 | 13.5% |
| College / Undergraduate | 143 | 24.2% |
| Graduate / Professional | 35 | 5.9% |
| Total | 591 | 100.0% |
School Enrollment by Age by Funding Source in Bardonia
Out of a total of 591 students who are enrolled in schools in Bardonia, 132 (22.3%) attend a private institution, while the remaining 459 (77.7%) are enrolled in public schools. The age group of 35 years and over has the highest likelihood of being enrolled in private schools, with 40 (100.0% in the age bracket) enrolled. Conversely, the age group of 10 to 14 year olds has the lowest likelihood of being enrolled in a private school, with 158 (100.0% in the age bracket) attending a public institution.
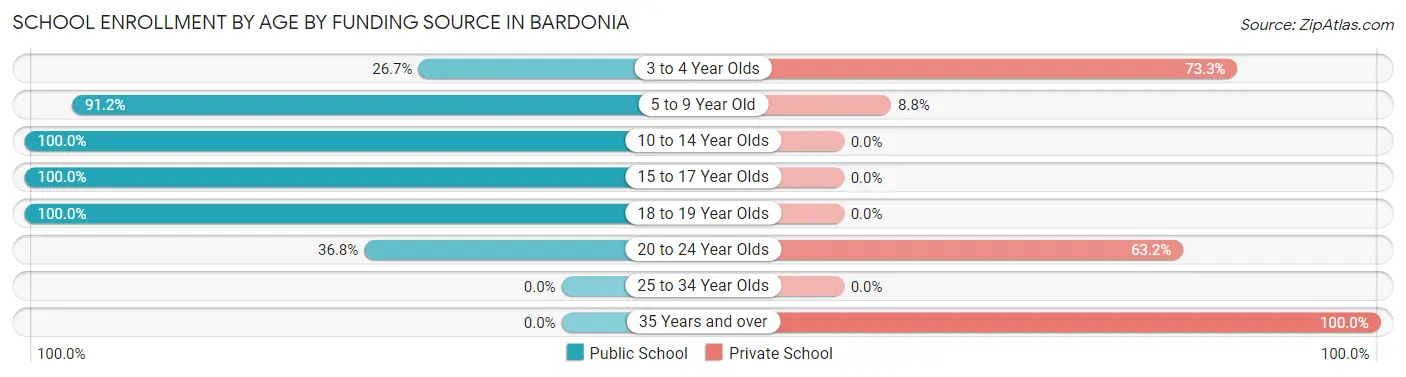
| Age Bracket | Public School | Private School |
| 3 to 4 Year Olds | 12 (26.7%) | 33 (73.3%) |
| 5 to 9 Year Old | 165 (91.2%) | 16 (8.8%) |
| 10 to 14 Year Olds | 158 (100.0%) | 0 (0.0%) |
| 15 to 17 Year Olds | 29 (100.0%) | 0 (0.0%) |
| 18 to 19 Year Olds | 70 (100.0%) | 0 (0.0%) |
| 20 to 24 Year Olds | 25 (36.8%) | 43 (63.2%) |
| 25 to 34 Year Olds | 0 (0.0%) | 0 (0.0%) |
| 35 Years and over | 0 (0.0%) | 40 (100.0%) |
| Total | 459 (77.7%) | 132 (22.3%) |
Educational Attainment by Field of Study in Bardonia
Business (456 | 26.0%), science & technology (371 | 21.1%), education (168 | 9.6%), engineering (117 | 6.7%), and literature & languages (97 | 5.5%) are the most common fields of study among 1,756 individuals in Bardonia who have obtained a bachelor's degree or higher.
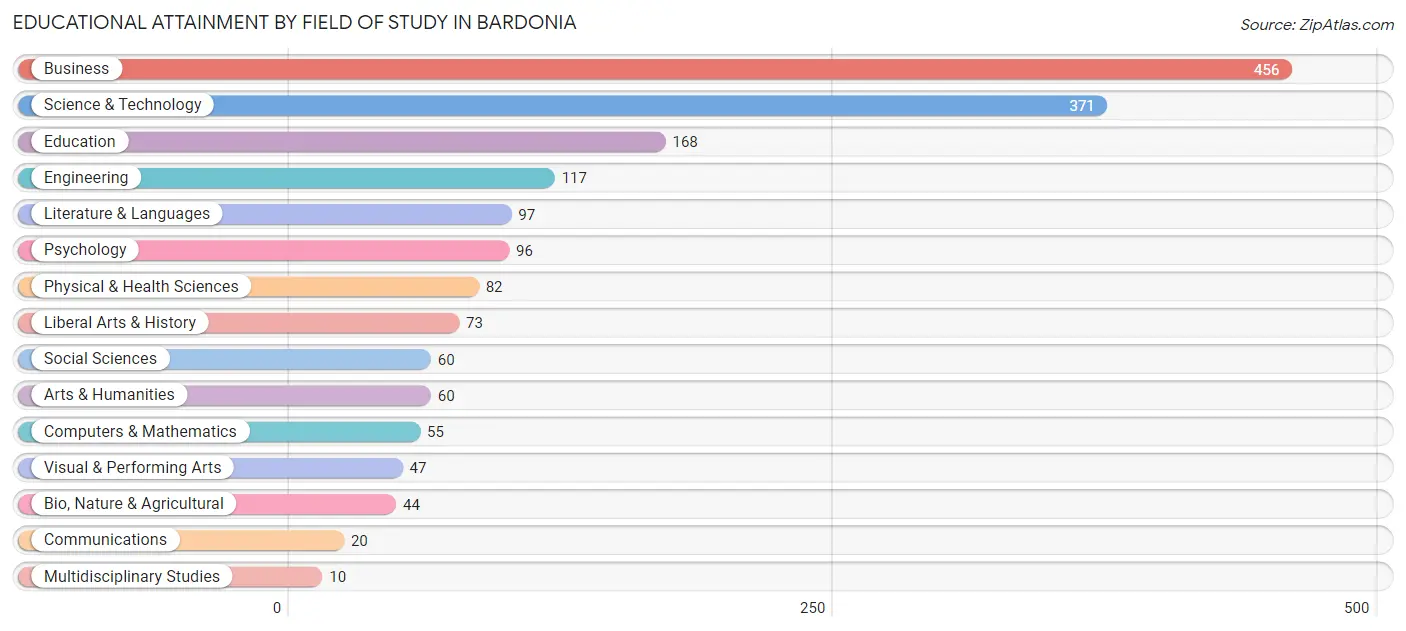
| Field of Study | # Graduates | % Graduates |
| Computers & Mathematics | 55 | 3.1% |
| Bio, Nature & Agricultural | 44 | 2.5% |
| Physical & Health Sciences | 82 | 4.7% |
| Psychology | 96 | 5.5% |
| Social Sciences | 60 | 3.4% |
| Engineering | 117 | 6.7% |
| Multidisciplinary Studies | 10 | 0.6% |
| Science & Technology | 371 | 21.1% |
| Business | 456 | 26.0% |
| Education | 168 | 9.6% |
| Literature & Languages | 97 | 5.5% |
| Liberal Arts & History | 73 | 4.2% |
| Visual & Performing Arts | 47 | 2.7% |
| Communications | 20 | 1.1% |
| Arts & Humanities | 60 | 3.4% |
| Total | 1,756 | 100.0% |
Transportation & Commute in Bardonia
Vehicle Availability by Sex in Bardonia
The most prevalent vehicle ownership categories in Bardonia are males with 2 vehicles (450, accounting for 54.0%) and females with 2 vehicles (529, making up 50.1%).
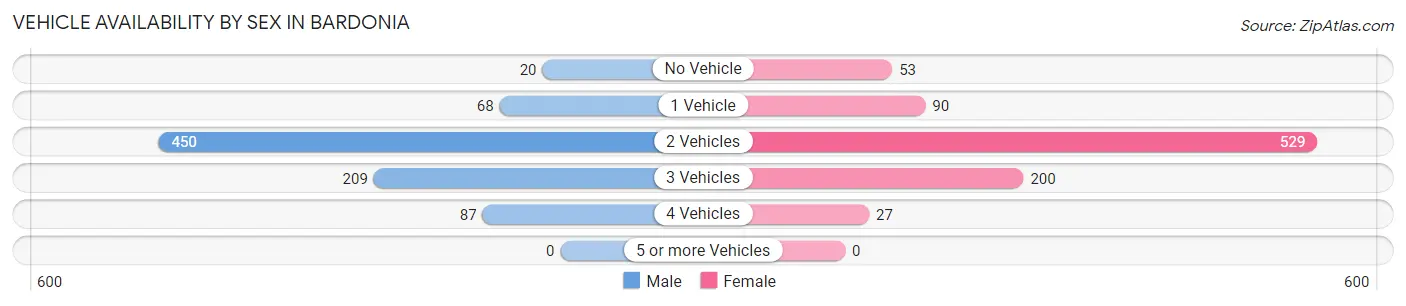
| Vehicles Available | Male | Female |
| No Vehicle | 20 (2.4%) | 53 (5.9%) |
| 1 Vehicle | 68 (8.2%) | 90 (10.0%) |
| 2 Vehicles | 450 (54.0%) | 529 (58.8%) |
| 3 Vehicles | 209 (25.1%) | 200 (22.3%) |
| 4 Vehicles | 87 (10.4%) | 27 (3.0%) |
| 5 or more Vehicles | 0 (0.0%) | 0 (0.0%) |
| Total | 834 (100.0%) | 899 (100.0%) |
Commute Time in Bardonia
The most frequently occuring commute durations in Bardonia are 10 to 14 minutes (272 commuters, 17.0%), 15 to 19 minutes (268 commuters, 16.8%), and 5 to 9 minutes (168 commuters, 10.5%).
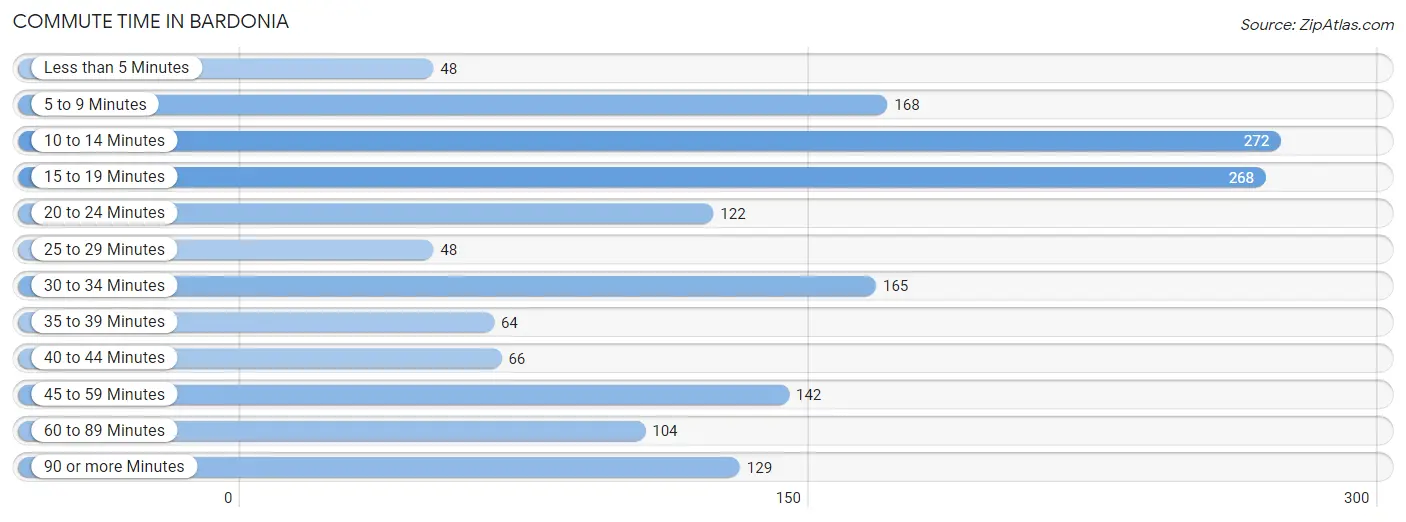
| Commute Time | # Commuters | % Commuters |
| Less than 5 Minutes | 48 | 3.0% |
| 5 to 9 Minutes | 168 | 10.5% |
| 10 to 14 Minutes | 272 | 17.0% |
| 15 to 19 Minutes | 268 | 16.8% |
| 20 to 24 Minutes | 122 | 7.6% |
| 25 to 29 Minutes | 48 | 3.0% |
| 30 to 34 Minutes | 165 | 10.3% |
| 35 to 39 Minutes | 64 | 4.0% |
| 40 to 44 Minutes | 66 | 4.1% |
| 45 to 59 Minutes | 142 | 8.9% |
| 60 to 89 Minutes | 104 | 6.5% |
| 90 or more Minutes | 129 | 8.1% |
Commute Time by Sex in Bardonia
The most common commute times in Bardonia are 10 to 14 minutes (186 commuters, 22.9%) for males and 15 to 19 minutes (180 commuters, 23.0%) for females.
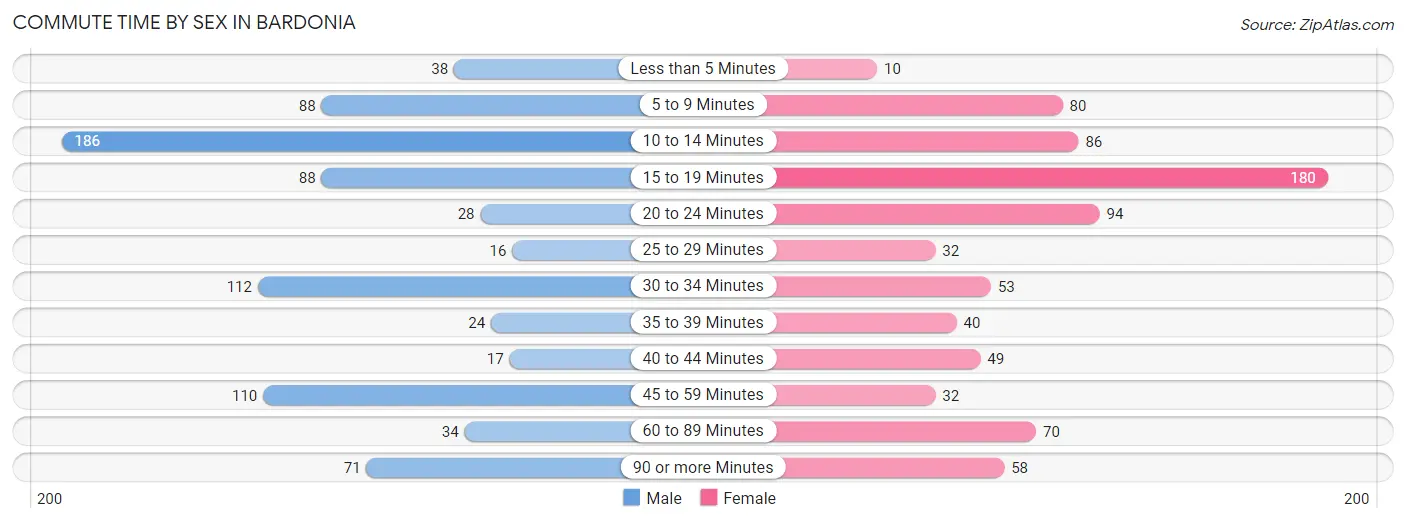
| Commute Time | Male | Female |
| Less than 5 Minutes | 38 (4.7%) | 10 (1.3%) |
| 5 to 9 Minutes | 88 (10.8%) | 80 (10.2%) |
| 10 to 14 Minutes | 186 (22.9%) | 86 (11.0%) |
| 15 to 19 Minutes | 88 (10.8%) | 180 (23.0%) |
| 20 to 24 Minutes | 28 (3.5%) | 94 (12.0%) |
| 25 to 29 Minutes | 16 (2.0%) | 32 (4.1%) |
| 30 to 34 Minutes | 112 (13.8%) | 53 (6.8%) |
| 35 to 39 Minutes | 24 (3.0%) | 40 (5.1%) |
| 40 to 44 Minutes | 17 (2.1%) | 49 (6.2%) |
| 45 to 59 Minutes | 110 (13.6%) | 32 (4.1%) |
| 60 to 89 Minutes | 34 (4.2%) | 70 (8.9%) |
| 90 or more Minutes | 71 (8.7%) | 58 (7.4%) |
Time of Departure to Work by Sex in Bardonia
The most frequent times of departure to work in Bardonia are 7:00 AM to 7:29 AM (197, 24.3%) for males and 8:00 AM to 8:29 AM (203, 25.9%) for females.
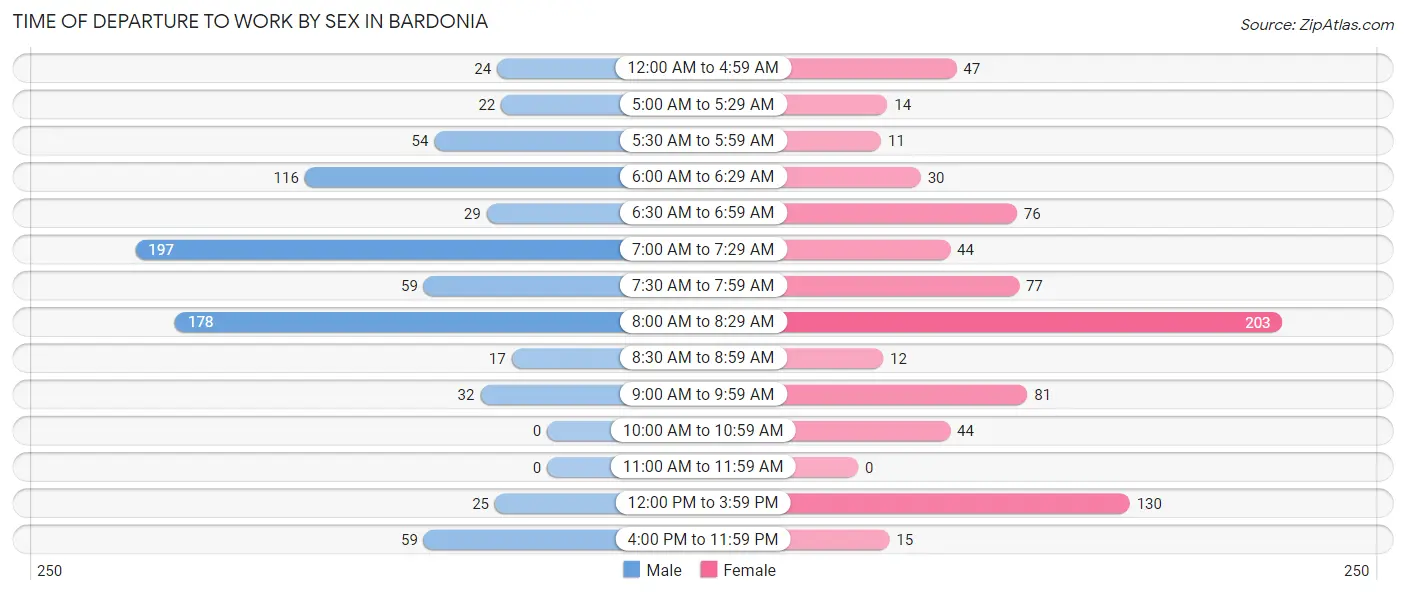
| Time of Departure | Male | Female |
| 12:00 AM to 4:59 AM | 24 (3.0%) | 47 (6.0%) |
| 5:00 AM to 5:29 AM | 22 (2.7%) | 14 (1.8%) |
| 5:30 AM to 5:59 AM | 54 (6.7%) | 11 (1.4%) |
| 6:00 AM to 6:29 AM | 116 (14.3%) | 30 (3.8%) |
| 6:30 AM to 6:59 AM | 29 (3.6%) | 76 (9.7%) |
| 7:00 AM to 7:29 AM | 197 (24.3%) | 44 (5.6%) |
| 7:30 AM to 7:59 AM | 59 (7.3%) | 77 (9.8%) |
| 8:00 AM to 8:29 AM | 178 (21.9%) | 203 (25.9%) |
| 8:30 AM to 8:59 AM | 17 (2.1%) | 12 (1.5%) |
| 9:00 AM to 9:59 AM | 32 (3.9%) | 81 (10.3%) |
| 10:00 AM to 10:59 AM | 0 (0.0%) | 44 (5.6%) |
| 11:00 AM to 11:59 AM | 0 (0.0%) | 0 (0.0%) |
| 12:00 PM to 3:59 PM | 25 (3.1%) | 130 (16.6%) |
| 4:00 PM to 11:59 PM | 59 (7.3%) | 15 (1.9%) |
| Total | 812 (100.0%) | 784 (100.0%) |
Housing Occupancy in Bardonia
Occupancy by Ownership in Bardonia
Of the total 1,444 dwellings in Bardonia, owner-occupied units account for 1,226 (84.9%), while renter-occupied units make up 218 (15.1%).
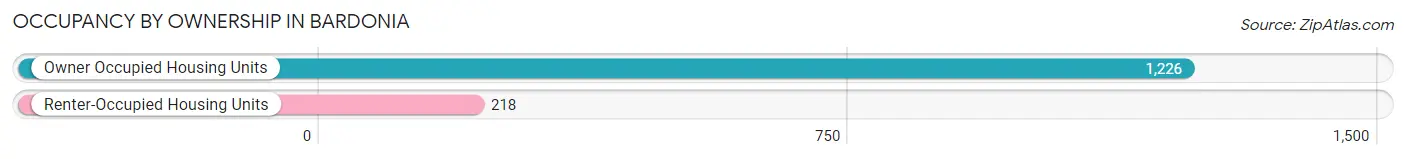
| Occupancy | # Housing Units | % Housing Units |
| Owner Occupied Housing Units | 1,226 | 84.9% |
| Renter-Occupied Housing Units | 218 | 15.1% |
| Total Occupied Housing Units | 1,444 | 100.0% |
Occupancy by Household Size in Bardonia
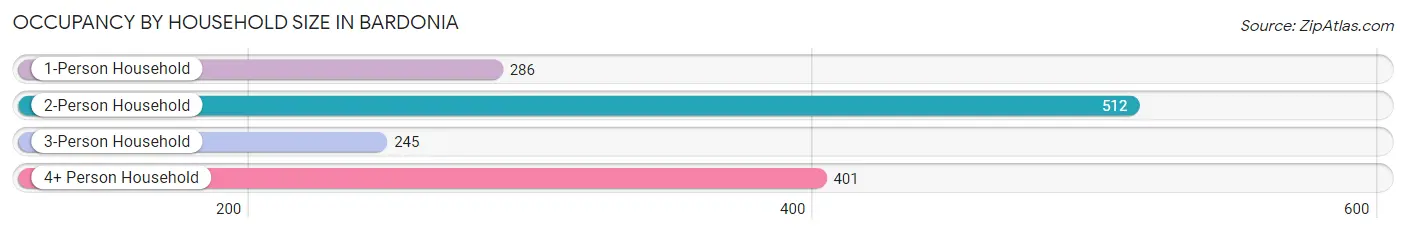
| Household Size | # Housing Units | % Housing Units |
| 1-Person Household | 286 | 19.8% |
| 2-Person Household | 512 | 35.5% |
| 3-Person Household | 245 | 17.0% |
| 4+ Person Household | 401 | 27.8% |
| Total Housing Units | 1,444 | 100.0% |
Occupancy by Ownership by Household Size in Bardonia
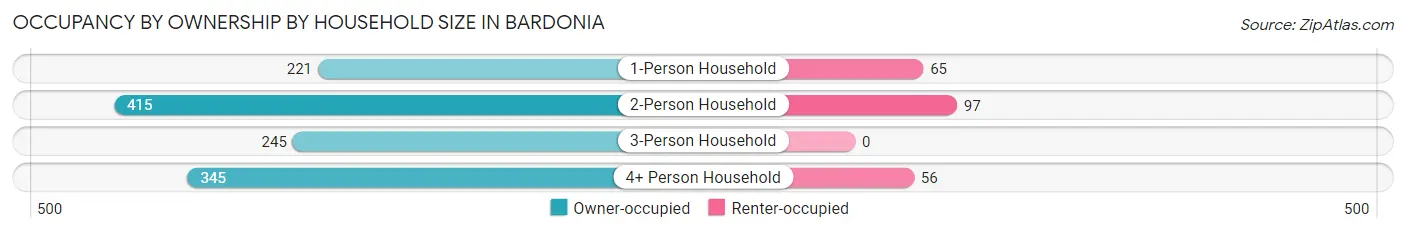
| Household Size | Owner-occupied | Renter-occupied |
| 1-Person Household | 221 (77.3%) | 65 (22.7%) |
| 2-Person Household | 415 (81.0%) | 97 (19.0%) |
| 3-Person Household | 245 (100.0%) | 0 (0.0%) |
| 4+ Person Household | 345 (86.0%) | 56 (14.0%) |
| Total Housing Units | 1,226 (84.9%) | 218 (15.1%) |
Occupancy by Educational Attainment in Bardonia
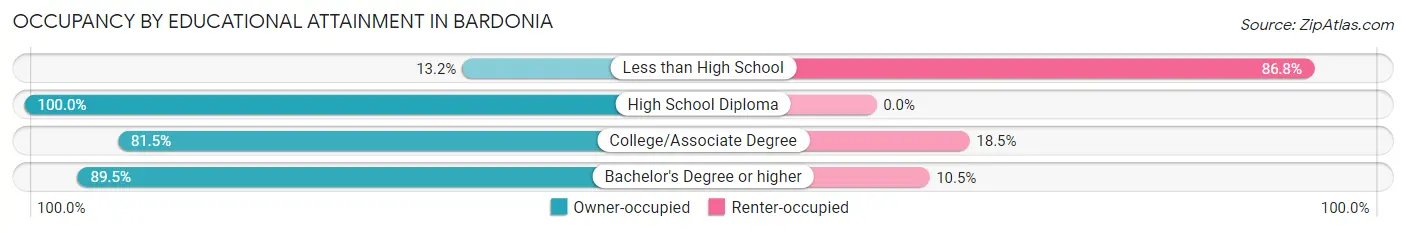
| Household Size | Owner-occupied | Renter-occupied |
| Less than High School | 9 (13.2%) | 59 (86.8%) |
| High School Diploma | 122 (100.0%) | 0 (0.0%) |
| College/Associate Degree | 278 (81.5%) | 63 (18.5%) |
| Bachelor's Degree or higher | 817 (89.5%) | 96 (10.5%) |
Occupancy by Age of Householder in Bardonia
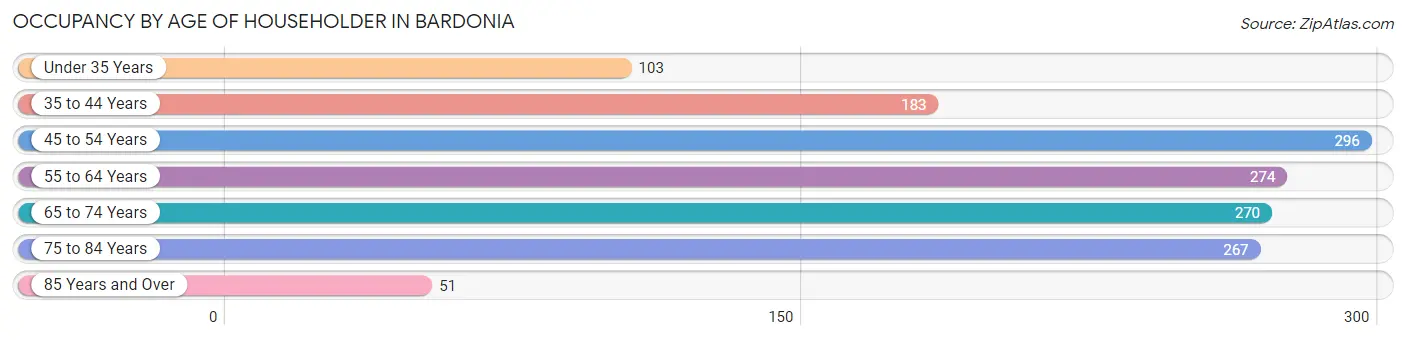
| Age Bracket | # Households | % Households |
| Under 35 Years | 103 | 7.1% |
| 35 to 44 Years | 183 | 12.7% |
| 45 to 54 Years | 296 | 20.5% |
| 55 to 64 Years | 274 | 19.0% |
| 65 to 74 Years | 270 | 18.7% |
| 75 to 84 Years | 267 | 18.5% |
| 85 Years and Over | 51 | 3.5% |
| Total | 1,444 | 100.0% |
Housing Finances in Bardonia
Median Income by Occupancy in Bardonia
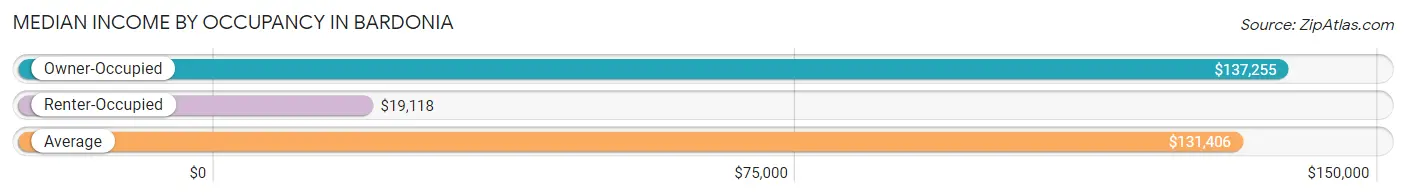
| Occupancy Type | # Households | Median Income |
| Owner-Occupied | 1,226 (84.9%) | $137,255 |
| Renter-Occupied | 218 (15.1%) | $19,118 |
| Average | 1,444 (100.0%) | $131,406 |
Occupancy by Householder Income Bracket in Bardonia
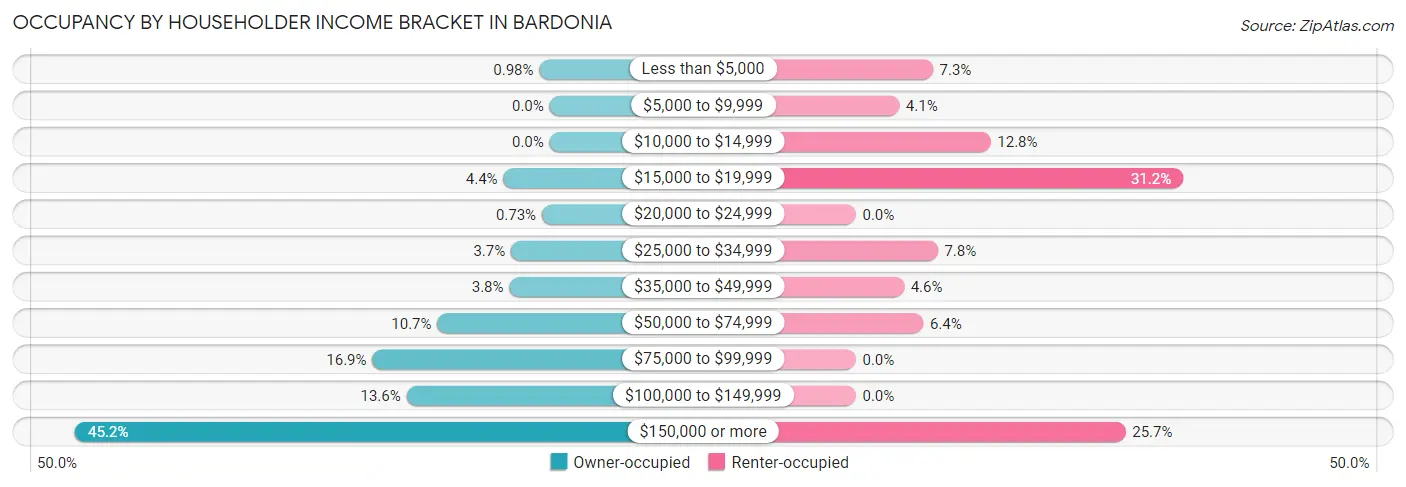
| Income Bracket | Owner-occupied | Renter-occupied |
| Less than $5,000 | 12 (1.0%) | 16 (7.3%) |
| $5,000 to $9,999 | 0 (0.0%) | 9 (4.1%) |
| $10,000 to $14,999 | 0 (0.0%) | 28 (12.8%) |
| $15,000 to $19,999 | 54 (4.4%) | 68 (31.2%) |
| $20,000 to $24,999 | 9 (0.7%) | 0 (0.0%) |
| $25,000 to $34,999 | 45 (3.7%) | 17 (7.8%) |
| $35,000 to $49,999 | 47 (3.8%) | 10 (4.6%) |
| $50,000 to $74,999 | 131 (10.7%) | 14 (6.4%) |
| $75,000 to $99,999 | 207 (16.9%) | 0 (0.0%) |
| $100,000 to $149,999 | 167 (13.6%) | 0 (0.0%) |
| $150,000 or more | 554 (45.2%) | 56 (25.7%) |
| Total | 1,226 (100.0%) | 218 (100.0%) |
Monthly Housing Cost Tiers in Bardonia
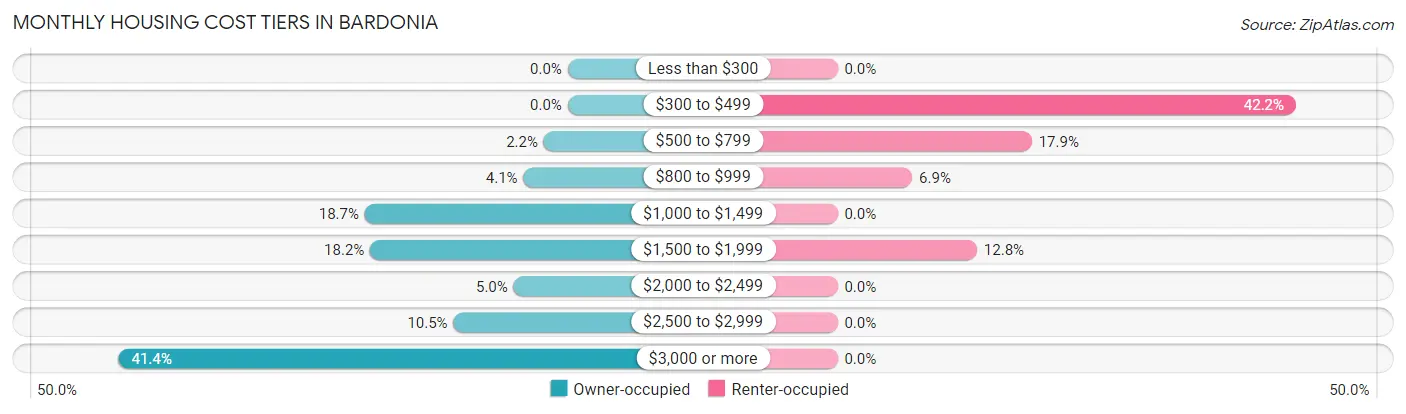
| Monthly Cost | Owner-occupied | Renter-occupied |
| Less than $300 | 0 (0.0%) | 0 (0.0%) |
| $300 to $499 | 0 (0.0%) | 92 (42.2%) |
| $500 to $799 | 27 (2.2%) | 39 (17.9%) |
| $800 to $999 | 50 (4.1%) | 15 (6.9%) |
| $1,000 to $1,499 | 229 (18.7%) | 0 (0.0%) |
| $1,500 to $1,999 | 223 (18.2%) | 28 (12.8%) |
| $2,000 to $2,499 | 61 (5.0%) | 0 (0.0%) |
| $2,500 to $2,999 | 129 (10.5%) | 0 (0.0%) |
| $3,000 or more | 507 (41.3%) | 0 (0.0%) |
| Total | 1,226 (100.0%) | 218 (100.0%) |
Physical Housing Characteristics in Bardonia
Housing Structures in Bardonia
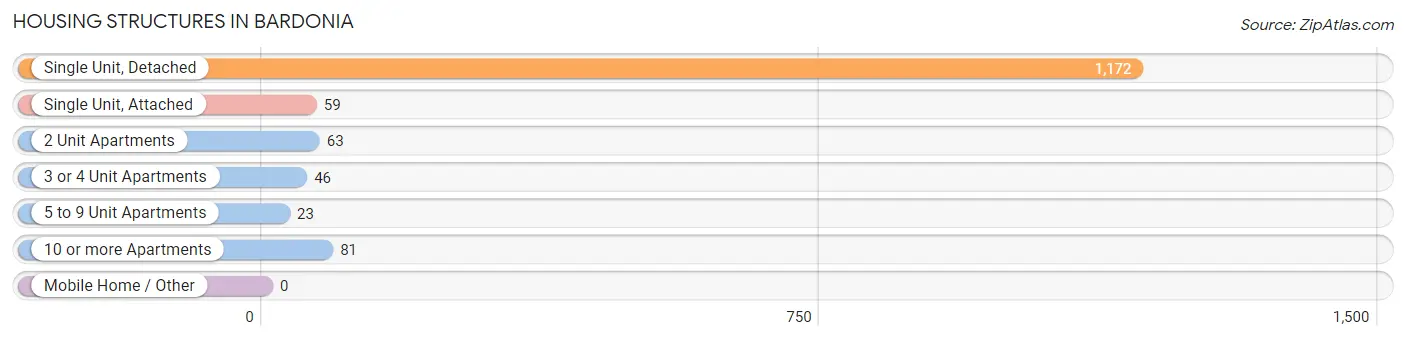
| Structure Type | # Housing Units | % Housing Units |
| Single Unit, Detached | 1,172 | 81.2% |
| Single Unit, Attached | 59 | 4.1% |
| 2 Unit Apartments | 63 | 4.4% |
| 3 or 4 Unit Apartments | 46 | 3.2% |
| 5 to 9 Unit Apartments | 23 | 1.6% |
| 10 or more Apartments | 81 | 5.6% |
| Mobile Home / Other | 0 | 0.0% |
| Total | 1,444 | 100.0% |
Housing Structures by Occupancy in Bardonia
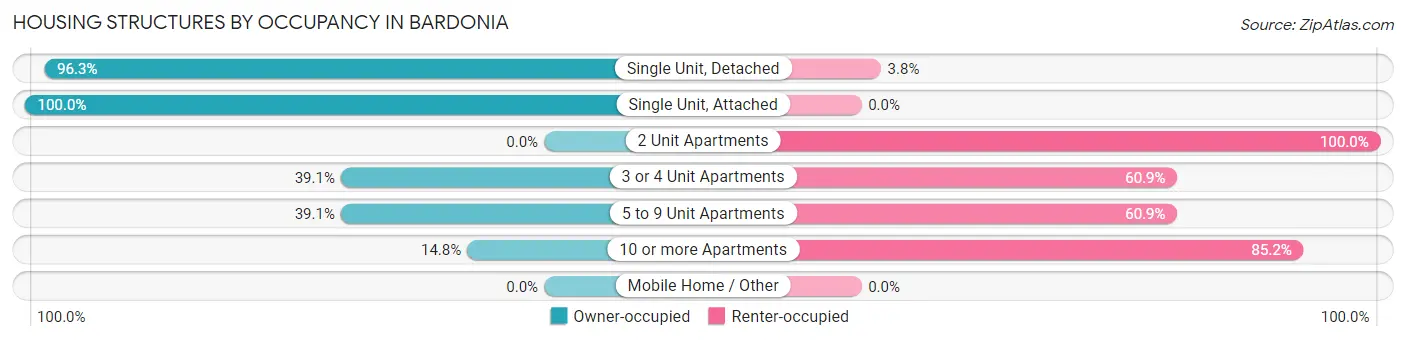
| Structure Type | Owner-occupied | Renter-occupied |
| Single Unit, Detached | 1,128 (96.3%) | 44 (3.7%) |
| Single Unit, Attached | 59 (100.0%) | 0 (0.0%) |
| 2 Unit Apartments | 0 (0.0%) | 63 (100.0%) |
| 3 or 4 Unit Apartments | 18 (39.1%) | 28 (60.9%) |
| 5 to 9 Unit Apartments | 9 (39.1%) | 14 (60.9%) |
| 10 or more Apartments | 12 (14.8%) | 69 (85.2%) |
| Mobile Home / Other | 0 (0.0%) | 0 (0.0%) |
| Total | 1,226 (84.9%) | 218 (15.1%) |
Housing Structures by Number of Rooms in Bardonia
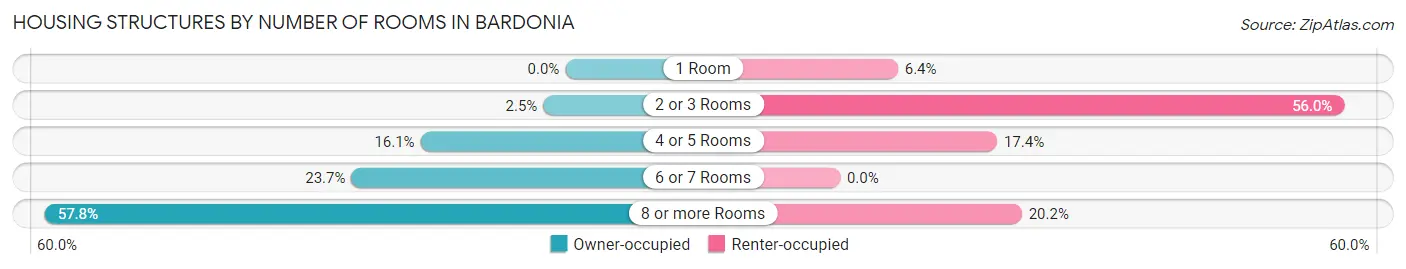
| Number of Rooms | Owner-occupied | Renter-occupied |
| 1 Room | 0 (0.0%) | 14 (6.4%) |
| 2 or 3 Rooms | 30 (2.5%) | 122 (56.0%) |
| 4 or 5 Rooms | 197 (16.1%) | 38 (17.4%) |
| 6 or 7 Rooms | 291 (23.7%) | 0 (0.0%) |
| 8 or more Rooms | 708 (57.8%) | 44 (20.2%) |
| Total | 1,226 (100.0%) | 218 (100.0%) |
Housing Structure by Heating Type in Bardonia
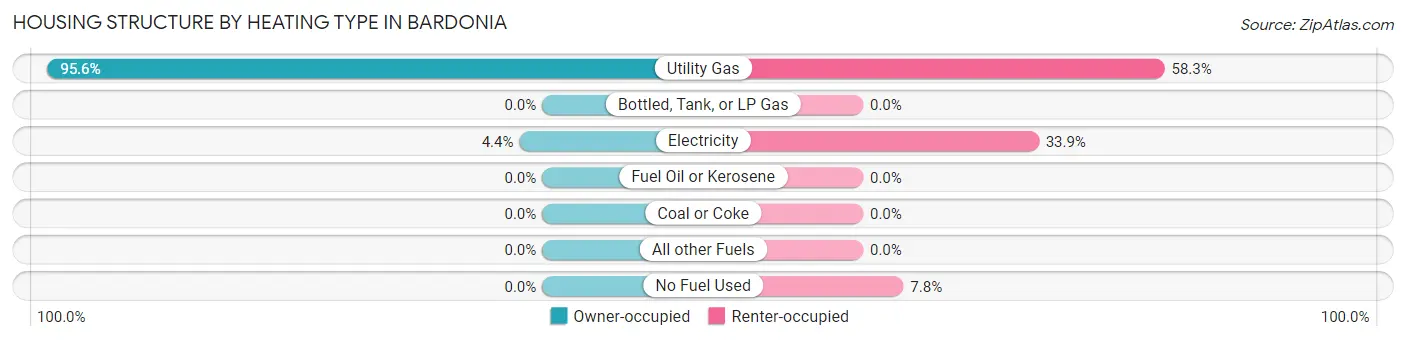
| Heating Type | Owner-occupied | Renter-occupied |
| Utility Gas | 1,172 (95.6%) | 127 (58.3%) |
| Bottled, Tank, or LP Gas | 0 (0.0%) | 0 (0.0%) |
| Electricity | 54 (4.4%) | 74 (33.9%) |
| Fuel Oil or Kerosene | 0 (0.0%) | 0 (0.0%) |
| Coal or Coke | 0 (0.0%) | 0 (0.0%) |
| All other Fuels | 0 (0.0%) | 0 (0.0%) |
| No Fuel Used | 0 (0.0%) | 17 (7.8%) |
| Total | 1,226 (100.0%) | 218 (100.0%) |
Household Vehicle Usage in Bardonia
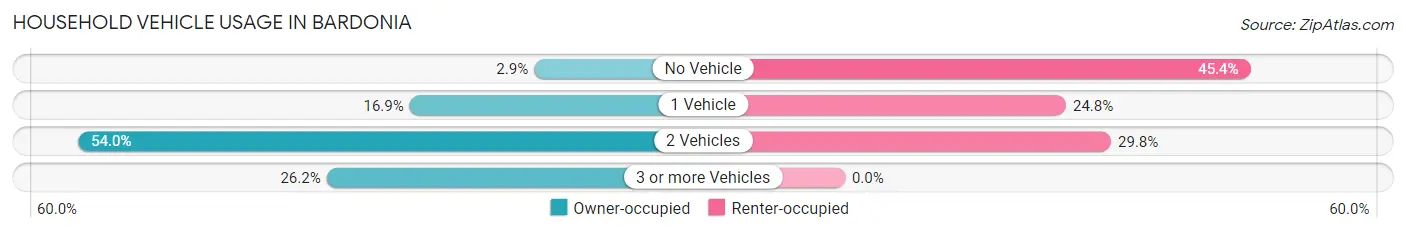
| Vehicles per Household | Owner-occupied | Renter-occupied |
| No Vehicle | 36 (2.9%) | 99 (45.4%) |
| 1 Vehicle | 207 (16.9%) | 54 (24.8%) |
| 2 Vehicles | 662 (54.0%) | 65 (29.8%) |
| 3 or more Vehicles | 321 (26.2%) | 0 (0.0%) |
| Total | 1,226 (100.0%) | 218 (100.0%) |
Real Estate & Mortgages in Bardonia
Real Estate and Mortgage Overview in Bardonia
| Characteristic | Without Mortgage | With Mortgage |
| Housing Units | 615 | 611 |
| Median Property Value | $516,600 | $647,200 |
| Median Household Income | $91,823 | $401 |
| Monthly Housing Costs | $1,501 | $500 |
| Real Estate Taxes | $10,001 | $0 |
Property Value by Mortgage Status in Bardonia
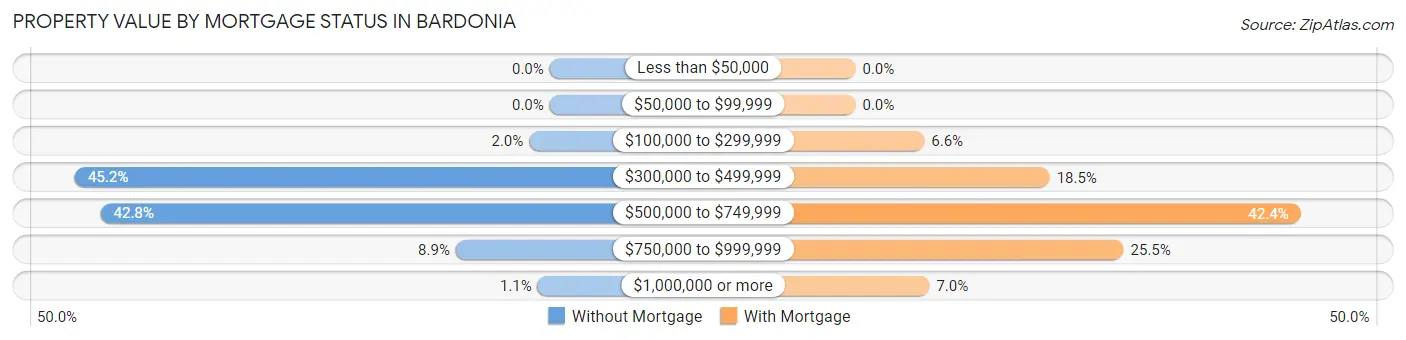
| Property Value | Without Mortgage | With Mortgage |
| Less than $50,000 | 0 (0.0%) | 0 (0.0%) |
| $50,000 to $99,999 | 0 (0.0%) | 0 (0.0%) |
| $100,000 to $299,999 | 12 (1.9%) | 40 (6.6%) |
| $300,000 to $499,999 | 278 (45.2%) | 113 (18.5%) |
| $500,000 to $749,999 | 263 (42.8%) | 259 (42.4%) |
| $750,000 to $999,999 | 55 (8.9%) | 156 (25.5%) |
| $1,000,000 or more | 7 (1.1%) | 43 (7.0%) |
| Total | 615 (100.0%) | 611 (100.0%) |
Household Income by Mortgage Status in Bardonia
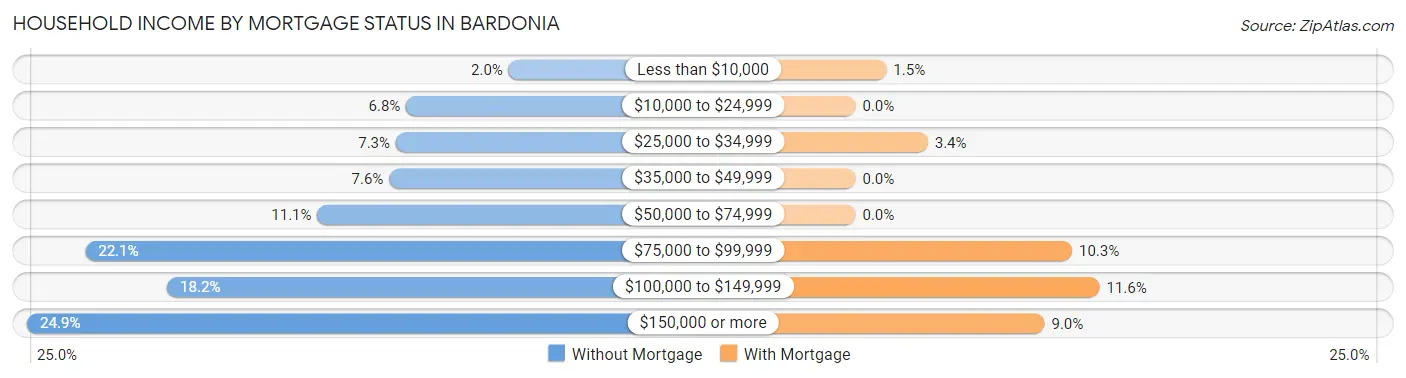
| Household Income | Without Mortgage | With Mortgage |
| Less than $10,000 | 12 (1.9%) | 9 (1.5%) |
| $10,000 to $24,999 | 42 (6.8%) | 0 (0.0%) |
| $25,000 to $34,999 | 45 (7.3%) | 21 (3.4%) |
| $35,000 to $49,999 | 47 (7.6%) | 0 (0.0%) |
| $50,000 to $74,999 | 68 (11.1%) | 0 (0.0%) |
| $75,000 to $99,999 | 136 (22.1%) | 63 (10.3%) |
| $100,000 to $149,999 | 112 (18.2%) | 71 (11.6%) |
| $150,000 or more | 153 (24.9%) | 55 (9.0%) |
| Total | 615 (100.0%) | 611 (100.0%) |
Property Value to Household Income Ratio in Bardonia
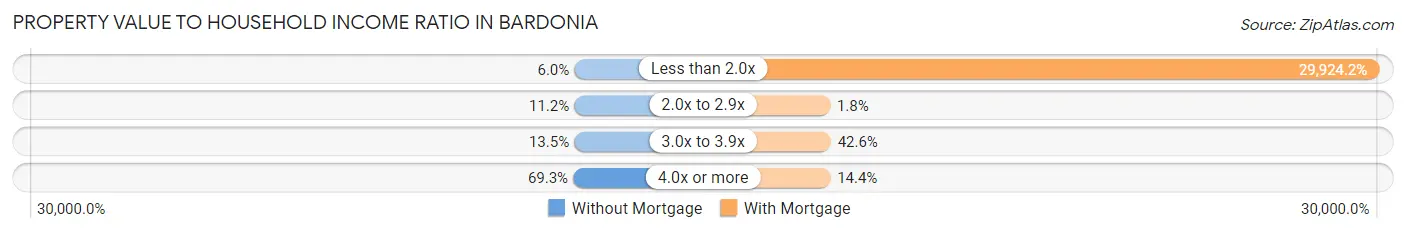
| Value-to-Income Ratio | Without Mortgage | With Mortgage |
| Less than 2.0x | 37 (6.0%) | 182,837 (29,924.2%) |
| 2.0x to 2.9x | 69 (11.2%) | 11 (1.8%) |
| 3.0x to 3.9x | 83 (13.5%) | 260 (42.5%) |
| 4.0x or more | 426 (69.3%) | 88 (14.4%) |
| Total | 615 (100.0%) | 611 (100.0%) |
Real Estate Taxes by Mortgage Status in Bardonia

| Property Taxes | Without Mortgage | With Mortgage |
| Less than $800 | 0 (0.0%) | 0 (0.0%) |
| $800 to $1,499 | 0 (0.0%) | 0 (0.0%) |
| $800 to $1,499 | 615 (100.0%) | 0 (0.0%) |
| Total | 615 (100.0%) | 611 (100.0%) |
Health & Disability in Bardonia
Health Insurance Coverage by Age in Bardonia
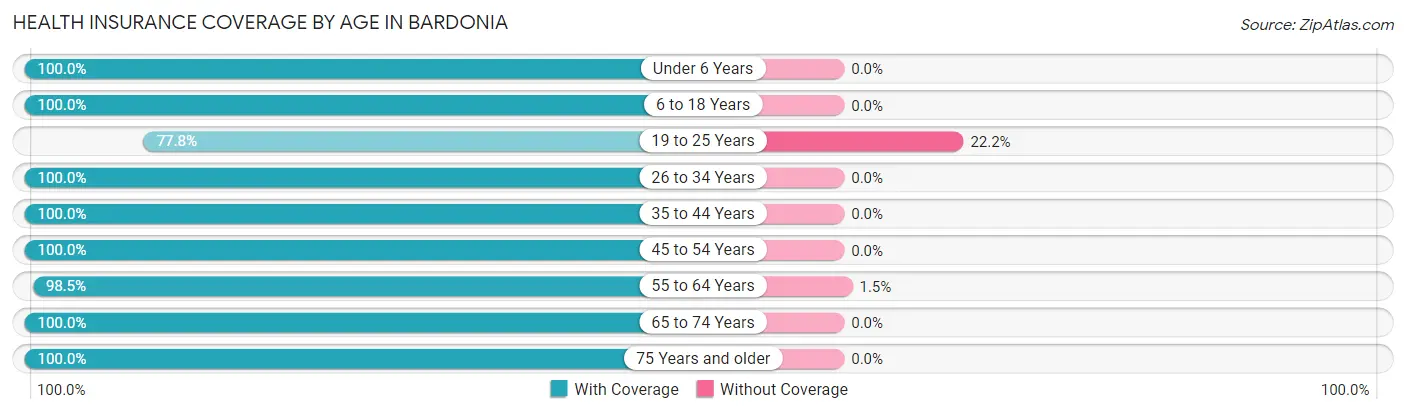
| Age Bracket | With Coverage | Without Coverage |
| Under 6 Years | 186 (100.0%) | 0 (0.0%) |
| 6 to 18 Years | 405 (100.0%) | 0 (0.0%) |
| 19 to 25 Years | 84 (77.8%) | 24 (22.2%) |
| 26 to 34 Years | 241 (100.0%) | 0 (0.0%) |
| 35 to 44 Years | 431 (100.0%) | 0 (0.0%) |
| 45 to 54 Years | 563 (100.0%) | 0 (0.0%) |
| 55 to 64 Years | 580 (98.5%) | 9 (1.5%) |
| 65 to 74 Years | 457 (100.0%) | 0 (0.0%) |
| 75 Years and older | 523 (100.0%) | 0 (0.0%) |
| Total | 3,470 (99.1%) | 33 (0.9%) |
Health Insurance Coverage by Citizenship Status in Bardonia

| Citizenship Status | With Coverage | Without Coverage |
| Native Born | 186 (100.0%) | 0 (0.0%) |
| Foreign Born, Citizen | 405 (100.0%) | 0 (0.0%) |
| Foreign Born, not a Citizen | 84 (77.8%) | 24 (22.2%) |
Health Insurance Coverage by Household Income in Bardonia
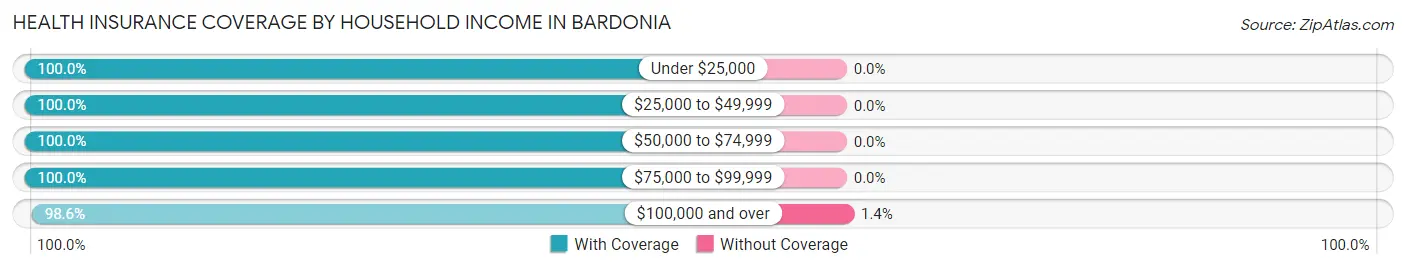
| Household Income | With Coverage | Without Coverage |
| Under $25,000 | 328 (100.0%) | 0 (0.0%) |
| $25,000 to $49,999 | 161 (100.0%) | 0 (0.0%) |
| $50,000 to $74,999 | 273 (100.0%) | 0 (0.0%) |
| $75,000 to $99,999 | 302 (100.0%) | 0 (0.0%) |
| $100,000 and over | 2,387 (98.6%) | 33 (1.4%) |
Public vs Private Health Insurance Coverage by Age in Bardonia
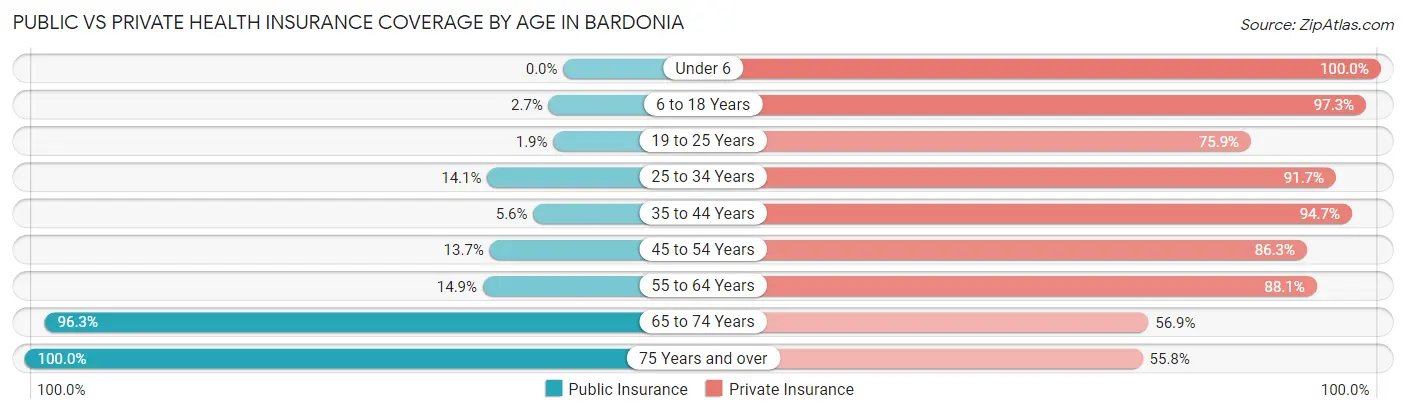
| Age Bracket | Public Insurance | Private Insurance |
| Under 6 | 0 (0.0%) | 186 (100.0%) |
| 6 to 18 Years | 11 (2.7%) | 394 (97.3%) |
| 19 to 25 Years | 2 (1.8%) | 82 (75.9%) |
| 25 to 34 Years | 34 (14.1%) | 221 (91.7%) |
| 35 to 44 Years | 24 (5.6%) | 408 (94.7%) |
| 45 to 54 Years | 77 (13.7%) | 486 (86.3%) |
| 55 to 64 Years | 88 (14.9%) | 519 (88.1%) |
| 65 to 74 Years | 440 (96.3%) | 260 (56.9%) |
| 75 Years and over | 523 (100.0%) | 292 (55.8%) |
| Total | 1,199 (34.2%) | 2,848 (81.3%) |
Disability Status by Sex by Age in Bardonia
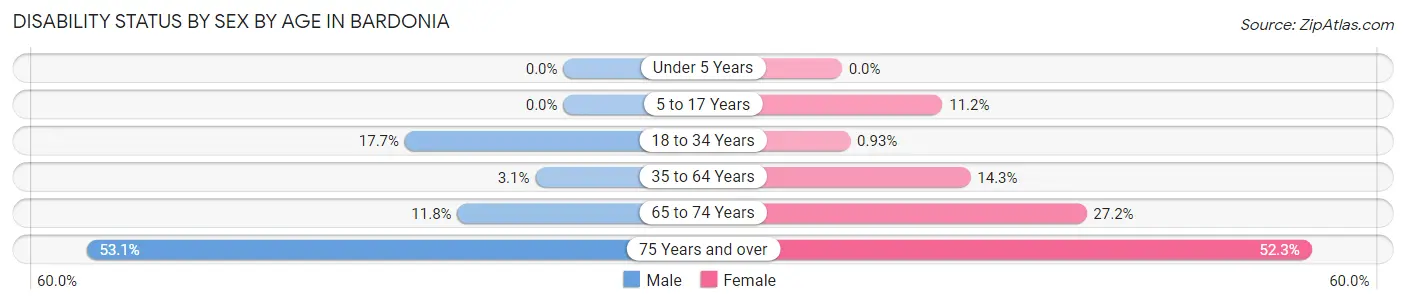
| Age Bracket | Male | Female |
| Under 5 Years | 0 (0.0%) | 0 (0.0%) |
| 5 to 17 Years | 0 (0.0%) | 16 (11.2%) |
| 18 to 34 Years | 36 (17.6%) | 2 (0.9%) |
| 35 to 64 Years | 23 (3.1%) | 121 (14.3%) |
| 65 to 74 Years | 21 (11.8%) | 76 (27.2%) |
| 75 Years and over | 94 (53.1%) | 181 (52.3%) |
Disability Class by Sex by Age in Bardonia
Disability Class: Hearing Difficulty
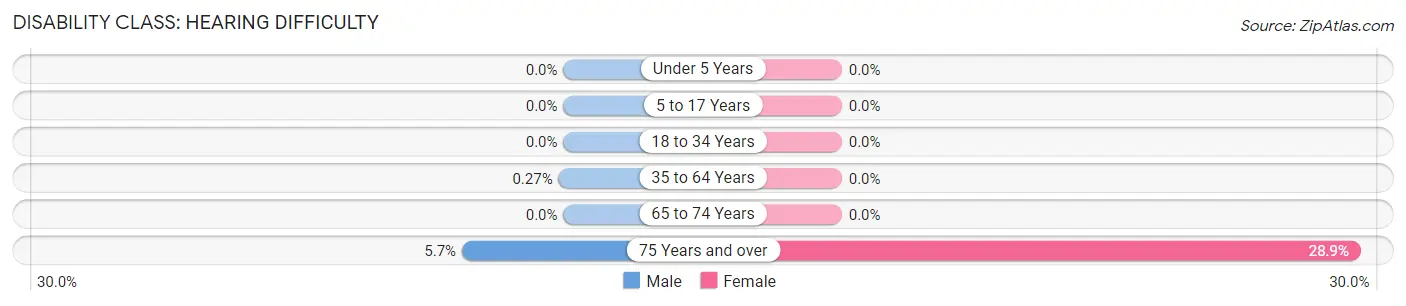
| Age Bracket | Male | Female |
| Under 5 Years | 0 (0.0%) | 0 (0.0%) |
| 5 to 17 Years | 0 (0.0%) | 0 (0.0%) |
| 18 to 34 Years | 0 (0.0%) | 0 (0.0%) |
| 35 to 64 Years | 2 (0.3%) | 0 (0.0%) |
| 65 to 74 Years | 0 (0.0%) | 0 (0.0%) |
| 75 Years and over | 10 (5.7%) | 100 (28.9%) |
Disability Class: Vision Difficulty
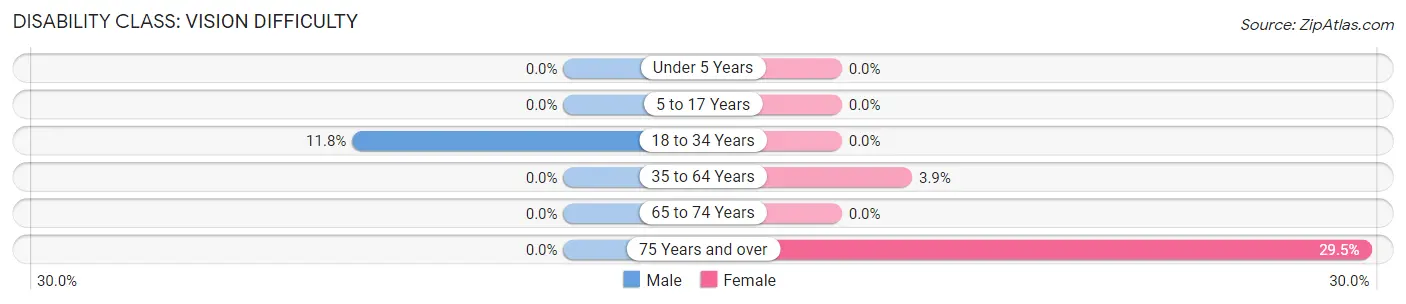
| Age Bracket | Male | Female |
| Under 5 Years | 0 (0.0%) | 0 (0.0%) |
| 5 to 17 Years | 0 (0.0%) | 0 (0.0%) |
| 18 to 34 Years | 24 (11.8%) | 0 (0.0%) |
| 35 to 64 Years | 0 (0.0%) | 33 (3.9%) |
| 65 to 74 Years | 0 (0.0%) | 0 (0.0%) |
| 75 Years and over | 0 (0.0%) | 102 (29.5%) |
Disability Class: Cognitive Difficulty
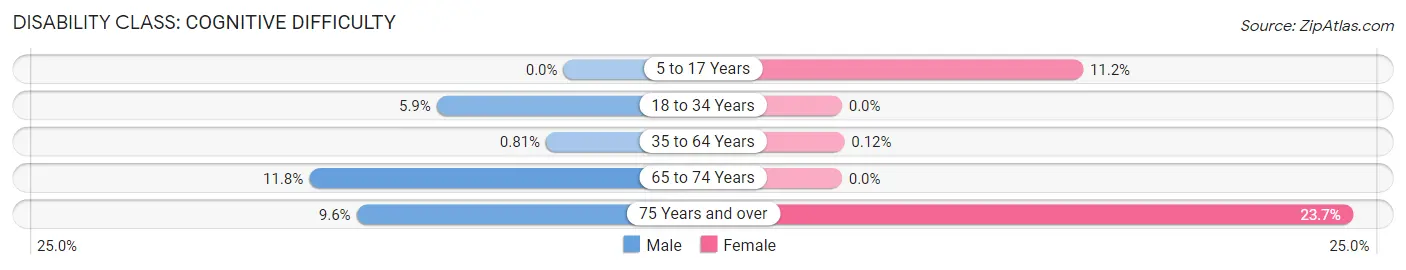
| Age Bracket | Male | Female |
| 5 to 17 Years | 0 (0.0%) | 16 (11.2%) |
| 18 to 34 Years | 12 (5.9%) | 0 (0.0%) |
| 35 to 64 Years | 6 (0.8%) | 1 (0.1%) |
| 65 to 74 Years | 21 (11.8%) | 0 (0.0%) |
| 75 Years and over | 17 (9.6%) | 82 (23.7%) |
Disability Class: Ambulatory Difficulty
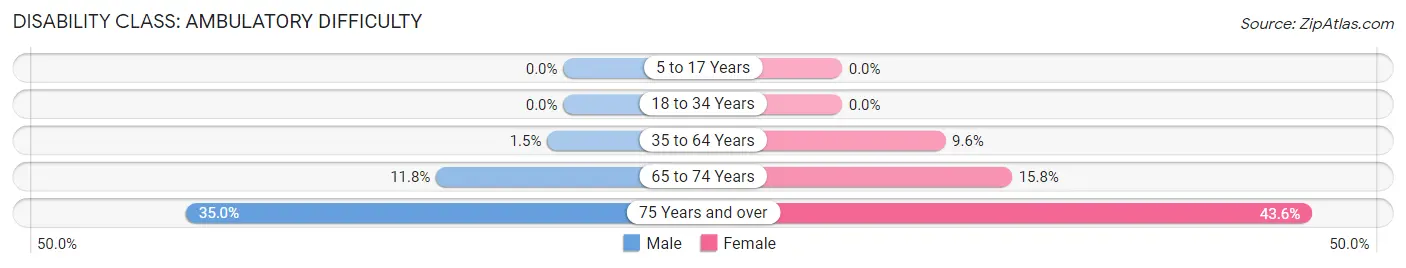
| Age Bracket | Male | Female |
| 5 to 17 Years | 0 (0.0%) | 0 (0.0%) |
| 18 to 34 Years | 0 (0.0%) | 0 (0.0%) |
| 35 to 64 Years | 11 (1.5%) | 81 (9.6%) |
| 65 to 74 Years | 21 (11.8%) | 44 (15.8%) |
| 75 Years and over | 62 (35.0%) | 151 (43.6%) |
Disability Class: Self-Care Difficulty
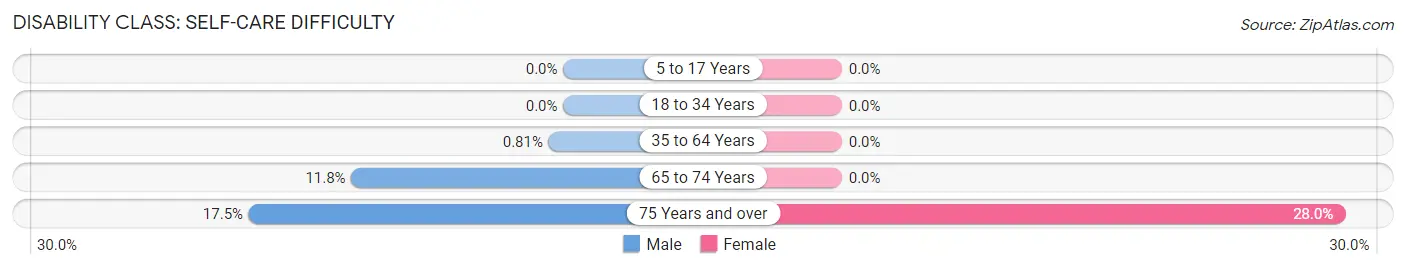
| Age Bracket | Male | Female |
| 5 to 17 Years | 0 (0.0%) | 0 (0.0%) |
| 18 to 34 Years | 0 (0.0%) | 0 (0.0%) |
| 35 to 64 Years | 6 (0.8%) | 0 (0.0%) |
| 65 to 74 Years | 21 (11.8%) | 0 (0.0%) |
| 75 Years and over | 31 (17.5%) | 97 (28.0%) |
Technology Access in Bardonia
Computing Device Access in Bardonia
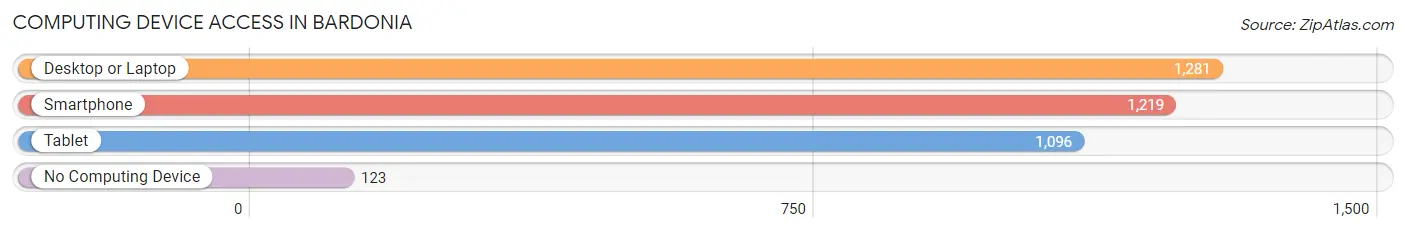
| Device Type | # Households | % Households |
| Desktop or Laptop | 1,281 | 88.7% |
| Smartphone | 1,219 | 84.4% |
| Tablet | 1,096 | 75.9% |
| No Computing Device | 123 | 8.5% |
| Total | 1,444 | 100.0% |
Internet Access in Bardonia
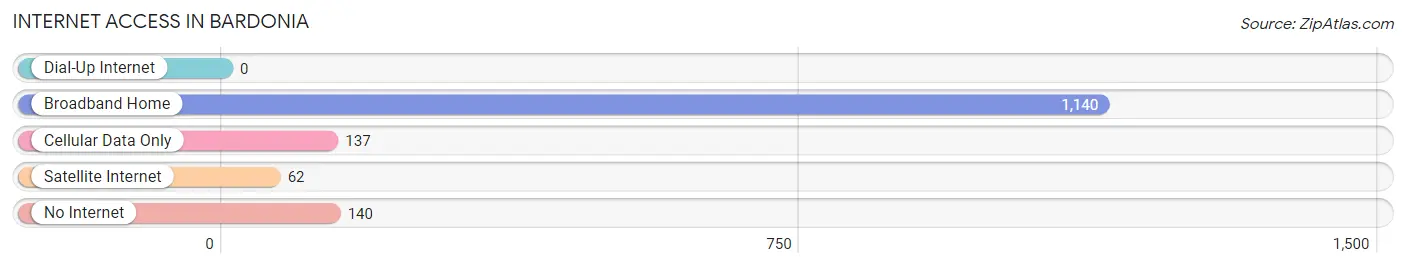
| Internet Type | # Households | % Households |
| Dial-Up Internet | 0 | 0.0% |
| Broadband Home | 1,140 | 78.9% |
| Cellular Data Only | 137 | 9.5% |
| Satellite Internet | 62 | 4.3% |
| No Internet | 140 | 9.7% |
| Total | 1,444 | 100.0% |
Bardonia Summary
Bardonia is a hamlet located in the town of Clarkstown in Rockland County, New York. It is located about 25 miles north of New York City and is part of the New York metropolitan area. The hamlet is bordered by the hamlets of New City to the north, Nanuet to the east, and West Nyack to the south.
History
The area that is now Bardonia was originally inhabited by the Munsee Native Americans. The first European settlers arrived in the area in the late 1700s. The hamlet was originally known as “Bard’s Corners” after the first settler, John Bard, who arrived in 1790. The hamlet was officially incorporated in 1853 and was renamed “Bardonia” in 1854.
Geography
Bardonia is located in the town of Clarkstown in Rockland County, New York. It is located about 25 miles north of New York City and is part of the New York metropolitan area. The hamlet is bordered by the hamlets of New City to the north, Nanuet to the east, and West Nyack to the south. The hamlet is located in the Ramapo Mountains and is home to several parks, including the Rockland Lake State Park and the Hook Mountain State Park.
Economy
Bardonia is primarily a residential community, with most of its residents commuting to nearby cities for work. The hamlet is home to several small businesses, including restaurants, retail stores, and professional services. The hamlet is also home to several corporate offices, including the headquarters of the pharmaceutical company Pfizer.
Demographics
As of the 2010 census, the population of Bardonia was 8,945. The racial makeup of the hamlet was 79.3% White, 11.2% African American, 0.3% Native American, 4.2% Asian, and 4.9% from other races. The median household income was $90,945, and the median family income was $103,945. The per capita income was $37,945.
Conclusion
Bardonia is a hamlet located in the town of Clarkstown in Rockland County, New York. It is located about 25 miles north of New York City and is part of the New York metropolitan area. The hamlet is primarily a residential community, with most of its residents commuting to nearby cities for work. The hamlet is home to several small businesses, including restaurants, retail stores, and professional services. As of the 2010 census, the population of Bardonia was 8,945. The racial makeup of the hamlet was 79.3% White, 11.2% African American, 0.3% Native American, 4.2% Asian, and 4.9% from other races. The median household income was $90,945, and the median family income was $103,945. The per capita income was $37,945.
Common Questions
What is Per Capita Income in Bardonia?
Per Capita income in Bardonia is $57,632.
What is the Median Family Income in Bardonia?
Median Family Income in Bardonia is $163,125.
What is the Median Household income in Bardonia?
Median Household Income in Bardonia is $131,406.
What is Income or Wage Gap in Bardonia?
Income or Wage Gap in Bardonia is 9.1%.
Women in Bardonia earn 90.9 cents for every dollar earned by a man.
What is Family Income Deficit in Bardonia?
Family Income Deficit in Bardonia is $6,797.
Families that are below poverty line in Bardonia earn $6,797 less on average than the poverty threshold level.
What is Inequality or Gini Index in Bardonia?
Inequality or Gini Index in Bardonia is 0.41.
What is the Total Population of Bardonia?
Total Population of Bardonia is 3,503.
What is the Total Male Population of Bardonia?
Total Male Population of Bardonia is 1,648.
What is the Total Female Population of Bardonia?
Total Female Population of Bardonia is 1,855.
What is the Ratio of Males per 100 Females in Bardonia?
There are 88.84 Males per 100 Females in Bardonia.
What is the Ratio of Females per 100 Males in Bardonia?
There are 112.56 Females per 100 Males in Bardonia.
What is the Median Population Age in Bardonia?
Median Population Age in Bardonia is 54.2 Years.
What is the Average Family Size in Bardonia
Average Family Size in Bardonia is 2.8 People.
What is the Average Household Size in Bardonia
Average Household Size in Bardonia is 2.4 People.
How Large is the Labor Force in Bardonia?
There are 1,837 People in the Labor Forcein in Bardonia.
What is the Percentage of People in the Labor Force in Bardonia?
61.0% of People are in the Labor Force in Bardonia.
What is the Unemployment Rate in Bardonia?
Unemployment Rate in Bardonia is 4.3%.