Richmondville, NY Map & Demographics
Richmondville Map
Richmondville Overview
$25,897
PER CAPITA INCOME
$58,523
AVG FAMILY INCOME
$47,132
AVG HOUSEHOLD INCOME
55.8%
WAGE / INCOME GAP [ % ]
44.2¢/ $1
WAGE / INCOME GAP [ $ ]
0.43
INEQUALITY / GINI INDEX
983
TOTAL POPULATION
425
MALE POPULATION
558
FEMALE POPULATION
76.16
MALES / 100 FEMALES
131.29
FEMALES / 100 MALES
33.6
MEDIAN AGE
3.3
AVG FAMILY SIZE
2.5
AVG HOUSEHOLD SIZE
478
LABOR FORCE [ PEOPLE ]
64.3%
PERCENT IN LABOR FORCE
3.3%
UNEMPLOYMENT RATE
Richmondville Zip Codes
Richmondville Area Codes
Income in Richmondville
Income Overview in Richmondville
Per Capita Income in Richmondville is $25,897, while median incomes of families and households are $58,523 and $47,132 respectively.
| Characteristic | Number | Measure |
| Per Capita Income | 983 | $25,897 |
| Median Family Income | 221 | $58,523 |
| Mean Family Income | 221 | $76,599 |
| Median Household Income | 393 | $47,132 |
| Mean Household Income | 393 | $62,856 |
| Income Deficit | 221 | $0 |
| Wage / Income Gap (%) | 983 | 55.76% |
| Wage / Income Gap ($) | 983 | 44.24¢ per $1 |
| Gini / Inequality Index | 983 | 0.43 |
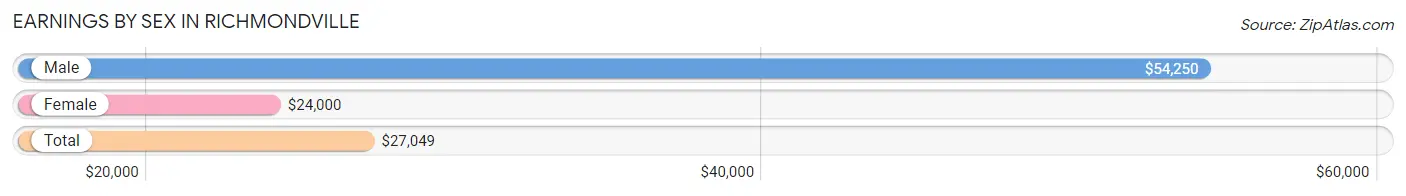
Earnings by Sex in Richmondville
Average Earnings in Richmondville are $27,049, $54,250 for men and $24,000 for women, a difference of 55.8%.
| Sex | Number | Average Earnings |
| Male | 215 (43.1%) | $54,250 |
| Female | 284 (56.9%) | $24,000 |
| Total | 499 (100.0%) | $27,049 |
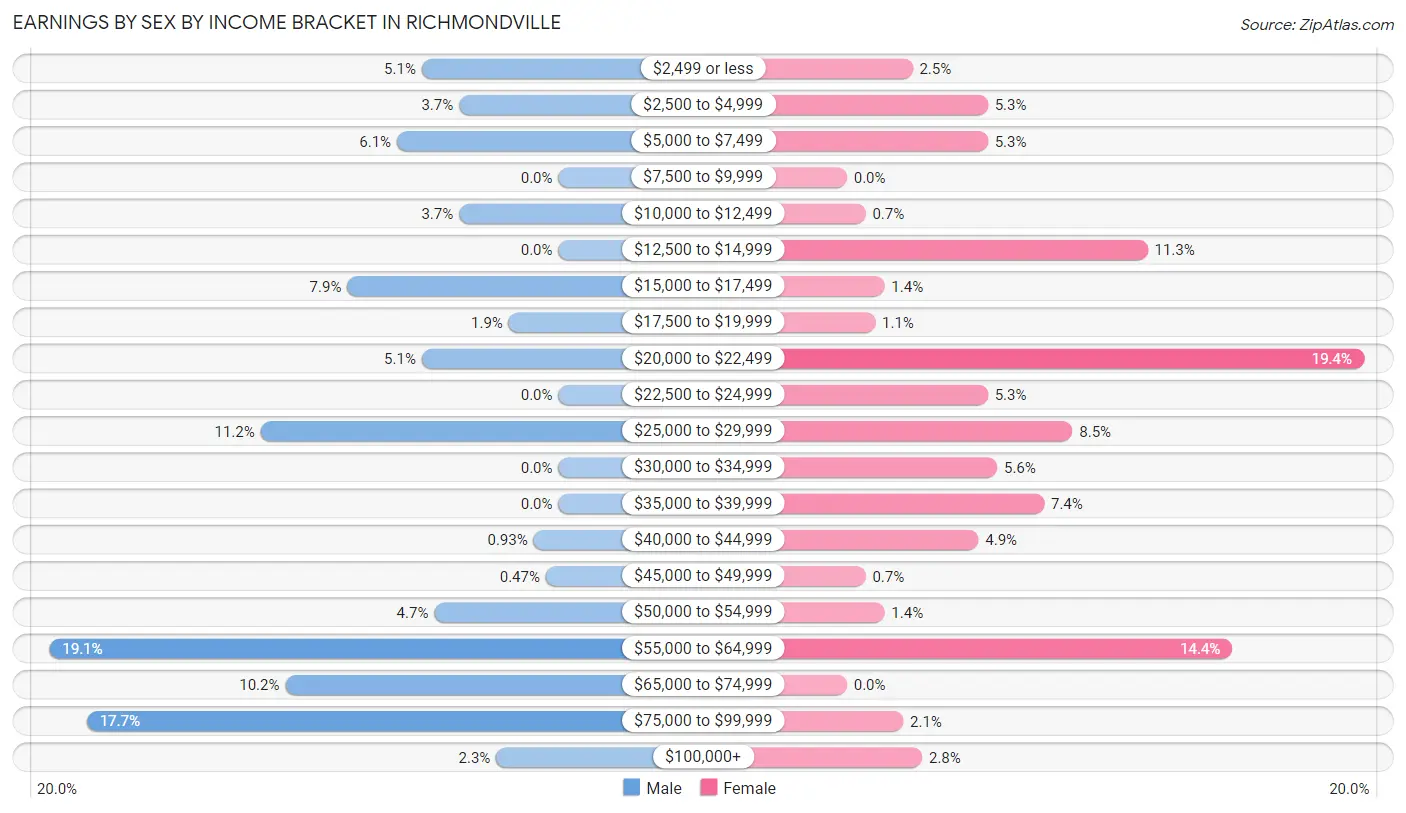
Earnings by Sex by Income Bracket in Richmondville
The most common earnings brackets in Richmondville are $55,000 to $64,999 for men (41 | 19.1%) and $20,000 to $22,499 for women (55 | 19.4%).
| Income | Male | Female |
| $2,499 or less | 11 (5.1%) | 7 (2.5%) |
| $2,500 to $4,999 | 8 (3.7%) | 15 (5.3%) |
| $5,000 to $7,499 | 13 (6.0%) | 15 (5.3%) |
| $7,500 to $9,999 | 0 (0.0%) | 0 (0.0%) |
| $10,000 to $12,499 | 8 (3.7%) | 2 (0.7%) |
| $12,500 to $14,999 | 0 (0.0%) | 32 (11.3%) |
| $15,000 to $17,499 | 17 (7.9%) | 4 (1.4%) |
| $17,500 to $19,999 | 4 (1.9%) | 3 (1.1%) |
| $20,000 to $22,499 | 11 (5.1%) | 55 (19.4%) |
| $22,500 to $24,999 | 0 (0.0%) | 15 (5.3%) |
| $25,000 to $29,999 | 24 (11.2%) | 24 (8.5%) |
| $30,000 to $34,999 | 0 (0.0%) | 16 (5.6%) |
| $35,000 to $39,999 | 0 (0.0%) | 21 (7.4%) |
| $40,000 to $44,999 | 2 (0.9%) | 14 (4.9%) |
| $45,000 to $49,999 | 1 (0.5%) | 2 (0.7%) |
| $50,000 to $54,999 | 10 (4.6%) | 4 (1.4%) |
| $55,000 to $64,999 | 41 (19.1%) | 41 (14.4%) |
| $65,000 to $74,999 | 22 (10.2%) | 0 (0.0%) |
| $75,000 to $99,999 | 38 (17.7%) | 6 (2.1%) |
| $100,000+ | 5 (2.3%) | 8 (2.8%) |
| Total | 215 (100.0%) | 284 (100.0%) |
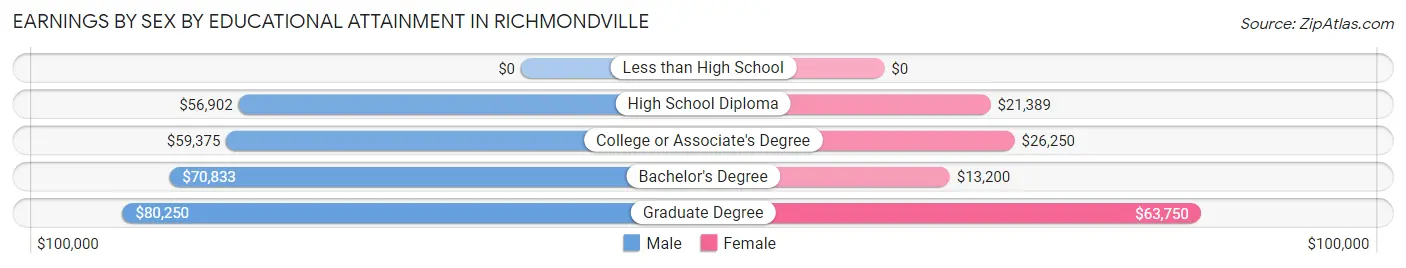
Earnings by Sex by Educational Attainment in Richmondville
Average earnings in Richmondville are $57,100 for men and $23,500 for women, a difference of 58.8%. Men with an educational attainment of graduate degree enjoy the highest average annual earnings of $80,250, while those with high school diploma education earn the least with $56,902. Women with an educational attainment of graduate degree earn the most with the average annual earnings of $63,750, while those with bachelor's degree education have the smallest earnings of $13,200.
| Educational Attainment | Male Income | Female Income |
| Less than High School | - | - |
| High School Diploma | $56,902 | $21,389 |
| College or Associate's Degree | $59,375 | $26,250 |
| Bachelor's Degree | $70,833 | $13,200 |
| Graduate Degree | $80,250 | $63,750 |
| Total | $57,100 | $23,500 |
Family Income in Richmondville
Family Income Brackets in Richmondville
According to the Richmondville family income data, there are 47 families falling into the $100,000 to $149,999 income range, which is the most common income bracket and makes up 21.3% of all families. Conversely, the $150,000 to $199,999 income bracket is the least frequent group with only 5 families (2.3%) belonging to this category.
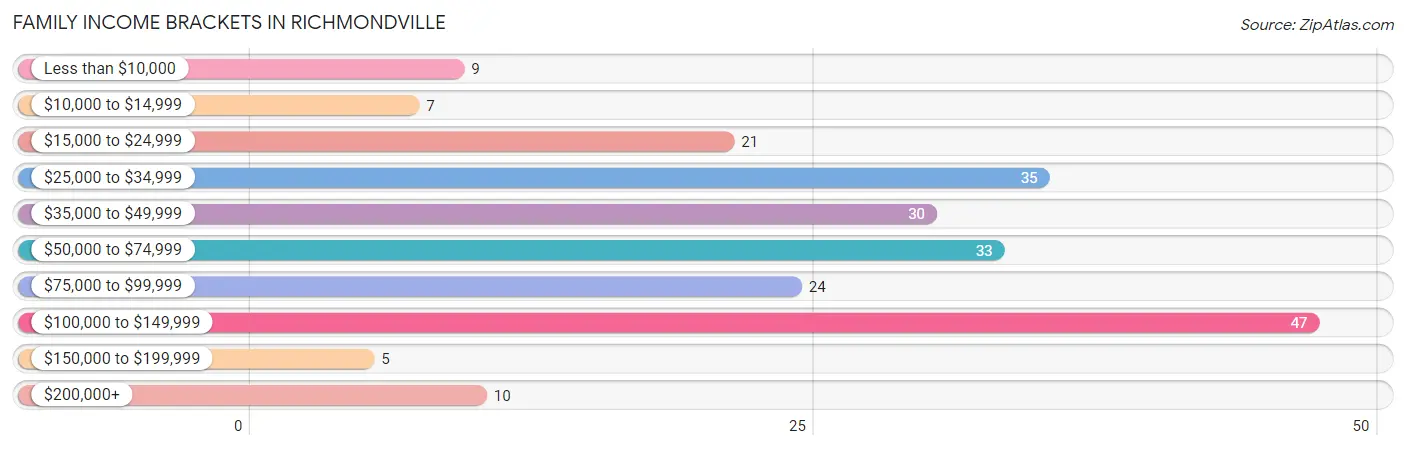
| Income Bracket | # Families | % Families |
| Less than $10,000 | 9 | 4.1% |
| $10,000 to $14,999 | 7 | 3.2% |
| $15,000 to $24,999 | 21 | 9.5% |
| $25,000 to $34,999 | 35 | 15.8% |
| $35,000 to $49,999 | 30 | 13.6% |
| $50,000 to $74,999 | 33 | 14.9% |
| $75,000 to $99,999 | 24 | 10.9% |
| $100,000 to $149,999 | 47 | 21.3% |
| $150,000 to $199,999 | 5 | 2.3% |
| $200,000+ | 10 | 4.5% |
Family Income by Famaliy Size in Richmondville
3-person families (52 | 23.5%) account for the highest median family income in Richmondville with $62,045 per family, while 2-person families (109 | 49.3%) have the highest median income of $22,831 per family member.
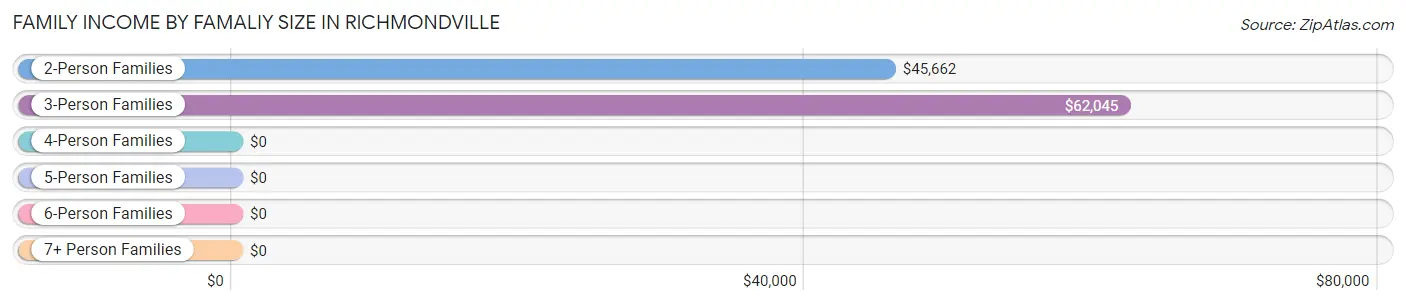
| Income Bracket | # Families | Median Income |
| 2-Person Families | 109 (49.3%) | $45,662 |
| 3-Person Families | 52 (23.5%) | $62,045 |
| 4-Person Families | 25 (11.3%) | $0 |
| 5-Person Families | 18 (8.1%) | $0 |
| 6-Person Families | 5 (2.3%) | $0 |
| 7+ Person Families | 12 (5.4%) | $0 |
| Total | 221 (100.0%) | $58,523 |
Family Income by Number of Earners in Richmondville
The median family income in Richmondville is $58,523, with families comprising 2 earners (71) having the highest median family income of $101,563, while families with no earners (22) have the lowest median family income of $10,833, accounting for 32.1% and 10.0% of families, respectively.
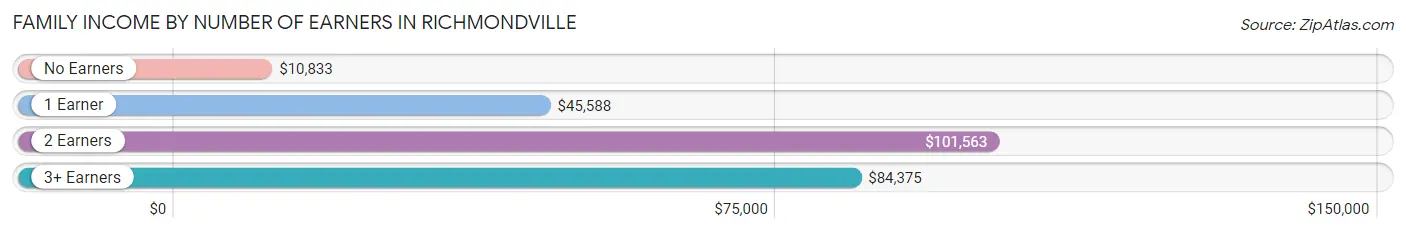
| Number of Earners | # Families | Median Income |
| No Earners | 22 (10.0%) | $10,833 |
| 1 Earner | 104 (47.1%) | $45,588 |
| 2 Earners | 71 (32.1%) | $101,563 |
| 3+ Earners | 24 (10.9%) | $84,375 |
| Total | 221 (100.0%) | $58,523 |
Household Income in Richmondville
Household Income Brackets in Richmondville
With 83 households falling in the category, the $50,000 to $74,999 income range is the most frequent in Richmondville, accounting for 21.1% of all households. In contrast, only 7 households (1.8%) fall into the $150,000 to $199,999 income bracket, making it the least populous group.
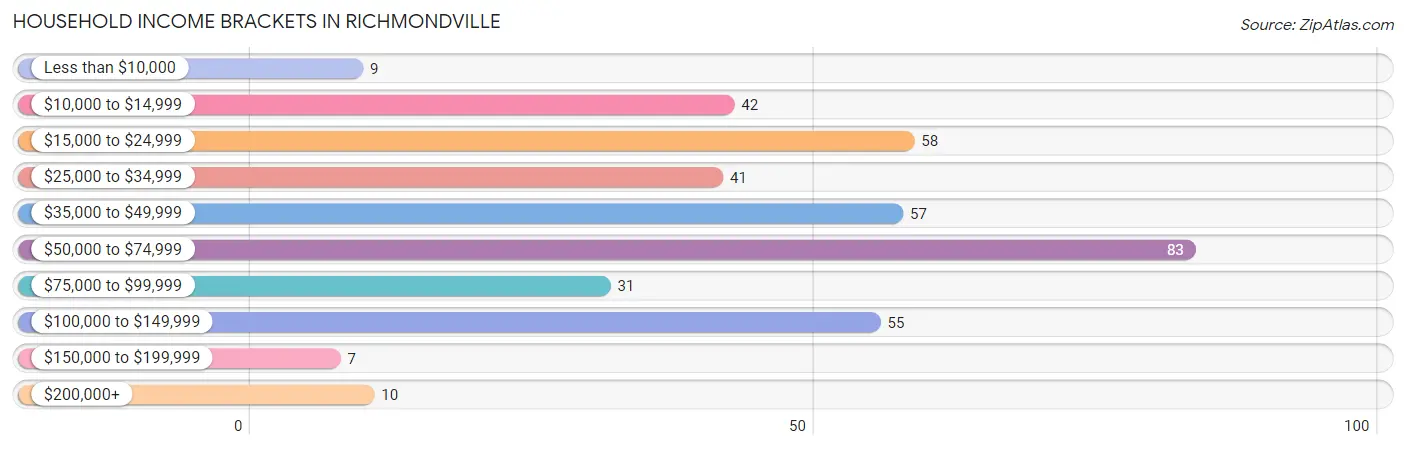
| Income Bracket | # Households | % Households |
| Less than $10,000 | 9 | 2.3% |
| $10,000 to $14,999 | 42 | 10.7% |
| $15,000 to $24,999 | 58 | 14.8% |
| $25,000 to $34,999 | 41 | 10.4% |
| $35,000 to $49,999 | 57 | 14.5% |
| $50,000 to $74,999 | 83 | 21.1% |
| $75,000 to $99,999 | 31 | 7.9% |
| $100,000 to $149,999 | 55 | 14.0% |
| $150,000 to $199,999 | 7 | 1.8% |
| $200,000+ | 10 | 2.5% |
Household Income by Householder Age in Richmondville
The median household income in Richmondville is $47,132, with the highest median household income of $73,194 found in the 45 to 64 years age bracket for the primary householder. A total of 106 households (27.0%) fall into this category. Meanwhile, the 15 to 24 years age bracket for the primary householder has the lowest median household income of $0, with 17 households (4.3%) in this group.
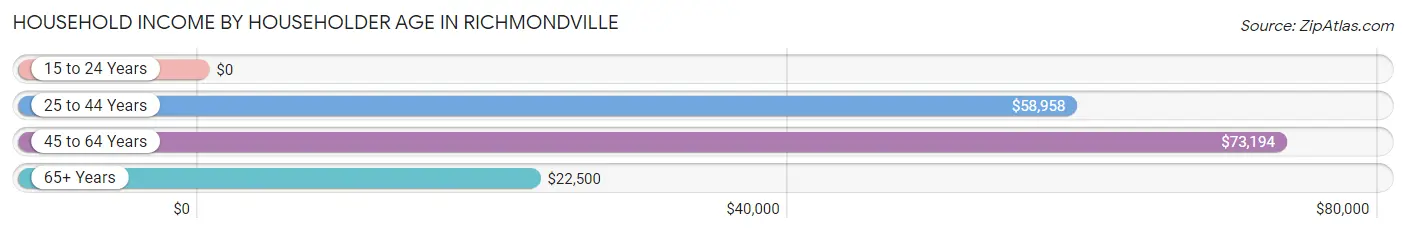
| Income Bracket | # Households | Median Income |
| 15 to 24 Years | 17 (4.3%) | $0 |
| 25 to 44 Years | 158 (40.2%) | $58,958 |
| 45 to 64 Years | 106 (27.0%) | $73,194 |
| 65+ Years | 112 (28.5%) | $22,500 |
| Total | 393 (100.0%) | $47,132 |
Poverty in Richmondville
Income Below Poverty by Sex and Age in Richmondville
With 15.6% poverty level for males and 13.3% for females among the residents of Richmondville, 65 to 74 year old males and 5 year old females are the most vulnerable to poverty, with 20 males (57.1%) and 8 females (100.0%) in their respective age groups living below the poverty level.
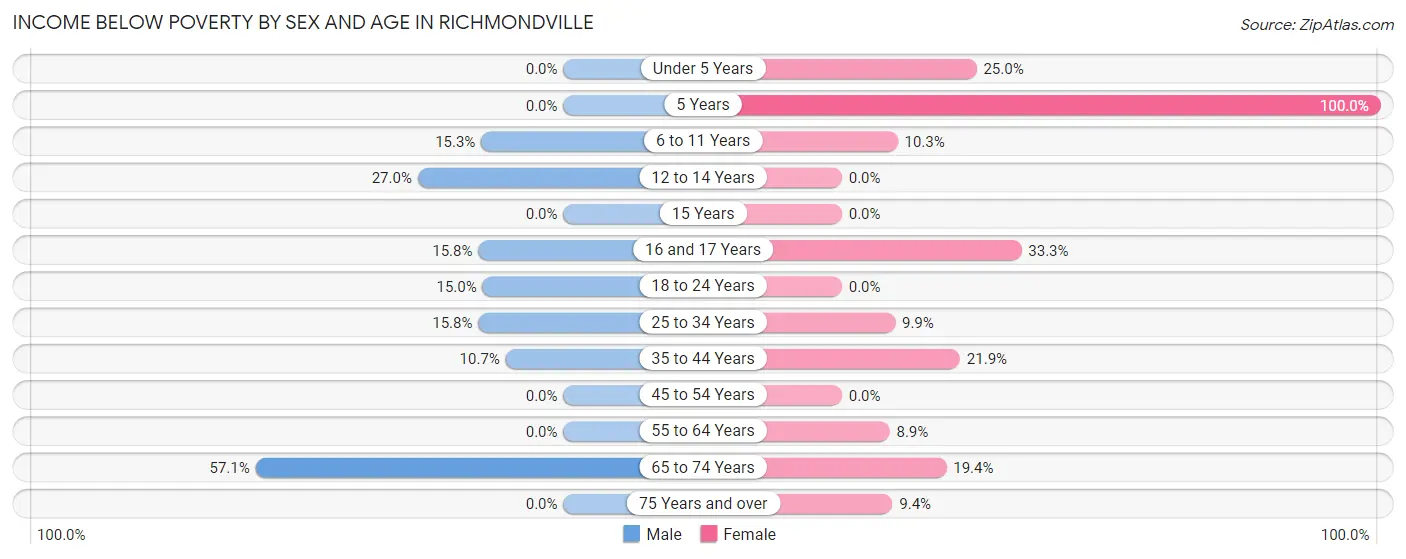
| Age Bracket | Male | Female |
| Under 5 Years | 0 (0.0%) | 7 (25.0%) |
| 5 Years | 0 (0.0%) | 8 (100.0%) |
| 6 to 11 Years | 9 (15.2%) | 6 (10.3%) |
| 12 to 14 Years | 10 (27.0%) | 0 (0.0%) |
| 15 Years | 0 (0.0%) | 0 (0.0%) |
| 16 and 17 Years | 6 (15.8%) | 5 (33.3%) |
| 18 to 24 Years | 3 (15.0%) | 0 (0.0%) |
| 25 to 34 Years | 12 (15.8%) | 8 (9.9%) |
| 35 to 44 Years | 6 (10.7%) | 16 (21.9%) |
| 45 to 54 Years | 0 (0.0%) | 0 (0.0%) |
| 55 to 64 Years | 0 (0.0%) | 7 (8.9%) |
| 65 to 74 Years | 20 (57.1%) | 13 (19.4%) |
| 75 Years and over | 0 (0.0%) | 3 (9.4%) |
| Total | 66 (15.6%) | 73 (13.3%) |
Income Above Poverty by Sex and Age in Richmondville
According to the poverty statistics in Richmondville, males aged under 5 years and females aged 12 to 14 years are the age groups that are most secure financially, with 100.0% of males and 100.0% of females in these age groups living above the poverty line.
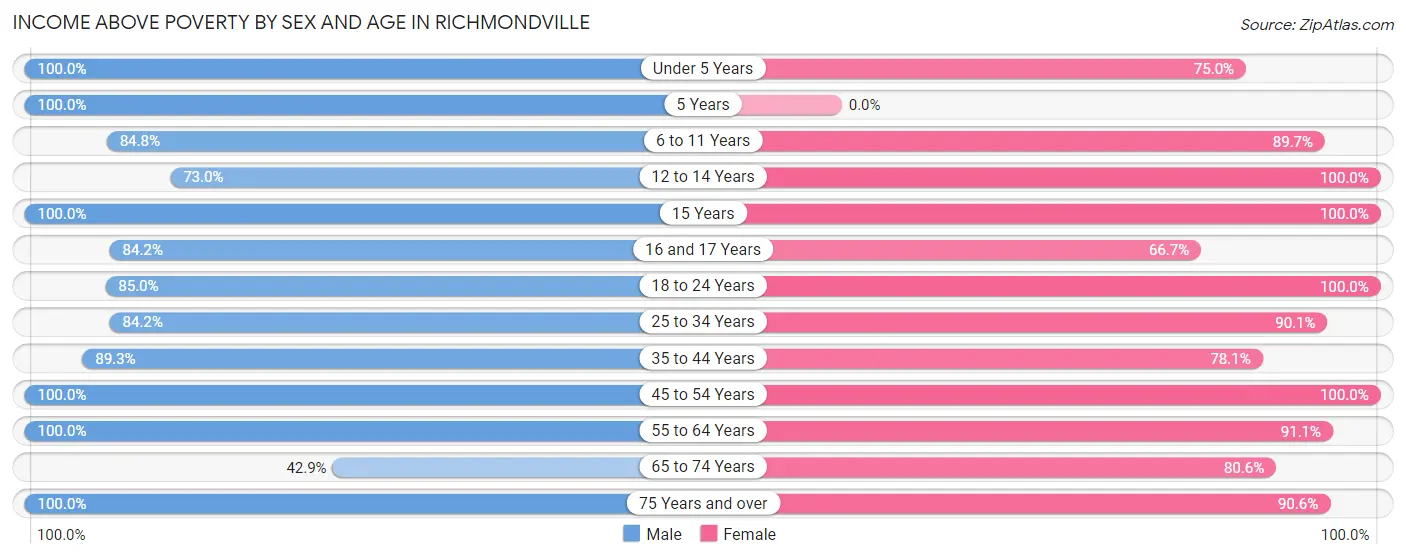
| Age Bracket | Male | Female |
| Under 5 Years | 4 (100.0%) | 21 (75.0%) |
| 5 Years | 4 (100.0%) | 0 (0.0%) |
| 6 to 11 Years | 50 (84.8%) | 52 (89.7%) |
| 12 to 14 Years | 27 (73.0%) | 17 (100.0%) |
| 15 Years | 2 (100.0%) | 13 (100.0%) |
| 16 and 17 Years | 32 (84.2%) | 10 (66.7%) |
| 18 to 24 Years | 17 (85.0%) | 30 (100.0%) |
| 25 to 34 Years | 64 (84.2%) | 73 (90.1%) |
| 35 to 44 Years | 50 (89.3%) | 57 (78.1%) |
| 45 to 54 Years | 20 (100.0%) | 50 (100.0%) |
| 55 to 64 Years | 55 (100.0%) | 72 (91.1%) |
| 65 to 74 Years | 15 (42.9%) | 54 (80.6%) |
| 75 Years and over | 16 (100.0%) | 29 (90.6%) |
| Total | 356 (84.4%) | 478 (86.8%) |
Income Below Poverty Among Married-Couple Families in Richmondville
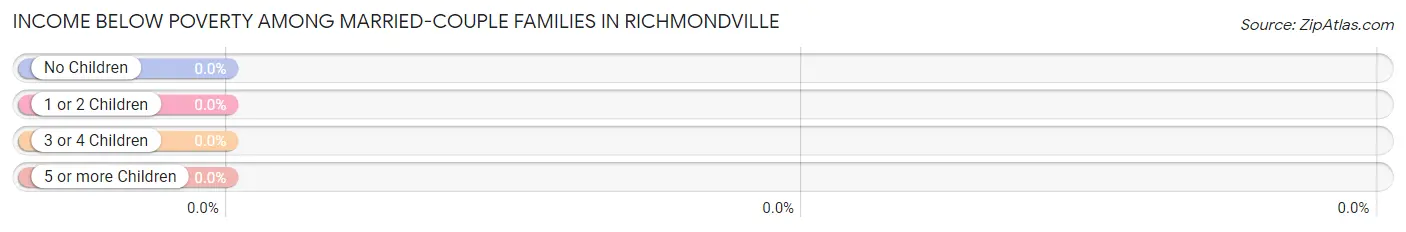
| Children | Above Poverty | Below Poverty |
| No Children | 44 (100.0%) | 0 (0.0%) |
| 1 or 2 Children | 53 (100.0%) | 0 (0.0%) |
| 3 or 4 Children | 4 (100.0%) | 0 (0.0%) |
| 5 or more Children | 12 (100.0%) | 0 (0.0%) |
| Total | 113 (100.0%) | 0 (0.0%) |
Income Below Poverty Among Single-Parent Households in Richmondville
According to the poverty data in Richmondville, 2.5% or 1 single-father households and 32.4% or 22 single-mother households are living below the poverty line. Among single-father households, those with 3 or 4 children have the highest poverty rate, with 1 households (8.3%) experiencing poverty. Likewise, among single-mother households, those with 5 or more children have the highest poverty rate, with 4 households (100.0%) falling below the poverty line.
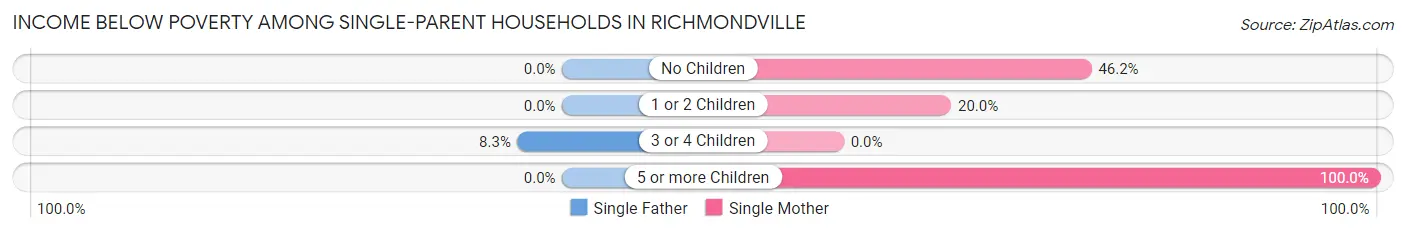
| Children | Single Father | Single Mother |
| No Children | 0 (0.0%) | 12 (46.2%) |
| 1 or 2 Children | 0 (0.0%) | 6 (20.0%) |
| 3 or 4 Children | 1 (8.3%) | 0 (0.0%) |
| 5 or more Children | 0 (0.0%) | 4 (100.0%) |
| Total | 1 (2.5%) | 22 (32.4%) |
Income Below Poverty Among Married-Couple vs Single-Parent Households in Richmondville
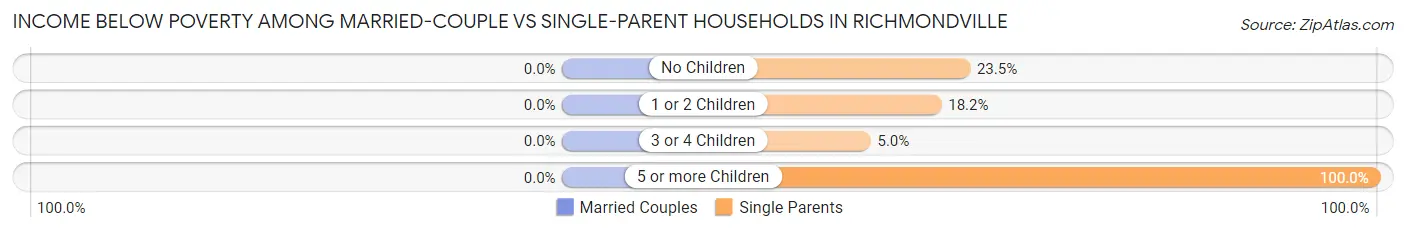
| Children | Married-Couple Families | Single-Parent Households |
| No Children | 0 (0.0%) | 12 (23.5%) |
| 1 or 2 Children | 0 (0.0%) | 6 (18.2%) |
| 3 or 4 Children | 0 (0.0%) | 1 (5.0%) |
| 5 or more Children | 0 (0.0%) | 4 (100.0%) |
| Total | 0 (0.0%) | 23 (21.3%) |
Race in Richmondville
The most populous races in Richmondville are White / Caucasian (925 | 94.1%), Two or more Races (40 | 4.1%), and Hispanic or Latino (15 | 1.5%).
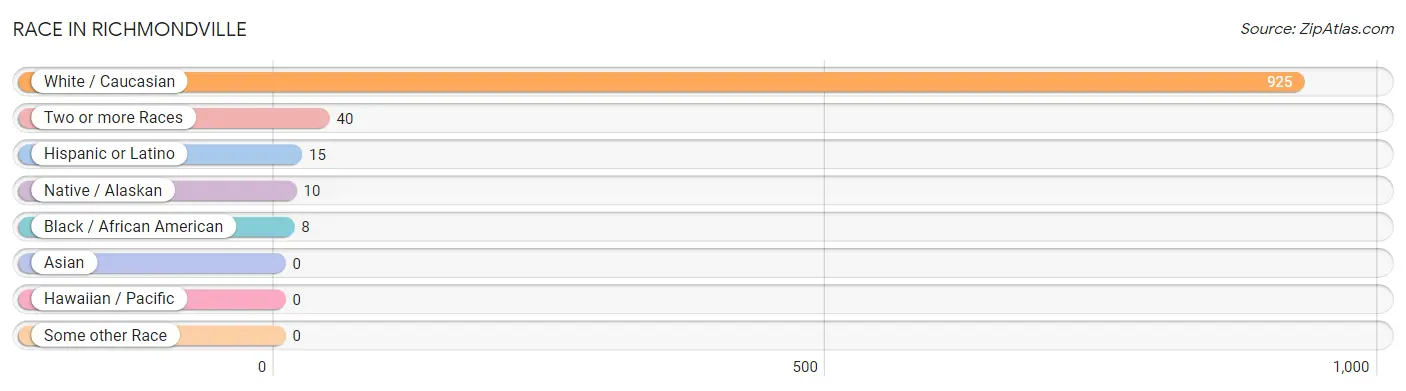
| Race | # Population | % Population |
| Asian | 0 | 0.0% |
| Black / African American | 8 | 0.8% |
| Hawaiian / Pacific | 0 | 0.0% |
| Hispanic or Latino | 15 | 1.5% |
| Native / Alaskan | 10 | 1.0% |
| White / Caucasian | 925 | 94.1% |
| Two or more Races | 40 | 4.1% |
| Some other Race | 0 | 0.0% |
| Total | 983 | 100.0% |
Ancestry in Richmondville
The most populous ancestries reported in Richmondville are German (386 | 39.3%), Irish (147 | 14.9%), Italian (138 | 14.0%), Dutch (111 | 11.3%), and English (84 | 8.6%), together accounting for 88.1% of all Richmondville residents.
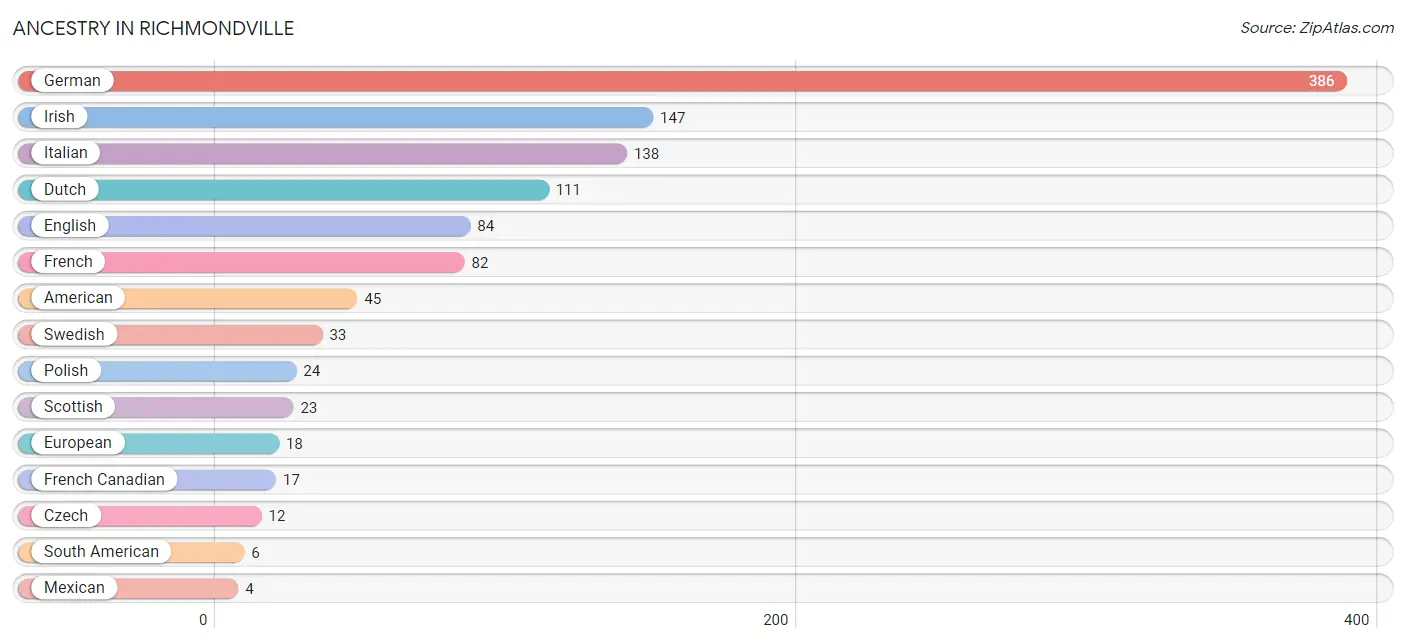
| Ancestry | # Population | % Population |
| American | 45 | 4.6% |
| Armenian | 2 | 0.2% |
| Colombian | 3 | 0.3% |
| Czech | 12 | 1.2% |
| Dominican | 2 | 0.2% |
| Dutch | 111 | 11.3% |
| Eastern European | 3 | 0.3% |
| English | 84 | 8.6% |
| European | 18 | 1.8% |
| French | 82 | 8.3% |
| French Canadian | 17 | 1.7% |
| German | 386 | 39.3% |
| Haitian | 2 | 0.2% |
| Irish | 147 | 14.9% |
| Italian | 138 | 14.0% |
| Mexican | 4 | 0.4% |
| Polish | 24 | 2.4% |
| Puerto Rican | 3 | 0.3% |
| Scottish | 23 | 2.3% |
| South American | 6 | 0.6% |
| Swedish | 33 | 3.4% |
| Turkish | 2 | 0.2% |
| Ukrainian | 2 | 0.2% |
| Venezuelan | 3 | 0.3% | View All 24 Rows |
Immigrants in Richmondville
The most numerous immigrant groups reported in Richmondville came from Latin America (6 | 0.6%), Brazil (4 | 0.4%), South America (4 | 0.4%), Asia (2 | 0.2%), and Caribbean (2 | 0.2%), together accounting for 1.8% of all Richmondville residents.
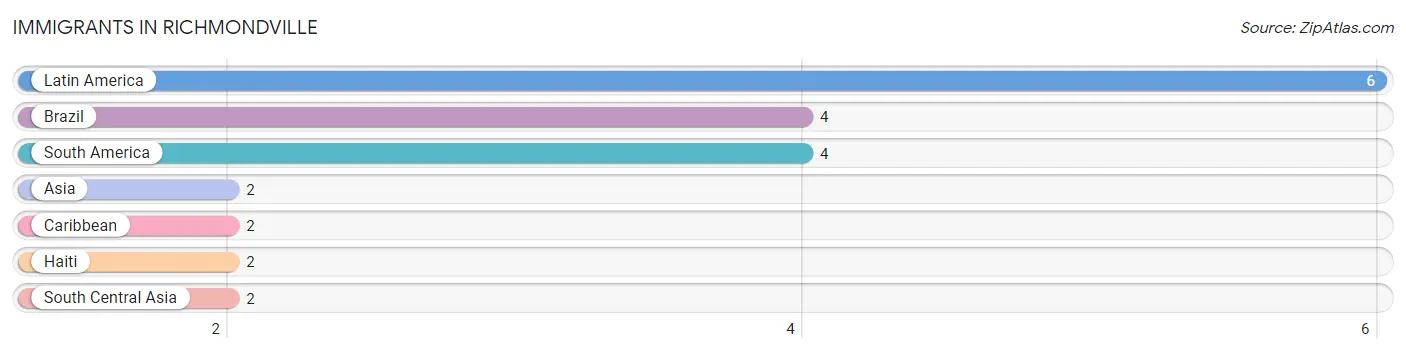
| Immigration Origin | # Population | % Population |
| Asia | 2 | 0.2% |
| Brazil | 4 | 0.4% |
| Caribbean | 2 | 0.2% |
| Haiti | 2 | 0.2% |
| Latin America | 6 | 0.6% |
| South America | 4 | 0.4% |
| South Central Asia | 2 | 0.2% | View All 7 Rows |
Sex and Age in Richmondville
Sex and Age in Richmondville
The most populous age groups in Richmondville are 10 to 14 Years (55 | 12.9%) for men and 60 to 64 Years (55 | 9.9%) for women.
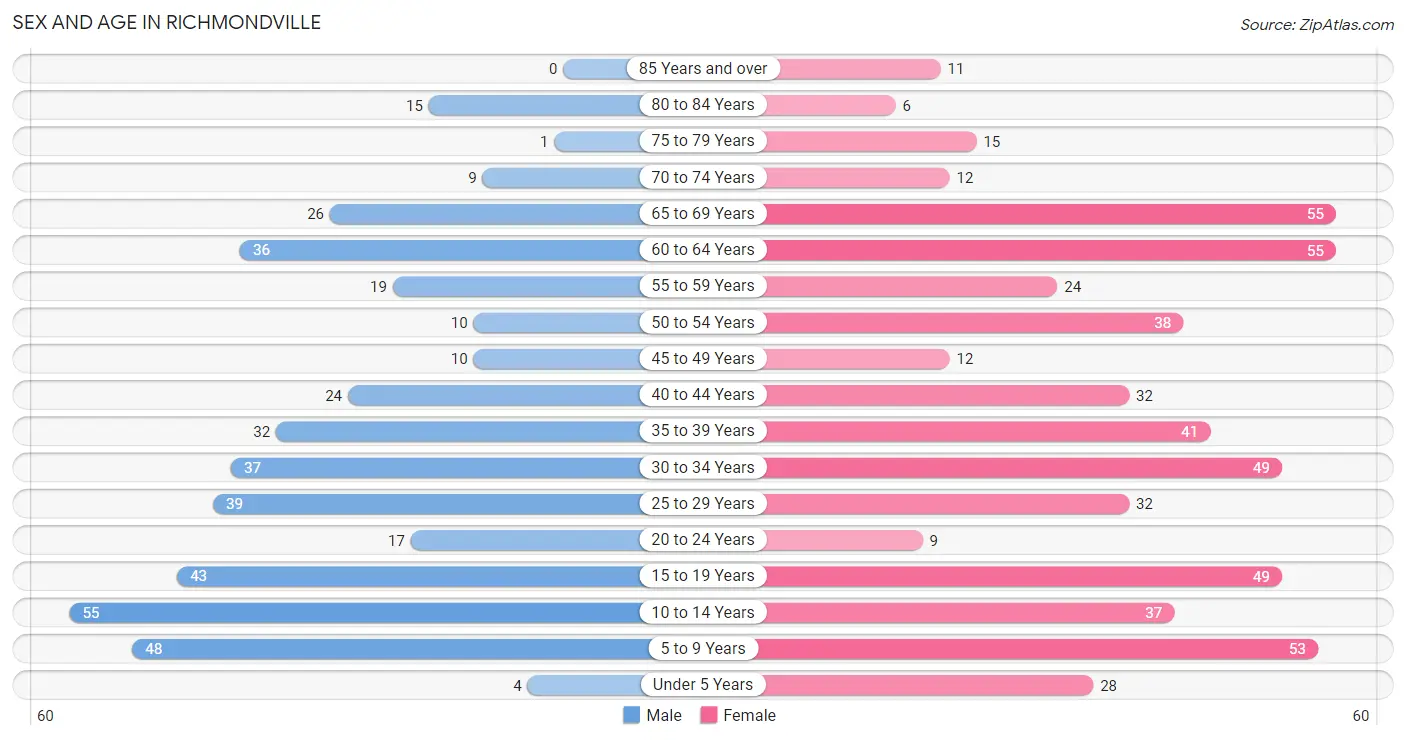
| Age Bracket | Male | Female |
| Under 5 Years | 4 (0.9%) | 28 (5.0%) |
| 5 to 9 Years | 48 (11.3%) | 53 (9.5%) |
| 10 to 14 Years | 55 (12.9%) | 37 (6.6%) |
| 15 to 19 Years | 43 (10.1%) | 49 (8.8%) |
| 20 to 24 Years | 17 (4.0%) | 9 (1.6%) |
| 25 to 29 Years | 39 (9.2%) | 32 (5.7%) |
| 30 to 34 Years | 37 (8.7%) | 49 (8.8%) |
| 35 to 39 Years | 32 (7.5%) | 41 (7.3%) |
| 40 to 44 Years | 24 (5.7%) | 32 (5.7%) |
| 45 to 49 Years | 10 (2.4%) | 12 (2.1%) |
| 50 to 54 Years | 10 (2.4%) | 38 (6.8%) |
| 55 to 59 Years | 19 (4.5%) | 24 (4.3%) |
| 60 to 64 Years | 36 (8.5%) | 55 (9.9%) |
| 65 to 69 Years | 26 (6.1%) | 55 (9.9%) |
| 70 to 74 Years | 9 (2.1%) | 12 (2.1%) |
| 75 to 79 Years | 1 (0.2%) | 15 (2.7%) |
| 80 to 84 Years | 15 (3.5%) | 6 (1.1%) |
| 85 Years and over | 0 (0.0%) | 11 (2.0%) |
| Total | 425 (100.0%) | 558 (100.0%) |
Families and Households in Richmondville
Median Family Size in Richmondville
The median family size in Richmondville is 3.28 persons per family, with married-couple families (113 | 51.1%) accounting for the largest median family size of 3.62 persons per family. On the other hand, single male/father families (40 | 18.1%) represent the smallest median family size with 2.63 persons per family.
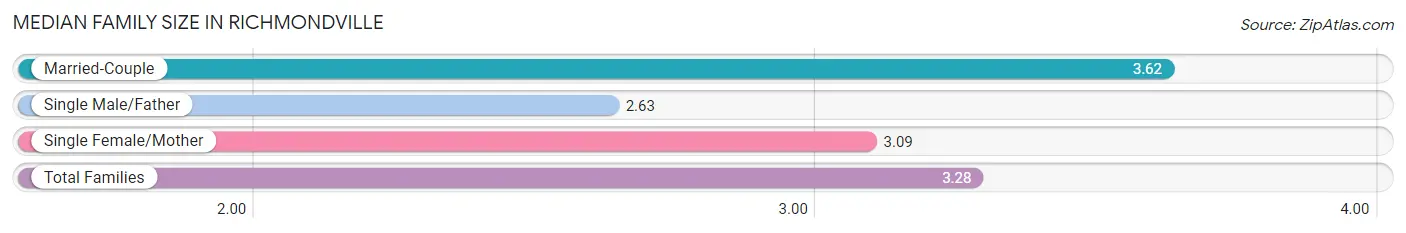
| Family Type | # Families | Family Size |
| Married-Couple | 113 (51.1%) | 3.62 |
| Single Male/Father | 40 (18.1%) | 2.63 |
| Single Female/Mother | 68 (30.8%) | 3.09 |
| Total Families | 221 (100.0%) | 3.28 |
Median Household Size in Richmondville
The median household size in Richmondville is 2.47 persons per household, with married-couple households (113 | 28.7%) accounting for the largest median household size of 3.68 persons per household. non-family households (172 | 43.8%) represent the smallest median household size with 1.30 persons per household.
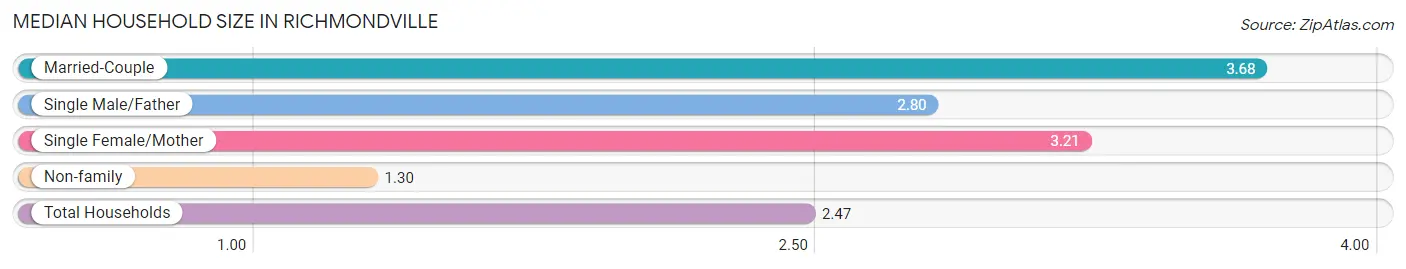
| Household Type | # Households | Household Size |
| Married-Couple | 113 (28.7%) | 3.68 |
| Single Male/Father | 40 (10.2%) | 2.80 |
| Single Female/Mother | 68 (17.3%) | 3.21 |
| Non-family | 172 (43.8%) | 1.30 |
| Total Households | 393 (100.0%) | 2.47 |
Household Size by Marriage Status in Richmondville
Out of a total of 393 households in Richmondville, 221 (56.2%) are family households, while 172 (43.8%) are nonfamily households. The most numerous type of family households are 2-person households, comprising 108, and the most common type of nonfamily households are 1-person households, comprising 127.
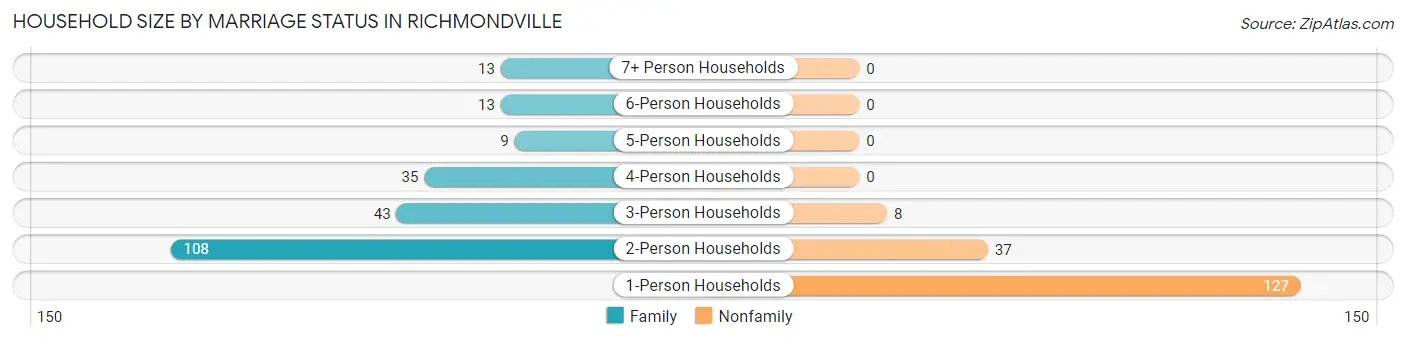
| Household Size | Family Households | Nonfamily Households |
| 1-Person Households | - | 127 (32.3%) |
| 2-Person Households | 108 (27.5%) | 37 (9.4%) |
| 3-Person Households | 43 (10.9%) | 8 (2.0%) |
| 4-Person Households | 35 (8.9%) | 0 (0.0%) |
| 5-Person Households | 9 (2.3%) | 0 (0.0%) |
| 6-Person Households | 13 (3.3%) | 0 (0.0%) |
| 7+ Person Households | 13 (3.3%) | 0 (0.0%) |
| Total | 221 (56.2%) | 172 (43.8%) |
Female Fertility in Richmondville
Fertility by Age in Richmondville
Average fertility rate in Richmondville is 13.0 births per 1,000 women. Women in the age bracket of 20 to 34 years have the highest fertility rate with 33.0 births per 1,000 women. Women in the age bracket of 20 to 34 years acount for 100.0% of all women with births.
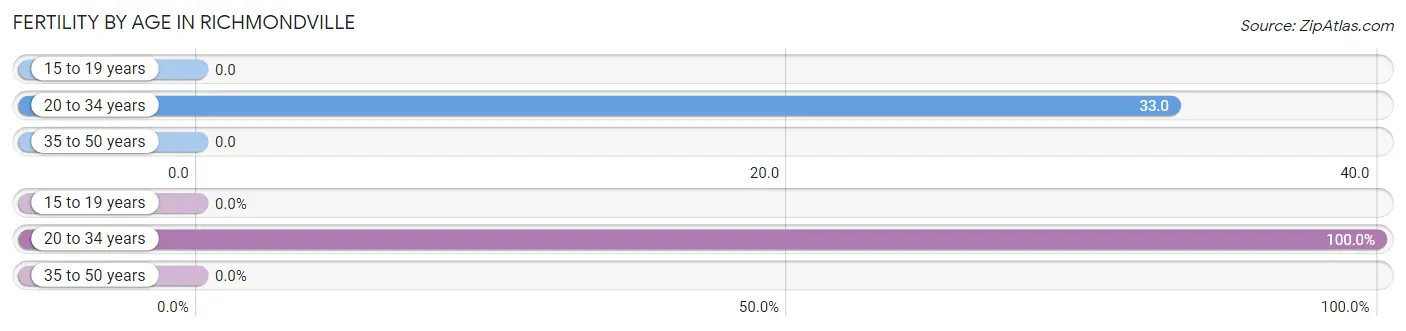
| Age Bracket | Women with Births | Births / 1,000 Women |
| 15 to 19 years | 0 (0.0%) | 0.0 |
| 20 to 34 years | 3 (100.0%) | 33.0 |
| 35 to 50 years | 0 (0.0%) | 0.0 |
| Total | 3 (100.0%) | 13.0 |
Fertility by Age by Marriage Status in Richmondville
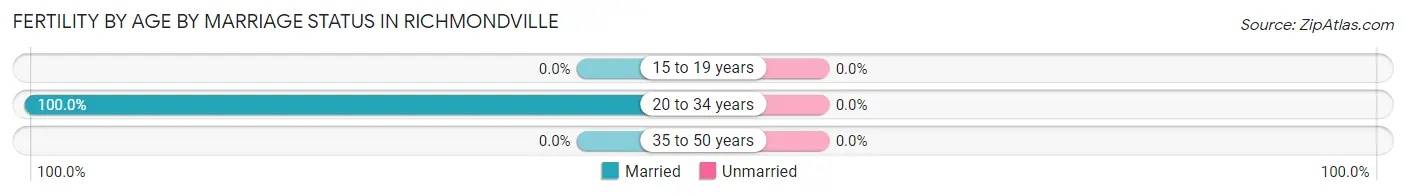
| Age Bracket | Married | Unmarried |
| 15 to 19 years | 0 (0.0%) | 0 (0.0%) |
| 20 to 34 years | 3 (100.0%) | 0 (0.0%) |
| 35 to 50 years | 0 (0.0%) | 0 (0.0%) |
| Total | 3 (100.0%) | 0 (0.0%) |
Fertility by Education in Richmondville
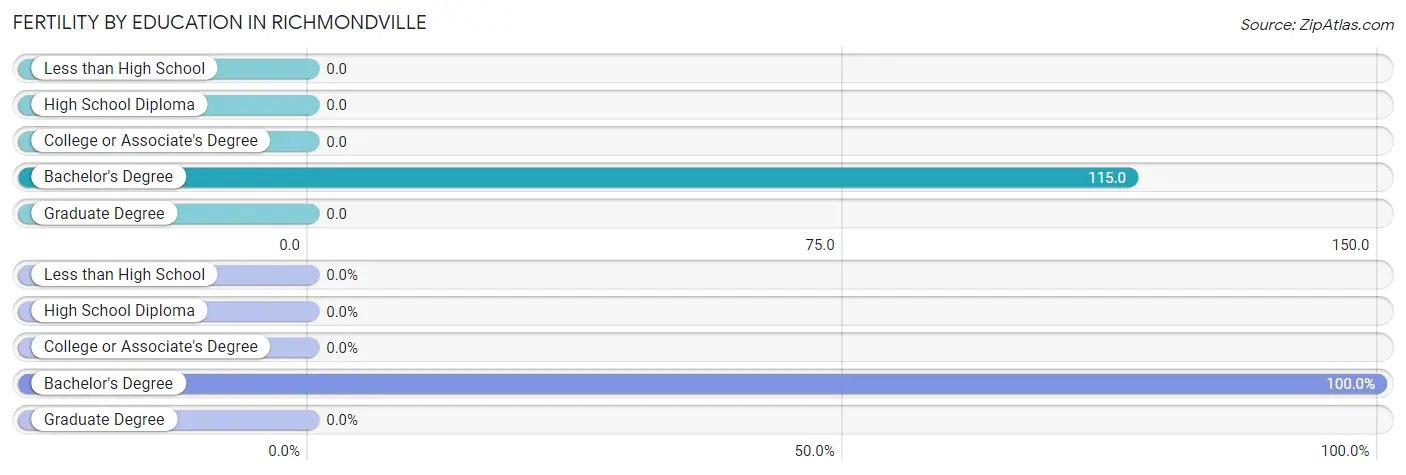
| Educational Attainment | Women with Births | Births / 1,000 Women |
| Less than High School | 0 (0.0%) | 0.0 |
| High School Diploma | 0 (0.0%) | 0.0 |
| College or Associate's Degree | 0 (0.0%) | 0.0 |
| Bachelor's Degree | 3 (100.0%) | 115.0 |
| Graduate Degree | 0 (0.0%) | 0.0 |
| Total | 3 (100.0%) | 13.0 |
Fertility by Education by Marriage Status in Richmondville
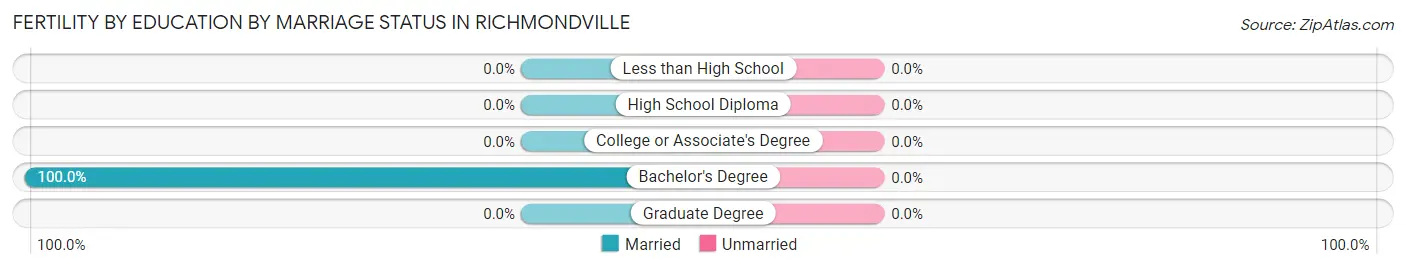
| Educational Attainment | Married | Unmarried |
| Less than High School | 0 (0.0%) | 0 (0.0%) |
| High School Diploma | 0 (0.0%) | 0 (0.0%) |
| College or Associate's Degree | 0 (0.0%) | 0 (0.0%) |
| Bachelor's Degree | 3 (100.0%) | 0 (0.0%) |
| Graduate Degree | 0 (0.0%) | 0 (0.0%) |
| Total | 3 (100.0%) | 0 (0.0%) |
Employment Characteristics in Richmondville
Employment by Class of Employer in Richmondville
Among the 408 employed individuals in Richmondville, private company employees (233 | 57.1%), not-for-profit organizations (62 | 15.2%), and local government employees (59 | 14.5%) make up the most common classes of employment.
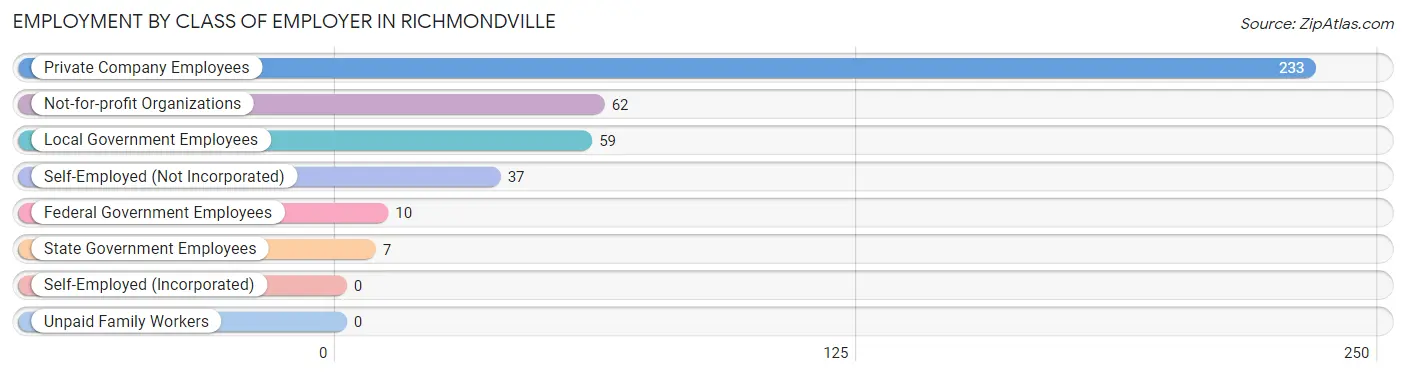
| Employer Class | # Employees | % Employees |
| Private Company Employees | 233 | 57.1% |
| Self-Employed (Incorporated) | 0 | 0.0% |
| Self-Employed (Not Incorporated) | 37 | 9.1% |
| Not-for-profit Organizations | 62 | 15.2% |
| Local Government Employees | 59 | 14.5% |
| State Government Employees | 7 | 1.7% |
| Federal Government Employees | 10 | 2.5% |
| Unpaid Family Workers | 0 | 0.0% |
| Total | 408 | 100.0% |
Employment Status by Age in Richmondville
According to the labor force statistics for Richmondville, out of the total population over 16 years of age (743), 64.3% or 478 individuals are in the labor force, with 3.3% or 16 of them unemployed. The age group with the highest labor force participation rate is 45 to 54 years, with 95.7% or 67 individuals in the labor force. Within the labor force, the 65 to 74 years age range has the highest percentage of unemployed individuals, with 19.0% or 4 of them being unemployed.
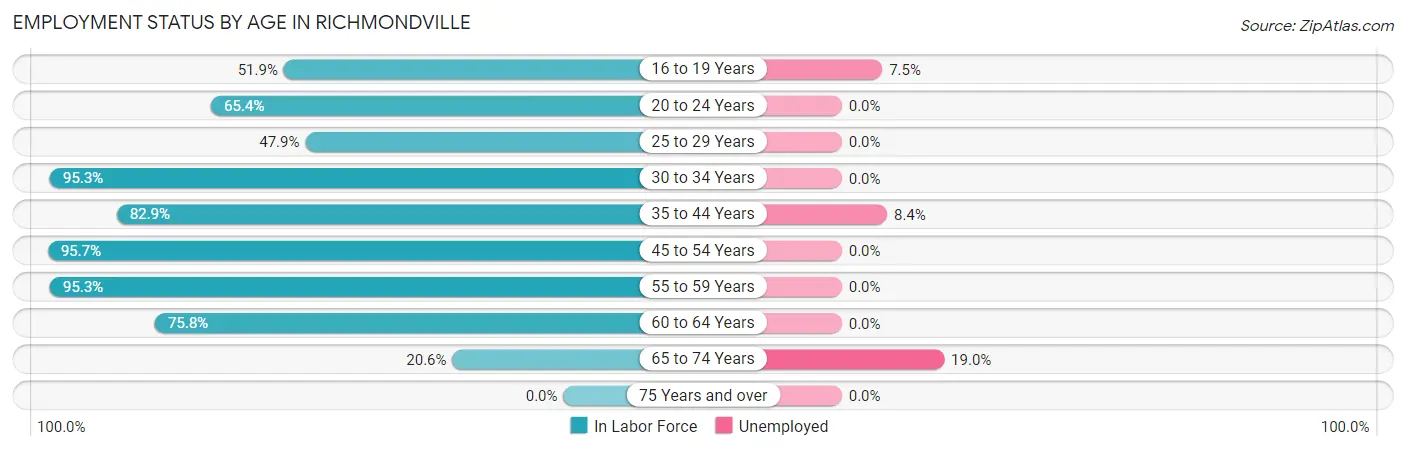
| Age Bracket | In Labor Force | Unemployed |
| 16 to 19 Years | 40 (51.9%) | 3 (7.5%) |
| 20 to 24 Years | 17 (65.4%) | 0 (0.0%) |
| 25 to 29 Years | 34 (47.9%) | 0 (0.0%) |
| 30 to 34 Years | 82 (95.3%) | 0 (0.0%) |
| 35 to 44 Years | 107 (82.9%) | 9 (8.4%) |
| 45 to 54 Years | 67 (95.7%) | 0 (0.0%) |
| 55 to 59 Years | 41 (95.3%) | 0 (0.0%) |
| 60 to 64 Years | 69 (75.8%) | 0 (0.0%) |
| 65 to 74 Years | 21 (20.6%) | 4 (19.0%) |
| 75 Years and over | 0 (0.0%) | 0 (0.0%) |
| Total | 478 (64.3%) | 16 (3.3%) |
Employment Status by Educational Attainment in Richmondville
According to labor force statistics for Richmondville, 81.6% of individuals (400) out of the total population between 25 and 64 years of age (490) are in the labor force, with 2.3% or 9 of them being unemployed. The group with the highest labor force participation rate are those with the educational attainment of less than high school, with 94.1% or 32 individuals in the labor force. Within the labor force, individuals with bachelor's degree or higher education have the highest percentage of unemployment, with 3.9% or 5 of them being unemployed.
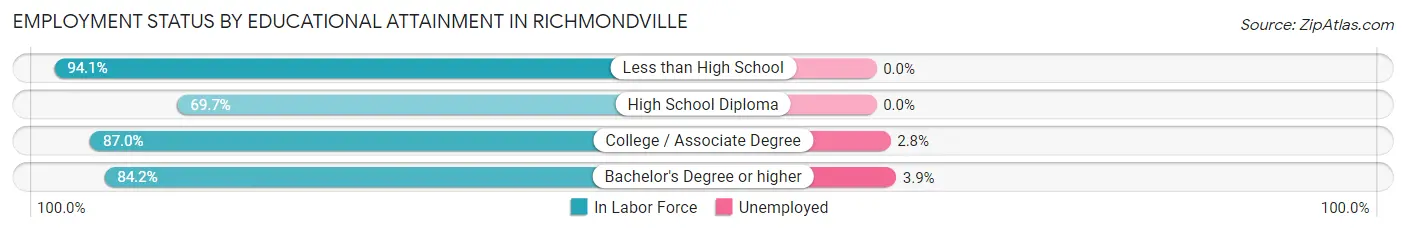
| Educational Attainment | In Labor Force | Unemployed |
| Less than High School | 32 (94.1%) | 0 (0.0%) |
| High School Diploma | 99 (69.7%) | 0 (0.0%) |
| College / Associate Degree | 141 (87.0%) | 5 (2.8%) |
| Bachelor's Degree or higher | 128 (84.2%) | 6 (3.9%) |
| Total | 400 (81.6%) | 11 (2.3%) |
Employment Occupations by Sex in Richmondville
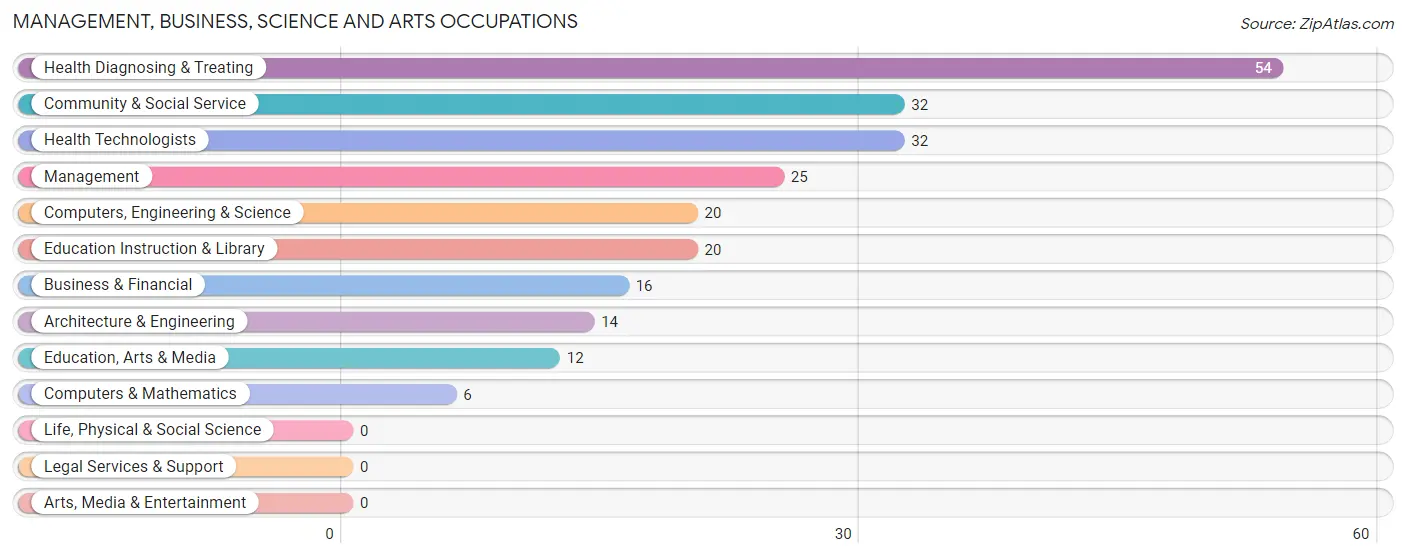
Management, Business, Science and Arts Occupations
The most common Management, Business, Science and Arts occupations in Richmondville are Health Diagnosing & Treating (54 | 11.7%), Community & Social Service (32 | 6.9%), Health Technologists (32 | 6.9%), Management (25 | 5.4%), and Computers, Engineering & Science (20 | 4.3%).
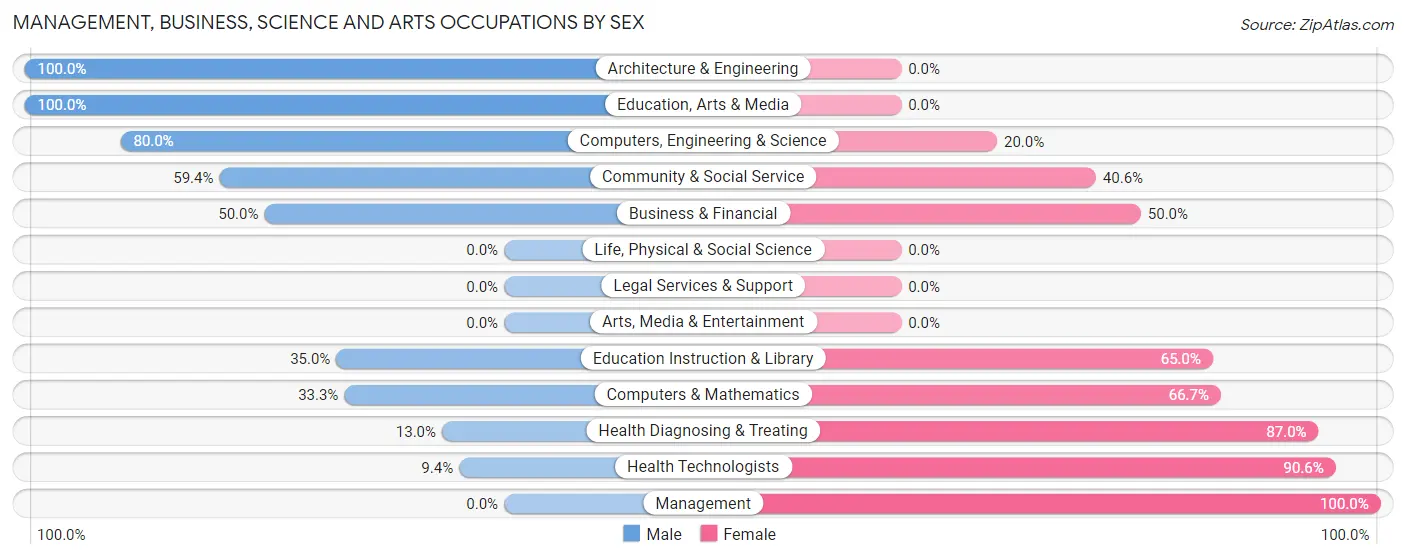
Management, Business, Science and Arts Occupations by Sex
Within the Management, Business, Science and Arts occupations in Richmondville, the most male-oriented occupations are Architecture & Engineering (100.0%), Education, Arts & Media (100.0%), and Computers, Engineering & Science (80.0%), while the most female-oriented occupations are Management (100.0%), Health Technologists (90.6%), and Health Diagnosing & Treating (87.0%).
| Occupation | Male | Female |
| Management | 0 (0.0%) | 25 (100.0%) |
| Business & Financial | 8 (50.0%) | 8 (50.0%) |
| Computers, Engineering & Science | 16 (80.0%) | 4 (20.0%) |
| Computers & Mathematics | 2 (33.3%) | 4 (66.7%) |
| Architecture & Engineering | 14 (100.0%) | 0 (0.0%) |
| Life, Physical & Social Science | 0 (0.0%) | 0 (0.0%) |
| Community & Social Service | 19 (59.4%) | 13 (40.6%) |
| Education, Arts & Media | 12 (100.0%) | 0 (0.0%) |
| Legal Services & Support | 0 (0.0%) | 0 (0.0%) |
| Education Instruction & Library | 7 (35.0%) | 13 (65.0%) |
| Arts, Media & Entertainment | 0 (0.0%) | 0 (0.0%) |
| Health Diagnosing & Treating | 7 (13.0%) | 47 (87.0%) |
| Health Technologists | 3 (9.4%) | 29 (90.6%) |
| Total (Category) | 50 (34.0%) | 97 (66.0%) |
| Total (Overall) | 194 (42.0%) | 268 (58.0%) |
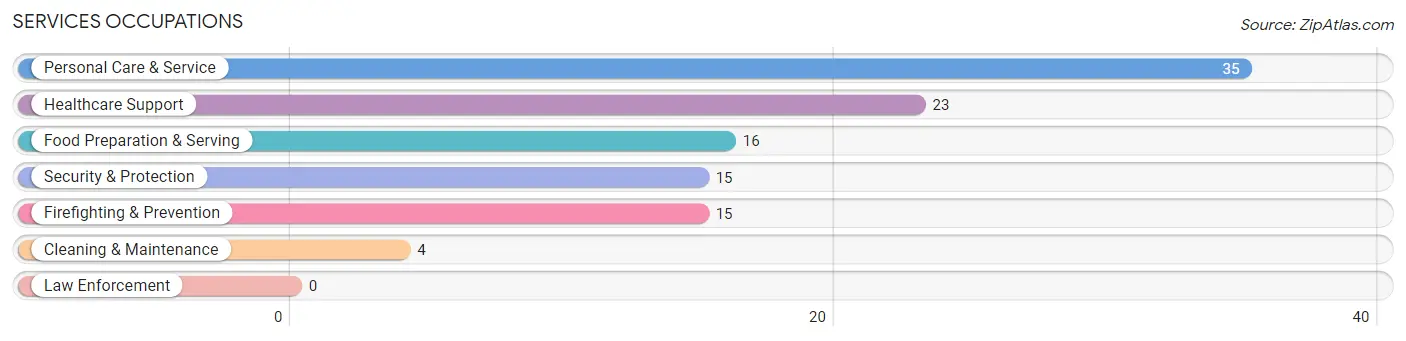
Services Occupations
The most common Services occupations in Richmondville are Personal Care & Service (35 | 7.6%), Healthcare Support (23 | 5.0%), Food Preparation & Serving (16 | 3.5%), Security & Protection (15 | 3.3%), and Firefighting & Prevention (15 | 3.3%).
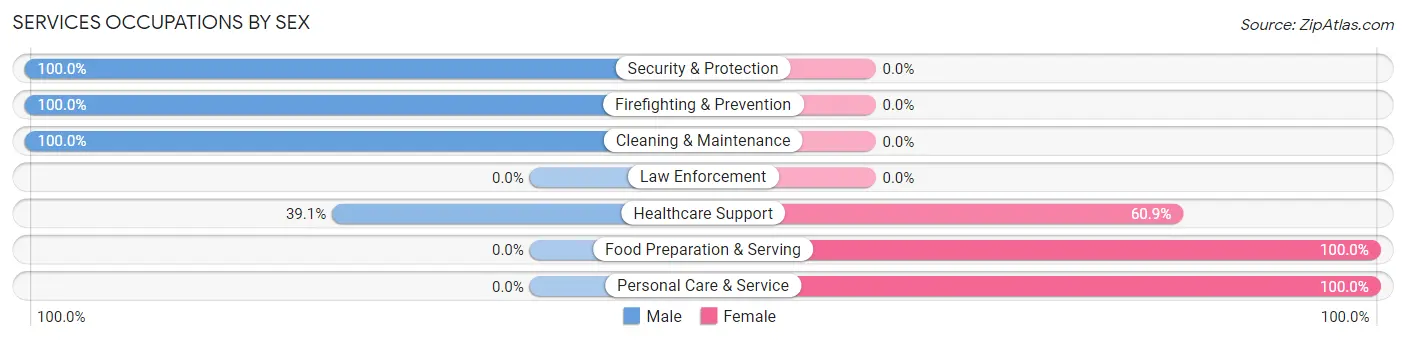
Services Occupations by Sex
Within the Services occupations in Richmondville, the most male-oriented occupations are Security & Protection (100.0%), Firefighting & Prevention (100.0%), and Cleaning & Maintenance (100.0%), while the most female-oriented occupations are Food Preparation & Serving (100.0%), Personal Care & Service (100.0%), and Healthcare Support (60.9%).
| Occupation | Male | Female |
| Healthcare Support | 9 (39.1%) | 14 (60.9%) |
| Security & Protection | 15 (100.0%) | 0 (0.0%) |
| Firefighting & Prevention | 15 (100.0%) | 0 (0.0%) |
| Law Enforcement | 0 (0.0%) | 0 (0.0%) |
| Food Preparation & Serving | 0 (0.0%) | 16 (100.0%) |
| Cleaning & Maintenance | 4 (100.0%) | 0 (0.0%) |
| Personal Care & Service | 0 (0.0%) | 35 (100.0%) |
| Total (Category) | 28 (30.1%) | 65 (69.9%) |
| Total (Overall) | 194 (42.0%) | 268 (58.0%) |
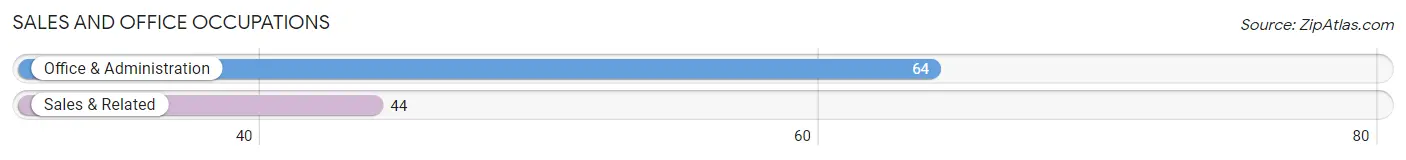
Sales and Office Occupations
The most common Sales and Office occupations in Richmondville are Office & Administration (64 | 13.9%), and Sales & Related (44 | 9.5%).
Sales and Office Occupations by Sex
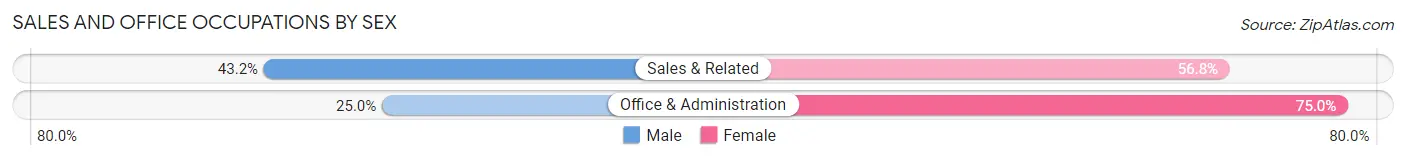
| Occupation | Male | Female |
| Sales & Related | 19 (43.2%) | 25 (56.8%) |
| Office & Administration | 16 (25.0%) | 48 (75.0%) |
| Total (Category) | 35 (32.4%) | 73 (67.6%) |
| Total (Overall) | 194 (42.0%) | 268 (58.0%) |
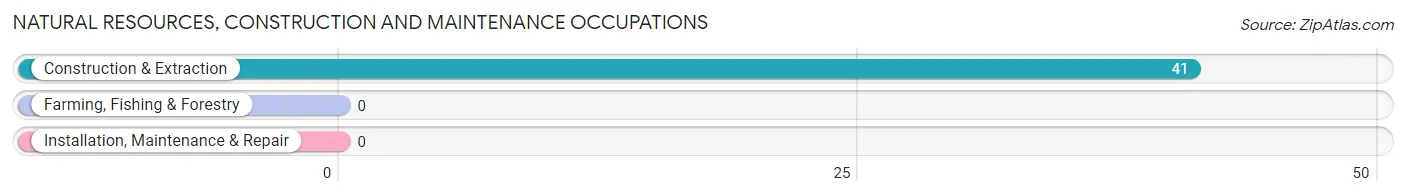
Natural Resources, Construction and Maintenance Occupations
The most common Natural Resources, Construction and Maintenance occupations in Richmondville are , and Construction & Extraction (41 | 8.9%).
Natural Resources, Construction and Maintenance Occupations by Sex
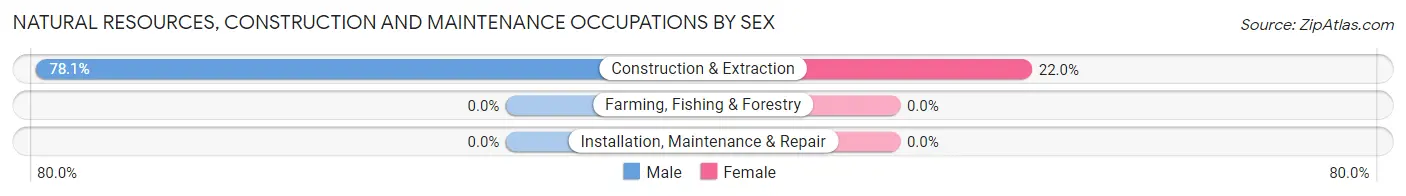
| Occupation | Male | Female |
| Farming, Fishing & Forestry | 0 (0.0%) | 0 (0.0%) |
| Construction & Extraction | 32 (78.0%) | 9 (22.0%) |
| Installation, Maintenance & Repair | 0 (0.0%) | 0 (0.0%) |
| Total (Category) | 32 (78.0%) | 9 (22.0%) |
| Total (Overall) | 194 (42.0%) | 268 (58.0%) |
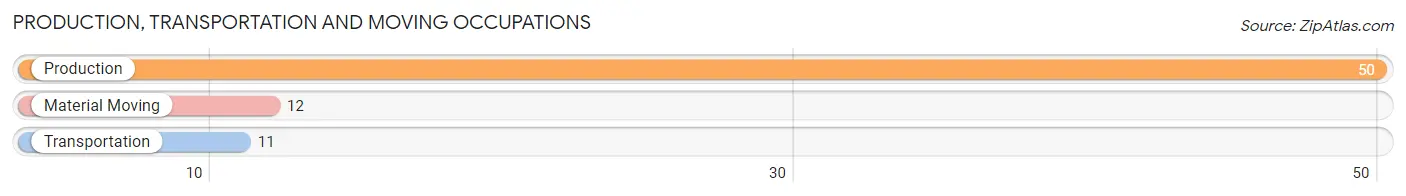
Production, Transportation and Moving Occupations
The most common Production, Transportation and Moving occupations in Richmondville are Production (50 | 10.8%), Material Moving (12 | 2.6%), and Transportation (11 | 2.4%).
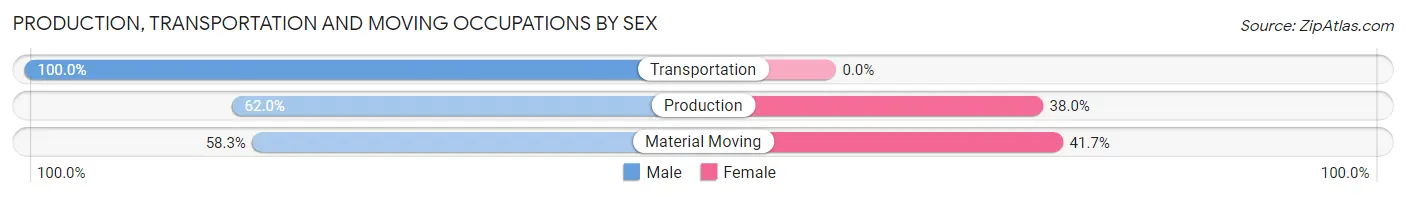
Production, Transportation and Moving Occupations by Sex
| Occupation | Male | Female |
| Production | 31 (62.0%) | 19 (38.0%) |
| Transportation | 11 (100.0%) | 0 (0.0%) |
| Material Moving | 7 (58.3%) | 5 (41.7%) |
| Total (Category) | 49 (67.1%) | 24 (32.9%) |
| Total (Overall) | 194 (42.0%) | 268 (58.0%) |
Employment Industries by Sex in Richmondville
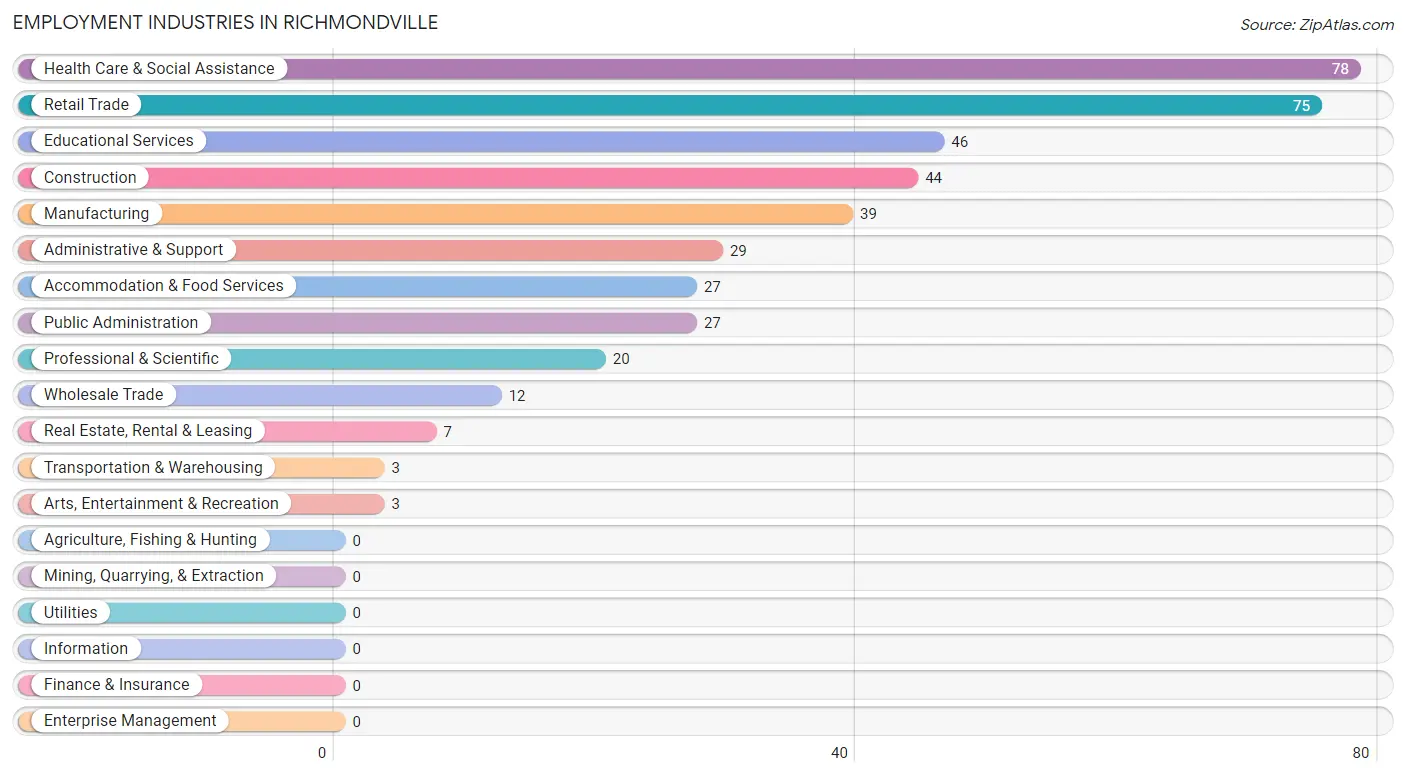
Employment Industries in Richmondville
The major employment industries in Richmondville include Health Care & Social Assistance (78 | 16.9%), Retail Trade (75 | 16.2%), Educational Services (46 | 10.0%), Construction (44 | 9.5%), and Manufacturing (39 | 8.4%).
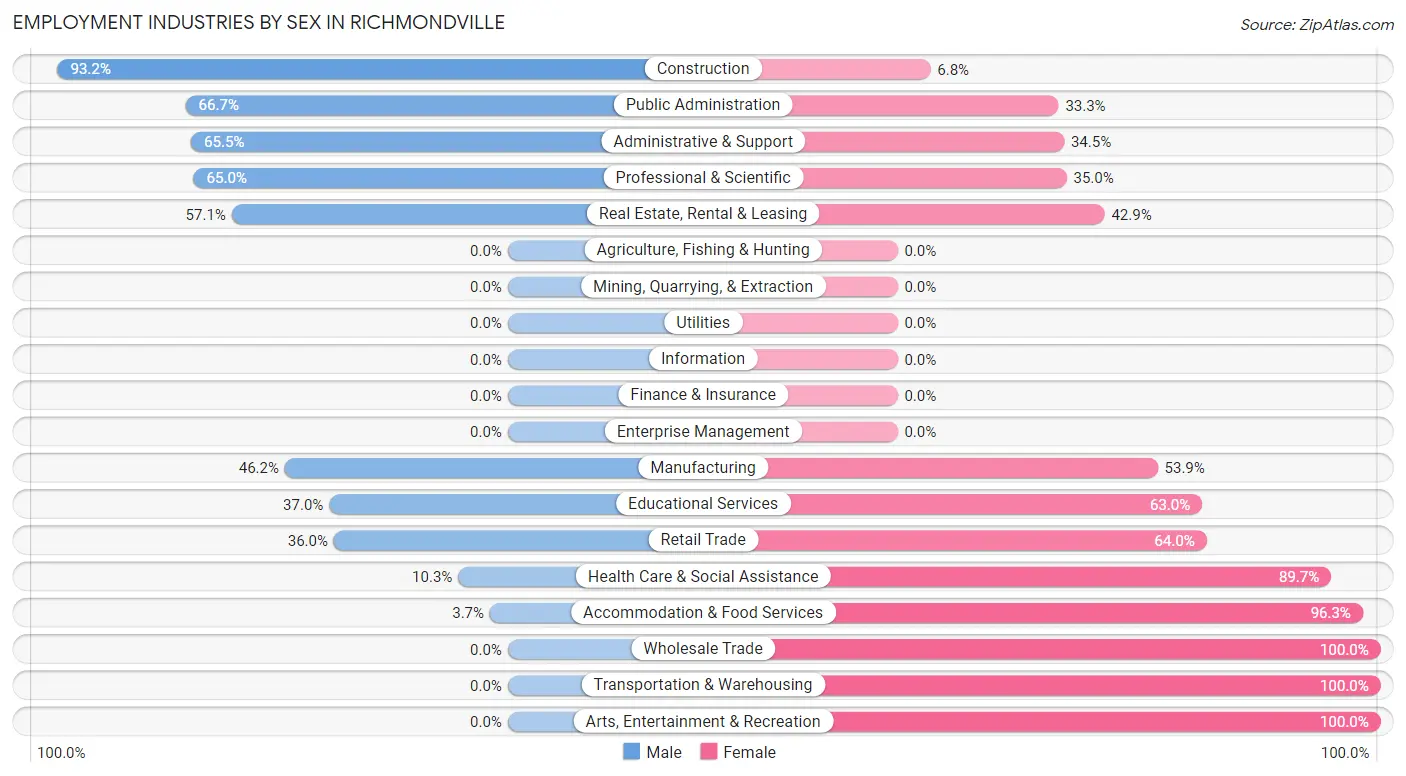
Employment Industries by Sex in Richmondville
The Richmondville industries that see more men than women are Construction (93.2%), Public Administration (66.7%), and Administrative & Support (65.5%), whereas the industries that tend to have a higher number of women are Wholesale Trade (100.0%), Transportation & Warehousing (100.0%), and Arts, Entertainment & Recreation (100.0%).
| Industry | Male | Female |
| Agriculture, Fishing & Hunting | 0 (0.0%) | 0 (0.0%) |
| Mining, Quarrying, & Extraction | 0 (0.0%) | 0 (0.0%) |
| Construction | 41 (93.2%) | 3 (6.8%) |
| Manufacturing | 18 (46.2%) | 21 (53.8%) |
| Wholesale Trade | 0 (0.0%) | 12 (100.0%) |
| Retail Trade | 27 (36.0%) | 48 (64.0%) |
| Transportation & Warehousing | 0 (0.0%) | 3 (100.0%) |
| Utilities | 0 (0.0%) | 0 (0.0%) |
| Information | 0 (0.0%) | 0 (0.0%) |
| Finance & Insurance | 0 (0.0%) | 0 (0.0%) |
| Real Estate, Rental & Leasing | 4 (57.1%) | 3 (42.9%) |
| Professional & Scientific | 13 (65.0%) | 7 (35.0%) |
| Enterprise Management | 0 (0.0%) | 0 (0.0%) |
| Administrative & Support | 19 (65.5%) | 10 (34.5%) |
| Educational Services | 17 (37.0%) | 29 (63.0%) |
| Health Care & Social Assistance | 8 (10.3%) | 70 (89.7%) |
| Arts, Entertainment & Recreation | 0 (0.0%) | 3 (100.0%) |
| Accommodation & Food Services | 1 (3.7%) | 26 (96.3%) |
| Public Administration | 18 (66.7%) | 9 (33.3%) |
| Total | 194 (42.0%) | 268 (58.0%) |
Education in Richmondville
School Enrollment in Richmondville
The most common levels of schooling among the 210 students in Richmondville are elementary school (65 | 30.9%), middle school (61 | 29.0%), and high school (45 | 21.4%).
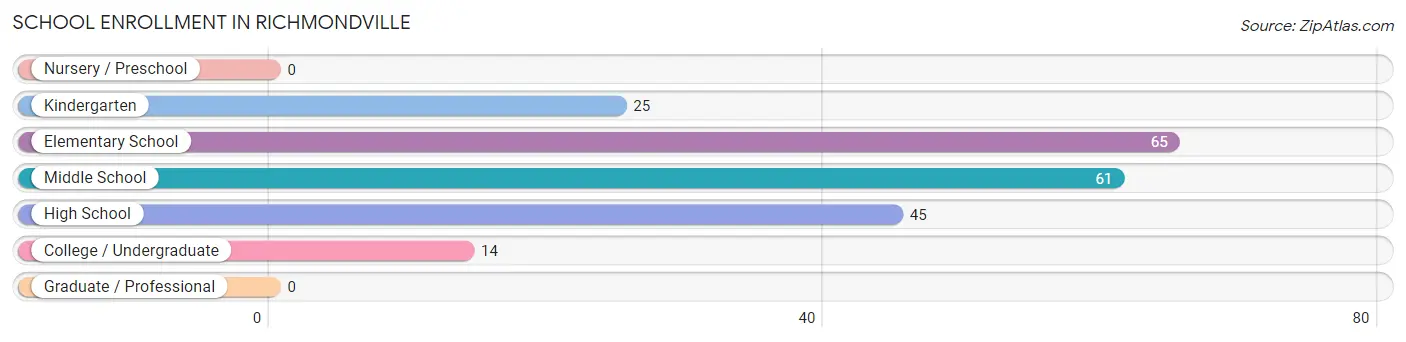
| School Level | # Students | % Students |
| Nursery / Preschool | 0 | 0.0% |
| Kindergarten | 25 | 11.9% |
| Elementary School | 65 | 30.9% |
| Middle School | 61 | 29.0% |
| High School | 45 | 21.4% |
| College / Undergraduate | 14 | 6.7% |
| Graduate / Professional | 0 | 0.0% |
| Total | 210 | 100.0% |
School Enrollment by Age by Funding Source in Richmondville
Out of a total of 210 students who are enrolled in schools in Richmondville, 6 (2.9%) attend a private institution, while the remaining 204 (97.1%) are enrolled in public schools. The age group of 5 to 9 year old has the highest likelihood of being enrolled in private schools, with 6 (6.3% in the age bracket) enrolled. Conversely, the age group of 10 to 14 year olds has the lowest likelihood of being enrolled in a private school, with 56 (100.0% in the age bracket) attending a public institution.
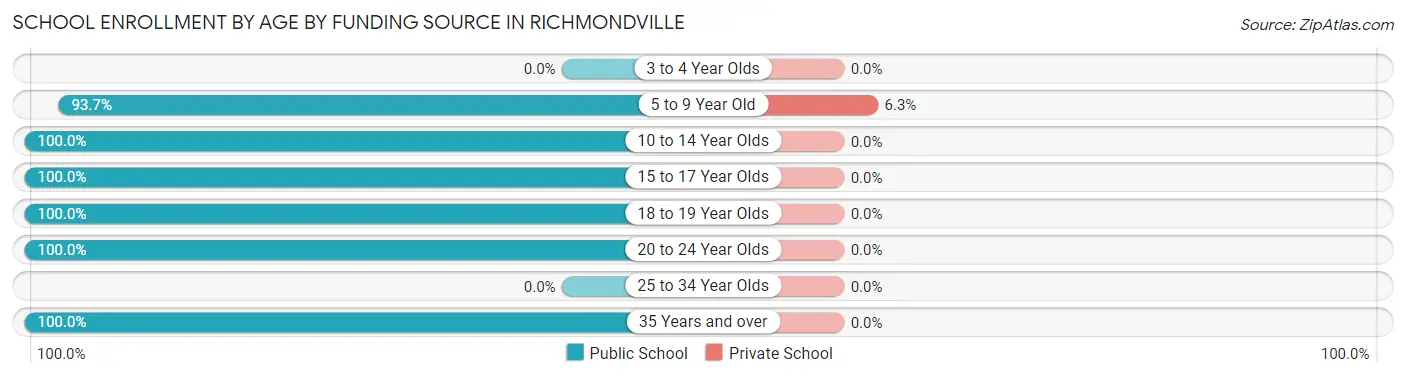
| Age Bracket | Public School | Private School |
| 3 to 4 Year Olds | 0 (0.0%) | 0 (0.0%) |
| 5 to 9 Year Old | 89 (93.7%) | 6 (6.3%) |
| 10 to 14 Year Olds | 56 (100.0%) | 0 (0.0%) |
| 15 to 17 Year Olds | 42 (100.0%) | 0 (0.0%) |
| 18 to 19 Year Olds | 7 (100.0%) | 0 (0.0%) |
| 20 to 24 Year Olds | 9 (100.0%) | 0 (0.0%) |
| 25 to 34 Year Olds | 0 (0.0%) | 0 (0.0%) |
| 35 Years and over | 1 (100.0%) | 0 (0.0%) |
| Total | 204 (97.1%) | 6 (2.9%) |
Educational Attainment by Field of Study in Richmondville
Education (44 | 25.4%), literature & languages (28 | 16.2%), business (18 | 10.4%), bio, nature & agricultural (16 | 9.2%), and social sciences (15 | 8.7%) are the most common fields of study among 173 individuals in Richmondville who have obtained a bachelor's degree or higher.
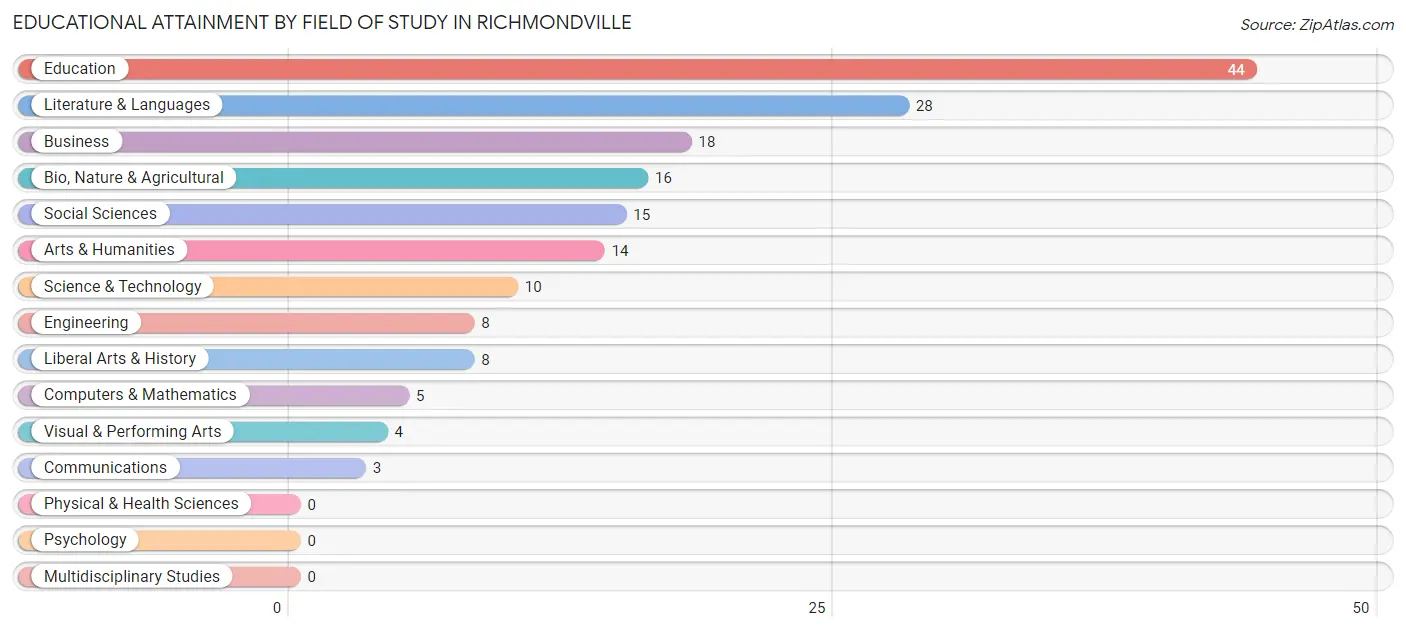
| Field of Study | # Graduates | % Graduates |
| Computers & Mathematics | 5 | 2.9% |
| Bio, Nature & Agricultural | 16 | 9.2% |
| Physical & Health Sciences | 0 | 0.0% |
| Psychology | 0 | 0.0% |
| Social Sciences | 15 | 8.7% |
| Engineering | 8 | 4.6% |
| Multidisciplinary Studies | 0 | 0.0% |
| Science & Technology | 10 | 5.8% |
| Business | 18 | 10.4% |
| Education | 44 | 25.4% |
| Literature & Languages | 28 | 16.2% |
| Liberal Arts & History | 8 | 4.6% |
| Visual & Performing Arts | 4 | 2.3% |
| Communications | 3 | 1.7% |
| Arts & Humanities | 14 | 8.1% |
| Total | 173 | 100.0% |
Transportation & Commute in Richmondville
Vehicle Availability by Sex in Richmondville
The most prevalent vehicle ownership categories in Richmondville are males with 3 vehicles (75, accounting for 41.7%) and females with 3 vehicles (74, making up 32.9%).
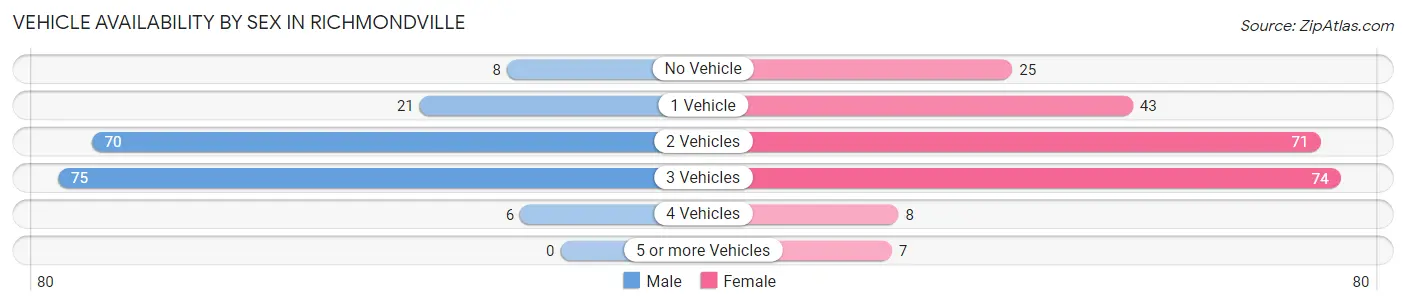
| Vehicles Available | Male | Female |
| No Vehicle | 8 (4.4%) | 25 (11.0%) |
| 1 Vehicle | 21 (11.7%) | 43 (18.9%) |
| 2 Vehicles | 70 (38.9%) | 71 (31.1%) |
| 3 Vehicles | 75 (41.7%) | 74 (32.5%) |
| 4 Vehicles | 6 (3.3%) | 8 (3.5%) |
| 5 or more Vehicles | 0 (0.0%) | 7 (3.1%) |
| Total | 180 (100.0%) | 228 (100.0%) |
Commute Time in Richmondville
The most frequently occuring commute durations in Richmondville are 45 to 59 minutes (84 commuters, 23.0%), 10 to 14 minutes (55 commuters, 15.1%), and 60 to 89 minutes (49 commuters, 13.4%).
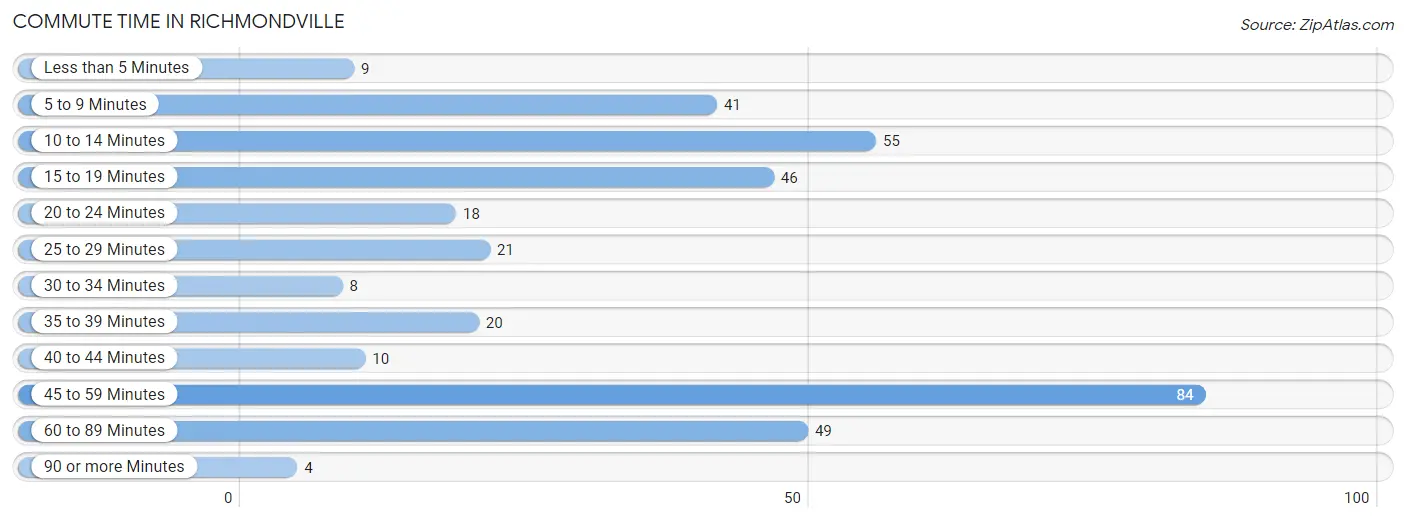
| Commute Time | # Commuters | % Commuters |
| Less than 5 Minutes | 9 | 2.5% |
| 5 to 9 Minutes | 41 | 11.2% |
| 10 to 14 Minutes | 55 | 15.1% |
| 15 to 19 Minutes | 46 | 12.6% |
| 20 to 24 Minutes | 18 | 4.9% |
| 25 to 29 Minutes | 21 | 5.8% |
| 30 to 34 Minutes | 8 | 2.2% |
| 35 to 39 Minutes | 20 | 5.5% |
| 40 to 44 Minutes | 10 | 2.7% |
| 45 to 59 Minutes | 84 | 23.0% |
| 60 to 89 Minutes | 49 | 13.4% |
| 90 or more Minutes | 4 | 1.1% |
Commute Time by Sex in Richmondville
The most common commute times in Richmondville are 45 to 59 minutes (52 commuters, 30.1%) for males and 10 to 14 minutes (48 commuters, 25.0%) for females.
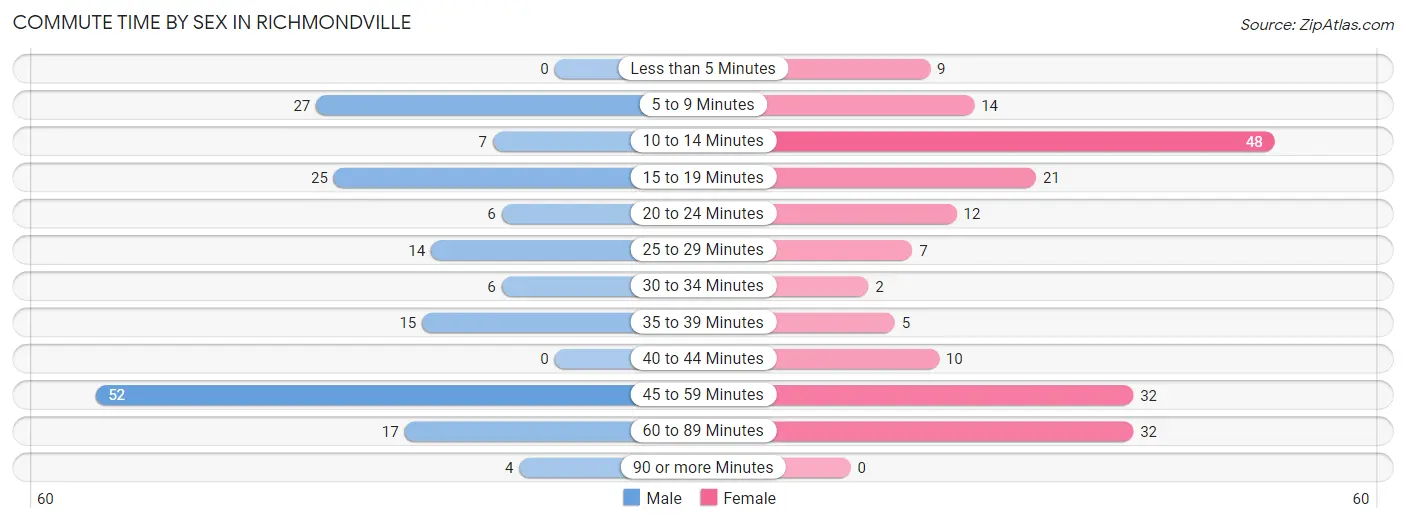
| Commute Time | Male | Female |
| Less than 5 Minutes | 0 (0.0%) | 9 (4.7%) |
| 5 to 9 Minutes | 27 (15.6%) | 14 (7.3%) |
| 10 to 14 Minutes | 7 (4.1%) | 48 (25.0%) |
| 15 to 19 Minutes | 25 (14.4%) | 21 (10.9%) |
| 20 to 24 Minutes | 6 (3.5%) | 12 (6.2%) |
| 25 to 29 Minutes | 14 (8.1%) | 7 (3.6%) |
| 30 to 34 Minutes | 6 (3.5%) | 2 (1.0%) |
| 35 to 39 Minutes | 15 (8.7%) | 5 (2.6%) |
| 40 to 44 Minutes | 0 (0.0%) | 10 (5.2%) |
| 45 to 59 Minutes | 52 (30.1%) | 32 (16.7%) |
| 60 to 89 Minutes | 17 (9.8%) | 32 (16.7%) |
| 90 or more Minutes | 4 (2.3%) | 0 (0.0%) |
Time of Departure to Work by Sex in Richmondville
The most frequent times of departure to work in Richmondville are 8:00 AM to 8:29 AM (45, 26.0%) for males and 7:00 AM to 7:29 AM (50, 26.0%) for females.
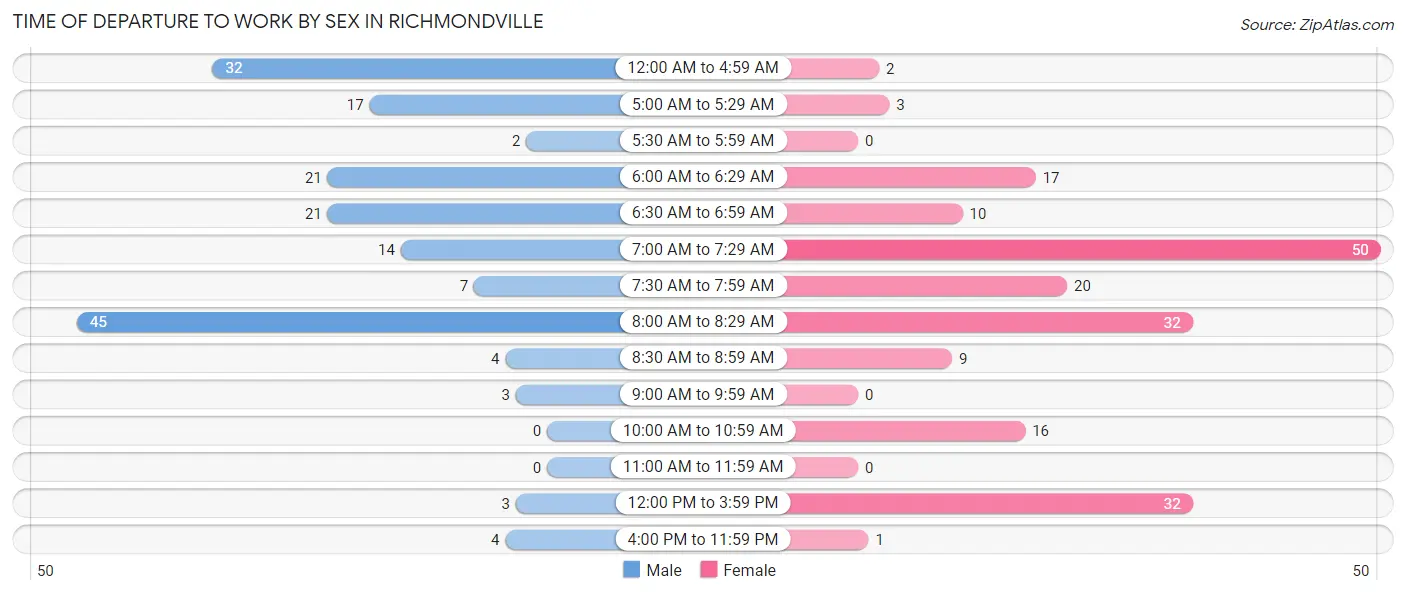
| Time of Departure | Male | Female |
| 12:00 AM to 4:59 AM | 32 (18.5%) | 2 (1.0%) |
| 5:00 AM to 5:29 AM | 17 (9.8%) | 3 (1.6%) |
| 5:30 AM to 5:59 AM | 2 (1.2%) | 0 (0.0%) |
| 6:00 AM to 6:29 AM | 21 (12.1%) | 17 (8.8%) |
| 6:30 AM to 6:59 AM | 21 (12.1%) | 10 (5.2%) |
| 7:00 AM to 7:29 AM | 14 (8.1%) | 50 (26.0%) |
| 7:30 AM to 7:59 AM | 7 (4.1%) | 20 (10.4%) |
| 8:00 AM to 8:29 AM | 45 (26.0%) | 32 (16.7%) |
| 8:30 AM to 8:59 AM | 4 (2.3%) | 9 (4.7%) |
| 9:00 AM to 9:59 AM | 3 (1.7%) | 0 (0.0%) |
| 10:00 AM to 10:59 AM | 0 (0.0%) | 16 (8.3%) |
| 11:00 AM to 11:59 AM | 0 (0.0%) | 0 (0.0%) |
| 12:00 PM to 3:59 PM | 3 (1.7%) | 32 (16.7%) |
| 4:00 PM to 11:59 PM | 4 (2.3%) | 1 (0.5%) |
| Total | 173 (100.0%) | 192 (100.0%) |
Housing Occupancy in Richmondville
Occupancy by Ownership in Richmondville
Of the total 393 dwellings in Richmondville, owner-occupied units account for 207 (52.7%), while renter-occupied units make up 186 (47.3%).
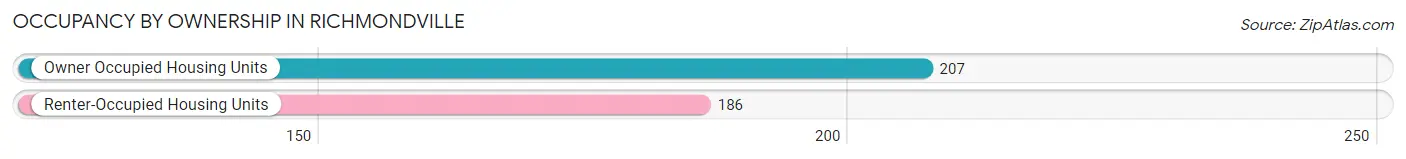
| Occupancy | # Housing Units | % Housing Units |
| Owner Occupied Housing Units | 207 | 52.7% |
| Renter-Occupied Housing Units | 186 | 47.3% |
| Total Occupied Housing Units | 393 | 100.0% |
Occupancy by Household Size in Richmondville
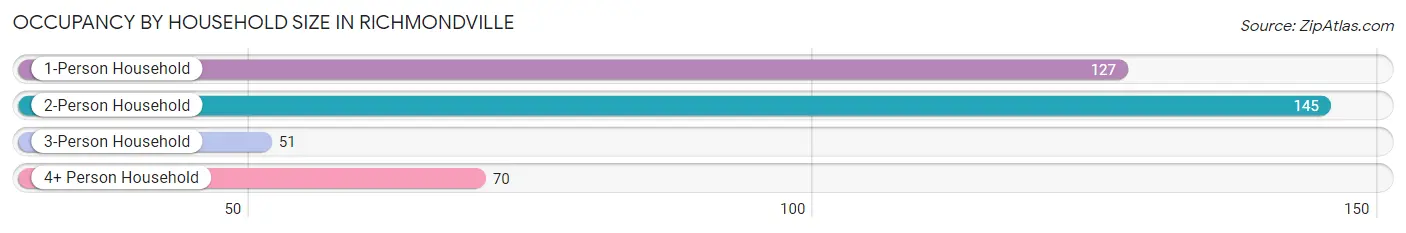
| Household Size | # Housing Units | % Housing Units |
| 1-Person Household | 127 | 32.3% |
| 2-Person Household | 145 | 36.9% |
| 3-Person Household | 51 | 13.0% |
| 4+ Person Household | 70 | 17.8% |
| Total Housing Units | 393 | 100.0% |
Occupancy by Ownership by Household Size in Richmondville
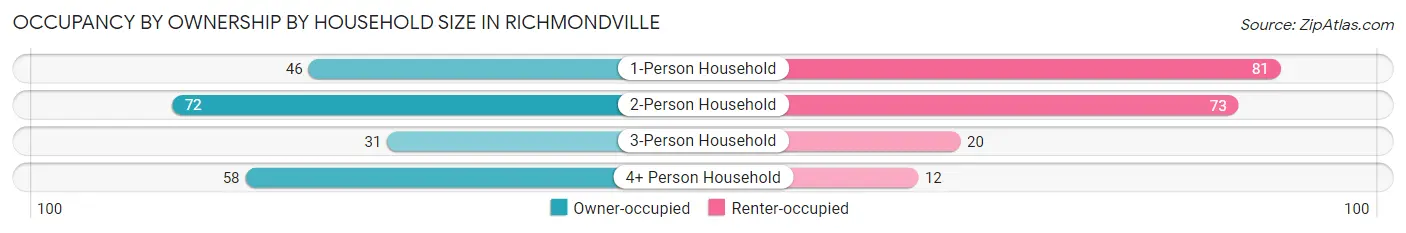
| Household Size | Owner-occupied | Renter-occupied |
| 1-Person Household | 46 (36.2%) | 81 (63.8%) |
| 2-Person Household | 72 (49.7%) | 73 (50.3%) |
| 3-Person Household | 31 (60.8%) | 20 (39.2%) |
| 4+ Person Household | 58 (82.9%) | 12 (17.1%) |
| Total Housing Units | 207 (52.7%) | 186 (47.3%) |
Occupancy by Educational Attainment in Richmondville
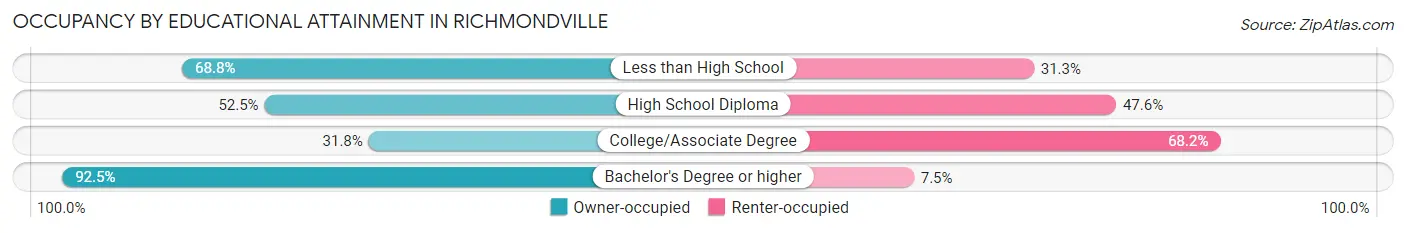
| Household Size | Owner-occupied | Renter-occupied |
| Less than High School | 22 (68.8%) | 10 (31.2%) |
| High School Diploma | 75 (52.4%) | 68 (47.5%) |
| College/Associate Degree | 48 (31.8%) | 103 (68.2%) |
| Bachelor's Degree or higher | 62 (92.5%) | 5 (7.5%) |
Occupancy by Age of Householder in Richmondville
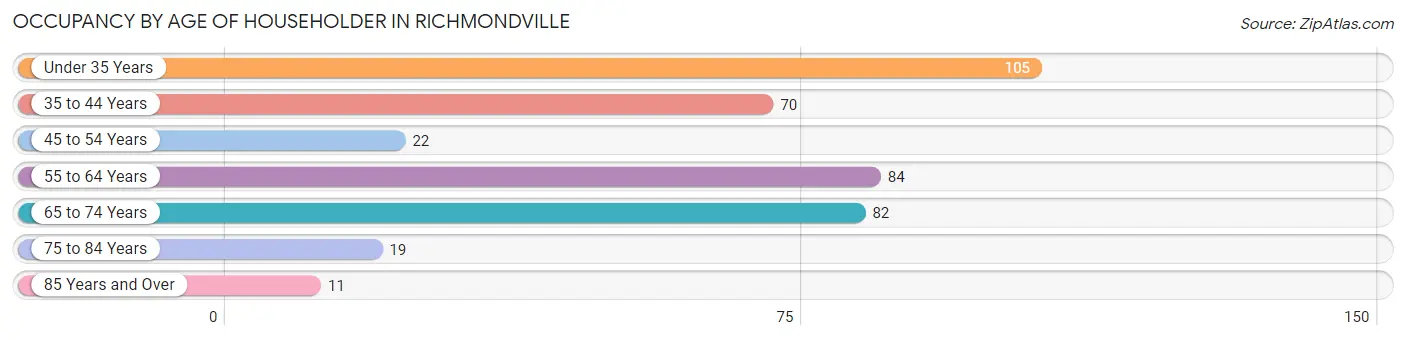
| Age Bracket | # Households | % Households |
| Under 35 Years | 105 | 26.7% |
| 35 to 44 Years | 70 | 17.8% |
| 45 to 54 Years | 22 | 5.6% |
| 55 to 64 Years | 84 | 21.4% |
| 65 to 74 Years | 82 | 20.9% |
| 75 to 84 Years | 19 | 4.8% |
| 85 Years and Over | 11 | 2.8% |
| Total | 393 | 100.0% |
Housing Finances in Richmondville
Median Income by Occupancy in Richmondville
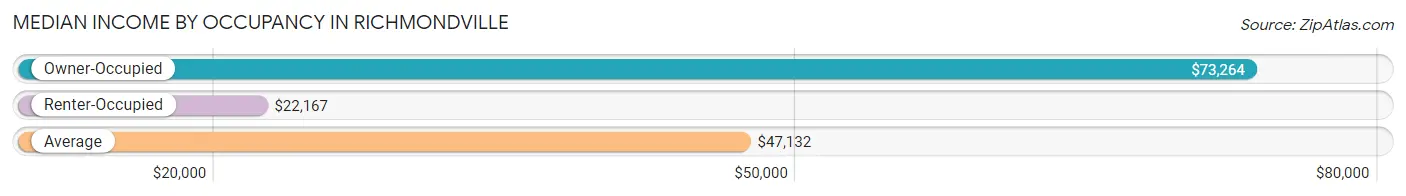
| Occupancy Type | # Households | Median Income |
| Owner-Occupied | 207 (52.7%) | $73,264 |
| Renter-Occupied | 186 (47.3%) | $22,167 |
| Average | 393 (100.0%) | $47,132 |
Occupancy by Householder Income Bracket in Richmondville
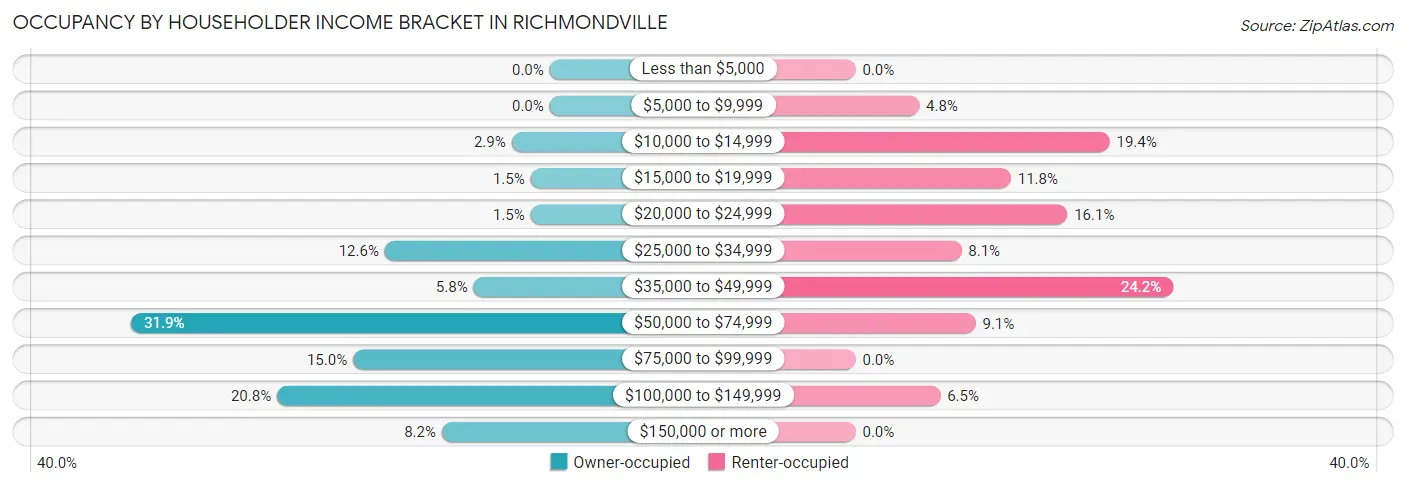
| Income Bracket | Owner-occupied | Renter-occupied |
| Less than $5,000 | 0 (0.0%) | 0 (0.0%) |
| $5,000 to $9,999 | 0 (0.0%) | 9 (4.8%) |
| $10,000 to $14,999 | 6 (2.9%) | 36 (19.4%) |
| $15,000 to $19,999 | 3 (1.5%) | 22 (11.8%) |
| $20,000 to $24,999 | 3 (1.5%) | 30 (16.1%) |
| $25,000 to $34,999 | 26 (12.6%) | 15 (8.1%) |
| $35,000 to $49,999 | 12 (5.8%) | 45 (24.2%) |
| $50,000 to $74,999 | 66 (31.9%) | 17 (9.1%) |
| $75,000 to $99,999 | 31 (15.0%) | 0 (0.0%) |
| $100,000 to $149,999 | 43 (20.8%) | 12 (6.5%) |
| $150,000 or more | 17 (8.2%) | 0 (0.0%) |
| Total | 207 (100.0%) | 186 (100.0%) |
Monthly Housing Cost Tiers in Richmondville
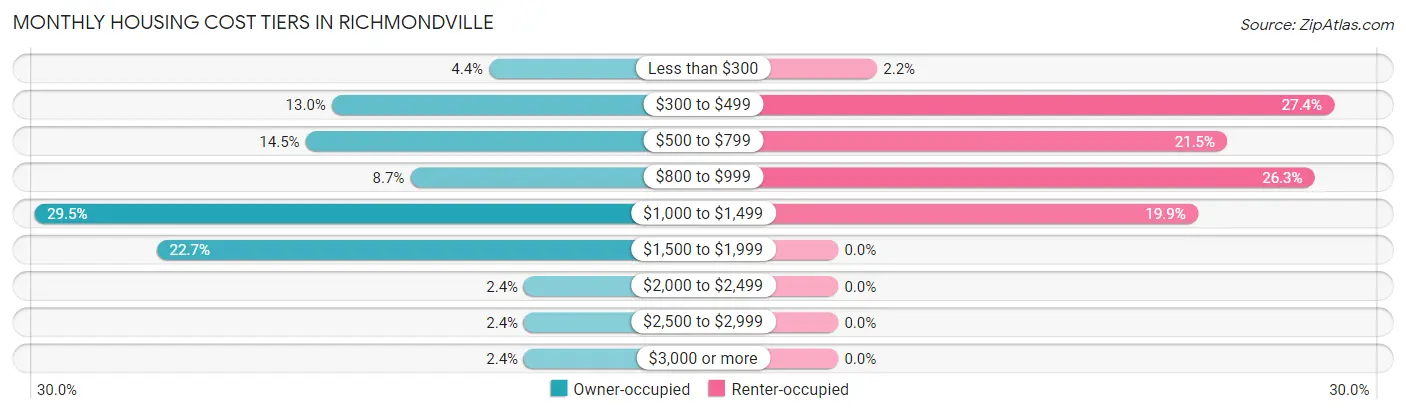
| Monthly Cost | Owner-occupied | Renter-occupied |
| Less than $300 | 9 (4.3%) | 4 (2.1%) |
| $300 to $499 | 27 (13.0%) | 51 (27.4%) |
| $500 to $799 | 30 (14.5%) | 40 (21.5%) |
| $800 to $999 | 18 (8.7%) | 49 (26.3%) |
| $1,000 to $1,499 | 61 (29.5%) | 37 (19.9%) |
| $1,500 to $1,999 | 47 (22.7%) | 0 (0.0%) |
| $2,000 to $2,499 | 5 (2.4%) | 0 (0.0%) |
| $2,500 to $2,999 | 5 (2.4%) | 0 (0.0%) |
| $3,000 or more | 5 (2.4%) | 0 (0.0%) |
| Total | 207 (100.0%) | 186 (100.0%) |
Physical Housing Characteristics in Richmondville
Housing Structures in Richmondville
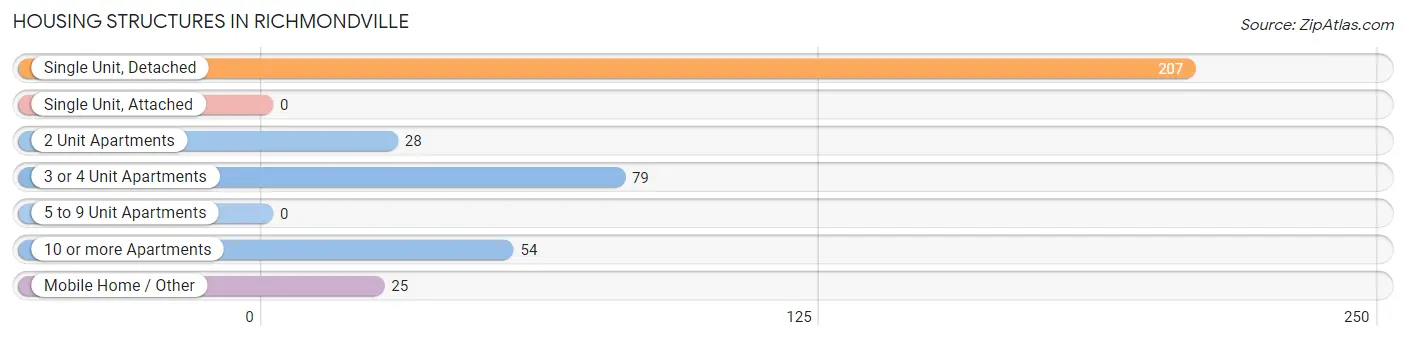
| Structure Type | # Housing Units | % Housing Units |
| Single Unit, Detached | 207 | 52.7% |
| Single Unit, Attached | 0 | 0.0% |
| 2 Unit Apartments | 28 | 7.1% |
| 3 or 4 Unit Apartments | 79 | 20.1% |
| 5 to 9 Unit Apartments | 0 | 0.0% |
| 10 or more Apartments | 54 | 13.7% |
| Mobile Home / Other | 25 | 6.4% |
| Total | 393 | 100.0% |
Housing Structures by Occupancy in Richmondville
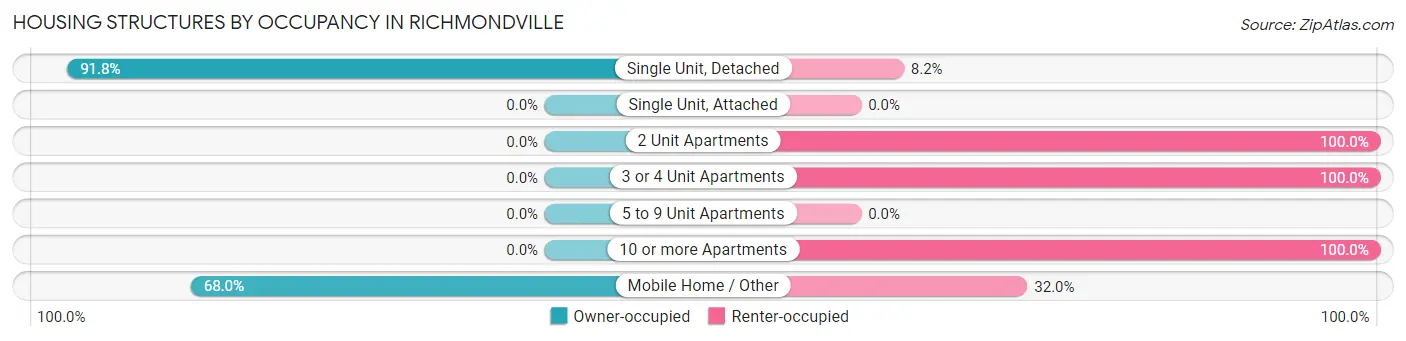
| Structure Type | Owner-occupied | Renter-occupied |
| Single Unit, Detached | 190 (91.8%) | 17 (8.2%) |
| Single Unit, Attached | 0 (0.0%) | 0 (0.0%) |
| 2 Unit Apartments | 0 (0.0%) | 28 (100.0%) |
| 3 or 4 Unit Apartments | 0 (0.0%) | 79 (100.0%) |
| 5 to 9 Unit Apartments | 0 (0.0%) | 0 (0.0%) |
| 10 or more Apartments | 0 (0.0%) | 54 (100.0%) |
| Mobile Home / Other | 17 (68.0%) | 8 (32.0%) |
| Total | 207 (52.7%) | 186 (47.3%) |
Housing Structures by Number of Rooms in Richmondville
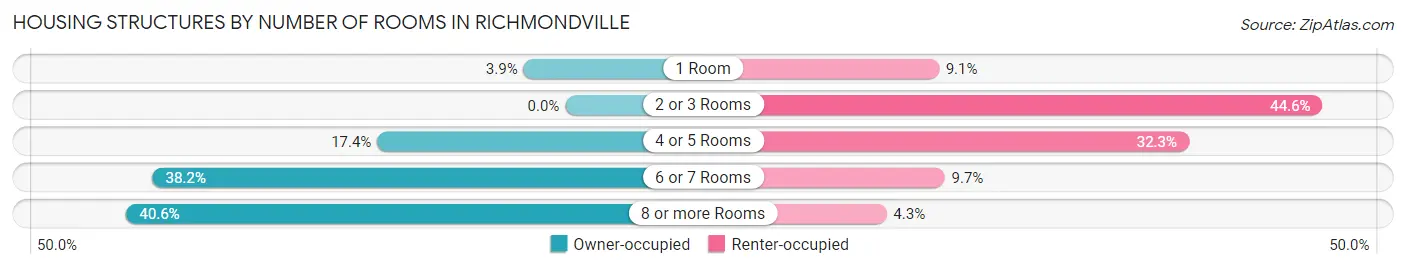
| Number of Rooms | Owner-occupied | Renter-occupied |
| 1 Room | 8 (3.9%) | 17 (9.1%) |
| 2 or 3 Rooms | 0 (0.0%) | 83 (44.6%) |
| 4 or 5 Rooms | 36 (17.4%) | 60 (32.3%) |
| 6 or 7 Rooms | 79 (38.2%) | 18 (9.7%) |
| 8 or more Rooms | 84 (40.6%) | 8 (4.3%) |
| Total | 207 (100.0%) | 186 (100.0%) |
Housing Structure by Heating Type in Richmondville
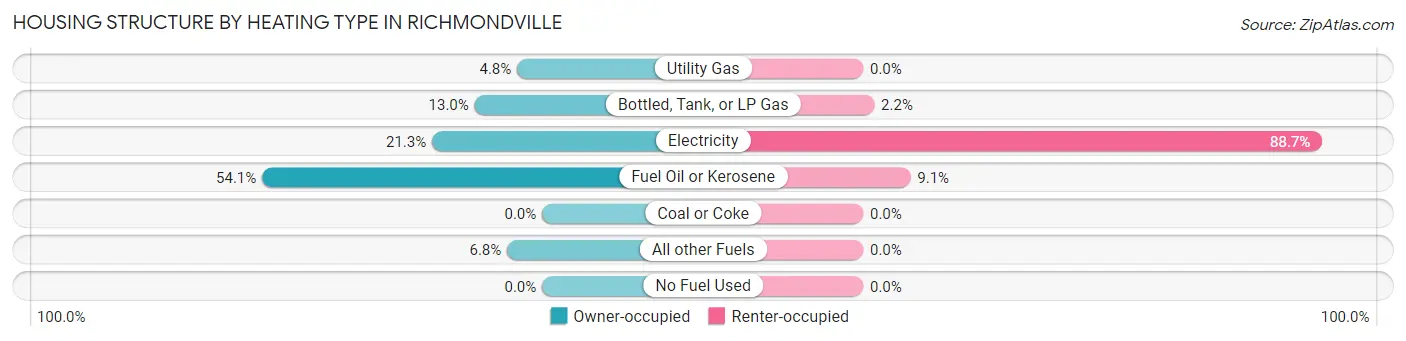
| Heating Type | Owner-occupied | Renter-occupied |
| Utility Gas | 10 (4.8%) | 0 (0.0%) |
| Bottled, Tank, or LP Gas | 27 (13.0%) | 4 (2.1%) |
| Electricity | 44 (21.3%) | 165 (88.7%) |
| Fuel Oil or Kerosene | 112 (54.1%) | 17 (9.1%) |
| Coal or Coke | 0 (0.0%) | 0 (0.0%) |
| All other Fuels | 14 (6.8%) | 0 (0.0%) |
| No Fuel Used | 0 (0.0%) | 0 (0.0%) |
| Total | 207 (100.0%) | 186 (100.0%) |
Household Vehicle Usage in Richmondville
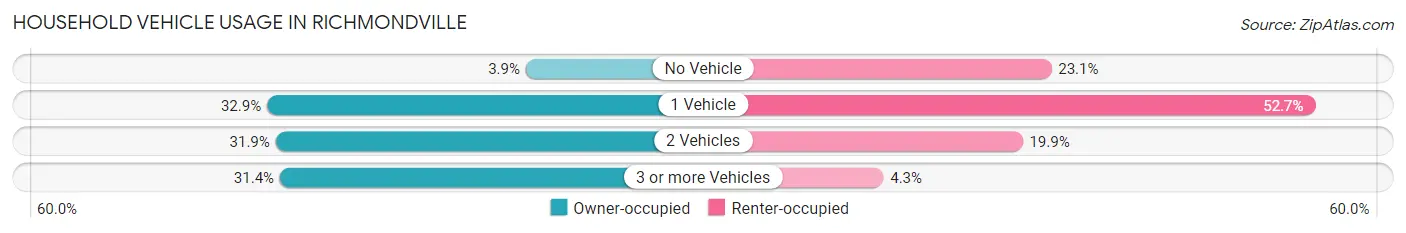
| Vehicles per Household | Owner-occupied | Renter-occupied |
| No Vehicle | 8 (3.9%) | 43 (23.1%) |
| 1 Vehicle | 68 (32.9%) | 98 (52.7%) |
| 2 Vehicles | 66 (31.9%) | 37 (19.9%) |
| 3 or more Vehicles | 65 (31.4%) | 8 (4.3%) |
| Total | 207 (100.0%) | 186 (100.0%) |
Real Estate & Mortgages in Richmondville
Real Estate and Mortgage Overview in Richmondville
| Characteristic | Without Mortgage | With Mortgage |
| Housing Units | 80 | 127 |
| Median Property Value | $120,000 | $160,700 |
| Median Household Income | $59,773 | $13 |
| Monthly Housing Costs | $521 | $5 |
| Real Estate Taxes | $4,094 | $5 |
Property Value by Mortgage Status in Richmondville
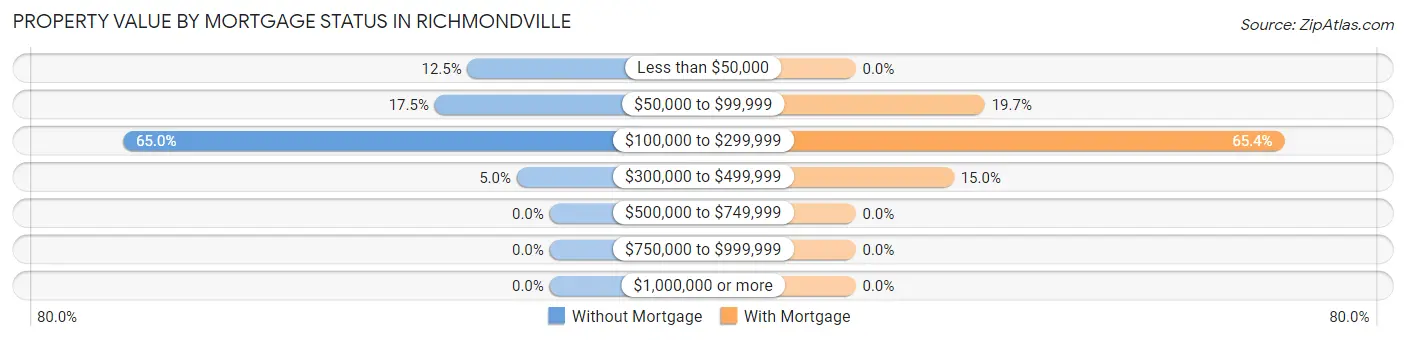
| Property Value | Without Mortgage | With Mortgage |
| Less than $50,000 | 10 (12.5%) | 0 (0.0%) |
| $50,000 to $99,999 | 14 (17.5%) | 25 (19.7%) |
| $100,000 to $299,999 | 52 (65.0%) | 83 (65.3%) |
| $300,000 to $499,999 | 4 (5.0%) | 19 (15.0%) |
| $500,000 to $749,999 | 0 (0.0%) | 0 (0.0%) |
| $750,000 to $999,999 | 0 (0.0%) | 0 (0.0%) |
| $1,000,000 or more | 0 (0.0%) | 0 (0.0%) |
| Total | 80 (100.0%) | 127 (100.0%) |
Household Income by Mortgage Status in Richmondville
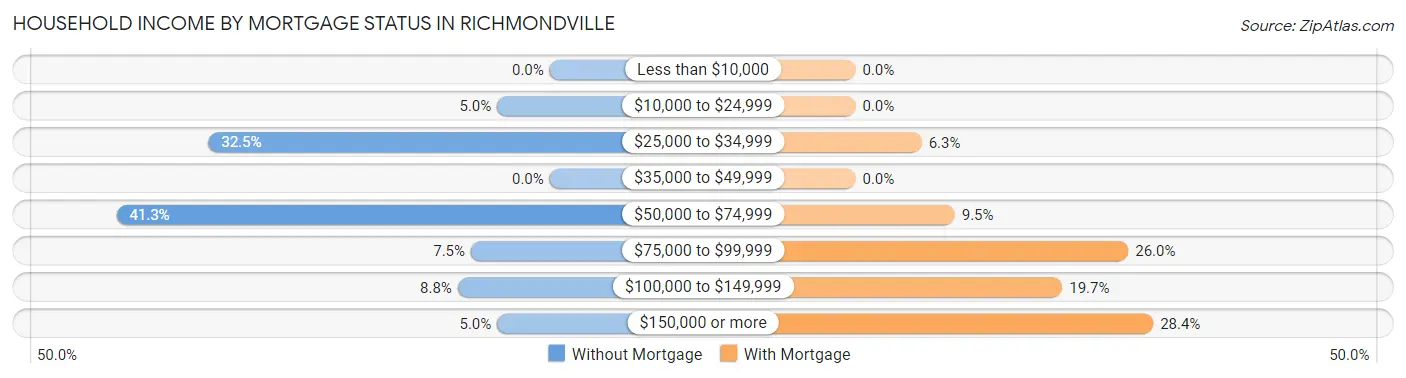
| Household Income | Without Mortgage | With Mortgage |
| Less than $10,000 | 0 (0.0%) | 0 (0.0%) |
| $10,000 to $24,999 | 4 (5.0%) | 0 (0.0%) |
| $25,000 to $34,999 | 26 (32.5%) | 8 (6.3%) |
| $35,000 to $49,999 | 0 (0.0%) | 0 (0.0%) |
| $50,000 to $74,999 | 33 (41.2%) | 12 (9.5%) |
| $75,000 to $99,999 | 6 (7.5%) | 33 (26.0%) |
| $100,000 to $149,999 | 7 (8.7%) | 25 (19.7%) |
| $150,000 or more | 4 (5.0%) | 36 (28.3%) |
| Total | 80 (100.0%) | 127 (100.0%) |
Property Value to Household Income Ratio in Richmondville
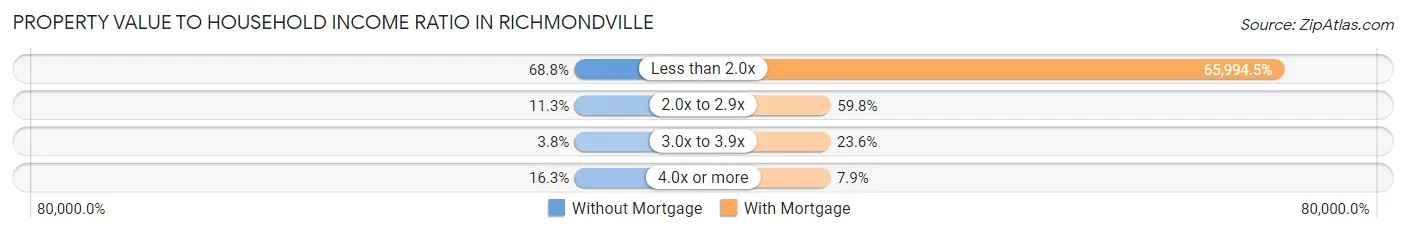
| Value-to-Income Ratio | Without Mortgage | With Mortgage |
| Less than 2.0x | 55 (68.8%) | 83,813 (65,994.5%) |
| 2.0x to 2.9x | 9 (11.3%) | 76 (59.8%) |
| 3.0x to 3.9x | 3 (3.7%) | 30 (23.6%) |
| 4.0x or more | 13 (16.3%) | 10 (7.9%) |
| Total | 80 (100.0%) | 127 (100.0%) |
Real Estate Taxes by Mortgage Status in Richmondville
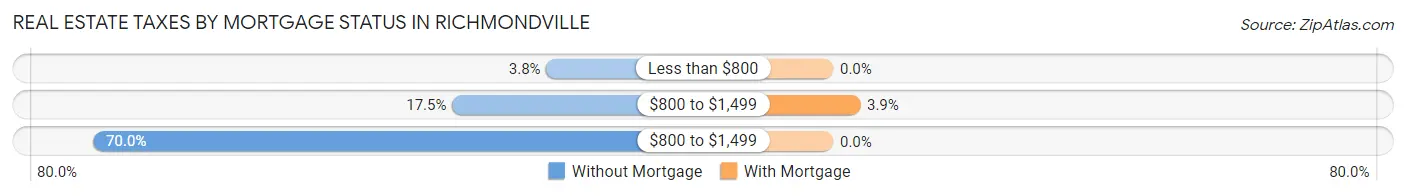
| Property Taxes | Without Mortgage | With Mortgage |
| Less than $800 | 3 (3.7%) | 0 (0.0%) |
| $800 to $1,499 | 14 (17.5%) | 5 (3.9%) |
| $800 to $1,499 | 56 (70.0%) | 0 (0.0%) |
| Total | 80 (100.0%) | 127 (100.0%) |
Health & Disability in Richmondville
Health Insurance Coverage by Age in Richmondville
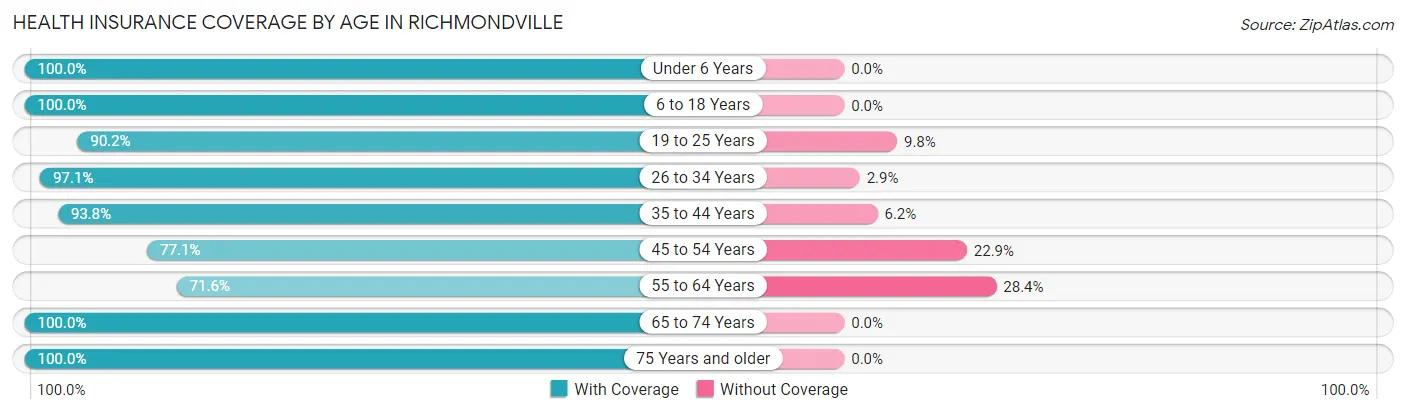
| Age Bracket | With Coverage | Without Coverage |
| Under 6 Years | 44 (100.0%) | 0 (0.0%) |
| 6 to 18 Years | 256 (100.0%) | 0 (0.0%) |
| 19 to 25 Years | 55 (90.2%) | 6 (9.8%) |
| 26 to 34 Years | 135 (97.1%) | 4 (2.9%) |
| 35 to 44 Years | 121 (93.8%) | 8 (6.2%) |
| 45 to 54 Years | 54 (77.1%) | 16 (22.9%) |
| 55 to 64 Years | 96 (71.6%) | 38 (28.4%) |
| 65 to 74 Years | 102 (100.0%) | 0 (0.0%) |
| 75 Years and older | 48 (100.0%) | 0 (0.0%) |
| Total | 911 (92.7%) | 72 (7.3%) |
Health Insurance Coverage by Citizenship Status in Richmondville
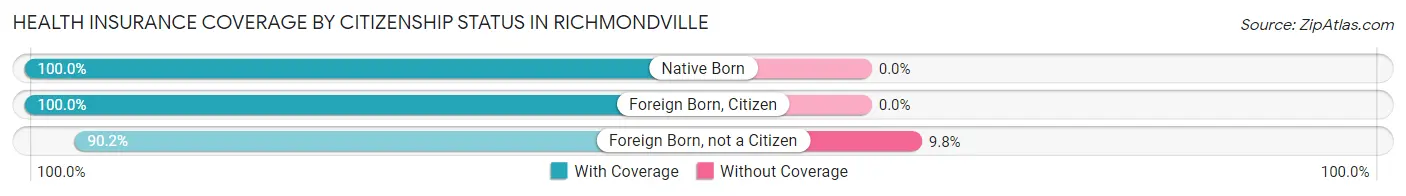
| Citizenship Status | With Coverage | Without Coverage |
| Native Born | 44 (100.0%) | 0 (0.0%) |
| Foreign Born, Citizen | 256 (100.0%) | 0 (0.0%) |
| Foreign Born, not a Citizen | 55 (90.2%) | 6 (9.8%) |
Health Insurance Coverage by Household Income in Richmondville
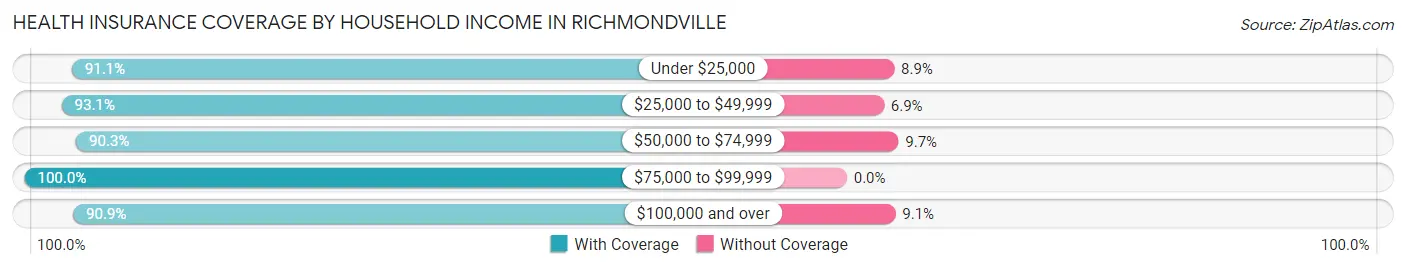
| Household Income | With Coverage | Without Coverage |
| Under $25,000 | 144 (91.1%) | 14 (8.9%) |
| $25,000 to $49,999 | 201 (93.1%) | 15 (6.9%) |
| $50,000 to $74,999 | 215 (90.3%) | 23 (9.7%) |
| $75,000 to $99,999 | 138 (100.0%) | 0 (0.0%) |
| $100,000 and over | 200 (90.9%) | 20 (9.1%) |
Public vs Private Health Insurance Coverage by Age in Richmondville
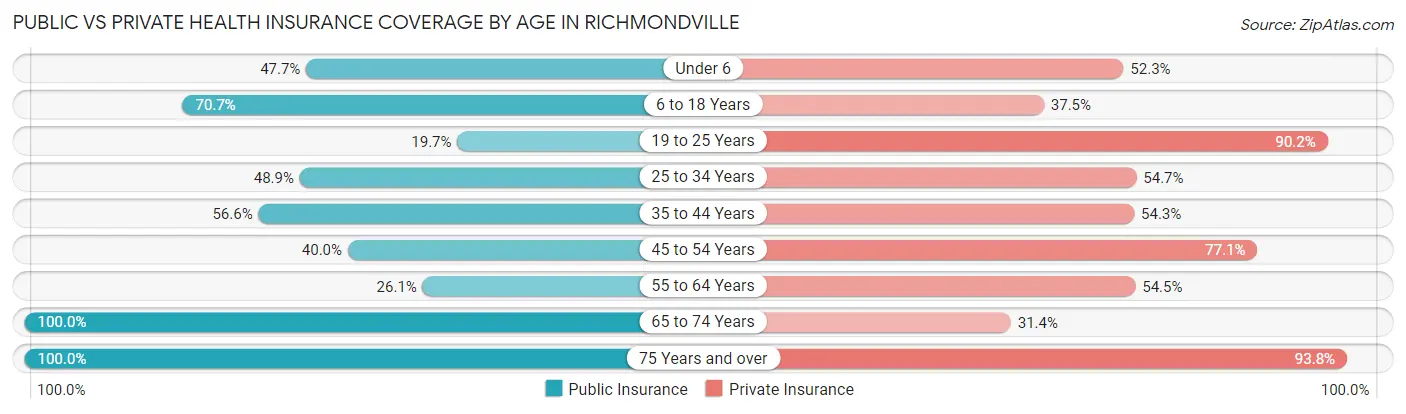
| Age Bracket | Public Insurance | Private Insurance |
| Under 6 | 21 (47.7%) | 23 (52.3%) |
| 6 to 18 Years | 181 (70.7%) | 96 (37.5%) |
| 19 to 25 Years | 12 (19.7%) | 55 (90.2%) |
| 25 to 34 Years | 68 (48.9%) | 76 (54.7%) |
| 35 to 44 Years | 73 (56.6%) | 70 (54.3%) |
| 45 to 54 Years | 28 (40.0%) | 54 (77.1%) |
| 55 to 64 Years | 35 (26.1%) | 73 (54.5%) |
| 65 to 74 Years | 102 (100.0%) | 32 (31.4%) |
| 75 Years and over | 48 (100.0%) | 45 (93.8%) |
| Total | 568 (57.8%) | 524 (53.3%) |
Disability Status by Sex by Age in Richmondville
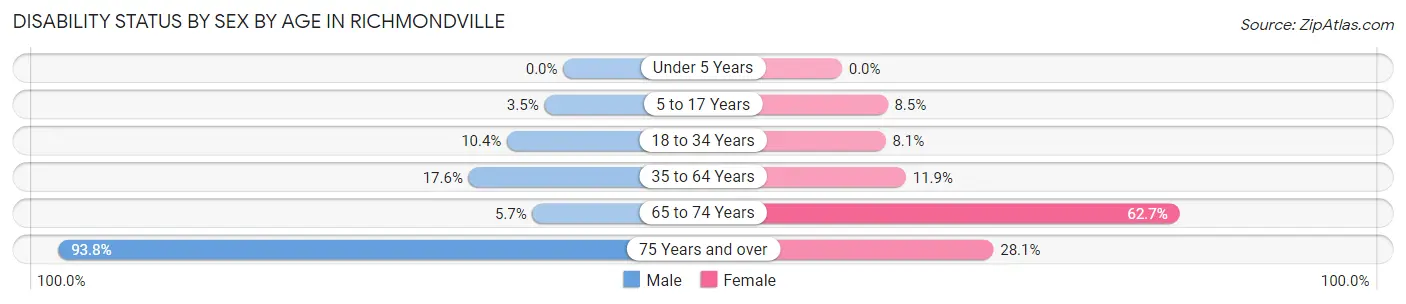
| Age Bracket | Male | Female |
| Under 5 Years | 0 (0.0%) | 0 (0.0%) |
| 5 to 17 Years | 5 (3.5%) | 10 (8.5%) |
| 18 to 34 Years | 10 (10.4%) | 9 (8.1%) |
| 35 to 64 Years | 23 (17.6%) | 24 (11.9%) |
| 65 to 74 Years | 2 (5.7%) | 42 (62.7%) |
| 75 Years and over | 15 (93.8%) | 9 (28.1%) |
Disability Class by Sex by Age in Richmondville
Disability Class: Hearing Difficulty
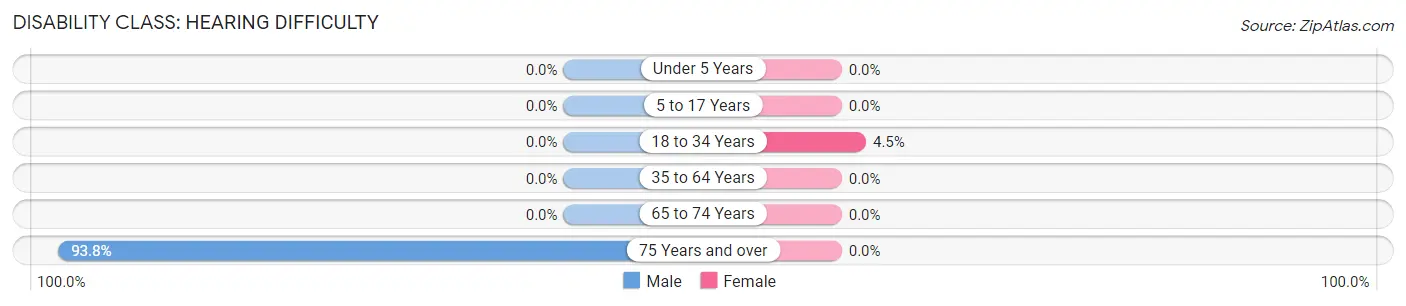
| Age Bracket | Male | Female |
| Under 5 Years | 0 (0.0%) | 0 (0.0%) |
| 5 to 17 Years | 0 (0.0%) | 0 (0.0%) |
| 18 to 34 Years | 0 (0.0%) | 5 (4.5%) |
| 35 to 64 Years | 0 (0.0%) | 0 (0.0%) |
| 65 to 74 Years | 0 (0.0%) | 0 (0.0%) |
| 75 Years and over | 15 (93.8%) | 0 (0.0%) |
Disability Class: Vision Difficulty
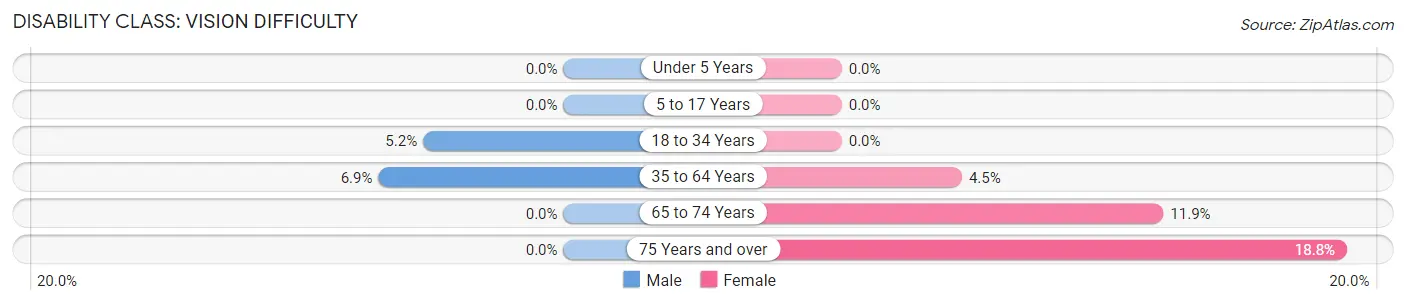
| Age Bracket | Male | Female |
| Under 5 Years | 0 (0.0%) | 0 (0.0%) |
| 5 to 17 Years | 0 (0.0%) | 0 (0.0%) |
| 18 to 34 Years | 5 (5.2%) | 0 (0.0%) |
| 35 to 64 Years | 9 (6.9%) | 9 (4.5%) |
| 65 to 74 Years | 0 (0.0%) | 8 (11.9%) |
| 75 Years and over | 0 (0.0%) | 6 (18.8%) |
Disability Class: Cognitive Difficulty
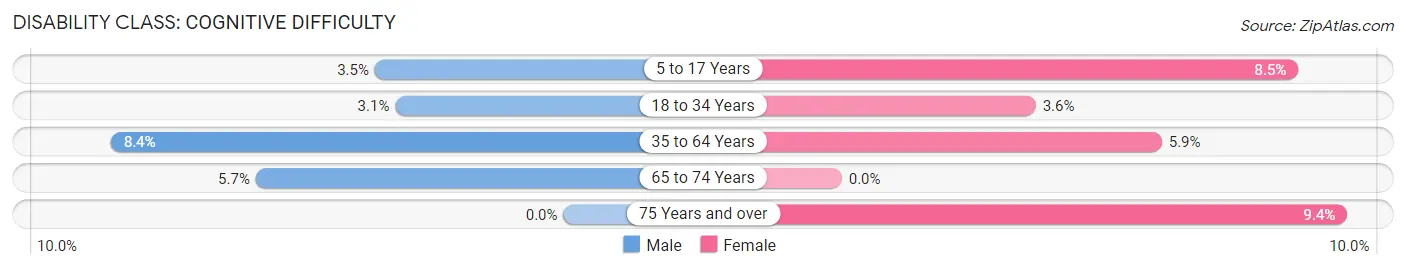
| Age Bracket | Male | Female |
| 5 to 17 Years | 5 (3.5%) | 10 (8.5%) |
| 18 to 34 Years | 3 (3.1%) | 4 (3.6%) |
| 35 to 64 Years | 11 (8.4%) | 12 (5.9%) |
| 65 to 74 Years | 2 (5.7%) | 0 (0.0%) |
| 75 Years and over | 0 (0.0%) | 3 (9.4%) |
Disability Class: Ambulatory Difficulty
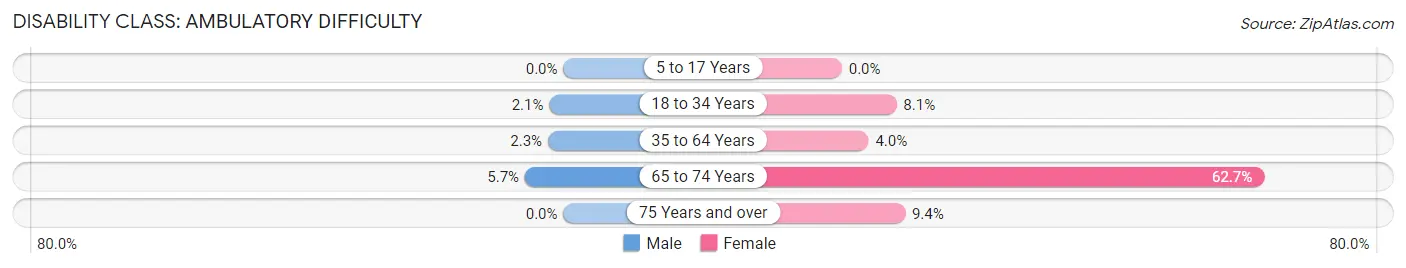
| Age Bracket | Male | Female |
| 5 to 17 Years | 0 (0.0%) | 0 (0.0%) |
| 18 to 34 Years | 2 (2.1%) | 9 (8.1%) |
| 35 to 64 Years | 3 (2.3%) | 8 (4.0%) |
| 65 to 74 Years | 2 (5.7%) | 42 (62.7%) |
| 75 Years and over | 0 (0.0%) | 3 (9.4%) |
Disability Class: Self-Care Difficulty
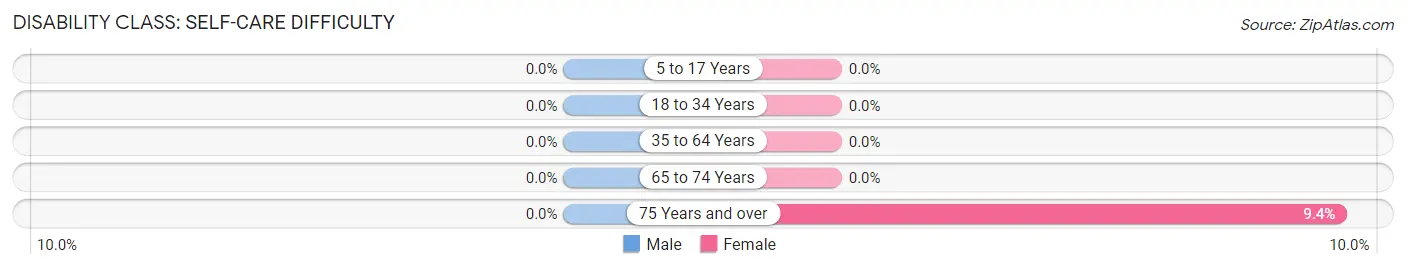
| Age Bracket | Male | Female |
| 5 to 17 Years | 0 (0.0%) | 0 (0.0%) |
| 18 to 34 Years | 0 (0.0%) | 0 (0.0%) |
| 35 to 64 Years | 0 (0.0%) | 0 (0.0%) |
| 65 to 74 Years | 0 (0.0%) | 0 (0.0%) |
| 75 Years and over | 0 (0.0%) | 3 (9.4%) |
Technology Access in Richmondville
Computing Device Access in Richmondville
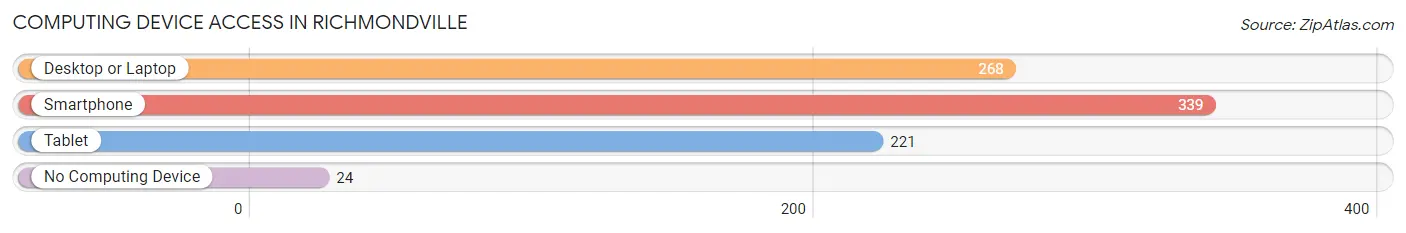
| Device Type | # Households | % Households |
| Desktop or Laptop | 268 | 68.2% |
| Smartphone | 339 | 86.3% |
| Tablet | 221 | 56.2% |
| No Computing Device | 24 | 6.1% |
| Total | 393 | 100.0% |
Internet Access in Richmondville
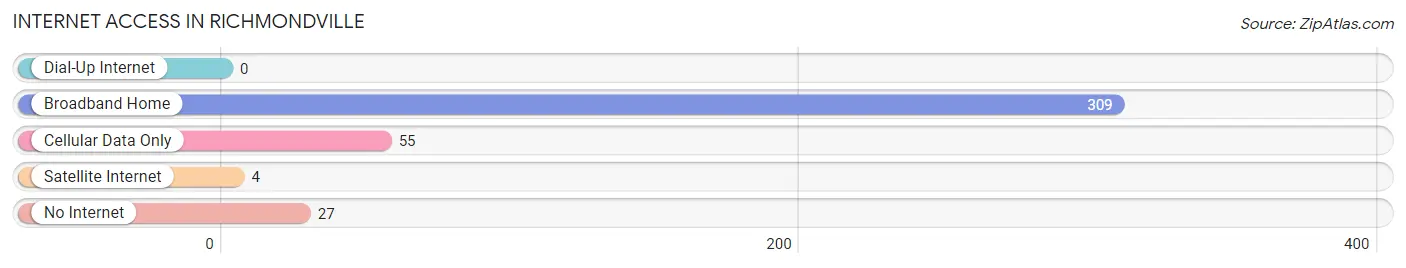
| Internet Type | # Households | % Households |
| Dial-Up Internet | 0 | 0.0% |
| Broadband Home | 309 | 78.6% |
| Cellular Data Only | 55 | 14.0% |
| Satellite Internet | 4 | 1.0% |
| No Internet | 27 | 6.9% |
| Total | 393 | 100.0% |
Richmondville Summary
Richmondville is a small town located in Schoharie County, New York, United States. The town is situated in the foothills of the Catskill Mountains, and is part of the Schoharie Valley. The population was 1,845 at the 2010 census.
History
Richmondville was first settled in 1790 by a group of settlers from Connecticut. The town was originally known as “Richmond”, and was named after the Duke of Richmond. The town was officially established in 1817, and was renamed “Richmondville” in 1820.
The town was an important center of industry in the 19th century, with several mills and factories located in the area. The town was also home to a number of tanneries, which produced leather goods for the local market.
Geography
Richmondville is located in the Schoharie Valley, in the foothills of the Catskill Mountains. The town is bordered by the towns of Cobleskill to the north, Middleburgh to the east, and Summit to the south. The town is located approximately 30 miles southwest of Albany, and is accessible via Interstate 88.
The terrain of Richmondville is mostly rolling hills, with some flat areas in the valleys. The highest point in the town is 1,890 feet above sea level, located on the summit of Richmond Hill.
Economy
Richmondville’s economy is largely based on agriculture and tourism. The town is home to several farms, which produce a variety of crops, including corn, hay, and apples. The town is also home to several wineries, which produce a variety of wines.
The town is also home to several small businesses, including restaurants, shops, and a variety of services. The town is also home to a number of bed and breakfasts, which cater to tourists visiting the area.
Demographics
As of the 2010 census, there were 1,845 people, 745 households, and 486 families residing in the town. The population density was 79.3 people per square mile. The racial makeup of the town was 97.2% White, 0.7% African American, 0.2% Native American, 0.2% Asian, 0.1% Pacific Islander, 0.4% from other races, and 1.2% from two or more races. Hispanic or Latino of any race were 1.7% of the population.
The median income for a household in the town was $41,250, and the median income for a family was $50,000. The per capita income for the town was $20,945. About 10.2% of families and 13.2% of the population were below the poverty line, including 17.2% of those under age 18 and 8.2% of those age 65 or over.
Richmondville is a small town with a rich history and a diverse economy. The town is home to a variety of businesses, farms, and wineries, and is a popular destination for tourists visiting the area. The town has a population of 1,845, and is a great place to live and work.
Common Questions
What is Per Capita Income in Richmondville?
Per Capita income in Richmondville is $25,897.
What is the Median Family Income in Richmondville?
Median Family Income in Richmondville is $58,523.
What is the Median Household income in Richmondville?
Median Household Income in Richmondville is $47,132.
What is Income or Wage Gap in Richmondville?
Income or Wage Gap in Richmondville is 55.8%.
Women in Richmondville earn 44.2 cents for every dollar earned by a man.
What is Inequality or Gini Index in Richmondville?
Inequality or Gini Index in Richmondville is 0.43.
What is the Total Population of Richmondville?
Total Population of Richmondville is 983.
What is the Total Male Population of Richmondville?
Total Male Population of Richmondville is 425.
What is the Total Female Population of Richmondville?
Total Female Population of Richmondville is 558.
What is the Ratio of Males per 100 Females in Richmondville?
There are 76.16 Males per 100 Females in Richmondville.
What is the Ratio of Females per 100 Males in Richmondville?
There are 131.29 Females per 100 Males in Richmondville.
What is the Median Population Age in Richmondville?
Median Population Age in Richmondville is 33.6 Years.
What is the Average Family Size in Richmondville
Average Family Size in Richmondville is 3.3 People.
What is the Average Household Size in Richmondville
Average Household Size in Richmondville is 2.5 People.
How Large is the Labor Force in Richmondville?
There are 478 People in the Labor Forcein in Richmondville.
What is the Percentage of People in the Labor Force in Richmondville?
64.3% of People are in the Labor Force in Richmondville.
What is the Unemployment Rate in Richmondville?
Unemployment Rate in Richmondville is 3.3%.