Ontario, NY Map & Demographics
Ontario Map
Ontario Overview
$31,284
PER CAPITA INCOME
$99,896
AVG FAMILY INCOME
$45,869
AVG HOUSEHOLD INCOME
52.5%
WAGE / INCOME GAP [ % ]
47.5¢/ $1
WAGE / INCOME GAP [ $ ]
0.44
INEQUALITY / GINI INDEX
2,122
TOTAL POPULATION
912
MALE POPULATION
1,210
FEMALE POPULATION
75.37
MALES / 100 FEMALES
132.68
FEMALES / 100 MALES
43.5
MEDIAN AGE
3.0
AVG FAMILY SIZE
2.0
AVG HOUSEHOLD SIZE
1,071
LABOR FORCE [ PEOPLE ]
61.4%
PERCENT IN LABOR FORCE
2.0%
UNEMPLOYMENT RATE
Ontario Zip Codes
Ontario Area Codes
Income in Ontario
Income Overview in Ontario
Per Capita Income in Ontario is $31,284, while median incomes of families and households are $99,896 and $45,869 respectively.
| Characteristic | Number | Measure |
| Per Capita Income | 2,122 | $31,284 |
| Median Family Income | 513 | $99,896 |
| Mean Family Income | 513 | $96,671 |
| Median Household Income | 1,035 | $45,869 |
| Mean Household Income | 1,035 | $64,125 |
| Income Deficit | 513 | $0 |
| Wage / Income Gap (%) | 2,122 | 52.53% |
| Wage / Income Gap ($) | 2,122 | 47.47¢ per $1 |
| Gini / Inequality Index | 2,122 | 0.44 |
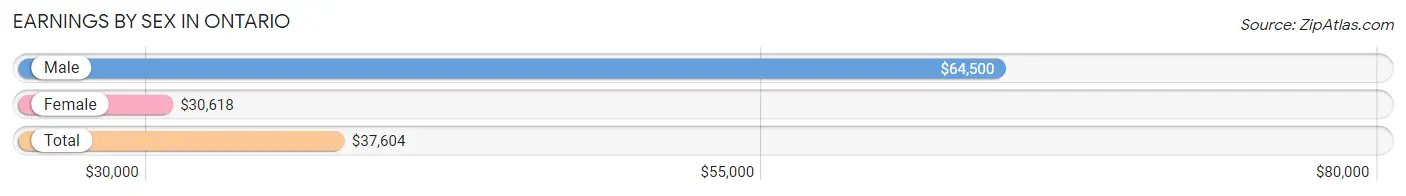
Earnings by Sex in Ontario
Average Earnings in Ontario are $37,604, $64,500 for men and $30,618 for women, a difference of 52.5%.
| Sex | Number | Average Earnings |
| Male | 518 (45.4%) | $64,500 |
| Female | 623 (54.6%) | $30,618 |
| Total | 1,141 (100.0%) | $37,604 |
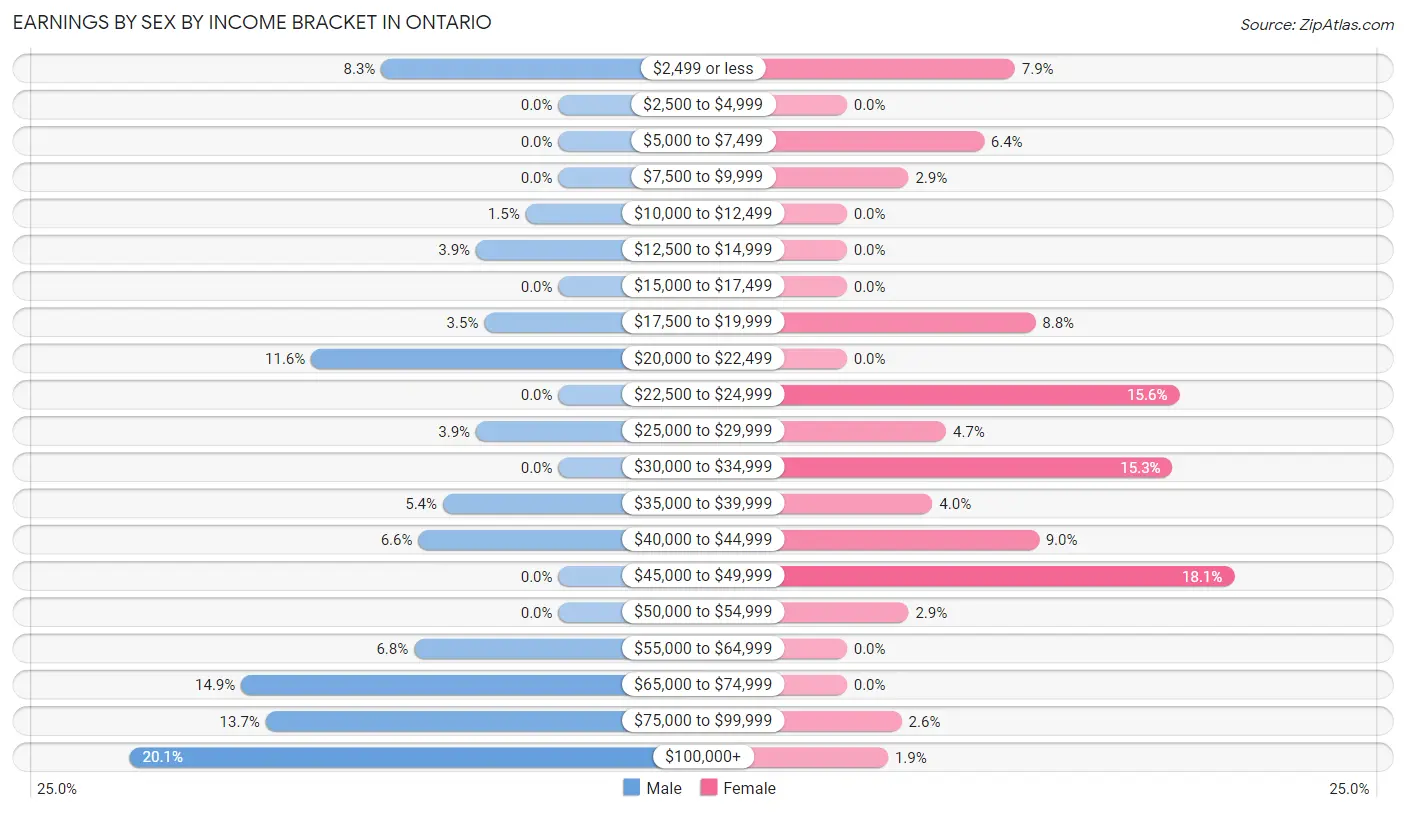
Earnings by Sex by Income Bracket in Ontario
The most common earnings brackets in Ontario are $100,000+ for men (104 | 20.1%) and $45,000 to $49,999 for women (113 | 18.1%).
| Income | Male | Female |
| $2,499 or less | 43 (8.3%) | 49 (7.9%) |
| $2,500 to $4,999 | 0 (0.0%) | 0 (0.0%) |
| $5,000 to $7,499 | 0 (0.0%) | 40 (6.4%) |
| $7,500 to $9,999 | 0 (0.0%) | 18 (2.9%) |
| $10,000 to $12,499 | 8 (1.5%) | 0 (0.0%) |
| $12,500 to $14,999 | 20 (3.9%) | 0 (0.0%) |
| $15,000 to $17,499 | 0 (0.0%) | 0 (0.0%) |
| $17,500 to $19,999 | 18 (3.5%) | 55 (8.8%) |
| $20,000 to $22,499 | 60 (11.6%) | 0 (0.0%) |
| $22,500 to $24,999 | 0 (0.0%) | 97 (15.6%) |
| $25,000 to $29,999 | 20 (3.9%) | 29 (4.6%) |
| $30,000 to $34,999 | 0 (0.0%) | 95 (15.2%) |
| $35,000 to $39,999 | 28 (5.4%) | 25 (4.0%) |
| $40,000 to $44,999 | 34 (6.6%) | 56 (9.0%) |
| $45,000 to $49,999 | 0 (0.0%) | 113 (18.1%) |
| $50,000 to $54,999 | 0 (0.0%) | 18 (2.9%) |
| $55,000 to $64,999 | 35 (6.8%) | 0 (0.0%) |
| $65,000 to $74,999 | 77 (14.9%) | 0 (0.0%) |
| $75,000 to $99,999 | 71 (13.7%) | 16 (2.6%) |
| $100,000+ | 104 (20.1%) | 12 (1.9%) |
| Total | 518 (100.0%) | 623 (100.0%) |
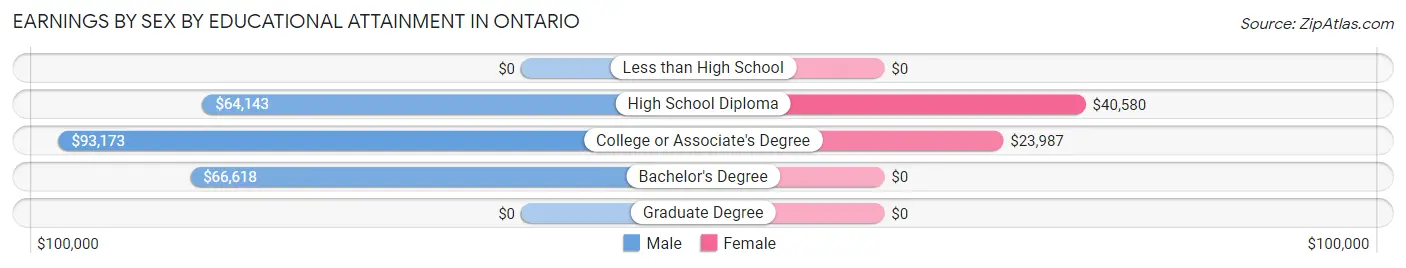
Earnings by Sex by Educational Attainment in Ontario
Average earnings in Ontario are $70,769 for men and $30,487 for women, a difference of 56.9%. Men with an educational attainment of college or associate's degree enjoy the highest average annual earnings of $93,173, while those with high school diploma education earn the least with $64,143. Women with an educational attainment of high school diploma earn the most with the average annual earnings of $40,580, while those with college or associate's degree education have the smallest earnings of $23,987.
| Educational Attainment | Male Income | Female Income |
| Less than High School | - | - |
| High School Diploma | $64,143 | $40,580 |
| College or Associate's Degree | $93,173 | $23,987 |
| Bachelor's Degree | $66,618 | $0 |
| Graduate Degree | - | - |
| Total | $70,769 | $30,487 |
Family Income in Ontario
Family Income Brackets in Ontario
According to the Ontario family income data, there are 194 families falling into the $100,000 to $149,999 income range, which is the most common income bracket and makes up 37.8% of all families.
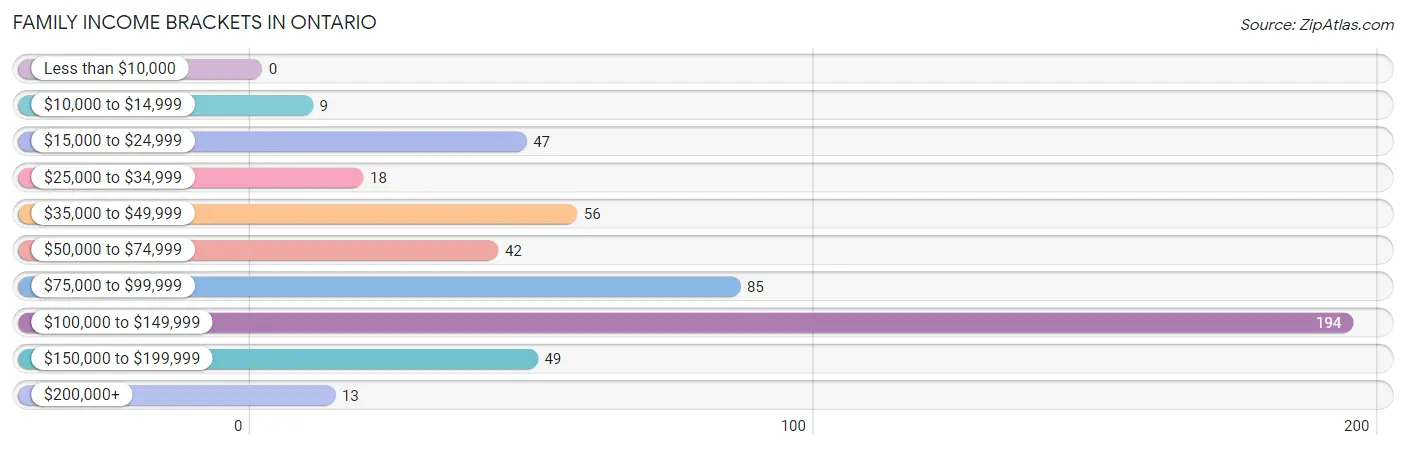
| Income Bracket | # Families | % Families |
| Less than $10,000 | 0 | 0.0% |
| $10,000 to $14,999 | 9 | 1.8% |
| $15,000 to $24,999 | 47 | 9.2% |
| $25,000 to $34,999 | 18 | 3.5% |
| $35,000 to $49,999 | 56 | 10.9% |
| $50,000 to $74,999 | 42 | 8.2% |
| $75,000 to $99,999 | 85 | 16.6% |
| $100,000 to $149,999 | 194 | 37.8% |
| $150,000 to $199,999 | 49 | 9.6% |
| $200,000+ | 13 | 2.5% |
Family Income by Famaliy Size in Ontario
4-person families (153 | 29.8%) account for the highest median family income in Ontario with $119,093 per family, while 2-person families (218 | 42.5%) have the highest median income of $38,203 per family member.
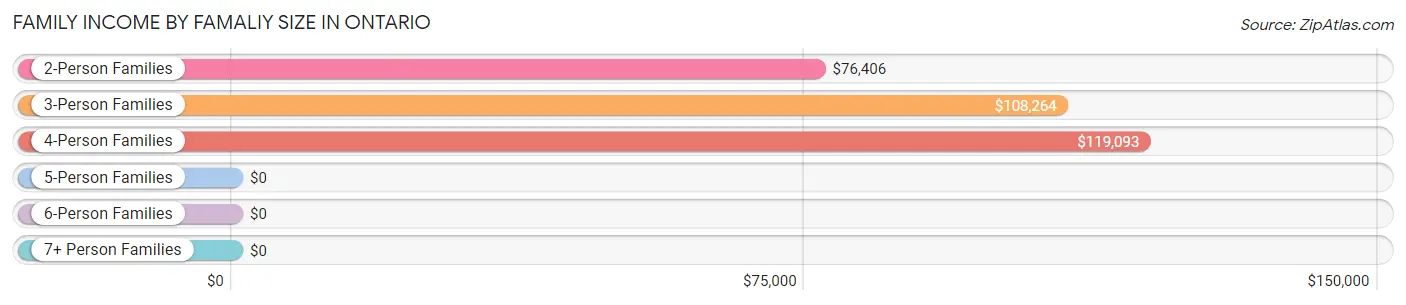
| Income Bracket | # Families | Median Income |
| 2-Person Families | 218 (42.5%) | $76,406 |
| 3-Person Families | 121 (23.6%) | $108,264 |
| 4-Person Families | 153 (29.8%) | $119,093 |
| 5-Person Families | 0 (0.0%) | $0 |
| 6-Person Families | 0 (0.0%) | $0 |
| 7+ Person Families | 21 (4.1%) | $0 |
| Total | 513 (100.0%) | $99,896 |
Family Income by Number of Earners in Ontario
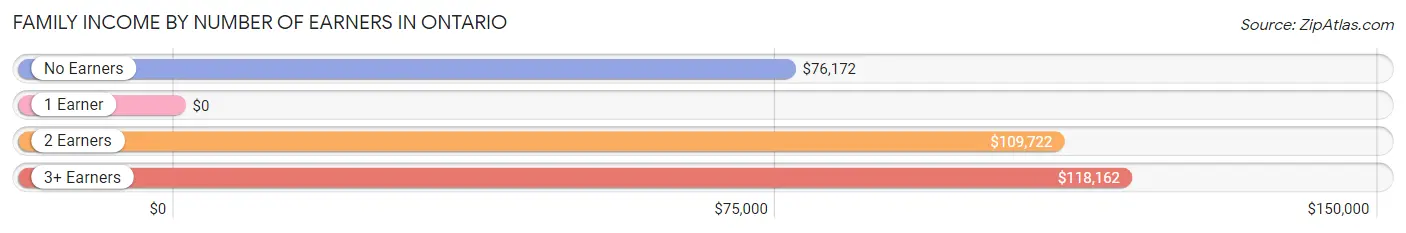
| Number of Earners | # Families | Median Income |
| No Earners | 102 (19.9%) | $76,172 |
| 1 Earner | 106 (20.7%) | $0 |
| 2 Earners | 162 (31.6%) | $109,722 |
| 3+ Earners | 143 (27.9%) | $118,162 |
| Total | 513 (100.0%) | $99,896 |
Household Income in Ontario
Household Income Brackets in Ontario
With 252 households falling in the category, the $15,000 to $24,999 income range is the most frequent in Ontario, accounting for 24.3% of all households. In contrast, only 13 households (1.3%) fall into the $200,000+ income bracket, making it the least populous group.
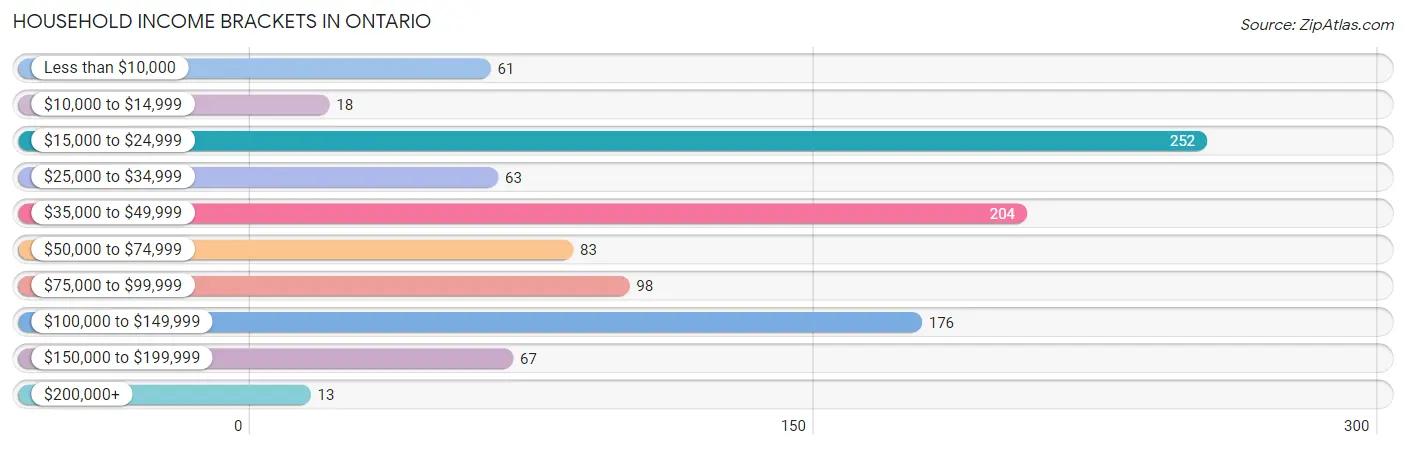
| Income Bracket | # Households | % Households |
| Less than $10,000 | 61 | 5.9% |
| $10,000 to $14,999 | 18 | 1.7% |
| $15,000 to $24,999 | 252 | 24.3% |
| $25,000 to $34,999 | 63 | 6.1% |
| $35,000 to $49,999 | 204 | 19.7% |
| $50,000 to $74,999 | 83 | 8.0% |
| $75,000 to $99,999 | 98 | 9.5% |
| $100,000 to $149,999 | 176 | 17.0% |
| $150,000 to $199,999 | 67 | 6.5% |
| $200,000+ | 13 | 1.3% |
Household Income by Householder Age in Ontario
The median household income in Ontario is $45,869, with the highest median household income of $64,853 found in the 45 to 64 years age bracket for the primary householder. A total of 446 households (43.1%) fall into this category. Meanwhile, the 15 to 24 years age bracket for the primary householder has the lowest median household income of $0, with 82 households (7.9%) in this group.
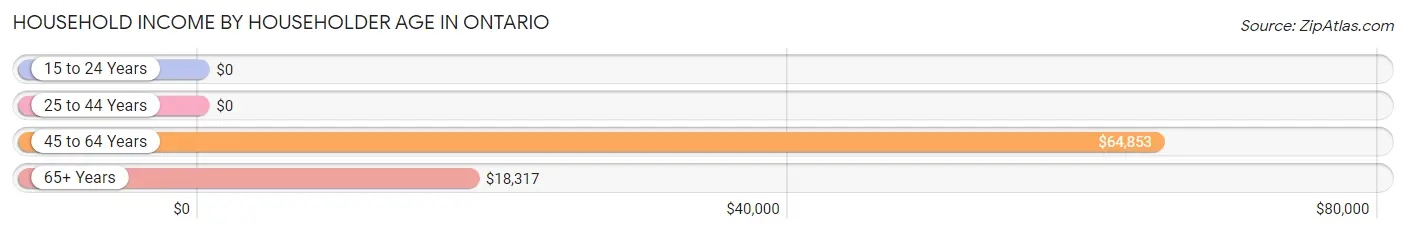
| Income Bracket | # Households | Median Income |
| 15 to 24 Years | 82 (7.9%) | $0 |
| 25 to 44 Years | 236 (22.8%) | $0 |
| 45 to 64 Years | 446 (43.1%) | $64,853 |
| 65+ Years | 271 (26.2%) | $18,317 |
| Total | 1,035 (100.0%) | $45,869 |
Poverty in Ontario
Income Below Poverty by Sex and Age in Ontario
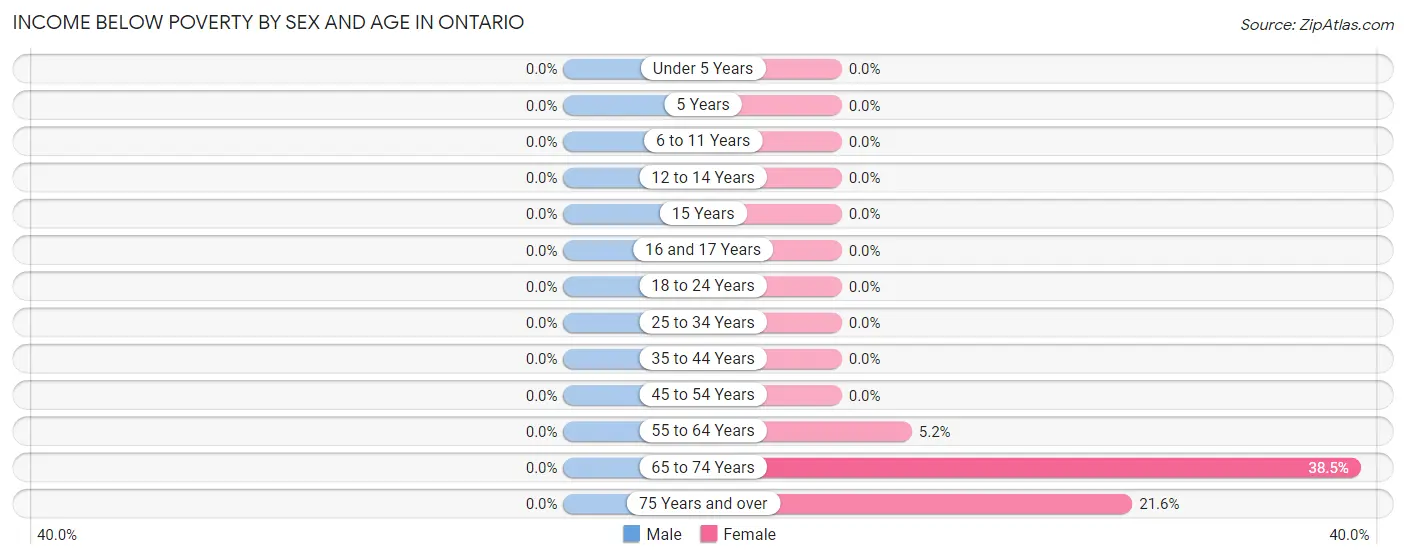
| Age Bracket | Male | Female |
| Under 5 Years | 0 (0.0%) | 0 (0.0%) |
| 5 Years | 0 (0.0%) | 0 (0.0%) |
| 6 to 11 Years | 0 (0.0%) | 0 (0.0%) |
| 12 to 14 Years | 0 (0.0%) | 0 (0.0%) |
| 15 Years | 0 (0.0%) | 0 (0.0%) |
| 16 and 17 Years | 0 (0.0%) | 0 (0.0%) |
| 18 to 24 Years | 0 (0.0%) | 0 (0.0%) |
| 25 to 34 Years | 0 (0.0%) | 0 (0.0%) |
| 35 to 44 Years | 0 (0.0%) | 0 (0.0%) |
| 45 to 54 Years | 0 (0.0%) | 0 (0.0%) |
| 55 to 64 Years | 0 (0.0%) | 9 (5.2%) |
| 65 to 74 Years | 0 (0.0%) | 47 (38.5%) |
| 75 Years and over | 0 (0.0%) | 33 (21.6%) |
| Total | 0 (0.0%) | 89 (7.4%) |
Income Above Poverty by Sex and Age in Ontario
According to the poverty statistics in Ontario, males aged under 5 years and females aged under 5 years are the age groups that are most secure financially, with 100.0% of males and 100.0% of females in these age groups living above the poverty line.
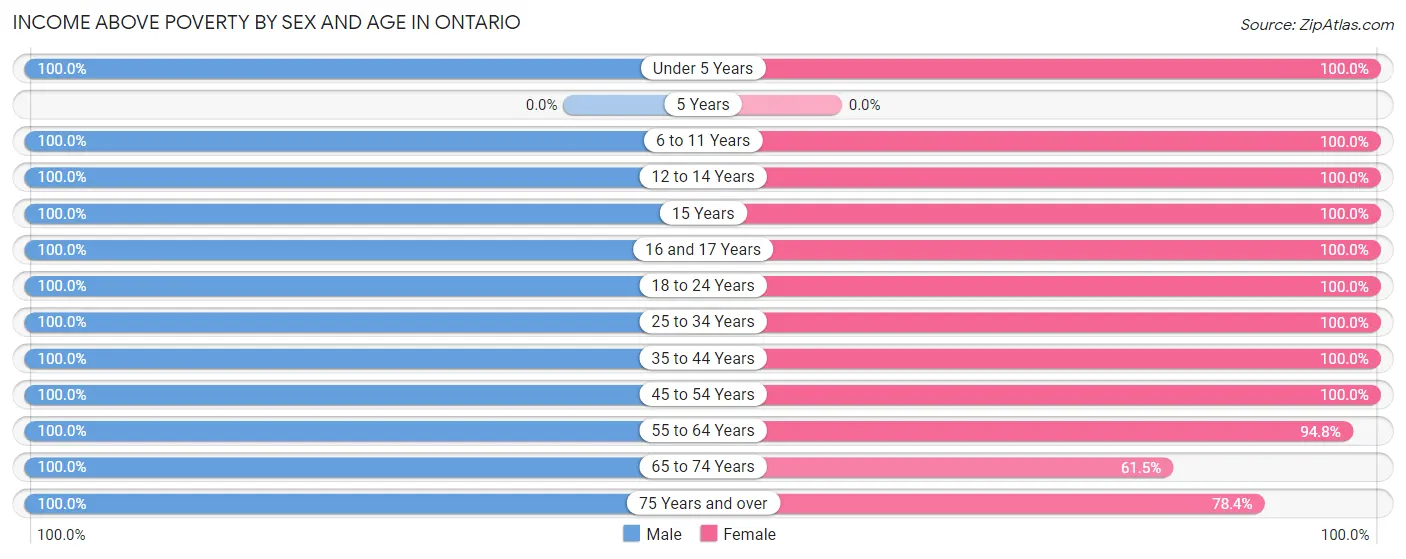
| Age Bracket | Male | Female |
| Under 5 Years | 77 (100.0%) | 10 (100.0%) |
| 5 Years | 0 (0.0%) | 0 (0.0%) |
| 6 to 11 Years | 23 (100.0%) | 74 (100.0%) |
| 12 to 14 Years | 53 (100.0%) | 67 (100.0%) |
| 15 Years | 50 (100.0%) | 23 (100.0%) |
| 16 and 17 Years | 24 (100.0%) | 60 (100.0%) |
| 18 to 24 Years | 108 (100.0%) | 133 (100.0%) |
| 25 to 34 Years | 62 (100.0%) | 62 (100.0%) |
| 35 to 44 Years | 113 (100.0%) | 143 (100.0%) |
| 45 to 54 Years | 252 (100.0%) | 190 (100.0%) |
| 55 to 64 Years | 84 (100.0%) | 164 (94.8%) |
| 65 to 74 Years | 39 (100.0%) | 75 (61.5%) |
| 75 Years and over | 25 (100.0%) | 120 (78.4%) |
| Total | 910 (100.0%) | 1,121 (92.6%) |
Income Below Poverty Among Married-Couple Families in Ontario
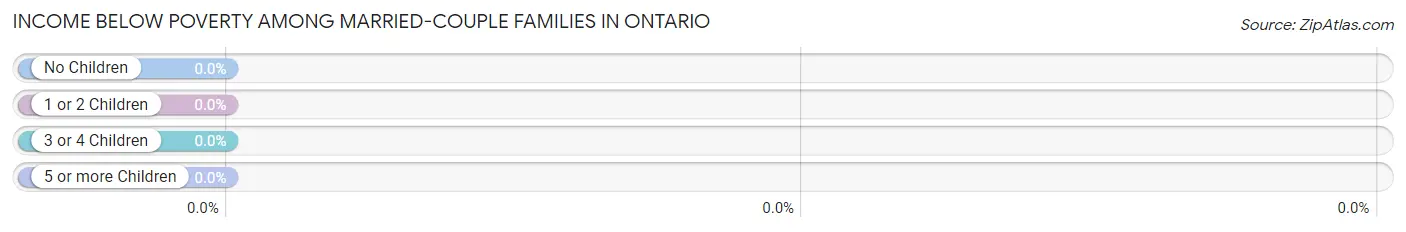
| Children | Above Poverty | Below Poverty |
| No Children | 193 (100.0%) | 0 (0.0%) |
| 1 or 2 Children | 175 (100.0%) | 0 (0.0%) |
| 3 or 4 Children | 0 (0.0%) | 0 (0.0%) |
| 5 or more Children | 21 (100.0%) | 0 (0.0%) |
| Total | 389 (100.0%) | 0 (0.0%) |
Income Below Poverty Among Single-Parent Households in Ontario
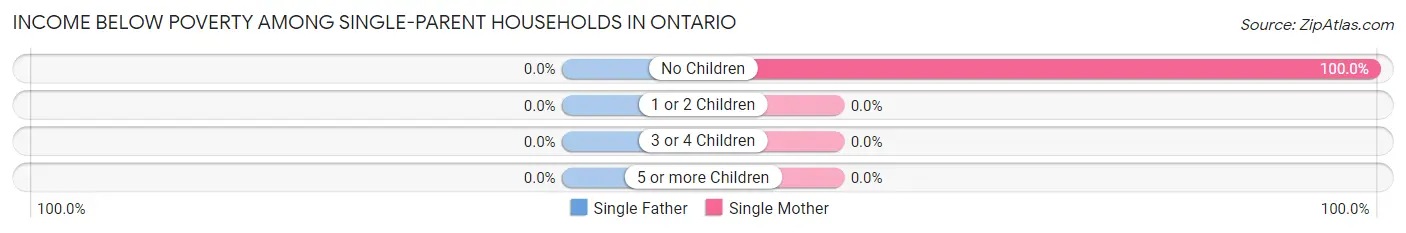
| Children | Single Father | Single Mother |
| No Children | 0 (0.0%) | 9 (100.0%) |
| 1 or 2 Children | 0 (0.0%) | 0 (0.0%) |
| 3 or 4 Children | 0 (0.0%) | 0 (0.0%) |
| 5 or more Children | 0 (0.0%) | 0 (0.0%) |
| Total | 0 (0.0%) | 9 (8.7%) |
Income Below Poverty Among Married-Couple vs Single-Parent Households in Ontario
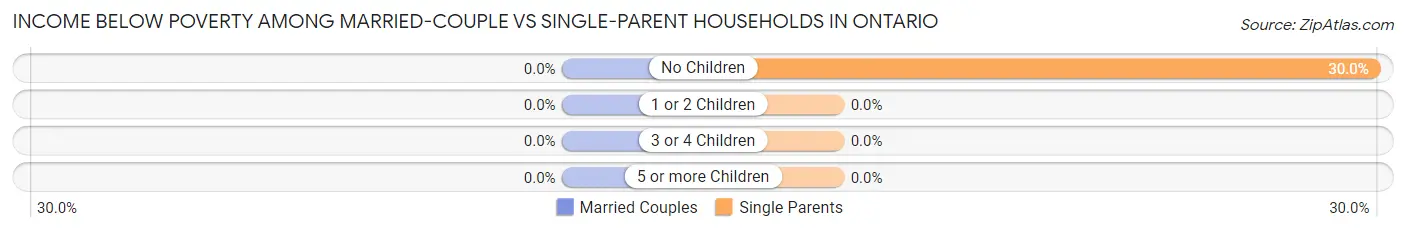
| Children | Married-Couple Families | Single-Parent Households |
| No Children | 0 (0.0%) | 9 (30.0%) |
| 1 or 2 Children | 0 (0.0%) | 0 (0.0%) |
| 3 or 4 Children | 0 (0.0%) | 0 (0.0%) |
| 5 or more Children | 0 (0.0%) | 0 (0.0%) |
| Total | 0 (0.0%) | 9 (7.3%) |
Race in Ontario
The most populous races in Ontario are White / Caucasian (2,009 | 94.7%), Black / African American (40 | 1.9%), and Asian (39 | 1.8%).
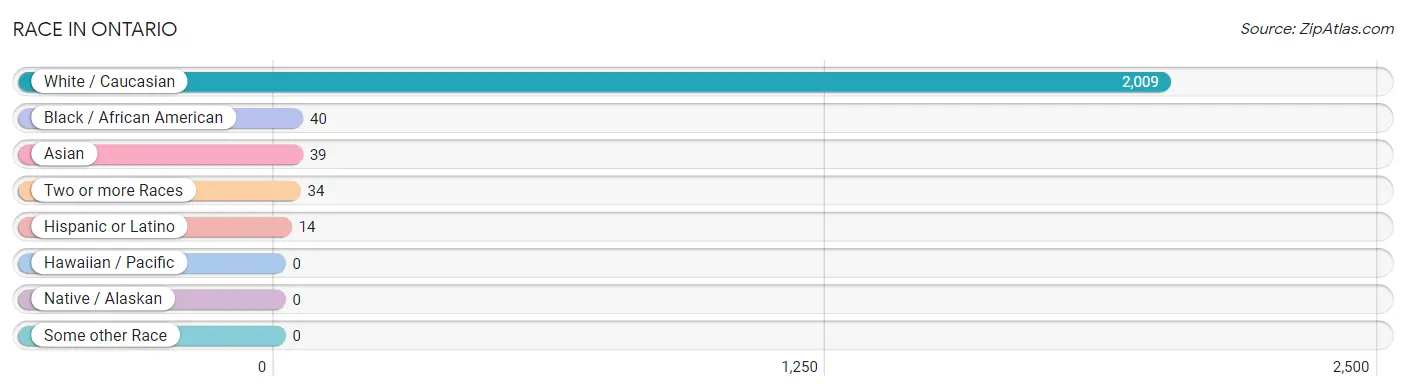
| Race | # Population | % Population |
| Asian | 39 | 1.8% |
| Black / African American | 40 | 1.9% |
| Hawaiian / Pacific | 0 | 0.0% |
| Hispanic or Latino | 14 | 0.7% |
| Native / Alaskan | 0 | 0.0% |
| White / Caucasian | 2,009 | 94.7% |
| Two or more Races | 34 | 1.6% |
| Some other Race | 0 | 0.0% |
| Total | 2,122 | 100.0% |
Ancestry in Ontario
The most populous ancestries reported in Ontario are German (547 | 25.8%), Irish (457 | 21.5%), Italian (359 | 16.9%), English (283 | 13.3%), and Dutch (194 | 9.1%), together accounting for 86.7% of all Ontario residents.
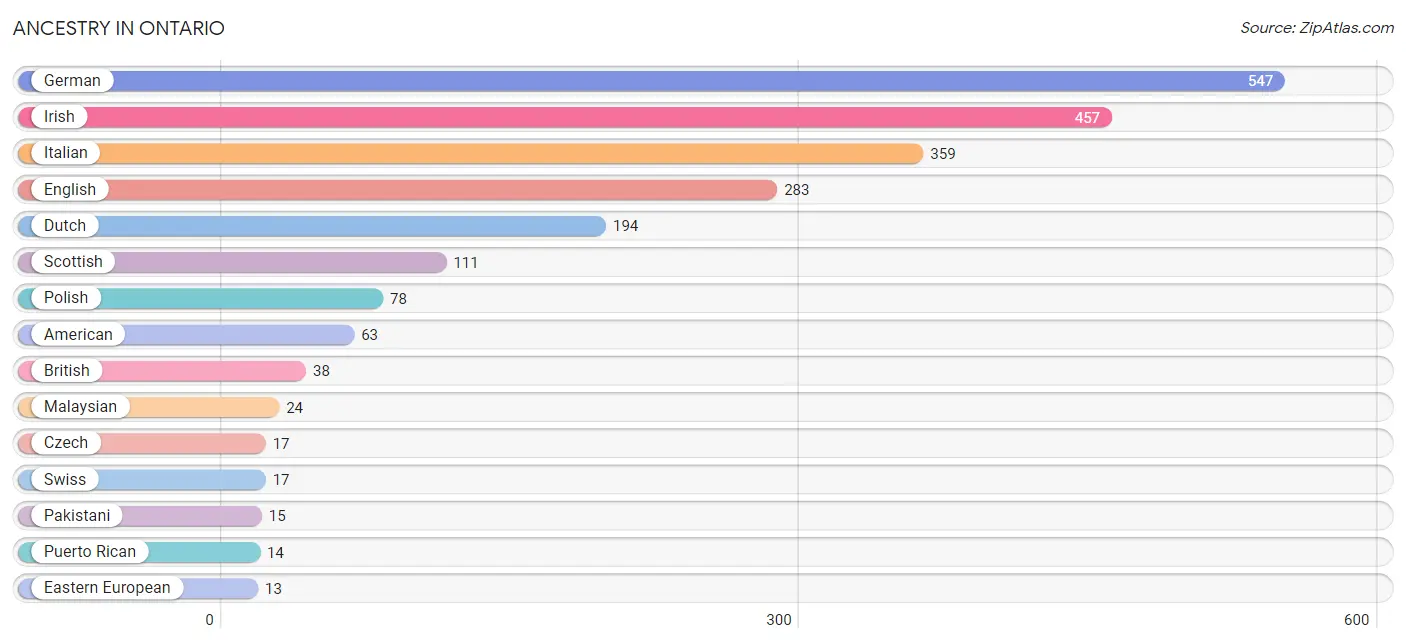
| Ancestry | # Population | % Population |
| American | 63 | 3.0% |
| British | 38 | 1.8% |
| Czech | 17 | 0.8% |
| Dutch | 194 | 9.1% |
| Eastern European | 13 | 0.6% |
| English | 283 | 13.3% |
| French | 8 | 0.4% |
| German | 547 | 25.8% |
| Irish | 457 | 21.5% |
| Italian | 359 | 16.9% |
| Malaysian | 24 | 1.1% |
| Pakistani | 15 | 0.7% |
| Polish | 78 | 3.7% |
| Puerto Rican | 14 | 0.7% |
| Scottish | 111 | 5.2% |
| Swiss | 17 | 0.8% |
| Welsh | 11 | 0.5% | View All 17 Rows |
Immigrants in Ontario
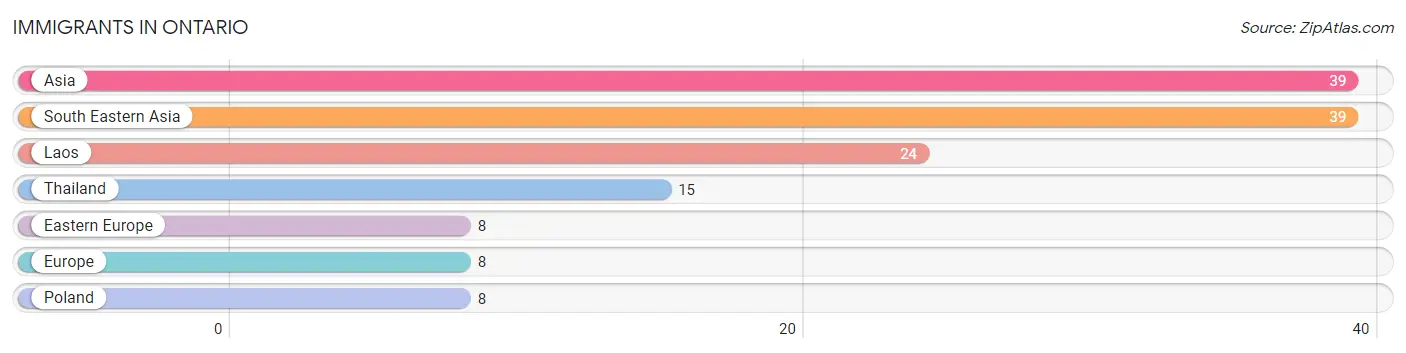
The most numerous immigrant groups reported in Ontario came from Asia (39 | 1.8%), South Eastern Asia (39 | 1.8%), Laos (24 | 1.1%), Thailand (15 | 0.7%), and Eastern Europe (8 | 0.4%), together accounting for 5.9% of all Ontario residents.
| Immigration Origin | # Population | % Population |
| Asia | 39 | 1.8% |
| Eastern Europe | 8 | 0.4% |
| Europe | 8 | 0.4% |
| Laos | 24 | 1.1% |
| Poland | 8 | 0.4% |
| South Eastern Asia | 39 | 1.8% |
| Thailand | 15 | 0.7% | View All 7 Rows |
Sex and Age in Ontario
Sex and Age in Ontario
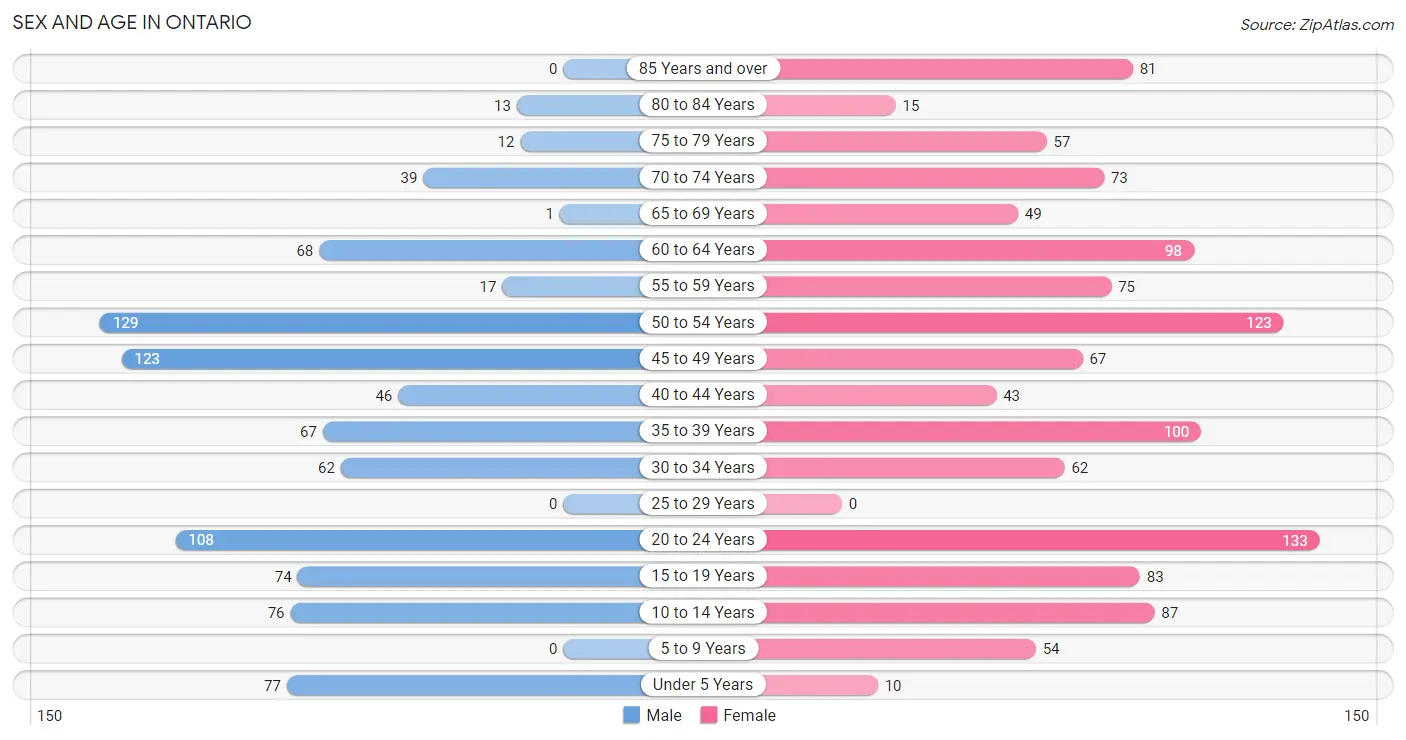
The most populous age groups in Ontario are 50 to 54 Years (129 | 14.1%) for men and 20 to 24 Years (133 | 11.0%) for women.
| Age Bracket | Male | Female |
| Under 5 Years | 77 (8.4%) | 10 (0.8%) |
| 5 to 9 Years | 0 (0.0%) | 54 (4.5%) |
| 10 to 14 Years | 76 (8.3%) | 87 (7.2%) |
| 15 to 19 Years | 74 (8.1%) | 83 (6.9%) |
| 20 to 24 Years | 108 (11.8%) | 133 (11.0%) |
| 25 to 29 Years | 0 (0.0%) | 0 (0.0%) |
| 30 to 34 Years | 62 (6.8%) | 62 (5.1%) |
| 35 to 39 Years | 67 (7.3%) | 100 (8.3%) |
| 40 to 44 Years | 46 (5.0%) | 43 (3.5%) |
| 45 to 49 Years | 123 (13.5%) | 67 (5.5%) |
| 50 to 54 Years | 129 (14.1%) | 123 (10.2%) |
| 55 to 59 Years | 17 (1.9%) | 75 (6.2%) |
| 60 to 64 Years | 68 (7.5%) | 98 (8.1%) |
| 65 to 69 Years | 1 (0.1%) | 49 (4.1%) |
| 70 to 74 Years | 39 (4.3%) | 73 (6.0%) |
| 75 to 79 Years | 12 (1.3%) | 57 (4.7%) |
| 80 to 84 Years | 13 (1.4%) | 15 (1.2%) |
| 85 Years and over | 0 (0.0%) | 81 (6.7%) |
| Total | 912 (100.0%) | 1,210 (100.0%) |
Families and Households in Ontario
Median Family Size in Ontario
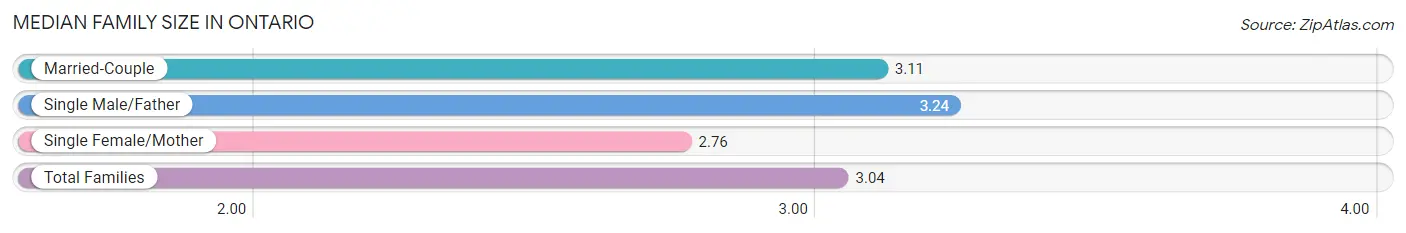
The median family size in Ontario is 3.04 persons per family, with single male/father families (21 | 4.1%) accounting for the largest median family size of 3.24 persons per family. On the other hand, single female/mother families (103 | 20.1%) represent the smallest median family size with 2.76 persons per family.
| Family Type | # Families | Family Size |
| Married-Couple | 389 (75.8%) | 3.11 |
| Single Male/Father | 21 (4.1%) | 3.24 |
| Single Female/Mother | 103 (20.1%) | 2.76 |
| Total Families | 513 (100.0%) | 3.04 |
Median Household Size in Ontario
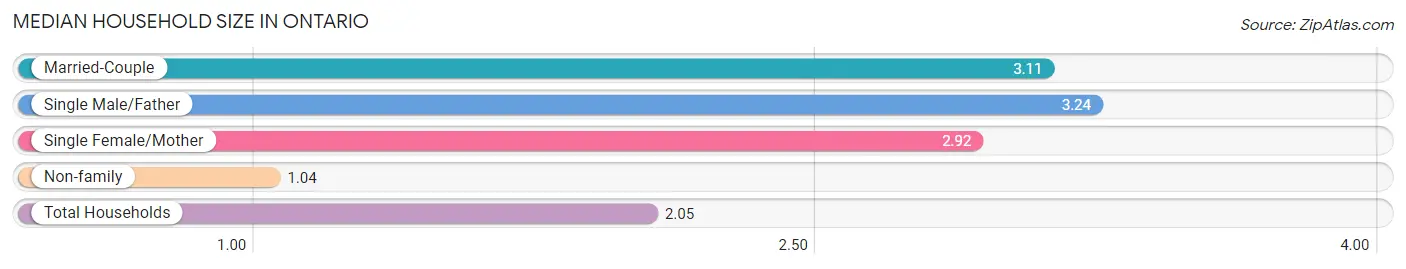
The median household size in Ontario is 2.05 persons per household, with single male/father households (21 | 2.0%) accounting for the largest median household size of 3.24 persons per household. non-family households (522 | 50.4%) represent the smallest median household size with 1.04 persons per household.
| Household Type | # Households | Household Size |
| Married-Couple | 389 (37.6%) | 3.11 |
| Single Male/Father | 21 (2.0%) | 3.24 |
| Single Female/Mother | 103 (10.0%) | 2.92 |
| Non-family | 522 (50.4%) | 1.04 |
| Total Households | 1,035 (100.0%) | 2.05 |
Household Size by Marriage Status in Ontario
Out of a total of 1,035 households in Ontario, 513 (49.6%) are family households, while 522 (50.4%) are nonfamily households. The most numerous type of family households are 2-person households, comprising 218, and the most common type of nonfamily households are 1-person households, comprising 501.
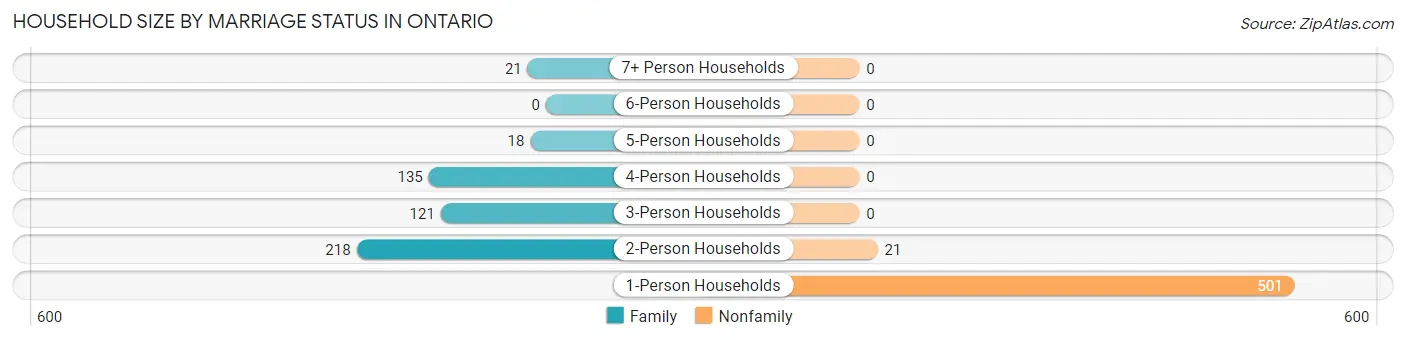
| Household Size | Family Households | Nonfamily Households |
| 1-Person Households | - | 501 (48.4%) |
| 2-Person Households | 218 (21.1%) | 21 (2.0%) |
| 3-Person Households | 121 (11.7%) | 0 (0.0%) |
| 4-Person Households | 135 (13.0%) | 0 (0.0%) |
| 5-Person Households | 18 (1.7%) | 0 (0.0%) |
| 6-Person Households | 0 (0.0%) | 0 (0.0%) |
| 7+ Person Households | 21 (2.0%) | 0 (0.0%) |
| Total | 513 (49.6%) | 522 (50.4%) |
Female Fertility in Ontario
Fertility by Age in Ontario
Average fertility rate in Ontario is 142.0 births per 1,000 women. Women in the age bracket of 20 to 34 years have the highest fertility rate with 369.0 births per 1,000 women. Women in the age bracket of 20 to 34 years acount for 100.0% of all women with births.
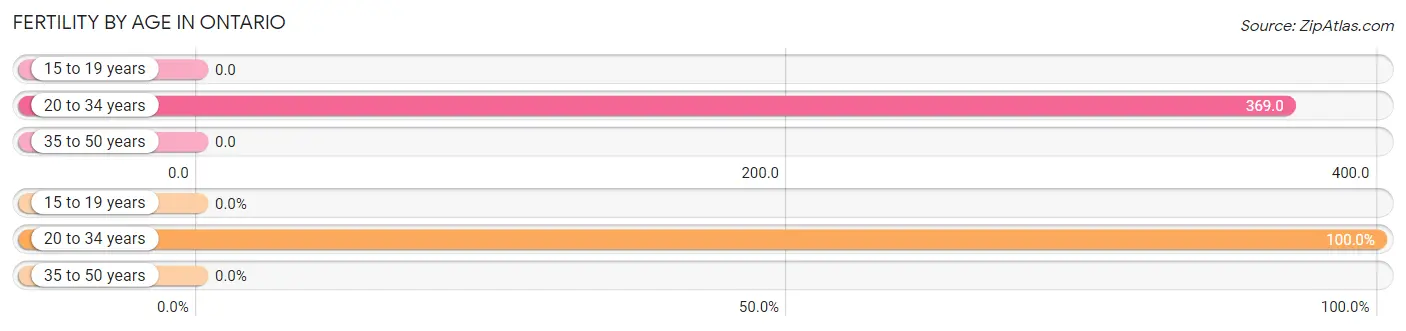
| Age Bracket | Women with Births | Births / 1,000 Women |
| 15 to 19 years | 0 (0.0%) | 0.0 |
| 20 to 34 years | 72 (100.0%) | 369.0 |
| 35 to 50 years | 0 (0.0%) | 0.0 |
| Total | 72 (100.0%) | 142.0 |
Fertility by Age by Marriage Status in Ontario
50.0% of women with births (72) in Ontario are married. The highest percentage of unmarried women with births falls into 20 to 34 years age bracket with 50.0% of them unmarried at the time of birth, while the lowest percentage of unmarried women with births belong to 20 to 34 years age bracket with 50.0% of them unmarried.
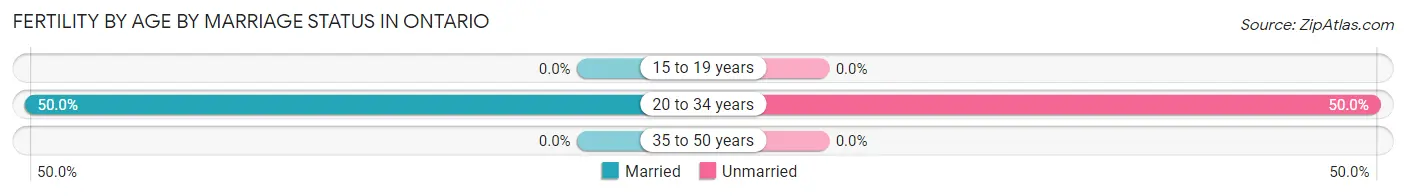
| Age Bracket | Married | Unmarried |
| 15 to 19 years | 0 (0.0%) | 0 (0.0%) |
| 20 to 34 years | 36 (50.0%) | 36 (50.0%) |
| 35 to 50 years | 0 (0.0%) | 0 (0.0%) |
| Total | 36 (50.0%) | 36 (50.0%) |
Fertility by Education in Ontario
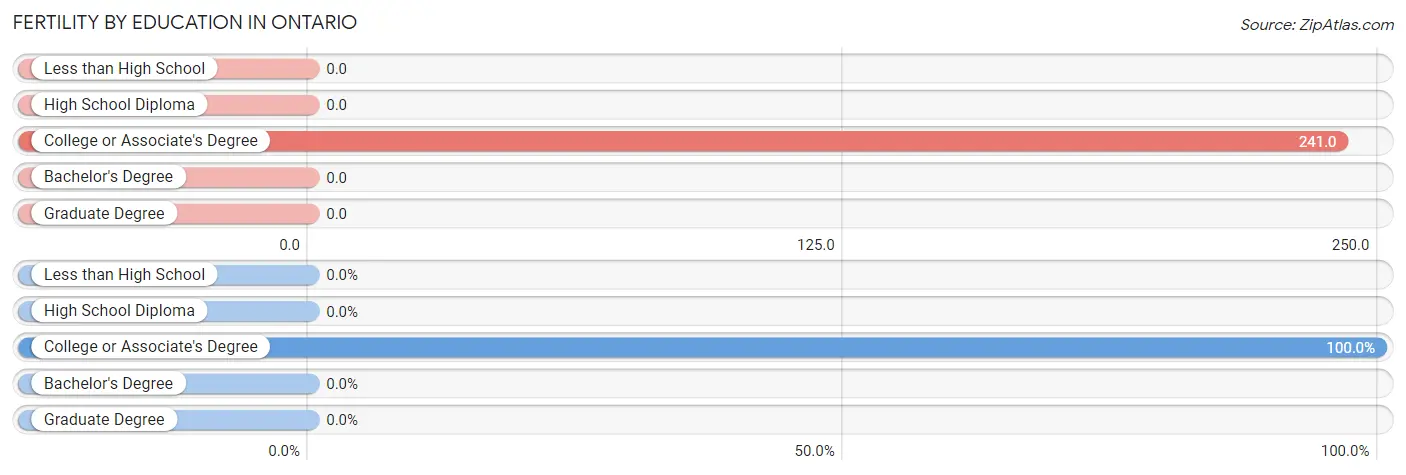
| Educational Attainment | Women with Births | Births / 1,000 Women |
| Less than High School | 0 (0.0%) | 0.0 |
| High School Diploma | 0 (0.0%) | 0.0 |
| College or Associate's Degree | 72 (100.0%) | 241.0 |
| Bachelor's Degree | 0 (0.0%) | 0.0 |
| Graduate Degree | 0 (0.0%) | 0.0 |
| Total | 72 (100.0%) | 142.0 |
Fertility by Education by Marriage Status in Ontario
50.0% of women with births in Ontario are unmarried. Women with the educational attainment of college or associate's degree are most likely to be married with 50.0% of them married at childbirth, while women with the educational attainment of college or associate's degree are least likely to be married with 50.0% of them unmarried at childbirth.
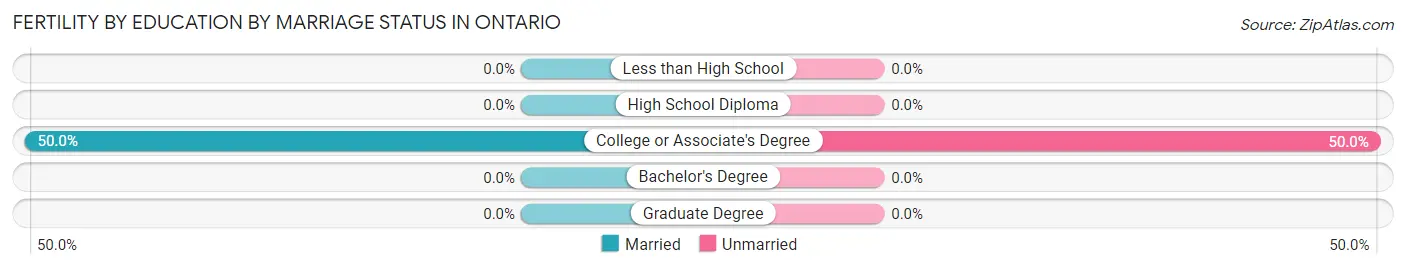
| Educational Attainment | Married | Unmarried |
| Less than High School | 0 (0.0%) | 0 (0.0%) |
| High School Diploma | 0 (0.0%) | 0 (0.0%) |
| College or Associate's Degree | 36 (50.0%) | 36 (50.0%) |
| Bachelor's Degree | 0 (0.0%) | 0 (0.0%) |
| Graduate Degree | 0 (0.0%) | 0 (0.0%) |
| Total | 36 (50.0%) | 36 (50.0%) |
Employment Characteristics in Ontario
Employment by Class of Employer in Ontario
Among the 1,033 employed individuals in Ontario, private company employees (679 | 65.7%), not-for-profit organizations (152 | 14.7%), and local government employees (107 | 10.4%) make up the most common classes of employment.
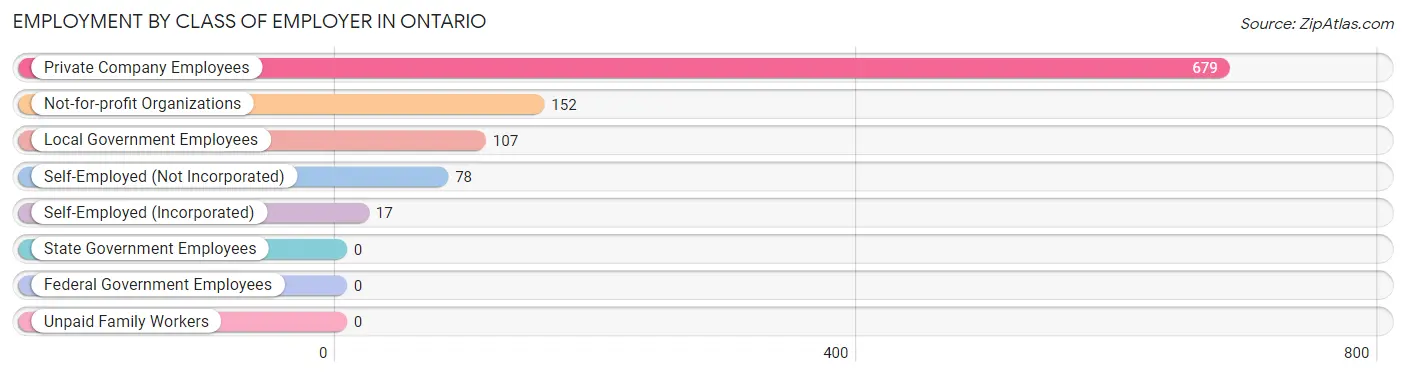
| Employer Class | # Employees | % Employees |
| Private Company Employees | 679 | 65.7% |
| Self-Employed (Incorporated) | 17 | 1.7% |
| Self-Employed (Not Incorporated) | 78 | 7.5% |
| Not-for-profit Organizations | 152 | 14.7% |
| Local Government Employees | 107 | 10.4% |
| State Government Employees | 0 | 0.0% |
| Federal Government Employees | 0 | 0.0% |
| Unpaid Family Workers | 0 | 0.0% |
| Total | 1,033 | 100.0% |
Employment Status by Age in Ontario
According to the labor force statistics for Ontario, out of the total population over 16 years of age (1,745), 61.4% or 1,071 individuals are in the labor force, with 2.0% or 21 of them unemployed. The age group with the highest labor force participation rate is 55 to 59 years, with 100.0% or 92 individuals in the labor force. Within the labor force, the 30 to 34 years age range has the highest percentage of unemployed individuals, with 20.4% or 21 of them being unemployed.
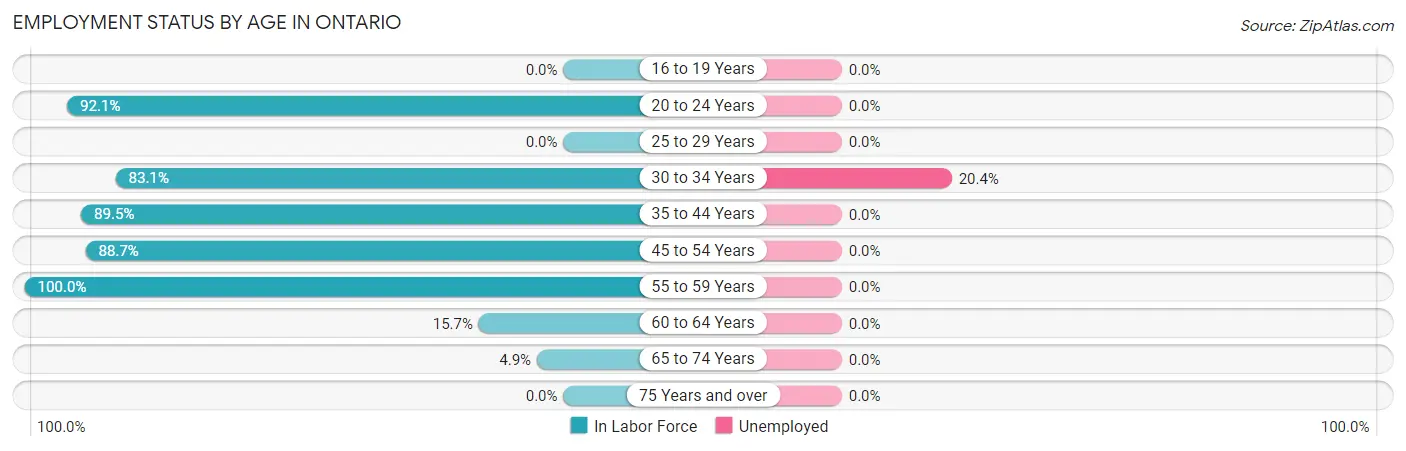
| Age Bracket | In Labor Force | Unemployed |
| 16 to 19 Years | 0 (0.0%) | 0 (0.0%) |
| 20 to 24 Years | 222 (92.1%) | 0 (0.0%) |
| 25 to 29 Years | 0 (0.0%) | 0 (0.0%) |
| 30 to 34 Years | 103 (83.1%) | 21 (20.4%) |
| 35 to 44 Years | 229 (89.5%) | 0 (0.0%) |
| 45 to 54 Years | 392 (88.7%) | 0 (0.0%) |
| 55 to 59 Years | 92 (100.0%) | 0 (0.0%) |
| 60 to 64 Years | 26 (15.7%) | 0 (0.0%) |
| 65 to 74 Years | 8 (4.9%) | 0 (0.0%) |
| 75 Years and over | 0 (0.0%) | 0 (0.0%) |
| Total | 1,071 (61.4%) | 21 (2.0%) |
Employment Status by Educational Attainment in Ontario
According to labor force statistics for Ontario, 78.0% of individuals (842) out of the total population between 25 and 64 years of age (1,080) are in the labor force, with 2.5% or 21 of them being unemployed. The group with the highest labor force participation rate are those with the educational attainment of bachelor's degree or higher, with 82.3% or 233 individuals in the labor force. Within the labor force, individuals with high school diploma education have the highest percentage of unemployment, with 8.9% or 21 of them being unemployed.
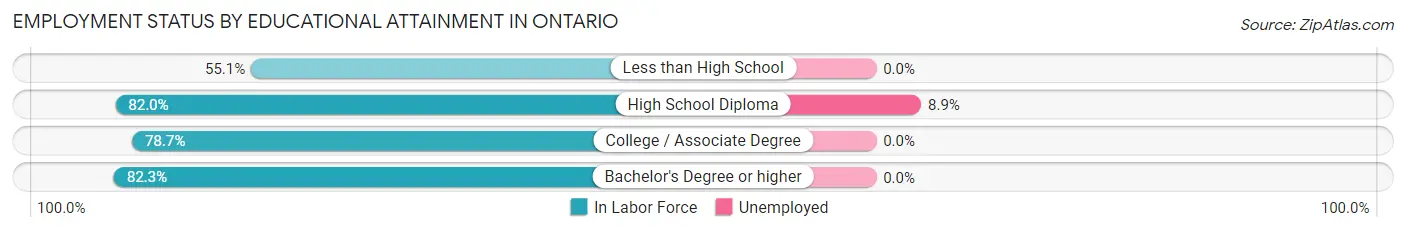
| Educational Attainment | In Labor Force | Unemployed |
| Less than High School | 65 (55.1%) | 0 (0.0%) |
| High School Diploma | 237 (82.0%) | 26 (8.9%) |
| College / Associate Degree | 307 (78.7%) | 0 (0.0%) |
| Bachelor's Degree or higher | 233 (82.3%) | 0 (0.0%) |
| Total | 842 (78.0%) | 27 (2.5%) |
Employment Occupations by Sex in Ontario
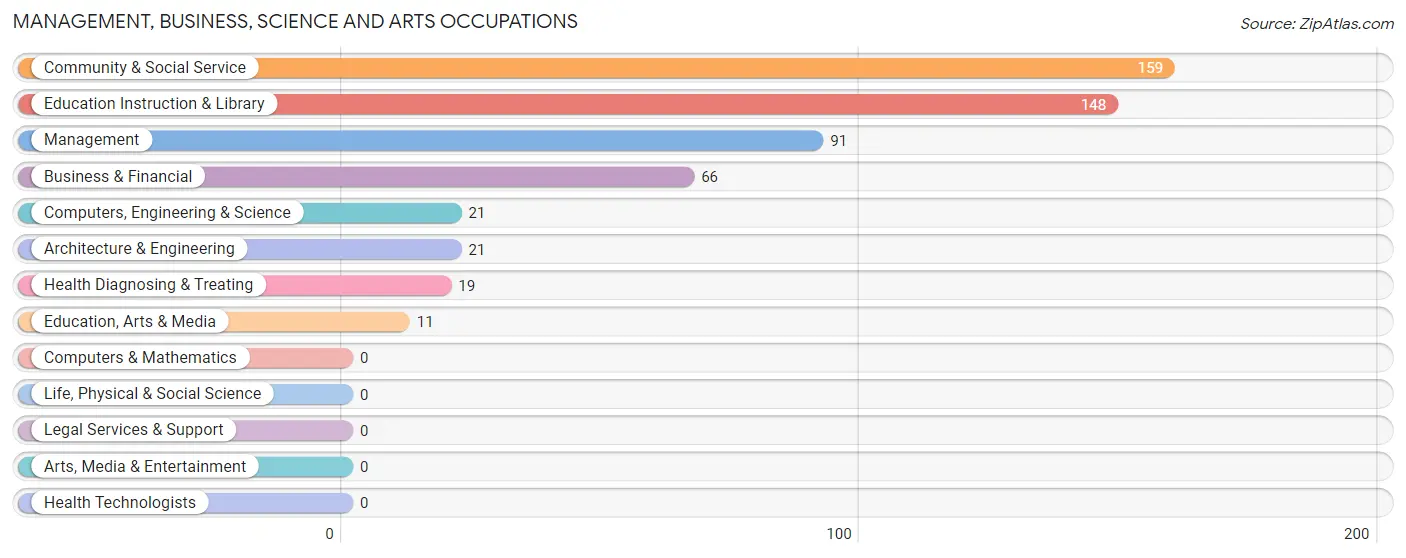
Management, Business, Science and Arts Occupations
The most common Management, Business, Science and Arts occupations in Ontario are Community & Social Service (159 | 15.1%), Education Instruction & Library (148 | 14.1%), Management (91 | 8.7%), Business & Financial (66 | 6.3%), and Computers, Engineering & Science (21 | 2.0%).
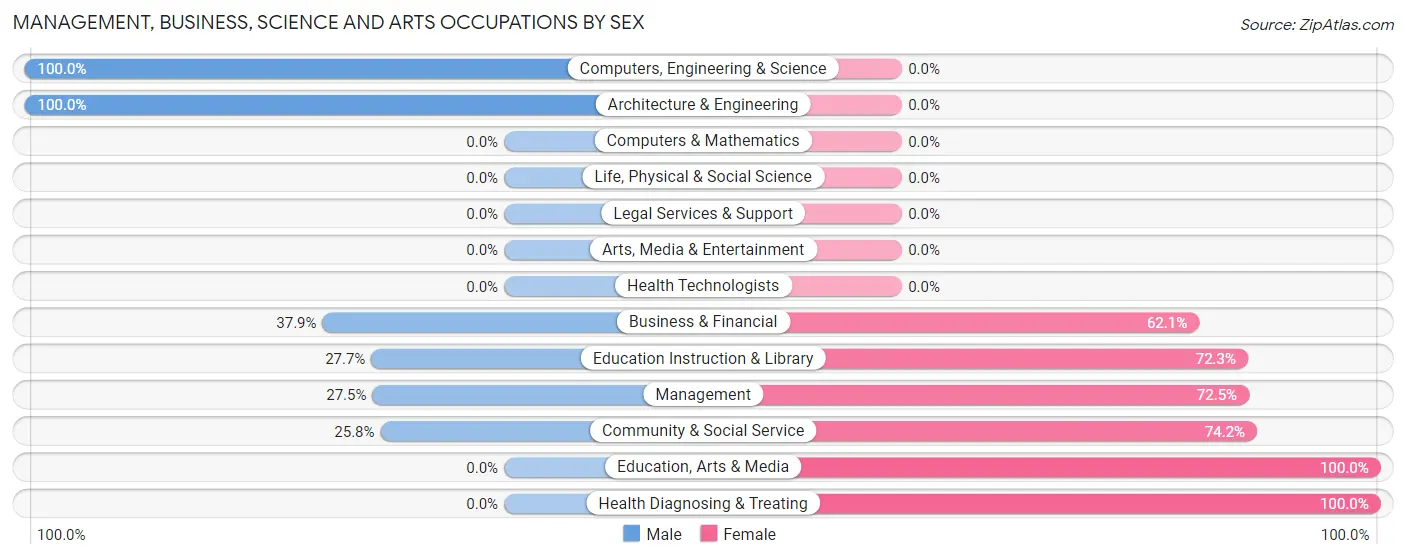
Management, Business, Science and Arts Occupations by Sex
Within the Management, Business, Science and Arts occupations in Ontario, the most male-oriented occupations are Computers, Engineering & Science (100.0%), Architecture & Engineering (100.0%), and Business & Financial (37.9%), while the most female-oriented occupations are Education, Arts & Media (100.0%), Health Diagnosing & Treating (100.0%), and Community & Social Service (74.2%).
| Occupation | Male | Female |
| Management | 25 (27.5%) | 66 (72.5%) |
| Business & Financial | 25 (37.9%) | 41 (62.1%) |
| Computers, Engineering & Science | 21 (100.0%) | 0 (0.0%) |
| Computers & Mathematics | 0 (0.0%) | 0 (0.0%) |
| Architecture & Engineering | 21 (100.0%) | 0 (0.0%) |
| Life, Physical & Social Science | 0 (0.0%) | 0 (0.0%) |
| Community & Social Service | 41 (25.8%) | 118 (74.2%) |
| Education, Arts & Media | 0 (0.0%) | 11 (100.0%) |
| Legal Services & Support | 0 (0.0%) | 0 (0.0%) |
| Education Instruction & Library | 41 (27.7%) | 107 (72.3%) |
| Arts, Media & Entertainment | 0 (0.0%) | 0 (0.0%) |
| Health Diagnosing & Treating | 0 (0.0%) | 19 (100.0%) |
| Health Technologists | 0 (0.0%) | 0 (0.0%) |
| Total (Category) | 112 (31.5%) | 244 (68.5%) |
| Total (Overall) | 494 (47.0%) | 557 (53.0%) |
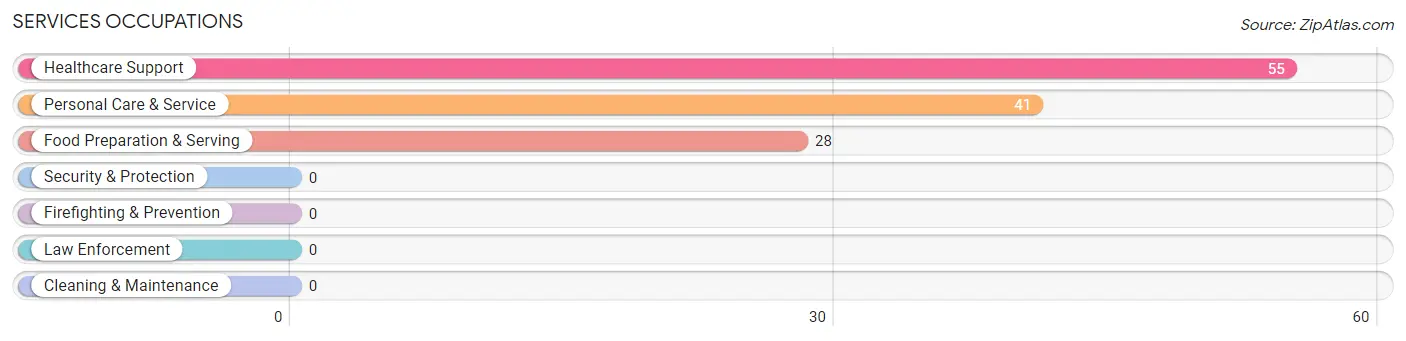
Services Occupations
The most common Services occupations in Ontario are Healthcare Support (55 | 5.2%), Personal Care & Service (41 | 3.9%), and Food Preparation & Serving (28 | 2.7%).
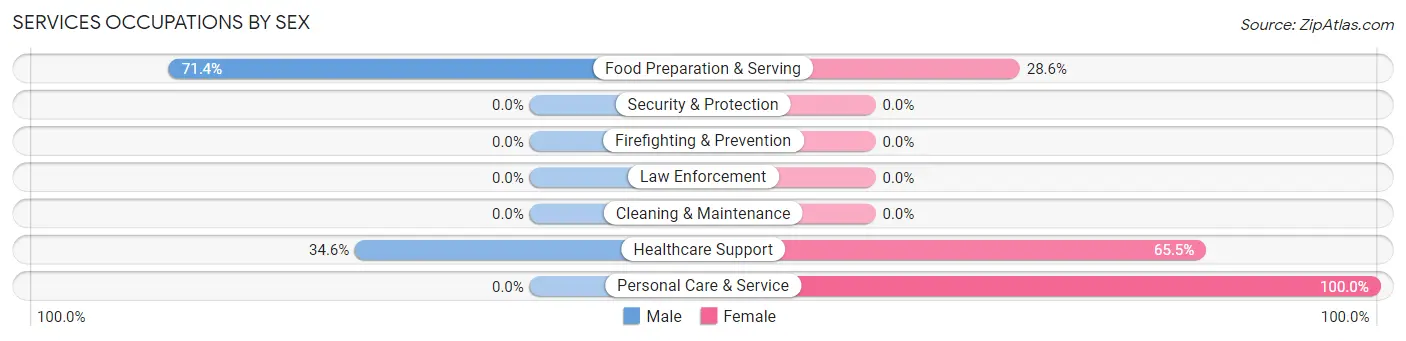
Services Occupations by Sex
Within the Services occupations in Ontario, the most male-oriented occupations are Food Preparation & Serving (71.4%), and Healthcare Support (34.5%), while the most female-oriented occupations are Personal Care & Service (100.0%), Healthcare Support (65.4%), and Food Preparation & Serving (28.6%).
| Occupation | Male | Female |
| Healthcare Support | 19 (34.5%) | 36 (65.4%) |
| Security & Protection | 0 (0.0%) | 0 (0.0%) |
| Firefighting & Prevention | 0 (0.0%) | 0 (0.0%) |
| Law Enforcement | 0 (0.0%) | 0 (0.0%) |
| Food Preparation & Serving | 20 (71.4%) | 8 (28.6%) |
| Cleaning & Maintenance | 0 (0.0%) | 0 (0.0%) |
| Personal Care & Service | 0 (0.0%) | 41 (100.0%) |
| Total (Category) | 39 (31.5%) | 85 (68.5%) |
| Total (Overall) | 494 (47.0%) | 557 (53.0%) |
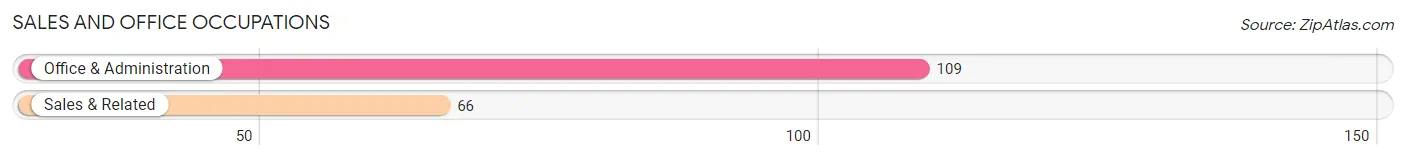
Sales and Office Occupations
The most common Sales and Office occupations in Ontario are Office & Administration (109 | 10.4%), and Sales & Related (66 | 6.3%).
Sales and Office Occupations by Sex

| Occupation | Male | Female |
| Sales & Related | 41 (62.1%) | 25 (37.9%) |
| Office & Administration | 18 (16.5%) | 91 (83.5%) |
| Total (Category) | 59 (33.7%) | 116 (66.3%) |
| Total (Overall) | 494 (47.0%) | 557 (53.0%) |
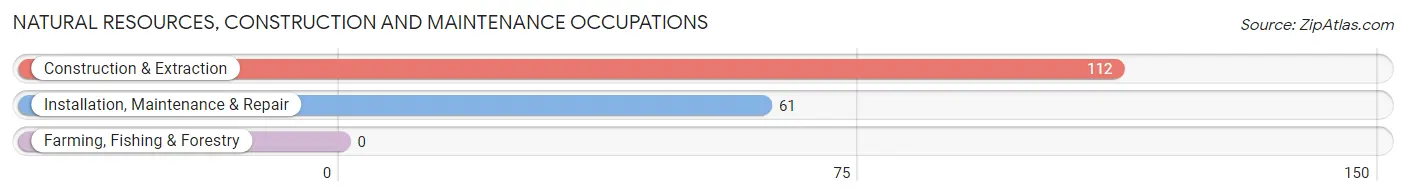
Natural Resources, Construction and Maintenance Occupations
The most common Natural Resources, Construction and Maintenance occupations in Ontario are Construction & Extraction (112 | 10.7%), and Installation, Maintenance & Repair (61 | 5.8%).
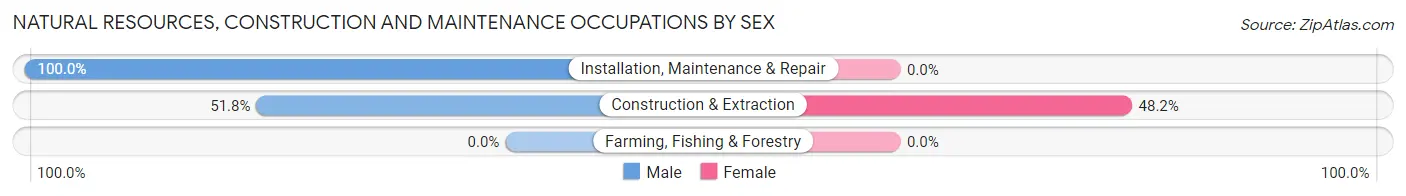
Natural Resources, Construction and Maintenance Occupations by Sex
| Occupation | Male | Female |
| Farming, Fishing & Forestry | 0 (0.0%) | 0 (0.0%) |
| Construction & Extraction | 58 (51.8%) | 54 (48.2%) |
| Installation, Maintenance & Repair | 61 (100.0%) | 0 (0.0%) |
| Total (Category) | 119 (68.8%) | 54 (31.2%) |
| Total (Overall) | 494 (47.0%) | 557 (53.0%) |
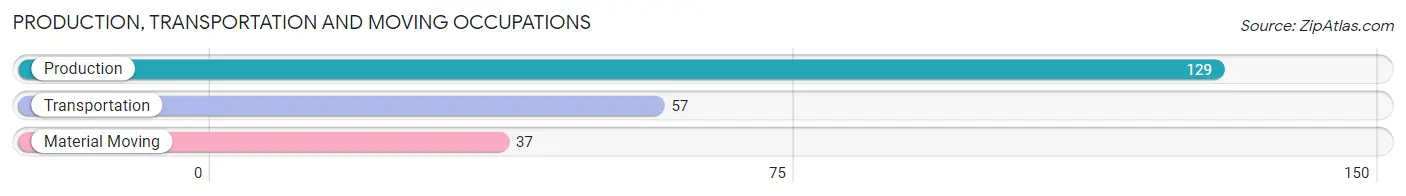
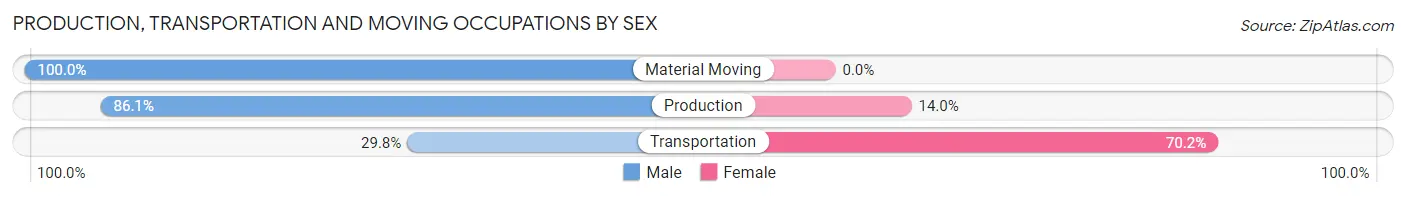
Production, Transportation and Moving Occupations
The most common Production, Transportation and Moving occupations in Ontario are Production (129 | 12.3%), Transportation (57 | 5.4%), and Material Moving (37 | 3.5%).
Production, Transportation and Moving Occupations by Sex
| Occupation | Male | Female |
| Production | 111 (86.1%) | 18 (14.0%) |
| Transportation | 17 (29.8%) | 40 (70.2%) |
| Material Moving | 37 (100.0%) | 0 (0.0%) |
| Total (Category) | 165 (74.0%) | 58 (26.0%) |
| Total (Overall) | 494 (47.0%) | 557 (53.0%) |
Employment Industries by Sex in Ontario
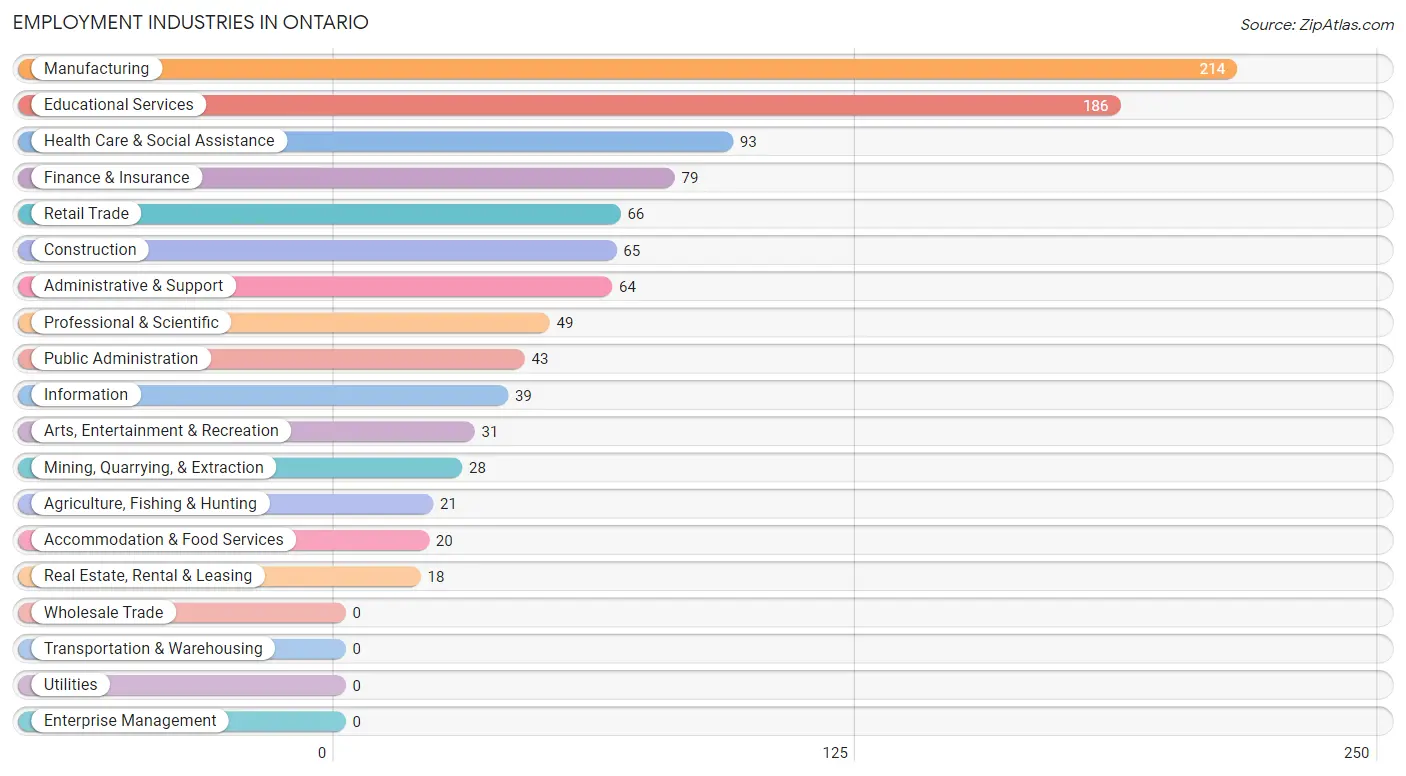
Employment Industries in Ontario
The major employment industries in Ontario include Manufacturing (214 | 20.4%), Educational Services (186 | 17.7%), Health Care & Social Assistance (93 | 8.8%), Finance & Insurance (79 | 7.5%), and Retail Trade (66 | 6.3%).
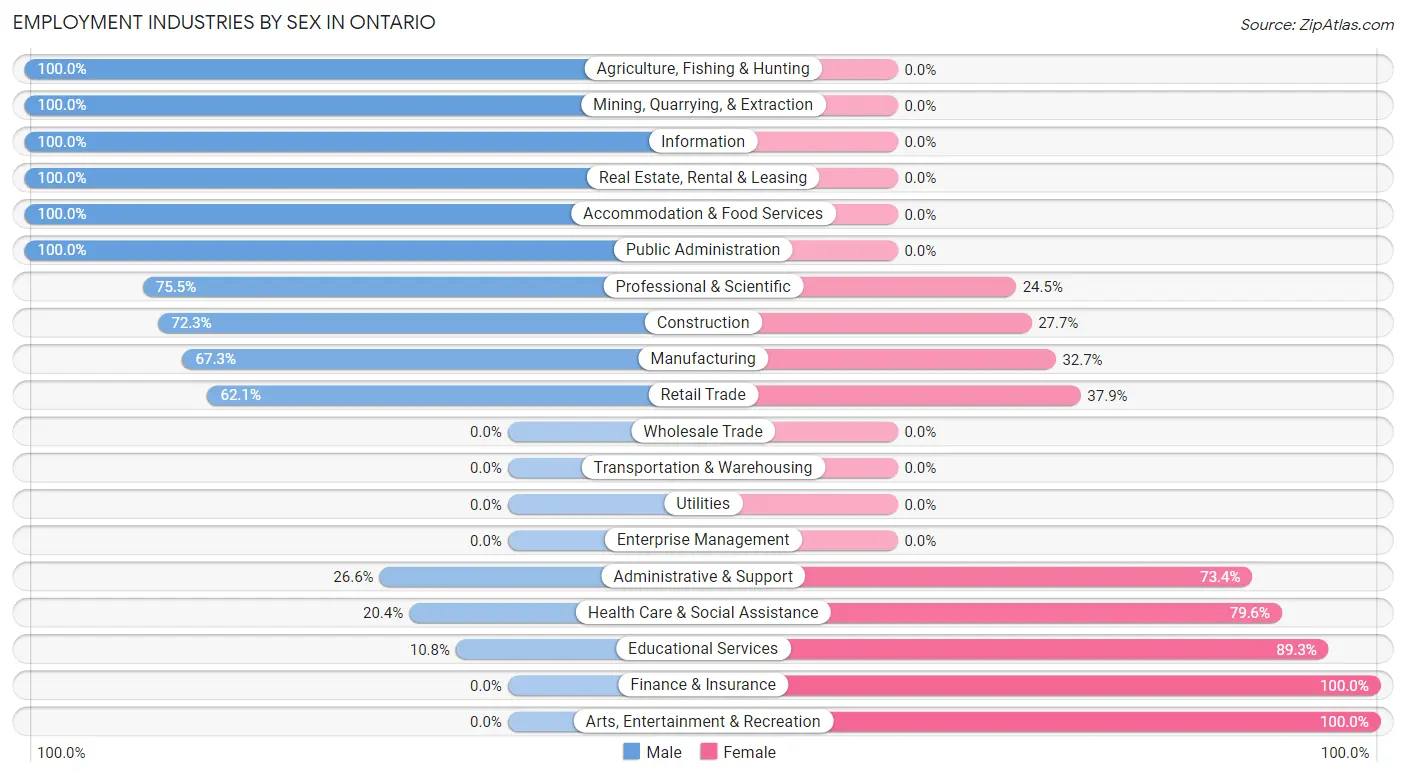
Employment Industries by Sex in Ontario
The Ontario industries that see more men than women are Agriculture, Fishing & Hunting (100.0%), Mining, Quarrying, & Extraction (100.0%), and Information (100.0%), whereas the industries that tend to have a higher number of women are Finance & Insurance (100.0%), Arts, Entertainment & Recreation (100.0%), and Educational Services (89.2%).
| Industry | Male | Female |
| Agriculture, Fishing & Hunting | 21 (100.0%) | 0 (0.0%) |
| Mining, Quarrying, & Extraction | 28 (100.0%) | 0 (0.0%) |
| Construction | 47 (72.3%) | 18 (27.7%) |
| Manufacturing | 144 (67.3%) | 70 (32.7%) |
| Wholesale Trade | 0 (0.0%) | 0 (0.0%) |
| Retail Trade | 41 (62.1%) | 25 (37.9%) |
| Transportation & Warehousing | 0 (0.0%) | 0 (0.0%) |
| Utilities | 0 (0.0%) | 0 (0.0%) |
| Information | 39 (100.0%) | 0 (0.0%) |
| Finance & Insurance | 0 (0.0%) | 79 (100.0%) |
| Real Estate, Rental & Leasing | 18 (100.0%) | 0 (0.0%) |
| Professional & Scientific | 37 (75.5%) | 12 (24.5%) |
| Enterprise Management | 0 (0.0%) | 0 (0.0%) |
| Administrative & Support | 17 (26.6%) | 47 (73.4%) |
| Educational Services | 20 (10.7%) | 166 (89.2%) |
| Health Care & Social Assistance | 19 (20.4%) | 74 (79.6%) |
| Arts, Entertainment & Recreation | 0 (0.0%) | 31 (100.0%) |
| Accommodation & Food Services | 20 (100.0%) | 0 (0.0%) |
| Public Administration | 43 (100.0%) | 0 (0.0%) |
| Total | 494 (47.0%) | 557 (53.0%) |
Education in Ontario
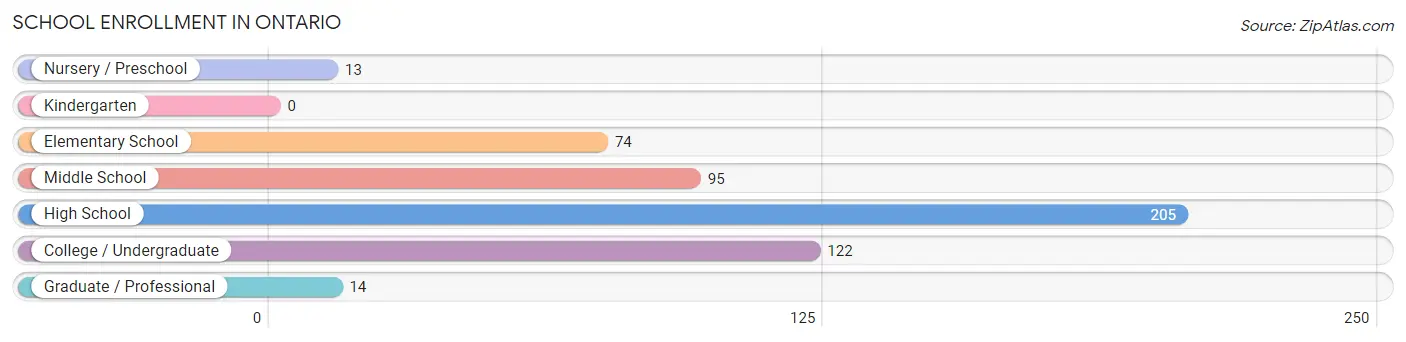
School Enrollment in Ontario
The most common levels of schooling among the 523 students in Ontario are high school (205 | 39.2%), college / undergraduate (122 | 23.3%), and middle school (95 | 18.2%).
| School Level | # Students | % Students |
| Nursery / Preschool | 13 | 2.5% |
| Kindergarten | 0 | 0.0% |
| Elementary School | 74 | 14.1% |
| Middle School | 95 | 18.2% |
| High School | 205 | 39.2% |
| College / Undergraduate | 122 | 23.3% |
| Graduate / Professional | 14 | 2.7% |
| Total | 523 | 100.0% |
School Enrollment by Age by Funding Source in Ontario
Out of a total of 523 students who are enrolled in schools in Ontario, 218 (41.7%) attend a private institution, while the remaining 305 (58.3%) are enrolled in public schools. The age group of 3 to 4 year olds has the highest likelihood of being enrolled in private schools, with 13 (100.0% in the age bracket) enrolled. Conversely, the age group of 15 to 17 year olds has the lowest likelihood of being enrolled in a private school, with 134 (85.4% in the age bracket) attending a public institution.
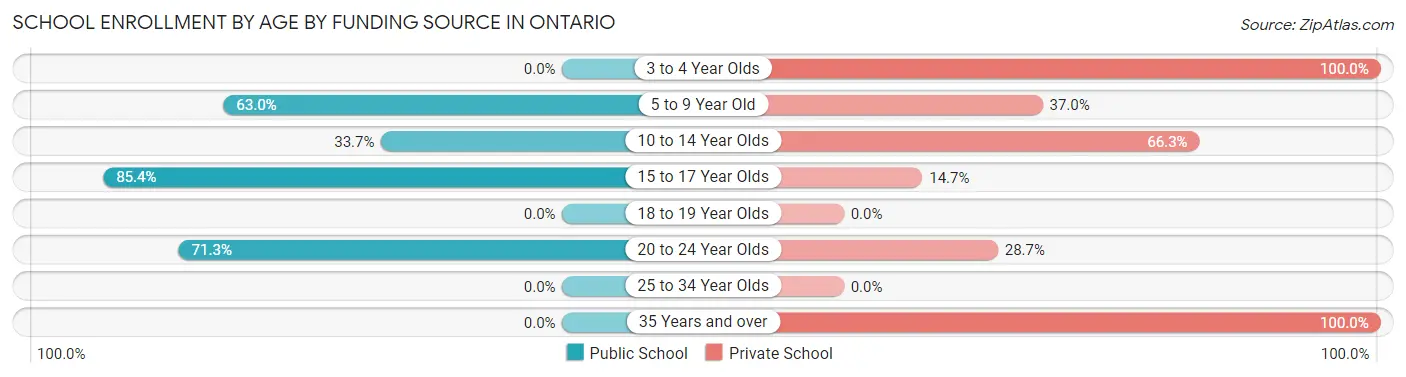
| Age Bracket | Public School | Private School |
| 3 to 4 Year Olds | 0 (0.0%) | 13 (100.0%) |
| 5 to 9 Year Old | 34 (63.0%) | 20 (37.0%) |
| 10 to 14 Year Olds | 55 (33.7%) | 108 (66.3%) |
| 15 to 17 Year Olds | 134 (85.4%) | 23 (14.6%) |
| 18 to 19 Year Olds | 0 (0.0%) | 0 (0.0%) |
| 20 to 24 Year Olds | 82 (71.3%) | 33 (28.7%) |
| 25 to 34 Year Olds | 0 (0.0%) | 0 (0.0%) |
| 35 Years and over | 0 (0.0%) | 21 (100.0%) |
| Total | 305 (58.3%) | 218 (41.7%) |
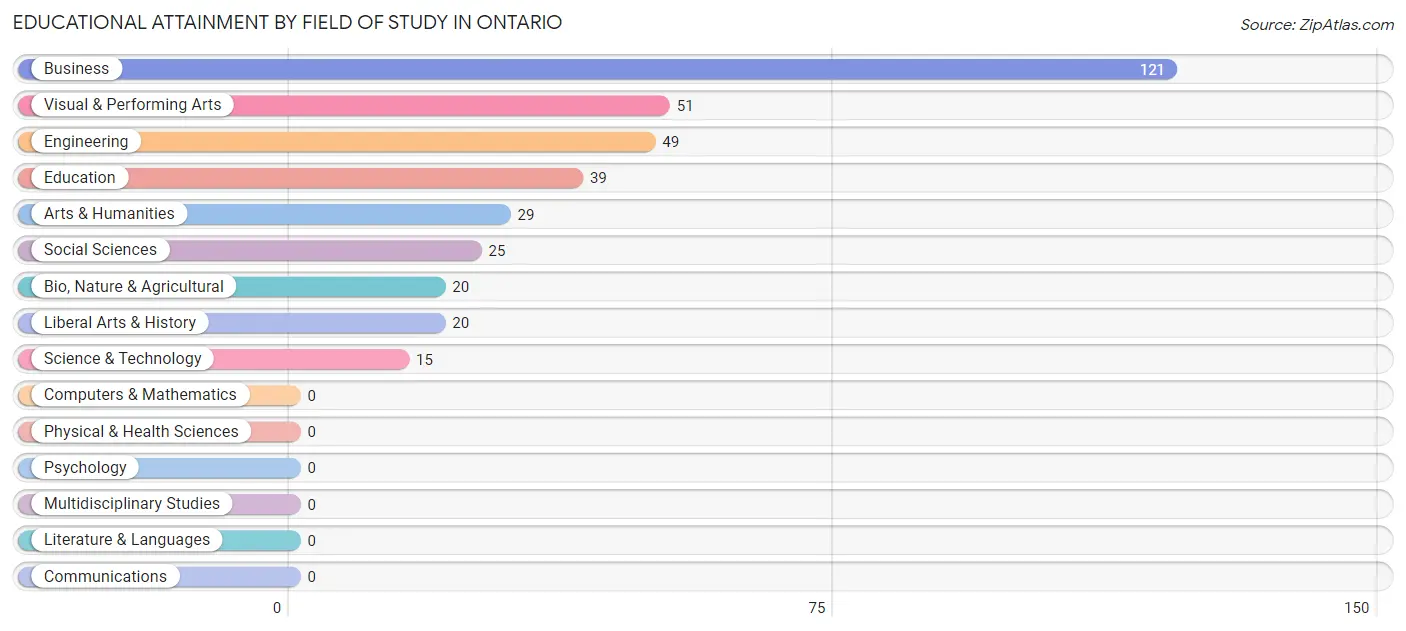
Educational Attainment by Field of Study in Ontario
Business (121 | 32.8%), visual & performing arts (51 | 13.8%), engineering (49 | 13.3%), education (39 | 10.6%), and arts & humanities (29 | 7.9%) are the most common fields of study among 369 individuals in Ontario who have obtained a bachelor's degree or higher.
| Field of Study | # Graduates | % Graduates |
| Computers & Mathematics | 0 | 0.0% |
| Bio, Nature & Agricultural | 20 | 5.4% |
| Physical & Health Sciences | 0 | 0.0% |
| Psychology | 0 | 0.0% |
| Social Sciences | 25 | 6.8% |
| Engineering | 49 | 13.3% |
| Multidisciplinary Studies | 0 | 0.0% |
| Science & Technology | 15 | 4.1% |
| Business | 121 | 32.8% |
| Education | 39 | 10.6% |
| Literature & Languages | 0 | 0.0% |
| Liberal Arts & History | 20 | 5.4% |
| Visual & Performing Arts | 51 | 13.8% |
| Communications | 0 | 0.0% |
| Arts & Humanities | 29 | 7.9% |
| Total | 369 | 100.0% |
Transportation & Commute in Ontario
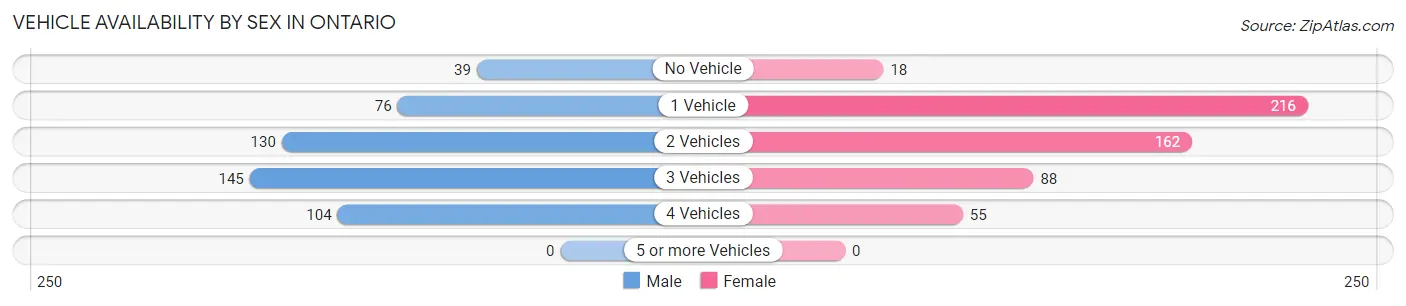
Vehicle Availability by Sex in Ontario
The most prevalent vehicle ownership categories in Ontario are males with 3 vehicles (145, accounting for 29.3%) and females with 3 vehicles (88, making up 26.9%).
| Vehicles Available | Male | Female |
| No Vehicle | 39 (7.9%) | 18 (3.3%) |
| 1 Vehicle | 76 (15.4%) | 216 (40.1%) |
| 2 Vehicles | 130 (26.3%) | 162 (30.1%) |
| 3 Vehicles | 145 (29.3%) | 88 (16.3%) |
| 4 Vehicles | 104 (21.0%) | 55 (10.2%) |
| 5 or more Vehicles | 0 (0.0%) | 0 (0.0%) |
| Total | 494 (100.0%) | 539 (100.0%) |
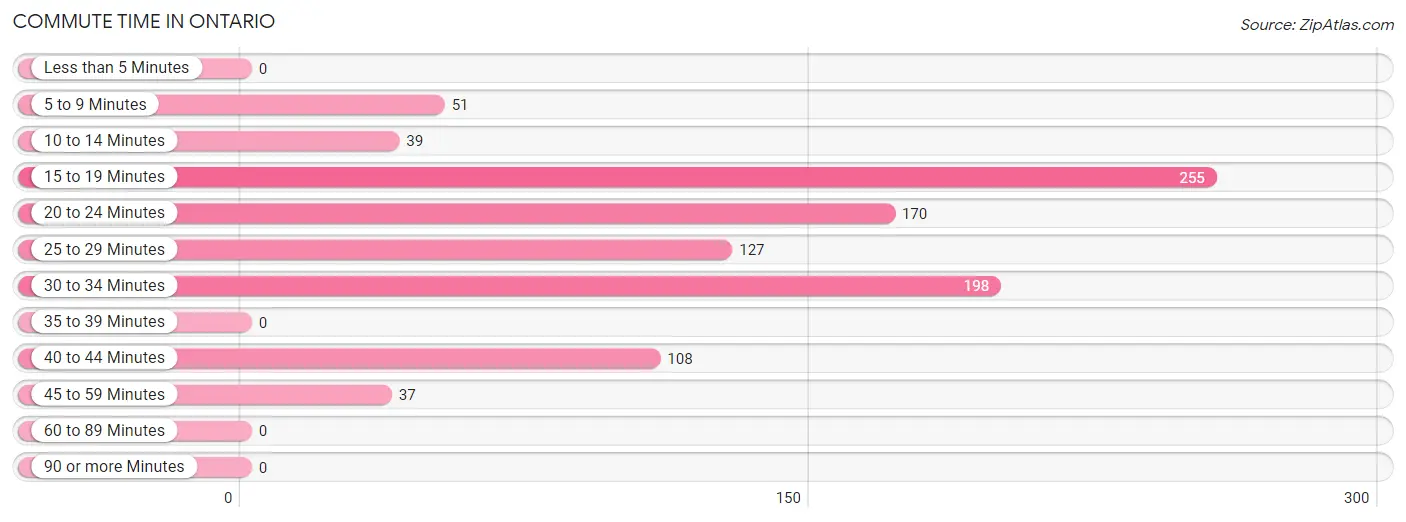
Commute Time in Ontario
The most frequently occuring commute durations in Ontario are 15 to 19 minutes (255 commuters, 25.9%), 30 to 34 minutes (198 commuters, 20.1%), and 20 to 24 minutes (170 commuters, 17.3%).
| Commute Time | # Commuters | % Commuters |
| Less than 5 Minutes | 0 | 0.0% |
| 5 to 9 Minutes | 51 | 5.2% |
| 10 to 14 Minutes | 39 | 4.0% |
| 15 to 19 Minutes | 255 | 25.9% |
| 20 to 24 Minutes | 170 | 17.3% |
| 25 to 29 Minutes | 127 | 12.9% |
| 30 to 34 Minutes | 198 | 20.1% |
| 35 to 39 Minutes | 0 | 0.0% |
| 40 to 44 Minutes | 108 | 11.0% |
| 45 to 59 Minutes | 37 | 3.8% |
| 60 to 89 Minutes | 0 | 0.0% |
| 90 or more Minutes | 0 | 0.0% |
Commute Time by Sex in Ontario
The most common commute times in Ontario are 15 to 19 minutes (215 commuters, 44.6%) for males and 30 to 34 minutes (124 commuters, 24.6%) for females.
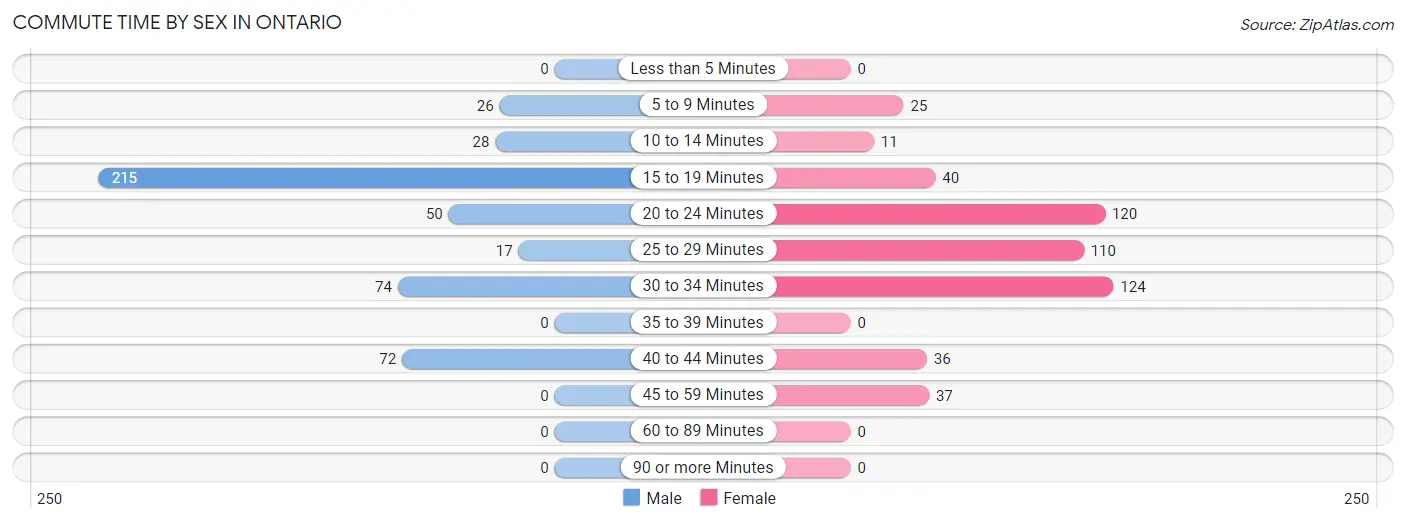
| Commute Time | Male | Female |
| Less than 5 Minutes | 0 (0.0%) | 0 (0.0%) |
| 5 to 9 Minutes | 26 (5.4%) | 25 (5.0%) |
| 10 to 14 Minutes | 28 (5.8%) | 11 (2.2%) |
| 15 to 19 Minutes | 215 (44.6%) | 40 (8.0%) |
| 20 to 24 Minutes | 50 (10.4%) | 120 (23.9%) |
| 25 to 29 Minutes | 17 (3.5%) | 110 (21.9%) |
| 30 to 34 Minutes | 74 (15.3%) | 124 (24.6%) |
| 35 to 39 Minutes | 0 (0.0%) | 0 (0.0%) |
| 40 to 44 Minutes | 72 (14.9%) | 36 (7.2%) |
| 45 to 59 Minutes | 0 (0.0%) | 37 (7.4%) |
| 60 to 89 Minutes | 0 (0.0%) | 0 (0.0%) |
| 90 or more Minutes | 0 (0.0%) | 0 (0.0%) |
Time of Departure to Work by Sex in Ontario
The most frequent times of departure to work in Ontario are 7:30 AM to 7:59 AM (100, 20.7%) for males and 7:00 AM to 7:29 AM (160, 31.8%) for females.
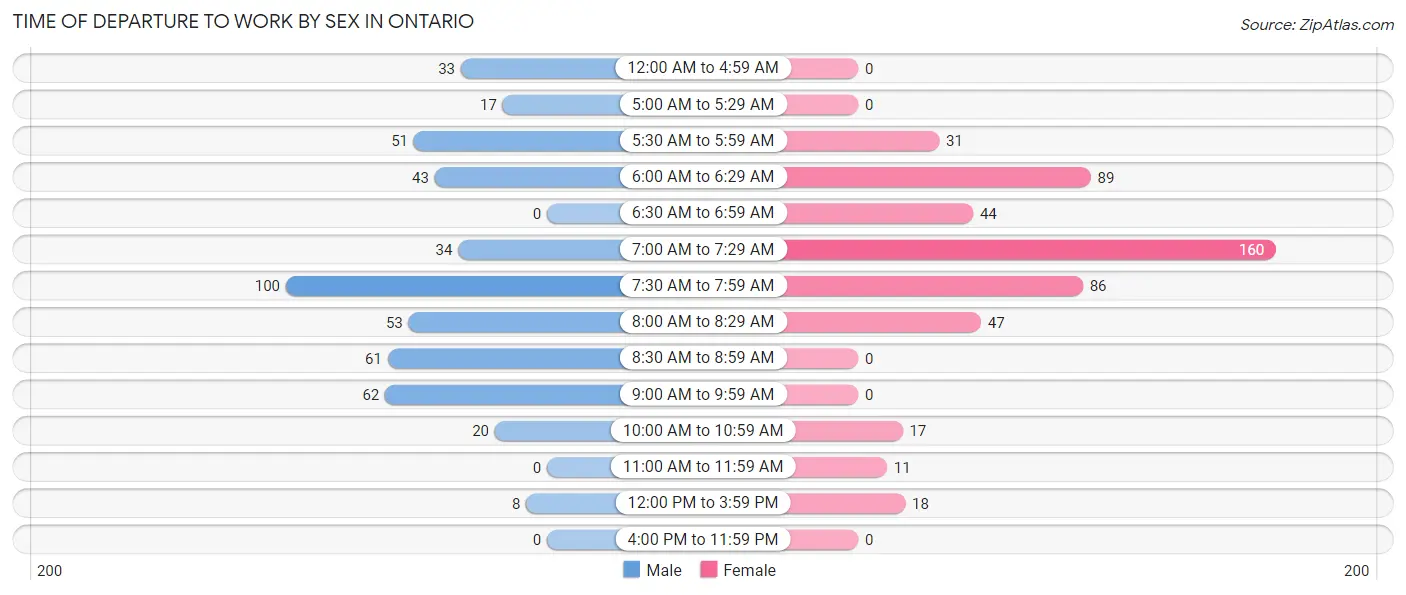
| Time of Departure | Male | Female |
| 12:00 AM to 4:59 AM | 33 (6.9%) | 0 (0.0%) |
| 5:00 AM to 5:29 AM | 17 (3.5%) | 0 (0.0%) |
| 5:30 AM to 5:59 AM | 51 (10.6%) | 31 (6.2%) |
| 6:00 AM to 6:29 AM | 43 (8.9%) | 89 (17.7%) |
| 6:30 AM to 6:59 AM | 0 (0.0%) | 44 (8.7%) |
| 7:00 AM to 7:29 AM | 34 (7.0%) | 160 (31.8%) |
| 7:30 AM to 7:59 AM | 100 (20.7%) | 86 (17.1%) |
| 8:00 AM to 8:29 AM | 53 (11.0%) | 47 (9.3%) |
| 8:30 AM to 8:59 AM | 61 (12.7%) | 0 (0.0%) |
| 9:00 AM to 9:59 AM | 62 (12.9%) | 0 (0.0%) |
| 10:00 AM to 10:59 AM | 20 (4.2%) | 17 (3.4%) |
| 11:00 AM to 11:59 AM | 0 (0.0%) | 11 (2.2%) |
| 12:00 PM to 3:59 PM | 8 (1.7%) | 18 (3.6%) |
| 4:00 PM to 11:59 PM | 0 (0.0%) | 0 (0.0%) |
| Total | 482 (100.0%) | 503 (100.0%) |
Housing Occupancy in Ontario
Occupancy by Ownership in Ontario
Of the total 1,035 dwellings in Ontario, owner-occupied units account for 581 (56.1%), while renter-occupied units make up 454 (43.9%).
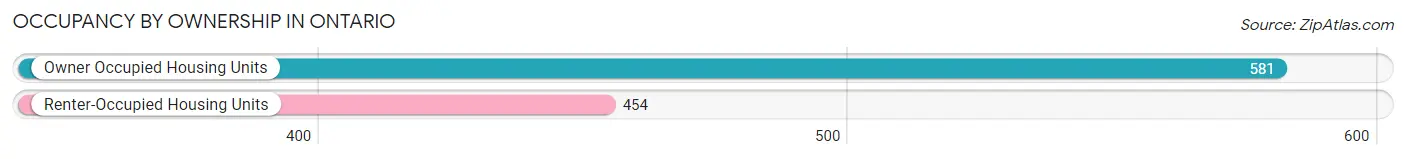
| Occupancy | # Housing Units | % Housing Units |
| Owner Occupied Housing Units | 581 | 56.1% |
| Renter-Occupied Housing Units | 454 | 43.9% |
| Total Occupied Housing Units | 1,035 | 100.0% |
Occupancy by Household Size in Ontario
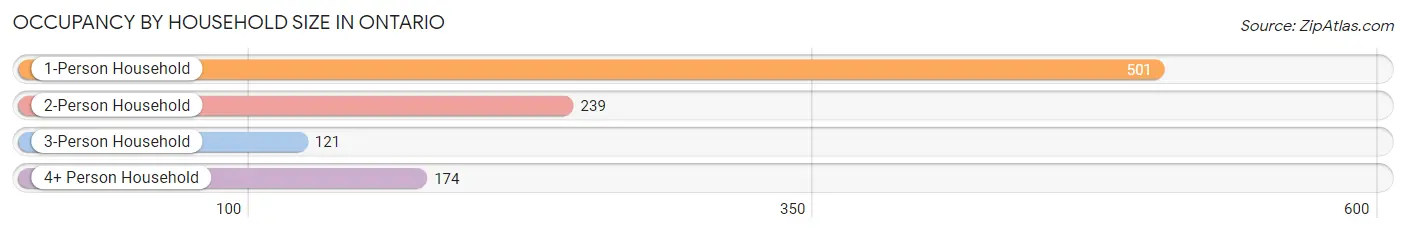
| Household Size | # Housing Units | % Housing Units |
| 1-Person Household | 501 | 48.4% |
| 2-Person Household | 239 | 23.1% |
| 3-Person Household | 121 | 11.7% |
| 4+ Person Household | 174 | 16.8% |
| Total Housing Units | 1,035 | 100.0% |
Occupancy by Ownership by Household Size in Ontario
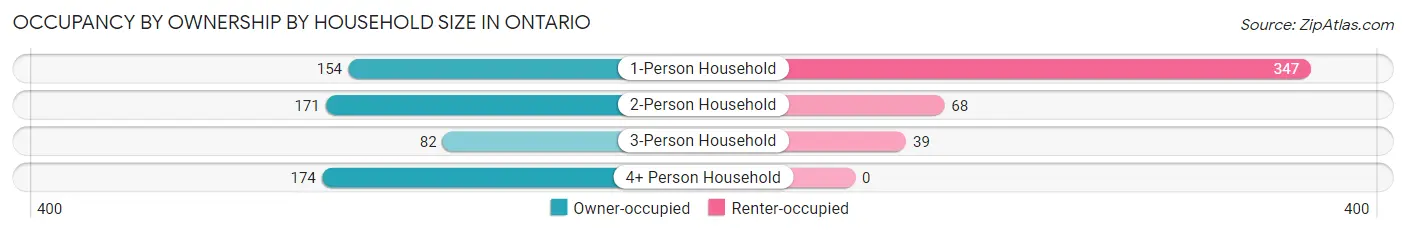
| Household Size | Owner-occupied | Renter-occupied |
| 1-Person Household | 154 (30.7%) | 347 (69.3%) |
| 2-Person Household | 171 (71.6%) | 68 (28.4%) |
| 3-Person Household | 82 (67.8%) | 39 (32.2%) |
| 4+ Person Household | 174 (100.0%) | 0 (0.0%) |
| Total Housing Units | 581 (56.1%) | 454 (43.9%) |
Occupancy by Educational Attainment in Ontario
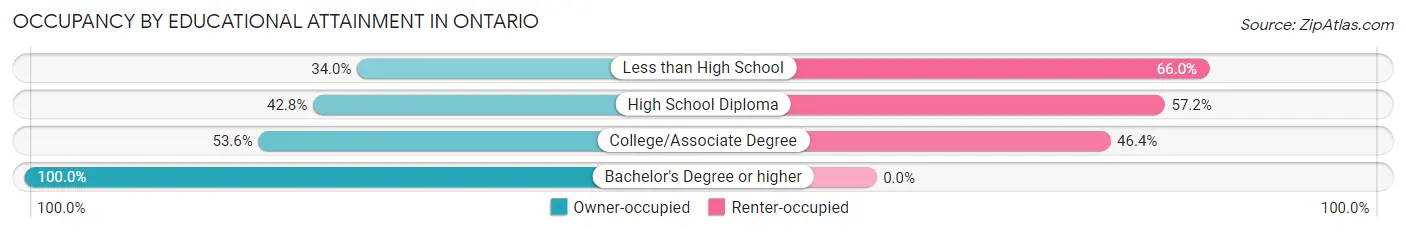
| Household Size | Owner-occupied | Renter-occupied |
| Less than High School | 32 (34.0%) | 62 (66.0%) |
| High School Diploma | 149 (42.8%) | 199 (57.2%) |
| College/Associate Degree | 223 (53.6%) | 193 (46.4%) |
| Bachelor's Degree or higher | 177 (100.0%) | 0 (0.0%) |
Occupancy by Age of Householder in Ontario
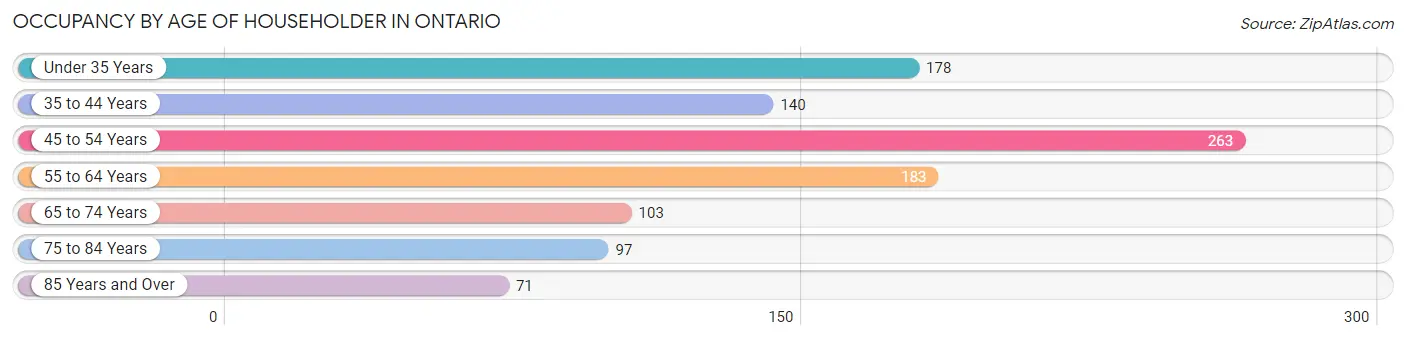
| Age Bracket | # Households | % Households |
| Under 35 Years | 178 | 17.2% |
| 35 to 44 Years | 140 | 13.5% |
| 45 to 54 Years | 263 | 25.4% |
| 55 to 64 Years | 183 | 17.7% |
| 65 to 74 Years | 103 | 10.0% |
| 75 to 84 Years | 97 | 9.4% |
| 85 Years and Over | 71 | 6.9% |
| Total | 1,035 | 100.0% |
Housing Finances in Ontario
Median Income by Occupancy in Ontario
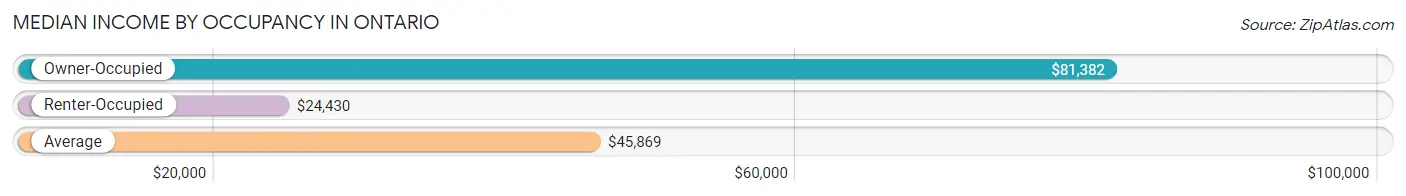
| Occupancy Type | # Households | Median Income |
| Owner-Occupied | 581 (56.1%) | $81,382 |
| Renter-Occupied | 454 (43.9%) | $24,430 |
| Average | 1,035 (100.0%) | $45,869 |
Occupancy by Householder Income Bracket in Ontario
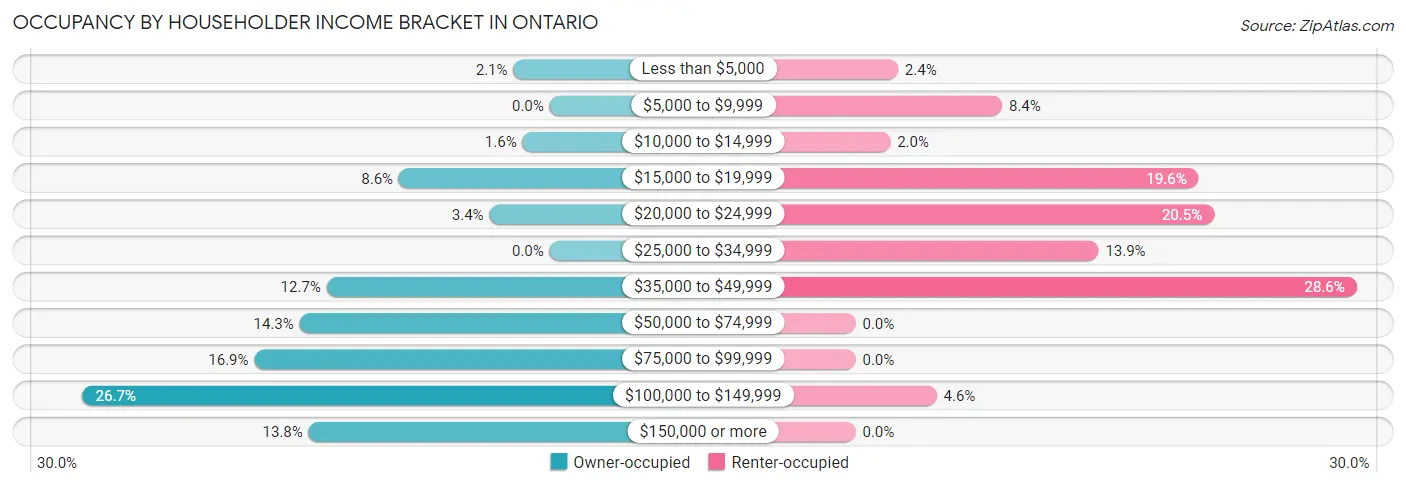
| Income Bracket | Owner-occupied | Renter-occupied |
| Less than $5,000 | 12 (2.1%) | 11 (2.4%) |
| $5,000 to $9,999 | 0 (0.0%) | 38 (8.4%) |
| $10,000 to $14,999 | 9 (1.5%) | 9 (2.0%) |
| $15,000 to $19,999 | 50 (8.6%) | 89 (19.6%) |
| $20,000 to $24,999 | 20 (3.4%) | 93 (20.5%) |
| $25,000 to $34,999 | 0 (0.0%) | 63 (13.9%) |
| $35,000 to $49,999 | 74 (12.7%) | 130 (28.6%) |
| $50,000 to $74,999 | 83 (14.3%) | 0 (0.0%) |
| $75,000 to $99,999 | 98 (16.9%) | 0 (0.0%) |
| $100,000 to $149,999 | 155 (26.7%) | 21 (4.6%) |
| $150,000 or more | 80 (13.8%) | 0 (0.0%) |
| Total | 581 (100.0%) | 454 (100.0%) |
Monthly Housing Cost Tiers in Ontario
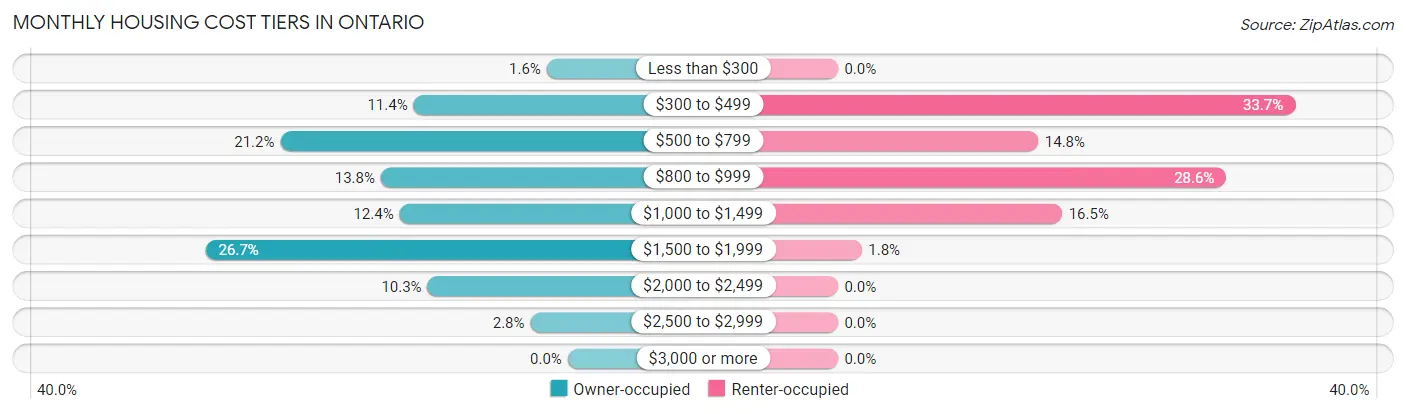
| Monthly Cost | Owner-occupied | Renter-occupied |
| Less than $300 | 9 (1.5%) | 0 (0.0%) |
| $300 to $499 | 66 (11.4%) | 153 (33.7%) |
| $500 to $799 | 123 (21.2%) | 67 (14.8%) |
| $800 to $999 | 80 (13.8%) | 130 (28.6%) |
| $1,000 to $1,499 | 72 (12.4%) | 75 (16.5%) |
| $1,500 to $1,999 | 155 (26.7%) | 8 (1.8%) |
| $2,000 to $2,499 | 60 (10.3%) | 0 (0.0%) |
| $2,500 to $2,999 | 16 (2.8%) | 0 (0.0%) |
| $3,000 or more | 0 (0.0%) | 0 (0.0%) |
| Total | 581 (100.0%) | 454 (100.0%) |
Physical Housing Characteristics in Ontario
Housing Structures in Ontario
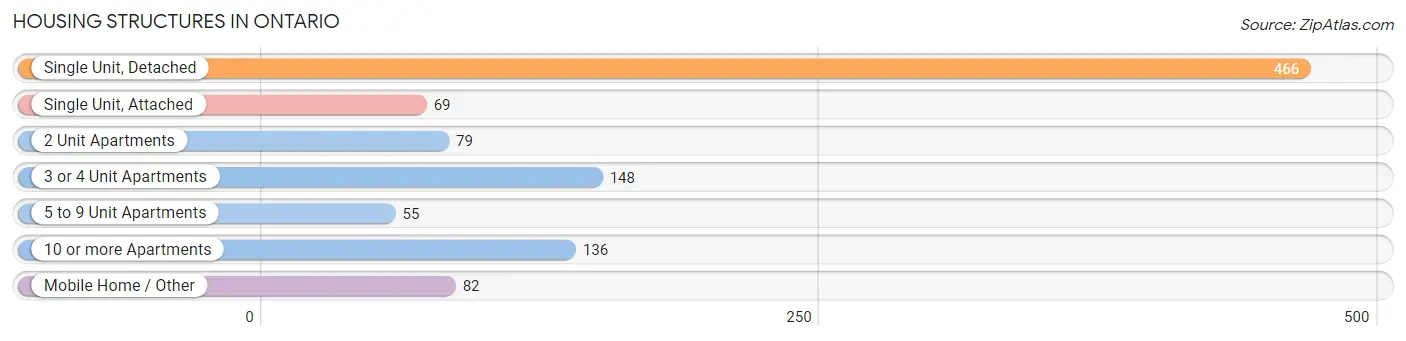
| Structure Type | # Housing Units | % Housing Units |
| Single Unit, Detached | 466 | 45.0% |
| Single Unit, Attached | 69 | 6.7% |
| 2 Unit Apartments | 79 | 7.6% |
| 3 or 4 Unit Apartments | 148 | 14.3% |
| 5 to 9 Unit Apartments | 55 | 5.3% |
| 10 or more Apartments | 136 | 13.1% |
| Mobile Home / Other | 82 | 7.9% |
| Total | 1,035 | 100.0% |
Housing Structures by Occupancy in Ontario
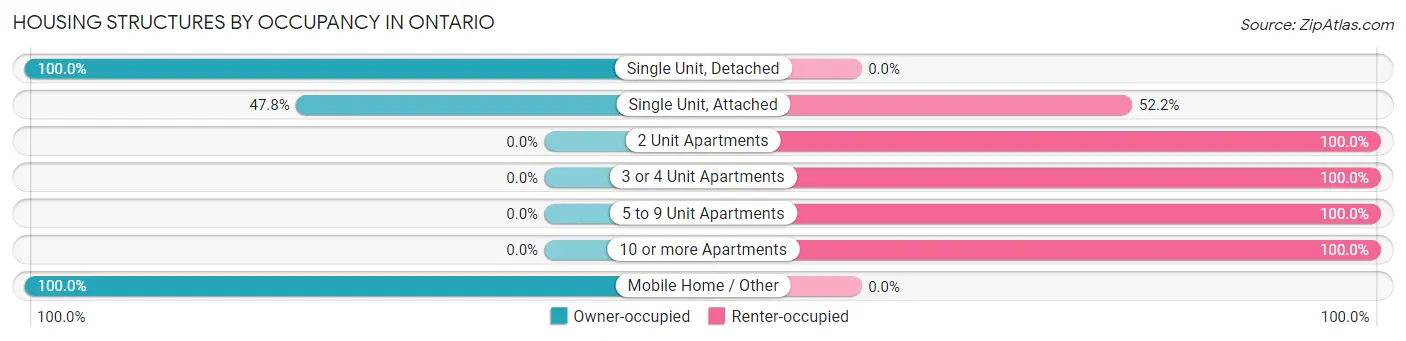
| Structure Type | Owner-occupied | Renter-occupied |
| Single Unit, Detached | 466 (100.0%) | 0 (0.0%) |
| Single Unit, Attached | 33 (47.8%) | 36 (52.2%) |
| 2 Unit Apartments | 0 (0.0%) | 79 (100.0%) |
| 3 or 4 Unit Apartments | 0 (0.0%) | 148 (100.0%) |
| 5 to 9 Unit Apartments | 0 (0.0%) | 55 (100.0%) |
| 10 or more Apartments | 0 (0.0%) | 136 (100.0%) |
| Mobile Home / Other | 82 (100.0%) | 0 (0.0%) |
| Total | 581 (56.1%) | 454 (43.9%) |
Housing Structures by Number of Rooms in Ontario
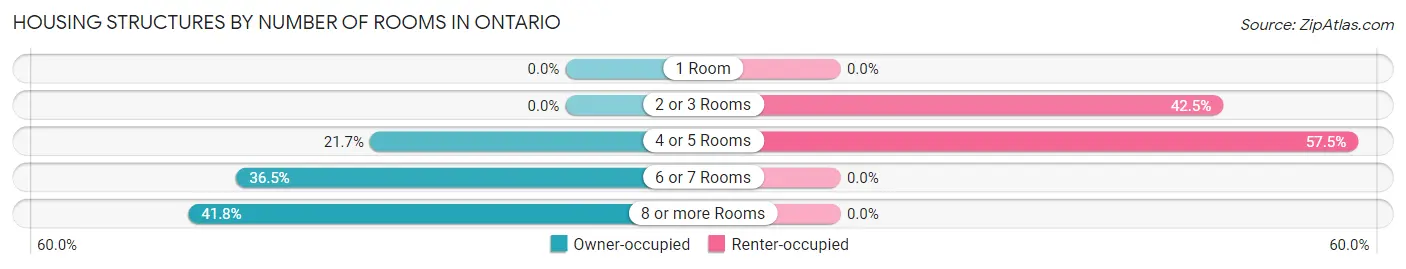
| Number of Rooms | Owner-occupied | Renter-occupied |
| 1 Room | 0 (0.0%) | 0 (0.0%) |
| 2 or 3 Rooms | 0 (0.0%) | 193 (42.5%) |
| 4 or 5 Rooms | 126 (21.7%) | 261 (57.5%) |
| 6 or 7 Rooms | 212 (36.5%) | 0 (0.0%) |
| 8 or more Rooms | 243 (41.8%) | 0 (0.0%) |
| Total | 581 (100.0%) | 454 (100.0%) |
Housing Structure by Heating Type in Ontario
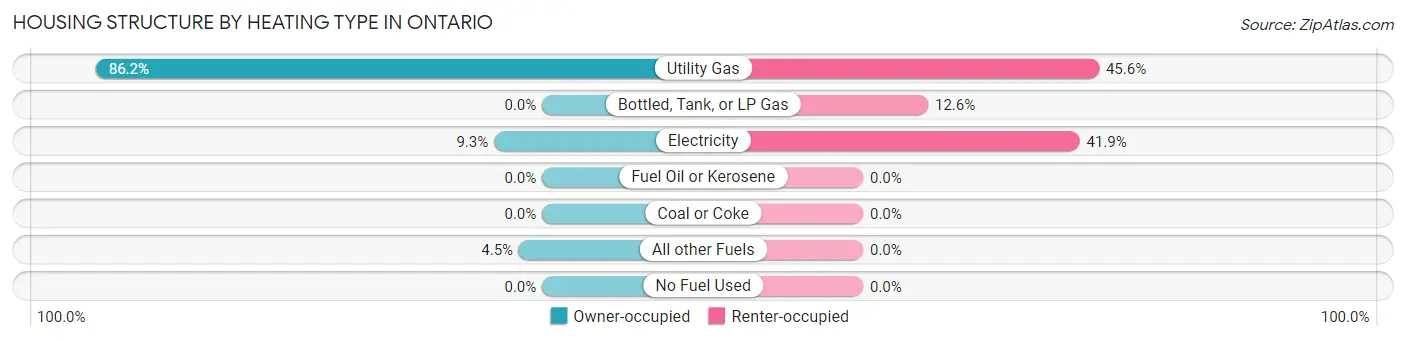
| Heating Type | Owner-occupied | Renter-occupied |
| Utility Gas | 501 (86.2%) | 207 (45.6%) |
| Bottled, Tank, or LP Gas | 0 (0.0%) | 57 (12.6%) |
| Electricity | 54 (9.3%) | 190 (41.8%) |
| Fuel Oil or Kerosene | 0 (0.0%) | 0 (0.0%) |
| Coal or Coke | 0 (0.0%) | 0 (0.0%) |
| All other Fuels | 26 (4.5%) | 0 (0.0%) |
| No Fuel Used | 0 (0.0%) | 0 (0.0%) |
| Total | 581 (100.0%) | 454 (100.0%) |
Household Vehicle Usage in Ontario
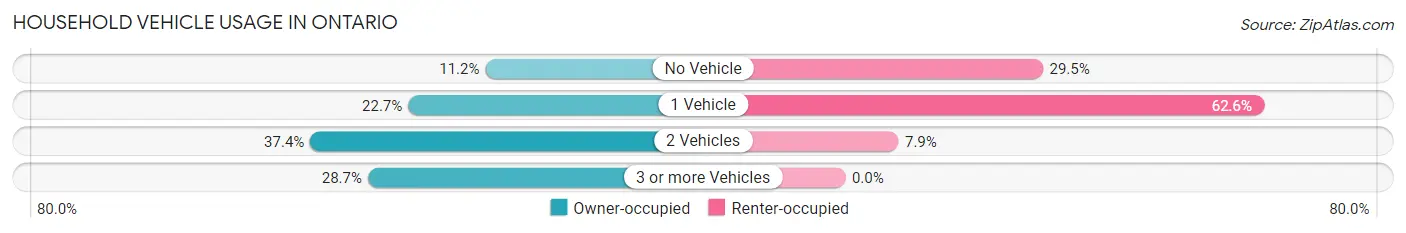
| Vehicles per Household | Owner-occupied | Renter-occupied |
| No Vehicle | 65 (11.2%) | 134 (29.5%) |
| 1 Vehicle | 132 (22.7%) | 284 (62.6%) |
| 2 Vehicles | 217 (37.3%) | 36 (7.9%) |
| 3 or more Vehicles | 167 (28.7%) | 0 (0.0%) |
| Total | 581 (100.0%) | 454 (100.0%) |
Real Estate & Mortgages in Ontario
Real Estate and Mortgage Overview in Ontario
| Characteristic | Without Mortgage | With Mortgage |
| Housing Units | 239 | 342 |
| Median Property Value | $144,500 | $180,200 |
| Median Household Income | $54,083 | $49 |
| Monthly Housing Costs | $640 | $0 |
| Real Estate Taxes | $3,250 | $0 |
Property Value by Mortgage Status in Ontario
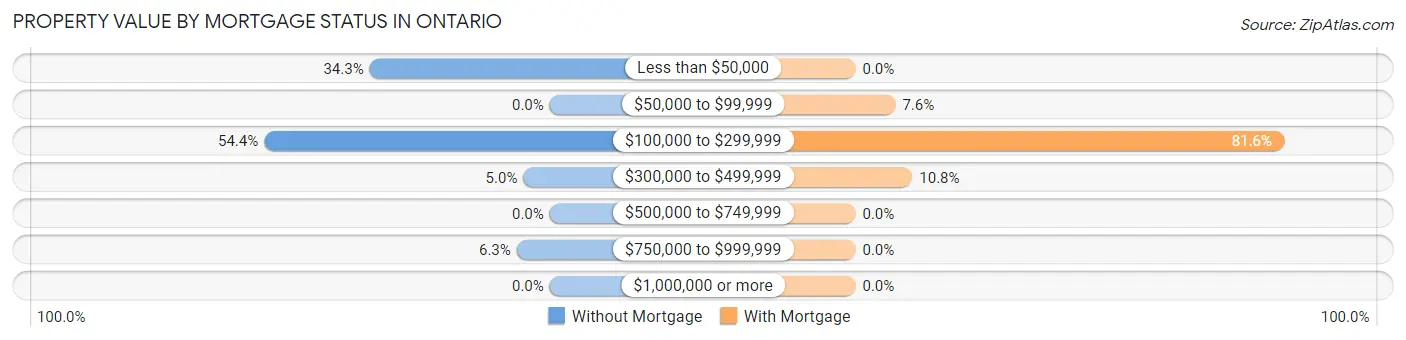
| Property Value | Without Mortgage | With Mortgage |
| Less than $50,000 | 82 (34.3%) | 0 (0.0%) |
| $50,000 to $99,999 | 0 (0.0%) | 26 (7.6%) |
| $100,000 to $299,999 | 130 (54.4%) | 279 (81.6%) |
| $300,000 to $499,999 | 12 (5.0%) | 37 (10.8%) |
| $500,000 to $749,999 | 0 (0.0%) | 0 (0.0%) |
| $750,000 to $999,999 | 15 (6.3%) | 0 (0.0%) |
| $1,000,000 or more | 0 (0.0%) | 0 (0.0%) |
| Total | 239 (100.0%) | 342 (100.0%) |
Household Income by Mortgage Status in Ontario
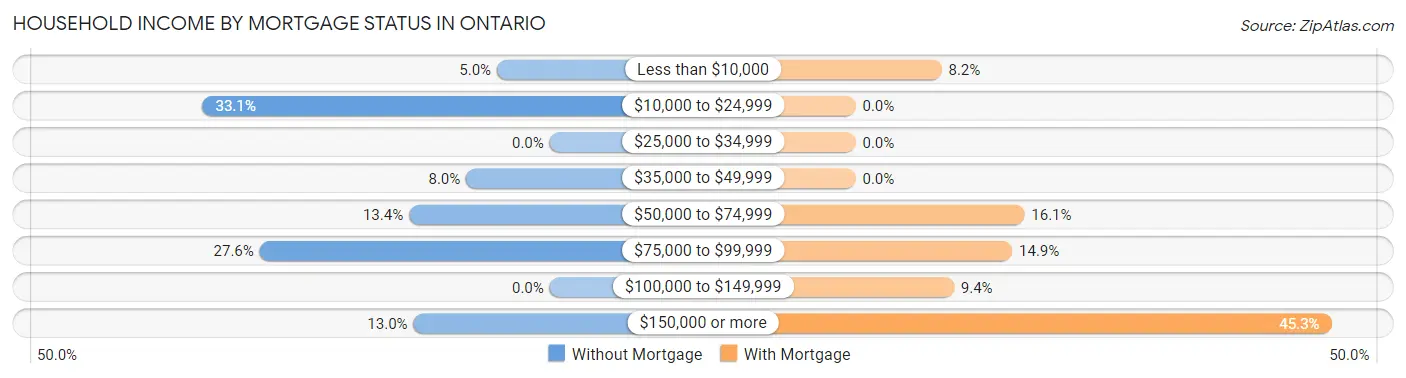
| Household Income | Without Mortgage | With Mortgage |
| Less than $10,000 | 12 (5.0%) | 28 (8.2%) |
| $10,000 to $24,999 | 79 (33.1%) | 0 (0.0%) |
| $25,000 to $34,999 | 0 (0.0%) | 0 (0.0%) |
| $35,000 to $49,999 | 19 (8.0%) | 0 (0.0%) |
| $50,000 to $74,999 | 32 (13.4%) | 55 (16.1%) |
| $75,000 to $99,999 | 66 (27.6%) | 51 (14.9%) |
| $100,000 to $149,999 | 0 (0.0%) | 32 (9.4%) |
| $150,000 or more | 31 (13.0%) | 155 (45.3%) |
| Total | 239 (100.0%) | 342 (100.0%) |
Property Value to Household Income Ratio in Ontario
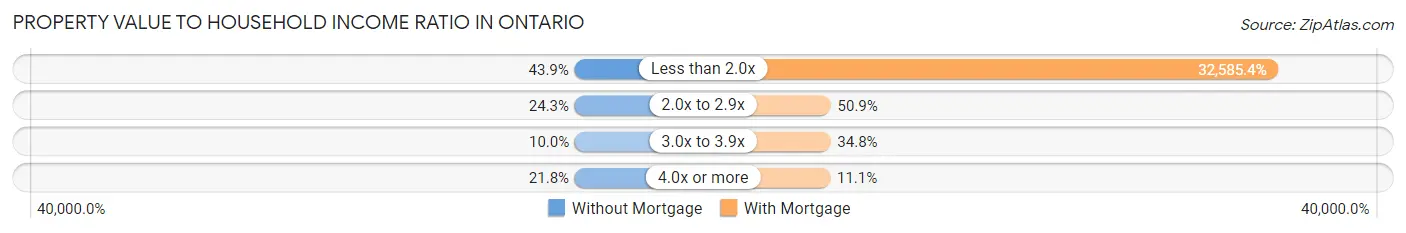
| Value-to-Income Ratio | Without Mortgage | With Mortgage |
| Less than 2.0x | 105 (43.9%) | 111,442 (32,585.4%) |
| 2.0x to 2.9x | 58 (24.3%) | 174 (50.9%) |
| 3.0x to 3.9x | 24 (10.0%) | 119 (34.8%) |
| 4.0x or more | 52 (21.8%) | 38 (11.1%) |
| Total | 239 (100.0%) | 342 (100.0%) |
Real Estate Taxes by Mortgage Status in Ontario
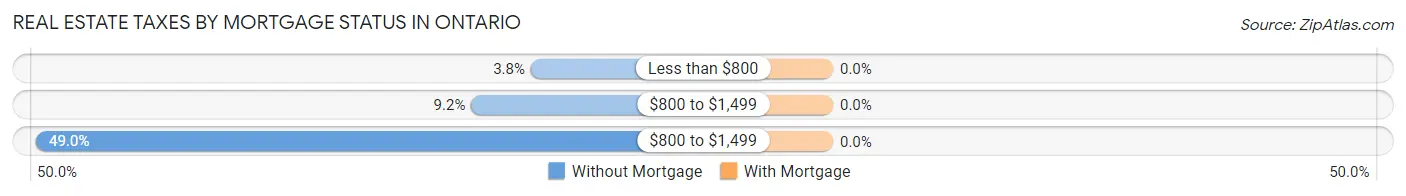
| Property Taxes | Without Mortgage | With Mortgage |
| Less than $800 | 9 (3.8%) | 0 (0.0%) |
| $800 to $1,499 | 22 (9.2%) | 0 (0.0%) |
| $800 to $1,499 | 117 (48.9%) | 0 (0.0%) |
| Total | 239 (100.0%) | 342 (100.0%) |
Health & Disability in Ontario
Health Insurance Coverage by Age in Ontario
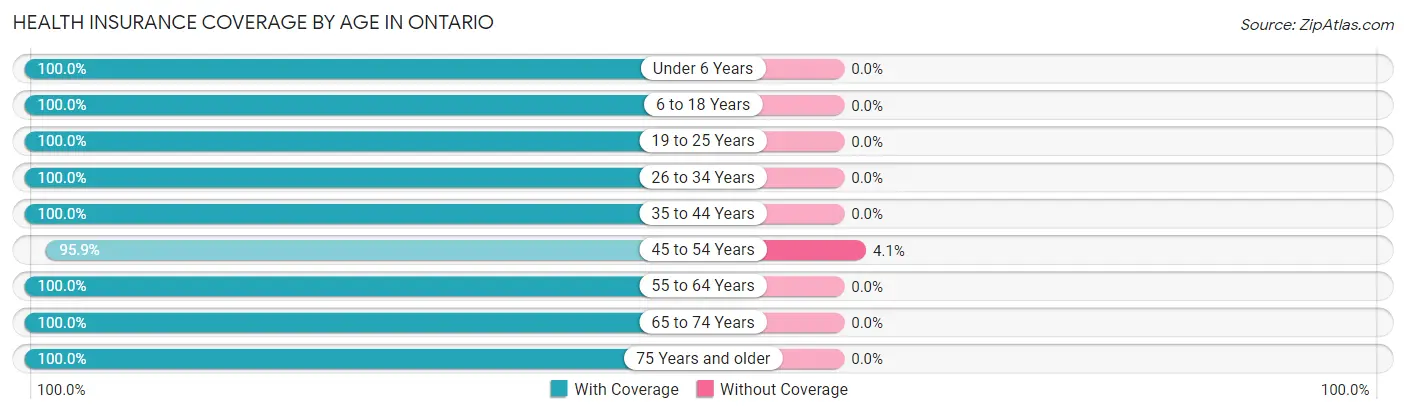
| Age Bracket | With Coverage | Without Coverage |
| Under 6 Years | 87 (100.0%) | 0 (0.0%) |
| 6 to 18 Years | 374 (100.0%) | 0 (0.0%) |
| 19 to 25 Years | 241 (100.0%) | 0 (0.0%) |
| 26 to 34 Years | 124 (100.0%) | 0 (0.0%) |
| 35 to 44 Years | 256 (100.0%) | 0 (0.0%) |
| 45 to 54 Years | 424 (95.9%) | 18 (4.1%) |
| 55 to 64 Years | 257 (100.0%) | 0 (0.0%) |
| 65 to 74 Years | 161 (100.0%) | 0 (0.0%) |
| 75 Years and older | 178 (100.0%) | 0 (0.0%) |
| Total | 2,102 (99.2%) | 18 (0.9%) |
Health Insurance Coverage by Citizenship Status in Ontario
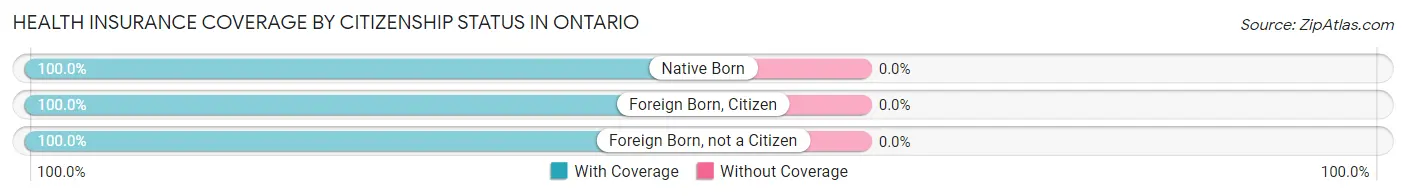
| Citizenship Status | With Coverage | Without Coverage |
| Native Born | 87 (100.0%) | 0 (0.0%) |
| Foreign Born, Citizen | 374 (100.0%) | 0 (0.0%) |
| Foreign Born, not a Citizen | 241 (100.0%) | 0 (0.0%) |
Health Insurance Coverage by Household Income in Ontario
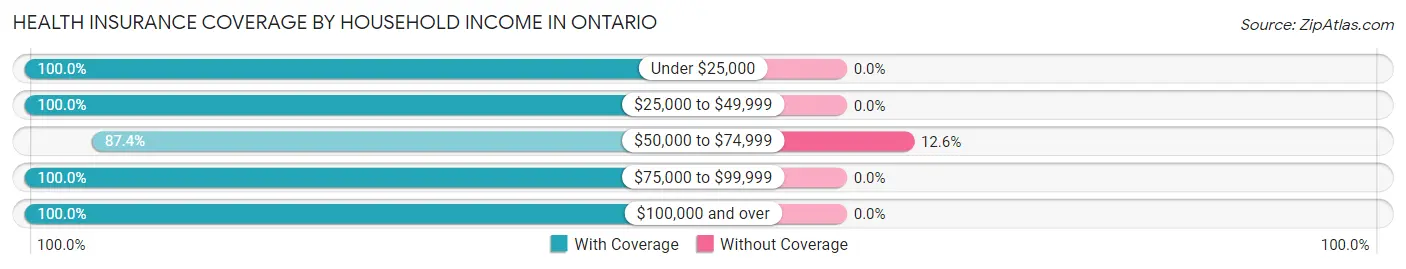
| Household Income | With Coverage | Without Coverage |
| Under $25,000 | 394 (100.0%) | 0 (0.0%) |
| $25,000 to $49,999 | 450 (100.0%) | 0 (0.0%) |
| $50,000 to $74,999 | 125 (87.4%) | 18 (12.6%) |
| $75,000 to $99,999 | 171 (100.0%) | 0 (0.0%) |
| $100,000 and over | 962 (100.0%) | 0 (0.0%) |
Public vs Private Health Insurance Coverage by Age in Ontario
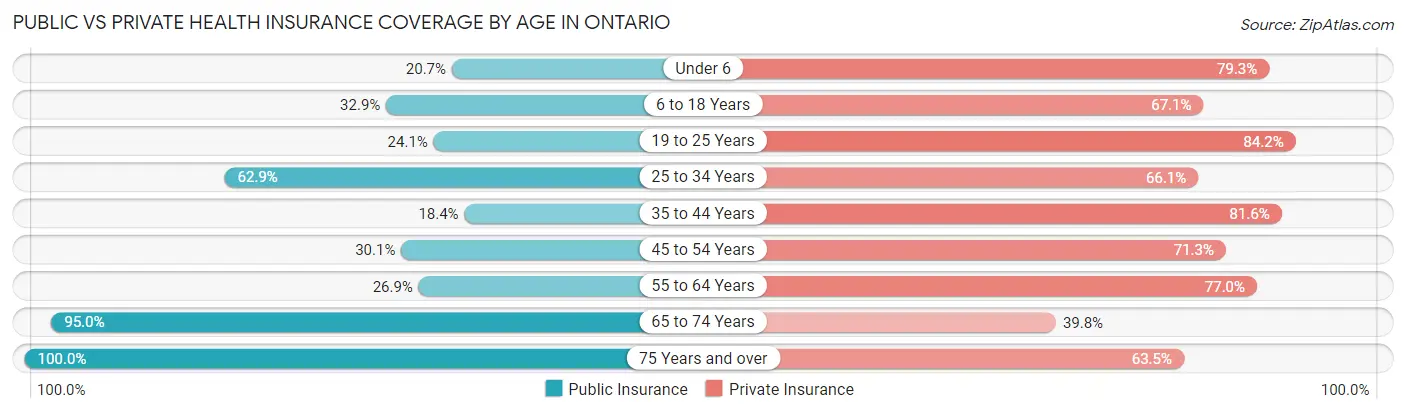
| Age Bracket | Public Insurance | Private Insurance |
| Under 6 | 18 (20.7%) | 69 (79.3%) |
| 6 to 18 Years | 123 (32.9%) | 251 (67.1%) |
| 19 to 25 Years | 58 (24.1%) | 203 (84.2%) |
| 25 to 34 Years | 78 (62.9%) | 82 (66.1%) |
| 35 to 44 Years | 47 (18.4%) | 209 (81.6%) |
| 45 to 54 Years | 133 (30.1%) | 315 (71.3%) |
| 55 to 64 Years | 69 (26.9%) | 198 (77.0%) |
| 65 to 74 Years | 153 (95.0%) | 64 (39.8%) |
| 75 Years and over | 178 (100.0%) | 113 (63.5%) |
| Total | 857 (40.4%) | 1,504 (70.9%) |
Disability Status by Sex by Age in Ontario
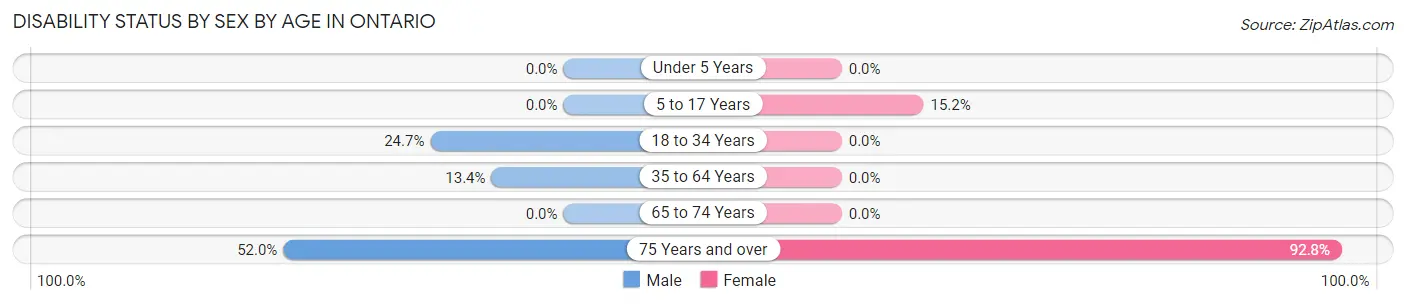
| Age Bracket | Male | Female |
| Under 5 Years | 0 (0.0%) | 0 (0.0%) |
| 5 to 17 Years | 0 (0.0%) | 34 (15.2%) |
| 18 to 34 Years | 42 (24.7%) | 0 (0.0%) |
| 35 to 64 Years | 60 (13.4%) | 0 (0.0%) |
| 65 to 74 Years | 0 (0.0%) | 0 (0.0%) |
| 75 Years and over | 13 (52.0%) | 142 (92.8%) |
Disability Class by Sex by Age in Ontario
Disability Class: Hearing Difficulty
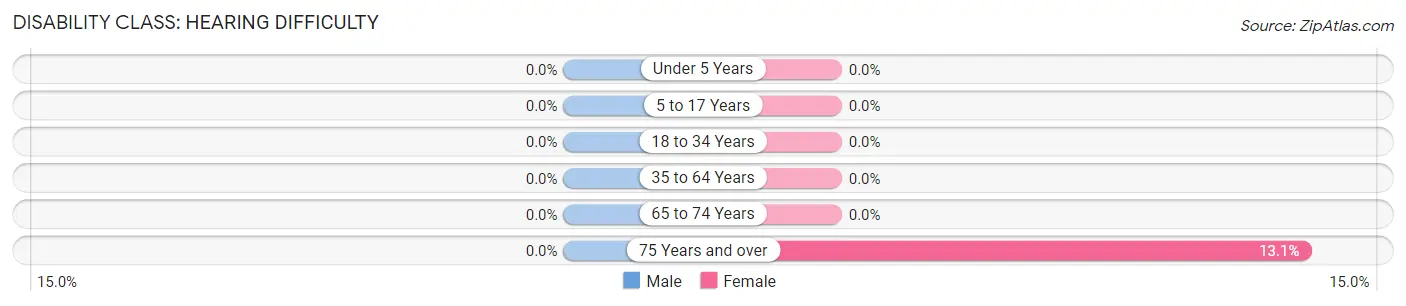
| Age Bracket | Male | Female |
| Under 5 Years | 0 (0.0%) | 0 (0.0%) |
| 5 to 17 Years | 0 (0.0%) | 0 (0.0%) |
| 18 to 34 Years | 0 (0.0%) | 0 (0.0%) |
| 35 to 64 Years | 0 (0.0%) | 0 (0.0%) |
| 65 to 74 Years | 0 (0.0%) | 0 (0.0%) |
| 75 Years and over | 0 (0.0%) | 20 (13.1%) |
Disability Class: Vision Difficulty
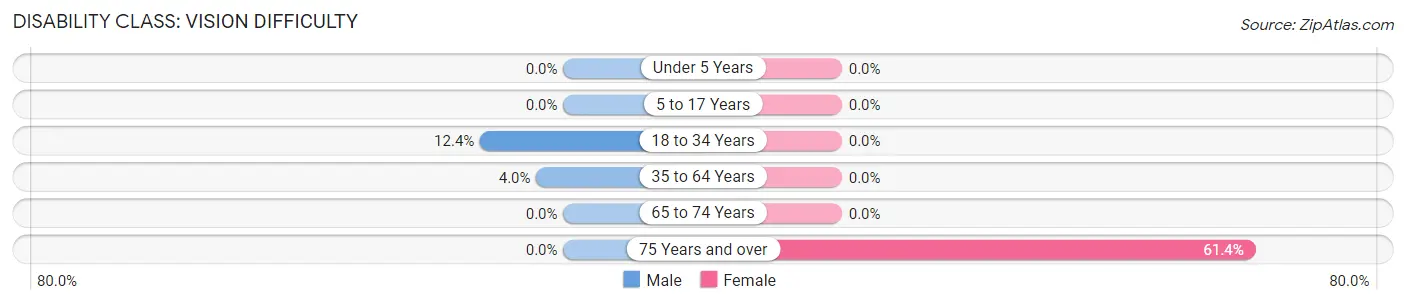
| Age Bracket | Male | Female |
| Under 5 Years | 0 (0.0%) | 0 (0.0%) |
| 5 to 17 Years | 0 (0.0%) | 0 (0.0%) |
| 18 to 34 Years | 21 (12.3%) | 0 (0.0%) |
| 35 to 64 Years | 18 (4.0%) | 0 (0.0%) |
| 65 to 74 Years | 0 (0.0%) | 0 (0.0%) |
| 75 Years and over | 0 (0.0%) | 94 (61.4%) |
Disability Class: Cognitive Difficulty
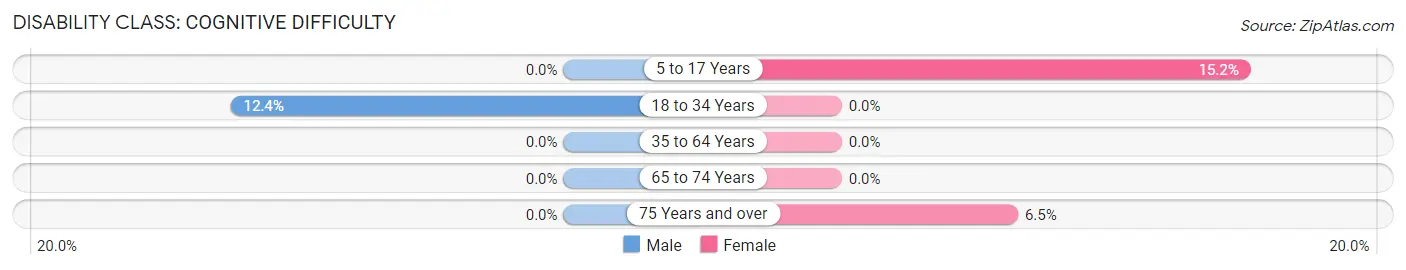
| Age Bracket | Male | Female |
| 5 to 17 Years | 0 (0.0%) | 34 (15.2%) |
| 18 to 34 Years | 21 (12.3%) | 0 (0.0%) |
| 35 to 64 Years | 0 (0.0%) | 0 (0.0%) |
| 65 to 74 Years | 0 (0.0%) | 0 (0.0%) |
| 75 Years and over | 0 (0.0%) | 10 (6.5%) |
Disability Class: Ambulatory Difficulty
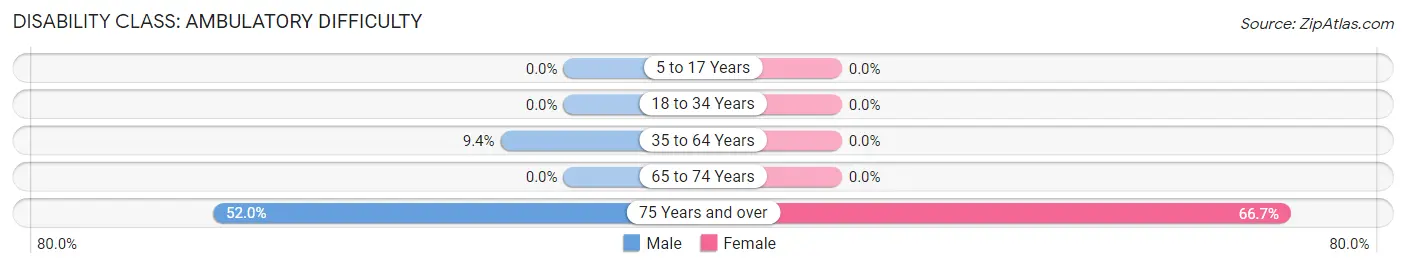
| Age Bracket | Male | Female |
| 5 to 17 Years | 0 (0.0%) | 0 (0.0%) |
| 18 to 34 Years | 0 (0.0%) | 0 (0.0%) |
| 35 to 64 Years | 42 (9.3%) | 0 (0.0%) |
| 65 to 74 Years | 0 (0.0%) | 0 (0.0%) |
| 75 Years and over | 13 (52.0%) | 102 (66.7%) |
Disability Class: Self-Care Difficulty
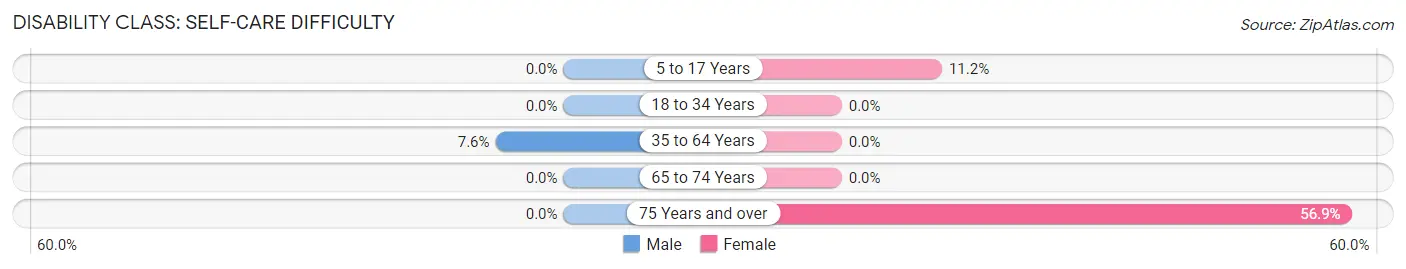
| Age Bracket | Male | Female |
| 5 to 17 Years | 0 (0.0%) | 25 (11.2%) |
| 18 to 34 Years | 0 (0.0%) | 0 (0.0%) |
| 35 to 64 Years | 34 (7.6%) | 0 (0.0%) |
| 65 to 74 Years | 0 (0.0%) | 0 (0.0%) |
| 75 Years and over | 0 (0.0%) | 87 (56.9%) |
Technology Access in Ontario
Computing Device Access in Ontario
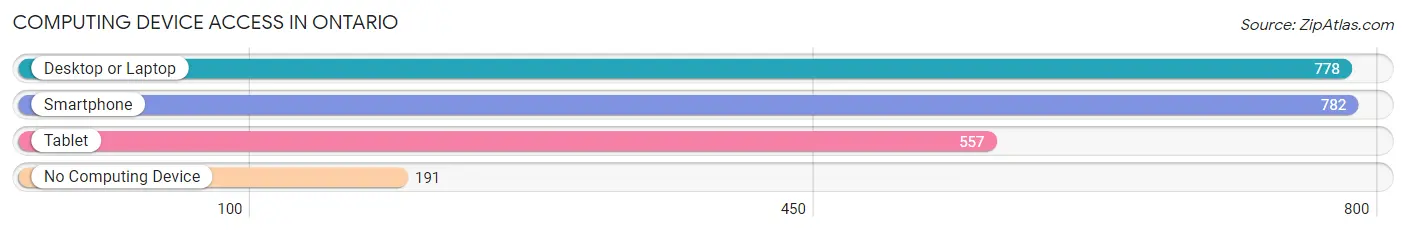
| Device Type | # Households | % Households |
| Desktop or Laptop | 778 | 75.2% |
| Smartphone | 782 | 75.6% |
| Tablet | 557 | 53.8% |
| No Computing Device | 191 | 18.4% |
| Total | 1,035 | 100.0% |
Internet Access in Ontario
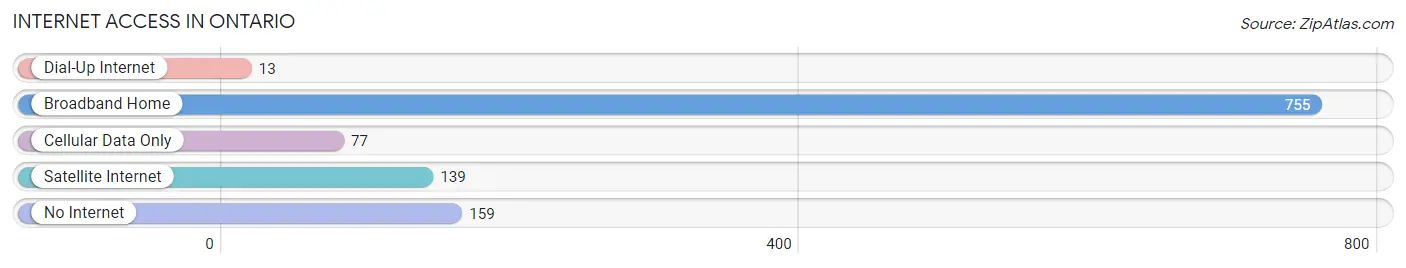
| Internet Type | # Households | % Households |
| Dial-Up Internet | 13 | 1.3% |
| Broadband Home | 755 | 73.0% |
| Cellular Data Only | 77 | 7.4% |
| Satellite Internet | 139 | 13.4% |
| No Internet | 159 | 15.4% |
| Total | 1,035 | 100.0% |
Ontario Summary
Ontario is a town located in Wayne County, New York, United States. The population was 8,945 at the 2010 census. The town is named after the Great Lake Ontario, which borders the town on the north.
History
The area that is now Ontario was first settled in 1789 by a group of settlers from Massachusetts. The town was originally part of the Town of Williamson, but was separated in 1806 and incorporated as the Town of Ontario. The town was named after the Great Lake Ontario, which borders the town on the north.
In the early 19th century, the town was a major center for the production of salt. The salt industry was so important to the town that it was nicknamed “Salt City.” The salt industry declined in the late 19th century, and the town shifted its focus to agriculture and tourism.
Geography
Ontario is located in the northwest corner of Wayne County, bordered by Lake Ontario to the north, the Town of Williamson to the east, the Town of Sodus to the south, and the Town of Huron to the west. According to the United States Census Bureau, the town has a total area of 33.2 square miles, of which 32.7 square miles is land and 0.5 square miles is water.
Economy
The economy of Ontario is largely based on agriculture and tourism. The town is home to several farms, which produce a variety of crops, including corn, soybeans, wheat, and hay. The town is also home to several wineries, which produce a variety of wines.
Tourism is also an important part of the economy. The town is home to several parks, including the Ontario County Park, which offers camping, fishing, and hiking. The town is also home to several historic sites, including the Ontario County Historical Society Museum and the Ontario County Courthouse.
Demographics
As of the 2010 census, there were 8,945 people, 3,541 households, and 2,521 families residing in the town. The population density was 273.3 people per square mile. There were 3,845 housing units at an average density of 117.2 per square mile. The racial makeup of the town was 97.2% White, 0.7% African American, 0.2% Native American, 0.4% Asian, 0.1% Pacific Islander, 0.4% from other races, and 1.0% from two or more races. Hispanic or Latino of any race were 1.7% of the population.
There were 3,541 households, out of which 32.2% had children under the age of 18 living with them, 54.2% were married couples living together, 11.2% had a female householder with no husband present, and 30.2% were non-families. 24.7% of all households were made up of individuals, and 10.2% had someone living alone who was 65 years of age or older. The average household size was 2.51 and the average family size was 2.98.
In the town, the population was spread out, with 25.2% under the age of 18, 6.7% from 18 to 24, 28.2% from 25 to 44, 25.2% from 45 to 64, and 14.7% who were 65 years of age or older. The median age was 39 years. For every 100 females, there were 95.2 males. For every 100 females age 18 and over, there were 92.2 males.
The median income for a household in the town was $45,938, and the median income for a family was $52,813. Males had a median income of $40,938 versus $27,917 for females. The per capita income for the town was $21,945. About 6.2% of families and 8.3% of the population were below the poverty line, including 11.2% of those under age 18 and 6.2% of those age 65 or over.
Common Questions
What is Per Capita Income in Ontario?
Per Capita income in Ontario is $31,284.
What is the Median Family Income in Ontario?
Median Family Income in Ontario is $99,896.
What is the Median Household income in Ontario?
Median Household Income in Ontario is $45,869.
What is Income or Wage Gap in Ontario?
Income or Wage Gap in Ontario is 52.5%.
Women in Ontario earn 47.5 cents for every dollar earned by a man.
What is Inequality or Gini Index in Ontario?
Inequality or Gini Index in Ontario is 0.44.
What is the Total Population of Ontario?
Total Population of Ontario is 2,122.
What is the Total Male Population of Ontario?
Total Male Population of Ontario is 912.
What is the Total Female Population of Ontario?
Total Female Population of Ontario is 1,210.
What is the Ratio of Males per 100 Females in Ontario?
There are 75.37 Males per 100 Females in Ontario.
What is the Ratio of Females per 100 Males in Ontario?
There are 132.68 Females per 100 Males in Ontario.
What is the Median Population Age in Ontario?
Median Population Age in Ontario is 43.5 Years.
What is the Average Family Size in Ontario
Average Family Size in Ontario is 3.0 People.
What is the Average Household Size in Ontario
Average Household Size in Ontario is 2.0 People.
How Large is the Labor Force in Ontario?
There are 1,071 People in the Labor Forcein in Ontario.
What is the Percentage of People in the Labor Force in Ontario?
61.4% of People are in the Labor Force in Ontario.
What is the Unemployment Rate in Ontario?
Unemployment Rate in Ontario is 2.0%.