Minooka, IL Map & Demographics
Minooka Map
Minooka Overview
$45,174
PER CAPITA INCOME
$124,879
AVG FAMILY INCOME
$119,730
AVG HOUSEHOLD INCOME
49.5%
WAGE / INCOME GAP [ % ]
50.5¢/ $1
WAGE / INCOME GAP [ $ ]
0.34
INEQUALITY / GINI INDEX
12,606
TOTAL POPULATION
6,503
MALE POPULATION
6,103
FEMALE POPULATION
106.55
MALES / 100 FEMALES
93.85
FEMALES / 100 MALES
33.7
MEDIAN AGE
3.5
AVG FAMILY SIZE
3.0
AVG HOUSEHOLD SIZE
7,337
LABOR FORCE [ PEOPLE ]
77.1%
PERCENT IN LABOR FORCE
4.4%
UNEMPLOYMENT RATE
Minooka Zip Codes
Minooka Area Codes
Income in Minooka
Income Overview in Minooka
Per Capita Income in Minooka is $45,174, while median incomes of families and households are $124,879 and $119,730 respectively.
| Characteristic | Number | Measure |
| Per Capita Income | 12,606 | $45,174 |
| Median Family Income | 3,241 | $124,879 |
| Mean Family Income | 3,241 | $147,085 |
| Median Household Income | 4,126 | $119,730 |
| Mean Household Income | 4,126 | $139,269 |
| Income Deficit | 3,241 | $0 |
| Wage / Income Gap (%) | 12,606 | 49.51% |
| Wage / Income Gap ($) | 12,606 | 50.49¢ per $1 |
| Gini / Inequality Index | 12,606 | 0.34 |
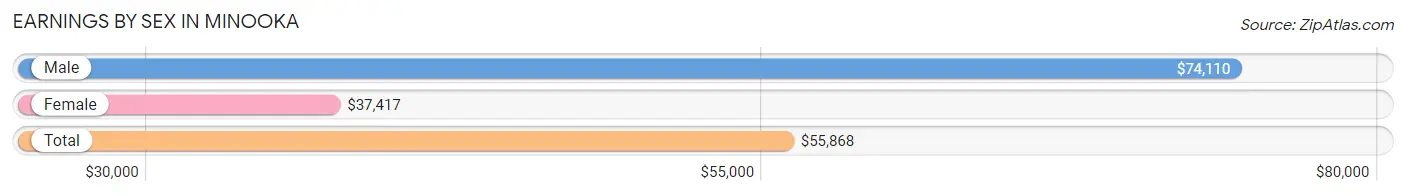
Earnings by Sex in Minooka
Average Earnings in Minooka are $55,868, $74,110 for men and $37,417 for women, a difference of 49.5%.
| Sex | Number | Average Earnings |
| Male | 4,024 (53.6%) | $74,110 |
| Female | 3,479 (46.4%) | $37,417 |
| Total | 7,503 (100.0%) | $55,868 |
Earnings by Sex by Income Bracket in Minooka
The most common earnings brackets in Minooka are $100,000+ for men (1,358 | 33.8%) and $75,000 to $99,999 for women (369 | 10.6%).
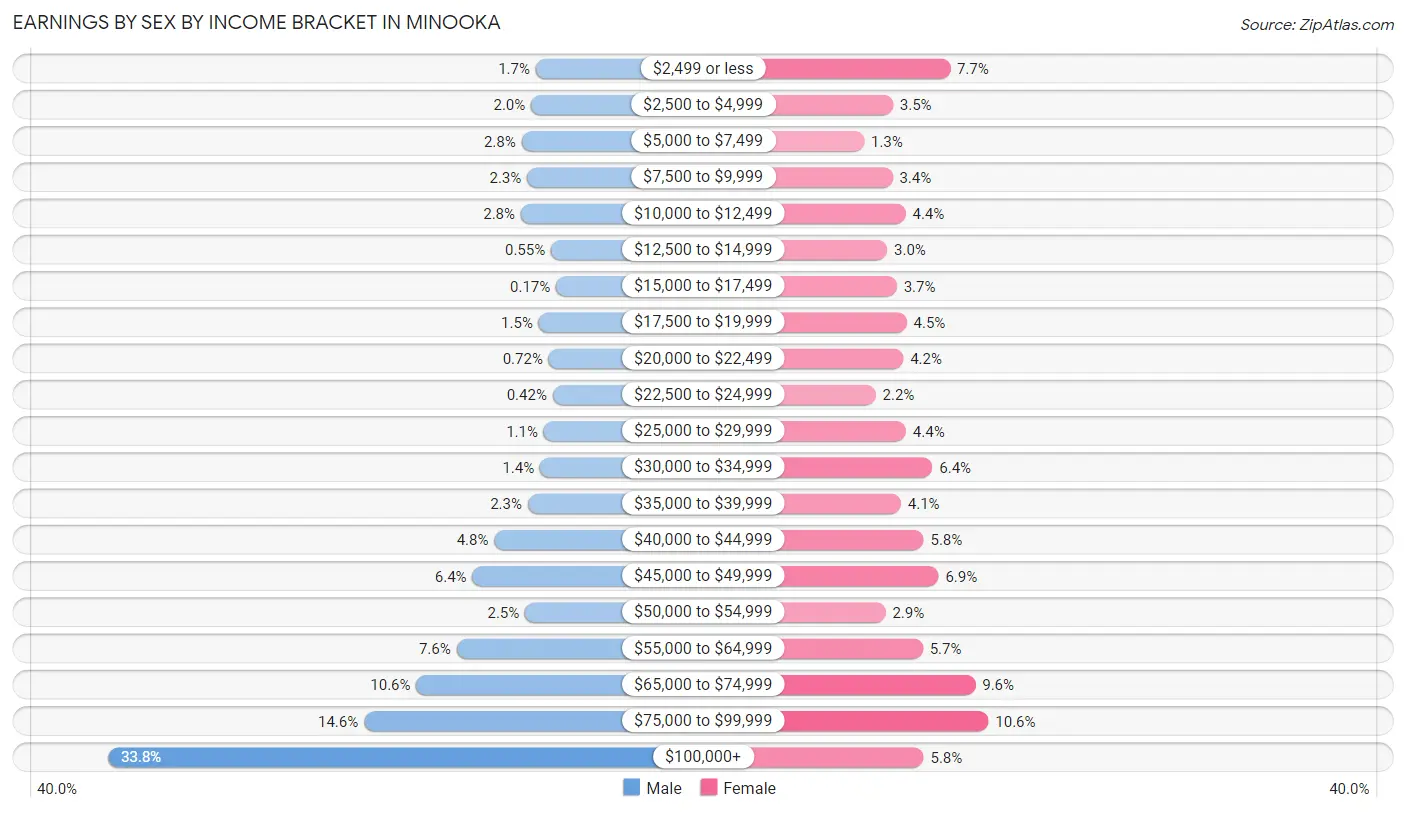
| Income | Male | Female |
| $2,499 or less | 68 (1.7%) | 269 (7.7%) |
| $2,500 to $4,999 | 82 (2.0%) | 120 (3.5%) |
| $5,000 to $7,499 | 111 (2.8%) | 45 (1.3%) |
| $7,500 to $9,999 | 94 (2.3%) | 119 (3.4%) |
| $10,000 to $12,499 | 113 (2.8%) | 153 (4.4%) |
| $12,500 to $14,999 | 22 (0.5%) | 105 (3.0%) |
| $15,000 to $17,499 | 7 (0.2%) | 130 (3.7%) |
| $17,500 to $19,999 | 59 (1.5%) | 156 (4.5%) |
| $20,000 to $22,499 | 29 (0.7%) | 147 (4.2%) |
| $22,500 to $24,999 | 17 (0.4%) | 75 (2.2%) |
| $25,000 to $29,999 | 44 (1.1%) | 154 (4.4%) |
| $30,000 to $34,999 | 55 (1.4%) | 223 (6.4%) |
| $35,000 to $39,999 | 92 (2.3%) | 141 (4.1%) |
| $40,000 to $44,999 | 193 (4.8%) | 200 (5.8%) |
| $45,000 to $49,999 | 259 (6.4%) | 239 (6.9%) |
| $50,000 to $54,999 | 100 (2.5%) | 101 (2.9%) |
| $55,000 to $64,999 | 307 (7.6%) | 198 (5.7%) |
| $65,000 to $74,999 | 428 (10.6%) | 335 (9.6%) |
| $75,000 to $99,999 | 586 (14.6%) | 369 (10.6%) |
| $100,000+ | 1,358 (33.8%) | 200 (5.8%) |
| Total | 4,024 (100.0%) | 3,479 (100.0%) |
Earnings by Sex by Educational Attainment in Minooka
Average earnings in Minooka are $84,368 for men and $44,405 for women, a difference of 47.4%. Men with an educational attainment of bachelor's degree enjoy the highest average annual earnings of $115,625, while those with high school diploma education earn the least with $73,095. Women with an educational attainment of graduate degree earn the most with the average annual earnings of $75,489, while those with high school diploma education have the smallest earnings of $20,227.
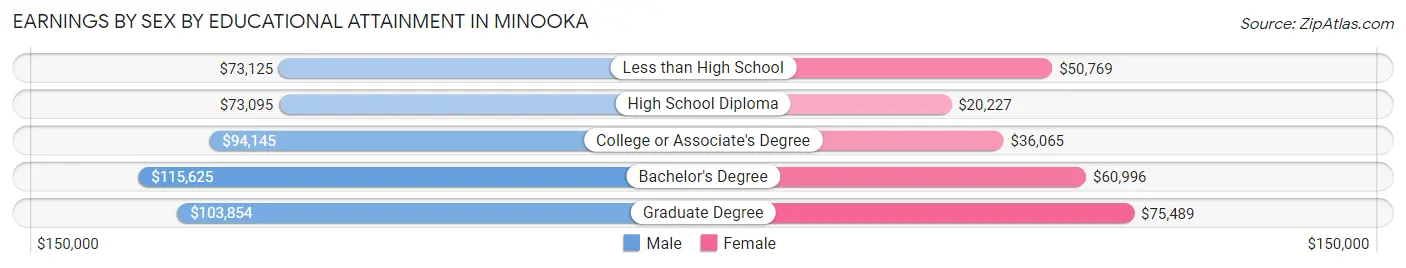
| Educational Attainment | Male Income | Female Income |
| Less than High School | $73,125 | $50,769 |
| High School Diploma | $73,095 | $20,227 |
| College or Associate's Degree | $94,145 | $36,065 |
| Bachelor's Degree | $115,625 | $60,996 |
| Graduate Degree | $103,854 | $75,489 |
| Total | $84,368 | $44,405 |
Family Income in Minooka
Family Income Brackets in Minooka
According to the Minooka family income data, there are 1,086 families falling into the $100,000 to $149,999 income range, which is the most common income bracket and makes up 33.5% of all families.
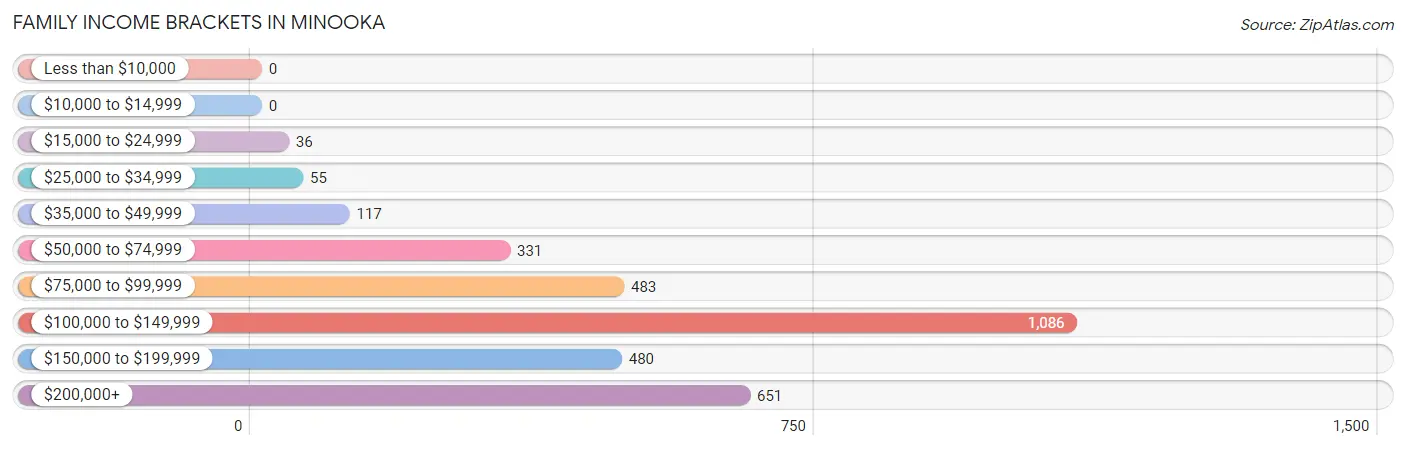
| Income Bracket | # Families | % Families |
| Less than $10,000 | 0 | 0.0% |
| $10,000 to $14,999 | 0 | 0.0% |
| $15,000 to $24,999 | 36 | 1.1% |
| $25,000 to $34,999 | 55 | 1.7% |
| $35,000 to $49,999 | 117 | 3.6% |
| $50,000 to $74,999 | 331 | 10.2% |
| $75,000 to $99,999 | 483 | 14.9% |
| $100,000 to $149,999 | 1,086 | 33.5% |
| $150,000 to $199,999 | 480 | 14.8% |
| $200,000+ | 651 | 20.1% |
Family Income by Famaliy Size in Minooka
4-person families (993 | 30.6%) account for the highest median family income in Minooka with $144,028 per family, while 3-person families (844 | 26.0%) have the highest median income of $41,395 per family member.
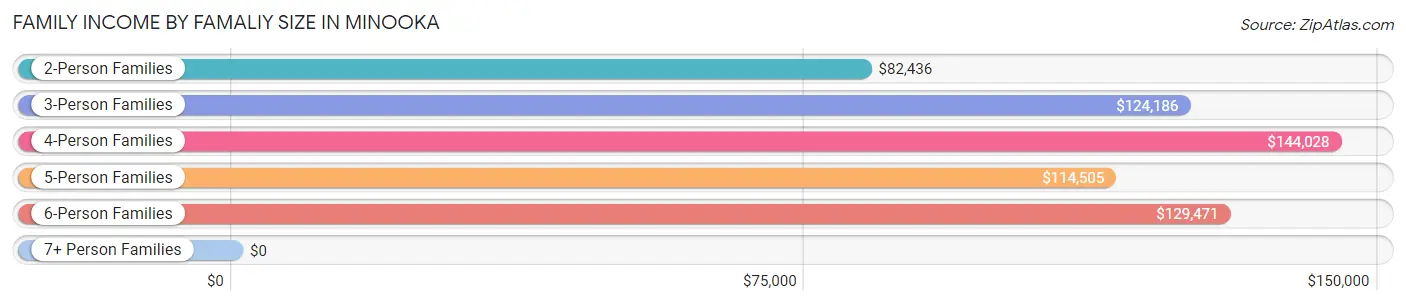
| Income Bracket | # Families | Median Income |
| 2-Person Families | 810 (25.0%) | $82,436 |
| 3-Person Families | 844 (26.0%) | $124,186 |
| 4-Person Families | 993 (30.6%) | $144,028 |
| 5-Person Families | 455 (14.0%) | $114,505 |
| 6-Person Families | 118 (3.6%) | $129,471 |
| 7+ Person Families | 21 (0.6%) | $0 |
| Total | 3,241 (100.0%) | $124,879 |
Family Income by Number of Earners in Minooka
The median family income in Minooka is $124,879, with families comprising 3+ earners (920) having the highest median family income of $178,049, while families with no earners (222) have the lowest median family income of $62,500, accounting for 28.4% and 6.9% of families, respectively.
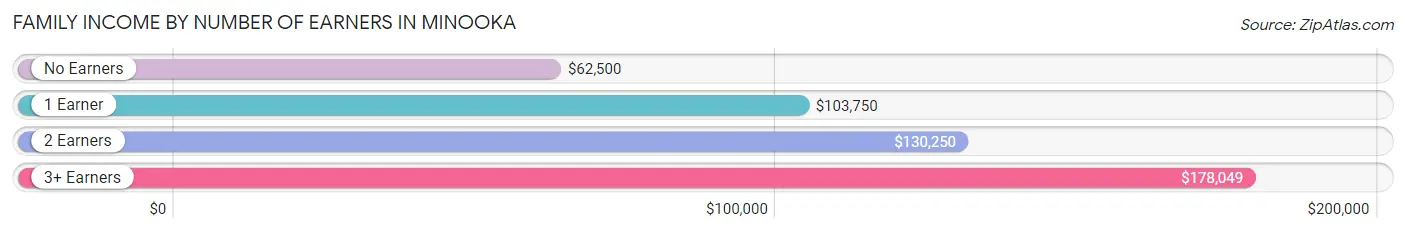
| Number of Earners | # Families | Median Income |
| No Earners | 222 (6.9%) | $62,500 |
| 1 Earner | 869 (26.8%) | $103,750 |
| 2 Earners | 1,230 (38.0%) | $130,250 |
| 3+ Earners | 920 (28.4%) | $178,049 |
| Total | 3,241 (100.0%) | $124,879 |
Household Income in Minooka
Household Income Brackets in Minooka
With 1,271 households falling in the category, the $100,000 to $149,999 income range is the most frequent in Minooka, accounting for 30.8% of all households.
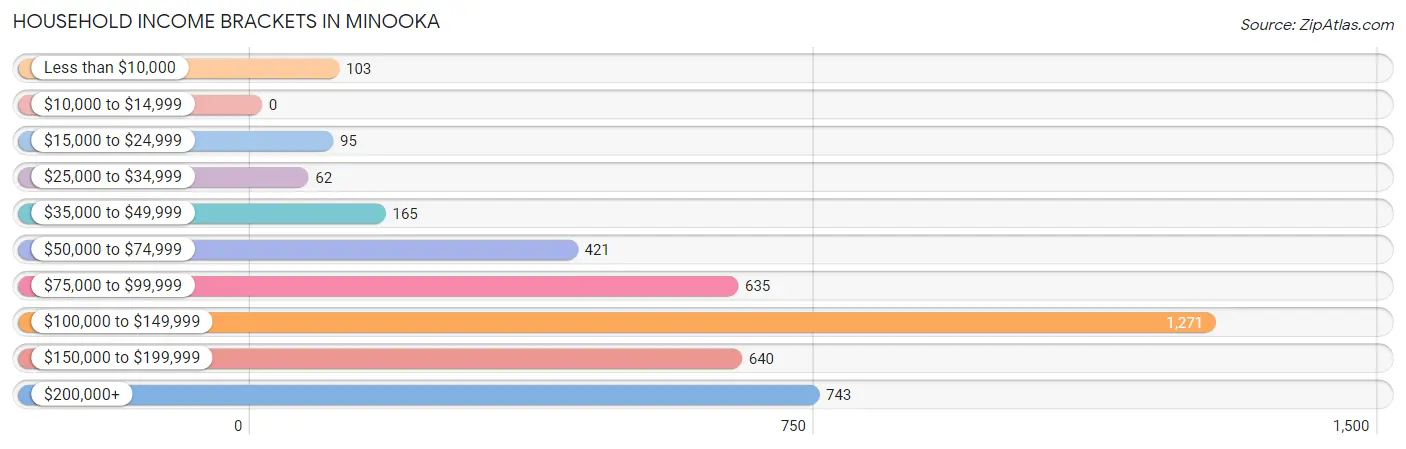
| Income Bracket | # Households | % Households |
| Less than $10,000 | 103 | 2.5% |
| $10,000 to $14,999 | 0 | 0.0% |
| $15,000 to $24,999 | 95 | 2.3% |
| $25,000 to $34,999 | 62 | 1.5% |
| $35,000 to $49,999 | 165 | 4.0% |
| $50,000 to $74,999 | 421 | 10.2% |
| $75,000 to $99,999 | 635 | 15.4% |
| $100,000 to $149,999 | 1,271 | 30.8% |
| $150,000 to $199,999 | 640 | 15.5% |
| $200,000+ | 743 | 18.0% |
Household Income by Householder Age in Minooka
The median household income in Minooka is $119,730, with the highest median household income of $130,327 found in the 45 to 64 years age bracket for the primary householder. A total of 1,850 households (44.8%) fall into this category. Meanwhile, the 65+ years age bracket for the primary householder has the lowest median household income of $63,000, with 472 households (11.4%) in this group.
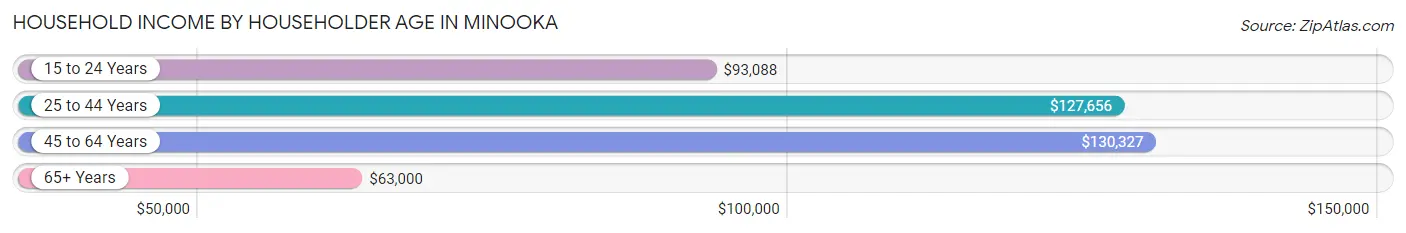
| Income Bracket | # Households | Median Income |
| 15 to 24 Years | 108 (2.6%) | $93,088 |
| 25 to 44 Years | 1,696 (41.1%) | $127,656 |
| 45 to 64 Years | 1,850 (44.8%) | $130,327 |
| 65+ Years | 472 (11.4%) | $63,000 |
| Total | 4,126 (100.0%) | $119,730 |
Poverty in Minooka
Income Below Poverty by Sex and Age in Minooka
With 2.6% poverty level for males and 3.8% for females among the residents of Minooka, 15 year old males and 75 year old and over females are the most vulnerable to poverty, with 26 males (20.2%) and 24 females (25.0%) in their respective age groups living below the poverty level.
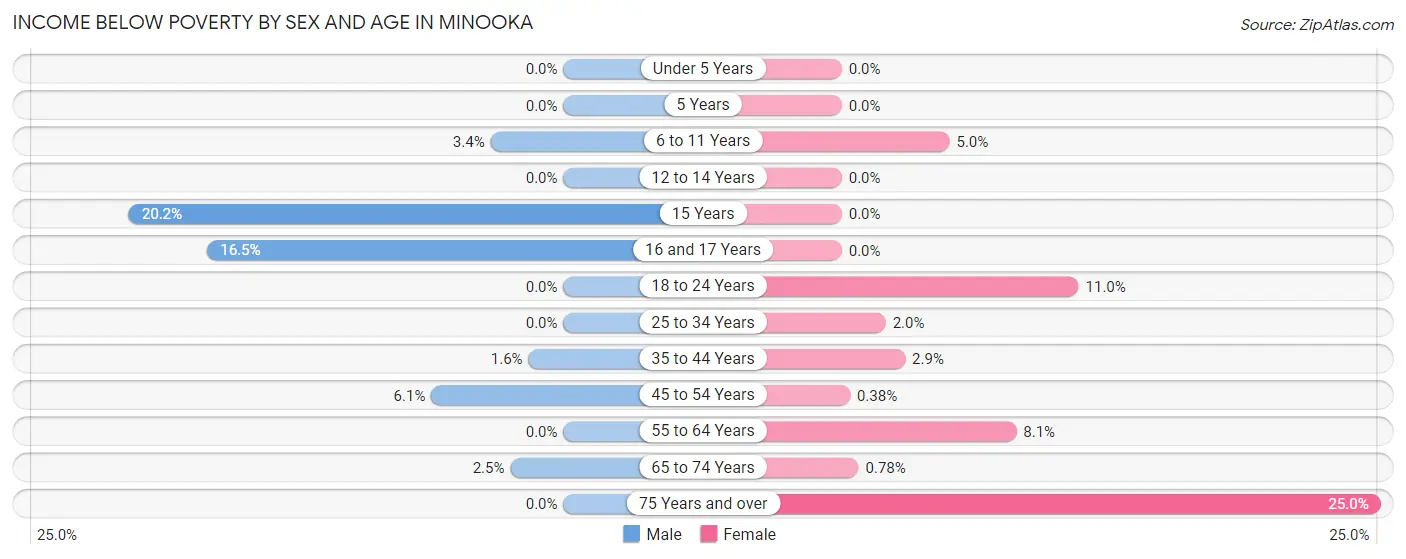
| Age Bracket | Male | Female |
| Under 5 Years | 0 (0.0%) | 0 (0.0%) |
| 5 Years | 0 (0.0%) | 0 (0.0%) |
| 6 to 11 Years | 22 (3.4%) | 26 (5.0%) |
| 12 to 14 Years | 0 (0.0%) | 0 (0.0%) |
| 15 Years | 26 (20.2%) | 0 (0.0%) |
| 16 and 17 Years | 38 (16.5%) | 0 (0.0%) |
| 18 to 24 Years | 0 (0.0%) | 72 (11.0%) |
| 25 to 34 Years | 0 (0.0%) | 18 (2.0%) |
| 35 to 44 Years | 18 (1.6%) | 28 (2.9%) |
| 45 to 54 Years | 59 (6.1%) | 3 (0.4%) |
| 55 to 64 Years | 0 (0.0%) | 57 (8.1%) |
| 65 to 74 Years | 7 (2.5%) | 3 (0.8%) |
| 75 Years and over | 0 (0.0%) | 24 (25.0%) |
| Total | 170 (2.6%) | 231 (3.8%) |
Income Above Poverty by Sex and Age in Minooka
According to the poverty statistics in Minooka, males aged under 5 years and females aged under 5 years are the age groups that are most secure financially, with 100.0% of males and 100.0% of females in these age groups living above the poverty line.
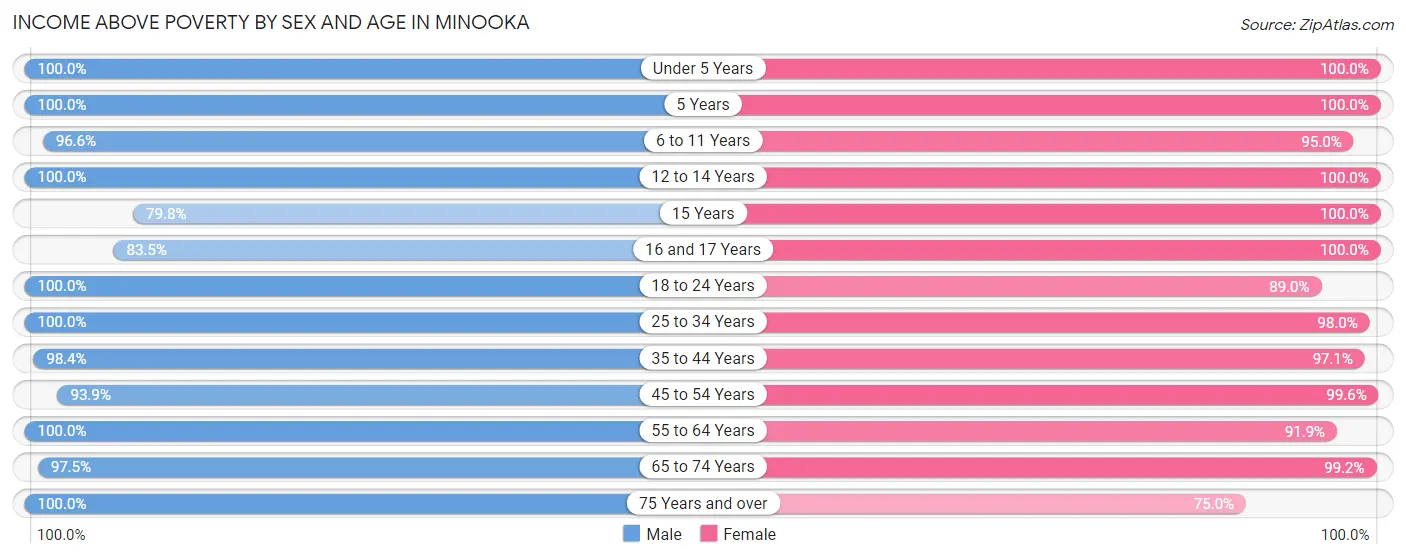
| Age Bracket | Male | Female |
| Under 5 Years | 521 (100.0%) | 218 (100.0%) |
| 5 Years | 121 (100.0%) | 151 (100.0%) |
| 6 to 11 Years | 629 (96.6%) | 494 (95.0%) |
| 12 to 14 Years | 233 (100.0%) | 446 (100.0%) |
| 15 Years | 103 (79.8%) | 84 (100.0%) |
| 16 and 17 Years | 192 (83.5%) | 197 (100.0%) |
| 18 to 24 Years | 716 (100.0%) | 583 (89.0%) |
| 25 to 34 Years | 723 (100.0%) | 863 (98.0%) |
| 35 to 44 Years | 1,092 (98.4%) | 925 (97.1%) |
| 45 to 54 Years | 903 (93.9%) | 794 (99.6%) |
| 55 to 64 Years | 737 (100.0%) | 647 (91.9%) |
| 65 to 74 Years | 277 (97.5%) | 382 (99.2%) |
| 75 Years and over | 81 (100.0%) | 72 (75.0%) |
| Total | 6,328 (97.4%) | 5,856 (96.2%) |
Income Below Poverty Among Married-Couple Families in Minooka
The poverty statistics for married-couple families in Minooka show that 1.3% or 35 of the total 2,777 families live below the poverty line. Families with 3 or 4 children have the highest poverty rate of 9.5%, comprising of 35 families. On the other hand, families with no children have the lowest poverty rate of 0.0%, which includes 0 families.
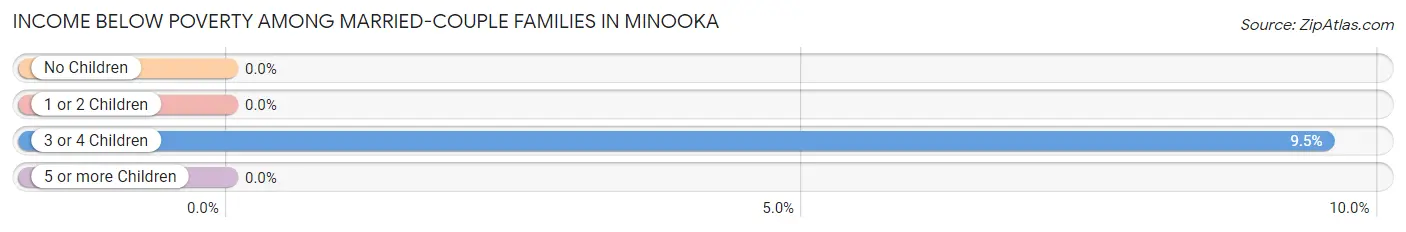
| Children | Above Poverty | Below Poverty |
| No Children | 990 (100.0%) | 0 (0.0%) |
| 1 or 2 Children | 1,420 (100.0%) | 0 (0.0%) |
| 3 or 4 Children | 332 (90.5%) | 35 (9.5%) |
| 5 or more Children | 0 (0.0%) | 0 (0.0%) |
| Total | 2,742 (98.7%) | 35 (1.3%) |
Income Below Poverty Among Single-Parent Households in Minooka
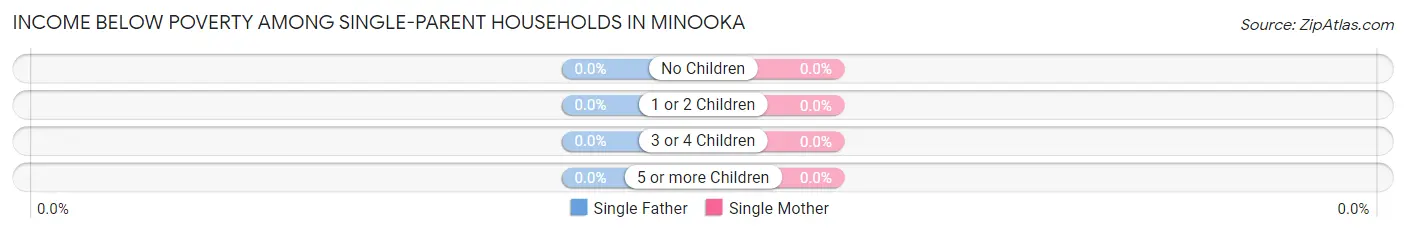
| Children | Single Father | Single Mother |
| No Children | 0 (0.0%) | 0 (0.0%) |
| 1 or 2 Children | 0 (0.0%) | 0 (0.0%) |
| 3 or 4 Children | 0 (0.0%) | 0 (0.0%) |
| 5 or more Children | 0 (0.0%) | 0 (0.0%) |
| Total | 0 (0.0%) | 0 (0.0%) |
Income Below Poverty Among Married-Couple vs Single-Parent Households in Minooka
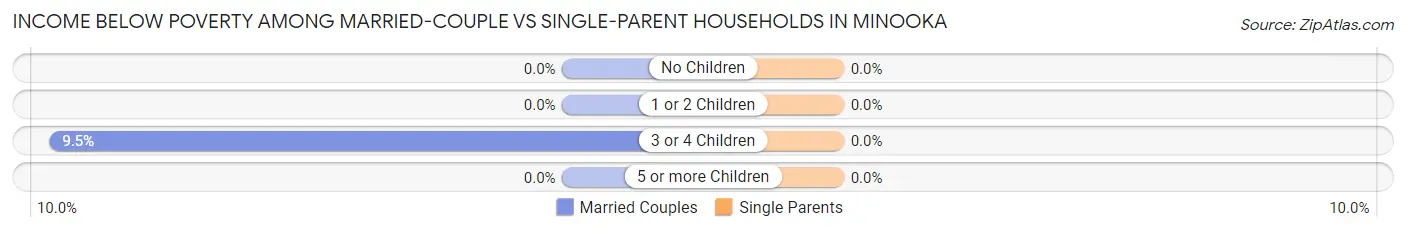
| Children | Married-Couple Families | Single-Parent Households |
| No Children | 0 (0.0%) | 0 (0.0%) |
| 1 or 2 Children | 0 (0.0%) | 0 (0.0%) |
| 3 or 4 Children | 35 (9.5%) | 0 (0.0%) |
| 5 or more Children | 0 (0.0%) | 0 (0.0%) |
| Total | 35 (1.3%) | 0 (0.0%) |
Race in Minooka
The most populous races in Minooka are White / Caucasian (10,877 | 86.3%), Hispanic or Latino (1,715 | 13.6%), and Black / African American (600 | 4.8%).
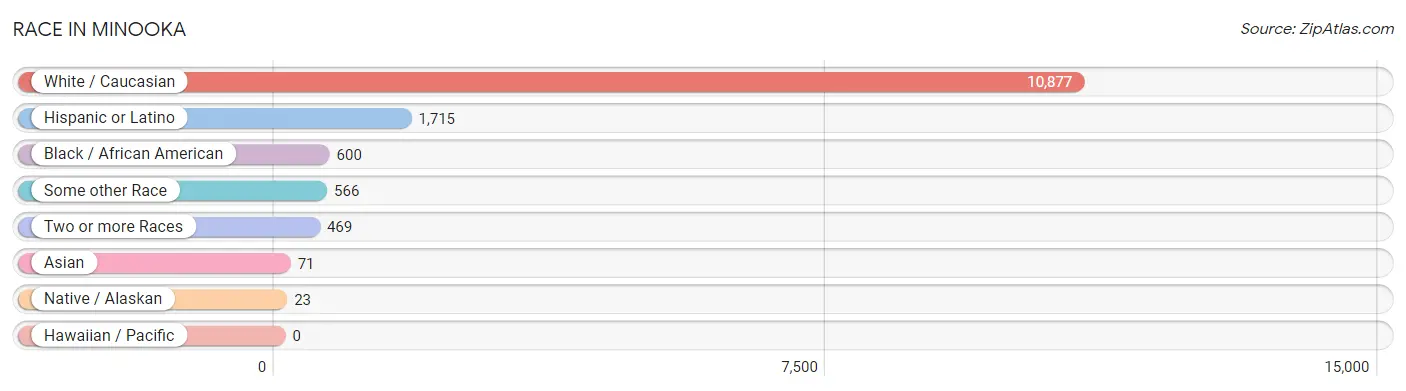
| Race | # Population | % Population |
| Asian | 71 | 0.6% |
| Black / African American | 600 | 4.8% |
| Hawaiian / Pacific | 0 | 0.0% |
| Hispanic or Latino | 1,715 | 13.6% |
| Native / Alaskan | 23 | 0.2% |
| White / Caucasian | 10,877 | 86.3% |
| Two or more Races | 469 | 3.7% |
| Some other Race | 566 | 4.5% |
| Total | 12,606 | 100.0% |
Ancestry in Minooka
The most populous ancestries reported in Minooka are German (2,535 | 20.1%), Irish (2,025 | 16.1%), Polish (1,737 | 13.8%), Italian (1,710 | 13.6%), and Mexican (1,418 | 11.3%), together accounting for 74.8% of all Minooka residents.
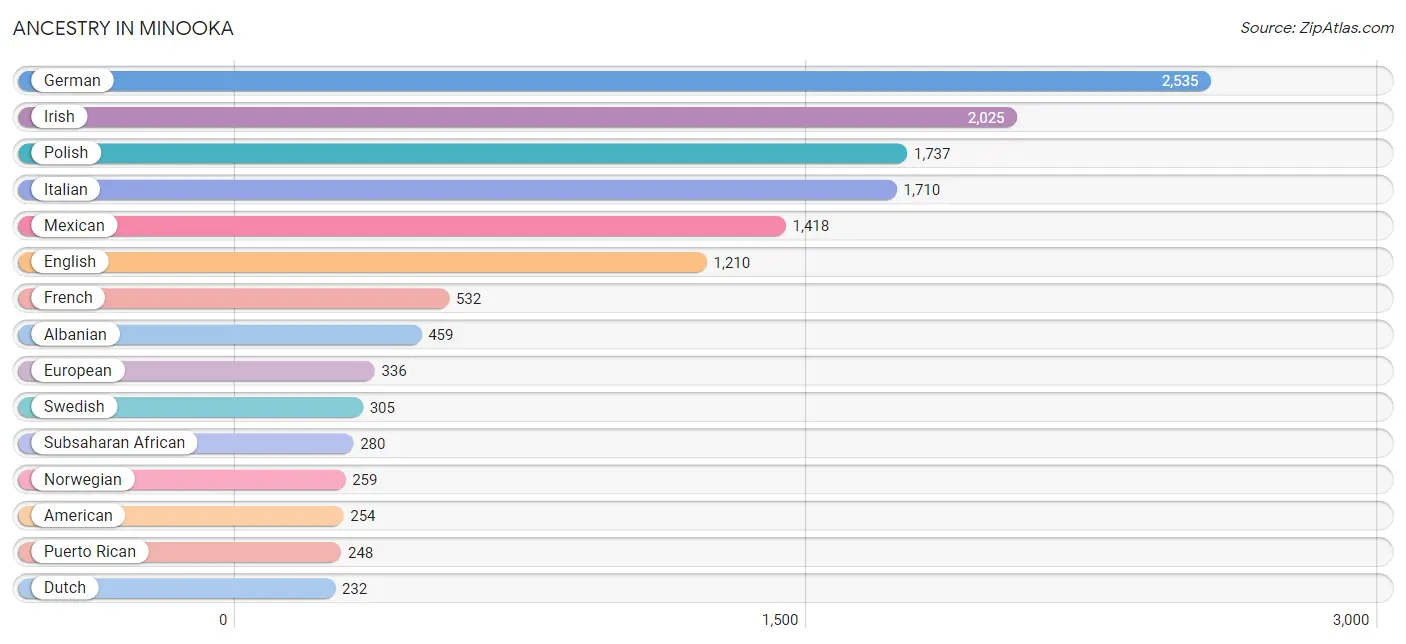
| Ancestry | # Population | % Population |
| African | 173 | 1.4% |
| Albanian | 459 | 3.6% |
| American | 254 | 2.0% |
| Arab | 27 | 0.2% |
| Austrian | 7 | 0.1% |
| Belgian | 38 | 0.3% |
| Bhutanese | 75 | 0.6% |
| British | 25 | 0.2% |
| Creek | 4 | 0.0% |
| Croatian | 154 | 1.2% |
| Czech | 97 | 0.8% |
| Czechoslovakian | 18 | 0.1% |
| Danish | 53 | 0.4% |
| Dutch | 232 | 1.8% |
| English | 1,210 | 9.6% |
| European | 336 | 2.7% |
| Finnish | 44 | 0.4% |
| French | 532 | 4.2% |
| German | 2,535 | 20.1% |
| Greek | 28 | 0.2% |
| Hungarian | 23 | 0.2% |
| Irish | 2,025 | 16.1% |
| Italian | 1,710 | 13.6% |
| Korean | 130 | 1.0% |
| Lithuanian | 74 | 0.6% |
| Mexican | 1,418 | 11.3% |
| Mexican American Indian | 12 | 0.1% |
| Navajo | 11 | 0.1% |
| Norwegian | 259 | 2.1% |
| Pakistani | 31 | 0.3% |
| Polish | 1,737 | 13.8% |
| Portuguese | 9 | 0.1% |
| Puerto Rican | 248 | 2.0% |
| Scotch-Irish | 134 | 1.1% |
| Scottish | 80 | 0.6% |
| Serbian | 10 | 0.1% |
| Slovak | 113 | 0.9% |
| Slovene | 158 | 1.3% |
| South American | 49 | 0.4% |
| Sri Lankan | 24 | 0.2% |
| Subsaharan African | 280 | 2.2% |
| Swedish | 305 | 2.4% |
| Syrian | 27 | 0.2% |
| Uruguayan | 49 | 0.4% |
| Welsh | 22 | 0.2% | View All 45 Rows |
Immigrants in Minooka
The most numerous immigrant groups reported in Minooka came from Latin America (471 | 3.7%), Central America (315 | 2.5%), Mexico (315 | 2.5%), Europe (239 | 1.9%), and Albania (214 | 1.7%), together accounting for 12.3% of all Minooka residents.
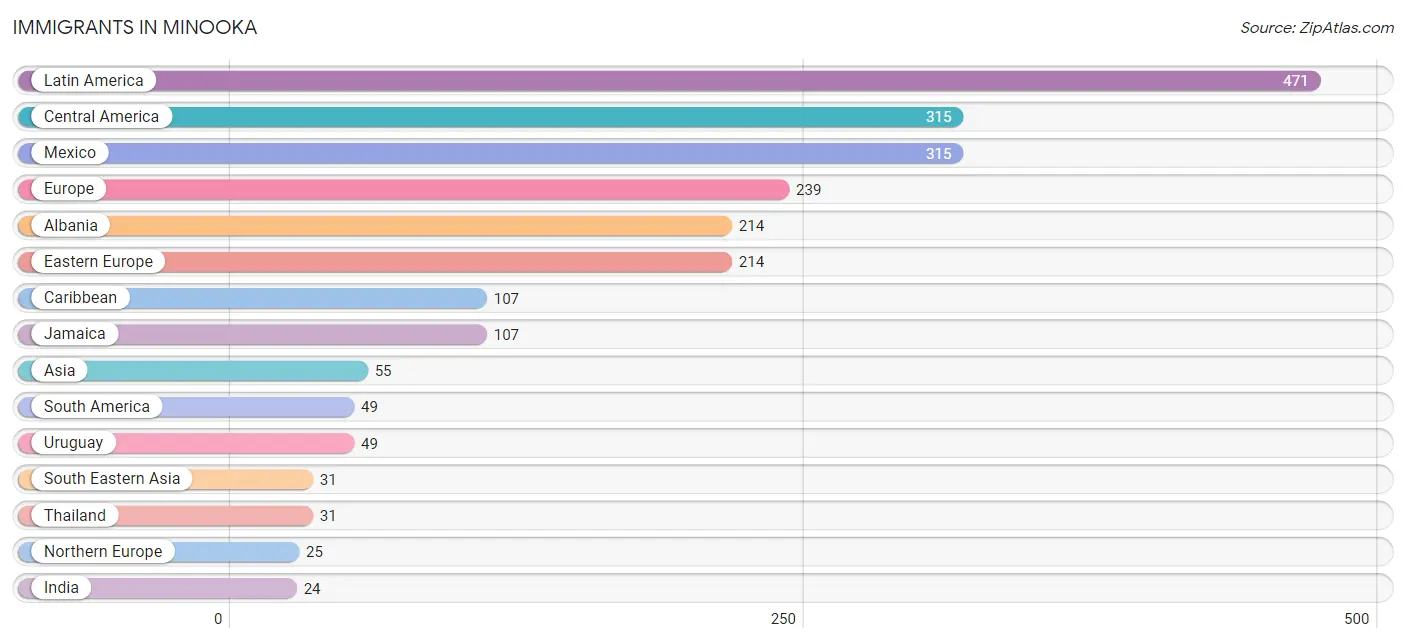
| Immigration Origin | # Population | % Population |
| Albania | 214 | 1.7% |
| Asia | 55 | 0.4% |
| Caribbean | 107 | 0.9% |
| Central America | 315 | 2.5% |
| Eastern Europe | 214 | 1.7% |
| Europe | 239 | 1.9% |
| India | 24 | 0.2% |
| Jamaica | 107 | 0.9% |
| Latin America | 471 | 3.7% |
| Mexico | 315 | 2.5% |
| Northern Europe | 25 | 0.2% |
| South America | 49 | 0.4% |
| South Central Asia | 24 | 0.2% |
| South Eastern Asia | 31 | 0.3% |
| Thailand | 31 | 0.3% |
| Uruguay | 49 | 0.4% | View All 16 Rows |
Sex and Age in Minooka
Sex and Age in Minooka
The most populous age groups in Minooka are 40 to 44 Years (611 | 9.4%) for men and 40 to 44 Years (632 | 10.4%) for women.
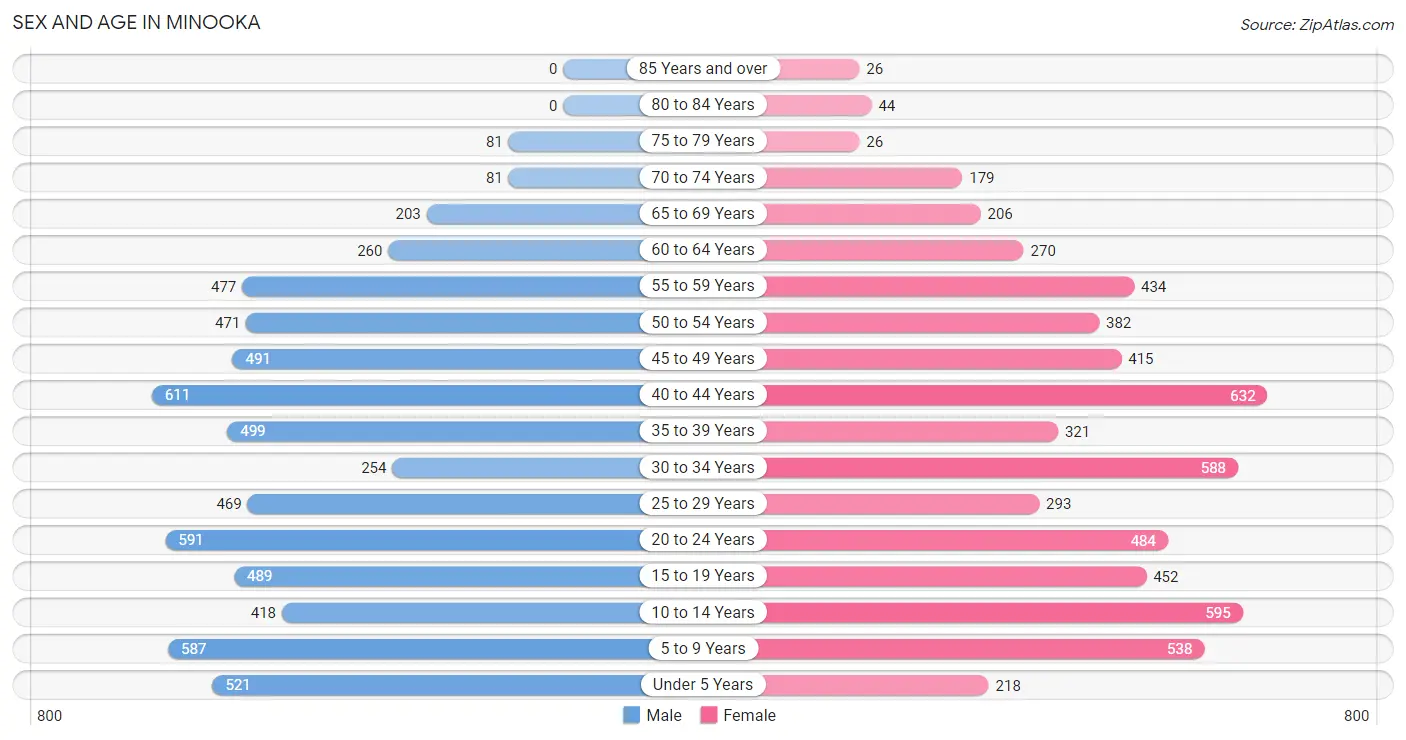
| Age Bracket | Male | Female |
| Under 5 Years | 521 (8.0%) | 218 (3.6%) |
| 5 to 9 Years | 587 (9.0%) | 538 (8.8%) |
| 10 to 14 Years | 418 (6.4%) | 595 (9.8%) |
| 15 to 19 Years | 489 (7.5%) | 452 (7.4%) |
| 20 to 24 Years | 591 (9.1%) | 484 (7.9%) |
| 25 to 29 Years | 469 (7.2%) | 293 (4.8%) |
| 30 to 34 Years | 254 (3.9%) | 588 (9.6%) |
| 35 to 39 Years | 499 (7.7%) | 321 (5.3%) |
| 40 to 44 Years | 611 (9.4%) | 632 (10.4%) |
| 45 to 49 Years | 491 (7.5%) | 415 (6.8%) |
| 50 to 54 Years | 471 (7.2%) | 382 (6.3%) |
| 55 to 59 Years | 477 (7.3%) | 434 (7.1%) |
| 60 to 64 Years | 260 (4.0%) | 270 (4.4%) |
| 65 to 69 Years | 203 (3.1%) | 206 (3.4%) |
| 70 to 74 Years | 81 (1.3%) | 179 (2.9%) |
| 75 to 79 Years | 81 (1.3%) | 26 (0.4%) |
| 80 to 84 Years | 0 (0.0%) | 44 (0.7%) |
| 85 Years and over | 0 (0.0%) | 26 (0.4%) |
| Total | 6,503 (100.0%) | 6,103 (100.0%) |
Families and Households in Minooka
Median Family Size in Minooka
The median family size in Minooka is 3.48 persons per family, with married-couple families (2,777 | 85.7%) accounting for the largest median family size of 3.57 persons per family. On the other hand, single male/father families (180 | 5.6%) represent the smallest median family size with 2.17 persons per family.
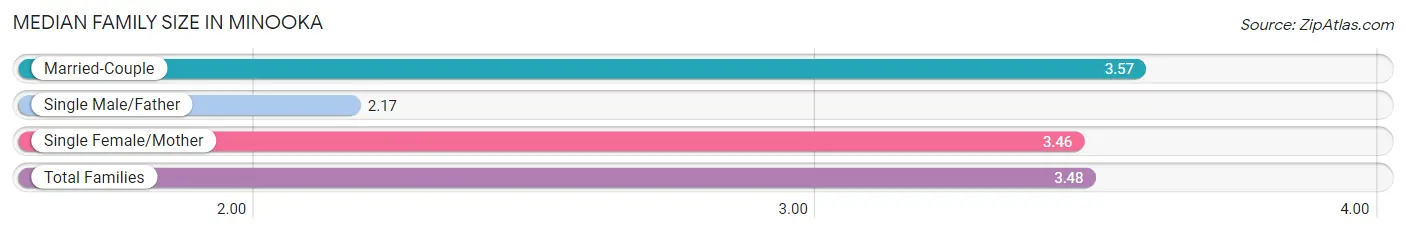
| Family Type | # Families | Family Size |
| Married-Couple | 2,777 (85.7%) | 3.57 |
| Single Male/Father | 180 (5.6%) | 2.17 |
| Single Female/Mother | 284 (8.8%) | 3.46 |
| Total Families | 3,241 (100.0%) | 3.48 |
Median Household Size in Minooka
The median household size in Minooka is 3.05 persons per household, with single female/mother households (284 | 6.9%) accounting for the largest median household size of 3.63 persons per household. non-family households (885 | 21.4%) represent the smallest median household size with 1.38 persons per household.
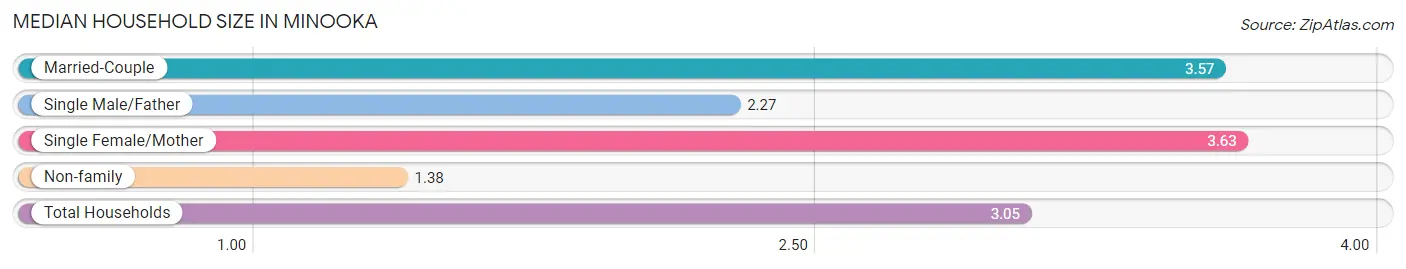
| Household Type | # Households | Household Size |
| Married-Couple | 2,777 (67.3%) | 3.57 |
| Single Male/Father | 180 (4.4%) | 2.27 |
| Single Female/Mother | 284 (6.9%) | 3.63 |
| Non-family | 885 (21.4%) | 1.38 |
| Total Households | 4,126 (100.0%) | 3.05 |
Household Size by Marriage Status in Minooka
Out of a total of 4,126 households in Minooka, 3,241 (78.5%) are family households, while 885 (21.4%) are nonfamily households. The most numerous type of family households are 4-person households, comprising 962, and the most common type of nonfamily households are 1-person households, comprising 641.
| Household Size | Family Households | Nonfamily Households |
| 1-Person Households | - | 641 (15.5%) |
| 2-Person Households | 750 (18.2%) | 165 (4.0%) |
| 3-Person Households | 904 (21.9%) | 30 (0.7%) |
| 4-Person Households | 962 (23.3%) | 49 (1.2%) |
| 5-Person Households | 486 (11.8%) | 0 (0.0%) |
| 6-Person Households | 118 (2.9%) | 0 (0.0%) |
| 7+ Person Households | 21 (0.5%) | 0 (0.0%) |
| Total | 3,241 (78.5%) | 885 (21.4%) |
Female Fertility in Minooka
Fertility by Age in Minooka
Average fertility rate in Minooka is 23.0 births per 1,000 women. Women in the age bracket of 20 to 34 years have the highest fertility rate with 50.0 births per 1,000 women. Women in the age bracket of 20 to 34 years acount for 88.3% of all women with births.
| Age Bracket | Women with Births | Births / 1,000 Women |
| 15 to 19 years | 0 (0.0%) | 0.0 |
| 20 to 34 years | 68 (88.3%) | 50.0 |
| 35 to 50 years | 9 (11.7%) | 6.0 |
| Total | 77 (100.0%) | 23.0 |
Fertility by Age by Marriage Status in Minooka
| Age Bracket | Married | Unmarried |
| 15 to 19 years | 0 (0.0%) | 0 (0.0%) |
| 20 to 34 years | 68 (100.0%) | 0 (0.0%) |
| 35 to 50 years | 9 (100.0%) | 0 (0.0%) |
| Total | 77 (100.0%) | 0 (0.0%) |
Fertility by Education in Minooka
| Educational Attainment | Women with Births | Births / 1,000 Women |
| Less than High School | 0 (0.0%) | 0.0 |
| High School Diploma | 0 (0.0%) | 0.0 |
| College or Associate's Degree | 18 (23.4%) | 12.0 |
| Bachelor's Degree | 50 (64.9%) | 63.0 |
| Graduate Degree | 9 (11.7%) | 32.0 |
| Total | 77 (100.0%) | 23.0 |
Fertility by Education by Marriage Status in Minooka
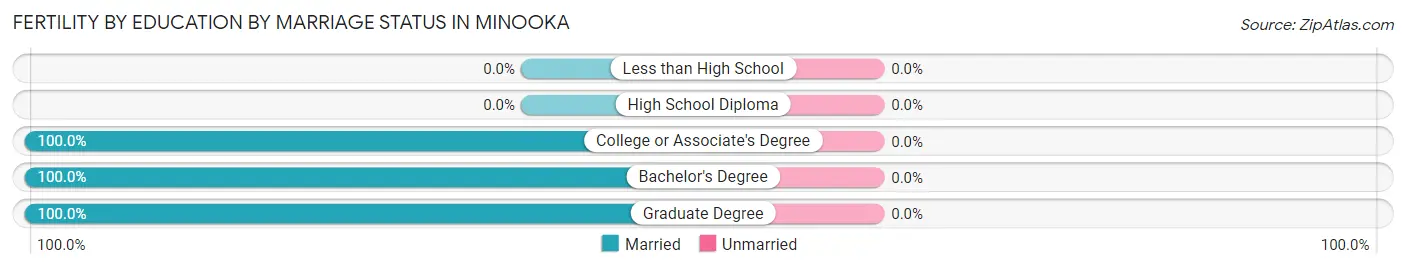
| Educational Attainment | Married | Unmarried |
| Less than High School | 0 (0.0%) | 0 (0.0%) |
| High School Diploma | 0 (0.0%) | 0 (0.0%) |
| College or Associate's Degree | 18 (100.0%) | 0 (0.0%) |
| Bachelor's Degree | 50 (100.0%) | 0 (0.0%) |
| Graduate Degree | 9 (100.0%) | 0 (0.0%) |
| Total | 77 (100.0%) | 0 (0.0%) |
Employment Characteristics in Minooka
Employment by Class of Employer in Minooka
Among the 6,876 employed individuals in Minooka, private company employees (4,982 | 72.5%), local government employees (726 | 10.6%), and not-for-profit organizations (486 | 7.1%) make up the most common classes of employment.
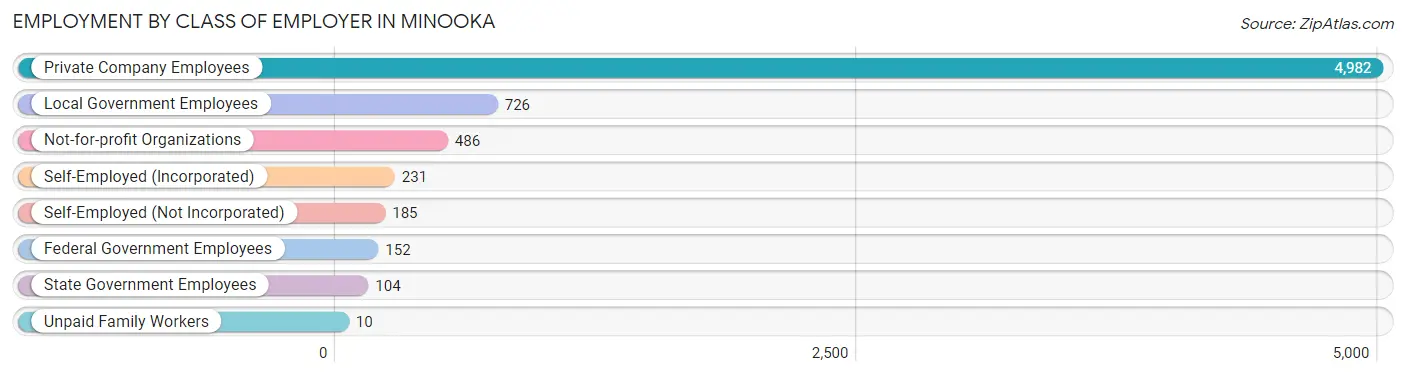
| Employer Class | # Employees | % Employees |
| Private Company Employees | 4,982 | 72.5% |
| Self-Employed (Incorporated) | 231 | 3.4% |
| Self-Employed (Not Incorporated) | 185 | 2.7% |
| Not-for-profit Organizations | 486 | 7.1% |
| Local Government Employees | 726 | 10.6% |
| State Government Employees | 104 | 1.5% |
| Federal Government Employees | 152 | 2.2% |
| Unpaid Family Workers | 10 | 0.2% |
| Total | 6,876 | 100.0% |
Employment Status by Age in Minooka
According to the labor force statistics for Minooka, out of the total population over 16 years of age (9,516), 77.1% or 7,337 individuals are in the labor force, with 4.4% or 323 of them unemployed. The age group with the highest labor force participation rate is 45 to 54 years, with 90.3% or 1,588 individuals in the labor force. Within the labor force, the 35 to 44 years age range has the highest percentage of unemployed individuals, with 7.7% or 142 of them being unemployed.
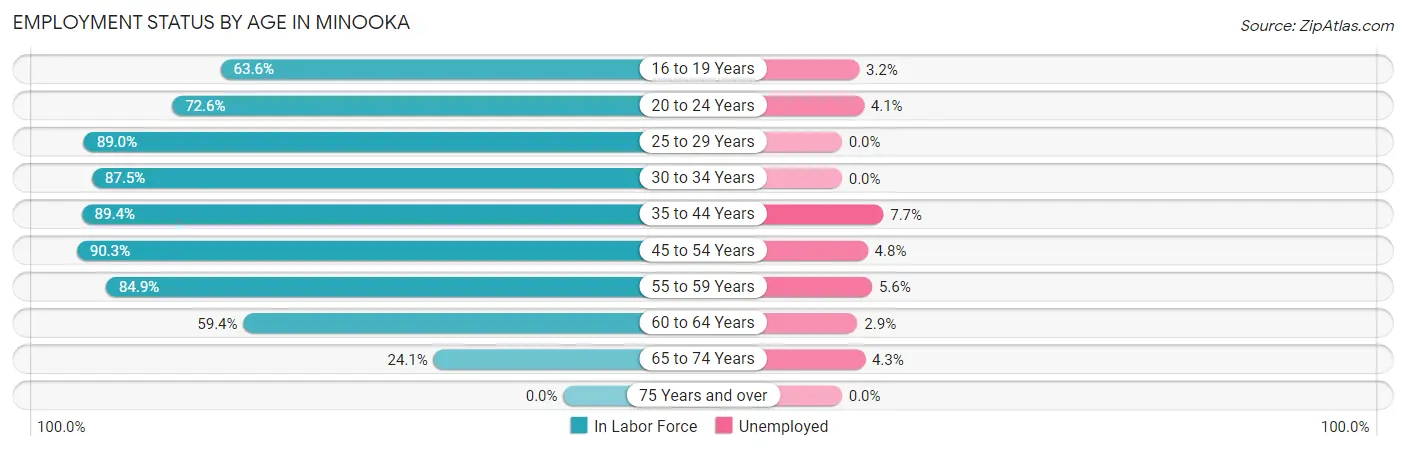
| Age Bracket | In Labor Force | Unemployed |
| 16 to 19 Years | 463 (63.6%) | 15 (3.2%) |
| 20 to 24 Years | 780 (72.6%) | 32 (4.1%) |
| 25 to 29 Years | 678 (89.0%) | 0 (0.0%) |
| 30 to 34 Years | 737 (87.5%) | 0 (0.0%) |
| 35 to 44 Years | 1,844 (89.4%) | 142 (7.7%) |
| 45 to 54 Years | 1,588 (90.3%) | 76 (4.8%) |
| 55 to 59 Years | 773 (84.9%) | 43 (5.6%) |
| 60 to 64 Years | 315 (59.4%) | 9 (2.9%) |
| 65 to 74 Years | 161 (24.1%) | 7 (4.3%) |
| 75 Years and over | 0 (0.0%) | 0 (0.0%) |
| Total | 7,337 (77.1%) | 323 (4.4%) |
Employment Status by Educational Attainment in Minooka
According to labor force statistics for Minooka, 86.4% of individuals (5,933) out of the total population between 25 and 64 years of age (6,867) are in the labor force, with 4.5% or 267 of them being unemployed. The group with the highest labor force participation rate are those with the educational attainment of bachelor's degree or higher, with 89.7% or 2,173 individuals in the labor force. Within the labor force, individuals with less than high school education have the highest percentage of unemployment, with 49.6% or 130 of them being unemployed.
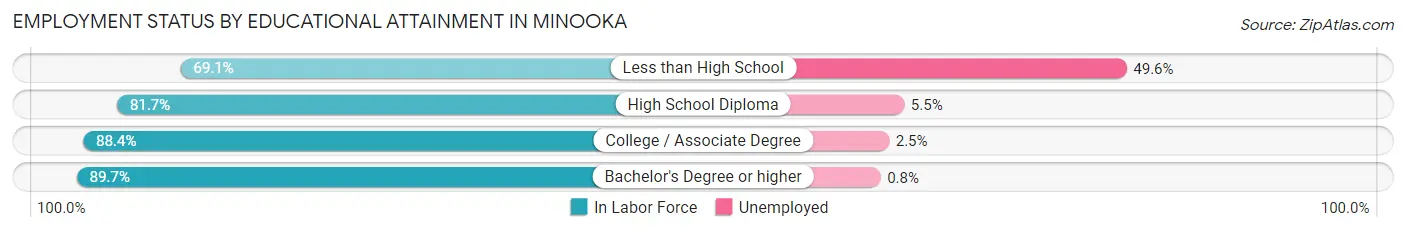
| Educational Attainment | In Labor Force | Unemployed |
| Less than High School | 262 (69.1%) | 188 (49.6%) |
| High School Diploma | 1,136 (81.7%) | 77 (5.5%) |
| College / Associate Degree | 2,365 (88.4%) | 67 (2.5%) |
| Bachelor's Degree or higher | 2,173 (89.7%) | 19 (0.8%) |
| Total | 5,933 (86.4%) | 309 (4.5%) |
Employment Occupations by Sex in Minooka
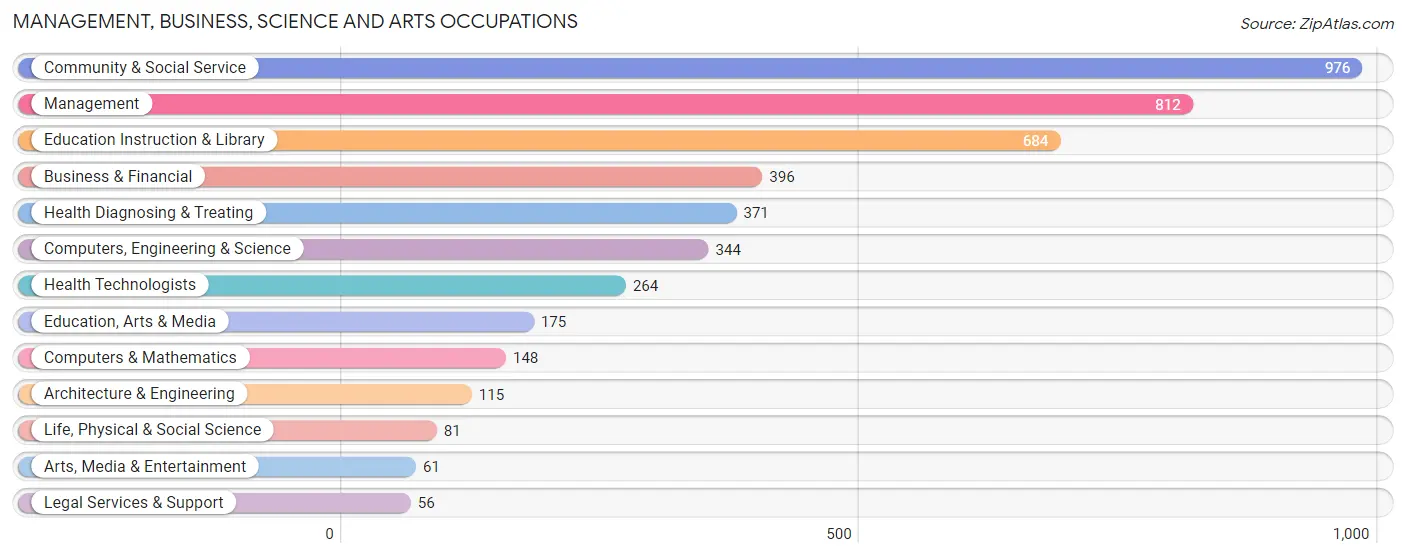
Management, Business, Science and Arts Occupations
The most common Management, Business, Science and Arts occupations in Minooka are Community & Social Service (976 | 13.9%), Management (812 | 11.6%), Education Instruction & Library (684 | 9.8%), Business & Financial (396 | 5.7%), and Health Diagnosing & Treating (371 | 5.3%).
Management, Business, Science and Arts Occupations by Sex
Within the Management, Business, Science and Arts occupations in Minooka, the most male-oriented occupations are Computers, Engineering & Science (100.0%), Computers & Mathematics (100.0%), and Architecture & Engineering (100.0%), while the most female-oriented occupations are Education, Arts & Media (100.0%), Health Technologists (93.6%), and Health Diagnosing & Treating (86.3%).
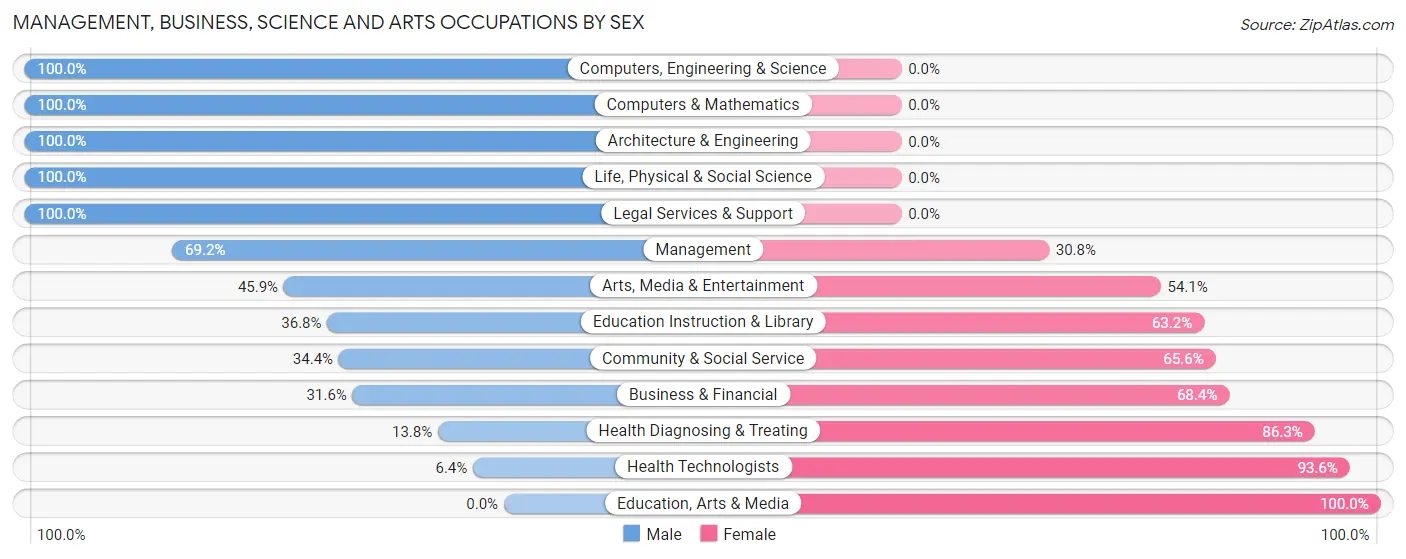
| Occupation | Male | Female |
| Management | 562 (69.2%) | 250 (30.8%) |
| Business & Financial | 125 (31.6%) | 271 (68.4%) |
| Computers, Engineering & Science | 344 (100.0%) | 0 (0.0%) |
| Computers & Mathematics | 148 (100.0%) | 0 (0.0%) |
| Architecture & Engineering | 115 (100.0%) | 0 (0.0%) |
| Life, Physical & Social Science | 81 (100.0%) | 0 (0.0%) |
| Community & Social Service | 336 (34.4%) | 640 (65.6%) |
| Education, Arts & Media | 0 (0.0%) | 175 (100.0%) |
| Legal Services & Support | 56 (100.0%) | 0 (0.0%) |
| Education Instruction & Library | 252 (36.8%) | 432 (63.2%) |
| Arts, Media & Entertainment | 28 (45.9%) | 33 (54.1%) |
| Health Diagnosing & Treating | 51 (13.8%) | 320 (86.3%) |
| Health Technologists | 17 (6.4%) | 247 (93.6%) |
| Total (Category) | 1,418 (48.9%) | 1,481 (51.1%) |
| Total (Overall) | 3,733 (53.3%) | 3,275 (46.7%) |
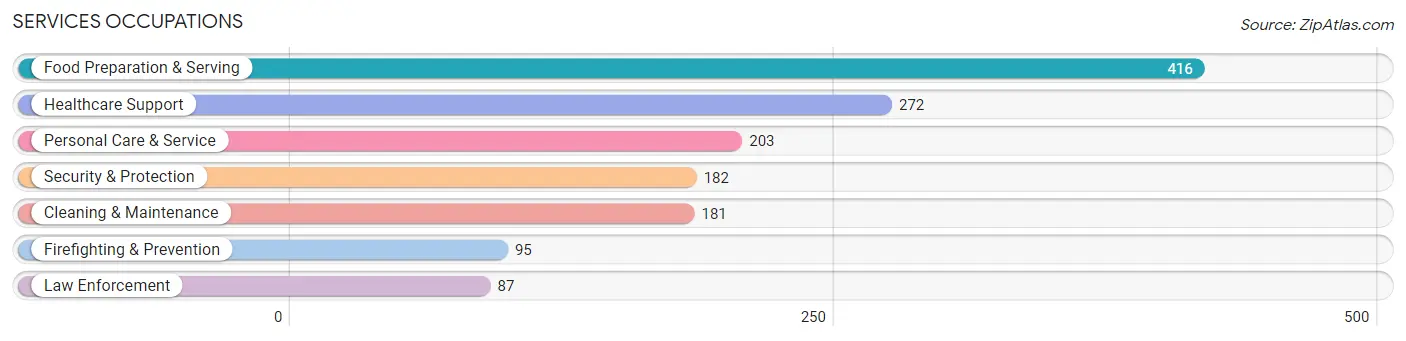
Services Occupations
The most common Services occupations in Minooka are Food Preparation & Serving (416 | 5.9%), Healthcare Support (272 | 3.9%), Personal Care & Service (203 | 2.9%), Security & Protection (182 | 2.6%), and Cleaning & Maintenance (181 | 2.6%).
Services Occupations by Sex
Within the Services occupations in Minooka, the most male-oriented occupations are Security & Protection (100.0%), Firefighting & Prevention (100.0%), and Law Enforcement (100.0%), while the most female-oriented occupations are Healthcare Support (97.4%), Personal Care & Service (94.1%), and Food Preparation & Serving (65.6%).
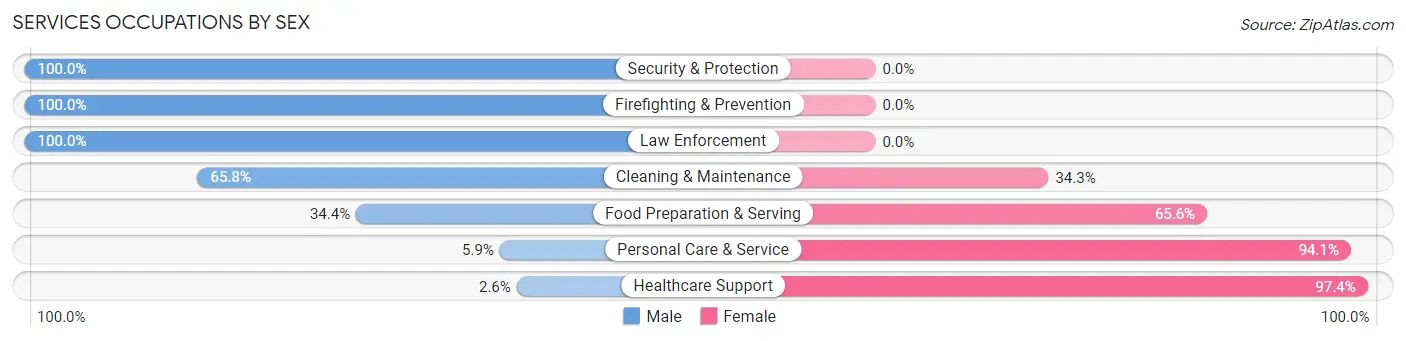
| Occupation | Male | Female |
| Healthcare Support | 7 (2.6%) | 265 (97.4%) |
| Security & Protection | 182 (100.0%) | 0 (0.0%) |
| Firefighting & Prevention | 95 (100.0%) | 0 (0.0%) |
| Law Enforcement | 87 (100.0%) | 0 (0.0%) |
| Food Preparation & Serving | 143 (34.4%) | 273 (65.6%) |
| Cleaning & Maintenance | 119 (65.7%) | 62 (34.3%) |
| Personal Care & Service | 12 (5.9%) | 191 (94.1%) |
| Total (Category) | 463 (36.9%) | 791 (63.1%) |
| Total (Overall) | 3,733 (53.3%) | 3,275 (46.7%) |
Sales and Office Occupations
The most common Sales and Office occupations in Minooka are Office & Administration (767 | 10.9%), and Sales & Related (478 | 6.8%).
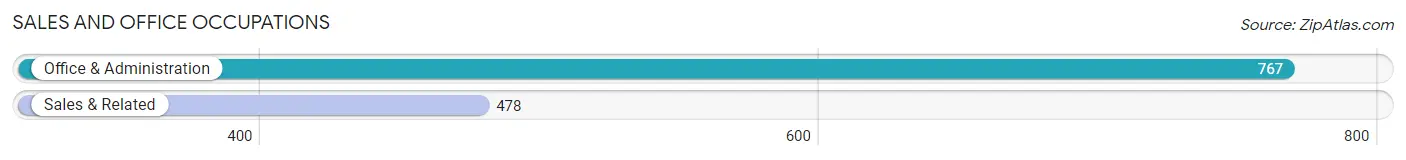
Sales and Office Occupations by Sex
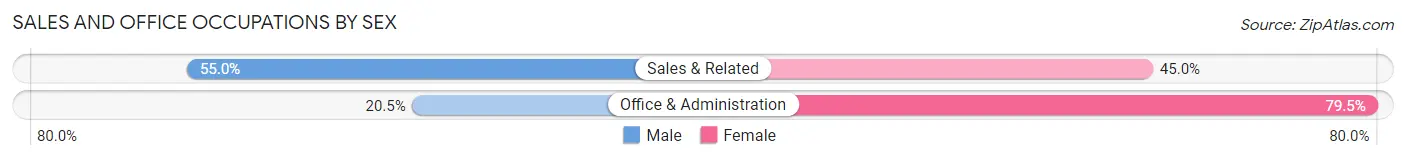
| Occupation | Male | Female |
| Sales & Related | 263 (55.0%) | 215 (45.0%) |
| Office & Administration | 157 (20.5%) | 610 (79.5%) |
| Total (Category) | 420 (33.7%) | 825 (66.3%) |
| Total (Overall) | 3,733 (53.3%) | 3,275 (46.7%) |
Natural Resources, Construction and Maintenance Occupations
The most common Natural Resources, Construction and Maintenance occupations in Minooka are Installation, Maintenance & Repair (346 | 4.9%), and Construction & Extraction (336 | 4.8%).
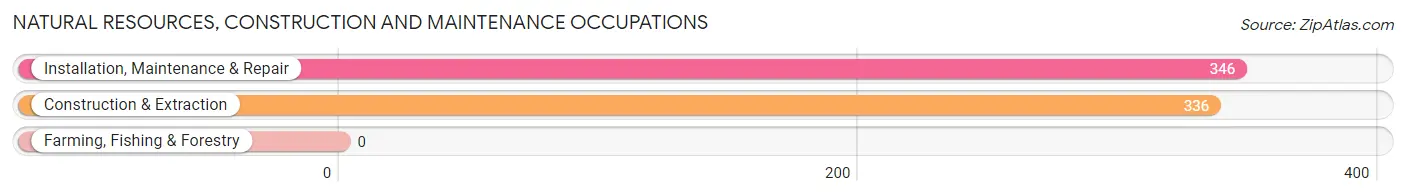
Natural Resources, Construction and Maintenance Occupations by Sex
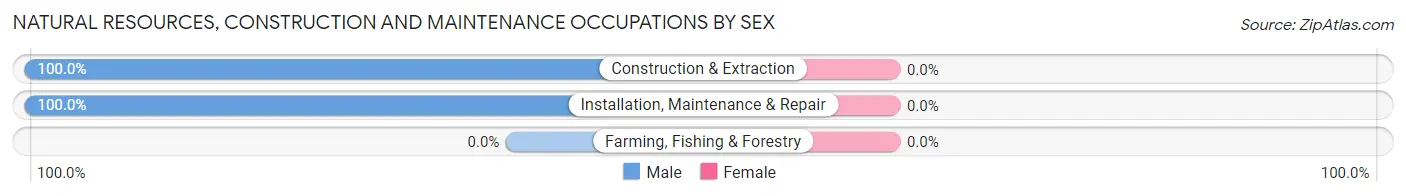
| Occupation | Male | Female |
| Farming, Fishing & Forestry | 0 (0.0%) | 0 (0.0%) |
| Construction & Extraction | 336 (100.0%) | 0 (0.0%) |
| Installation, Maintenance & Repair | 346 (100.0%) | 0 (0.0%) |
| Total (Category) | 682 (100.0%) | 0 (0.0%) |
| Total (Overall) | 3,733 (53.3%) | 3,275 (46.7%) |
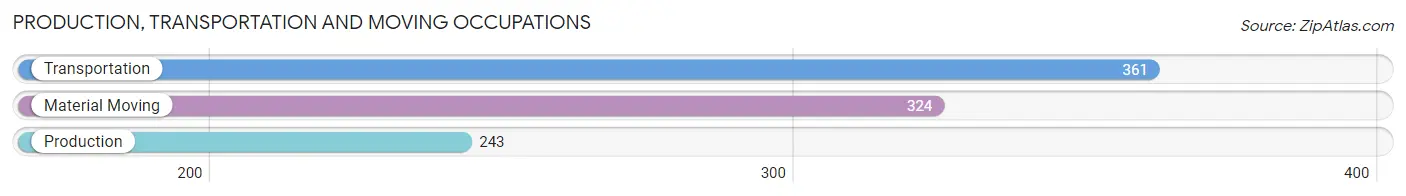
Production, Transportation and Moving Occupations
The most common Production, Transportation and Moving occupations in Minooka are Transportation (361 | 5.1%), Material Moving (324 | 4.6%), and Production (243 | 3.5%).
Production, Transportation and Moving Occupations by Sex
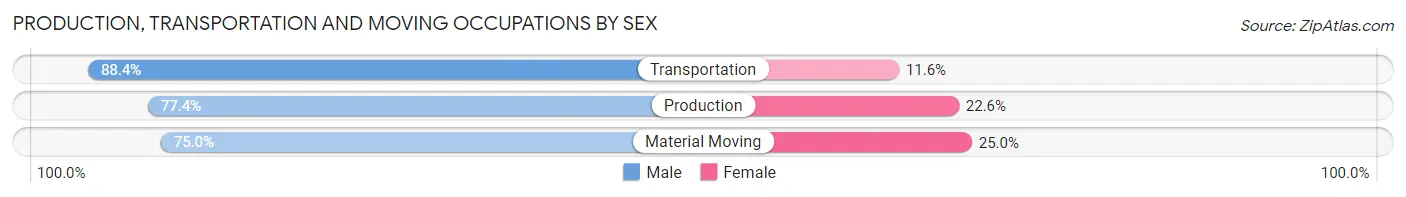
| Occupation | Male | Female |
| Production | 188 (77.4%) | 55 (22.6%) |
| Transportation | 319 (88.4%) | 42 (11.6%) |
| Material Moving | 243 (75.0%) | 81 (25.0%) |
| Total (Category) | 750 (80.8%) | 178 (19.2%) |
| Total (Overall) | 3,733 (53.3%) | 3,275 (46.7%) |
Employment Industries by Sex in Minooka
Employment Industries in Minooka
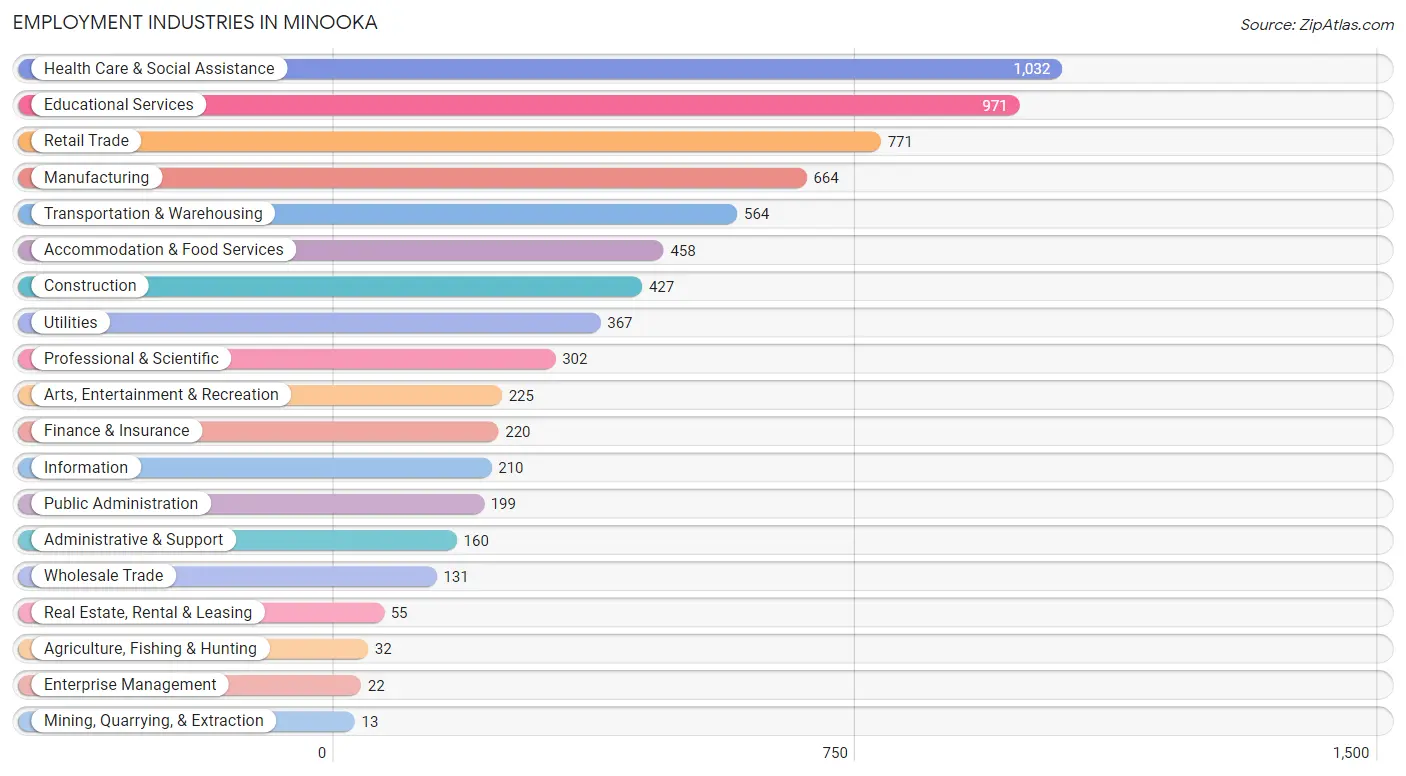
The major employment industries in Minooka include Health Care & Social Assistance (1,032 | 14.7%), Educational Services (971 | 13.9%), Retail Trade (771 | 11.0%), Manufacturing (664 | 9.5%), and Transportation & Warehousing (564 | 8.1%).
Employment Industries by Sex in Minooka
The Minooka industries that see more men than women are Mining, Quarrying, & Extraction (100.0%), Public Administration (97.5%), and Utilities (91.8%), whereas the industries that tend to have a higher number of women are Real Estate, Rental & Leasing (100.0%), Enterprise Management (100.0%), and Health Care & Social Assistance (91.2%).
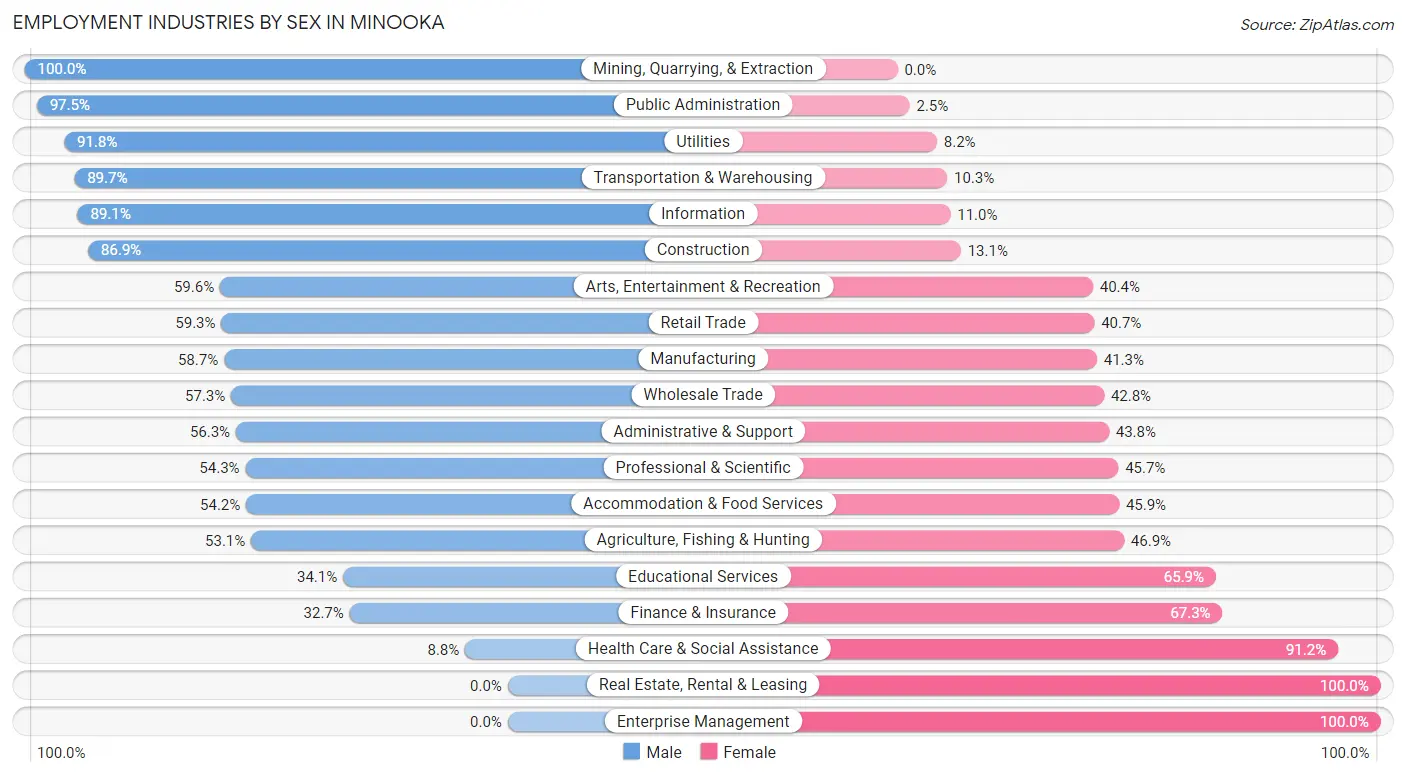
| Industry | Male | Female |
| Agriculture, Fishing & Hunting | 17 (53.1%) | 15 (46.9%) |
| Mining, Quarrying, & Extraction | 13 (100.0%) | 0 (0.0%) |
| Construction | 371 (86.9%) | 56 (13.1%) |
| Manufacturing | 390 (58.7%) | 274 (41.3%) |
| Wholesale Trade | 75 (57.3%) | 56 (42.7%) |
| Retail Trade | 457 (59.3%) | 314 (40.7%) |
| Transportation & Warehousing | 506 (89.7%) | 58 (10.3%) |
| Utilities | 337 (91.8%) | 30 (8.2%) |
| Information | 187 (89.0%) | 23 (11.0%) |
| Finance & Insurance | 72 (32.7%) | 148 (67.3%) |
| Real Estate, Rental & Leasing | 0 (0.0%) | 55 (100.0%) |
| Professional & Scientific | 164 (54.3%) | 138 (45.7%) |
| Enterprise Management | 0 (0.0%) | 22 (100.0%) |
| Administrative & Support | 90 (56.2%) | 70 (43.8%) |
| Educational Services | 331 (34.1%) | 640 (65.9%) |
| Health Care & Social Assistance | 91 (8.8%) | 941 (91.2%) |
| Arts, Entertainment & Recreation | 134 (59.6%) | 91 (40.4%) |
| Accommodation & Food Services | 248 (54.1%) | 210 (45.9%) |
| Public Administration | 194 (97.5%) | 5 (2.5%) |
| Total | 3,733 (53.3%) | 3,275 (46.7%) |
Education in Minooka
School Enrollment in Minooka
The most common levels of schooling among the 3,925 students in Minooka are high school (999 | 25.5%), elementary school (835 | 21.3%), and college / undergraduate (758 | 19.3%).
| School Level | # Students | % Students |
| Nursery / Preschool | 169 | 4.3% |
| Kindergarten | 247 | 6.3% |
| Elementary School | 835 | 21.3% |
| Middle School | 710 | 18.1% |
| High School | 999 | 25.5% |
| College / Undergraduate | 758 | 19.3% |
| Graduate / Professional | 207 | 5.3% |
| Total | 3,925 | 100.0% |
School Enrollment by Age by Funding Source in Minooka
Out of a total of 3,925 students who are enrolled in schools in Minooka, 467 (11.9%) attend a private institution, while the remaining 3,458 (88.1%) are enrolled in public schools. The age group of 25 to 34 year olds has the highest likelihood of being enrolled in private schools, with 183 (61.4% in the age bracket) enrolled. Conversely, the age group of 10 to 14 year olds has the lowest likelihood of being enrolled in a private school, with 1,013 (100.0% in the age bracket) attending a public institution.
| Age Bracket | Public School | Private School |
| 3 to 4 Year Olds | 107 (75.3%) | 35 (24.6%) |
| 5 to 9 Year Old | 981 (93.2%) | 71 (6.8%) |
| 10 to 14 Year Olds | 1,013 (100.0%) | 0 (0.0%) |
| 15 to 17 Year Olds | 628 (98.0%) | 13 (2.0%) |
| 18 to 19 Year Olds | 216 (89.6%) | 25 (10.4%) |
| 20 to 24 Year Olds | 299 (71.4%) | 120 (28.6%) |
| 25 to 34 Year Olds | 115 (38.6%) | 183 (61.4%) |
| 35 Years and over | 97 (81.5%) | 22 (18.5%) |
| Total | 3,458 (88.1%) | 467 (11.9%) |
Educational Attainment by Field of Study in Minooka
Business (692 | 24.5%), education (448 | 15.9%), science & technology (290 | 10.3%), social sciences (244 | 8.7%), and engineering (223 | 7.9%) are the most common fields of study among 2,819 individuals in Minooka who have obtained a bachelor's degree or higher.
| Field of Study | # Graduates | % Graduates |
| Computers & Mathematics | 66 | 2.3% |
| Bio, Nature & Agricultural | 122 | 4.3% |
| Physical & Health Sciences | 49 | 1.7% |
| Psychology | 192 | 6.8% |
| Social Sciences | 244 | 8.7% |
| Engineering | 223 | 7.9% |
| Multidisciplinary Studies | 59 | 2.1% |
| Science & Technology | 290 | 10.3% |
| Business | 692 | 24.5% |
| Education | 448 | 15.9% |
| Literature & Languages | 122 | 4.3% |
| Liberal Arts & History | 65 | 2.3% |
| Visual & Performing Arts | 34 | 1.2% |
| Communications | 73 | 2.6% |
| Arts & Humanities | 140 | 5.0% |
| Total | 2,819 | 100.0% |
Transportation & Commute in Minooka
Vehicle Availability by Sex in Minooka
The most prevalent vehicle ownership categories in Minooka are males with 2 vehicles (1,656, accounting for 45.5%) and females with 2 vehicles (1,276, making up 51.2%).
| Vehicles Available | Male | Female |
| No Vehicle | 20 (0.5%) | 31 (1.0%) |
| 1 Vehicle | 172 (4.7%) | 334 (10.3%) |
| 2 Vehicles | 1,656 (45.5%) | 1,276 (39.4%) |
| 3 Vehicles | 971 (26.7%) | 753 (23.3%) |
| 4 Vehicles | 728 (20.0%) | 787 (24.3%) |
| 5 or more Vehicles | 93 (2.5%) | 55 (1.7%) |
| Total | 3,640 (100.0%) | 3,236 (100.0%) |
Commute Time in Minooka
The most frequently occuring commute durations in Minooka are 20 to 24 minutes (1,011 commuters, 16.1%), 30 to 34 minutes (937 commuters, 14.9%), and 25 to 29 minutes (731 commuters, 11.6%).
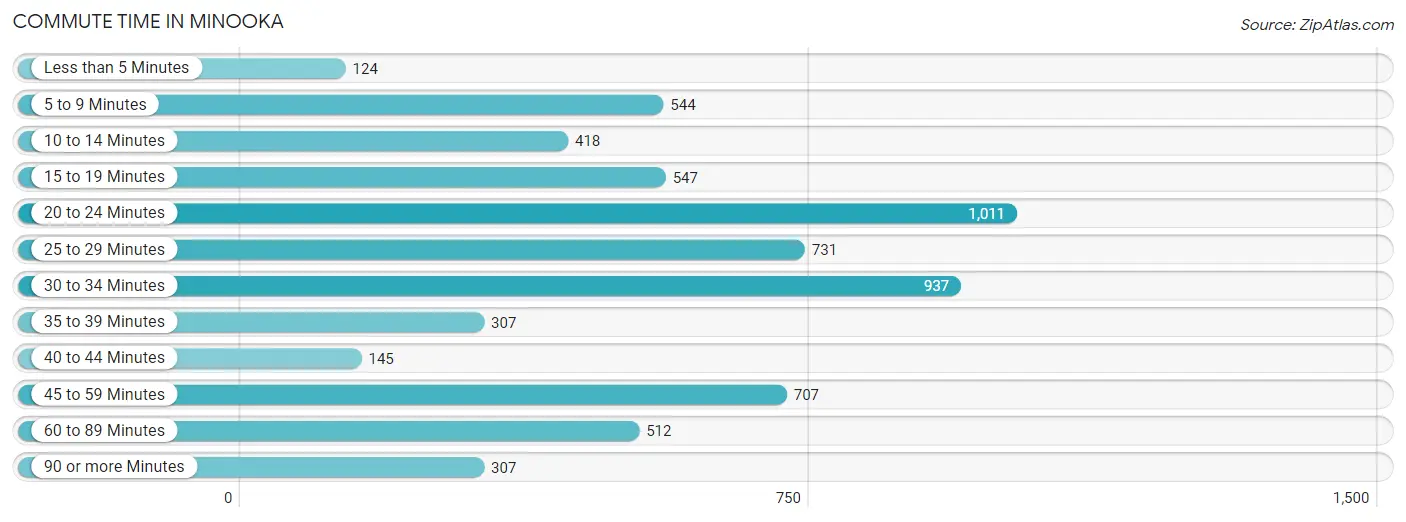
| Commute Time | # Commuters | % Commuters |
| Less than 5 Minutes | 124 | 2.0% |
| 5 to 9 Minutes | 544 | 8.6% |
| 10 to 14 Minutes | 418 | 6.7% |
| 15 to 19 Minutes | 547 | 8.7% |
| 20 to 24 Minutes | 1,011 | 16.1% |
| 25 to 29 Minutes | 731 | 11.6% |
| 30 to 34 Minutes | 937 | 14.9% |
| 35 to 39 Minutes | 307 | 4.9% |
| 40 to 44 Minutes | 145 | 2.3% |
| 45 to 59 Minutes | 707 | 11.2% |
| 60 to 89 Minutes | 512 | 8.1% |
| 90 or more Minutes | 307 | 4.9% |
Commute Time by Sex in Minooka
The most common commute times in Minooka are 30 to 34 minutes (609 commuters, 18.2%) for males and 20 to 24 minutes (489 commuters, 16.6%) for females.
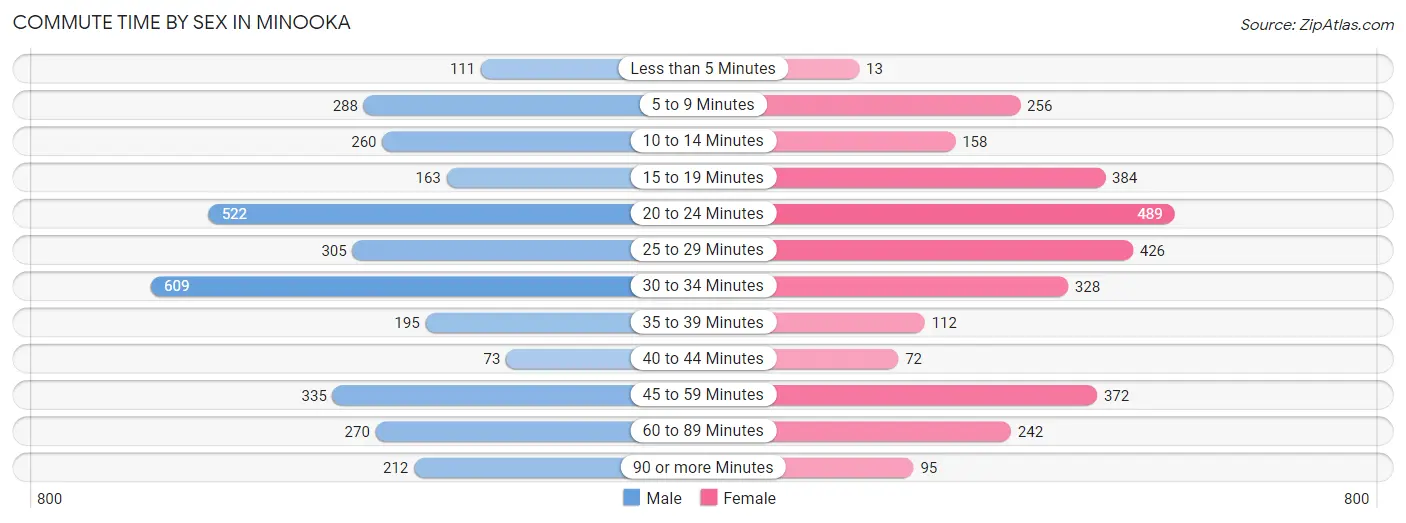
| Commute Time | Male | Female |
| Less than 5 Minutes | 111 (3.3%) | 13 (0.4%) |
| 5 to 9 Minutes | 288 (8.6%) | 256 (8.7%) |
| 10 to 14 Minutes | 260 (7.8%) | 158 (5.4%) |
| 15 to 19 Minutes | 163 (4.9%) | 384 (13.0%) |
| 20 to 24 Minutes | 522 (15.6%) | 489 (16.6%) |
| 25 to 29 Minutes | 305 (9.1%) | 426 (14.5%) |
| 30 to 34 Minutes | 609 (18.2%) | 328 (11.1%) |
| 35 to 39 Minutes | 195 (5.8%) | 112 (3.8%) |
| 40 to 44 Minutes | 73 (2.2%) | 72 (2.4%) |
| 45 to 59 Minutes | 335 (10.0%) | 372 (12.6%) |
| 60 to 89 Minutes | 270 (8.1%) | 242 (8.2%) |
| 90 or more Minutes | 212 (6.3%) | 95 (3.2%) |
Time of Departure to Work by Sex in Minooka
The most frequent times of departure to work in Minooka are 6:00 AM to 6:29 AM (545, 16.3%) for males and 8:00 AM to 8:29 AM (694, 23.5%) for females.
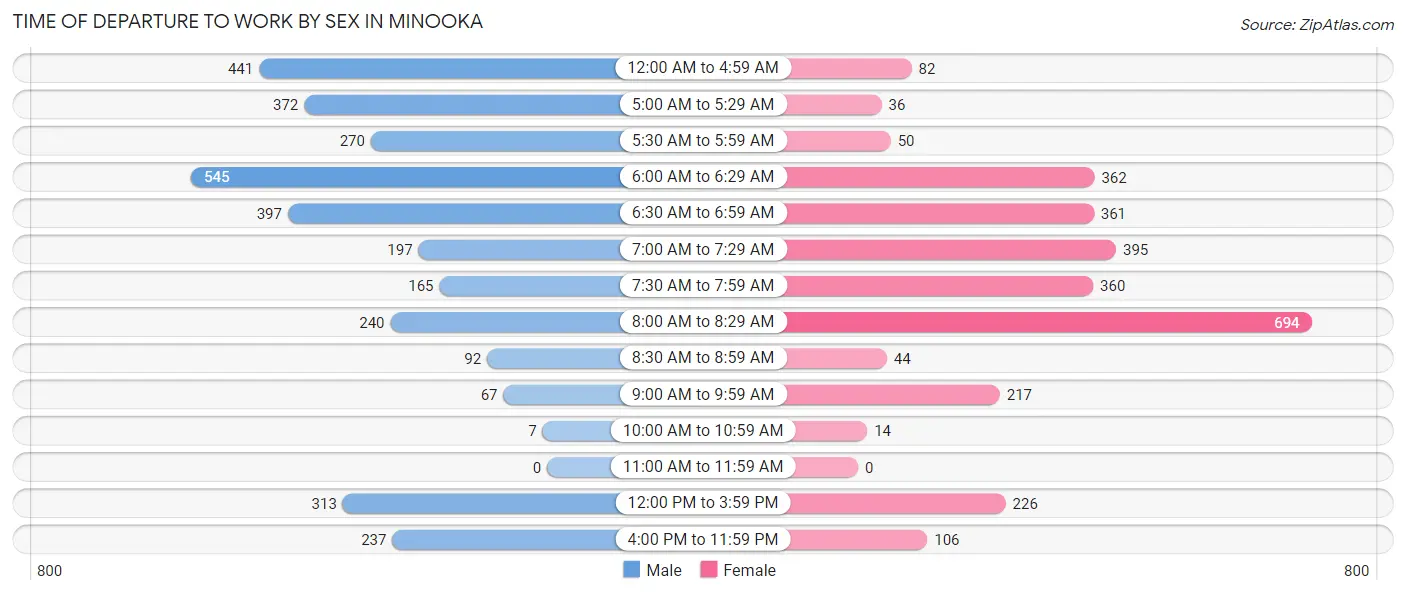
| Time of Departure | Male | Female |
| 12:00 AM to 4:59 AM | 441 (13.2%) | 82 (2.8%) |
| 5:00 AM to 5:29 AM | 372 (11.1%) | 36 (1.2%) |
| 5:30 AM to 5:59 AM | 270 (8.1%) | 50 (1.7%) |
| 6:00 AM to 6:29 AM | 545 (16.3%) | 362 (12.3%) |
| 6:30 AM to 6:59 AM | 397 (11.9%) | 361 (12.2%) |
| 7:00 AM to 7:29 AM | 197 (5.9%) | 395 (13.4%) |
| 7:30 AM to 7:59 AM | 165 (4.9%) | 360 (12.2%) |
| 8:00 AM to 8:29 AM | 240 (7.2%) | 694 (23.5%) |
| 8:30 AM to 8:59 AM | 92 (2.8%) | 44 (1.5%) |
| 9:00 AM to 9:59 AM | 67 (2.0%) | 217 (7.4%) |
| 10:00 AM to 10:59 AM | 7 (0.2%) | 14 (0.5%) |
| 11:00 AM to 11:59 AM | 0 (0.0%) | 0 (0.0%) |
| 12:00 PM to 3:59 PM | 313 (9.4%) | 226 (7.7%) |
| 4:00 PM to 11:59 PM | 237 (7.1%) | 106 (3.6%) |
| Total | 3,343 (100.0%) | 2,947 (100.0%) |
Housing Occupancy in Minooka
Occupancy by Ownership in Minooka
Of the total 4,126 dwellings in Minooka, owner-occupied units account for 3,937 (95.4%), while renter-occupied units make up 189 (4.6%).
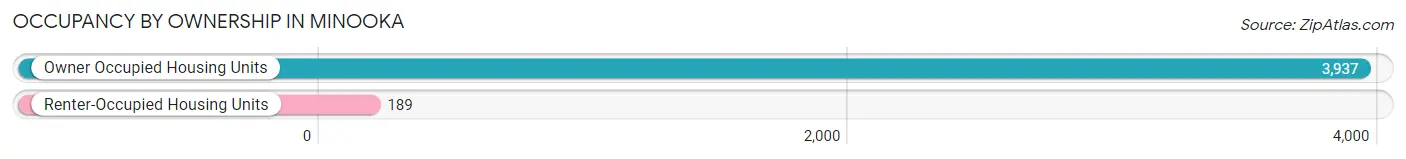
| Occupancy | # Housing Units | % Housing Units |
| Owner Occupied Housing Units | 3,937 | 95.4% |
| Renter-Occupied Housing Units | 189 | 4.6% |
| Total Occupied Housing Units | 4,126 | 100.0% |
Occupancy by Household Size in Minooka
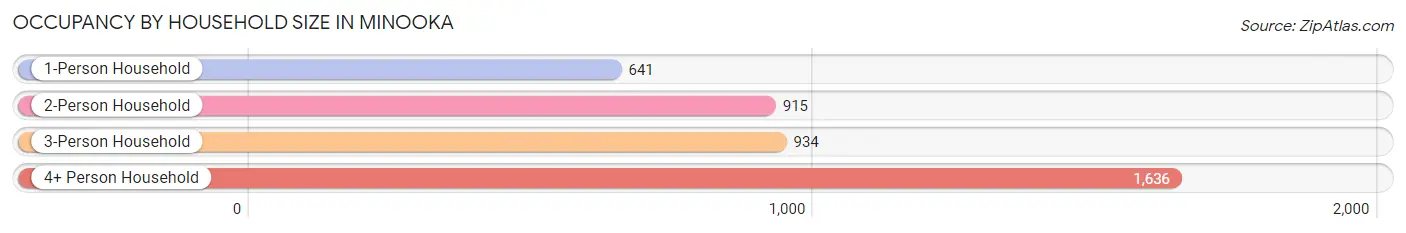
| Household Size | # Housing Units | % Housing Units |
| 1-Person Household | 641 | 15.5% |
| 2-Person Household | 915 | 22.2% |
| 3-Person Household | 934 | 22.6% |
| 4+ Person Household | 1,636 | 39.7% |
| Total Housing Units | 4,126 | 100.0% |
Occupancy by Ownership by Household Size in Minooka
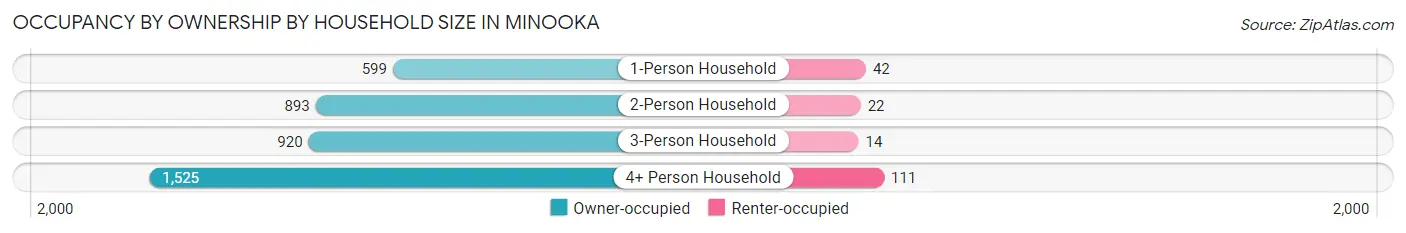
| Household Size | Owner-occupied | Renter-occupied |
| 1-Person Household | 599 (93.4%) | 42 (6.6%) |
| 2-Person Household | 893 (97.6%) | 22 (2.4%) |
| 3-Person Household | 920 (98.5%) | 14 (1.5%) |
| 4+ Person Household | 1,525 (93.2%) | 111 (6.8%) |
| Total Housing Units | 3,937 (95.4%) | 189 (4.6%) |
Occupancy by Educational Attainment in Minooka
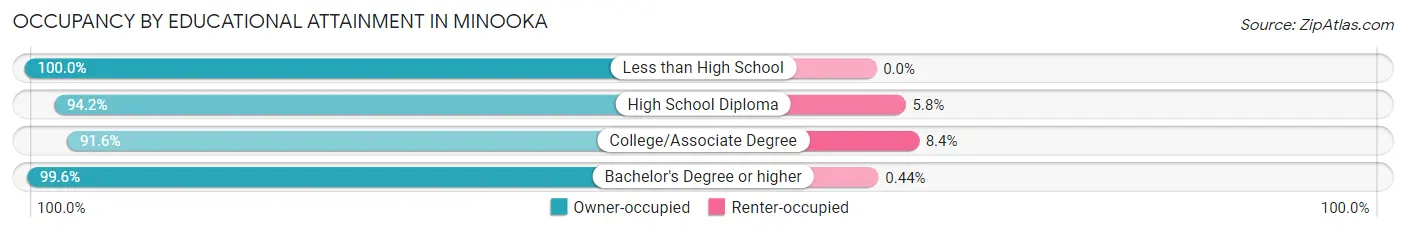
| Household Size | Owner-occupied | Renter-occupied |
| Less than High School | 141 (100.0%) | 0 (0.0%) |
| High School Diploma | 776 (94.2%) | 48 (5.8%) |
| College/Associate Degree | 1,453 (91.6%) | 134 (8.4%) |
| Bachelor's Degree or higher | 1,567 (99.6%) | 7 (0.4%) |
Occupancy by Age of Householder in Minooka
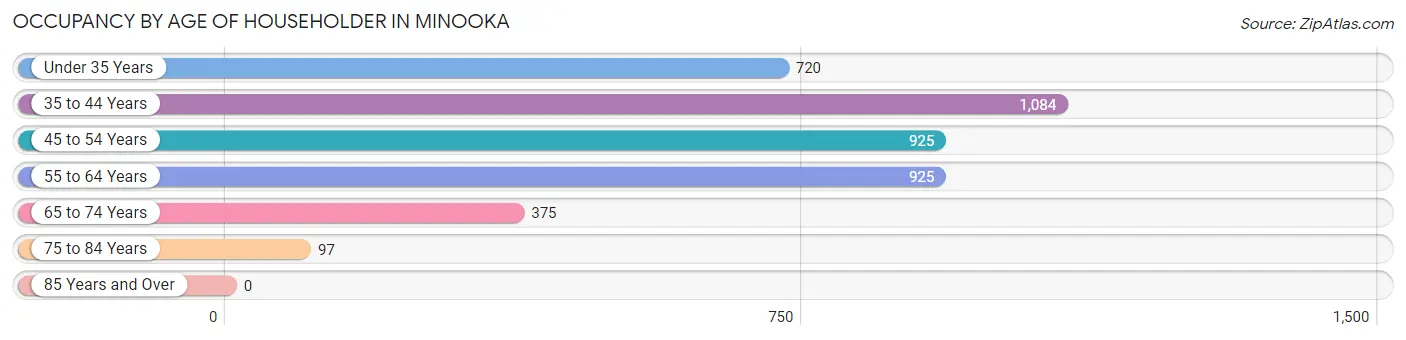
| Age Bracket | # Households | % Households |
| Under 35 Years | 720 | 17.4% |
| 35 to 44 Years | 1,084 | 26.3% |
| 45 to 54 Years | 925 | 22.4% |
| 55 to 64 Years | 925 | 22.4% |
| 65 to 74 Years | 375 | 9.1% |
| 75 to 84 Years | 97 | 2.4% |
| 85 Years and Over | 0 | 0.0% |
| Total | 4,126 | 100.0% |
Housing Finances in Minooka
Median Income by Occupancy in Minooka
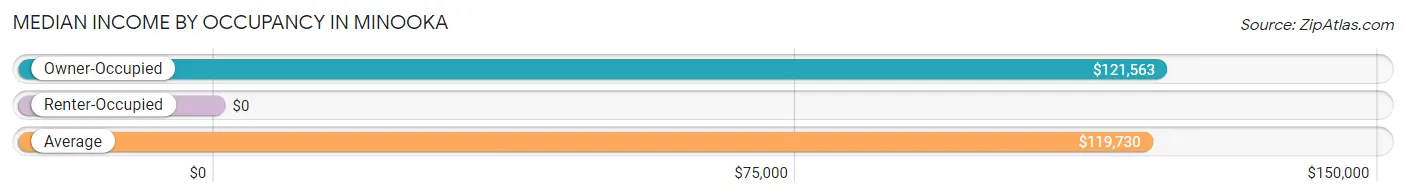
| Occupancy Type | # Households | Median Income |
| Owner-Occupied | 3,937 (95.4%) | $121,563 |
| Renter-Occupied | 189 (4.6%) | $0 |
| Average | 4,126 (100.0%) | $119,730 |
Occupancy by Householder Income Bracket in Minooka
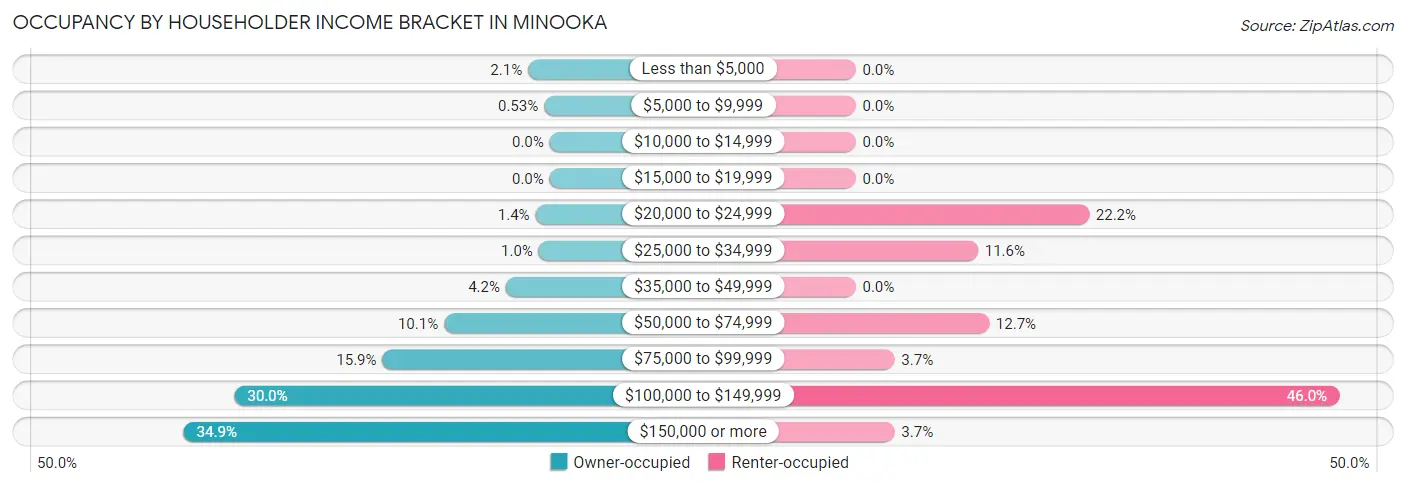
| Income Bracket | Owner-occupied | Renter-occupied |
| Less than $5,000 | 81 (2.1%) | 0 (0.0%) |
| $5,000 to $9,999 | 21 (0.5%) | 0 (0.0%) |
| $10,000 to $14,999 | 0 (0.0%) | 0 (0.0%) |
| $15,000 to $19,999 | 0 (0.0%) | 0 (0.0%) |
| $20,000 to $24,999 | 53 (1.3%) | 42 (22.2%) |
| $25,000 to $34,999 | 41 (1.0%) | 22 (11.6%) |
| $35,000 to $49,999 | 164 (4.2%) | 0 (0.0%) |
| $50,000 to $74,999 | 396 (10.1%) | 24 (12.7%) |
| $75,000 to $99,999 | 627 (15.9%) | 7 (3.7%) |
| $100,000 to $149,999 | 1,182 (30.0%) | 87 (46.0%) |
| $150,000 or more | 1,372 (34.8%) | 7 (3.7%) |
| Total | 3,937 (100.0%) | 189 (100.0%) |
Monthly Housing Cost Tiers in Minooka
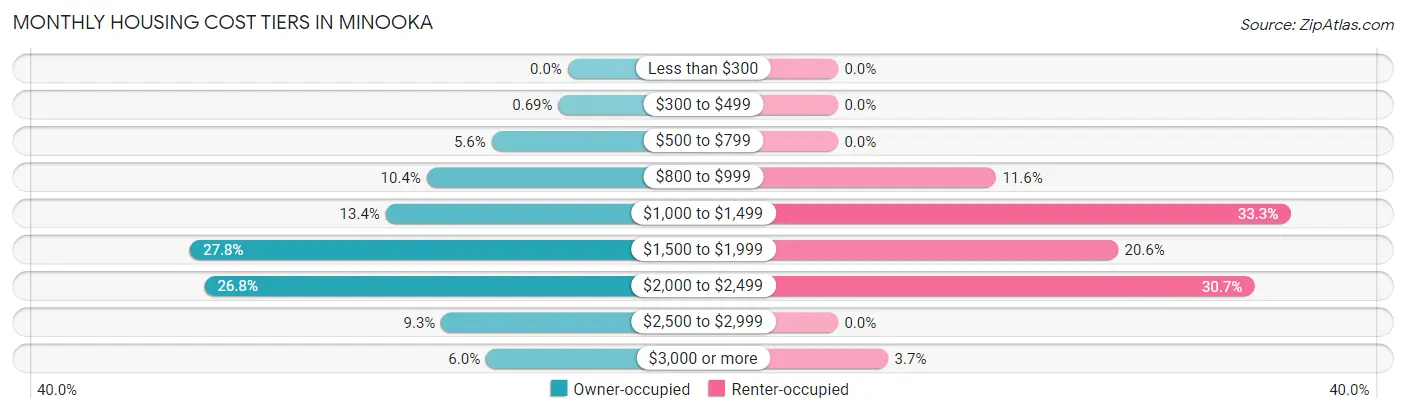
| Monthly Cost | Owner-occupied | Renter-occupied |
| Less than $300 | 0 (0.0%) | 0 (0.0%) |
| $300 to $499 | 27 (0.7%) | 0 (0.0%) |
| $500 to $799 | 221 (5.6%) | 0 (0.0%) |
| $800 to $999 | 409 (10.4%) | 22 (11.6%) |
| $1,000 to $1,499 | 528 (13.4%) | 63 (33.3%) |
| $1,500 to $1,999 | 1,095 (27.8%) | 39 (20.6%) |
| $2,000 to $2,499 | 1,053 (26.8%) | 58 (30.7%) |
| $2,500 to $2,999 | 367 (9.3%) | 0 (0.0%) |
| $3,000 or more | 237 (6.0%) | 7 (3.7%) |
| Total | 3,937 (100.0%) | 189 (100.0%) |
Physical Housing Characteristics in Minooka
Housing Structures in Minooka
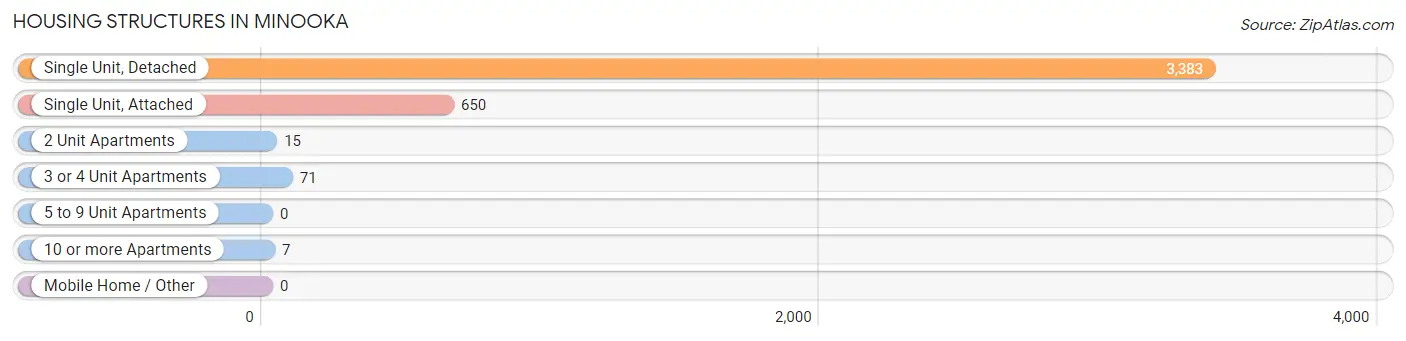
| Structure Type | # Housing Units | % Housing Units |
| Single Unit, Detached | 3,383 | 82.0% |
| Single Unit, Attached | 650 | 15.8% |
| 2 Unit Apartments | 15 | 0.4% |
| 3 or 4 Unit Apartments | 71 | 1.7% |
| 5 to 9 Unit Apartments | 0 | 0.0% |
| 10 or more Apartments | 7 | 0.2% |
| Mobile Home / Other | 0 | 0.0% |
| Total | 4,126 | 100.0% |
Housing Structures by Occupancy in Minooka
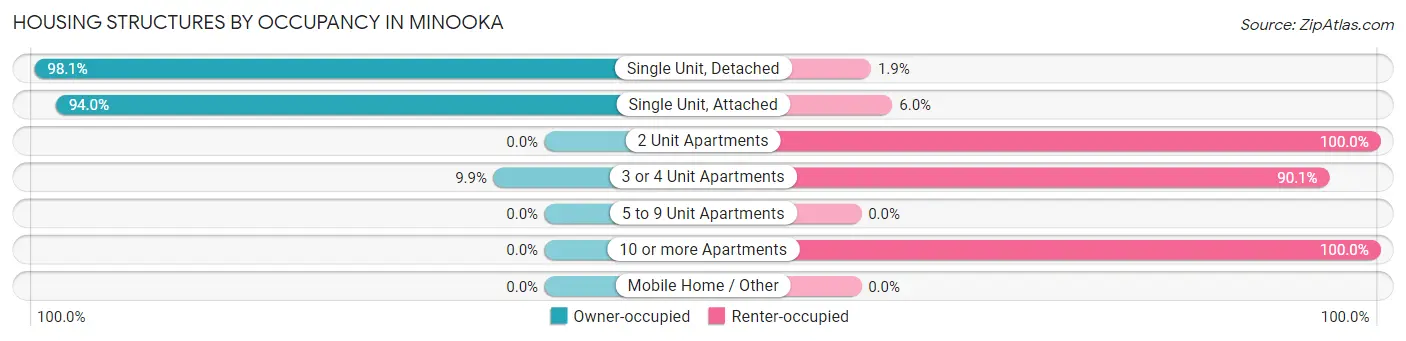
| Structure Type | Owner-occupied | Renter-occupied |
| Single Unit, Detached | 3,319 (98.1%) | 64 (1.9%) |
| Single Unit, Attached | 611 (94.0%) | 39 (6.0%) |
| 2 Unit Apartments | 0 (0.0%) | 15 (100.0%) |
| 3 or 4 Unit Apartments | 7 (9.9%) | 64 (90.1%) |
| 5 to 9 Unit Apartments | 0 (0.0%) | 0 (0.0%) |
| 10 or more Apartments | 0 (0.0%) | 7 (100.0%) |
| Mobile Home / Other | 0 (0.0%) | 0 (0.0%) |
| Total | 3,937 (95.4%) | 189 (4.6%) |
Housing Structures by Number of Rooms in Minooka
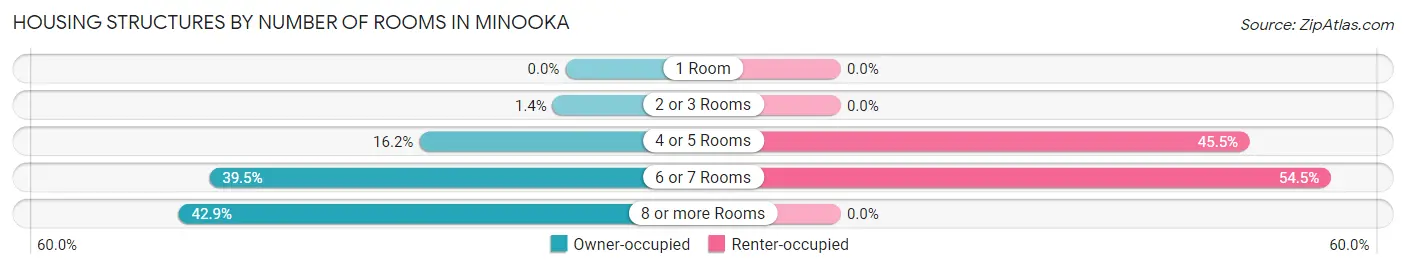
| Number of Rooms | Owner-occupied | Renter-occupied |
| 1 Room | 0 (0.0%) | 0 (0.0%) |
| 2 or 3 Rooms | 55 (1.4%) | 0 (0.0%) |
| 4 or 5 Rooms | 638 (16.2%) | 86 (45.5%) |
| 6 or 7 Rooms | 1,555 (39.5%) | 103 (54.5%) |
| 8 or more Rooms | 1,689 (42.9%) | 0 (0.0%) |
| Total | 3,937 (100.0%) | 189 (100.0%) |
Housing Structure by Heating Type in Minooka
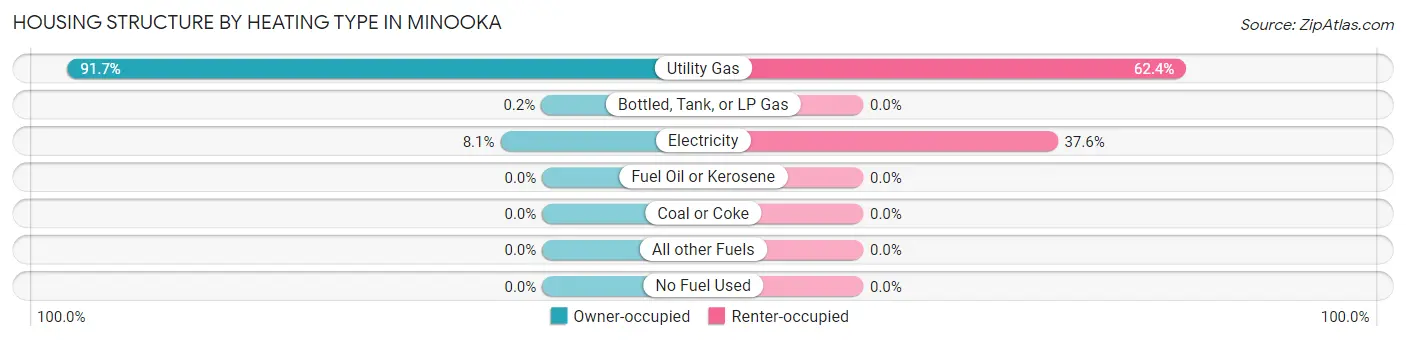
| Heating Type | Owner-occupied | Renter-occupied |
| Utility Gas | 3,611 (91.7%) | 118 (62.4%) |
| Bottled, Tank, or LP Gas | 8 (0.2%) | 0 (0.0%) |
| Electricity | 318 (8.1%) | 71 (37.6%) |
| Fuel Oil or Kerosene | 0 (0.0%) | 0 (0.0%) |
| Coal or Coke | 0 (0.0%) | 0 (0.0%) |
| All other Fuels | 0 (0.0%) | 0 (0.0%) |
| No Fuel Used | 0 (0.0%) | 0 (0.0%) |
| Total | 3,937 (100.0%) | 189 (100.0%) |
Household Vehicle Usage in Minooka
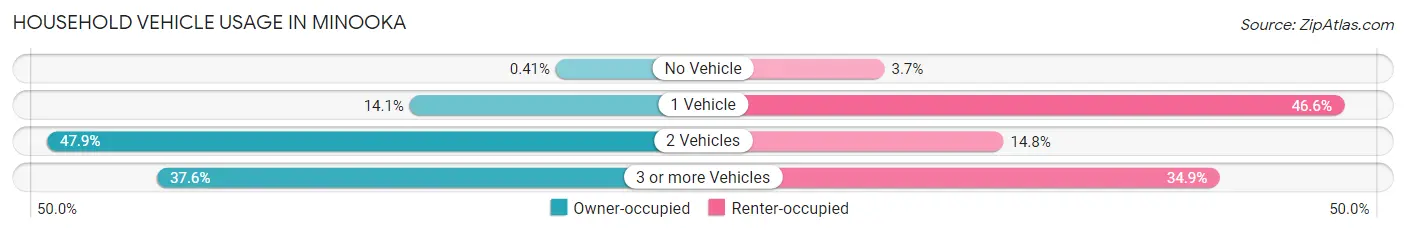
| Vehicles per Household | Owner-occupied | Renter-occupied |
| No Vehicle | 16 (0.4%) | 7 (3.7%) |
| 1 Vehicle | 553 (14.1%) | 88 (46.6%) |
| 2 Vehicles | 1,886 (47.9%) | 28 (14.8%) |
| 3 or more Vehicles | 1,482 (37.6%) | 66 (34.9%) |
| Total | 3,937 (100.0%) | 189 (100.0%) |
Real Estate & Mortgages in Minooka
Real Estate and Mortgage Overview in Minooka
| Characteristic | Without Mortgage | With Mortgage |
| Housing Units | 782 | 3,155 |
| Median Property Value | $269,900 | $265,600 |
| Median Household Income | $113,500 | $1,111 |
| Monthly Housing Costs | $888 | $237 |
| Real Estate Taxes | $6,308 | $16 |
Property Value by Mortgage Status in Minooka
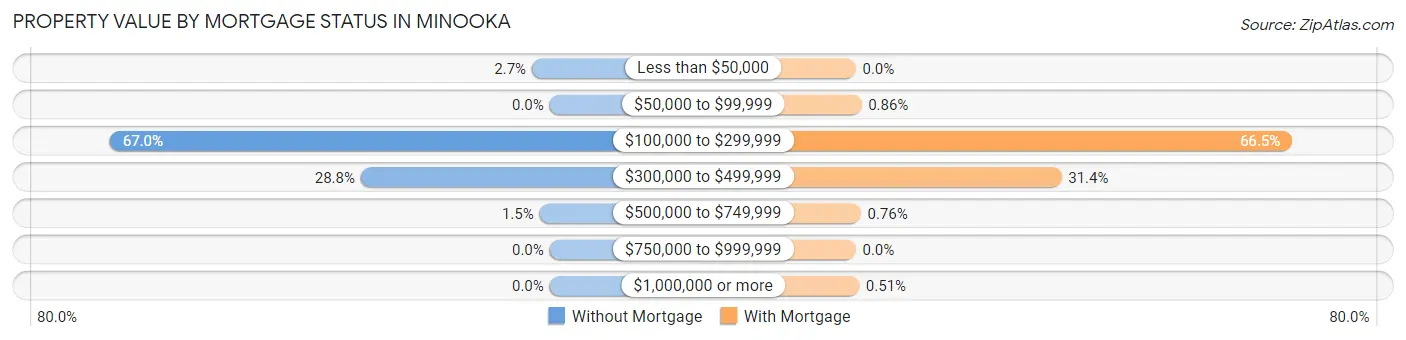
| Property Value | Without Mortgage | With Mortgage |
| Less than $50,000 | 21 (2.7%) | 0 (0.0%) |
| $50,000 to $99,999 | 0 (0.0%) | 27 (0.9%) |
| $100,000 to $299,999 | 524 (67.0%) | 2,099 (66.5%) |
| $300,000 to $499,999 | 225 (28.8%) | 989 (31.4%) |
| $500,000 to $749,999 | 12 (1.5%) | 24 (0.8%) |
| $750,000 to $999,999 | 0 (0.0%) | 0 (0.0%) |
| $1,000,000 or more | 0 (0.0%) | 16 (0.5%) |
| Total | 782 (100.0%) | 3,155 (100.0%) |
Household Income by Mortgage Status in Minooka
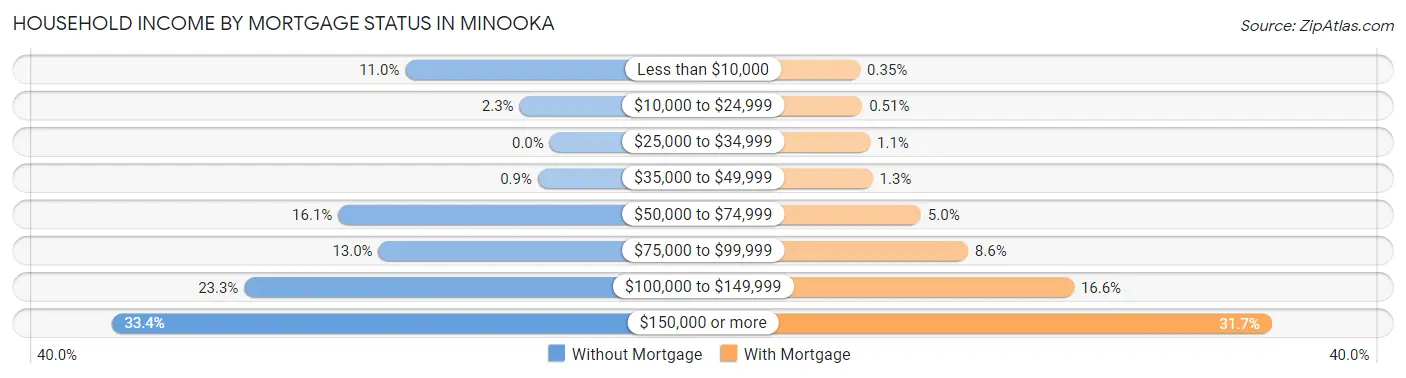
| Household Income | Without Mortgage | With Mortgage |
| Less than $10,000 | 86 (11.0%) | 11 (0.4%) |
| $10,000 to $24,999 | 18 (2.3%) | 16 (0.5%) |
| $25,000 to $34,999 | 0 (0.0%) | 35 (1.1%) |
| $35,000 to $49,999 | 7 (0.9%) | 41 (1.3%) |
| $50,000 to $74,999 | 126 (16.1%) | 157 (5.0%) |
| $75,000 to $99,999 | 102 (13.0%) | 270 (8.6%) |
| $100,000 to $149,999 | 182 (23.3%) | 525 (16.6%) |
| $150,000 or more | 261 (33.4%) | 1,000 (31.7%) |
| Total | 782 (100.0%) | 3,155 (100.0%) |
Property Value to Household Income Ratio in Minooka
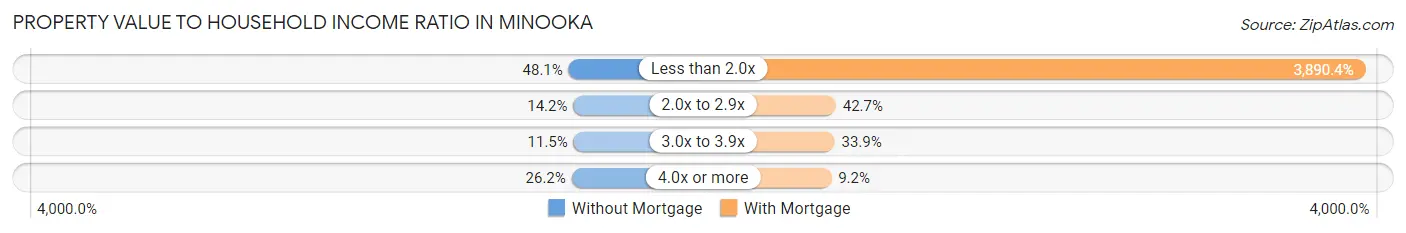
| Value-to-Income Ratio | Without Mortgage | With Mortgage |
| Less than 2.0x | 376 (48.1%) | 122,741 (3,890.4%) |
| 2.0x to 2.9x | 111 (14.2%) | 1,348 (42.7%) |
| 3.0x to 3.9x | 90 (11.5%) | 1,069 (33.9%) |
| 4.0x or more | 205 (26.2%) | 289 (9.2%) |
| Total | 782 (100.0%) | 3,155 (100.0%) |
Real Estate Taxes by Mortgage Status in Minooka
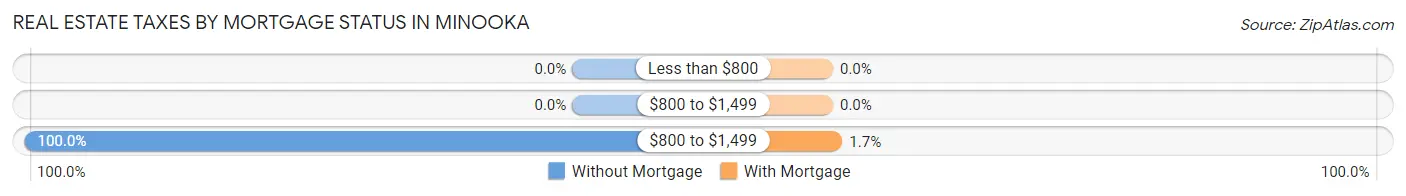
| Property Taxes | Without Mortgage | With Mortgage |
| Less than $800 | 0 (0.0%) | 0 (0.0%) |
| $800 to $1,499 | 0 (0.0%) | 0 (0.0%) |
| $800 to $1,499 | 782 (100.0%) | 54 (1.7%) |
| Total | 782 (100.0%) | 3,155 (100.0%) |
Health & Disability in Minooka
Health Insurance Coverage by Age in Minooka
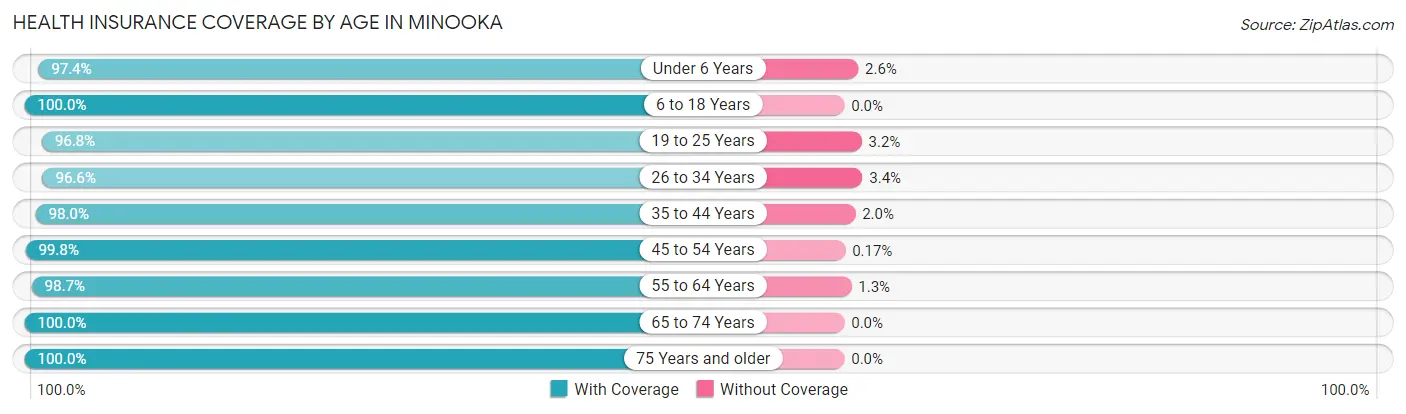
| Age Bracket | With Coverage | Without Coverage |
| Under 6 Years | 985 (97.4%) | 26 (2.6%) |
| 6 to 18 Years | 2,716 (100.0%) | 0 (0.0%) |
| 19 to 25 Years | 1,172 (96.8%) | 39 (3.2%) |
| 26 to 34 Years | 1,494 (96.6%) | 52 (3.4%) |
| 35 to 44 Years | 2,021 (98.0%) | 42 (2.0%) |
| 45 to 54 Years | 1,756 (99.8%) | 3 (0.2%) |
| 55 to 64 Years | 1,422 (98.7%) | 19 (1.3%) |
| 65 to 74 Years | 669 (100.0%) | 0 (0.0%) |
| 75 Years and older | 177 (100.0%) | 0 (0.0%) |
| Total | 12,412 (98.6%) | 181 (1.4%) |
Health Insurance Coverage by Citizenship Status in Minooka
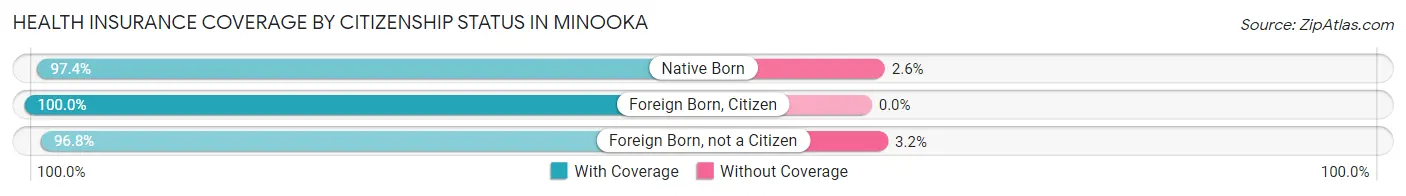
| Citizenship Status | With Coverage | Without Coverage |
| Native Born | 985 (97.4%) | 26 (2.6%) |
| Foreign Born, Citizen | 2,716 (100.0%) | 0 (0.0%) |
| Foreign Born, not a Citizen | 1,172 (96.8%) | 39 (3.2%) |
Health Insurance Coverage by Household Income in Minooka
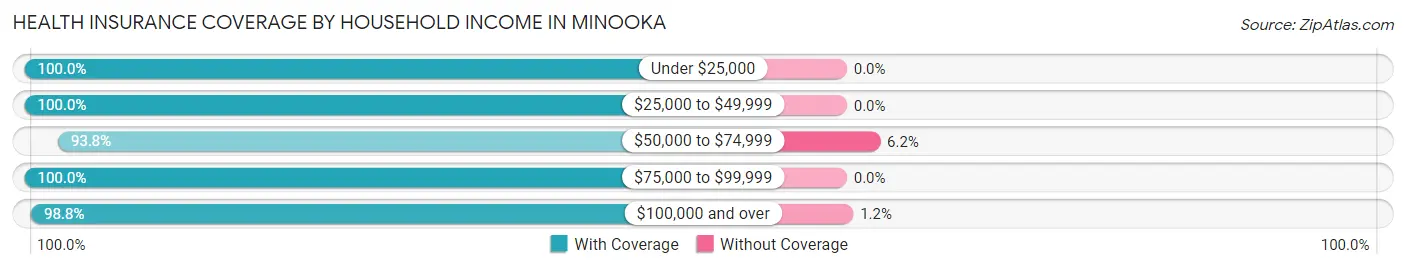
| Household Income | With Coverage | Without Coverage |
| Under $25,000 | 333 (100.0%) | 0 (0.0%) |
| $25,000 to $49,999 | 524 (100.0%) | 0 (0.0%) |
| $50,000 to $74,999 | 1,021 (93.8%) | 68 (6.2%) |
| $75,000 to $99,999 | 1,526 (100.0%) | 0 (0.0%) |
| $100,000 and over | 8,994 (98.8%) | 110 (1.2%) |
Public vs Private Health Insurance Coverage by Age in Minooka
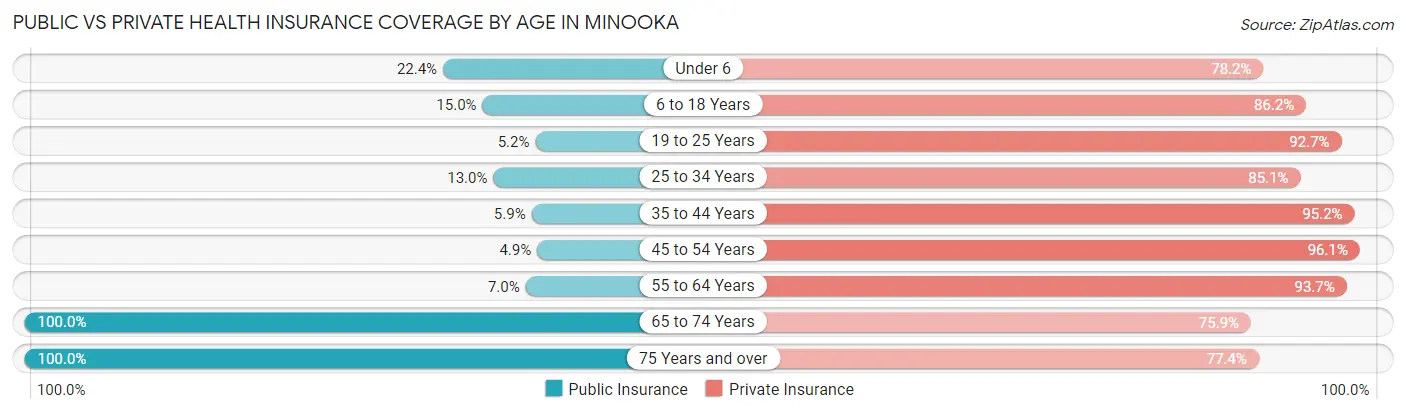
| Age Bracket | Public Insurance | Private Insurance |
| Under 6 | 226 (22.4%) | 791 (78.2%) |
| 6 to 18 Years | 408 (15.0%) | 2,341 (86.2%) |
| 19 to 25 Years | 63 (5.2%) | 1,123 (92.7%) |
| 25 to 34 Years | 201 (13.0%) | 1,316 (85.1%) |
| 35 to 44 Years | 122 (5.9%) | 1,963 (95.2%) |
| 45 to 54 Years | 86 (4.9%) | 1,691 (96.1%) |
| 55 to 64 Years | 101 (7.0%) | 1,350 (93.7%) |
| 65 to 74 Years | 669 (100.0%) | 508 (75.9%) |
| 75 Years and over | 177 (100.0%) | 137 (77.4%) |
| Total | 2,053 (16.3%) | 11,220 (89.1%) |
Disability Status by Sex by Age in Minooka
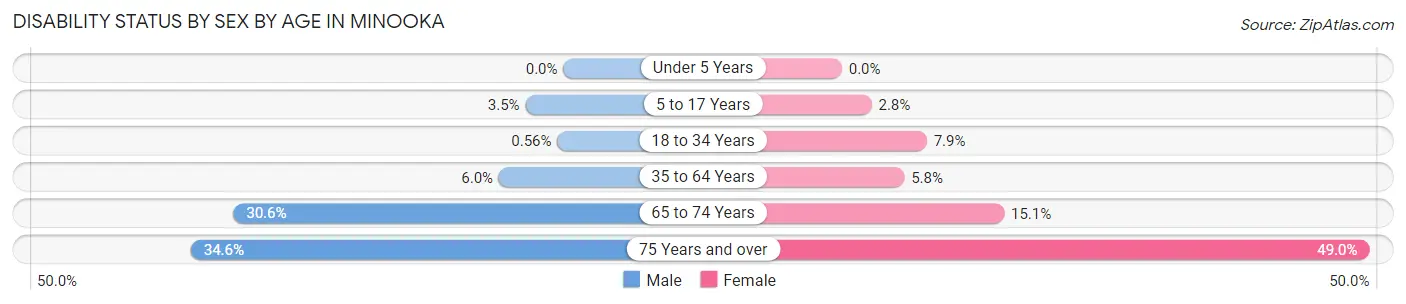
| Age Bracket | Male | Female |
| Under 5 Years | 0 (0.0%) | 0 (0.0%) |
| 5 to 17 Years | 48 (3.5%) | 39 (2.8%) |
| 18 to 34 Years | 8 (0.6%) | 121 (7.9%) |
| 35 to 64 Years | 168 (6.0%) | 142 (5.8%) |
| 65 to 74 Years | 87 (30.6%) | 58 (15.1%) |
| 75 Years and over | 28 (34.6%) | 47 (49.0%) |
Disability Class by Sex by Age in Minooka
Disability Class: Hearing Difficulty
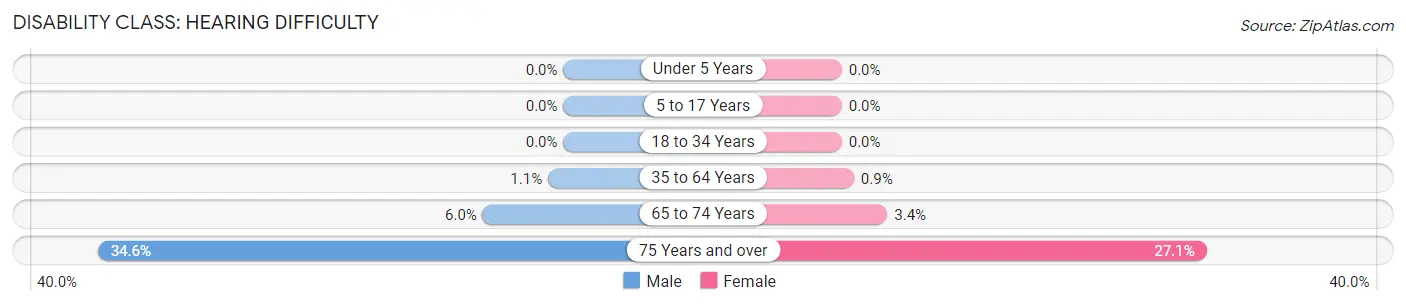
| Age Bracket | Male | Female |
| Under 5 Years | 0 (0.0%) | 0 (0.0%) |
| 5 to 17 Years | 0 (0.0%) | 0 (0.0%) |
| 18 to 34 Years | 0 (0.0%) | 0 (0.0%) |
| 35 to 64 Years | 32 (1.1%) | 22 (0.9%) |
| 65 to 74 Years | 17 (6.0%) | 13 (3.4%) |
| 75 Years and over | 28 (34.6%) | 26 (27.1%) |
Disability Class: Vision Difficulty
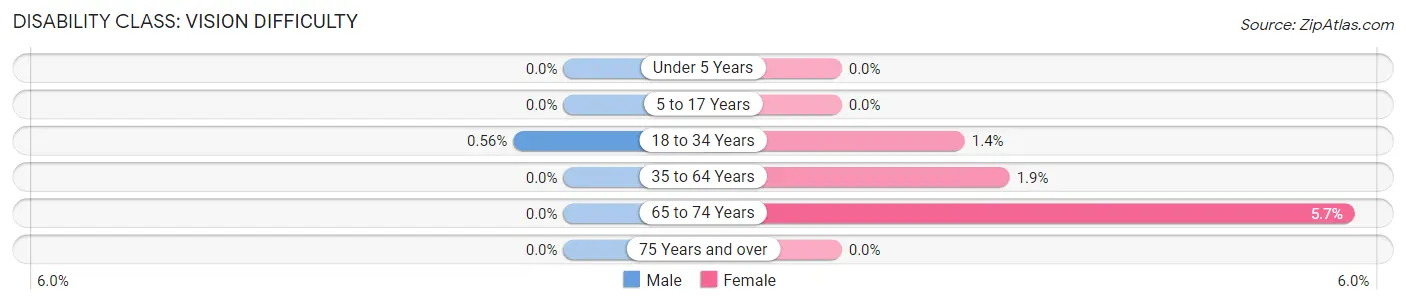
| Age Bracket | Male | Female |
| Under 5 Years | 0 (0.0%) | 0 (0.0%) |
| 5 to 17 Years | 0 (0.0%) | 0 (0.0%) |
| 18 to 34 Years | 8 (0.6%) | 21 (1.4%) |
| 35 to 64 Years | 0 (0.0%) | 46 (1.9%) |
| 65 to 74 Years | 0 (0.0%) | 22 (5.7%) |
| 75 Years and over | 0 (0.0%) | 0 (0.0%) |
Disability Class: Cognitive Difficulty
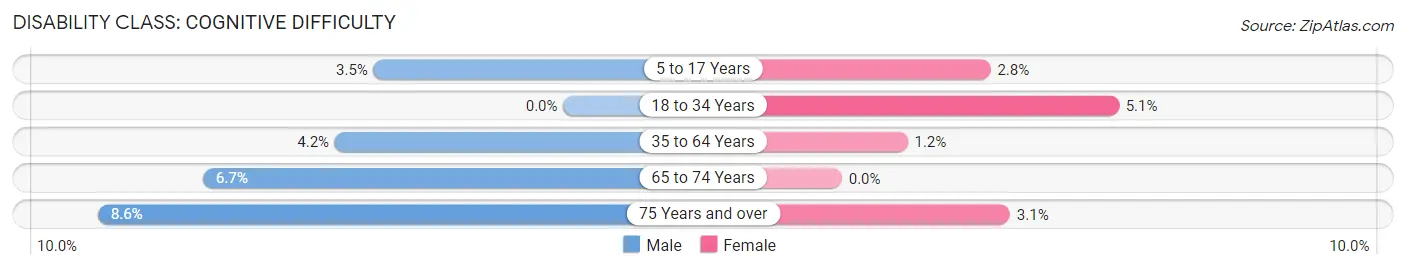
| Age Bracket | Male | Female |
| 5 to 17 Years | 48 (3.5%) | 39 (2.8%) |
| 18 to 34 Years | 0 (0.0%) | 79 (5.1%) |
| 35 to 64 Years | 119 (4.2%) | 30 (1.2%) |
| 65 to 74 Years | 19 (6.7%) | 0 (0.0%) |
| 75 Years and over | 7 (8.6%) | 3 (3.1%) |
Disability Class: Ambulatory Difficulty
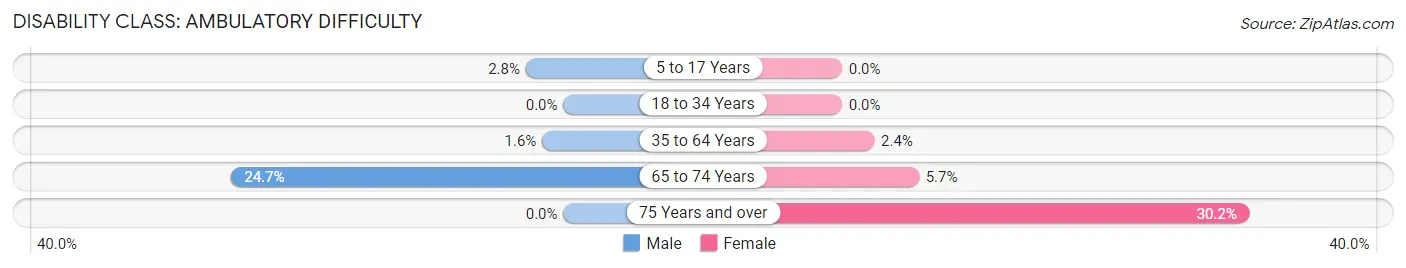
| Age Bracket | Male | Female |
| 5 to 17 Years | 38 (2.8%) | 0 (0.0%) |
| 18 to 34 Years | 0 (0.0%) | 0 (0.0%) |
| 35 to 64 Years | 44 (1.6%) | 59 (2.4%) |
| 65 to 74 Years | 70 (24.6%) | 22 (5.7%) |
| 75 Years and over | 0 (0.0%) | 29 (30.2%) |
Disability Class: Self-Care Difficulty
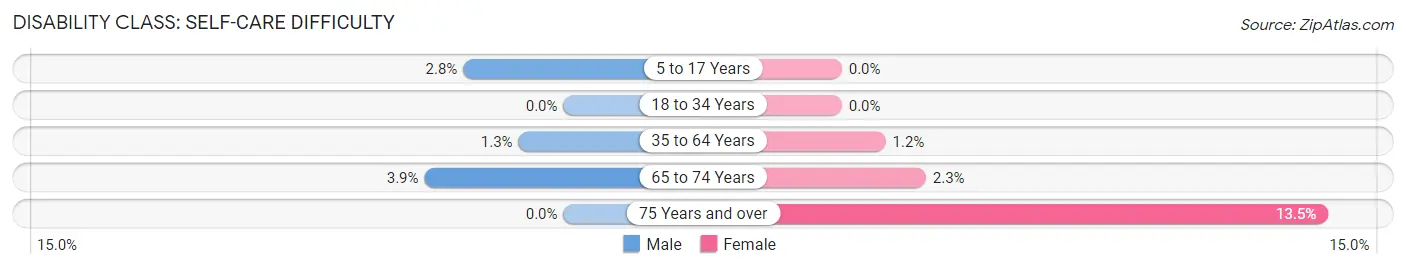
| Age Bracket | Male | Female |
| 5 to 17 Years | 38 (2.8%) | 0 (0.0%) |
| 18 to 34 Years | 0 (0.0%) | 0 (0.0%) |
| 35 to 64 Years | 35 (1.3%) | 30 (1.2%) |
| 65 to 74 Years | 11 (3.9%) | 9 (2.3%) |
| 75 Years and over | 0 (0.0%) | 13 (13.5%) |
Technology Access in Minooka
Computing Device Access in Minooka
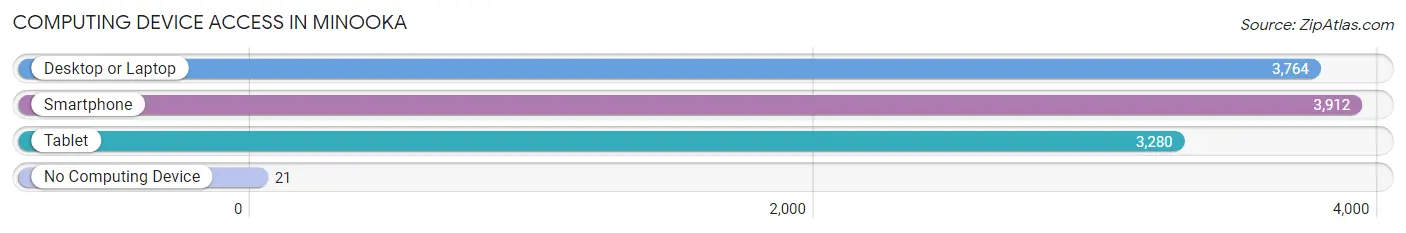
| Device Type | # Households | % Households |
| Desktop or Laptop | 3,764 | 91.2% |
| Smartphone | 3,912 | 94.8% |
| Tablet | 3,280 | 79.5% |
| No Computing Device | 21 | 0.5% |
| Total | 4,126 | 100.0% |
Internet Access in Minooka
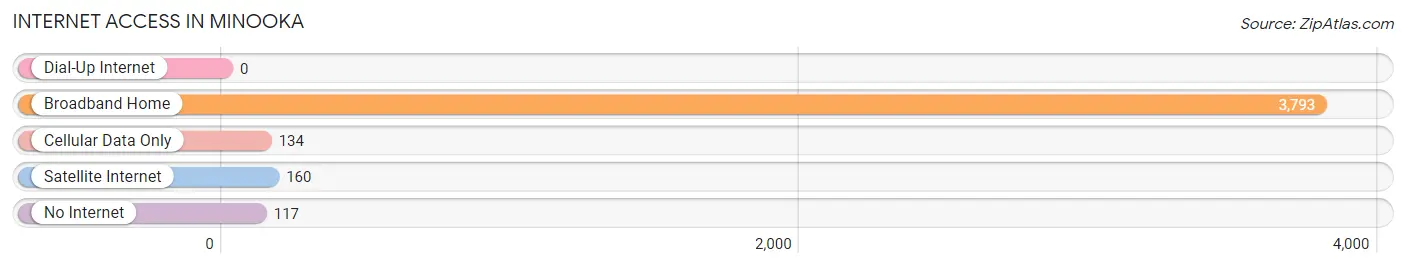
| Internet Type | # Households | % Households |
| Dial-Up Internet | 0 | 0.0% |
| Broadband Home | 3,793 | 91.9% |
| Cellular Data Only | 134 | 3.3% |
| Satellite Internet | 160 | 3.9% |
| No Internet | 117 | 2.8% |
| Total | 4,126 | 100.0% |
Minooka Summary
Minooka, IL is a village located in Grundy and Will Counties in the state of Illinois. It is part of the Chicago metropolitan area and is located approximately 40 miles southwest of the city. The village has a population of 8,924 as of the 2010 census.
History
The area that is now Minooka was first settled in the 1830s by settlers from New York and New England. The village was originally known as “Minooka Station” and was a stop on the Chicago and Alton Railroad. The village was officially incorporated in 1867 and was named after the Potawatomi word “minoka” which means “good land”.
In the late 19th century, Minooka was a major producer of coal and was home to several coal mines. The coal industry declined in the early 20th century and the village shifted its focus to agriculture. The village also became a popular destination for Chicagoans looking to escape the city for the weekend.
Geography
Minooka is located at 41°25'25"N 88°20'45"W (41.423607, -88.345845). The village is situated on the banks of the DuPage River and is surrounded by rolling hills and farmland. The village is located approximately 40 miles southwest of Chicago and is part of the Chicago metropolitan area.
The village has a total area of 4.2 square miles, all of which is land. The village is located in Grundy and Will Counties and is bordered by the villages of Channahon, Shorewood, and Plainfield.
Economy
The economy of Minooka is largely based on agriculture and manufacturing. The village is home to several large manufacturing companies, including Caterpillar, Inc., which has a large manufacturing facility in the village. The village is also home to several small businesses, including restaurants, retail stores, and service providers.
The village is also home to several large agricultural operations, including dairy farms, grain farms, and vegetable farms. The village is also home to several wineries and vineyards, which produce a variety of wines.
Demographics
As of the 2010 census, the village had a population of 8,924. The racial makeup of the village was 94.2% White, 1.2% African American, 0.3% Native American, 1.2% Asian, 0.1% Pacific Islander, 1.7% from other races, and 1.4% from two or more races. Hispanic or Latino of any race were 5.2% of the population.
The median income for a household in the village was $63,917 and the median income for a family was $76,917. The per capita income for the village was $27,917. About 4.2% of families and 5.7% of the population were below the poverty line, including 7.2% of those under age 18 and 4.2% of those age 65 or over.
Minooka is served by several school districts, including Minooka Community Consolidated School District 201, Channahon School District 17, and Plainfield Community Consolidated School District 202. The village is also home to several private schools, including Minooka Christian Academy and St. Mary’s Catholic School.
Common Questions
What is Per Capita Income in Minooka?
Per Capita income in Minooka is $45,174.
What is the Median Family Income in Minooka?
Median Family Income in Minooka is $124,879.
What is the Median Household income in Minooka?
Median Household Income in Minooka is $119,730.
What is Income or Wage Gap in Minooka?
Income or Wage Gap in Minooka is 49.5%.
Women in Minooka earn 50.5 cents for every dollar earned by a man.
What is Inequality or Gini Index in Minooka?
Inequality or Gini Index in Minooka is 0.34.
What is the Total Population of Minooka?
Total Population of Minooka is 12,606.
What is the Total Male Population of Minooka?
Total Male Population of Minooka is 6,503.
What is the Total Female Population of Minooka?
Total Female Population of Minooka is 6,103.
What is the Ratio of Males per 100 Females in Minooka?
There are 106.55 Males per 100 Females in Minooka.
What is the Ratio of Females per 100 Males in Minooka?
There are 93.85 Females per 100 Males in Minooka.
What is the Median Population Age in Minooka?
Median Population Age in Minooka is 33.7 Years.
What is the Average Family Size in Minooka
Average Family Size in Minooka is 3.5 People.
What is the Average Household Size in Minooka
Average Household Size in Minooka is 3.0 People.
How Large is the Labor Force in Minooka?
There are 7,337 People in the Labor Forcein in Minooka.
What is the Percentage of People in the Labor Force in Minooka?
77.1% of People are in the Labor Force in Minooka.
What is the Unemployment Rate in Minooka?
Unemployment Rate in Minooka is 4.4%.