Taylorville, IL Map & Demographics
Taylorville Map
Taylorville Overview
$27,377
PER CAPITA INCOME
$79,479
AVG FAMILY INCOME
$49,471
AVG HOUSEHOLD INCOME
27.4%
WAGE / INCOME GAP [ % ]
72.6¢/ $1
WAGE / INCOME GAP [ $ ]
0.45
INEQUALITY / GINI INDEX
11,318
TOTAL POPULATION
5,464
MALE POPULATION
5,854
FEMALE POPULATION
93.34
MALES / 100 FEMALES
107.14
FEMALES / 100 MALES
38.2
MEDIAN AGE
3.5
AVG FAMILY SIZE
2.3
AVG HOUSEHOLD SIZE
5,071
LABOR FORCE [ PEOPLE ]
56.2%
PERCENT IN LABOR FORCE
5.3%
UNEMPLOYMENT RATE
Taylorville Zip Codes
Taylorville Area Codes
Income in Taylorville
Income Overview in Taylorville
Per Capita Income in Taylorville is $27,377, while median incomes of families and households are $79,479 and $49,471 respectively.
| Characteristic | Number | Measure |
| Per Capita Income | 11,318 | $27,377 |
| Median Family Income | 2,304 | $79,479 |
| Mean Family Income | 2,304 | $84,694 |
| Median Household Income | 4,779 | $49,471 |
| Mean Household Income | 4,779 | $60,908 |
| Income Deficit | 2,304 | $0 |
| Wage / Income Gap (%) | 11,318 | 27.35% |
| Wage / Income Gap ($) | 11,318 | 72.65¢ per $1 |
| Gini / Inequality Index | 11,318 | 0.45 |
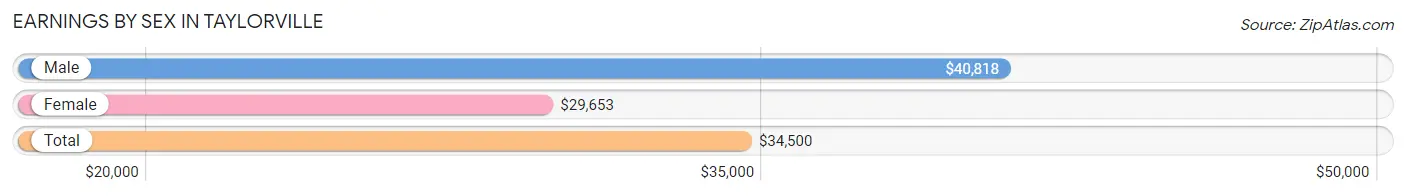
Earnings by Sex in Taylorville
Average Earnings in Taylorville are $34,500, $40,818 for men and $29,653 for women, a difference of 27.4%.
| Sex | Number | Average Earnings |
| Male | 2,814 (54.6%) | $40,818 |
| Female | 2,340 (45.4%) | $29,653 |
| Total | 5,154 (100.0%) | $34,500 |
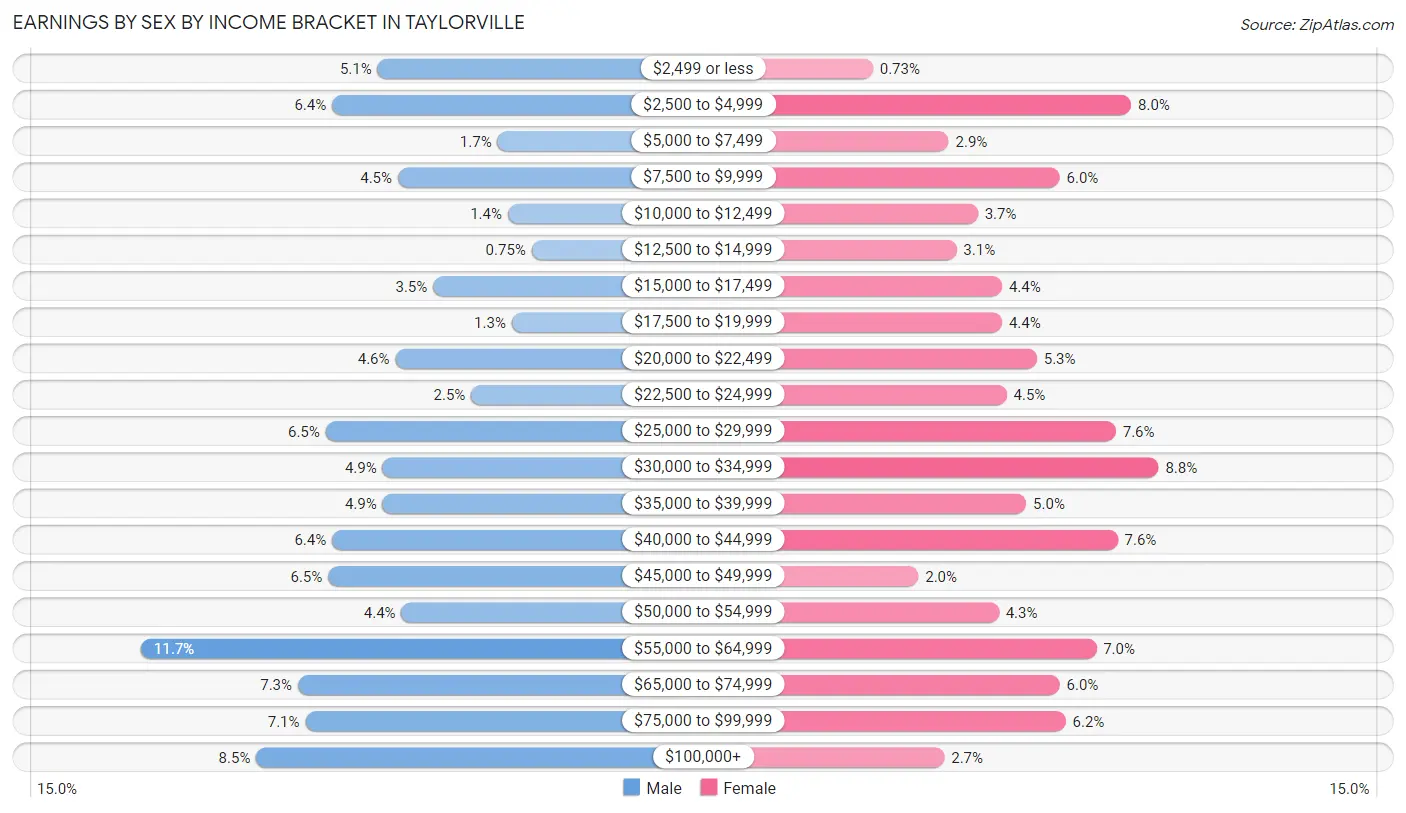
Earnings by Sex by Income Bracket in Taylorville
The most common earnings brackets in Taylorville are $55,000 to $64,999 for men (330 | 11.7%) and $30,000 to $34,999 for women (205 | 8.8%).
| Income | Male | Female |
| $2,499 or less | 143 (5.1%) | 17 (0.7%) |
| $2,500 to $4,999 | 179 (6.4%) | 187 (8.0%) |
| $5,000 to $7,499 | 48 (1.7%) | 67 (2.9%) |
| $7,500 to $9,999 | 127 (4.5%) | 140 (6.0%) |
| $10,000 to $12,499 | 40 (1.4%) | 86 (3.7%) |
| $12,500 to $14,999 | 21 (0.7%) | 72 (3.1%) |
| $15,000 to $17,499 | 99 (3.5%) | 102 (4.4%) |
| $17,500 to $19,999 | 37 (1.3%) | 102 (4.4%) |
| $20,000 to $22,499 | 129 (4.6%) | 125 (5.3%) |
| $22,500 to $24,999 | 69 (2.5%) | 105 (4.5%) |
| $25,000 to $29,999 | 184 (6.5%) | 177 (7.6%) |
| $30,000 to $34,999 | 139 (4.9%) | 205 (8.8%) |
| $35,000 to $39,999 | 139 (4.9%) | 118 (5.0%) |
| $40,000 to $44,999 | 179 (6.4%) | 178 (7.6%) |
| $45,000 to $49,999 | 182 (6.5%) | 47 (2.0%) |
| $50,000 to $54,999 | 124 (4.4%) | 100 (4.3%) |
| $55,000 to $64,999 | 330 (11.7%) | 164 (7.0%) |
| $65,000 to $74,999 | 206 (7.3%) | 140 (6.0%) |
| $75,000 to $99,999 | 200 (7.1%) | 144 (6.1%) |
| $100,000+ | 239 (8.5%) | 64 (2.7%) |
| Total | 2,814 (100.0%) | 2,340 (100.0%) |
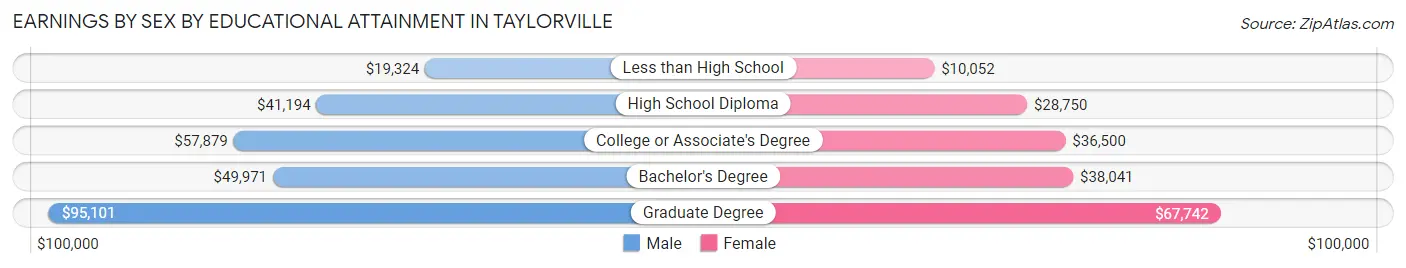
Earnings by Sex by Educational Attainment in Taylorville
Average earnings in Taylorville are $48,516 for men and $32,793 for women, a difference of 32.4%. Men with an educational attainment of graduate degree enjoy the highest average annual earnings of $95,101, while those with less than high school education earn the least with $19,324. Women with an educational attainment of graduate degree earn the most with the average annual earnings of $67,742, while those with less than high school education have the smallest earnings of $10,052.
| Educational Attainment | Male Income | Female Income |
| Less than High School | $19,324 | $10,052 |
| High School Diploma | $41,194 | $28,750 |
| College or Associate's Degree | $57,879 | $36,500 |
| Bachelor's Degree | $49,971 | $38,041 |
| Graduate Degree | $95,101 | $67,742 |
| Total | $48,516 | $32,793 |
Family Income in Taylorville
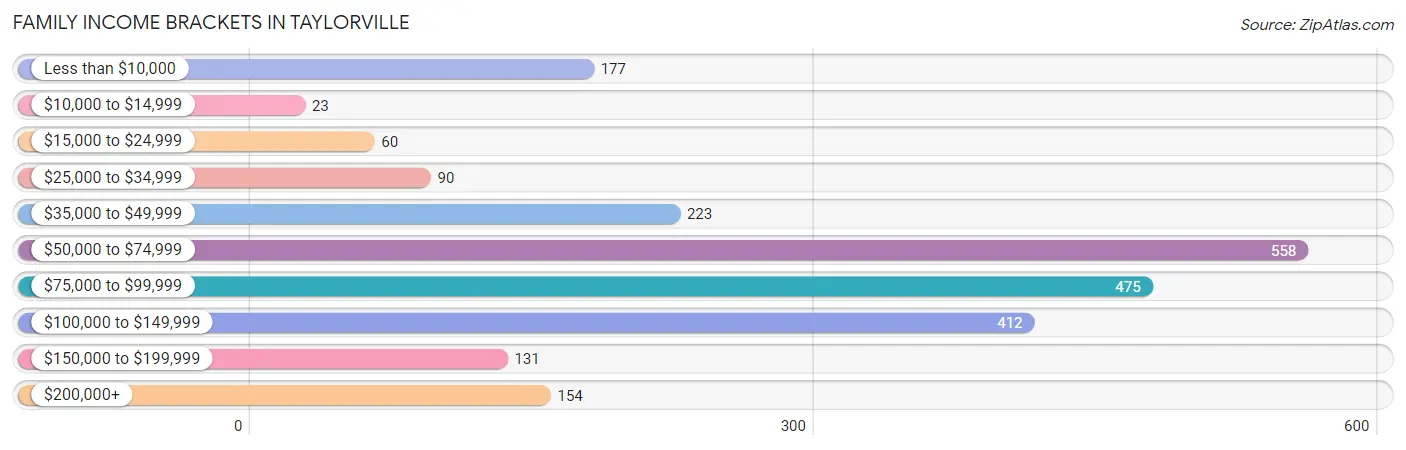
Family Income Brackets in Taylorville
According to the Taylorville family income data, there are 558 families falling into the $50,000 to $74,999 income range, which is the most common income bracket and makes up 24.2% of all families. Conversely, the $10,000 to $14,999 income bracket is the least frequent group with only 23 families (1.0%) belonging to this category.
| Income Bracket | # Families | % Families |
| Less than $10,000 | 177 | 7.7% |
| $10,000 to $14,999 | 23 | 1.0% |
| $15,000 to $24,999 | 60 | 2.6% |
| $25,000 to $34,999 | 90 | 3.9% |
| $35,000 to $49,999 | 223 | 9.7% |
| $50,000 to $74,999 | 558 | 24.2% |
| $75,000 to $99,999 | 475 | 20.6% |
| $100,000 to $149,999 | 412 | 17.9% |
| $150,000 to $199,999 | 131 | 5.7% |
| $200,000+ | 154 | 6.7% |
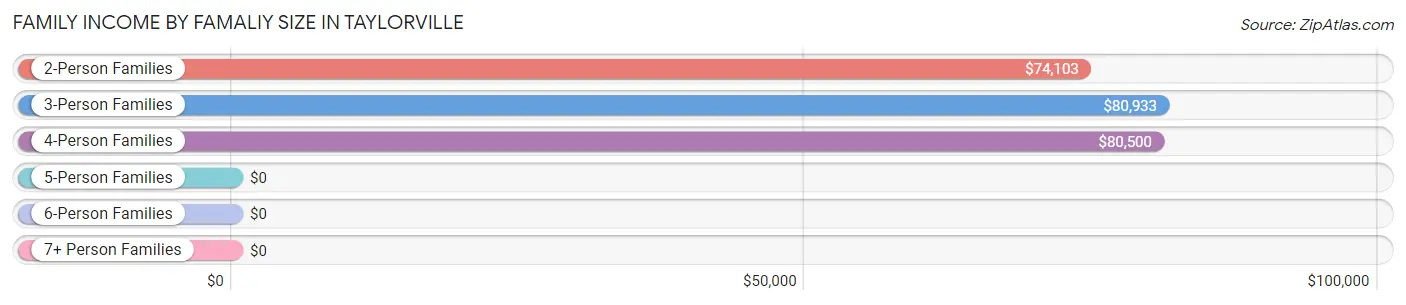
Family Income by Famaliy Size in Taylorville
3-person families (541 | 23.5%) account for the highest median family income in Taylorville with $80,933 per family, while 2-person families (1,040 | 45.1%) have the highest median income of $37,052 per family member.
| Income Bracket | # Families | Median Income |
| 2-Person Families | 1,040 (45.1%) | $74,103 |
| 3-Person Families | 541 (23.5%) | $80,933 |
| 4-Person Families | 548 (23.8%) | $80,500 |
| 5-Person Families | 118 (5.1%) | $0 |
| 6-Person Families | 41 (1.8%) | $0 |
| 7+ Person Families | 16 (0.7%) | $0 |
| Total | 2,304 (100.0%) | $79,479 |
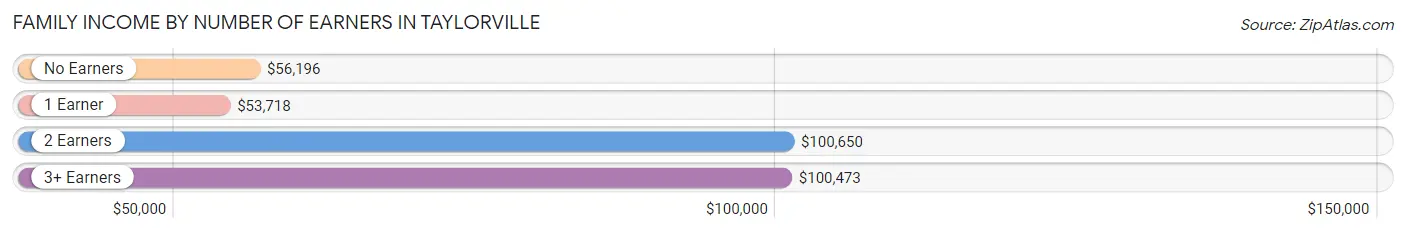
Family Income by Number of Earners in Taylorville
The median family income in Taylorville is $79,479, with families comprising 2 earners (800) having the highest median family income of $100,650, while families with 1 earner (726) have the lowest median family income of $53,718, accounting for 34.7% and 31.5% of families, respectively.
| Number of Earners | # Families | Median Income |
| No Earners | 476 (20.7%) | $56,196 |
| 1 Earner | 726 (31.5%) | $53,718 |
| 2 Earners | 800 (34.7%) | $100,650 |
| 3+ Earners | 302 (13.1%) | $100,473 |
| Total | 2,304 (100.0%) | $79,479 |
Household Income in Taylorville
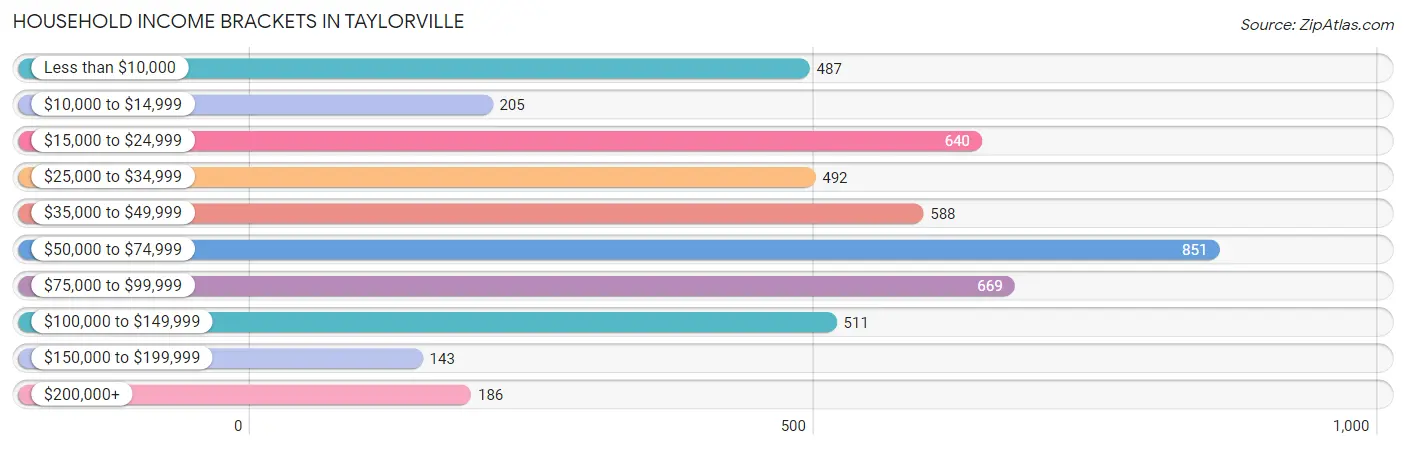
Household Income Brackets in Taylorville
With 851 households falling in the category, the $50,000 to $74,999 income range is the most frequent in Taylorville, accounting for 17.8% of all households. In contrast, only 143 households (3.0%) fall into the $150,000 to $199,999 income bracket, making it the least populous group.
| Income Bracket | # Households | % Households |
| Less than $10,000 | 487 | 10.2% |
| $10,000 to $14,999 | 205 | 4.3% |
| $15,000 to $24,999 | 640 | 13.4% |
| $25,000 to $34,999 | 492 | 10.3% |
| $35,000 to $49,999 | 588 | 12.3% |
| $50,000 to $74,999 | 851 | 17.8% |
| $75,000 to $99,999 | 669 | 14.0% |
| $100,000 to $149,999 | 511 | 10.7% |
| $150,000 to $199,999 | 143 | 3.0% |
| $200,000+ | 186 | 3.9% |
Household Income by Householder Age in Taylorville
The median household income in Taylorville is $49,471, with the highest median household income of $58,107 found in the 45 to 64 years age bracket for the primary householder. A total of 1,701 households (35.6%) fall into this category. Meanwhile, the 15 to 24 years age bracket for the primary householder has the lowest median household income of $19,153, with 181 households (3.8%) in this group.
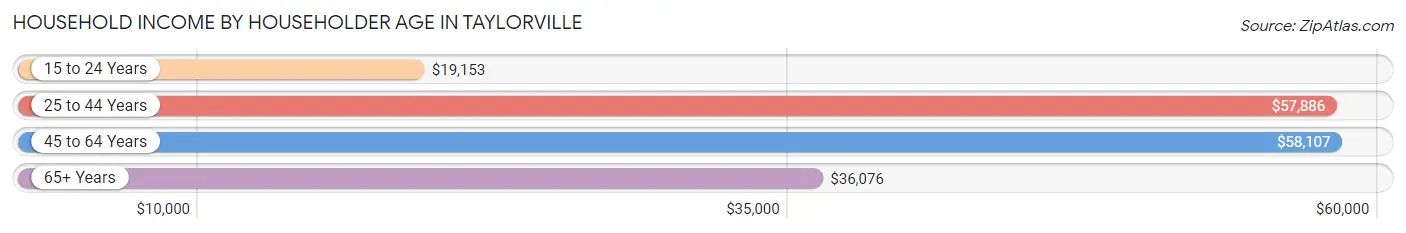
| Income Bracket | # Households | Median Income |
| 15 to 24 Years | 181 (3.8%) | $19,153 |
| 25 to 44 Years | 1,404 (29.4%) | $57,886 |
| 45 to 64 Years | 1,701 (35.6%) | $58,107 |
| 65+ Years | 1,493 (31.2%) | $36,076 |
| Total | 4,779 (100.0%) | $49,471 |
Poverty in Taylorville
Income Below Poverty by Sex and Age in Taylorville
With 13.0% poverty level for males and 19.1% for females among the residents of Taylorville, 35 to 44 year old males and 5 year old females are the most vulnerable to poverty, with 200 males (27.3%) and 40 females (76.9%) in their respective age groups living below the poverty level.
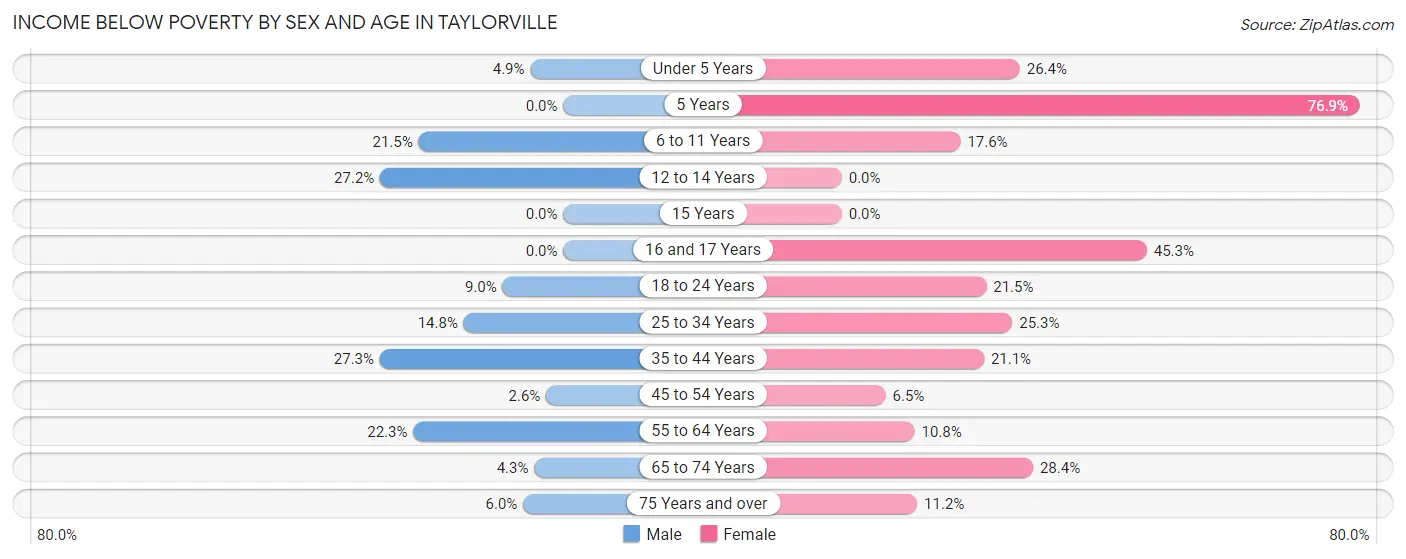
| Age Bracket | Male | Female |
| Under 5 Years | 32 (4.9%) | 74 (26.4%) |
| 5 Years | 0 (0.0%) | 40 (76.9%) |
| 6 to 11 Years | 66 (21.5%) | 86 (17.6%) |
| 12 to 14 Years | 68 (27.2%) | 0 (0.0%) |
| 15 Years | 0 (0.0%) | 0 (0.0%) |
| 16 and 17 Years | 0 (0.0%) | 149 (45.3%) |
| 18 to 24 Years | 45 (9.0%) | 100 (21.5%) |
| 25 to 34 Years | 97 (14.8%) | 200 (25.3%) |
| 35 to 44 Years | 200 (27.3%) | 110 (21.1%) |
| 45 to 54 Years | 17 (2.5%) | 47 (6.5%) |
| 55 to 64 Years | 133 (22.3%) | 76 (10.8%) |
| 65 to 74 Years | 20 (4.3%) | 132 (28.4%) |
| 75 Years and over | 23 (6.0%) | 80 (11.2%) |
| Total | 701 (13.0%) | 1,094 (19.1%) |
Income Above Poverty by Sex and Age in Taylorville
According to the poverty statistics in Taylorville, males aged 5 years and females aged 12 to 14 years are the age groups that are most secure financially, with 100.0% of males and 100.0% of females in these age groups living above the poverty line.
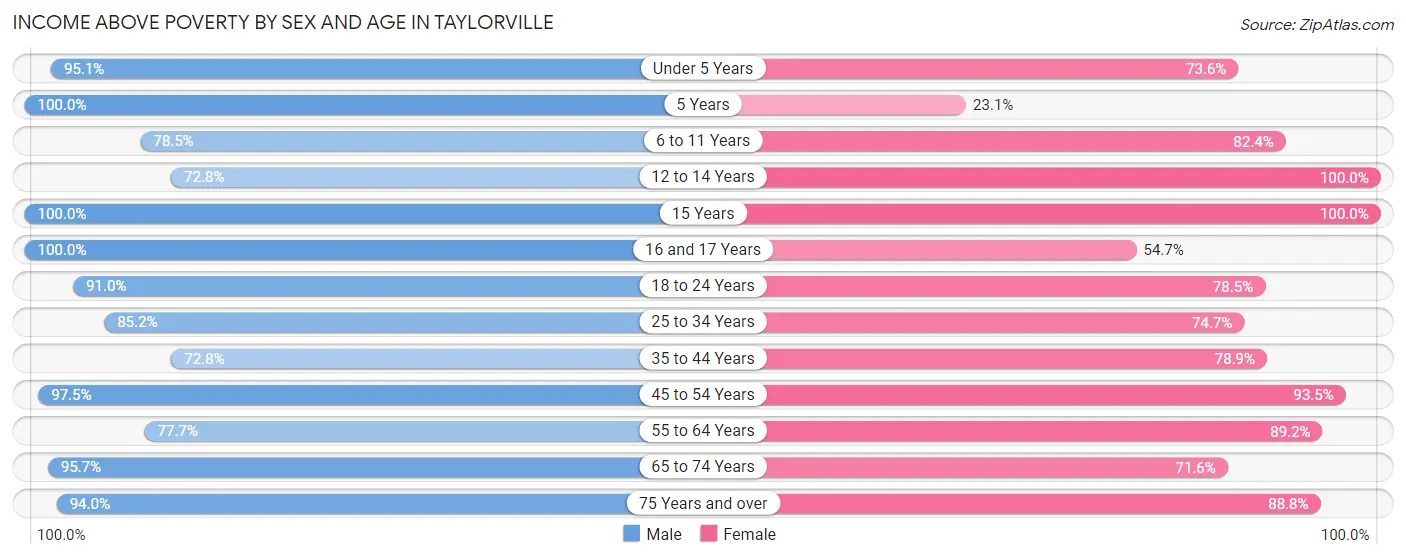
| Age Bracket | Male | Female |
| Under 5 Years | 621 (95.1%) | 206 (73.6%) |
| 5 Years | 11 (100.0%) | 12 (23.1%) |
| 6 to 11 Years | 241 (78.5%) | 402 (82.4%) |
| 12 to 14 Years | 182 (72.8%) | 134 (100.0%) |
| 15 Years | 44 (100.0%) | 60 (100.0%) |
| 16 and 17 Years | 121 (100.0%) | 180 (54.7%) |
| 18 to 24 Years | 454 (91.0%) | 366 (78.5%) |
| 25 to 34 Years | 559 (85.2%) | 590 (74.7%) |
| 35 to 44 Years | 534 (72.8%) | 411 (78.9%) |
| 45 to 54 Years | 650 (97.5%) | 676 (93.5%) |
| 55 to 64 Years | 464 (77.7%) | 628 (89.2%) |
| 65 to 74 Years | 444 (95.7%) | 333 (71.6%) |
| 75 Years and over | 362 (94.0%) | 635 (88.8%) |
| Total | 4,687 (87.0%) | 4,633 (80.9%) |
Income Below Poverty Among Married-Couple Families in Taylorville
The poverty statistics for married-couple families in Taylorville show that 6.4% or 112 of the total 1,749 families live below the poverty line. Families with 3 or 4 children have the highest poverty rate of 16.4%, comprising of 24 families. On the other hand, families with 5 or more children have the lowest poverty rate of 0.0%, which includes 0 families.
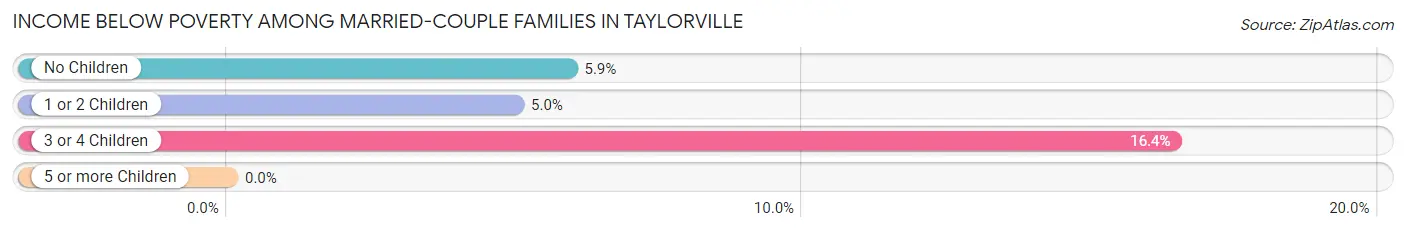
| Children | Above Poverty | Below Poverty |
| No Children | 907 (94.1%) | 57 (5.9%) |
| 1 or 2 Children | 592 (95.0%) | 31 (5.0%) |
| 3 or 4 Children | 122 (83.6%) | 24 (16.4%) |
| 5 or more Children | 16 (100.0%) | 0 (0.0%) |
| Total | 1,637 (93.6%) | 112 (6.4%) |
Income Below Poverty Among Single-Parent Households in Taylorville
According to the poverty data in Taylorville, 35.0% or 34 single-father households and 28.6% or 131 single-mother households are living below the poverty line. Among single-father households, those with 1 or 2 children have the highest poverty rate, with 20 households (40.8%) experiencing poverty. Likewise, among single-mother households, those with 1 or 2 children have the highest poverty rate, with 131 households (36.2%) falling below the poverty line.
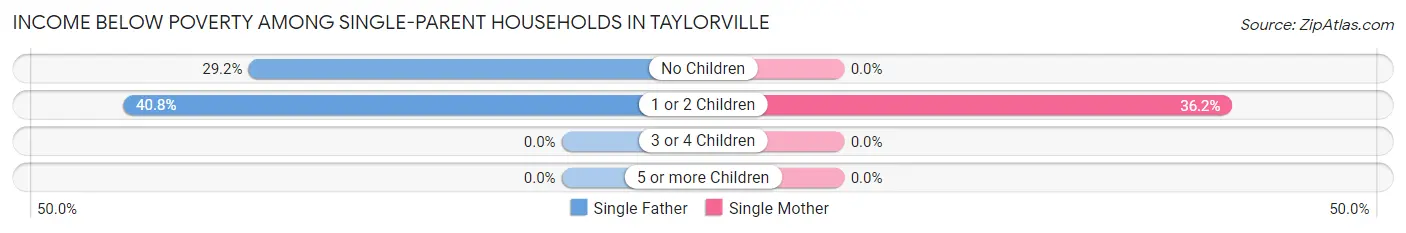
| Children | Single Father | Single Mother |
| No Children | 14 (29.2%) | 0 (0.0%) |
| 1 or 2 Children | 20 (40.8%) | 131 (36.2%) |
| 3 or 4 Children | 0 (0.0%) | 0 (0.0%) |
| 5 or more Children | 0 (0.0%) | 0 (0.0%) |
| Total | 34 (35.0%) | 131 (28.6%) |
Income Below Poverty Among Married-Couple vs Single-Parent Households in Taylorville
The poverty data for Taylorville shows that 112 of the married-couple family households (6.4%) and 165 of the single-parent households (29.7%) are living below the poverty level. Within the married-couple family households, those with 3 or 4 children have the highest poverty rate, with 24 households (16.4%) falling below the poverty line. Among the single-parent households, those with 1 or 2 children have the highest poverty rate, with 151 household (36.7%) living below poverty.
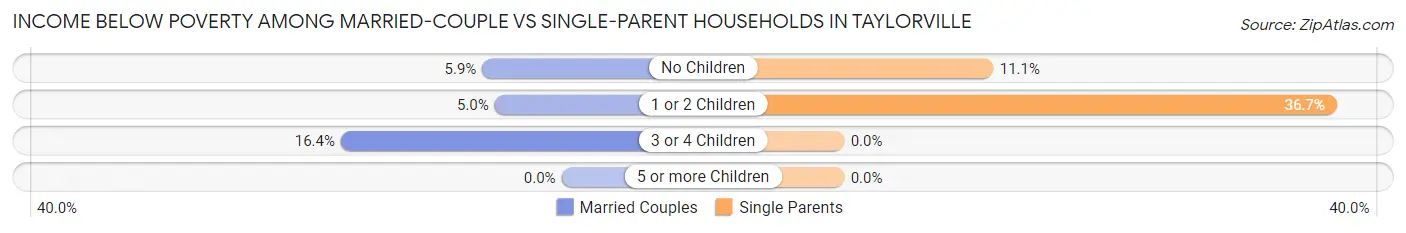
| Children | Married-Couple Families | Single-Parent Households |
| No Children | 57 (5.9%) | 14 (11.1%) |
| 1 or 2 Children | 31 (5.0%) | 151 (36.7%) |
| 3 or 4 Children | 24 (16.4%) | 0 (0.0%) |
| 5 or more Children | 0 (0.0%) | 0 (0.0%) |
| Total | 112 (6.4%) | 165 (29.7%) |
Race in Taylorville
The most populous races in Taylorville are White / Caucasian (10,429 | 92.1%), Black / African American (591 | 5.2%), and Asian (168 | 1.5%).
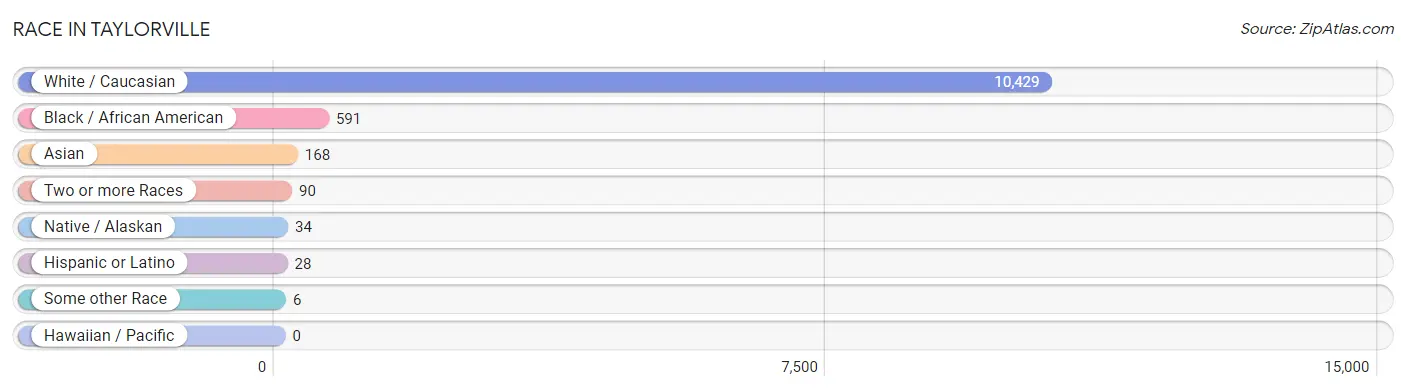
| Race | # Population | % Population |
| Asian | 168 | 1.5% |
| Black / African American | 591 | 5.2% |
| Hawaiian / Pacific | 0 | 0.0% |
| Hispanic or Latino | 28 | 0.3% |
| Native / Alaskan | 34 | 0.3% |
| White / Caucasian | 10,429 | 92.1% |
| Two or more Races | 90 | 0.8% |
| Some other Race | 6 | 0.1% |
| Total | 11,318 | 100.0% |
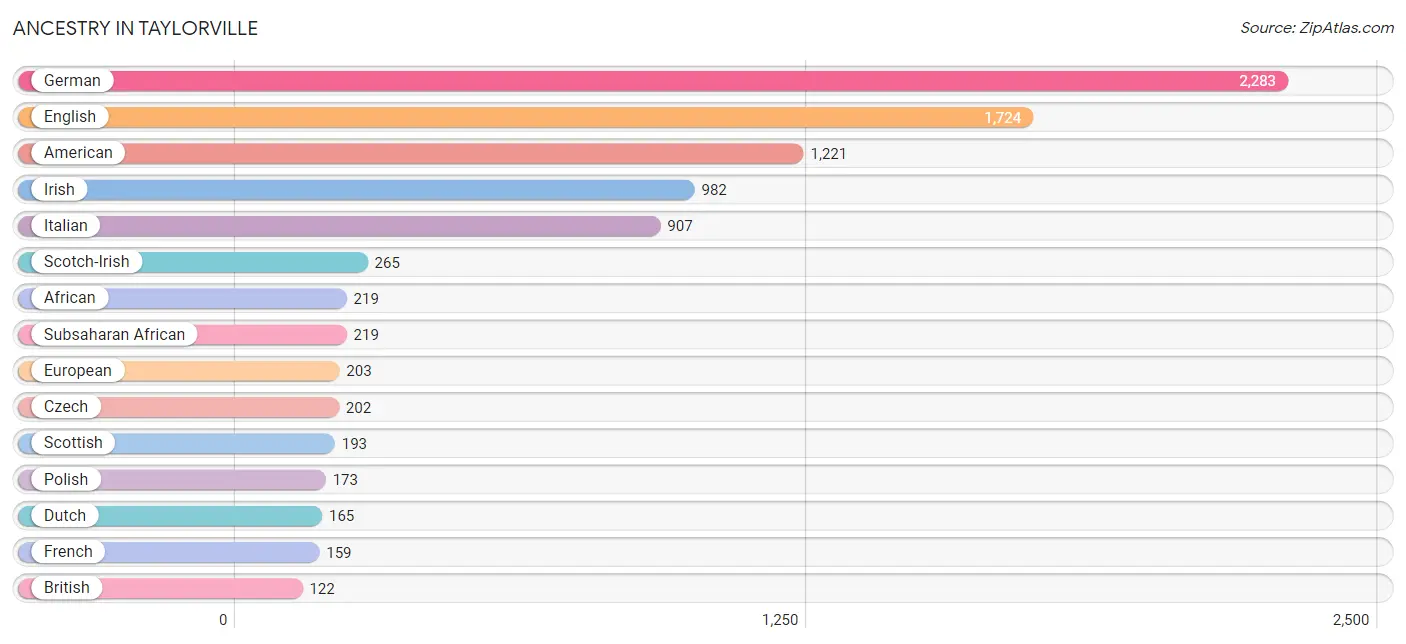
Ancestry in Taylorville
The most populous ancestries reported in Taylorville are German (2,283 | 20.2%), English (1,724 | 15.2%), American (1,221 | 10.8%), Irish (982 | 8.7%), and Italian (907 | 8.0%), together accounting for 62.9% of all Taylorville residents.
| Ancestry | # Population | % Population |
| African | 219 | 1.9% |
| American | 1,221 | 10.8% |
| Belgian | 21 | 0.2% |
| Bhutanese | 11 | 0.1% |
| Blackfeet | 16 | 0.1% |
| British | 122 | 1.1% |
| Burmese | 14 | 0.1% |
| Croatian | 20 | 0.2% |
| Czech | 202 | 1.8% |
| Czechoslovakian | 6 | 0.1% |
| Danish | 28 | 0.3% |
| Dutch | 165 | 1.5% |
| English | 1,724 | 15.2% |
| European | 203 | 1.8% |
| French | 159 | 1.4% |
| French American Indian | 15 | 0.1% |
| German | 2,283 | 20.2% |
| Greek | 58 | 0.5% |
| Hungarian | 18 | 0.2% |
| Indian (Asian) | 11 | 0.1% |
| Irish | 982 | 8.7% |
| Italian | 907 | 8.0% |
| Lithuanian | 32 | 0.3% |
| Malaysian | 4 | 0.0% |
| Mexican | 6 | 0.1% |
| Northern European | 33 | 0.3% |
| Norwegian | 36 | 0.3% |
| Polish | 173 | 1.5% |
| Portuguese | 19 | 0.2% |
| Puerto Rican | 1 | 0.0% |
| Scotch-Irish | 265 | 2.3% |
| Scottish | 193 | 1.7% |
| Slovene | 22 | 0.2% |
| Spanish | 21 | 0.2% |
| Sri Lankan | 48 | 0.4% |
| Subsaharan African | 219 | 1.9% |
| Swedish | 121 | 1.1% |
| Swiss | 15 | 0.1% |
| Thai | 115 | 1.0% |
| Welsh | 49 | 0.4% |
| Yugoslavian | 16 | 0.1% | View All 41 Rows |
Immigrants in Taylorville
The most numerous immigrant groups reported in Taylorville came from Asia (87 | 0.8%), Eastern Asia (36 | 0.3%), South Eastern Asia (31 | 0.3%), Europe (24 | 0.2%), and Vietnam (21 | 0.2%), together accounting for 1.8% of all Taylorville residents.
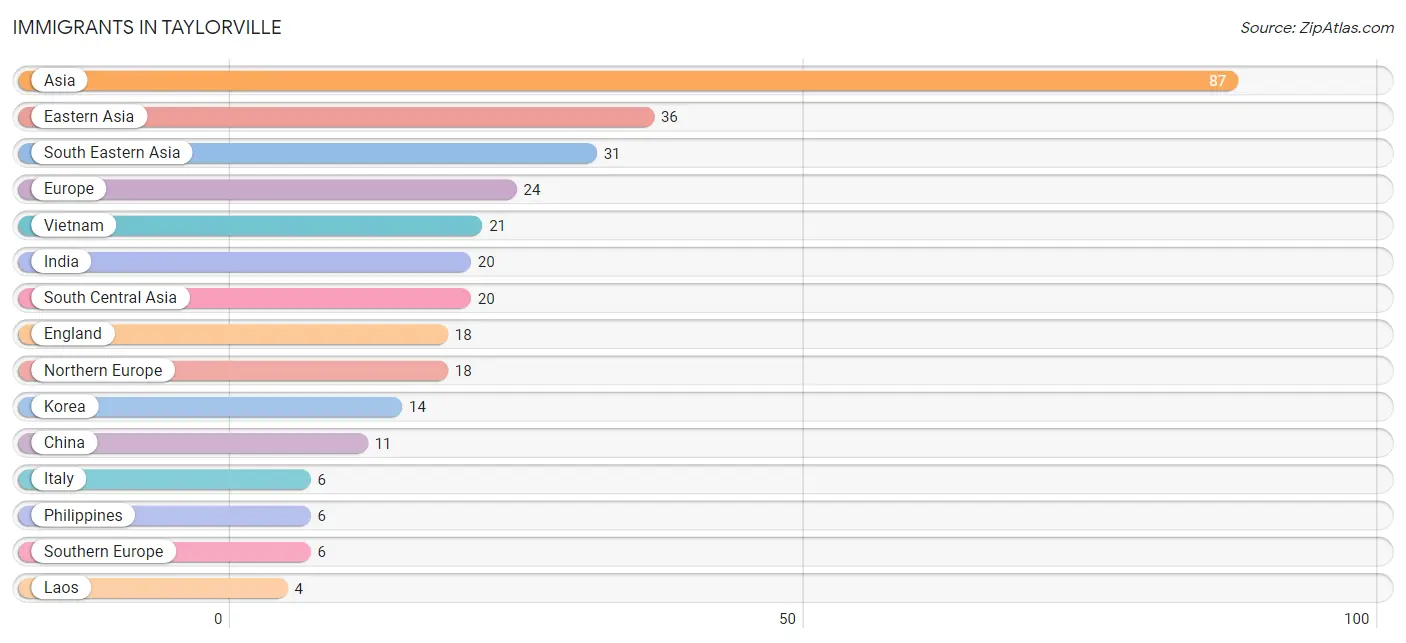
| Immigration Origin | # Population | % Population |
| Asia | 87 | 0.8% |
| China | 11 | 0.1% |
| Eastern Asia | 36 | 0.3% |
| England | 18 | 0.2% |
| Europe | 24 | 0.2% |
| India | 20 | 0.2% |
| Italy | 6 | 0.1% |
| Korea | 14 | 0.1% |
| Laos | 4 | 0.0% |
| Northern Europe | 18 | 0.2% |
| Philippines | 6 | 0.1% |
| South Central Asia | 20 | 0.2% |
| South Eastern Asia | 31 | 0.3% |
| Southern Europe | 6 | 0.1% |
| Vietnam | 21 | 0.2% | View All 15 Rows |
Sex and Age in Taylorville
Sex and Age in Taylorville
The most populous age groups in Taylorville are Under 5 Years (668 | 12.2%) for men and 15 to 19 Years (466 | 8.0%) for women.
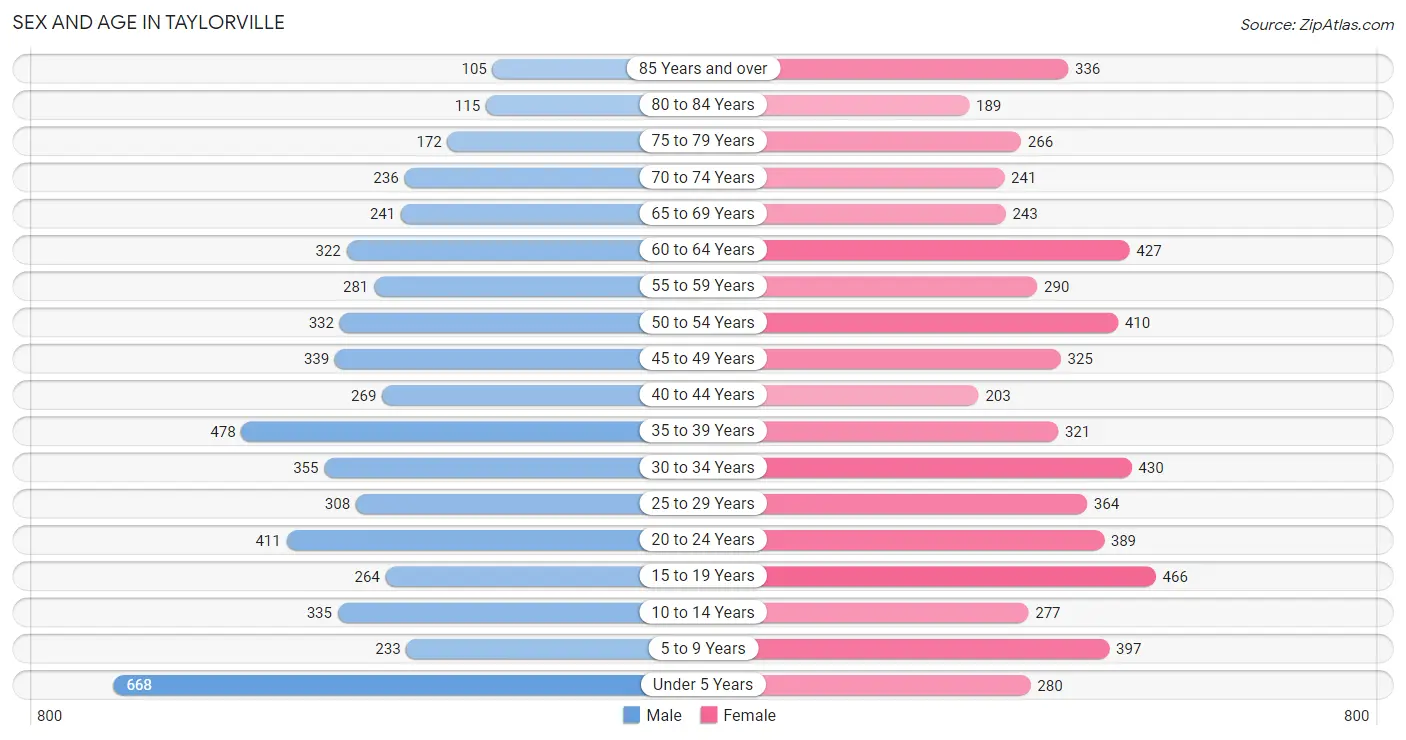
| Age Bracket | Male | Female |
| Under 5 Years | 668 (12.2%) | 280 (4.8%) |
| 5 to 9 Years | 233 (4.3%) | 397 (6.8%) |
| 10 to 14 Years | 335 (6.1%) | 277 (4.7%) |
| 15 to 19 Years | 264 (4.8%) | 466 (8.0%) |
| 20 to 24 Years | 411 (7.5%) | 389 (6.7%) |
| 25 to 29 Years | 308 (5.6%) | 364 (6.2%) |
| 30 to 34 Years | 355 (6.5%) | 430 (7.3%) |
| 35 to 39 Years | 478 (8.7%) | 321 (5.5%) |
| 40 to 44 Years | 269 (4.9%) | 203 (3.5%) |
| 45 to 49 Years | 339 (6.2%) | 325 (5.6%) |
| 50 to 54 Years | 332 (6.1%) | 410 (7.0%) |
| 55 to 59 Years | 281 (5.1%) | 290 (5.0%) |
| 60 to 64 Years | 322 (5.9%) | 427 (7.3%) |
| 65 to 69 Years | 241 (4.4%) | 243 (4.2%) |
| 70 to 74 Years | 236 (4.3%) | 241 (4.1%) |
| 75 to 79 Years | 172 (3.2%) | 266 (4.5%) |
| 80 to 84 Years | 115 (2.1%) | 189 (3.2%) |
| 85 Years and over | 105 (1.9%) | 336 (5.7%) |
| Total | 5,464 (100.0%) | 5,854 (100.0%) |
Families and Households in Taylorville
Median Family Size in Taylorville
The median family size in Taylorville is 3.50 persons per family, with married-couple families (1,749 | 75.9%) accounting for the largest median family size of 3.54 persons per family. On the other hand, single male/father families (97 | 4.2%) represent the smallest median family size with 2.96 persons per family.
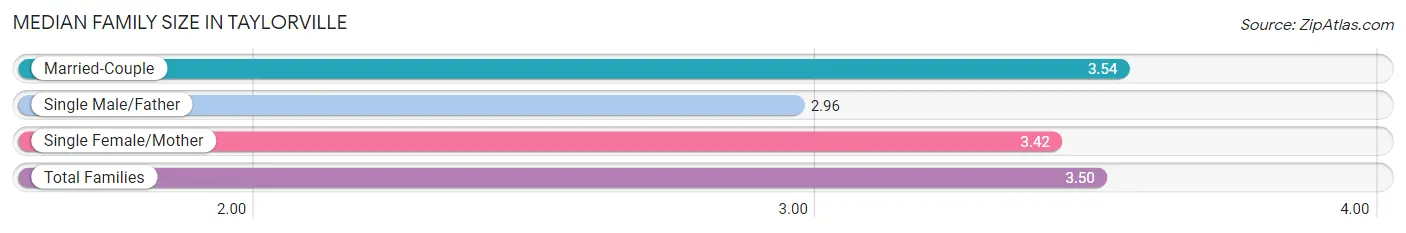
| Family Type | # Families | Family Size |
| Married-Couple | 1,749 (75.9%) | 3.54 |
| Single Male/Father | 97 (4.2%) | 2.96 |
| Single Female/Mother | 458 (19.9%) | 3.42 |
| Total Families | 2,304 (100.0%) | 3.50 |
Median Household Size in Taylorville
The median household size in Taylorville is 2.32 persons per household, with single female/mother households (458 | 9.6%) accounting for the largest median household size of 3.56 persons per household. non-family households (2,475 | 51.8%) represent the smallest median household size with 1.19 persons per household.
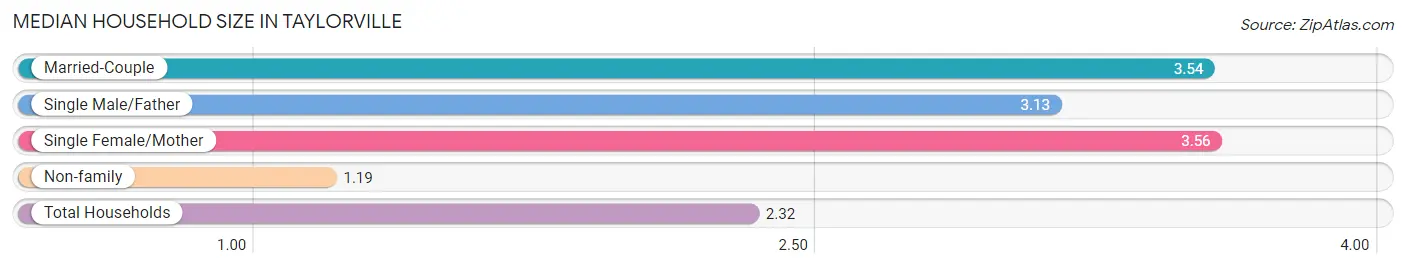
| Household Type | # Households | Household Size |
| Married-Couple | 1,749 (36.6%) | 3.54 |
| Single Male/Father | 97 (2.0%) | 3.13 |
| Single Female/Mother | 458 (9.6%) | 3.56 |
| Non-family | 2,475 (51.8%) | 1.19 |
| Total Households | 4,779 (100.0%) | 2.32 |
Household Size by Marriage Status in Taylorville
Out of a total of 4,779 households in Taylorville, 2,304 (48.2%) are family households, while 2,475 (51.8%) are nonfamily households. The most numerous type of family households are 2-person households, comprising 1,001, and the most common type of nonfamily households are 1-person households, comprising 2,169.
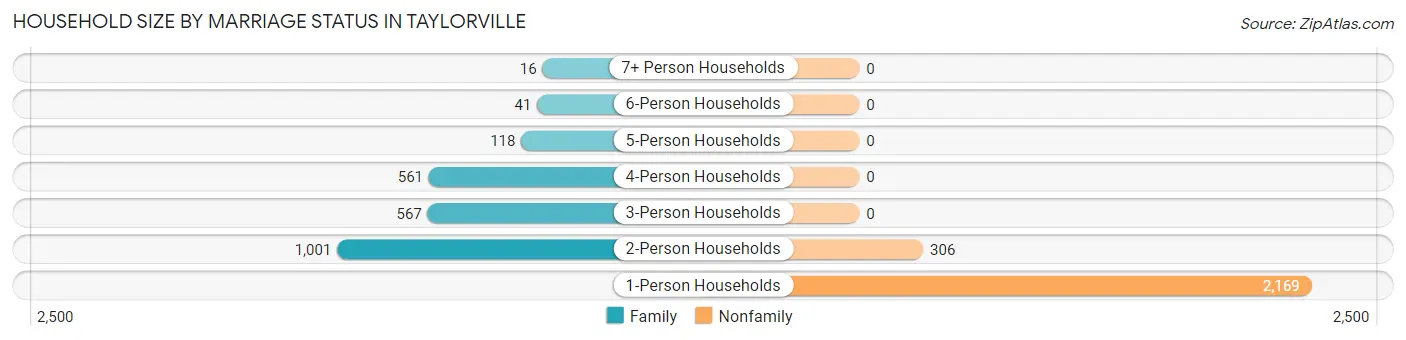
| Household Size | Family Households | Nonfamily Households |
| 1-Person Households | - | 2,169 (45.4%) |
| 2-Person Households | 1,001 (20.9%) | 306 (6.4%) |
| 3-Person Households | 567 (11.9%) | 0 (0.0%) |
| 4-Person Households | 561 (11.7%) | 0 (0.0%) |
| 5-Person Households | 118 (2.5%) | 0 (0.0%) |
| 6-Person Households | 41 (0.9%) | 0 (0.0%) |
| 7+ Person Households | 16 (0.3%) | 0 (0.0%) |
| Total | 2,304 (48.2%) | 2,475 (51.8%) |
Female Fertility in Taylorville
Fertility by Age in Taylorville
Average fertility rate in Taylorville is 24.0 births per 1,000 women. Women in the age bracket of 20 to 34 years have the highest fertility rate with 42.0 births per 1,000 women. Women in the age bracket of 20 to 34 years acount for 82.0% of all women with births.
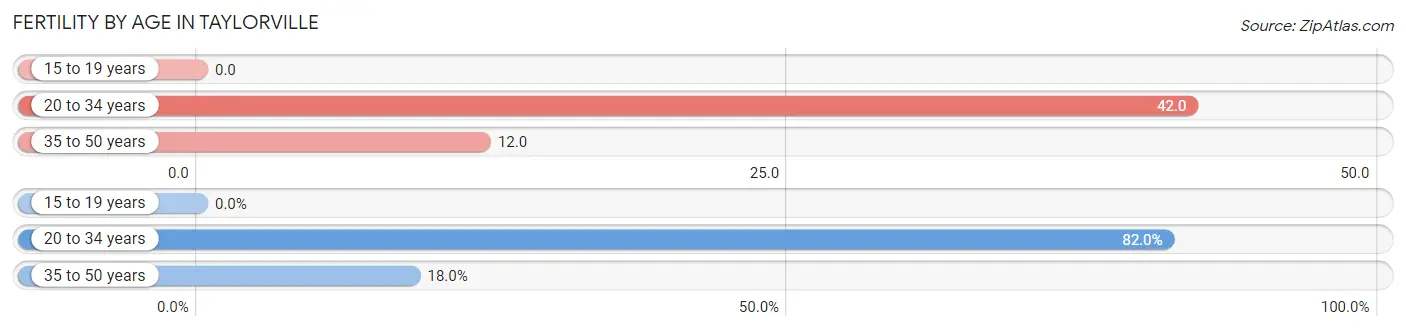
| Age Bracket | Women with Births | Births / 1,000 Women |
| 15 to 19 years | 0 (0.0%) | 0.0 |
| 20 to 34 years | 50 (82.0%) | 42.0 |
| 35 to 50 years | 11 (18.0%) | 12.0 |
| Total | 61 (100.0%) | 24.0 |
Fertility by Age by Marriage Status in Taylorville
78.7% of women with births (61) in Taylorville are married. The highest percentage of unmarried women with births falls into 20 to 34 years age bracket with 26.0% of them unmarried at the time of birth, while the lowest percentage of unmarried women with births belong to 35 to 50 years age bracket with 0.0% of them unmarried.
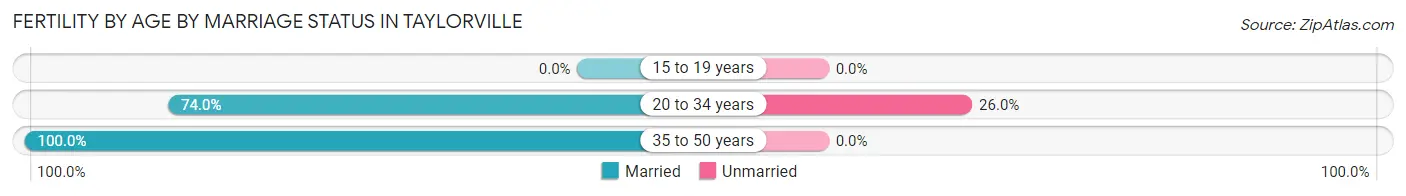
| Age Bracket | Married | Unmarried |
| 15 to 19 years | 0 (0.0%) | 0 (0.0%) |
| 20 to 34 years | 37 (74.0%) | 13 (26.0%) |
| 35 to 50 years | 11 (100.0%) | 0 (0.0%) |
| Total | 48 (78.7%) | 13 (21.3%) |
Fertility by Education in Taylorville
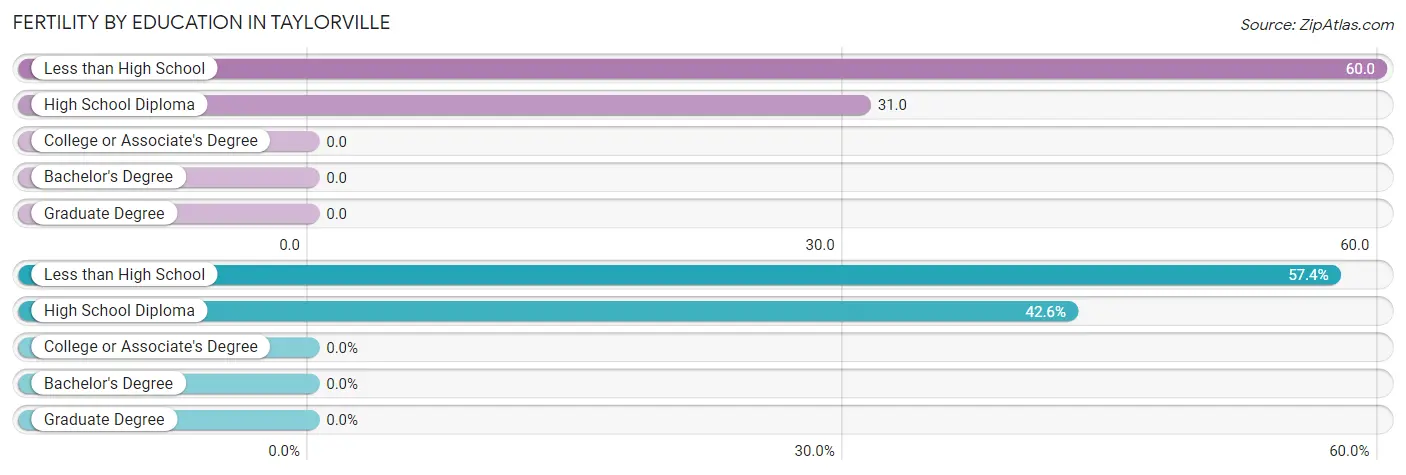
| Educational Attainment | Women with Births | Births / 1,000 Women |
| Less than High School | 35 (57.4%) | 60.0 |
| High School Diploma | 26 (42.6%) | 31.0 |
| College or Associate's Degree | 0 (0.0%) | 0.0 |
| Bachelor's Degree | 0 (0.0%) | 0.0 |
| Graduate Degree | 0 (0.0%) | 0.0 |
| Total | 61 (100.0%) | 24.0 |
Fertility by Education by Marriage Status in Taylorville
21.3% of women with births in Taylorville are unmarried. Women with the educational attainment of less than high school are most likely to be married with 100.0% of them married at childbirth, while women with the educational attainment of high school diploma are least likely to be married with 50.0% of them unmarried at childbirth.
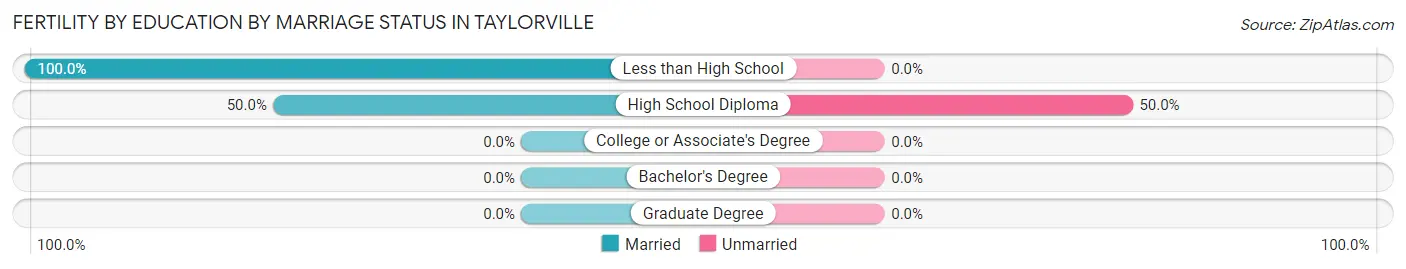
| Educational Attainment | Married | Unmarried |
| Less than High School | 35 (100.0%) | 0 (0.0%) |
| High School Diploma | 13 (50.0%) | 13 (50.0%) |
| College or Associate's Degree | 0 (0.0%) | 0 (0.0%) |
| Bachelor's Degree | 0 (0.0%) | 0 (0.0%) |
| Graduate Degree | 0 (0.0%) | 0 (0.0%) |
| Total | 48 (78.7%) | 13 (21.3%) |
Employment Characteristics in Taylorville
Employment by Class of Employer in Taylorville
Among the 4,753 employed individuals in Taylorville, private company employees (3,475 | 73.1%), not-for-profit organizations (493 | 10.4%), and local government employees (419 | 8.8%) make up the most common classes of employment.
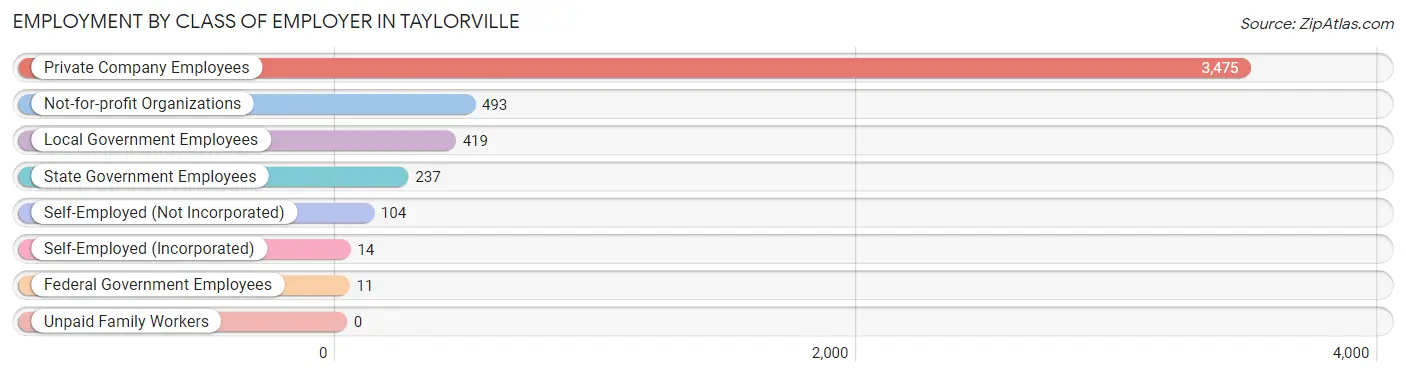
| Employer Class | # Employees | % Employees |
| Private Company Employees | 3,475 | 73.1% |
| Self-Employed (Incorporated) | 14 | 0.3% |
| Self-Employed (Not Incorporated) | 104 | 2.2% |
| Not-for-profit Organizations | 493 | 10.4% |
| Local Government Employees | 419 | 8.8% |
| State Government Employees | 237 | 5.0% |
| Federal Government Employees | 11 | 0.2% |
| Unpaid Family Workers | 0 | 0.0% |
| Total | 4,753 | 100.0% |
Employment Status by Age in Taylorville
According to the labor force statistics for Taylorville, out of the total population over 16 years of age (9,024), 56.2% or 5,071 individuals are in the labor force, with 5.3% or 269 of them unemployed. The age group with the highest labor force participation rate is 45 to 54 years, with 90.3% or 1,270 individuals in the labor force. Within the labor force, the 16 to 19 years age range has the highest percentage of unemployed individuals, with 19.9% or 61 of them being unemployed.
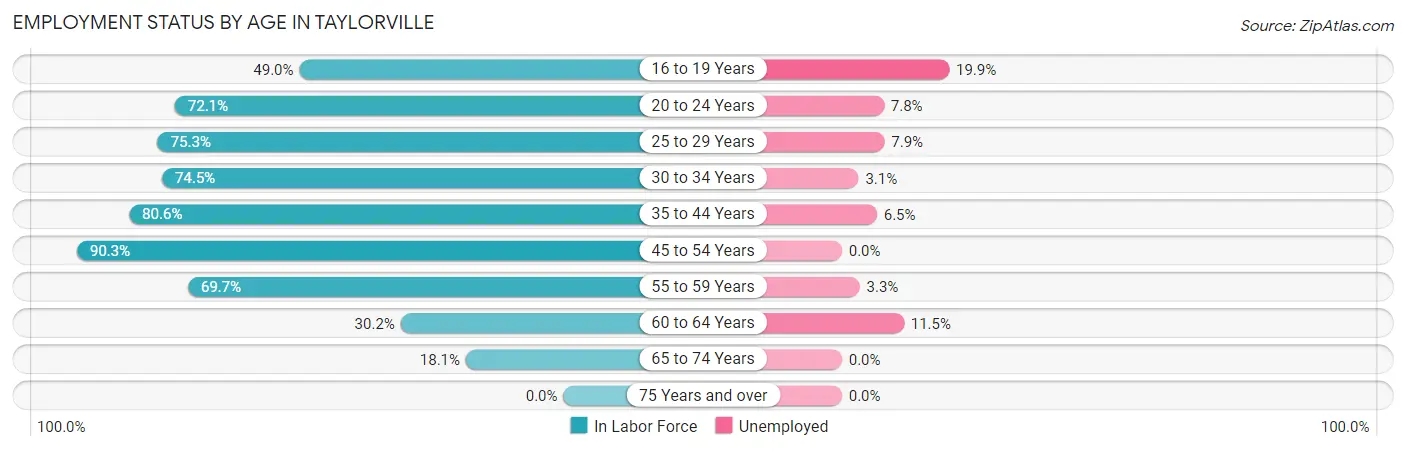
| Age Bracket | In Labor Force | Unemployed |
| 16 to 19 Years | 307 (49.0%) | 61 (19.9%) |
| 20 to 24 Years | 577 (72.1%) | 45 (7.8%) |
| 25 to 29 Years | 506 (75.3%) | 40 (7.9%) |
| 30 to 34 Years | 585 (74.5%) | 18 (3.1%) |
| 35 to 44 Years | 1,024 (80.6%) | 67 (6.5%) |
| 45 to 54 Years | 1,270 (90.3%) | 0 (0.0%) |
| 55 to 59 Years | 398 (69.7%) | 13 (3.3%) |
| 60 to 64 Years | 226 (30.2%) | 26 (11.5%) |
| 65 to 74 Years | 174 (18.1%) | 0 (0.0%) |
| 75 Years and over | 0 (0.0%) | 0 (0.0%) |
| Total | 5,071 (56.2%) | 269 (5.3%) |
Employment Status by Educational Attainment in Taylorville
According to labor force statistics for Taylorville, 73.5% of individuals (4,009) out of the total population between 25 and 64 years of age (5,454) are in the labor force, with 4.1% or 164 of them being unemployed. The group with the highest labor force participation rate are those with the educational attainment of bachelor's degree or higher, with 91.1% or 1,027 individuals in the labor force. Within the labor force, individuals with college / associate degree education have the highest percentage of unemployment, with 5.5% or 73 of them being unemployed.
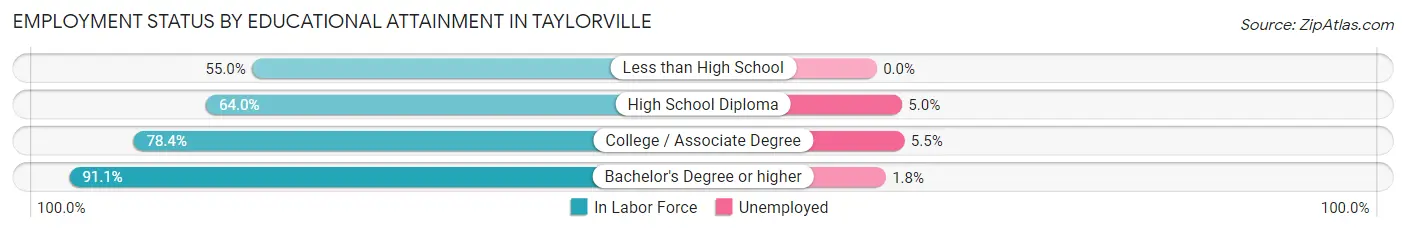
| Educational Attainment | In Labor Force | Unemployed |
| Less than High School | 193 (55.0%) | 0 (0.0%) |
| High School Diploma | 1,459 (64.0%) | 114 (5.0%) |
| College / Associate Degree | 1,330 (78.4%) | 93 (5.5%) |
| Bachelor's Degree or higher | 1,027 (91.1%) | 20 (1.8%) |
| Total | 4,009 (73.5%) | 224 (4.1%) |
Employment Occupations by Sex in Taylorville
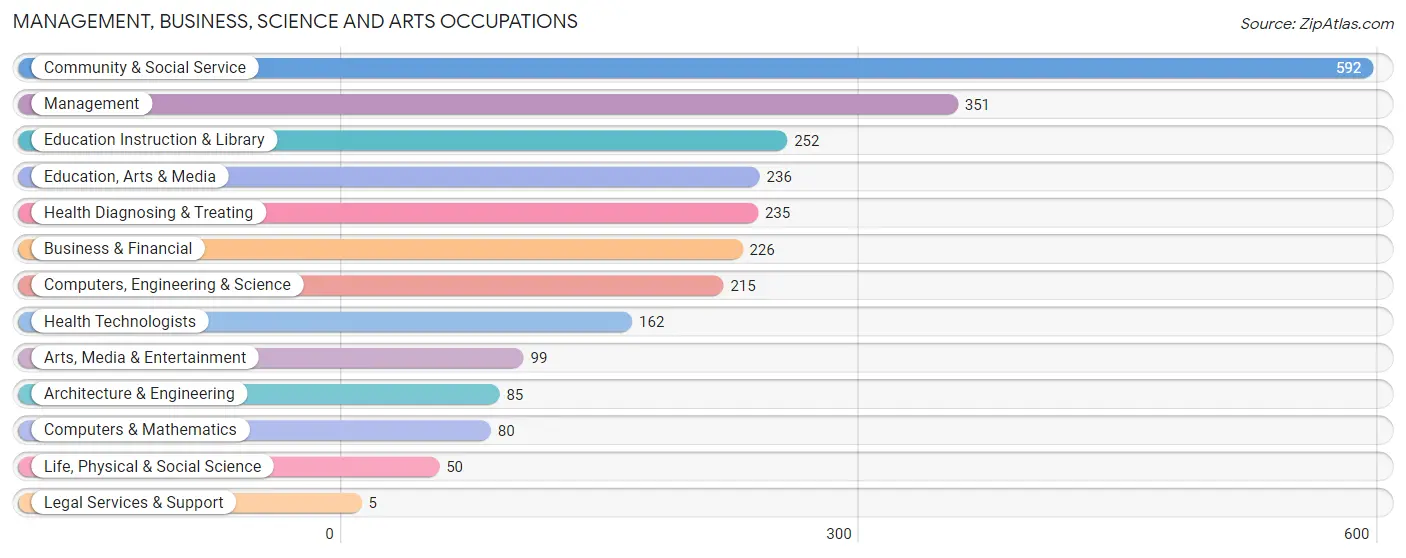
Management, Business, Science and Arts Occupations
The most common Management, Business, Science and Arts occupations in Taylorville are Community & Social Service (592 | 12.3%), Management (351 | 7.3%), Education Instruction & Library (252 | 5.2%), Education, Arts & Media (236 | 4.9%), and Health Diagnosing & Treating (235 | 4.9%).
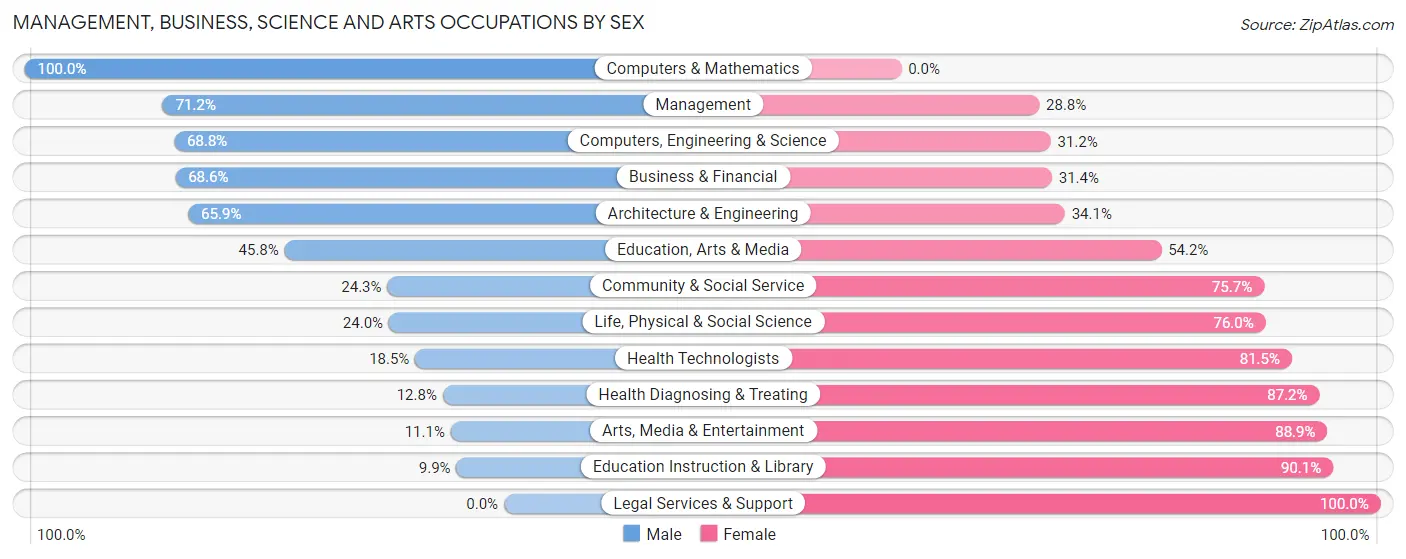
Management, Business, Science and Arts Occupations by Sex
Within the Management, Business, Science and Arts occupations in Taylorville, the most male-oriented occupations are Computers & Mathematics (100.0%), Management (71.2%), and Computers, Engineering & Science (68.8%), while the most female-oriented occupations are Legal Services & Support (100.0%), Education Instruction & Library (90.1%), and Arts, Media & Entertainment (88.9%).
| Occupation | Male | Female |
| Management | 250 (71.2%) | 101 (28.8%) |
| Business & Financial | 155 (68.6%) | 71 (31.4%) |
| Computers, Engineering & Science | 148 (68.8%) | 67 (31.2%) |
| Computers & Mathematics | 80 (100.0%) | 0 (0.0%) |
| Architecture & Engineering | 56 (65.9%) | 29 (34.1%) |
| Life, Physical & Social Science | 12 (24.0%) | 38 (76.0%) |
| Community & Social Service | 144 (24.3%) | 448 (75.7%) |
| Education, Arts & Media | 108 (45.8%) | 128 (54.2%) |
| Legal Services & Support | 0 (0.0%) | 5 (100.0%) |
| Education Instruction & Library | 25 (9.9%) | 227 (90.1%) |
| Arts, Media & Entertainment | 11 (11.1%) | 88 (88.9%) |
| Health Diagnosing & Treating | 30 (12.8%) | 205 (87.2%) |
| Health Technologists | 30 (18.5%) | 132 (81.5%) |
| Total (Category) | 727 (44.9%) | 892 (55.1%) |
| Total (Overall) | 2,528 (52.7%) | 2,269 (47.3%) |
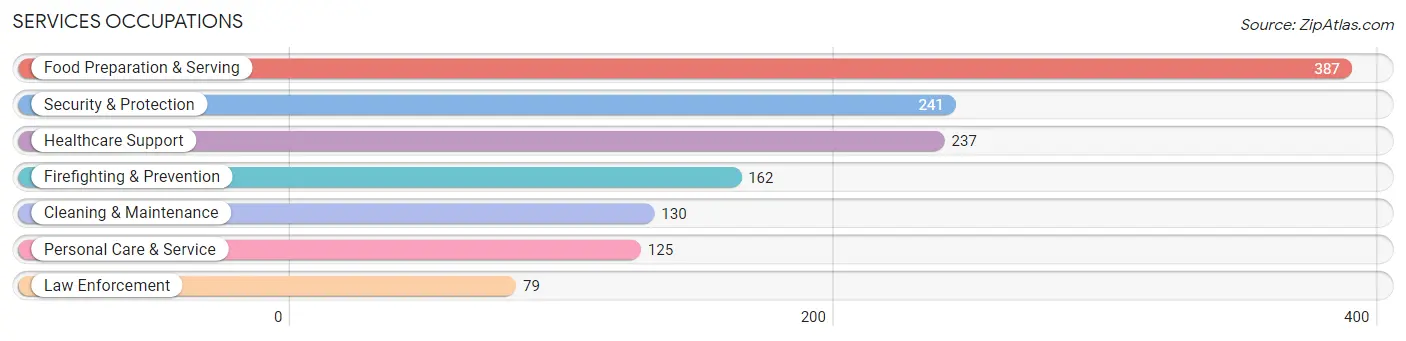
Services Occupations
The most common Services occupations in Taylorville are Food Preparation & Serving (387 | 8.1%), Security & Protection (241 | 5.0%), Healthcare Support (237 | 4.9%), Firefighting & Prevention (162 | 3.4%), and Cleaning & Maintenance (130 | 2.7%).
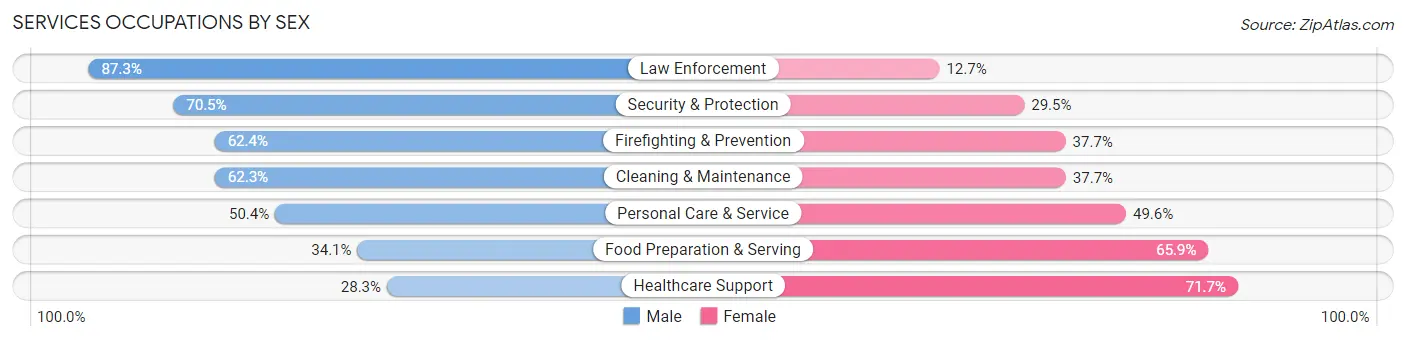
Services Occupations by Sex
Within the Services occupations in Taylorville, the most male-oriented occupations are Law Enforcement (87.3%), Security & Protection (70.5%), and Firefighting & Prevention (62.4%), while the most female-oriented occupations are Healthcare Support (71.7%), Food Preparation & Serving (65.9%), and Personal Care & Service (49.6%).
| Occupation | Male | Female |
| Healthcare Support | 67 (28.3%) | 170 (71.7%) |
| Security & Protection | 170 (70.5%) | 71 (29.5%) |
| Firefighting & Prevention | 101 (62.4%) | 61 (37.7%) |
| Law Enforcement | 69 (87.3%) | 10 (12.7%) |
| Food Preparation & Serving | 132 (34.1%) | 255 (65.9%) |
| Cleaning & Maintenance | 81 (62.3%) | 49 (37.7%) |
| Personal Care & Service | 63 (50.4%) | 62 (49.6%) |
| Total (Category) | 513 (45.8%) | 607 (54.2%) |
| Total (Overall) | 2,528 (52.7%) | 2,269 (47.3%) |
Sales and Office Occupations
The most common Sales and Office occupations in Taylorville are Sales & Related (518 | 10.8%), and Office & Administration (505 | 10.5%).

Sales and Office Occupations by Sex
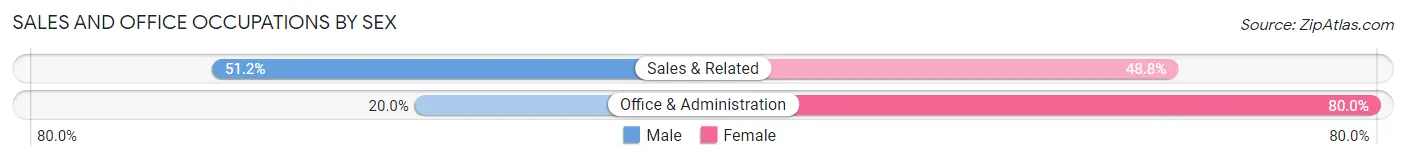
| Occupation | Male | Female |
| Sales & Related | 265 (51.2%) | 253 (48.8%) |
| Office & Administration | 101 (20.0%) | 404 (80.0%) |
| Total (Category) | 366 (35.8%) | 657 (64.2%) |
| Total (Overall) | 2,528 (52.7%) | 2,269 (47.3%) |
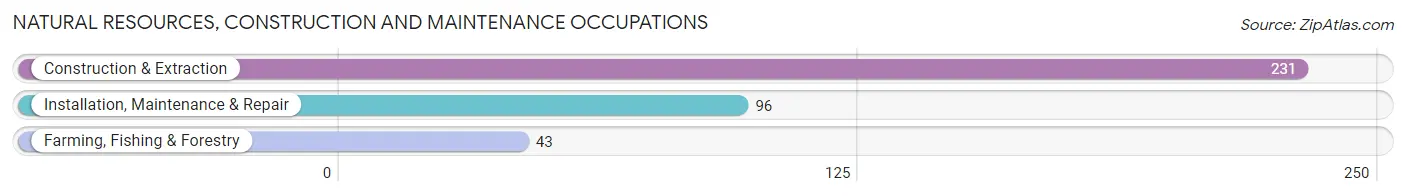
Natural Resources, Construction and Maintenance Occupations
The most common Natural Resources, Construction and Maintenance occupations in Taylorville are Construction & Extraction (231 | 4.8%), Installation, Maintenance & Repair (96 | 2.0%), and Farming, Fishing & Forestry (43 | 0.9%).
Natural Resources, Construction and Maintenance Occupations by Sex
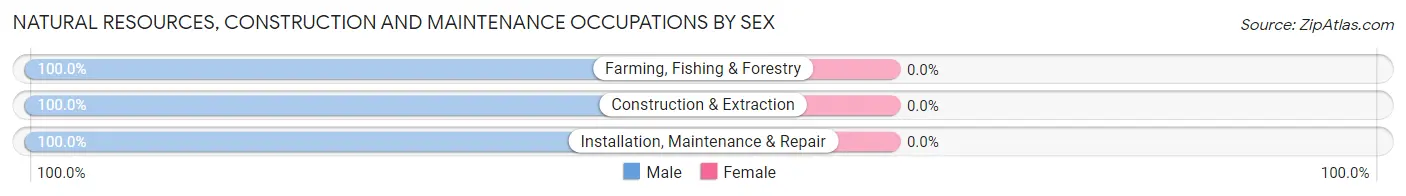
| Occupation | Male | Female |
| Farming, Fishing & Forestry | 43 (100.0%) | 0 (0.0%) |
| Construction & Extraction | 231 (100.0%) | 0 (0.0%) |
| Installation, Maintenance & Repair | 96 (100.0%) | 0 (0.0%) |
| Total (Category) | 370 (100.0%) | 0 (0.0%) |
| Total (Overall) | 2,528 (52.7%) | 2,269 (47.3%) |
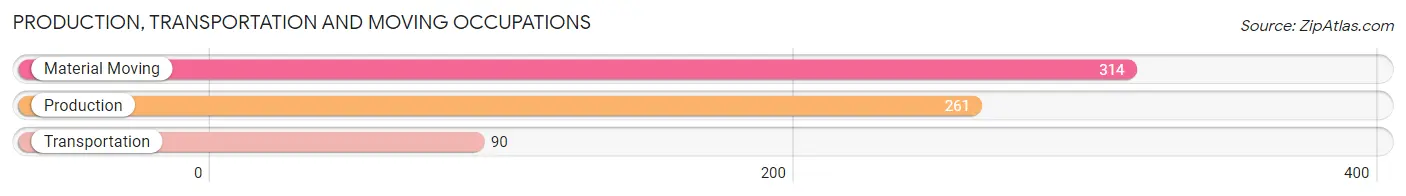
Production, Transportation and Moving Occupations
The most common Production, Transportation and Moving occupations in Taylorville are Material Moving (314 | 6.6%), Production (261 | 5.4%), and Transportation (90 | 1.9%).
Production, Transportation and Moving Occupations by Sex
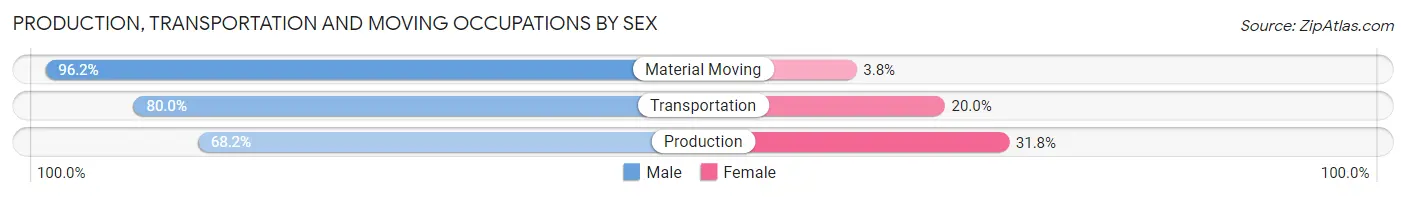
| Occupation | Male | Female |
| Production | 178 (68.2%) | 83 (31.8%) |
| Transportation | 72 (80.0%) | 18 (20.0%) |
| Material Moving | 302 (96.2%) | 12 (3.8%) |
| Total (Category) | 552 (83.0%) | 113 (17.0%) |
| Total (Overall) | 2,528 (52.7%) | 2,269 (47.3%) |
Employment Industries by Sex in Taylorville
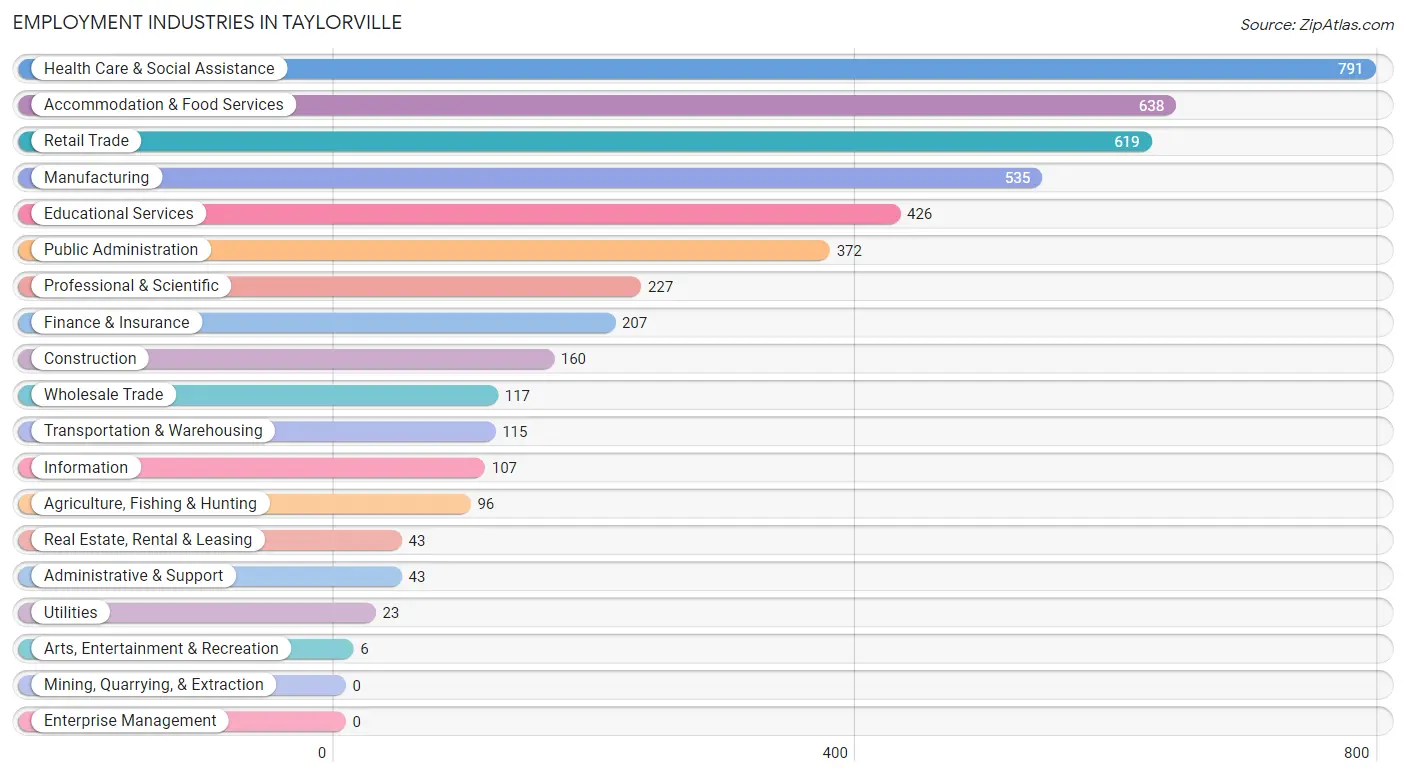
Employment Industries in Taylorville
The major employment industries in Taylorville include Health Care & Social Assistance (791 | 16.5%), Accommodation & Food Services (638 | 13.3%), Retail Trade (619 | 12.9%), Manufacturing (535 | 11.2%), and Educational Services (426 | 8.9%).
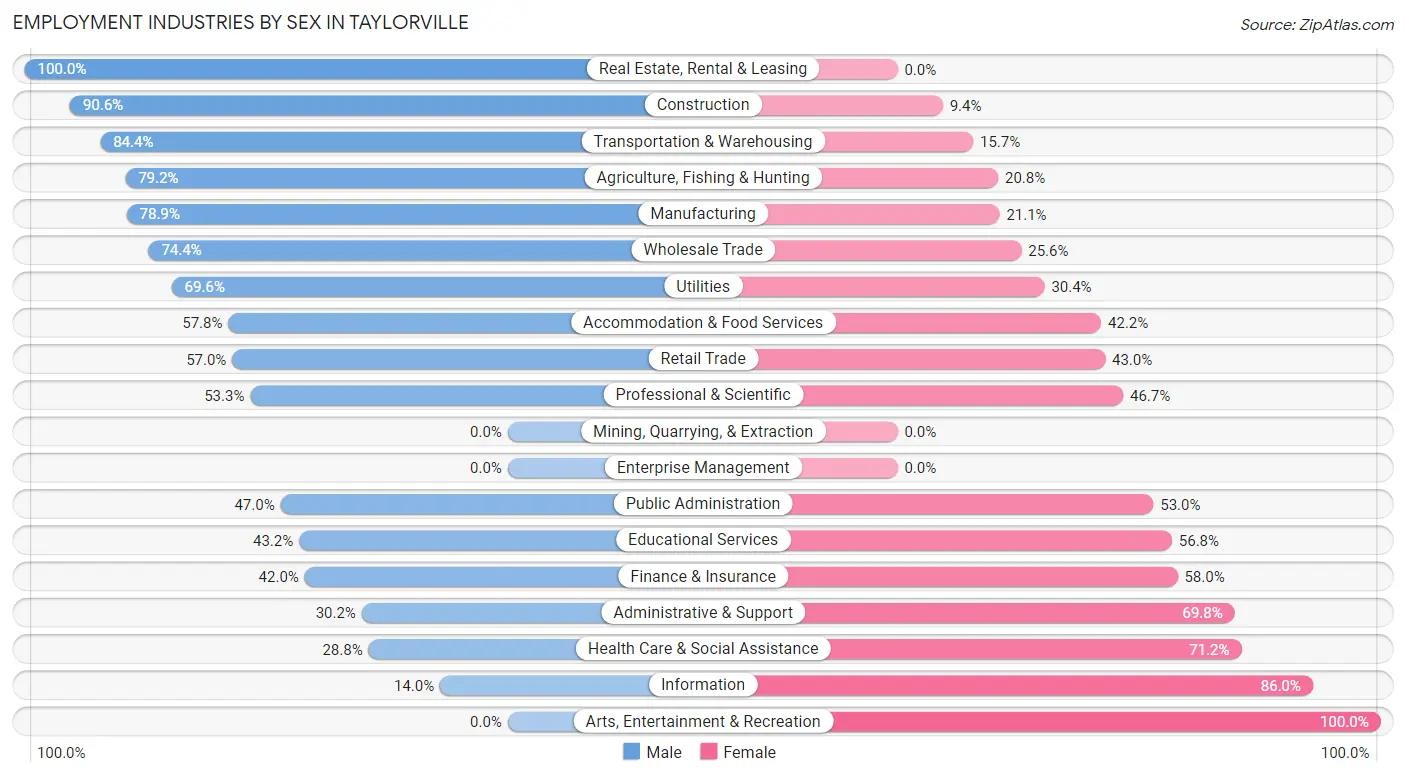
Employment Industries by Sex in Taylorville
The Taylorville industries that see more men than women are Real Estate, Rental & Leasing (100.0%), Construction (90.6%), and Transportation & Warehousing (84.4%), whereas the industries that tend to have a higher number of women are Arts, Entertainment & Recreation (100.0%), Information (86.0%), and Health Care & Social Assistance (71.2%).
| Industry | Male | Female |
| Agriculture, Fishing & Hunting | 76 (79.2%) | 20 (20.8%) |
| Mining, Quarrying, & Extraction | 0 (0.0%) | 0 (0.0%) |
| Construction | 145 (90.6%) | 15 (9.4%) |
| Manufacturing | 422 (78.9%) | 113 (21.1%) |
| Wholesale Trade | 87 (74.4%) | 30 (25.6%) |
| Retail Trade | 353 (57.0%) | 266 (43.0%) |
| Transportation & Warehousing | 97 (84.4%) | 18 (15.7%) |
| Utilities | 16 (69.6%) | 7 (30.4%) |
| Information | 15 (14.0%) | 92 (86.0%) |
| Finance & Insurance | 87 (42.0%) | 120 (58.0%) |
| Real Estate, Rental & Leasing | 43 (100.0%) | 0 (0.0%) |
| Professional & Scientific | 121 (53.3%) | 106 (46.7%) |
| Enterprise Management | 0 (0.0%) | 0 (0.0%) |
| Administrative & Support | 13 (30.2%) | 30 (69.8%) |
| Educational Services | 184 (43.2%) | 242 (56.8%) |
| Health Care & Social Assistance | 228 (28.8%) | 563 (71.2%) |
| Arts, Entertainment & Recreation | 0 (0.0%) | 6 (100.0%) |
| Accommodation & Food Services | 369 (57.8%) | 269 (42.2%) |
| Public Administration | 175 (47.0%) | 197 (53.0%) |
| Total | 2,528 (52.7%) | 2,269 (47.3%) |
Education in Taylorville
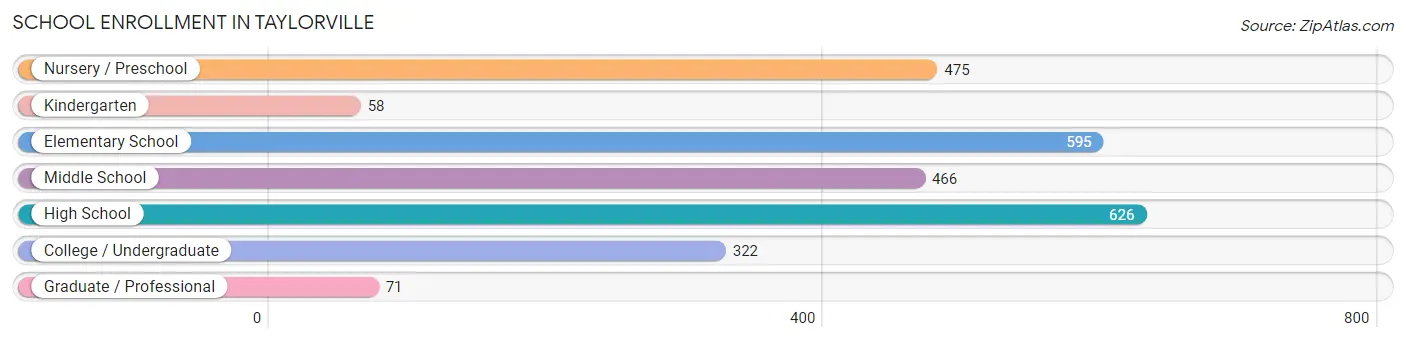
School Enrollment in Taylorville
The most common levels of schooling among the 2,613 students in Taylorville are high school (626 | 24.0%), elementary school (595 | 22.8%), and nursery / preschool (475 | 18.2%).
| School Level | # Students | % Students |
| Nursery / Preschool | 475 | 18.2% |
| Kindergarten | 58 | 2.2% |
| Elementary School | 595 | 22.8% |
| Middle School | 466 | 17.8% |
| High School | 626 | 24.0% |
| College / Undergraduate | 322 | 12.3% |
| Graduate / Professional | 71 | 2.7% |
| Total | 2,613 | 100.0% |
School Enrollment by Age by Funding Source in Taylorville
Out of a total of 2,613 students who are enrolled in schools in Taylorville, 162 (6.2%) attend a private institution, while the remaining 2,451 (93.8%) are enrolled in public schools. The age group of 35 years and over has the highest likelihood of being enrolled in private schools, with 26 (52.0% in the age bracket) enrolled. Conversely, the age group of 3 to 4 year olds has the lowest likelihood of being enrolled in a private school, with 424 (100.0% in the age bracket) attending a public institution.
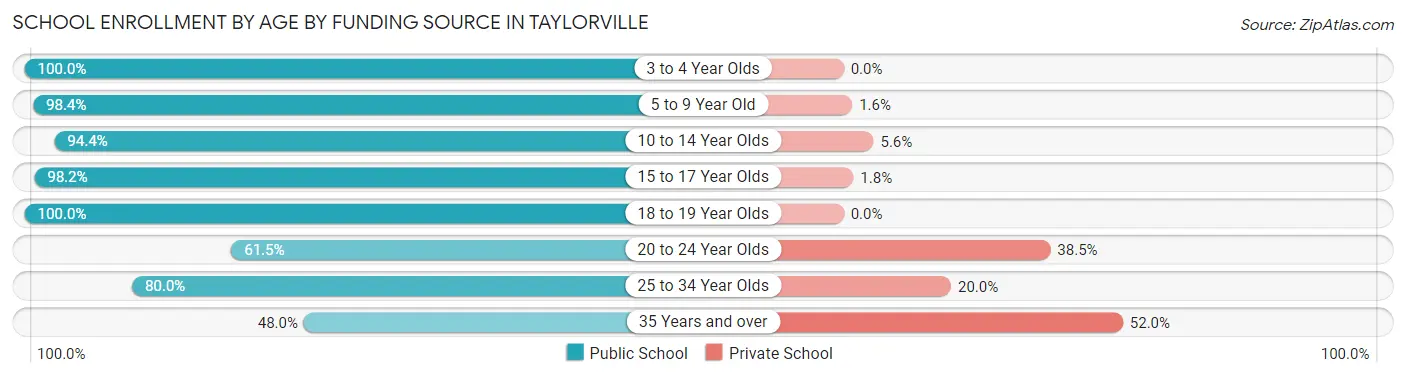
| Age Bracket | Public School | Private School |
| 3 to 4 Year Olds | 424 (100.0%) | 0 (0.0%) |
| 5 to 9 Year Old | 620 (98.4%) | 10 (1.6%) |
| 10 to 14 Year Olds | 578 (94.4%) | 34 (5.6%) |
| 15 to 17 Year Olds | 544 (98.2%) | 10 (1.8%) |
| 18 to 19 Year Olds | 94 (100.0%) | 0 (0.0%) |
| 20 to 24 Year Olds | 107 (61.5%) | 67 (38.5%) |
| 25 to 34 Year Olds | 60 (80.0%) | 15 (20.0%) |
| 35 Years and over | 24 (48.0%) | 26 (52.0%) |
| Total | 2,451 (93.8%) | 162 (6.2%) |
Educational Attainment by Field of Study in Taylorville
Education (344 | 21.9%), arts & humanities (205 | 13.0%), liberal arts & history (140 | 8.9%), science & technology (139 | 8.8%), and social sciences (118 | 7.5%) are the most common fields of study among 1,574 individuals in Taylorville who have obtained a bachelor's degree or higher.
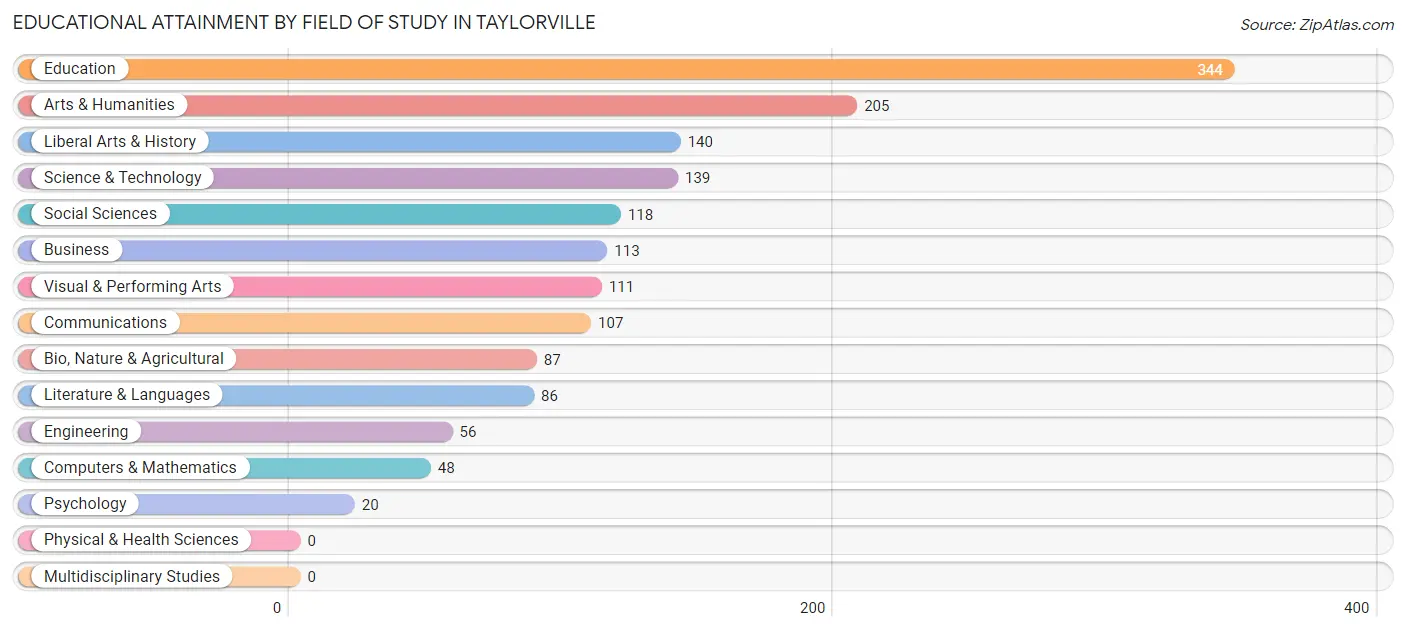
| Field of Study | # Graduates | % Graduates |
| Computers & Mathematics | 48 | 3.0% |
| Bio, Nature & Agricultural | 87 | 5.5% |
| Physical & Health Sciences | 0 | 0.0% |
| Psychology | 20 | 1.3% |
| Social Sciences | 118 | 7.5% |
| Engineering | 56 | 3.6% |
| Multidisciplinary Studies | 0 | 0.0% |
| Science & Technology | 139 | 8.8% |
| Business | 113 | 7.2% |
| Education | 344 | 21.9% |
| Literature & Languages | 86 | 5.5% |
| Liberal Arts & History | 140 | 8.9% |
| Visual & Performing Arts | 111 | 7.0% |
| Communications | 107 | 6.8% |
| Arts & Humanities | 205 | 13.0% |
| Total | 1,574 | 100.0% |
Transportation & Commute in Taylorville
Vehicle Availability by Sex in Taylorville
The most prevalent vehicle ownership categories in Taylorville are males with 2 vehicles (1,298, accounting for 51.5%) and females with 2 vehicles (927, making up 58.3%).
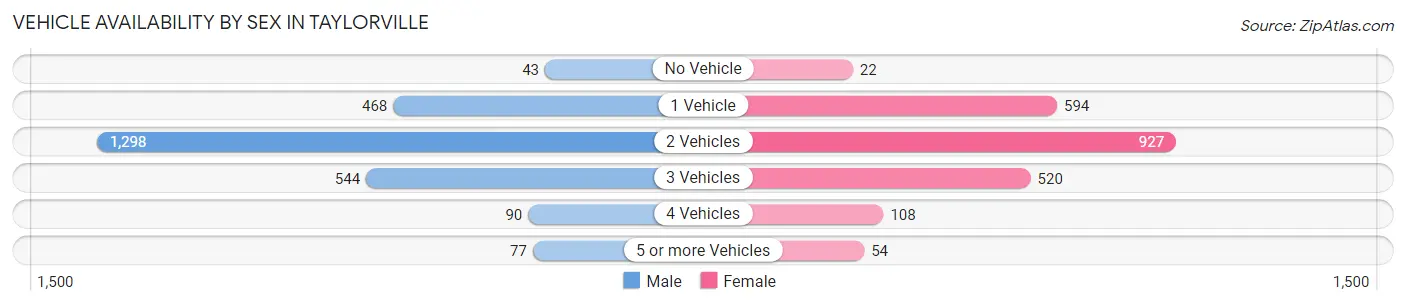
| Vehicles Available | Male | Female |
| No Vehicle | 43 (1.7%) | 22 (1.0%) |
| 1 Vehicle | 468 (18.6%) | 594 (26.7%) |
| 2 Vehicles | 1,298 (51.5%) | 927 (41.7%) |
| 3 Vehicles | 544 (21.6%) | 520 (23.4%) |
| 4 Vehicles | 90 (3.6%) | 108 (4.9%) |
| 5 or more Vehicles | 77 (3.1%) | 54 (2.4%) |
| Total | 2,520 (100.0%) | 2,225 (100.0%) |
Commute Time in Taylorville
The most frequently occuring commute durations in Taylorville are 5 to 9 minutes (1,524 commuters, 33.2%), 10 to 14 minutes (817 commuters, 17.8%), and 45 to 59 minutes (372 commuters, 8.1%).
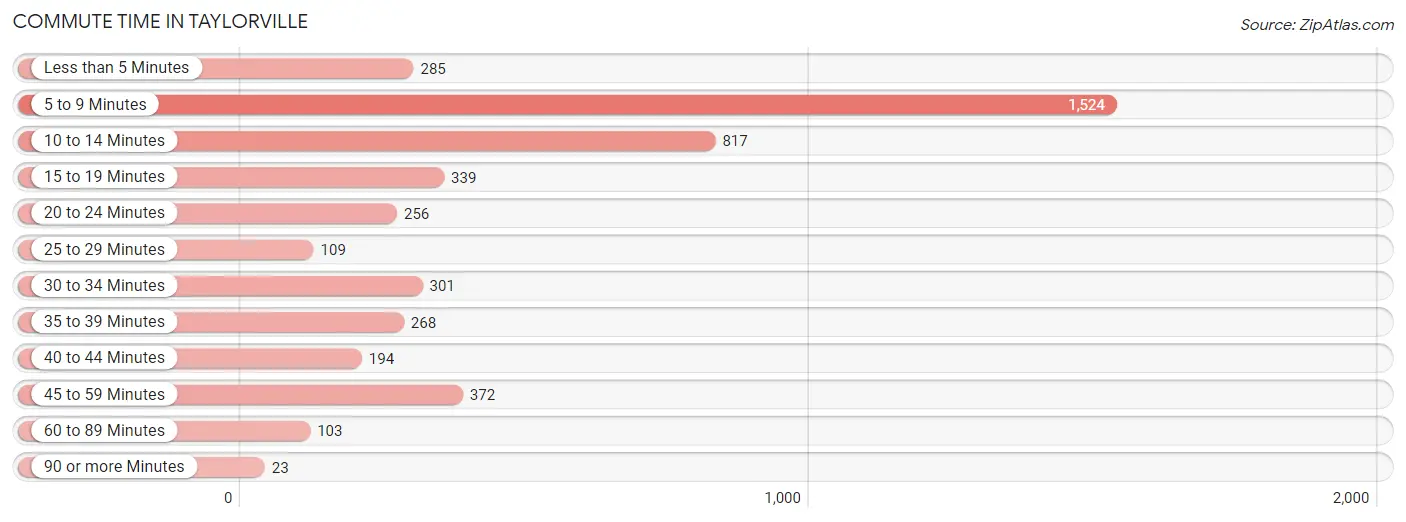
| Commute Time | # Commuters | % Commuters |
| Less than 5 Minutes | 285 | 6.2% |
| 5 to 9 Minutes | 1,524 | 33.2% |
| 10 to 14 Minutes | 817 | 17.8% |
| 15 to 19 Minutes | 339 | 7.4% |
| 20 to 24 Minutes | 256 | 5.6% |
| 25 to 29 Minutes | 109 | 2.4% |
| 30 to 34 Minutes | 301 | 6.6% |
| 35 to 39 Minutes | 268 | 5.8% |
| 40 to 44 Minutes | 194 | 4.2% |
| 45 to 59 Minutes | 372 | 8.1% |
| 60 to 89 Minutes | 103 | 2.2% |
| 90 or more Minutes | 23 | 0.5% |
Commute Time by Sex in Taylorville
The most common commute times in Taylorville are 5 to 9 minutes (806 commuters, 32.4%) for males and 5 to 9 minutes (718 commuters, 34.1%) for females.
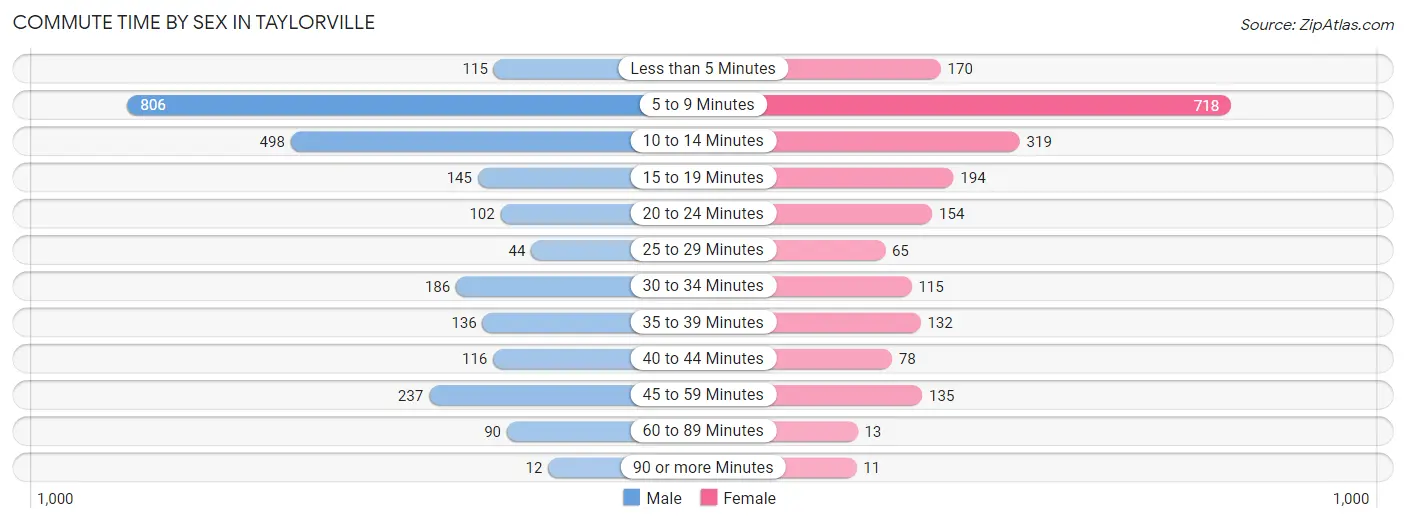
| Commute Time | Male | Female |
| Less than 5 Minutes | 115 (4.6%) | 170 (8.1%) |
| 5 to 9 Minutes | 806 (32.4%) | 718 (34.1%) |
| 10 to 14 Minutes | 498 (20.0%) | 319 (15.2%) |
| 15 to 19 Minutes | 145 (5.8%) | 194 (9.2%) |
| 20 to 24 Minutes | 102 (4.1%) | 154 (7.3%) |
| 25 to 29 Minutes | 44 (1.8%) | 65 (3.1%) |
| 30 to 34 Minutes | 186 (7.5%) | 115 (5.5%) |
| 35 to 39 Minutes | 136 (5.5%) | 132 (6.3%) |
| 40 to 44 Minutes | 116 (4.7%) | 78 (3.7%) |
| 45 to 59 Minutes | 237 (9.5%) | 135 (6.4%) |
| 60 to 89 Minutes | 90 (3.6%) | 13 (0.6%) |
| 90 or more Minutes | 12 (0.5%) | 11 (0.5%) |
Time of Departure to Work by Sex in Taylorville
The most frequent times of departure to work in Taylorville are 7:00 AM to 7:29 AM (478, 19.2%) for males and 7:00 AM to 7:29 AM (393, 18.7%) for females.
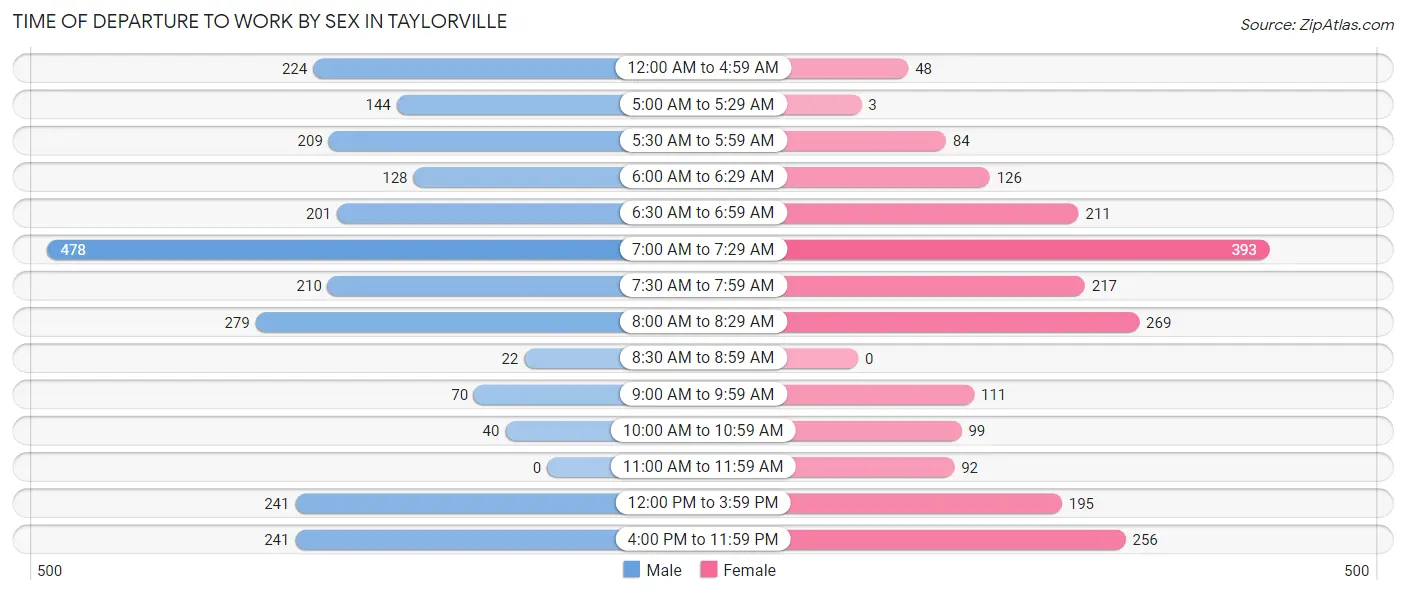
| Time of Departure | Male | Female |
| 12:00 AM to 4:59 AM | 224 (9.0%) | 48 (2.3%) |
| 5:00 AM to 5:29 AM | 144 (5.8%) | 3 (0.1%) |
| 5:30 AM to 5:59 AM | 209 (8.4%) | 84 (4.0%) |
| 6:00 AM to 6:29 AM | 128 (5.1%) | 126 (6.0%) |
| 6:30 AM to 6:59 AM | 201 (8.1%) | 211 (10.0%) |
| 7:00 AM to 7:29 AM | 478 (19.2%) | 393 (18.7%) |
| 7:30 AM to 7:59 AM | 210 (8.4%) | 217 (10.3%) |
| 8:00 AM to 8:29 AM | 279 (11.2%) | 269 (12.8%) |
| 8:30 AM to 8:59 AM | 22 (0.9%) | 0 (0.0%) |
| 9:00 AM to 9:59 AM | 70 (2.8%) | 111 (5.3%) |
| 10:00 AM to 10:59 AM | 40 (1.6%) | 99 (4.7%) |
| 11:00 AM to 11:59 AM | 0 (0.0%) | 92 (4.4%) |
| 12:00 PM to 3:59 PM | 241 (9.7%) | 195 (9.3%) |
| 4:00 PM to 11:59 PM | 241 (9.7%) | 256 (12.2%) |
| Total | 2,487 (100.0%) | 2,104 (100.0%) |
Housing Occupancy in Taylorville
Occupancy by Ownership in Taylorville
Of the total 4,779 dwellings in Taylorville, owner-occupied units account for 3,364 (70.4%), while renter-occupied units make up 1,415 (29.6%).
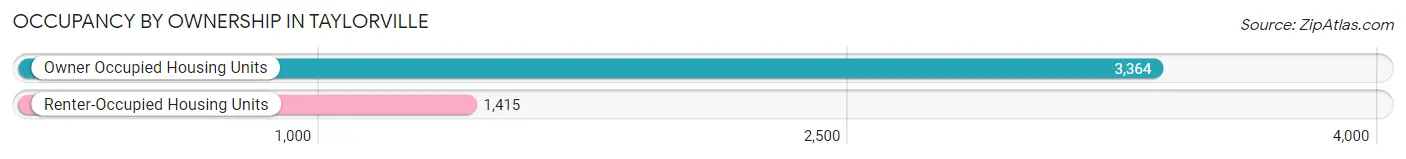
| Occupancy | # Housing Units | % Housing Units |
| Owner Occupied Housing Units | 3,364 | 70.4% |
| Renter-Occupied Housing Units | 1,415 | 29.6% |
| Total Occupied Housing Units | 4,779 | 100.0% |
Occupancy by Household Size in Taylorville
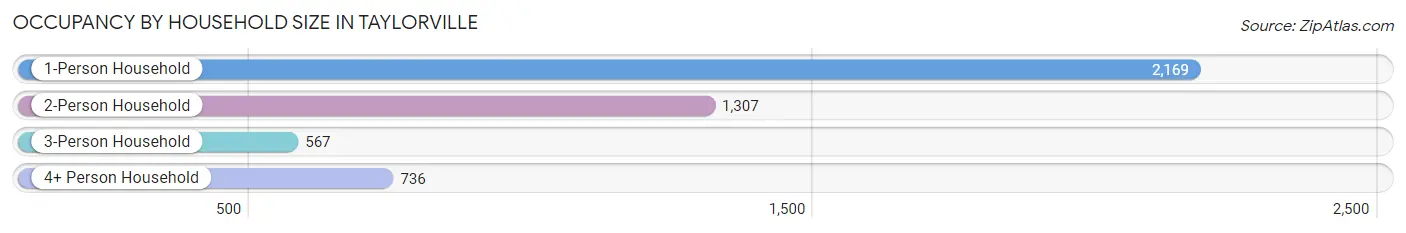
| Household Size | # Housing Units | % Housing Units |
| 1-Person Household | 2,169 | 45.4% |
| 2-Person Household | 1,307 | 27.4% |
| 3-Person Household | 567 | 11.9% |
| 4+ Person Household | 736 | 15.4% |
| Total Housing Units | 4,779 | 100.0% |
Occupancy by Ownership by Household Size in Taylorville
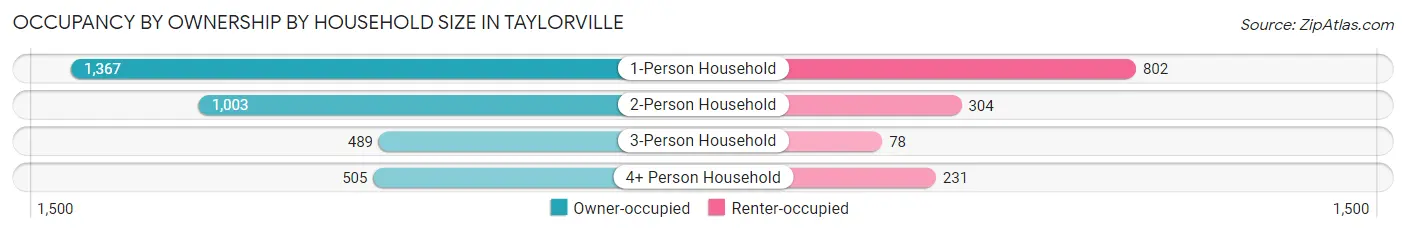
| Household Size | Owner-occupied | Renter-occupied |
| 1-Person Household | 1,367 (63.0%) | 802 (37.0%) |
| 2-Person Household | 1,003 (76.7%) | 304 (23.3%) |
| 3-Person Household | 489 (86.2%) | 78 (13.8%) |
| 4+ Person Household | 505 (68.6%) | 231 (31.4%) |
| Total Housing Units | 3,364 (70.4%) | 1,415 (29.6%) |
Occupancy by Educational Attainment in Taylorville
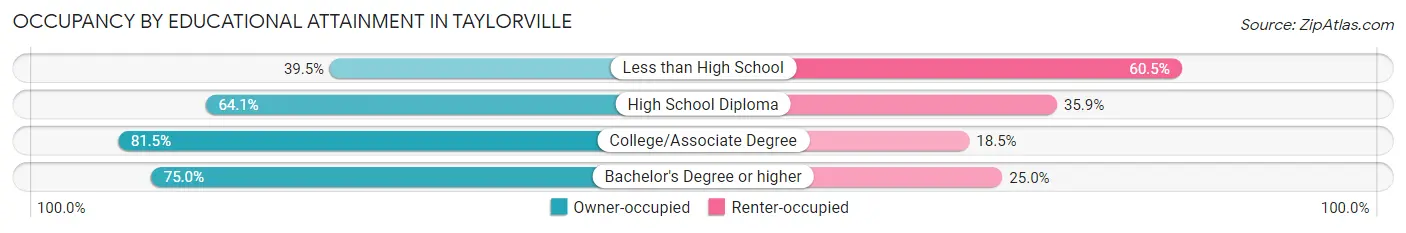
| Household Size | Owner-occupied | Renter-occupied |
| Less than High School | 116 (39.5%) | 178 (60.5%) |
| High School Diploma | 1,302 (64.1%) | 728 (35.9%) |
| College/Associate Degree | 1,314 (81.5%) | 298 (18.5%) |
| Bachelor's Degree or higher | 632 (75.0%) | 211 (25.0%) |
Occupancy by Age of Householder in Taylorville
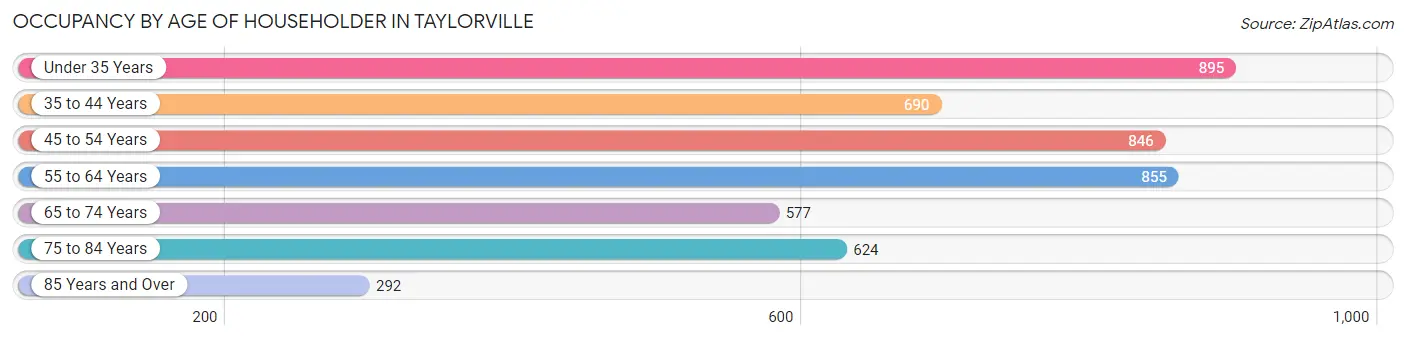
| Age Bracket | # Households | % Households |
| Under 35 Years | 895 | 18.7% |
| 35 to 44 Years | 690 | 14.4% |
| 45 to 54 Years | 846 | 17.7% |
| 55 to 64 Years | 855 | 17.9% |
| 65 to 74 Years | 577 | 12.1% |
| 75 to 84 Years | 624 | 13.1% |
| 85 Years and Over | 292 | 6.1% |
| Total | 4,779 | 100.0% |
Housing Finances in Taylorville
Median Income by Occupancy in Taylorville
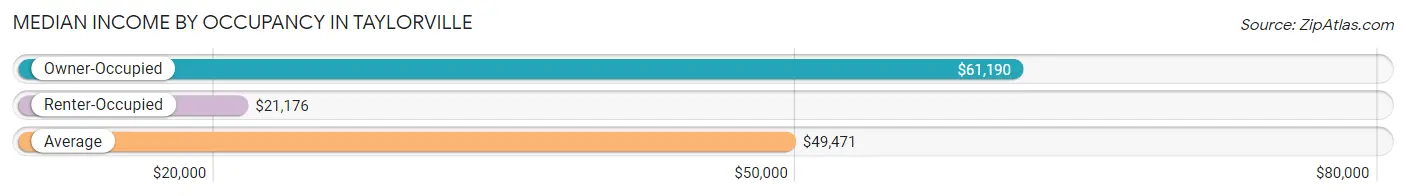
| Occupancy Type | # Households | Median Income |
| Owner-Occupied | 3,364 (70.4%) | $61,190 |
| Renter-Occupied | 1,415 (29.6%) | $21,176 |
| Average | 4,779 (100.0%) | $49,471 |
Occupancy by Householder Income Bracket in Taylorville
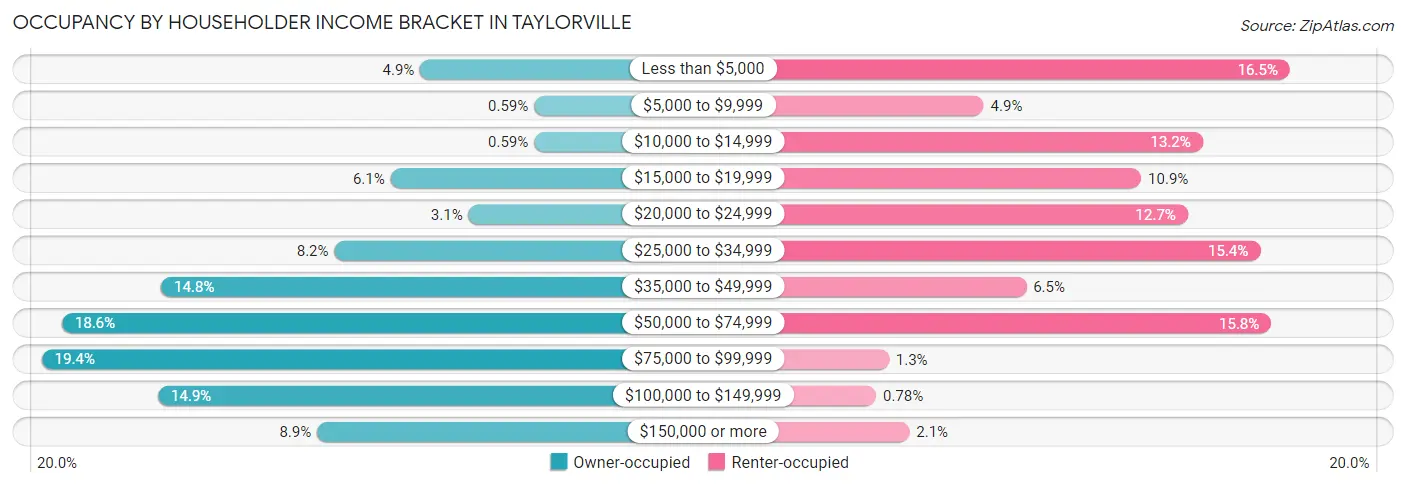
| Income Bracket | Owner-occupied | Renter-occupied |
| Less than $5,000 | 166 (4.9%) | 234 (16.5%) |
| $5,000 to $9,999 | 20 (0.6%) | 69 (4.9%) |
| $10,000 to $14,999 | 20 (0.6%) | 187 (13.2%) |
| $15,000 to $19,999 | 204 (6.1%) | 154 (10.9%) |
| $20,000 to $24,999 | 104 (3.1%) | 179 (12.7%) |
| $25,000 to $34,999 | 276 (8.2%) | 218 (15.4%) |
| $35,000 to $49,999 | 498 (14.8%) | 92 (6.5%) |
| $50,000 to $74,999 | 625 (18.6%) | 224 (15.8%) |
| $75,000 to $99,999 | 651 (19.4%) | 18 (1.3%) |
| $100,000 to $149,999 | 502 (14.9%) | 11 (0.8%) |
| $150,000 or more | 298 (8.9%) | 29 (2.1%) |
| Total | 3,364 (100.0%) | 1,415 (100.0%) |
Monthly Housing Cost Tiers in Taylorville
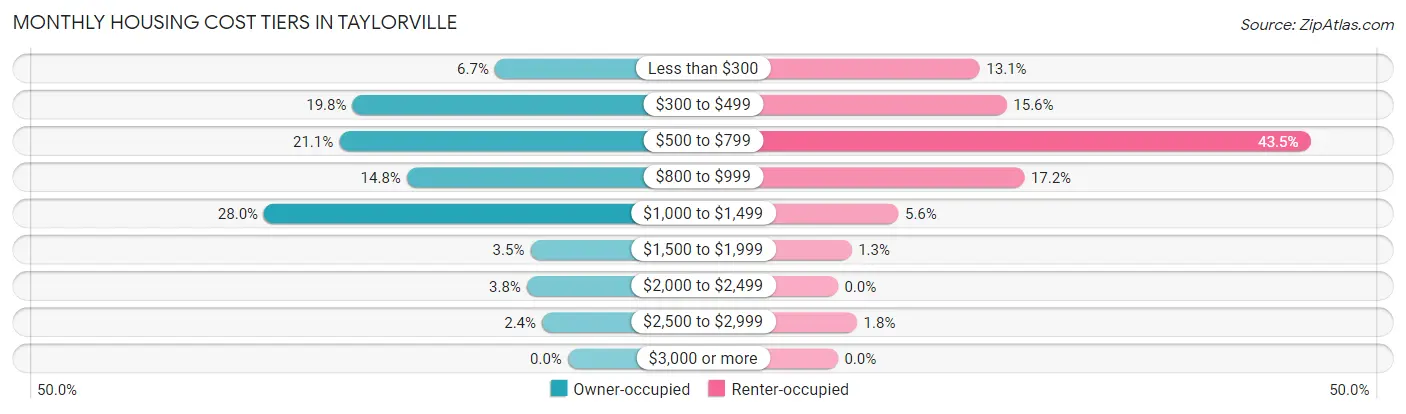
| Monthly Cost | Owner-occupied | Renter-occupied |
| Less than $300 | 226 (6.7%) | 185 (13.1%) |
| $300 to $499 | 667 (19.8%) | 220 (15.5%) |
| $500 to $799 | 708 (21.0%) | 616 (43.5%) |
| $800 to $999 | 499 (14.8%) | 243 (17.2%) |
| $1,000 to $1,499 | 941 (28.0%) | 79 (5.6%) |
| $1,500 to $1,999 | 116 (3.5%) | 18 (1.3%) |
| $2,000 to $2,499 | 127 (3.8%) | 0 (0.0%) |
| $2,500 to $2,999 | 80 (2.4%) | 25 (1.8%) |
| $3,000 or more | 0 (0.0%) | 0 (0.0%) |
| Total | 3,364 (100.0%) | 1,415 (100.0%) |
Physical Housing Characteristics in Taylorville
Housing Structures in Taylorville
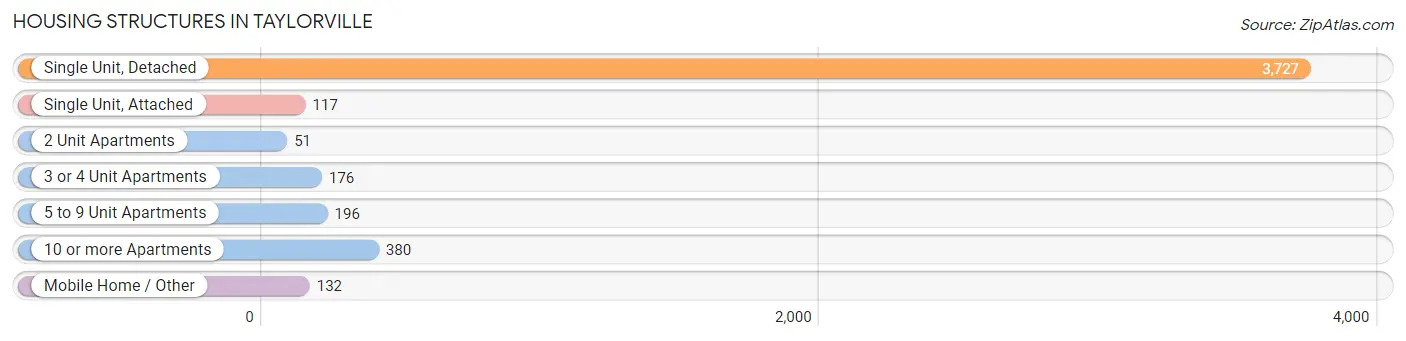
| Structure Type | # Housing Units | % Housing Units |
| Single Unit, Detached | 3,727 | 78.0% |
| Single Unit, Attached | 117 | 2.5% |
| 2 Unit Apartments | 51 | 1.1% |
| 3 or 4 Unit Apartments | 176 | 3.7% |
| 5 to 9 Unit Apartments | 196 | 4.1% |
| 10 or more Apartments | 380 | 8.0% |
| Mobile Home / Other | 132 | 2.8% |
| Total | 4,779 | 100.0% |
Housing Structures by Occupancy in Taylorville
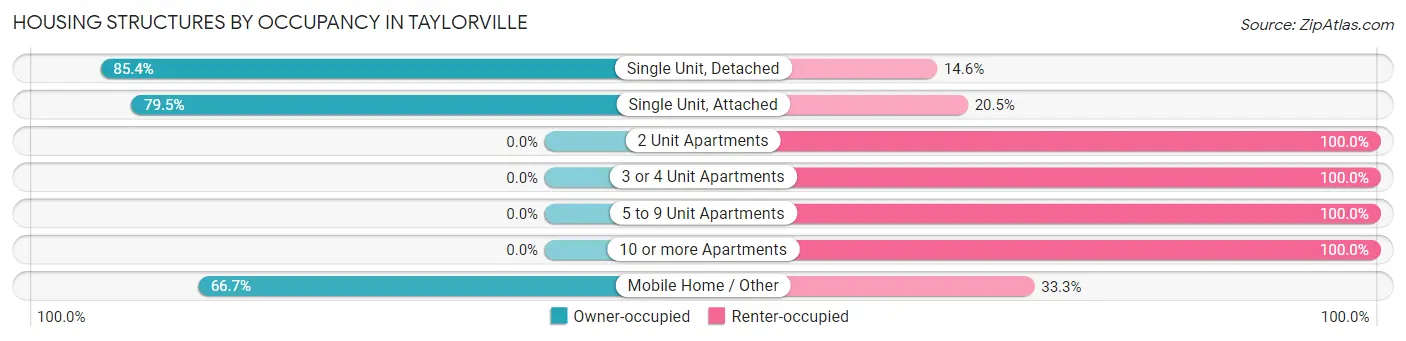
| Structure Type | Owner-occupied | Renter-occupied |
| Single Unit, Detached | 3,183 (85.4%) | 544 (14.6%) |
| Single Unit, Attached | 93 (79.5%) | 24 (20.5%) |
| 2 Unit Apartments | 0 (0.0%) | 51 (100.0%) |
| 3 or 4 Unit Apartments | 0 (0.0%) | 176 (100.0%) |
| 5 to 9 Unit Apartments | 0 (0.0%) | 196 (100.0%) |
| 10 or more Apartments | 0 (0.0%) | 380 (100.0%) |
| Mobile Home / Other | 88 (66.7%) | 44 (33.3%) |
| Total | 3,364 (70.4%) | 1,415 (29.6%) |
Housing Structures by Number of Rooms in Taylorville
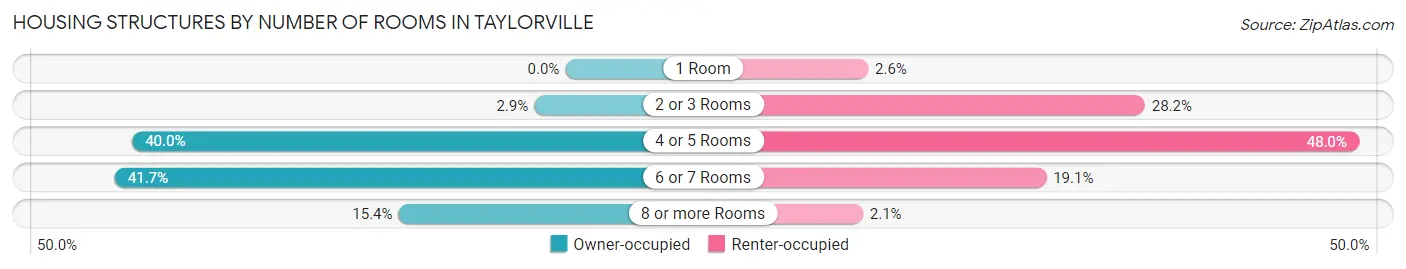
| Number of Rooms | Owner-occupied | Renter-occupied |
| 1 Room | 0 (0.0%) | 37 (2.6%) |
| 2 or 3 Rooms | 97 (2.9%) | 399 (28.2%) |
| 4 or 5 Rooms | 1,347 (40.0%) | 679 (48.0%) |
| 6 or 7 Rooms | 1,401 (41.6%) | 270 (19.1%) |
| 8 or more Rooms | 519 (15.4%) | 30 (2.1%) |
| Total | 3,364 (100.0%) | 1,415 (100.0%) |
Housing Structure by Heating Type in Taylorville
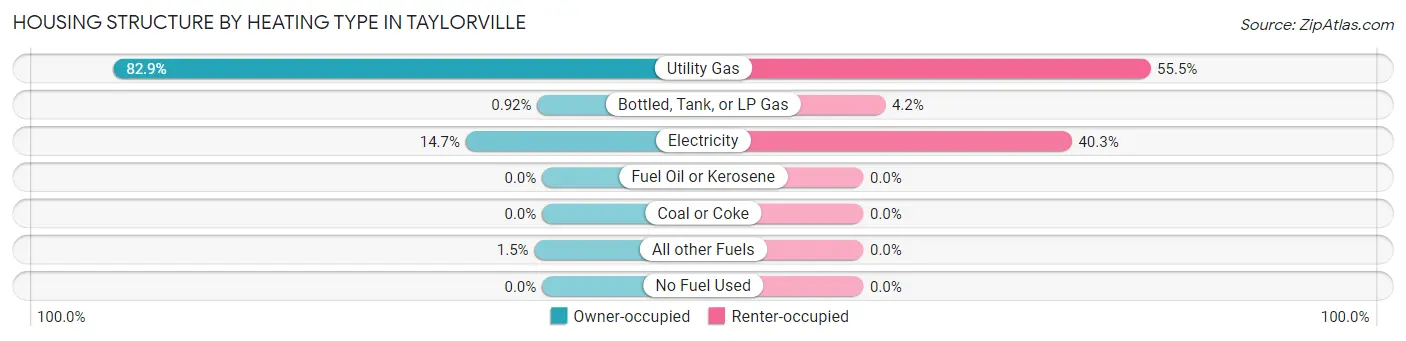
| Heating Type | Owner-occupied | Renter-occupied |
| Utility Gas | 2,787 (82.9%) | 785 (55.5%) |
| Bottled, Tank, or LP Gas | 31 (0.9%) | 60 (4.2%) |
| Electricity | 496 (14.7%) | 570 (40.3%) |
| Fuel Oil or Kerosene | 0 (0.0%) | 0 (0.0%) |
| Coal or Coke | 0 (0.0%) | 0 (0.0%) |
| All other Fuels | 50 (1.5%) | 0 (0.0%) |
| No Fuel Used | 0 (0.0%) | 0 (0.0%) |
| Total | 3,364 (100.0%) | 1,415 (100.0%) |
Household Vehicle Usage in Taylorville
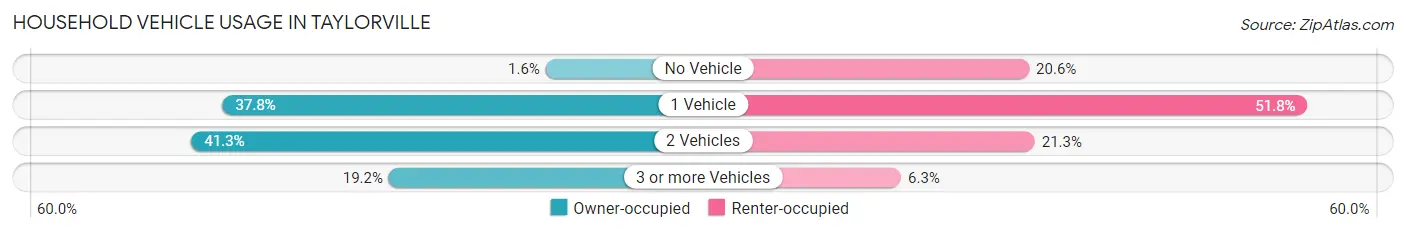
| Vehicles per Household | Owner-occupied | Renter-occupied |
| No Vehicle | 55 (1.6%) | 292 (20.6%) |
| 1 Vehicle | 1,273 (37.8%) | 733 (51.8%) |
| 2 Vehicles | 1,390 (41.3%) | 301 (21.3%) |
| 3 or more Vehicles | 646 (19.2%) | 89 (6.3%) |
| Total | 3,364 (100.0%) | 1,415 (100.0%) |
Real Estate & Mortgages in Taylorville
Real Estate and Mortgage Overview in Taylorville
| Characteristic | Without Mortgage | With Mortgage |
| Housing Units | 1,466 | 1,898 |
| Median Property Value | $103,700 | $105,700 |
| Median Household Income | $48,082 | $175 |
| Monthly Housing Costs | $468 | $0 |
| Real Estate Taxes | $1,502 | $0 |
Property Value by Mortgage Status in Taylorville
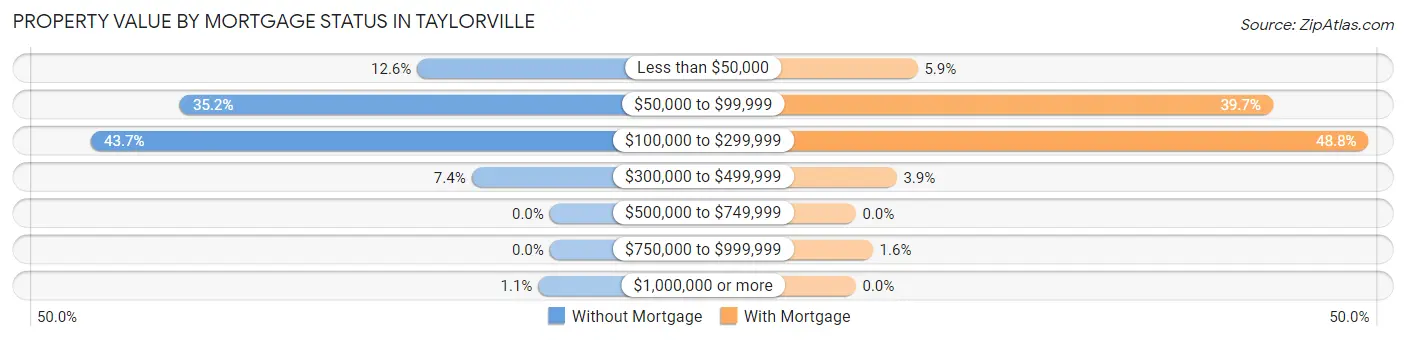
| Property Value | Without Mortgage | With Mortgage |
| Less than $50,000 | 185 (12.6%) | 112 (5.9%) |
| $50,000 to $99,999 | 516 (35.2%) | 754 (39.7%) |
| $100,000 to $299,999 | 640 (43.7%) | 927 (48.8%) |
| $300,000 to $499,999 | 109 (7.4%) | 74 (3.9%) |
| $500,000 to $749,999 | 0 (0.0%) | 0 (0.0%) |
| $750,000 to $999,999 | 0 (0.0%) | 31 (1.6%) |
| $1,000,000 or more | 16 (1.1%) | 0 (0.0%) |
| Total | 1,466 (100.0%) | 1,898 (100.0%) |
Household Income by Mortgage Status in Taylorville
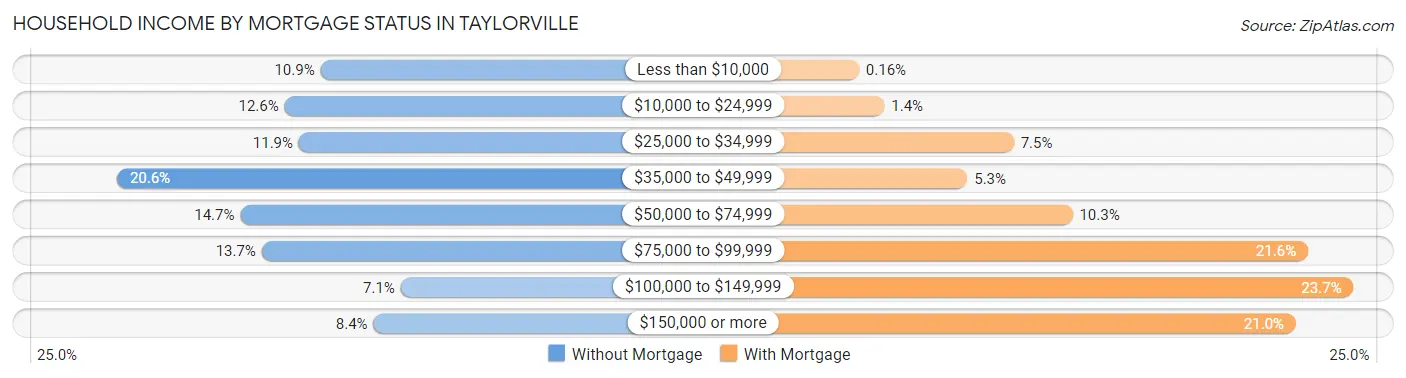
| Household Income | Without Mortgage | With Mortgage |
| Less than $10,000 | 160 (10.9%) | 3 (0.2%) |
| $10,000 to $24,999 | 185 (12.6%) | 26 (1.4%) |
| $25,000 to $34,999 | 175 (11.9%) | 143 (7.5%) |
| $35,000 to $49,999 | 302 (20.6%) | 101 (5.3%) |
| $50,000 to $74,999 | 216 (14.7%) | 196 (10.3%) |
| $75,000 to $99,999 | 201 (13.7%) | 409 (21.5%) |
| $100,000 to $149,999 | 104 (7.1%) | 450 (23.7%) |
| $150,000 or more | 123 (8.4%) | 398 (21.0%) |
| Total | 1,466 (100.0%) | 1,898 (100.0%) |
Property Value to Household Income Ratio in Taylorville
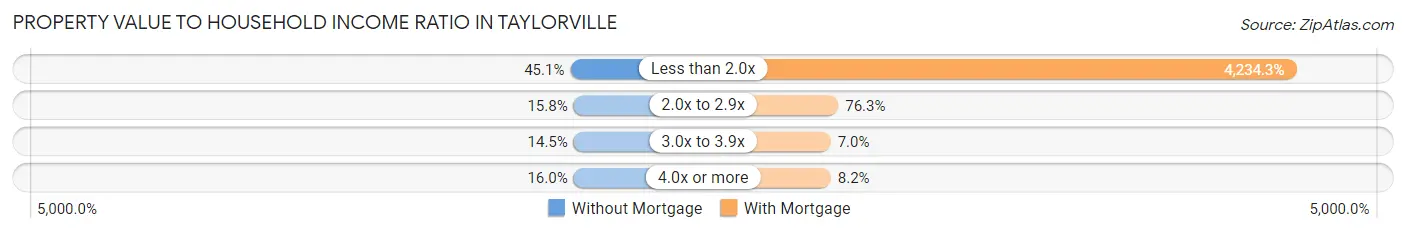
| Value-to-Income Ratio | Without Mortgage | With Mortgage |
| Less than 2.0x | 661 (45.1%) | 80,366 (4,234.3%) |
| 2.0x to 2.9x | 231 (15.8%) | 1,449 (76.3%) |
| 3.0x to 3.9x | 213 (14.5%) | 133 (7.0%) |
| 4.0x or more | 234 (16.0%) | 156 (8.2%) |
| Total | 1,466 (100.0%) | 1,898 (100.0%) |
Real Estate Taxes by Mortgage Status in Taylorville
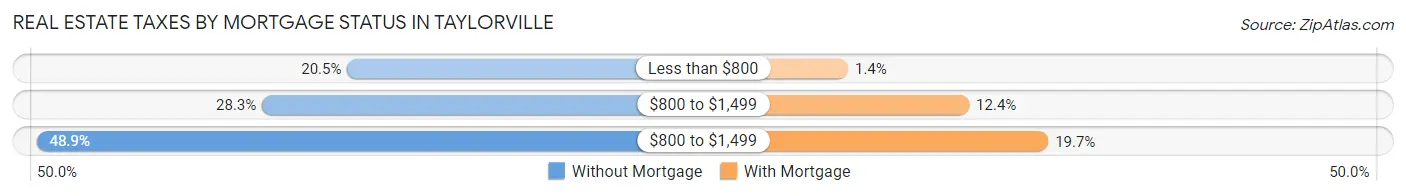
| Property Taxes | Without Mortgage | With Mortgage |
| Less than $800 | 301 (20.5%) | 26 (1.4%) |
| $800 to $1,499 | 415 (28.3%) | 236 (12.4%) |
| $800 to $1,499 | 717 (48.9%) | 373 (19.7%) |
| Total | 1,466 (100.0%) | 1,898 (100.0%) |
Health & Disability in Taylorville
Health Insurance Coverage by Age in Taylorville
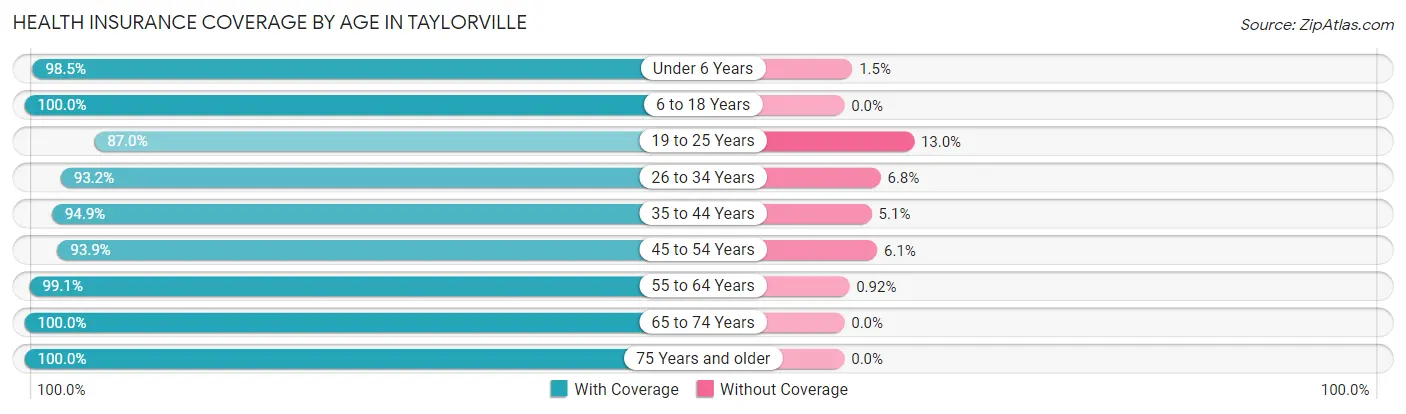
| Age Bracket | With Coverage | Without Coverage |
| Under 6 Years | 996 (98.5%) | 15 (1.5%) |
| 6 to 18 Years | 1,840 (100.0%) | 0 (0.0%) |
| 19 to 25 Years | 911 (87.0%) | 136 (13.0%) |
| 26 to 34 Years | 1,172 (93.2%) | 85 (6.8%) |
| 35 to 44 Years | 1,191 (94.9%) | 64 (5.1%) |
| 45 to 54 Years | 1,305 (93.9%) | 85 (6.1%) |
| 55 to 64 Years | 1,289 (99.1%) | 12 (0.9%) |
| 65 to 74 Years | 929 (100.0%) | 0 (0.0%) |
| 75 Years and older | 1,100 (100.0%) | 0 (0.0%) |
| Total | 10,733 (96.4%) | 397 (3.6%) |
Health Insurance Coverage by Citizenship Status in Taylorville
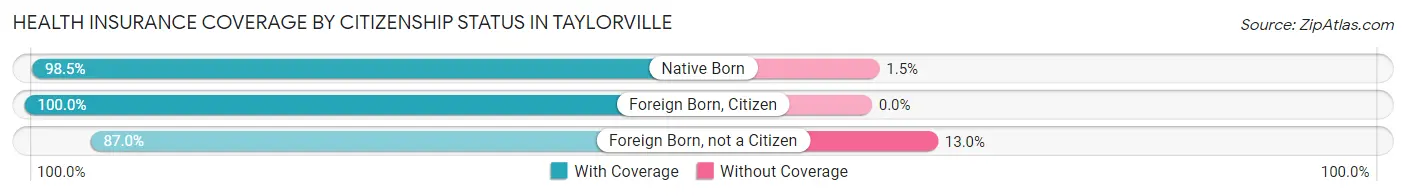
| Citizenship Status | With Coverage | Without Coverage |
| Native Born | 996 (98.5%) | 15 (1.5%) |
| Foreign Born, Citizen | 1,840 (100.0%) | 0 (0.0%) |
| Foreign Born, not a Citizen | 911 (87.0%) | 136 (13.0%) |
Health Insurance Coverage by Household Income in Taylorville
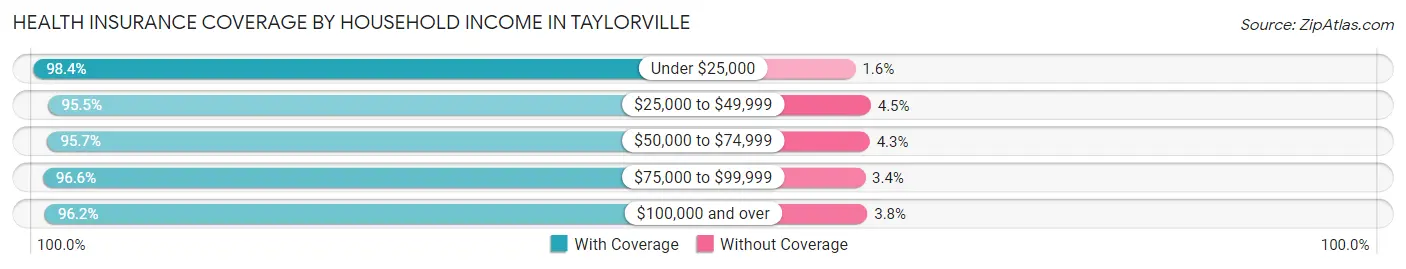
| Household Income | With Coverage | Without Coverage |
| Under $25,000 | 2,005 (98.4%) | 33 (1.6%) |
| $25,000 to $49,999 | 1,763 (95.5%) | 83 (4.5%) |
| $50,000 to $74,999 | 2,542 (95.7%) | 114 (4.3%) |
| $75,000 to $99,999 | 1,801 (96.6%) | 64 (3.4%) |
| $100,000 and over | 2,581 (96.2%) | 103 (3.8%) |
Public vs Private Health Insurance Coverage by Age in Taylorville
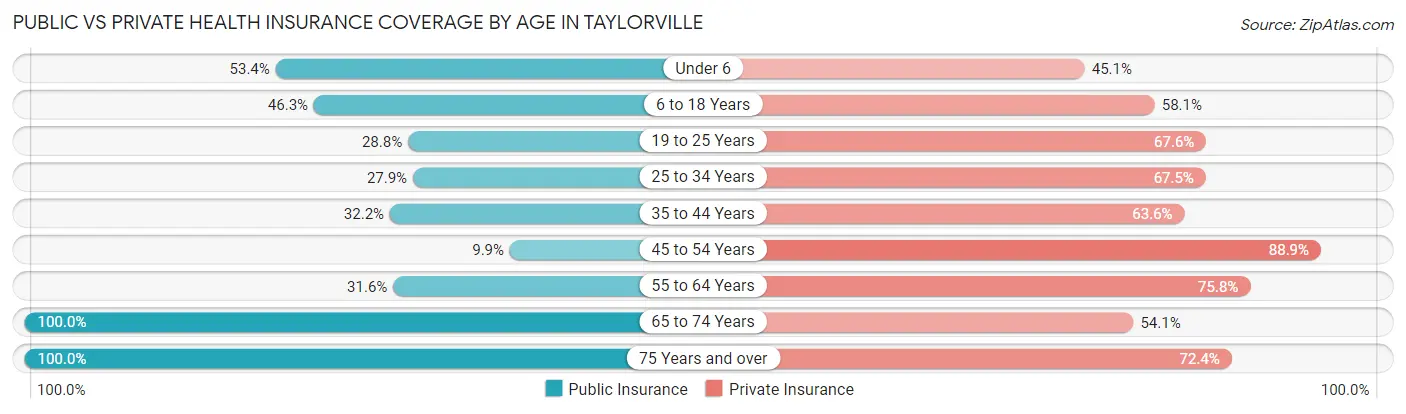
| Age Bracket | Public Insurance | Private Insurance |
| Under 6 | 540 (53.4%) | 456 (45.1%) |
| 6 to 18 Years | 852 (46.3%) | 1,069 (58.1%) |
| 19 to 25 Years | 302 (28.8%) | 708 (67.6%) |
| 25 to 34 Years | 351 (27.9%) | 849 (67.5%) |
| 35 to 44 Years | 404 (32.2%) | 798 (63.6%) |
| 45 to 54 Years | 138 (9.9%) | 1,236 (88.9%) |
| 55 to 64 Years | 411 (31.6%) | 986 (75.8%) |
| 65 to 74 Years | 929 (100.0%) | 503 (54.1%) |
| 75 Years and over | 1,100 (100.0%) | 796 (72.4%) |
| Total | 5,027 (45.2%) | 7,401 (66.5%) |
Disability Status by Sex by Age in Taylorville
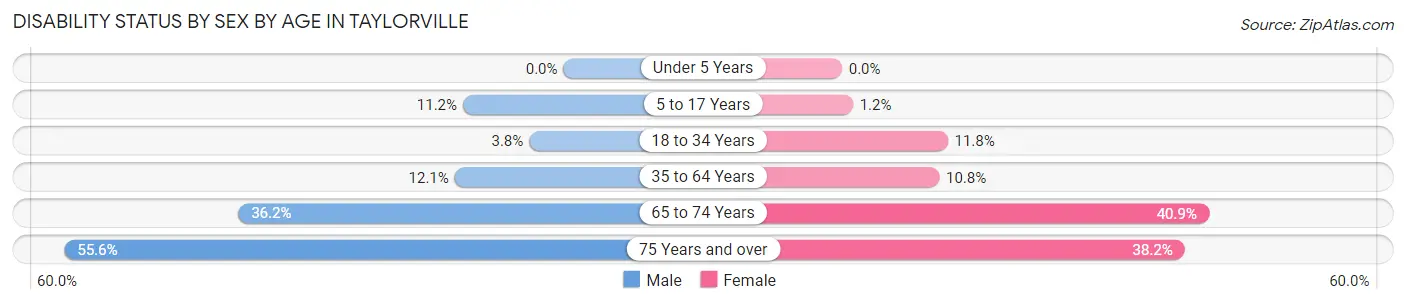
| Age Bracket | Male | Female |
| Under 5 Years | 0 (0.0%) | 0 (0.0%) |
| 5 to 17 Years | 82 (11.2%) | 13 (1.2%) |
| 18 to 34 Years | 44 (3.8%) | 148 (11.8%) |
| 35 to 64 Years | 242 (12.1%) | 211 (10.8%) |
| 65 to 74 Years | 168 (36.2%) | 190 (40.9%) |
| 75 Years and over | 214 (55.6%) | 273 (38.2%) |
Disability Class by Sex by Age in Taylorville
Disability Class: Hearing Difficulty
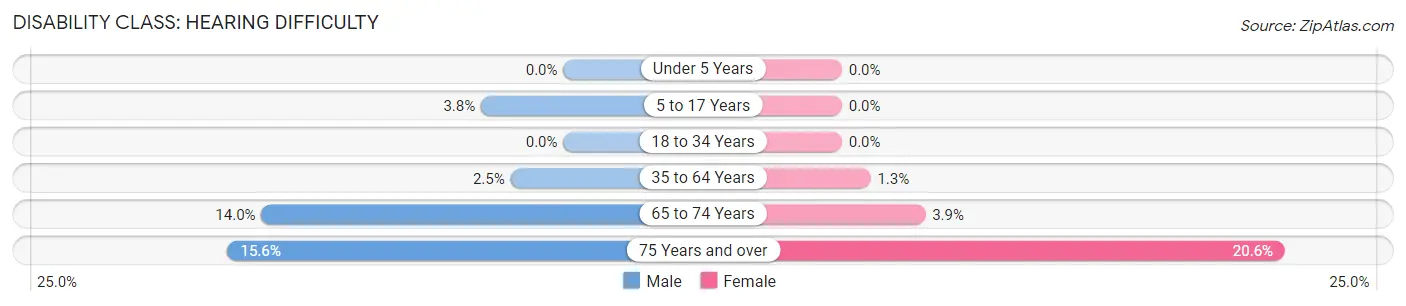
| Age Bracket | Male | Female |
| Under 5 Years | 0 (0.0%) | 0 (0.0%) |
| 5 to 17 Years | 28 (3.8%) | 0 (0.0%) |
| 18 to 34 Years | 0 (0.0%) | 0 (0.0%) |
| 35 to 64 Years | 49 (2.5%) | 26 (1.3%) |
| 65 to 74 Years | 65 (14.0%) | 18 (3.9%) |
| 75 Years and over | 60 (15.6%) | 147 (20.6%) |
Disability Class: Vision Difficulty
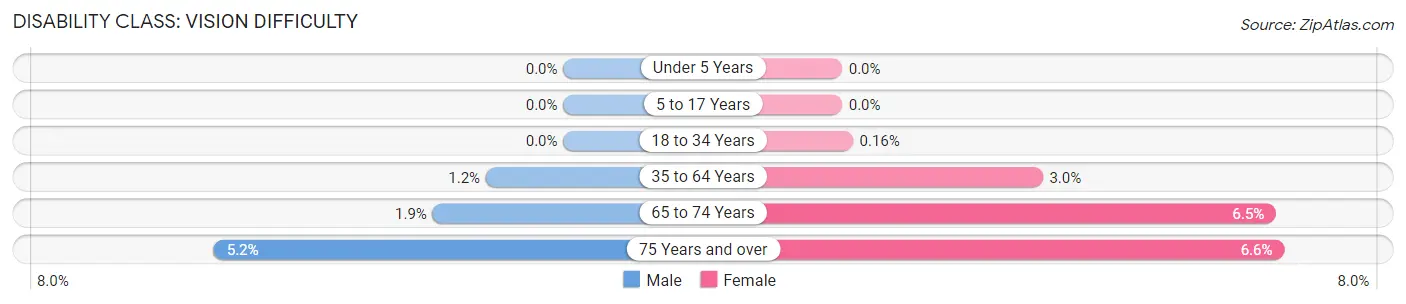
| Age Bracket | Male | Female |
| Under 5 Years | 0 (0.0%) | 0 (0.0%) |
| 5 to 17 Years | 0 (0.0%) | 0 (0.0%) |
| 18 to 34 Years | 0 (0.0%) | 2 (0.2%) |
| 35 to 64 Years | 23 (1.1%) | 58 (3.0%) |
| 65 to 74 Years | 9 (1.9%) | 30 (6.5%) |
| 75 Years and over | 20 (5.2%) | 47 (6.6%) |
Disability Class: Cognitive Difficulty
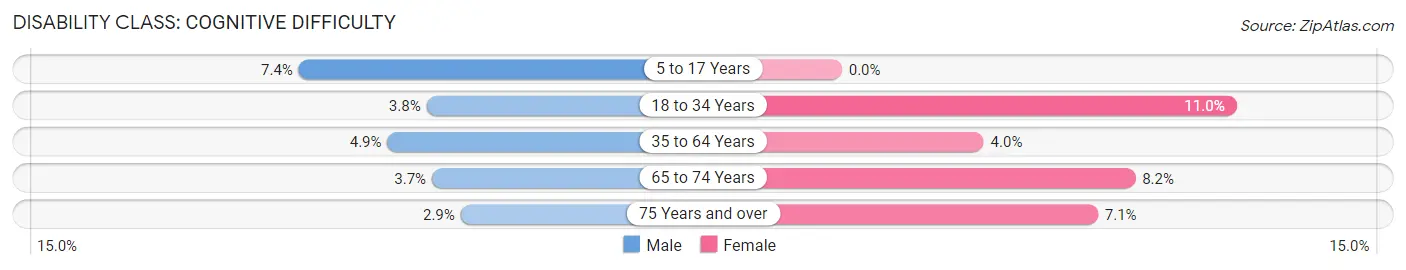
| Age Bracket | Male | Female |
| 5 to 17 Years | 54 (7.4%) | 0 (0.0%) |
| 18 to 34 Years | 44 (3.8%) | 138 (11.0%) |
| 35 to 64 Years | 98 (4.9%) | 77 (4.0%) |
| 65 to 74 Years | 17 (3.7%) | 38 (8.2%) |
| 75 Years and over | 11 (2.9%) | 51 (7.1%) |
Disability Class: Ambulatory Difficulty
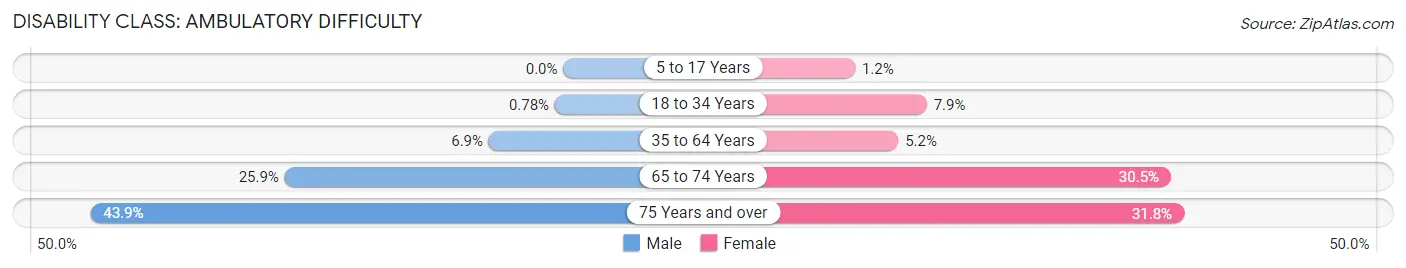
| Age Bracket | Male | Female |
| 5 to 17 Years | 0 (0.0%) | 13 (1.2%) |
| 18 to 34 Years | 9 (0.8%) | 99 (7.9%) |
| 35 to 64 Years | 138 (6.9%) | 102 (5.2%) |
| 65 to 74 Years | 120 (25.9%) | 142 (30.5%) |
| 75 Years and over | 169 (43.9%) | 227 (31.8%) |
Disability Class: Self-Care Difficulty
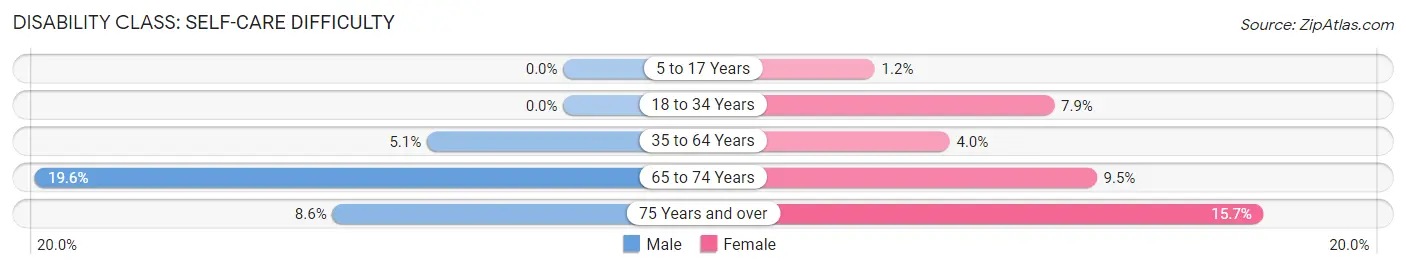
| Age Bracket | Male | Female |
| 5 to 17 Years | 0 (0.0%) | 13 (1.2%) |
| 18 to 34 Years | 0 (0.0%) | 99 (7.9%) |
| 35 to 64 Years | 101 (5.1%) | 78 (4.0%) |
| 65 to 74 Years | 91 (19.6%) | 44 (9.5%) |
| 75 Years and over | 33 (8.6%) | 112 (15.7%) |
Technology Access in Taylorville
Computing Device Access in Taylorville
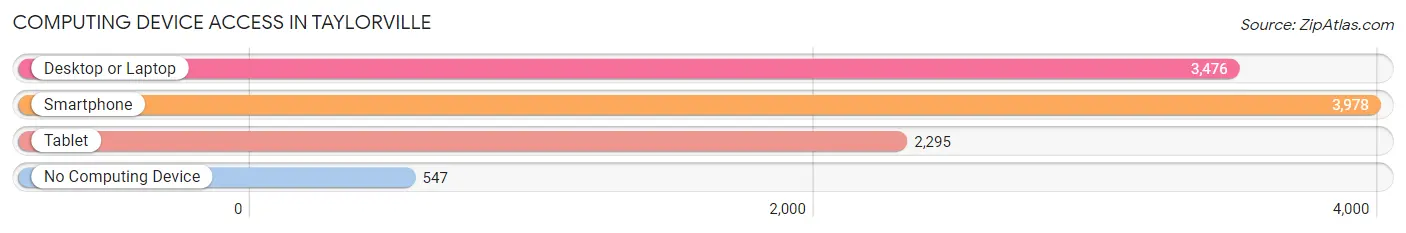
| Device Type | # Households | % Households |
| Desktop or Laptop | 3,476 | 72.7% |
| Smartphone | 3,978 | 83.2% |
| Tablet | 2,295 | 48.0% |
| No Computing Device | 547 | 11.5% |
| Total | 4,779 | 100.0% |
Internet Access in Taylorville
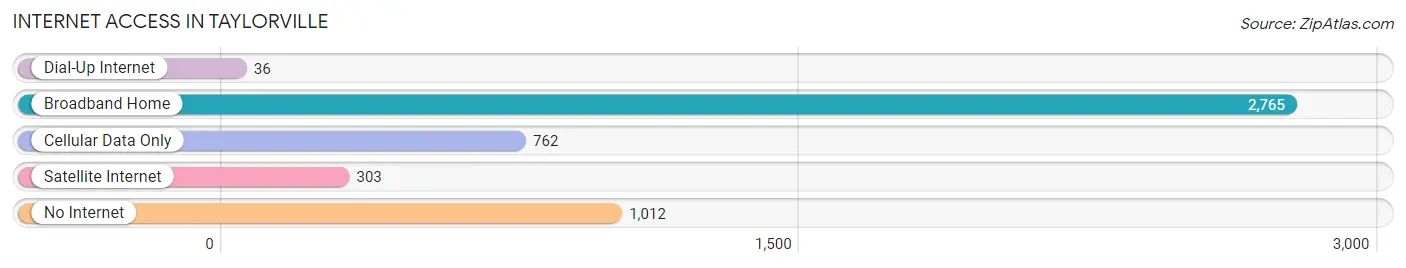
| Internet Type | # Households | % Households |
| Dial-Up Internet | 36 | 0.7% |
| Broadband Home | 2,765 | 57.9% |
| Cellular Data Only | 762 | 15.9% |
| Satellite Internet | 303 | 6.3% |
| No Internet | 1,012 | 21.2% |
| Total | 4,779 | 100.0% |
Taylorville Summary
History
The city of Taylorville, Illinois is located in the heart of the state, in Christian County. It is the county seat and the largest city in the county. The city was founded in 1829 and was named after Isaac Taylor, a local landowner. The city was incorporated in 1855 and has since grown to a population of 11,427 as of the 2010 census.
The city of Taylorville has a rich history that dates back to the early 1800s. The first settlers in the area were Native Americans, who were followed by European settlers in the early 1800s. The first settlers in the area were mostly farmers, who were attracted to the fertile soil and abundant water sources. The first post office was established in 1829 and the first school was built in 1835.
The city of Taylorville was an important stop on the Illinois Central Railroad, which was built in 1854. This allowed the city to become a major hub for trade and commerce. The city also became a center for manufacturing, with several factories being built in the late 1800s and early 1900s.
The city of Taylorville was also an important stop on the Underground Railroad, which was used by escaped slaves to make their way to freedom. The city was also home to several prominent abolitionists, including William Still and Harriet Tubman.
Geography
Taylorville is located in the central part of the state of Illinois, in Christian County. It is situated on the banks of the Kaskaskia River, which is a tributary of the Mississippi River. The city is located about 80 miles south of Chicago and about 40 miles north of St. Louis.
The city of Taylorville has a total area of 5.3 square miles, all of which is land. The city is located in a flat, open area, with no major hills or mountains. The climate in the area is classified as humid continental, with hot, humid summers and cold, snowy winters.
Economy
The economy of Taylorville is largely based on agriculture and manufacturing. The city is home to several large agricultural operations, including grain and livestock farms. The city is also home to several manufacturing companies, including a large paper mill and a plastics factory.
The city is also home to several retail stores, restaurants, and other businesses. The city is also home to several educational institutions, including a community college and a technical school.
Demographics
As of the 2010 census, the city of Taylorville had a population of 11,427. The racial makeup of the city was 95.3% White, 1.2% African American, 0.3% Native American, 0.7% Asian, 0.1% Pacific Islander, and 2.4% from other races. Hispanic or Latino of any race were 3.2% of the population.
The median income for a household in the city was $41,945, and the median income for a family was $50,945. The per capita income for the city was $20,845. About 11.2% of families and 14.2% of the population were below the poverty line, including 19.2% of those under age 18 and 8.2% of those age 65 or over.
Common Questions
What is Per Capita Income in Taylorville?
Per Capita income in Taylorville is $27,377.
What is the Median Family Income in Taylorville?
Median Family Income in Taylorville is $79,479.
What is the Median Household income in Taylorville?
Median Household Income in Taylorville is $49,471.
What is Income or Wage Gap in Taylorville?
Income or Wage Gap in Taylorville is 27.4%.
Women in Taylorville earn 72.6 cents for every dollar earned by a man.
What is Inequality or Gini Index in Taylorville?
Inequality or Gini Index in Taylorville is 0.45.
What is the Total Population of Taylorville?
Total Population of Taylorville is 11,318.
What is the Total Male Population of Taylorville?
Total Male Population of Taylorville is 5,464.
What is the Total Female Population of Taylorville?
Total Female Population of Taylorville is 5,854.
What is the Ratio of Males per 100 Females in Taylorville?
There are 93.34 Males per 100 Females in Taylorville.
What is the Ratio of Females per 100 Males in Taylorville?
There are 107.14 Females per 100 Males in Taylorville.
What is the Median Population Age in Taylorville?
Median Population Age in Taylorville is 38.2 Years.
What is the Average Family Size in Taylorville
Average Family Size in Taylorville is 3.5 People.
What is the Average Household Size in Taylorville
Average Household Size in Taylorville is 2.3 People.
How Large is the Labor Force in Taylorville?
There are 5,071 People in the Labor Forcein in Taylorville.
What is the Percentage of People in the Labor Force in Taylorville?
56.2% of People are in the Labor Force in Taylorville.
What is the Unemployment Rate in Taylorville?
Unemployment Rate in Taylorville is 5.3%.