Peoria Heights, IL Map & Demographics
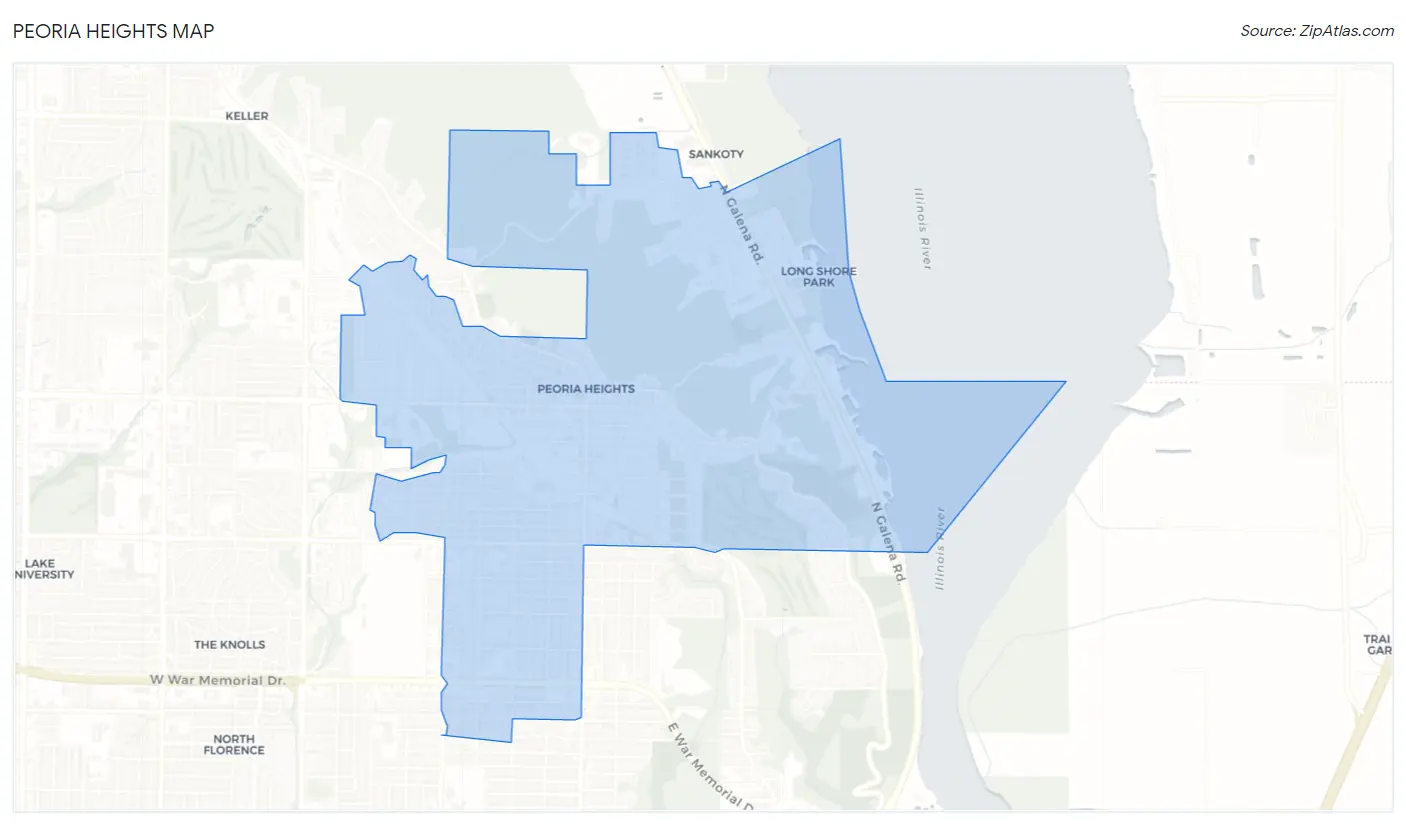
Peoria Heights Map
Peoria Heights Overview
$41,851
PER CAPITA INCOME
$64,916
AVG FAMILY INCOME
$59,286
AVG HOUSEHOLD INCOME
25.5%
WAGE / INCOME GAP [ % ]
74.5¢/ $1
WAGE / INCOME GAP [ $ ]
0.50
INEQUALITY / GINI INDEX
5,890
TOTAL POPULATION
2,848
MALE POPULATION
3,042
FEMALE POPULATION
93.62
MALES / 100 FEMALES
106.81
FEMALES / 100 MALES
39.7
MEDIAN AGE
3.0
AVG FAMILY SIZE
2.1
AVG HOUSEHOLD SIZE
3,270
LABOR FORCE [ PEOPLE ]
68.9%
PERCENT IN LABOR FORCE
5.3%
UNEMPLOYMENT RATE
Peoria Heights Zip Codes
Peoria Heights Area Codes
Income in Peoria Heights
Income Overview in Peoria Heights
Per Capita Income in Peoria Heights is $41,851, while median incomes of families and households are $64,916 and $59,286 respectively.
| Characteristic | Number | Measure |
| Per Capita Income | 5,890 | $41,851 |
| Median Family Income | 1,248 | $64,916 |
| Mean Family Income | 1,248 | $119,746 |
| Median Household Income | 2,794 | $59,286 |
| Mean Household Income | 2,794 | $86,343 |
| Income Deficit | 1,248 | $0 |
| Wage / Income Gap (%) | 5,890 | 25.53% |
| Wage / Income Gap ($) | 5,890 | 74.47¢ per $1 |
| Gini / Inequality Index | 5,890 | 0.50 |
Earnings by Sex in Peoria Heights
Average Earnings in Peoria Heights are $36,111, $42,352 for men and $31,540 for women, a difference of 25.5%.
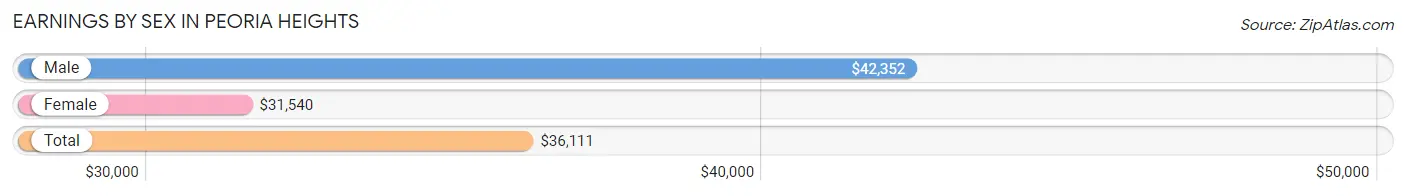
| Sex | Number | Average Earnings |
| Male | 1,680 (51.3%) | $42,352 |
| Female | 1,592 (48.7%) | $31,540 |
| Total | 3,272 (100.0%) | $36,111 |
Earnings by Sex by Income Bracket in Peoria Heights
The most common earnings brackets in Peoria Heights are $45,000 to $49,999 for men (195 | 11.6%) and $2,499 or less for women (230 | 14.4%).
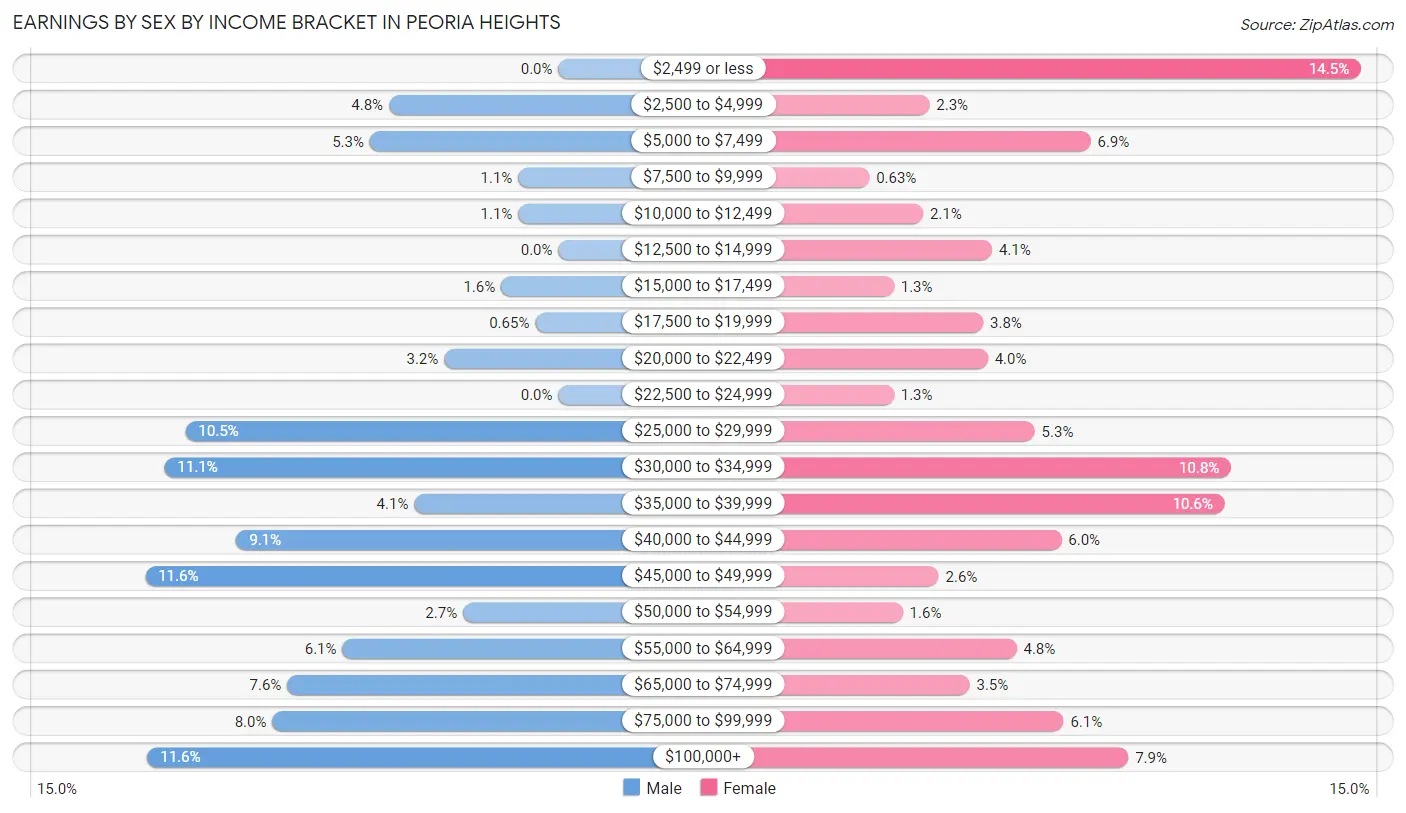
| Income | Male | Female |
| $2,499 or less | 0 (0.0%) | 230 (14.4%) |
| $2,500 to $4,999 | 80 (4.8%) | 37 (2.3%) |
| $5,000 to $7,499 | 89 (5.3%) | 109 (6.9%) |
| $7,500 to $9,999 | 19 (1.1%) | 10 (0.6%) |
| $10,000 to $12,499 | 19 (1.1%) | 34 (2.1%) |
| $12,500 to $14,999 | 0 (0.0%) | 65 (4.1%) |
| $15,000 to $17,499 | 27 (1.6%) | 21 (1.3%) |
| $17,500 to $19,999 | 11 (0.6%) | 61 (3.8%) |
| $20,000 to $22,499 | 54 (3.2%) | 63 (4.0%) |
| $22,500 to $24,999 | 0 (0.0%) | 21 (1.3%) |
| $25,000 to $29,999 | 176 (10.5%) | 84 (5.3%) |
| $30,000 to $34,999 | 186 (11.1%) | 172 (10.8%) |
| $35,000 to $39,999 | 68 (4.1%) | 169 (10.6%) |
| $40,000 to $44,999 | 152 (9.0%) | 96 (6.0%) |
| $45,000 to $49,999 | 195 (11.6%) | 41 (2.6%) |
| $50,000 to $54,999 | 45 (2.7%) | 25 (1.6%) |
| $55,000 to $64,999 | 102 (6.1%) | 76 (4.8%) |
| $65,000 to $74,999 | 128 (7.6%) | 55 (3.5%) |
| $75,000 to $99,999 | 135 (8.0%) | 97 (6.1%) |
| $100,000+ | 194 (11.6%) | 126 (7.9%) |
| Total | 1,680 (100.0%) | 1,592 (100.0%) |
Earnings by Sex by Educational Attainment in Peoria Heights
Average earnings in Peoria Heights are $45,909 for men and $35,604 for women, a difference of 22.5%. Men with an educational attainment of high school diploma enjoy the highest average annual earnings of $46,296, while those with less than high school education earn the least with $33,750. Women with an educational attainment of graduate degree earn the most with the average annual earnings of $170,363, while those with high school diploma education have the smallest earnings of $30,813.
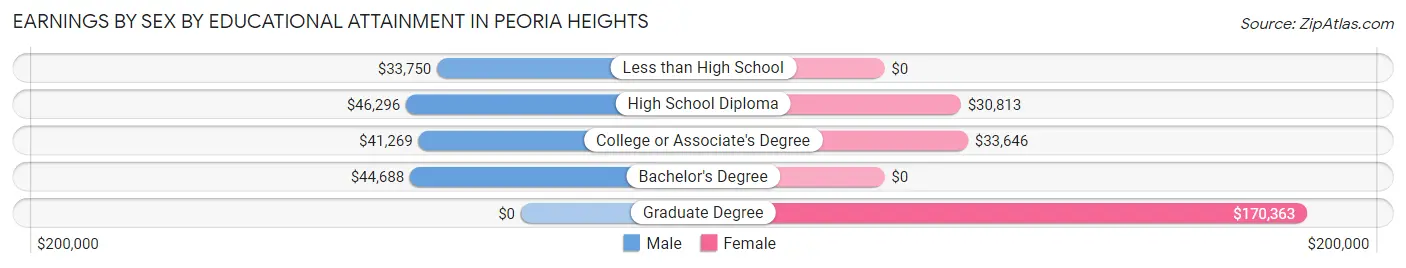
| Educational Attainment | Male Income | Female Income |
| Less than High School | $33,750 | $0 |
| High School Diploma | $46,296 | $30,813 |
| College or Associate's Degree | $41,269 | $33,646 |
| Bachelor's Degree | $44,688 | $0 |
| Graduate Degree | - | - |
| Total | $45,909 | $35,604 |
Family Income in Peoria Heights
Family Income Brackets in Peoria Heights
According to the Peoria Heights family income data, there are 398 families falling into the $50,000 to $74,999 income range, which is the most common income bracket and makes up 31.9% of all families.
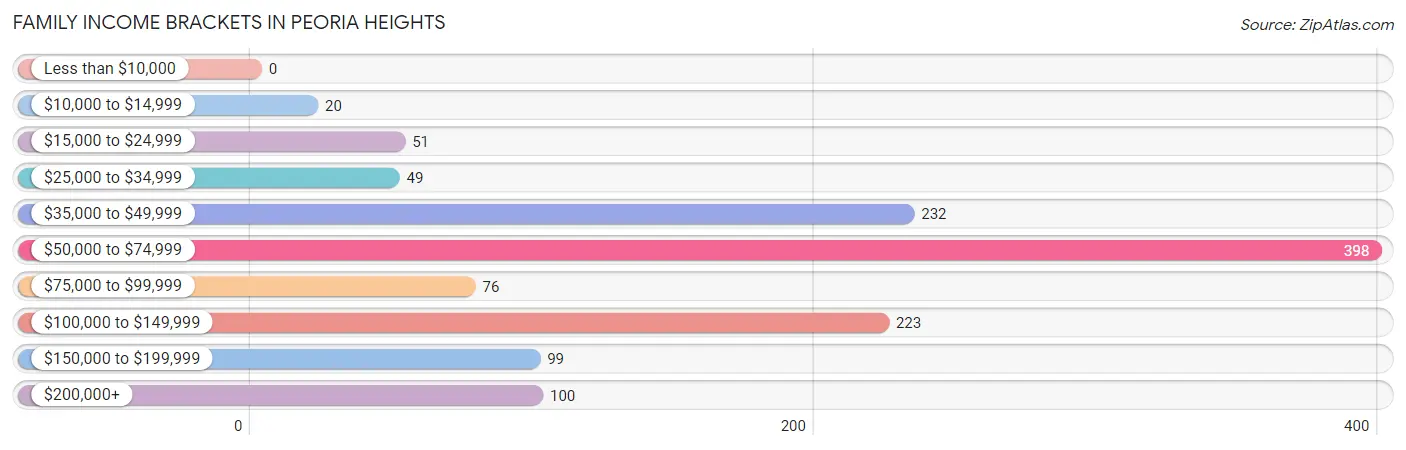
| Income Bracket | # Families | % Families |
| Less than $10,000 | 0 | 0.0% |
| $10,000 to $14,999 | 20 | 1.6% |
| $15,000 to $24,999 | 51 | 4.1% |
| $25,000 to $34,999 | 49 | 3.9% |
| $35,000 to $49,999 | 232 | 18.6% |
| $50,000 to $74,999 | 398 | 31.9% |
| $75,000 to $99,999 | 76 | 6.1% |
| $100,000 to $149,999 | 223 | 17.9% |
| $150,000 to $199,999 | 99 | 7.9% |
| $200,000+ | 100 | 8.0% |
Family Income by Famaliy Size in Peoria Heights
5-person families (159 | 12.7%) account for the highest median family income in Peoria Heights with $158,259 per family, while 5-person families (159 | 12.7%) have the highest median income of $31,652 per family member.
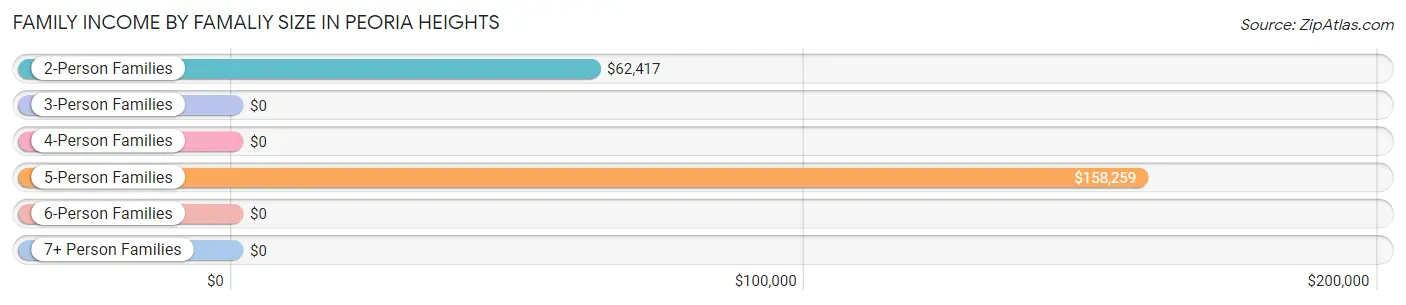
| Income Bracket | # Families | Median Income |
| 2-Person Families | 771 (61.8%) | $62,417 |
| 3-Person Families | 150 (12.0%) | $0 |
| 4-Person Families | 75 (6.0%) | $0 |
| 5-Person Families | 159 (12.7%) | $158,259 |
| 6-Person Families | 58 (4.6%) | $0 |
| 7+ Person Families | 35 (2.8%) | $0 |
| Total | 1,248 (100.0%) | $64,916 |
Family Income by Number of Earners in Peoria Heights
The median family income in Peoria Heights is $64,916, with families comprising 3+ earners (114) having the highest median family income of $122,214, while families with no earners (119) have the lowest median family income of $51,806, accounting for 9.1% and 9.5% of families, respectively.
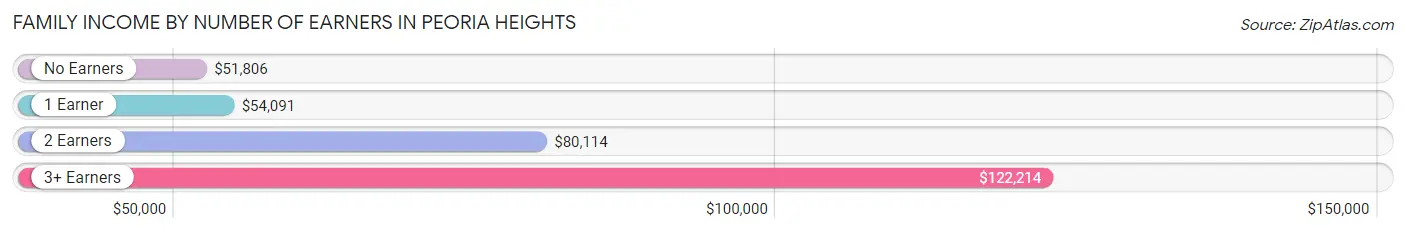
| Number of Earners | # Families | Median Income |
| No Earners | 119 (9.5%) | $51,806 |
| 1 Earner | 564 (45.2%) | $54,091 |
| 2 Earners | 451 (36.1%) | $80,114 |
| 3+ Earners | 114 (9.1%) | $122,214 |
| Total | 1,248 (100.0%) | $64,916 |
Household Income in Peoria Heights
Household Income Brackets in Peoria Heights
With 746 households falling in the category, the $50,000 to $74,999 income range is the most frequent in Peoria Heights, accounting for 26.7% of all households. In contrast, only 87 households (3.1%) fall into the $10,000 to $14,999 income bracket, making it the least populous group.
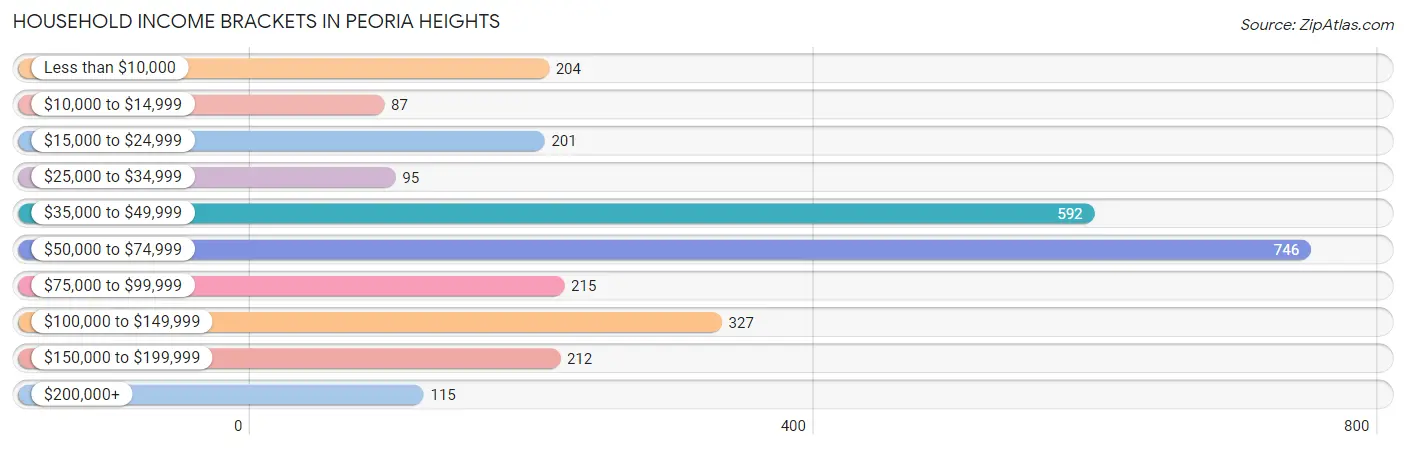
| Income Bracket | # Households | % Households |
| Less than $10,000 | 204 | 7.3% |
| $10,000 to $14,999 | 87 | 3.1% |
| $15,000 to $24,999 | 201 | 7.2% |
| $25,000 to $34,999 | 95 | 3.4% |
| $35,000 to $49,999 | 592 | 21.2% |
| $50,000 to $74,999 | 746 | 26.7% |
| $75,000 to $99,999 | 215 | 7.7% |
| $100,000 to $149,999 | 327 | 11.7% |
| $150,000 to $199,999 | 212 | 7.6% |
| $200,000+ | 115 | 4.1% |
Household Income by Householder Age in Peoria Heights
The median household income in Peoria Heights is $59,286, with the highest median household income of $65,795 found in the 45 to 64 years age bracket for the primary householder. A total of 935 households (33.5%) fall into this category. Meanwhile, the 15 to 24 years age bracket for the primary householder has the lowest median household income of $0, with 138 households (4.9%) in this group.
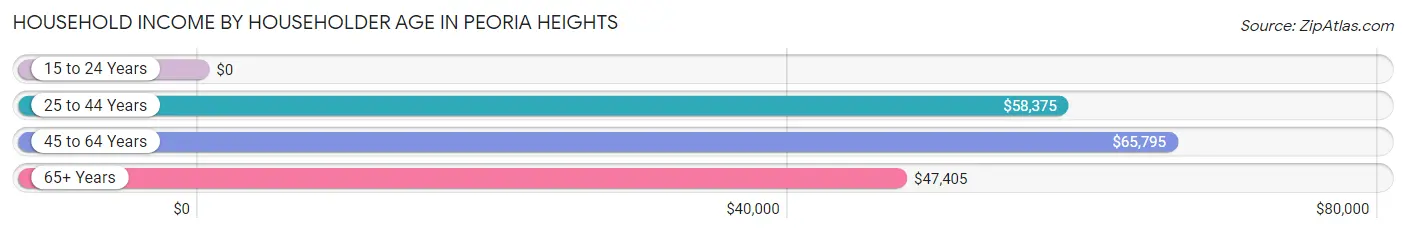
| Income Bracket | # Households | Median Income |
| 15 to 24 Years | 138 (4.9%) | $0 |
| 25 to 44 Years | 1,024 (36.6%) | $58,375 |
| 45 to 64 Years | 935 (33.5%) | $65,795 |
| 65+ Years | 697 (24.9%) | $47,405 |
| Total | 2,794 (100.0%) | $59,286 |
Poverty in Peoria Heights
Income Below Poverty by Sex and Age in Peoria Heights
With 11.7% poverty level for males and 12.5% for females among the residents of Peoria Heights, 16 and 17 year old males and 15 year old females are the most vulnerable to poverty, with 17 males (32.7%) and 36 females (33.3%) in their respective age groups living below the poverty level.
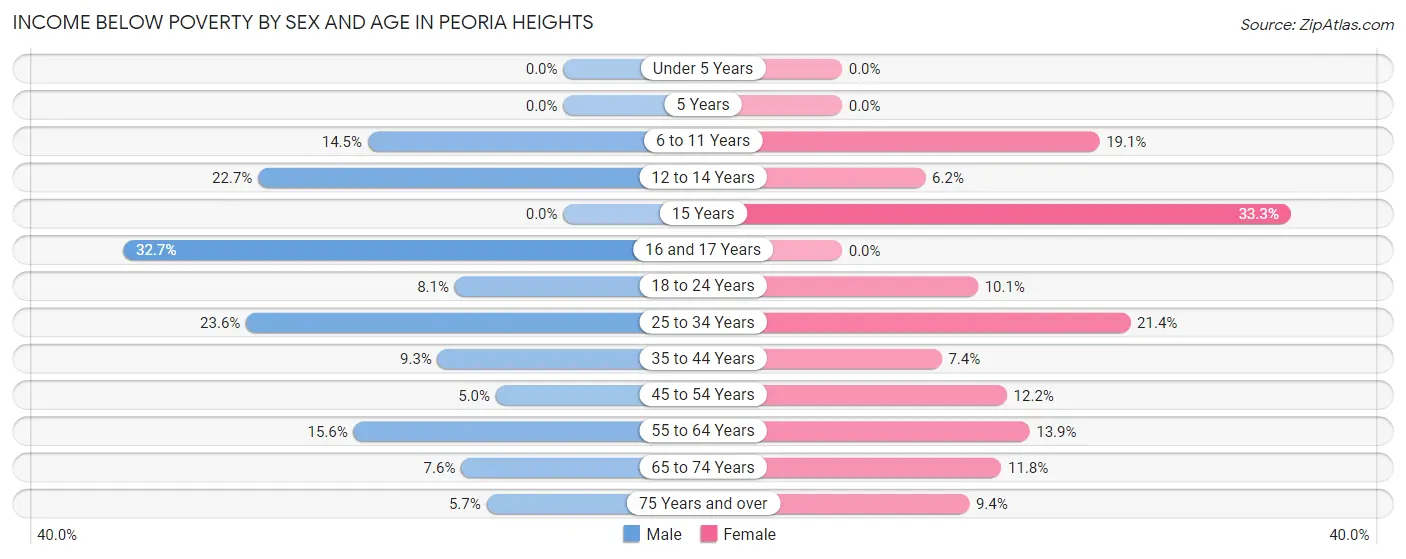
| Age Bracket | Male | Female |
| Under 5 Years | 0 (0.0%) | 0 (0.0%) |
| 5 Years | 0 (0.0%) | 0 (0.0%) |
| 6 to 11 Years | 27 (14.5%) | 47 (19.1%) |
| 12 to 14 Years | 34 (22.7%) | 7 (6.2%) |
| 15 Years | 0 (0.0%) | 36 (33.3%) |
| 16 and 17 Years | 17 (32.7%) | 0 (0.0%) |
| 18 to 24 Years | 15 (8.1%) | 23 (10.1%) |
| 25 to 34 Years | 77 (23.5%) | 70 (21.4%) |
| 35 to 44 Years | 53 (9.3%) | 29 (7.4%) |
| 45 to 54 Years | 18 (5.0%) | 53 (12.2%) |
| 55 to 64 Years | 55 (15.6%) | 54 (13.9%) |
| 65 to 74 Years | 25 (7.6%) | 33 (11.8%) |
| 75 Years and over | 9 (5.7%) | 17 (9.4%) |
| Total | 330 (11.7%) | 369 (12.5%) |
Income Above Poverty by Sex and Age in Peoria Heights
According to the poverty statistics in Peoria Heights, males aged under 5 years and females aged under 5 years are the age groups that are most secure financially, with 100.0% of males and 100.0% of females in these age groups living above the poverty line.
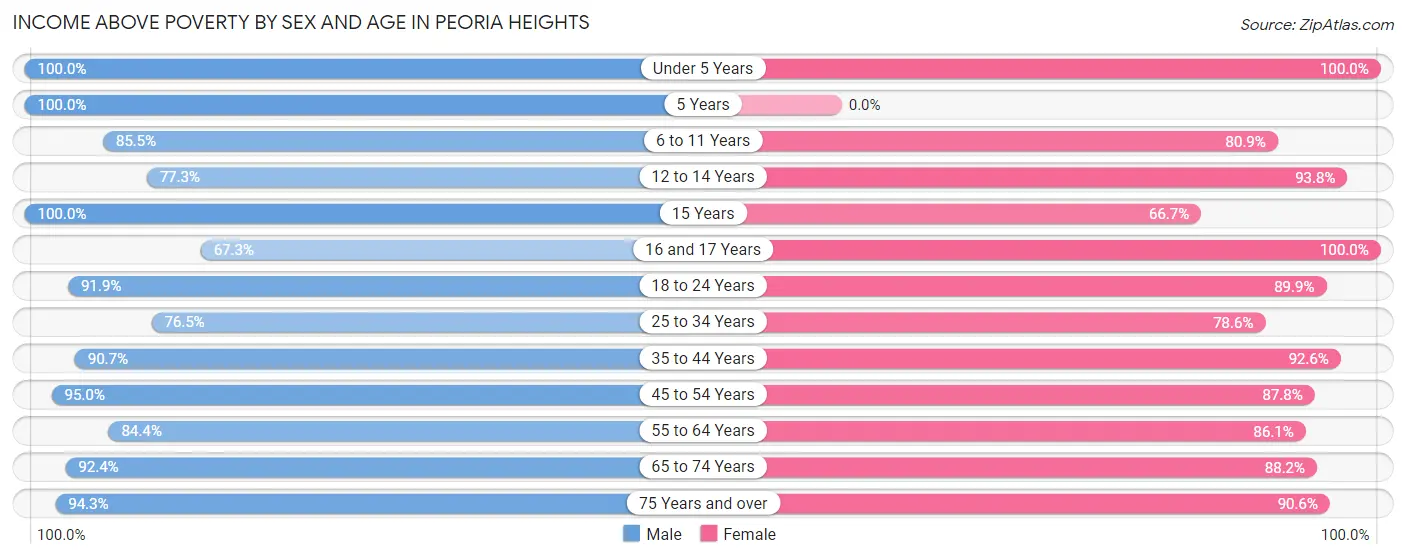
| Age Bracket | Male | Female |
| Under 5 Years | 112 (100.0%) | 197 (100.0%) |
| 5 Years | 23 (100.0%) | 0 (0.0%) |
| 6 to 11 Years | 159 (85.5%) | 199 (80.9%) |
| 12 to 14 Years | 116 (77.3%) | 106 (93.8%) |
| 15 Years | 9 (100.0%) | 72 (66.7%) |
| 16 and 17 Years | 35 (67.3%) | 71 (100.0%) |
| 18 to 24 Years | 171 (91.9%) | 205 (89.9%) |
| 25 to 34 Years | 250 (76.4%) | 257 (78.6%) |
| 35 to 44 Years | 515 (90.7%) | 363 (92.6%) |
| 45 to 54 Years | 341 (95.0%) | 380 (87.8%) |
| 55 to 64 Years | 298 (84.4%) | 334 (86.1%) |
| 65 to 74 Years | 305 (92.4%) | 246 (88.2%) |
| 75 Years and over | 149 (94.3%) | 163 (90.6%) |
| Total | 2,483 (88.3%) | 2,593 (87.5%) |
Income Below Poverty Among Married-Couple Families in Peoria Heights
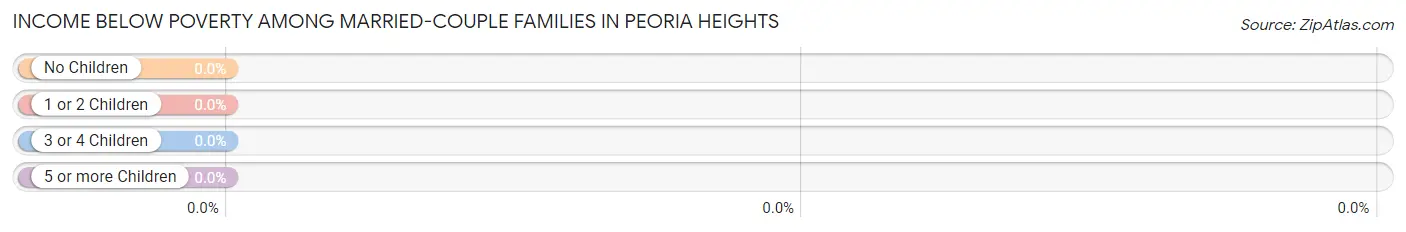
| Children | Above Poverty | Below Poverty |
| No Children | 562 (100.0%) | 0 (0.0%) |
| 1 or 2 Children | 198 (100.0%) | 0 (0.0%) |
| 3 or 4 Children | 166 (100.0%) | 0 (0.0%) |
| 5 or more Children | 0 (0.0%) | 0 (0.0%) |
| Total | 926 (100.0%) | 0 (0.0%) |
Income Below Poverty Among Single-Parent Households in Peoria Heights
According to the poverty data in Peoria Heights, 72.1% or 44 single-father households and 18.0% or 47 single-mother households are living below the poverty line. Among single-father households, those with no children have the highest poverty rate, with 44 households (72.1%) experiencing poverty. Likewise, among single-mother households, those with 3 or 4 children have the highest poverty rate, with 27 households (46.6%) falling below the poverty line.
| Children | Single Father | Single Mother |
| No Children | 44 (72.1%) | 0 (0.0%) |
| 1 or 2 Children | 0 (0.0%) | 20 (14.8%) |
| 3 or 4 Children | 0 (0.0%) | 27 (46.6%) |
| 5 or more Children | 0 (0.0%) | 0 (0.0%) |
| Total | 44 (72.1%) | 47 (18.0%) |
Income Below Poverty Among Married-Couple vs Single-Parent Households in Peoria Heights
| Children | Married-Couple Families | Single-Parent Households |
| No Children | 0 (0.0%) | 44 (34.1%) |
| 1 or 2 Children | 0 (0.0%) | 20 (14.8%) |
| 3 or 4 Children | 0 (0.0%) | 27 (46.6%) |
| 5 or more Children | 0 (0.0%) | 0 (0.0%) |
| Total | 0 (0.0%) | 91 (28.3%) |
Race in Peoria Heights
The most populous races in Peoria Heights are White / Caucasian (5,135 | 87.2%), Two or more Races (372 | 6.3%), and Black / African American (193 | 3.3%).
| Race | # Population | % Population |
| Asian | 133 | 2.3% |
| Black / African American | 193 | 3.3% |
| Hawaiian / Pacific | 0 | 0.0% |
| Hispanic or Latino | 149 | 2.5% |
| Native / Alaskan | 0 | 0.0% |
| White / Caucasian | 5,135 | 87.2% |
| Two or more Races | 372 | 6.3% |
| Some other Race | 57 | 1.0% |
| Total | 5,890 | 100.0% |
Ancestry in Peoria Heights
The most populous ancestries reported in Peoria Heights are German (1,277 | 21.7%), Irish (770 | 13.1%), English (645 | 11.0%), American (380 | 6.5%), and Dutch (298 | 5.1%), together accounting for 57.2% of all Peoria Heights residents.
| Ancestry | # Population | % Population |
| African | 87 | 1.5% |
| American | 380 | 6.5% |
| Arab | 28 | 0.5% |
| Australian | 17 | 0.3% |
| Austrian | 8 | 0.1% |
| Bhutanese | 44 | 0.7% |
| British | 23 | 0.4% |
| Central American | 5 | 0.1% |
| Cherokee | 62 | 1.1% |
| Croatian | 116 | 2.0% |
| Czech | 31 | 0.5% |
| Dutch | 298 | 5.1% |
| Eastern European | 28 | 0.5% |
| English | 645 | 11.0% |
| European | 109 | 1.8% |
| French | 162 | 2.8% |
| German | 1,277 | 21.7% |
| Guatemalan | 5 | 0.1% |
| Hungarian | 1 | 0.0% |
| Irish | 770 | 13.1% |
| Italian | 276 | 4.7% |
| Korean | 86 | 1.5% |
| Lebanese | 13 | 0.2% |
| Lithuanian | 20 | 0.3% |
| Mexican | 135 | 2.3% |
| Northern European | 7 | 0.1% |
| Norwegian | 36 | 0.6% |
| Polish | 94 | 1.6% |
| Portuguese | 12 | 0.2% |
| Puerto Rican | 9 | 0.2% |
| Scotch-Irish | 164 | 2.8% |
| Scottish | 253 | 4.3% |
| Slovene | 20 | 0.3% |
| Sri Lankan | 9 | 0.2% |
| Subsaharan African | 87 | 1.5% |
| Swedish | 114 | 1.9% |
| Swiss | 25 | 0.4% |
| Ukrainian | 4 | 0.1% |
| Welsh | 153 | 2.6% |
| Yugoslavian | 12 | 0.2% | View All 40 Rows |
Immigrants in Peoria Heights
The most numerous immigrant groups reported in Peoria Heights came from Central America (57 | 1.0%), Latin America (57 | 1.0%), Mexico (52 | 0.9%), Asia (51 | 0.9%), and Canada (48 | 0.8%), together accounting for 4.5% of all Peoria Heights residents.
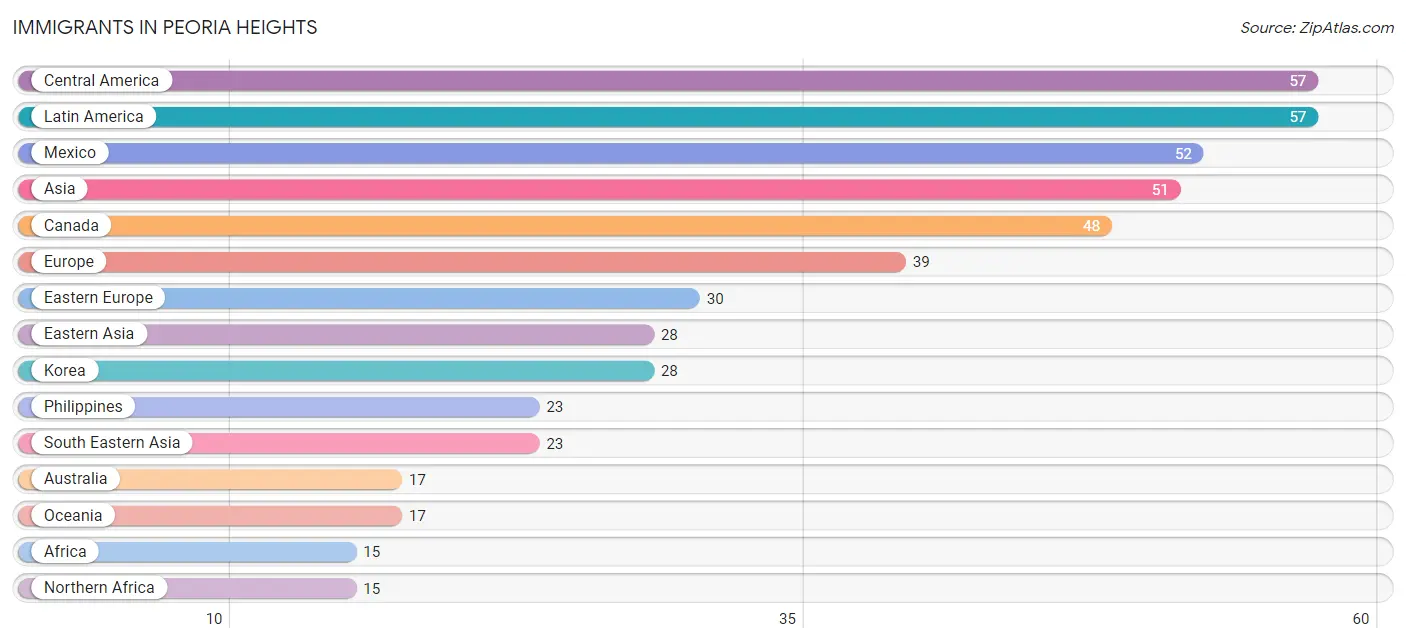
| Immigration Origin | # Population | % Population |
| Africa | 15 | 0.3% |
| Asia | 51 | 0.9% |
| Australia | 17 | 0.3% |
| Canada | 48 | 0.8% |
| Central America | 57 | 1.0% |
| Eastern Asia | 28 | 0.5% |
| Eastern Europe | 30 | 0.5% |
| Europe | 39 | 0.7% |
| France | 7 | 0.1% |
| Germany | 2 | 0.0% |
| Guatemala | 5 | 0.1% |
| Hungary | 1 | 0.0% |
| Korea | 28 | 0.5% |
| Latin America | 57 | 1.0% |
| Mexico | 52 | 0.9% |
| Northern Africa | 15 | 0.3% |
| Oceania | 17 | 0.3% |
| Philippines | 23 | 0.4% |
| South Eastern Asia | 23 | 0.4% |
| Western Europe | 9 | 0.2% | View All 20 Rows |
Sex and Age in Peoria Heights
Sex and Age in Peoria Heights
The most populous age groups in Peoria Heights are 35 to 39 Years (395 | 13.9%) for men and 35 to 39 Years (262 | 8.6%) for women.
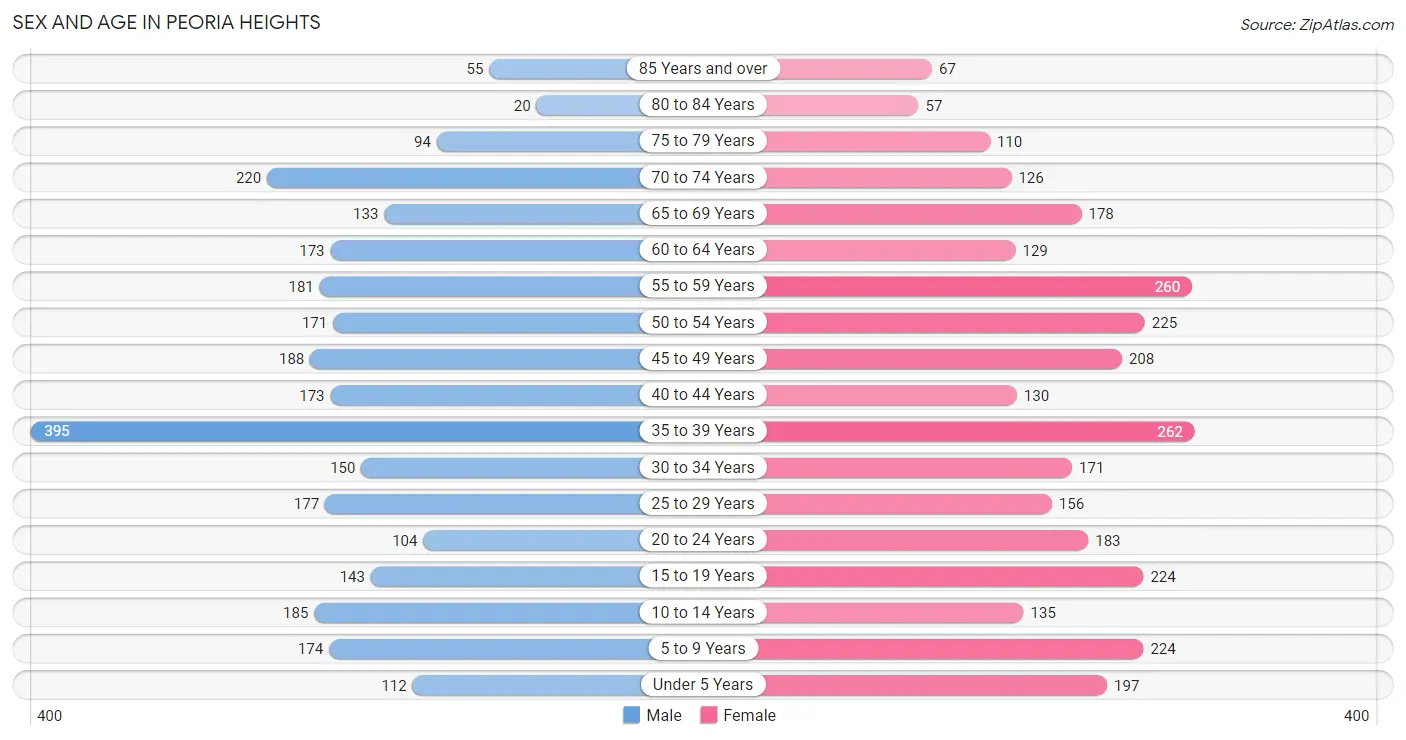
| Age Bracket | Male | Female |
| Under 5 Years | 112 (3.9%) | 197 (6.5%) |
| 5 to 9 Years | 174 (6.1%) | 224 (7.4%) |
| 10 to 14 Years | 185 (6.5%) | 135 (4.4%) |
| 15 to 19 Years | 143 (5.0%) | 224 (7.4%) |
| 20 to 24 Years | 104 (3.6%) | 183 (6.0%) |
| 25 to 29 Years | 177 (6.2%) | 156 (5.1%) |
| 30 to 34 Years | 150 (5.3%) | 171 (5.6%) |
| 35 to 39 Years | 395 (13.9%) | 262 (8.6%) |
| 40 to 44 Years | 173 (6.1%) | 130 (4.3%) |
| 45 to 49 Years | 188 (6.6%) | 208 (6.8%) |
| 50 to 54 Years | 171 (6.0%) | 225 (7.4%) |
| 55 to 59 Years | 181 (6.4%) | 260 (8.6%) |
| 60 to 64 Years | 173 (6.1%) | 129 (4.2%) |
| 65 to 69 Years | 133 (4.7%) | 178 (5.9%) |
| 70 to 74 Years | 220 (7.7%) | 126 (4.1%) |
| 75 to 79 Years | 94 (3.3%) | 110 (3.6%) |
| 80 to 84 Years | 20 (0.7%) | 57 (1.9%) |
| 85 Years and over | 55 (1.9%) | 67 (2.2%) |
| Total | 2,848 (100.0%) | 3,042 (100.0%) |
Families and Households in Peoria Heights
Median Family Size in Peoria Heights
The median family size in Peoria Heights is 3.02 persons per family, with married-couple families (926 | 74.2%) accounting for the largest median family size of 3.1 persons per family. On the other hand, single male/father families (61 | 4.9%) represent the smallest median family size with 2.16 persons per family.
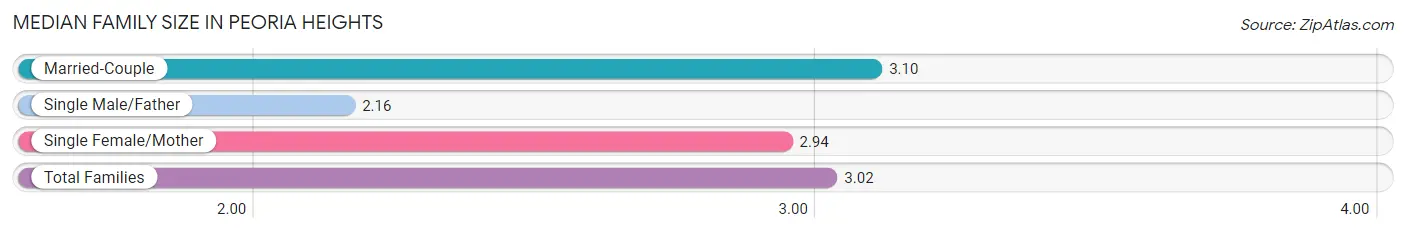
| Family Type | # Families | Family Size |
| Married-Couple | 926 (74.2%) | 3.10 |
| Single Male/Father | 61 (4.9%) | 2.16 |
| Single Female/Mother | 261 (20.9%) | 2.94 |
| Total Families | 1,248 (100.0%) | 3.02 |
Median Household Size in Peoria Heights
The median household size in Peoria Heights is 2.06 persons per household, with single female/mother households (261 | 9.3%) accounting for the largest median household size of 3.46 persons per household. non-family households (1,546 | 55.3%) represent the smallest median household size with 1.20 persons per household.
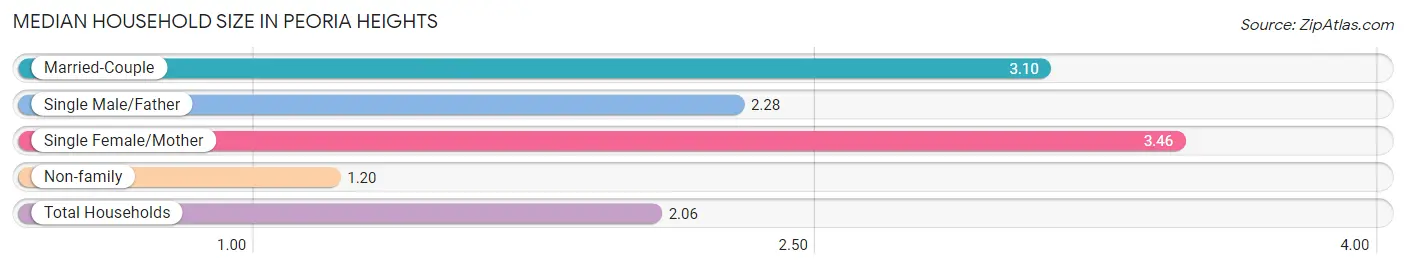
| Household Type | # Households | Household Size |
| Married-Couple | 926 (33.1%) | 3.10 |
| Single Male/Father | 61 (2.2%) | 2.28 |
| Single Female/Mother | 261 (9.3%) | 3.46 |
| Non-family | 1,546 (55.3%) | 1.20 |
| Total Households | 2,794 (100.0%) | 2.06 |
Household Size by Marriage Status in Peoria Heights
Out of a total of 2,794 households in Peoria Heights, 1,248 (44.7%) are family households, while 1,546 (55.3%) are nonfamily households. The most numerous type of family households are 2-person households, comprising 705, and the most common type of nonfamily households are 1-person households, comprising 1,275.
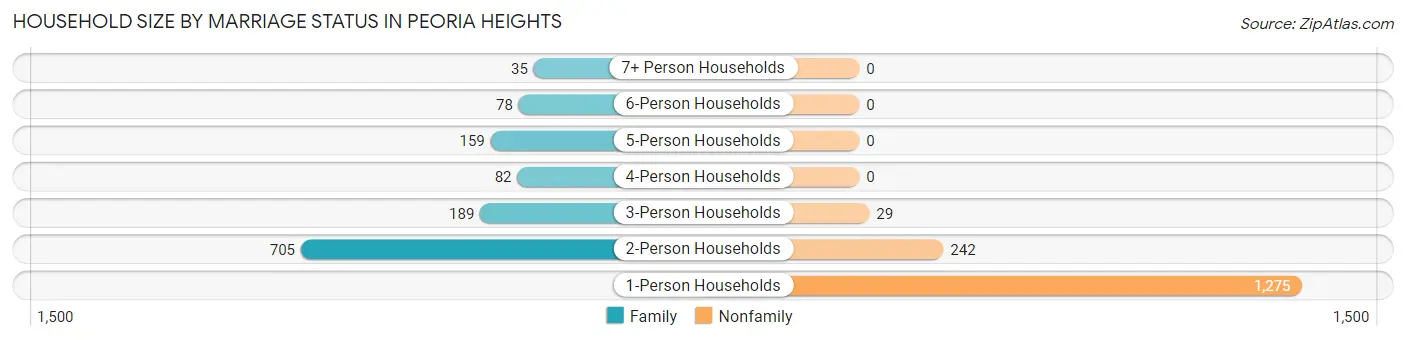
| Household Size | Family Households | Nonfamily Households |
| 1-Person Households | - | 1,275 (45.6%) |
| 2-Person Households | 705 (25.2%) | 242 (8.7%) |
| 3-Person Households | 189 (6.8%) | 29 (1.0%) |
| 4-Person Households | 82 (2.9%) | 0 (0.0%) |
| 5-Person Households | 159 (5.7%) | 0 (0.0%) |
| 6-Person Households | 78 (2.8%) | 0 (0.0%) |
| 7+ Person Households | 35 (1.3%) | 0 (0.0%) |
| Total | 1,248 (44.7%) | 1,546 (55.3%) |
Female Fertility in Peoria Heights
Fertility by Age in Peoria Heights
Average fertility rate in Peoria Heights is 33.0 births per 1,000 women. Women in the age bracket of 35 to 50 years have the highest fertility rate with 47.0 births per 1,000 women. Women in the age bracket of 35 to 50 years acount for 64.4% of all women with births.
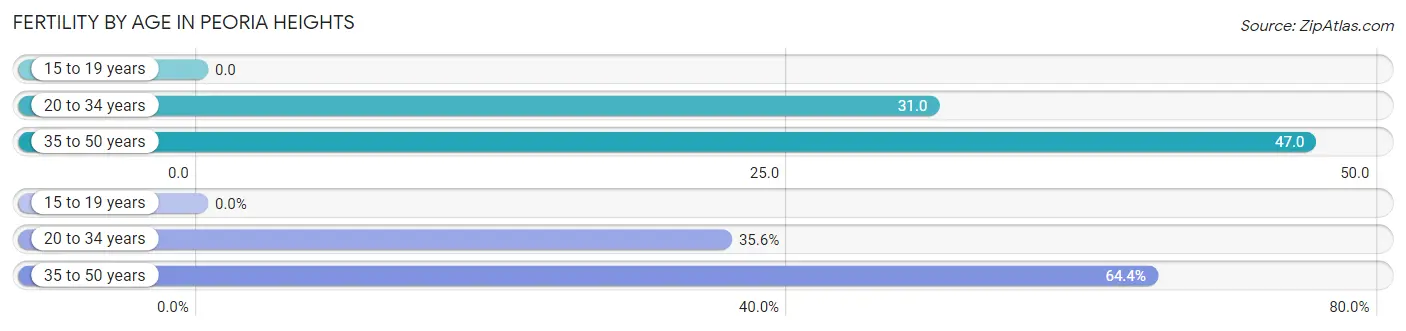
| Age Bracket | Women with Births | Births / 1,000 Women |
| 15 to 19 years | 0 (0.0%) | 0.0 |
| 20 to 34 years | 16 (35.6%) | 31.0 |
| 35 to 50 years | 29 (64.4%) | 47.0 |
| Total | 45 (100.0%) | 33.0 |
Fertility by Age by Marriage Status in Peoria Heights
64.4% of women with births (45) in Peoria Heights are married. The highest percentage of unmarried women with births falls into 20 to 34 years age bracket with 100.0% of them unmarried at the time of birth, while the lowest percentage of unmarried women with births belong to 35 to 50 years age bracket with 0.0% of them unmarried.
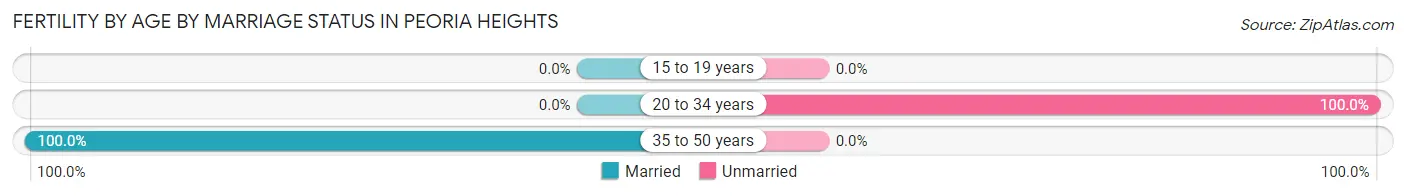
| Age Bracket | Married | Unmarried |
| 15 to 19 years | 0 (0.0%) | 0 (0.0%) |
| 20 to 34 years | 0 (0.0%) | 16 (100.0%) |
| 35 to 50 years | 29 (100.0%) | 0 (0.0%) |
| Total | 29 (64.4%) | 16 (35.6%) |
Fertility by Education in Peoria Heights
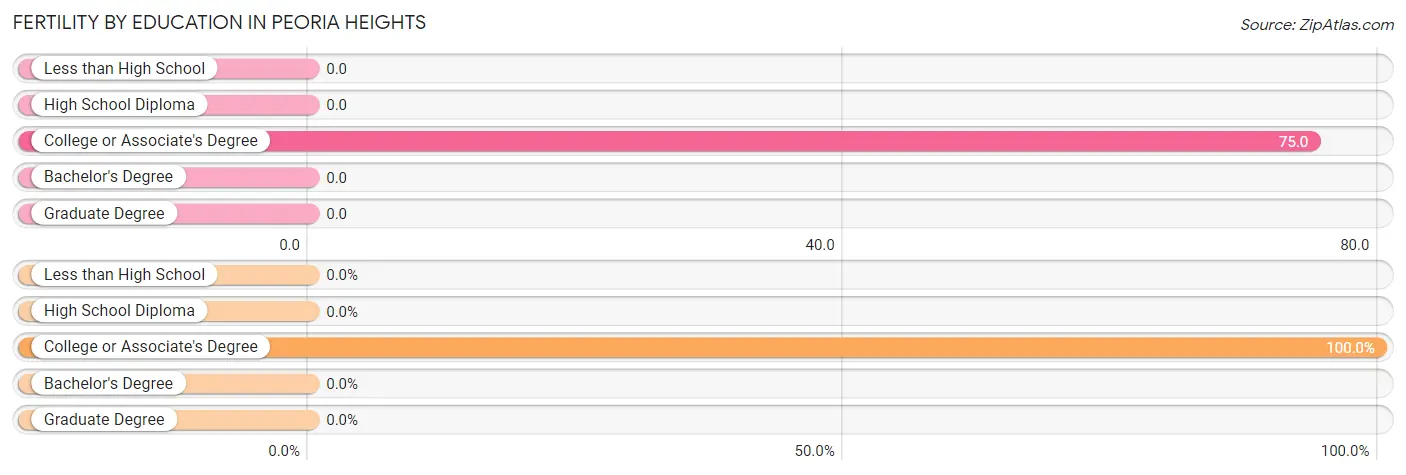
| Educational Attainment | Women with Births | Births / 1,000 Women |
| Less than High School | 0 (0.0%) | 0.0 |
| High School Diploma | 0 (0.0%) | 0.0 |
| College or Associate's Degree | 45 (100.0%) | 75.0 |
| Bachelor's Degree | 0 (0.0%) | 0.0 |
| Graduate Degree | 0 (0.0%) | 0.0 |
| Total | 45 (100.0%) | 33.0 |
Fertility by Education by Marriage Status in Peoria Heights
35.6% of women with births in Peoria Heights are unmarried. Women with the educational attainment of college or associate's degree are most likely to be married with 64.4% of them married at childbirth, while women with the educational attainment of college or associate's degree are least likely to be married with 35.6% of them unmarried at childbirth.
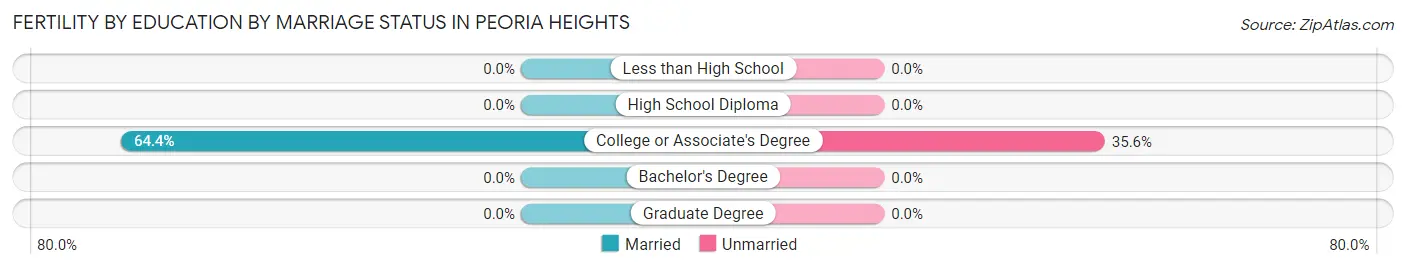
| Educational Attainment | Married | Unmarried |
| Less than High School | 0 (0.0%) | 0 (0.0%) |
| High School Diploma | 0 (0.0%) | 0 (0.0%) |
| College or Associate's Degree | 29 (64.4%) | 16 (35.6%) |
| Bachelor's Degree | 0 (0.0%) | 0 (0.0%) |
| Graduate Degree | 0 (0.0%) | 0 (0.0%) |
| Total | 29 (64.4%) | 16 (35.6%) |
Employment Characteristics in Peoria Heights
Employment by Class of Employer in Peoria Heights
Among the 3,028 employed individuals in Peoria Heights, private company employees (2,069 | 68.3%), not-for-profit organizations (398 | 13.1%), and self-employed (not incorporated) (162 | 5.3%) make up the most common classes of employment.
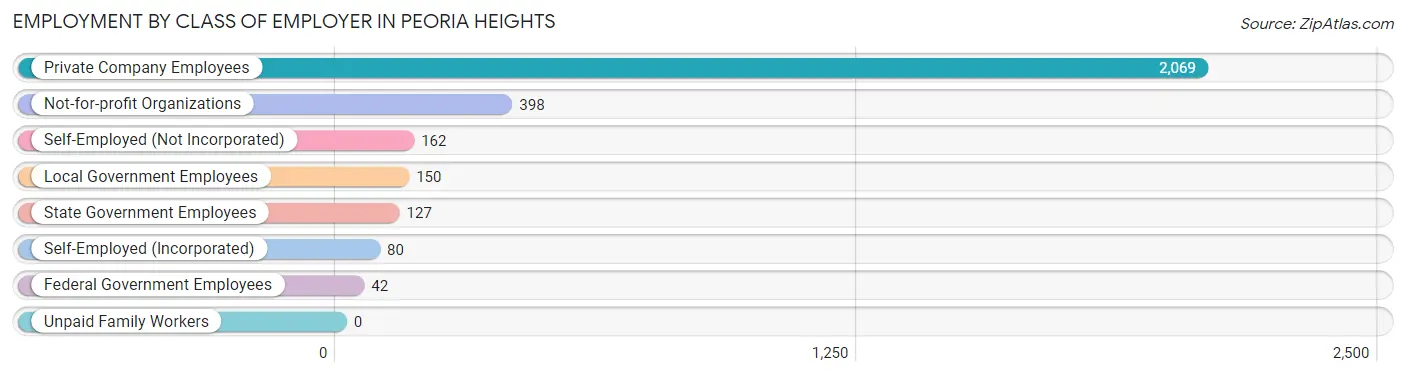
| Employer Class | # Employees | % Employees |
| Private Company Employees | 2,069 | 68.3% |
| Self-Employed (Incorporated) | 80 | 2.6% |
| Self-Employed (Not Incorporated) | 162 | 5.3% |
| Not-for-profit Organizations | 398 | 13.1% |
| Local Government Employees | 150 | 5.0% |
| State Government Employees | 127 | 4.2% |
| Federal Government Employees | 42 | 1.4% |
| Unpaid Family Workers | 0 | 0.0% |
| Total | 3,028 | 100.0% |
Employment Status by Age in Peoria Heights
According to the labor force statistics for Peoria Heights, out of the total population over 16 years of age (4,746), 68.9% or 3,270 individuals are in the labor force, with 5.3% or 173 of them unemployed. The age group with the highest labor force participation rate is 20 to 24 years, with 100.0% or 287 individuals in the labor force. Within the labor force, the 16 to 19 years age range has the highest percentage of unemployed individuals, with 17.9% or 29 of them being unemployed.
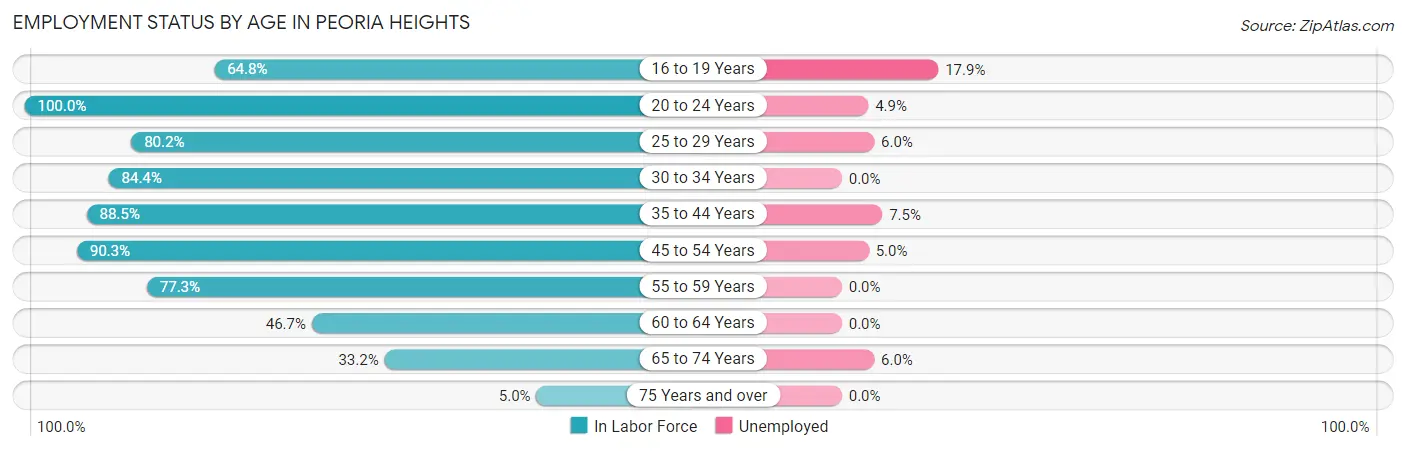
| Age Bracket | In Labor Force | Unemployed |
| 16 to 19 Years | 162 (64.8%) | 29 (17.9%) |
| 20 to 24 Years | 287 (100.0%) | 14 (4.9%) |
| 25 to 29 Years | 267 (80.2%) | 16 (6.0%) |
| 30 to 34 Years | 271 (84.4%) | 0 (0.0%) |
| 35 to 44 Years | 850 (88.5%) | 64 (7.5%) |
| 45 to 54 Years | 715 (90.3%) | 36 (5.0%) |
| 55 to 59 Years | 341 (77.3%) | 0 (0.0%) |
| 60 to 64 Years | 141 (46.7%) | 0 (0.0%) |
| 65 to 74 Years | 218 (33.2%) | 13 (6.0%) |
| 75 Years and over | 20 (5.0%) | 0 (0.0%) |
| Total | 3,270 (68.9%) | 173 (5.3%) |
Employment Status by Educational Attainment in Peoria Heights
According to labor force statistics for Peoria Heights, 82.1% of individuals (2,585) out of the total population between 25 and 64 years of age (3,149) are in the labor force, with 4.5% or 116 of them being unemployed. The group with the highest labor force participation rate are those with the educational attainment of bachelor's degree or higher, with 87.6% or 665 individuals in the labor force. Within the labor force, individuals with high school diploma education have the highest percentage of unemployment, with 14.7% or 82 of them being unemployed.
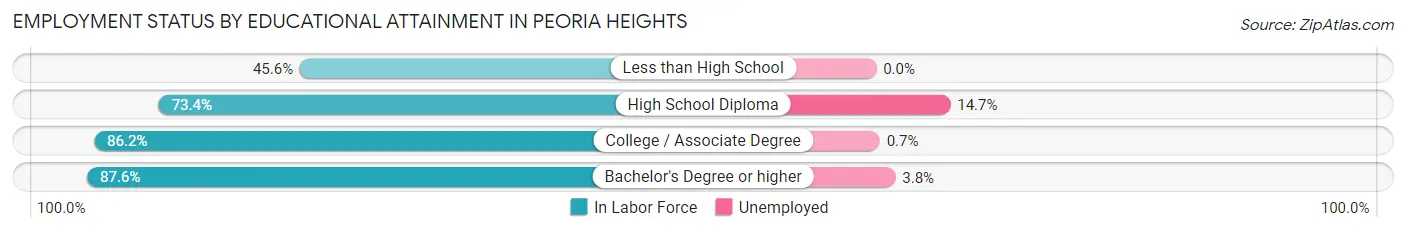
| Educational Attainment | In Labor Force | Unemployed |
| Less than High School | 47 (45.6%) | 0 (0.0%) |
| High School Diploma | 559 (73.4%) | 112 (14.7%) |
| College / Associate Degree | 1,315 (86.2%) | 11 (0.7%) |
| Bachelor's Degree or higher | 665 (87.6%) | 29 (3.8%) |
| Total | 2,585 (82.1%) | 142 (4.5%) |
Employment Occupations by Sex in Peoria Heights
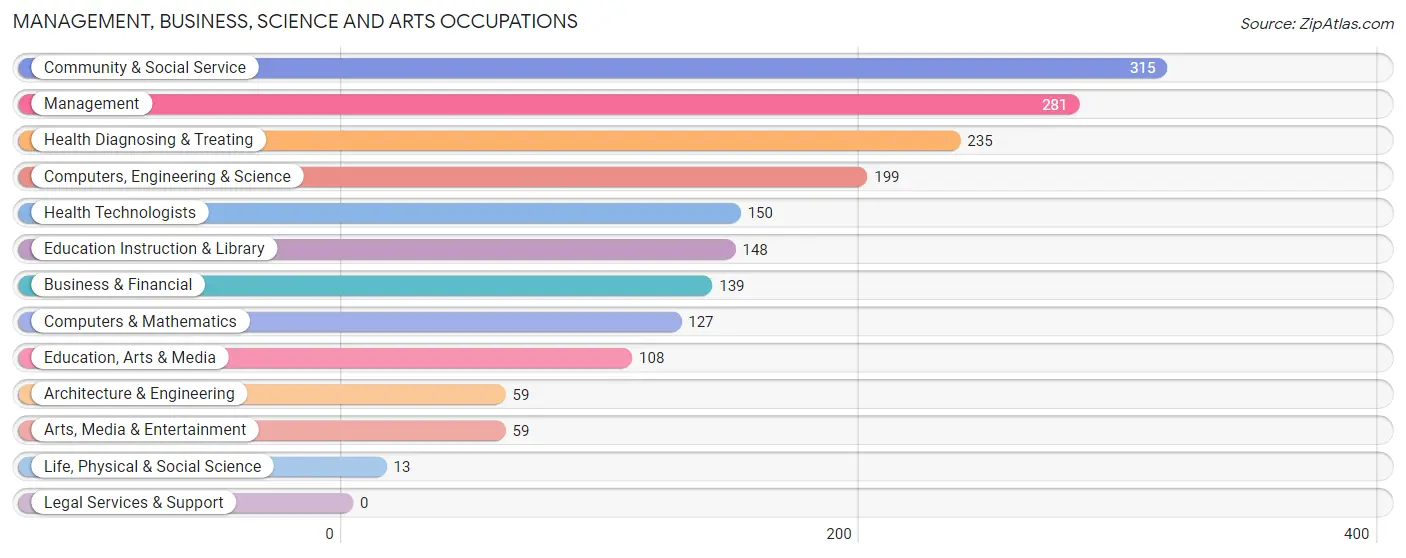
Management, Business, Science and Arts Occupations
The most common Management, Business, Science and Arts occupations in Peoria Heights are Community & Social Service (315 | 10.2%), Management (281 | 9.1%), Health Diagnosing & Treating (235 | 7.6%), Computers, Engineering & Science (199 | 6.4%), and Health Technologists (150 | 4.8%).
Management, Business, Science and Arts Occupations by Sex
Within the Management, Business, Science and Arts occupations in Peoria Heights, the most male-oriented occupations are Life, Physical & Social Science (100.0%), Computers, Engineering & Science (83.4%), and Computers & Mathematics (82.7%), while the most female-oriented occupations are Education, Arts & Media (88.0%), Business & Financial (84.2%), and Community & Social Service (71.8%).
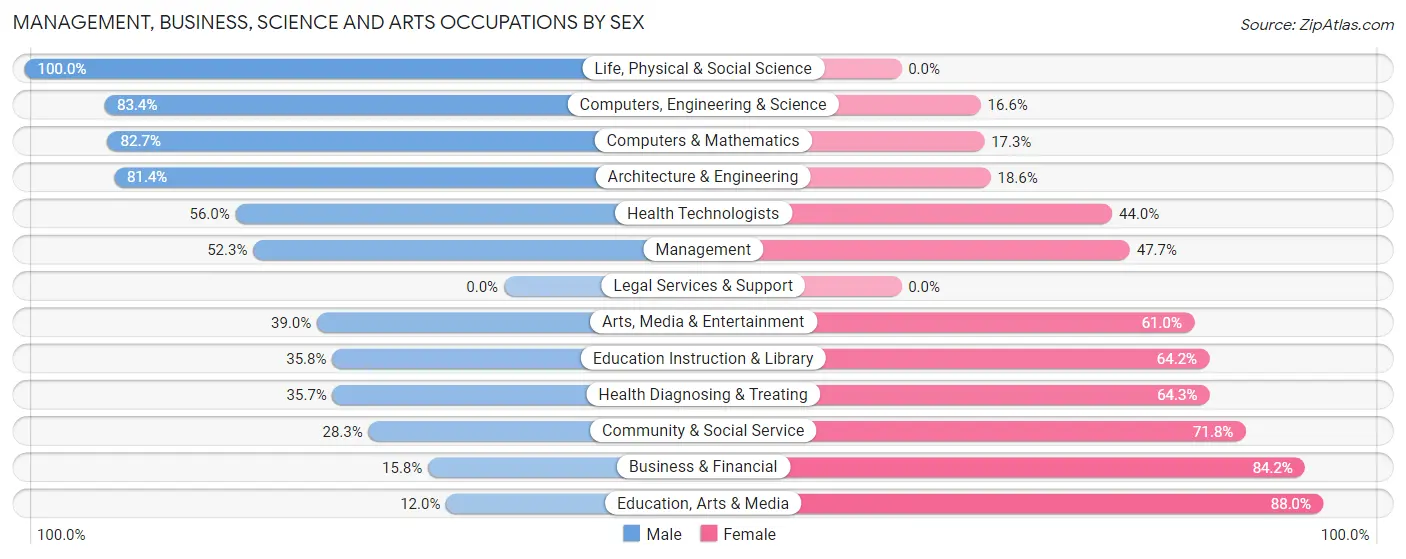
| Occupation | Male | Female |
| Management | 147 (52.3%) | 134 (47.7%) |
| Business & Financial | 22 (15.8%) | 117 (84.2%) |
| Computers, Engineering & Science | 166 (83.4%) | 33 (16.6%) |
| Computers & Mathematics | 105 (82.7%) | 22 (17.3%) |
| Architecture & Engineering | 48 (81.4%) | 11 (18.6%) |
| Life, Physical & Social Science | 13 (100.0%) | 0 (0.0%) |
| Community & Social Service | 89 (28.2%) | 226 (71.8%) |
| Education, Arts & Media | 13 (12.0%) | 95 (88.0%) |
| Legal Services & Support | 0 (0.0%) | 0 (0.0%) |
| Education Instruction & Library | 53 (35.8%) | 95 (64.2%) |
| Arts, Media & Entertainment | 23 (39.0%) | 36 (61.0%) |
| Health Diagnosing & Treating | 84 (35.7%) | 151 (64.3%) |
| Health Technologists | 84 (56.0%) | 66 (44.0%) |
| Total (Category) | 508 (43.5%) | 661 (56.5%) |
| Total (Overall) | 1,632 (52.6%) | 1,468 (47.3%) |
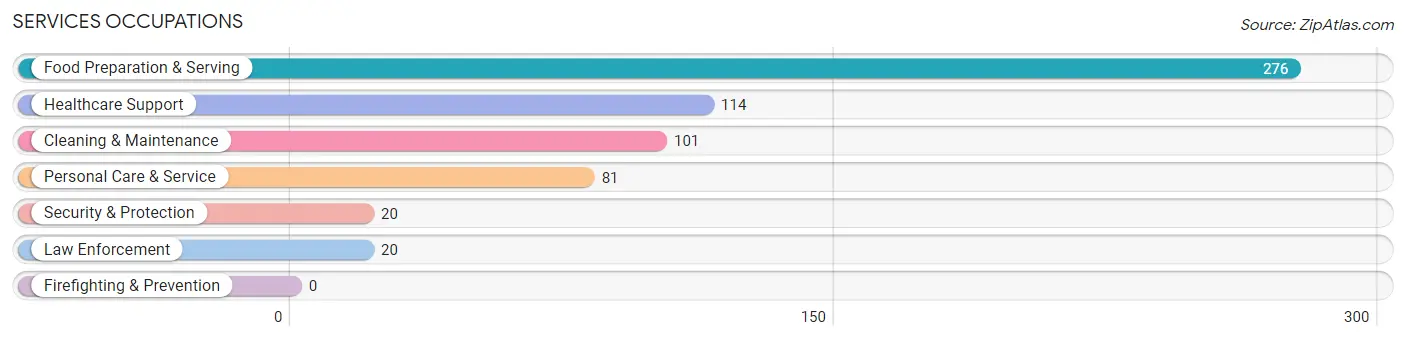
Services Occupations
The most common Services occupations in Peoria Heights are Food Preparation & Serving (276 | 8.9%), Healthcare Support (114 | 3.7%), Cleaning & Maintenance (101 | 3.3%), Personal Care & Service (81 | 2.6%), and Security & Protection (20 | 0.6%).
Services Occupations by Sex
Within the Services occupations in Peoria Heights, the most male-oriented occupations are Security & Protection (100.0%), Law Enforcement (100.0%), and Cleaning & Maintenance (63.4%), while the most female-oriented occupations are Healthcare Support (100.0%), Personal Care & Service (100.0%), and Food Preparation & Serving (54.3%).
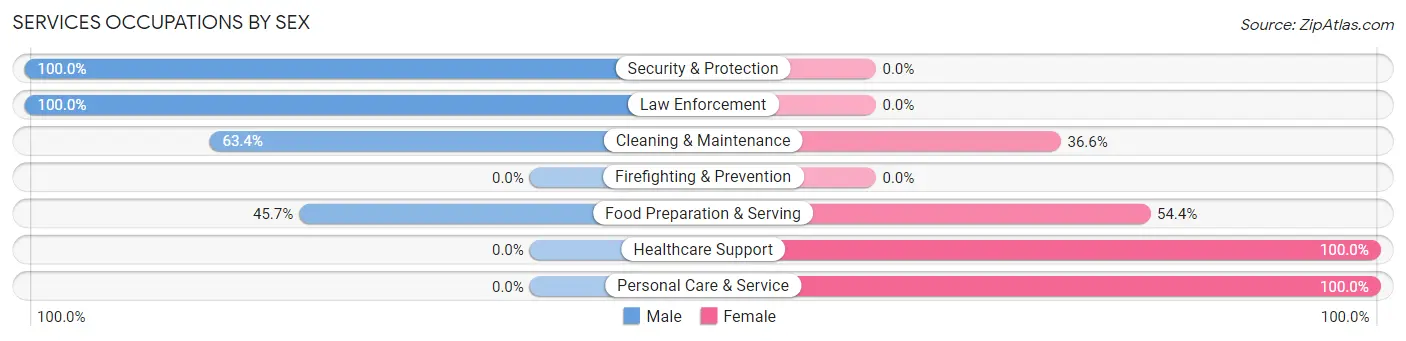
| Occupation | Male | Female |
| Healthcare Support | 0 (0.0%) | 114 (100.0%) |
| Security & Protection | 20 (100.0%) | 0 (0.0%) |
| Firefighting & Prevention | 0 (0.0%) | 0 (0.0%) |
| Law Enforcement | 20 (100.0%) | 0 (0.0%) |
| Food Preparation & Serving | 126 (45.7%) | 150 (54.3%) |
| Cleaning & Maintenance | 64 (63.4%) | 37 (36.6%) |
| Personal Care & Service | 0 (0.0%) | 81 (100.0%) |
| Total (Category) | 210 (35.5%) | 382 (64.5%) |
| Total (Overall) | 1,632 (52.6%) | 1,468 (47.3%) |
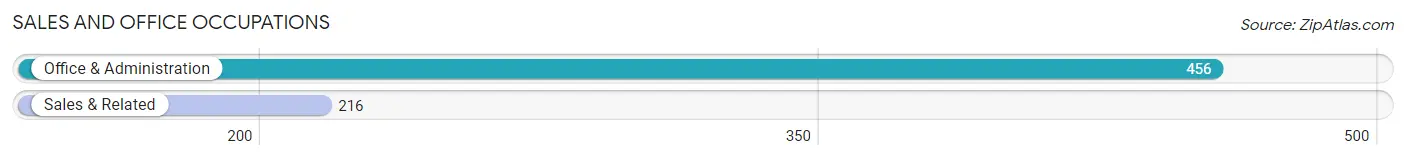
Sales and Office Occupations
The most common Sales and Office occupations in Peoria Heights are Office & Administration (456 | 14.7%), and Sales & Related (216 | 7.0%).
Sales and Office Occupations by Sex
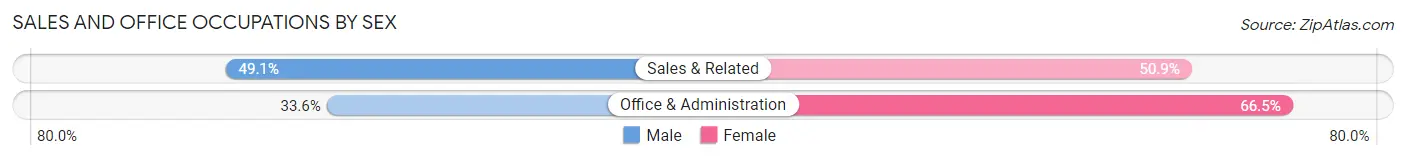
| Occupation | Male | Female |
| Sales & Related | 106 (49.1%) | 110 (50.9%) |
| Office & Administration | 153 (33.6%) | 303 (66.4%) |
| Total (Category) | 259 (38.5%) | 413 (61.5%) |
| Total (Overall) | 1,632 (52.6%) | 1,468 (47.3%) |
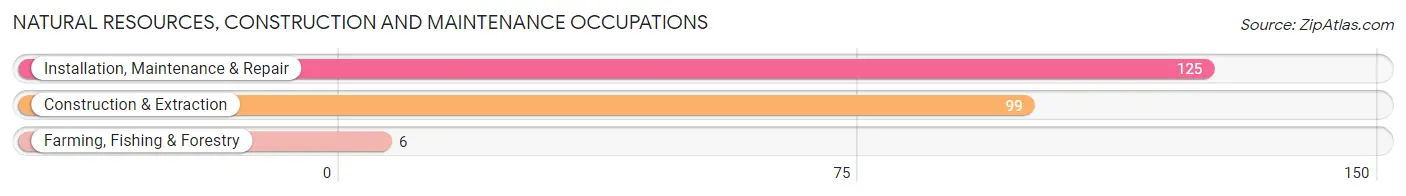
Natural Resources, Construction and Maintenance Occupations
The most common Natural Resources, Construction and Maintenance occupations in Peoria Heights are Installation, Maintenance & Repair (125 | 4.0%), Construction & Extraction (99 | 3.2%), and Farming, Fishing & Forestry (6 | 0.2%).
Natural Resources, Construction and Maintenance Occupations by Sex
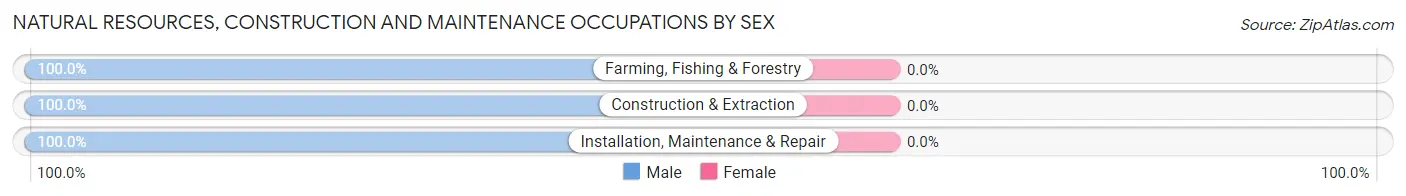
| Occupation | Male | Female |
| Farming, Fishing & Forestry | 6 (100.0%) | 0 (0.0%) |
| Construction & Extraction | 99 (100.0%) | 0 (0.0%) |
| Installation, Maintenance & Repair | 125 (100.0%) | 0 (0.0%) |
| Total (Category) | 230 (100.0%) | 0 (0.0%) |
| Total (Overall) | 1,632 (52.6%) | 1,468 (47.3%) |
Production, Transportation and Moving Occupations
The most common Production, Transportation and Moving occupations in Peoria Heights are Production (175 | 5.7%), Material Moving (156 | 5.0%), and Transportation (106 | 3.4%).
Production, Transportation and Moving Occupations by Sex
| Occupation | Male | Female |
| Production | 163 (93.1%) | 12 (6.9%) |
| Transportation | 106 (100.0%) | 0 (0.0%) |
| Material Moving | 156 (100.0%) | 0 (0.0%) |
| Total (Category) | 425 (97.3%) | 12 (2.8%) |
| Total (Overall) | 1,632 (52.6%) | 1,468 (47.3%) |
Employment Industries by Sex in Peoria Heights
Employment Industries in Peoria Heights
The major employment industries in Peoria Heights include Health Care & Social Assistance (640 | 20.6%), Retail Trade (366 | 11.8%), Manufacturing (326 | 10.5%), Accommodation & Food Services (297 | 9.6%), and Educational Services (280 | 9.0%).
Employment Industries by Sex in Peoria Heights
The Peoria Heights industries that see more men than women are Construction (100.0%), Information (100.0%), and Public Administration (86.8%), whereas the industries that tend to have a higher number of women are Educational Services (78.9%), Finance & Insurance (77.9%), and Health Care & Social Assistance (72.3%).
| Industry | Male | Female |
| Agriculture, Fishing & Hunting | 0 (0.0%) | 0 (0.0%) |
| Mining, Quarrying, & Extraction | 0 (0.0%) | 0 (0.0%) |
| Construction | 122 (100.0%) | 0 (0.0%) |
| Manufacturing | 264 (81.0%) | 62 (19.0%) |
| Wholesale Trade | 62 (63.3%) | 36 (36.7%) |
| Retail Trade | 178 (48.6%) | 188 (51.4%) |
| Transportation & Warehousing | 81 (73.0%) | 30 (27.0%) |
| Utilities | 13 (31.7%) | 28 (68.3%) |
| Information | 68 (100.0%) | 0 (0.0%) |
| Finance & Insurance | 15 (22.1%) | 53 (77.9%) |
| Real Estate, Rental & Leasing | 9 (56.2%) | 7 (43.8%) |
| Professional & Scientific | 76 (84.4%) | 14 (15.6%) |
| Enterprise Management | 0 (0.0%) | 0 (0.0%) |
| Administrative & Support | 146 (80.2%) | 36 (19.8%) |
| Educational Services | 59 (21.1%) | 221 (78.9%) |
| Health Care & Social Assistance | 177 (27.7%) | 463 (72.3%) |
| Arts, Entertainment & Recreation | 49 (37.7%) | 81 (62.3%) |
| Accommodation & Food Services | 164 (55.2%) | 133 (44.8%) |
| Public Administration | 72 (86.8%) | 11 (13.3%) |
| Total | 1,632 (52.6%) | 1,468 (47.3%) |
Education in Peoria Heights
School Enrollment in Peoria Heights
The most common levels of schooling among the 1,312 students in Peoria Heights are elementary school (356 | 27.1%), middle school (285 | 21.7%), and high school (270 | 20.6%).
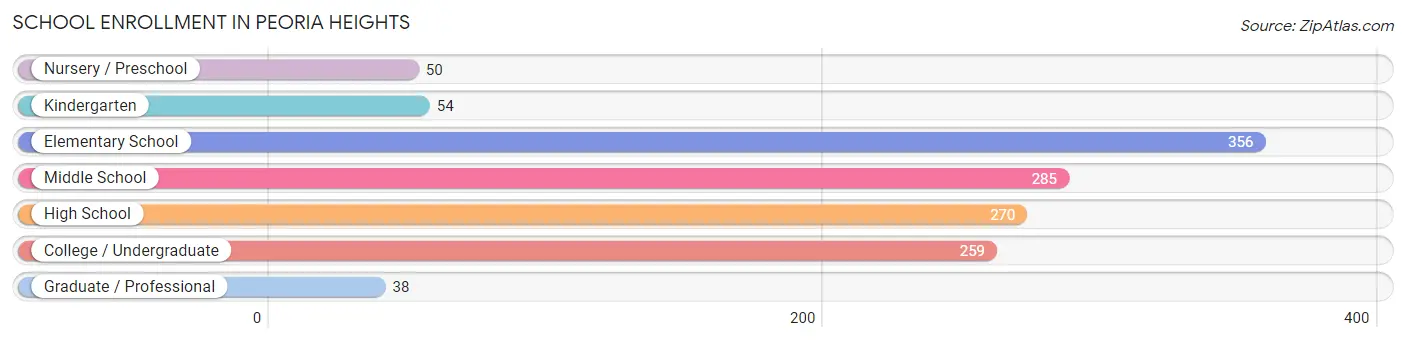
| School Level | # Students | % Students |
| Nursery / Preschool | 50 | 3.8% |
| Kindergarten | 54 | 4.1% |
| Elementary School | 356 | 27.1% |
| Middle School | 285 | 21.7% |
| High School | 270 | 20.6% |
| College / Undergraduate | 259 | 19.7% |
| Graduate / Professional | 38 | 2.9% |
| Total | 1,312 | 100.0% |
School Enrollment by Age by Funding Source in Peoria Heights
Out of a total of 1,312 students who are enrolled in schools in Peoria Heights, 377 (28.7%) attend a private institution, while the remaining 935 (71.3%) are enrolled in public schools. The age group of 25 to 34 year olds has the highest likelihood of being enrolled in private schools, with 30 (66.7% in the age bracket) enrolled. Conversely, the age group of 10 to 14 year olds has the lowest likelihood of being enrolled in a private school, with 283 (88.4% in the age bracket) attending a public institution.
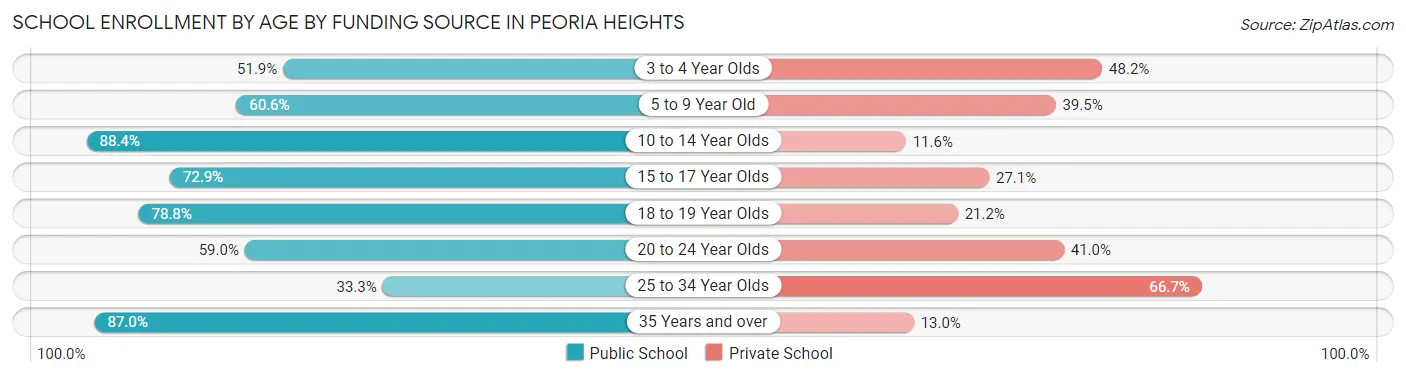
| Age Bracket | Public School | Private School |
| 3 to 4 Year Olds | 14 (51.8%) | 13 (48.1%) |
| 5 to 9 Year Old | 241 (60.6%) | 157 (39.5%) |
| 10 to 14 Year Olds | 283 (88.4%) | 37 (11.6%) |
| 15 to 17 Year Olds | 175 (72.9%) | 65 (27.1%) |
| 18 to 19 Year Olds | 89 (78.8%) | 24 (21.2%) |
| 20 to 24 Year Olds | 59 (59.0%) | 41 (41.0%) |
| 25 to 34 Year Olds | 15 (33.3%) | 30 (66.7%) |
| 35 Years and over | 60 (87.0%) | 9 (13.0%) |
| Total | 935 (71.3%) | 377 (28.7%) |
Educational Attainment by Field of Study in Peoria Heights
Education (187 | 15.6%), business (175 | 14.6%), science & technology (164 | 13.7%), literature & languages (110 | 9.2%), and bio, nature & agricultural (92 | 7.7%) are the most common fields of study among 1,200 individuals in Peoria Heights who have obtained a bachelor's degree or higher.
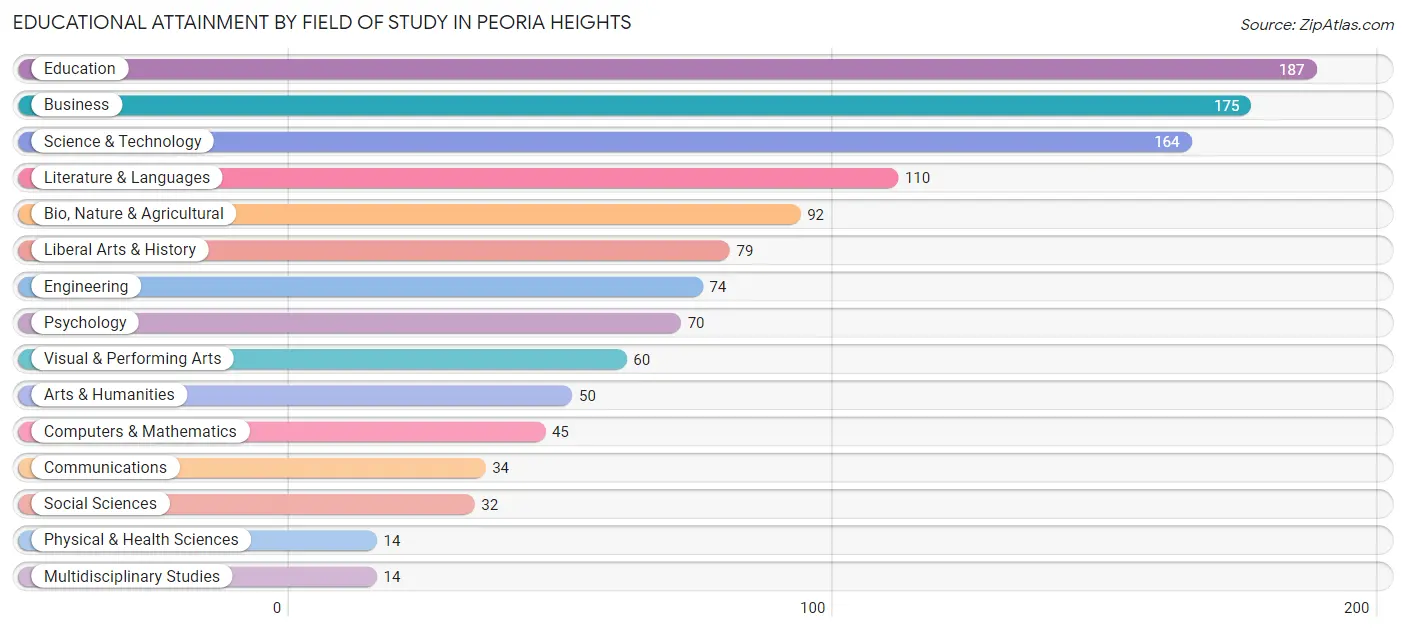
| Field of Study | # Graduates | % Graduates |
| Computers & Mathematics | 45 | 3.7% |
| Bio, Nature & Agricultural | 92 | 7.7% |
| Physical & Health Sciences | 14 | 1.2% |
| Psychology | 70 | 5.8% |
| Social Sciences | 32 | 2.7% |
| Engineering | 74 | 6.2% |
| Multidisciplinary Studies | 14 | 1.2% |
| Science & Technology | 164 | 13.7% |
| Business | 175 | 14.6% |
| Education | 187 | 15.6% |
| Literature & Languages | 110 | 9.2% |
| Liberal Arts & History | 79 | 6.6% |
| Visual & Performing Arts | 60 | 5.0% |
| Communications | 34 | 2.8% |
| Arts & Humanities | 50 | 4.2% |
| Total | 1,200 | 100.0% |
Transportation & Commute in Peoria Heights
Vehicle Availability by Sex in Peoria Heights
The most prevalent vehicle ownership categories in Peoria Heights are males with 2 vehicles (630, accounting for 38.8%) and females with 2 vehicles (432, making up 44.9%).
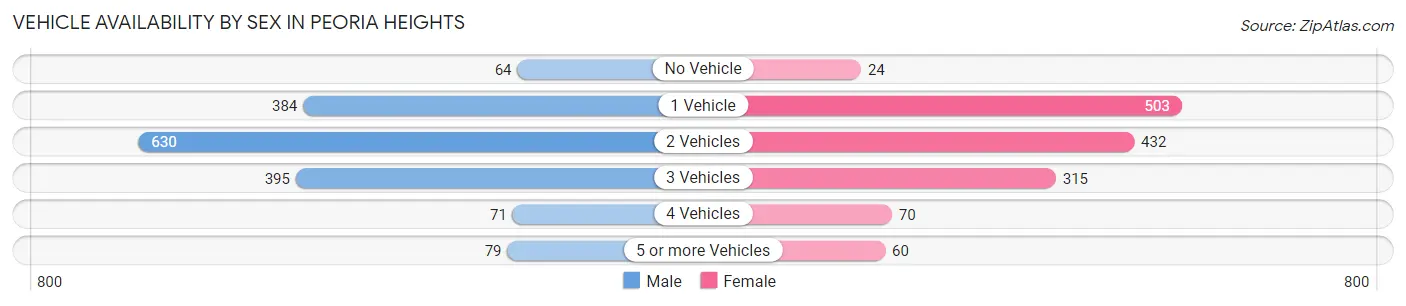
| Vehicles Available | Male | Female |
| No Vehicle | 64 (3.9%) | 24 (1.7%) |
| 1 Vehicle | 384 (23.7%) | 503 (35.8%) |
| 2 Vehicles | 630 (38.8%) | 432 (30.8%) |
| 3 Vehicles | 395 (24.3%) | 315 (22.4%) |
| 4 Vehicles | 71 (4.4%) | 70 (5.0%) |
| 5 or more Vehicles | 79 (4.9%) | 60 (4.3%) |
| Total | 1,623 (100.0%) | 1,404 (100.0%) |
Commute Time in Peoria Heights
The most frequently occuring commute durations in Peoria Heights are 15 to 19 minutes (810 commuters, 28.9%), 10 to 14 minutes (698 commuters, 24.9%), and 5 to 9 minutes (390 commuters, 13.9%).
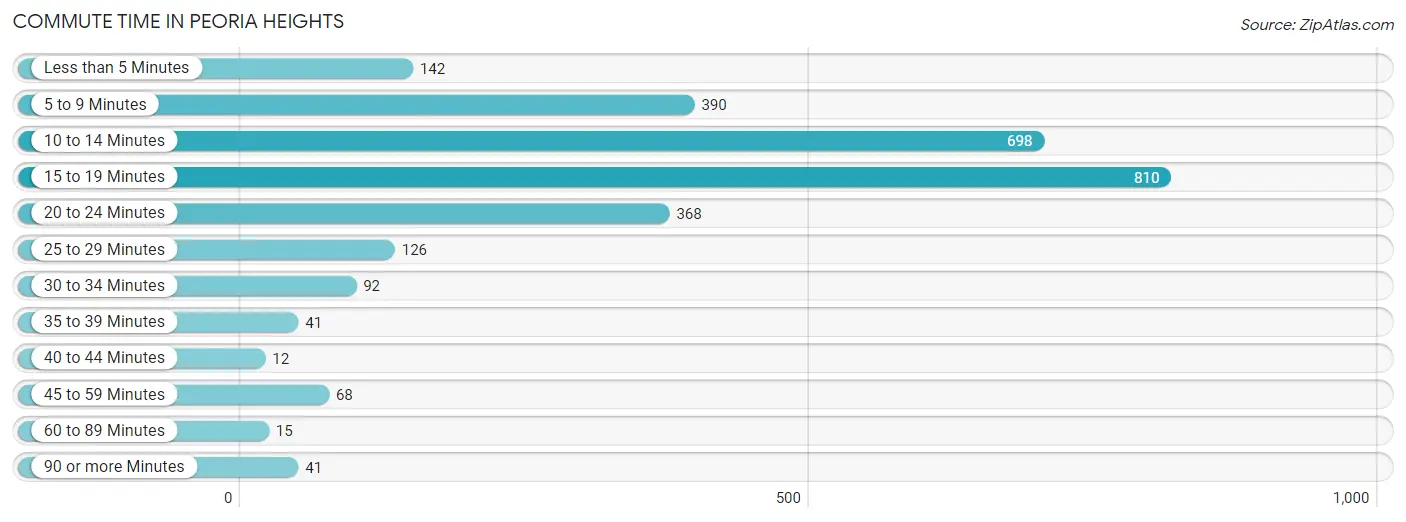
| Commute Time | # Commuters | % Commuters |
| Less than 5 Minutes | 142 | 5.1% |
| 5 to 9 Minutes | 390 | 13.9% |
| 10 to 14 Minutes | 698 | 24.9% |
| 15 to 19 Minutes | 810 | 28.9% |
| 20 to 24 Minutes | 368 | 13.1% |
| 25 to 29 Minutes | 126 | 4.5% |
| 30 to 34 Minutes | 92 | 3.3% |
| 35 to 39 Minutes | 41 | 1.5% |
| 40 to 44 Minutes | 12 | 0.4% |
| 45 to 59 Minutes | 68 | 2.4% |
| 60 to 89 Minutes | 15 | 0.5% |
| 90 or more Minutes | 41 | 1.5% |
Commute Time by Sex in Peoria Heights
The most common commute times in Peoria Heights are 10 to 14 minutes (404 commuters, 25.9%) for males and 15 to 19 minutes (478 commuters, 38.4%) for females.
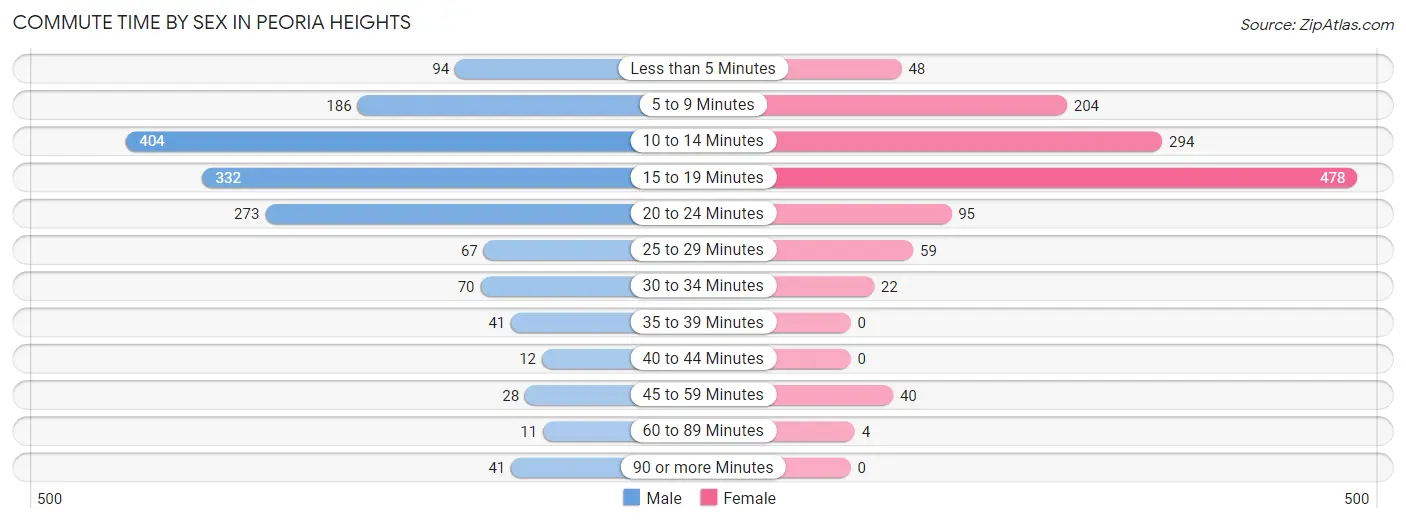
| Commute Time | Male | Female |
| Less than 5 Minutes | 94 (6.0%) | 48 (3.9%) |
| 5 to 9 Minutes | 186 (11.9%) | 204 (16.4%) |
| 10 to 14 Minutes | 404 (25.9%) | 294 (23.6%) |
| 15 to 19 Minutes | 332 (21.3%) | 478 (38.4%) |
| 20 to 24 Minutes | 273 (17.5%) | 95 (7.6%) |
| 25 to 29 Minutes | 67 (4.3%) | 59 (4.7%) |
| 30 to 34 Minutes | 70 (4.5%) | 22 (1.8%) |
| 35 to 39 Minutes | 41 (2.6%) | 0 (0.0%) |
| 40 to 44 Minutes | 12 (0.8%) | 0 (0.0%) |
| 45 to 59 Minutes | 28 (1.8%) | 40 (3.2%) |
| 60 to 89 Minutes | 11 (0.7%) | 4 (0.3%) |
| 90 or more Minutes | 41 (2.6%) | 0 (0.0%) |
Time of Departure to Work by Sex in Peoria Heights
The most frequent times of departure to work in Peoria Heights are 12:00 PM to 3:59 PM (381, 24.4%) for males and 7:30 AM to 7:59 AM (190, 15.3%) for females.
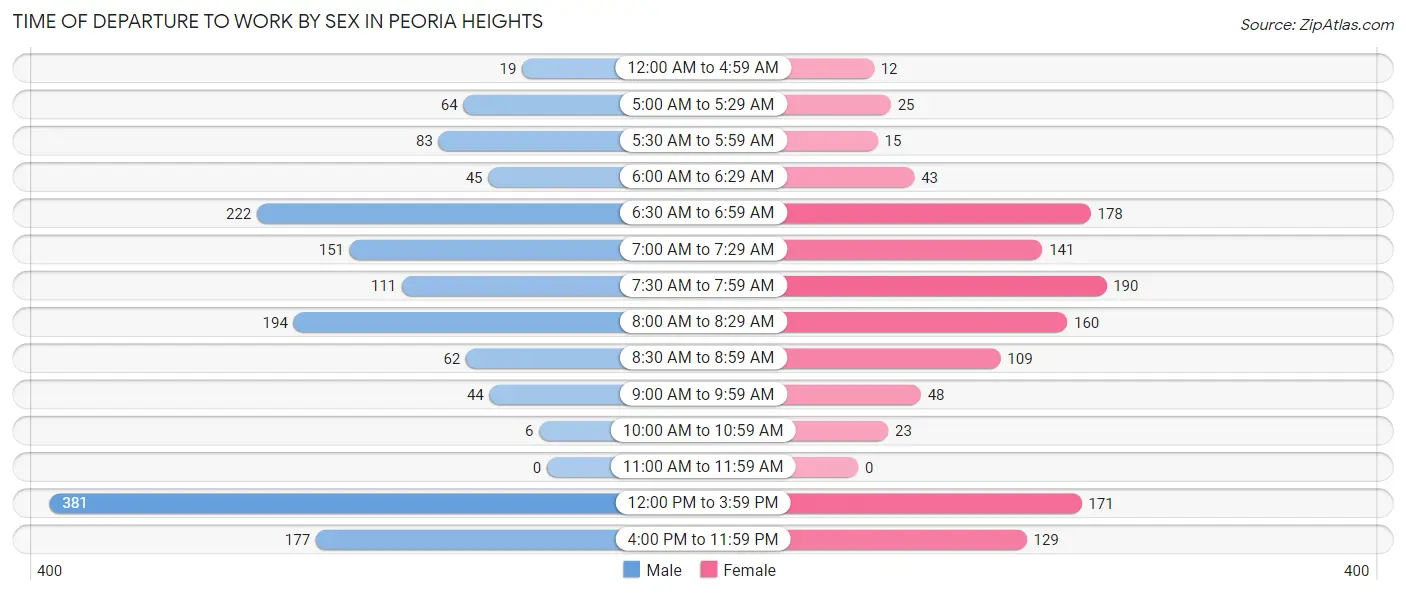
| Time of Departure | Male | Female |
| 12:00 AM to 4:59 AM | 19 (1.2%) | 12 (1.0%) |
| 5:00 AM to 5:29 AM | 64 (4.1%) | 25 (2.0%) |
| 5:30 AM to 5:59 AM | 83 (5.3%) | 15 (1.2%) |
| 6:00 AM to 6:29 AM | 45 (2.9%) | 43 (3.5%) |
| 6:30 AM to 6:59 AM | 222 (14.2%) | 178 (14.3%) |
| 7:00 AM to 7:29 AM | 151 (9.7%) | 141 (11.3%) |
| 7:30 AM to 7:59 AM | 111 (7.1%) | 190 (15.3%) |
| 8:00 AM to 8:29 AM | 194 (12.4%) | 160 (12.9%) |
| 8:30 AM to 8:59 AM | 62 (4.0%) | 109 (8.8%) |
| 9:00 AM to 9:59 AM | 44 (2.8%) | 48 (3.9%) |
| 10:00 AM to 10:59 AM | 6 (0.4%) | 23 (1.8%) |
| 11:00 AM to 11:59 AM | 0 (0.0%) | 0 (0.0%) |
| 12:00 PM to 3:59 PM | 381 (24.4%) | 171 (13.8%) |
| 4:00 PM to 11:59 PM | 177 (11.4%) | 129 (10.4%) |
| Total | 1,559 (100.0%) | 1,244 (100.0%) |
Housing Occupancy in Peoria Heights
Occupancy by Ownership in Peoria Heights
Of the total 2,794 dwellings in Peoria Heights, owner-occupied units account for 1,744 (62.4%), while renter-occupied units make up 1,050 (37.6%).
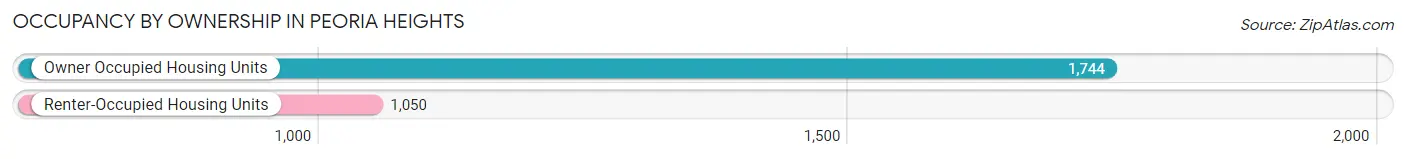
| Occupancy | # Housing Units | % Housing Units |
| Owner Occupied Housing Units | 1,744 | 62.4% |
| Renter-Occupied Housing Units | 1,050 | 37.6% |
| Total Occupied Housing Units | 2,794 | 100.0% |
Occupancy by Household Size in Peoria Heights
| Household Size | # Housing Units | % Housing Units |
| 1-Person Household | 1,275 | 45.6% |
| 2-Person Household | 947 | 33.9% |
| 3-Person Household | 218 | 7.8% |
| 4+ Person Household | 354 | 12.7% |
| Total Housing Units | 2,794 | 100.0% |
Occupancy by Ownership by Household Size in Peoria Heights
| Household Size | Owner-occupied | Renter-occupied |
| 1-Person Household | 763 (59.8%) | 512 (40.2%) |
| 2-Person Household | 519 (54.8%) | 428 (45.2%) |
| 3-Person Household | 166 (76.1%) | 52 (23.8%) |
| 4+ Person Household | 296 (83.6%) | 58 (16.4%) |
| Total Housing Units | 1,744 (62.4%) | 1,050 (37.6%) |
Occupancy by Educational Attainment in Peoria Heights
| Household Size | Owner-occupied | Renter-occupied |
| Less than High School | 57 (41.9%) | 79 (58.1%) |
| High School Diploma | 337 (54.3%) | 283 (45.7%) |
| College/Associate Degree | 797 (67.9%) | 376 (32.1%) |
| Bachelor's Degree or higher | 553 (63.9%) | 312 (36.1%) |
Occupancy by Age of Householder in Peoria Heights
| Age Bracket | # Households | % Households |
| Under 35 Years | 562 | 20.1% |
| 35 to 44 Years | 600 | 21.5% |
| 45 to 54 Years | 501 | 17.9% |
| 55 to 64 Years | 434 | 15.5% |
| 65 to 74 Years | 396 | 14.2% |
| 75 to 84 Years | 220 | 7.9% |
| 85 Years and Over | 81 | 2.9% |
| Total | 2,794 | 100.0% |
Housing Finances in Peoria Heights
Median Income by Occupancy in Peoria Heights
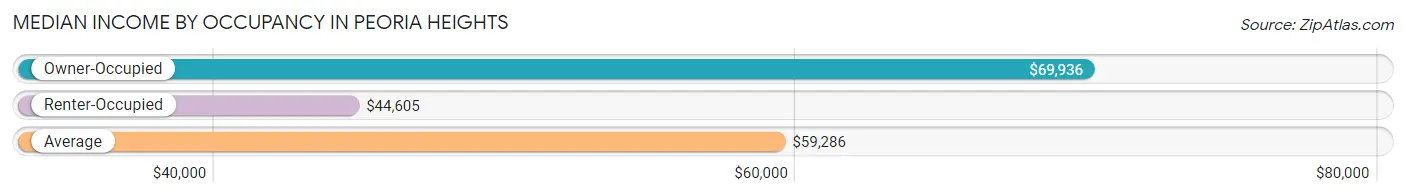
| Occupancy Type | # Households | Median Income |
| Owner-Occupied | 1,744 (62.4%) | $69,936 |
| Renter-Occupied | 1,050 (37.6%) | $44,605 |
| Average | 2,794 (100.0%) | $59,286 |
Occupancy by Householder Income Bracket in Peoria Heights
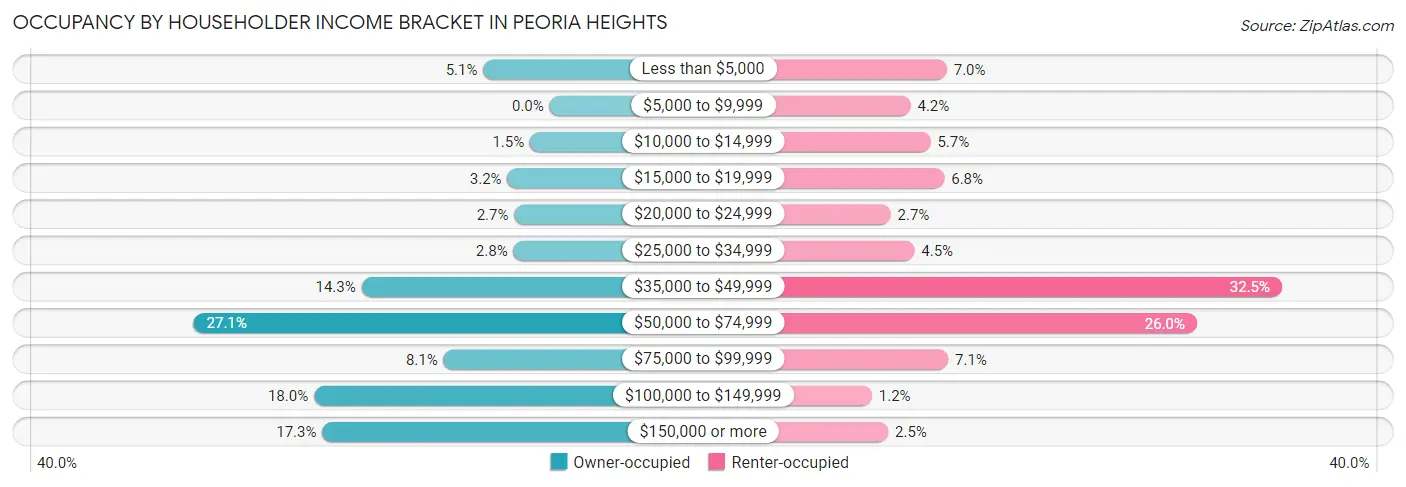
| Income Bracket | Owner-occupied | Renter-occupied |
| Less than $5,000 | 88 (5.1%) | 73 (7.0%) |
| $5,000 to $9,999 | 0 (0.0%) | 44 (4.2%) |
| $10,000 to $14,999 | 26 (1.5%) | 60 (5.7%) |
| $15,000 to $19,999 | 56 (3.2%) | 71 (6.8%) |
| $20,000 to $24,999 | 47 (2.7%) | 28 (2.7%) |
| $25,000 to $34,999 | 48 (2.8%) | 47 (4.5%) |
| $35,000 to $49,999 | 250 (14.3%) | 341 (32.5%) |
| $50,000 to $74,999 | 473 (27.1%) | 273 (26.0%) |
| $75,000 to $99,999 | 141 (8.1%) | 74 (7.0%) |
| $100,000 to $149,999 | 313 (17.9%) | 13 (1.2%) |
| $150,000 or more | 302 (17.3%) | 26 (2.5%) |
| Total | 1,744 (100.0%) | 1,050 (100.0%) |
Monthly Housing Cost Tiers in Peoria Heights
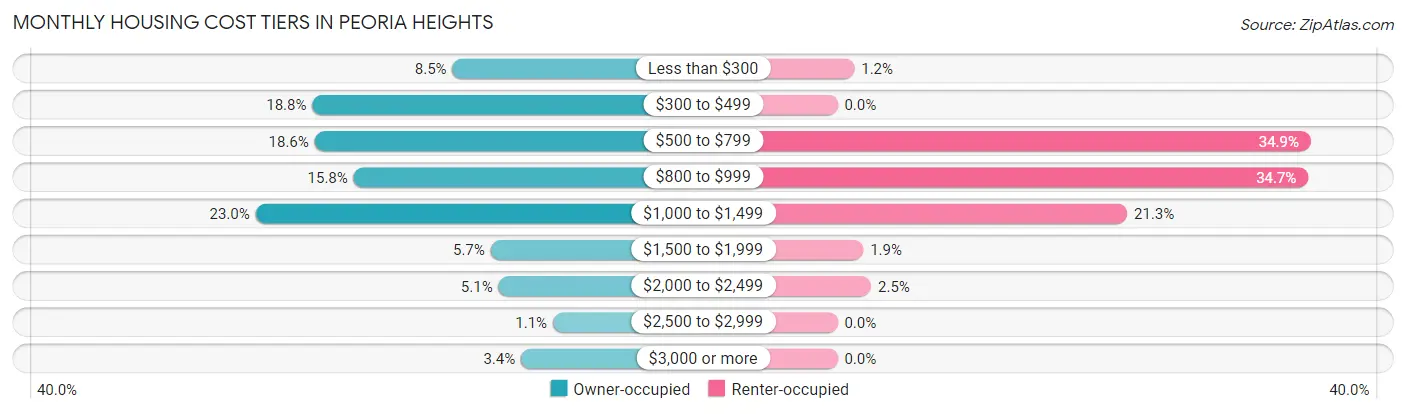
| Monthly Cost | Owner-occupied | Renter-occupied |
| Less than $300 | 148 (8.5%) | 13 (1.2%) |
| $300 to $499 | 328 (18.8%) | 0 (0.0%) |
| $500 to $799 | 325 (18.6%) | 366 (34.9%) |
| $800 to $999 | 275 (15.8%) | 364 (34.7%) |
| $1,000 to $1,499 | 401 (23.0%) | 224 (21.3%) |
| $1,500 to $1,999 | 99 (5.7%) | 20 (1.9%) |
| $2,000 to $2,499 | 89 (5.1%) | 26 (2.5%) |
| $2,500 to $2,999 | 19 (1.1%) | 0 (0.0%) |
| $3,000 or more | 60 (3.4%) | 0 (0.0%) |
| Total | 1,744 (100.0%) | 1,050 (100.0%) |
Physical Housing Characteristics in Peoria Heights
Housing Structures in Peoria Heights
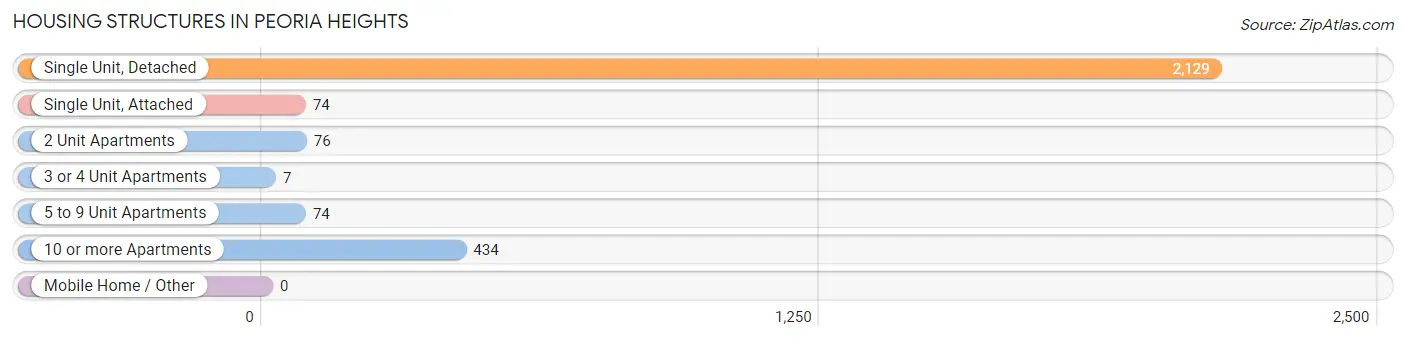
| Structure Type | # Housing Units | % Housing Units |
| Single Unit, Detached | 2,129 | 76.2% |
| Single Unit, Attached | 74 | 2.6% |
| 2 Unit Apartments | 76 | 2.7% |
| 3 or 4 Unit Apartments | 7 | 0.3% |
| 5 to 9 Unit Apartments | 74 | 2.6% |
| 10 or more Apartments | 434 | 15.5% |
| Mobile Home / Other | 0 | 0.0% |
| Total | 2,794 | 100.0% |
Housing Structures by Occupancy in Peoria Heights
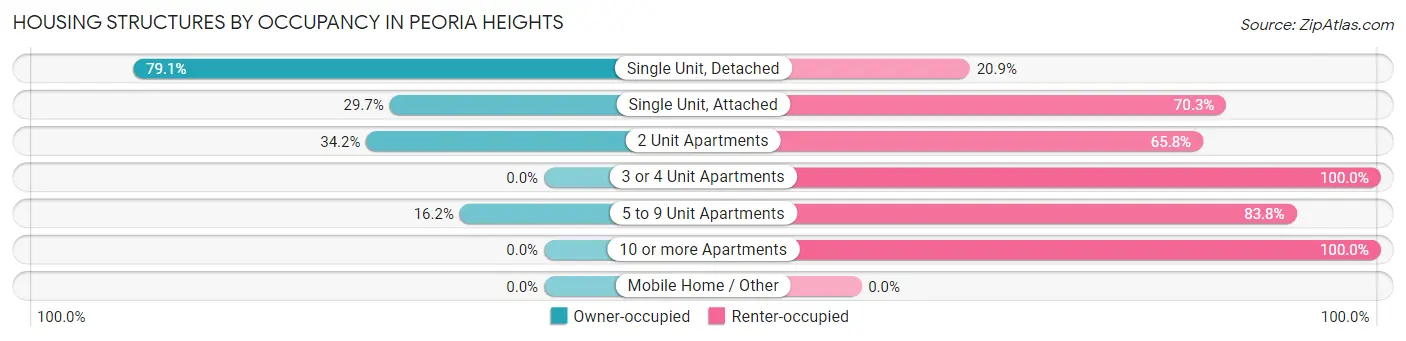
| Structure Type | Owner-occupied | Renter-occupied |
| Single Unit, Detached | 1,684 (79.1%) | 445 (20.9%) |
| Single Unit, Attached | 22 (29.7%) | 52 (70.3%) |
| 2 Unit Apartments | 26 (34.2%) | 50 (65.8%) |
| 3 or 4 Unit Apartments | 0 (0.0%) | 7 (100.0%) |
| 5 to 9 Unit Apartments | 12 (16.2%) | 62 (83.8%) |
| 10 or more Apartments | 0 (0.0%) | 434 (100.0%) |
| Mobile Home / Other | 0 (0.0%) | 0 (0.0%) |
| Total | 1,744 (62.4%) | 1,050 (37.6%) |
Housing Structures by Number of Rooms in Peoria Heights
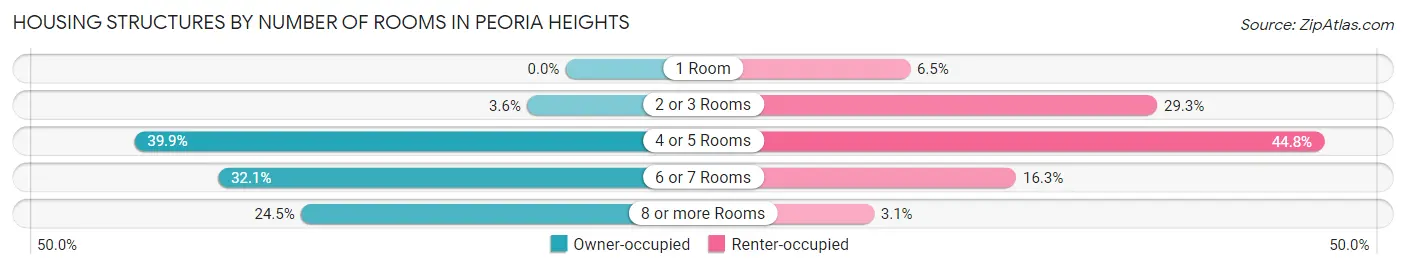
| Number of Rooms | Owner-occupied | Renter-occupied |
| 1 Room | 0 (0.0%) | 68 (6.5%) |
| 2 or 3 Rooms | 62 (3.6%) | 308 (29.3%) |
| 4 or 5 Rooms | 695 (39.9%) | 470 (44.8%) |
| 6 or 7 Rooms | 560 (32.1%) | 171 (16.3%) |
| 8 or more Rooms | 427 (24.5%) | 33 (3.1%) |
| Total | 1,744 (100.0%) | 1,050 (100.0%) |
Housing Structure by Heating Type in Peoria Heights
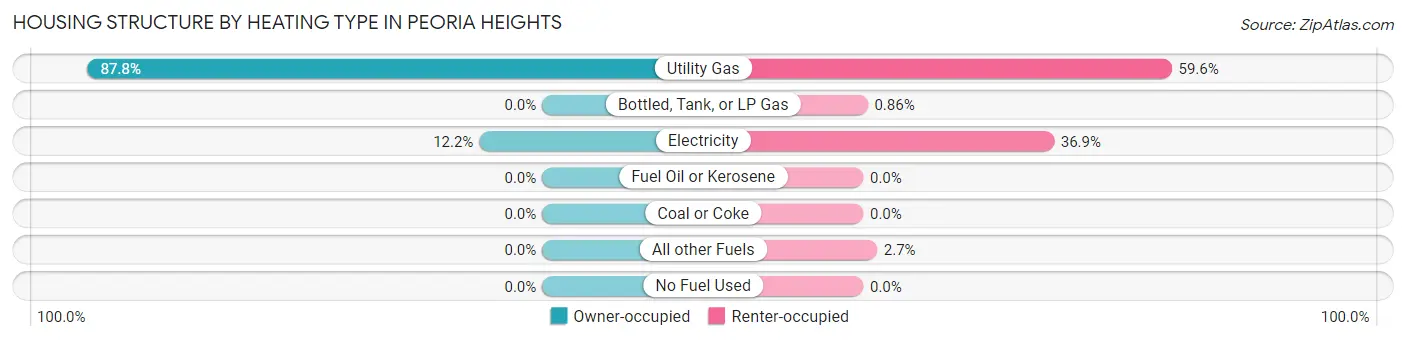
| Heating Type | Owner-occupied | Renter-occupied |
| Utility Gas | 1,532 (87.8%) | 626 (59.6%) |
| Bottled, Tank, or LP Gas | 0 (0.0%) | 9 (0.9%) |
| Electricity | 212 (12.2%) | 387 (36.9%) |
| Fuel Oil or Kerosene | 0 (0.0%) | 0 (0.0%) |
| Coal or Coke | 0 (0.0%) | 0 (0.0%) |
| All other Fuels | 0 (0.0%) | 28 (2.7%) |
| No Fuel Used | 0 (0.0%) | 0 (0.0%) |
| Total | 1,744 (100.0%) | 1,050 (100.0%) |
Household Vehicle Usage in Peoria Heights
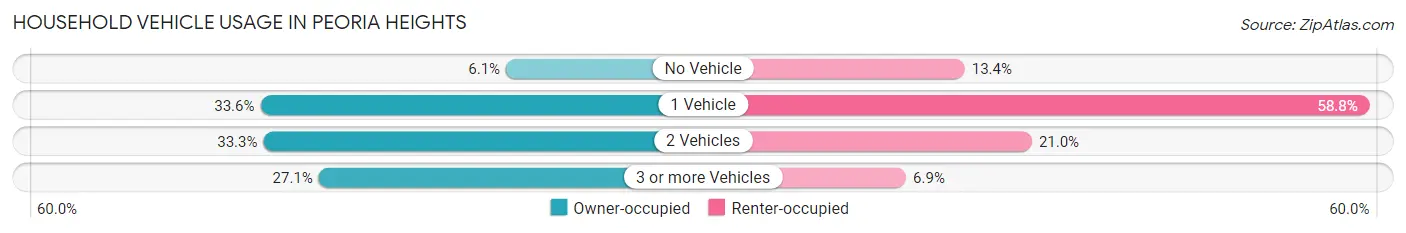
| Vehicles per Household | Owner-occupied | Renter-occupied |
| No Vehicle | 106 (6.1%) | 141 (13.4%) |
| 1 Vehicle | 586 (33.6%) | 617 (58.8%) |
| 2 Vehicles | 580 (33.3%) | 220 (20.9%) |
| 3 or more Vehicles | 472 (27.1%) | 72 (6.9%) |
| Total | 1,744 (100.0%) | 1,050 (100.0%) |
Real Estate & Mortgages in Peoria Heights
Real Estate and Mortgage Overview in Peoria Heights
| Characteristic | Without Mortgage | With Mortgage |
| Housing Units | 813 | 931 |
| Median Property Value | $121,100 | $96,100 |
| Median Household Income | $65,809 | $99 |
| Monthly Housing Costs | $466 | $54 |
| Real Estate Taxes | $1,953 | $17 |
Property Value by Mortgage Status in Peoria Heights
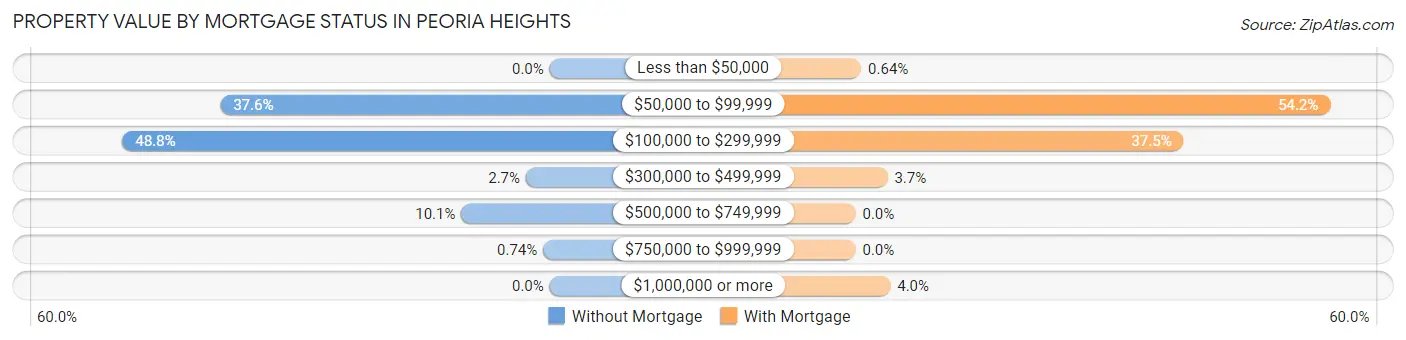
| Property Value | Without Mortgage | With Mortgage |
| Less than $50,000 | 0 (0.0%) | 6 (0.6%) |
| $50,000 to $99,999 | 306 (37.6%) | 505 (54.2%) |
| $100,000 to $299,999 | 397 (48.8%) | 349 (37.5%) |
| $300,000 to $499,999 | 22 (2.7%) | 34 (3.6%) |
| $500,000 to $749,999 | 82 (10.1%) | 0 (0.0%) |
| $750,000 to $999,999 | 6 (0.7%) | 0 (0.0%) |
| $1,000,000 or more | 0 (0.0%) | 37 (4.0%) |
| Total | 813 (100.0%) | 931 (100.0%) |
Household Income by Mortgage Status in Peoria Heights
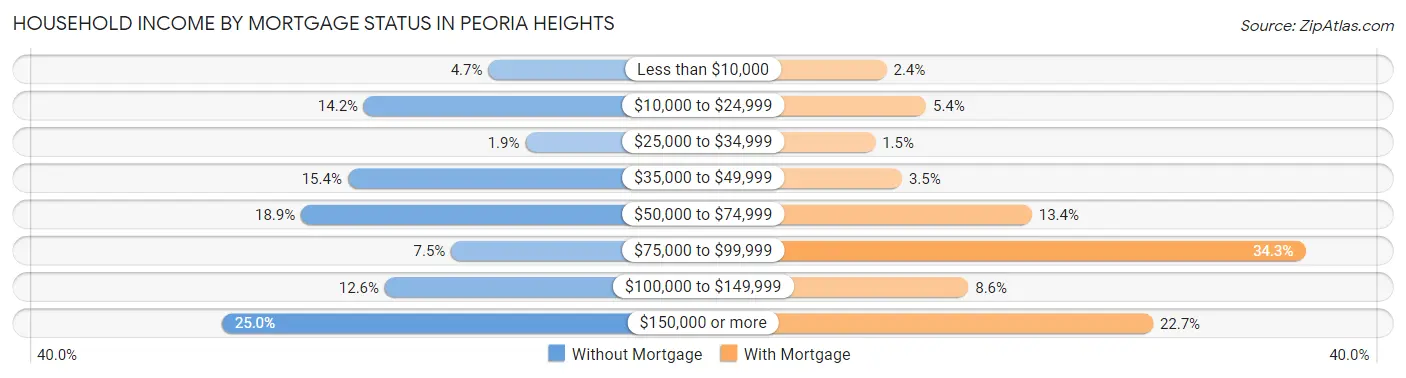
| Household Income | Without Mortgage | With Mortgage |
| Less than $10,000 | 38 (4.7%) | 22 (2.4%) |
| $10,000 to $24,999 | 115 (14.1%) | 50 (5.4%) |
| $25,000 to $34,999 | 15 (1.8%) | 14 (1.5%) |
| $35,000 to $49,999 | 125 (15.4%) | 33 (3.5%) |
| $50,000 to $74,999 | 154 (18.9%) | 125 (13.4%) |
| $75,000 to $99,999 | 61 (7.5%) | 319 (34.3%) |
| $100,000 to $149,999 | 102 (12.6%) | 80 (8.6%) |
| $150,000 or more | 203 (25.0%) | 211 (22.7%) |
| Total | 813 (100.0%) | 931 (100.0%) |
Property Value to Household Income Ratio in Peoria Heights
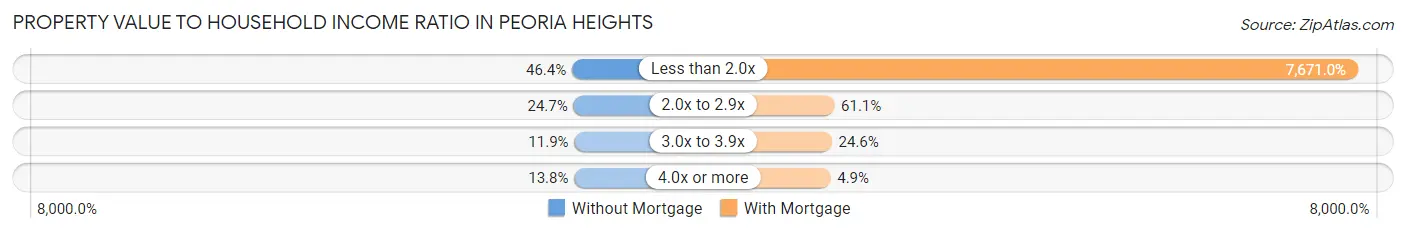
| Value-to-Income Ratio | Without Mortgage | With Mortgage |
| Less than 2.0x | 377 (46.4%) | 71,417 (7,671.0%) |
| 2.0x to 2.9x | 201 (24.7%) | 569 (61.1%) |
| 3.0x to 3.9x | 97 (11.9%) | 229 (24.6%) |
| 4.0x or more | 112 (13.8%) | 46 (4.9%) |
| Total | 813 (100.0%) | 931 (100.0%) |
Real Estate Taxes by Mortgage Status in Peoria Heights
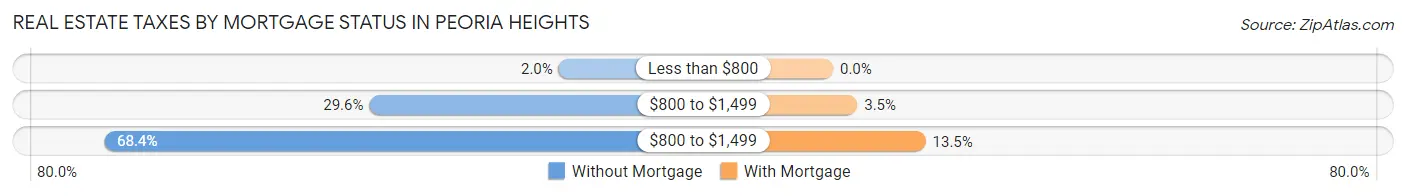
| Property Taxes | Without Mortgage | With Mortgage |
| Less than $800 | 16 (2.0%) | 0 (0.0%) |
| $800 to $1,499 | 241 (29.6%) | 33 (3.5%) |
| $800 to $1,499 | 556 (68.4%) | 126 (13.5%) |
| Total | 813 (100.0%) | 931 (100.0%) |
Health & Disability in Peoria Heights
Health Insurance Coverage by Age in Peoria Heights
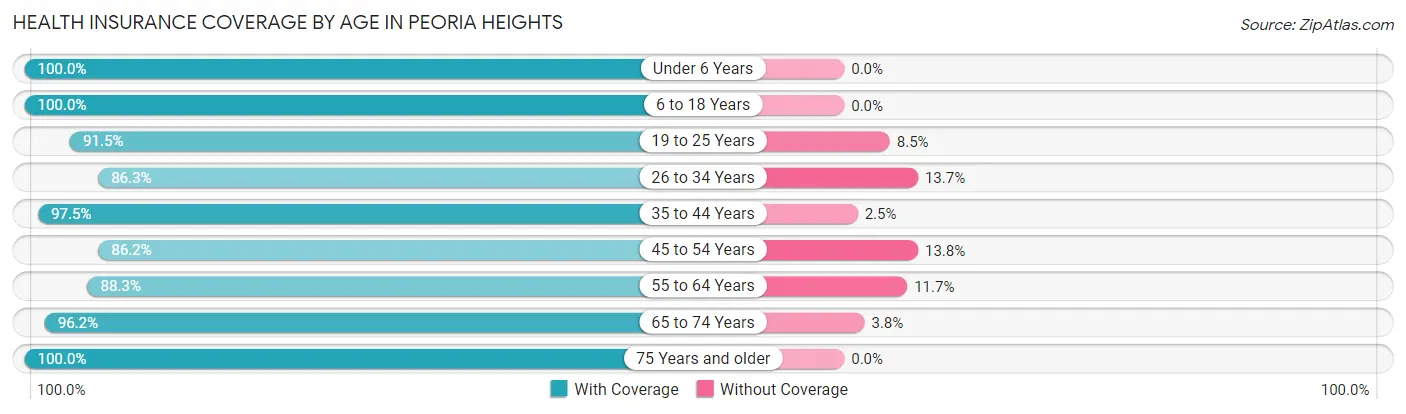
| Age Bracket | With Coverage | Without Coverage |
| Under 6 Years | 332 (100.0%) | 0 (0.0%) |
| 6 to 18 Years | 1,006 (100.0%) | 0 (0.0%) |
| 19 to 25 Years | 366 (91.5%) | 34 (8.5%) |
| 26 to 34 Years | 515 (86.3%) | 82 (13.7%) |
| 35 to 44 Years | 936 (97.5%) | 24 (2.5%) |
| 45 to 54 Years | 683 (86.2%) | 109 (13.8%) |
| 55 to 64 Years | 654 (88.3%) | 87 (11.7%) |
| 65 to 74 Years | 586 (96.2%) | 23 (3.8%) |
| 75 Years and older | 338 (100.0%) | 0 (0.0%) |
| Total | 5,416 (93.8%) | 359 (6.2%) |
Health Insurance Coverage by Citizenship Status in Peoria Heights
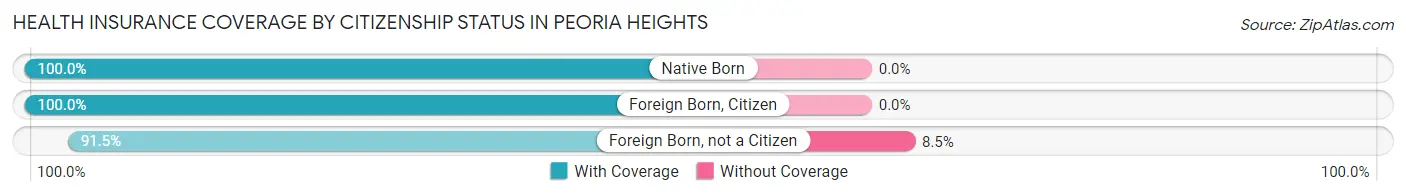
| Citizenship Status | With Coverage | Without Coverage |
| Native Born | 332 (100.0%) | 0 (0.0%) |
| Foreign Born, Citizen | 1,006 (100.0%) | 0 (0.0%) |
| Foreign Born, not a Citizen | 366 (91.5%) | 34 (8.5%) |
Health Insurance Coverage by Household Income in Peoria Heights
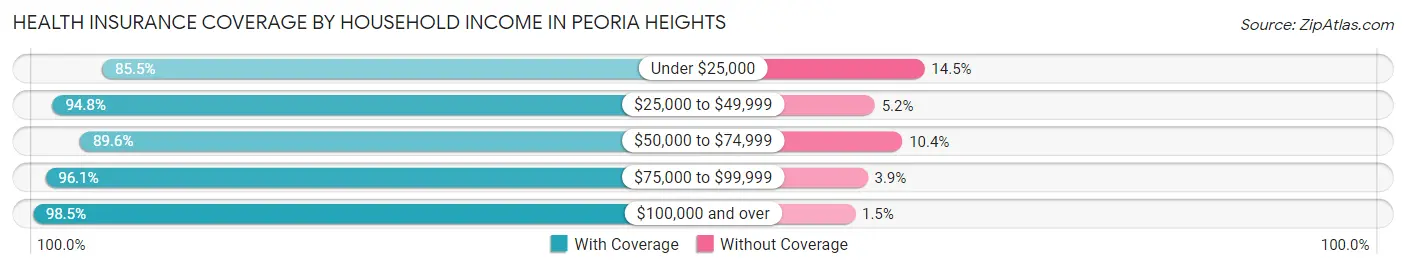
| Household Income | With Coverage | Without Coverage |
| Under $25,000 | 523 (85.5%) | 89 (14.5%) |
| $25,000 to $49,999 | 1,124 (94.8%) | 62 (5.2%) |
| $50,000 to $74,999 | 1,399 (89.6%) | 162 (10.4%) |
| $75,000 to $99,999 | 372 (96.1%) | 15 (3.9%) |
| $100,000 and over | 1,988 (98.5%) | 31 (1.5%) |
Public vs Private Health Insurance Coverage by Age in Peoria Heights
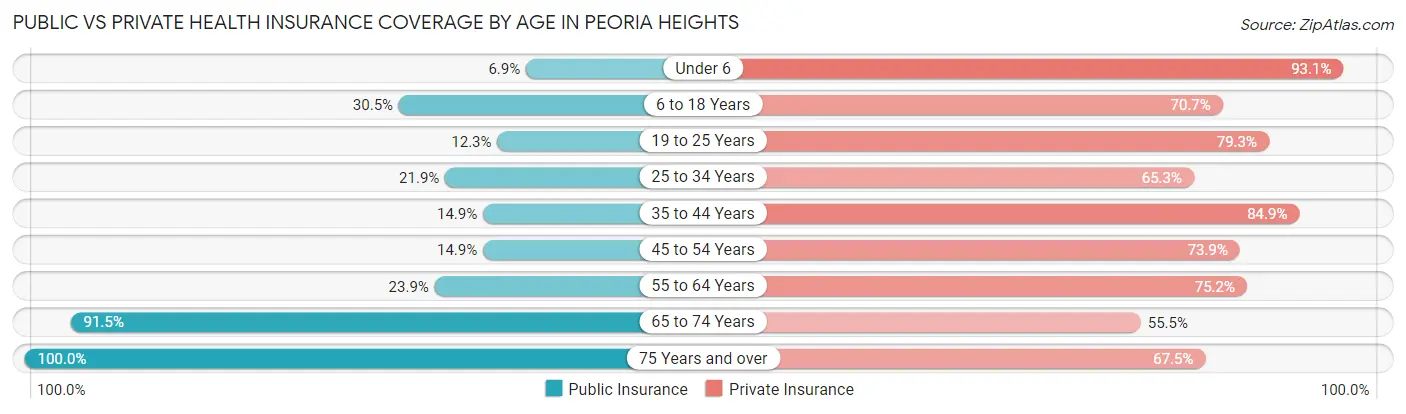
| Age Bracket | Public Insurance | Private Insurance |
| Under 6 | 23 (6.9%) | 309 (93.1%) |
| 6 to 18 Years | 307 (30.5%) | 711 (70.7%) |
| 19 to 25 Years | 49 (12.2%) | 317 (79.2%) |
| 25 to 34 Years | 131 (21.9%) | 390 (65.3%) |
| 35 to 44 Years | 143 (14.9%) | 815 (84.9%) |
| 45 to 54 Years | 118 (14.9%) | 585 (73.9%) |
| 55 to 64 Years | 177 (23.9%) | 557 (75.2%) |
| 65 to 74 Years | 557 (91.5%) | 338 (55.5%) |
| 75 Years and over | 338 (100.0%) | 228 (67.5%) |
| Total | 1,843 (31.9%) | 4,250 (73.6%) |
Disability Status by Sex by Age in Peoria Heights
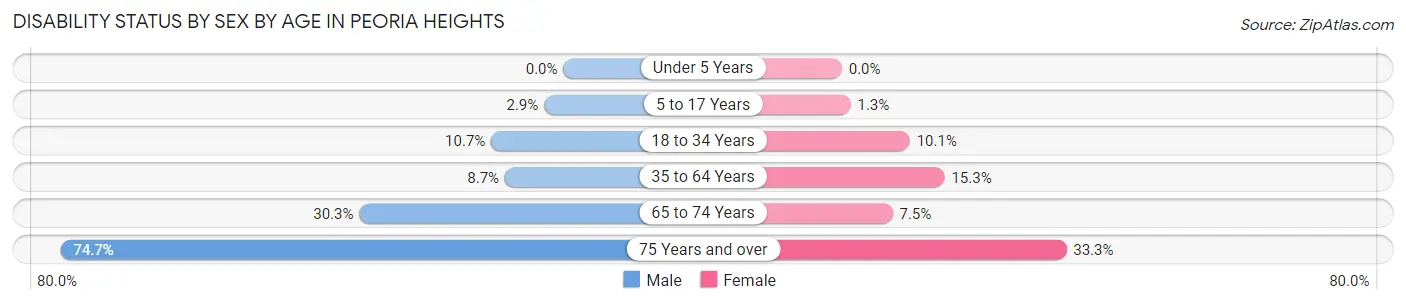
| Age Bracket | Male | Female |
| Under 5 Years | 0 (0.0%) | 0 (0.0%) |
| 5 to 17 Years | 12 (2.9%) | 7 (1.3%) |
| 18 to 34 Years | 55 (10.7%) | 56 (10.1%) |
| 35 to 64 Years | 111 (8.7%) | 185 (15.2%) |
| 65 to 74 Years | 100 (30.3%) | 21 (7.5%) |
| 75 Years and over | 118 (74.7%) | 60 (33.3%) |
Disability Class by Sex by Age in Peoria Heights
Disability Class: Hearing Difficulty
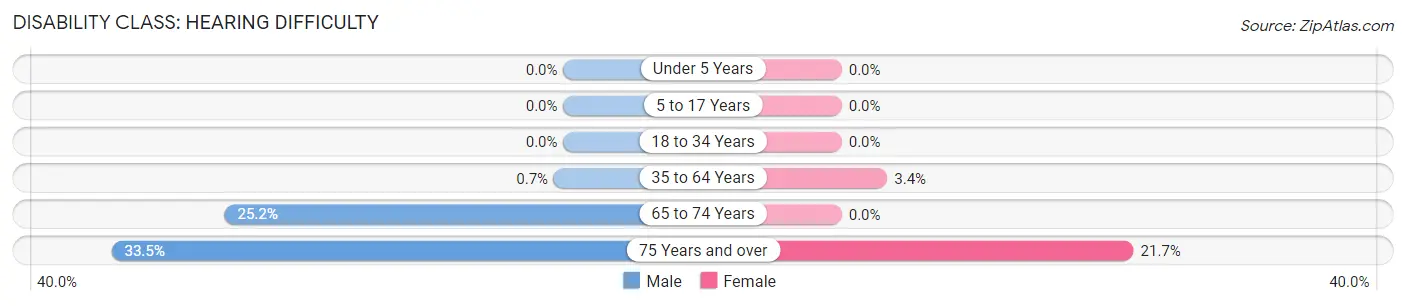
| Age Bracket | Male | Female |
| Under 5 Years | 0 (0.0%) | 0 (0.0%) |
| 5 to 17 Years | 0 (0.0%) | 0 (0.0%) |
| 18 to 34 Years | 0 (0.0%) | 0 (0.0%) |
| 35 to 64 Years | 9 (0.7%) | 41 (3.4%) |
| 65 to 74 Years | 83 (25.2%) | 0 (0.0%) |
| 75 Years and over | 53 (33.5%) | 39 (21.7%) |
Disability Class: Vision Difficulty
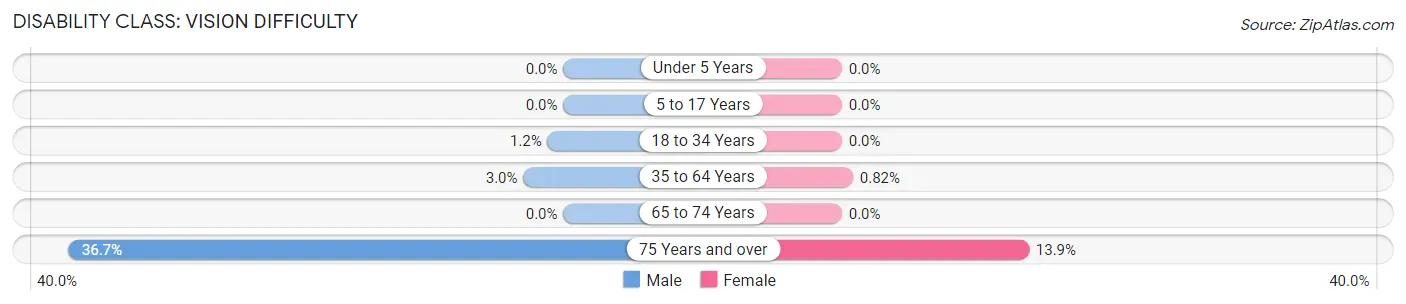
| Age Bracket | Male | Female |
| Under 5 Years | 0 (0.0%) | 0 (0.0%) |
| 5 to 17 Years | 0 (0.0%) | 0 (0.0%) |
| 18 to 34 Years | 6 (1.2%) | 0 (0.0%) |
| 35 to 64 Years | 38 (3.0%) | 10 (0.8%) |
| 65 to 74 Years | 0 (0.0%) | 0 (0.0%) |
| 75 Years and over | 58 (36.7%) | 25 (13.9%) |
Disability Class: Cognitive Difficulty
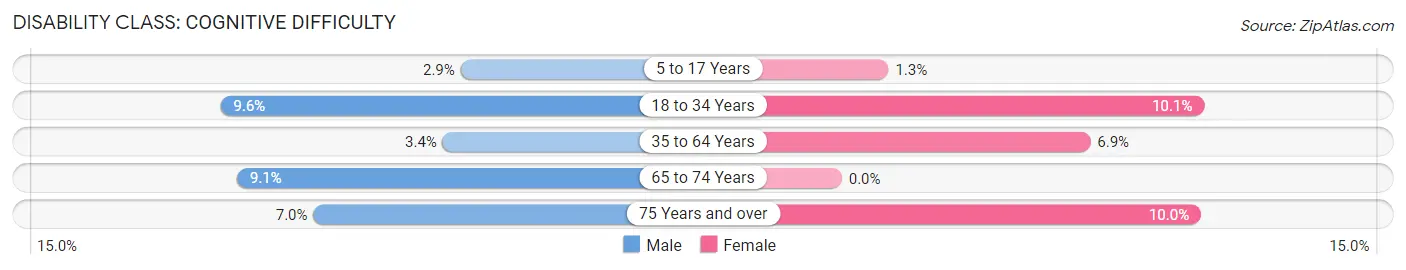
| Age Bracket | Male | Female |
| 5 to 17 Years | 12 (2.9%) | 7 (1.3%) |
| 18 to 34 Years | 49 (9.6%) | 56 (10.1%) |
| 35 to 64 Years | 43 (3.4%) | 84 (6.9%) |
| 65 to 74 Years | 30 (9.1%) | 0 (0.0%) |
| 75 Years and over | 11 (7.0%) | 18 (10.0%) |
Disability Class: Ambulatory Difficulty
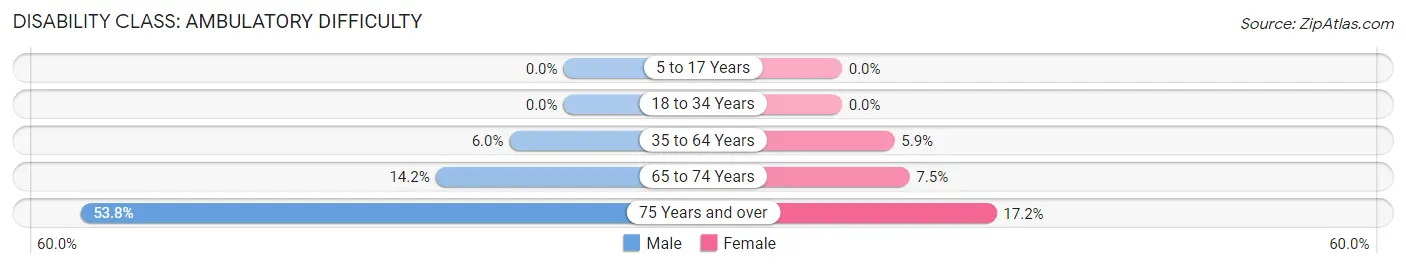
| Age Bracket | Male | Female |
| 5 to 17 Years | 0 (0.0%) | 0 (0.0%) |
| 18 to 34 Years | 0 (0.0%) | 0 (0.0%) |
| 35 to 64 Years | 77 (6.0%) | 71 (5.9%) |
| 65 to 74 Years | 47 (14.2%) | 21 (7.5%) |
| 75 Years and over | 85 (53.8%) | 31 (17.2%) |
Disability Class: Self-Care Difficulty
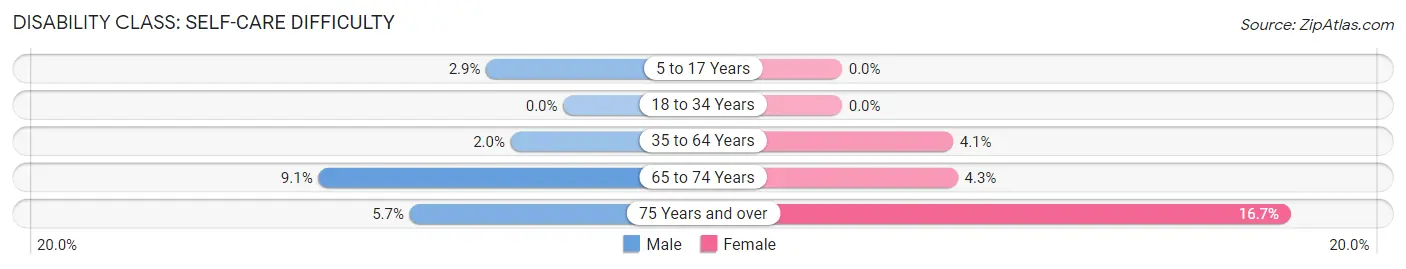
| Age Bracket | Male | Female |
| 5 to 17 Years | 12 (2.9%) | 0 (0.0%) |
| 18 to 34 Years | 0 (0.0%) | 0 (0.0%) |
| 35 to 64 Years | 25 (1.9%) | 50 (4.1%) |
| 65 to 74 Years | 30 (9.1%) | 12 (4.3%) |
| 75 Years and over | 9 (5.7%) | 30 (16.7%) |
Technology Access in Peoria Heights
Computing Device Access in Peoria Heights
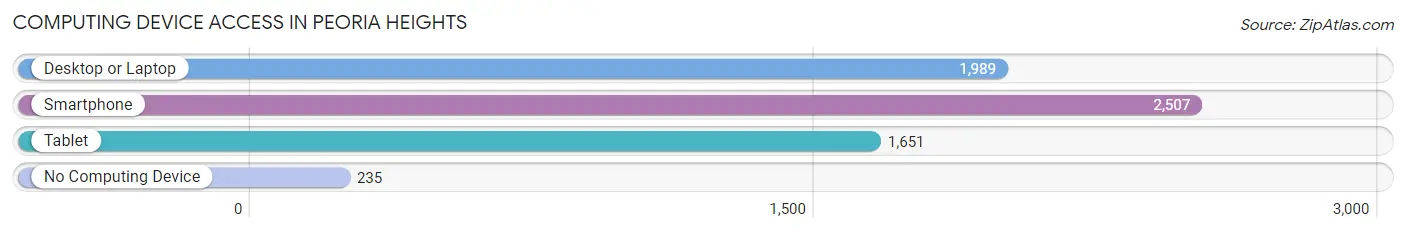
| Device Type | # Households | % Households |
| Desktop or Laptop | 1,989 | 71.2% |
| Smartphone | 2,507 | 89.7% |
| Tablet | 1,651 | 59.1% |
| No Computing Device | 235 | 8.4% |
| Total | 2,794 | 100.0% |
Internet Access in Peoria Heights
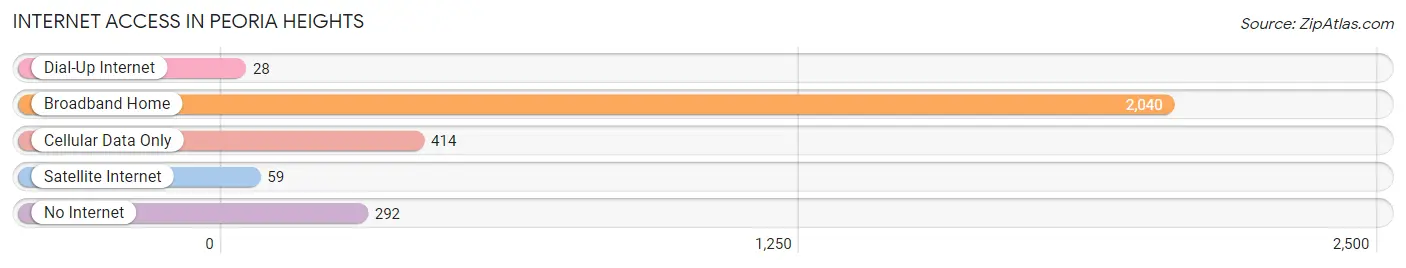
| Internet Type | # Households | % Households |
| Dial-Up Internet | 28 | 1.0% |
| Broadband Home | 2,040 | 73.0% |
| Cellular Data Only | 414 | 14.8% |
| Satellite Internet | 59 | 2.1% |
| No Internet | 292 | 10.4% |
| Total | 2,794 | 100.0% |
Peoria Heights Summary
Peoria Heights is a village located in Peoria County, Illinois, United States. The population was 6,156 at the 2010 census. It is part of the Peoria, Illinois Metropolitan Statistical Area.
History
Peoria Heights was founded in 1868 by a group of settlers from Peoria, Illinois. The village was originally known as Prospect Hill, but the name was changed to Peoria Heights in 1872. The village was incorporated in 1895.
The village was home to the first roller coaster in the United States, the Gravity Pleasure Switchback Railway, which opened in 1884. The coaster was located on Prospect Hill, which is now the site of the Prospect Park neighborhood.
Geography
Peoria Heights is located at 40°41'17" North, 89°37'45" West (40.6879, -89.6292). According to the 2010 census, the village has a total area of 2.2 square miles (5.7 km2), all land.
Economy
The economy of Peoria Heights is largely based on retail and services. The village is home to several restaurants, shops, and other businesses. The village is also home to the Peoria Heights Shopping Center, which is anchored by a Walmart Supercenter.
Demographics
As of the census of 2010, there were 6,156 people, 2,541 households, and 1,637 families residing in the village. The population density was 2,811.8 people per square mile (1,087.7/km2). There were 2,717 housing units at an average density of 1,232.3 per square mile (475.3/km2). The racial makeup of the village was 95.2% White, 0.9% African American, 0.2% Native American, 0.9% Asian, 0.1% Pacific Islander, 1.2% from other races, and 1.5% from two or more races. Hispanic or Latino of any race were 3.2% of the population.
There were 2,541 households, out of which 28.2% had children under the age of 18 living with them, 48.2% were married couples living together, 11.3% had a female householder with no husband present, and 36.3% were non-families. 30.7% of all households were made up of individuals, and 11.7% had someone living alone who was 65 years of age or older. The average household size was 2.39 and the average family size was 2.97.
In the village, the population was spread out, with 23.2% under the age of 18, 7.7% from 18 to 24, 28.2% from 25 to 44, 25.2% from 45 to 64, and 15.7% who were 65 years of age or older. The median age was 39 years. For every 100 females, there were 92.2 males. For every 100 females age 18 and over, there were 88.7 males.
The median income for a household in the village was $45,938, and the median income for a family was $54,917. Males had a median income of $41,944 versus $27,917 for females. The per capita income for the village was $23,945. About 4.2% of families and 6.2% of the population were below the poverty line, including 8.2% of those under age 18 and 4.2% of those age 65 or over.
Common Questions
What is Per Capita Income in Peoria Heights?
Per Capita income in Peoria Heights is $41,851.
What is the Median Family Income in Peoria Heights?
Median Family Income in Peoria Heights is $64,916.
What is the Median Household income in Peoria Heights?
Median Household Income in Peoria Heights is $59,286.
What is Income or Wage Gap in Peoria Heights?
Income or Wage Gap in Peoria Heights is 25.5%.
Women in Peoria Heights earn 74.5 cents for every dollar earned by a man.
What is Inequality or Gini Index in Peoria Heights?
Inequality or Gini Index in Peoria Heights is 0.50.
What is the Total Population of Peoria Heights?
Total Population of Peoria Heights is 5,890.
What is the Total Male Population of Peoria Heights?
Total Male Population of Peoria Heights is 2,848.
What is the Total Female Population of Peoria Heights?
Total Female Population of Peoria Heights is 3,042.
What is the Ratio of Males per 100 Females in Peoria Heights?
There are 93.62 Males per 100 Females in Peoria Heights.
What is the Ratio of Females per 100 Males in Peoria Heights?
There are 106.81 Females per 100 Males in Peoria Heights.
What is the Median Population Age in Peoria Heights?
Median Population Age in Peoria Heights is 39.7 Years.
What is the Average Family Size in Peoria Heights
Average Family Size in Peoria Heights is 3.0 People.
What is the Average Household Size in Peoria Heights
Average Household Size in Peoria Heights is 2.1 People.
How Large is the Labor Force in Peoria Heights?
There are 3,270 People in the Labor Forcein in Peoria Heights.
What is the Percentage of People in the Labor Force in Peoria Heights?
68.9% of People are in the Labor Force in Peoria Heights.
What is the Unemployment Rate in Peoria Heights?
Unemployment Rate in Peoria Heights is 5.3%.