Bourbonnais, IL Map & Demographics
Bourbonnais Map
Bourbonnais Overview
$32,326
PER CAPITA INCOME
$98,290
AVG FAMILY INCOME
$77,738
AVG HOUSEHOLD INCOME
43.4%
WAGE / INCOME GAP [ % ]
56.6¢/ $1
WAGE / INCOME GAP [ $ ]
0.40
INEQUALITY / GINI INDEX
18,125
TOTAL POPULATION
8,802
MALE POPULATION
9,323
FEMALE POPULATION
94.41
MALES / 100 FEMALES
105.92
FEMALES / 100 MALES
33.9
MEDIAN AGE
3.2
AVG FAMILY SIZE
2.7
AVG HOUSEHOLD SIZE
9,160
LABOR FORCE [ PEOPLE ]
61.6%
PERCENT IN LABOR FORCE
5.4%
UNEMPLOYMENT RATE
Bourbonnais Zip Codes
Bourbonnais Area Codes
Income in Bourbonnais
Income Overview in Bourbonnais
Per Capita Income in Bourbonnais is $32,326, while median incomes of families and households are $98,290 and $77,738 respectively.
| Characteristic | Number | Measure |
| Per Capita Income | 18,125 | $32,326 |
| Median Family Income | 4,055 | $98,290 |
| Mean Family Income | 4,055 | $109,622 |
| Median Household Income | 5,834 | $77,738 |
| Mean Household Income | 5,834 | $96,428 |
| Income Deficit | 4,055 | $0 |
| Wage / Income Gap (%) | 18,125 | 43.43% |
| Wage / Income Gap ($) | 18,125 | 56.57¢ per $1 |
| Gini / Inequality Index | 18,125 | 0.40 |
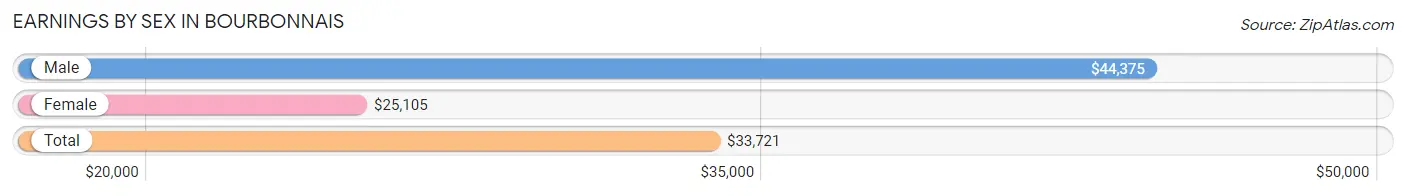
Earnings by Sex in Bourbonnais
Average Earnings in Bourbonnais are $33,721, $44,375 for men and $25,105 for women, a difference of 43.4%.
| Sex | Number | Average Earnings |
| Male | 4,936 (48.5%) | $44,375 |
| Female | 5,237 (51.5%) | $25,105 |
| Total | 10,173 (100.0%) | $33,721 |
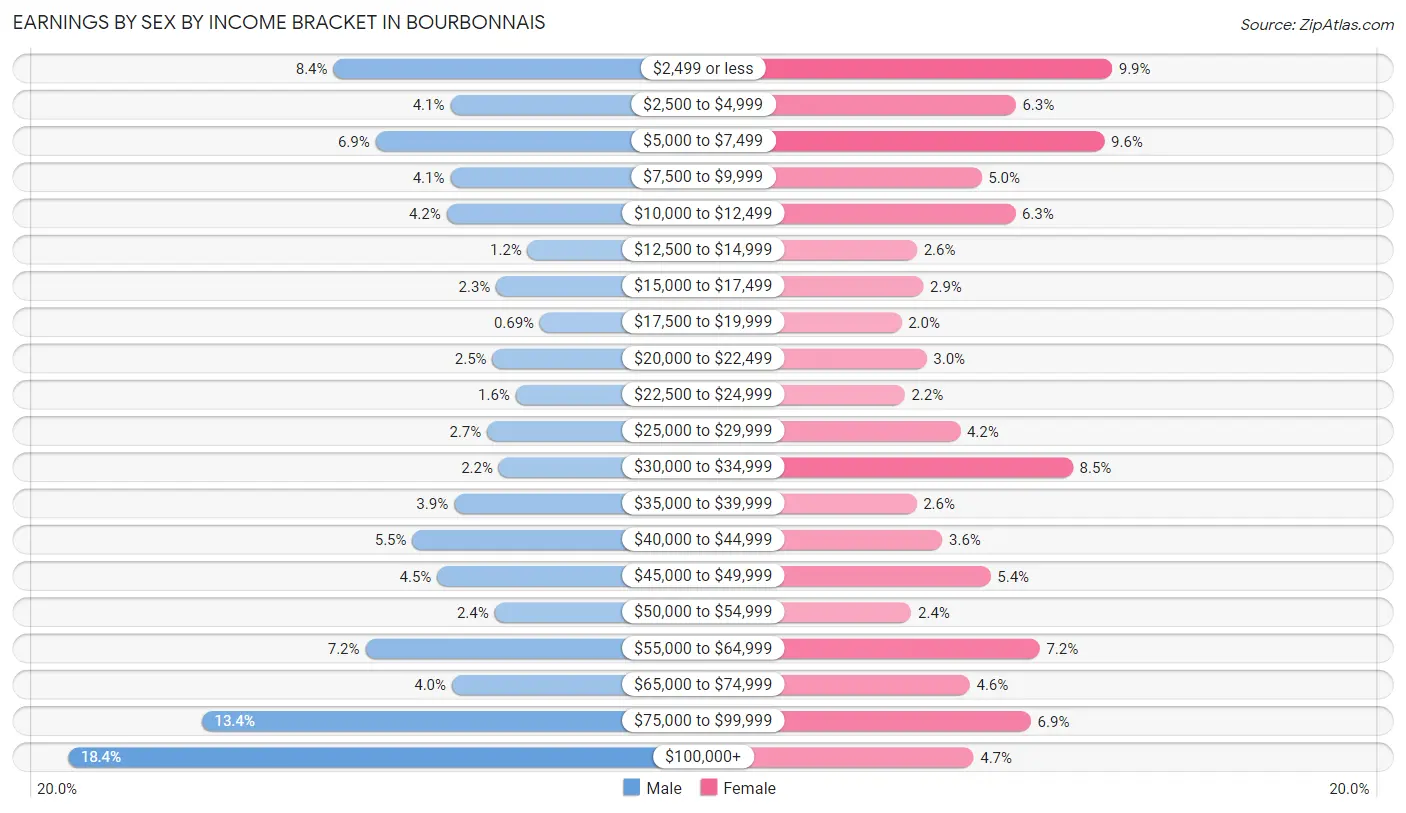
Earnings by Sex by Income Bracket in Bourbonnais
The most common earnings brackets in Bourbonnais are $100,000+ for men (907 | 18.4%) and $2,499 or less for women (520 | 9.9%).
| Income | Male | Female |
| $2,499 or less | 416 (8.4%) | 520 (9.9%) |
| $2,500 to $4,999 | 200 (4.1%) | 331 (6.3%) |
| $5,000 to $7,499 | 338 (6.9%) | 505 (9.6%) |
| $7,500 to $9,999 | 200 (4.1%) | 264 (5.0%) |
| $10,000 to $12,499 | 207 (4.2%) | 330 (6.3%) |
| $12,500 to $14,999 | 57 (1.1%) | 137 (2.6%) |
| $15,000 to $17,499 | 115 (2.3%) | 150 (2.9%) |
| $17,500 to $19,999 | 34 (0.7%) | 107 (2.0%) |
| $20,000 to $22,499 | 122 (2.5%) | 156 (3.0%) |
| $22,500 to $24,999 | 79 (1.6%) | 113 (2.2%) |
| $25,000 to $29,999 | 132 (2.7%) | 222 (4.2%) |
| $30,000 to $34,999 | 110 (2.2%) | 443 (8.5%) |
| $35,000 to $39,999 | 193 (3.9%) | 136 (2.6%) |
| $40,000 to $44,999 | 270 (5.5%) | 187 (3.6%) |
| $45,000 to $49,999 | 224 (4.5%) | 282 (5.4%) |
| $50,000 to $54,999 | 118 (2.4%) | 126 (2.4%) |
| $55,000 to $64,999 | 357 (7.2%) | 378 (7.2%) |
| $65,000 to $74,999 | 197 (4.0%) | 241 (4.6%) |
| $75,000 to $99,999 | 660 (13.4%) | 361 (6.9%) |
| $100,000+ | 907 (18.4%) | 248 (4.7%) |
| Total | 4,936 (100.0%) | 5,237 (100.0%) |
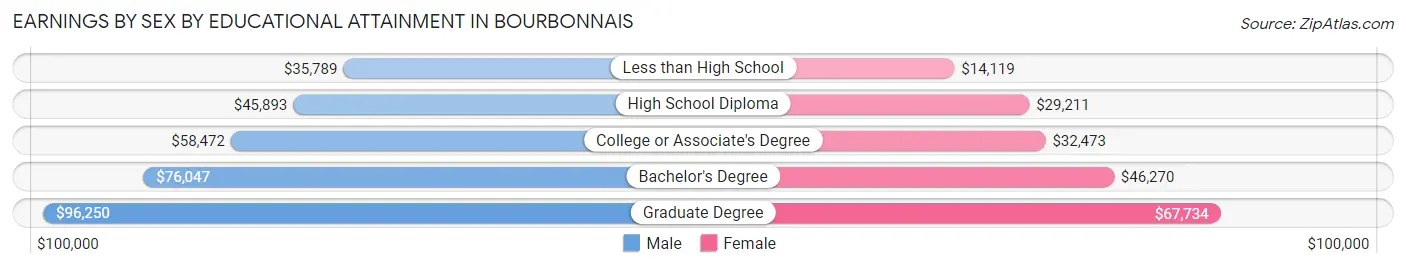
Earnings by Sex by Educational Attainment in Bourbonnais
Average earnings in Bourbonnais are $61,465 for men and $41,014 for women, a difference of 33.3%. Men with an educational attainment of graduate degree enjoy the highest average annual earnings of $96,250, while those with less than high school education earn the least with $35,789. Women with an educational attainment of graduate degree earn the most with the average annual earnings of $67,734, while those with less than high school education have the smallest earnings of $14,119.
| Educational Attainment | Male Income | Female Income |
| Less than High School | $35,789 | $14,119 |
| High School Diploma | $45,893 | $29,211 |
| College or Associate's Degree | $58,472 | $32,473 |
| Bachelor's Degree | $76,047 | $46,270 |
| Graduate Degree | $96,250 | $67,734 |
| Total | $61,465 | $41,014 |
Family Income in Bourbonnais
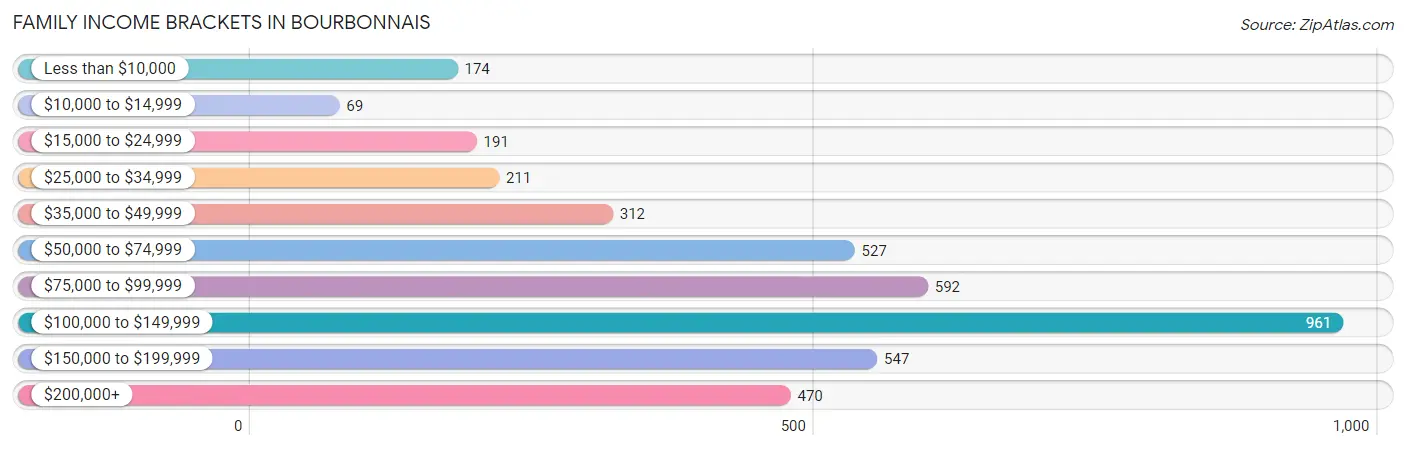
Family Income Brackets in Bourbonnais
According to the Bourbonnais family income data, there are 961 families falling into the $100,000 to $149,999 income range, which is the most common income bracket and makes up 23.7% of all families. Conversely, the $10,000 to $14,999 income bracket is the least frequent group with only 69 families (1.7%) belonging to this category.
| Income Bracket | # Families | % Families |
| Less than $10,000 | 174 | 4.3% |
| $10,000 to $14,999 | 69 | 1.7% |
| $15,000 to $24,999 | 191 | 4.7% |
| $25,000 to $34,999 | 211 | 5.2% |
| $35,000 to $49,999 | 312 | 7.7% |
| $50,000 to $74,999 | 527 | 13.0% |
| $75,000 to $99,999 | 592 | 14.6% |
| $100,000 to $149,999 | 961 | 23.7% |
| $150,000 to $199,999 | 547 | 13.5% |
| $200,000+ | 470 | 11.6% |
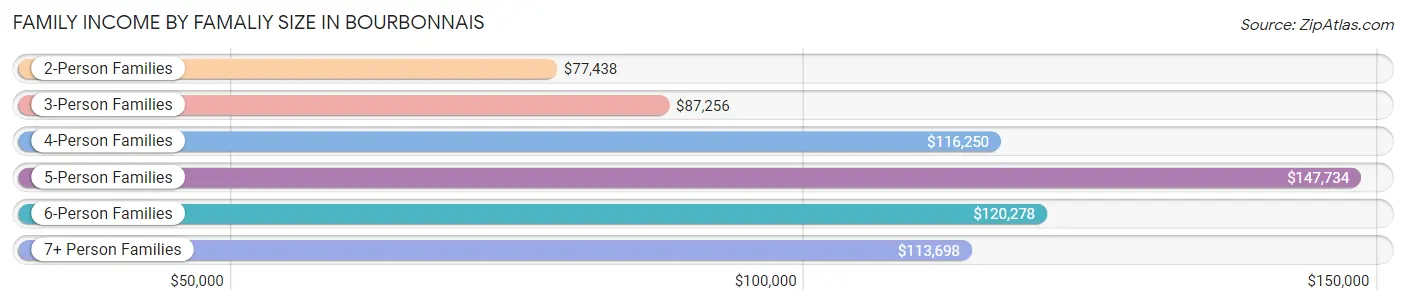
Family Income by Famaliy Size in Bourbonnais
5-person families (251 | 6.2%) account for the highest median family income in Bourbonnais with $147,734 per family, while 2-person families (1,650 | 40.7%) have the highest median income of $38,719 per family member.
| Income Bracket | # Families | Median Income |
| 2-Person Families | 1,650 (40.7%) | $77,438 |
| 3-Person Families | 1,064 (26.2%) | $87,256 |
| 4-Person Families | 867 (21.4%) | $116,250 |
| 5-Person Families | 251 (6.2%) | $147,734 |
| 6-Person Families | 180 (4.4%) | $120,278 |
| 7+ Person Families | 43 (1.1%) | $113,698 |
| Total | 4,055 (100.0%) | $98,290 |
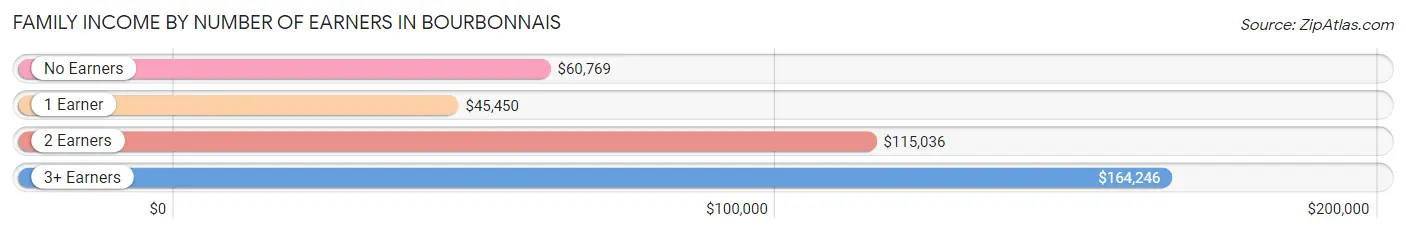
Family Income by Number of Earners in Bourbonnais
The median family income in Bourbonnais is $98,290, with families comprising 3+ earners (662) having the highest median family income of $164,246, while families with 1 earner (1,206) have the lowest median family income of $45,450, accounting for 16.3% and 29.7% of families, respectively.
| Number of Earners | # Families | Median Income |
| No Earners | 542 (13.4%) | $60,769 |
| 1 Earner | 1,206 (29.7%) | $45,450 |
| 2 Earners | 1,645 (40.6%) | $115,036 |
| 3+ Earners | 662 (16.3%) | $164,246 |
| Total | 4,055 (100.0%) | $98,290 |
Household Income in Bourbonnais
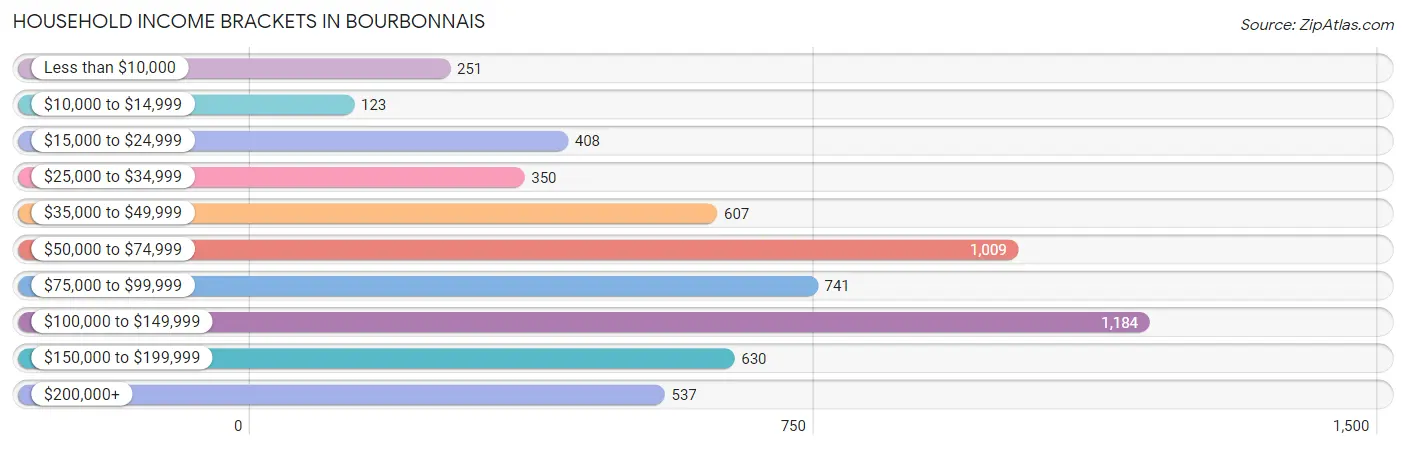
Household Income Brackets in Bourbonnais
With 1,184 households falling in the category, the $100,000 to $149,999 income range is the most frequent in Bourbonnais, accounting for 20.3% of all households. In contrast, only 123 households (2.1%) fall into the $10,000 to $14,999 income bracket, making it the least populous group.
| Income Bracket | # Households | % Households |
| Less than $10,000 | 251 | 4.3% |
| $10,000 to $14,999 | 123 | 2.1% |
| $15,000 to $24,999 | 408 | 7.0% |
| $25,000 to $34,999 | 350 | 6.0% |
| $35,000 to $49,999 | 607 | 10.4% |
| $50,000 to $74,999 | 1,009 | 17.3% |
| $75,000 to $99,999 | 741 | 12.7% |
| $100,000 to $149,999 | 1,184 | 20.3% |
| $150,000 to $199,999 | 630 | 10.8% |
| $200,000+ | 537 | 9.2% |
Household Income by Householder Age in Bourbonnais
The median household income in Bourbonnais is $77,738, with the highest median household income of $104,142 found in the 45 to 64 years age bracket for the primary householder. A total of 2,288 households (39.2%) fall into this category. Meanwhile, the 15 to 24 years age bracket for the primary householder has the lowest median household income of $28,313, with 112 households (1.9%) in this group.
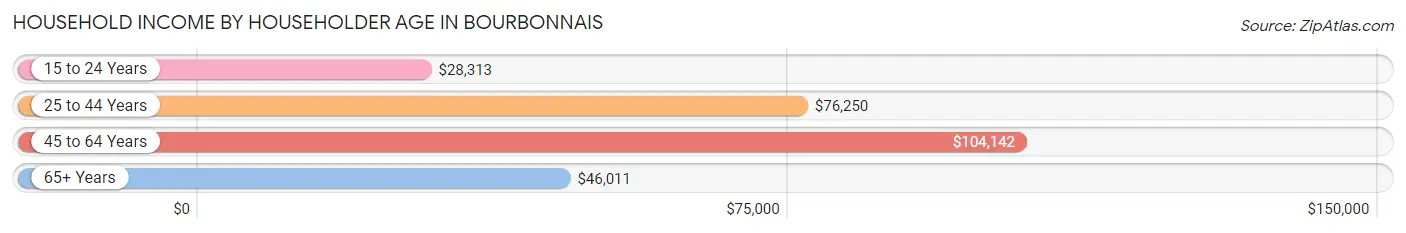
| Income Bracket | # Households | Median Income |
| 15 to 24 Years | 112 (1.9%) | $28,313 |
| 25 to 44 Years | 2,004 (34.4%) | $76,250 |
| 45 to 64 Years | 2,288 (39.2%) | $104,142 |
| 65+ Years | 1,430 (24.5%) | $46,011 |
| Total | 5,834 (100.0%) | $77,738 |
Poverty in Bourbonnais
Income Below Poverty by Sex and Age in Bourbonnais
With 9.8% poverty level for males and 12.7% for females among the residents of Bourbonnais, under 5 year old males and under 5 year old females are the most vulnerable to poverty, with 199 males (44.8%) and 95 females (23.2%) in their respective age groups living below the poverty level.
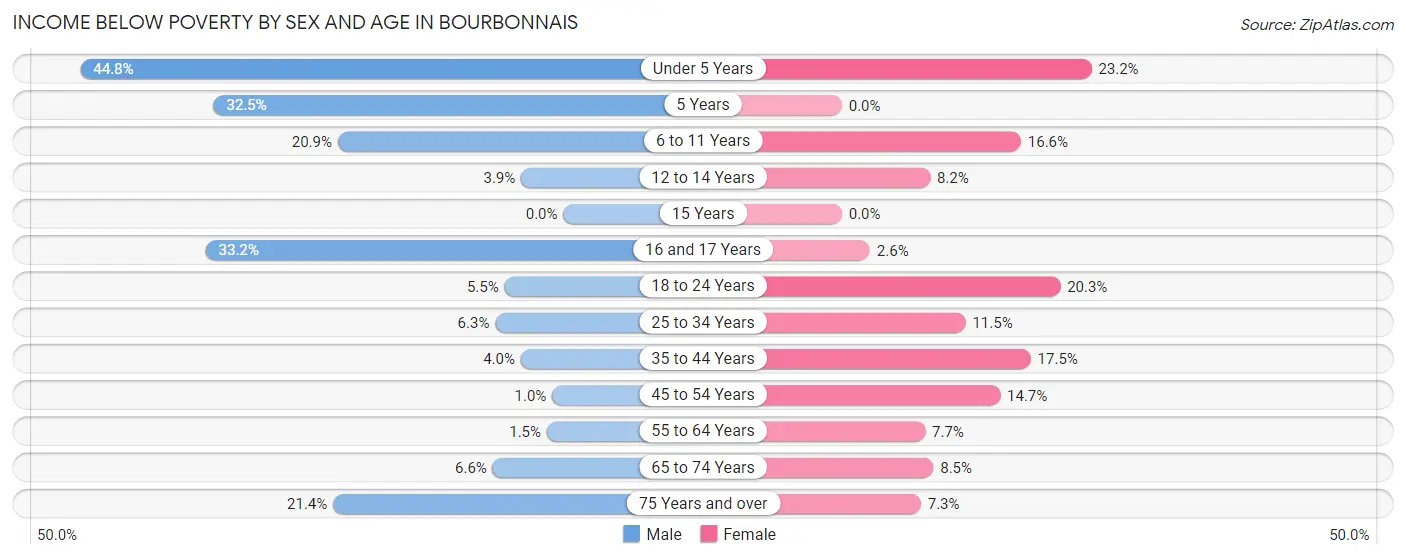
| Age Bracket | Male | Female |
| Under 5 Years | 199 (44.8%) | 95 (23.2%) |
| 5 Years | 38 (32.5%) | 0 (0.0%) |
| 6 to 11 Years | 122 (20.9%) | 113 (16.6%) |
| 12 to 14 Years | 22 (3.9%) | 18 (8.2%) |
| 15 Years | 0 (0.0%) | 0 (0.0%) |
| 16 and 17 Years | 86 (33.2%) | 9 (2.6%) |
| 18 to 24 Years | 39 (5.5%) | 148 (20.3%) |
| 25 to 34 Years | 58 (6.3%) | 117 (11.5%) |
| 35 to 44 Years | 41 (4.0%) | 176 (17.5%) |
| 45 to 54 Years | 10 (1.0%) | 152 (14.7%) |
| 55 to 64 Years | 13 (1.5%) | 85 (7.7%) |
| 65 to 74 Years | 59 (6.6%) | 57 (8.5%) |
| 75 Years and over | 78 (21.4%) | 44 (7.3%) |
| Total | 765 (9.8%) | 1,014 (12.7%) |
Income Above Poverty by Sex and Age in Bourbonnais
According to the poverty statistics in Bourbonnais, males aged 15 years and females aged 5 years are the age groups that are most secure financially, with 100.0% of males and 100.0% of females in these age groups living above the poverty line.
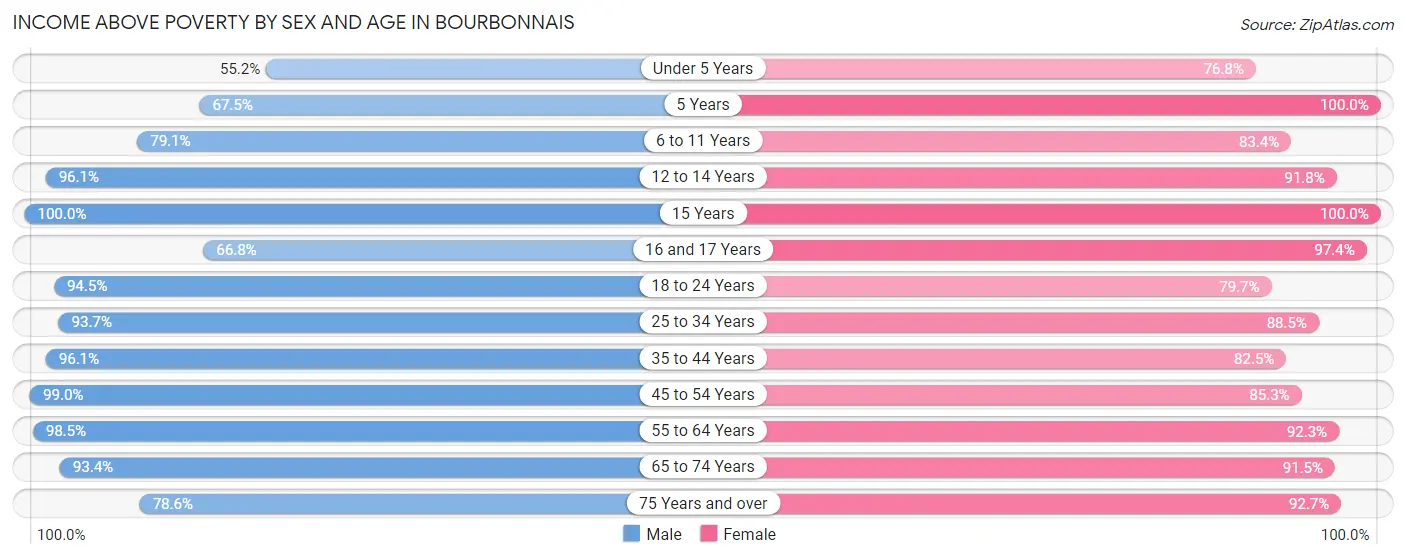
| Age Bracket | Male | Female |
| Under 5 Years | 245 (55.2%) | 315 (76.8%) |
| 5 Years | 79 (67.5%) | 27 (100.0%) |
| 6 to 11 Years | 461 (79.1%) | 567 (83.4%) |
| 12 to 14 Years | 539 (96.1%) | 202 (91.8%) |
| 15 Years | 83 (100.0%) | 118 (100.0%) |
| 16 and 17 Years | 173 (66.8%) | 336 (97.4%) |
| 18 to 24 Years | 675 (94.5%) | 582 (79.7%) |
| 25 to 34 Years | 860 (93.7%) | 902 (88.5%) |
| 35 to 44 Years | 996 (96.1%) | 828 (82.5%) |
| 45 to 54 Years | 950 (99.0%) | 883 (85.3%) |
| 55 to 64 Years | 834 (98.5%) | 1,015 (92.3%) |
| 65 to 74 Years | 841 (93.4%) | 614 (91.5%) |
| 75 Years and over | 287 (78.6%) | 556 (92.7%) |
| Total | 7,023 (90.2%) | 6,945 (87.3%) |
Income Below Poverty Among Married-Couple Families in Bourbonnais
The poverty statistics for married-couple families in Bourbonnais show that 4.7% or 142 of the total 3,012 families live below the poverty line. Families with 5 or more children have the highest poverty rate of 55.6%, comprising of 10 families. On the other hand, families with 1 or 2 children have the lowest poverty rate of 0.0%, which includes 0 families.
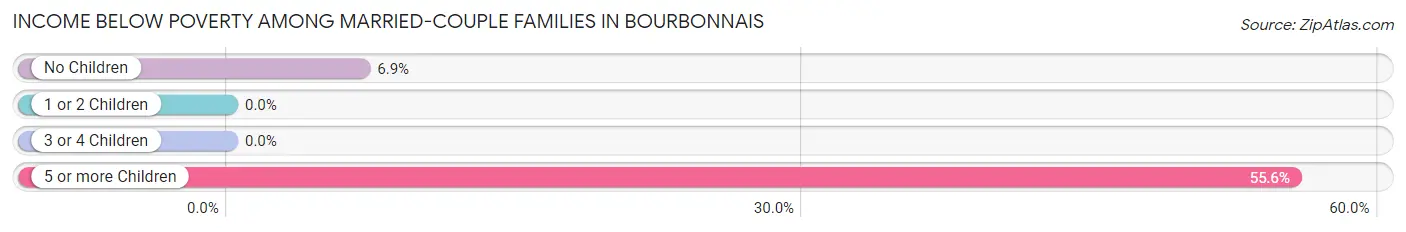
| Children | Above Poverty | Below Poverty |
| No Children | 1,778 (93.1%) | 132 (6.9%) |
| 1 or 2 Children | 803 (100.0%) | 0 (0.0%) |
| 3 or 4 Children | 281 (100.0%) | 0 (0.0%) |
| 5 or more Children | 8 (44.4%) | 10 (55.6%) |
| Total | 2,870 (95.3%) | 142 (4.7%) |
Income Below Poverty Among Single-Parent Households in Bourbonnais
According to the poverty data in Bourbonnais, 11.1% or 37 single-father households and 35.3% or 251 single-mother households are living below the poverty line. Among single-father households, those with 3 or 4 children have the highest poverty rate, with 29 households (49.1%) experiencing poverty. Likewise, among single-mother households, those with 1 or 2 children have the highest poverty rate, with 159 households (57.8%) falling below the poverty line.
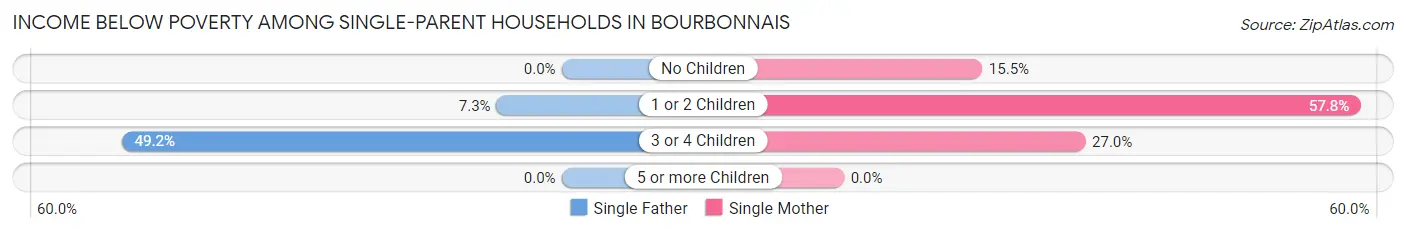
| Children | Single Father | Single Mother |
| No Children | 0 (0.0%) | 34 (15.4%) |
| 1 or 2 Children | 8 (7.3%) | 159 (57.8%) |
| 3 or 4 Children | 29 (49.1%) | 58 (27.0%) |
| 5 or more Children | 0 (0.0%) | 0 (0.0%) |
| Total | 37 (11.1%) | 251 (35.3%) |
Income Below Poverty Among Married-Couple vs Single-Parent Households in Bourbonnais
The poverty data for Bourbonnais shows that 142 of the married-couple family households (4.7%) and 288 of the single-parent households (27.6%) are living below the poverty level. Within the married-couple family households, those with 5 or more children have the highest poverty rate, with 10 households (55.6%) falling below the poverty line. Among the single-parent households, those with 1 or 2 children have the highest poverty rate, with 167 household (43.4%) living below poverty.
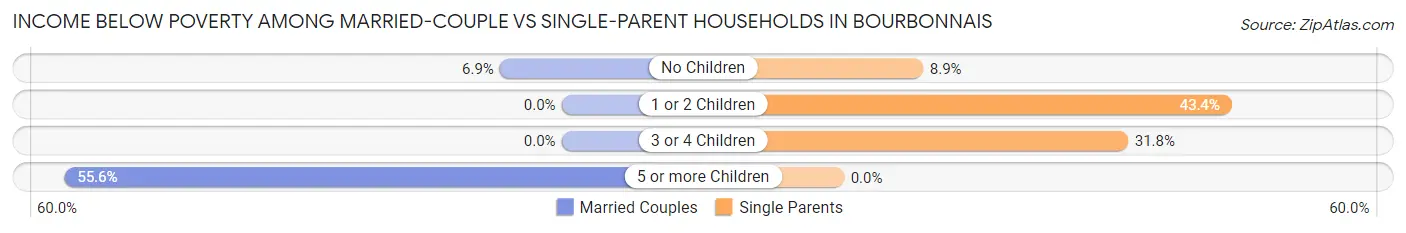
| Children | Married-Couple Families | Single-Parent Households |
| No Children | 132 (6.9%) | 34 (8.8%) |
| 1 or 2 Children | 0 (0.0%) | 167 (43.4%) |
| 3 or 4 Children | 0 (0.0%) | 87 (31.8%) |
| 5 or more Children | 10 (55.6%) | 0 (0.0%) |
| Total | 142 (4.7%) | 288 (27.6%) |
Race in Bourbonnais
The most populous races in Bourbonnais are White / Caucasian (14,226 | 78.5%), Black / African American (1,783 | 9.8%), and Hispanic or Latino (1,496 | 8.3%).
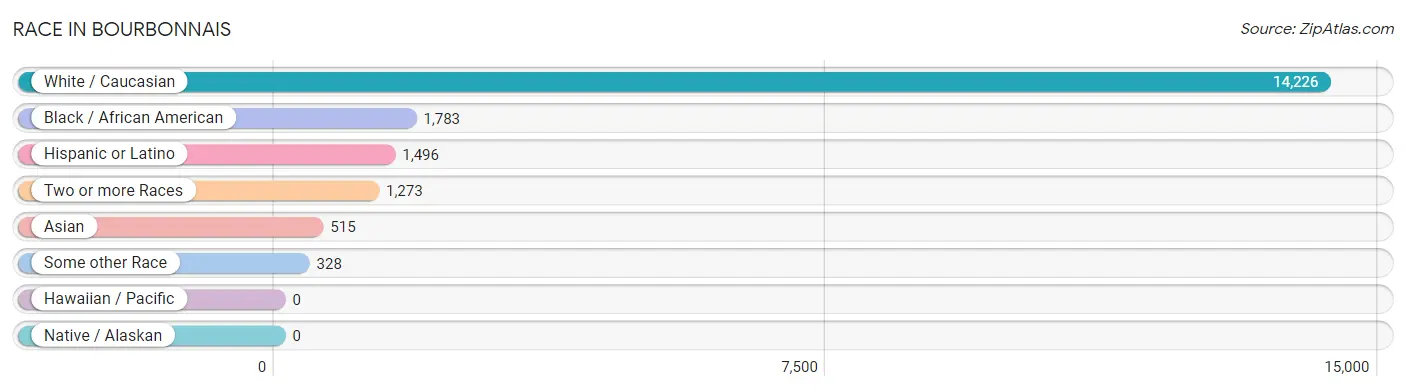
| Race | # Population | % Population |
| Asian | 515 | 2.8% |
| Black / African American | 1,783 | 9.8% |
| Hawaiian / Pacific | 0 | 0.0% |
| Hispanic or Latino | 1,496 | 8.3% |
| Native / Alaskan | 0 | 0.0% |
| White / Caucasian | 14,226 | 78.5% |
| Two or more Races | 1,273 | 7.0% |
| Some other Race | 328 | 1.8% |
| Total | 18,125 | 100.0% |
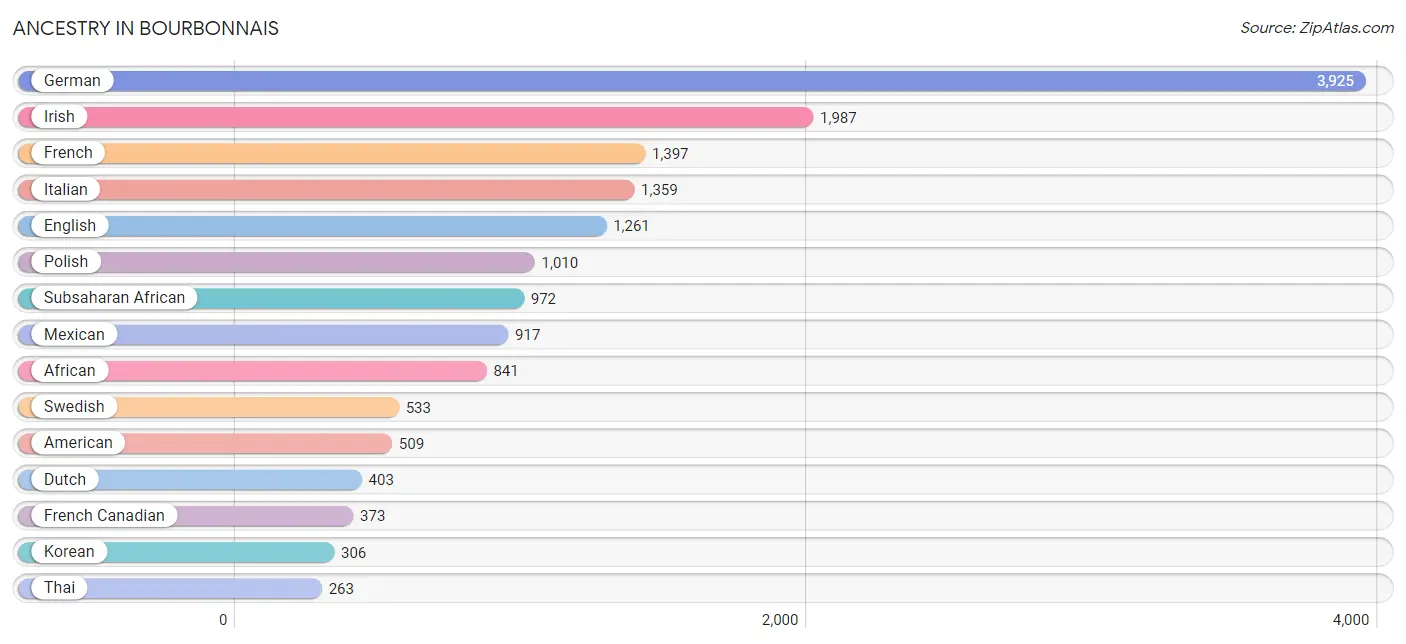
Ancestry in Bourbonnais
The most populous ancestries reported in Bourbonnais are German (3,925 | 21.7%), Irish (1,987 | 11.0%), French (1,397 | 7.7%), Italian (1,359 | 7.5%), and English (1,261 | 7.0%), together accounting for 54.8% of all Bourbonnais residents.
| Ancestry | # Population | % Population |
| African | 841 | 4.6% |
| American | 509 | 2.8% |
| Arab | 4 | 0.0% |
| Austrian | 107 | 0.6% |
| Bahamian | 12 | 0.1% |
| Bhutanese | 7 | 0.0% |
| British | 51 | 0.3% |
| Bulgarian | 17 | 0.1% |
| Burmese | 95 | 0.5% |
| Canadian | 2 | 0.0% |
| Central American | 244 | 1.3% |
| Croatian | 25 | 0.1% |
| Czech | 124 | 0.7% |
| Danish | 145 | 0.8% |
| Dominican | 35 | 0.2% |
| Dutch | 403 | 2.2% |
| Eastern European | 69 | 0.4% |
| Ecuadorian | 2 | 0.0% |
| English | 1,261 | 7.0% |
| European | 118 | 0.6% |
| French | 1,397 | 7.7% |
| French Canadian | 373 | 2.1% |
| German | 3,925 | 21.7% |
| Greek | 36 | 0.2% |
| Honduran | 6 | 0.0% |
| Hungarian | 89 | 0.5% |
| Indian (Asian) | 10 | 0.1% |
| Irish | 1,987 | 11.0% |
| Italian | 1,359 | 7.5% |
| Kenyan | 53 | 0.3% |
| Korean | 306 | 1.7% |
| Laotian | 35 | 0.2% |
| Lithuanian | 61 | 0.3% |
| Mexican | 917 | 5.1% |
| Native Hawaiian | 9 | 0.1% |
| Nigerian | 13 | 0.1% |
| Northern European | 14 | 0.1% |
| Norwegian | 222 | 1.2% |
| Palestinian | 4 | 0.0% |
| Polish | 1,010 | 5.6% |
| Portuguese | 2 | 0.0% |
| Puerto Rican | 144 | 0.8% |
| Romanian | 8 | 0.0% |
| Russian | 19 | 0.1% |
| Salvadoran | 238 | 1.3% |
| Scandinavian | 46 | 0.3% |
| Scotch-Irish | 99 | 0.5% |
| Scottish | 169 | 0.9% |
| Slovak | 9 | 0.1% |
| South American | 108 | 0.6% |
| Spaniard | 1 | 0.0% |
| Spanish | 22 | 0.1% |
| Sri Lankan | 21 | 0.1% |
| Subsaharan African | 972 | 5.4% |
| Swedish | 533 | 2.9% |
| Swiss | 59 | 0.3% |
| Thai | 263 | 1.5% |
| Ukrainian | 8 | 0.0% |
| Venezuelan | 106 | 0.6% |
| Welsh | 47 | 0.3% | View All 60 Rows |
Immigrants in Bourbonnais
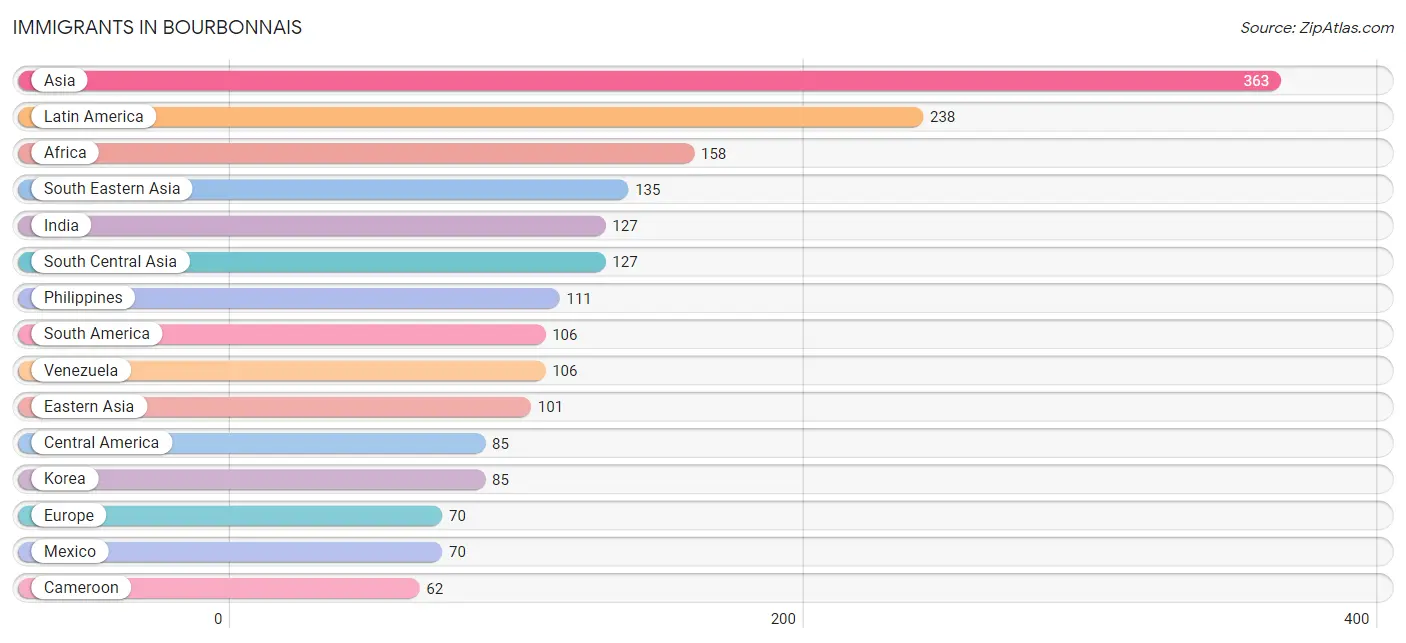
The most numerous immigrant groups reported in Bourbonnais came from Asia (363 | 2.0%), Latin America (238 | 1.3%), Africa (158 | 0.9%), South Eastern Asia (135 | 0.7%), and India (127 | 0.7%), together accounting for 5.6% of all Bourbonnais residents.
| Immigration Origin | # Population | % Population |
| Africa | 158 | 0.9% |
| Asia | 363 | 2.0% |
| Austria | 13 | 0.1% |
| Bahamas | 12 | 0.1% |
| Cameroon | 62 | 0.3% |
| Canada | 23 | 0.1% |
| Caribbean | 47 | 0.3% |
| Central America | 85 | 0.5% |
| China | 16 | 0.1% |
| Dominican Republic | 35 | 0.2% |
| Eastern Africa | 37 | 0.2% |
| Eastern Asia | 101 | 0.6% |
| Eastern Europe | 18 | 0.1% |
| El Salvador | 15 | 0.1% |
| England | 10 | 0.1% |
| Europe | 70 | 0.4% |
| Germany | 24 | 0.1% |
| Ghana | 8 | 0.0% |
| India | 127 | 0.7% |
| Indonesia | 22 | 0.1% |
| Kenya | 37 | 0.2% |
| Korea | 85 | 0.5% |
| Latin America | 238 | 1.3% |
| Lithuania | 9 | 0.1% |
| Mexico | 70 | 0.4% |
| Middle Africa | 62 | 0.3% |
| Nigeria | 51 | 0.3% |
| Northern Europe | 10 | 0.1% |
| Philippines | 111 | 0.6% |
| Poland | 9 | 0.1% |
| South America | 106 | 0.6% |
| South Central Asia | 127 | 0.7% |
| South Eastern Asia | 135 | 0.7% |
| Switzerland | 5 | 0.0% |
| Taiwan | 13 | 0.1% |
| Venezuela | 106 | 0.6% |
| Vietnam | 2 | 0.0% |
| Western Africa | 59 | 0.3% |
| Western Europe | 42 | 0.2% | View All 39 Rows |
Sex and Age in Bourbonnais
Sex and Age in Bourbonnais
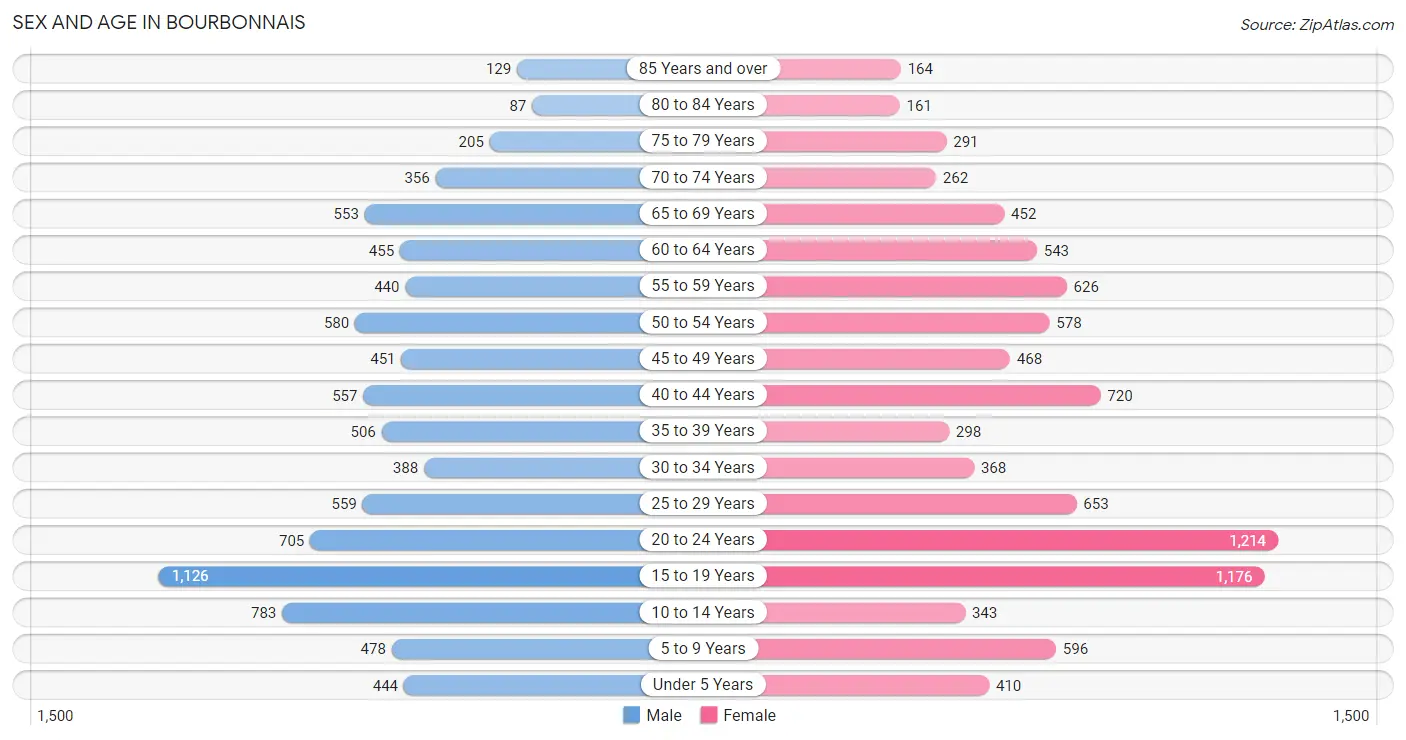
The most populous age groups in Bourbonnais are 15 to 19 Years (1,126 | 12.8%) for men and 20 to 24 Years (1,214 | 13.0%) for women.
| Age Bracket | Male | Female |
| Under 5 Years | 444 (5.0%) | 410 (4.4%) |
| 5 to 9 Years | 478 (5.4%) | 596 (6.4%) |
| 10 to 14 Years | 783 (8.9%) | 343 (3.7%) |
| 15 to 19 Years | 1,126 (12.8%) | 1,176 (12.6%) |
| 20 to 24 Years | 705 (8.0%) | 1,214 (13.0%) |
| 25 to 29 Years | 559 (6.4%) | 653 (7.0%) |
| 30 to 34 Years | 388 (4.4%) | 368 (4.0%) |
| 35 to 39 Years | 506 (5.8%) | 298 (3.2%) |
| 40 to 44 Years | 557 (6.3%) | 720 (7.7%) |
| 45 to 49 Years | 451 (5.1%) | 468 (5.0%) |
| 50 to 54 Years | 580 (6.6%) | 578 (6.2%) |
| 55 to 59 Years | 440 (5.0%) | 626 (6.7%) |
| 60 to 64 Years | 455 (5.2%) | 543 (5.8%) |
| 65 to 69 Years | 553 (6.3%) | 452 (4.9%) |
| 70 to 74 Years | 356 (4.0%) | 262 (2.8%) |
| 75 to 79 Years | 205 (2.3%) | 291 (3.1%) |
| 80 to 84 Years | 87 (1.0%) | 161 (1.7%) |
| 85 Years and over | 129 (1.5%) | 164 (1.8%) |
| Total | 8,802 (100.0%) | 9,323 (100.0%) |
Families and Households in Bourbonnais
Median Family Size in Bourbonnais
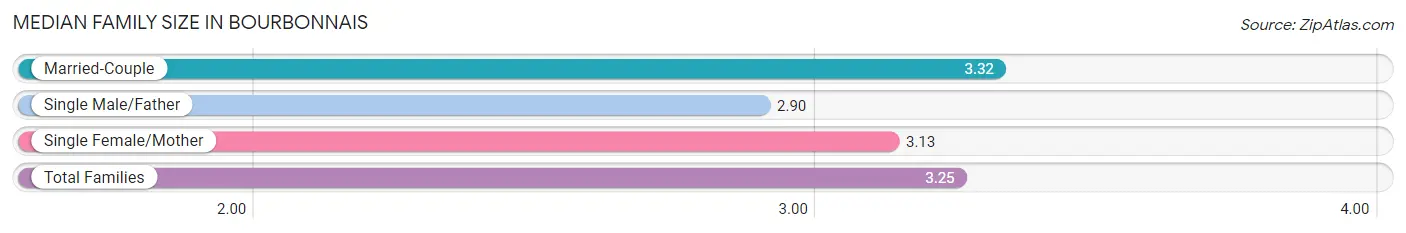
The median family size in Bourbonnais is 3.25 persons per family, with married-couple families (3,012 | 74.3%) accounting for the largest median family size of 3.32 persons per family. On the other hand, single male/father families (333 | 8.2%) represent the smallest median family size with 2.90 persons per family.
| Family Type | # Families | Family Size |
| Married-Couple | 3,012 (74.3%) | 3.32 |
| Single Male/Father | 333 (8.2%) | 2.90 |
| Single Female/Mother | 710 (17.5%) | 3.13 |
| Total Families | 4,055 (100.0%) | 3.25 |
Median Household Size in Bourbonnais
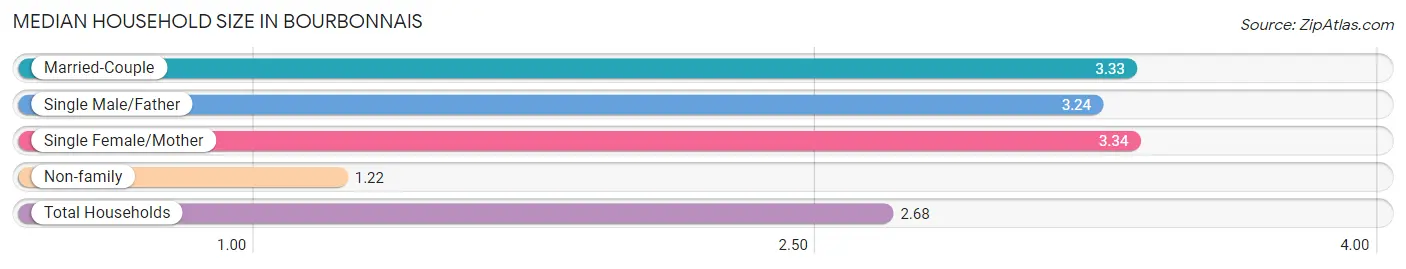
The median household size in Bourbonnais is 2.68 persons per household, with single female/mother households (710 | 12.2%) accounting for the largest median household size of 3.34 persons per household. non-family households (1,779 | 30.5%) represent the smallest median household size with 1.22 persons per household.
| Household Type | # Households | Household Size |
| Married-Couple | 3,012 (51.6%) | 3.33 |
| Single Male/Father | 333 (5.7%) | 3.24 |
| Single Female/Mother | 710 (12.2%) | 3.34 |
| Non-family | 1,779 (30.5%) | 1.22 |
| Total Households | 5,834 (100.0%) | 2.68 |
Household Size by Marriage Status in Bourbonnais
Out of a total of 5,834 households in Bourbonnais, 4,055 (69.5%) are family households, while 1,779 (30.5%) are nonfamily households. The most numerous type of family households are 2-person households, comprising 1,538, and the most common type of nonfamily households are 1-person households, comprising 1,447.
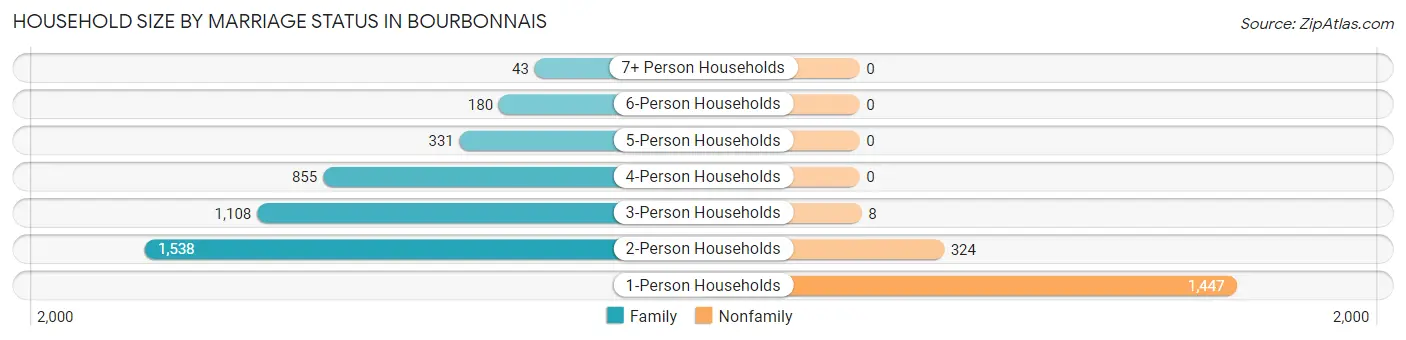
| Household Size | Family Households | Nonfamily Households |
| 1-Person Households | - | 1,447 (24.8%) |
| 2-Person Households | 1,538 (26.4%) | 324 (5.6%) |
| 3-Person Households | 1,108 (19.0%) | 8 (0.1%) |
| 4-Person Households | 855 (14.7%) | 0 (0.0%) |
| 5-Person Households | 331 (5.7%) | 0 (0.0%) |
| 6-Person Households | 180 (3.1%) | 0 (0.0%) |
| 7+ Person Households | 43 (0.7%) | 0 (0.0%) |
| Total | 4,055 (69.5%) | 1,779 (30.5%) |
Female Fertility in Bourbonnais
Fertility by Age in Bourbonnais
Average fertility rate in Bourbonnais is 52.0 births per 1,000 women. Women in the age bracket of 20 to 34 years have the highest fertility rate with 95.0 births per 1,000 women. Women in the age bracket of 20 to 34 years acount for 82.6% of all women with births.
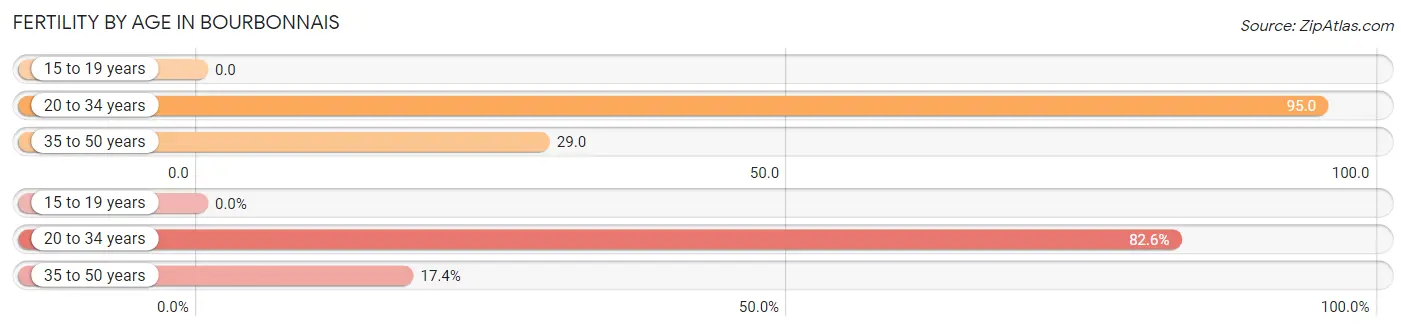
| Age Bracket | Women with Births | Births / 1,000 Women |
| 15 to 19 years | 0 (0.0%) | 0.0 |
| 20 to 34 years | 213 (82.6%) | 95.0 |
| 35 to 50 years | 45 (17.4%) | 29.0 |
| Total | 258 (100.0%) | 52.0 |
Fertility by Age by Marriage Status in Bourbonnais
64.3% of women with births (258) in Bourbonnais are married. The highest percentage of unmarried women with births falls into 35 to 50 years age bracket with 64.4% of them unmarried at the time of birth, while the lowest percentage of unmarried women with births belong to 20 to 34 years age bracket with 29.6% of them unmarried.
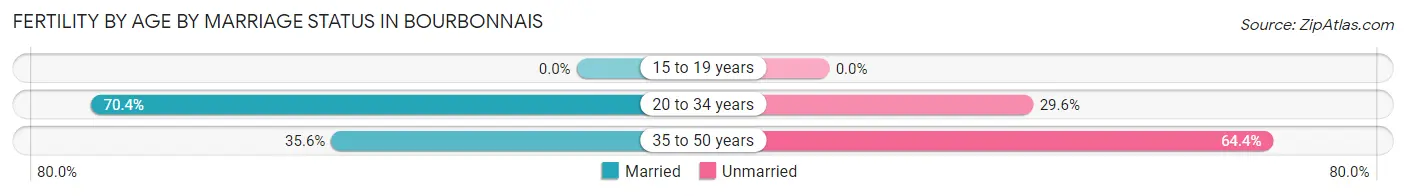
| Age Bracket | Married | Unmarried |
| 15 to 19 years | 0 (0.0%) | 0 (0.0%) |
| 20 to 34 years | 150 (70.4%) | 63 (29.6%) |
| 35 to 50 years | 16 (35.6%) | 29 (64.4%) |
| Total | 166 (64.3%) | 92 (35.7%) |
Fertility by Education in Bourbonnais
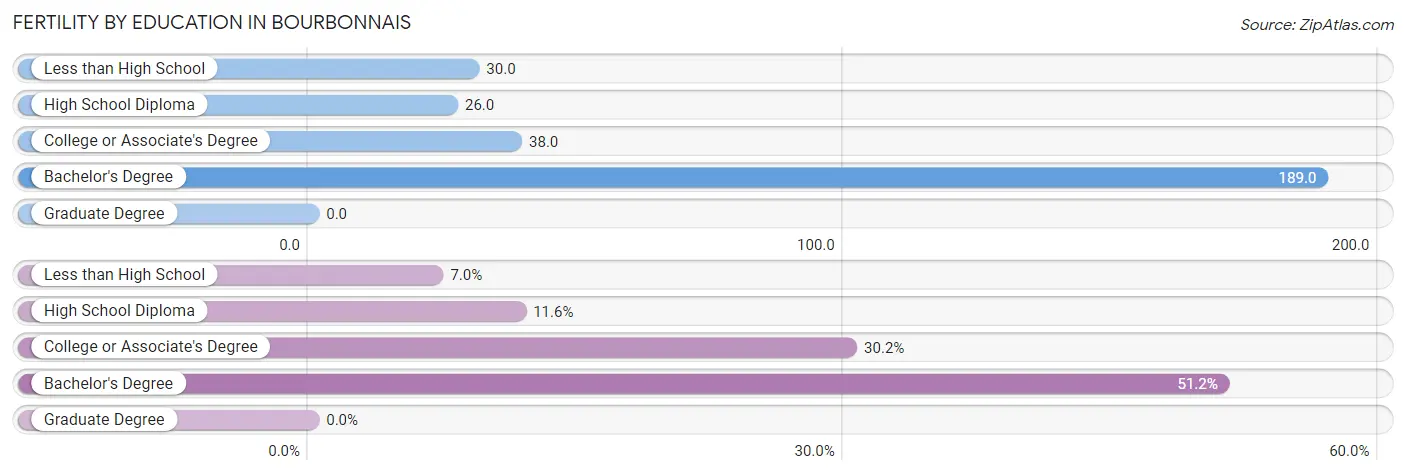
| Educational Attainment | Women with Births | Births / 1,000 Women |
| Less than High School | 18 (7.0%) | 30.0 |
| High School Diploma | 30 (11.6%) | 26.0 |
| College or Associate's Degree | 78 (30.2%) | 38.0 |
| Bachelor's Degree | 132 (51.2%) | 189.0 |
| Graduate Degree | 0 (0.0%) | 0.0 |
| Total | 258 (100.0%) | 52.0 |
Fertility by Education by Marriage Status in Bourbonnais
35.7% of women with births in Bourbonnais are unmarried. Women with the educational attainment of bachelor's degree are most likely to be married with 100.0% of them married at childbirth, while women with the educational attainment of less than high school are least likely to be married with 100.0% of them unmarried at childbirth.
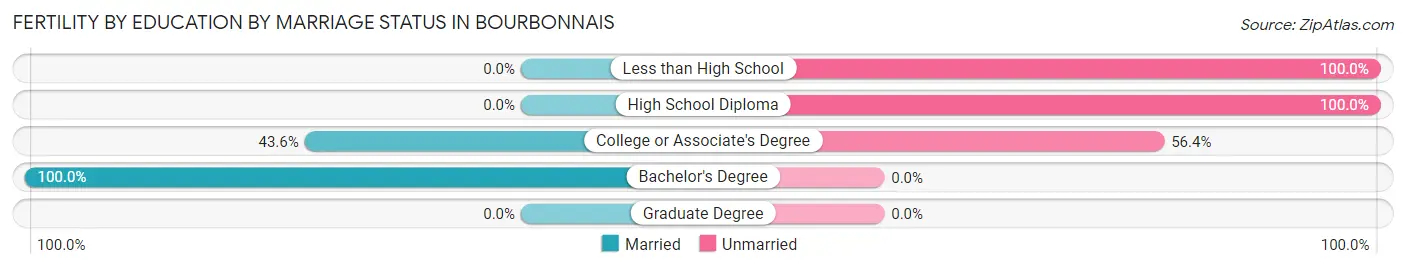
| Educational Attainment | Married | Unmarried |
| Less than High School | 0 (0.0%) | 18 (100.0%) |
| High School Diploma | 0 (0.0%) | 30 (100.0%) |
| College or Associate's Degree | 34 (43.6%) | 44 (56.4%) |
| Bachelor's Degree | 132 (100.0%) | 0 (0.0%) |
| Graduate Degree | 0 (0.0%) | 0 (0.0%) |
| Total | 166 (64.3%) | 92 (35.7%) |
Employment Characteristics in Bourbonnais
Employment by Class of Employer in Bourbonnais
Among the 8,491 employed individuals in Bourbonnais, private company employees (5,718 | 67.3%), not-for-profit organizations (1,262 | 14.9%), and local government employees (556 | 6.6%) make up the most common classes of employment.
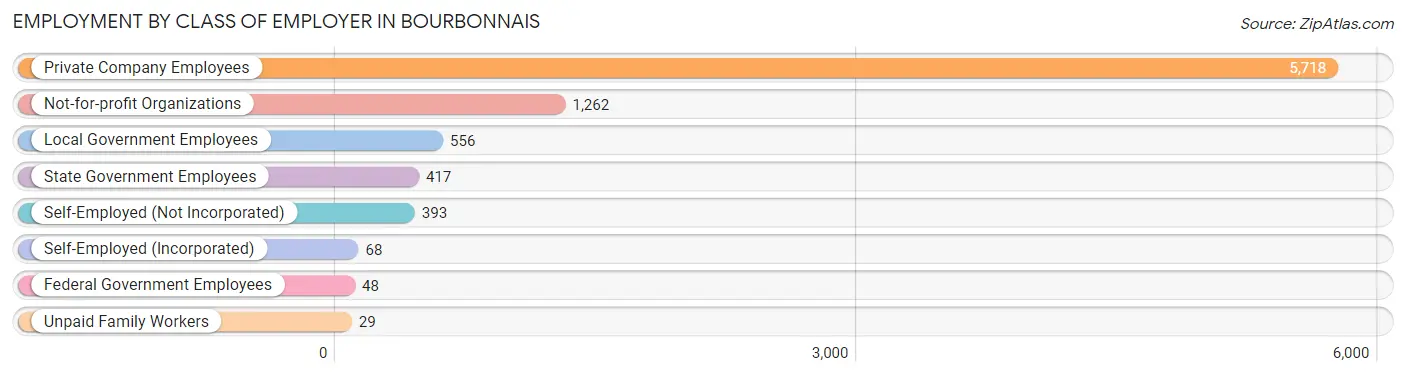
| Employer Class | # Employees | % Employees |
| Private Company Employees | 5,718 | 67.3% |
| Self-Employed (Incorporated) | 68 | 0.8% |
| Self-Employed (Not Incorporated) | 393 | 4.6% |
| Not-for-profit Organizations | 1,262 | 14.9% |
| Local Government Employees | 556 | 6.6% |
| State Government Employees | 417 | 4.9% |
| Federal Government Employees | 48 | 0.6% |
| Unpaid Family Workers | 29 | 0.3% |
| Total | 8,491 | 100.0% |
Employment Status by Age in Bourbonnais
According to the labor force statistics for Bourbonnais, out of the total population over 16 years of age (14,870), 61.6% or 9,160 individuals are in the labor force, with 5.4% or 495 of them unemployed. The age group with the highest labor force participation rate is 30 to 34 years, with 93.7% or 708 individuals in the labor force. Within the labor force, the 16 to 19 years age range has the highest percentage of unemployed individuals, with 18.4% or 148 of them being unemployed.
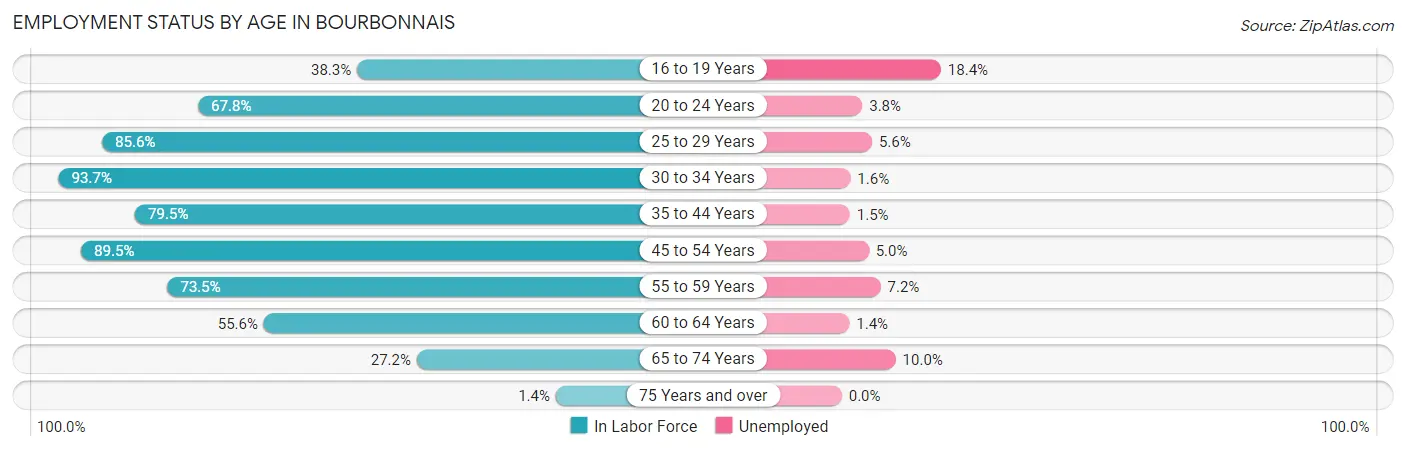
| Age Bracket | In Labor Force | Unemployed |
| 16 to 19 Years | 805 (38.3%) | 148 (18.4%) |
| 20 to 24 Years | 1,301 (67.8%) | 49 (3.8%) |
| 25 to 29 Years | 1,037 (85.6%) | 58 (5.6%) |
| 30 to 34 Years | 708 (93.7%) | 11 (1.6%) |
| 35 to 44 Years | 1,654 (79.5%) | 25 (1.5%) |
| 45 to 54 Years | 1,859 (89.5%) | 93 (5.0%) |
| 55 to 59 Years | 784 (73.5%) | 56 (7.2%) |
| 60 to 64 Years | 555 (55.6%) | 8 (1.4%) |
| 65 to 74 Years | 441 (27.2%) | 44 (10.0%) |
| 75 Years and over | 15 (1.4%) | 0 (0.0%) |
| Total | 9,160 (61.6%) | 495 (5.4%) |
Employment Status by Educational Attainment in Bourbonnais
According to labor force statistics for Bourbonnais, 80.5% of individuals (6,593) out of the total population between 25 and 64 years of age (8,190) are in the labor force, with 3.8% or 251 of them being unemployed. The group with the highest labor force participation rate are those with the educational attainment of bachelor's degree or higher, with 88.2% or 2,722 individuals in the labor force. Within the labor force, individuals with college / associate degree education have the highest percentage of unemployment, with 5.1% or 102 of them being unemployed.
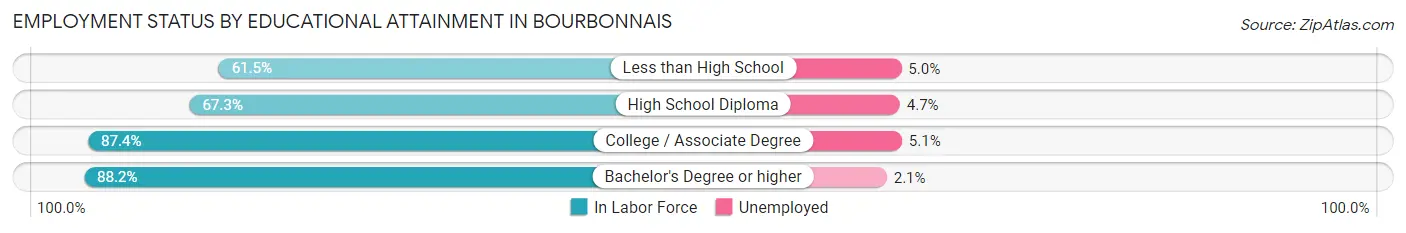
| Educational Attainment | In Labor Force | Unemployed |
| Less than High School | 219 (61.5%) | 18 (5.0%) |
| High School Diploma | 1,653 (67.3%) | 115 (4.7%) |
| College / Associate Degree | 2,003 (87.4%) | 117 (5.1%) |
| Bachelor's Degree or higher | 2,722 (88.2%) | 65 (2.1%) |
| Total | 6,593 (80.5%) | 311 (3.8%) |
Employment Occupations by Sex in Bourbonnais
Management, Business, Science and Arts Occupations
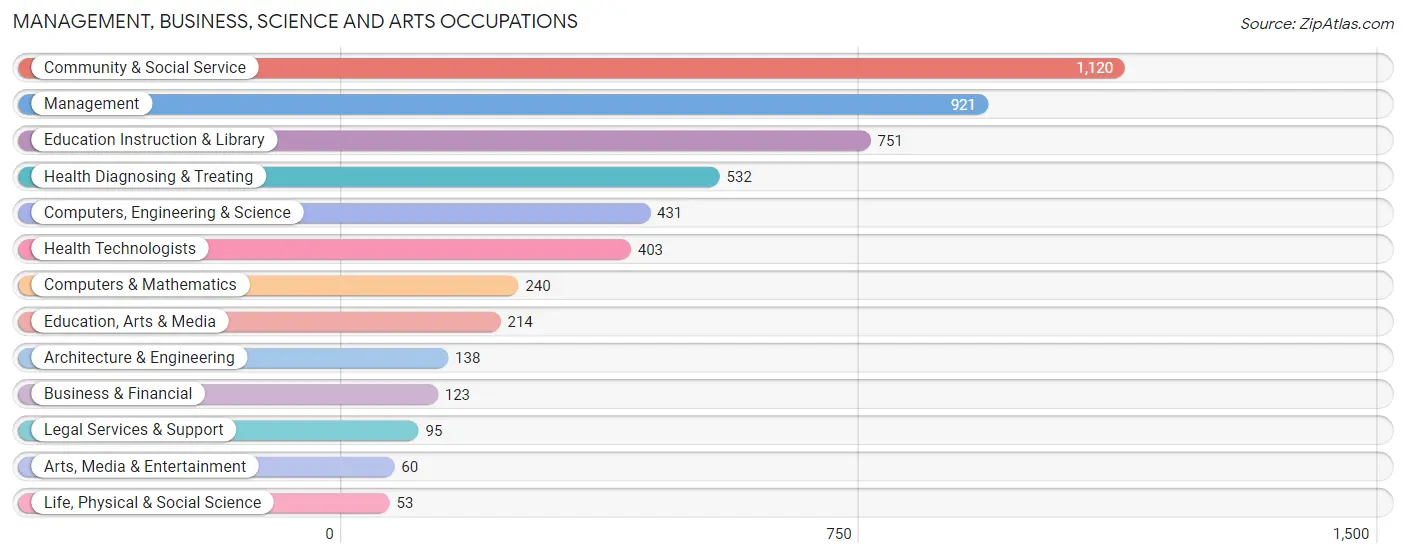
The most common Management, Business, Science and Arts occupations in Bourbonnais are Community & Social Service (1,120 | 12.9%), Management (921 | 10.6%), Education Instruction & Library (751 | 8.7%), Health Diagnosing & Treating (532 | 6.1%), and Computers, Engineering & Science (431 | 5.0%).
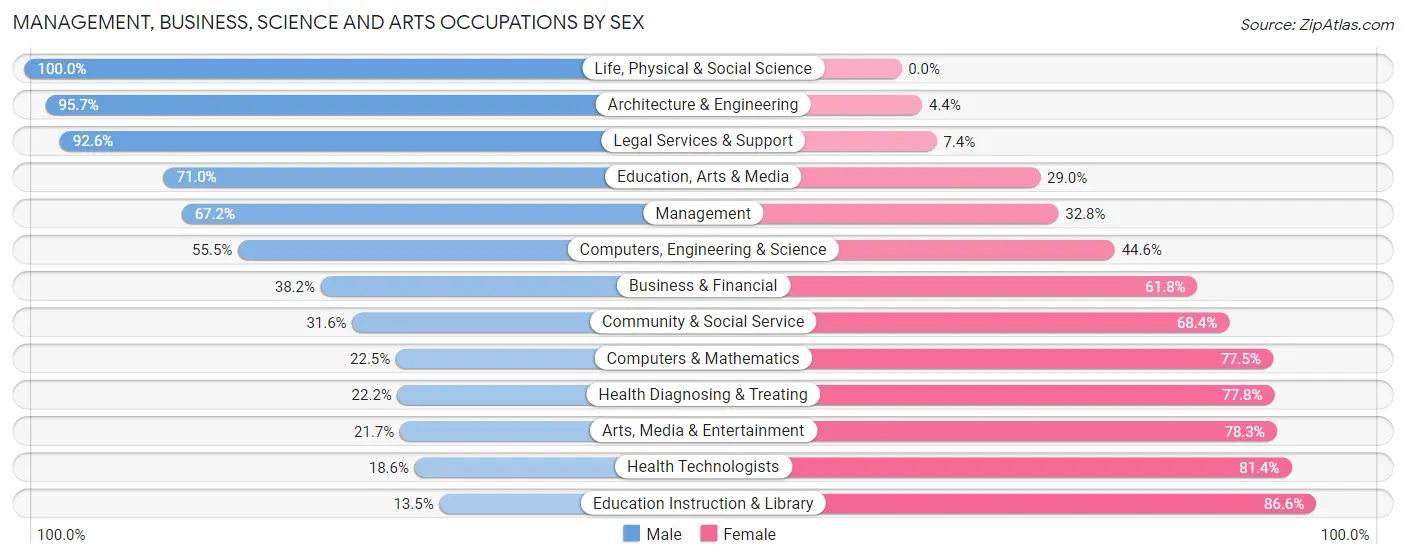
Management, Business, Science and Arts Occupations by Sex
Within the Management, Business, Science and Arts occupations in Bourbonnais, the most male-oriented occupations are Life, Physical & Social Science (100.0%), Architecture & Engineering (95.7%), and Legal Services & Support (92.6%), while the most female-oriented occupations are Education Instruction & Library (86.6%), Health Technologists (81.4%), and Arts, Media & Entertainment (78.3%).
| Occupation | Male | Female |
| Management | 619 (67.2%) | 302 (32.8%) |
| Business & Financial | 47 (38.2%) | 76 (61.8%) |
| Computers, Engineering & Science | 239 (55.4%) | 192 (44.6%) |
| Computers & Mathematics | 54 (22.5%) | 186 (77.5%) |
| Architecture & Engineering | 132 (95.7%) | 6 (4.3%) |
| Life, Physical & Social Science | 53 (100.0%) | 0 (0.0%) |
| Community & Social Service | 354 (31.6%) | 766 (68.4%) |
| Education, Arts & Media | 152 (71.0%) | 62 (29.0%) |
| Legal Services & Support | 88 (92.6%) | 7 (7.4%) |
| Education Instruction & Library | 101 (13.5%) | 650 (86.6%) |
| Arts, Media & Entertainment | 13 (21.7%) | 47 (78.3%) |
| Health Diagnosing & Treating | 118 (22.2%) | 414 (77.8%) |
| Health Technologists | 75 (18.6%) | 328 (81.4%) |
| Total (Category) | 1,377 (44.0%) | 1,750 (56.0%) |
| Total (Overall) | 4,143 (47.8%) | 4,523 (52.2%) |
Services Occupations
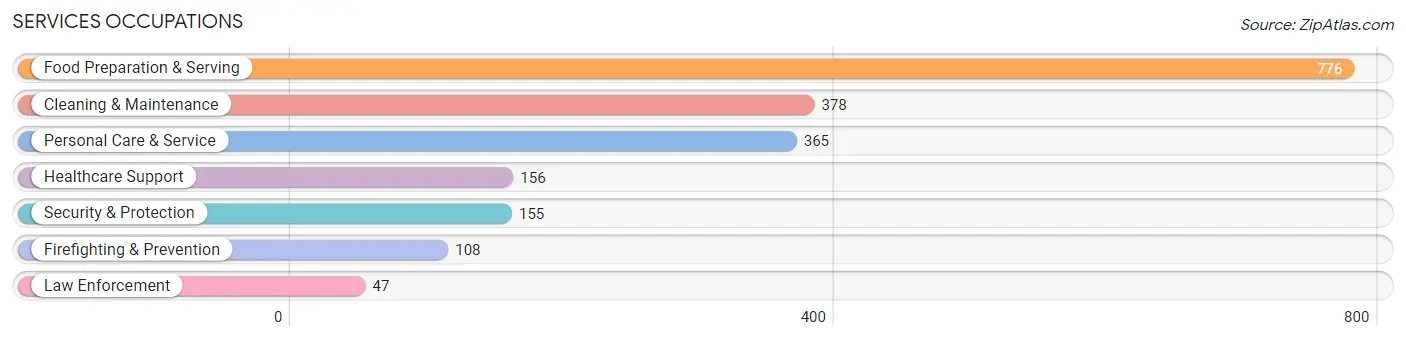
The most common Services occupations in Bourbonnais are Food Preparation & Serving (776 | 8.9%), Cleaning & Maintenance (378 | 4.4%), Personal Care & Service (365 | 4.2%), Healthcare Support (156 | 1.8%), and Security & Protection (155 | 1.8%).
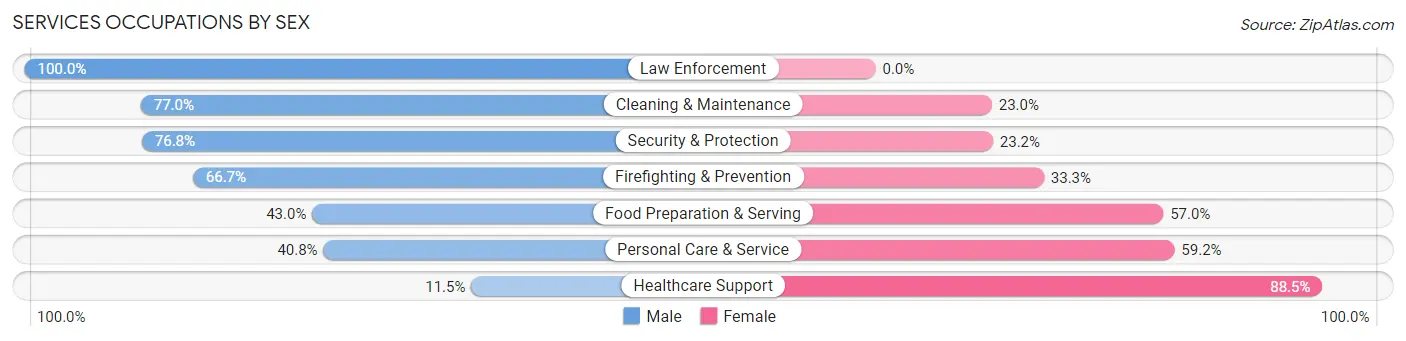
Services Occupations by Sex
Within the Services occupations in Bourbonnais, the most male-oriented occupations are Law Enforcement (100.0%), Cleaning & Maintenance (77.0%), and Security & Protection (76.8%), while the most female-oriented occupations are Healthcare Support (88.5%), Personal Care & Service (59.2%), and Food Preparation & Serving (57.0%).
| Occupation | Male | Female |
| Healthcare Support | 18 (11.5%) | 138 (88.5%) |
| Security & Protection | 119 (76.8%) | 36 (23.2%) |
| Firefighting & Prevention | 72 (66.7%) | 36 (33.3%) |
| Law Enforcement | 47 (100.0%) | 0 (0.0%) |
| Food Preparation & Serving | 334 (43.0%) | 442 (57.0%) |
| Cleaning & Maintenance | 291 (77.0%) | 87 (23.0%) |
| Personal Care & Service | 149 (40.8%) | 216 (59.2%) |
| Total (Category) | 911 (49.8%) | 919 (50.2%) |
| Total (Overall) | 4,143 (47.8%) | 4,523 (52.2%) |
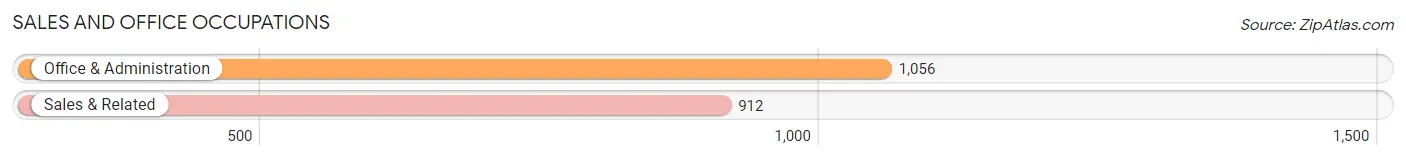
Sales and Office Occupations
The most common Sales and Office occupations in Bourbonnais are Office & Administration (1,056 | 12.2%), and Sales & Related (912 | 10.5%).
Sales and Office Occupations by Sex
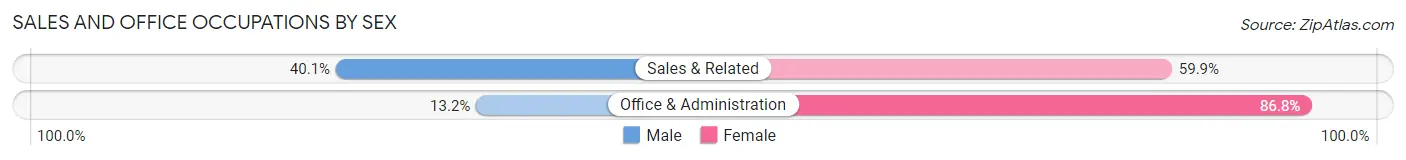
| Occupation | Male | Female |
| Sales & Related | 366 (40.1%) | 546 (59.9%) |
| Office & Administration | 139 (13.2%) | 917 (86.8%) |
| Total (Category) | 505 (25.7%) | 1,463 (74.3%) |
| Total (Overall) | 4,143 (47.8%) | 4,523 (52.2%) |
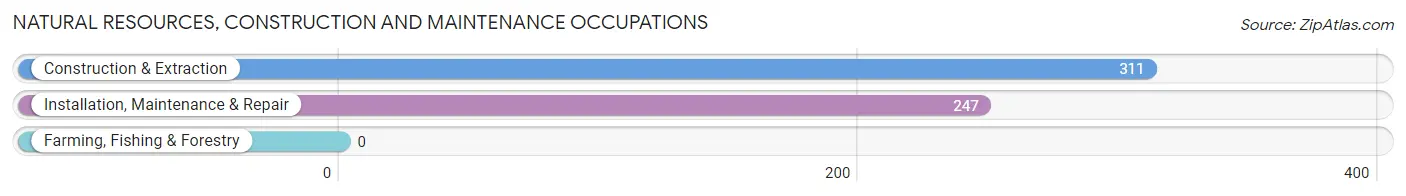
Natural Resources, Construction and Maintenance Occupations
The most common Natural Resources, Construction and Maintenance occupations in Bourbonnais are Construction & Extraction (311 | 3.6%), and Installation, Maintenance & Repair (247 | 2.9%).
Natural Resources, Construction and Maintenance Occupations by Sex
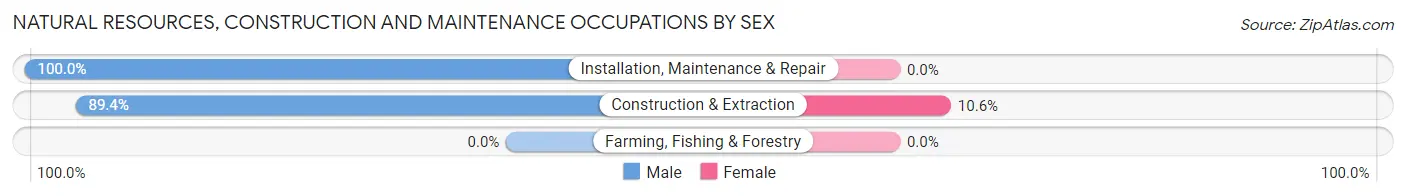
| Occupation | Male | Female |
| Farming, Fishing & Forestry | 0 (0.0%) | 0 (0.0%) |
| Construction & Extraction | 278 (89.4%) | 33 (10.6%) |
| Installation, Maintenance & Repair | 247 (100.0%) | 0 (0.0%) |
| Total (Category) | 525 (94.1%) | 33 (5.9%) |
| Total (Overall) | 4,143 (47.8%) | 4,523 (52.2%) |
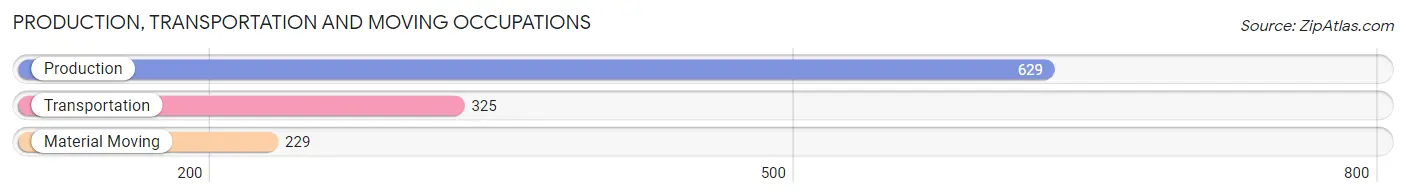
Production, Transportation and Moving Occupations
The most common Production, Transportation and Moving occupations in Bourbonnais are Production (629 | 7.3%), Transportation (325 | 3.7%), and Material Moving (229 | 2.6%).
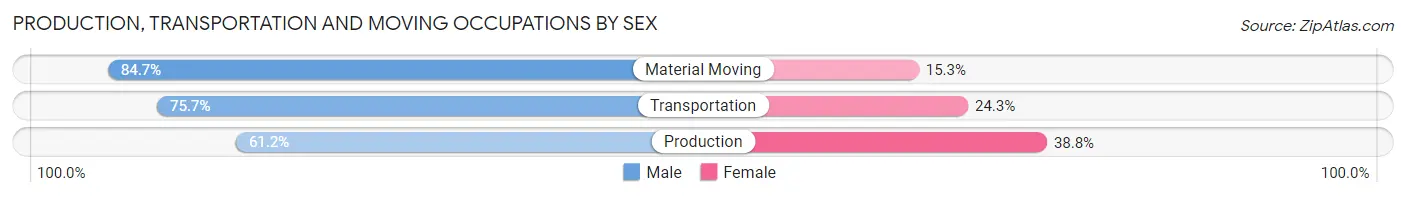
Production, Transportation and Moving Occupations by Sex
| Occupation | Male | Female |
| Production | 385 (61.2%) | 244 (38.8%) |
| Transportation | 246 (75.7%) | 79 (24.3%) |
| Material Moving | 194 (84.7%) | 35 (15.3%) |
| Total (Category) | 825 (69.7%) | 358 (30.3%) |
| Total (Overall) | 4,143 (47.8%) | 4,523 (52.2%) |
Employment Industries by Sex in Bourbonnais
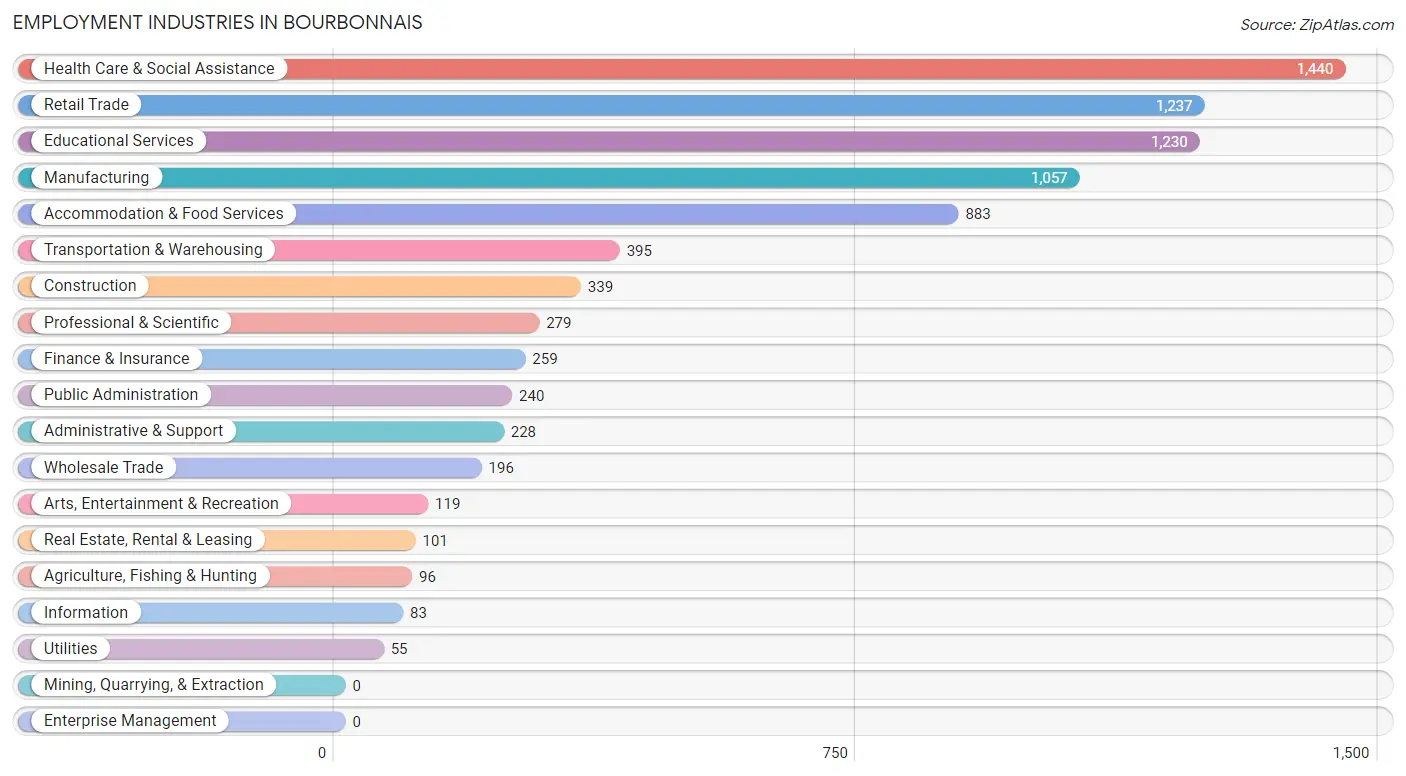
Employment Industries in Bourbonnais
The major employment industries in Bourbonnais include Health Care & Social Assistance (1,440 | 16.6%), Retail Trade (1,237 | 14.3%), Educational Services (1,230 | 14.2%), Manufacturing (1,057 | 12.2%), and Accommodation & Food Services (883 | 10.2%).
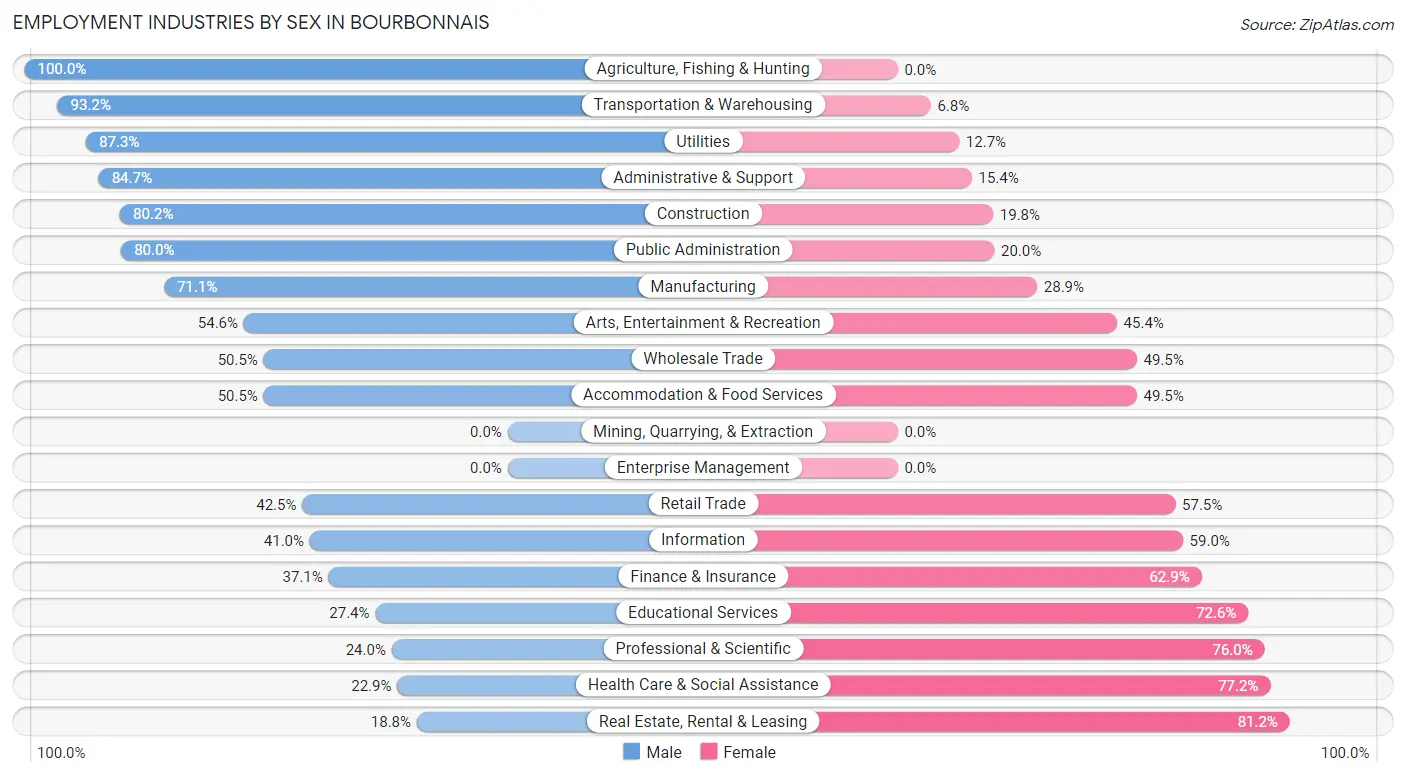
Employment Industries by Sex in Bourbonnais
The Bourbonnais industries that see more men than women are Agriculture, Fishing & Hunting (100.0%), Transportation & Warehousing (93.2%), and Utilities (87.3%), whereas the industries that tend to have a higher number of women are Real Estate, Rental & Leasing (81.2%), Health Care & Social Assistance (77.1%), and Professional & Scientific (76.0%).
| Industry | Male | Female |
| Agriculture, Fishing & Hunting | 96 (100.0%) | 0 (0.0%) |
| Mining, Quarrying, & Extraction | 0 (0.0%) | 0 (0.0%) |
| Construction | 272 (80.2%) | 67 (19.8%) |
| Manufacturing | 752 (71.1%) | 305 (28.9%) |
| Wholesale Trade | 99 (50.5%) | 97 (49.5%) |
| Retail Trade | 526 (42.5%) | 711 (57.5%) |
| Transportation & Warehousing | 368 (93.2%) | 27 (6.8%) |
| Utilities | 48 (87.3%) | 7 (12.7%) |
| Information | 34 (41.0%) | 49 (59.0%) |
| Finance & Insurance | 96 (37.1%) | 163 (62.9%) |
| Real Estate, Rental & Leasing | 19 (18.8%) | 82 (81.2%) |
| Professional & Scientific | 67 (24.0%) | 212 (76.0%) |
| Enterprise Management | 0 (0.0%) | 0 (0.0%) |
| Administrative & Support | 193 (84.7%) | 35 (15.3%) |
| Educational Services | 337 (27.4%) | 893 (72.6%) |
| Health Care & Social Assistance | 329 (22.9%) | 1,111 (77.1%) |
| Arts, Entertainment & Recreation | 65 (54.6%) | 54 (45.4%) |
| Accommodation & Food Services | 446 (50.5%) | 437 (49.5%) |
| Public Administration | 192 (80.0%) | 48 (20.0%) |
| Total | 4,143 (47.8%) | 4,523 (52.2%) |
Education in Bourbonnais
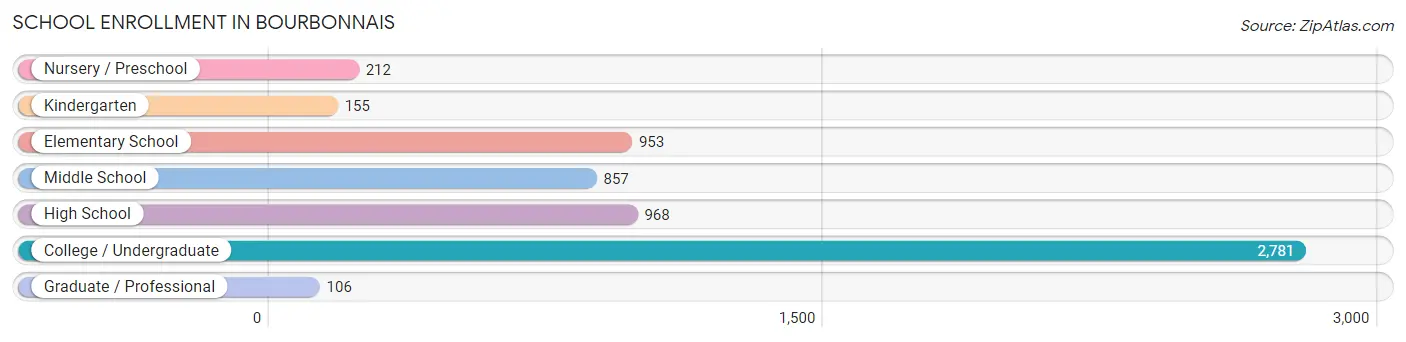
School Enrollment in Bourbonnais
The most common levels of schooling among the 6,032 students in Bourbonnais are college / undergraduate (2,781 | 46.1%), high school (968 | 16.1%), and elementary school (953 | 15.8%).
| School Level | # Students | % Students |
| Nursery / Preschool | 212 | 3.5% |
| Kindergarten | 155 | 2.6% |
| Elementary School | 953 | 15.8% |
| Middle School | 857 | 14.2% |
| High School | 968 | 16.1% |
| College / Undergraduate | 2,781 | 46.1% |
| Graduate / Professional | 106 | 1.8% |
| Total | 6,032 | 100.0% |
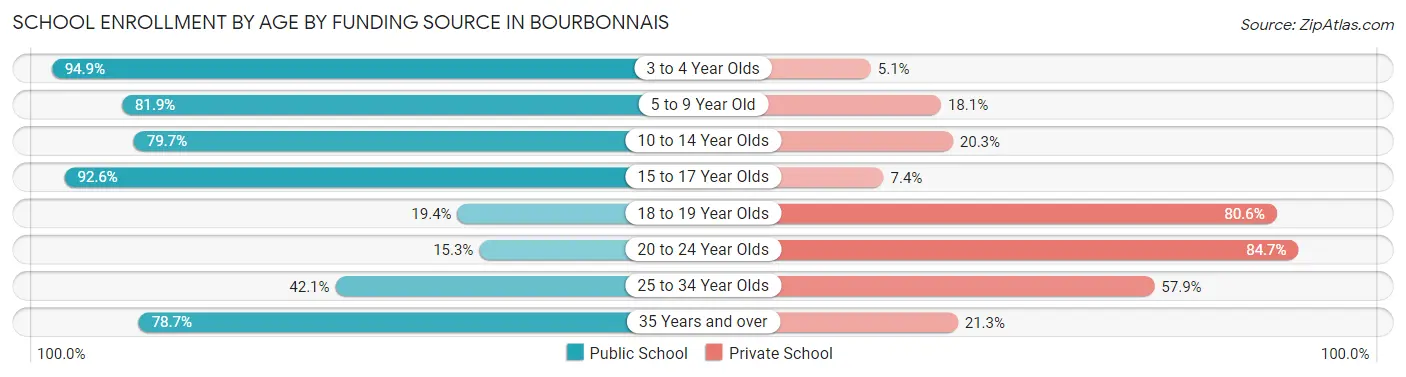
School Enrollment by Age by Funding Source in Bourbonnais
Out of a total of 6,032 students who are enrolled in schools in Bourbonnais, 2,769 (45.9%) attend a private institution, while the remaining 3,263 (54.1%) are enrolled in public schools. The age group of 20 to 24 year olds has the highest likelihood of being enrolled in private schools, with 1,005 (84.7% in the age bracket) enrolled. Conversely, the age group of 3 to 4 year olds has the lowest likelihood of being enrolled in a private school, with 150 (94.9% in the age bracket) attending a public institution.
| Age Bracket | Public School | Private School |
| 3 to 4 Year Olds | 150 (94.9%) | 8 (5.1%) |
| 5 to 9 Year Old | 795 (81.9%) | 176 (18.1%) |
| 10 to 14 Year Olds | 897 (79.7%) | 229 (20.3%) |
| 15 to 17 Year Olds | 723 (92.6%) | 58 (7.4%) |
| 18 to 19 Year Olds | 264 (19.4%) | 1,098 (80.6%) |
| 20 to 24 Year Olds | 182 (15.3%) | 1,005 (84.7%) |
| 25 to 34 Year Olds | 115 (42.1%) | 158 (57.9%) |
| 35 Years and over | 137 (78.7%) | 37 (21.3%) |
| Total | 3,263 (54.1%) | 2,769 (45.9%) |
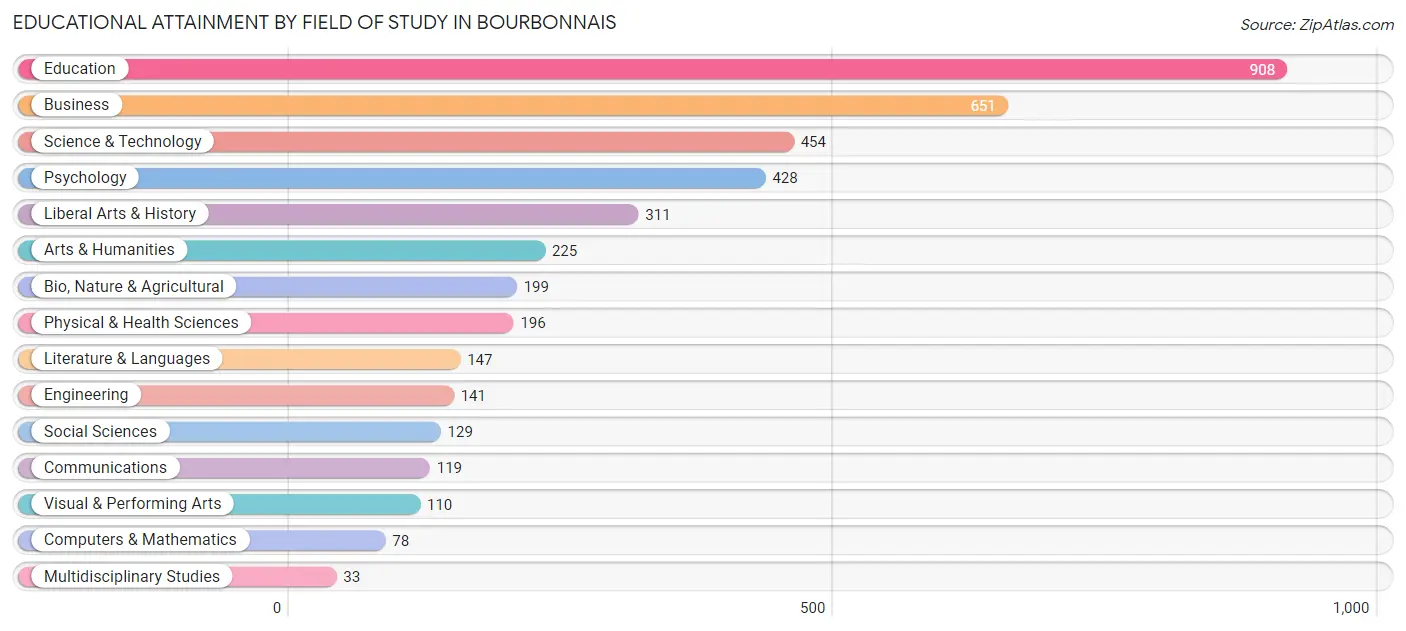
Educational Attainment by Field of Study in Bourbonnais
Education (908 | 22.0%), business (651 | 15.8%), science & technology (454 | 11.0%), psychology (428 | 10.4%), and liberal arts & history (311 | 7.5%) are the most common fields of study among 4,129 individuals in Bourbonnais who have obtained a bachelor's degree or higher.
| Field of Study | # Graduates | % Graduates |
| Computers & Mathematics | 78 | 1.9% |
| Bio, Nature & Agricultural | 199 | 4.8% |
| Physical & Health Sciences | 196 | 4.8% |
| Psychology | 428 | 10.4% |
| Social Sciences | 129 | 3.1% |
| Engineering | 141 | 3.4% |
| Multidisciplinary Studies | 33 | 0.8% |
| Science & Technology | 454 | 11.0% |
| Business | 651 | 15.8% |
| Education | 908 | 22.0% |
| Literature & Languages | 147 | 3.6% |
| Liberal Arts & History | 311 | 7.5% |
| Visual & Performing Arts | 110 | 2.7% |
| Communications | 119 | 2.9% |
| Arts & Humanities | 225 | 5.4% |
| Total | 4,129 | 100.0% |
Transportation & Commute in Bourbonnais
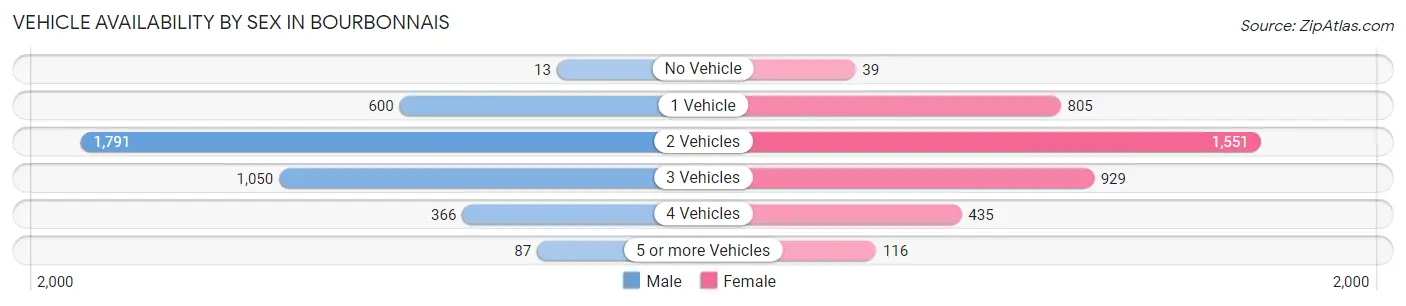
Vehicle Availability by Sex in Bourbonnais
The most prevalent vehicle ownership categories in Bourbonnais are males with 2 vehicles (1,791, accounting for 45.8%) and females with 2 vehicles (1,551, making up 46.2%).
| Vehicles Available | Male | Female |
| No Vehicle | 13 (0.3%) | 39 (1.0%) |
| 1 Vehicle | 600 (15.4%) | 805 (20.8%) |
| 2 Vehicles | 1,791 (45.8%) | 1,551 (40.0%) |
| 3 Vehicles | 1,050 (26.9%) | 929 (24.0%) |
| 4 Vehicles | 366 (9.4%) | 435 (11.2%) |
| 5 or more Vehicles | 87 (2.2%) | 116 (3.0%) |
| Total | 3,907 (100.0%) | 3,875 (100.0%) |
Commute Time in Bourbonnais
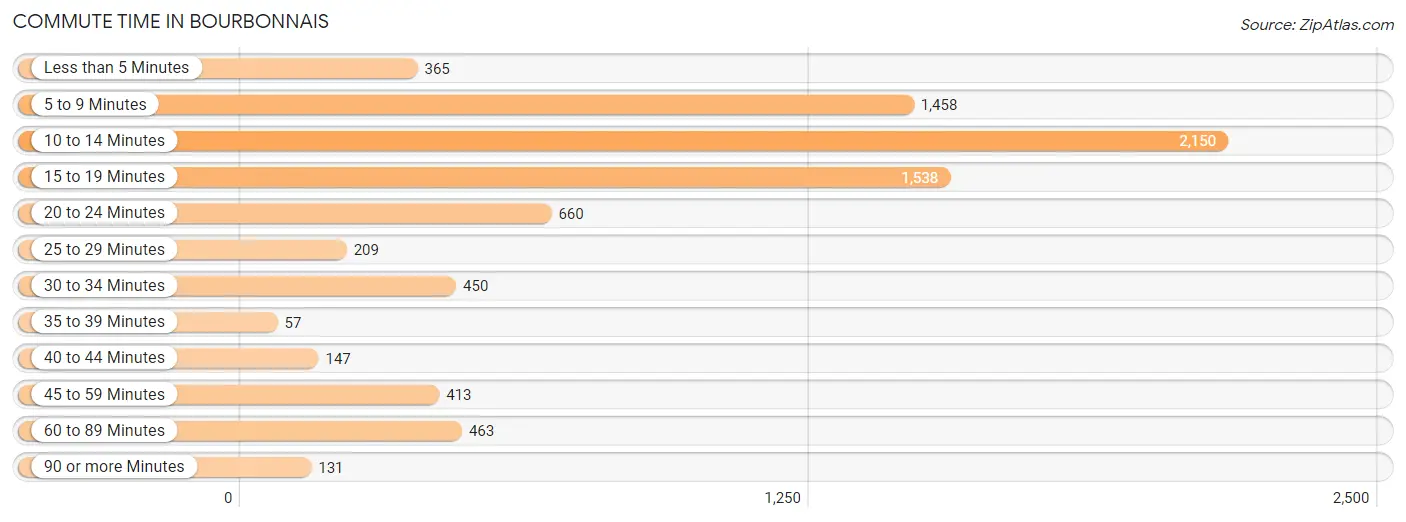
The most frequently occuring commute durations in Bourbonnais are 10 to 14 minutes (2,150 commuters, 26.7%), 15 to 19 minutes (1,538 commuters, 19.1%), and 5 to 9 minutes (1,458 commuters, 18.1%).
| Commute Time | # Commuters | % Commuters |
| Less than 5 Minutes | 365 | 4.5% |
| 5 to 9 Minutes | 1,458 | 18.1% |
| 10 to 14 Minutes | 2,150 | 26.7% |
| 15 to 19 Minutes | 1,538 | 19.1% |
| 20 to 24 Minutes | 660 | 8.2% |
| 25 to 29 Minutes | 209 | 2.6% |
| 30 to 34 Minutes | 450 | 5.6% |
| 35 to 39 Minutes | 57 | 0.7% |
| 40 to 44 Minutes | 147 | 1.8% |
| 45 to 59 Minutes | 413 | 5.1% |
| 60 to 89 Minutes | 463 | 5.8% |
| 90 or more Minutes | 131 | 1.6% |
Commute Time by Sex in Bourbonnais
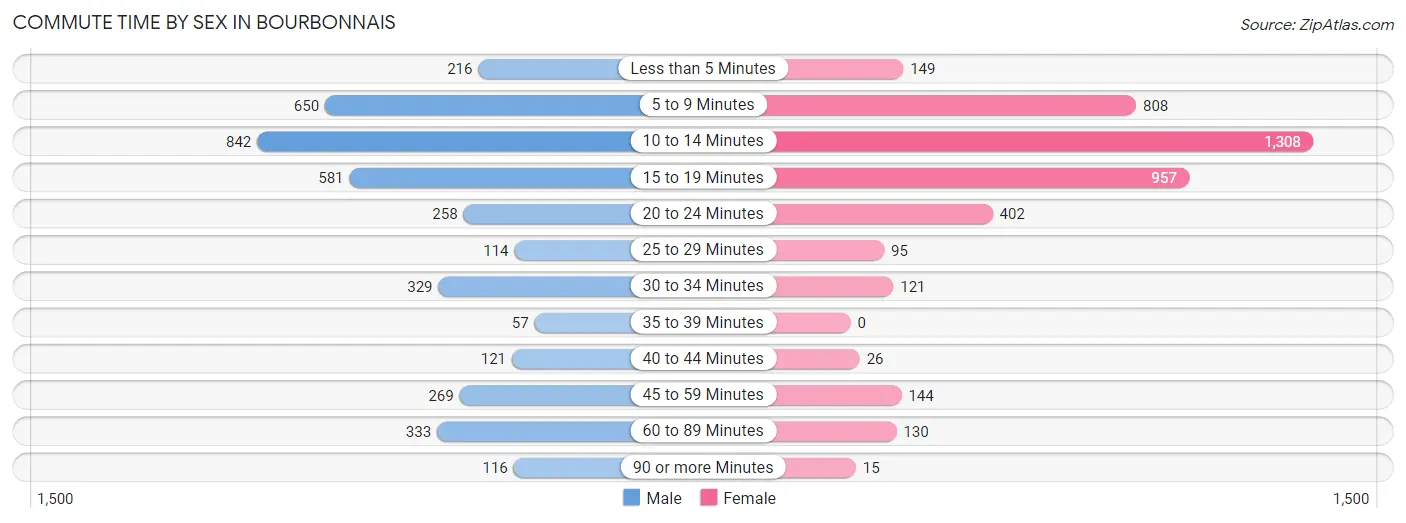
The most common commute times in Bourbonnais are 10 to 14 minutes (842 commuters, 21.7%) for males and 10 to 14 minutes (1,308 commuters, 31.5%) for females.
| Commute Time | Male | Female |
| Less than 5 Minutes | 216 (5.6%) | 149 (3.6%) |
| 5 to 9 Minutes | 650 (16.7%) | 808 (19.5%) |
| 10 to 14 Minutes | 842 (21.7%) | 1,308 (31.5%) |
| 15 to 19 Minutes | 581 (14.9%) | 957 (23.0%) |
| 20 to 24 Minutes | 258 (6.6%) | 402 (9.7%) |
| 25 to 29 Minutes | 114 (2.9%) | 95 (2.3%) |
| 30 to 34 Minutes | 329 (8.5%) | 121 (2.9%) |
| 35 to 39 Minutes | 57 (1.5%) | 0 (0.0%) |
| 40 to 44 Minutes | 121 (3.1%) | 26 (0.6%) |
| 45 to 59 Minutes | 269 (6.9%) | 144 (3.5%) |
| 60 to 89 Minutes | 333 (8.6%) | 130 (3.1%) |
| 90 or more Minutes | 116 (3.0%) | 15 (0.4%) |
Time of Departure to Work by Sex in Bourbonnais
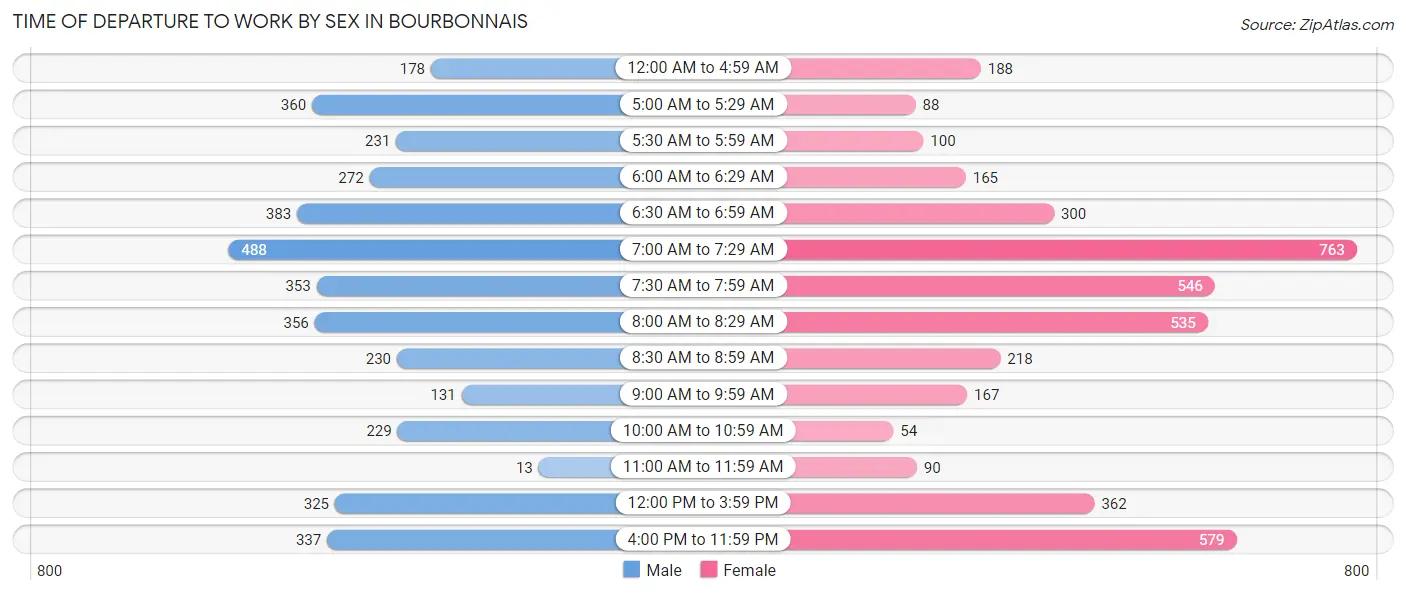
The most frequent times of departure to work in Bourbonnais are 7:00 AM to 7:29 AM (488, 12.6%) for males and 7:00 AM to 7:29 AM (763, 18.4%) for females.
| Time of Departure | Male | Female |
| 12:00 AM to 4:59 AM | 178 (4.6%) | 188 (4.5%) |
| 5:00 AM to 5:29 AM | 360 (9.3%) | 88 (2.1%) |
| 5:30 AM to 5:59 AM | 231 (5.9%) | 100 (2.4%) |
| 6:00 AM to 6:29 AM | 272 (7.0%) | 165 (4.0%) |
| 6:30 AM to 6:59 AM | 383 (9.9%) | 300 (7.2%) |
| 7:00 AM to 7:29 AM | 488 (12.6%) | 763 (18.4%) |
| 7:30 AM to 7:59 AM | 353 (9.1%) | 546 (13.1%) |
| 8:00 AM to 8:29 AM | 356 (9.2%) | 535 (12.9%) |
| 8:30 AM to 8:59 AM | 230 (5.9%) | 218 (5.2%) |
| 9:00 AM to 9:59 AM | 131 (3.4%) | 167 (4.0%) |
| 10:00 AM to 10:59 AM | 229 (5.9%) | 54 (1.3%) |
| 11:00 AM to 11:59 AM | 13 (0.3%) | 90 (2.2%) |
| 12:00 PM to 3:59 PM | 325 (8.4%) | 362 (8.7%) |
| 4:00 PM to 11:59 PM | 337 (8.7%) | 579 (13.9%) |
| Total | 3,886 (100.0%) | 4,155 (100.0%) |
Housing Occupancy in Bourbonnais
Occupancy by Ownership in Bourbonnais
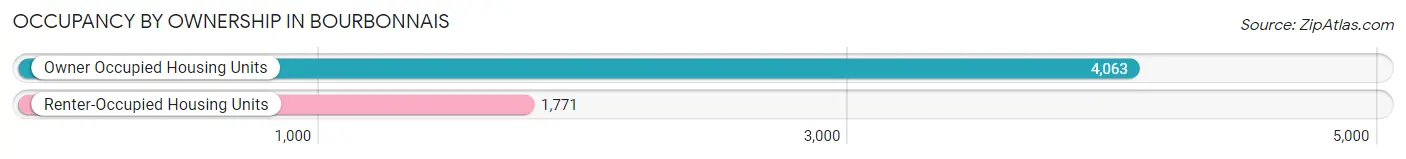
Of the total 5,834 dwellings in Bourbonnais, owner-occupied units account for 4,063 (69.6%), while renter-occupied units make up 1,771 (30.4%).
| Occupancy | # Housing Units | % Housing Units |
| Owner Occupied Housing Units | 4,063 | 69.6% |
| Renter-Occupied Housing Units | 1,771 | 30.4% |
| Total Occupied Housing Units | 5,834 | 100.0% |
Occupancy by Household Size in Bourbonnais
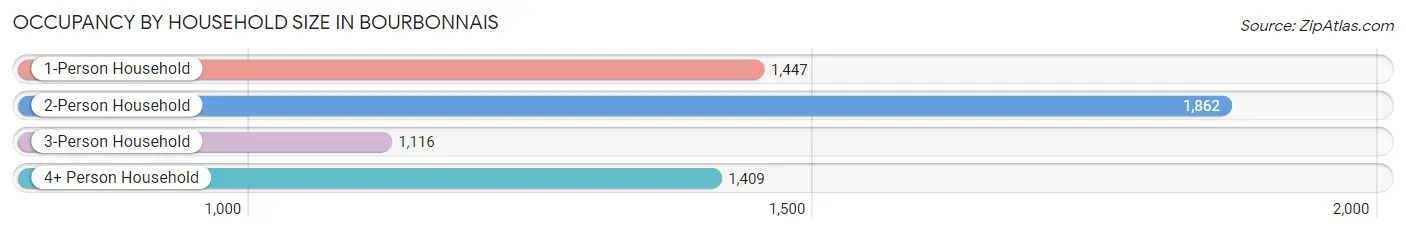
| Household Size | # Housing Units | % Housing Units |
| 1-Person Household | 1,447 | 24.8% |
| 2-Person Household | 1,862 | 31.9% |
| 3-Person Household | 1,116 | 19.1% |
| 4+ Person Household | 1,409 | 24.1% |
| Total Housing Units | 5,834 | 100.0% |
Occupancy by Ownership by Household Size in Bourbonnais
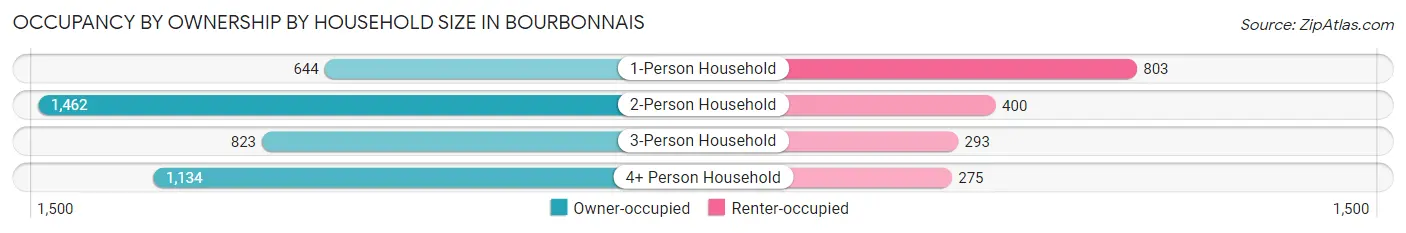
| Household Size | Owner-occupied | Renter-occupied |
| 1-Person Household | 644 (44.5%) | 803 (55.5%) |
| 2-Person Household | 1,462 (78.5%) | 400 (21.5%) |
| 3-Person Household | 823 (73.8%) | 293 (26.3%) |
| 4+ Person Household | 1,134 (80.5%) | 275 (19.5%) |
| Total Housing Units | 4,063 (69.6%) | 1,771 (30.4%) |
Occupancy by Educational Attainment in Bourbonnais

| Household Size | Owner-occupied | Renter-occupied |
| Less than High School | 107 (61.5%) | 67 (38.5%) |
| High School Diploma | 1,035 (63.4%) | 598 (36.6%) |
| College/Associate Degree | 1,184 (62.8%) | 702 (37.2%) |
| Bachelor's Degree or higher | 1,737 (81.1%) | 404 (18.9%) |
Occupancy by Age of Householder in Bourbonnais
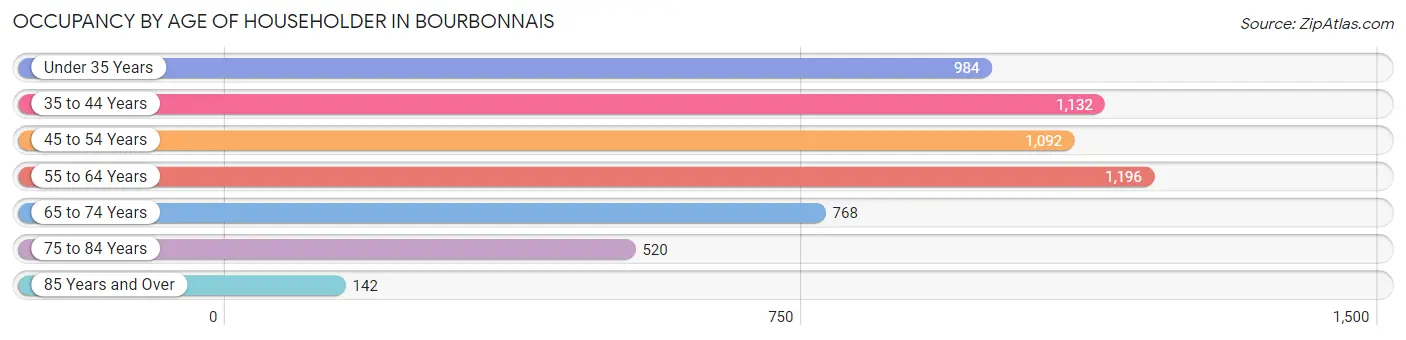
| Age Bracket | # Households | % Households |
| Under 35 Years | 984 | 16.9% |
| 35 to 44 Years | 1,132 | 19.4% |
| 45 to 54 Years | 1,092 | 18.7% |
| 55 to 64 Years | 1,196 | 20.5% |
| 65 to 74 Years | 768 | 13.2% |
| 75 to 84 Years | 520 | 8.9% |
| 85 Years and Over | 142 | 2.4% |
| Total | 5,834 | 100.0% |
Housing Finances in Bourbonnais
Median Income by Occupancy in Bourbonnais
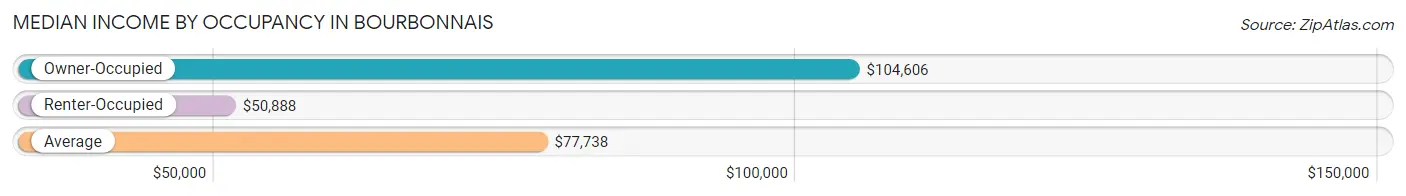
| Occupancy Type | # Households | Median Income |
| Owner-Occupied | 4,063 (69.6%) | $104,606 |
| Renter-Occupied | 1,771 (30.4%) | $50,888 |
| Average | 5,834 (100.0%) | $77,738 |
Occupancy by Householder Income Bracket in Bourbonnais
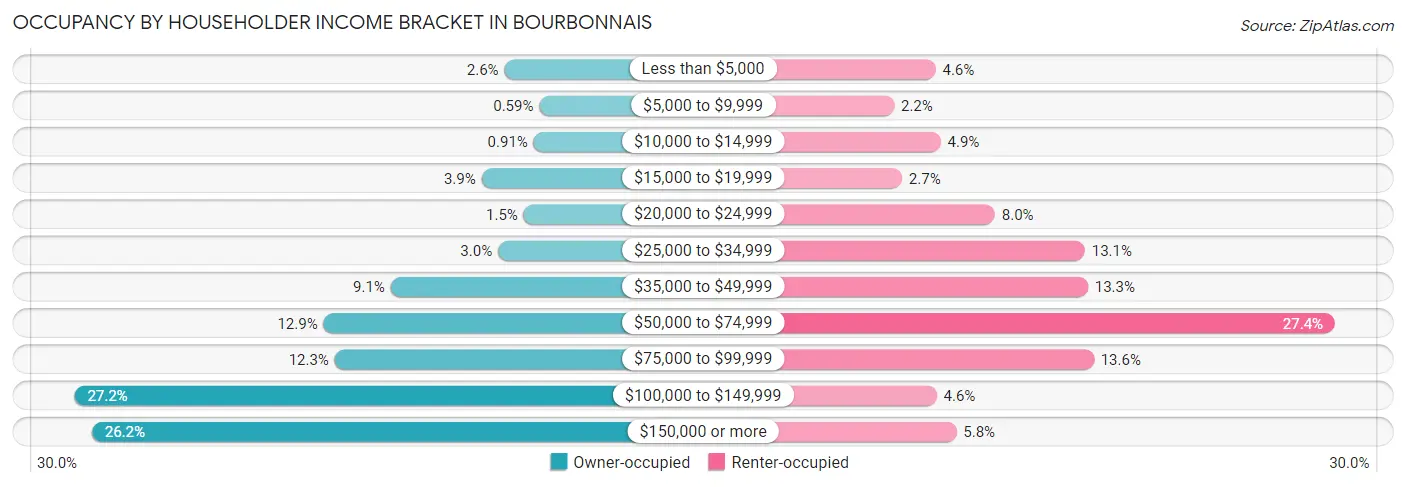
| Income Bracket | Owner-occupied | Renter-occupied |
| Less than $5,000 | 105 (2.6%) | 81 (4.6%) |
| $5,000 to $9,999 | 24 (0.6%) | 39 (2.2%) |
| $10,000 to $14,999 | 37 (0.9%) | 86 (4.9%) |
| $15,000 to $19,999 | 158 (3.9%) | 47 (2.6%) |
| $20,000 to $24,999 | 60 (1.5%) | 141 (8.0%) |
| $25,000 to $34,999 | 120 (2.9%) | 232 (13.1%) |
| $35,000 to $49,999 | 369 (9.1%) | 235 (13.3%) |
| $50,000 to $74,999 | 525 (12.9%) | 485 (27.4%) |
| $75,000 to $99,999 | 499 (12.3%) | 241 (13.6%) |
| $100,000 to $149,999 | 1,103 (27.2%) | 82 (4.6%) |
| $150,000 or more | 1,063 (26.2%) | 102 (5.8%) |
| Total | 4,063 (100.0%) | 1,771 (100.0%) |
Monthly Housing Cost Tiers in Bourbonnais
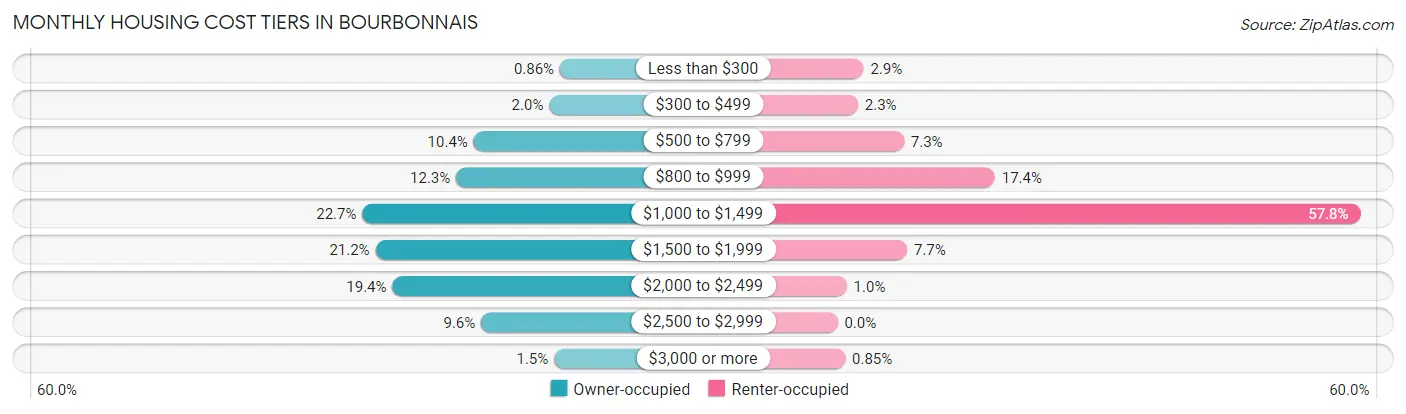
| Monthly Cost | Owner-occupied | Renter-occupied |
| Less than $300 | 35 (0.9%) | 51 (2.9%) |
| $300 to $499 | 83 (2.0%) | 40 (2.3%) |
| $500 to $799 | 422 (10.4%) | 130 (7.3%) |
| $800 to $999 | 501 (12.3%) | 308 (17.4%) |
| $1,000 to $1,499 | 922 (22.7%) | 1,023 (57.8%) |
| $1,500 to $1,999 | 863 (21.2%) | 136 (7.7%) |
| $2,000 to $2,499 | 787 (19.4%) | 18 (1.0%) |
| $2,500 to $2,999 | 389 (9.6%) | 0 (0.0%) |
| $3,000 or more | 61 (1.5%) | 15 (0.9%) |
| Total | 4,063 (100.0%) | 1,771 (100.0%) |
Physical Housing Characteristics in Bourbonnais
Housing Structures in Bourbonnais
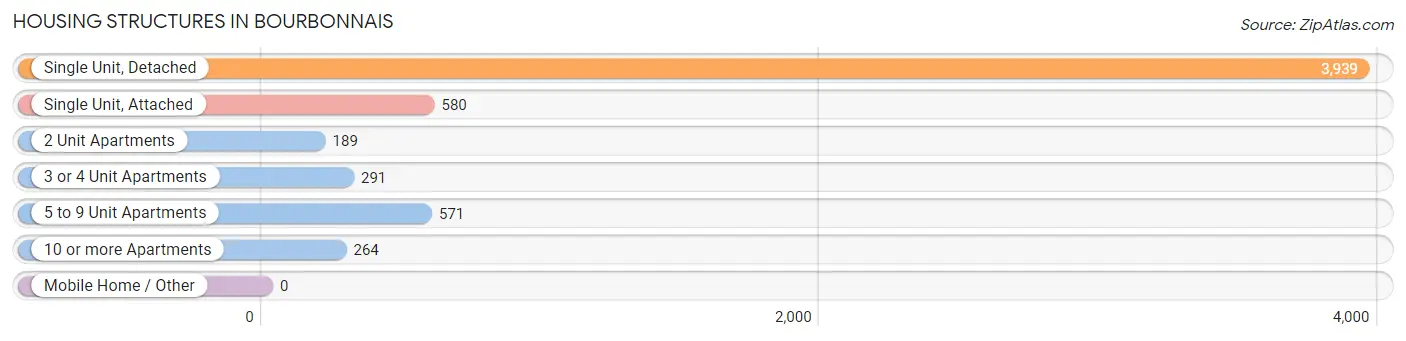
| Structure Type | # Housing Units | % Housing Units |
| Single Unit, Detached | 3,939 | 67.5% |
| Single Unit, Attached | 580 | 9.9% |
| 2 Unit Apartments | 189 | 3.2% |
| 3 or 4 Unit Apartments | 291 | 5.0% |
| 5 to 9 Unit Apartments | 571 | 9.8% |
| 10 or more Apartments | 264 | 4.5% |
| Mobile Home / Other | 0 | 0.0% |
| Total | 5,834 | 100.0% |
Housing Structures by Occupancy in Bourbonnais
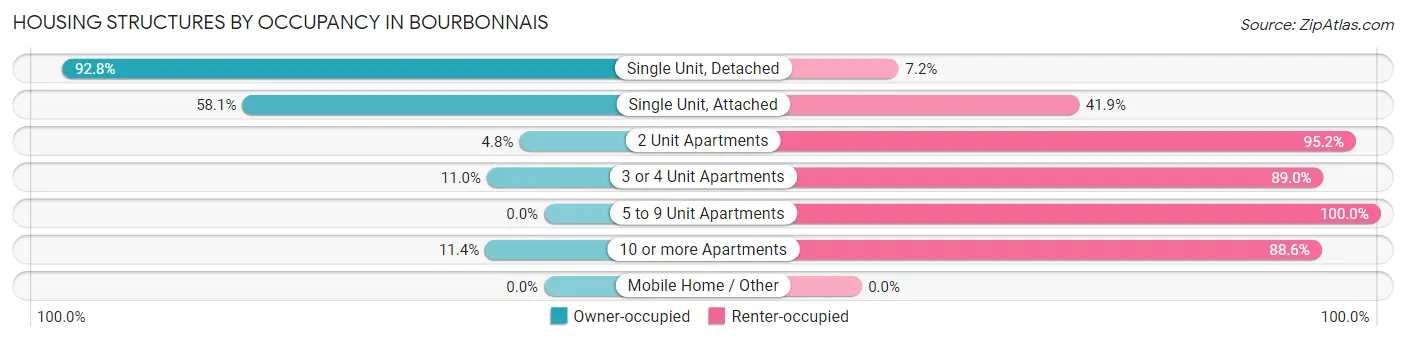
| Structure Type | Owner-occupied | Renter-occupied |
| Single Unit, Detached | 3,655 (92.8%) | 284 (7.2%) |
| Single Unit, Attached | 337 (58.1%) | 243 (41.9%) |
| 2 Unit Apartments | 9 (4.8%) | 180 (95.2%) |
| 3 or 4 Unit Apartments | 32 (11.0%) | 259 (89.0%) |
| 5 to 9 Unit Apartments | 0 (0.0%) | 571 (100.0%) |
| 10 or more Apartments | 30 (11.4%) | 234 (88.6%) |
| Mobile Home / Other | 0 (0.0%) | 0 (0.0%) |
| Total | 4,063 (69.6%) | 1,771 (30.4%) |
Housing Structures by Number of Rooms in Bourbonnais
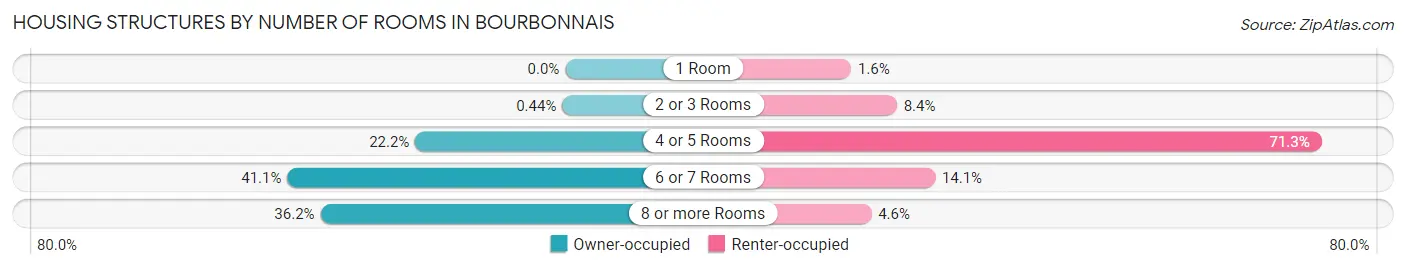
| Number of Rooms | Owner-occupied | Renter-occupied |
| 1 Room | 0 (0.0%) | 29 (1.6%) |
| 2 or 3 Rooms | 18 (0.4%) | 149 (8.4%) |
| 4 or 5 Rooms | 902 (22.2%) | 1,262 (71.3%) |
| 6 or 7 Rooms | 1,671 (41.1%) | 249 (14.1%) |
| 8 or more Rooms | 1,472 (36.2%) | 82 (4.6%) |
| Total | 4,063 (100.0%) | 1,771 (100.0%) |
Housing Structure by Heating Type in Bourbonnais
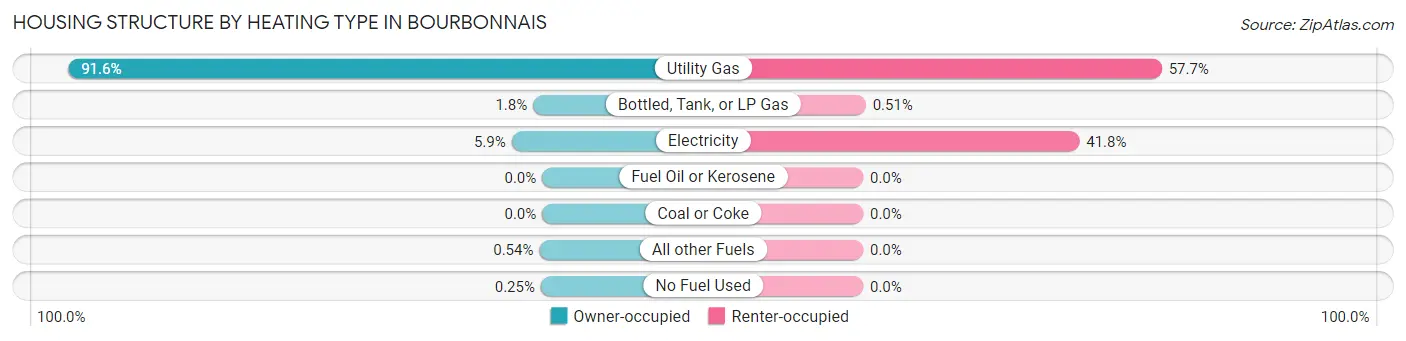
| Heating Type | Owner-occupied | Renter-occupied |
| Utility Gas | 3,720 (91.6%) | 1,022 (57.7%) |
| Bottled, Tank, or LP Gas | 71 (1.8%) | 9 (0.5%) |
| Electricity | 240 (5.9%) | 740 (41.8%) |
| Fuel Oil or Kerosene | 0 (0.0%) | 0 (0.0%) |
| Coal or Coke | 0 (0.0%) | 0 (0.0%) |
| All other Fuels | 22 (0.5%) | 0 (0.0%) |
| No Fuel Used | 10 (0.3%) | 0 (0.0%) |
| Total | 4,063 (100.0%) | 1,771 (100.0%) |
Household Vehicle Usage in Bourbonnais
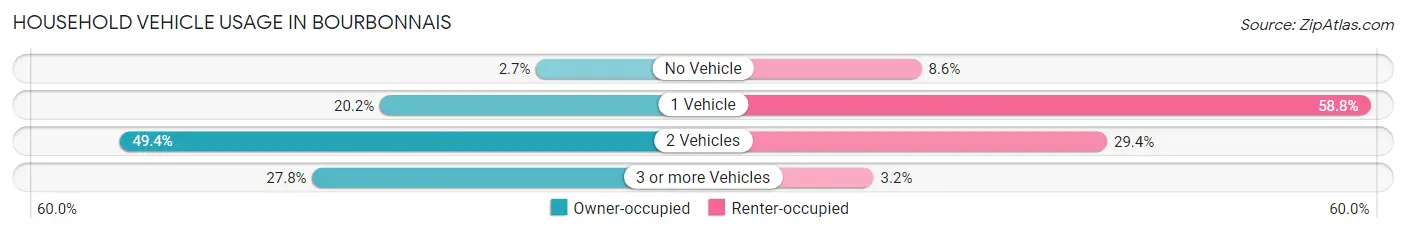
| Vehicles per Household | Owner-occupied | Renter-occupied |
| No Vehicle | 109 (2.7%) | 152 (8.6%) |
| 1 Vehicle | 820 (20.2%) | 1,042 (58.8%) |
| 2 Vehicles | 2,006 (49.4%) | 520 (29.4%) |
| 3 or more Vehicles | 1,128 (27.8%) | 57 (3.2%) |
| Total | 4,063 (100.0%) | 1,771 (100.0%) |
Real Estate & Mortgages in Bourbonnais
Real Estate and Mortgage Overview in Bourbonnais
| Characteristic | Without Mortgage | With Mortgage |
| Housing Units | 1,173 | 2,890 |
| Median Property Value | $235,400 | $238,600 |
| Median Household Income | $75,664 | $815 |
| Monthly Housing Costs | $825 | $61 |
| Real Estate Taxes | $4,996 | $12 |
Property Value by Mortgage Status in Bourbonnais
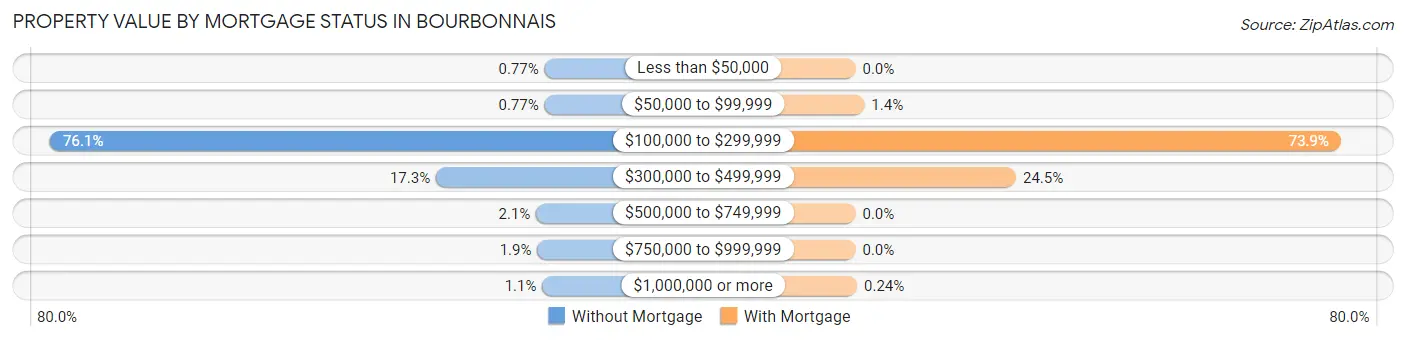
| Property Value | Without Mortgage | With Mortgage |
| Less than $50,000 | 9 (0.8%) | 0 (0.0%) |
| $50,000 to $99,999 | 9 (0.8%) | 39 (1.3%) |
| $100,000 to $299,999 | 893 (76.1%) | 2,137 (73.9%) |
| $300,000 to $499,999 | 203 (17.3%) | 707 (24.5%) |
| $500,000 to $749,999 | 24 (2.1%) | 0 (0.0%) |
| $750,000 to $999,999 | 22 (1.9%) | 0 (0.0%) |
| $1,000,000 or more | 13 (1.1%) | 7 (0.2%) |
| Total | 1,173 (100.0%) | 2,890 (100.0%) |
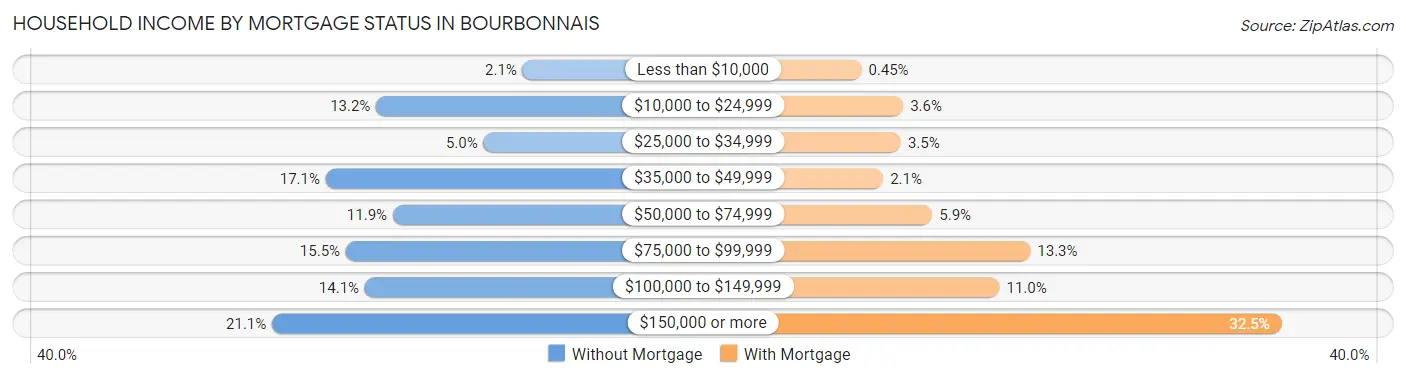
Household Income by Mortgage Status in Bourbonnais
| Household Income | Without Mortgage | With Mortgage |
| Less than $10,000 | 24 (2.1%) | 13 (0.4%) |
| $10,000 to $24,999 | 155 (13.2%) | 105 (3.6%) |
| $25,000 to $34,999 | 59 (5.0%) | 100 (3.5%) |
| $35,000 to $49,999 | 200 (17.1%) | 61 (2.1%) |
| $50,000 to $74,999 | 140 (11.9%) | 169 (5.9%) |
| $75,000 to $99,999 | 182 (15.5%) | 385 (13.3%) |
| $100,000 to $149,999 | 165 (14.1%) | 317 (11.0%) |
| $150,000 or more | 248 (21.1%) | 938 (32.5%) |
| Total | 1,173 (100.0%) | 2,890 (100.0%) |
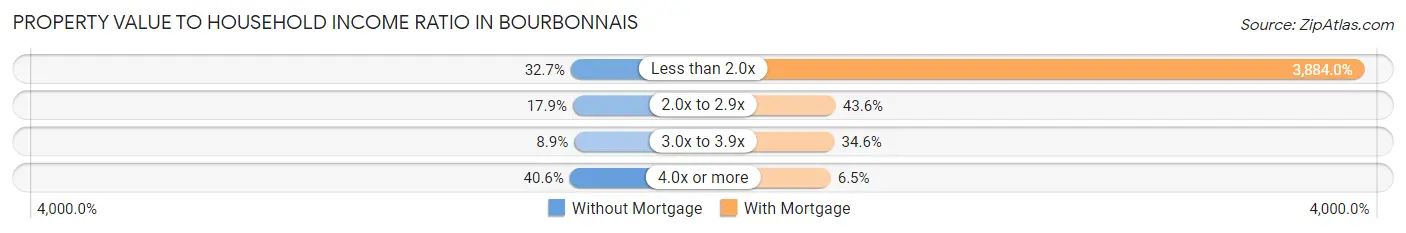
Property Value to Household Income Ratio in Bourbonnais
| Value-to-Income Ratio | Without Mortgage | With Mortgage |
| Less than 2.0x | 383 (32.7%) | 112,248 (3,884.0%) |
| 2.0x to 2.9x | 210 (17.9%) | 1,261 (43.6%) |
| 3.0x to 3.9x | 104 (8.9%) | 1,000 (34.6%) |
| 4.0x or more | 476 (40.6%) | 188 (6.5%) |
| Total | 1,173 (100.0%) | 2,890 (100.0%) |
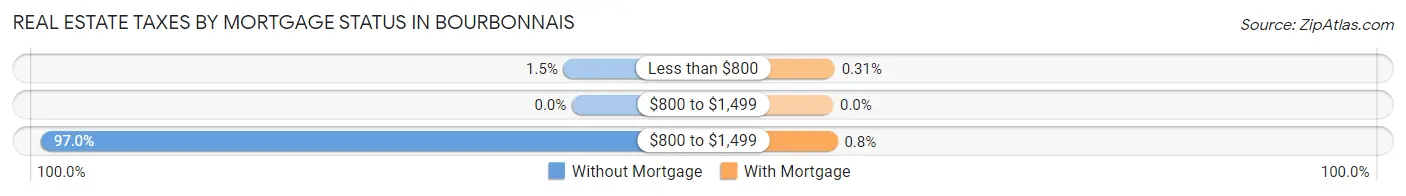
Real Estate Taxes by Mortgage Status in Bourbonnais
| Property Taxes | Without Mortgage | With Mortgage |
| Less than $800 | 18 (1.5%) | 9 (0.3%) |
| $800 to $1,499 | 0 (0.0%) | 0 (0.0%) |
| $800 to $1,499 | 1,138 (97.0%) | 23 (0.8%) |
| Total | 1,173 (100.0%) | 2,890 (100.0%) |
Health & Disability in Bourbonnais
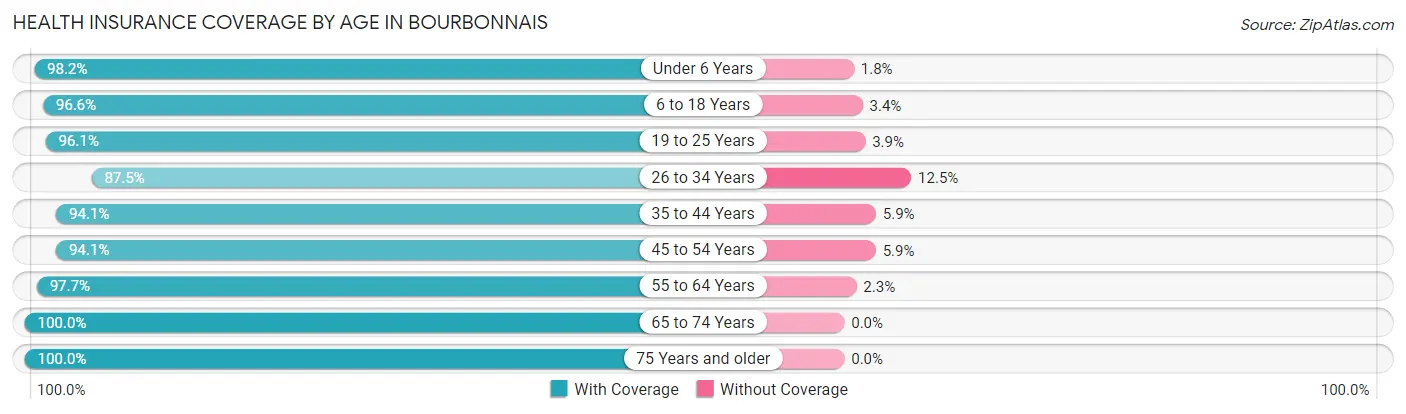
Health Insurance Coverage by Age in Bourbonnais
| Age Bracket | With Coverage | Without Coverage |
| Under 6 Years | 992 (98.2%) | 18 (1.8%) |
| 6 to 18 Years | 3,368 (96.6%) | 119 (3.4%) |
| 19 to 25 Years | 2,812 (96.1%) | 114 (3.9%) |
| 26 to 34 Years | 1,573 (87.5%) | 224 (12.5%) |
| 35 to 44 Years | 1,921 (94.1%) | 120 (5.9%) |
| 45 to 54 Years | 1,878 (94.1%) | 117 (5.9%) |
| 55 to 64 Years | 1,903 (97.7%) | 44 (2.3%) |
| 65 to 74 Years | 1,571 (100.0%) | 0 (0.0%) |
| 75 Years and older | 965 (100.0%) | 0 (0.0%) |
| Total | 16,983 (95.7%) | 756 (4.3%) |
Health Insurance Coverage by Citizenship Status in Bourbonnais
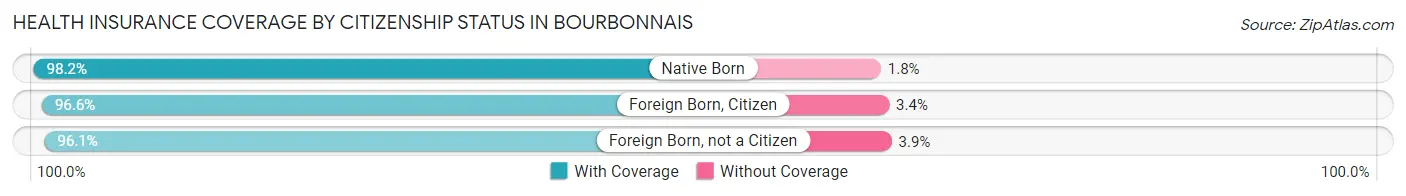
| Citizenship Status | With Coverage | Without Coverage |
| Native Born | 992 (98.2%) | 18 (1.8%) |
| Foreign Born, Citizen | 3,368 (96.6%) | 119 (3.4%) |
| Foreign Born, not a Citizen | 2,812 (96.1%) | 114 (3.9%) |
Health Insurance Coverage by Household Income in Bourbonnais
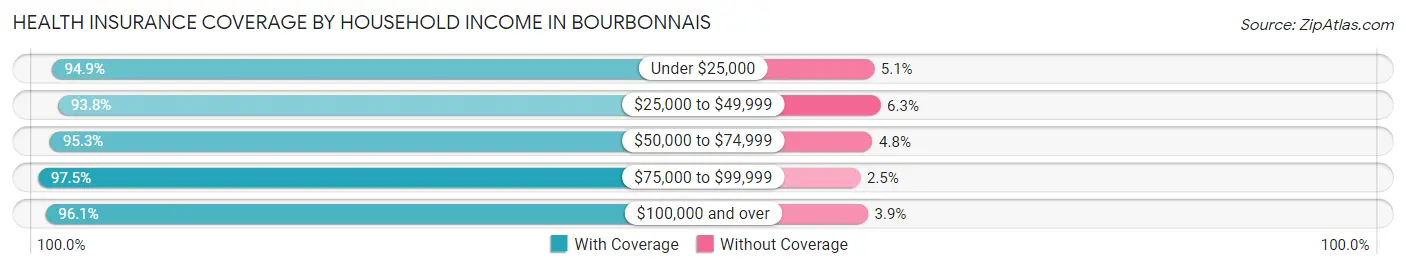
| Household Income | With Coverage | Without Coverage |
| Under $25,000 | 1,554 (94.9%) | 83 (5.1%) |
| $25,000 to $49,999 | 1,650 (93.8%) | 110 (6.2%) |
| $50,000 to $74,999 | 2,489 (95.3%) | 124 (4.8%) |
| $75,000 to $99,999 | 1,886 (97.5%) | 48 (2.5%) |
| $100,000 and over | 7,407 (96.1%) | 300 (3.9%) |
Public vs Private Health Insurance Coverage by Age in Bourbonnais
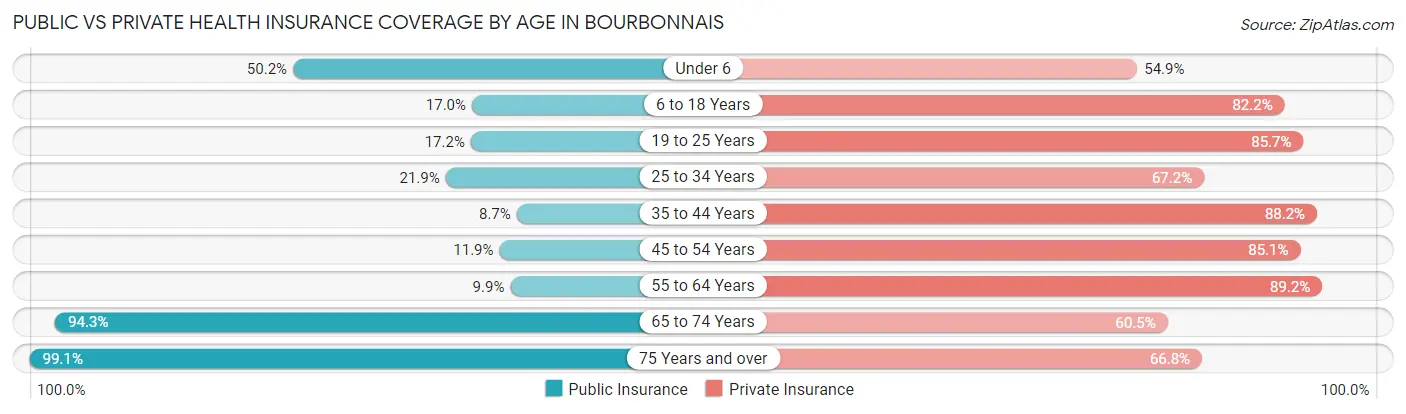
| Age Bracket | Public Insurance | Private Insurance |
| Under 6 | 507 (50.2%) | 554 (54.8%) |
| 6 to 18 Years | 592 (17.0%) | 2,865 (82.2%) |
| 19 to 25 Years | 503 (17.2%) | 2,506 (85.7%) |
| 25 to 34 Years | 393 (21.9%) | 1,208 (67.2%) |
| 35 to 44 Years | 177 (8.7%) | 1,800 (88.2%) |
| 45 to 54 Years | 237 (11.9%) | 1,698 (85.1%) |
| 55 to 64 Years | 192 (9.9%) | 1,736 (89.2%) |
| 65 to 74 Years | 1,482 (94.3%) | 950 (60.5%) |
| 75 Years and over | 956 (99.1%) | 645 (66.8%) |
| Total | 5,039 (28.4%) | 13,962 (78.7%) |
Disability Status by Sex by Age in Bourbonnais
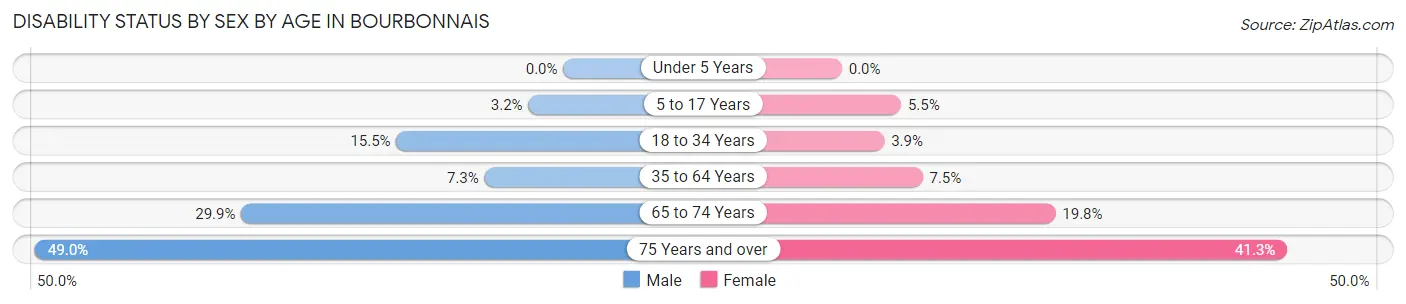
| Age Bracket | Male | Female |
| Under 5 Years | 0 (0.0%) | 0 (0.0%) |
| 5 to 17 Years | 52 (3.2%) | 77 (5.5%) |
| 18 to 34 Years | 374 (15.5%) | 116 (3.9%) |
| 35 to 64 Years | 208 (7.3%) | 235 (7.5%) |
| 65 to 74 Years | 269 (29.9%) | 133 (19.8%) |
| 75 Years and over | 179 (49.0%) | 248 (41.3%) |
Disability Class by Sex by Age in Bourbonnais
Disability Class: Hearing Difficulty
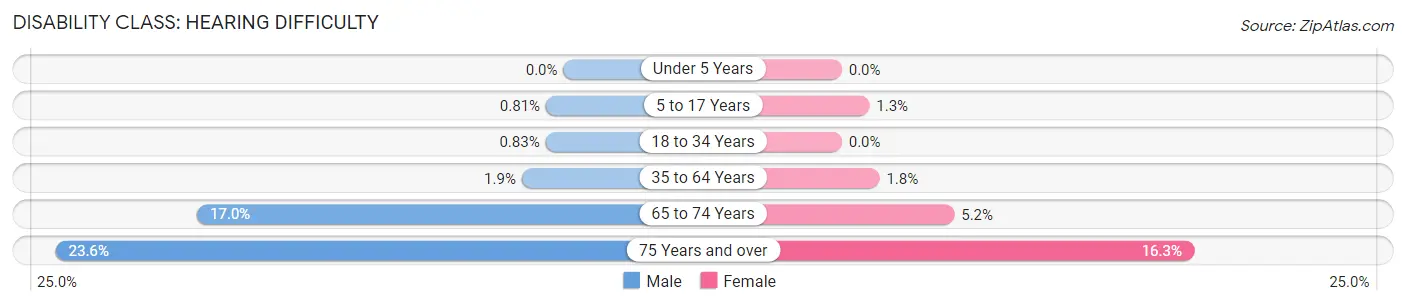
| Age Bracket | Male | Female |
| Under 5 Years | 0 (0.0%) | 0 (0.0%) |
| 5 to 17 Years | 13 (0.8%) | 18 (1.3%) |
| 18 to 34 Years | 20 (0.8%) | 0 (0.0%) |
| 35 to 64 Years | 55 (1.9%) | 55 (1.8%) |
| 65 to 74 Years | 153 (17.0%) | 35 (5.2%) |
| 75 Years and over | 86 (23.6%) | 98 (16.3%) |
Disability Class: Vision Difficulty
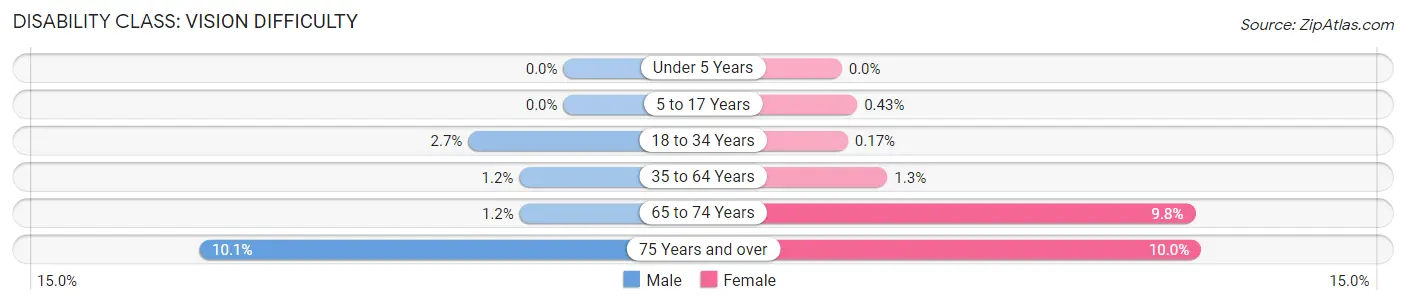
| Age Bracket | Male | Female |
| Under 5 Years | 0 (0.0%) | 0 (0.0%) |
| 5 to 17 Years | 0 (0.0%) | 6 (0.4%) |
| 18 to 34 Years | 64 (2.6%) | 5 (0.2%) |
| 35 to 64 Years | 35 (1.2%) | 40 (1.3%) |
| 65 to 74 Years | 11 (1.2%) | 66 (9.8%) |
| 75 Years and over | 37 (10.1%) | 60 (10.0%) |
Disability Class: Cognitive Difficulty
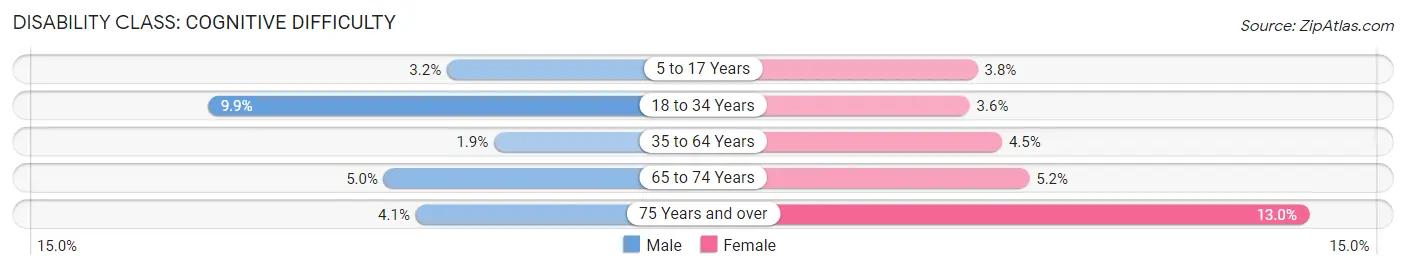
| Age Bracket | Male | Female |
| 5 to 17 Years | 52 (3.2%) | 53 (3.8%) |
| 18 to 34 Years | 239 (9.9%) | 105 (3.6%) |
| 35 to 64 Years | 55 (1.9%) | 140 (4.5%) |
| 65 to 74 Years | 45 (5.0%) | 35 (5.2%) |
| 75 Years and over | 15 (4.1%) | 78 (13.0%) |
Disability Class: Ambulatory Difficulty
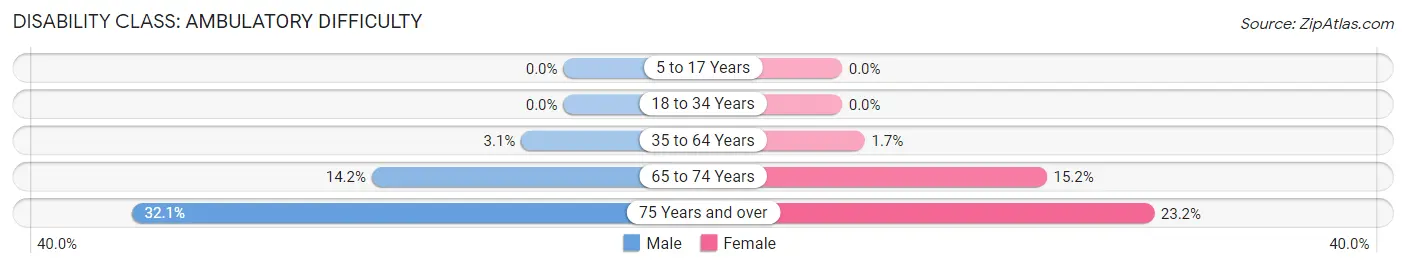
| Age Bracket | Male | Female |
| 5 to 17 Years | 0 (0.0%) | 0 (0.0%) |
| 18 to 34 Years | 0 (0.0%) | 0 (0.0%) |
| 35 to 64 Years | 89 (3.1%) | 53 (1.7%) |
| 65 to 74 Years | 128 (14.2%) | 102 (15.2%) |
| 75 Years and over | 117 (32.1%) | 139 (23.2%) |
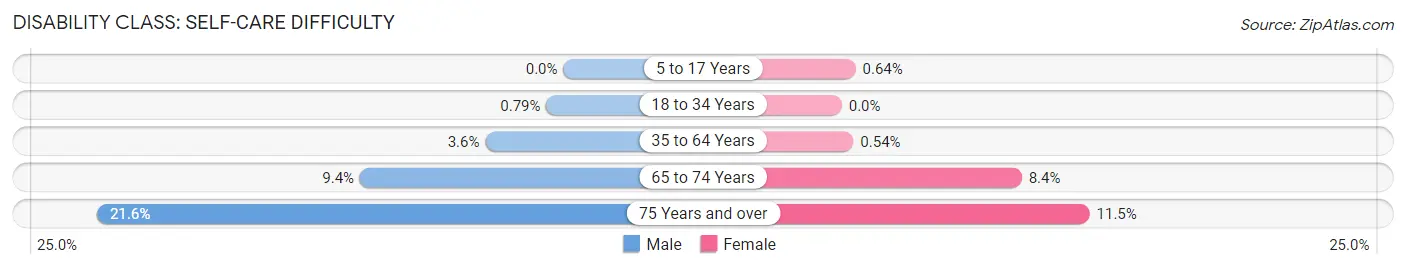
Disability Class: Self-Care Difficulty
| Age Bracket | Male | Female |
| 5 to 17 Years | 0 (0.0%) | 9 (0.6%) |
| 18 to 34 Years | 19 (0.8%) | 0 (0.0%) |
| 35 to 64 Years | 103 (3.6%) | 17 (0.5%) |
| 65 to 74 Years | 85 (9.4%) | 56 (8.4%) |
| 75 Years and over | 79 (21.6%) | 69 (11.5%) |
Technology Access in Bourbonnais
Computing Device Access in Bourbonnais
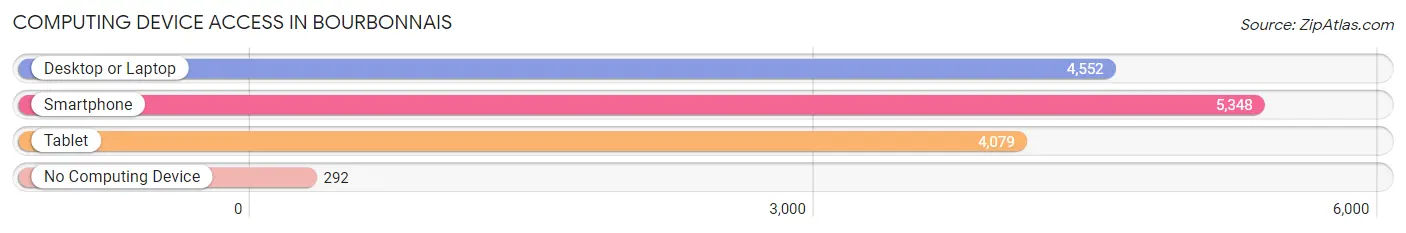
| Device Type | # Households | % Households |
| Desktop or Laptop | 4,552 | 78.0% |
| Smartphone | 5,348 | 91.7% |
| Tablet | 4,079 | 69.9% |
| No Computing Device | 292 | 5.0% |
| Total | 5,834 | 100.0% |
Internet Access in Bourbonnais
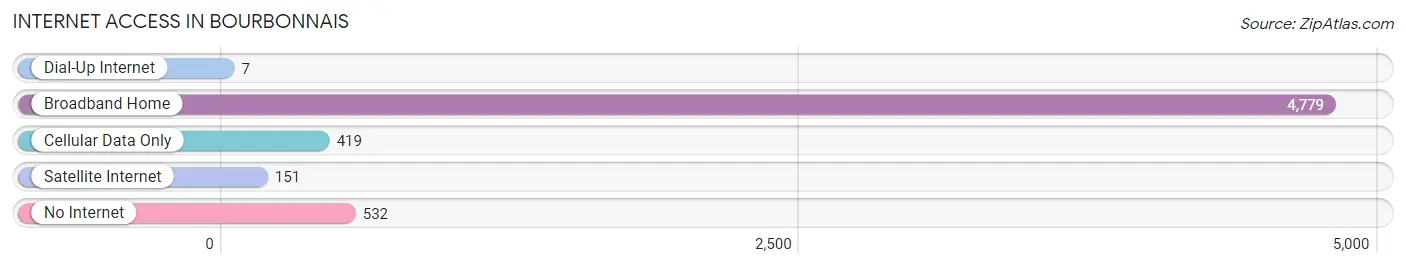
| Internet Type | # Households | % Households |
| Dial-Up Internet | 7 | 0.1% |
| Broadband Home | 4,779 | 81.9% |
| Cellular Data Only | 419 | 7.2% |
| Satellite Internet | 151 | 2.6% |
| No Internet | 532 | 9.1% |
| Total | 5,834 | 100.0% |
Bourbonnais Summary
Bourbonnais, IL is a village located in Kankakee County, Illinois. It is part of the Kankakee-Bradley Metropolitan Statistical Area. The population of Bourbonnais was 15,256 at the 2010 census.
History
The area that is now Bourbonnais was first settled in 1834 by French-Canadian fur trader, Joseph Bourbonnais. He was the first permanent settler in the area and the village was named after him. The village was officially incorporated in 1855.
In the late 19th century, Bourbonnais was a major stop on the Chicago and Alton Railroad. The railroad brought many new settlers to the area and the village grew rapidly. By the early 20th century, Bourbonnais had become a major agricultural center.
In the 1950s, the village began to experience a period of rapid growth. This was due to the construction of the nearby Kankakee River Dam, which provided a reliable source of water for the area. The dam also created a large recreational area, which attracted many visitors to the village.
In the late 20th century, Bourbonnais began to experience a period of economic decline. This was due to the decline of the railroad industry and the closure of many of the local factories. However, the village has since experienced a period of revitalization.
Geography
Bourbonnais is located in Kankakee County, Illinois. It is situated on the Kankakee River, about 40 miles south of Chicago. The village covers an area of 8.2 square miles and has a population density of 1,867 people per square mile.
The village is located in a flat, low-lying area. The climate is humid continental, with hot summers and cold winters. The average annual temperature is 54°F and the average annual precipitation is 37 inches.
Economy
The economy of Bourbonnais is largely based on agriculture and manufacturing. The village is home to several large agricultural companies, including Archer Daniels Midland, Cargill, and Monsanto. The village is also home to several manufacturing companies, including Caterpillar, Inc., and Wabash National Corporation.
The village is also home to several retail stores, restaurants, and other businesses. The village is served by the Kankakee River Valley Airport, which provides air service to Chicago and other cities.
Demographics
As of the 2010 census, the population of Bourbonnais was 15,256. The racial makeup of the village was 87.3% White, 8.2% African American, 0.7% Native American, 0.7% Asian, 0.1% Pacific Islander, 1.2% from other races, and 2.0% from two or more races. Hispanic or Latino of any race were 4.2% of the population.
The median household income in the village was $50,945 and the median family income was $60,945. The per capita income was $24,945. About 8.2% of families and 10.2% of the population were below the poverty line.
Common Questions
What is Per Capita Income in Bourbonnais?
Per Capita income in Bourbonnais is $32,326.
What is the Median Family Income in Bourbonnais?
Median Family Income in Bourbonnais is $98,290.
What is the Median Household income in Bourbonnais?
Median Household Income in Bourbonnais is $77,738.
What is Income or Wage Gap in Bourbonnais?
Income or Wage Gap in Bourbonnais is 43.4%.
Women in Bourbonnais earn 56.6 cents for every dollar earned by a man.
What is Inequality or Gini Index in Bourbonnais?
Inequality or Gini Index in Bourbonnais is 0.40.
What is the Total Population of Bourbonnais?
Total Population of Bourbonnais is 18,125.
What is the Total Male Population of Bourbonnais?
Total Male Population of Bourbonnais is 8,802.
What is the Total Female Population of Bourbonnais?
Total Female Population of Bourbonnais is 9,323.
What is the Ratio of Males per 100 Females in Bourbonnais?
There are 94.41 Males per 100 Females in Bourbonnais.
What is the Ratio of Females per 100 Males in Bourbonnais?
There are 105.92 Females per 100 Males in Bourbonnais.
What is the Median Population Age in Bourbonnais?
Median Population Age in Bourbonnais is 33.9 Years.
What is the Average Family Size in Bourbonnais
Average Family Size in Bourbonnais is 3.2 People.
What is the Average Household Size in Bourbonnais
Average Household Size in Bourbonnais is 2.7 People.
How Large is the Labor Force in Bourbonnais?
There are 9,160 People in the Labor Forcein in Bourbonnais.
What is the Percentage of People in the Labor Force in Bourbonnais?
61.6% of People are in the Labor Force in Bourbonnais.
What is the Unemployment Rate in Bourbonnais?
Unemployment Rate in Bourbonnais is 5.4%.