Harrison, IL Map & Demographics
Harrison Map
Harrison Overview
$24,195
PER CAPITA INCOME
$52,422
AVG HOUSEHOLD INCOME
0.35
INEQUALITY / GINI INDEX
974
TOTAL POPULATION
354
MALE POPULATION
620
FEMALE POPULATION
57.10
MALES / 100 FEMALES
175.14
FEMALES / 100 MALES
43.6
MEDIAN AGE
2.8
AVG FAMILY SIZE
2.4
AVG HOUSEHOLD SIZE
395
LABOR FORCE [ PEOPLE ]
50.8%
PERCENT IN LABOR FORCE
11.4%
UNEMPLOYMENT RATE
Income in Harrison
Income Overview in Harrison
| Characteristic | Number | Measure |
| Per Capita Income | 974 | $24,195 |
| Median Family Income | 288 | $0 |
| Mean Family Income | 288 | $55,240 |
| Median Household Income | 403 | $52,422 |
| Mean Household Income | 403 | $56,730 |
| Income Deficit | 288 | $0 |
| Wage / Income Gap (%) | 974 | 0.00% |
| Wage / Income Gap ($) | 974 | 100.00¢ per $1 |
| Gini / Inequality Index | 974 | 0.35 |
Earnings by Sex in Harrison
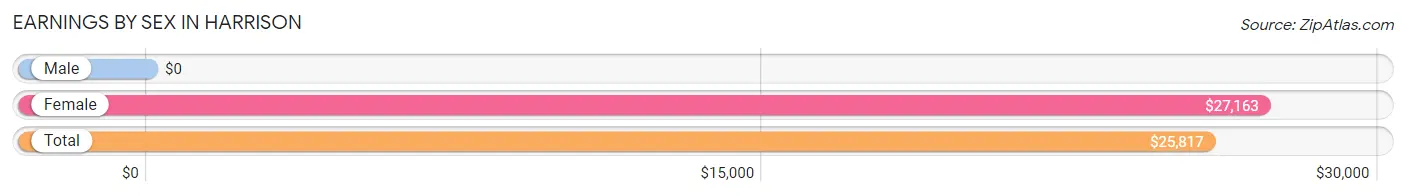
| Sex | Number | Average Earnings |
| Male | 96 (25.3%) | $0 |
| Female | 283 (74.7%) | $27,163 |
| Total | 379 (100.0%) | $25,817 |
Earnings by Sex by Income Bracket in Harrison
The most common earnings brackets in Harrison are $12,500 to $14,999 for men (28 | 29.2%) and $55,000 to $64,999 for women (48 | 17.0%).
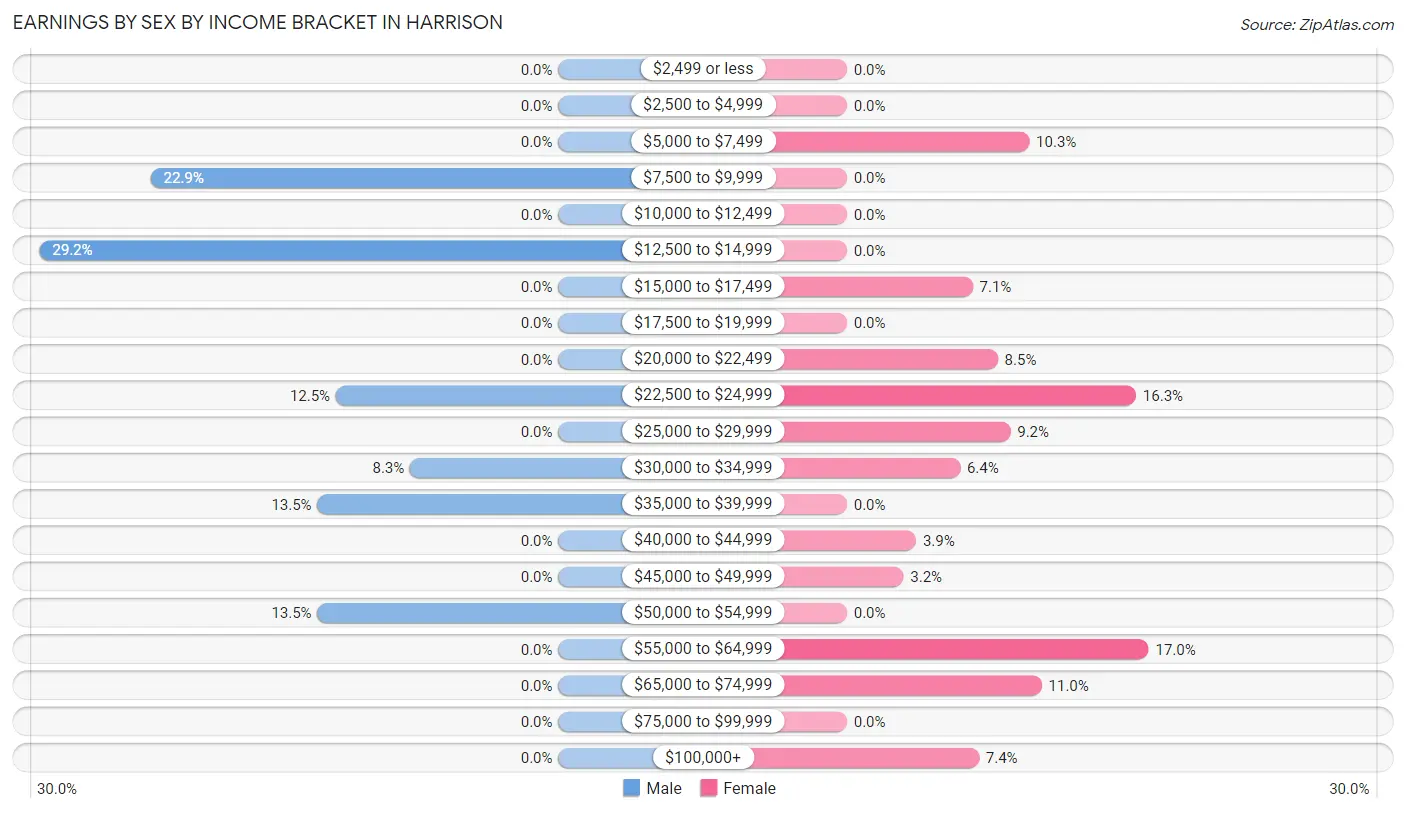
| Income | Male | Female |
| $2,499 or less | 0 (0.0%) | 0 (0.0%) |
| $2,500 to $4,999 | 0 (0.0%) | 0 (0.0%) |
| $5,000 to $7,499 | 0 (0.0%) | 29 (10.2%) |
| $7,500 to $9,999 | 22 (22.9%) | 0 (0.0%) |
| $10,000 to $12,499 | 0 (0.0%) | 0 (0.0%) |
| $12,500 to $14,999 | 28 (29.2%) | 0 (0.0%) |
| $15,000 to $17,499 | 0 (0.0%) | 20 (7.1%) |
| $17,500 to $19,999 | 0 (0.0%) | 0 (0.0%) |
| $20,000 to $22,499 | 0 (0.0%) | 24 (8.5%) |
| $22,500 to $24,999 | 12 (12.5%) | 46 (16.3%) |
| $25,000 to $29,999 | 0 (0.0%) | 26 (9.2%) |
| $30,000 to $34,999 | 8 (8.3%) | 18 (6.4%) |
| $35,000 to $39,999 | 13 (13.5%) | 0 (0.0%) |
| $40,000 to $44,999 | 0 (0.0%) | 11 (3.9%) |
| $45,000 to $49,999 | 0 (0.0%) | 9 (3.2%) |
| $50,000 to $54,999 | 13 (13.5%) | 0 (0.0%) |
| $55,000 to $64,999 | 0 (0.0%) | 48 (17.0%) |
| $65,000 to $74,999 | 0 (0.0%) | 31 (11.0%) |
| $75,000 to $99,999 | 0 (0.0%) | 0 (0.0%) |
| $100,000+ | 0 (0.0%) | 21 (7.4%) |
| Total | 96 (100.0%) | 283 (100.0%) |
Earnings by Sex by Educational Attainment in Harrison
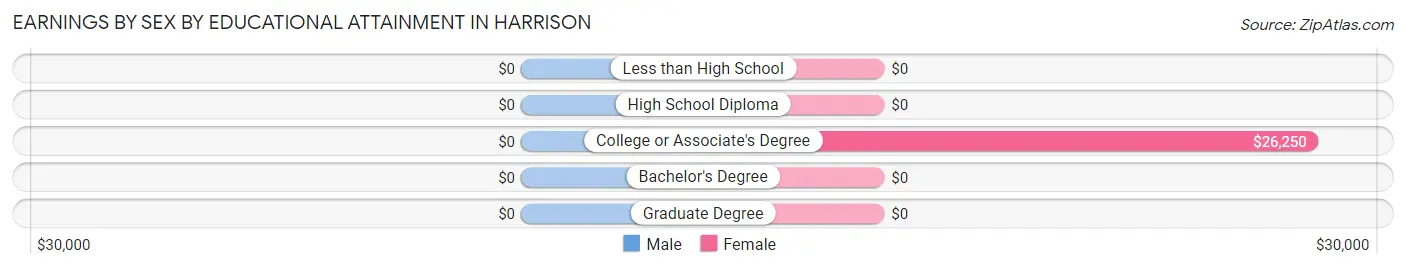
| Educational Attainment | Male Income | Female Income |
| Less than High School | - | - |
| High School Diploma | - | - |
| College or Associate's Degree | - | - |
| Bachelor's Degree | - | - |
| Graduate Degree | - | - |
| Total | $35,577 | $47,639 |
Family Income in Harrison
Family Income Brackets in Harrison
According to the Harrison family income data, there are 89 families falling into the $15,000 to $24,999 income range, which is the most common income bracket and makes up 30.9% of all families.
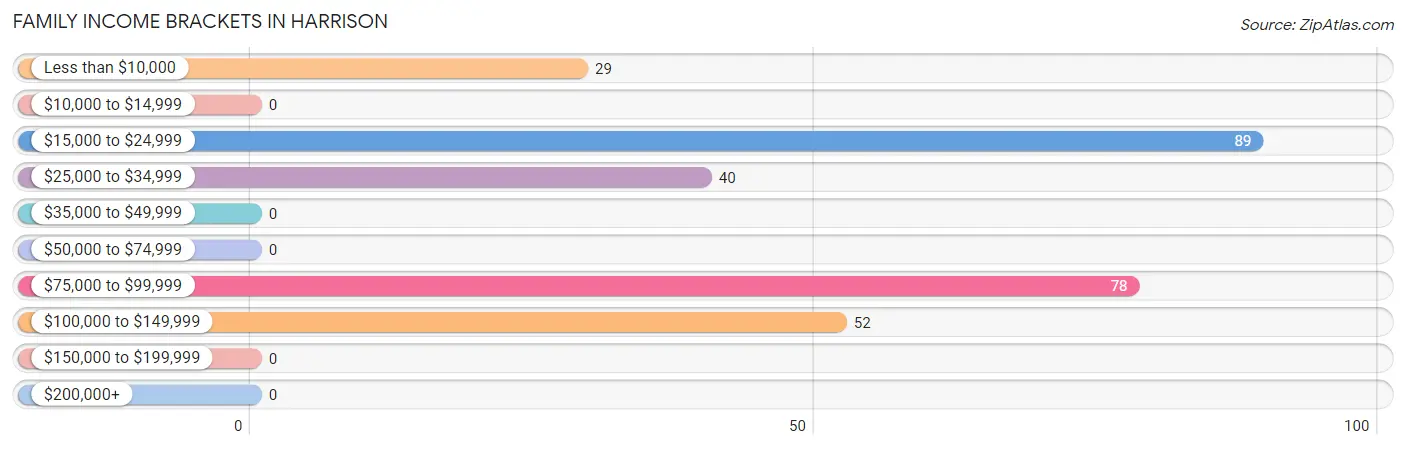
| Income Bracket | # Families | % Families |
| Less than $10,000 | 29 | 10.1% |
| $10,000 to $14,999 | 0 | 0.0% |
| $15,000 to $24,999 | 89 | 30.9% |
| $25,000 to $34,999 | 40 | 13.9% |
| $35,000 to $49,999 | 0 | 0.0% |
| $50,000 to $74,999 | 0 | 0.0% |
| $75,000 to $99,999 | 78 | 27.1% |
| $100,000 to $149,999 | 52 | 18.1% |
| $150,000 to $199,999 | 0 | 0.0% |
| $200,000+ | 0 | 0.0% |
Family Income by Famaliy Size in Harrison
3-person families (89 | 30.9%) account for the highest median family income in Harrison with $85,772 per family, while 3-person families (89 | 30.9%) have the highest median income of $28,591 per family member.
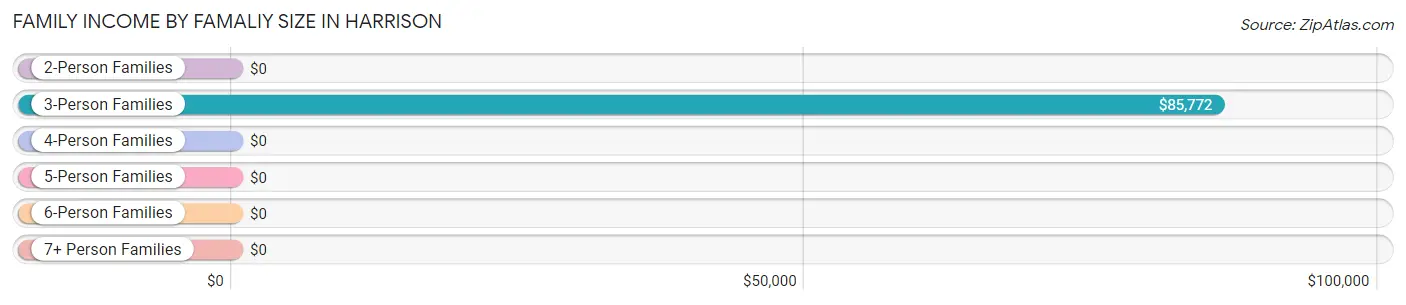
| Income Bracket | # Families | Median Income |
| 2-Person Families | 184 (63.9%) | $0 |
| 3-Person Families | 89 (30.9%) | $85,772 |
| 4-Person Families | 15 (5.2%) | $0 |
| 5-Person Families | 0 (0.0%) | $0 |
| 6-Person Families | 0 (0.0%) | $0 |
| 7+ Person Families | 0 (0.0%) | $0 |
| Total | 288 (100.0%) | $0 |
Family Income by Number of Earners in Harrison
| Number of Earners | # Families | Median Income |
| No Earners | 76 (26.4%) | $0 |
| 1 Earner | 168 (58.3%) | $0 |
| 2 Earners | 29 (10.1%) | $0 |
| 3+ Earners | 15 (5.2%) | $0 |
| Total | 288 (100.0%) | $0 |
Household Income in Harrison
Household Income Brackets in Harrison
With 99 households falling in the category, the $15,000 to $24,999 income range is the most frequent in Harrison, accounting for 24.6% of all households.
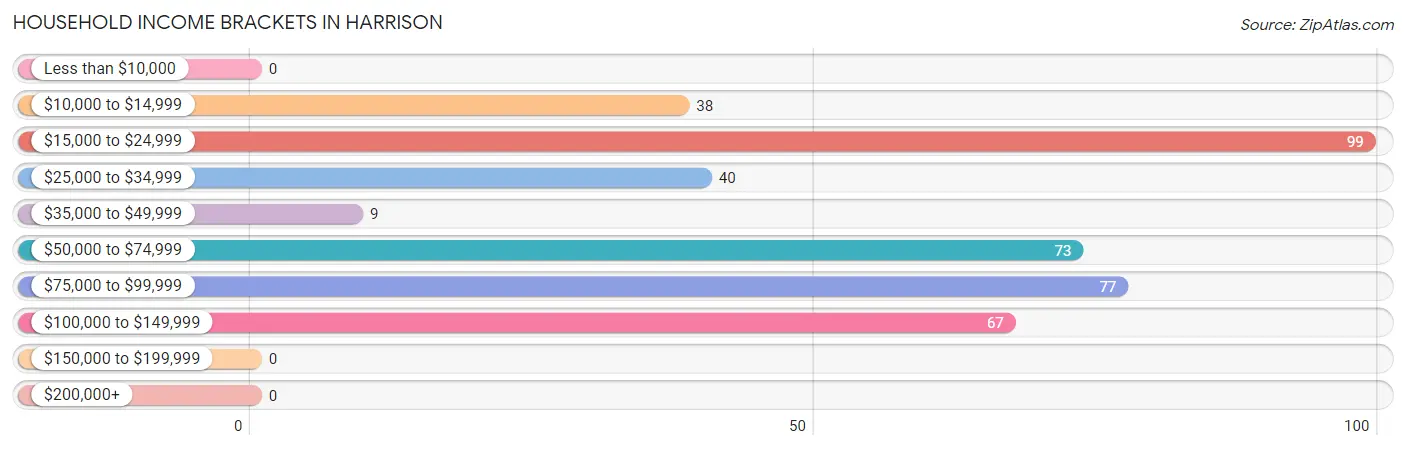
| Income Bracket | # Households | % Households |
| Less than $10,000 | 0 | 0.0% |
| $10,000 to $14,999 | 38 | 9.4% |
| $15,000 to $24,999 | 99 | 24.6% |
| $25,000 to $34,999 | 40 | 9.9% |
| $35,000 to $49,999 | 9 | 2.2% |
| $50,000 to $74,999 | 73 | 18.1% |
| $75,000 to $99,999 | 77 | 19.1% |
| $100,000 to $149,999 | 67 | 16.6% |
| $150,000 to $199,999 | 0 | 0.0% |
| $200,000+ | 0 | 0.0% |
Household Income by Householder Age in Harrison
The median household income in Harrison is $52,422, with the highest median household income of $85,208 found in the 45 to 64 years age bracket for the primary householder. A total of 118 households (29.3%) fall into this category. Meanwhile, the 15 to 24 years age bracket for the primary householder has the lowest median household income of $0, with 29 households (7.2%) in this group.
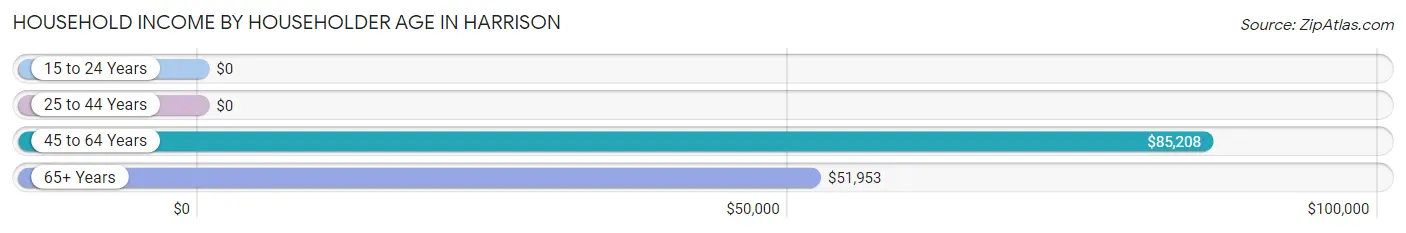
| Income Bracket | # Households | Median Income |
| 15 to 24 Years | 29 (7.2%) | $0 |
| 25 to 44 Years | 71 (17.6%) | $0 |
| 45 to 64 Years | 118 (29.3%) | $85,208 |
| 65+ Years | 185 (45.9%) | $51,953 |
| Total | 403 (100.0%) | $52,422 |
Poverty in Harrison
Income Below Poverty by Sex and Age in Harrison
With 15.5% poverty level for males and 4.7% for females among the residents of Harrison, under 5 year old males and 18 to 24 year old females are the most vulnerable to poverty, with 24 males (100.0%) and 29 females (43.9%) in their respective age groups living below the poverty level.
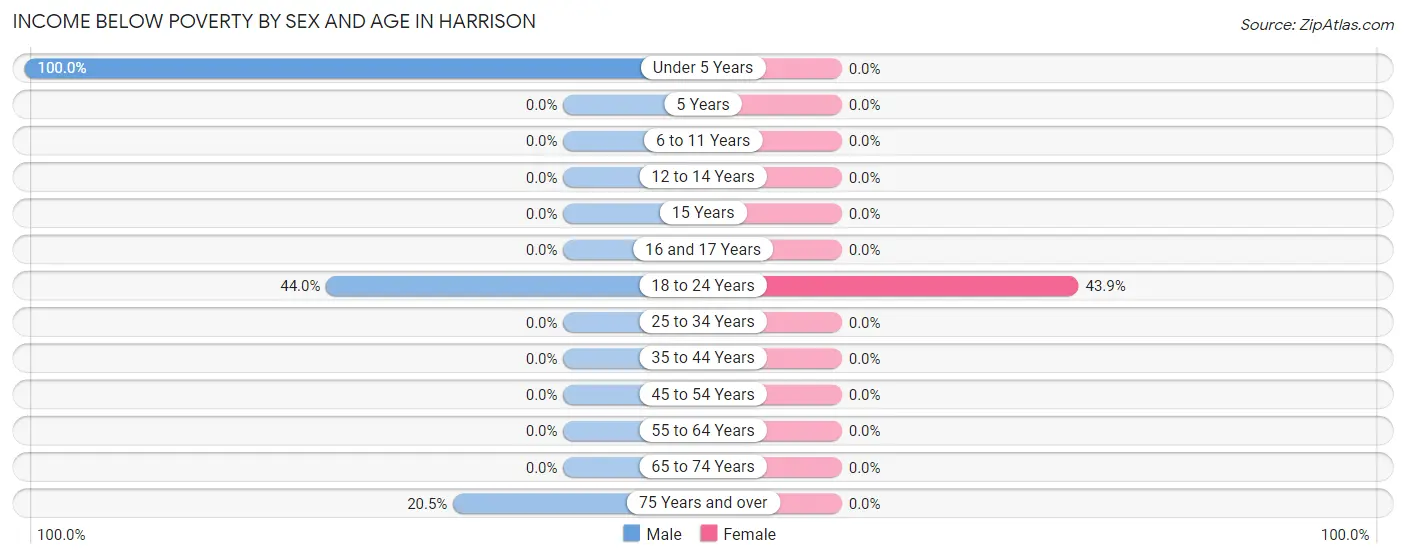
| Age Bracket | Male | Female |
| Under 5 Years | 24 (100.0%) | 0 (0.0%) |
| 5 Years | 0 (0.0%) | 0 (0.0%) |
| 6 to 11 Years | 0 (0.0%) | 0 (0.0%) |
| 12 to 14 Years | 0 (0.0%) | 0 (0.0%) |
| 15 Years | 0 (0.0%) | 0 (0.0%) |
| 16 and 17 Years | 0 (0.0%) | 0 (0.0%) |
| 18 to 24 Years | 22 (44.0%) | 29 (43.9%) |
| 25 to 34 Years | 0 (0.0%) | 0 (0.0%) |
| 35 to 44 Years | 0 (0.0%) | 0 (0.0%) |
| 45 to 54 Years | 0 (0.0%) | 0 (0.0%) |
| 55 to 64 Years | 0 (0.0%) | 0 (0.0%) |
| 65 to 74 Years | 0 (0.0%) | 0 (0.0%) |
| 75 Years and over | 9 (20.4%) | 0 (0.0%) |
| Total | 55 (15.5%) | 29 (4.7%) |
Income Above Poverty by Sex and Age in Harrison
According to the poverty statistics in Harrison, males aged 6 to 11 years and females aged under 5 years are the age groups that are most secure financially, with 100.0% of males and 100.0% of females in these age groups living above the poverty line.
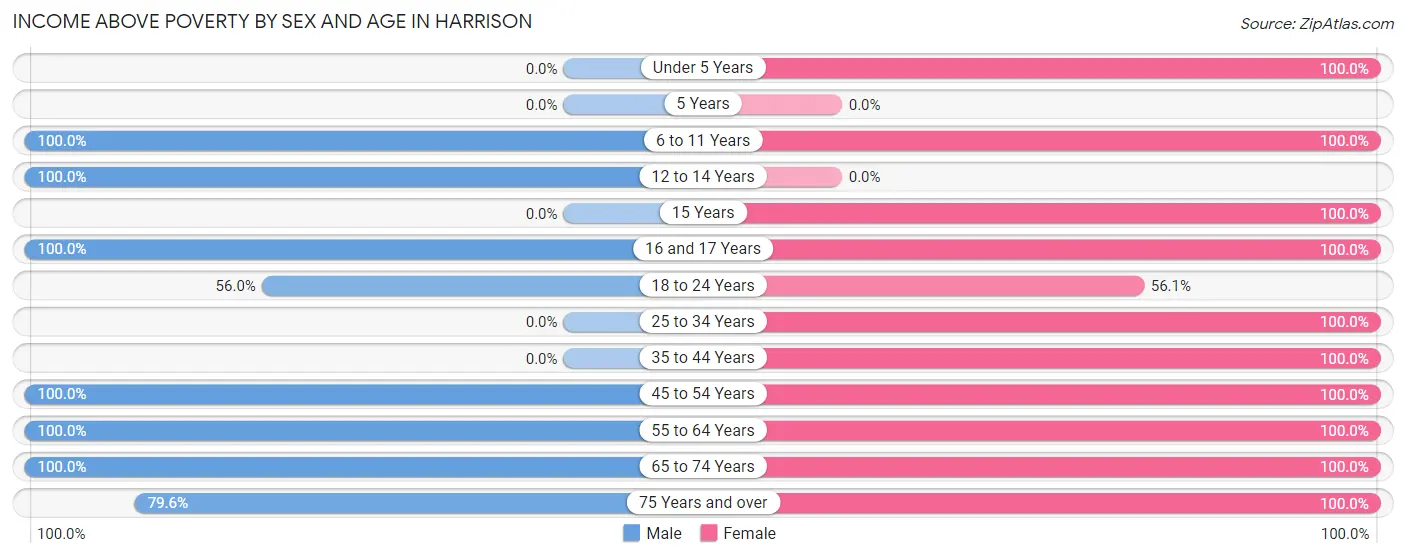
| Age Bracket | Male | Female |
| Under 5 Years | 0 (0.0%) | 43 (100.0%) |
| 5 Years | 0 (0.0%) | 0 (0.0%) |
| 6 to 11 Years | 29 (100.0%) | 35 (100.0%) |
| 12 to 14 Years | 36 (100.0%) | 0 (0.0%) |
| 15 Years | 0 (0.0%) | 30 (100.0%) |
| 16 and 17 Years | 32 (100.0%) | 30 (100.0%) |
| 18 to 24 Years | 28 (56.0%) | 37 (56.1%) |
| 25 to 34 Years | 0 (0.0%) | 67 (100.0%) |
| 35 to 44 Years | 0 (0.0%) | 58 (100.0%) |
| 45 to 54 Years | 13 (100.0%) | 45 (100.0%) |
| 55 to 64 Years | 29 (100.0%) | 88 (100.0%) |
| 65 to 74 Years | 97 (100.0%) | 132 (100.0%) |
| 75 Years and over | 35 (79.5%) | 26 (100.0%) |
| Total | 299 (84.5%) | 591 (95.3%) |
Income Below Poverty Among Married-Couple Families in Harrison
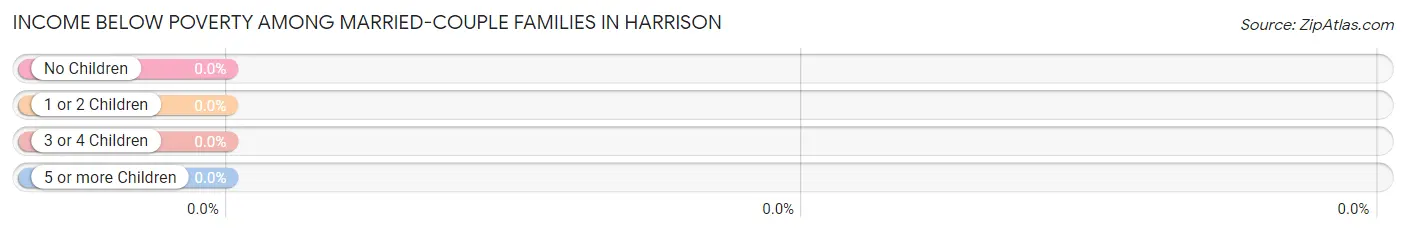
| Children | Above Poverty | Below Poverty |
| No Children | 92 (100.0%) | 0 (0.0%) |
| 1 or 2 Children | 0 (0.0%) | 0 (0.0%) |
| 3 or 4 Children | 0 (0.0%) | 0 (0.0%) |
| 5 or more Children | 0 (0.0%) | 0 (0.0%) |
| Total | 92 (100.0%) | 0 (0.0%) |
Income Below Poverty Among Single-Parent Households in Harrison
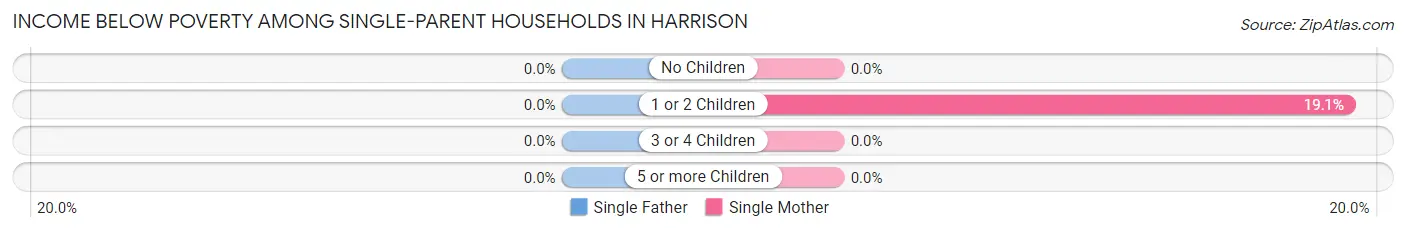
| Children | Single Father | Single Mother |
| No Children | 0 (0.0%) | 0 (0.0%) |
| 1 or 2 Children | 0 (0.0%) | 29 (19.1%) |
| 3 or 4 Children | 0 (0.0%) | 0 (0.0%) |
| 5 or more Children | 0 (0.0%) | 0 (0.0%) |
| Total | 0 (0.0%) | 29 (14.8%) |
Income Below Poverty Among Married-Couple vs Single-Parent Households in Harrison
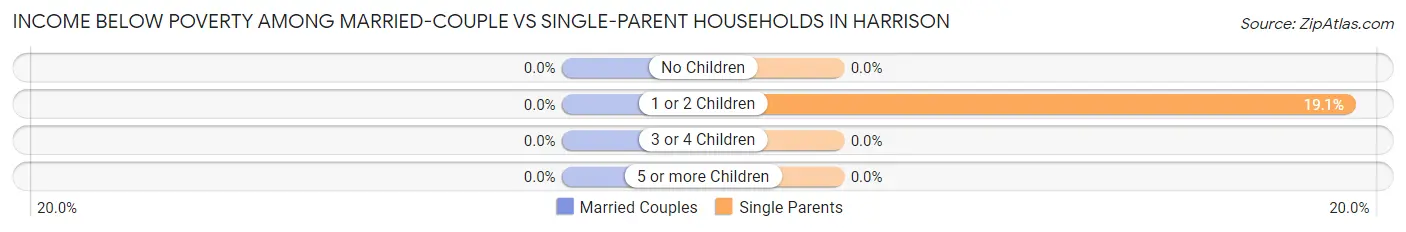
| Children | Married-Couple Families | Single-Parent Households |
| No Children | 0 (0.0%) | 0 (0.0%) |
| 1 or 2 Children | 0 (0.0%) | 29 (19.1%) |
| 3 or 4 Children | 0 (0.0%) | 0 (0.0%) |
| 5 or more Children | 0 (0.0%) | 0 (0.0%) |
| Total | 0 (0.0%) | 29 (14.8%) |
Race in Harrison
The most populous races in Harrison are White / Caucasian (606 | 62.2%), Some other Race (175 | 18.0%), and Two or more Races (103 | 10.6%).
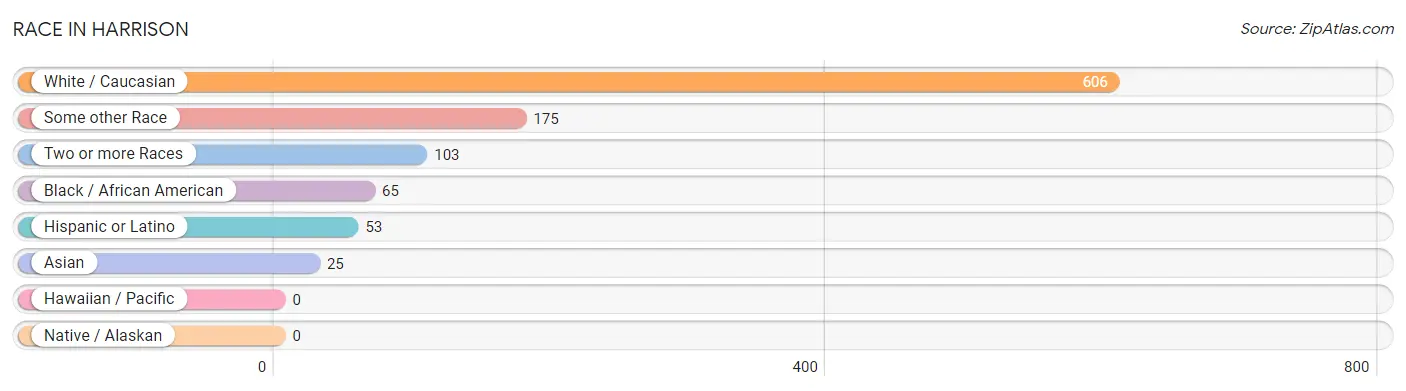
| Race | # Population | % Population |
| Asian | 25 | 2.6% |
| Black / African American | 65 | 6.7% |
| Hawaiian / Pacific | 0 | 0.0% |
| Hispanic or Latino | 53 | 5.4% |
| Native / Alaskan | 0 | 0.0% |
| White / Caucasian | 606 | 62.2% |
| Two or more Races | 103 | 10.6% |
| Some other Race | 175 | 18.0% |
| Total | 974 | 100.0% |
Ancestry in Harrison
The most populous ancestries reported in Harrison are German (278 | 28.5%), Irish (124 | 12.7%), American (110 | 11.3%), English (103 | 10.6%), and Korean (88 | 9.0%), together accounting for 72.2% of all Harrison residents.
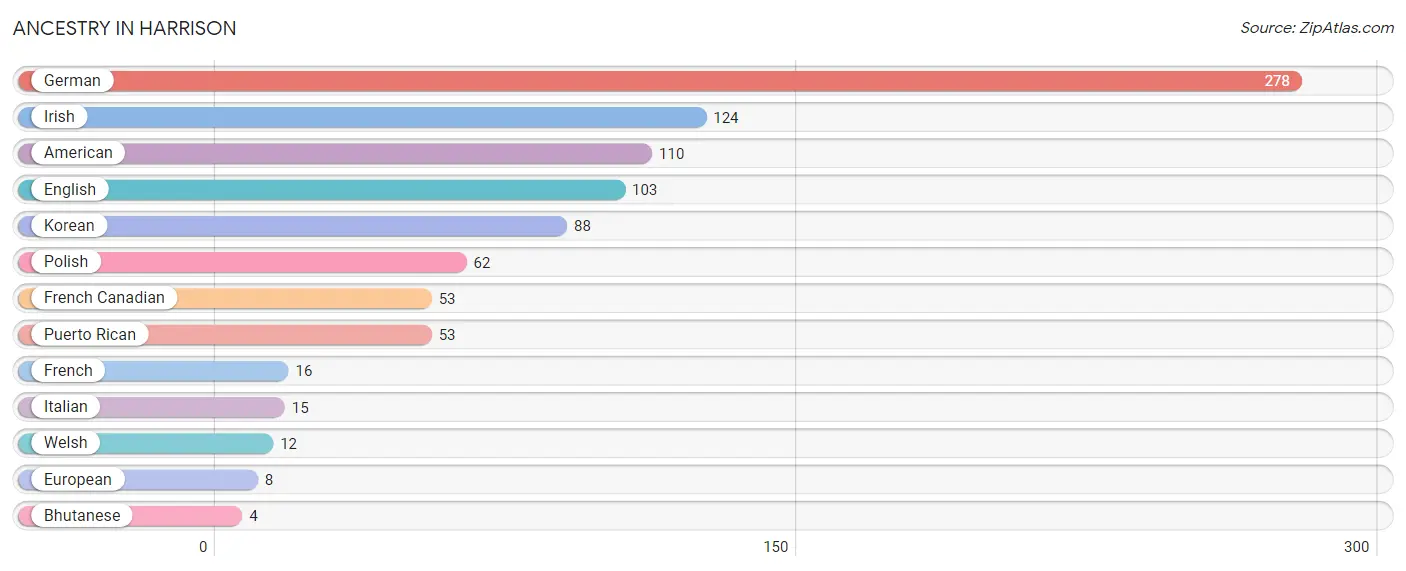
| Ancestry | # Population | % Population |
| American | 110 | 11.3% |
| Bhutanese | 4 | 0.4% |
| English | 103 | 10.6% |
| European | 8 | 0.8% |
| French | 16 | 1.6% |
| French Canadian | 53 | 5.4% |
| German | 278 | 28.5% |
| Irish | 124 | 12.7% |
| Italian | 15 | 1.5% |
| Korean | 88 | 9.0% |
| Polish | 62 | 6.4% |
| Puerto Rican | 53 | 5.4% |
| Welsh | 12 | 1.2% | View All 13 Rows |
Immigrants in Harrison
The most numerous immigrant groups reported in Harrison came from Asia (21 | 2.2%), Philippines (21 | 2.2%), and South Eastern Asia (21 | 2.2%), together accounting for 6.5% of all Harrison residents.
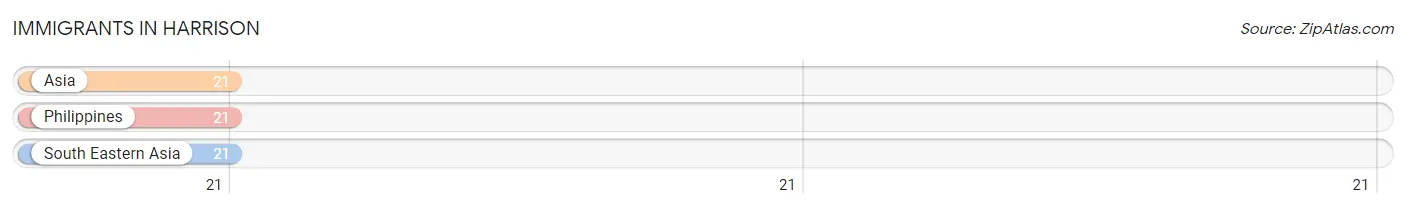
| Immigration Origin | # Population | % Population |
| Asia | 21 | 2.2% |
| Philippines | 21 | 2.2% |
| South Eastern Asia | 21 | 2.2% | View All 3 Rows |
Sex and Age in Harrison
Sex and Age in Harrison
The most populous age groups in Harrison are 70 to 74 Years (85 | 24.0%) for men and 65 to 69 Years (124 | 20.0%) for women.
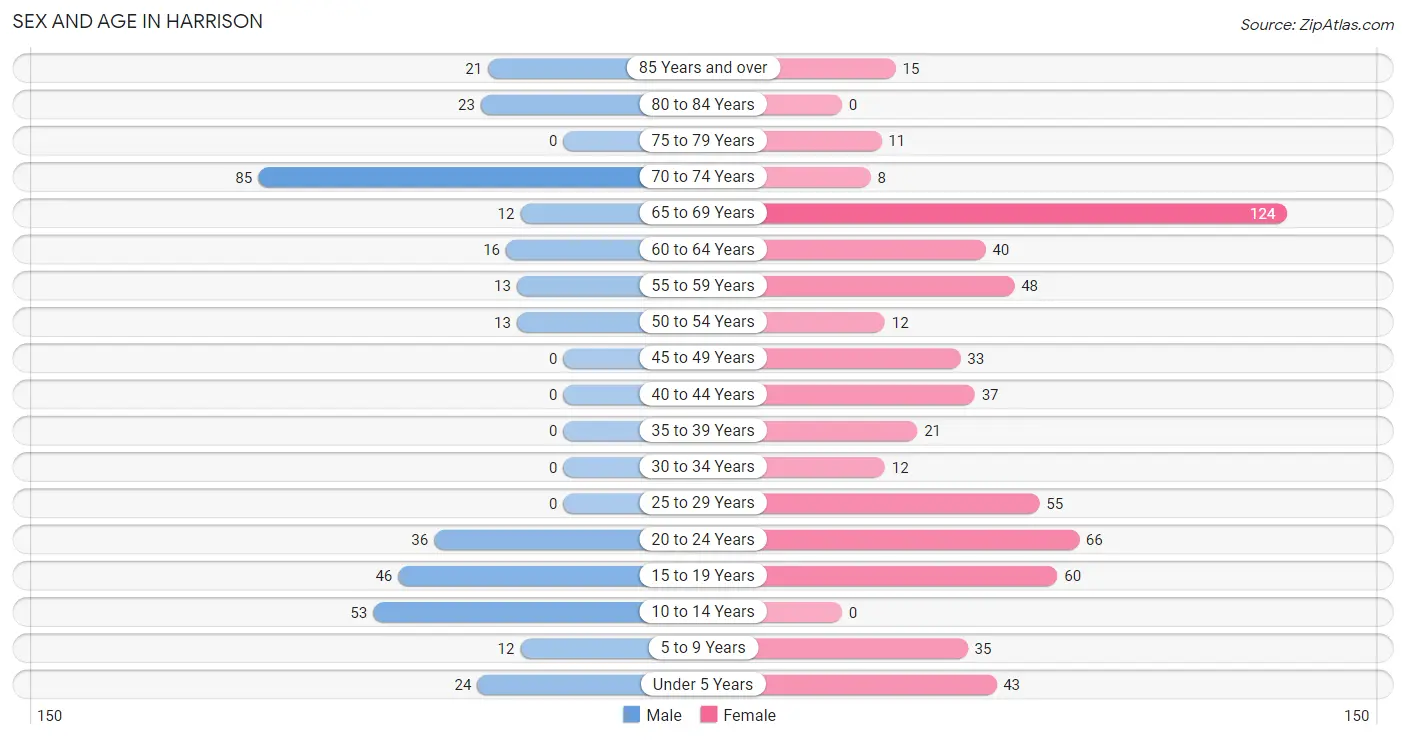
| Age Bracket | Male | Female |
| Under 5 Years | 24 (6.8%) | 43 (6.9%) |
| 5 to 9 Years | 12 (3.4%) | 35 (5.7%) |
| 10 to 14 Years | 53 (15.0%) | 0 (0.0%) |
| 15 to 19 Years | 46 (13.0%) | 60 (9.7%) |
| 20 to 24 Years | 36 (10.2%) | 66 (10.6%) |
| 25 to 29 Years | 0 (0.0%) | 55 (8.9%) |
| 30 to 34 Years | 0 (0.0%) | 12 (1.9%) |
| 35 to 39 Years | 0 (0.0%) | 21 (3.4%) |
| 40 to 44 Years | 0 (0.0%) | 37 (6.0%) |
| 45 to 49 Years | 0 (0.0%) | 33 (5.3%) |
| 50 to 54 Years | 13 (3.7%) | 12 (1.9%) |
| 55 to 59 Years | 13 (3.7%) | 48 (7.7%) |
| 60 to 64 Years | 16 (4.5%) | 40 (6.5%) |
| 65 to 69 Years | 12 (3.4%) | 124 (20.0%) |
| 70 to 74 Years | 85 (24.0%) | 8 (1.3%) |
| 75 to 79 Years | 0 (0.0%) | 11 (1.8%) |
| 80 to 84 Years | 23 (6.5%) | 0 (0.0%) |
| 85 Years and over | 21 (5.9%) | 15 (2.4%) |
| Total | 354 (100.0%) | 620 (100.0%) |
Families and Households in Harrison
Median Family Size in Harrison
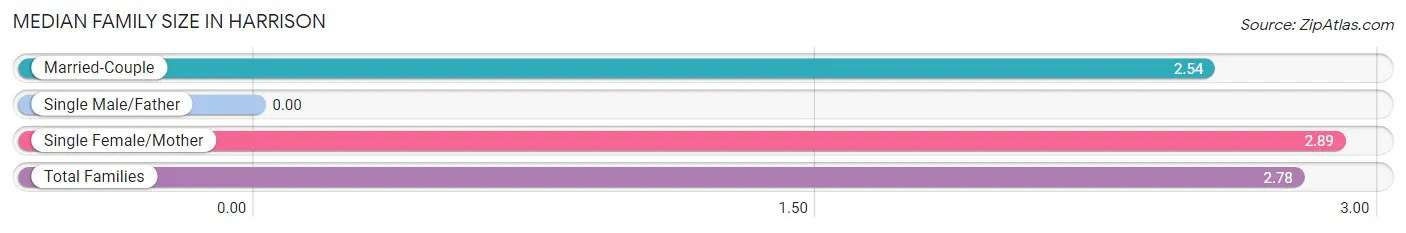
| Family Type | # Families | Family Size |
| Married-Couple | 92 (31.9%) | 2.54 |
| Single Male/Father | 0 (0.0%) | - |
| Single Female/Mother | 196 (68.1%) | 2.89 |
| Total Families | 288 (100.0%) | 2.78 |
Median Household Size in Harrison
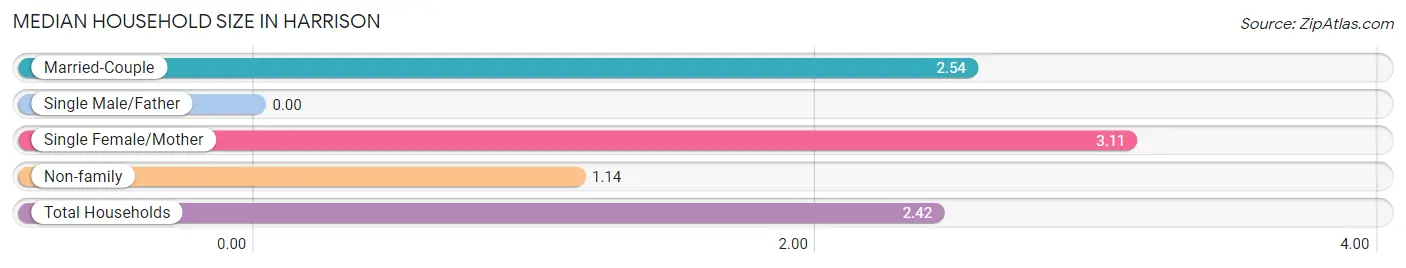
| Household Type | # Households | Household Size |
| Married-Couple | 92 (22.8%) | 2.54 |
| Single Male/Father | 0 (0.0%) | - |
| Single Female/Mother | 196 (48.6%) | 3.11 |
| Non-family | 115 (28.5%) | 1.14 |
| Total Households | 403 (100.0%) | 2.42 |
Household Size by Marriage Status in Harrison
Out of a total of 403 households in Harrison, 288 (71.5%) are family households, while 115 (28.5%) are nonfamily households. The most numerous type of family households are 2-person households, comprising 155, and the most common type of nonfamily households are 1-person households, comprising 90.
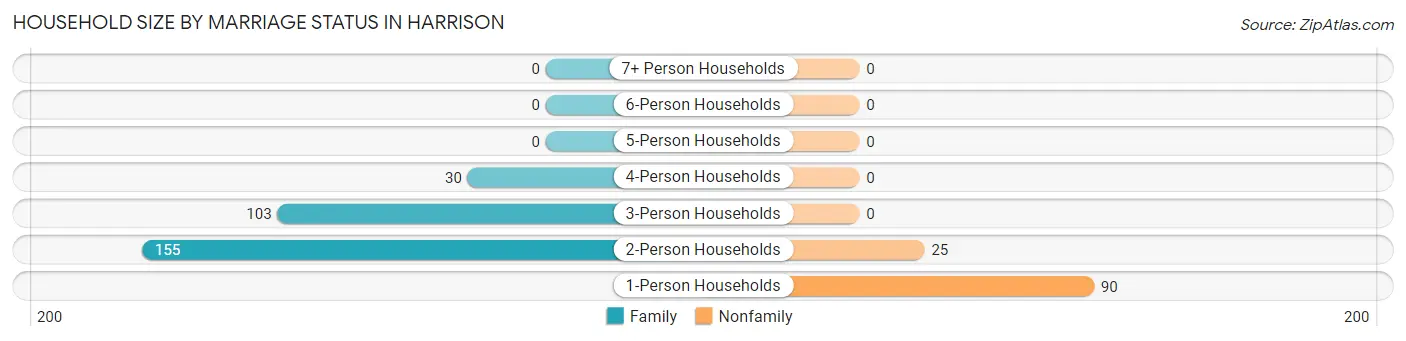
| Household Size | Family Households | Nonfamily Households |
| 1-Person Households | - | 90 (22.3%) |
| 2-Person Households | 155 (38.5%) | 25 (6.2%) |
| 3-Person Households | 103 (25.6%) | 0 (0.0%) |
| 4-Person Households | 30 (7.4%) | 0 (0.0%) |
| 5-Person Households | 0 (0.0%) | 0 (0.0%) |
| 6-Person Households | 0 (0.0%) | 0 (0.0%) |
| 7+ Person Households | 0 (0.0%) | 0 (0.0%) |
| Total | 288 (71.5%) | 115 (28.5%) |
Female Fertility in Harrison
Fertility by Age in Harrison
Average fertility rate in Harrison is 102.0 births per 1,000 women. Women in the age bracket of 20 to 34 years have the highest fertility rate with 218.0 births per 1,000 women. Women in the age bracket of 20 to 34 years acount for 100.0% of all women with births.
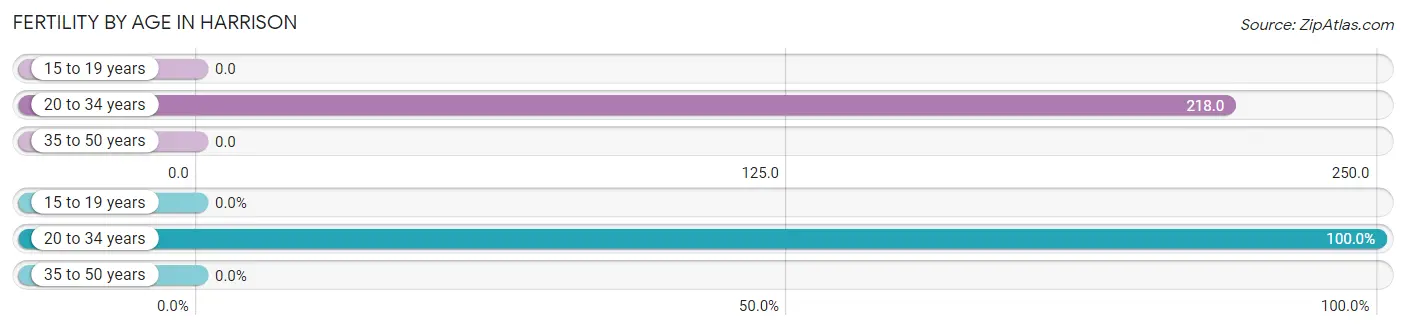
| Age Bracket | Women with Births | Births / 1,000 Women |
| 15 to 19 years | 0 (0.0%) | 0.0 |
| 20 to 34 years | 29 (100.0%) | 218.0 |
| 35 to 50 years | 0 (0.0%) | 0.0 |
| Total | 29 (100.0%) | 102.0 |
Fertility by Age by Marriage Status in Harrison
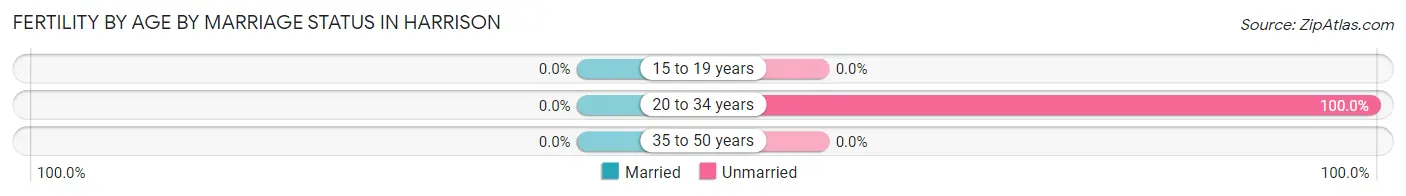
| Age Bracket | Married | Unmarried |
| 15 to 19 years | 0 (0.0%) | 0 (0.0%) |
| 20 to 34 years | 0 (0.0%) | 29 (100.0%) |
| 35 to 50 years | 0 (0.0%) | 0 (0.0%) |
| Total | 0 (0.0%) | 29 (100.0%) |
Fertility by Education in Harrison
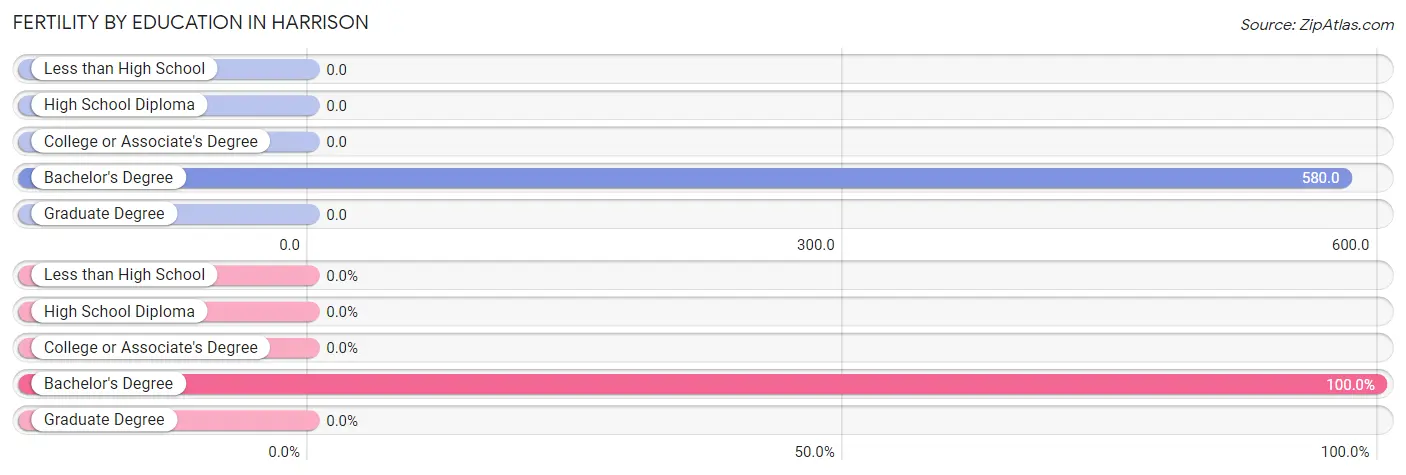
| Educational Attainment | Women with Births | Births / 1,000 Women |
| Less than High School | 0 (0.0%) | 0.0 |
| High School Diploma | 0 (0.0%) | 0.0 |
| College or Associate's Degree | 0 (0.0%) | 0.0 |
| Bachelor's Degree | 29 (100.0%) | 580.0 |
| Graduate Degree | 0 (0.0%) | 0.0 |
| Total | 29 (100.0%) | 102.0 |
Fertility by Education by Marriage Status in Harrison
| Educational Attainment | Married | Unmarried |
| Less than High School | 0 (0.0%) | 0 (0.0%) |
| High School Diploma | 0 (0.0%) | 0 (0.0%) |
| College or Associate's Degree | 0 (0.0%) | 0 (0.0%) |
| Bachelor's Degree | 0 (0.0%) | 29 (100.0%) |
| Graduate Degree | 0 (0.0%) | 0 (0.0%) |
| Total | 0 (0.0%) | 29 (100.0%) |
Employment Characteristics in Harrison
Employment by Class of Employer in Harrison
Among the 350 employed individuals in Harrison, private company employees (179 | 51.1%), self-employed (incorporated) (70 | 20.0%), and not-for-profit organizations (45 | 12.9%) make up the most common classes of employment.
| Employer Class | # Employees | % Employees |
| Private Company Employees | 179 | 51.1% |
| Self-Employed (Incorporated) | 70 | 20.0% |
| Self-Employed (Not Incorporated) | 0 | 0.0% |
| Not-for-profit Organizations | 45 | 12.9% |
| Local Government Employees | 25 | 7.1% |
| State Government Employees | 31 | 8.9% |
| Federal Government Employees | 0 | 0.0% |
| Unpaid Family Workers | 0 | 0.0% |
| Total | 350 | 100.0% |
Employment Status by Age in Harrison
According to the labor force statistics for Harrison, out of the total population over 16 years of age (777), 50.8% or 395 individuals are in the labor force, with 11.4% or 45 of them unemployed. The age group with the highest labor force participation rate is 20 to 24 years, with 100.0% or 102 individuals in the labor force. Within the labor force, the 60 to 64 years age range has the highest percentage of unemployed individuals, with 39.0% or 16 of them being unemployed.
| Age Bracket | In Labor Force | Unemployed |
| 16 to 19 Years | 14 (18.4%) | 0 (0.0%) |
| 20 to 24 Years | 102 (100.0%) | 29 (28.4%) |
| 25 to 29 Years | 55 (100.0%) | 0 (0.0%) |
| 30 to 34 Years | 12 (100.0%) | 0 (0.0%) |
| 35 to 44 Years | 21 (36.2%) | 0 (0.0%) |
| 45 to 54 Years | 58 (100.0%) | 0 (0.0%) |
| 55 to 59 Years | 61 (100.0%) | 0 (0.0%) |
| 60 to 64 Years | 41 (73.2%) | 16 (39.0%) |
| 65 to 74 Years | 20 (8.7%) | 0 (0.0%) |
| 75 Years and over | 11 (15.7%) | 0 (0.0%) |
| Total | 395 (50.8%) | 45 (11.4%) |
Employment Status by Educational Attainment in Harrison
According to labor force statistics for Harrison, 82.7% of individuals (248) out of the total population between 25 and 64 years of age (300) are in the labor force, with 6.5% or 16 of them being unemployed. The group with the highest labor force participation rate are those with the educational attainment of college / associate degree, with 100.0% or 147 individuals in the labor force. Within the labor force, individuals with bachelor's degree or higher education have the highest percentage of unemployment, with 32.7% or 16 of them being unemployed.
| Educational Attainment | In Labor Force | Unemployed |
| Less than High School | 0 (0.0%) | 0 (0.0%) |
| High School Diploma | 52 (59.1%) | 0 (0.0%) |
| College / Associate Degree | 147 (100.0%) | 0 (0.0%) |
| Bachelor's Degree or higher | 49 (100.0%) | 16 (32.7%) |
| Total | 248 (82.7%) | 20 (6.5%) |
Employment Occupations by Sex in Harrison
Management, Business, Science and Arts Occupations
The most common Management, Business, Science and Arts occupations in Harrison are Health Diagnosing & Treating (54 | 15.4%), Community & Social Service (38 | 10.9%), Education, Arts & Media (26 | 7.4%), Management (21 | 6.0%), and Business & Financial (20 | 5.7%).
Management, Business, Science and Arts Occupations by Sex
Within the Management, Business, Science and Arts occupations in Harrison, the most male-oriented occupations are Business & Financial (100.0%), Computers, Engineering & Science (100.0%), and Computers & Mathematics (100.0%), while the most female-oriented occupations are Management (100.0%), Community & Social Service (100.0%), and Education, Arts & Media (100.0%).
| Occupation | Male | Female |
| Management | 0 (0.0%) | 21 (100.0%) |
| Business & Financial | 20 (100.0%) | 0 (0.0%) |
| Computers, Engineering & Science | 14 (100.0%) | 0 (0.0%) |
| Computers & Mathematics | 14 (100.0%) | 0 (0.0%) |
| Architecture & Engineering | 0 (0.0%) | 0 (0.0%) |
| Life, Physical & Social Science | 0 (0.0%) | 0 (0.0%) |
| Community & Social Service | 0 (0.0%) | 38 (100.0%) |
| Education, Arts & Media | 0 (0.0%) | 26 (100.0%) |
| Legal Services & Support | 0 (0.0%) | 0 (0.0%) |
| Education Instruction & Library | 0 (0.0%) | 12 (100.0%) |
| Arts, Media & Entertainment | 0 (0.0%) | 0 (0.0%) |
| Health Diagnosing & Treating | 0 (0.0%) | 54 (100.0%) |
| Health Technologists | 0 (0.0%) | 12 (100.0%) |
| Total (Category) | 34 (23.1%) | 113 (76.9%) |
| Total (Overall) | 96 (27.4%) | 254 (72.6%) |
Services Occupations
The most common Services occupations in Harrison are Personal Care & Service (62 | 17.7%), Healthcare Support (30 | 8.6%), and Cleaning & Maintenance (26 | 7.4%).
Services Occupations by Sex
| Occupation | Male | Female |
| Healthcare Support | 0 (0.0%) | 30 (100.0%) |
| Security & Protection | 0 (0.0%) | 0 (0.0%) |
| Firefighting & Prevention | 0 (0.0%) | 0 (0.0%) |
| Law Enforcement | 0 (0.0%) | 0 (0.0%) |
| Food Preparation & Serving | 0 (0.0%) | 0 (0.0%) |
| Cleaning & Maintenance | 26 (100.0%) | 0 (0.0%) |
| Personal Care & Service | 0 (0.0%) | 62 (100.0%) |
| Total (Category) | 26 (22.0%) | 92 (78.0%) |
| Total (Overall) | 96 (27.4%) | 254 (72.6%) |
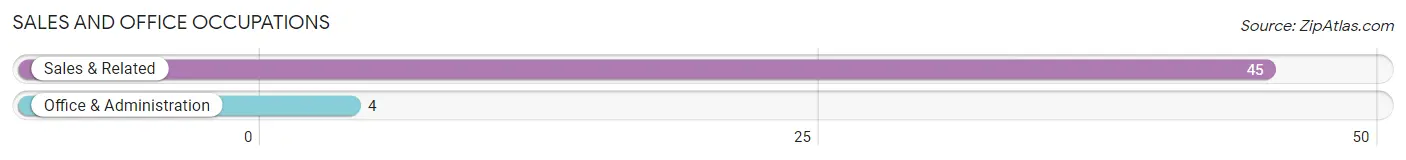
Sales and Office Occupations
The most common Sales and Office occupations in Harrison are Sales & Related (45 | 12.9%), and Office & Administration (4 | 1.1%).
Sales and Office Occupations by Sex
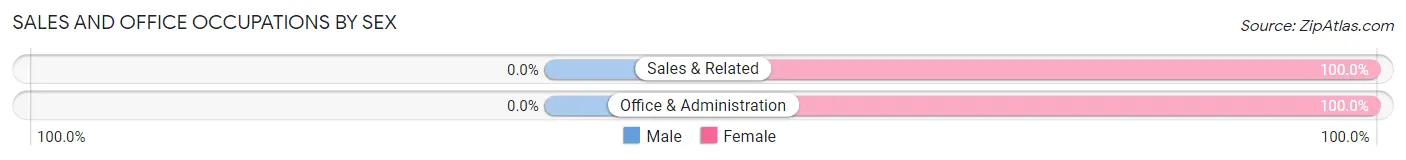
| Occupation | Male | Female |
| Sales & Related | 0 (0.0%) | 45 (100.0%) |
| Office & Administration | 0 (0.0%) | 4 (100.0%) |
| Total (Category) | 0 (0.0%) | 49 (100.0%) |
| Total (Overall) | 96 (27.4%) | 254 (72.6%) |
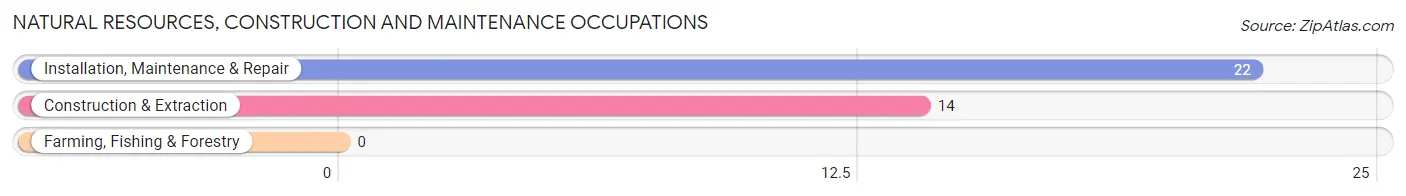
Natural Resources, Construction and Maintenance Occupations
The most common Natural Resources, Construction and Maintenance occupations in Harrison are Installation, Maintenance & Repair (22 | 6.3%), and Construction & Extraction (14 | 4.0%).
Natural Resources, Construction and Maintenance Occupations by Sex
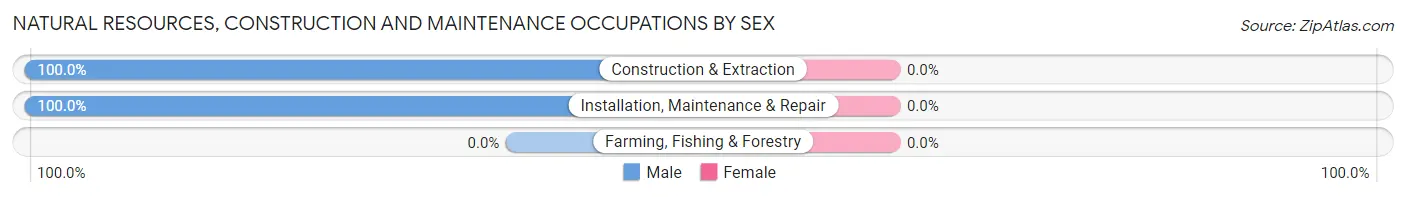
| Occupation | Male | Female |
| Farming, Fishing & Forestry | 0 (0.0%) | 0 (0.0%) |
| Construction & Extraction | 14 (100.0%) | 0 (0.0%) |
| Installation, Maintenance & Repair | 22 (100.0%) | 0 (0.0%) |
| Total (Category) | 36 (100.0%) | 0 (0.0%) |
| Total (Overall) | 96 (27.4%) | 254 (72.6%) |
Production, Transportation and Moving Occupations
Production, Transportation and Moving Occupations by Sex
| Occupation | Male | Female |
| Production | 0 (0.0%) | 0 (0.0%) |
| Transportation | 0 (0.0%) | 0 (0.0%) |
| Material Moving | 0 (0.0%) | 0 (0.0%) |
| Total (Category) | 0 (0.0%) | 0 (0.0%) |
| Total (Overall) | 96 (27.4%) | 254 (72.6%) |
Employment Industries by Sex in Harrison
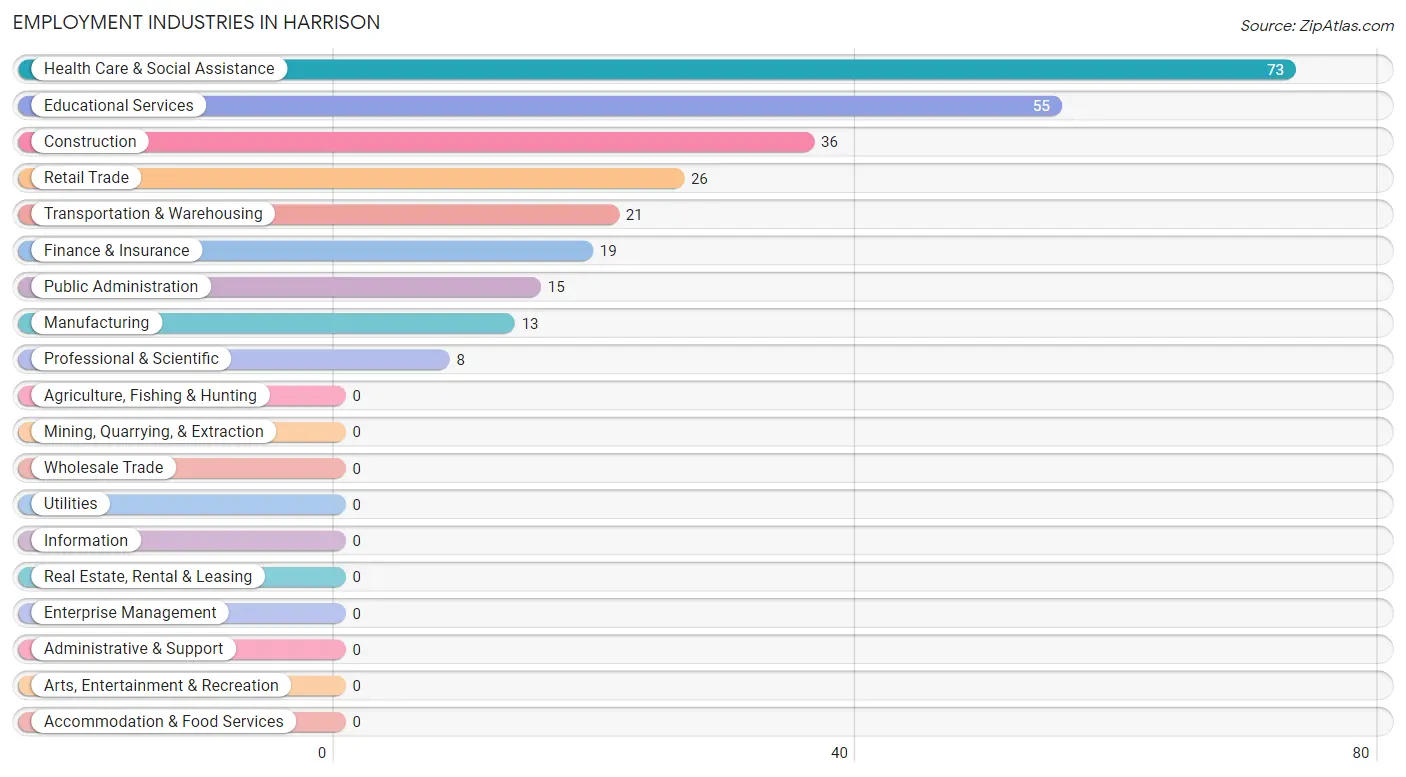
Employment Industries in Harrison
The major employment industries in Harrison include Health Care & Social Assistance (73 | 20.9%), Educational Services (55 | 15.7%), Construction (36 | 10.3%), Retail Trade (26 | 7.4%), and Transportation & Warehousing (21 | 6.0%).
Employment Industries by Sex in Harrison
The Harrison industries that see more men than women are Construction (100.0%), Manufacturing (100.0%), and Professional & Scientific (100.0%), whereas the industries that tend to have a higher number of women are Retail Trade (100.0%), Transportation & Warehousing (100.0%), and Finance & Insurance (100.0%).
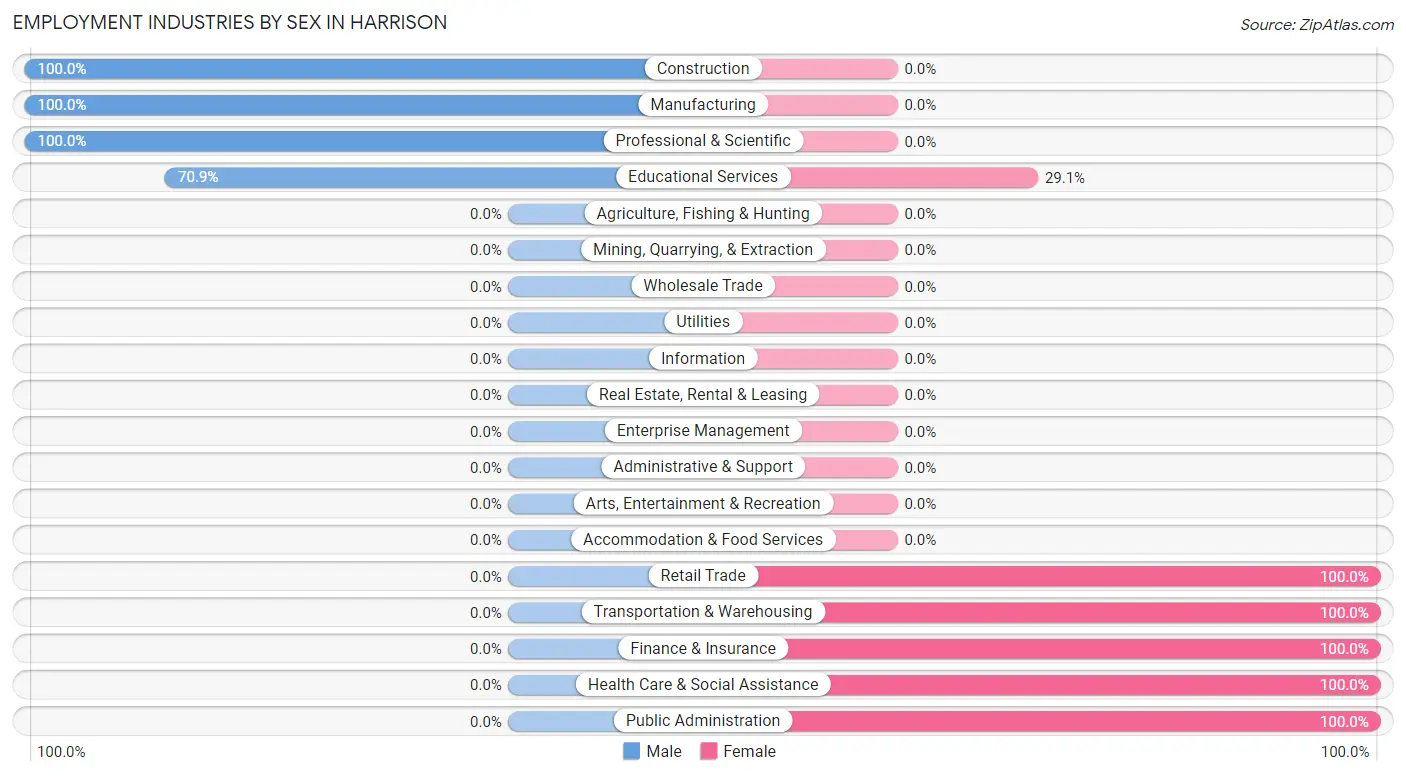
| Industry | Male | Female |
| Agriculture, Fishing & Hunting | 0 (0.0%) | 0 (0.0%) |
| Mining, Quarrying, & Extraction | 0 (0.0%) | 0 (0.0%) |
| Construction | 36 (100.0%) | 0 (0.0%) |
| Manufacturing | 13 (100.0%) | 0 (0.0%) |
| Wholesale Trade | 0 (0.0%) | 0 (0.0%) |
| Retail Trade | 0 (0.0%) | 26 (100.0%) |
| Transportation & Warehousing | 0 (0.0%) | 21 (100.0%) |
| Utilities | 0 (0.0%) | 0 (0.0%) |
| Information | 0 (0.0%) | 0 (0.0%) |
| Finance & Insurance | 0 (0.0%) | 19 (100.0%) |
| Real Estate, Rental & Leasing | 0 (0.0%) | 0 (0.0%) |
| Professional & Scientific | 8 (100.0%) | 0 (0.0%) |
| Enterprise Management | 0 (0.0%) | 0 (0.0%) |
| Administrative & Support | 0 (0.0%) | 0 (0.0%) |
| Educational Services | 39 (70.9%) | 16 (29.1%) |
| Health Care & Social Assistance | 0 (0.0%) | 73 (100.0%) |
| Arts, Entertainment & Recreation | 0 (0.0%) | 0 (0.0%) |
| Accommodation & Food Services | 0 (0.0%) | 0 (0.0%) |
| Public Administration | 0 (0.0%) | 15 (100.0%) |
| Total | 96 (27.4%) | 254 (72.6%) |
Education in Harrison
School Enrollment in Harrison
The most common levels of schooling among the 238 students in Harrison are high school (108 | 45.4%), elementary school (47 | 19.8%), and college / undergraduate (46 | 19.3%).
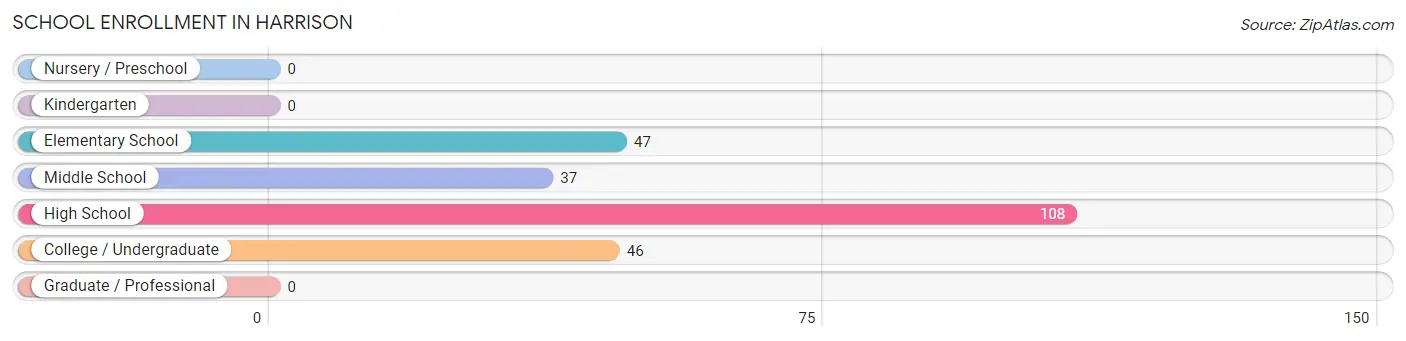
| School Level | # Students | % Students |
| Nursery / Preschool | 0 | 0.0% |
| Kindergarten | 0 | 0.0% |
| Elementary School | 47 | 19.8% |
| Middle School | 37 | 15.5% |
| High School | 108 | 45.4% |
| College / Undergraduate | 46 | 19.3% |
| Graduate / Professional | 0 | 0.0% |
| Total | 238 | 100.0% |
School Enrollment by Age by Funding Source in Harrison
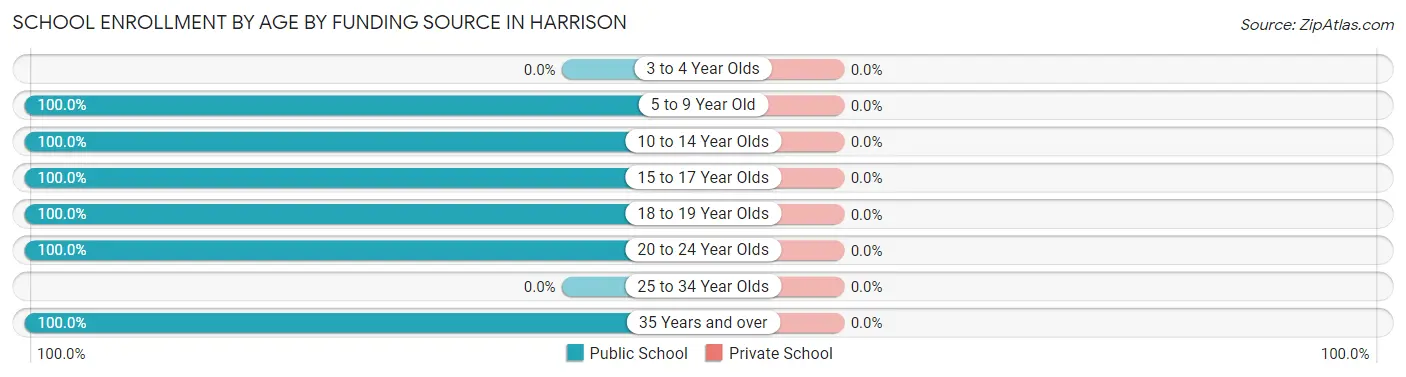
| Age Bracket | Public School | Private School |
| 3 to 4 Year Olds | 0 (0.0%) | 0 (0.0%) |
| 5 to 9 Year Old | 47 (100.0%) | 0 (0.0%) |
| 10 to 14 Year Olds | 53 (100.0%) | 0 (0.0%) |
| 15 to 17 Year Olds | 92 (100.0%) | 0 (0.0%) |
| 18 to 19 Year Olds | 14 (100.0%) | 0 (0.0%) |
| 20 to 24 Year Olds | 20 (100.0%) | 0 (0.0%) |
| 25 to 34 Year Olds | 0 (0.0%) | 0 (0.0%) |
| 35 Years and over | 12 (100.0%) | 0 (0.0%) |
| Total | 238 (100.0%) | 0 (0.0%) |
Educational Attainment by Field of Study in Harrison
Computers & mathematics (61 | 46.6%), business (29 | 22.1%), education (16 | 12.2%), physical & health sciences (13 | 9.9%), and science & technology (12 | 9.2%) are the most common fields of study among 131 individuals in Harrison who have obtained a bachelor's degree or higher.
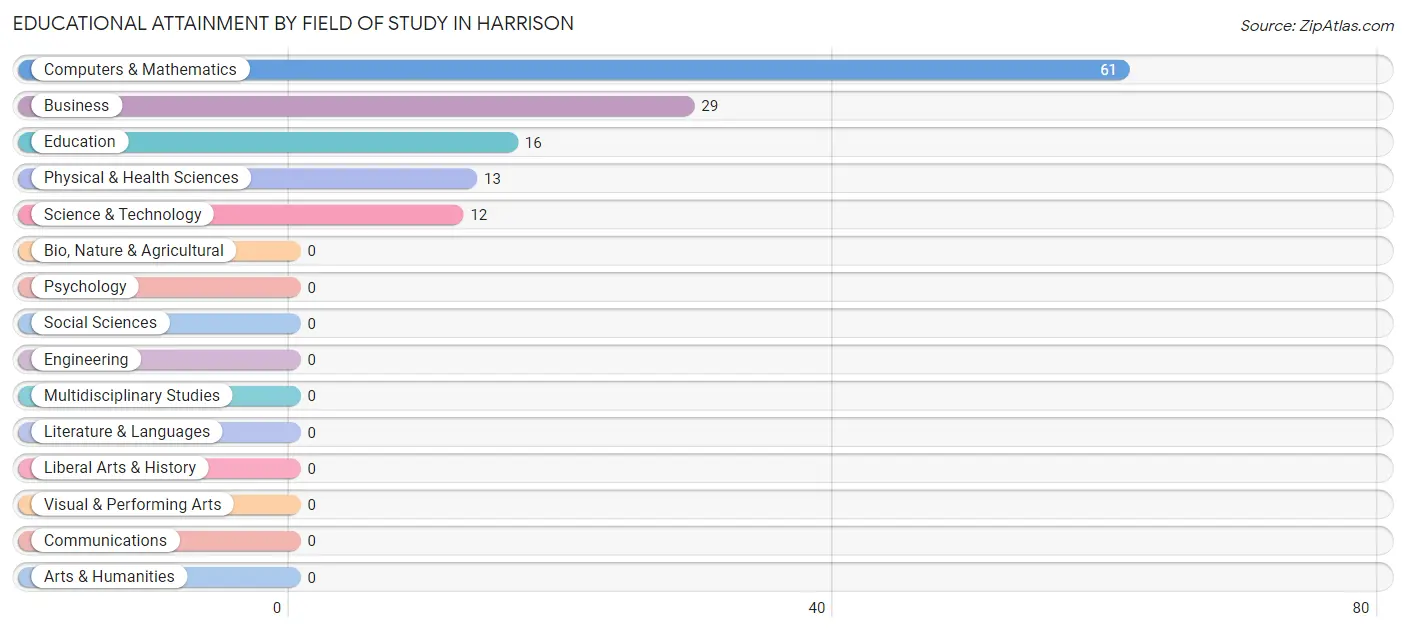
| Field of Study | # Graduates | % Graduates |
| Computers & Mathematics | 61 | 46.6% |
| Bio, Nature & Agricultural | 0 | 0.0% |
| Physical & Health Sciences | 13 | 9.9% |
| Psychology | 0 | 0.0% |
| Social Sciences | 0 | 0.0% |
| Engineering | 0 | 0.0% |
| Multidisciplinary Studies | 0 | 0.0% |
| Science & Technology | 12 | 9.2% |
| Business | 29 | 22.1% |
| Education | 16 | 12.2% |
| Literature & Languages | 0 | 0.0% |
| Liberal Arts & History | 0 | 0.0% |
| Visual & Performing Arts | 0 | 0.0% |
| Communications | 0 | 0.0% |
| Arts & Humanities | 0 | 0.0% |
| Total | 131 | 100.0% |
Transportation & Commute in Harrison
Vehicle Availability by Sex in Harrison
The most prevalent vehicle ownership categories in Harrison are males with 2 vehicles (48, accounting for 50.0%) and females with 2 vehicles (86, making up 18.9%).
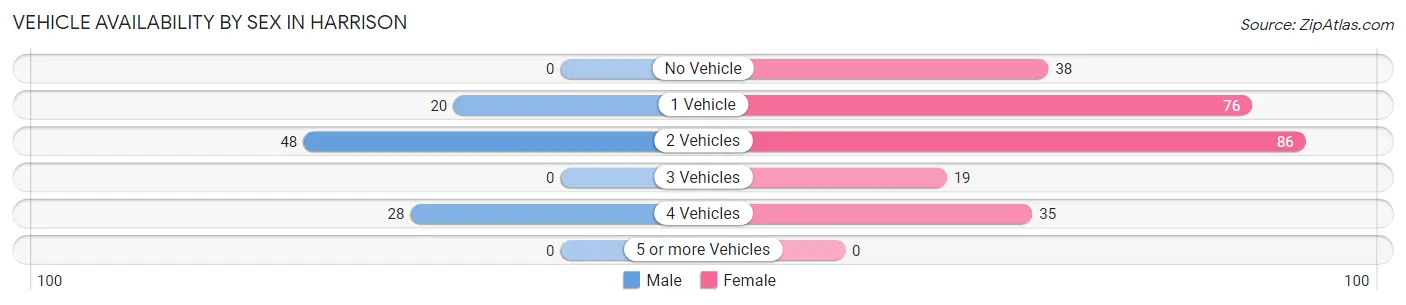
| Vehicles Available | Male | Female |
| No Vehicle | 0 (0.0%) | 38 (15.0%) |
| 1 Vehicle | 20 (20.8%) | 76 (29.9%) |
| 2 Vehicles | 48 (50.0%) | 86 (33.9%) |
| 3 Vehicles | 0 (0.0%) | 19 (7.5%) |
| 4 Vehicles | 28 (29.2%) | 35 (13.8%) |
| 5 or more Vehicles | 0 (0.0%) | 0 (0.0%) |
| Total | 96 (100.0%) | 254 (100.0%) |
Commute Time in Harrison
The most frequently occuring commute durations in Harrison are 30 to 34 minutes (92 commuters, 26.3%), 15 to 19 minutes (72 commuters, 20.6%), and 5 to 9 minutes (37 commuters, 10.6%).
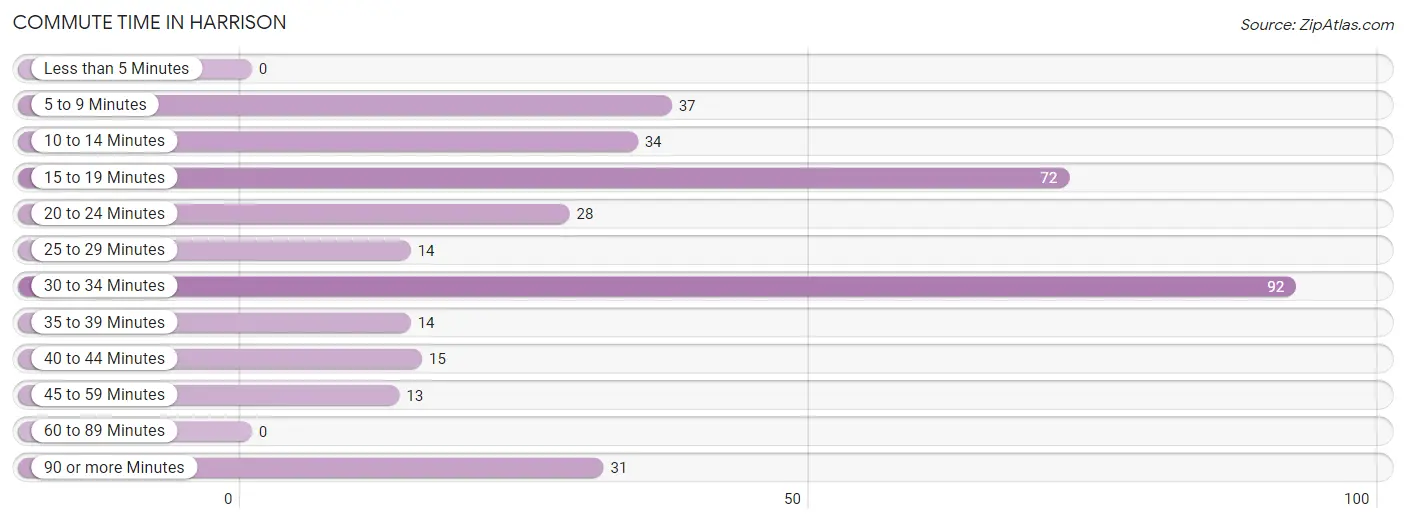
| Commute Time | # Commuters | % Commuters |
| Less than 5 Minutes | 0 | 0.0% |
| 5 to 9 Minutes | 37 | 10.6% |
| 10 to 14 Minutes | 34 | 9.7% |
| 15 to 19 Minutes | 72 | 20.6% |
| 20 to 24 Minutes | 28 | 8.0% |
| 25 to 29 Minutes | 14 | 4.0% |
| 30 to 34 Minutes | 92 | 26.3% |
| 35 to 39 Minutes | 14 | 4.0% |
| 40 to 44 Minutes | 15 | 4.3% |
| 45 to 59 Minutes | 13 | 3.7% |
| 60 to 89 Minutes | 0 | 0.0% |
| 90 or more Minutes | 31 | 8.9% |
Commute Time by Sex in Harrison
The most common commute times in Harrison are 90 or more minutes (22 commuters, 22.9%) for males and 30 to 34 minutes (79 commuters, 31.1%) for females.
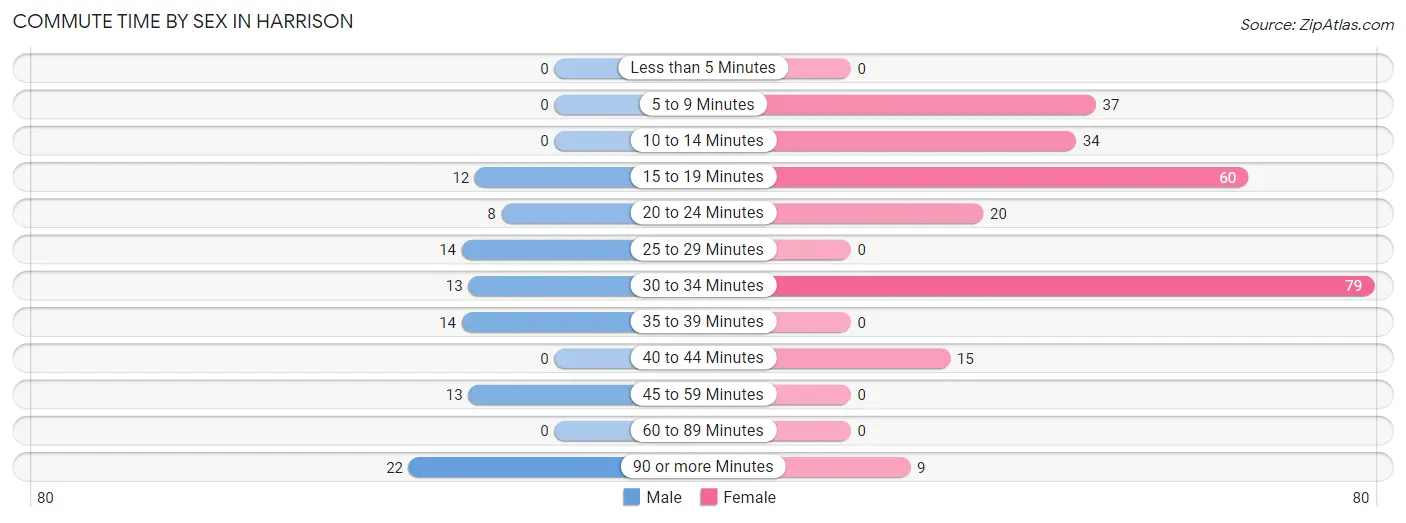
| Commute Time | Male | Female |
| Less than 5 Minutes | 0 (0.0%) | 0 (0.0%) |
| 5 to 9 Minutes | 0 (0.0%) | 37 (14.6%) |
| 10 to 14 Minutes | 0 (0.0%) | 34 (13.4%) |
| 15 to 19 Minutes | 12 (12.5%) | 60 (23.6%) |
| 20 to 24 Minutes | 8 (8.3%) | 20 (7.9%) |
| 25 to 29 Minutes | 14 (14.6%) | 0 (0.0%) |
| 30 to 34 Minutes | 13 (13.5%) | 79 (31.1%) |
| 35 to 39 Minutes | 14 (14.6%) | 0 (0.0%) |
| 40 to 44 Minutes | 0 (0.0%) | 15 (5.9%) |
| 45 to 59 Minutes | 13 (13.5%) | 0 (0.0%) |
| 60 to 89 Minutes | 0 (0.0%) | 0 (0.0%) |
| 90 or more Minutes | 22 (22.9%) | 9 (3.5%) |
Time of Departure to Work by Sex in Harrison
The most frequent times of departure to work in Harrison are 6:00 AM to 6:29 AM (35, 36.5%) for males and 7:00 AM to 7:29 AM (94, 37.0%) for females.
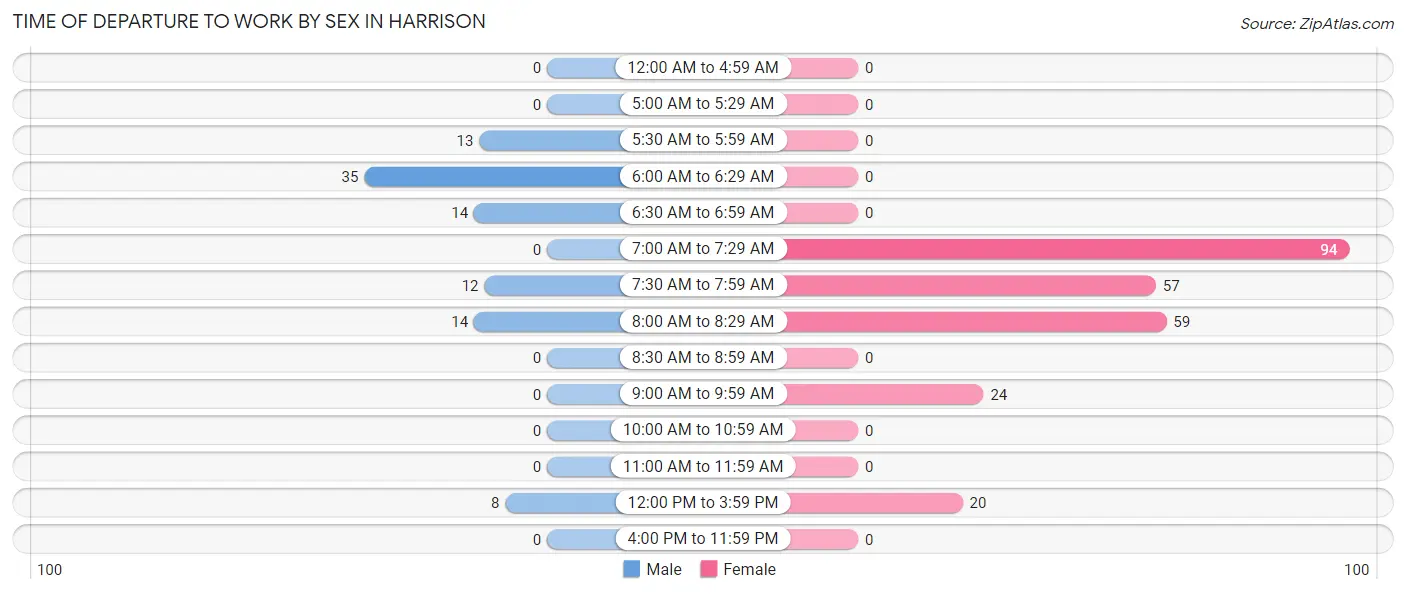
| Time of Departure | Male | Female |
| 12:00 AM to 4:59 AM | 0 (0.0%) | 0 (0.0%) |
| 5:00 AM to 5:29 AM | 0 (0.0%) | 0 (0.0%) |
| 5:30 AM to 5:59 AM | 13 (13.5%) | 0 (0.0%) |
| 6:00 AM to 6:29 AM | 35 (36.5%) | 0 (0.0%) |
| 6:30 AM to 6:59 AM | 14 (14.6%) | 0 (0.0%) |
| 7:00 AM to 7:29 AM | 0 (0.0%) | 94 (37.0%) |
| 7:30 AM to 7:59 AM | 12 (12.5%) | 57 (22.4%) |
| 8:00 AM to 8:29 AM | 14 (14.6%) | 59 (23.2%) |
| 8:30 AM to 8:59 AM | 0 (0.0%) | 0 (0.0%) |
| 9:00 AM to 9:59 AM | 0 (0.0%) | 24 (9.5%) |
| 10:00 AM to 10:59 AM | 0 (0.0%) | 0 (0.0%) |
| 11:00 AM to 11:59 AM | 0 (0.0%) | 0 (0.0%) |
| 12:00 PM to 3:59 PM | 8 (8.3%) | 20 (7.9%) |
| 4:00 PM to 11:59 PM | 0 (0.0%) | 0 (0.0%) |
| Total | 96 (100.0%) | 254 (100.0%) |
Housing Occupancy in Harrison
Occupancy by Ownership in Harrison
Of the total 403 dwellings in Harrison, owner-occupied units account for 276 (68.5%), while renter-occupied units make up 127 (31.5%).
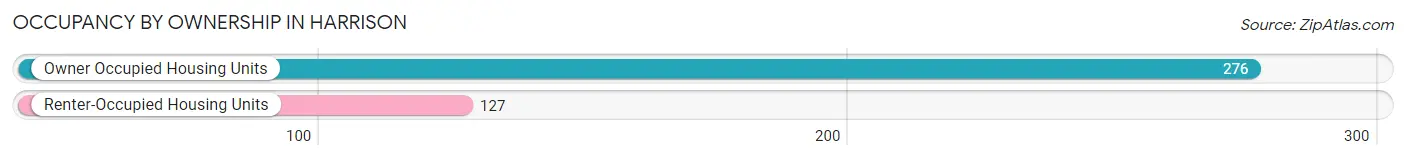
| Occupancy | # Housing Units | % Housing Units |
| Owner Occupied Housing Units | 276 | 68.5% |
| Renter-Occupied Housing Units | 127 | 31.5% |
| Total Occupied Housing Units | 403 | 100.0% |
Occupancy by Household Size in Harrison
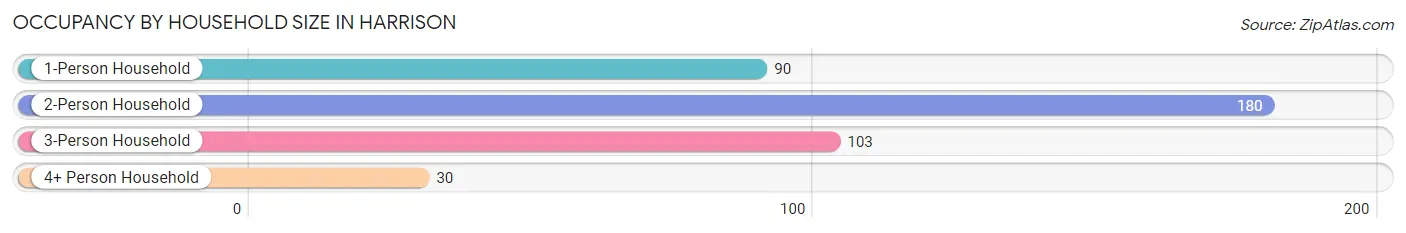
| Household Size | # Housing Units | % Housing Units |
| 1-Person Household | 90 | 22.3% |
| 2-Person Household | 180 | 44.7% |
| 3-Person Household | 103 | 25.6% |
| 4+ Person Household | 30 | 7.4% |
| Total Housing Units | 403 | 100.0% |
Occupancy by Ownership by Household Size in Harrison
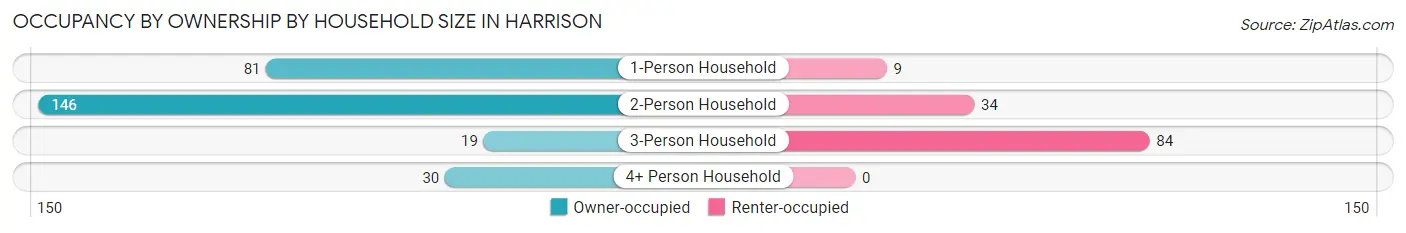
| Household Size | Owner-occupied | Renter-occupied |
| 1-Person Household | 81 (90.0%) | 9 (10.0%) |
| 2-Person Household | 146 (81.1%) | 34 (18.9%) |
| 3-Person Household | 19 (18.4%) | 84 (81.6%) |
| 4+ Person Household | 30 (100.0%) | 0 (0.0%) |
| Total Housing Units | 276 (68.5%) | 127 (31.5%) |
Occupancy by Educational Attainment in Harrison
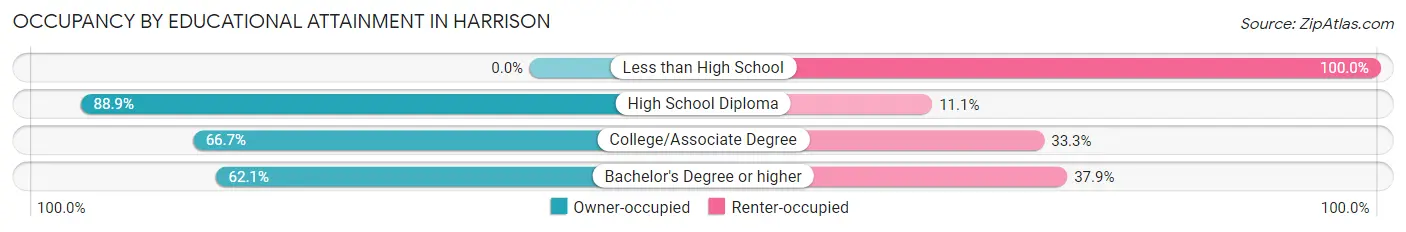
| Household Size | Owner-occupied | Renter-occupied |
| Less than High School | 0 (0.0%) | 16 (100.0%) |
| High School Diploma | 96 (88.9%) | 12 (11.1%) |
| College/Associate Degree | 98 (66.7%) | 49 (33.3%) |
| Bachelor's Degree or higher | 82 (62.1%) | 50 (37.9%) |
Occupancy by Age of Householder in Harrison
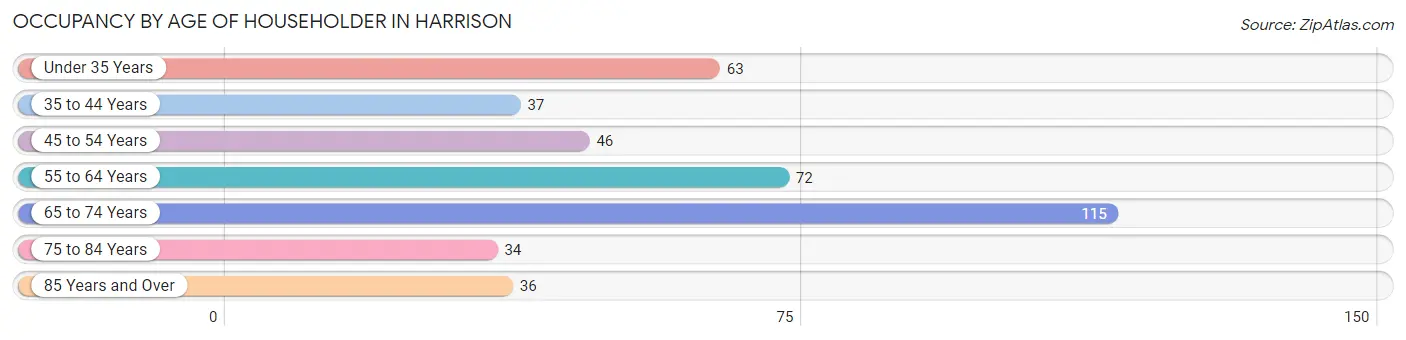
| Age Bracket | # Households | % Households |
| Under 35 Years | 63 | 15.6% |
| 35 to 44 Years | 37 | 9.2% |
| 45 to 54 Years | 46 | 11.4% |
| 55 to 64 Years | 72 | 17.9% |
| 65 to 74 Years | 115 | 28.5% |
| 75 to 84 Years | 34 | 8.4% |
| 85 Years and Over | 36 | 8.9% |
| Total | 403 | 100.0% |
Housing Finances in Harrison
Median Income by Occupancy in Harrison
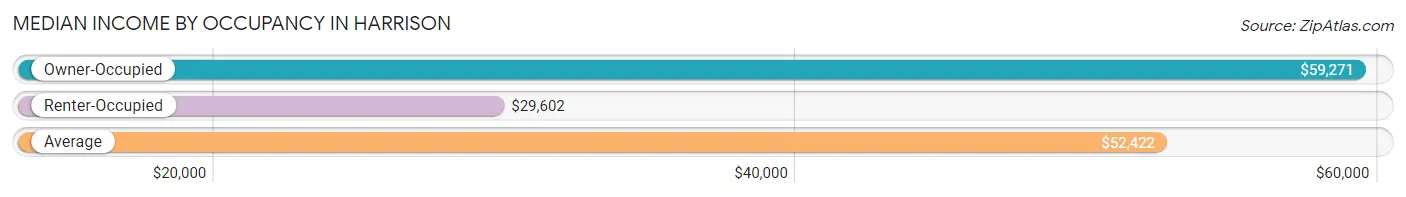
| Occupancy Type | # Households | Median Income |
| Owner-Occupied | 276 (68.5%) | $59,271 |
| Renter-Occupied | 127 (31.5%) | $29,602 |
| Average | 403 (100.0%) | $52,422 |
Occupancy by Householder Income Bracket in Harrison
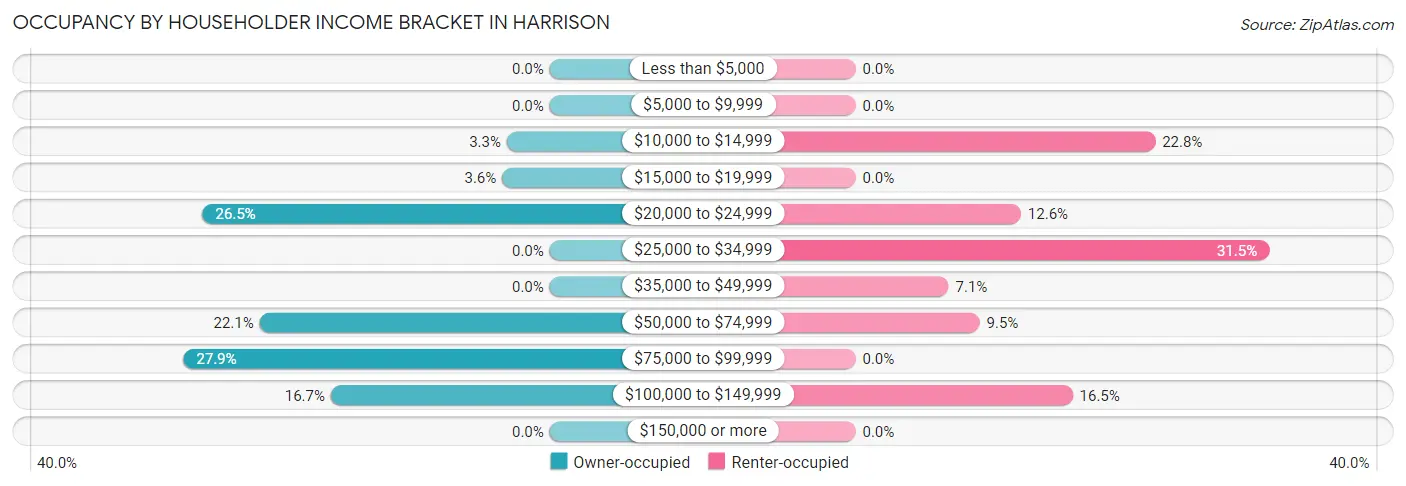
| Income Bracket | Owner-occupied | Renter-occupied |
| Less than $5,000 | 0 (0.0%) | 0 (0.0%) |
| $5,000 to $9,999 | 0 (0.0%) | 0 (0.0%) |
| $10,000 to $14,999 | 9 (3.3%) | 29 (22.8%) |
| $15,000 to $19,999 | 10 (3.6%) | 0 (0.0%) |
| $20,000 to $24,999 | 73 (26.5%) | 16 (12.6%) |
| $25,000 to $34,999 | 0 (0.0%) | 40 (31.5%) |
| $35,000 to $49,999 | 0 (0.0%) | 9 (7.1%) |
| $50,000 to $74,999 | 61 (22.1%) | 12 (9.5%) |
| $75,000 to $99,999 | 77 (27.9%) | 0 (0.0%) |
| $100,000 to $149,999 | 46 (16.7%) | 21 (16.5%) |
| $150,000 or more | 0 (0.0%) | 0 (0.0%) |
| Total | 276 (100.0%) | 127 (100.0%) |
Monthly Housing Cost Tiers in Harrison
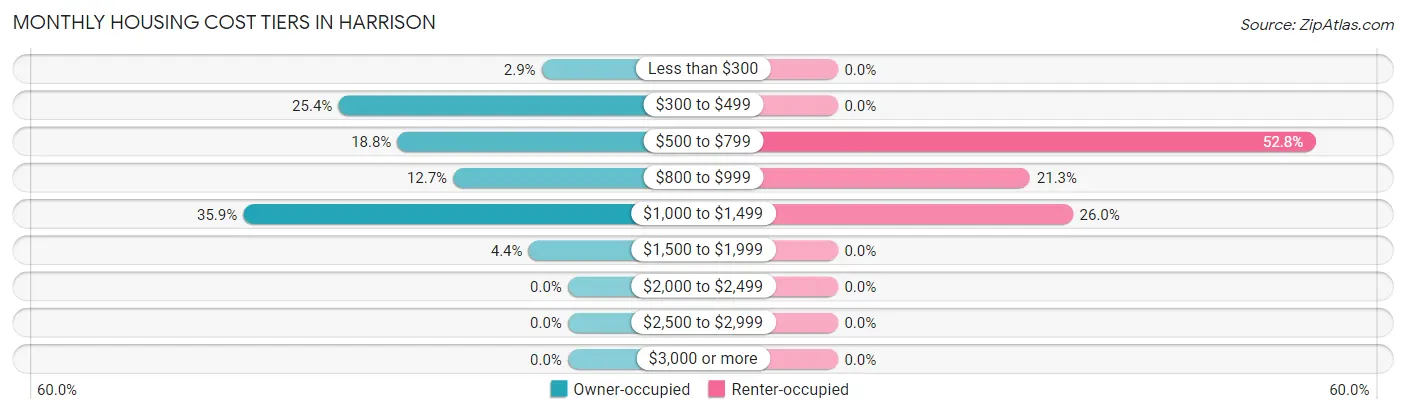
| Monthly Cost | Owner-occupied | Renter-occupied |
| Less than $300 | 8 (2.9%) | 0 (0.0%) |
| $300 to $499 | 70 (25.4%) | 0 (0.0%) |
| $500 to $799 | 52 (18.8%) | 67 (52.8%) |
| $800 to $999 | 35 (12.7%) | 27 (21.3%) |
| $1,000 to $1,499 | 99 (35.9%) | 33 (26.0%) |
| $1,500 to $1,999 | 12 (4.3%) | 0 (0.0%) |
| $2,000 to $2,499 | 0 (0.0%) | 0 (0.0%) |
| $2,500 to $2,999 | 0 (0.0%) | 0 (0.0%) |
| $3,000 or more | 0 (0.0%) | 0 (0.0%) |
| Total | 276 (100.0%) | 127 (100.0%) |
Physical Housing Characteristics in Harrison
Housing Structures in Harrison
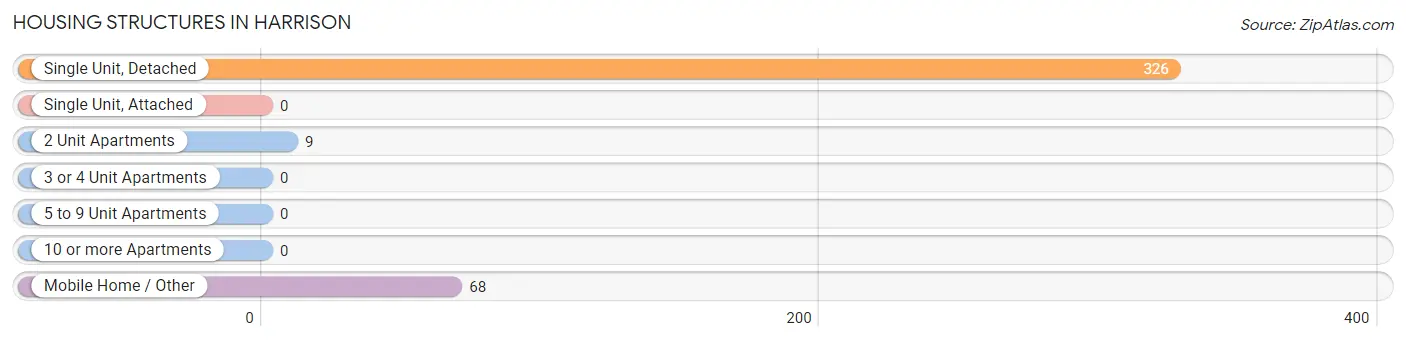
| Structure Type | # Housing Units | % Housing Units |
| Single Unit, Detached | 326 | 80.9% |
| Single Unit, Attached | 0 | 0.0% |
| 2 Unit Apartments | 9 | 2.2% |
| 3 or 4 Unit Apartments | 0 | 0.0% |
| 5 to 9 Unit Apartments | 0 | 0.0% |
| 10 or more Apartments | 0 | 0.0% |
| Mobile Home / Other | 68 | 16.9% |
| Total | 403 | 100.0% |
Housing Structures by Occupancy in Harrison
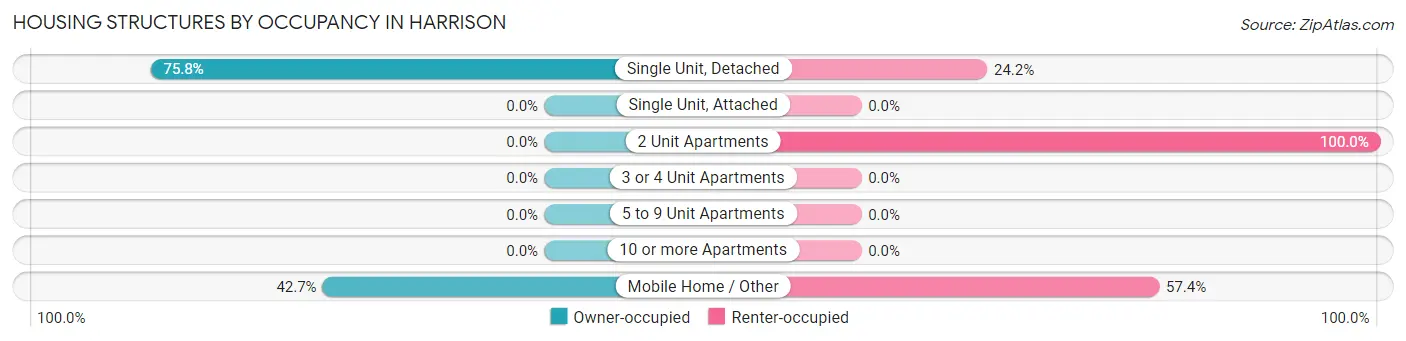
| Structure Type | Owner-occupied | Renter-occupied |
| Single Unit, Detached | 247 (75.8%) | 79 (24.2%) |
| Single Unit, Attached | 0 (0.0%) | 0 (0.0%) |
| 2 Unit Apartments | 0 (0.0%) | 9 (100.0%) |
| 3 or 4 Unit Apartments | 0 (0.0%) | 0 (0.0%) |
| 5 to 9 Unit Apartments | 0 (0.0%) | 0 (0.0%) |
| 10 or more Apartments | 0 (0.0%) | 0 (0.0%) |
| Mobile Home / Other | 29 (42.6%) | 39 (57.4%) |
| Total | 276 (68.5%) | 127 (31.5%) |
Housing Structures by Number of Rooms in Harrison
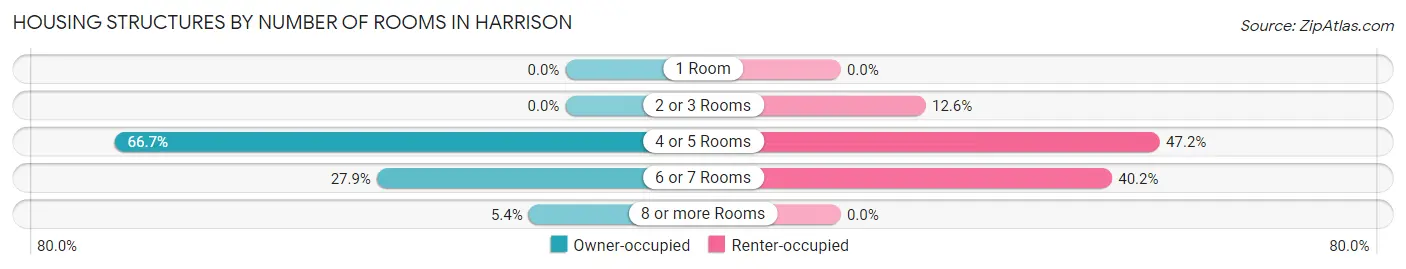
| Number of Rooms | Owner-occupied | Renter-occupied |
| 1 Room | 0 (0.0%) | 0 (0.0%) |
| 2 or 3 Rooms | 0 (0.0%) | 16 (12.6%) |
| 4 or 5 Rooms | 184 (66.7%) | 60 (47.2%) |
| 6 or 7 Rooms | 77 (27.9%) | 51 (40.2%) |
| 8 or more Rooms | 15 (5.4%) | 0 (0.0%) |
| Total | 276 (100.0%) | 127 (100.0%) |
Housing Structure by Heating Type in Harrison
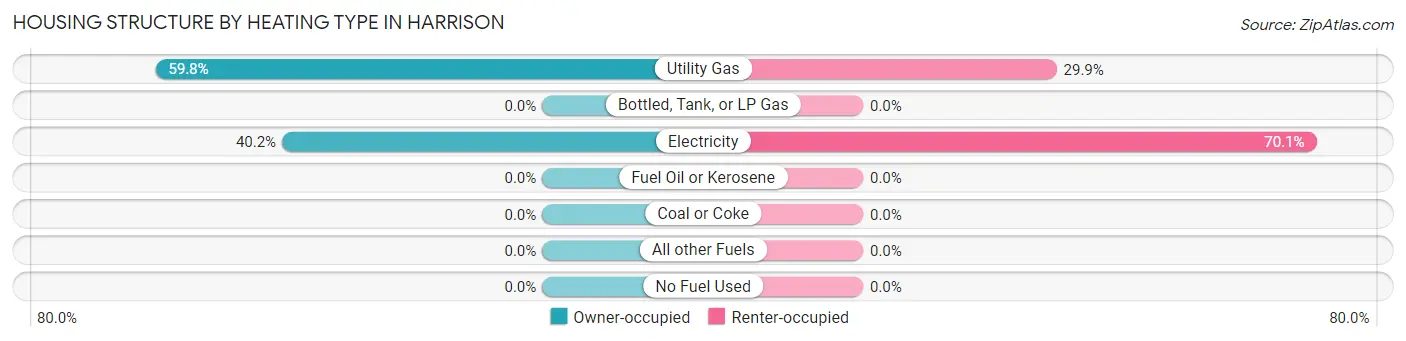
| Heating Type | Owner-occupied | Renter-occupied |
| Utility Gas | 165 (59.8%) | 38 (29.9%) |
| Bottled, Tank, or LP Gas | 0 (0.0%) | 0 (0.0%) |
| Electricity | 111 (40.2%) | 89 (70.1%) |
| Fuel Oil or Kerosene | 0 (0.0%) | 0 (0.0%) |
| Coal or Coke | 0 (0.0%) | 0 (0.0%) |
| All other Fuels | 0 (0.0%) | 0 (0.0%) |
| No Fuel Used | 0 (0.0%) | 0 (0.0%) |
| Total | 276 (100.0%) | 127 (100.0%) |
Household Vehicle Usage in Harrison
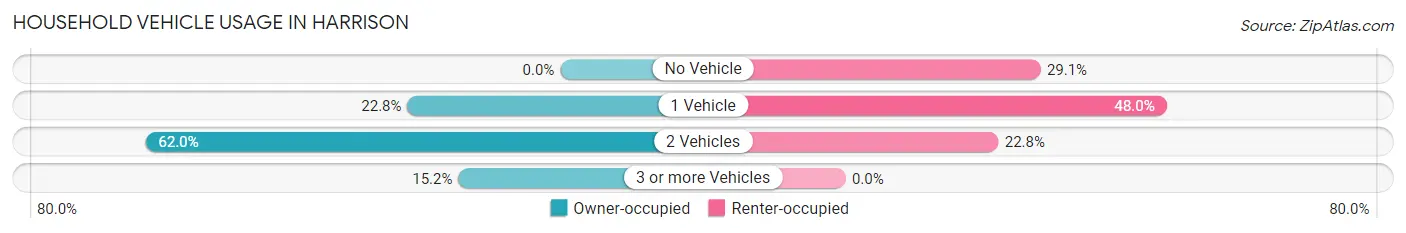
| Vehicles per Household | Owner-occupied | Renter-occupied |
| No Vehicle | 0 (0.0%) | 37 (29.1%) |
| 1 Vehicle | 63 (22.8%) | 61 (48.0%) |
| 2 Vehicles | 171 (62.0%) | 29 (22.8%) |
| 3 or more Vehicles | 42 (15.2%) | 0 (0.0%) |
| Total | 276 (100.0%) | 127 (100.0%) |
Real Estate & Mortgages in Harrison
Real Estate and Mortgage Overview in Harrison
| Characteristic | Without Mortgage | With Mortgage |
| Housing Units | 77 | 199 |
| Median Property Value | $89,700 | $108,400 |
| Median Household Income | $58,385 | $0 |
| Monthly Housing Costs | $428 | $0 |
| Real Estate Taxes | - | - |
Property Value by Mortgage Status in Harrison
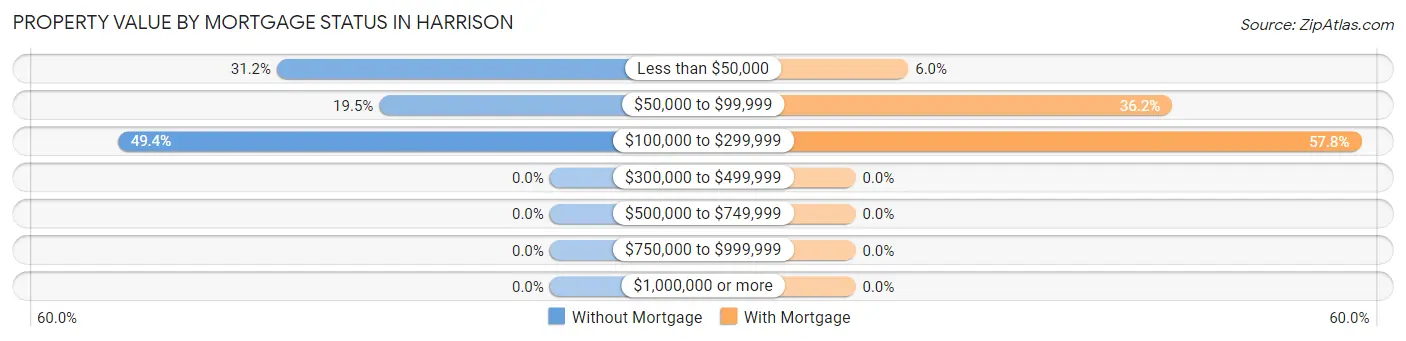
| Property Value | Without Mortgage | With Mortgage |
| Less than $50,000 | 24 (31.2%) | 12 (6.0%) |
| $50,000 to $99,999 | 15 (19.5%) | 72 (36.2%) |
| $100,000 to $299,999 | 38 (49.3%) | 115 (57.8%) |
| $300,000 to $499,999 | 0 (0.0%) | 0 (0.0%) |
| $500,000 to $749,999 | 0 (0.0%) | 0 (0.0%) |
| $750,000 to $999,999 | 0 (0.0%) | 0 (0.0%) |
| $1,000,000 or more | 0 (0.0%) | 0 (0.0%) |
| Total | 77 (100.0%) | 199 (100.0%) |
Household Income by Mortgage Status in Harrison
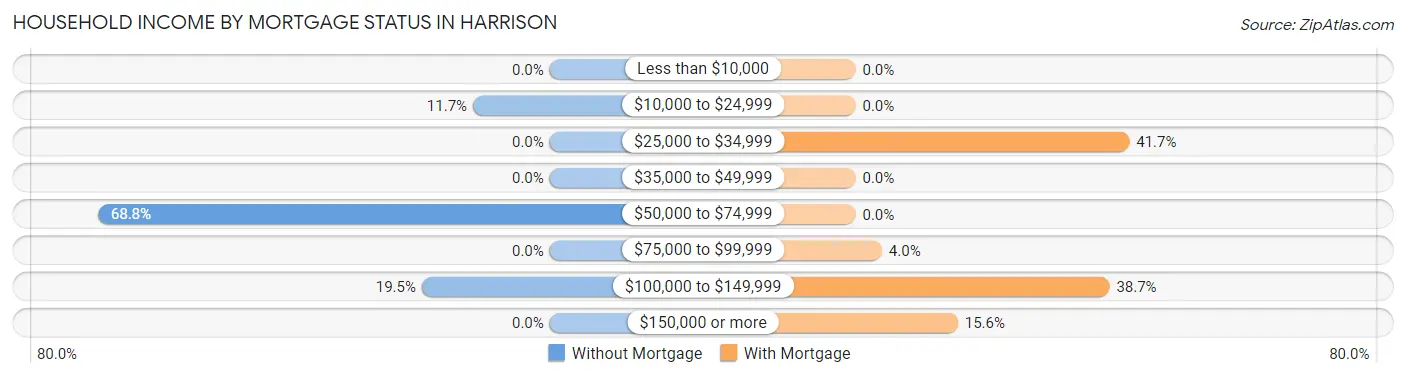
| Household Income | Without Mortgage | With Mortgage |
| Less than $10,000 | 0 (0.0%) | 0 (0.0%) |
| $10,000 to $24,999 | 9 (11.7%) | 0 (0.0%) |
| $25,000 to $34,999 | 0 (0.0%) | 83 (41.7%) |
| $35,000 to $49,999 | 0 (0.0%) | 0 (0.0%) |
| $50,000 to $74,999 | 53 (68.8%) | 0 (0.0%) |
| $75,000 to $99,999 | 0 (0.0%) | 8 (4.0%) |
| $100,000 to $149,999 | 15 (19.5%) | 77 (38.7%) |
| $150,000 or more | 0 (0.0%) | 31 (15.6%) |
| Total | 77 (100.0%) | 199 (100.0%) |
Property Value to Household Income Ratio in Harrison
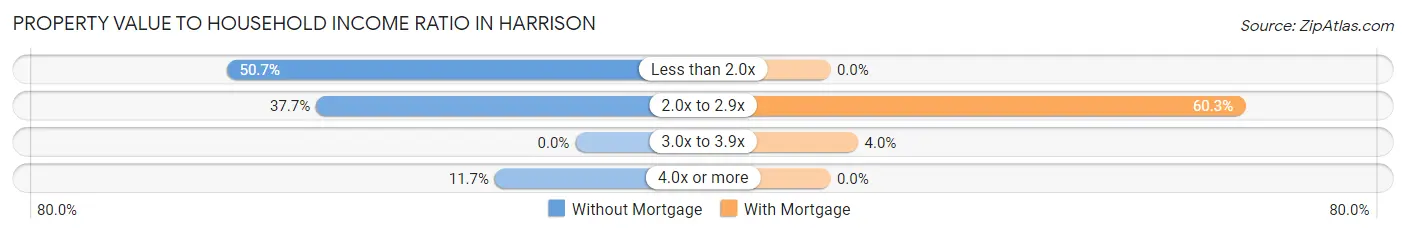
| Value-to-Income Ratio | Without Mortgage | With Mortgage |
| Less than 2.0x | 39 (50.6%) | 0 (0.0%) |
| 2.0x to 2.9x | 29 (37.7%) | 120 (60.3%) |
| 3.0x to 3.9x | 0 (0.0%) | 8 (4.0%) |
| 4.0x or more | 9 (11.7%) | 0 (0.0%) |
| Total | 77 (100.0%) | 199 (100.0%) |
Real Estate Taxes by Mortgage Status in Harrison
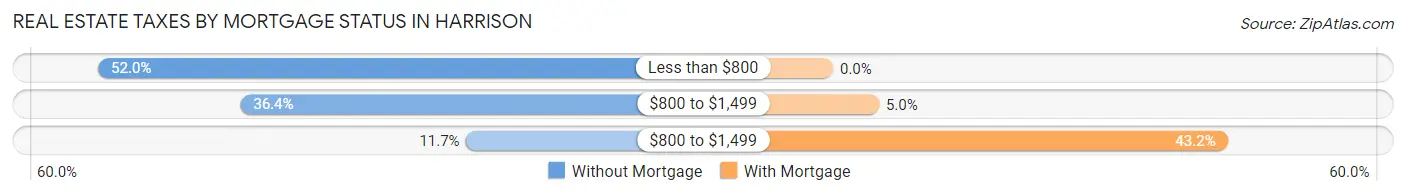
| Property Taxes | Without Mortgage | With Mortgage |
| Less than $800 | 40 (51.9%) | 0 (0.0%) |
| $800 to $1,499 | 28 (36.4%) | 10 (5.0%) |
| $800 to $1,499 | 9 (11.7%) | 86 (43.2%) |
| Total | 77 (100.0%) | 199 (100.0%) |
Health & Disability in Harrison
Health Insurance Coverage by Age in Harrison
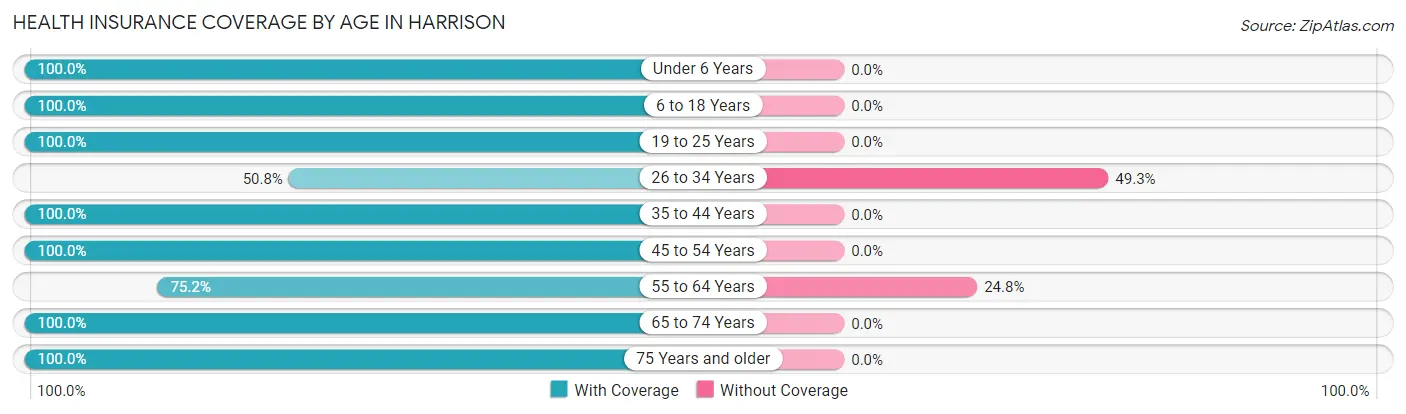
| Age Bracket | With Coverage | Without Coverage |
| Under 6 Years | 67 (100.0%) | 0 (0.0%) |
| 6 to 18 Years | 192 (100.0%) | 0 (0.0%) |
| 19 to 25 Years | 116 (100.0%) | 0 (0.0%) |
| 26 to 34 Years | 34 (50.7%) | 33 (49.2%) |
| 35 to 44 Years | 58 (100.0%) | 0 (0.0%) |
| 45 to 54 Years | 58 (100.0%) | 0 (0.0%) |
| 55 to 64 Years | 88 (75.2%) | 29 (24.8%) |
| 65 to 74 Years | 229 (100.0%) | 0 (0.0%) |
| 75 Years and older | 70 (100.0%) | 0 (0.0%) |
| Total | 912 (93.6%) | 62 (6.4%) |
Health Insurance Coverage by Citizenship Status in Harrison
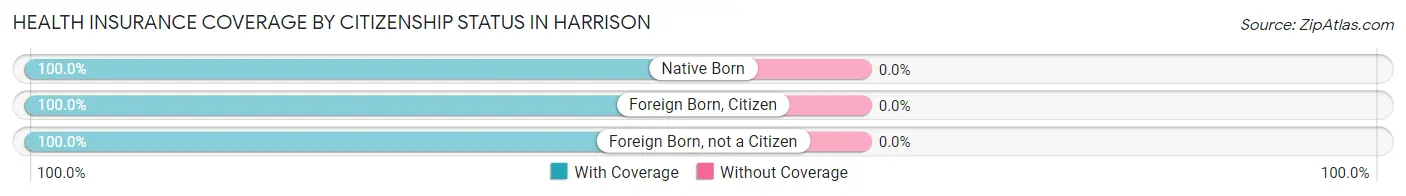
| Citizenship Status | With Coverage | Without Coverage |
| Native Born | 67 (100.0%) | 0 (0.0%) |
| Foreign Born, Citizen | 192 (100.0%) | 0 (0.0%) |
| Foreign Born, not a Citizen | 116 (100.0%) | 0 (0.0%) |
Health Insurance Coverage by Household Income in Harrison
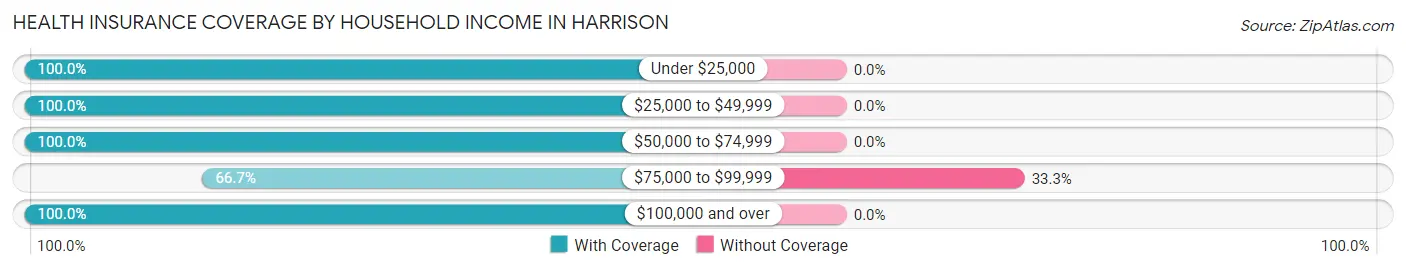
| Household Income | With Coverage | Without Coverage |
| Under $25,000 | 346 (100.0%) | 0 (0.0%) |
| $25,000 to $49,999 | 105 (100.0%) | 0 (0.0%) |
| $50,000 to $74,999 | 89 (100.0%) | 0 (0.0%) |
| $75,000 to $99,999 | 124 (66.7%) | 62 (33.3%) |
| $100,000 and over | 248 (100.0%) | 0 (0.0%) |
Public vs Private Health Insurance Coverage by Age in Harrison
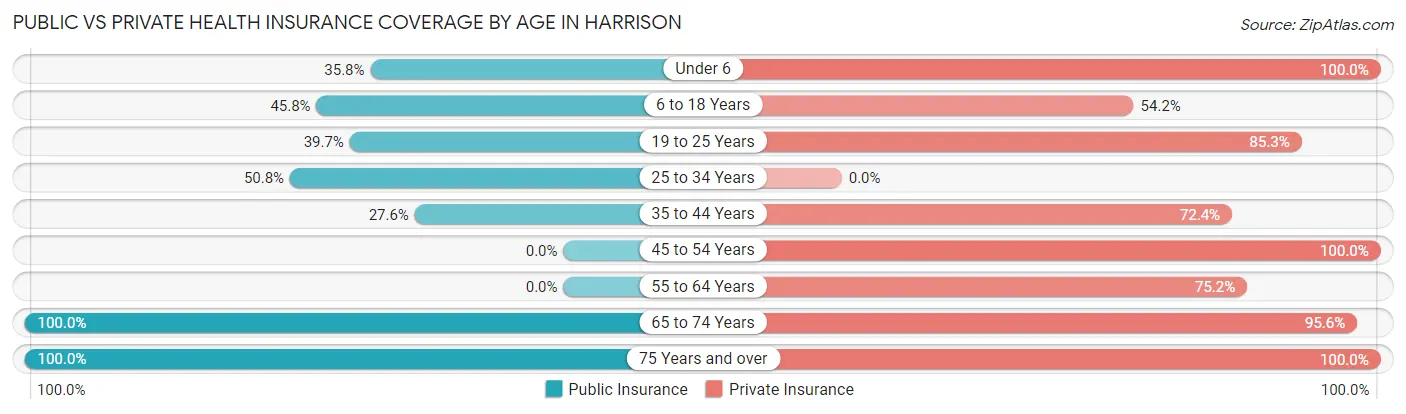
| Age Bracket | Public Insurance | Private Insurance |
| Under 6 | 24 (35.8%) | 67 (100.0%) |
| 6 to 18 Years | 88 (45.8%) | 104 (54.2%) |
| 19 to 25 Years | 46 (39.7%) | 99 (85.3%) |
| 25 to 34 Years | 34 (50.7%) | 0 (0.0%) |
| 35 to 44 Years | 16 (27.6%) | 42 (72.4%) |
| 45 to 54 Years | 0 (0.0%) | 58 (100.0%) |
| 55 to 64 Years | 0 (0.0%) | 88 (75.2%) |
| 65 to 74 Years | 229 (100.0%) | 219 (95.6%) |
| 75 Years and over | 70 (100.0%) | 70 (100.0%) |
| Total | 507 (52.0%) | 747 (76.7%) |
Disability Status by Sex by Age in Harrison
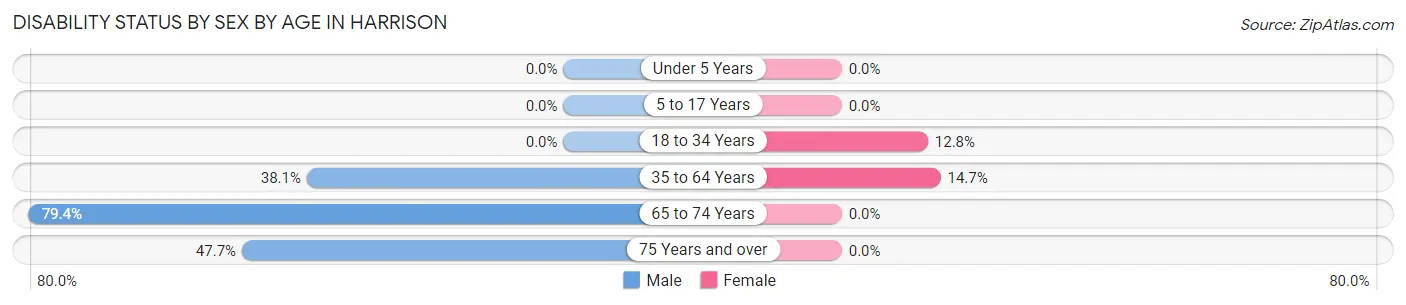
| Age Bracket | Male | Female |
| Under 5 Years | 0 (0.0%) | 0 (0.0%) |
| 5 to 17 Years | 0 (0.0%) | 0 (0.0%) |
| 18 to 34 Years | 0 (0.0%) | 17 (12.8%) |
| 35 to 64 Years | 16 (38.1%) | 28 (14.7%) |
| 65 to 74 Years | 77 (79.4%) | 0 (0.0%) |
| 75 Years and over | 21 (47.7%) | 0 (0.0%) |
Disability Class by Sex by Age in Harrison
Disability Class: Hearing Difficulty
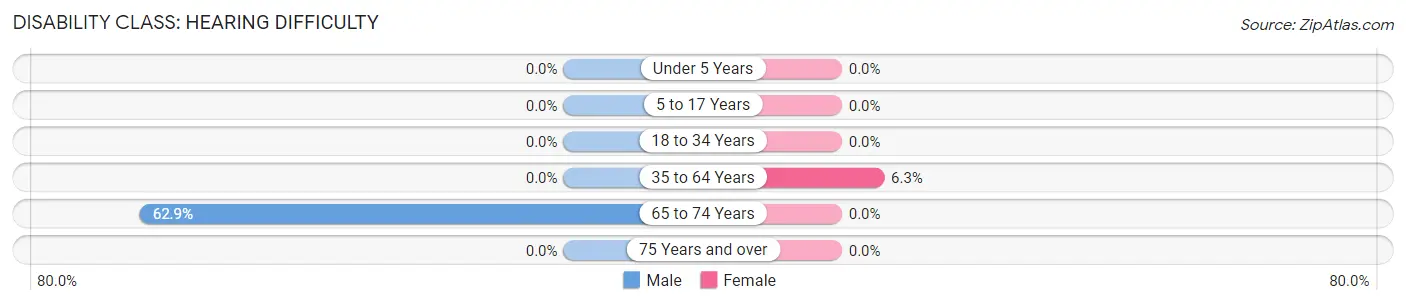
| Age Bracket | Male | Female |
| Under 5 Years | 0 (0.0%) | 0 (0.0%) |
| 5 to 17 Years | 0 (0.0%) | 0 (0.0%) |
| 18 to 34 Years | 0 (0.0%) | 0 (0.0%) |
| 35 to 64 Years | 0 (0.0%) | 12 (6.3%) |
| 65 to 74 Years | 61 (62.9%) | 0 (0.0%) |
| 75 Years and over | 0 (0.0%) | 0 (0.0%) |
Disability Class: Vision Difficulty
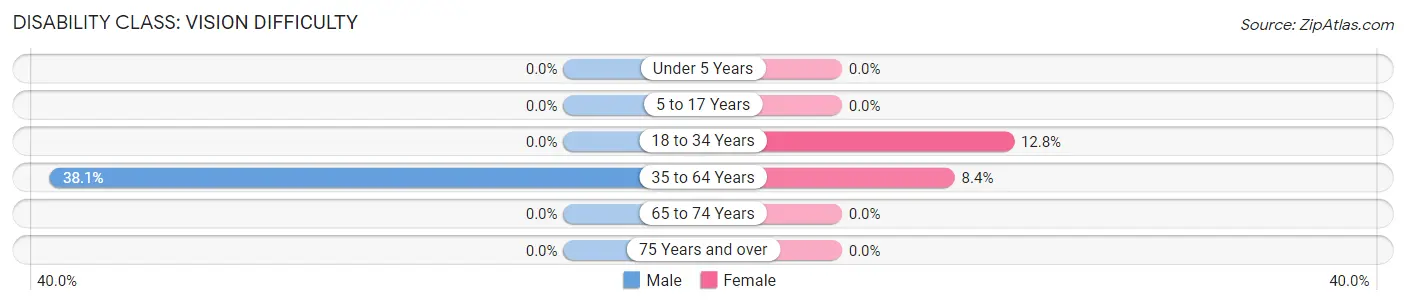
| Age Bracket | Male | Female |
| Under 5 Years | 0 (0.0%) | 0 (0.0%) |
| 5 to 17 Years | 0 (0.0%) | 0 (0.0%) |
| 18 to 34 Years | 0 (0.0%) | 17 (12.8%) |
| 35 to 64 Years | 16 (38.1%) | 16 (8.4%) |
| 65 to 74 Years | 0 (0.0%) | 0 (0.0%) |
| 75 Years and over | 0 (0.0%) | 0 (0.0%) |
Disability Class: Cognitive Difficulty
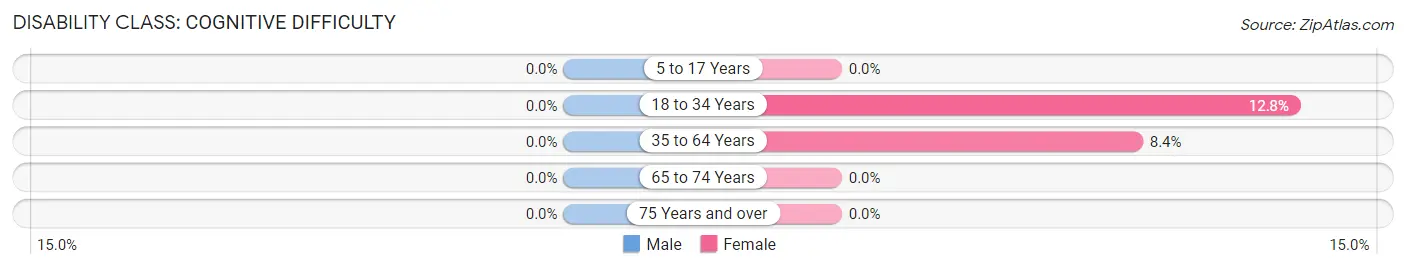
| Age Bracket | Male | Female |
| 5 to 17 Years | 0 (0.0%) | 0 (0.0%) |
| 18 to 34 Years | 0 (0.0%) | 17 (12.8%) |
| 35 to 64 Years | 0 (0.0%) | 16 (8.4%) |
| 65 to 74 Years | 0 (0.0%) | 0 (0.0%) |
| 75 Years and over | 0 (0.0%) | 0 (0.0%) |
Disability Class: Ambulatory Difficulty
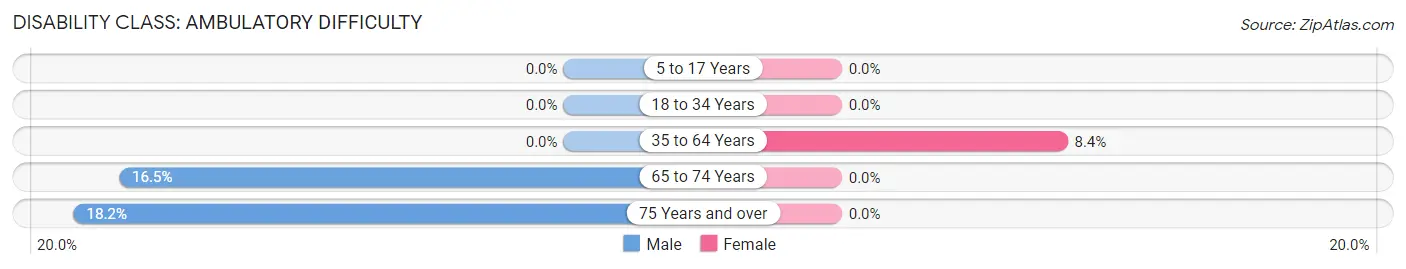
| Age Bracket | Male | Female |
| 5 to 17 Years | 0 (0.0%) | 0 (0.0%) |
| 18 to 34 Years | 0 (0.0%) | 0 (0.0%) |
| 35 to 64 Years | 0 (0.0%) | 16 (8.4%) |
| 65 to 74 Years | 16 (16.5%) | 0 (0.0%) |
| 75 Years and over | 8 (18.2%) | 0 (0.0%) |
Disability Class: Self-Care Difficulty
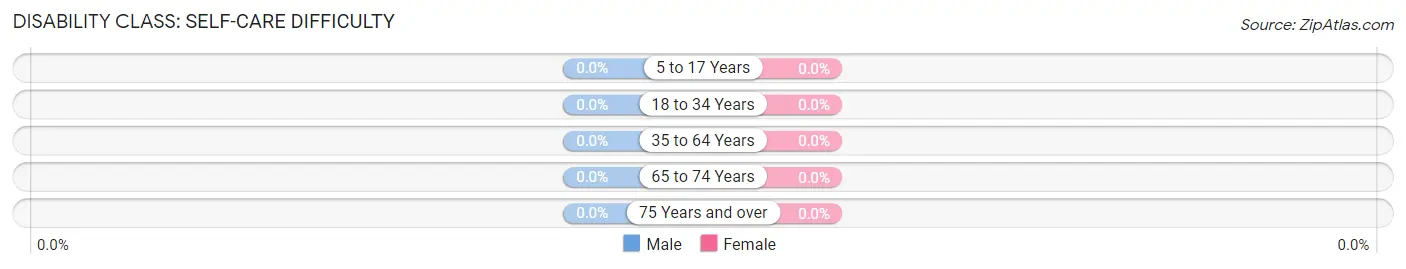
| Age Bracket | Male | Female |
| 5 to 17 Years | 0 (0.0%) | 0 (0.0%) |
| 18 to 34 Years | 0 (0.0%) | 0 (0.0%) |
| 35 to 64 Years | 0 (0.0%) | 0 (0.0%) |
| 65 to 74 Years | 0 (0.0%) | 0 (0.0%) |
| 75 Years and over | 0 (0.0%) | 0 (0.0%) |
Technology Access in Harrison
Computing Device Access in Harrison
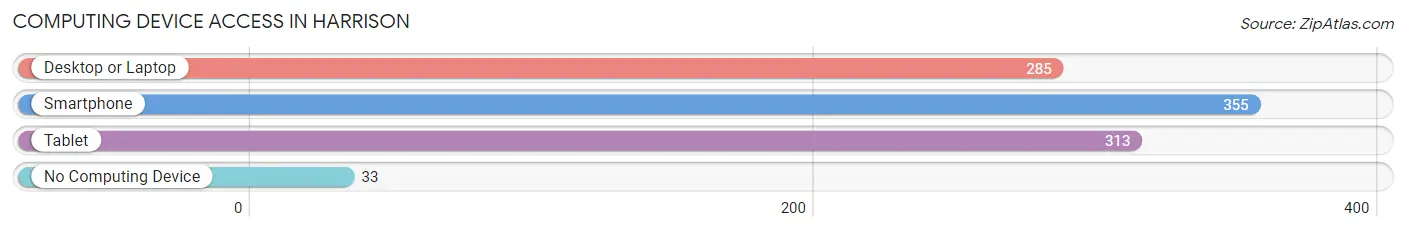
| Device Type | # Households | % Households |
| Desktop or Laptop | 285 | 70.7% |
| Smartphone | 355 | 88.1% |
| Tablet | 313 | 77.7% |
| No Computing Device | 33 | 8.2% |
| Total | 403 | 100.0% |
Internet Access in Harrison
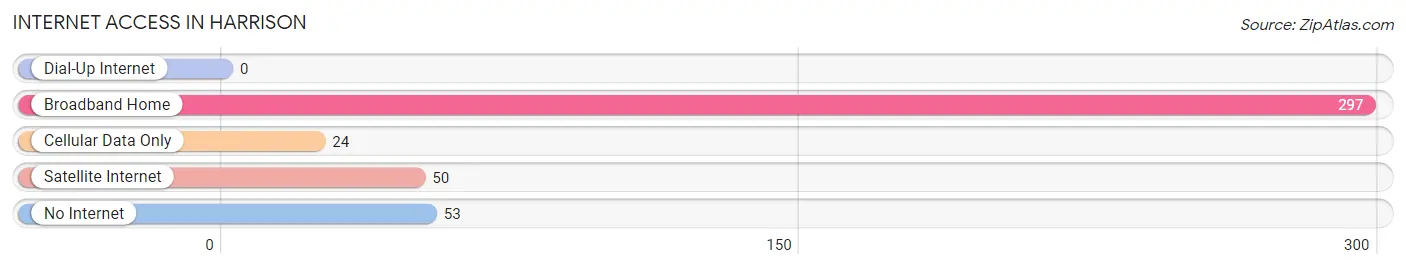
| Internet Type | # Households | % Households |
| Dial-Up Internet | 0 | 0.0% |
| Broadband Home | 297 | 73.7% |
| Cellular Data Only | 24 | 6.0% |
| Satellite Internet | 50 | 12.4% |
| No Internet | 53 | 13.2% |
| Total | 403 | 100.0% |
Harrison Summary
Harrison is a small village located in McHenry County, Illinois, United States. The village is situated on the banks of the Fox River, approximately 40 miles northwest of Chicago. As of the 2010 census, the population of Harrison was 1,836.
History
Harrison was first settled in 1836 by a group of settlers from New York. The village was named after William Henry Harrison, the ninth President of the United States. The village was officially incorporated in 1872.
In the late 19th century, Harrison was a popular destination for wealthy Chicagoans looking to escape the city. The village was home to several large estates, including the estate of Cyrus McCormick, the inventor of the mechanical reaper.
Geography
Harrison is located at 42°14'25" North, 88°20'45" West (42.240278, -88.345833). According to the United States Census Bureau, the village has a total area of 1.2 square miles, all of it land.
Economy
Harrison is a small, rural village with a limited economy. The village is home to several small businesses, including a grocery store, a hardware store, and a few restaurants. The village is also home to a few small manufacturing companies.
Demographics
As of the 2010 census, there were 1,836 people, 690 households, and 486 families residing in the village. The population density was 1,527.5 people per square mile. The racial makeup of the village was 94.2% White, 0.7% African American, 0.2% Native American, 0.7% Asian, 0.1% Pacific Islander, 2.3% from other races, and 1.9% from two or more races. Hispanic or Latino of any race were 5.2% of the population.
The median income for a household in the village was $60,938, and the median income for a family was $71,250. Males had a median income of $50,000 versus $31,250 for females. The per capita income for the village was $25,945. About 3.2% of families and 4.2% of the population were below the poverty line, including 5.2% of those under age 18 and 4.2% of those age 65 or over.
Common Questions
What is Per Capita Income in Harrison?
Per Capita income in Harrison is $24,195.
What is the Median Household income in Harrison?
Median Household Income in Harrison is $52,422.
What is Inequality or Gini Index in Harrison?
Inequality or Gini Index in Harrison is 0.35.
What is the Total Population of Harrison?
Total Population of Harrison is 974.
What is the Total Male Population of Harrison?
Total Male Population of Harrison is 354.
What is the Total Female Population of Harrison?
Total Female Population of Harrison is 620.
What is the Ratio of Males per 100 Females in Harrison?
There are 57.10 Males per 100 Females in Harrison.
What is the Ratio of Females per 100 Males in Harrison?
There are 175.14 Females per 100 Males in Harrison.
What is the Median Population Age in Harrison?
Median Population Age in Harrison is 43.6 Years.
What is the Average Family Size in Harrison
Average Family Size in Harrison is 2.8 People.
What is the Average Household Size in Harrison
Average Household Size in Harrison is 2.4 People.
How Large is the Labor Force in Harrison?
There are 395 People in the Labor Forcein in Harrison.
What is the Percentage of People in the Labor Force in Harrison?
50.8% of People are in the Labor Force in Harrison.
What is the Unemployment Rate in Harrison?
Unemployment Rate in Harrison is 11.4%.