Greenville, IL Map & Demographics
Greenville Map
Greenville Overview
$24,808
PER CAPITA INCOME
$57,273
AVG FAMILY INCOME
$49,635
AVG HOUSEHOLD INCOME
29.6%
WAGE / INCOME GAP [ % ]
70.4¢/ $1
WAGE / INCOME GAP [ $ ]
0.42
INEQUALITY / GINI INDEX
7,121
TOTAL POPULATION
4,115
MALE POPULATION
3,006
FEMALE POPULATION
136.89
MALES / 100 FEMALES
73.05
FEMALES / 100 MALES
37.4
MEDIAN AGE
2.9
AVG FAMILY SIZE
2.0
AVG HOUSEHOLD SIZE
2,946
LABOR FORCE [ PEOPLE ]
46.4%
PERCENT IN LABOR FORCE
2.7%
UNEMPLOYMENT RATE
Greenville Zip Codes
Greenville Area Codes
Income in Greenville
Income Overview in Greenville
Per Capita Income in Greenville is $24,808, while median incomes of families and households are $57,273 and $49,635 respectively.
| Characteristic | Number | Measure |
| Per Capita Income | 7,121 | $24,808 |
| Median Family Income | 1,248 | $57,273 |
| Mean Family Income | 1,248 | $71,690 |
| Median Household Income | 2,479 | $49,635 |
| Mean Household Income | 2,479 | $63,368 |
| Income Deficit | 1,248 | $0 |
| Wage / Income Gap (%) | 7,121 | 29.56% |
| Wage / Income Gap ($) | 7,121 | 70.44¢ per $1 |
| Gini / Inequality Index | 7,121 | 0.42 |
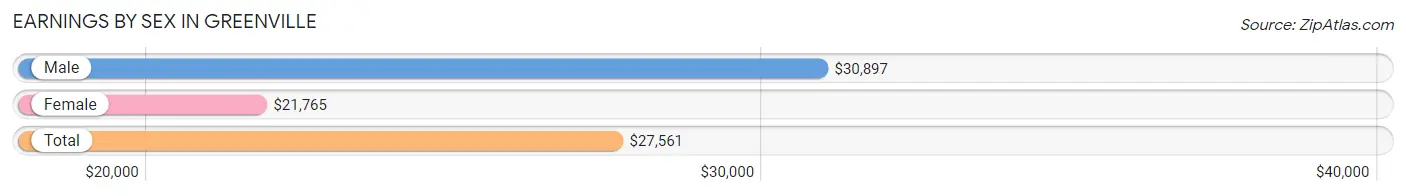
Earnings by Sex in Greenville
Average Earnings in Greenville are $27,561, $30,897 for men and $21,765 for women, a difference of 29.6%.
| Sex | Number | Average Earnings |
| Male | 2,103 (55.9%) | $30,897 |
| Female | 1,660 (44.1%) | $21,765 |
| Total | 3,763 (100.0%) | $27,561 |
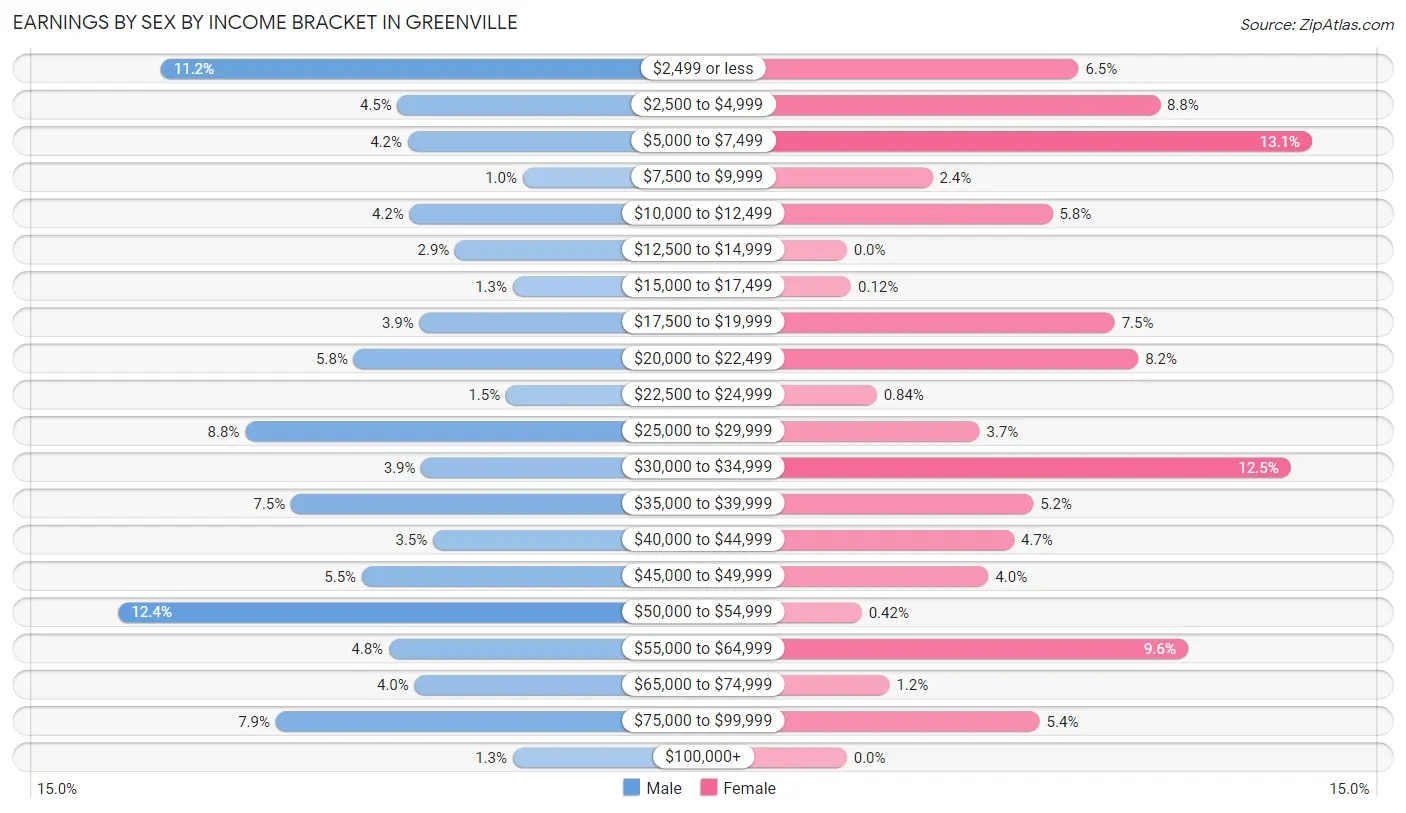
Earnings by Sex by Income Bracket in Greenville
The most common earnings brackets in Greenville are $50,000 to $54,999 for men (260 | 12.4%) and $5,000 to $7,499 for women (217 | 13.1%).
| Income | Male | Female |
| $2,499 or less | 235 (11.2%) | 108 (6.5%) |
| $2,500 to $4,999 | 95 (4.5%) | 146 (8.8%) |
| $5,000 to $7,499 | 89 (4.2%) | 217 (13.1%) |
| $7,500 to $9,999 | 21 (1.0%) | 40 (2.4%) |
| $10,000 to $12,499 | 88 (4.2%) | 96 (5.8%) |
| $12,500 to $14,999 | 61 (2.9%) | 0 (0.0%) |
| $15,000 to $17,499 | 27 (1.3%) | 2 (0.1%) |
| $17,500 to $19,999 | 82 (3.9%) | 125 (7.5%) |
| $20,000 to $22,499 | 121 (5.8%) | 136 (8.2%) |
| $22,500 to $24,999 | 31 (1.5%) | 14 (0.8%) |
| $25,000 to $29,999 | 185 (8.8%) | 62 (3.7%) |
| $30,000 to $34,999 | 81 (3.8%) | 207 (12.5%) |
| $35,000 to $39,999 | 158 (7.5%) | 87 (5.2%) |
| $40,000 to $44,999 | 74 (3.5%) | 78 (4.7%) |
| $45,000 to $49,999 | 116 (5.5%) | 66 (4.0%) |
| $50,000 to $54,999 | 260 (12.4%) | 7 (0.4%) |
| $55,000 to $64,999 | 100 (4.8%) | 159 (9.6%) |
| $65,000 to $74,999 | 85 (4.0%) | 20 (1.2%) |
| $75,000 to $99,999 | 167 (7.9%) | 90 (5.4%) |
| $100,000+ | 27 (1.3%) | 0 (0.0%) |
| Total | 2,103 (100.0%) | 1,660 (100.0%) |
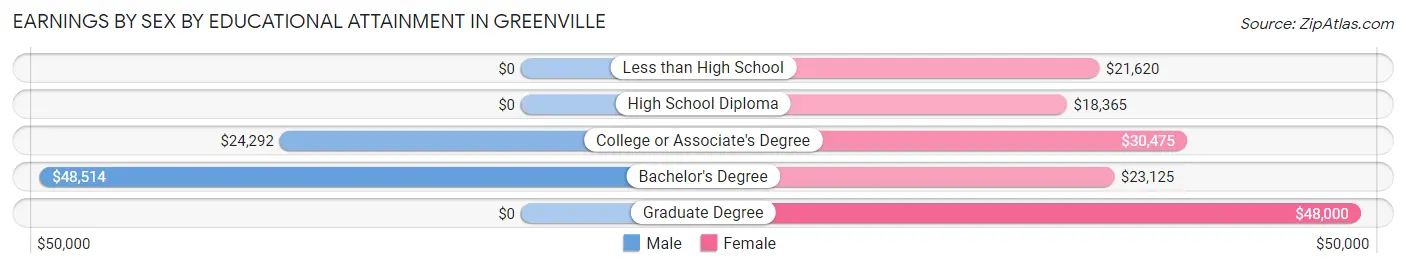
Earnings by Sex by Educational Attainment in Greenville
Average earnings in Greenville are $37,232 for men and $30,152 for women, a difference of 19.0%. Men with an educational attainment of bachelor's degree enjoy the highest average annual earnings of $48,514, while those with college or associate's degree education earn the least with $24,292. Women with an educational attainment of graduate degree earn the most with the average annual earnings of $48,000, while those with high school diploma education have the smallest earnings of $18,365.
| Educational Attainment | Male Income | Female Income |
| Less than High School | - | - |
| High School Diploma | - | - |
| College or Associate's Degree | $24,292 | $30,475 |
| Bachelor's Degree | $48,514 | $23,125 |
| Graduate Degree | - | - |
| Total | $37,232 | $30,152 |
Family Income in Greenville
Family Income Brackets in Greenville
According to the Greenville family income data, there are 293 families falling into the $35,000 to $49,999 income range, which is the most common income bracket and makes up 23.5% of all families.
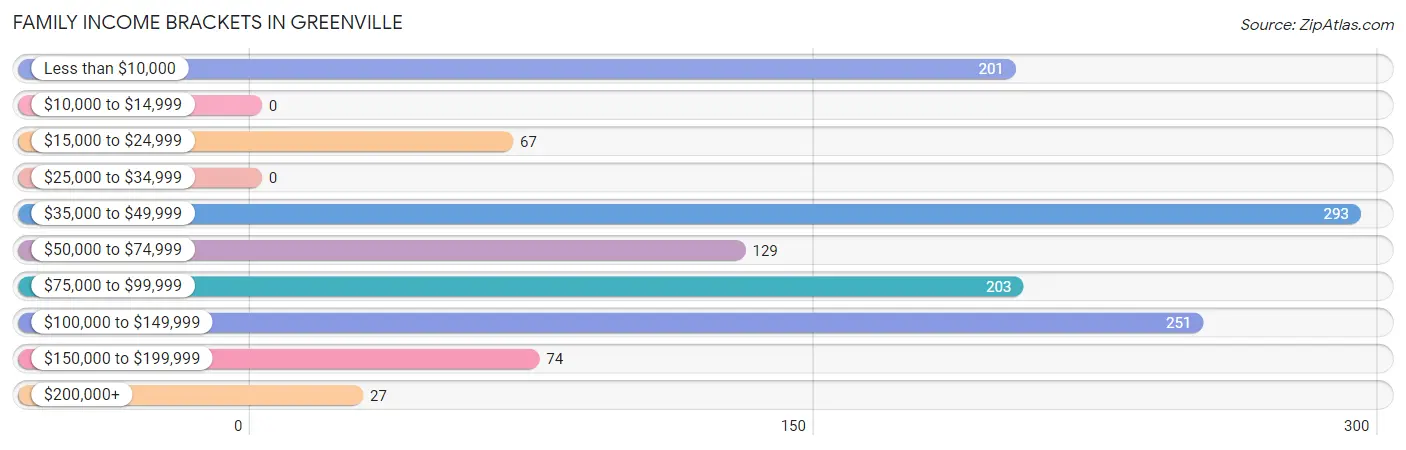
| Income Bracket | # Families | % Families |
| Less than $10,000 | 201 | 16.1% |
| $10,000 to $14,999 | 0 | 0.0% |
| $15,000 to $24,999 | 67 | 5.4% |
| $25,000 to $34,999 | 0 | 0.0% |
| $35,000 to $49,999 | 293 | 23.5% |
| $50,000 to $74,999 | 129 | 10.3% |
| $75,000 to $99,999 | 203 | 16.3% |
| $100,000 to $149,999 | 251 | 20.1% |
| $150,000 to $199,999 | 74 | 5.9% |
| $200,000+ | 27 | 2.2% |
Family Income by Famaliy Size in Greenville
2-person families (706 | 56.6%) account for the highest median family income in Greenville with $52,266 per family, while 2-person families (706 | 56.6%) have the highest median income of $26,133 per family member.
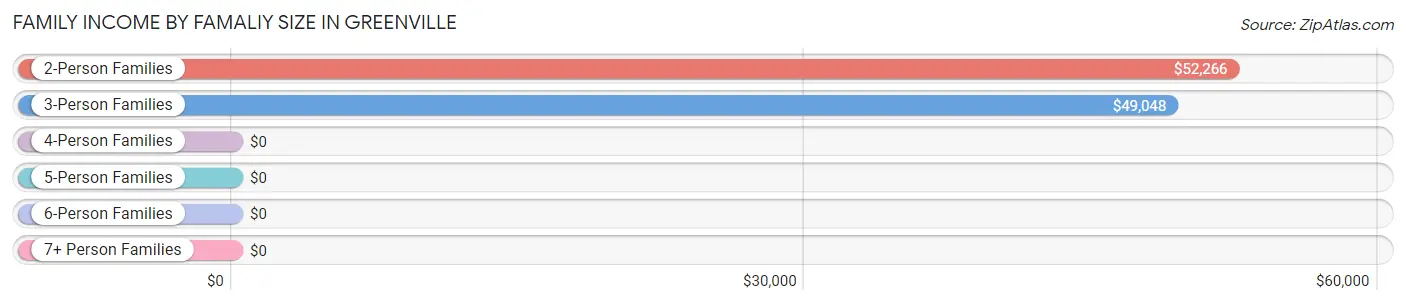
| Income Bracket | # Families | Median Income |
| 2-Person Families | 706 (56.6%) | $52,266 |
| 3-Person Families | 280 (22.4%) | $49,048 |
| 4-Person Families | 197 (15.8%) | $0 |
| 5-Person Families | 46 (3.7%) | $0 |
| 6-Person Families | 0 (0.0%) | $0 |
| 7+ Person Families | 19 (1.5%) | $0 |
| Total | 1,248 (100.0%) | $57,273 |
Family Income by Number of Earners in Greenville
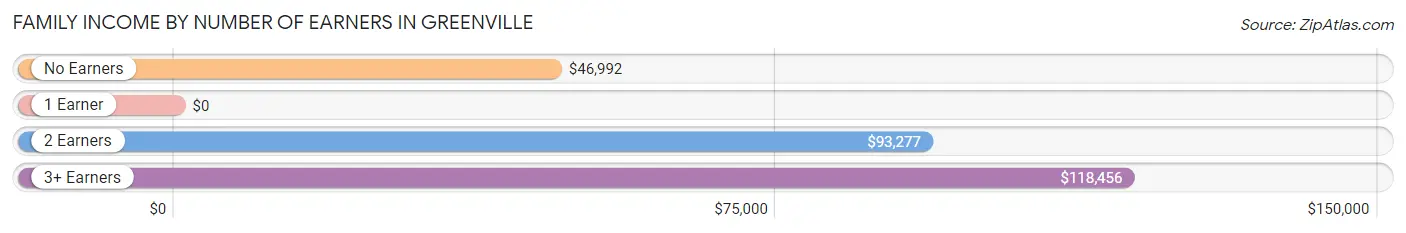
| Number of Earners | # Families | Median Income |
| No Earners | 151 (12.1%) | $46,992 |
| 1 Earner | 413 (33.1%) | $0 |
| 2 Earners | 620 (49.7%) | $93,277 |
| 3+ Earners | 64 (5.1%) | $118,456 |
| Total | 1,248 (100.0%) | $57,273 |
Household Income in Greenville
Household Income Brackets in Greenville
With 563 households falling in the category, the $35,000 to $49,999 income range is the most frequent in Greenville, accounting for 22.7% of all households. In contrast, only 52 households (2.1%) fall into the $200,000+ income bracket, making it the least populous group.
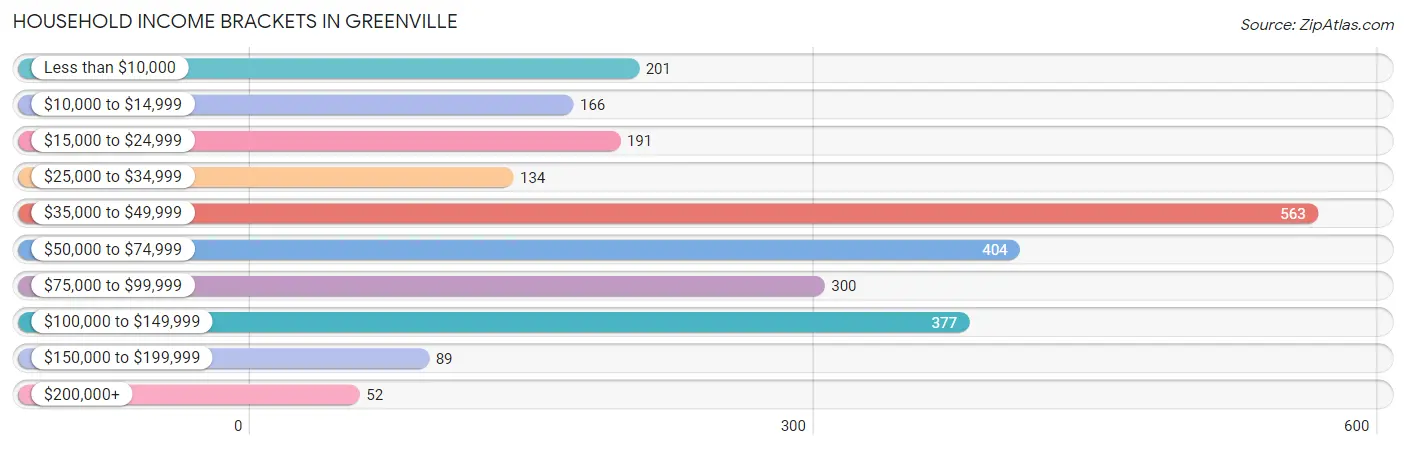
| Income Bracket | # Households | % Households |
| Less than $10,000 | 201 | 8.1% |
| $10,000 to $14,999 | 166 | 6.7% |
| $15,000 to $24,999 | 191 | 7.7% |
| $25,000 to $34,999 | 134 | 5.4% |
| $35,000 to $49,999 | 563 | 22.7% |
| $50,000 to $74,999 | 404 | 16.3% |
| $75,000 to $99,999 | 300 | 12.1% |
| $100,000 to $149,999 | 377 | 15.2% |
| $150,000 to $199,999 | 89 | 3.6% |
| $200,000+ | 52 | 2.1% |
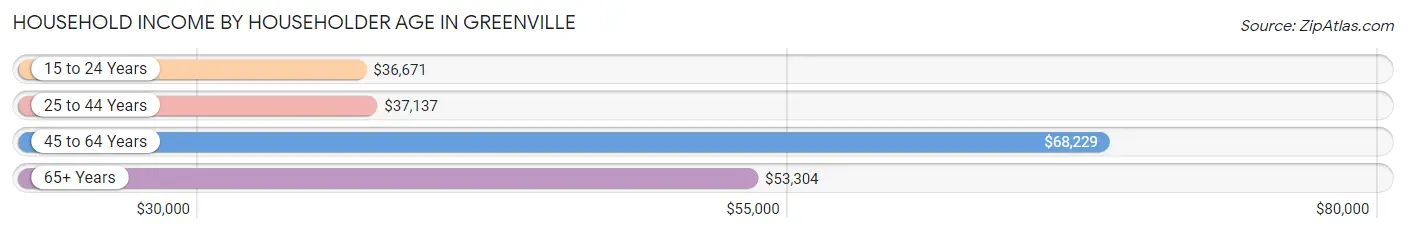
Household Income by Householder Age in Greenville
The median household income in Greenville is $49,635, with the highest median household income of $68,229 found in the 45 to 64 years age bracket for the primary householder. A total of 647 households (26.1%) fall into this category. Meanwhile, the 15 to 24 years age bracket for the primary householder has the lowest median household income of $36,671, with 191 households (7.7%) in this group.
| Income Bracket | # Households | Median Income |
| 15 to 24 Years | 191 (7.7%) | $36,671 |
| 25 to 44 Years | 946 (38.2%) | $37,137 |
| 45 to 64 Years | 647 (26.1%) | $68,229 |
| 65+ Years | 695 (28.0%) | $53,304 |
| Total | 2,479 (100.0%) | $49,635 |
Poverty in Greenville
Income Below Poverty by Sex and Age in Greenville
With 18.4% poverty level for males and 19.2% for females among the residents of Greenville, 12 to 14 year old males and 15 year old females are the most vulnerable to poverty, with 190 males (100.0%) and 34 females (100.0%) in their respective age groups living below the poverty level.
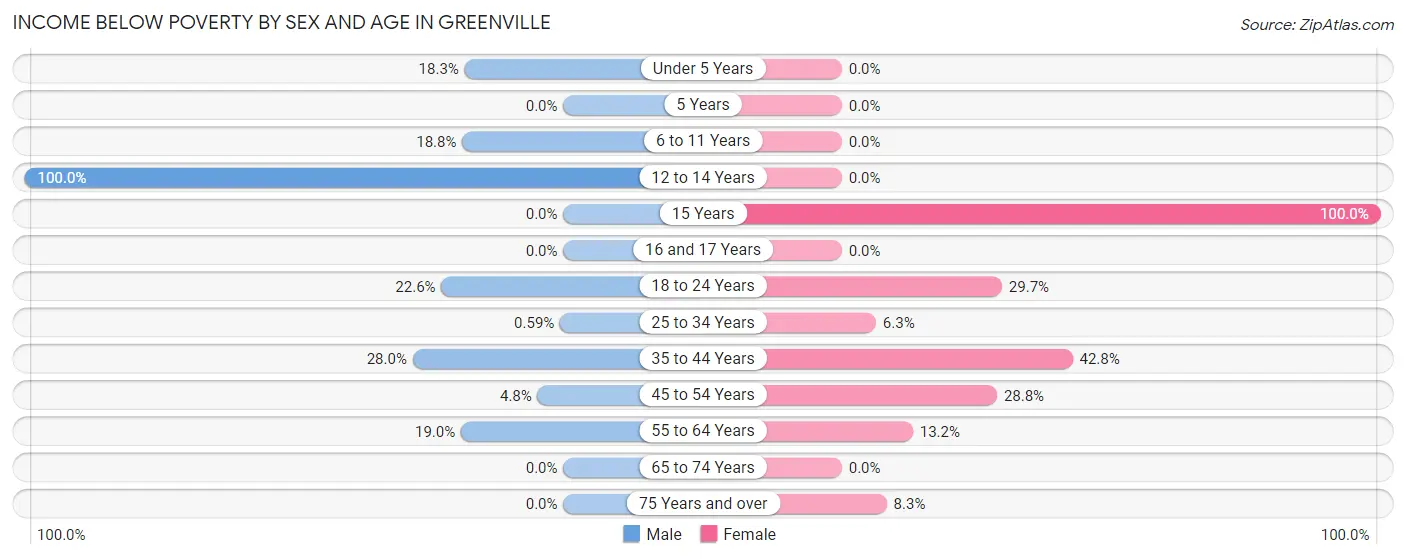
| Age Bracket | Male | Female |
| Under 5 Years | 24 (18.3%) | 0 (0.0%) |
| 5 Years | 0 (0.0%) | 0 (0.0%) |
| 6 to 11 Years | 54 (18.8%) | 0 (0.0%) |
| 12 to 14 Years | 190 (100.0%) | 0 (0.0%) |
| 15 Years | 0 (0.0%) | 34 (100.0%) |
| 16 and 17 Years | 0 (0.0%) | 0 (0.0%) |
| 18 to 24 Years | 81 (22.6%) | 85 (29.7%) |
| 25 to 34 Years | 2 (0.6%) | 24 (6.3%) |
| 35 to 44 Years | 78 (28.0%) | 191 (42.8%) |
| 45 to 54 Years | 14 (4.8%) | 72 (28.8%) |
| 55 to 64 Years | 45 (19.0%) | 41 (13.2%) |
| 65 to 74 Years | 0 (0.0%) | 0 (0.0%) |
| 75 Years and over | 0 (0.0%) | 26 (8.3%) |
| Total | 488 (18.4%) | 473 (19.2%) |
Income Above Poverty by Sex and Age in Greenville
According to the poverty statistics in Greenville, males aged 16 and 17 years and females aged under 5 years are the age groups that are most secure financially, with 100.0% of males and 100.0% of females in these age groups living above the poverty line.
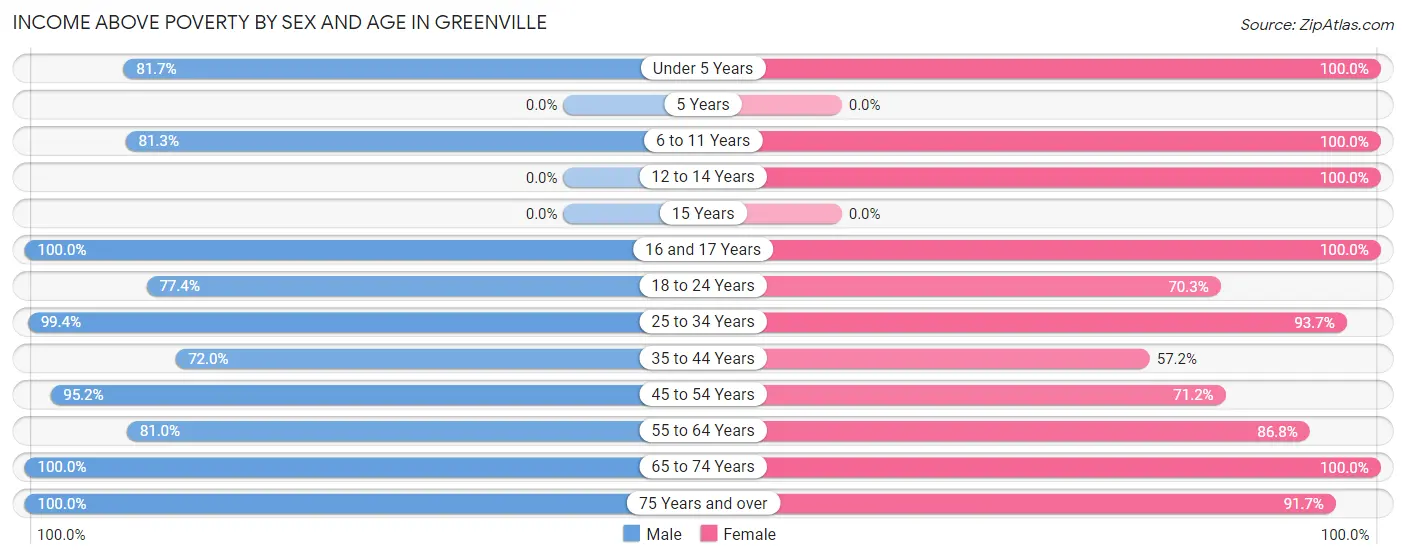
| Age Bracket | Male | Female |
| Under 5 Years | 107 (81.7%) | 23 (100.0%) |
| 5 Years | 0 (0.0%) | 0 (0.0%) |
| 6 to 11 Years | 234 (81.2%) | 37 (100.0%) |
| 12 to 14 Years | 0 (0.0%) | 68 (100.0%) |
| 15 Years | 0 (0.0%) | 0 (0.0%) |
| 16 and 17 Years | 97 (100.0%) | 85 (100.0%) |
| 18 to 24 Years | 277 (77.4%) | 201 (70.3%) |
| 25 to 34 Years | 336 (99.4%) | 355 (93.7%) |
| 35 to 44 Years | 201 (72.0%) | 255 (57.2%) |
| 45 to 54 Years | 279 (95.2%) | 178 (71.2%) |
| 55 to 64 Years | 192 (81.0%) | 270 (86.8%) |
| 65 to 74 Years | 209 (100.0%) | 234 (100.0%) |
| 75 Years and over | 227 (100.0%) | 286 (91.7%) |
| Total | 2,159 (81.6%) | 1,992 (80.8%) |
Income Below Poverty Among Married-Couple Families in Greenville
The poverty statistics for married-couple families in Greenville show that 1.2% or 10 of the total 818 families live below the poverty line. Families with no children have the highest poverty rate of 2.2%, comprising of 10 families. On the other hand, families with 1 or 2 children have the lowest poverty rate of 0.0%, which includes 0 families.
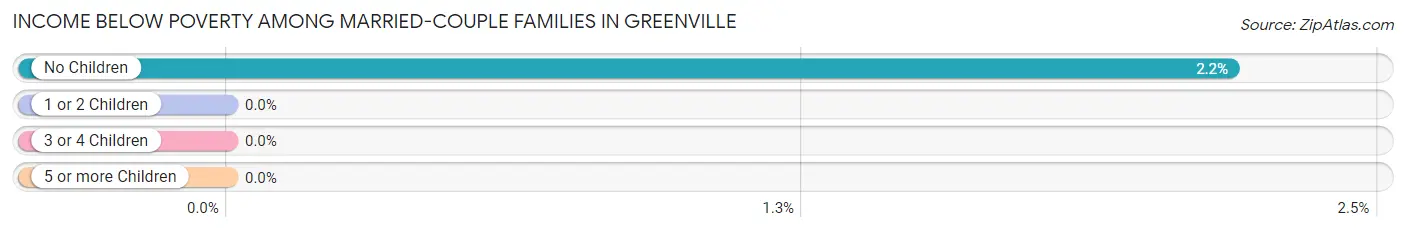
| Children | Above Poverty | Below Poverty |
| No Children | 449 (97.8%) | 10 (2.2%) |
| 1 or 2 Children | 320 (100.0%) | 0 (0.0%) |
| 3 or 4 Children | 39 (100.0%) | 0 (0.0%) |
| 5 or more Children | 0 (0.0%) | 0 (0.0%) |
| Total | 808 (98.8%) | 10 (1.2%) |
Income Below Poverty Among Single-Parent Households in Greenville
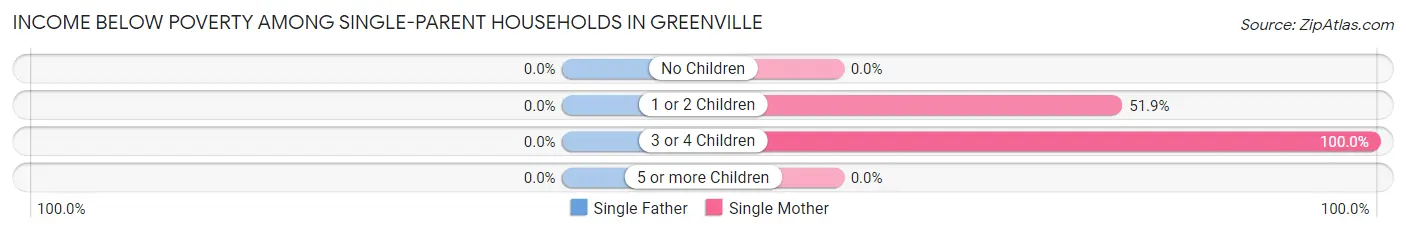
| Children | Single Father | Single Mother |
| No Children | 0 (0.0%) | 0 (0.0%) |
| 1 or 2 Children | 0 (0.0%) | 191 (51.9%) |
| 3 or 4 Children | 0 (0.0%) | 22 (100.0%) |
| 5 or more Children | 0 (0.0%) | 0 (0.0%) |
| Total | 0 (0.0%) | 213 (54.6%) |
Income Below Poverty Among Married-Couple vs Single-Parent Households in Greenville
The poverty data for Greenville shows that 10 of the married-couple family households (1.2%) and 213 of the single-parent households (49.5%) are living below the poverty level. Within the married-couple family households, those with no children have the highest poverty rate, with 10 households (2.2%) falling below the poverty line. Among the single-parent households, those with 3 or 4 children have the highest poverty rate, with 22 household (100.0%) living below poverty.
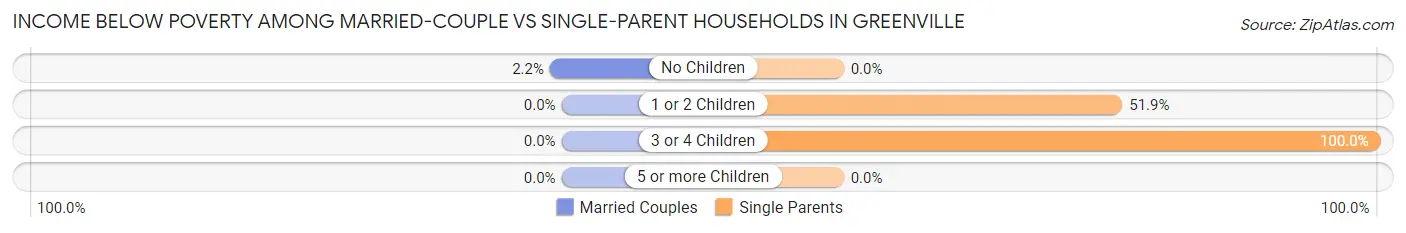
| Children | Married-Couple Families | Single-Parent Households |
| No Children | 10 (2.2%) | 0 (0.0%) |
| 1 or 2 Children | 0 (0.0%) | 191 (51.9%) |
| 3 or 4 Children | 0 (0.0%) | 22 (100.0%) |
| 5 or more Children | 0 (0.0%) | 0 (0.0%) |
| Total | 10 (1.2%) | 213 (49.5%) |
Race in Greenville
The most populous races in Greenville are White / Caucasian (5,721 | 80.3%), Black / African American (1,125 | 15.8%), and Hispanic or Latino (405 | 5.7%).
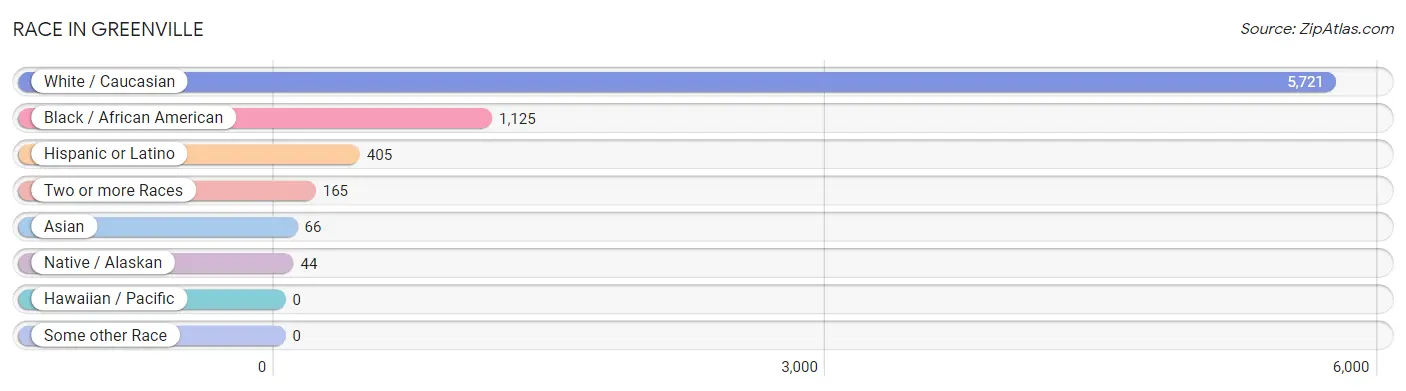
| Race | # Population | % Population |
| Asian | 66 | 0.9% |
| Black / African American | 1,125 | 15.8% |
| Hawaiian / Pacific | 0 | 0.0% |
| Hispanic or Latino | 405 | 5.7% |
| Native / Alaskan | 44 | 0.6% |
| White / Caucasian | 5,721 | 80.3% |
| Two or more Races | 165 | 2.3% |
| Some other Race | 0 | 0.0% |
| Total | 7,121 | 100.0% |
Ancestry in Greenville
The most populous ancestries reported in Greenville are German (1,535 | 21.6%), Irish (950 | 13.3%), English (644 | 9.0%), Mexican (315 | 4.4%), and American (288 | 4.0%), together accounting for 52.4% of all Greenville residents.
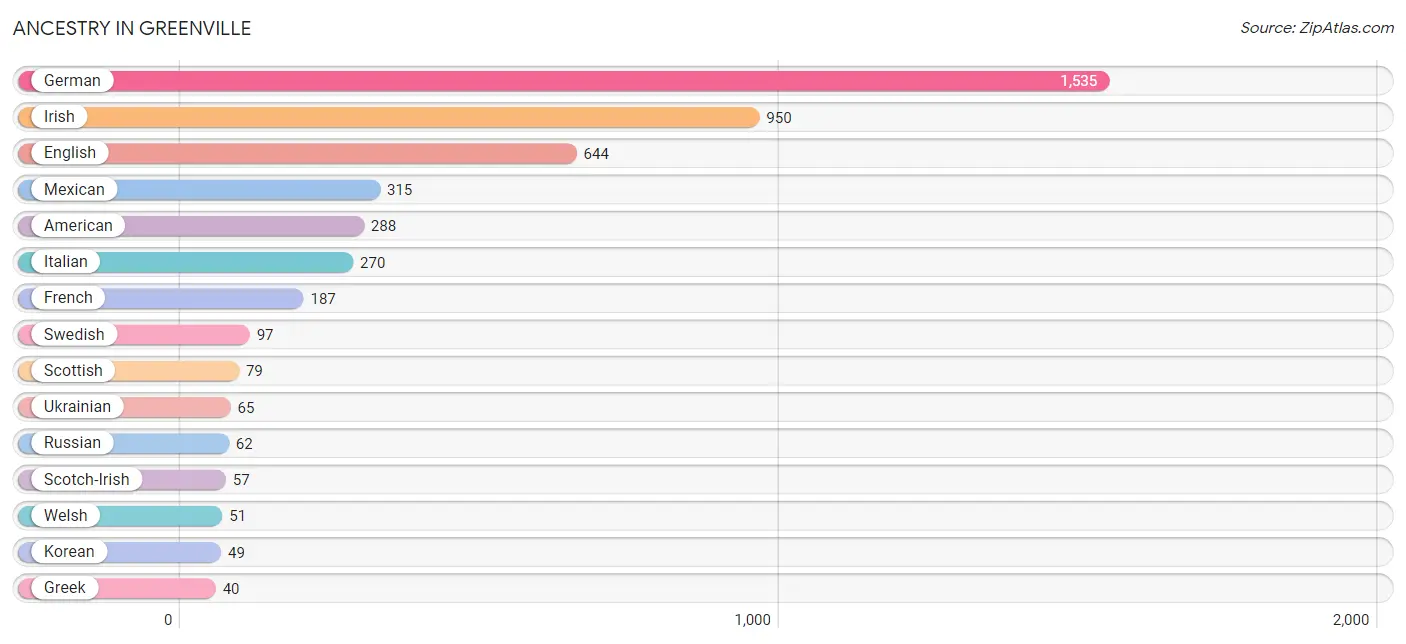
| Ancestry | # Population | % Population |
| African | 20 | 0.3% |
| American | 288 | 4.0% |
| British | 36 | 0.5% |
| Canadian | 5 | 0.1% |
| Czech | 35 | 0.5% |
| Danish | 18 | 0.3% |
| Dutch | 7 | 0.1% |
| Ecuadorian | 12 | 0.2% |
| English | 644 | 9.0% |
| European | 6 | 0.1% |
| French | 187 | 2.6% |
| German | 1,535 | 21.6% |
| Greek | 40 | 0.6% |
| Indian (Asian) | 4 | 0.1% |
| Irish | 950 | 13.3% |
| Italian | 270 | 3.8% |
| Korean | 49 | 0.7% |
| Lithuanian | 16 | 0.2% |
| Mexican | 315 | 4.4% |
| Norwegian | 31 | 0.4% |
| Polish | 24 | 0.3% |
| Russian | 62 | 0.9% |
| Scandinavian | 15 | 0.2% |
| Scotch-Irish | 57 | 0.8% |
| Scottish | 79 | 1.1% |
| Sioux | 11 | 0.2% |
| South American | 12 | 0.2% |
| Spanish | 3 | 0.0% |
| Subsaharan African | 24 | 0.3% |
| Swedish | 97 | 1.4% |
| Swiss | 36 | 0.5% |
| Thai | 23 | 0.3% |
| U.S. Virgin Islander | 1 | 0.0% |
| Ugandan | 4 | 0.1% |
| Ukrainian | 65 | 0.9% |
| Welsh | 51 | 0.7% | View All 36 Rows |
Immigrants in Greenville
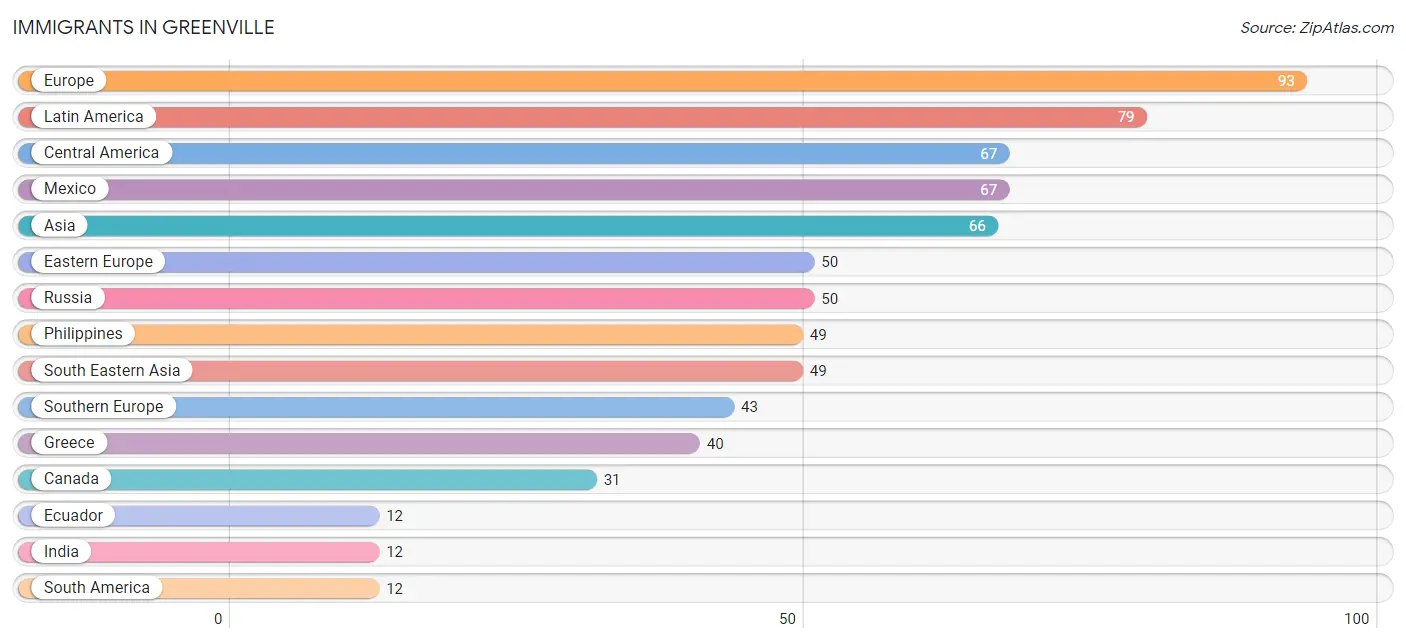
The most numerous immigrant groups reported in Greenville came from Europe (93 | 1.3%), Latin America (79 | 1.1%), Central America (67 | 0.9%), Mexico (67 | 0.9%), and Asia (66 | 0.9%), together accounting for 5.2% of all Greenville residents.
| Immigration Origin | # Population | % Population |
| Africa | 4 | 0.1% |
| Asia | 66 | 0.9% |
| Canada | 31 | 0.4% |
| Central America | 67 | 0.9% |
| China | 5 | 0.1% |
| Eastern Africa | 4 | 0.1% |
| Eastern Asia | 5 | 0.1% |
| Eastern Europe | 50 | 0.7% |
| Ecuador | 12 | 0.2% |
| Europe | 93 | 1.3% |
| Greece | 40 | 0.6% |
| India | 12 | 0.2% |
| Latin America | 79 | 1.1% |
| Mexico | 67 | 0.9% |
| Philippines | 49 | 0.7% |
| Russia | 50 | 0.7% |
| South America | 12 | 0.2% |
| South Central Asia | 12 | 0.2% |
| South Eastern Asia | 49 | 0.7% |
| Southern Europe | 43 | 0.6% |
| Spain | 3 | 0.0% |
| Uganda | 4 | 0.1% | View All 22 Rows |
Sex and Age in Greenville
Sex and Age in Greenville
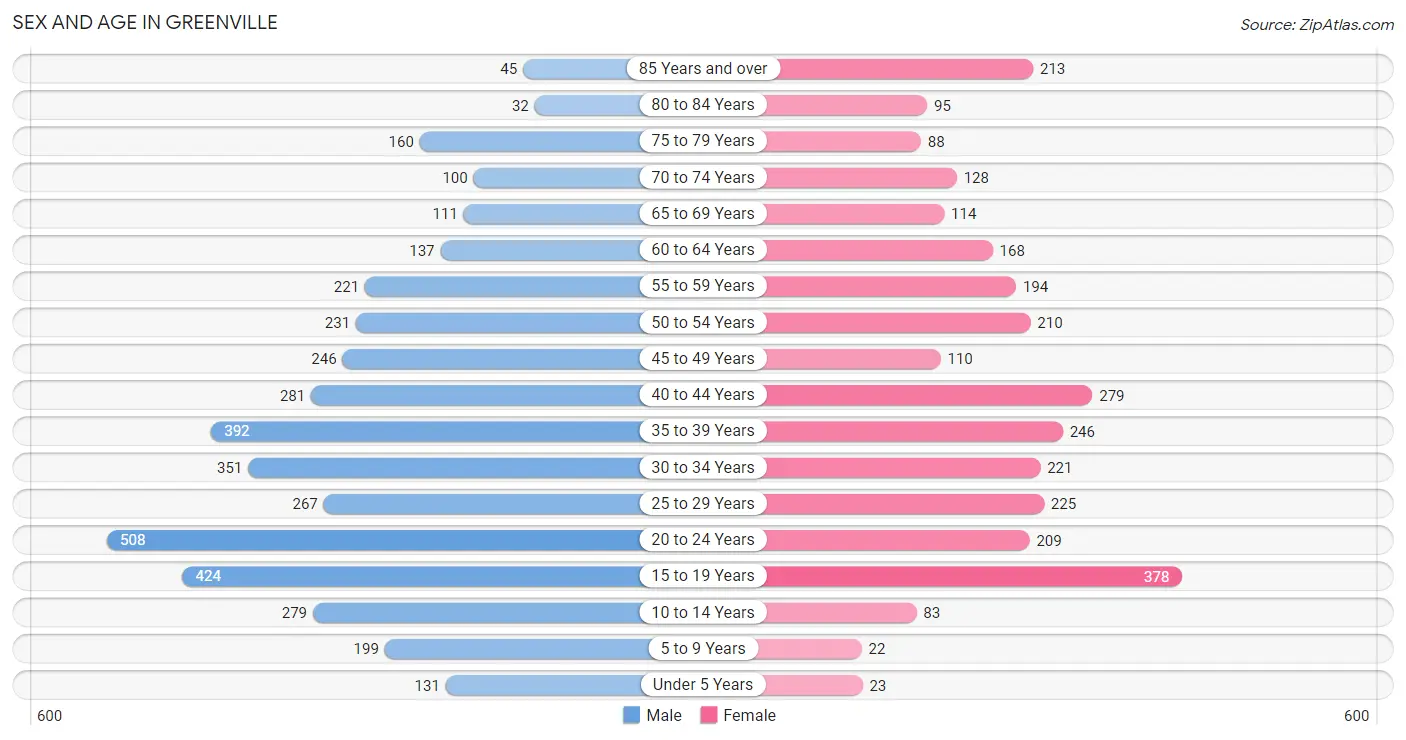
The most populous age groups in Greenville are 20 to 24 Years (508 | 12.3%) for men and 15 to 19 Years (378 | 12.6%) for women.
| Age Bracket | Male | Female |
| Under 5 Years | 131 (3.2%) | 23 (0.8%) |
| 5 to 9 Years | 199 (4.8%) | 22 (0.7%) |
| 10 to 14 Years | 279 (6.8%) | 83 (2.8%) |
| 15 to 19 Years | 424 (10.3%) | 378 (12.6%) |
| 20 to 24 Years | 508 (12.3%) | 209 (7.0%) |
| 25 to 29 Years | 267 (6.5%) | 225 (7.5%) |
| 30 to 34 Years | 351 (8.5%) | 221 (7.3%) |
| 35 to 39 Years | 392 (9.5%) | 246 (8.2%) |
| 40 to 44 Years | 281 (6.8%) | 279 (9.3%) |
| 45 to 49 Years | 246 (6.0%) | 110 (3.7%) |
| 50 to 54 Years | 231 (5.6%) | 210 (7.0%) |
| 55 to 59 Years | 221 (5.4%) | 194 (6.5%) |
| 60 to 64 Years | 137 (3.3%) | 168 (5.6%) |
| 65 to 69 Years | 111 (2.7%) | 114 (3.8%) |
| 70 to 74 Years | 100 (2.4%) | 128 (4.3%) |
| 75 to 79 Years | 160 (3.9%) | 88 (2.9%) |
| 80 to 84 Years | 32 (0.8%) | 95 (3.2%) |
| 85 Years and over | 45 (1.1%) | 213 (7.1%) |
| Total | 4,115 (100.0%) | 3,006 (100.0%) |
Families and Households in Greenville
Median Family Size in Greenville
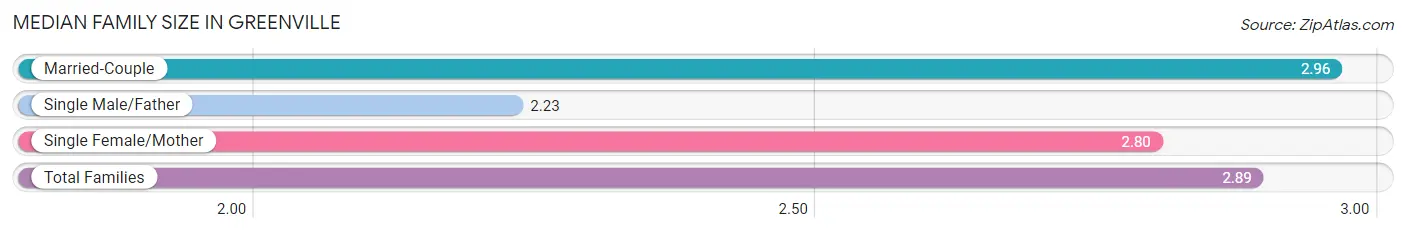
The median family size in Greenville is 2.89 persons per family, with married-couple families (818 | 65.5%) accounting for the largest median family size of 2.96 persons per family. On the other hand, single male/father families (40 | 3.2%) represent the smallest median family size with 2.23 persons per family.
| Family Type | # Families | Family Size |
| Married-Couple | 818 (65.5%) | 2.96 |
| Single Male/Father | 40 (3.2%) | 2.23 |
| Single Female/Mother | 390 (31.2%) | 2.80 |
| Total Families | 1,248 (100.0%) | 2.89 |
Median Household Size in Greenville
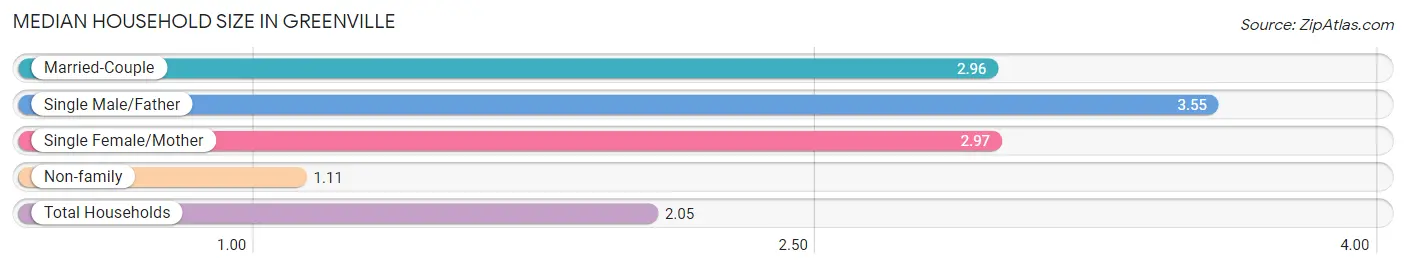
The median household size in Greenville is 2.05 persons per household, with single male/father households (40 | 1.6%) accounting for the largest median household size of 3.55 persons per household. non-family households (1,231 | 49.7%) represent the smallest median household size with 1.11 persons per household.
| Household Type | # Households | Household Size |
| Married-Couple | 818 (33.0%) | 2.96 |
| Single Male/Father | 40 (1.6%) | 3.55 |
| Single Female/Mother | 390 (15.7%) | 2.97 |
| Non-family | 1,231 (49.7%) | 1.11 |
| Total Households | 2,479 (100.0%) | 2.05 |
Household Size by Marriage Status in Greenville
Out of a total of 2,479 households in Greenville, 1,248 (50.3%) are family households, while 1,231 (49.7%) are nonfamily households. The most numerous type of family households are 2-person households, comprising 674, and the most common type of nonfamily households are 1-person households, comprising 1,080.
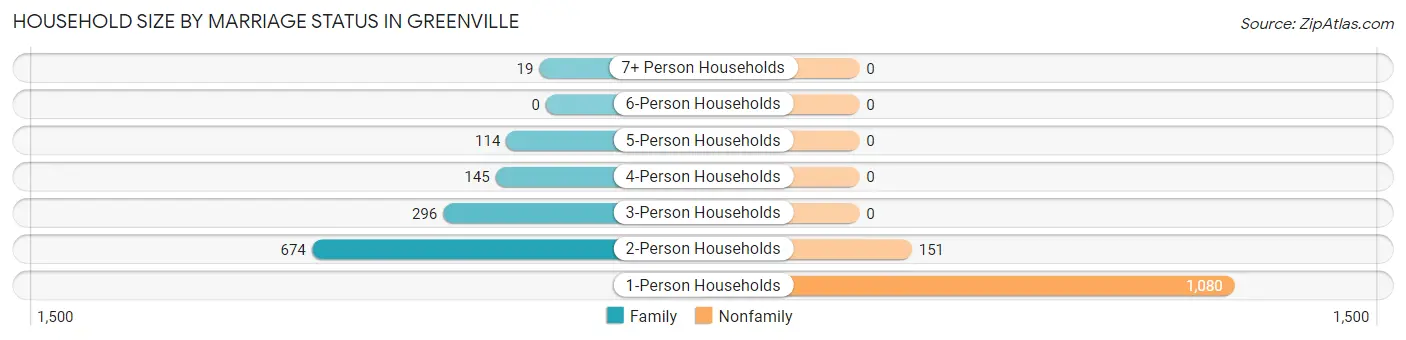
| Household Size | Family Households | Nonfamily Households |
| 1-Person Households | - | 1,080 (43.6%) |
| 2-Person Households | 674 (27.2%) | 151 (6.1%) |
| 3-Person Households | 296 (11.9%) | 0 (0.0%) |
| 4-Person Households | 145 (5.9%) | 0 (0.0%) |
| 5-Person Households | 114 (4.6%) | 0 (0.0%) |
| 6-Person Households | 0 (0.0%) | 0 (0.0%) |
| 7+ Person Households | 19 (0.8%) | 0 (0.0%) |
| Total | 1,248 (50.3%) | 1,231 (49.7%) |
Female Fertility in Greenville
Fertility by Age in Greenville
Average fertility rate in Greenville is 2.0 births per 1,000 women. Women in the age bracket of 20 to 34 years have the highest fertility rate with 6.0 births per 1,000 women. Women in the age bracket of 20 to 34 years acount for 100.0% of all women with births.
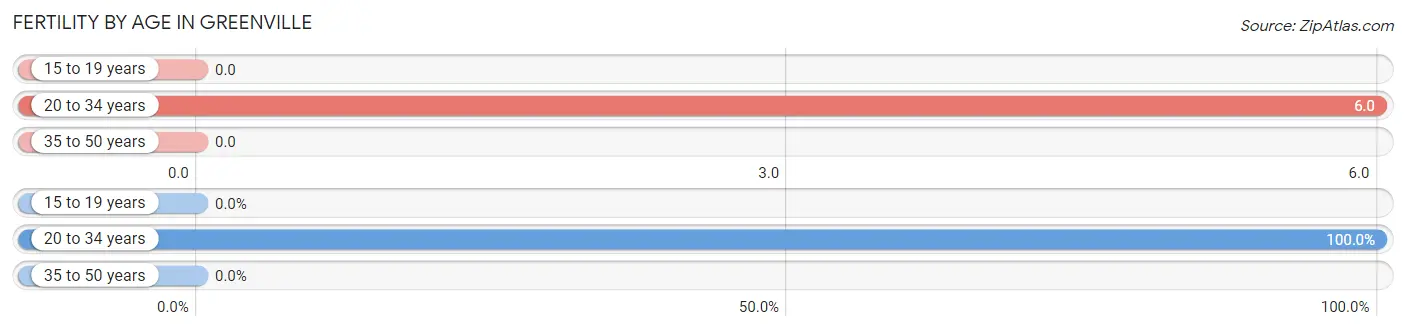
| Age Bracket | Women with Births | Births / 1,000 Women |
| 15 to 19 years | 0 (0.0%) | 0.0 |
| 20 to 34 years | 4 (100.0%) | 6.0 |
| 35 to 50 years | 0 (0.0%) | 0.0 |
| Total | 4 (100.0%) | 2.0 |
Fertility by Age by Marriage Status in Greenville
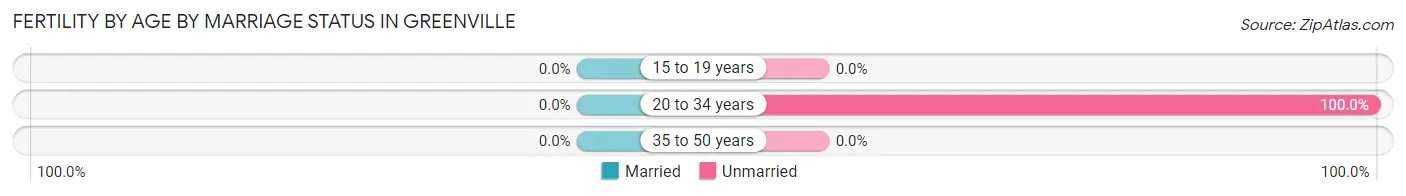
| Age Bracket | Married | Unmarried |
| 15 to 19 years | 0 (0.0%) | 0 (0.0%) |
| 20 to 34 years | 0 (0.0%) | 4 (100.0%) |
| 35 to 50 years | 0 (0.0%) | 0 (0.0%) |
| Total | 0 (0.0%) | 4 (100.0%) |
Fertility by Education in Greenville
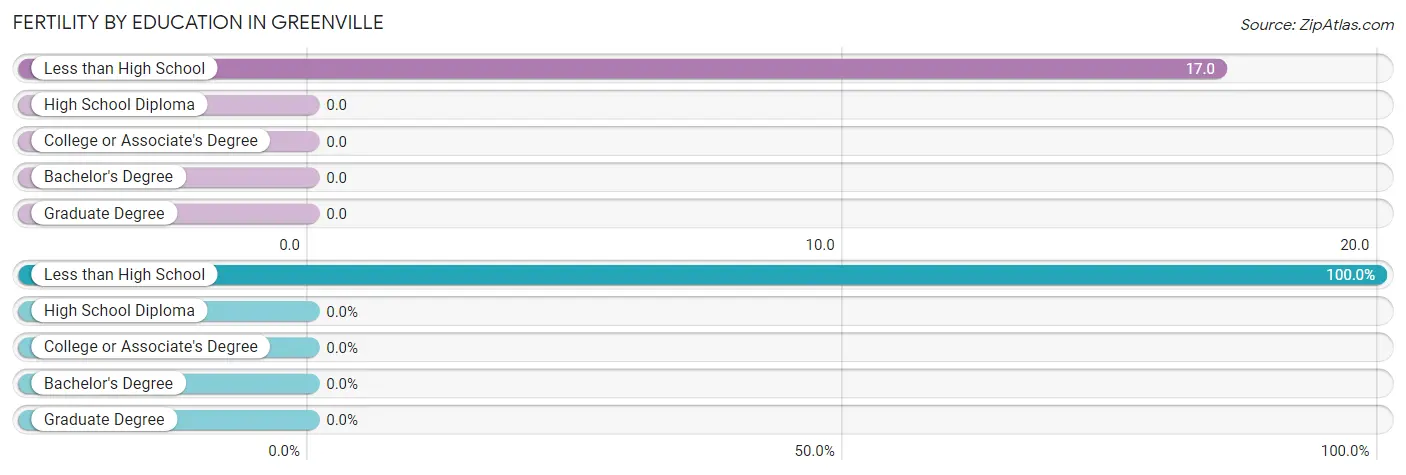
| Educational Attainment | Women with Births | Births / 1,000 Women |
| Less than High School | 4 (100.0%) | 17.0 |
| High School Diploma | 0 (0.0%) | 0.0 |
| College or Associate's Degree | 0 (0.0%) | 0.0 |
| Bachelor's Degree | 0 (0.0%) | 0.0 |
| Graduate Degree | 0 (0.0%) | 0.0 |
| Total | 4 (100.0%) | 2.0 |
Fertility by Education by Marriage Status in Greenville
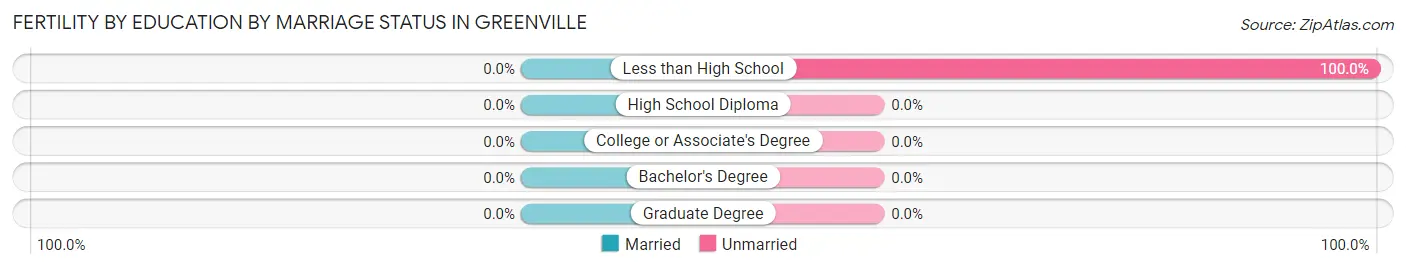
| Educational Attainment | Married | Unmarried |
| Less than High School | 0 (0.0%) | 4 (100.0%) |
| High School Diploma | 0 (0.0%) | 0 (0.0%) |
| College or Associate's Degree | 0 (0.0%) | 0 (0.0%) |
| Bachelor's Degree | 0 (0.0%) | 0 (0.0%) |
| Graduate Degree | 0 (0.0%) | 0 (0.0%) |
| Total | 0 (0.0%) | 4 (100.0%) |
Employment Characteristics in Greenville
Employment by Class of Employer in Greenville
Among the 2,819 employed individuals in Greenville, private company employees (2,047 | 72.6%), local government employees (238 | 8.4%), and not-for-profit organizations (203 | 7.2%) make up the most common classes of employment.
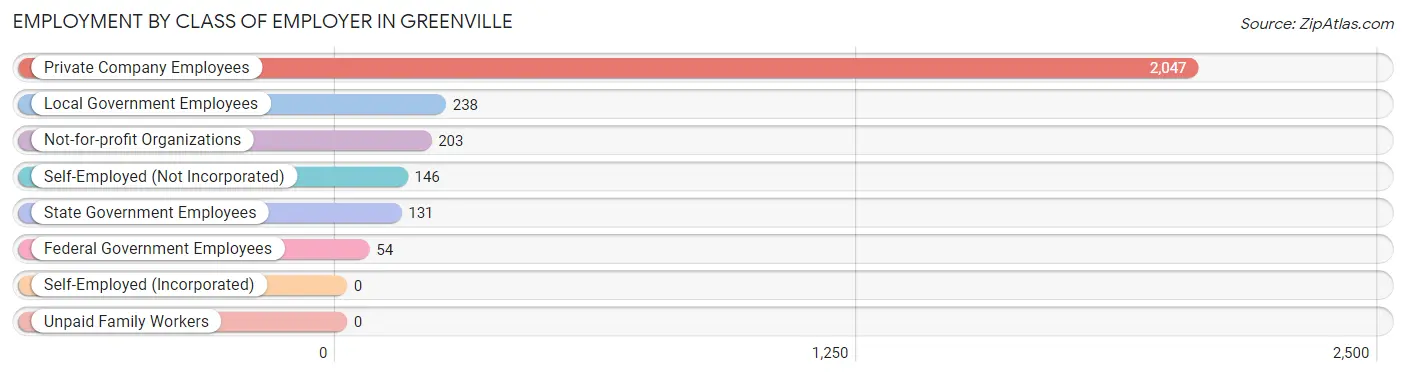
| Employer Class | # Employees | % Employees |
| Private Company Employees | 2,047 | 72.6% |
| Self-Employed (Incorporated) | 0 | 0.0% |
| Self-Employed (Not Incorporated) | 146 | 5.2% |
| Not-for-profit Organizations | 203 | 7.2% |
| Local Government Employees | 238 | 8.4% |
| State Government Employees | 131 | 4.6% |
| Federal Government Employees | 54 | 1.9% |
| Unpaid Family Workers | 0 | 0.0% |
| Total | 2,819 | 100.0% |
Employment Status by Age in Greenville
According to the labor force statistics for Greenville, out of the total population over 16 years of age (6,350), 46.4% or 2,946 individuals are in the labor force, with 2.7% or 80 of them unemployed. The age group with the highest labor force participation rate is 55 to 59 years, with 80.2% or 333 individuals in the labor force. Within the labor force, the 16 to 19 years age range has the highest percentage of unemployed individuals, with 27.0% or 79 of them being unemployed.
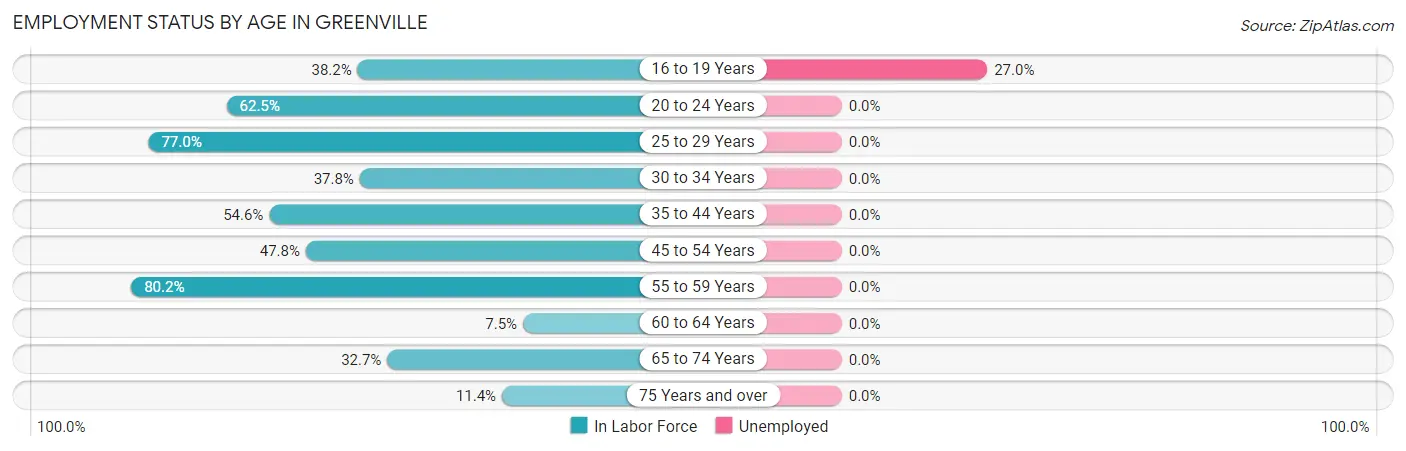
| Age Bracket | In Labor Force | Unemployed |
| 16 to 19 Years | 293 (38.2%) | 79 (27.0%) |
| 20 to 24 Years | 448 (62.5%) | 0 (0.0%) |
| 25 to 29 Years | 379 (77.0%) | 0 (0.0%) |
| 30 to 34 Years | 216 (37.8%) | 0 (0.0%) |
| 35 to 44 Years | 654 (54.6%) | 0 (0.0%) |
| 45 to 54 Years | 381 (47.8%) | 0 (0.0%) |
| 55 to 59 Years | 333 (80.2%) | 0 (0.0%) |
| 60 to 64 Years | 23 (7.5%) | 0 (0.0%) |
| 65 to 74 Years | 148 (32.7%) | 0 (0.0%) |
| 75 Years and over | 72 (11.4%) | 0 (0.0%) |
| Total | 2,946 (46.4%) | 80 (2.7%) |
Employment Status by Educational Attainment in Greenville
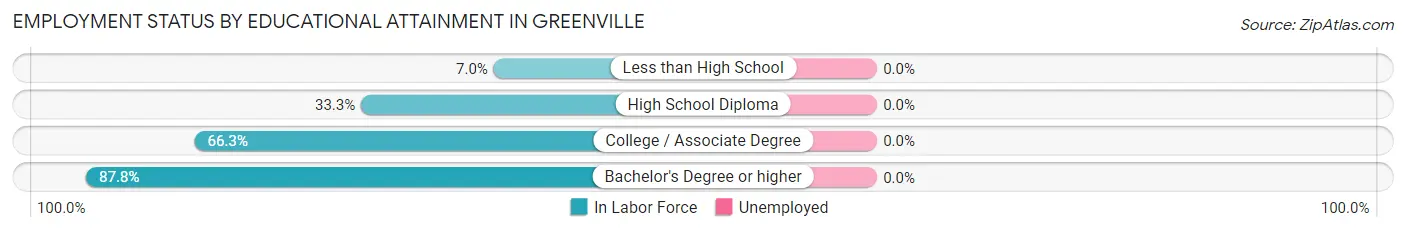
| Educational Attainment | In Labor Force | Unemployed |
| Less than High School | 45 (7.0%) | 0 (0.0%) |
| High School Diploma | 286 (33.3%) | 0 (0.0%) |
| College / Associate Degree | 1,051 (66.3%) | 0 (0.0%) |
| Bachelor's Degree or higher | 604 (87.8%) | 0 (0.0%) |
| Total | 1,988 (52.6%) | 0 (0.0%) |
Employment Occupations by Sex in Greenville
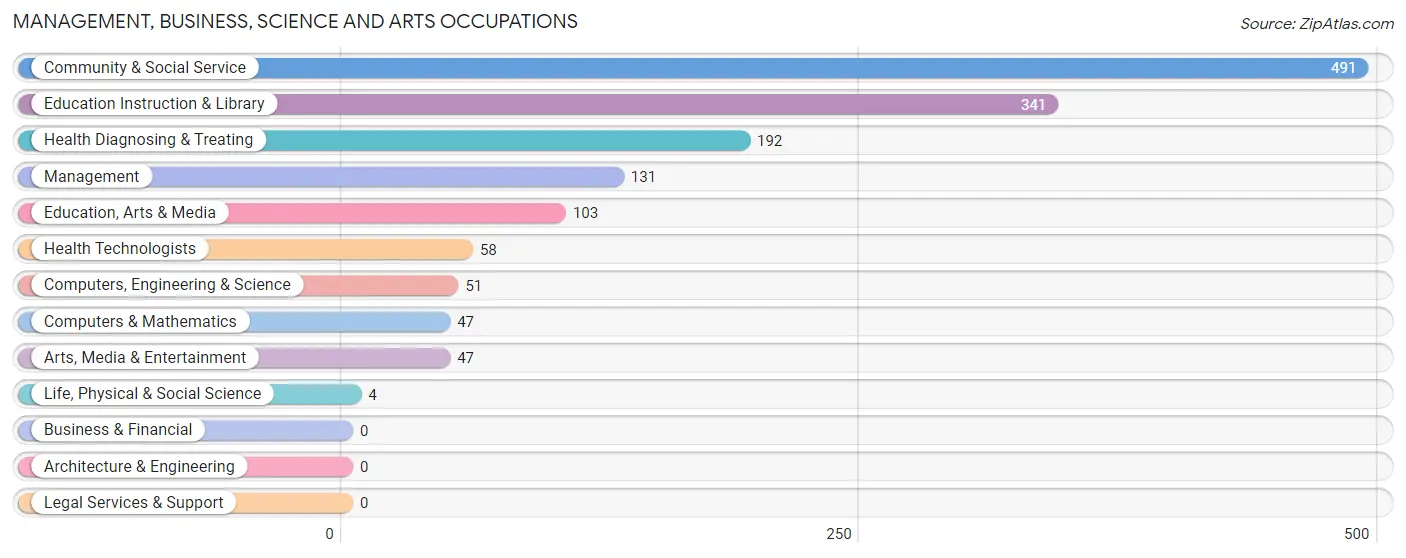
Management, Business, Science and Arts Occupations
The most common Management, Business, Science and Arts occupations in Greenville are Community & Social Service (491 | 17.2%), Education Instruction & Library (341 | 11.9%), Health Diagnosing & Treating (192 | 6.7%), Management (131 | 4.6%), and Education, Arts & Media (103 | 3.6%).
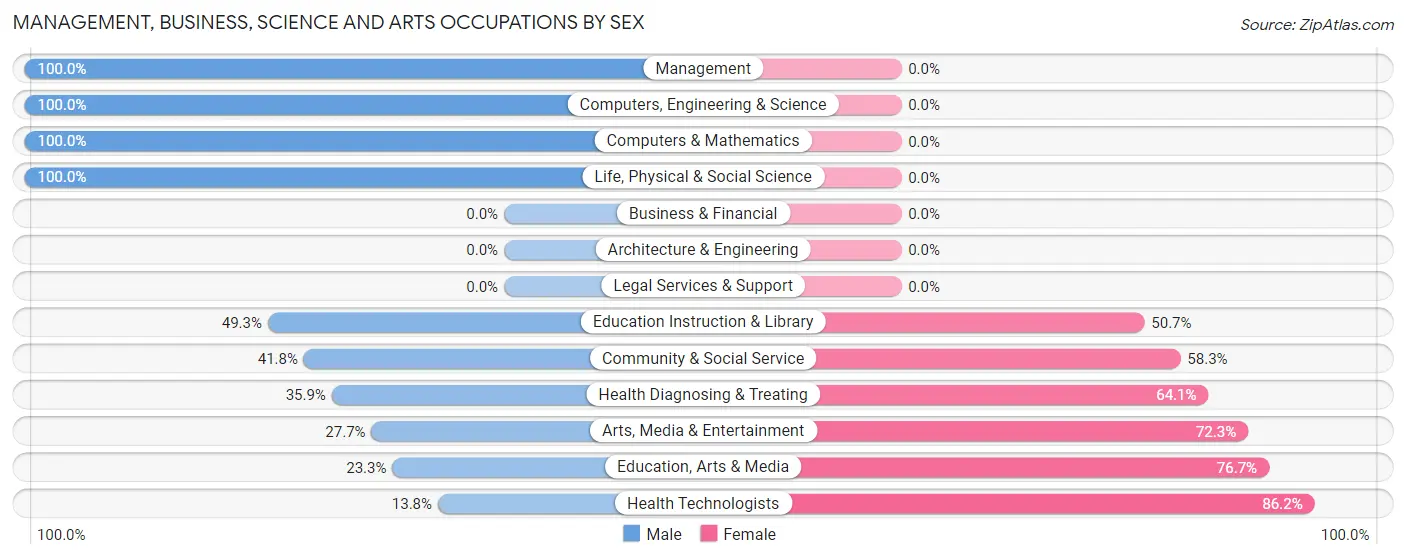
Management, Business, Science and Arts Occupations by Sex
Within the Management, Business, Science and Arts occupations in Greenville, the most male-oriented occupations are Management (100.0%), Computers, Engineering & Science (100.0%), and Computers & Mathematics (100.0%), while the most female-oriented occupations are Health Technologists (86.2%), Education, Arts & Media (76.7%), and Arts, Media & Entertainment (72.3%).
| Occupation | Male | Female |
| Management | 131 (100.0%) | 0 (0.0%) |
| Business & Financial | 0 (0.0%) | 0 (0.0%) |
| Computers, Engineering & Science | 51 (100.0%) | 0 (0.0%) |
| Computers & Mathematics | 47 (100.0%) | 0 (0.0%) |
| Architecture & Engineering | 0 (0.0%) | 0 (0.0%) |
| Life, Physical & Social Science | 4 (100.0%) | 0 (0.0%) |
| Community & Social Service | 205 (41.7%) | 286 (58.3%) |
| Education, Arts & Media | 24 (23.3%) | 79 (76.7%) |
| Legal Services & Support | 0 (0.0%) | 0 (0.0%) |
| Education Instruction & Library | 168 (49.3%) | 173 (50.7%) |
| Arts, Media & Entertainment | 13 (27.7%) | 34 (72.3%) |
| Health Diagnosing & Treating | 69 (35.9%) | 123 (64.1%) |
| Health Technologists | 8 (13.8%) | 50 (86.2%) |
| Total (Category) | 456 (52.7%) | 409 (47.3%) |
| Total (Overall) | 1,381 (48.2%) | 1,482 (51.8%) |
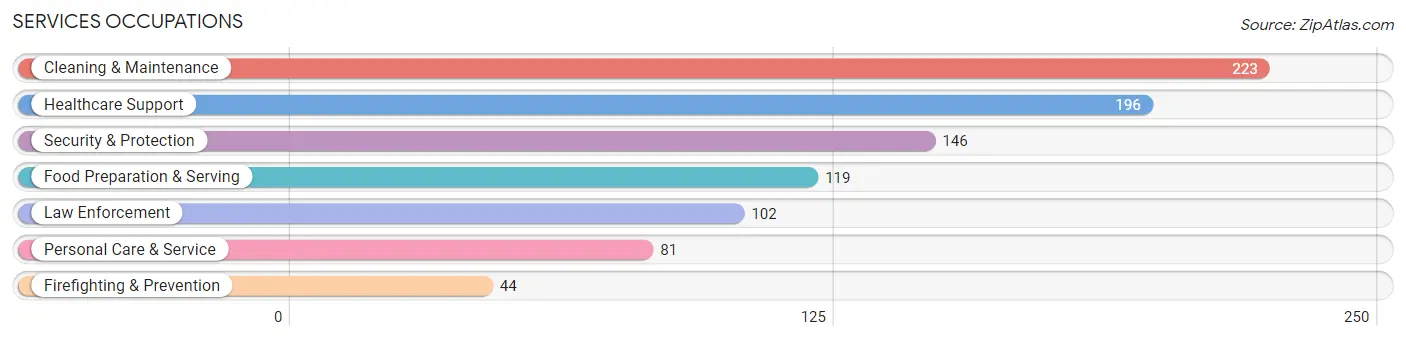
Services Occupations
The most common Services occupations in Greenville are Cleaning & Maintenance (223 | 7.8%), Healthcare Support (196 | 6.9%), Security & Protection (146 | 5.1%), Food Preparation & Serving (119 | 4.2%), and Law Enforcement (102 | 3.6%).
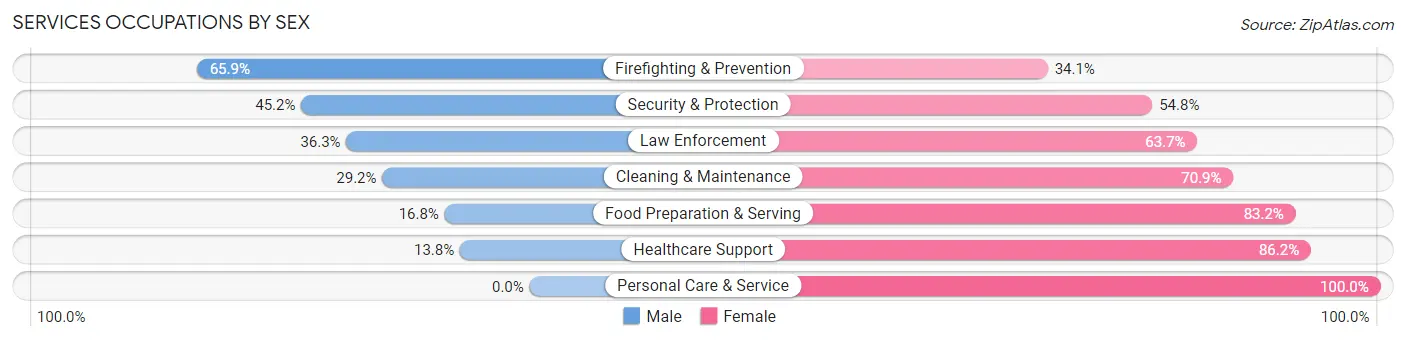
Services Occupations by Sex
Within the Services occupations in Greenville, the most male-oriented occupations are Firefighting & Prevention (65.9%), Security & Protection (45.2%), and Law Enforcement (36.3%), while the most female-oriented occupations are Personal Care & Service (100.0%), Healthcare Support (86.2%), and Food Preparation & Serving (83.2%).
| Occupation | Male | Female |
| Healthcare Support | 27 (13.8%) | 169 (86.2%) |
| Security & Protection | 66 (45.2%) | 80 (54.8%) |
| Firefighting & Prevention | 29 (65.9%) | 15 (34.1%) |
| Law Enforcement | 37 (36.3%) | 65 (63.7%) |
| Food Preparation & Serving | 20 (16.8%) | 99 (83.2%) |
| Cleaning & Maintenance | 65 (29.1%) | 158 (70.9%) |
| Personal Care & Service | 0 (0.0%) | 81 (100.0%) |
| Total (Category) | 178 (23.3%) | 587 (76.7%) |
| Total (Overall) | 1,381 (48.2%) | 1,482 (51.8%) |
Sales and Office Occupations
The most common Sales and Office occupations in Greenville are Sales & Related (277 | 9.7%), and Office & Administration (227 | 7.9%).

Sales and Office Occupations by Sex
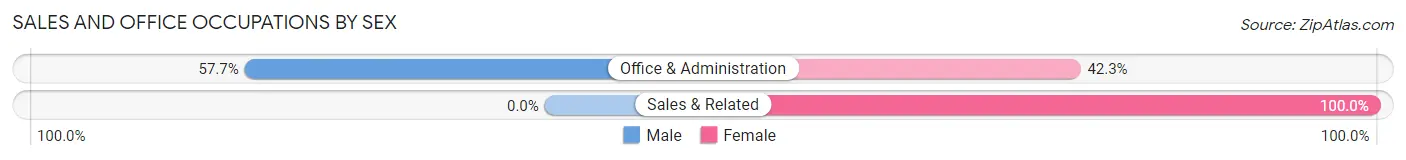
| Occupation | Male | Female |
| Sales & Related | 0 (0.0%) | 277 (100.0%) |
| Office & Administration | 131 (57.7%) | 96 (42.3%) |
| Total (Category) | 131 (26.0%) | 373 (74.0%) |
| Total (Overall) | 1,381 (48.2%) | 1,482 (51.8%) |
Natural Resources, Construction and Maintenance Occupations
The most common Natural Resources, Construction and Maintenance occupations in Greenville are Construction & Extraction (220 | 7.7%), Installation, Maintenance & Repair (110 | 3.8%), and Farming, Fishing & Forestry (32 | 1.1%).

Natural Resources, Construction and Maintenance Occupations by Sex
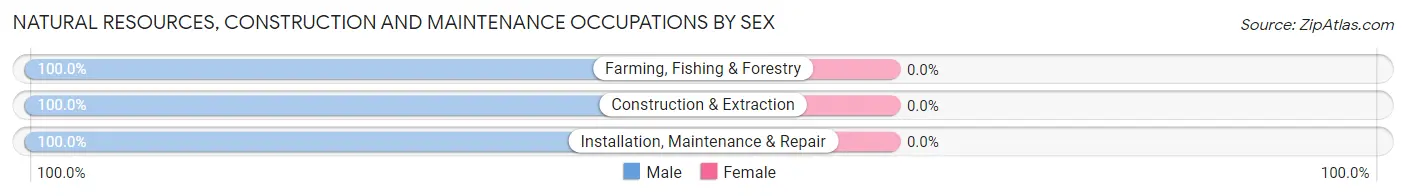
| Occupation | Male | Female |
| Farming, Fishing & Forestry | 32 (100.0%) | 0 (0.0%) |
| Construction & Extraction | 220 (100.0%) | 0 (0.0%) |
| Installation, Maintenance & Repair | 110 (100.0%) | 0 (0.0%) |
| Total (Category) | 362 (100.0%) | 0 (0.0%) |
| Total (Overall) | 1,381 (48.2%) | 1,482 (51.8%) |
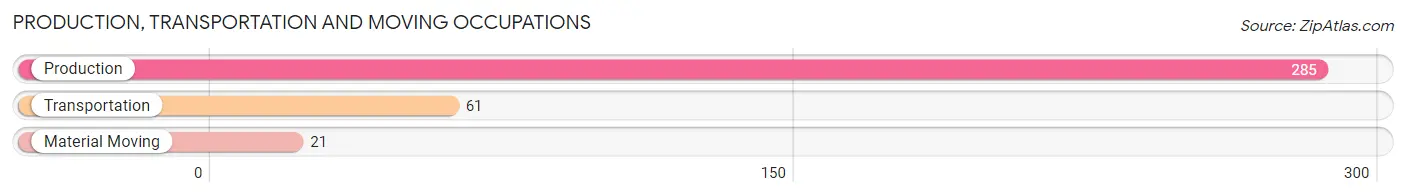
Production, Transportation and Moving Occupations
The most common Production, Transportation and Moving occupations in Greenville are Production (285 | 10.0%), Transportation (61 | 2.1%), and Material Moving (21 | 0.7%).
Production, Transportation and Moving Occupations by Sex
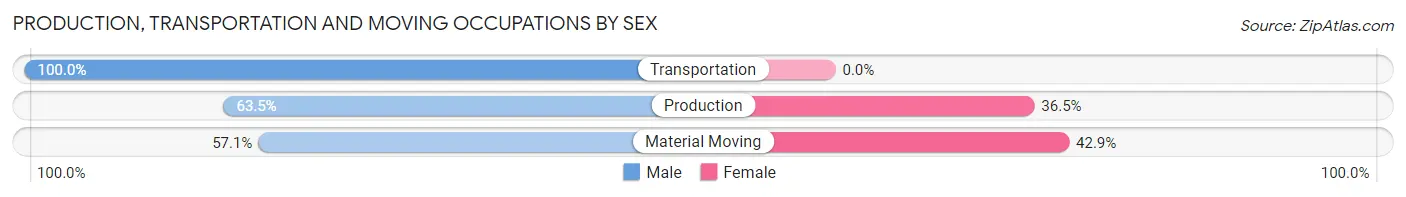
| Occupation | Male | Female |
| Production | 181 (63.5%) | 104 (36.5%) |
| Transportation | 61 (100.0%) | 0 (0.0%) |
| Material Moving | 12 (57.1%) | 9 (42.9%) |
| Total (Category) | 254 (69.2%) | 113 (30.8%) |
| Total (Overall) | 1,381 (48.2%) | 1,482 (51.8%) |
Employment Industries by Sex in Greenville
Employment Industries in Greenville
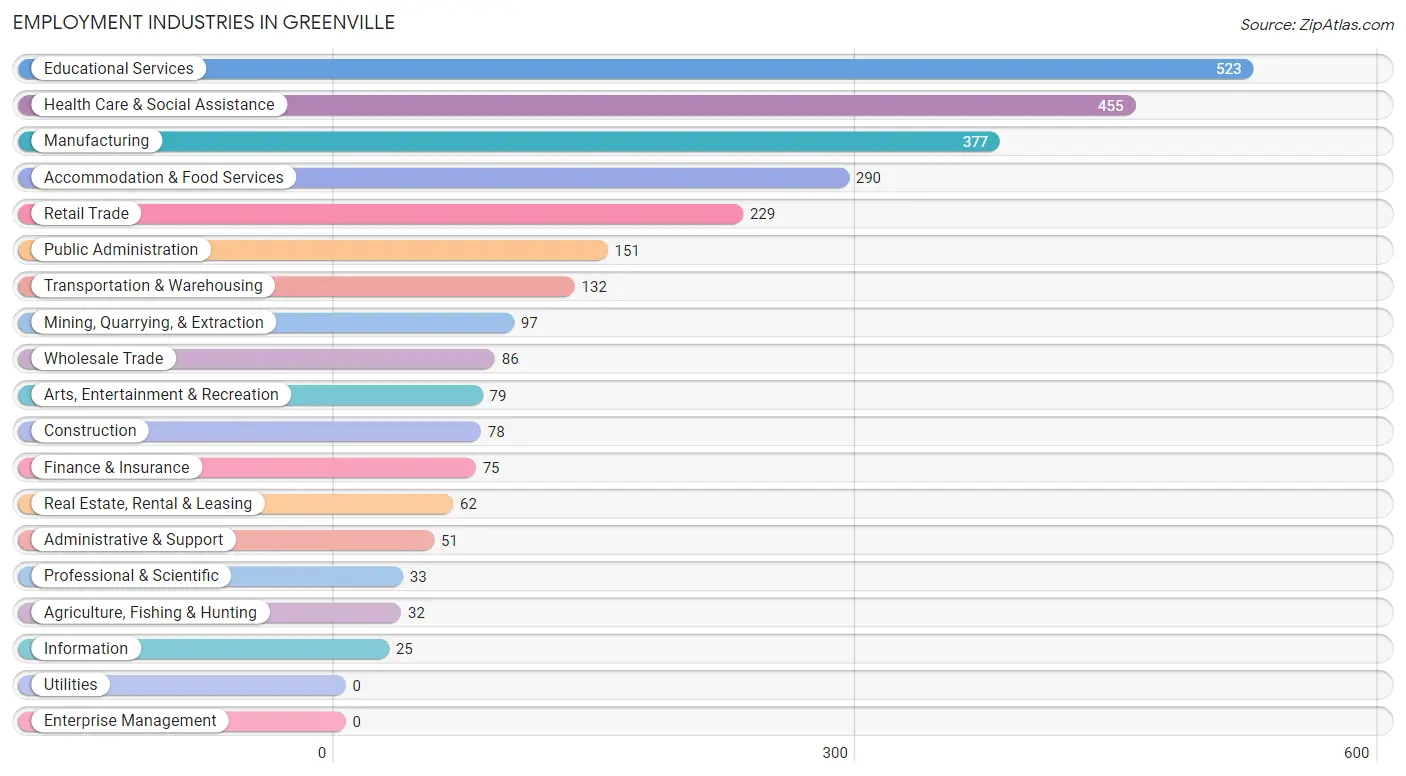
The major employment industries in Greenville include Educational Services (523 | 18.3%), Health Care & Social Assistance (455 | 15.9%), Manufacturing (377 | 13.2%), Accommodation & Food Services (290 | 10.1%), and Retail Trade (229 | 8.0%).
Employment Industries by Sex in Greenville
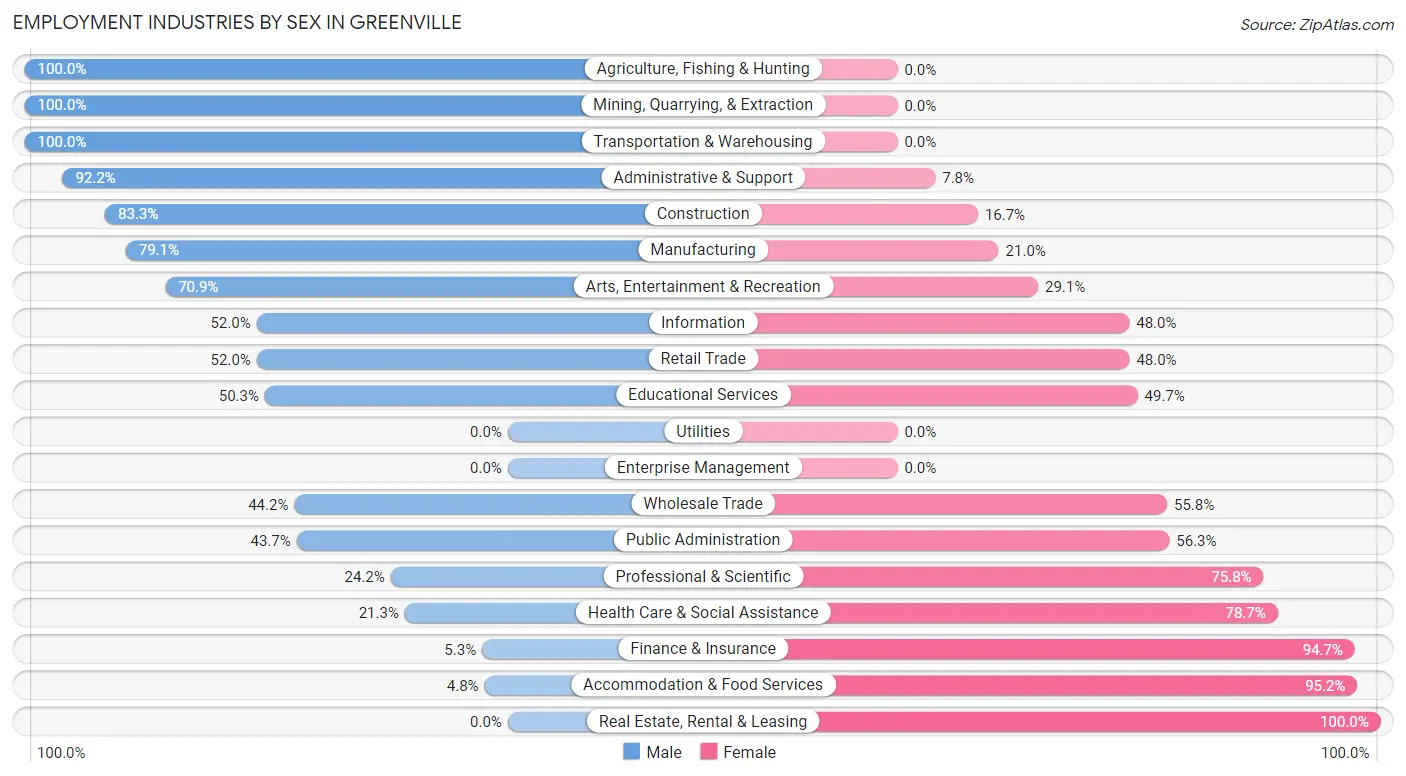
The Greenville industries that see more men than women are Agriculture, Fishing & Hunting (100.0%), Mining, Quarrying, & Extraction (100.0%), and Transportation & Warehousing (100.0%), whereas the industries that tend to have a higher number of women are Real Estate, Rental & Leasing (100.0%), Accommodation & Food Services (95.2%), and Finance & Insurance (94.7%).
| Industry | Male | Female |
| Agriculture, Fishing & Hunting | 32 (100.0%) | 0 (0.0%) |
| Mining, Quarrying, & Extraction | 97 (100.0%) | 0 (0.0%) |
| Construction | 65 (83.3%) | 13 (16.7%) |
| Manufacturing | 298 (79.0%) | 79 (20.9%) |
| Wholesale Trade | 38 (44.2%) | 48 (55.8%) |
| Retail Trade | 119 (52.0%) | 110 (48.0%) |
| Transportation & Warehousing | 132 (100.0%) | 0 (0.0%) |
| Utilities | 0 (0.0%) | 0 (0.0%) |
| Information | 13 (52.0%) | 12 (48.0%) |
| Finance & Insurance | 4 (5.3%) | 71 (94.7%) |
| Real Estate, Rental & Leasing | 0 (0.0%) | 62 (100.0%) |
| Professional & Scientific | 8 (24.2%) | 25 (75.8%) |
| Enterprise Management | 0 (0.0%) | 0 (0.0%) |
| Administrative & Support | 47 (92.2%) | 4 (7.8%) |
| Educational Services | 263 (50.3%) | 260 (49.7%) |
| Health Care & Social Assistance | 97 (21.3%) | 358 (78.7%) |
| Arts, Entertainment & Recreation | 56 (70.9%) | 23 (29.1%) |
| Accommodation & Food Services | 14 (4.8%) | 276 (95.2%) |
| Public Administration | 66 (43.7%) | 85 (56.3%) |
| Total | 1,381 (48.2%) | 1,482 (51.8%) |
Education in Greenville
School Enrollment in Greenville
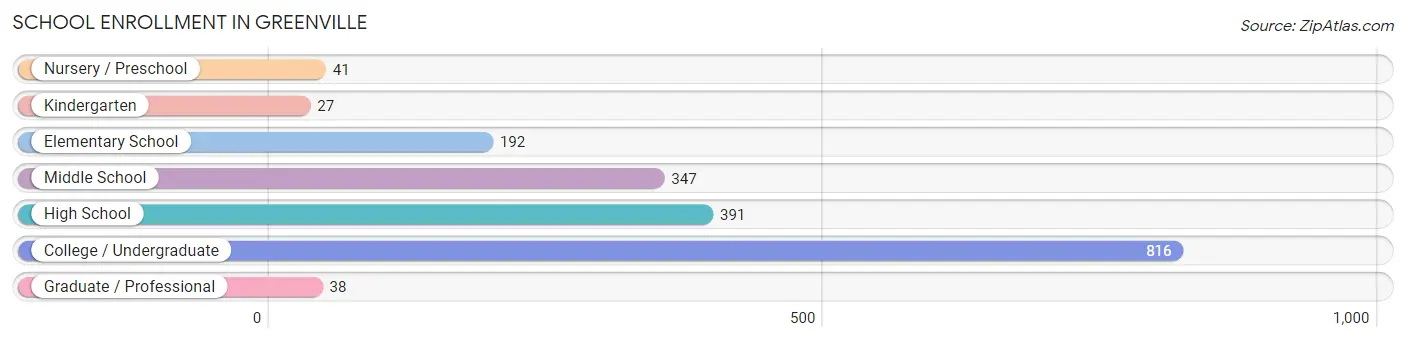
The most common levels of schooling among the 1,852 students in Greenville are college / undergraduate (816 | 44.1%), high school (391 | 21.1%), and middle school (347 | 18.7%).
| School Level | # Students | % Students |
| Nursery / Preschool | 41 | 2.2% |
| Kindergarten | 27 | 1.5% |
| Elementary School | 192 | 10.4% |
| Middle School | 347 | 18.7% |
| High School | 391 | 21.1% |
| College / Undergraduate | 816 | 44.1% |
| Graduate / Professional | 38 | 2.1% |
| Total | 1,852 | 100.0% |
School Enrollment by Age by Funding Source in Greenville
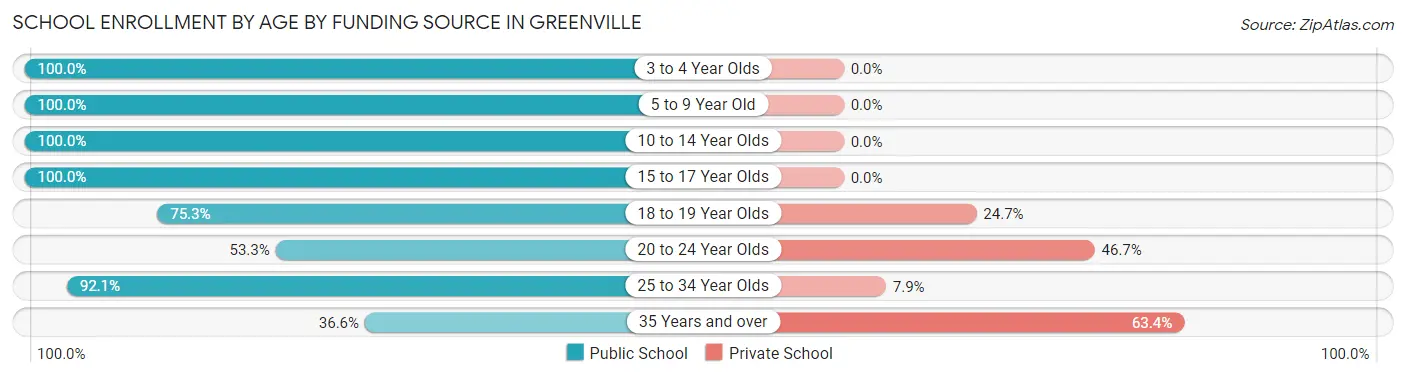
Out of a total of 1,852 students who are enrolled in schools in Greenville, 319 (17.2%) attend a private institution, while the remaining 1,533 (82.8%) are enrolled in public schools. The age group of 35 years and over has the highest likelihood of being enrolled in private schools, with 45 (63.4% in the age bracket) enrolled. Conversely, the age group of 3 to 4 year olds has the lowest likelihood of being enrolled in a private school, with 24 (100.0% in the age bracket) attending a public institution.
| Age Bracket | Public School | Private School |
| 3 to 4 Year Olds | 24 (100.0%) | 0 (0.0%) |
| 5 to 9 Year Old | 221 (100.0%) | 0 (0.0%) |
| 10 to 14 Year Olds | 362 (100.0%) | 0 (0.0%) |
| 15 to 17 Year Olds | 216 (100.0%) | 0 (0.0%) |
| 18 to 19 Year Olds | 408 (75.3%) | 134 (24.7%) |
| 20 to 24 Year Olds | 147 (53.3%) | 129 (46.7%) |
| 25 to 34 Year Olds | 129 (92.1%) | 11 (7.9%) |
| 35 Years and over | 26 (36.6%) | 45 (63.4%) |
| Total | 1,533 (82.8%) | 319 (17.2%) |
Educational Attainment by Field of Study in Greenville
Education (370 | 27.5%), psychology (122 | 9.1%), computers & mathematics (120 | 8.9%), bio, nature & agricultural (118 | 8.8%), and business (114 | 8.5%) are the most common fields of study among 1,344 individuals in Greenville who have obtained a bachelor's degree or higher.
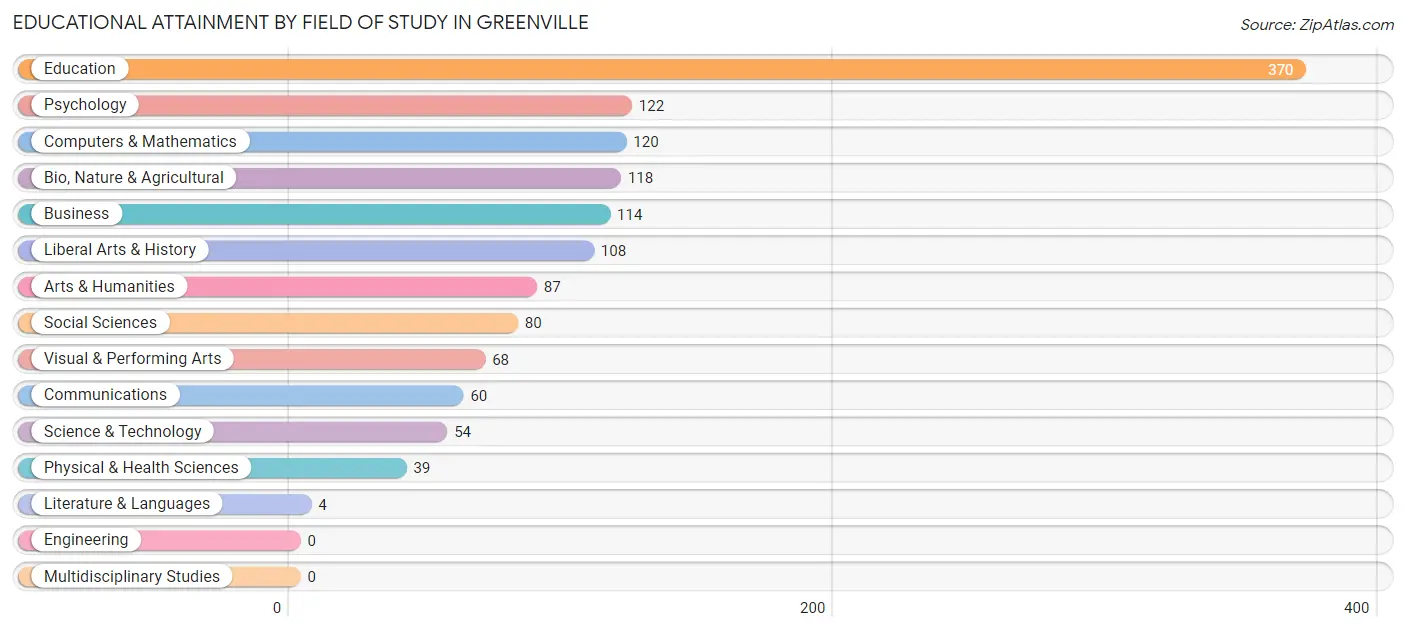
| Field of Study | # Graduates | % Graduates |
| Computers & Mathematics | 120 | 8.9% |
| Bio, Nature & Agricultural | 118 | 8.8% |
| Physical & Health Sciences | 39 | 2.9% |
| Psychology | 122 | 9.1% |
| Social Sciences | 80 | 5.9% |
| Engineering | 0 | 0.0% |
| Multidisciplinary Studies | 0 | 0.0% |
| Science & Technology | 54 | 4.0% |
| Business | 114 | 8.5% |
| Education | 370 | 27.5% |
| Literature & Languages | 4 | 0.3% |
| Liberal Arts & History | 108 | 8.0% |
| Visual & Performing Arts | 68 | 5.1% |
| Communications | 60 | 4.5% |
| Arts & Humanities | 87 | 6.5% |
| Total | 1,344 | 100.0% |
Transportation & Commute in Greenville
Vehicle Availability by Sex in Greenville
The most prevalent vehicle ownership categories in Greenville are males with 2 vehicles (537, accounting for 40.7%) and females with 2 vehicles (516, making up 38.4%).
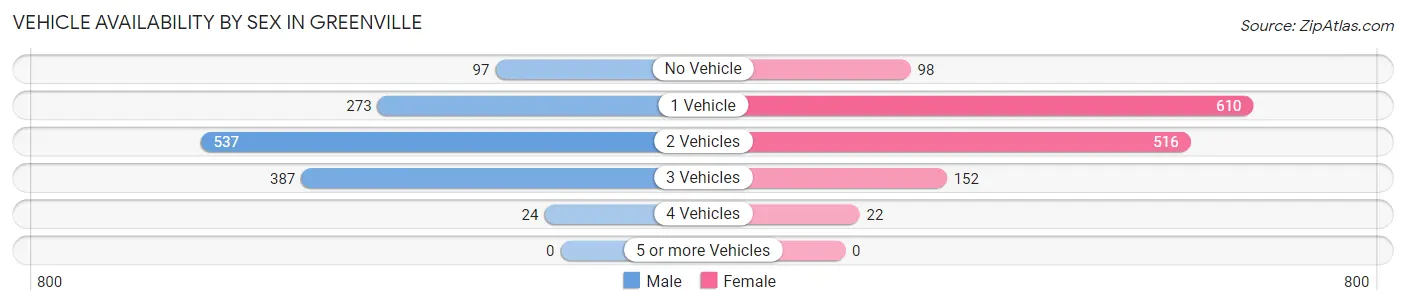
| Vehicles Available | Male | Female |
| No Vehicle | 97 (7.4%) | 98 (7.0%) |
| 1 Vehicle | 273 (20.7%) | 610 (43.6%) |
| 2 Vehicles | 537 (40.7%) | 516 (36.9%) |
| 3 Vehicles | 387 (29.4%) | 152 (10.9%) |
| 4 Vehicles | 24 (1.8%) | 22 (1.6%) |
| 5 or more Vehicles | 0 (0.0%) | 0 (0.0%) |
| Total | 1,318 (100.0%) | 1,398 (100.0%) |
Commute Time in Greenville
The most frequently occuring commute durations in Greenville are 5 to 9 minutes (677 commuters, 25.4%), 10 to 14 minutes (478 commuters, 17.9%), and less than 5 minutes (469 commuters, 17.6%).
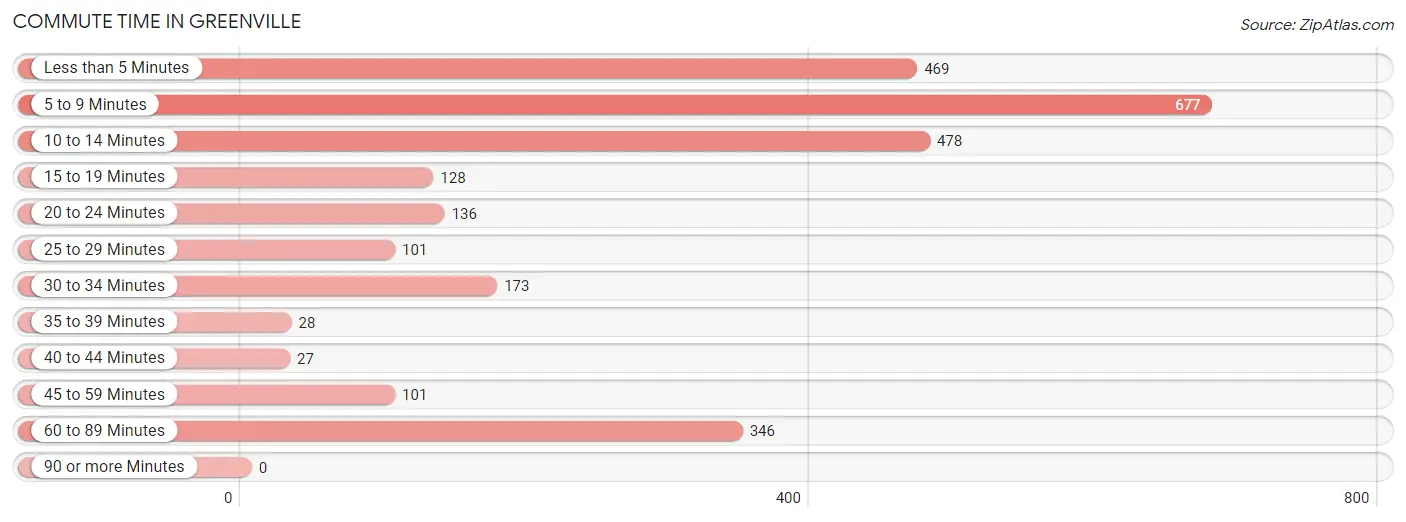
| Commute Time | # Commuters | % Commuters |
| Less than 5 Minutes | 469 | 17.6% |
| 5 to 9 Minutes | 677 | 25.4% |
| 10 to 14 Minutes | 478 | 17.9% |
| 15 to 19 Minutes | 128 | 4.8% |
| 20 to 24 Minutes | 136 | 5.1% |
| 25 to 29 Minutes | 101 | 3.8% |
| 30 to 34 Minutes | 173 | 6.5% |
| 35 to 39 Minutes | 28 | 1.1% |
| 40 to 44 Minutes | 27 | 1.0% |
| 45 to 59 Minutes | 101 | 3.8% |
| 60 to 89 Minutes | 346 | 13.0% |
| 90 or more Minutes | 0 | 0.0% |
Commute Time by Sex in Greenville
The most common commute times in Greenville are 5 to 9 minutes (447 commuters, 34.6%) for males and 10 to 14 minutes (477 commuters, 34.7%) for females.
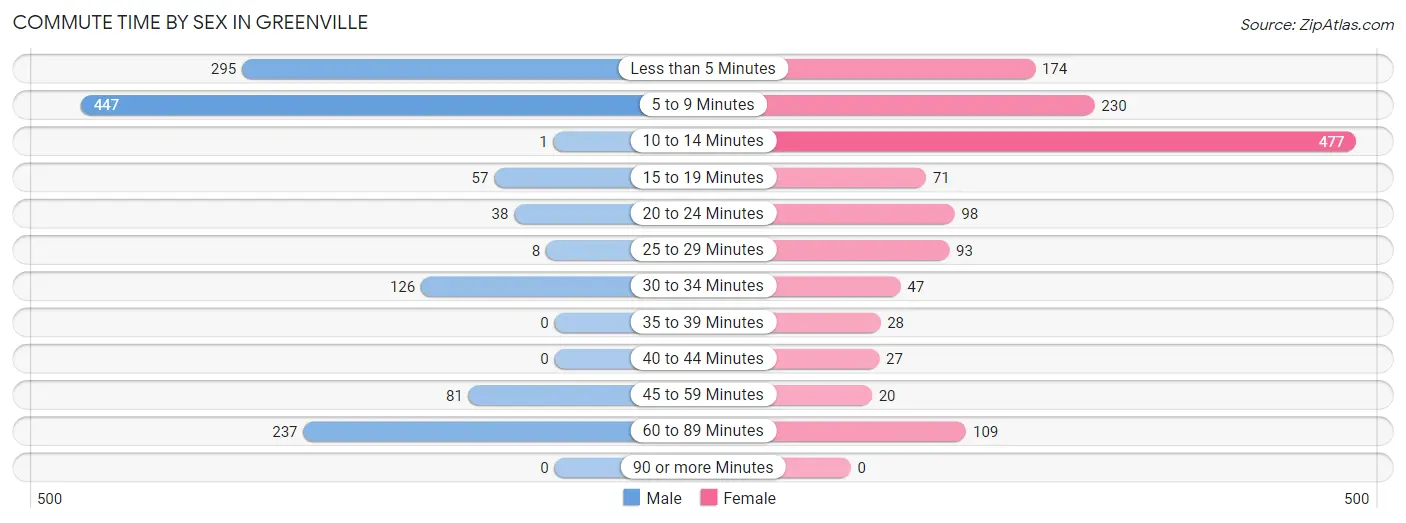
| Commute Time | Male | Female |
| Less than 5 Minutes | 295 (22.9%) | 174 (12.7%) |
| 5 to 9 Minutes | 447 (34.6%) | 230 (16.7%) |
| 10 to 14 Minutes | 1 (0.1%) | 477 (34.7%) |
| 15 to 19 Minutes | 57 (4.4%) | 71 (5.2%) |
| 20 to 24 Minutes | 38 (2.9%) | 98 (7.1%) |
| 25 to 29 Minutes | 8 (0.6%) | 93 (6.8%) |
| 30 to 34 Minutes | 126 (9.8%) | 47 (3.4%) |
| 35 to 39 Minutes | 0 (0.0%) | 28 (2.0%) |
| 40 to 44 Minutes | 0 (0.0%) | 27 (2.0%) |
| 45 to 59 Minutes | 81 (6.3%) | 20 (1.5%) |
| 60 to 89 Minutes | 237 (18.4%) | 109 (7.9%) |
| 90 or more Minutes | 0 (0.0%) | 0 (0.0%) |
Time of Departure to Work by Sex in Greenville
The most frequent times of departure to work in Greenville are 12:00 PM to 3:59 PM (324, 25.1%) for males and 6:30 AM to 6:59 AM (236, 17.2%) for females.
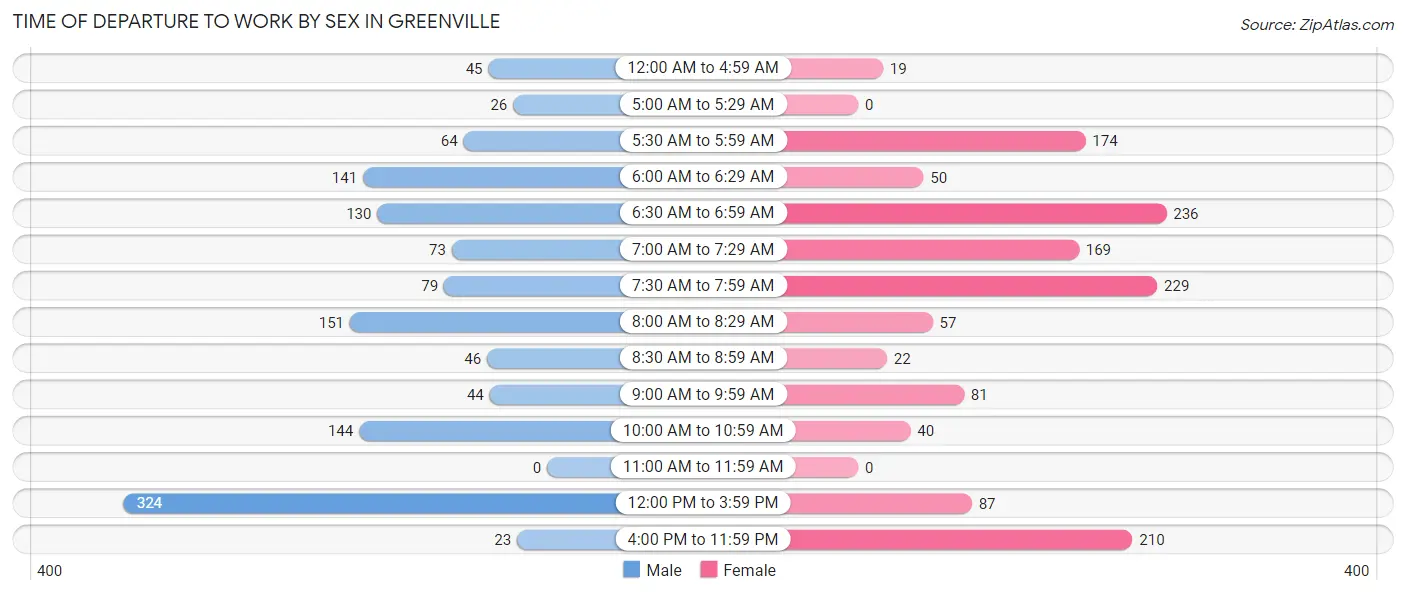
| Time of Departure | Male | Female |
| 12:00 AM to 4:59 AM | 45 (3.5%) | 19 (1.4%) |
| 5:00 AM to 5:29 AM | 26 (2.0%) | 0 (0.0%) |
| 5:30 AM to 5:59 AM | 64 (5.0%) | 174 (12.7%) |
| 6:00 AM to 6:29 AM | 141 (10.9%) | 50 (3.6%) |
| 6:30 AM to 6:59 AM | 130 (10.1%) | 236 (17.2%) |
| 7:00 AM to 7:29 AM | 73 (5.7%) | 169 (12.3%) |
| 7:30 AM to 7:59 AM | 79 (6.1%) | 229 (16.7%) |
| 8:00 AM to 8:29 AM | 151 (11.7%) | 57 (4.2%) |
| 8:30 AM to 8:59 AM | 46 (3.6%) | 22 (1.6%) |
| 9:00 AM to 9:59 AM | 44 (3.4%) | 81 (5.9%) |
| 10:00 AM to 10:59 AM | 144 (11.2%) | 40 (2.9%) |
| 11:00 AM to 11:59 AM | 0 (0.0%) | 0 (0.0%) |
| 12:00 PM to 3:59 PM | 324 (25.1%) | 87 (6.3%) |
| 4:00 PM to 11:59 PM | 23 (1.8%) | 210 (15.3%) |
| Total | 1,290 (100.0%) | 1,374 (100.0%) |
Housing Occupancy in Greenville
Occupancy by Ownership in Greenville
Of the total 2,479 dwellings in Greenville, owner-occupied units account for 1,301 (52.5%), while renter-occupied units make up 1,178 (47.5%).
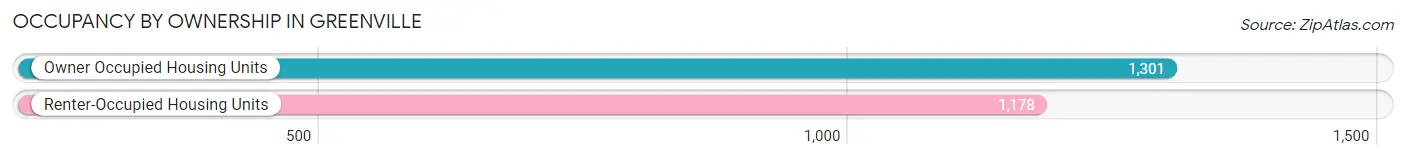
| Occupancy | # Housing Units | % Housing Units |
| Owner Occupied Housing Units | 1,301 | 52.5% |
| Renter-Occupied Housing Units | 1,178 | 47.5% |
| Total Occupied Housing Units | 2,479 | 100.0% |
Occupancy by Household Size in Greenville
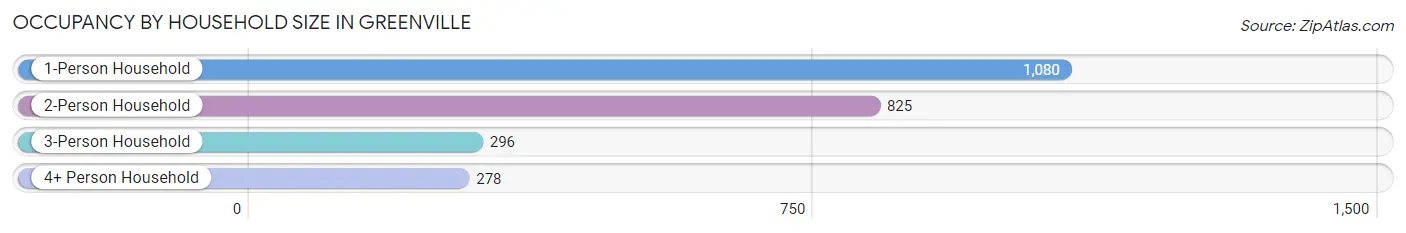
| Household Size | # Housing Units | % Housing Units |
| 1-Person Household | 1,080 | 43.6% |
| 2-Person Household | 825 | 33.3% |
| 3-Person Household | 296 | 11.9% |
| 4+ Person Household | 278 | 11.2% |
| Total Housing Units | 2,479 | 100.0% |
Occupancy by Ownership by Household Size in Greenville
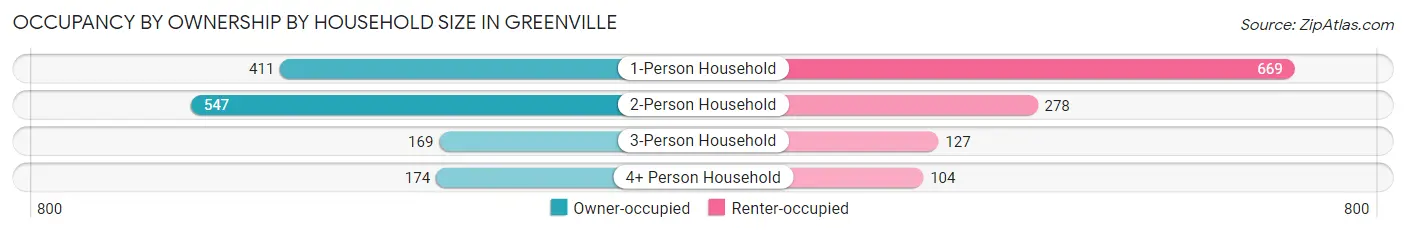
| Household Size | Owner-occupied | Renter-occupied |
| 1-Person Household | 411 (38.1%) | 669 (61.9%) |
| 2-Person Household | 547 (66.3%) | 278 (33.7%) |
| 3-Person Household | 169 (57.1%) | 127 (42.9%) |
| 4+ Person Household | 174 (62.6%) | 104 (37.4%) |
| Total Housing Units | 1,301 (52.5%) | 1,178 (47.5%) |
Occupancy by Educational Attainment in Greenville
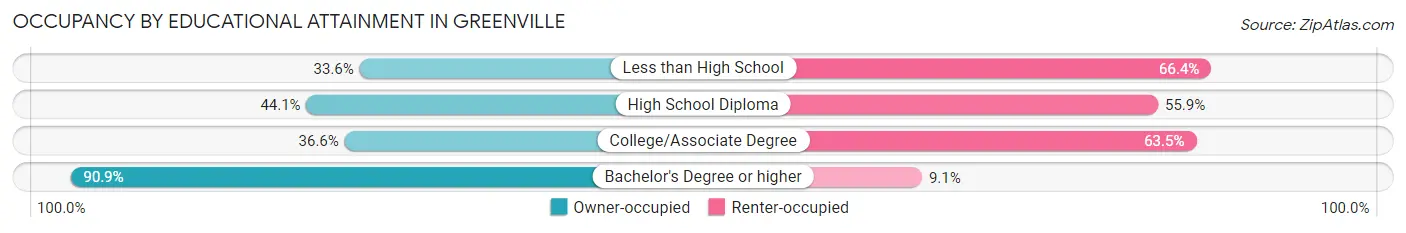
| Household Size | Owner-occupied | Renter-occupied |
| Less than High School | 44 (33.6%) | 87 (66.4%) |
| High School Diploma | 195 (44.1%) | 247 (55.9%) |
| College/Associate Degree | 451 (36.5%) | 783 (63.4%) |
| Bachelor's Degree or higher | 611 (90.9%) | 61 (9.1%) |
Occupancy by Age of Householder in Greenville
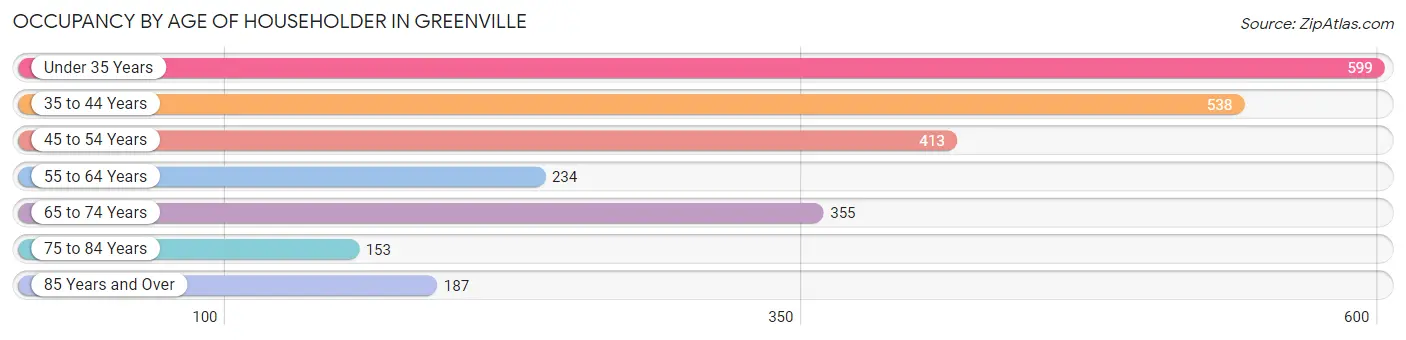
| Age Bracket | # Households | % Households |
| Under 35 Years | 599 | 24.2% |
| 35 to 44 Years | 538 | 21.7% |
| 45 to 54 Years | 413 | 16.7% |
| 55 to 64 Years | 234 | 9.4% |
| 65 to 74 Years | 355 | 14.3% |
| 75 to 84 Years | 153 | 6.2% |
| 85 Years and Over | 187 | 7.5% |
| Total | 2,479 | 100.0% |
Housing Finances in Greenville
Median Income by Occupancy in Greenville
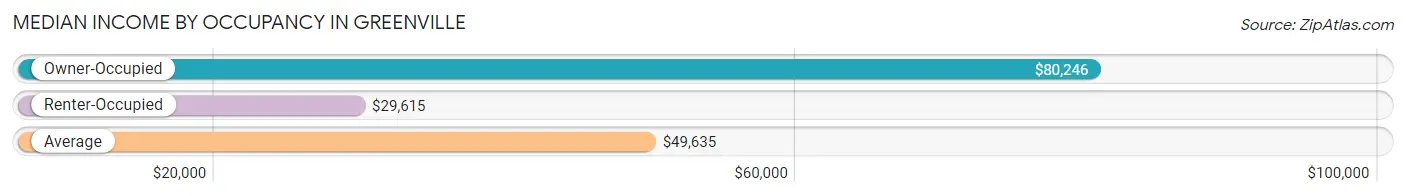
| Occupancy Type | # Households | Median Income |
| Owner-Occupied | 1,301 (52.5%) | $80,246 |
| Renter-Occupied | 1,178 (47.5%) | $29,615 |
| Average | 2,479 (100.0%) | $49,635 |
Occupancy by Householder Income Bracket in Greenville
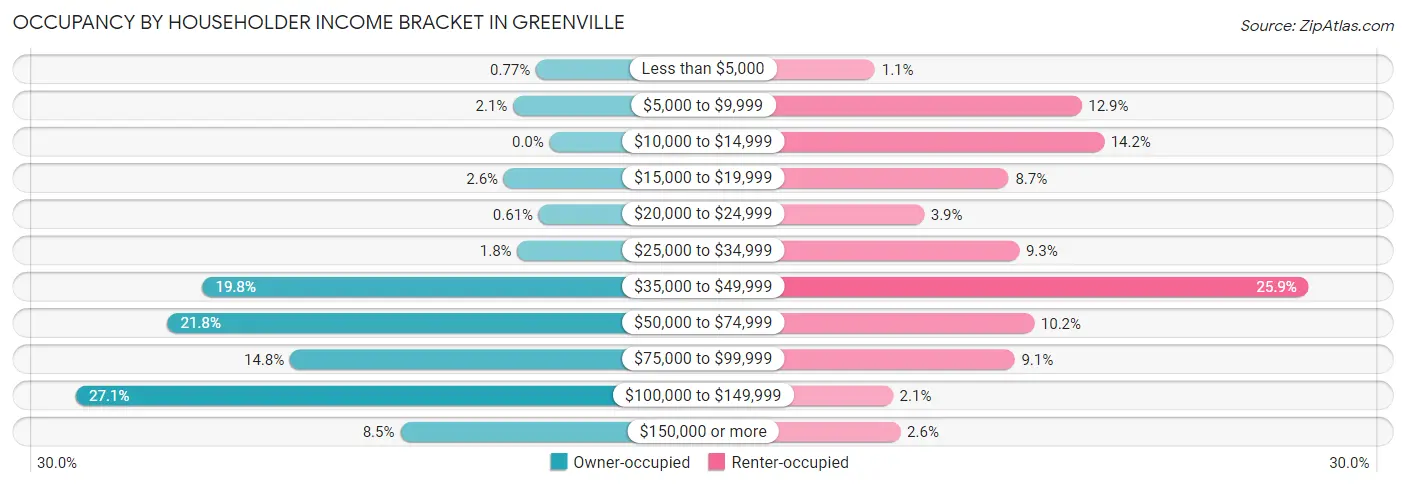
| Income Bracket | Owner-occupied | Renter-occupied |
| Less than $5,000 | 10 (0.8%) | 13 (1.1%) |
| $5,000 to $9,999 | 27 (2.1%) | 152 (12.9%) |
| $10,000 to $14,999 | 0 (0.0%) | 167 (14.2%) |
| $15,000 to $19,999 | 34 (2.6%) | 103 (8.7%) |
| $20,000 to $24,999 | 8 (0.6%) | 46 (3.9%) |
| $25,000 to $34,999 | 24 (1.8%) | 110 (9.3%) |
| $35,000 to $49,999 | 258 (19.8%) | 305 (25.9%) |
| $50,000 to $74,999 | 284 (21.8%) | 120 (10.2%) |
| $75,000 to $99,999 | 193 (14.8%) | 107 (9.1%) |
| $100,000 to $149,999 | 352 (27.1%) | 25 (2.1%) |
| $150,000 or more | 111 (8.5%) | 30 (2.5%) |
| Total | 1,301 (100.0%) | 1,178 (100.0%) |
Monthly Housing Cost Tiers in Greenville
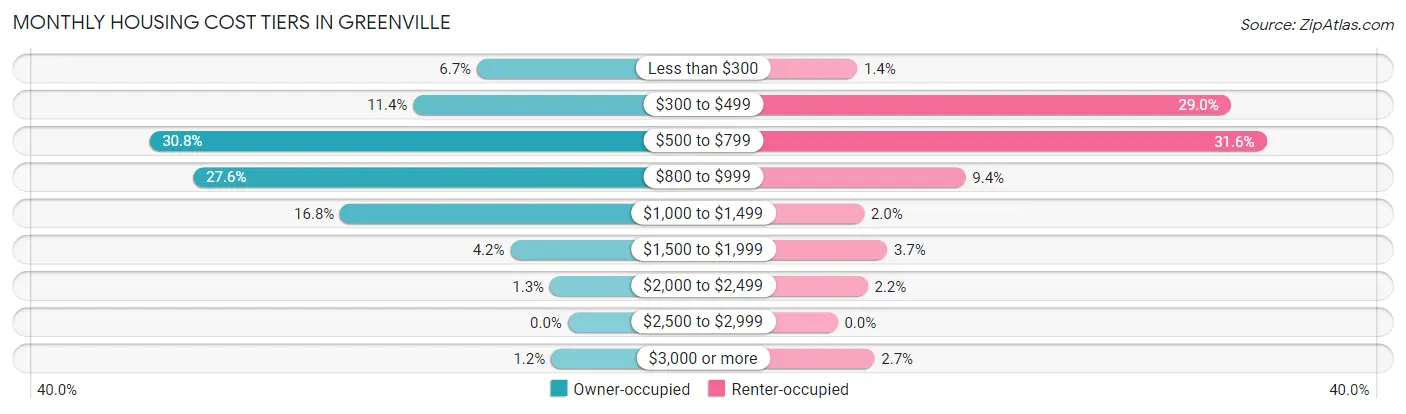
| Monthly Cost | Owner-occupied | Renter-occupied |
| Less than $300 | 87 (6.7%) | 17 (1.4%) |
| $300 to $499 | 148 (11.4%) | 341 (28.9%) |
| $500 to $799 | 401 (30.8%) | 372 (31.6%) |
| $800 to $999 | 359 (27.6%) | 111 (9.4%) |
| $1,000 to $1,499 | 218 (16.8%) | 23 (1.9%) |
| $1,500 to $1,999 | 55 (4.2%) | 43 (3.6%) |
| $2,000 to $2,499 | 17 (1.3%) | 26 (2.2%) |
| $2,500 to $2,999 | 0 (0.0%) | 0 (0.0%) |
| $3,000 or more | 16 (1.2%) | 32 (2.7%) |
| Total | 1,301 (100.0%) | 1,178 (100.0%) |
Physical Housing Characteristics in Greenville
Housing Structures in Greenville
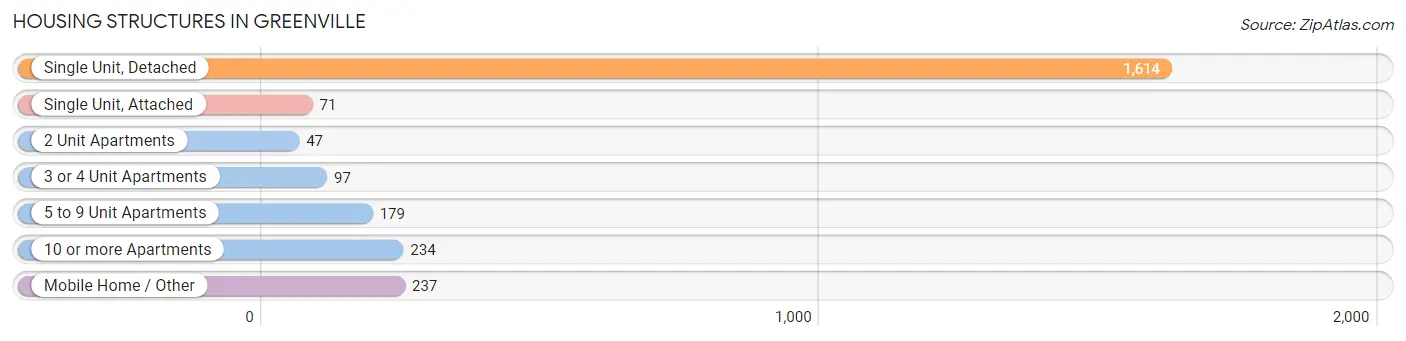
| Structure Type | # Housing Units | % Housing Units |
| Single Unit, Detached | 1,614 | 65.1% |
| Single Unit, Attached | 71 | 2.9% |
| 2 Unit Apartments | 47 | 1.9% |
| 3 or 4 Unit Apartments | 97 | 3.9% |
| 5 to 9 Unit Apartments | 179 | 7.2% |
| 10 or more Apartments | 234 | 9.4% |
| Mobile Home / Other | 237 | 9.6% |
| Total | 2,479 | 100.0% |
Housing Structures by Occupancy in Greenville
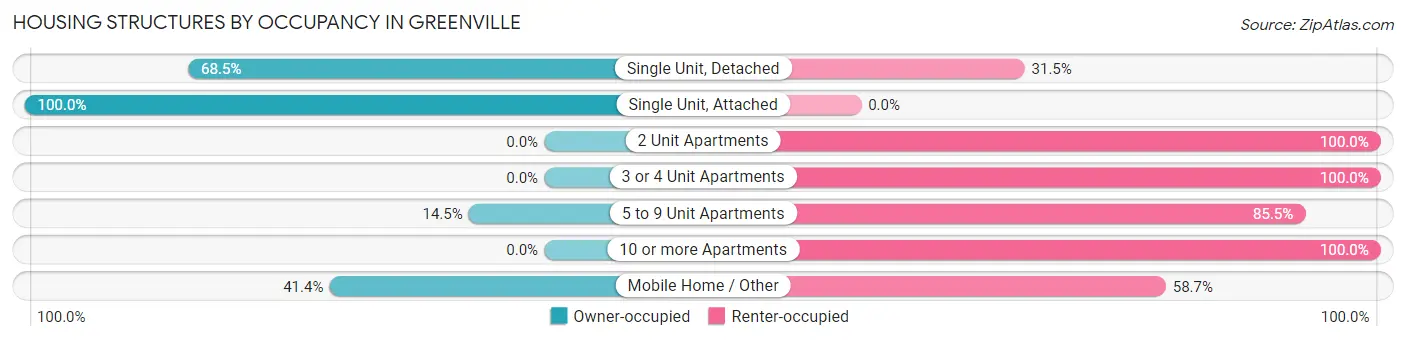
| Structure Type | Owner-occupied | Renter-occupied |
| Single Unit, Detached | 1,106 (68.5%) | 508 (31.5%) |
| Single Unit, Attached | 71 (100.0%) | 0 (0.0%) |
| 2 Unit Apartments | 0 (0.0%) | 47 (100.0%) |
| 3 or 4 Unit Apartments | 0 (0.0%) | 97 (100.0%) |
| 5 to 9 Unit Apartments | 26 (14.5%) | 153 (85.5%) |
| 10 or more Apartments | 0 (0.0%) | 234 (100.0%) |
| Mobile Home / Other | 98 (41.3%) | 139 (58.7%) |
| Total | 1,301 (52.5%) | 1,178 (47.5%) |
Housing Structures by Number of Rooms in Greenville
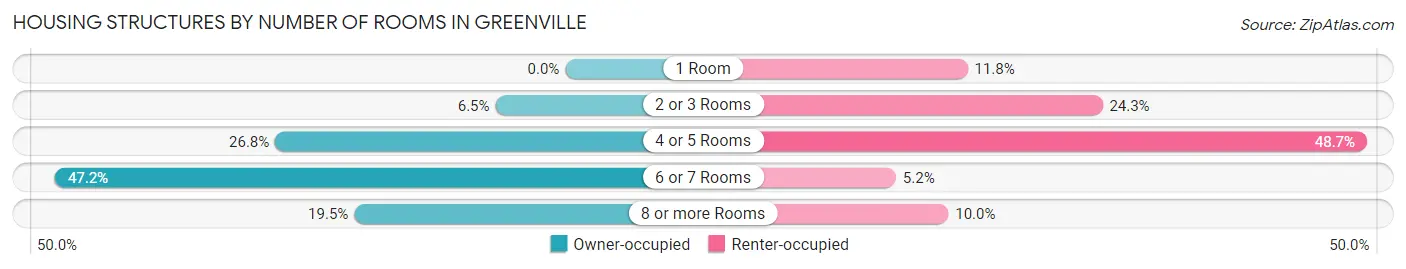
| Number of Rooms | Owner-occupied | Renter-occupied |
| 1 Room | 0 (0.0%) | 139 (11.8%) |
| 2 or 3 Rooms | 84 (6.5%) | 286 (24.3%) |
| 4 or 5 Rooms | 349 (26.8%) | 574 (48.7%) |
| 6 or 7 Rooms | 614 (47.2%) | 61 (5.2%) |
| 8 or more Rooms | 254 (19.5%) | 118 (10.0%) |
| Total | 1,301 (100.0%) | 1,178 (100.0%) |
Housing Structure by Heating Type in Greenville
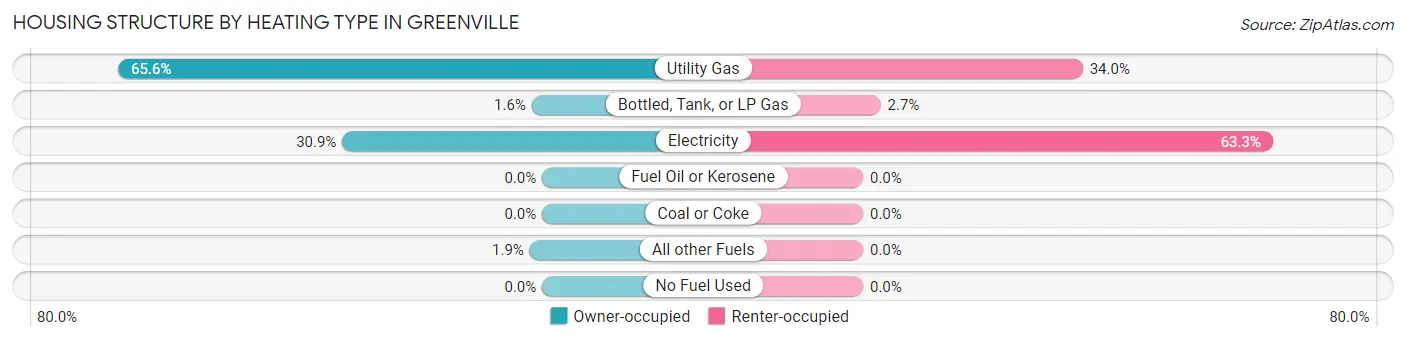
| Heating Type | Owner-occupied | Renter-occupied |
| Utility Gas | 853 (65.6%) | 400 (34.0%) |
| Bottled, Tank, or LP Gas | 21 (1.6%) | 32 (2.7%) |
| Electricity | 402 (30.9%) | 746 (63.3%) |
| Fuel Oil or Kerosene | 0 (0.0%) | 0 (0.0%) |
| Coal or Coke | 0 (0.0%) | 0 (0.0%) |
| All other Fuels | 25 (1.9%) | 0 (0.0%) |
| No Fuel Used | 0 (0.0%) | 0 (0.0%) |
| Total | 1,301 (100.0%) | 1,178 (100.0%) |
Household Vehicle Usage in Greenville
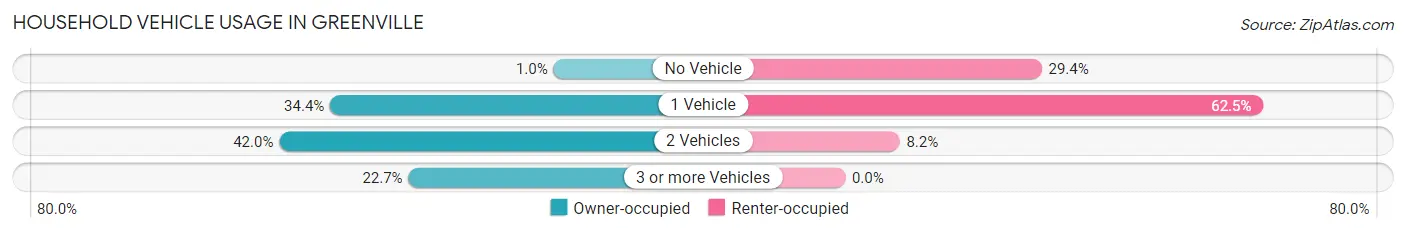
| Vehicles per Household | Owner-occupied | Renter-occupied |
| No Vehicle | 13 (1.0%) | 346 (29.4%) |
| 1 Vehicle | 447 (34.4%) | 736 (62.5%) |
| 2 Vehicles | 546 (42.0%) | 96 (8.2%) |
| 3 or more Vehicles | 295 (22.7%) | 0 (0.0%) |
| Total | 1,301 (100.0%) | 1,178 (100.0%) |
Real Estate & Mortgages in Greenville
Real Estate and Mortgage Overview in Greenville
| Characteristic | Without Mortgage | With Mortgage |
| Housing Units | 641 | 660 |
| Median Property Value | $111,800 | $123,300 |
| Median Household Income | $54,608 | $64 |
| Monthly Housing Costs | $578 | $16 |
| Real Estate Taxes | $2,959 | $52 |
Property Value by Mortgage Status in Greenville
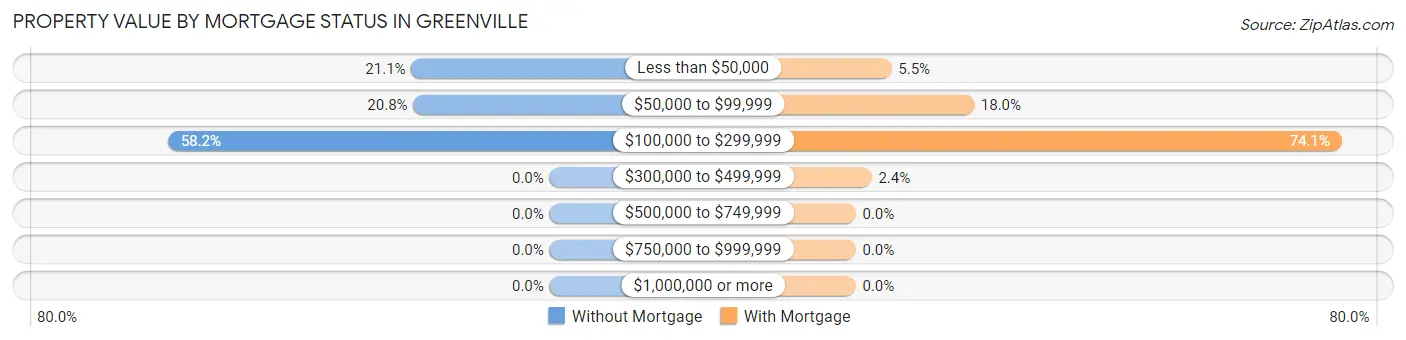
| Property Value | Without Mortgage | With Mortgage |
| Less than $50,000 | 135 (21.1%) | 36 (5.4%) |
| $50,000 to $99,999 | 133 (20.7%) | 119 (18.0%) |
| $100,000 to $299,999 | 373 (58.2%) | 489 (74.1%) |
| $300,000 to $499,999 | 0 (0.0%) | 16 (2.4%) |
| $500,000 to $749,999 | 0 (0.0%) | 0 (0.0%) |
| $750,000 to $999,999 | 0 (0.0%) | 0 (0.0%) |
| $1,000,000 or more | 0 (0.0%) | 0 (0.0%) |
| Total | 641 (100.0%) | 660 (100.0%) |
Household Income by Mortgage Status in Greenville
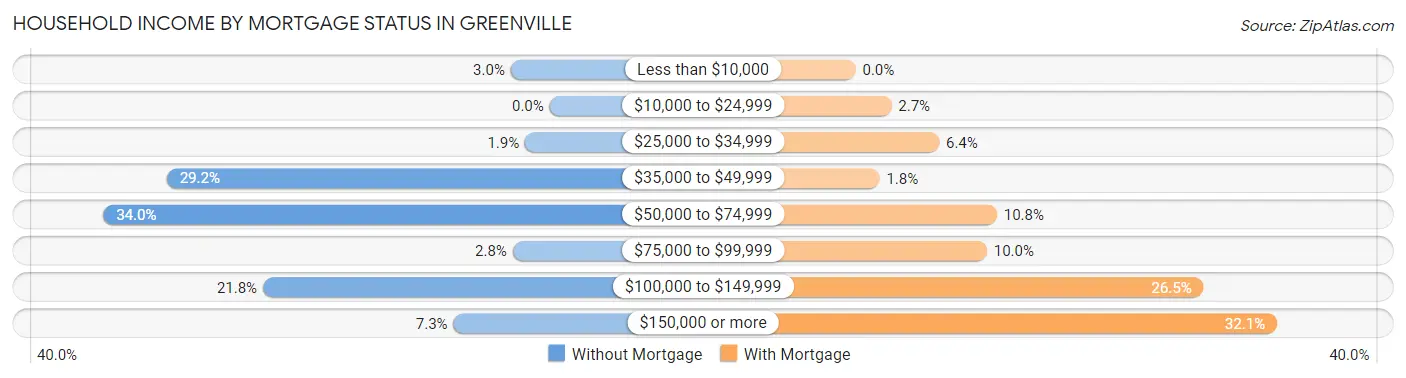
| Household Income | Without Mortgage | With Mortgage |
| Less than $10,000 | 19 (3.0%) | 0 (0.0%) |
| $10,000 to $24,999 | 0 (0.0%) | 18 (2.7%) |
| $25,000 to $34,999 | 12 (1.9%) | 42 (6.4%) |
| $35,000 to $49,999 | 187 (29.2%) | 12 (1.8%) |
| $50,000 to $74,999 | 218 (34.0%) | 71 (10.8%) |
| $75,000 to $99,999 | 18 (2.8%) | 66 (10.0%) |
| $100,000 to $149,999 | 140 (21.8%) | 175 (26.5%) |
| $150,000 or more | 47 (7.3%) | 212 (32.1%) |
| Total | 641 (100.0%) | 660 (100.0%) |
Property Value to Household Income Ratio in Greenville
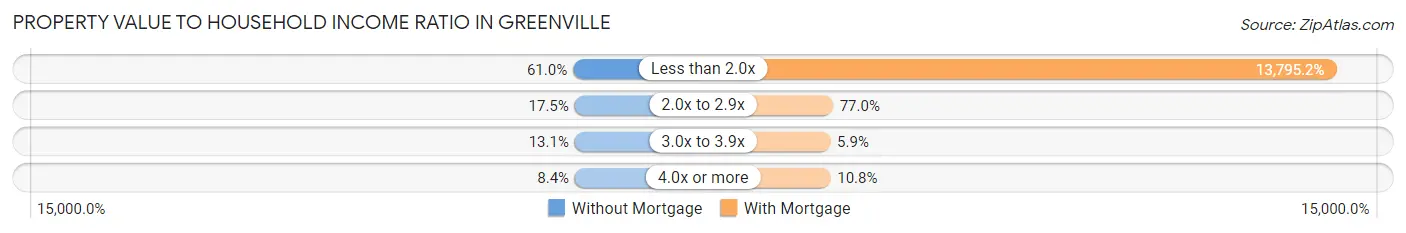
| Value-to-Income Ratio | Without Mortgage | With Mortgage |
| Less than 2.0x | 391 (61.0%) | 91,048 (13,795.2%) |
| 2.0x to 2.9x | 112 (17.5%) | 508 (77.0%) |
| 3.0x to 3.9x | 84 (13.1%) | 39 (5.9%) |
| 4.0x or more | 54 (8.4%) | 71 (10.8%) |
| Total | 641 (100.0%) | 660 (100.0%) |
Real Estate Taxes by Mortgage Status in Greenville
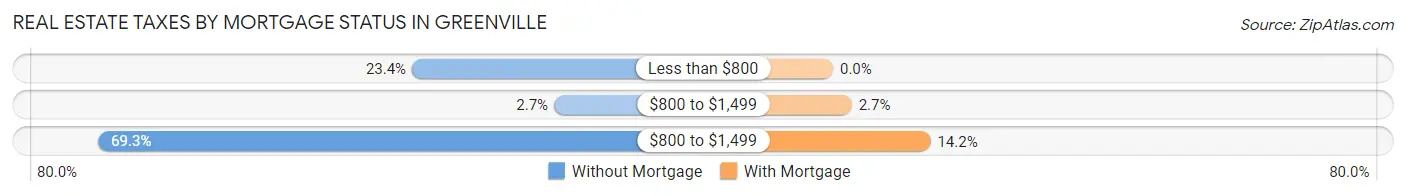
| Property Taxes | Without Mortgage | With Mortgage |
| Less than $800 | 150 (23.4%) | 0 (0.0%) |
| $800 to $1,499 | 17 (2.6%) | 18 (2.7%) |
| $800 to $1,499 | 444 (69.3%) | 94 (14.2%) |
| Total | 641 (100.0%) | 660 (100.0%) |
Health & Disability in Greenville
Health Insurance Coverage by Age in Greenville
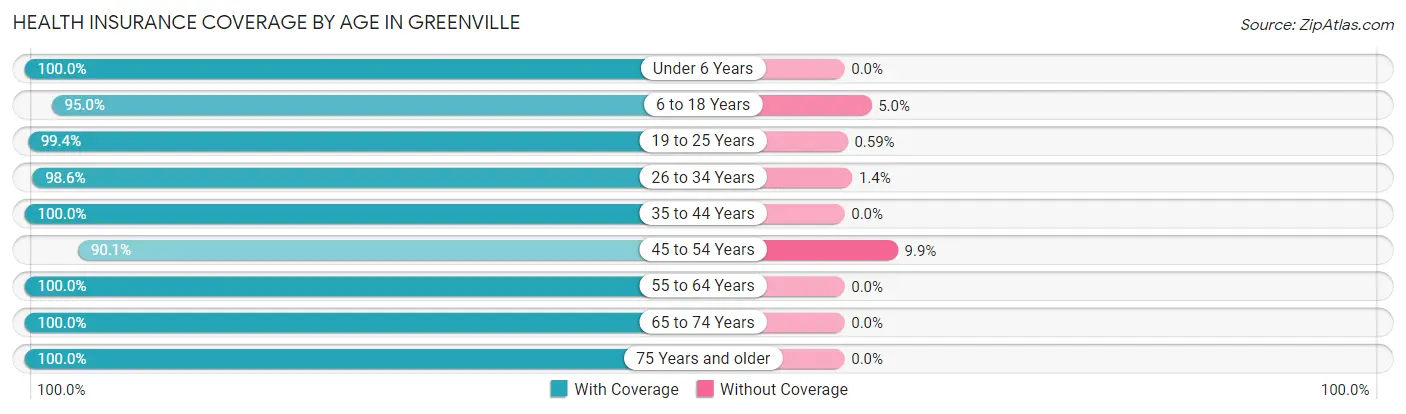
| Age Bracket | With Coverage | Without Coverage |
| Under 6 Years | 154 (100.0%) | 0 (0.0%) |
| 6 to 18 Years | 984 (95.0%) | 52 (5.0%) |
| 19 to 25 Years | 1,018 (99.4%) | 6 (0.6%) |
| 26 to 34 Years | 688 (98.6%) | 10 (1.4%) |
| 35 to 44 Years | 720 (100.0%) | 0 (0.0%) |
| 45 to 54 Years | 489 (90.1%) | 54 (9.9%) |
| 55 to 64 Years | 548 (100.0%) | 0 (0.0%) |
| 65 to 74 Years | 443 (100.0%) | 0 (0.0%) |
| 75 Years and older | 539 (100.0%) | 0 (0.0%) |
| Total | 5,583 (97.9%) | 122 (2.1%) |
Health Insurance Coverage by Citizenship Status in Greenville
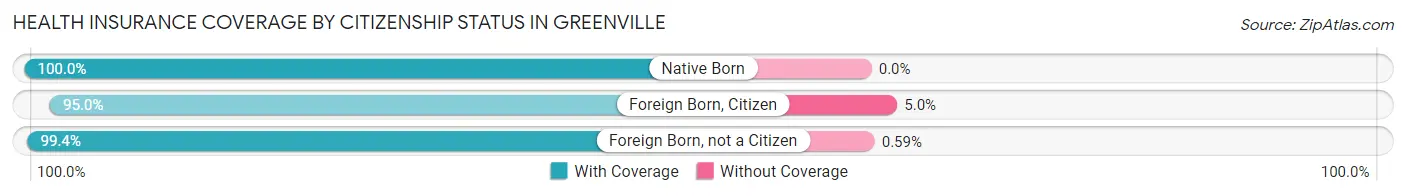
| Citizenship Status | With Coverage | Without Coverage |
| Native Born | 154 (100.0%) | 0 (0.0%) |
| Foreign Born, Citizen | 984 (95.0%) | 52 (5.0%) |
| Foreign Born, not a Citizen | 1,018 (99.4%) | 6 (0.6%) |
Health Insurance Coverage by Household Income in Greenville
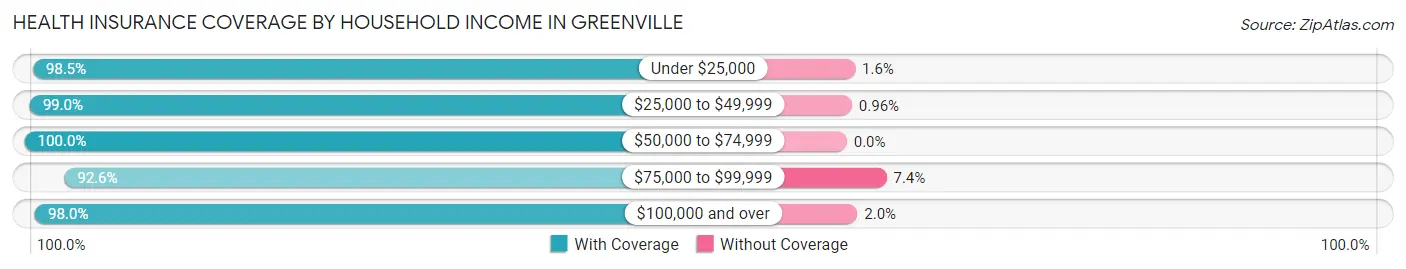
| Household Income | With Coverage | Without Coverage |
| Under $25,000 | 1,141 (98.5%) | 18 (1.5%) |
| $25,000 to $49,999 | 1,129 (99.0%) | 11 (1.0%) |
| $50,000 to $74,999 | 634 (100.0%) | 0 (0.0%) |
| $75,000 to $99,999 | 622 (92.6%) | 50 (7.4%) |
| $100,000 and over | 1,443 (98.0%) | 29 (2.0%) |
Public vs Private Health Insurance Coverage by Age in Greenville
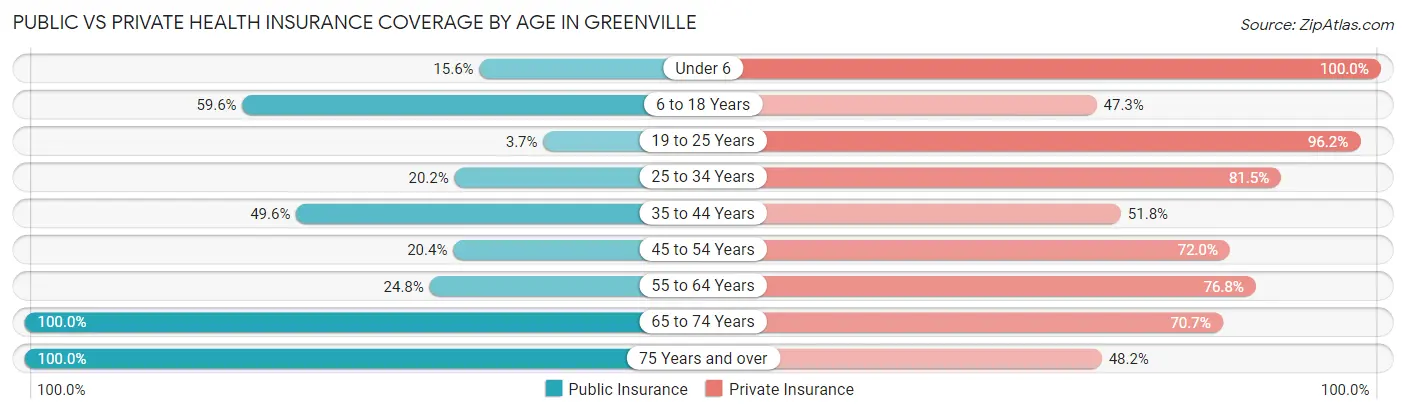
| Age Bracket | Public Insurance | Private Insurance |
| Under 6 | 24 (15.6%) | 154 (100.0%) |
| 6 to 18 Years | 617 (59.6%) | 490 (47.3%) |
| 19 to 25 Years | 38 (3.7%) | 985 (96.2%) |
| 25 to 34 Years | 141 (20.2%) | 569 (81.5%) |
| 35 to 44 Years | 357 (49.6%) | 373 (51.8%) |
| 45 to 54 Years | 111 (20.4%) | 391 (72.0%) |
| 55 to 64 Years | 136 (24.8%) | 421 (76.8%) |
| 65 to 74 Years | 443 (100.0%) | 313 (70.7%) |
| 75 Years and over | 539 (100.0%) | 260 (48.2%) |
| Total | 2,406 (42.2%) | 3,956 (69.3%) |
Disability Status by Sex by Age in Greenville
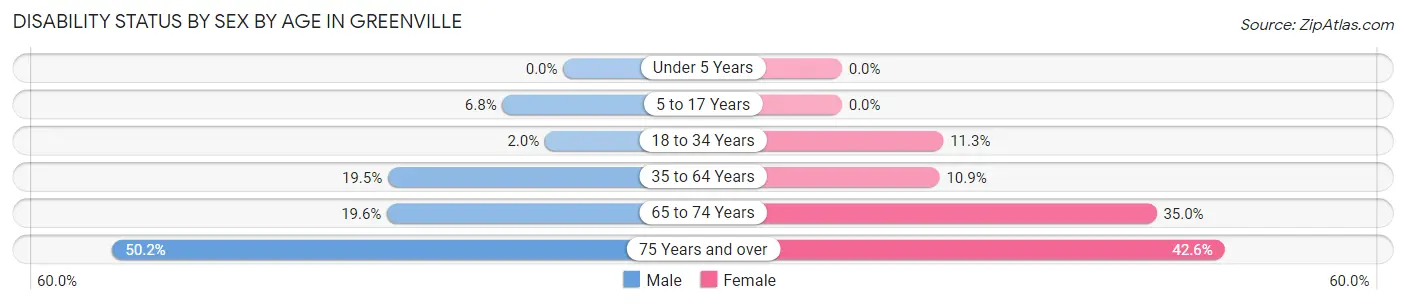
| Age Bracket | Male | Female |
| Under 5 Years | 0 (0.0%) | 0 (0.0%) |
| 5 to 17 Years | 39 (6.8%) | 0 (0.0%) |
| 18 to 34 Years | 23 (2.0%) | 94 (11.3%) |
| 35 to 64 Years | 158 (19.5%) | 109 (10.9%) |
| 65 to 74 Years | 41 (19.6%) | 82 (35.0%) |
| 75 Years and over | 114 (50.2%) | 133 (42.6%) |
Disability Class by Sex by Age in Greenville
Disability Class: Hearing Difficulty
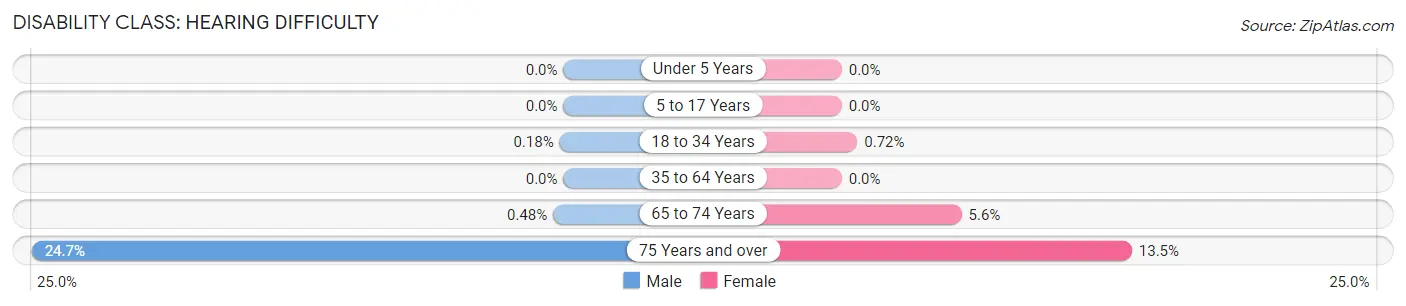
| Age Bracket | Male | Female |
| Under 5 Years | 0 (0.0%) | 0 (0.0%) |
| 5 to 17 Years | 0 (0.0%) | 0 (0.0%) |
| 18 to 34 Years | 2 (0.2%) | 6 (0.7%) |
| 35 to 64 Years | 0 (0.0%) | 0 (0.0%) |
| 65 to 74 Years | 1 (0.5%) | 13 (5.6%) |
| 75 Years and over | 56 (24.7%) | 42 (13.5%) |
Disability Class: Vision Difficulty
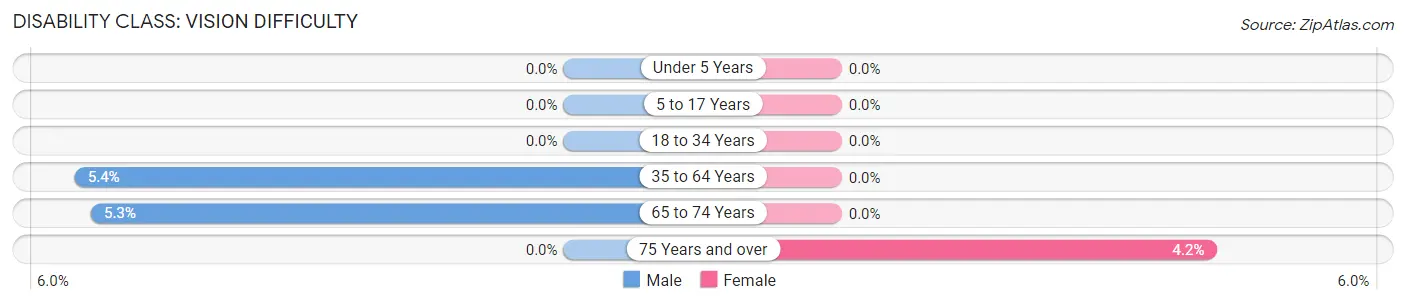
| Age Bracket | Male | Female |
| Under 5 Years | 0 (0.0%) | 0 (0.0%) |
| 5 to 17 Years | 0 (0.0%) | 0 (0.0%) |
| 18 to 34 Years | 0 (0.0%) | 0 (0.0%) |
| 35 to 64 Years | 44 (5.4%) | 0 (0.0%) |
| 65 to 74 Years | 11 (5.3%) | 0 (0.0%) |
| 75 Years and over | 0 (0.0%) | 13 (4.2%) |
Disability Class: Cognitive Difficulty
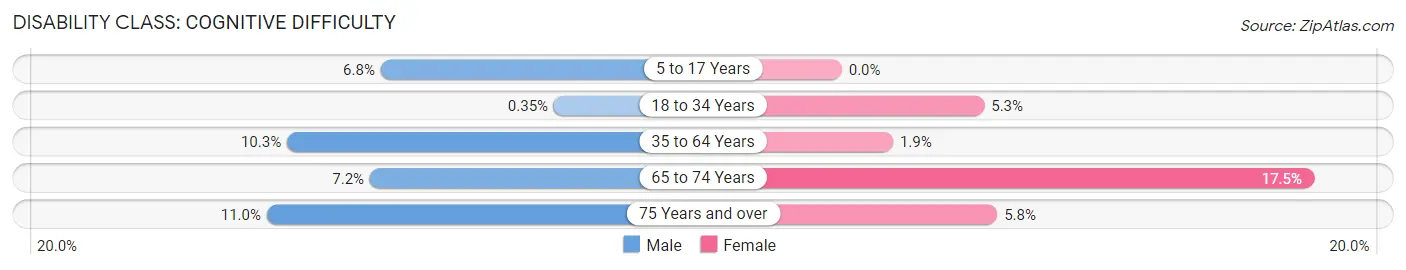
| Age Bracket | Male | Female |
| 5 to 17 Years | 39 (6.8%) | 0 (0.0%) |
| 18 to 34 Years | 4 (0.4%) | 44 (5.3%) |
| 35 to 64 Years | 83 (10.3%) | 19 (1.9%) |
| 65 to 74 Years | 15 (7.2%) | 41 (17.5%) |
| 75 Years and over | 25 (11.0%) | 18 (5.8%) |
Disability Class: Ambulatory Difficulty
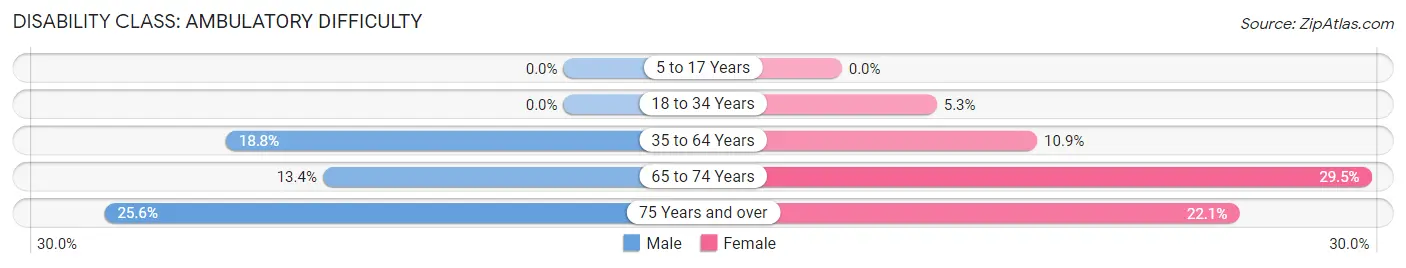
| Age Bracket | Male | Female |
| 5 to 17 Years | 0 (0.0%) | 0 (0.0%) |
| 18 to 34 Years | 0 (0.0%) | 44 (5.3%) |
| 35 to 64 Years | 152 (18.8%) | 109 (10.9%) |
| 65 to 74 Years | 28 (13.4%) | 69 (29.5%) |
| 75 Years and over | 58 (25.6%) | 69 (22.1%) |
Disability Class: Self-Care Difficulty
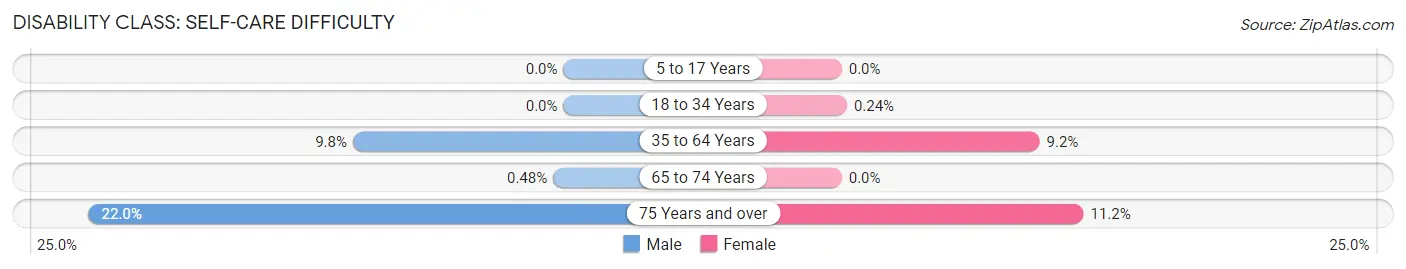
| Age Bracket | Male | Female |
| 5 to 17 Years | 0 (0.0%) | 0 (0.0%) |
| 18 to 34 Years | 0 (0.0%) | 2 (0.2%) |
| 35 to 64 Years | 79 (9.8%) | 92 (9.2%) |
| 65 to 74 Years | 1 (0.5%) | 0 (0.0%) |
| 75 Years and over | 50 (22.0%) | 35 (11.2%) |
Technology Access in Greenville
Computing Device Access in Greenville
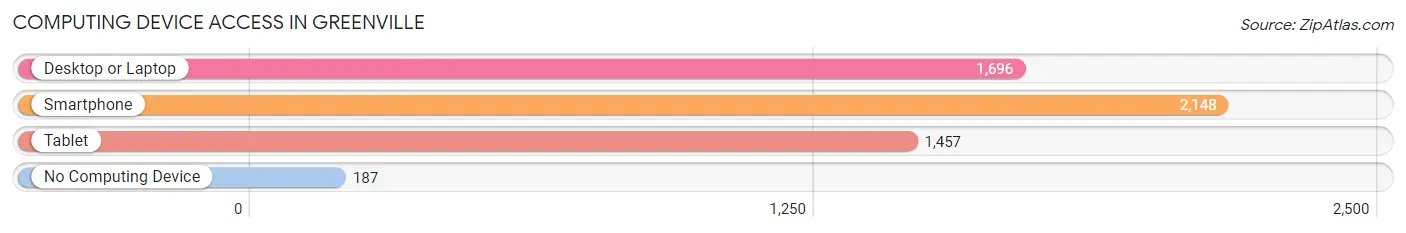
| Device Type | # Households | % Households |
| Desktop or Laptop | 1,696 | 68.4% |
| Smartphone | 2,148 | 86.7% |
| Tablet | 1,457 | 58.8% |
| No Computing Device | 187 | 7.5% |
| Total | 2,479 | 100.0% |
Internet Access in Greenville
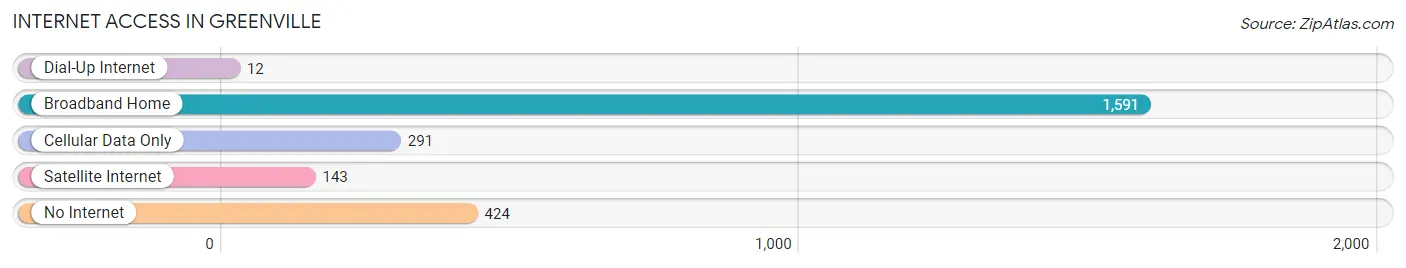
| Internet Type | # Households | % Households |
| Dial-Up Internet | 12 | 0.5% |
| Broadband Home | 1,591 | 64.2% |
| Cellular Data Only | 291 | 11.7% |
| Satellite Internet | 143 | 5.8% |
| No Internet | 424 | 17.1% |
| Total | 2,479 | 100.0% |
Greenville Summary
Greenville, Illinois is a small city located in Bond County, Illinois, United States. It is the county seat of Bond County and is located about 50 miles east of St. Louis, Missouri. The city has a population of around 7,000 people and is part of the Metro East region of the St. Louis metropolitan area.
History
Greenville was founded in 1819 by William Green, a Revolutionary War veteran. The city was named after him and was incorporated in 1855. The city was an important stop on the Vandalia Railroad, which connected St. Louis to Vandalia, Illinois. The railroad was a major factor in the growth of the city and helped to make it a major agricultural center in the region.
In the late 19th century, Greenville was a major center for the production of tobacco. The city was also home to several large manufacturing companies, including the Greenville Manufacturing Company, which produced agricultural equipment.
Geography
Greenville is located in the central part of Bond County, in the southwestern part of the state of Illinois. The city is situated on the Kaskaskia River, which flows through the city and is a tributary of the Mississippi River. The city is located about 50 miles east of St. Louis, Missouri and about 25 miles west of Vandalia, Illinois.
The city has a total area of 4.2 square miles, of which 4.1 square miles is land and 0.1 square miles is water. The city is located in a hilly region and is surrounded by farmland.
Economy
Greenville’s economy is largely based on agriculture and manufacturing. The city is home to several large agricultural companies, including the Greenville Manufacturing Company, which produces agricultural equipment. The city is also home to several small businesses, including restaurants, retail stores, and service providers.
The city is also home to several large employers, including the Greenville Public School District, the Bond County Health Department, and the Bond County Sheriff’s Office. The city is also home to several small businesses, including restaurants, retail stores, and service providers.
Demographics
As of the 2010 census, Greenville had a population of 7,000 people. The racial makeup of the city was 95.3% White, 1.2% African American, 0.3% Native American, 0.7% Asian, 0.1% Pacific Islander, 0.7% from other races, and 1.9% from two or more races. Hispanic or Latino of any race were 2.3% of the population.
The median income for a household in the city was $41,250, and the median income for a family was $50,000. The per capita income for the city was $20,845. About 11.2% of families and 14.2% of the population were below the poverty line, including 19.2% of those under age 18 and 8.2% of those age 65 or over.
Common Questions
What is Per Capita Income in Greenville?
Per Capita income in Greenville is $24,808.
What is the Median Family Income in Greenville?
Median Family Income in Greenville is $57,273.
What is the Median Household income in Greenville?
Median Household Income in Greenville is $49,635.
What is Income or Wage Gap in Greenville?
Income or Wage Gap in Greenville is 29.6%.
Women in Greenville earn 70.4 cents for every dollar earned by a man.
What is Inequality or Gini Index in Greenville?
Inequality or Gini Index in Greenville is 0.42.
What is the Total Population of Greenville?
Total Population of Greenville is 7,121.
What is the Total Male Population of Greenville?
Total Male Population of Greenville is 4,115.
What is the Total Female Population of Greenville?
Total Female Population of Greenville is 3,006.
What is the Ratio of Males per 100 Females in Greenville?
There are 136.89 Males per 100 Females in Greenville.
What is the Ratio of Females per 100 Males in Greenville?
There are 73.05 Females per 100 Males in Greenville.
What is the Median Population Age in Greenville?
Median Population Age in Greenville is 37.4 Years.
What is the Average Family Size in Greenville
Average Family Size in Greenville is 2.9 People.
What is the Average Household Size in Greenville
Average Household Size in Greenville is 2.0 People.
How Large is the Labor Force in Greenville?
There are 2,946 People in the Labor Forcein in Greenville.
What is the Percentage of People in the Labor Force in Greenville?
46.4% of People are in the Labor Force in Greenville.
What is the Unemployment Rate in Greenville?
Unemployment Rate in Greenville is 2.7%.