LaPlace, IL Map & Demographics
LaPlace Map
LaPlace Overview
$50,383
PER CAPITA INCOME
$89,018
AVG FAMILY INCOME
$87,768
AVG HOUSEHOLD INCOME
27.1%
WAGE / INCOME GAP [ % ]
72.9¢/ $1
WAGE / INCOME GAP [ $ ]
0.47
INEQUALITY / GINI INDEX
149
TOTAL POPULATION
97
MALE POPULATION
52
FEMALE POPULATION
186.54
MALES / 100 FEMALES
53.61
FEMALES / 100 MALES
53.0
MEDIAN AGE
2.7
AVG FAMILY SIZE
2.0
AVG HOUSEHOLD SIZE
95
LABOR FORCE [ PEOPLE ]
73.1%
PERCENT IN LABOR FORCE
14.7%
UNEMPLOYMENT RATE
Income in LaPlace
Income Overview in LaPlace
Per Capita Income in LaPlace is $50,383, while median incomes of families and households are $89,018 and $87,768 respectively.
| Characteristic | Number | Measure |
| Per Capita Income | 149 | $50,383 |
| Median Family Income | 39 | $89,018 |
| Mean Family Income | 39 | $72,923 |
| Median Household Income | 73 | $87,768 |
| Mean Household Income | 73 | $100,321 |
| Income Deficit | 39 | $0 |
| Wage / Income Gap (%) | 149 | 27.09% |
| Wage / Income Gap ($) | 149 | 72.91¢ per $1 |
| Gini / Inequality Index | 149 | 0.47 |
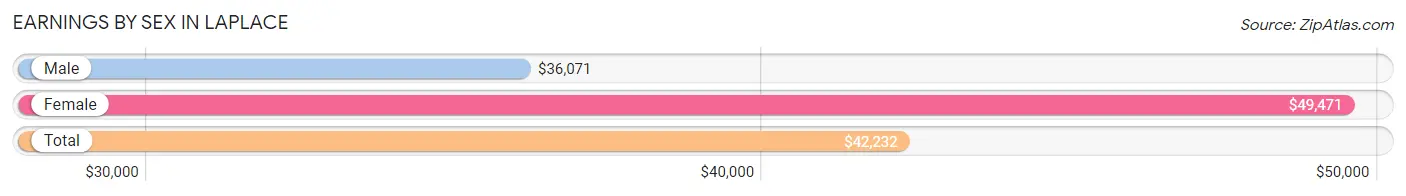
Earnings by Sex in LaPlace
Average Earnings in LaPlace are $42,232, $36,071 for men and $49,471 for women, a difference of 27.1%.
| Sex | Number | Average Earnings |
| Male | 64 (61.0%) | $36,071 |
| Female | 41 (39.1%) | $49,471 |
| Total | 105 (100.0%) | $42,232 |
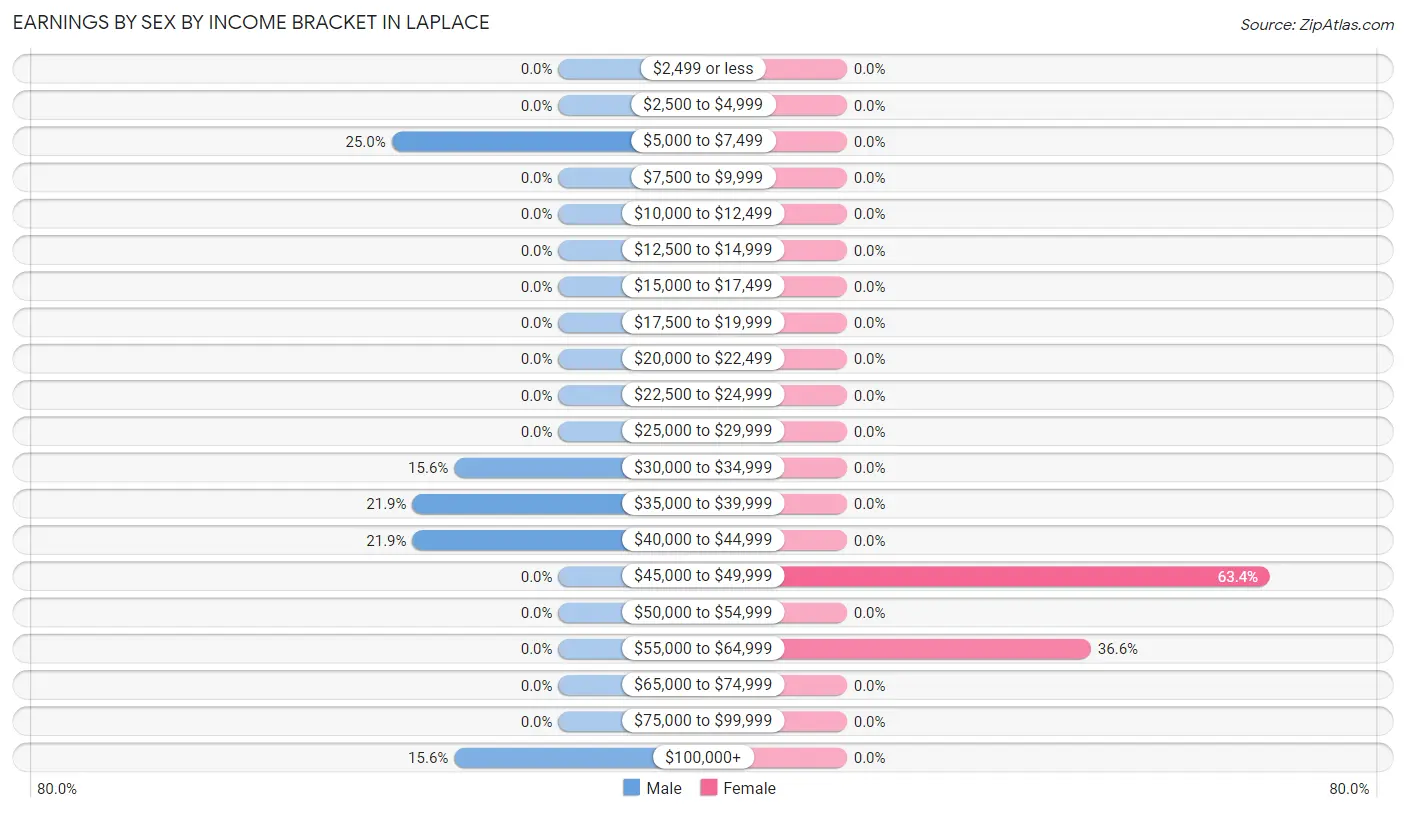
Earnings by Sex by Income Bracket in LaPlace
The most common earnings brackets in LaPlace are $5,000 to $7,499 for men (16 | 25.0%) and $45,000 to $49,999 for women (26 | 63.4%).
| Income | Male | Female |
| $2,499 or less | 0 (0.0%) | 0 (0.0%) |
| $2,500 to $4,999 | 0 (0.0%) | 0 (0.0%) |
| $5,000 to $7,499 | 16 (25.0%) | 0 (0.0%) |
| $7,500 to $9,999 | 0 (0.0%) | 0 (0.0%) |
| $10,000 to $12,499 | 0 (0.0%) | 0 (0.0%) |
| $12,500 to $14,999 | 0 (0.0%) | 0 (0.0%) |
| $15,000 to $17,499 | 0 (0.0%) | 0 (0.0%) |
| $17,500 to $19,999 | 0 (0.0%) | 0 (0.0%) |
| $20,000 to $22,499 | 0 (0.0%) | 0 (0.0%) |
| $22,500 to $24,999 | 0 (0.0%) | 0 (0.0%) |
| $25,000 to $29,999 | 0 (0.0%) | 0 (0.0%) |
| $30,000 to $34,999 | 10 (15.6%) | 0 (0.0%) |
| $35,000 to $39,999 | 14 (21.9%) | 0 (0.0%) |
| $40,000 to $44,999 | 14 (21.9%) | 0 (0.0%) |
| $45,000 to $49,999 | 0 (0.0%) | 26 (63.4%) |
| $50,000 to $54,999 | 0 (0.0%) | 0 (0.0%) |
| $55,000 to $64,999 | 0 (0.0%) | 15 (36.6%) |
| $65,000 to $74,999 | 0 (0.0%) | 0 (0.0%) |
| $75,000 to $99,999 | 0 (0.0%) | 0 (0.0%) |
| $100,000+ | 10 (15.6%) | 0 (0.0%) |
| Total | 64 (100.0%) | 41 (100.0%) |
Earnings by Sex by Educational Attainment in LaPlace
| Educational Attainment | Male Income | Female Income |
| Less than High School | - | - |
| High School Diploma | - | - |
| College or Associate's Degree | - | - |
| Bachelor's Degree | - | - |
| Graduate Degree | - | - |
| Total | $38,750 | $49,471 |
Family Income in LaPlace
Family Income Brackets in LaPlace
According to the LaPlace family income data, there are 14 families falling into the $75,000 to $99,999 income range, which is the most common income bracket and makes up 35.9% of all families.
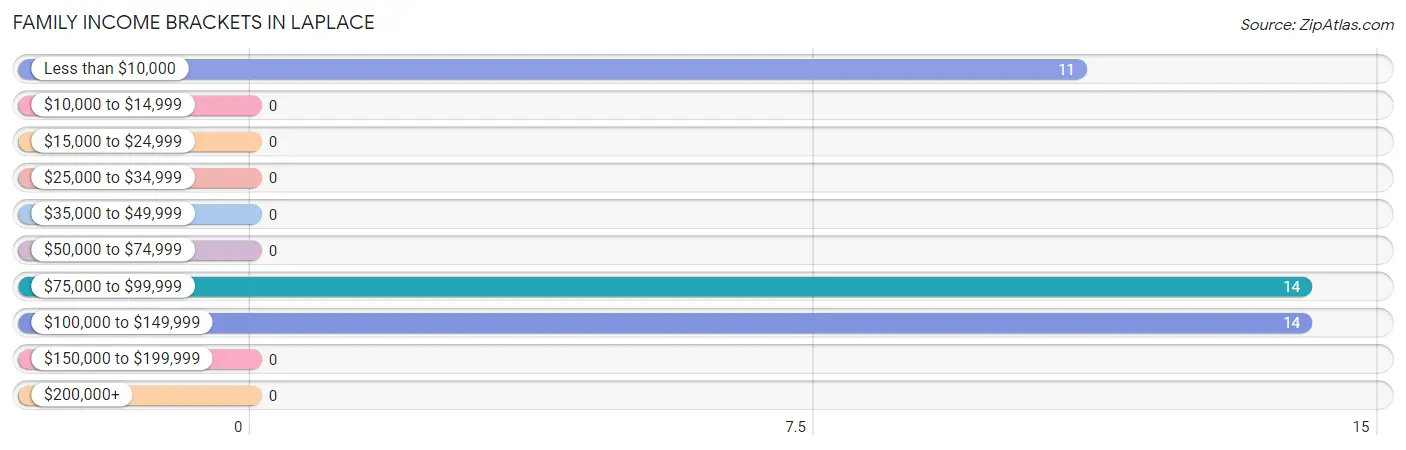
| Income Bracket | # Families | % Families |
| Less than $10,000 | 11 | 28.2% |
| $10,000 to $14,999 | 0 | 0.0% |
| $15,000 to $24,999 | 0 | 0.0% |
| $25,000 to $34,999 | 0 | 0.0% |
| $35,000 to $49,999 | 0 | 0.0% |
| $50,000 to $74,999 | 0 | 0.0% |
| $75,000 to $99,999 | 14 | 35.9% |
| $100,000 to $149,999 | 14 | 35.9% |
| $150,000 to $199,999 | 0 | 0.0% |
| $200,000+ | 0 | 0.0% |
Family Income by Famaliy Size in LaPlace
| Income Bracket | # Families | Median Income |
| 2-Person Families | 25 (64.1%) | $0 |
| 3-Person Families | 14 (35.9%) | $0 |
| 4-Person Families | 0 (0.0%) | $0 |
| 5-Person Families | 0 (0.0%) | $0 |
| 6-Person Families | 0 (0.0%) | $0 |
| 7+ Person Families | 0 (0.0%) | $0 |
| Total | 39 (100.0%) | $89,018 |
Family Income by Number of Earners in LaPlace
| Number of Earners | # Families | Median Income |
| No Earners | 0 (0.0%) | $0 |
| 1 Earner | 11 (28.2%) | $0 |
| 2 Earners | 28 (71.8%) | $0 |
| 3+ Earners | 0 (0.0%) | $0 |
| Total | 39 (100.0%) | $89,018 |
Household Income in LaPlace
Household Income Brackets in LaPlace
With 14 households falling in the category, the $50,000 to $74,999 income range is the most frequent in LaPlace, accounting for 19.2% of all households.
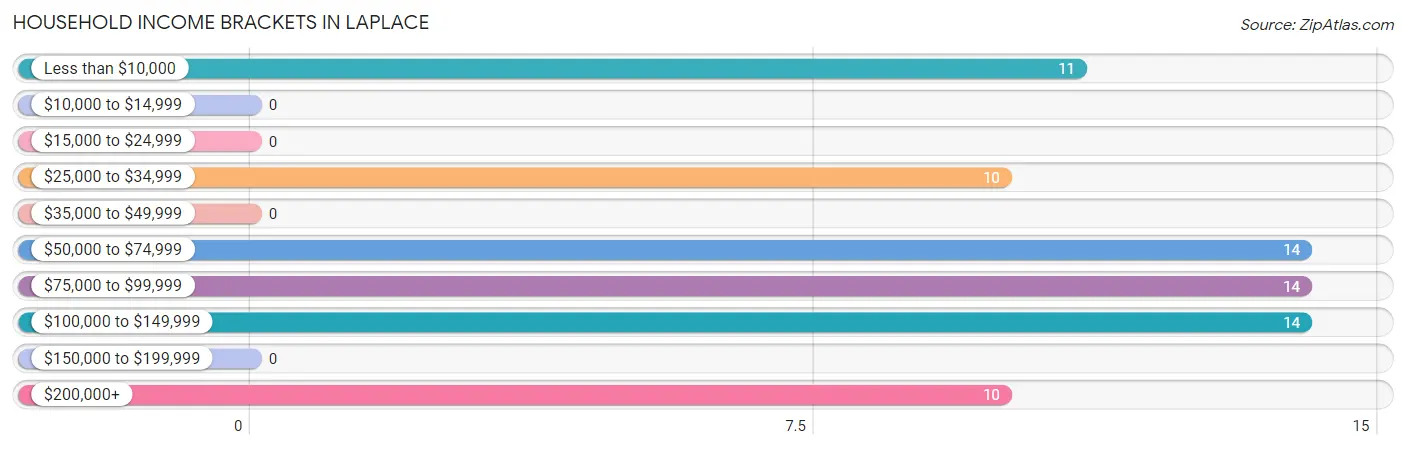
| Income Bracket | # Households | % Households |
| Less than $10,000 | 11 | 15.1% |
| $10,000 to $14,999 | 0 | 0.0% |
| $15,000 to $24,999 | 0 | 0.0% |
| $25,000 to $34,999 | 10 | 13.7% |
| $35,000 to $49,999 | 0 | 0.0% |
| $50,000 to $74,999 | 14 | 19.2% |
| $75,000 to $99,999 | 14 | 19.2% |
| $100,000 to $149,999 | 14 | 19.2% |
| $150,000 to $199,999 | 0 | 0.0% |
| $200,000+ | 10 | 13.7% |
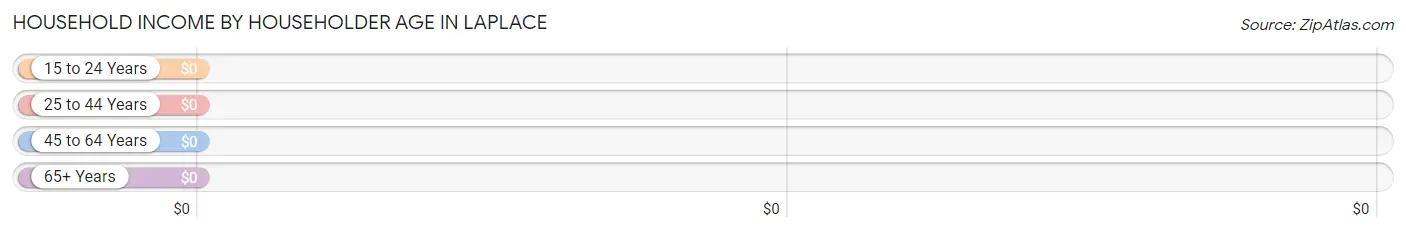
Household Income by Householder Age in LaPlace
| Income Bracket | # Households | Median Income |
| 15 to 24 Years | 0 (0.0%) | $0 |
| 25 to 44 Years | 14 (19.2%) | $0 |
| 45 to 64 Years | 35 (47.9%) | $0 |
| 65+ Years | 24 (32.9%) | $0 |
| Total | 73 (100.0%) | $87,768 |
Poverty in LaPlace
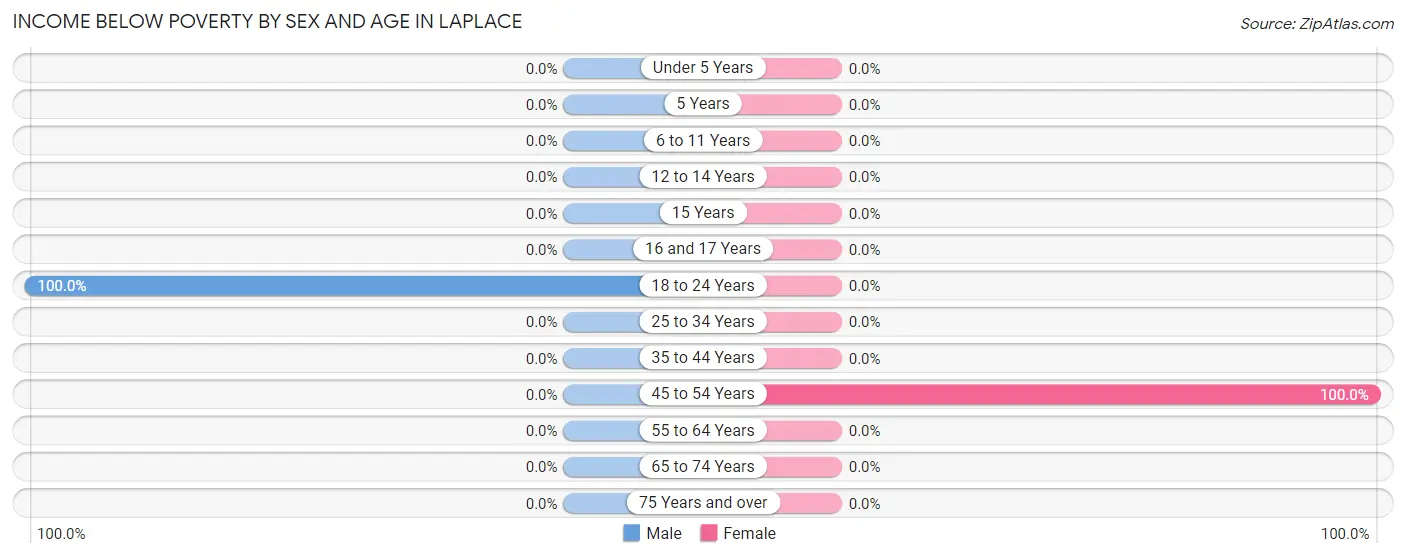
Income Below Poverty by Sex and Age in LaPlace
With 16.5% poverty level for males and 21.1% for females among the residents of LaPlace, 18 to 24 year old males and 45 to 54 year old females are the most vulnerable to poverty, with 16 males (100.0%) and 11 females (100.0%) in their respective age groups living below the poverty level.
| Age Bracket | Male | Female |
| Under 5 Years | 0 (0.0%) | 0 (0.0%) |
| 5 Years | 0 (0.0%) | 0 (0.0%) |
| 6 to 11 Years | 0 (0.0%) | 0 (0.0%) |
| 12 to 14 Years | 0 (0.0%) | 0 (0.0%) |
| 15 Years | 0 (0.0%) | 0 (0.0%) |
| 16 and 17 Years | 0 (0.0%) | 0 (0.0%) |
| 18 to 24 Years | 16 (100.0%) | 0 (0.0%) |
| 25 to 34 Years | 0 (0.0%) | 0 (0.0%) |
| 35 to 44 Years | 0 (0.0%) | 0 (0.0%) |
| 45 to 54 Years | 0 (0.0%) | 11 (100.0%) |
| 55 to 64 Years | 0 (0.0%) | 0 (0.0%) |
| 65 to 74 Years | 0 (0.0%) | 0 (0.0%) |
| 75 Years and over | 0 (0.0%) | 0 (0.0%) |
| Total | 16 (16.5%) | 11 (21.1%) |
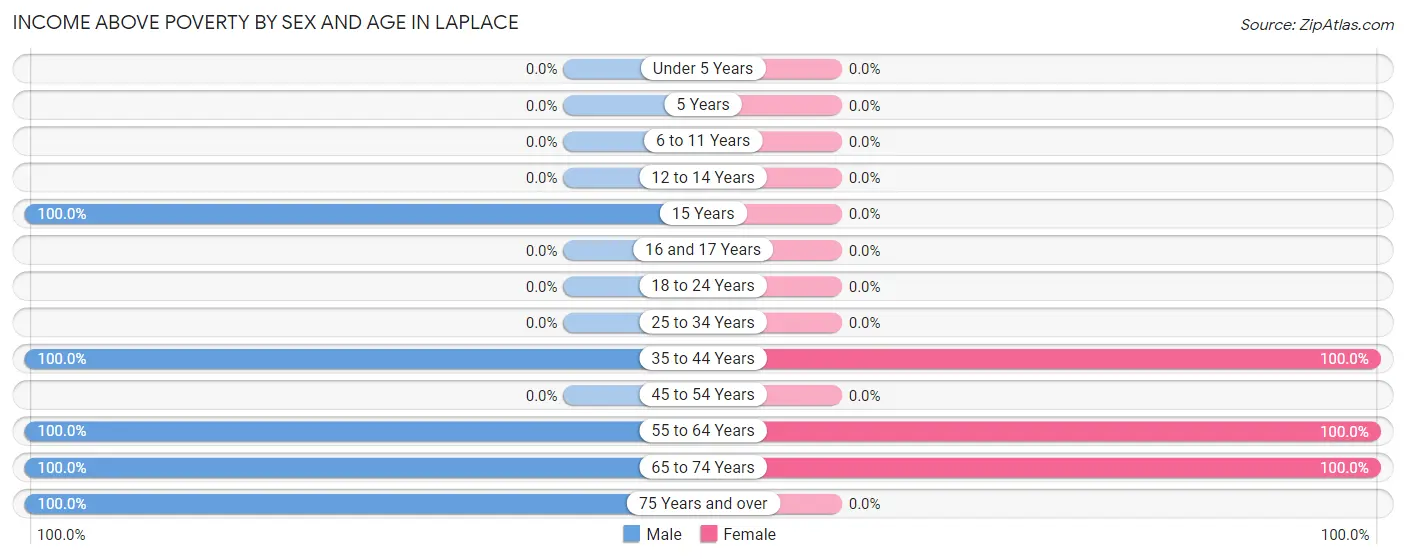
Income Above Poverty by Sex and Age in LaPlace
According to the poverty statistics in LaPlace, males aged 15 years and females aged 35 to 44 years are the age groups that are most secure financially, with 100.0% of males and 100.0% of females in these age groups living above the poverty line.
| Age Bracket | Male | Female |
| Under 5 Years | 0 (0.0%) | 0 (0.0%) |
| 5 Years | 0 (0.0%) | 0 (0.0%) |
| 6 to 11 Years | 0 (0.0%) | 0 (0.0%) |
| 12 to 14 Years | 0 (0.0%) | 0 (0.0%) |
| 15 Years | 19 (100.0%) | 0 (0.0%) |
| 16 and 17 Years | 0 (0.0%) | 0 (0.0%) |
| 18 to 24 Years | 0 (0.0%) | 0 (0.0%) |
| 25 to 34 Years | 0 (0.0%) | 0 (0.0%) |
| 35 to 44 Years | 14 (100.0%) | 15 (100.0%) |
| 45 to 54 Years | 0 (0.0%) | 0 (0.0%) |
| 55 to 64 Years | 24 (100.0%) | 15 (100.0%) |
| 65 to 74 Years | 10 (100.0%) | 11 (100.0%) |
| 75 Years and over | 14 (100.0%) | 0 (0.0%) |
| Total | 81 (83.5%) | 41 (78.8%) |
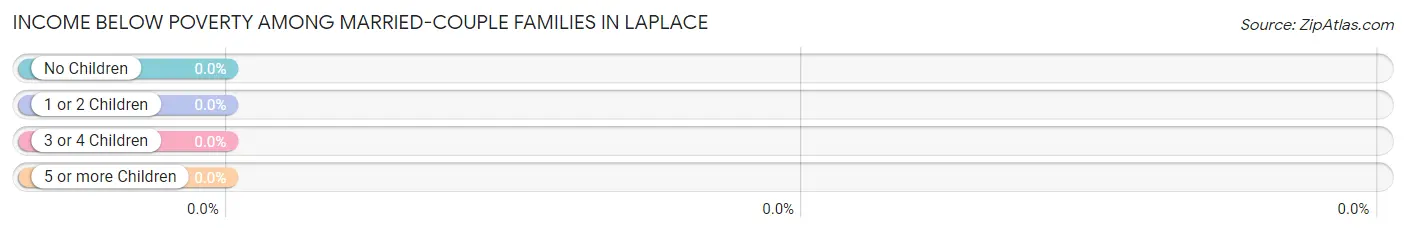
Income Below Poverty Among Married-Couple Families in LaPlace
| Children | Above Poverty | Below Poverty |
| No Children | 14 (100.0%) | 0 (0.0%) |
| 1 or 2 Children | 14 (100.0%) | 0 (0.0%) |
| 3 or 4 Children | 0 (0.0%) | 0 (0.0%) |
| 5 or more Children | 0 (0.0%) | 0 (0.0%) |
| Total | 28 (100.0%) | 0 (0.0%) |
Income Below Poverty Among Single-Parent Households in LaPlace
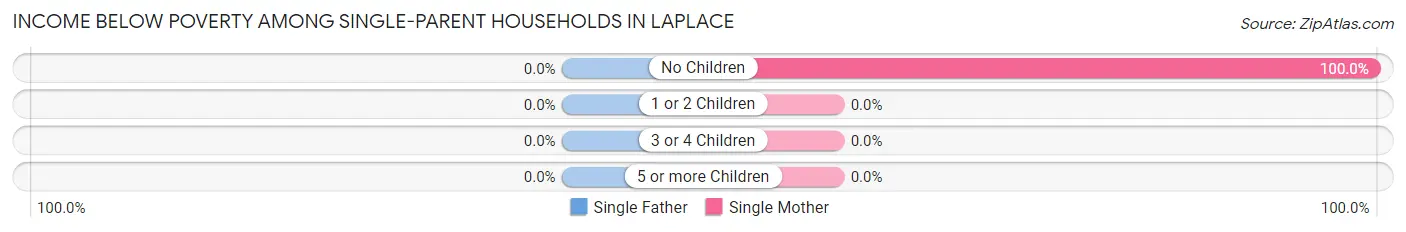
| Children | Single Father | Single Mother |
| No Children | 0 (0.0%) | 11 (100.0%) |
| 1 or 2 Children | 0 (0.0%) | 0 (0.0%) |
| 3 or 4 Children | 0 (0.0%) | 0 (0.0%) |
| 5 or more Children | 0 (0.0%) | 0 (0.0%) |
| Total | 0 (0.0%) | 11 (100.0%) |
Income Below Poverty Among Married-Couple vs Single-Parent Households in LaPlace
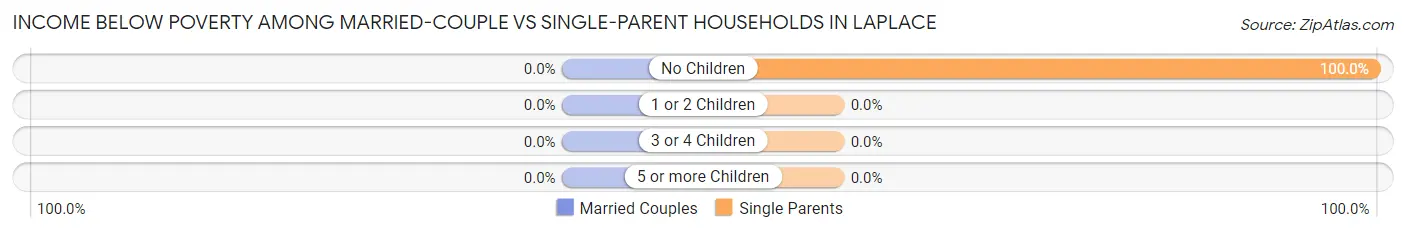
| Children | Married-Couple Families | Single-Parent Households |
| No Children | 0 (0.0%) | 11 (100.0%) |
| 1 or 2 Children | 0 (0.0%) | 0 (0.0%) |
| 3 or 4 Children | 0 (0.0%) | 0 (0.0%) |
| 5 or more Children | 0 (0.0%) | 0 (0.0%) |
| Total | 0 (0.0%) | 11 (100.0%) |
Race in LaPlace
The most populous races in LaPlace are , and White / Caucasian (149 | 100.0%).
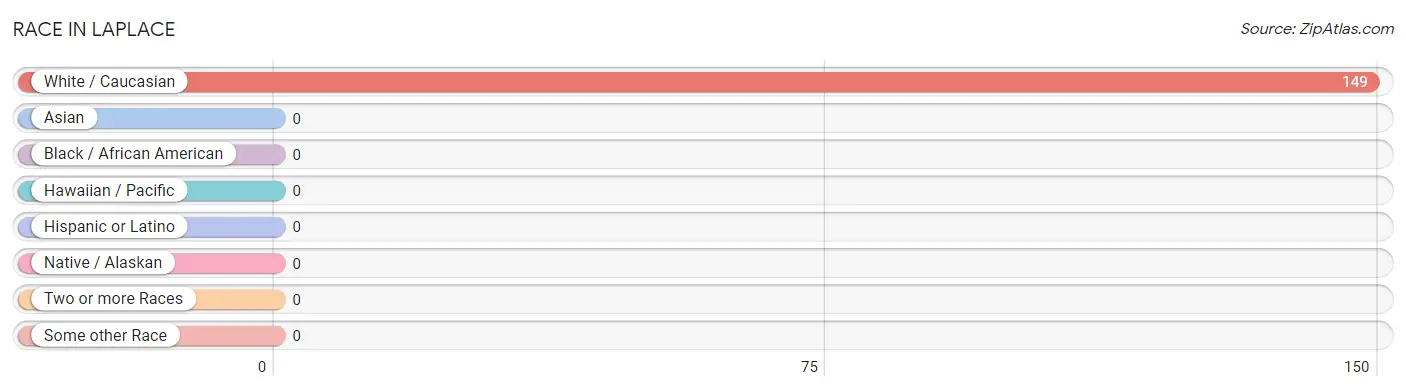
| Race | # Population | % Population |
| Asian | 0 | 0.0% |
| Black / African American | 0 | 0.0% |
| Hawaiian / Pacific | 0 | 0.0% |
| Hispanic or Latino | 0 | 0.0% |
| Native / Alaskan | 0 | 0.0% |
| White / Caucasian | 149 | 100.0% |
| Two or more Races | 0 | 0.0% |
| Some other Race | 0 | 0.0% |
| Total | 149 | 100.0% |
Ancestry in LaPlace
The most populous ancestries reported in LaPlace are German (48 | 32.2%), American (24 | 16.1%), Greek (16 | 10.7%), European (15 | 10.1%), and Dutch (14 | 9.4%), together accounting for 78.5% of all LaPlace residents.
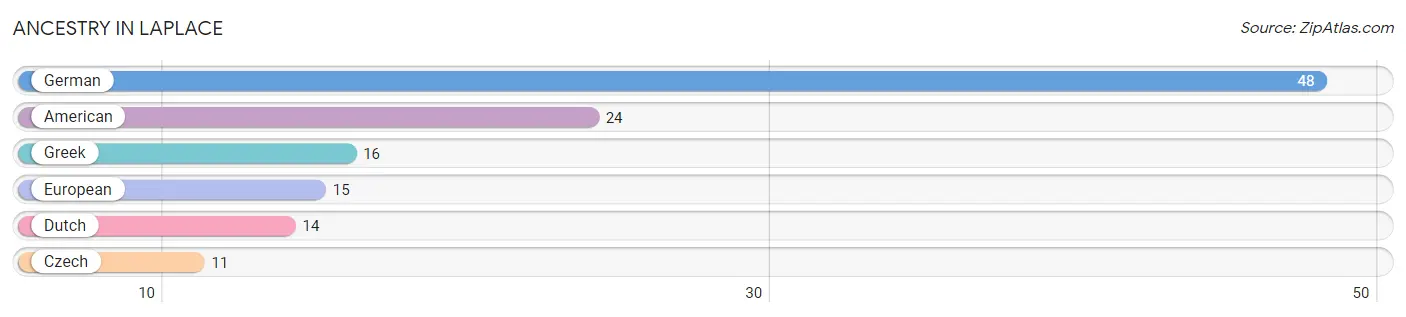
| Ancestry | # Population | % Population |
| American | 24 | 16.1% |
| Czech | 11 | 7.4% |
| Dutch | 14 | 9.4% |
| European | 15 | 10.1% |
| German | 48 | 32.2% |
| Greek | 16 | 10.7% | View All 6 Rows |
Immigrants in LaPlace

| Immigration Origin | # Population | % Population | View All 0 Rows |
Sex and Age in LaPlace
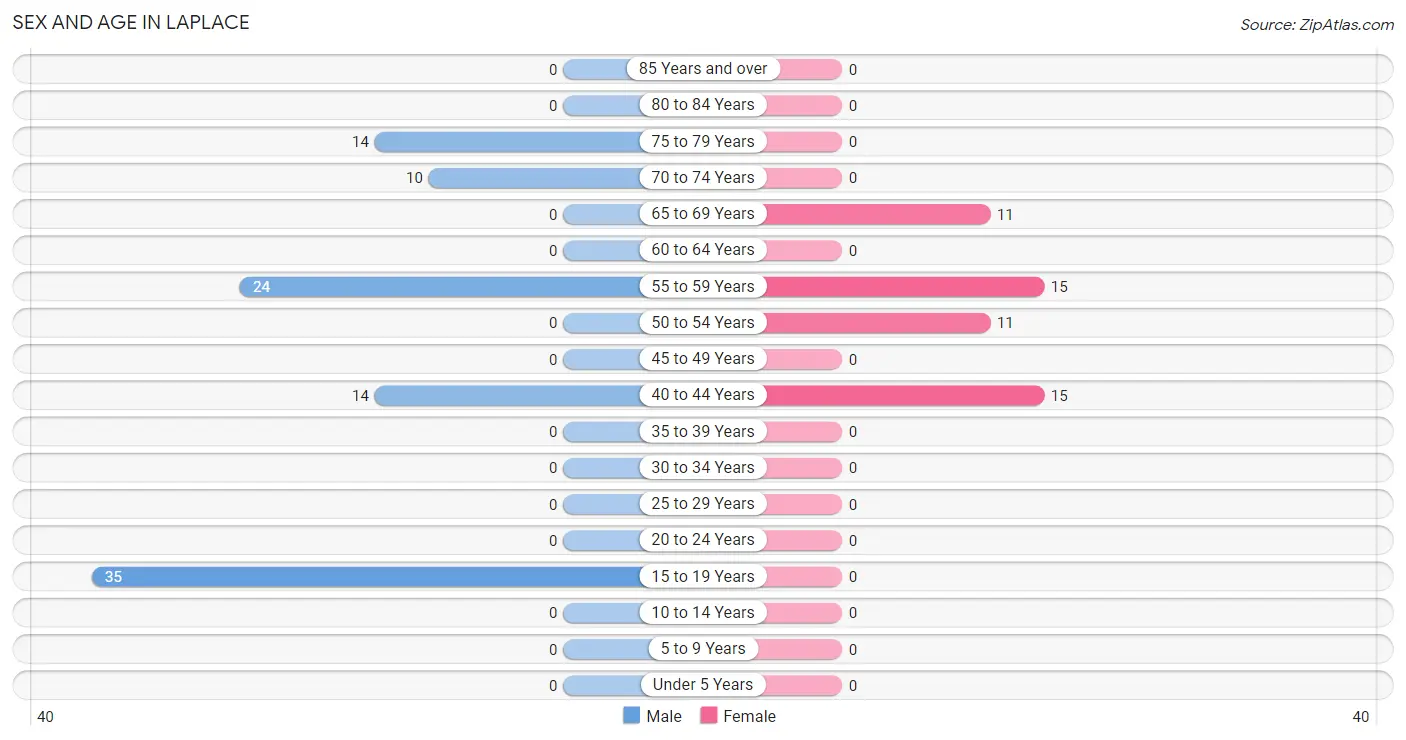
Sex and Age in LaPlace
The most populous age groups in LaPlace are 15 to 19 Years (35 | 36.1%) for men and 40 to 44 Years (15 | 28.8%) for women.
| Age Bracket | Male | Female |
| Under 5 Years | 0 (0.0%) | 0 (0.0%) |
| 5 to 9 Years | 0 (0.0%) | 0 (0.0%) |
| 10 to 14 Years | 0 (0.0%) | 0 (0.0%) |
| 15 to 19 Years | 35 (36.1%) | 0 (0.0%) |
| 20 to 24 Years | 0 (0.0%) | 0 (0.0%) |
| 25 to 29 Years | 0 (0.0%) | 0 (0.0%) |
| 30 to 34 Years | 0 (0.0%) | 0 (0.0%) |
| 35 to 39 Years | 0 (0.0%) | 0 (0.0%) |
| 40 to 44 Years | 14 (14.4%) | 15 (28.8%) |
| 45 to 49 Years | 0 (0.0%) | 0 (0.0%) |
| 50 to 54 Years | 0 (0.0%) | 11 (21.1%) |
| 55 to 59 Years | 24 (24.7%) | 15 (28.8%) |
| 60 to 64 Years | 0 (0.0%) | 0 (0.0%) |
| 65 to 69 Years | 0 (0.0%) | 11 (21.1%) |
| 70 to 74 Years | 10 (10.3%) | 0 (0.0%) |
| 75 to 79 Years | 14 (14.4%) | 0 (0.0%) |
| 80 to 84 Years | 0 (0.0%) | 0 (0.0%) |
| 85 Years and over | 0 (0.0%) | 0 (0.0%) |
| Total | 97 (100.0%) | 52 (100.0%) |
Families and Households in LaPlace
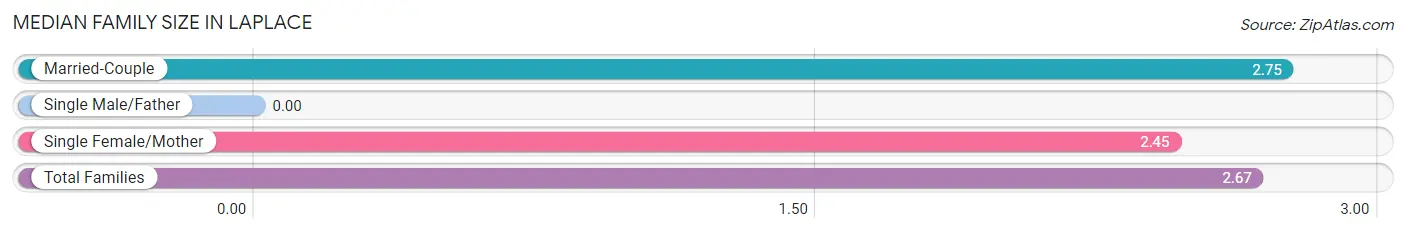
Median Family Size in LaPlace
| Family Type | # Families | Family Size |
| Married-Couple | 28 (71.8%) | 2.75 |
| Single Male/Father | 0 (0.0%) | - |
| Single Female/Mother | 11 (28.2%) | 2.45 |
| Total Families | 39 (100.0%) | 2.67 |
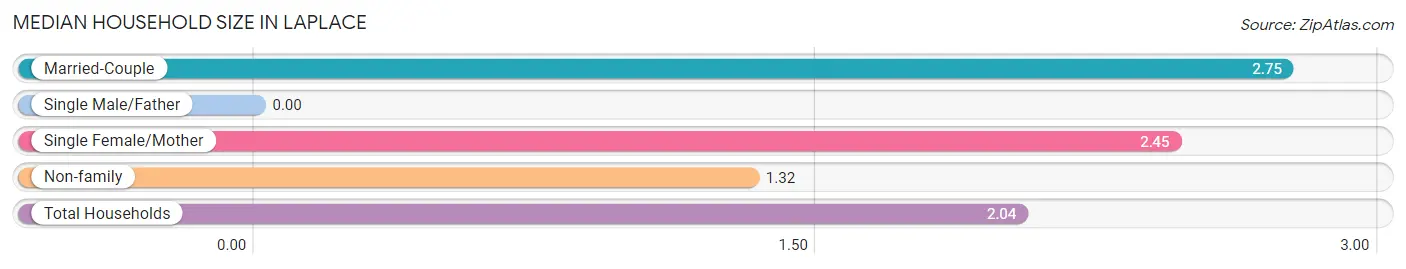
Median Household Size in LaPlace
| Household Type | # Households | Household Size |
| Married-Couple | 28 (38.4%) | 2.75 |
| Single Male/Father | 0 (0.0%) | - |
| Single Female/Mother | 11 (15.1%) | 2.45 |
| Non-family | 34 (46.6%) | 1.32 |
| Total Households | 73 (100.0%) | 2.04 |
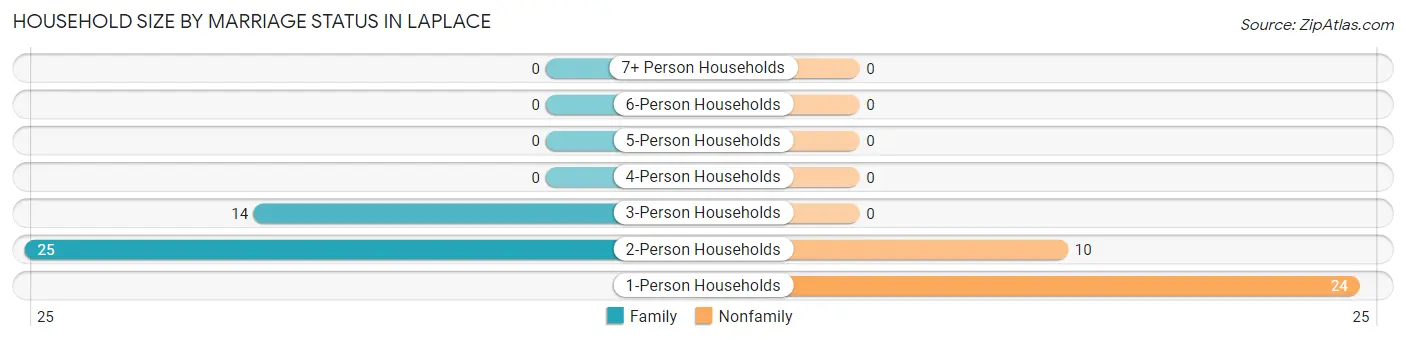
Household Size by Marriage Status in LaPlace
Out of a total of 73 households in LaPlace, 39 (53.4%) are family households, while 34 (46.6%) are nonfamily households. The most numerous type of family households are 2-person households, comprising 25, and the most common type of nonfamily households are 1-person households, comprising 24.
| Household Size | Family Households | Nonfamily Households |
| 1-Person Households | - | 24 (32.9%) |
| 2-Person Households | 25 (34.3%) | 10 (13.7%) |
| 3-Person Households | 14 (19.2%) | 0 (0.0%) |
| 4-Person Households | 0 (0.0%) | 0 (0.0%) |
| 5-Person Households | 0 (0.0%) | 0 (0.0%) |
| 6-Person Households | 0 (0.0%) | 0 (0.0%) |
| 7+ Person Households | 0 (0.0%) | 0 (0.0%) |
| Total | 39 (53.4%) | 34 (46.6%) |
Female Fertility in LaPlace
Fertility by Age in LaPlace
| Age Bracket | Women with Births | Births / 1,000 Women |
| 15 to 19 years | 0 (0.0%) | 0.0 |
| 20 to 34 years | 0 (0.0%) | 0.0 |
| 35 to 50 years | 0 (0.0%) | 0.0 |
| Total | 0 (0.0%) | 0.0 |
Fertility by Age by Marriage Status in LaPlace
| Age Bracket | Married | Unmarried |
| 15 to 19 years | 0 (0.0%) | 0 (0.0%) |
| 20 to 34 years | 0 (0.0%) | 0 (0.0%) |
| 35 to 50 years | 0 (0.0%) | 0 (0.0%) |
| Total | 0 (0.0%) | 0 (0.0%) |
Fertility by Education in LaPlace
| Educational Attainment | Women with Births | Births / 1,000 Women |
| Less than High School | 0 (0.0%) | 0.0 |
| High School Diploma | 0 (0.0%) | 0.0 |
| College or Associate's Degree | 0 (0.0%) | 0.0 |
| Bachelor's Degree | 0 (0.0%) | 0.0 |
| Graduate Degree | 0 (0.0%) | 0.0 |
| Total | 0 (0.0%) | 0.0 |
Fertility by Education by Marriage Status in LaPlace
| Educational Attainment | Married | Unmarried |
| Less than High School | 0 (0.0%) | 0 (0.0%) |
| High School Diploma | 0 (0.0%) | 0 (0.0%) |
| College or Associate's Degree | 0 (0.0%) | 0 (0.0%) |
| Bachelor's Degree | 0 (0.0%) | 0 (0.0%) |
| Graduate Degree | 0 (0.0%) | 0 (0.0%) |
| Total | 0 (0.0%) | 0 (0.0%) |
Employment Characteristics in LaPlace
Employment by Class of Employer in LaPlace
Among the 81 employed individuals in LaPlace, private company employees (41 | 50.6%), not-for-profit organizations (25 | 30.9%), and local government employees (15 | 18.5%) make up the most common classes of employment.
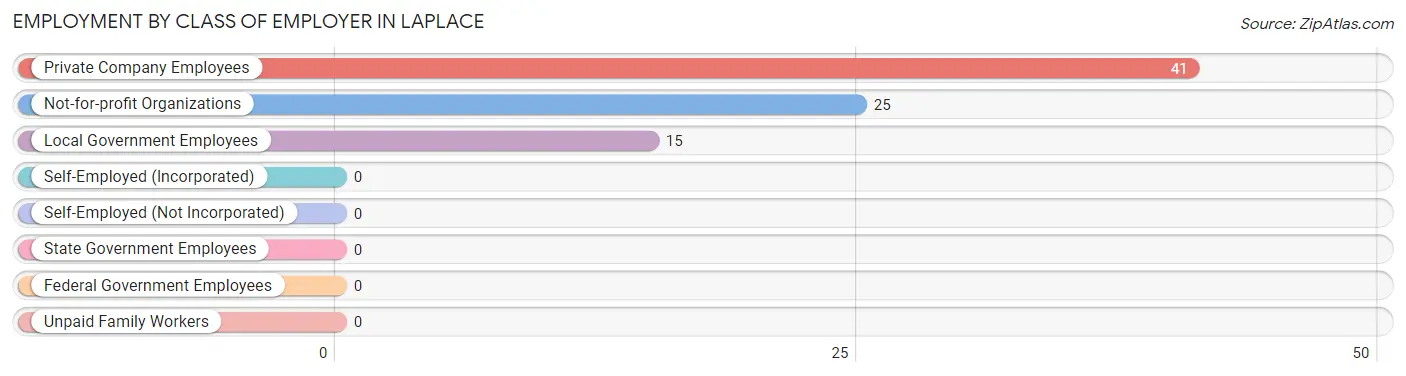
| Employer Class | # Employees | % Employees |
| Private Company Employees | 41 | 50.6% |
| Self-Employed (Incorporated) | 0 | 0.0% |
| Self-Employed (Not Incorporated) | 0 | 0.0% |
| Not-for-profit Organizations | 25 | 30.9% |
| Local Government Employees | 15 | 18.5% |
| State Government Employees | 0 | 0.0% |
| Federal Government Employees | 0 | 0.0% |
| Unpaid Family Workers | 0 | 0.0% |
| Total | 81 | 100.0% |
Employment Status by Age in LaPlace
According to the labor force statistics for LaPlace, out of the total population over 16 years of age (130), 73.1% or 95 individuals are in the labor force, with 14.7% or 14 of them unemployed. The age group with the highest labor force participation rate is 16 to 19 years, with 100.0% or 16 individuals in the labor force. Within the labor force, the 35 to 44 years age range has the highest percentage of unemployed individuals, with 48.3% or 14 of them being unemployed.
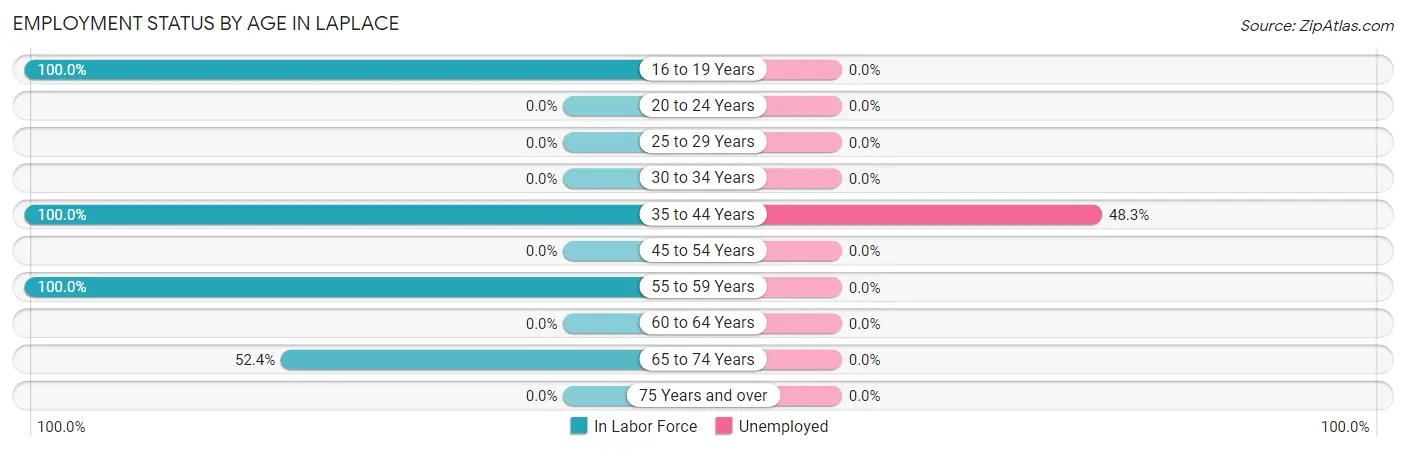
| Age Bracket | In Labor Force | Unemployed |
| 16 to 19 Years | 16 (100.0%) | 0 (0.0%) |
| 20 to 24 Years | 0 (0.0%) | 0 (0.0%) |
| 25 to 29 Years | 0 (0.0%) | 0 (0.0%) |
| 30 to 34 Years | 0 (0.0%) | 0 (0.0%) |
| 35 to 44 Years | 29 (100.0%) | 14 (48.3%) |
| 45 to 54 Years | 0 (0.0%) | 0 (0.0%) |
| 55 to 59 Years | 39 (100.0%) | 0 (0.0%) |
| 60 to 64 Years | 0 (0.0%) | 0 (0.0%) |
| 65 to 74 Years | 11 (52.4%) | 0 (0.0%) |
| 75 Years and over | 0 (0.0%) | 0 (0.0%) |
| Total | 95 (73.1%) | 14 (14.7%) |
Employment Status by Educational Attainment in LaPlace
According to labor force statistics for LaPlace, 86.1% of individuals (68) out of the total population between 25 and 64 years of age (79) are in the labor force, with 20.6% or 14 of them being unemployed. The group with the highest labor force participation rate are those with the educational attainment of college / associate degree, with 100.0% or 10 individuals in the labor force. Within the labor force, individuals with high school diploma education have the highest percentage of unemployment, with 50.0% or 14 of them being unemployed.
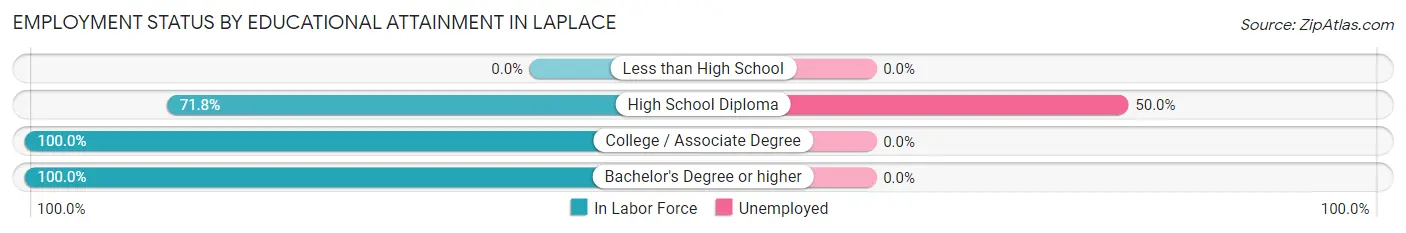
| Educational Attainment | In Labor Force | Unemployed |
| Less than High School | 0 (0.0%) | 0 (0.0%) |
| High School Diploma | 28 (71.8%) | 20 (50.0%) |
| College / Associate Degree | 10 (100.0%) | 0 (0.0%) |
| Bachelor's Degree or higher | 30 (100.0%) | 0 (0.0%) |
| Total | 68 (86.1%) | 16 (20.6%) |
Employment Occupations by Sex in LaPlace
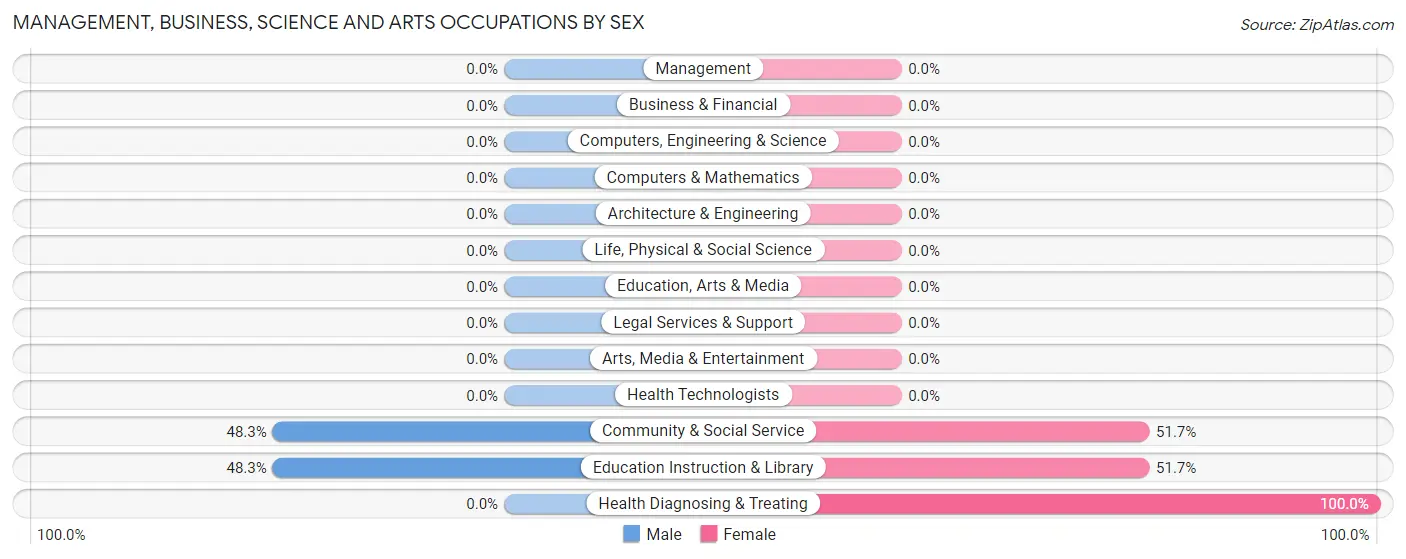
Management, Business, Science and Arts Occupations
The most common Management, Business, Science and Arts occupations in LaPlace are Community & Social Service (29 | 35.8%), Education Instruction & Library (29 | 35.8%), and Health Diagnosing & Treating (26 | 32.1%).
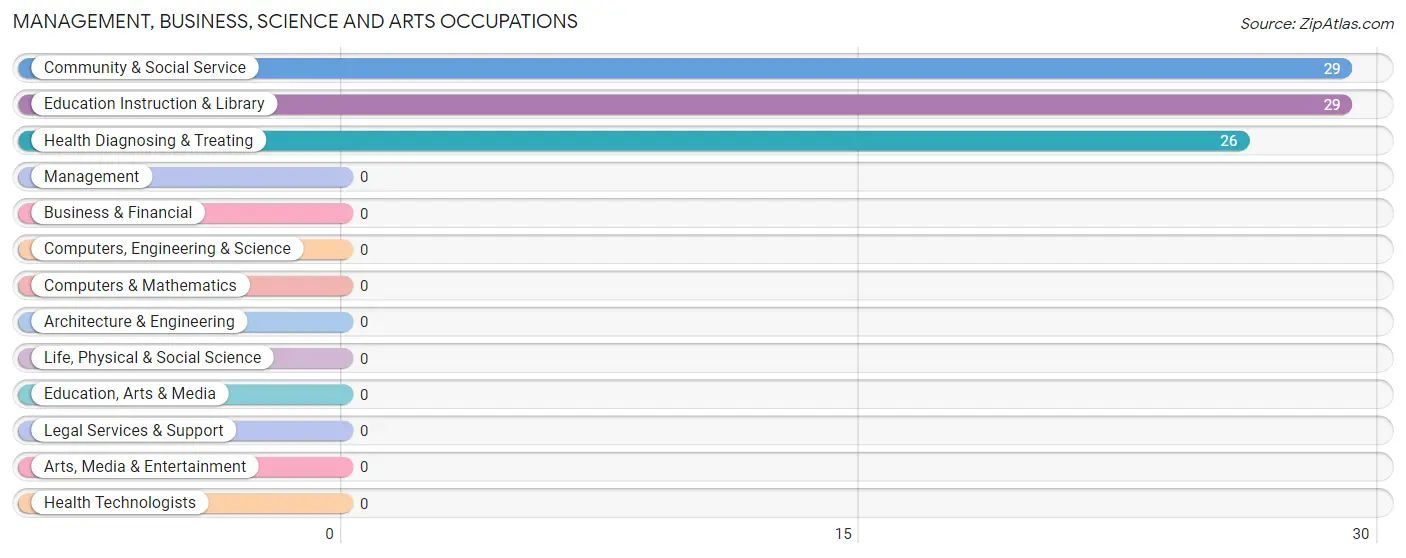
Management, Business, Science and Arts Occupations by Sex
Within the Management, Business, Science and Arts occupations in LaPlace, the most male-oriented occupations are Community & Social Service (48.3%), and Education Instruction & Library (48.3%), while the most female-oriented occupations are Health Diagnosing & Treating (100.0%), Community & Social Service (51.7%), and Education Instruction & Library (51.7%).
| Occupation | Male | Female |
| Management | 0 (0.0%) | 0 (0.0%) |
| Business & Financial | 0 (0.0%) | 0 (0.0%) |
| Computers, Engineering & Science | 0 (0.0%) | 0 (0.0%) |
| Computers & Mathematics | 0 (0.0%) | 0 (0.0%) |
| Architecture & Engineering | 0 (0.0%) | 0 (0.0%) |
| Life, Physical & Social Science | 0 (0.0%) | 0 (0.0%) |
| Community & Social Service | 14 (48.3%) | 15 (51.7%) |
| Education, Arts & Media | 0 (0.0%) | 0 (0.0%) |
| Legal Services & Support | 0 (0.0%) | 0 (0.0%) |
| Education Instruction & Library | 14 (48.3%) | 15 (51.7%) |
| Arts, Media & Entertainment | 0 (0.0%) | 0 (0.0%) |
| Health Diagnosing & Treating | 0 (0.0%) | 26 (100.0%) |
| Health Technologists | 0 (0.0%) | 0 (0.0%) |
| Total (Category) | 14 (25.5%) | 41 (74.6%) |
| Total (Overall) | 40 (49.4%) | 41 (50.6%) |
Services Occupations
Services Occupations by Sex
| Occupation | Male | Female |
| Healthcare Support | 0 (0.0%) | 0 (0.0%) |
| Security & Protection | 0 (0.0%) | 0 (0.0%) |
| Firefighting & Prevention | 0 (0.0%) | 0 (0.0%) |
| Law Enforcement | 0 (0.0%) | 0 (0.0%) |
| Food Preparation & Serving | 0 (0.0%) | 0 (0.0%) |
| Cleaning & Maintenance | 0 (0.0%) | 0 (0.0%) |
| Personal Care & Service | 0 (0.0%) | 0 (0.0%) |
| Total (Category) | 0 (0.0%) | 0 (0.0%) |
| Total (Overall) | 40 (49.4%) | 41 (50.6%) |
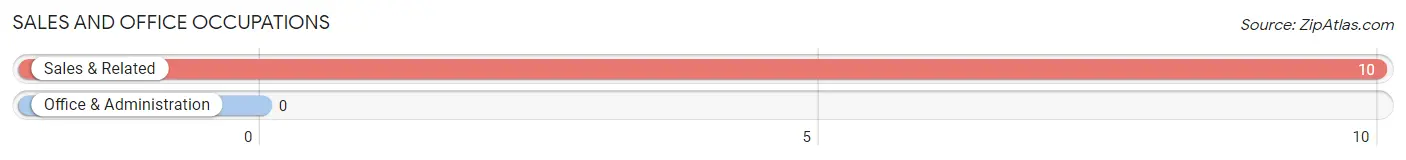
Sales and Office Occupations
The most common Sales and Office occupations in LaPlace are , and Sales & Related (10 | 12.3%).
Sales and Office Occupations by Sex

| Occupation | Male | Female |
| Sales & Related | 10 (100.0%) | 0 (0.0%) |
| Office & Administration | 0 (0.0%) | 0 (0.0%) |
| Total (Category) | 10 (100.0%) | 0 (0.0%) |
| Total (Overall) | 40 (49.4%) | 41 (50.6%) |
Natural Resources, Construction and Maintenance Occupations
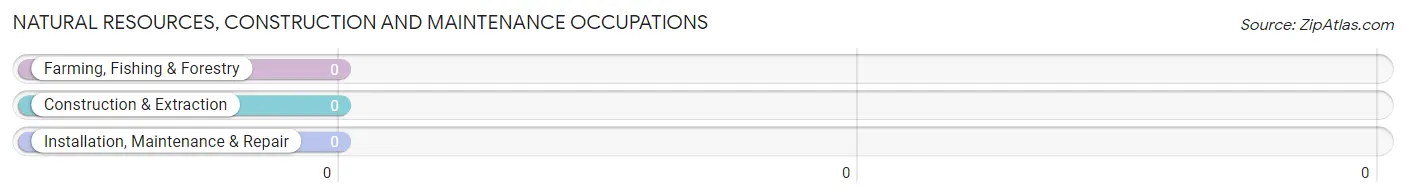
Natural Resources, Construction and Maintenance Occupations by Sex
| Occupation | Male | Female |
| Farming, Fishing & Forestry | 0 (0.0%) | 0 (0.0%) |
| Construction & Extraction | 0 (0.0%) | 0 (0.0%) |
| Installation, Maintenance & Repair | 0 (0.0%) | 0 (0.0%) |
| Total (Category) | 0 (0.0%) | 0 (0.0%) |
| Total (Overall) | 40 (49.4%) | 41 (50.6%) |
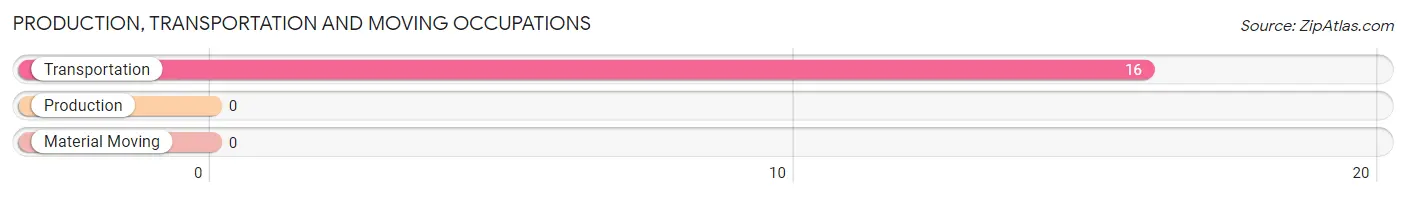
Production, Transportation and Moving Occupations
The most common Production, Transportation and Moving occupations in LaPlace are , and Transportation (16 | 19.8%).
Production, Transportation and Moving Occupations by Sex
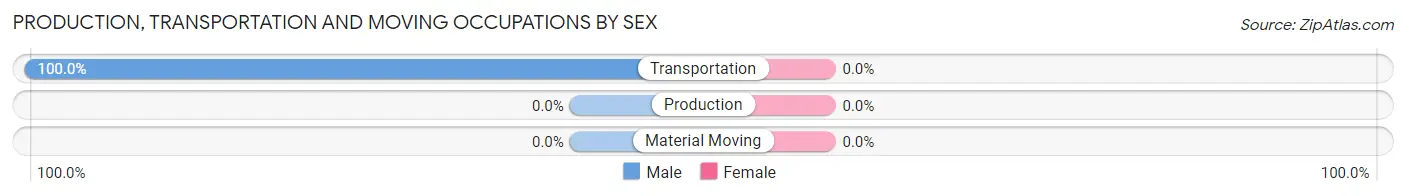
| Occupation | Male | Female |
| Production | 0 (0.0%) | 0 (0.0%) |
| Transportation | 16 (100.0%) | 0 (0.0%) |
| Material Moving | 0 (0.0%) | 0 (0.0%) |
| Total (Category) | 16 (100.0%) | 0 (0.0%) |
| Total (Overall) | 40 (49.4%) | 41 (50.6%) |
Employment Industries by Sex in LaPlace
Employment Industries in LaPlace
The major employment industries in LaPlace include Educational Services (29 | 35.8%), Retail Trade (21 | 25.9%), Construction (16 | 19.8%), and Health Care & Social Assistance (15 | 18.5%).
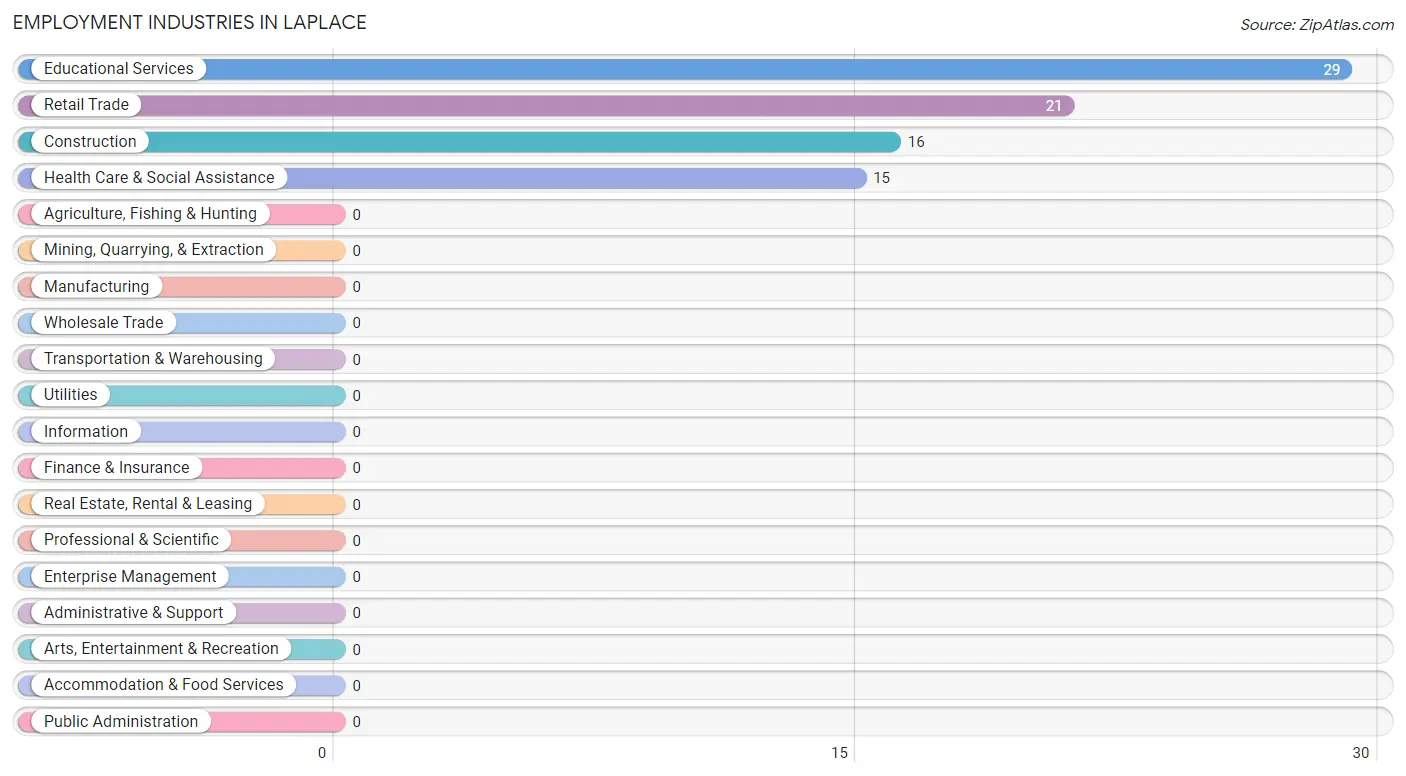
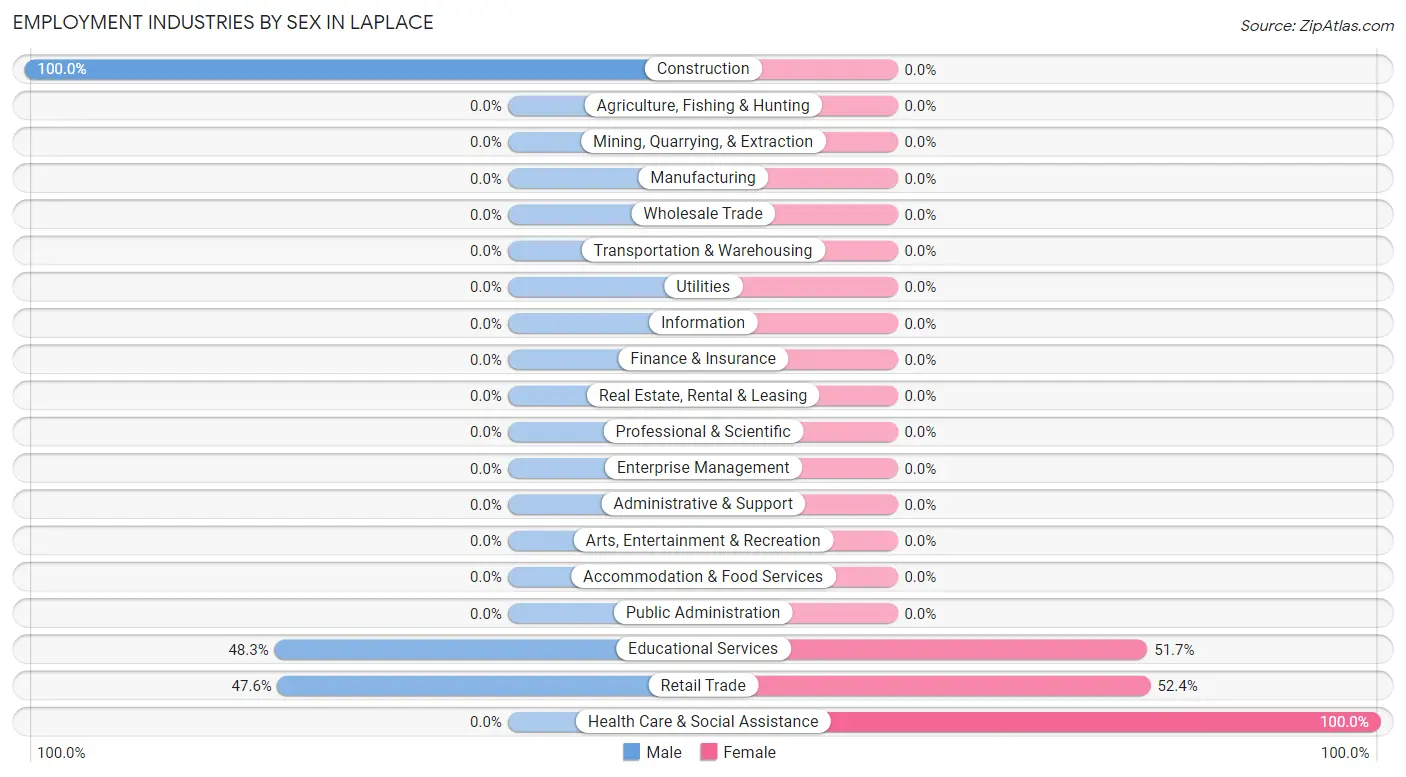
Employment Industries by Sex in LaPlace
The LaPlace industries that see more men than women are Construction (100.0%), Educational Services (48.3%), and Retail Trade (47.6%), whereas the industries that tend to have a higher number of women are Health Care & Social Assistance (100.0%), Retail Trade (52.4%), and Educational Services (51.7%).
| Industry | Male | Female |
| Agriculture, Fishing & Hunting | 0 (0.0%) | 0 (0.0%) |
| Mining, Quarrying, & Extraction | 0 (0.0%) | 0 (0.0%) |
| Construction | 16 (100.0%) | 0 (0.0%) |
| Manufacturing | 0 (0.0%) | 0 (0.0%) |
| Wholesale Trade | 0 (0.0%) | 0 (0.0%) |
| Retail Trade | 10 (47.6%) | 11 (52.4%) |
| Transportation & Warehousing | 0 (0.0%) | 0 (0.0%) |
| Utilities | 0 (0.0%) | 0 (0.0%) |
| Information | 0 (0.0%) | 0 (0.0%) |
| Finance & Insurance | 0 (0.0%) | 0 (0.0%) |
| Real Estate, Rental & Leasing | 0 (0.0%) | 0 (0.0%) |
| Professional & Scientific | 0 (0.0%) | 0 (0.0%) |
| Enterprise Management | 0 (0.0%) | 0 (0.0%) |
| Administrative & Support | 0 (0.0%) | 0 (0.0%) |
| Educational Services | 14 (48.3%) | 15 (51.7%) |
| Health Care & Social Assistance | 0 (0.0%) | 15 (100.0%) |
| Arts, Entertainment & Recreation | 0 (0.0%) | 0 (0.0%) |
| Accommodation & Food Services | 0 (0.0%) | 0 (0.0%) |
| Public Administration | 0 (0.0%) | 0 (0.0%) |
| Total | 40 (49.4%) | 41 (50.6%) |
Education in LaPlace
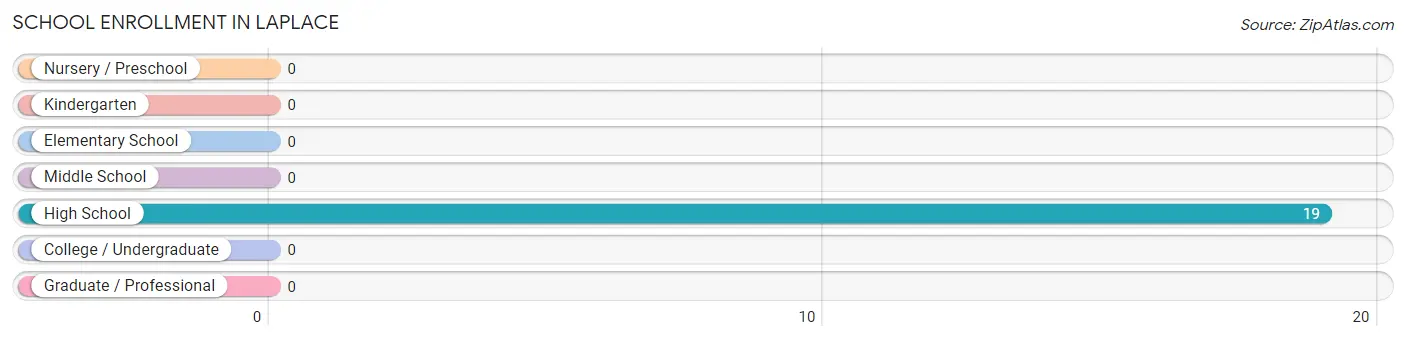
School Enrollment in LaPlace
| School Level | # Students | % Students |
| Nursery / Preschool | 0 | 0.0% |
| Kindergarten | 0 | 0.0% |
| Elementary School | 0 | 0.0% |
| Middle School | 0 | 0.0% |
| High School | 19 | 100.0% |
| College / Undergraduate | 0 | 0.0% |
| Graduate / Professional | 0 | 0.0% |
| Total | 19 | 100.0% |
School Enrollment by Age by Funding Source in LaPlace
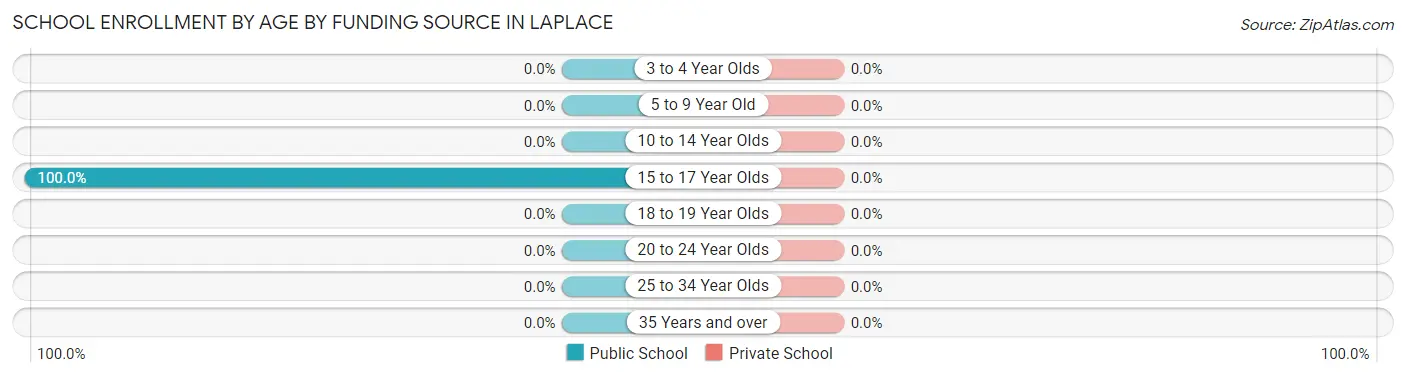
| Age Bracket | Public School | Private School |
| 3 to 4 Year Olds | 0 (0.0%) | 0 (0.0%) |
| 5 to 9 Year Old | 0 (0.0%) | 0 (0.0%) |
| 10 to 14 Year Olds | 0 (0.0%) | 0 (0.0%) |
| 15 to 17 Year Olds | 19 (100.0%) | 0 (0.0%) |
| 18 to 19 Year Olds | 0 (0.0%) | 0 (0.0%) |
| 20 to 24 Year Olds | 0 (0.0%) | 0 (0.0%) |
| 25 to 34 Year Olds | 0 (0.0%) | 0 (0.0%) |
| 35 Years and over | 0 (0.0%) | 0 (0.0%) |
| Total | 19 (100.0%) | 0 (0.0%) |
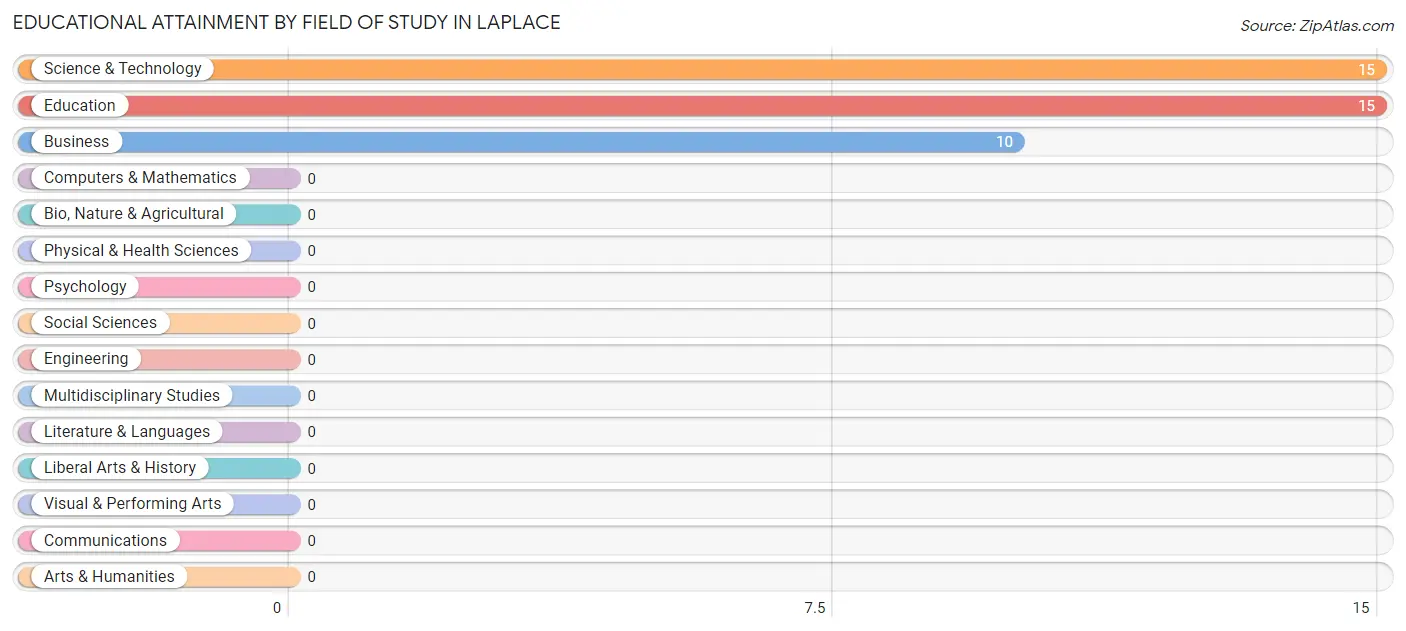
Educational Attainment by Field of Study in LaPlace
Science & technology (15 | 37.5%), education (15 | 37.5%), and business (10 | 25.0%) are the most common fields of study among 40 individuals in LaPlace who have obtained a bachelor's degree or higher.
| Field of Study | # Graduates | % Graduates |
| Computers & Mathematics | 0 | 0.0% |
| Bio, Nature & Agricultural | 0 | 0.0% |
| Physical & Health Sciences | 0 | 0.0% |
| Psychology | 0 | 0.0% |
| Social Sciences | 0 | 0.0% |
| Engineering | 0 | 0.0% |
| Multidisciplinary Studies | 0 | 0.0% |
| Science & Technology | 15 | 37.5% |
| Business | 10 | 25.0% |
| Education | 15 | 37.5% |
| Literature & Languages | 0 | 0.0% |
| Liberal Arts & History | 0 | 0.0% |
| Visual & Performing Arts | 0 | 0.0% |
| Communications | 0 | 0.0% |
| Arts & Humanities | 0 | 0.0% |
| Total | 40 | 100.0% |
Transportation & Commute in LaPlace
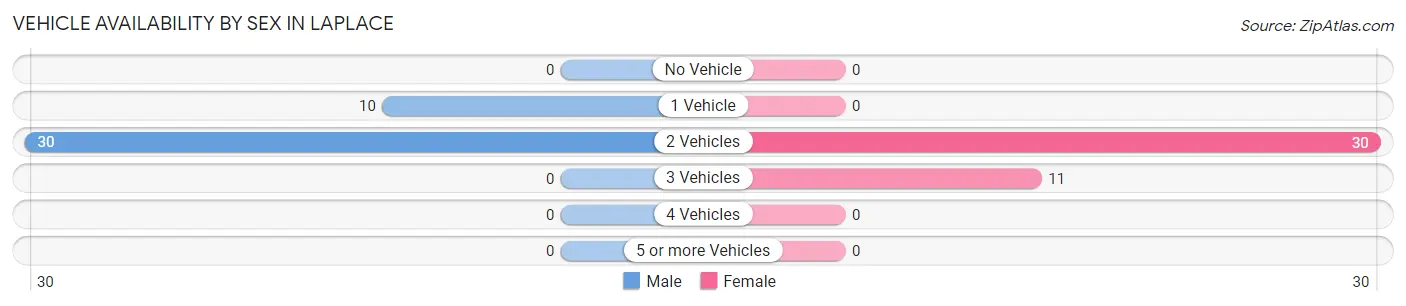
Vehicle Availability by Sex in LaPlace
The most prevalent vehicle ownership categories in LaPlace are males with 2 vehicles (30, accounting for 75.0%) and females with 2 vehicles (30, making up 73.2%).
| Vehicles Available | Male | Female |
| No Vehicle | 0 (0.0%) | 0 (0.0%) |
| 1 Vehicle | 10 (25.0%) | 0 (0.0%) |
| 2 Vehicles | 30 (75.0%) | 30 (73.2%) |
| 3 Vehicles | 0 (0.0%) | 11 (26.8%) |
| 4 Vehicles | 0 (0.0%) | 0 (0.0%) |
| 5 or more Vehicles | 0 (0.0%) | 0 (0.0%) |
| Total | 40 (100.0%) | 41 (100.0%) |
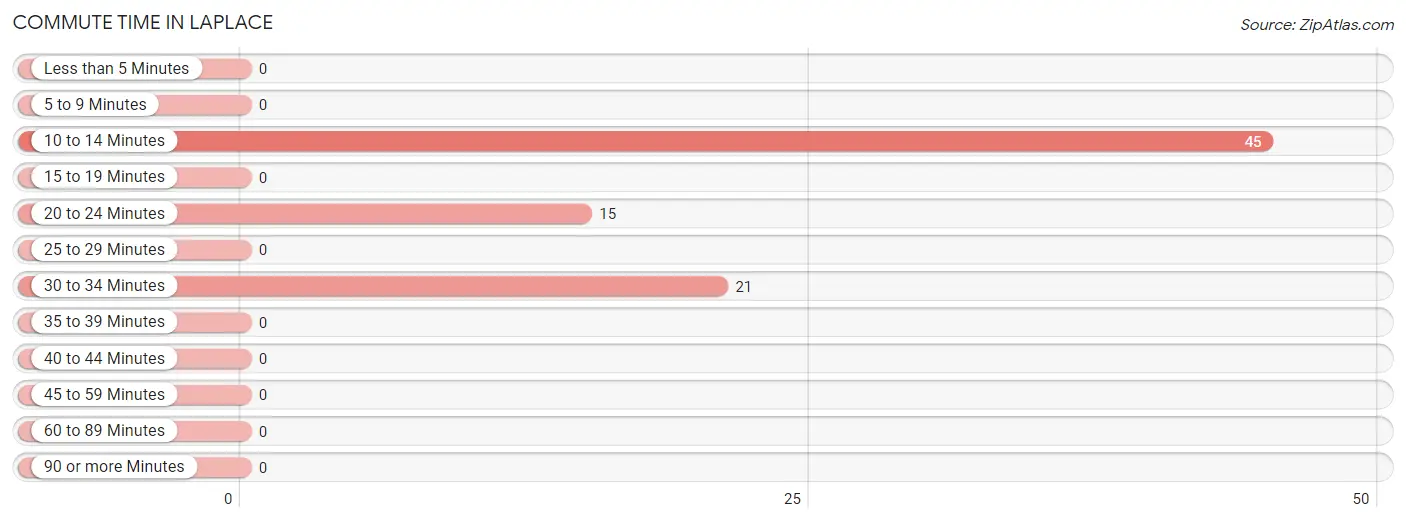
Commute Time in LaPlace
The most frequently occuring commute durations in LaPlace are 10 to 14 minutes (45 commuters, 55.6%), 30 to 34 minutes (21 commuters, 25.9%), and 20 to 24 minutes (15 commuters, 18.5%).
| Commute Time | # Commuters | % Commuters |
| Less than 5 Minutes | 0 | 0.0% |
| 5 to 9 Minutes | 0 | 0.0% |
| 10 to 14 Minutes | 45 | 55.6% |
| 15 to 19 Minutes | 0 | 0.0% |
| 20 to 24 Minutes | 15 | 18.5% |
| 25 to 29 Minutes | 0 | 0.0% |
| 30 to 34 Minutes | 21 | 25.9% |
| 35 to 39 Minutes | 0 | 0.0% |
| 40 to 44 Minutes | 0 | 0.0% |
| 45 to 59 Minutes | 0 | 0.0% |
| 60 to 89 Minutes | 0 | 0.0% |
| 90 or more Minutes | 0 | 0.0% |
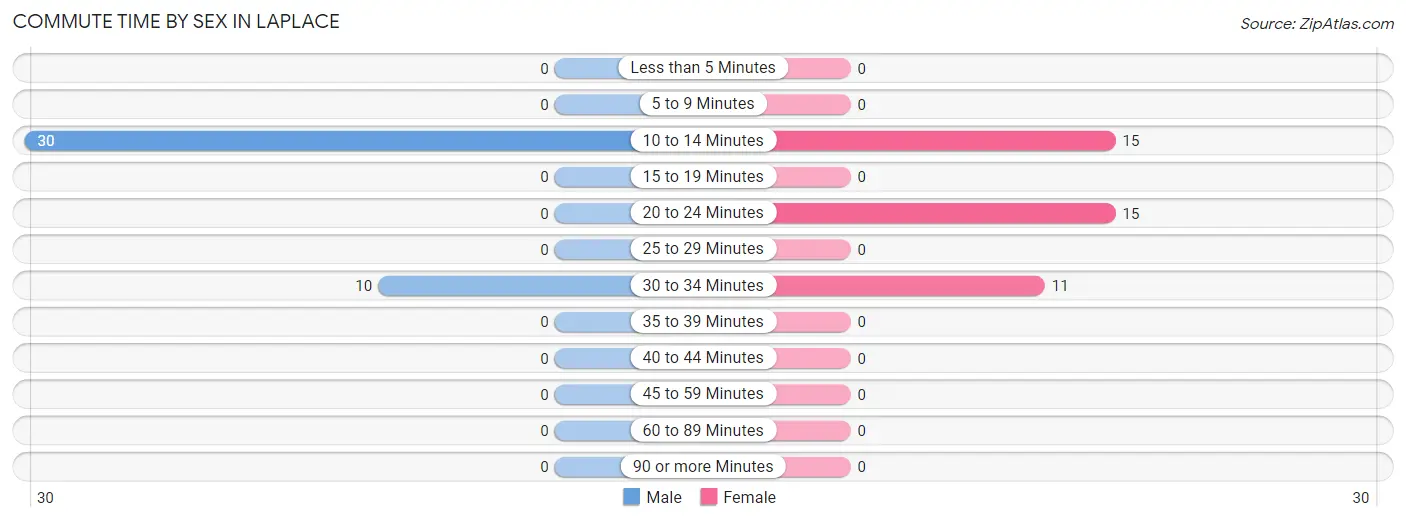
Commute Time by Sex in LaPlace
The most common commute times in LaPlace are 10 to 14 minutes (30 commuters, 75.0%) for males and 10 to 14 minutes (15 commuters, 36.6%) for females.
| Commute Time | Male | Female |
| Less than 5 Minutes | 0 (0.0%) | 0 (0.0%) |
| 5 to 9 Minutes | 0 (0.0%) | 0 (0.0%) |
| 10 to 14 Minutes | 30 (75.0%) | 15 (36.6%) |
| 15 to 19 Minutes | 0 (0.0%) | 0 (0.0%) |
| 20 to 24 Minutes | 0 (0.0%) | 15 (36.6%) |
| 25 to 29 Minutes | 0 (0.0%) | 0 (0.0%) |
| 30 to 34 Minutes | 10 (25.0%) | 11 (26.8%) |
| 35 to 39 Minutes | 0 (0.0%) | 0 (0.0%) |
| 40 to 44 Minutes | 0 (0.0%) | 0 (0.0%) |
| 45 to 59 Minutes | 0 (0.0%) | 0 (0.0%) |
| 60 to 89 Minutes | 0 (0.0%) | 0 (0.0%) |
| 90 or more Minutes | 0 (0.0%) | 0 (0.0%) |
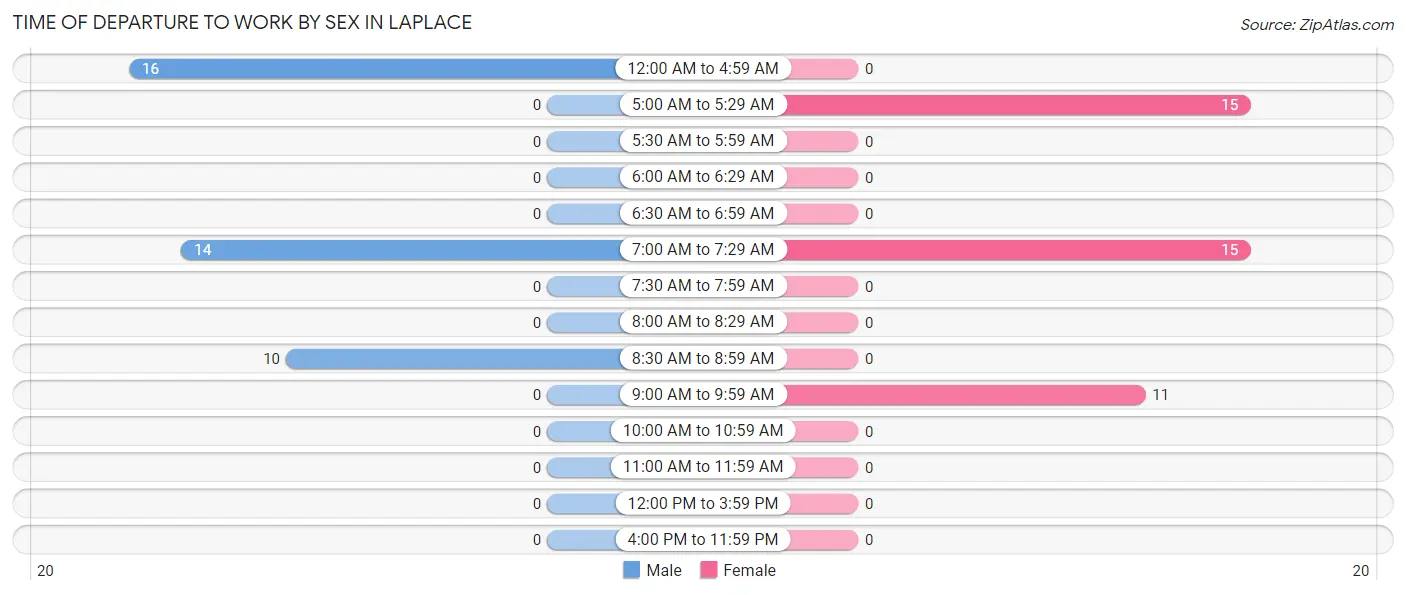
Time of Departure to Work by Sex in LaPlace
The most frequent times of departure to work in LaPlace are 12:00 AM to 4:59 AM (16, 40.0%) for males and 5:00 AM to 5:29 AM (15, 36.6%) for females.
| Time of Departure | Male | Female |
| 12:00 AM to 4:59 AM | 16 (40.0%) | 0 (0.0%) |
| 5:00 AM to 5:29 AM | 0 (0.0%) | 15 (36.6%) |
| 5:30 AM to 5:59 AM | 0 (0.0%) | 0 (0.0%) |
| 6:00 AM to 6:29 AM | 0 (0.0%) | 0 (0.0%) |
| 6:30 AM to 6:59 AM | 0 (0.0%) | 0 (0.0%) |
| 7:00 AM to 7:29 AM | 14 (35.0%) | 15 (36.6%) |
| 7:30 AM to 7:59 AM | 0 (0.0%) | 0 (0.0%) |
| 8:00 AM to 8:29 AM | 0 (0.0%) | 0 (0.0%) |
| 8:30 AM to 8:59 AM | 10 (25.0%) | 0 (0.0%) |
| 9:00 AM to 9:59 AM | 0 (0.0%) | 11 (26.8%) |
| 10:00 AM to 10:59 AM | 0 (0.0%) | 0 (0.0%) |
| 11:00 AM to 11:59 AM | 0 (0.0%) | 0 (0.0%) |
| 12:00 PM to 3:59 PM | 0 (0.0%) | 0 (0.0%) |
| 4:00 PM to 11:59 PM | 0 (0.0%) | 0 (0.0%) |
| Total | 40 (100.0%) | 41 (100.0%) |
Housing Occupancy in LaPlace
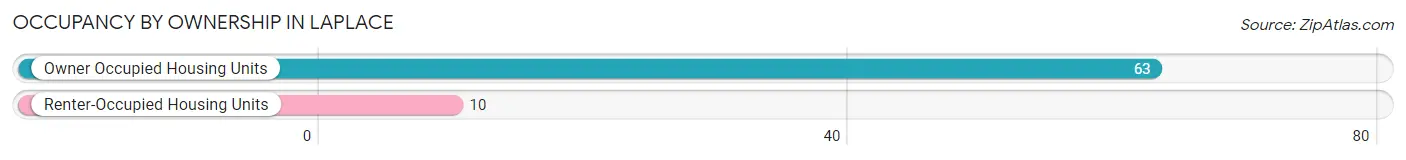
Occupancy by Ownership in LaPlace
Of the total 73 dwellings in LaPlace, owner-occupied units account for 63 (86.3%), while renter-occupied units make up 10 (13.7%).
| Occupancy | # Housing Units | % Housing Units |
| Owner Occupied Housing Units | 63 | 86.3% |
| Renter-Occupied Housing Units | 10 | 13.7% |
| Total Occupied Housing Units | 73 | 100.0% |
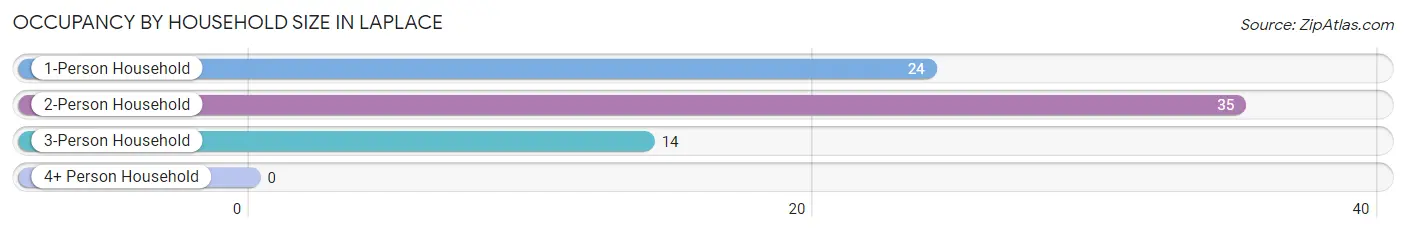
Occupancy by Household Size in LaPlace
| Household Size | # Housing Units | % Housing Units |
| 1-Person Household | 24 | 32.9% |
| 2-Person Household | 35 | 47.9% |
| 3-Person Household | 14 | 19.2% |
| 4+ Person Household | 0 | 0.0% |
| Total Housing Units | 73 | 100.0% |
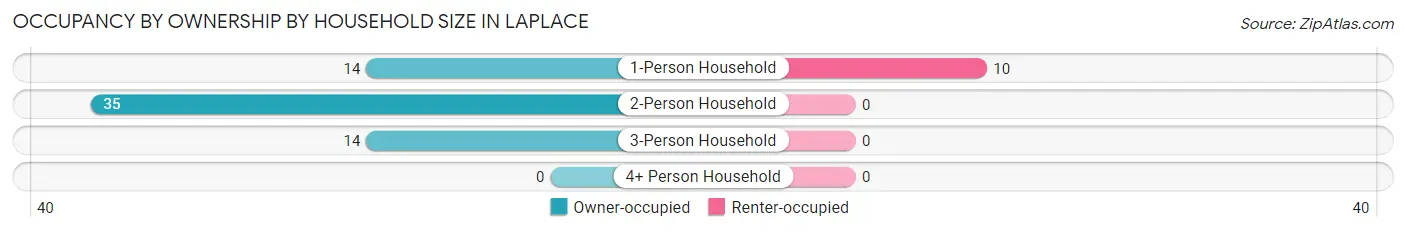
Occupancy by Ownership by Household Size in LaPlace
| Household Size | Owner-occupied | Renter-occupied |
| 1-Person Household | 14 (58.3%) | 10 (41.7%) |
| 2-Person Household | 35 (100.0%) | 0 (0.0%) |
| 3-Person Household | 14 (100.0%) | 0 (0.0%) |
| 4+ Person Household | 0 (0.0%) | 0 (0.0%) |
| Total Housing Units | 63 (86.3%) | 10 (13.7%) |
Occupancy by Educational Attainment in LaPlace
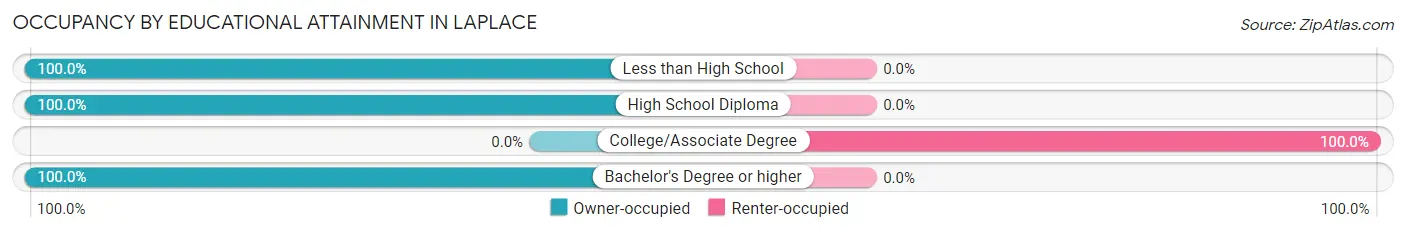
| Household Size | Owner-occupied | Renter-occupied |
| Less than High School | 14 (100.0%) | 0 (0.0%) |
| High School Diploma | 39 (100.0%) | 0 (0.0%) |
| College/Associate Degree | 0 (0.0%) | 10 (100.0%) |
| Bachelor's Degree or higher | 10 (100.0%) | 0 (0.0%) |
Occupancy by Age of Householder in LaPlace
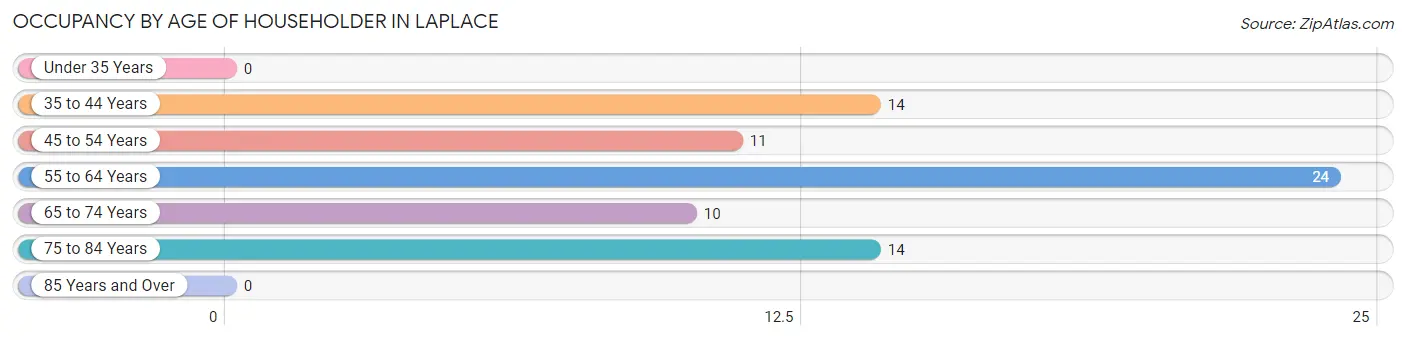
| Age Bracket | # Households | % Households |
| Under 35 Years | 0 | 0.0% |
| 35 to 44 Years | 14 | 19.2% |
| 45 to 54 Years | 11 | 15.1% |
| 55 to 64 Years | 24 | 32.9% |
| 65 to 74 Years | 10 | 13.7% |
| 75 to 84 Years | 14 | 19.2% |
| 85 Years and Over | 0 | 0.0% |
| Total | 73 | 100.0% |
Housing Finances in LaPlace
Median Income by Occupancy in LaPlace
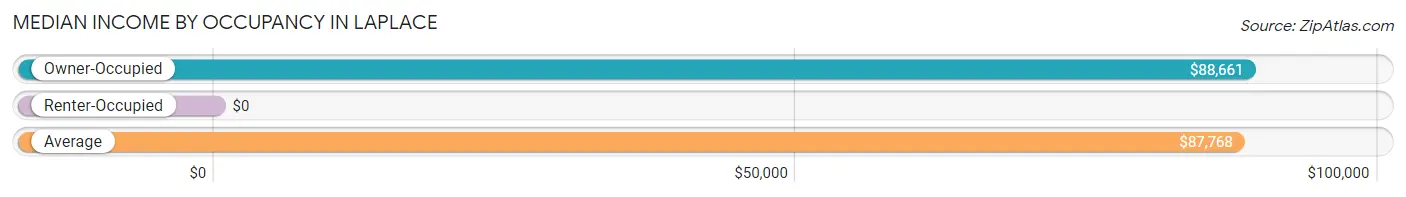
| Occupancy Type | # Households | Median Income |
| Owner-Occupied | 63 (86.3%) | $88,661 |
| Renter-Occupied | 10 (13.7%) | $0 |
| Average | 73 (100.0%) | $87,768 |
Occupancy by Householder Income Bracket in LaPlace
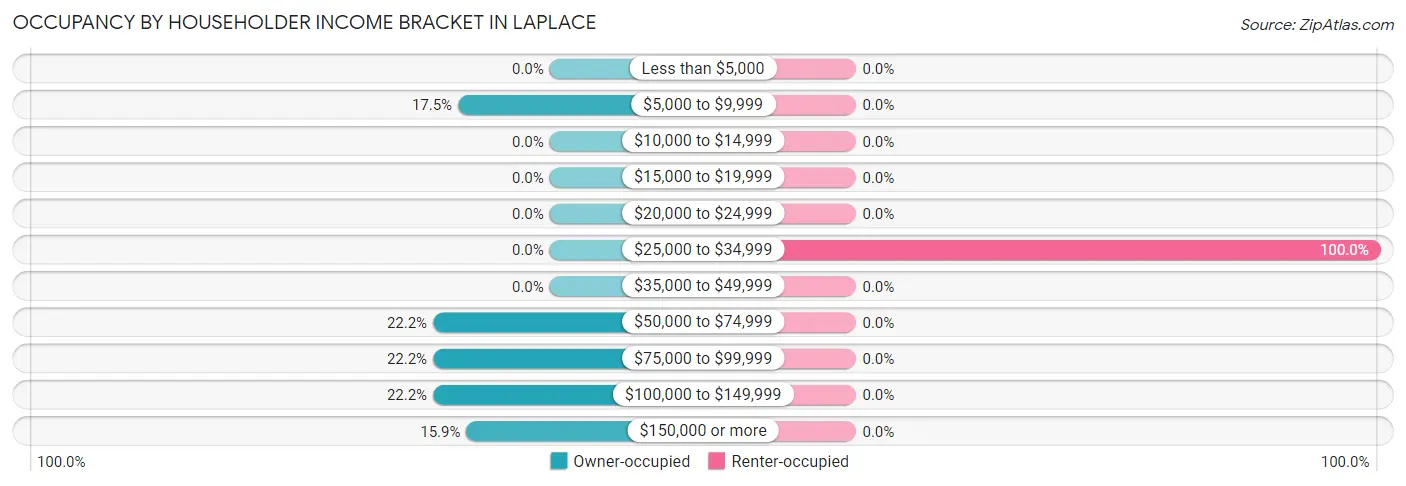
| Income Bracket | Owner-occupied | Renter-occupied |
| Less than $5,000 | 0 (0.0%) | 0 (0.0%) |
| $5,000 to $9,999 | 11 (17.5%) | 0 (0.0%) |
| $10,000 to $14,999 | 0 (0.0%) | 0 (0.0%) |
| $15,000 to $19,999 | 0 (0.0%) | 0 (0.0%) |
| $20,000 to $24,999 | 0 (0.0%) | 0 (0.0%) |
| $25,000 to $34,999 | 0 (0.0%) | 10 (100.0%) |
| $35,000 to $49,999 | 0 (0.0%) | 0 (0.0%) |
| $50,000 to $74,999 | 14 (22.2%) | 0 (0.0%) |
| $75,000 to $99,999 | 14 (22.2%) | 0 (0.0%) |
| $100,000 to $149,999 | 14 (22.2%) | 0 (0.0%) |
| $150,000 or more | 10 (15.9%) | 0 (0.0%) |
| Total | 63 (100.0%) | 10 (100.0%) |
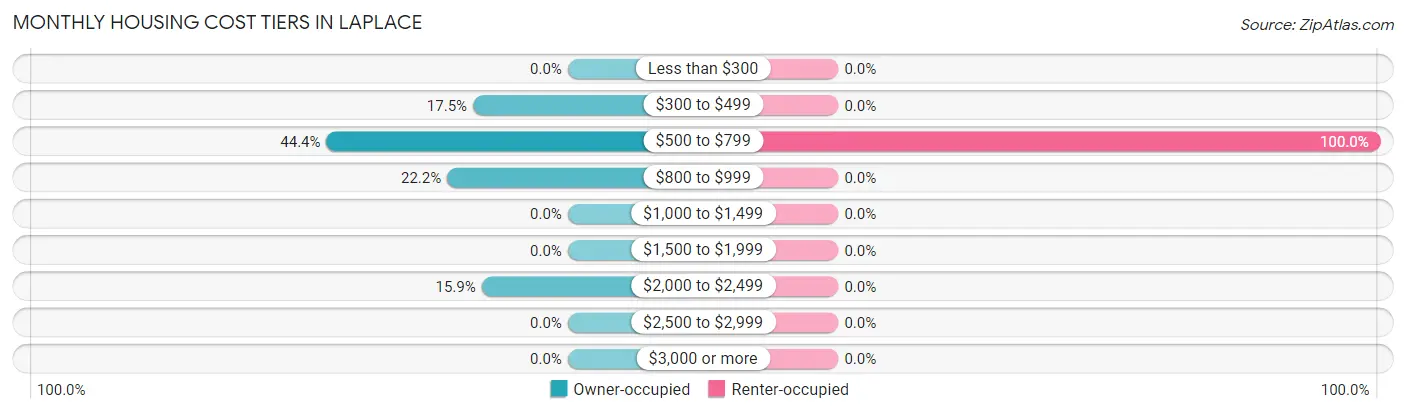
Monthly Housing Cost Tiers in LaPlace
| Monthly Cost | Owner-occupied | Renter-occupied |
| Less than $300 | 0 (0.0%) | 0 (0.0%) |
| $300 to $499 | 11 (17.5%) | 0 (0.0%) |
| $500 to $799 | 28 (44.4%) | 10 (100.0%) |
| $800 to $999 | 14 (22.2%) | 0 (0.0%) |
| $1,000 to $1,499 | 0 (0.0%) | 0 (0.0%) |
| $1,500 to $1,999 | 0 (0.0%) | 0 (0.0%) |
| $2,000 to $2,499 | 10 (15.9%) | 0 (0.0%) |
| $2,500 to $2,999 | 0 (0.0%) | 0 (0.0%) |
| $3,000 or more | 0 (0.0%) | 0 (0.0%) |
| Total | 63 (100.0%) | 10 (100.0%) |
Physical Housing Characteristics in LaPlace
Housing Structures in LaPlace
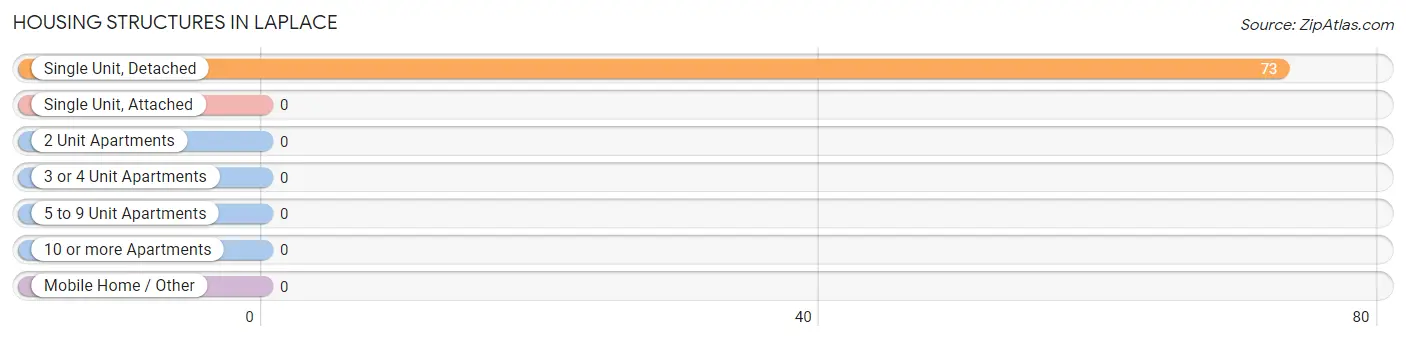
| Structure Type | # Housing Units | % Housing Units |
| Single Unit, Detached | 73 | 100.0% |
| Single Unit, Attached | 0 | 0.0% |
| 2 Unit Apartments | 0 | 0.0% |
| 3 or 4 Unit Apartments | 0 | 0.0% |
| 5 to 9 Unit Apartments | 0 | 0.0% |
| 10 or more Apartments | 0 | 0.0% |
| Mobile Home / Other | 0 | 0.0% |
| Total | 73 | 100.0% |
Housing Structures by Occupancy in LaPlace
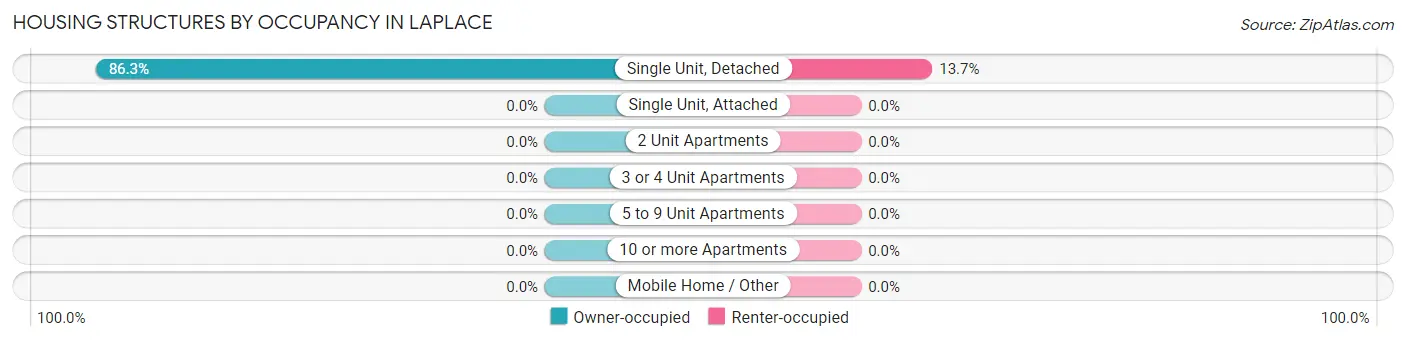
| Structure Type | Owner-occupied | Renter-occupied |
| Single Unit, Detached | 63 (86.3%) | 10 (13.7%) |
| Single Unit, Attached | 0 (0.0%) | 0 (0.0%) |
| 2 Unit Apartments | 0 (0.0%) | 0 (0.0%) |
| 3 or 4 Unit Apartments | 0 (0.0%) | 0 (0.0%) |
| 5 to 9 Unit Apartments | 0 (0.0%) | 0 (0.0%) |
| 10 or more Apartments | 0 (0.0%) | 0 (0.0%) |
| Mobile Home / Other | 0 (0.0%) | 0 (0.0%) |
| Total | 63 (86.3%) | 10 (13.7%) |
Housing Structures by Number of Rooms in LaPlace
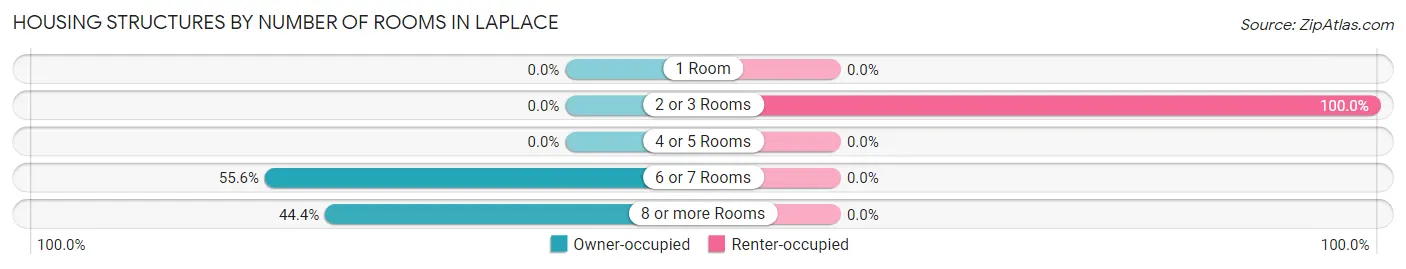
| Number of Rooms | Owner-occupied | Renter-occupied |
| 1 Room | 0 (0.0%) | 0 (0.0%) |
| 2 or 3 Rooms | 0 (0.0%) | 10 (100.0%) |
| 4 or 5 Rooms | 0 (0.0%) | 0 (0.0%) |
| 6 or 7 Rooms | 35 (55.6%) | 0 (0.0%) |
| 8 or more Rooms | 28 (44.4%) | 0 (0.0%) |
| Total | 63 (100.0%) | 10 (100.0%) |
Housing Structure by Heating Type in LaPlace
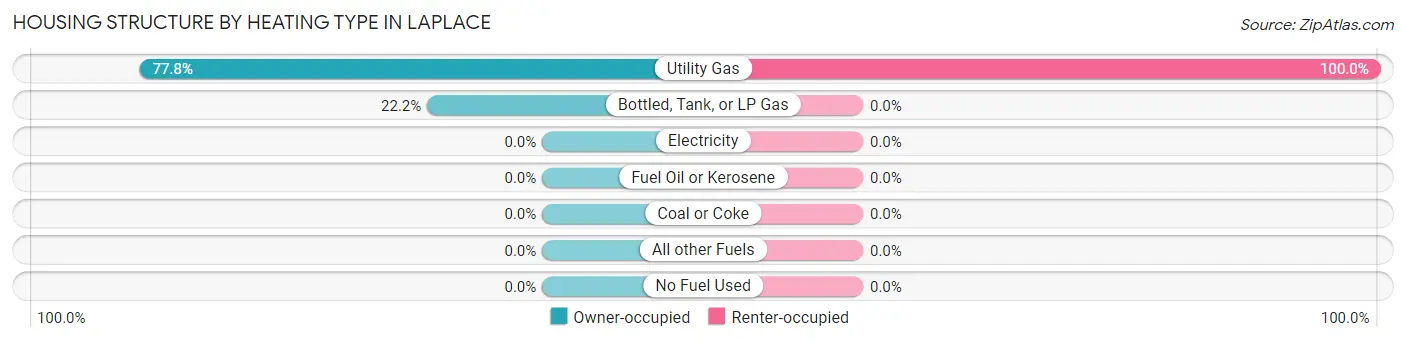
| Heating Type | Owner-occupied | Renter-occupied |
| Utility Gas | 49 (77.8%) | 10 (100.0%) |
| Bottled, Tank, or LP Gas | 14 (22.2%) | 0 (0.0%) |
| Electricity | 0 (0.0%) | 0 (0.0%) |
| Fuel Oil or Kerosene | 0 (0.0%) | 0 (0.0%) |
| Coal or Coke | 0 (0.0%) | 0 (0.0%) |
| All other Fuels | 0 (0.0%) | 0 (0.0%) |
| No Fuel Used | 0 (0.0%) | 0 (0.0%) |
| Total | 63 (100.0%) | 10 (100.0%) |
Household Vehicle Usage in LaPlace
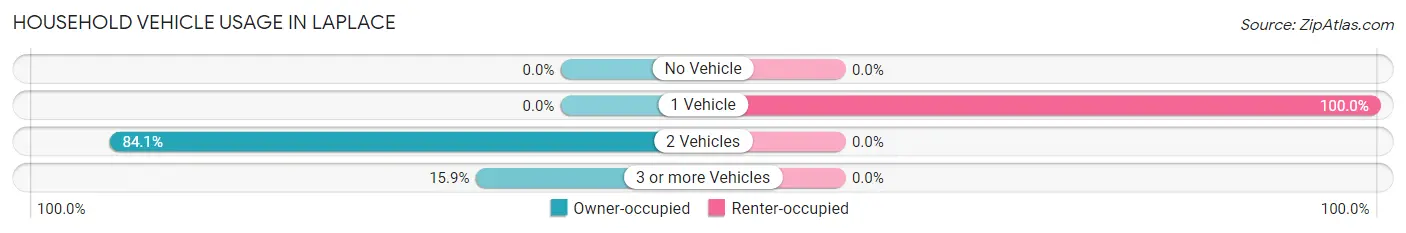
| Vehicles per Household | Owner-occupied | Renter-occupied |
| No Vehicle | 0 (0.0%) | 0 (0.0%) |
| 1 Vehicle | 0 (0.0%) | 10 (100.0%) |
| 2 Vehicles | 53 (84.1%) | 0 (0.0%) |
| 3 or more Vehicles | 10 (15.9%) | 0 (0.0%) |
| Total | 63 (100.0%) | 10 (100.0%) |
Real Estate & Mortgages in LaPlace
Real Estate and Mortgage Overview in LaPlace
| Characteristic | Without Mortgage | With Mortgage |
| Housing Units | 39 | 24 |
| Median Property Value | $76,100 | $0 |
| Median Household Income | $56,518 | $10 |
| Monthly Housing Costs | $530 | $0 |
| Real Estate Taxes | $956 | $0 |
Property Value by Mortgage Status in LaPlace
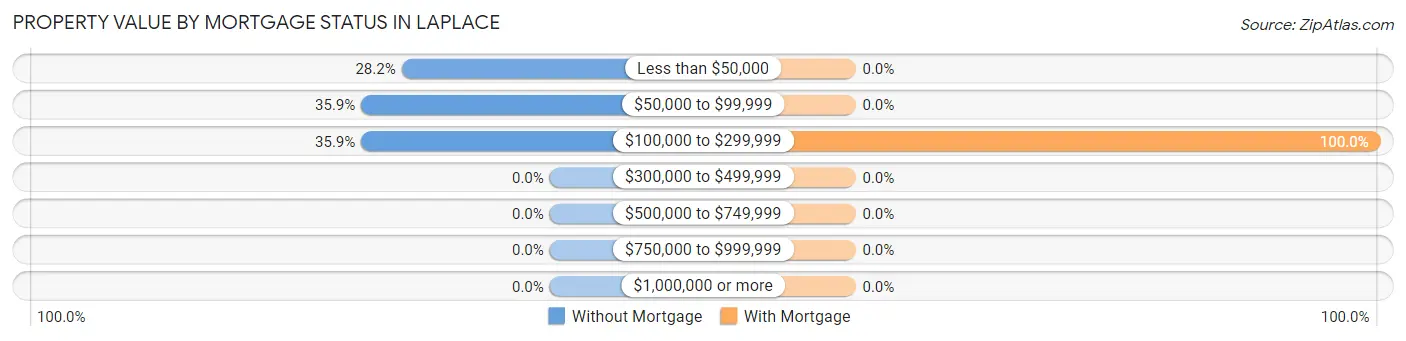
| Property Value | Without Mortgage | With Mortgage |
| Less than $50,000 | 11 (28.2%) | 0 (0.0%) |
| $50,000 to $99,999 | 14 (35.9%) | 0 (0.0%) |
| $100,000 to $299,999 | 14 (35.9%) | 24 (100.0%) |
| $300,000 to $499,999 | 0 (0.0%) | 0 (0.0%) |
| $500,000 to $749,999 | 0 (0.0%) | 0 (0.0%) |
| $750,000 to $999,999 | 0 (0.0%) | 0 (0.0%) |
| $1,000,000 or more | 0 (0.0%) | 0 (0.0%) |
| Total | 39 (100.0%) | 24 (100.0%) |
Household Income by Mortgage Status in LaPlace
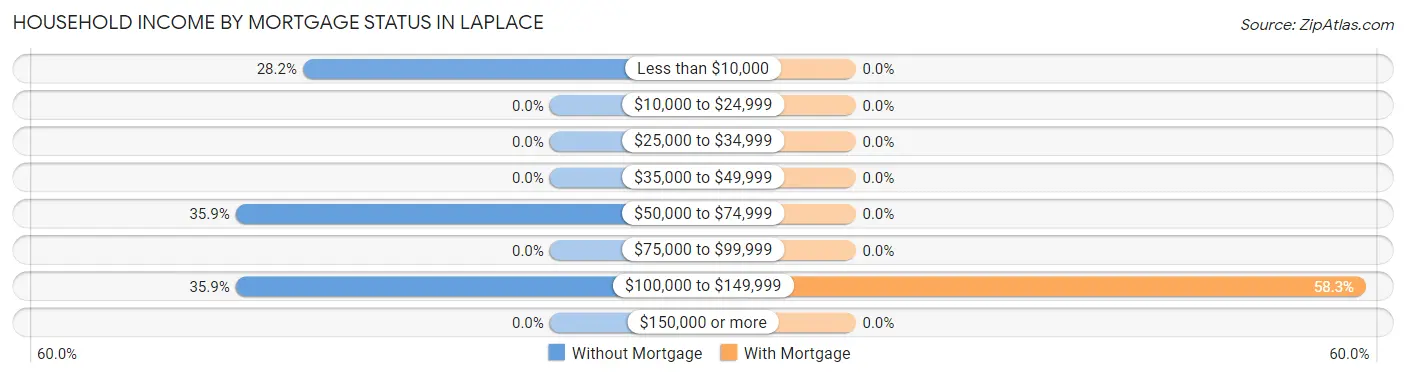
| Household Income | Without Mortgage | With Mortgage |
| Less than $10,000 | 11 (28.2%) | 0 (0.0%) |
| $10,000 to $24,999 | 0 (0.0%) | 0 (0.0%) |
| $25,000 to $34,999 | 0 (0.0%) | 0 (0.0%) |
| $35,000 to $49,999 | 0 (0.0%) | 0 (0.0%) |
| $50,000 to $74,999 | 14 (35.9%) | 0 (0.0%) |
| $75,000 to $99,999 | 0 (0.0%) | 0 (0.0%) |
| $100,000 to $149,999 | 14 (35.9%) | 14 (58.3%) |
| $150,000 or more | 0 (0.0%) | 0 (0.0%) |
| Total | 39 (100.0%) | 24 (100.0%) |
Property Value to Household Income Ratio in LaPlace
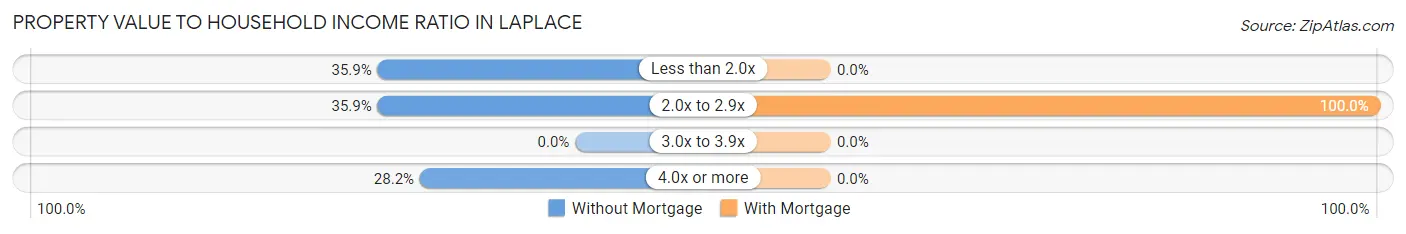
| Value-to-Income Ratio | Without Mortgage | With Mortgage |
| Less than 2.0x | 14 (35.9%) | 0 (0.0%) |
| 2.0x to 2.9x | 14 (35.9%) | 24 (100.0%) |
| 3.0x to 3.9x | 0 (0.0%) | 0 (0.0%) |
| 4.0x or more | 11 (28.2%) | 0 (0.0%) |
| Total | 39 (100.0%) | 24 (100.0%) |
Real Estate Taxes by Mortgage Status in LaPlace
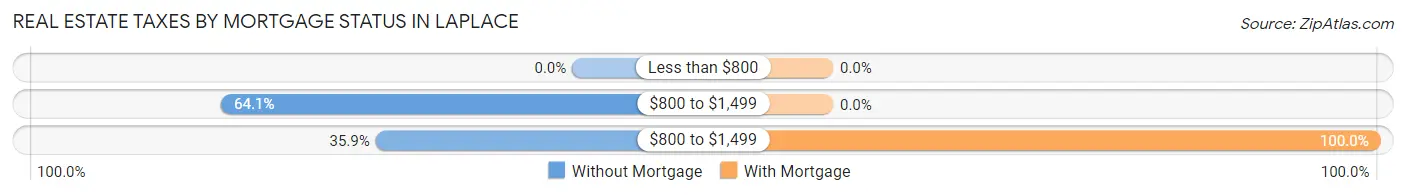
| Property Taxes | Without Mortgage | With Mortgage |
| Less than $800 | 0 (0.0%) | 0 (0.0%) |
| $800 to $1,499 | 25 (64.1%) | 0 (0.0%) |
| $800 to $1,499 | 14 (35.9%) | 24 (100.0%) |
| Total | 39 (100.0%) | 24 (100.0%) |
Health & Disability in LaPlace
Health Insurance Coverage by Age in LaPlace
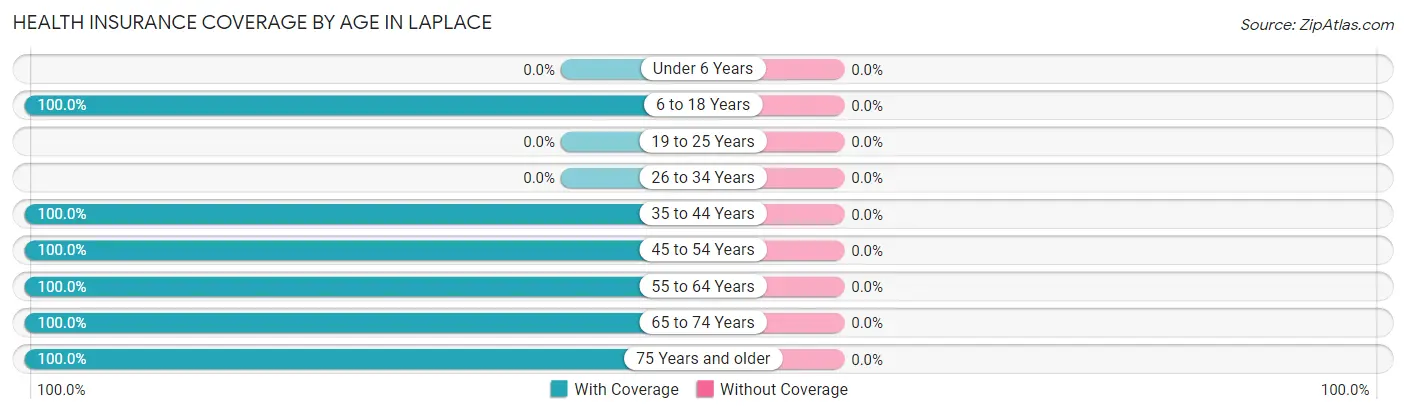
| Age Bracket | With Coverage | Without Coverage |
| Under 6 Years | 0 (0.0%) | 0 (0.0%) |
| 6 to 18 Years | 35 (100.0%) | 0 (0.0%) |
| 19 to 25 Years | 0 (0.0%) | 0 (0.0%) |
| 26 to 34 Years | 0 (0.0%) | 0 (0.0%) |
| 35 to 44 Years | 29 (100.0%) | 0 (0.0%) |
| 45 to 54 Years | 11 (100.0%) | 0 (0.0%) |
| 55 to 64 Years | 39 (100.0%) | 0 (0.0%) |
| 65 to 74 Years | 21 (100.0%) | 0 (0.0%) |
| 75 Years and older | 14 (100.0%) | 0 (0.0%) |
| Total | 149 (100.0%) | 0 (0.0%) |
Health Insurance Coverage by Citizenship Status in LaPlace
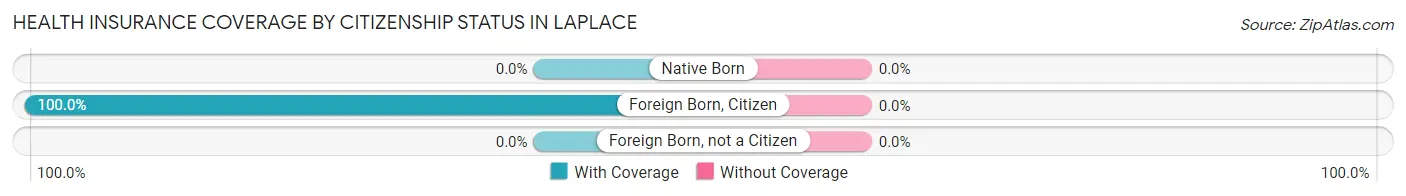
| Citizenship Status | With Coverage | Without Coverage |
| Native Born | 0 (0.0%) | 0 (0.0%) |
| Foreign Born, Citizen | 35 (100.0%) | 0 (0.0%) |
| Foreign Born, not a Citizen | 0 (0.0%) | 0 (0.0%) |
Health Insurance Coverage by Household Income in LaPlace
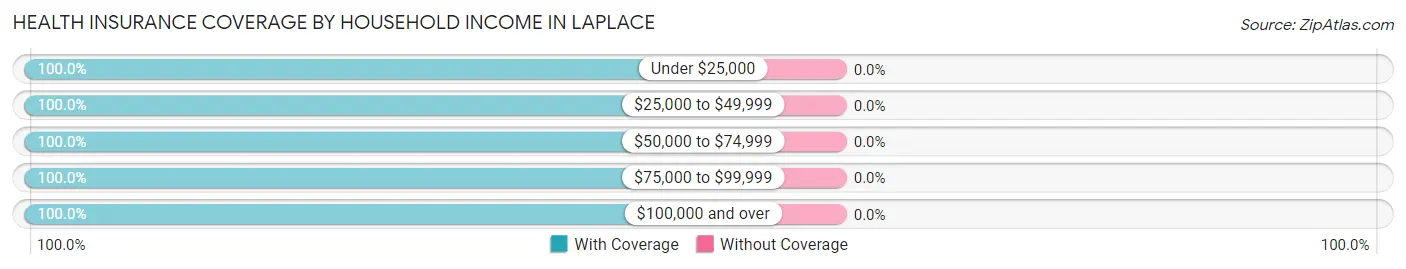
| Household Income | With Coverage | Without Coverage |
| Under $25,000 | 27 (100.0%) | 0 (0.0%) |
| $25,000 to $49,999 | 10 (100.0%) | 0 (0.0%) |
| $50,000 to $74,999 | 14 (100.0%) | 0 (0.0%) |
| $75,000 to $99,999 | 29 (100.0%) | 0 (0.0%) |
| $100,000 and over | 69 (100.0%) | 0 (0.0%) |
Public vs Private Health Insurance Coverage by Age in LaPlace
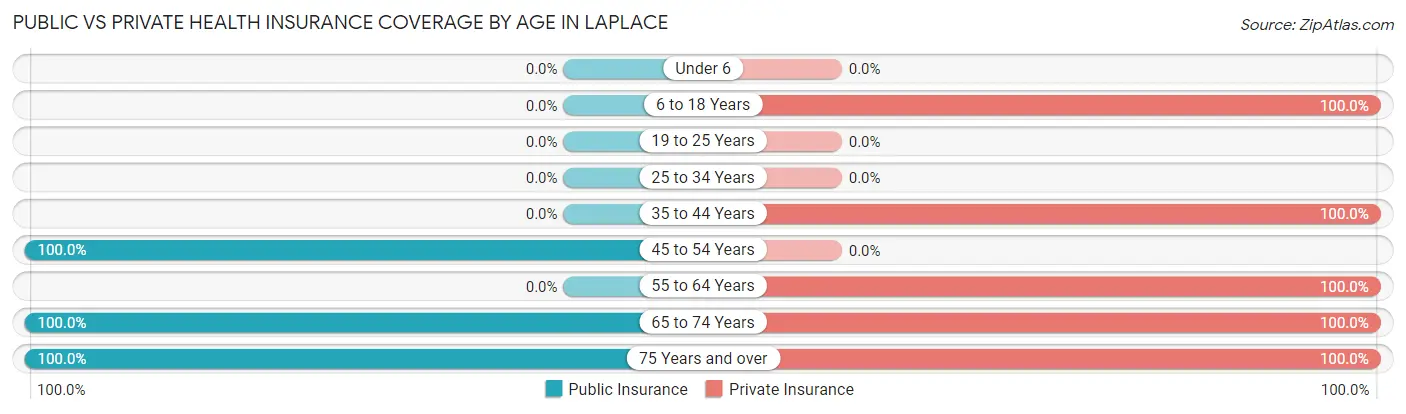
| Age Bracket | Public Insurance | Private Insurance |
| Under 6 | 0 (0.0%) | 0 (0.0%) |
| 6 to 18 Years | 0 (0.0%) | 35 (100.0%) |
| 19 to 25 Years | 0 (0.0%) | 0 (0.0%) |
| 25 to 34 Years | 0 (0.0%) | 0 (0.0%) |
| 35 to 44 Years | 0 (0.0%) | 29 (100.0%) |
| 45 to 54 Years | 11 (100.0%) | 0 (0.0%) |
| 55 to 64 Years | 0 (0.0%) | 39 (100.0%) |
| 65 to 74 Years | 21 (100.0%) | 21 (100.0%) |
| 75 Years and over | 14 (100.0%) | 14 (100.0%) |
| Total | 46 (30.9%) | 138 (92.6%) |
Disability Status by Sex by Age in LaPlace

| Age Bracket | Male | Female |
| Under 5 Years | 0 (0.0%) | 0 (0.0%) |
| 5 to 17 Years | 0 (0.0%) | 0 (0.0%) |
| 18 to 34 Years | 0 (0.0%) | 0 (0.0%) |
| 35 to 64 Years | 0 (0.0%) | 0 (0.0%) |
| 65 to 74 Years | 0 (0.0%) | 11 (100.0%) |
| 75 Years and over | 0 (0.0%) | 0 (0.0%) |
Disability Class by Sex by Age in LaPlace
Disability Class: Hearing Difficulty
| Age Bracket | Male | Female |
| Under 5 Years | 0 (0.0%) | 0 (0.0%) |
| 5 to 17 Years | 0 (0.0%) | 0 (0.0%) |
| 18 to 34 Years | 0 (0.0%) | 0 (0.0%) |
| 35 to 64 Years | 0 (0.0%) | 0 (0.0%) |
| 65 to 74 Years | 0 (0.0%) | 0 (0.0%) |
| 75 Years and over | 0 (0.0%) | 0 (0.0%) |
Disability Class: Vision Difficulty
| Age Bracket | Male | Female |
| Under 5 Years | 0 (0.0%) | 0 (0.0%) |
| 5 to 17 Years | 0 (0.0%) | 0 (0.0%) |
| 18 to 34 Years | 0 (0.0%) | 0 (0.0%) |
| 35 to 64 Years | 0 (0.0%) | 0 (0.0%) |
| 65 to 74 Years | 0 (0.0%) | 0 (0.0%) |
| 75 Years and over | 0 (0.0%) | 0 (0.0%) |
Disability Class: Cognitive Difficulty
| Age Bracket | Male | Female |
| 5 to 17 Years | 0 (0.0%) | 0 (0.0%) |
| 18 to 34 Years | 0 (0.0%) | 0 (0.0%) |
| 35 to 64 Years | 0 (0.0%) | 0 (0.0%) |
| 65 to 74 Years | 0 (0.0%) | 0 (0.0%) |
| 75 Years and over | 0 (0.0%) | 0 (0.0%) |
Disability Class: Ambulatory Difficulty
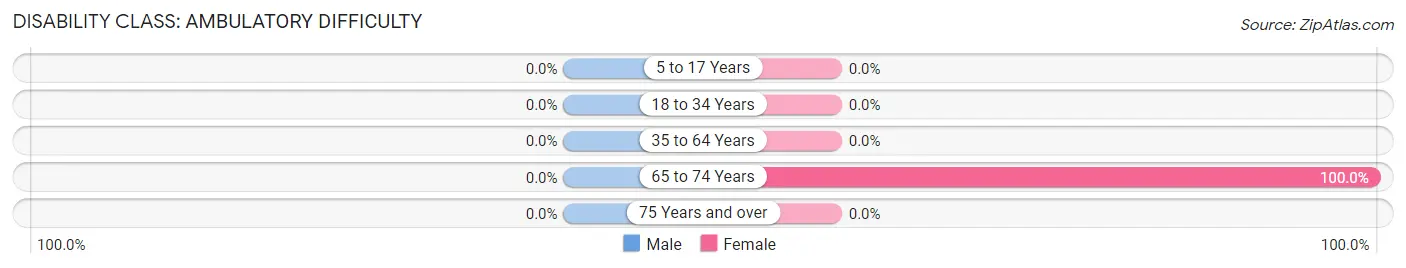
| Age Bracket | Male | Female |
| 5 to 17 Years | 0 (0.0%) | 0 (0.0%) |
| 18 to 34 Years | 0 (0.0%) | 0 (0.0%) |
| 35 to 64 Years | 0 (0.0%) | 0 (0.0%) |
| 65 to 74 Years | 0 (0.0%) | 11 (100.0%) |
| 75 Years and over | 0 (0.0%) | 0 (0.0%) |
Disability Class: Self-Care Difficulty

| Age Bracket | Male | Female |
| 5 to 17 Years | 0 (0.0%) | 0 (0.0%) |
| 18 to 34 Years | 0 (0.0%) | 0 (0.0%) |
| 35 to 64 Years | 0 (0.0%) | 0 (0.0%) |
| 65 to 74 Years | 0 (0.0%) | 0 (0.0%) |
| 75 Years and over | 0 (0.0%) | 0 (0.0%) |
Technology Access in LaPlace
Computing Device Access in LaPlace
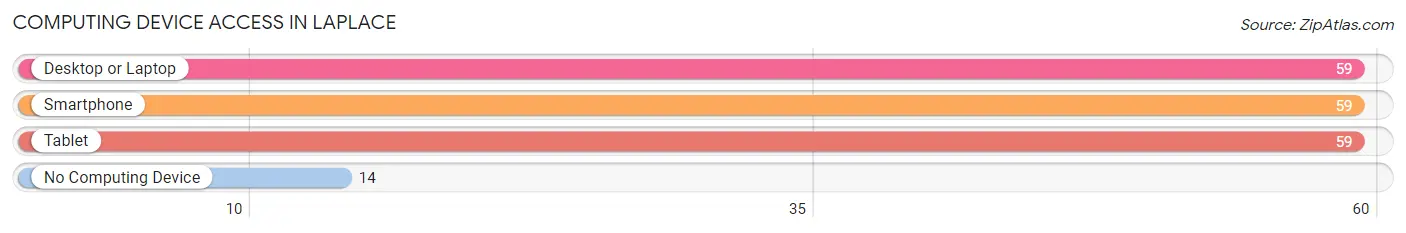
| Device Type | # Households | % Households |
| Desktop or Laptop | 59 | 80.8% |
| Smartphone | 59 | 80.8% |
| Tablet | 59 | 80.8% |
| No Computing Device | 14 | 19.2% |
| Total | 73 | 100.0% |
Internet Access in LaPlace
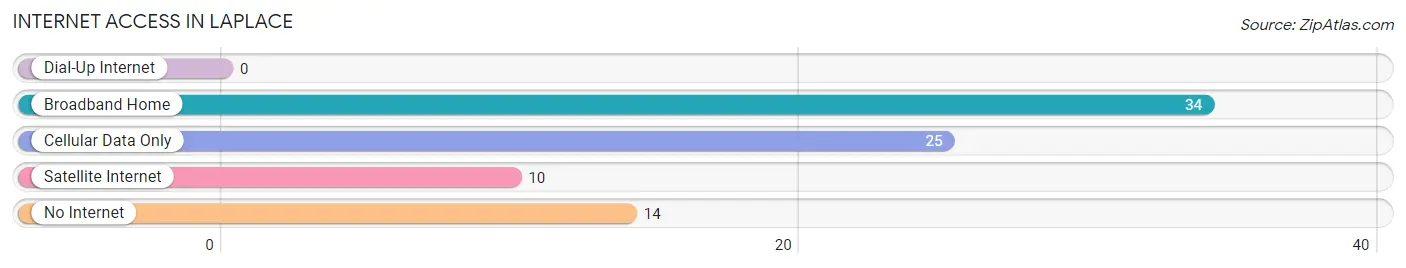
| Internet Type | # Households | % Households |
| Dial-Up Internet | 0 | 0.0% |
| Broadband Home | 34 | 46.6% |
| Cellular Data Only | 25 | 34.3% |
| Satellite Internet | 10 | 13.7% |
| No Internet | 14 | 19.2% |
| Total | 73 | 100.0% |
LaPlace Summary
Laplace is a small city located in St. John the Baptist Parish, Louisiana. It is situated on the west bank of the Mississippi River, about 25 miles west of New Orleans. The city was founded in 1883 and named after the French explorer Pierre Laplace.
History
The area that is now Laplace was originally inhabited by the Chitimacha Indians. The first European settlers arrived in the area in the late 1700s. The area was part of the Spanish colony of Louisiana until 1803, when it became part of the United States.
In 1883, the town of Laplace was founded by a group of French-speaking settlers from the nearby town of Reserve. The town was named after the French explorer Pierre Laplace, who had explored the area in the late 1700s.
The town grew slowly over the next few decades, and by the early 1900s, it had become a thriving agricultural center. The town was also home to several sawmills and brickyards.
In the 1950s, Laplace began to experience rapid growth due to the construction of Interstate 10, which connected the city to New Orleans. This led to an influx of new residents and businesses, and the city’s population grew from 2,000 in 1950 to over 10,000 by the end of the decade.
Geography
Laplace is located in St. John the Baptist Parish, Louisiana, on the west bank of the Mississippi River. The city covers an area of 8.3 square miles and has a population of approximately 32,000 people.
The city is situated on a low-lying plain, with an elevation of only 10 feet above sea level. The city is bordered by the Mississippi River to the north, the Bonnet Carre Spillway to the east, and the city of Reserve to the south.
The climate in Laplace is humid subtropical, with hot, humid summers and mild winters. The average annual temperature is 68 degrees Fahrenheit, and the average annual precipitation is 62 inches.
Economy
The economy of Laplace is largely based on the oil and gas industry. The city is home to several oil refineries, as well as a number of chemical plants. The city is also home to several manufacturing companies, including a paper mill and a steel mill.
In addition to the oil and gas industry, Laplace is also home to a number of retail stores, restaurants, and other businesses. The city is also home to several casinos, which attract tourists from all over the region.
Demographics
As of the 2010 census, Laplace had a population of 32,134 people. The racial makeup of the city was 64.3% White, 28.2% African American, 0.4% Native American, 0.7% Asian, and 5.4% from other races.
The median household income in Laplace was $41,945, and the median family income was $50,945. The per capita income was $20,945. The poverty rate was 22.3%.
Laplace is served by the St. John the Baptist Parish School District. The city is home to several public schools, as well as a number of private schools. The city is also home to a branch of the University of Louisiana at Lafayette.
Common Questions
What is Per Capita Income in LaPlace?
Per Capita income in LaPlace is $50,383.
What is the Median Family Income in LaPlace?
Median Family Income in LaPlace is $89,018.
What is the Median Household income in LaPlace?
Median Household Income in LaPlace is $87,768.
What is Income or Wage Gap in LaPlace?
Income or Wage Gap in LaPlace is 27.1%.
Women in LaPlace earn 72.9 cents for every dollar earned by a man.
What is Inequality or Gini Index in LaPlace?
Inequality or Gini Index in LaPlace is 0.47.
What is the Total Population of LaPlace?
Total Population of LaPlace is 149.
What is the Total Male Population of LaPlace?
Total Male Population of LaPlace is 97.
What is the Total Female Population of LaPlace?
Total Female Population of LaPlace is 52.
What is the Ratio of Males per 100 Females in LaPlace?
There are 186.54 Males per 100 Females in LaPlace.
What is the Ratio of Females per 100 Males in LaPlace?
There are 53.61 Females per 100 Males in LaPlace.
What is the Median Population Age in LaPlace?
Median Population Age in LaPlace is 53.0 Years.
What is the Average Family Size in LaPlace
Average Family Size in LaPlace is 2.7 People.
What is the Average Household Size in LaPlace
Average Household Size in LaPlace is 2.0 People.
How Large is the Labor Force in LaPlace?
There are 95 People in the Labor Forcein in LaPlace.
What is the Percentage of People in the Labor Force in LaPlace?
73.1% of People are in the Labor Force in LaPlace.
What is the Unemployment Rate in LaPlace?
Unemployment Rate in LaPlace is 14.7%.