Zip Codes with the Highest Percentage of Families with Income Below $10,000 in Illinois
RELATED REPORTS & OPTIONS
Family Income | $0-10k
Illinois
Compare Zip Codes
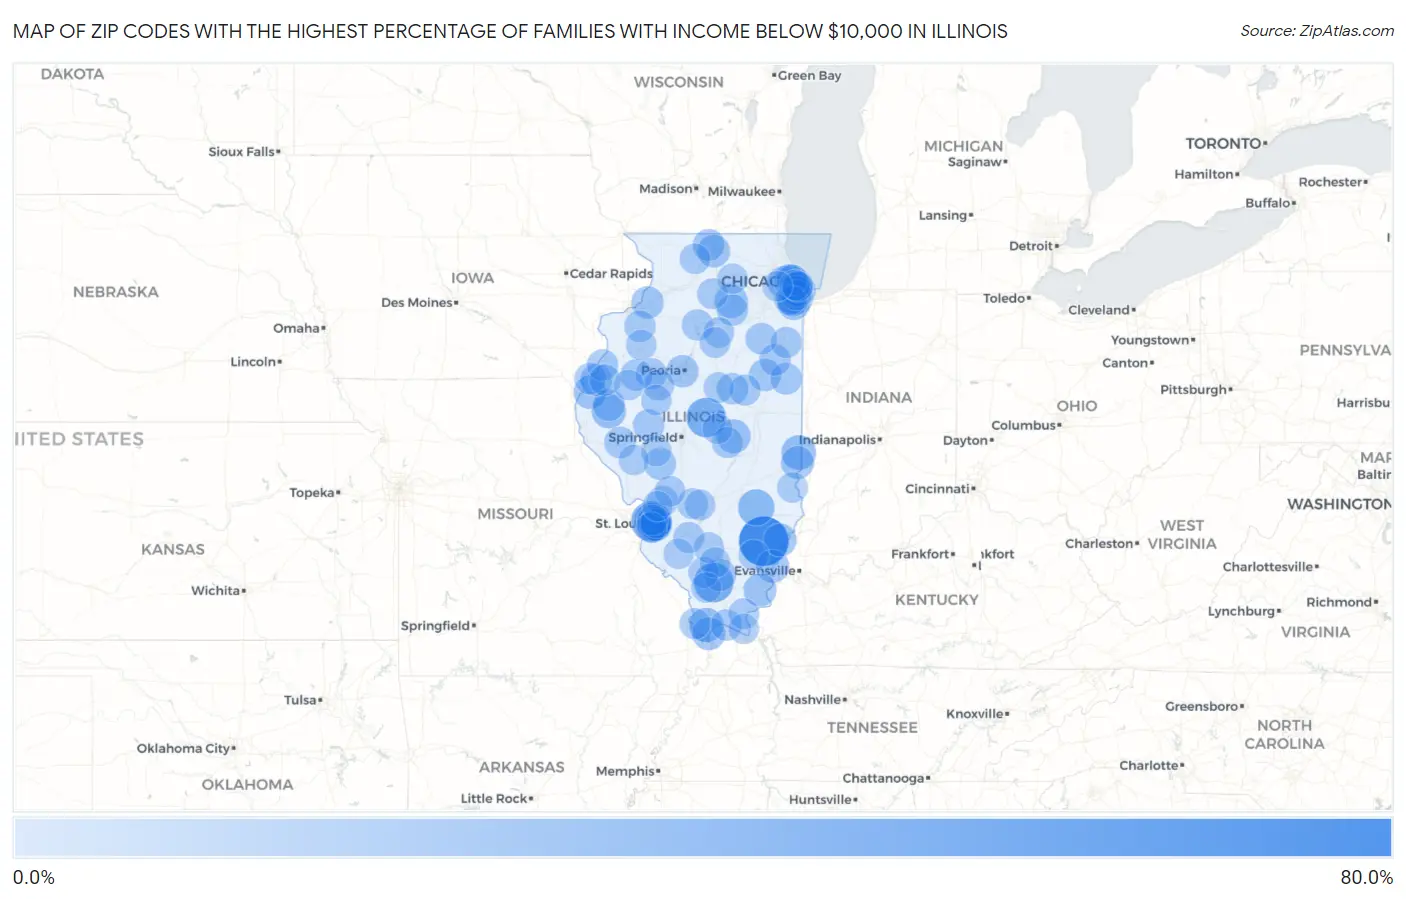
Map of Zip Codes with the Highest Percentage of Families with Income Below $10,000 in Illinois
0.0%
80.0%
Zip Codes with the Highest Percentage of Families with Income Below $10,000 in Illinois
| Zip Code | Families with Income < $10k | vs State | vs National | |
| 1. | 62843 | 64.3% | 3.0%(+61.3)#1 | 3.1%(+61.2)#33 |
| 2. | 62059 | 36.3% | 3.0%(+33.3)#2 | 3.1%(+33.2)#135 |
| 3. | 62921 | 34.5% | 3.0%(+31.5)#3 | 3.1%(+31.4)#150 |
| 4. | 62518 | 34.3% | 3.0%(+31.3)#4 | 3.1%(+31.2)#154 |
| 5. | 62434 | 25.2% | 3.0%(+22.2)#5 | 3.1%(+22.1)#300 |
| 6. | 61955 | 20.0% | 3.0%(+17.0)#6 | 3.1%(+16.9)#479 |
| 7. | 62201 | 19.9% | 3.0%(+16.9)#7 | 3.1%(+16.8)#486 |
| 8. | 62346 | 19.0% | 3.0%(+16.0)#8 | 3.1%(+15.9)#528 |
| 9. | 62090 | 18.9% | 3.0%(+15.9)#9 | 3.1%(+15.8)#533 |
| 10. | 62976 | 18.8% | 3.0%(+15.8)#10 | 3.1%(+15.7)#540 |
| 11. | 60827 | 18.6% | 3.0%(+15.6)#11 | 3.1%(+15.5)#550 |
| 12. | 61936 | 17.7% | 3.0%(+14.7)#12 | 3.1%(+14.6)#606 |
| 13. | 60531 | 16.3% | 3.0%(+13.3)#13 | 3.1%(+13.2)#726 |
| 14. | 62861 | 16.1% | 3.0%(+13.1)#14 | 3.1%(+13.0)#745 |
| 15. | 62811 | 15.7% | 3.0%(+12.7)#15 | 3.1%(+12.6)#786 |
| 16. | 62963 | 15.5% | 3.0%(+12.5)#16 | 3.1%(+12.4)#808 |
| 17. | 62423 | 15.3% | 3.0%(+12.3)#17 | 3.1%(+12.2)#832 |
| 18. | 62954 | 15.3% | 3.0%(+12.3)#18 | 3.1%(+12.2)#833 |
| 19. | 62334 | 15.0% | 3.0%(+12.0)#19 | 3.1%(+11.9)#870 |
| 20. | 60429 | 14.3% | 3.0%(+11.3)#20 | 3.1%(+11.2)#928 |
| 21. | 61104 | 14.2% | 3.0%(+11.2)#21 | 3.1%(+11.1)#953 |
| 22. | 62207 | 14.1% | 3.0%(+11.1)#22 | 3.1%(+11.0)#958 |
| 23. | 60155 | 14.0% | 3.0%(+11.0)#23 | 3.1%(+10.9)#968 |
| 24. | 61257 | 13.8% | 3.0%(+10.8)#24 | 3.1%(+10.7)#1,006 |
| 25. | 61605 | 13.6% | 3.0%(+10.6)#25 | 3.1%(+10.5)#1,027 |
| 26. | 60962 | 13.5% | 3.0%(+10.5)#26 | 3.1%(+10.4)#1,052 |
| 27. | 62874 | 13.3% | 3.0%(+10.3)#27 | 3.1%(+10.2)#1,079 |
| 28. | 60621 | 13.1% | 3.0%(+10.1)#28 | 3.1%(+10.00)#1,101 |
| 29. | 62674 | 12.8% | 3.0%(+9.80)#29 | 3.1%(+9.70)#1,167 |
| 30. | 62311 | 12.7% | 3.0%(+9.70)#30 | 3.1%(+9.60)#1,188 |
| 31. | 62203 | 12.5% | 3.0%(+9.50)#31 | 3.1%(+9.40)#1,220 |
| 32. | 61101 | 12.2% | 3.0%(+9.20)#32 | 3.1%(+9.10)#1,278 |
| 33. | 62205 | 11.9% | 3.0%(+8.90)#33 | 3.1%(+8.80)#1,348 |
| 34. | 60926 | 11.8% | 3.0%(+8.80)#34 | 3.1%(+8.70)#1,389 |
| 35. | 62330 | 11.6% | 3.0%(+8.60)#35 | 3.1%(+8.50)#1,426 |
| 36. | 62340 | 11.5% | 3.0%(+8.50)#36 | 3.1%(+8.40)#1,457 |
| 37. | 62358 | 11.4% | 3.0%(+8.40)#37 | 3.1%(+8.30)#1,495 |
| 38. | 62204 | 11.3% | 3.0%(+8.30)#38 | 3.1%(+8.20)#1,508 |
| 39. | 62691 | 11.3% | 3.0%(+8.30)#39 | 3.1%(+8.20)#1,510 |
| 40. | 60930 | 11.3% | 3.0%(+8.30)#40 | 3.1%(+8.20)#1,520 |
| 41. | 60961 | 11.2% | 3.0%(+8.20)#41 | 3.1%(+8.10)#1,545 |
| 42. | 60649 | 11.1% | 3.0%(+8.10)#42 | 3.1%(+8.00)#1,550 |
| 43. | 61415 | 11.1% | 3.0%(+8.10)#43 | 3.1%(+8.00)#1,567 |
| 44. | 60549 | 11.0% | 3.0%(+8.00)#44 | 3.1%(+7.90)#1,604 |
| 45. | 60624 | 10.9% | 3.0%(+7.90)#45 | 3.1%(+7.80)#1,609 |
| 46. | 61737 | 10.9% | 3.0%(+7.90)#46 | 3.1%(+7.80)#1,635 |
| 47. | 61425 | 10.9% | 3.0%(+7.90)#47 | 3.1%(+7.80)#1,637 |
| 48. | 60636 | 10.8% | 3.0%(+7.80)#48 | 3.1%(+7.70)#1,647 |
| 49. | 61262 | 10.8% | 3.0%(+7.80)#49 | 3.1%(+7.70)#1,668 |
| 50. | 61450 | 10.6% | 3.0%(+7.60)#50 | 3.1%(+7.50)#1,719 |
| 51. | 62953 | 10.6% | 3.0%(+7.60)#51 | 3.1%(+7.50)#1,730 |
| 52. | 61315 | 10.5% | 3.0%(+7.50)#52 | 3.1%(+7.40)#1,766 |
| 53. | 60653 | 10.4% | 3.0%(+7.40)#53 | 3.1%(+7.30)#1,776 |
| 54. | 61432 | 10.3% | 3.0%(+7.30)#54 | 3.1%(+7.20)#1,816 |
| 55. | 62990 | 10.1% | 3.0%(+7.10)#55 | 3.1%(+7.00)#1,886 |
| 56. | 60910 | 10.1% | 3.0%(+7.10)#56 | 3.1%(+7.00)#1,893 |
| 57. | 61925 | 10.0% | 3.0%(+7.00)#57 | 3.1%(+6.90)#1,927 |
| 58. | 60644 | 9.9% | 3.0%(+6.90)#58 | 3.1%(+6.80)#1,946 |
| 59. | 60620 | 9.8% | 3.0%(+6.80)#59 | 3.1%(+6.70)#1,981 |
| 60. | 62271 | 9.7% | 3.0%(+6.70)#60 | 3.1%(+6.60)#2,048 |
| 61. | 61770 | 9.7% | 3.0%(+6.70)#61 | 3.1%(+6.60)#2,056 |
| 62. | 61524 | 9.6% | 3.0%(+6.60)#62 | 3.1%(+6.50)#2,100 |
| 63. | 62067 | 9.5% | 3.0%(+6.50)#63 | 3.1%(+6.40)#2,128 |
| 64. | 62246 | 9.3% | 3.0%(+6.30)#64 | 3.1%(+6.20)#2,202 |
| 65. | 60472 | 9.2% | 3.0%(+6.20)#65 | 3.1%(+6.10)#2,262 |
| 66. | 62938 | 9.2% | 3.0%(+6.20)#66 | 3.1%(+6.10)#2,266 |
| 67. | 62927 | 9.2% | 3.0%(+6.20)#67 | 3.1%(+6.10)#2,288 |
| 68. | 62060 | 9.1% | 3.0%(+6.10)#68 | 3.1%(+6.00)#2,314 |
| 69. | 60619 | 9.0% | 3.0%(+6.00)#69 | 3.1%(+5.90)#2,353 |
| 70. | 60637 | 9.0% | 3.0%(+6.00)#70 | 3.1%(+5.90)#2,354 |
| 71. | 60445 | 9.0% | 3.0%(+6.00)#71 | 3.1%(+5.90)#2,364 |
| 72. | 62206 | 9.0% | 3.0%(+6.00)#72 | 3.1%(+5.90)#2,365 |
| 73. | 62284 | 9.0% | 3.0%(+6.00)#73 | 3.1%(+5.90)#2,391 |
| 74. | 61318 | 8.8% | 3.0%(+5.80)#74 | 3.1%(+5.70)#2,490 |
| 75. | 61332 | 8.8% | 3.0%(+5.80)#75 | 3.1%(+5.70)#2,500 |
| 76. | 62808 | 8.7% | 3.0%(+5.70)#76 | 3.1%(+5.60)#2,536 |
| 77. | 60628 | 8.6% | 3.0%(+5.60)#77 | 3.1%(+5.50)#2,554 |
| 78. | 62644 | 8.6% | 3.0%(+5.60)#78 | 3.1%(+5.50)#2,577 |
| 79. | 61047 | 8.6% | 3.0%(+5.60)#79 | 3.1%(+5.50)#2,600 |
| 80. | 61377 | 8.6% | 3.0%(+5.60)#80 | 3.1%(+5.50)#2,604 |
| 81. | 62093 | 8.6% | 3.0%(+5.60)#81 | 3.1%(+5.50)#2,614 |
| 82. | 60115 | 8.5% | 3.0%(+5.50)#82 | 3.1%(+5.40)#2,625 |
| 83. | 60612 | 8.5% | 3.0%(+5.50)#83 | 3.1%(+5.40)#2,626 |
| 84. | 60428 | 8.5% | 3.0%(+5.50)#84 | 3.1%(+5.40)#2,639 |
| 85. | 62884 | 8.5% | 3.0%(+5.50)#85 | 3.1%(+5.40)#2,666 |
| 86. | 62887 | 8.5% | 3.0%(+5.50)#86 | 3.1%(+5.40)#2,695 |
| 87. | 60609 | 8.4% | 3.0%(+5.40)#87 | 3.1%(+5.30)#2,700 |
| 88. | 62910 | 8.4% | 3.0%(+5.40)#88 | 3.1%(+5.30)#2,745 |
| 89. | 62433 | 8.4% | 3.0%(+5.40)#89 | 3.1%(+5.30)#2,753 |
| 90. | 60615 | 8.3% | 3.0%(+5.30)#90 | 3.1%(+5.20)#2,761 |
| 91. | 60514 | 8.3% | 3.0%(+5.30)#91 | 3.1%(+5.20)#2,780 |
| 92. | 61439 | 8.3% | 3.0%(+5.30)#92 | 3.1%(+5.20)#2,824 |
| 93. | 61701 | 8.2% | 3.0%(+5.20)#93 | 3.1%(+5.10)#2,835 |
| 94. | 62526 | 8.2% | 3.0%(+5.20)#94 | 3.1%(+5.10)#2,837 |
| 95. | 62901 | 8.2% | 3.0%(+5.20)#95 | 3.1%(+5.10)#2,842 |
| 96. | 62292 | 8.2% | 3.0%(+5.20)#96 | 3.1%(+5.10)#2,886 |
| 97. | 62095 | 8.0% | 3.0%(+5.00)#97 | 3.1%(+4.90)#2,964 |
| 98. | 62638 | 8.0% | 3.0%(+5.00)#98 | 3.1%(+4.90)#2,997 |
| 99. | 61416 | 8.0% | 3.0%(+5.00)#99 | 3.1%(+4.90)#3,009 |
| 100. | 62078 | 8.0% | 3.0%(+5.00)#100 | 3.1%(+4.90)#3,011 |
Common Questions
What are the Top 10 Zip Codes with the Highest Percentage of Families with Income Below $10,000 in Illinois?
Top 10 Zip Codes with the Highest Percentage of Families with Income Below $10,000 in Illinois are:
What zip code has the Highest Percentage of Families with Income Below $10,000 in Illinois?
62843 has the Highest Percentage of Families with Income Below $10,000 in Illinois with 64.3%.
What is the Percentage of Families with Income Below $10,000 in the State of Illinois?
Percentage of Families with Income Below $10,000 in Illinois is 3.0%.
What is the Percentage of Families with Income Below $10,000 in the United States?
Percentage of Families with Income Below $10,000 in the United States is 3.1%.