Spring Bay, IL Map & Demographics
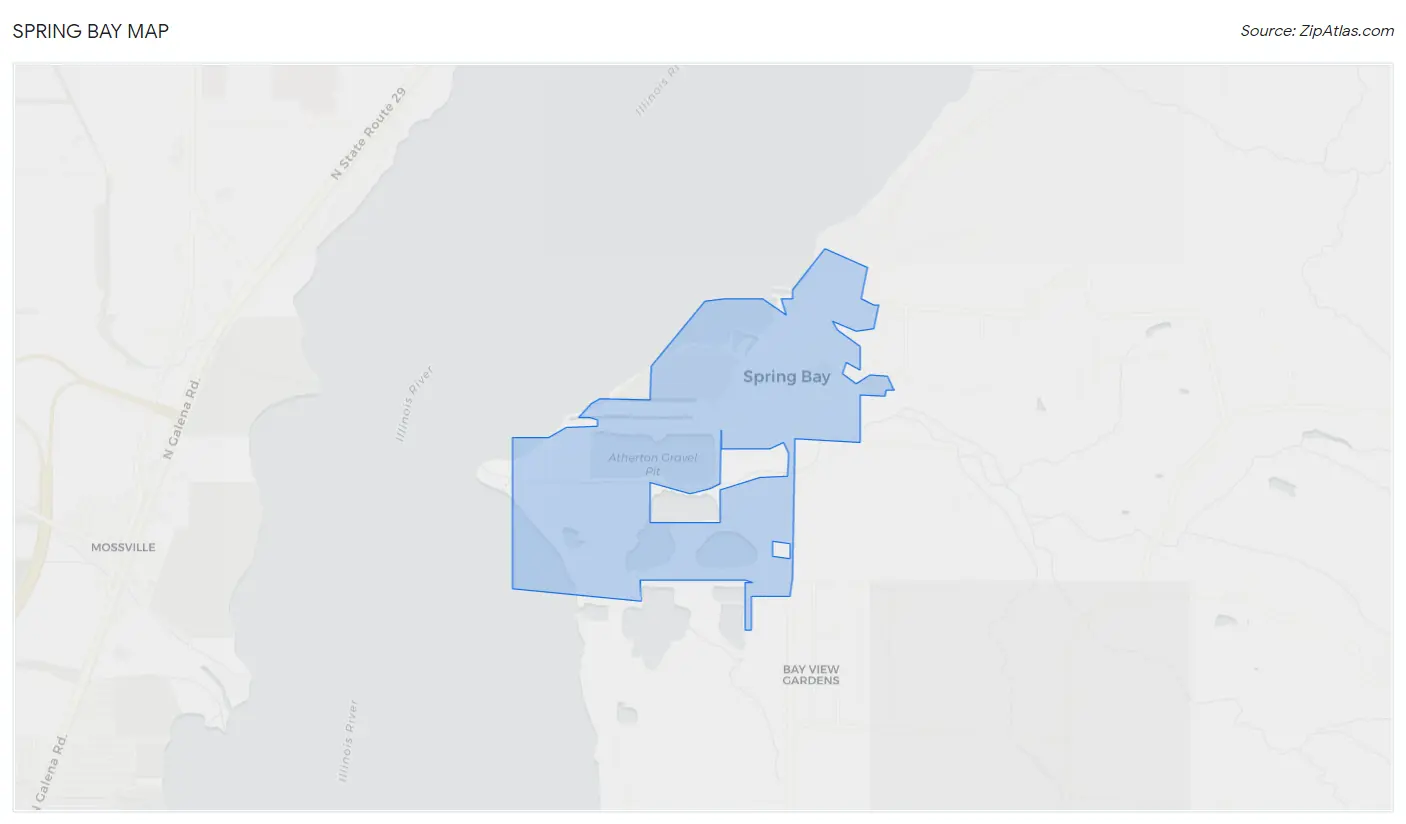
Spring Bay Map
Spring Bay Overview
$26,824
PER CAPITA INCOME
$71,250
AVG FAMILY INCOME
$58,214
AVG HOUSEHOLD INCOME
33.7%
WAGE / INCOME GAP [ % ]
66.3¢/ $1
WAGE / INCOME GAP [ $ ]
$15,368
FAMILY INCOME DEFICIT
0.45
INEQUALITY / GINI INDEX
484
TOTAL POPULATION
285
MALE POPULATION
199
FEMALE POPULATION
143.22
MALES / 100 FEMALES
69.82
FEMALES / 100 MALES
44.0
MEDIAN AGE
3.0
AVG FAMILY SIZE
2.7
AVG HOUSEHOLD SIZE
219
LABOR FORCE [ PEOPLE ]
55.7%
PERCENT IN LABOR FORCE
5.9%
UNEMPLOYMENT RATE
Spring Bay Area Codes
Income in Spring Bay
Income Overview in Spring Bay
Per Capita Income in Spring Bay is $26,824, while median incomes of families and households are $71,250 and $58,214 respectively.
| Characteristic | Number | Measure |
| Per Capita Income | 484 | $26,824 |
| Median Family Income | 132 | $71,250 |
| Mean Family Income | 132 | $75,473 |
| Median Household Income | 180 | $58,214 |
| Mean Household Income | 180 | $65,208 |
| Income Deficit | 132 | $15,368 |
| Wage / Income Gap (%) | 484 | 33.66% |
| Wage / Income Gap ($) | 484 | 66.34¢ per $1 |
| Gini / Inequality Index | 484 | 0.45 |
Earnings by Sex in Spring Bay
Average Earnings in Spring Bay are $40,302, $41,450 for men and $27,500 for women, a difference of 33.7%.
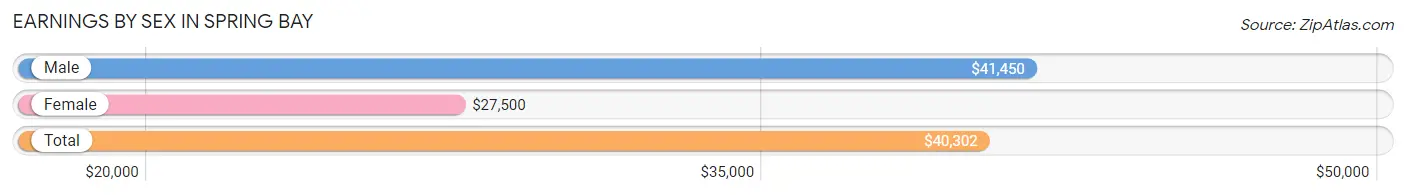
| Sex | Number | Average Earnings |
| Male | 147 (65.3%) | $41,450 |
| Female | 78 (34.7%) | $27,500 |
| Total | 225 (100.0%) | $40,302 |
Earnings by Sex by Income Bracket in Spring Bay
The most common earnings brackets in Spring Bay are $40,000 to $44,999 for men (26 | 17.7%) and $40,000 to $44,999 for women (10 | 12.8%).
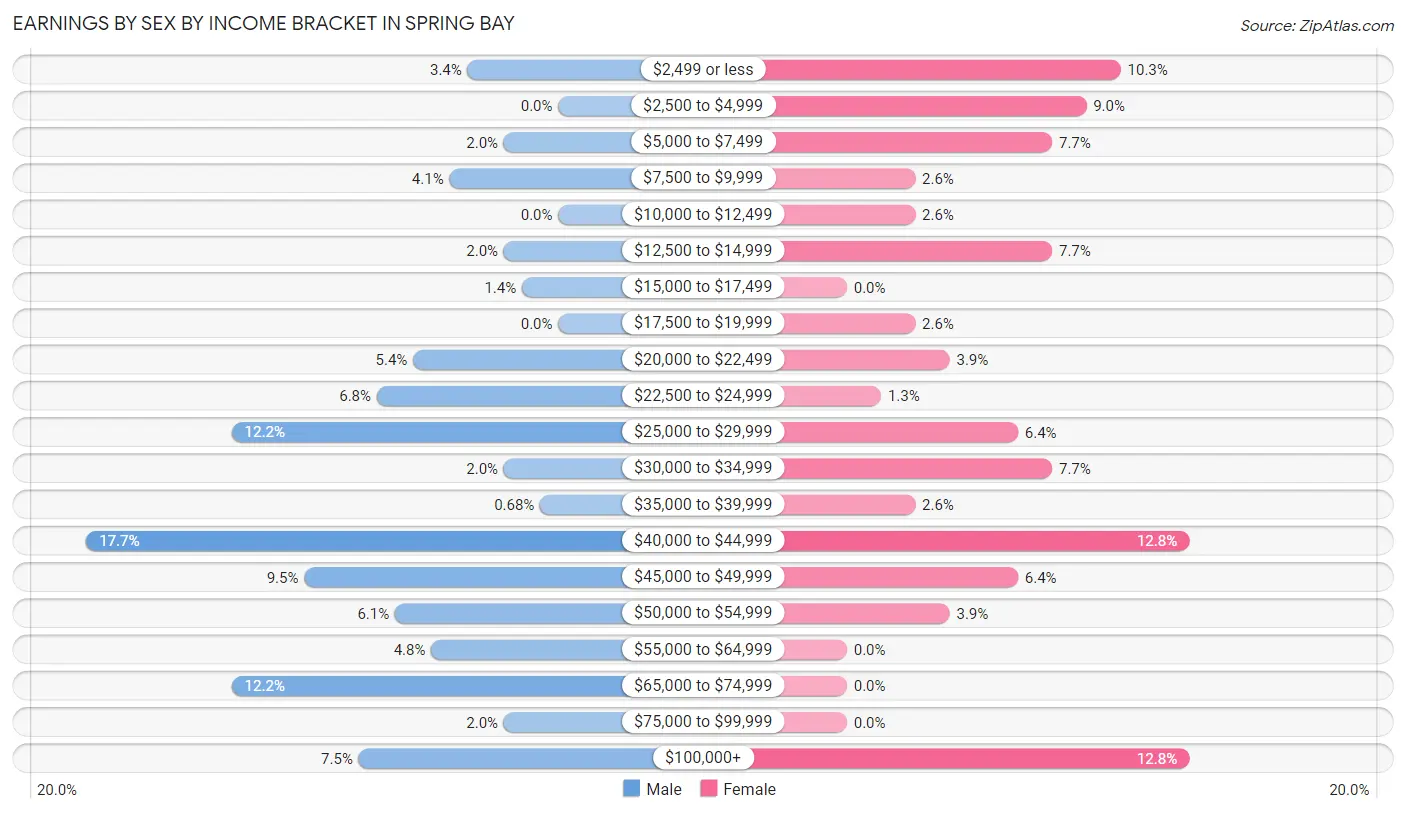
| Income | Male | Female |
| $2,499 or less | 5 (3.4%) | 8 (10.3%) |
| $2,500 to $4,999 | 0 (0.0%) | 7 (9.0%) |
| $5,000 to $7,499 | 3 (2.0%) | 6 (7.7%) |
| $7,500 to $9,999 | 6 (4.1%) | 2 (2.6%) |
| $10,000 to $12,499 | 0 (0.0%) | 2 (2.6%) |
| $12,500 to $14,999 | 3 (2.0%) | 6 (7.7%) |
| $15,000 to $17,499 | 2 (1.4%) | 0 (0.0%) |
| $17,500 to $19,999 | 0 (0.0%) | 2 (2.6%) |
| $20,000 to $22,499 | 8 (5.4%) | 3 (3.8%) |
| $22,500 to $24,999 | 10 (6.8%) | 1 (1.3%) |
| $25,000 to $29,999 | 18 (12.2%) | 5 (6.4%) |
| $30,000 to $34,999 | 3 (2.0%) | 6 (7.7%) |
| $35,000 to $39,999 | 1 (0.7%) | 2 (2.6%) |
| $40,000 to $44,999 | 26 (17.7%) | 10 (12.8%) |
| $45,000 to $49,999 | 14 (9.5%) | 5 (6.4%) |
| $50,000 to $54,999 | 9 (6.1%) | 3 (3.8%) |
| $55,000 to $64,999 | 7 (4.8%) | 0 (0.0%) |
| $65,000 to $74,999 | 18 (12.2%) | 0 (0.0%) |
| $75,000 to $99,999 | 3 (2.0%) | 0 (0.0%) |
| $100,000+ | 11 (7.5%) | 10 (12.8%) |
| Total | 147 (100.0%) | 78 (100.0%) |
Earnings by Sex by Educational Attainment in Spring Bay
Average earnings in Spring Bay are $45,417 for men and $32,500 for women, a difference of 28.4%. Men with an educational attainment of college or associate's degree enjoy the highest average annual earnings of $58,750, while those with high school diploma education earn the least with $41,300. Women with an educational attainment of high school diploma earn the most with the average annual earnings of $35,000, while those with high school diploma education have the smallest earnings of $35,000.
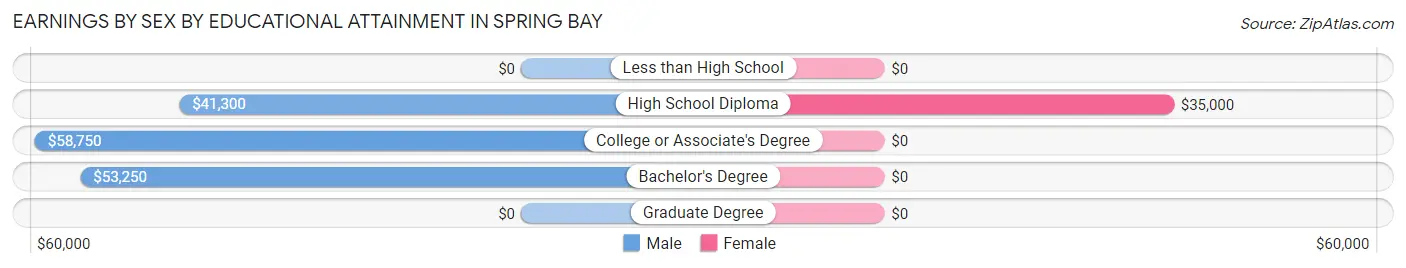
| Educational Attainment | Male Income | Female Income |
| Less than High School | - | - |
| High School Diploma | $41,300 | $35,000 |
| College or Associate's Degree | $58,750 | $0 |
| Bachelor's Degree | $53,250 | $0 |
| Graduate Degree | - | - |
| Total | $45,417 | $32,500 |
Family Income in Spring Bay
Family Income Brackets in Spring Bay
According to the Spring Bay family income data, there are 27 families falling into the $75,000 to $99,999 income range, which is the most common income bracket and makes up 20.4% of all families.
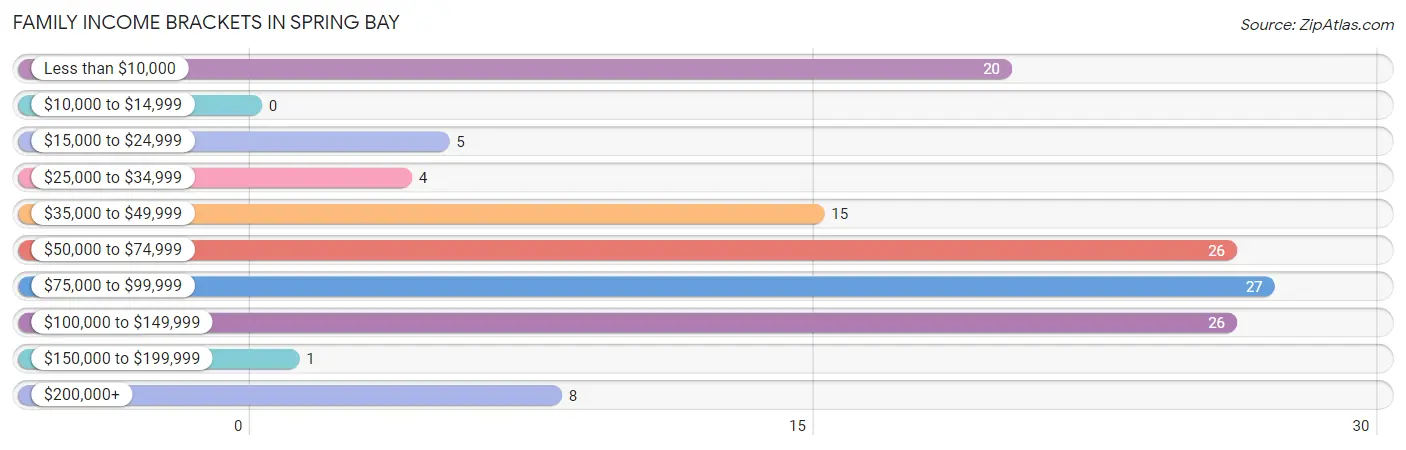
| Income Bracket | # Families | % Families |
| Less than $10,000 | 20 | 15.2% |
| $10,000 to $14,999 | 0 | 0.0% |
| $15,000 to $24,999 | 5 | 3.8% |
| $25,000 to $34,999 | 4 | 3.0% |
| $35,000 to $49,999 | 15 | 11.4% |
| $50,000 to $74,999 | 26 | 19.7% |
| $75,000 to $99,999 | 27 | 20.5% |
| $100,000 to $149,999 | 26 | 19.7% |
| $150,000 to $199,999 | 1 | 0.8% |
| $200,000+ | 8 | 6.1% |
Family Income by Famaliy Size in Spring Bay
4-person families (12 | 9.1%) account for the highest median family income in Spring Bay with $210,357 per family, while 4-person families (12 | 9.1%) have the highest median income of $52,589 per family member.
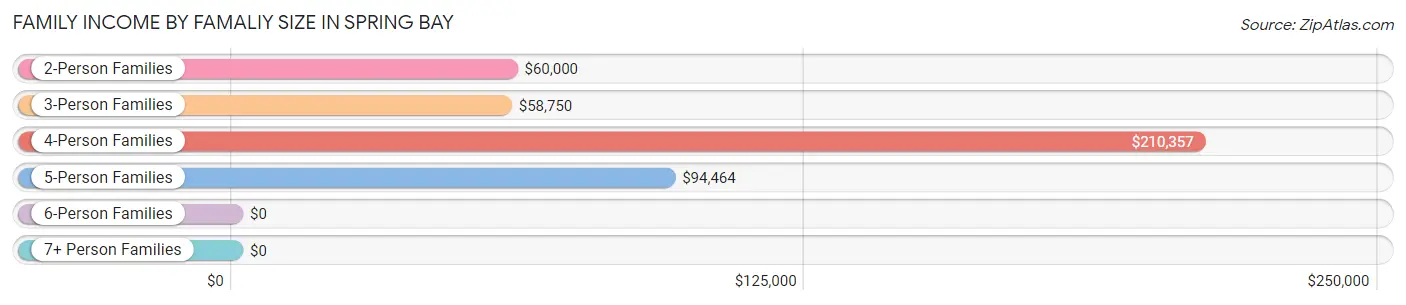
| Income Bracket | # Families | Median Income |
| 2-Person Families | 54 (40.9%) | $60,000 |
| 3-Person Families | 47 (35.6%) | $58,750 |
| 4-Person Families | 12 (9.1%) | $210,357 |
| 5-Person Families | 17 (12.9%) | $94,464 |
| 6-Person Families | 2 (1.5%) | $0 |
| 7+ Person Families | 0 (0.0%) | $0 |
| Total | 132 (100.0%) | $71,250 |
Family Income by Number of Earners in Spring Bay
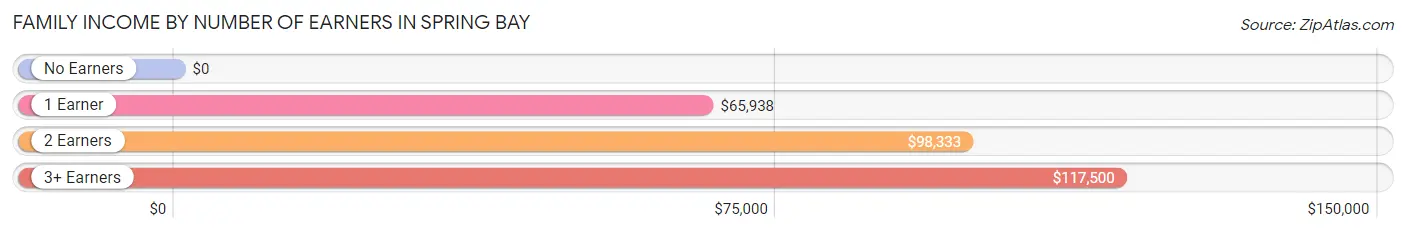
| Number of Earners | # Families | Median Income |
| No Earners | 29 (22.0%) | $0 |
| 1 Earner | 43 (32.6%) | $65,938 |
| 2 Earners | 56 (42.4%) | $98,333 |
| 3+ Earners | 4 (3.0%) | $117,500 |
| Total | 132 (100.0%) | $71,250 |
Household Income in Spring Bay
Household Income Brackets in Spring Bay
With 30 households falling in the category, the $100,000 to $149,999 income range is the most frequent in Spring Bay, accounting for 16.7% of all households. In contrast, only 2 households (1.1%) fall into the $150,000 to $199,999 income bracket, making it the least populous group.
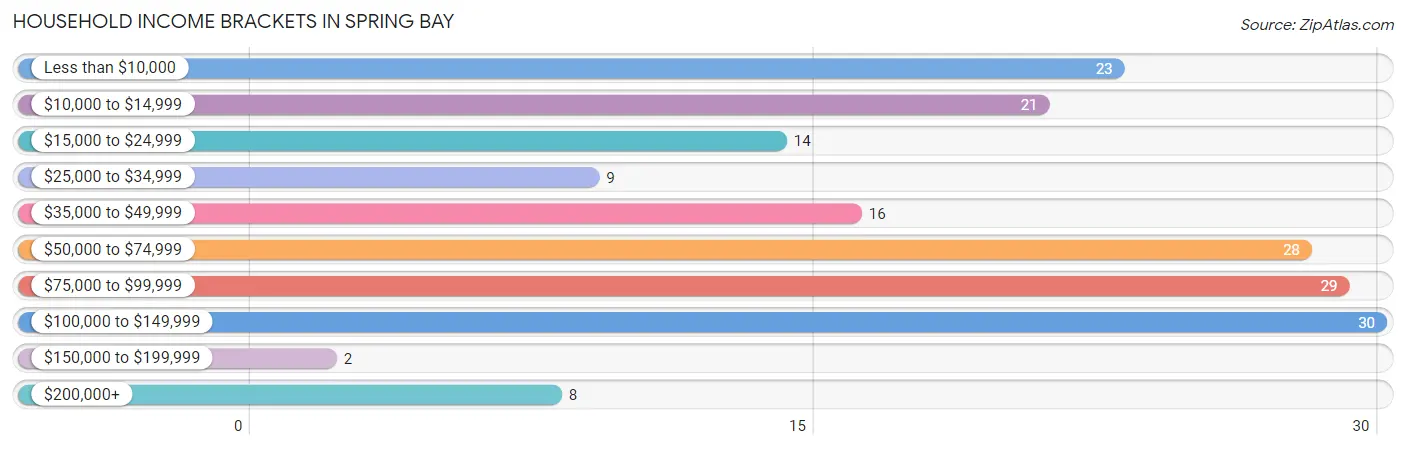
| Income Bracket | # Households | % Households |
| Less than $10,000 | 23 | 12.8% |
| $10,000 to $14,999 | 21 | 11.7% |
| $15,000 to $24,999 | 14 | 7.8% |
| $25,000 to $34,999 | 9 | 5.0% |
| $35,000 to $49,999 | 16 | 8.9% |
| $50,000 to $74,999 | 28 | 15.6% |
| $75,000 to $99,999 | 29 | 16.1% |
| $100,000 to $149,999 | 30 | 16.7% |
| $150,000 to $199,999 | 2 | 1.1% |
| $200,000+ | 8 | 4.4% |
Household Income by Householder Age in Spring Bay
The median household income in Spring Bay is $58,214, with the highest median household income of $66,250 found in the 45 to 64 years age bracket for the primary householder. A total of 60 households (33.3%) fall into this category. Meanwhile, the 25 to 44 years age bracket for the primary householder has the lowest median household income of $0, with 55 households (30.6%) in this group.
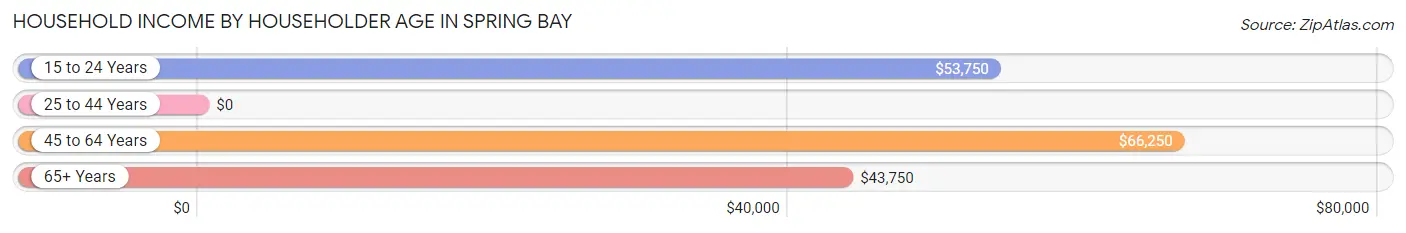
| Income Bracket | # Households | Median Income |
| 15 to 24 Years | 4 (2.2%) | $53,750 |
| 25 to 44 Years | 55 (30.6%) | $0 |
| 45 to 64 Years | 60 (33.3%) | $66,250 |
| 65+ Years | 61 (33.9%) | $43,750 |
| Total | 180 (100.0%) | $58,214 |
Poverty in Spring Bay
Income Below Poverty by Sex and Age in Spring Bay
With 16.8% poverty level for males and 19.1% for females among the residents of Spring Bay, 65 to 74 year old males and 12 to 14 year old females are the most vulnerable to poverty, with 20 males (44.4%) and 1 females (100.0%) in their respective age groups living below the poverty level.
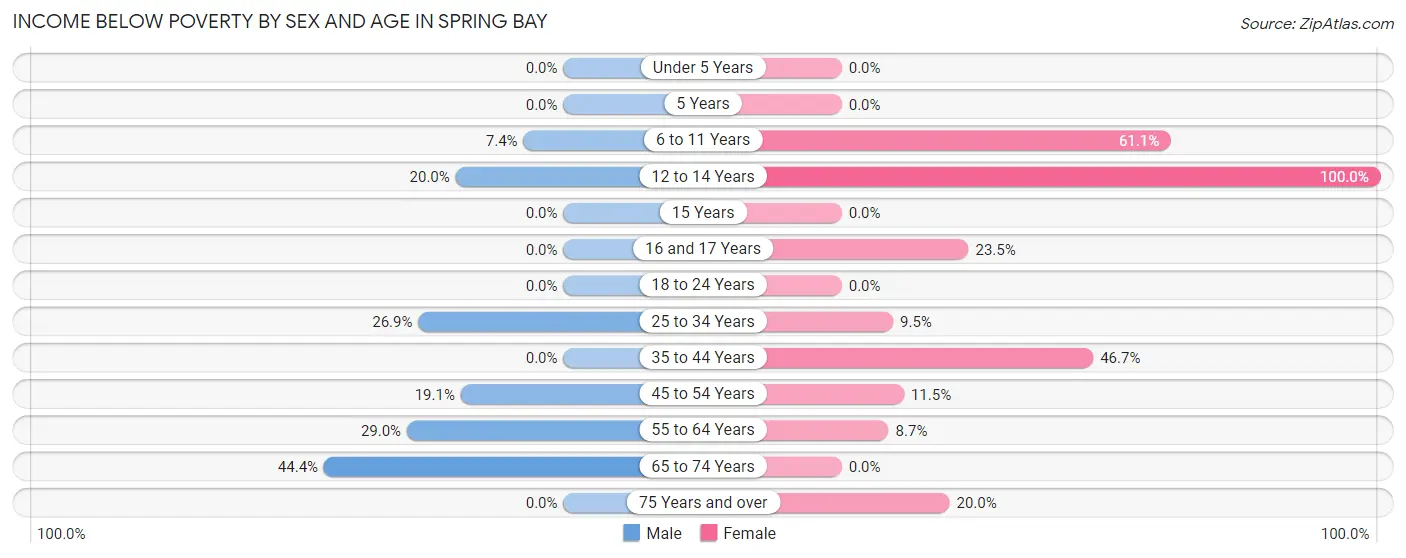
| Age Bracket | Male | Female |
| Under 5 Years | 0 (0.0%) | 0 (0.0%) |
| 5 Years | 0 (0.0%) | 0 (0.0%) |
| 6 to 11 Years | 2 (7.4%) | 11 (61.1%) |
| 12 to 14 Years | 2 (20.0%) | 1 (100.0%) |
| 15 Years | 0 (0.0%) | 0 (0.0%) |
| 16 and 17 Years | 0 (0.0%) | 4 (23.5%) |
| 18 to 24 Years | 0 (0.0%) | 0 (0.0%) |
| 25 to 34 Years | 7 (26.9%) | 2 (9.5%) |
| 35 to 44 Years | 0 (0.0%) | 14 (46.7%) |
| 45 to 54 Years | 8 (19.1%) | 3 (11.5%) |
| 55 to 64 Years | 9 (29.0%) | 2 (8.7%) |
| 65 to 74 Years | 20 (44.4%) | 0 (0.0%) |
| 75 Years and over | 0 (0.0%) | 1 (20.0%) |
| Total | 48 (16.8%) | 38 (19.1%) |
Income Above Poverty by Sex and Age in Spring Bay
According to the poverty statistics in Spring Bay, males aged under 5 years and females aged 5 years are the age groups that are most secure financially, with 100.0% of males and 100.0% of females in these age groups living above the poverty line.
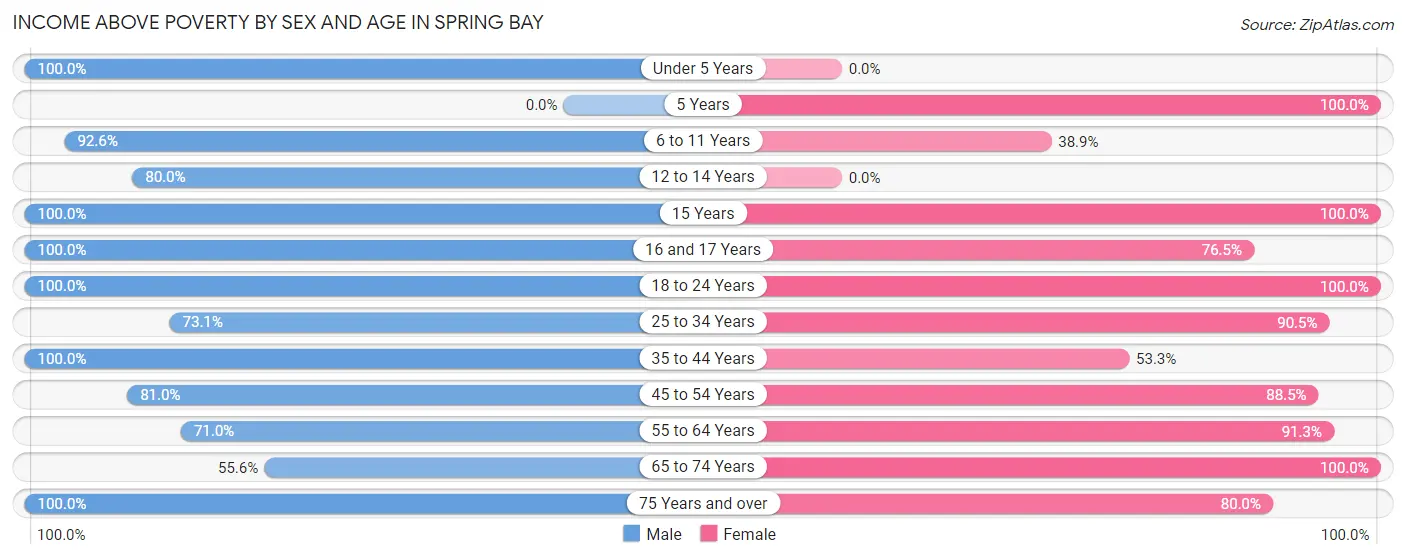
| Age Bracket | Male | Female |
| Under 5 Years | 24 (100.0%) | 0 (0.0%) |
| 5 Years | 0 (0.0%) | 1 (100.0%) |
| 6 to 11 Years | 25 (92.6%) | 7 (38.9%) |
| 12 to 14 Years | 8 (80.0%) | 0 (0.0%) |
| 15 Years | 7 (100.0%) | 3 (100.0%) |
| 16 and 17 Years | 2 (100.0%) | 13 (76.5%) |
| 18 to 24 Years | 26 (100.0%) | 17 (100.0%) |
| 25 to 34 Years | 19 (73.1%) | 19 (90.5%) |
| 35 to 44 Years | 33 (100.0%) | 16 (53.3%) |
| 45 to 54 Years | 34 (80.9%) | 23 (88.5%) |
| 55 to 64 Years | 22 (71.0%) | 21 (91.3%) |
| 65 to 74 Years | 25 (55.6%) | 37 (100.0%) |
| 75 Years and over | 12 (100.0%) | 4 (80.0%) |
| Total | 237 (83.2%) | 161 (80.9%) |
Income Below Poverty Among Married-Couple Families in Spring Bay
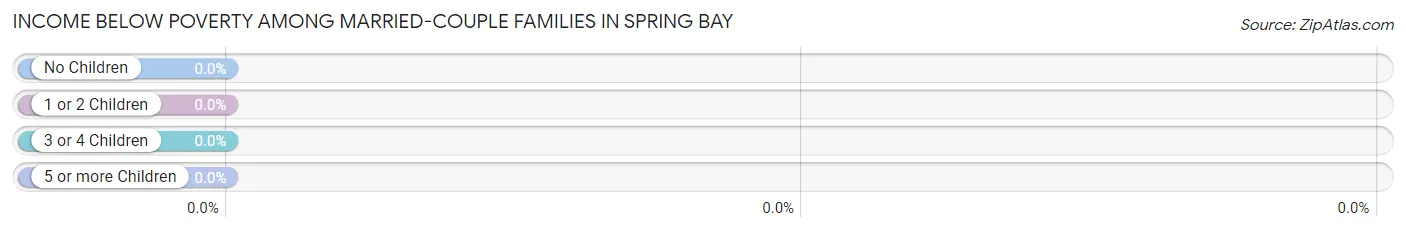
| Children | Above Poverty | Below Poverty |
| No Children | 55 (100.0%) | 0 (0.0%) |
| 1 or 2 Children | 31 (100.0%) | 0 (0.0%) |
| 3 or 4 Children | 7 (100.0%) | 0 (0.0%) |
| 5 or more Children | 0 (0.0%) | 0 (0.0%) |
| Total | 93 (100.0%) | 0 (0.0%) |
Income Below Poverty Among Single-Parent Households in Spring Bay
According to the poverty data in Spring Bay, 75.0% or 9 single-father households and 59.3% or 16 single-mother households are living below the poverty line. Among single-father households, those with no children have the highest poverty rate, with 3 households (100.0%) experiencing poverty. Likewise, among single-mother households, those with 3 or 4 children have the highest poverty rate, with 2 households (100.0%) falling below the poverty line.
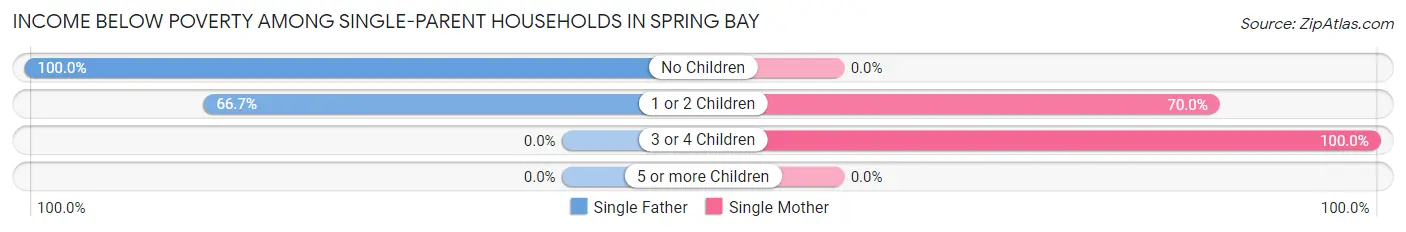
| Children | Single Father | Single Mother |
| No Children | 3 (100.0%) | 0 (0.0%) |
| 1 or 2 Children | 6 (66.7%) | 14 (70.0%) |
| 3 or 4 Children | 0 (0.0%) | 2 (100.0%) |
| 5 or more Children | 0 (0.0%) | 0 (0.0%) |
| Total | 9 (75.0%) | 16 (59.3%) |
Income Below Poverty Among Married-Couple vs Single-Parent Households in Spring Bay
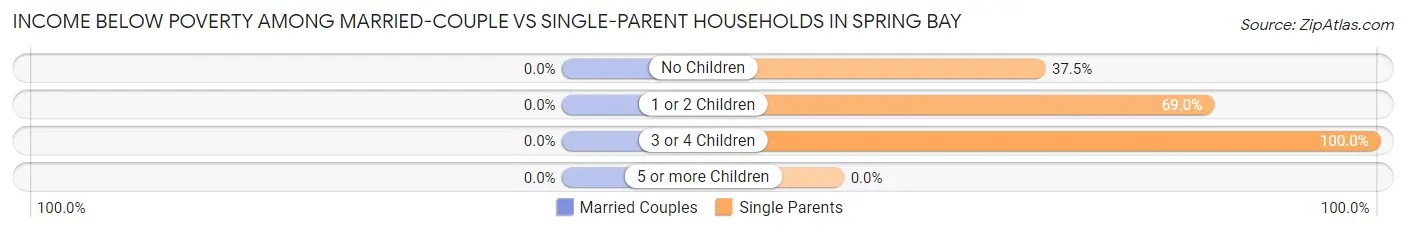
| Children | Married-Couple Families | Single-Parent Households |
| No Children | 0 (0.0%) | 3 (37.5%) |
| 1 or 2 Children | 0 (0.0%) | 20 (69.0%) |
| 3 or 4 Children | 0 (0.0%) | 2 (100.0%) |
| 5 or more Children | 0 (0.0%) | 0 (0.0%) |
| Total | 0 (0.0%) | 25 (64.1%) |
Race in Spring Bay
The most populous races in Spring Bay are White / Caucasian (469 | 96.9%), Two or more Races (13 | 2.7%), and Hispanic or Latino (7 | 1.5%).
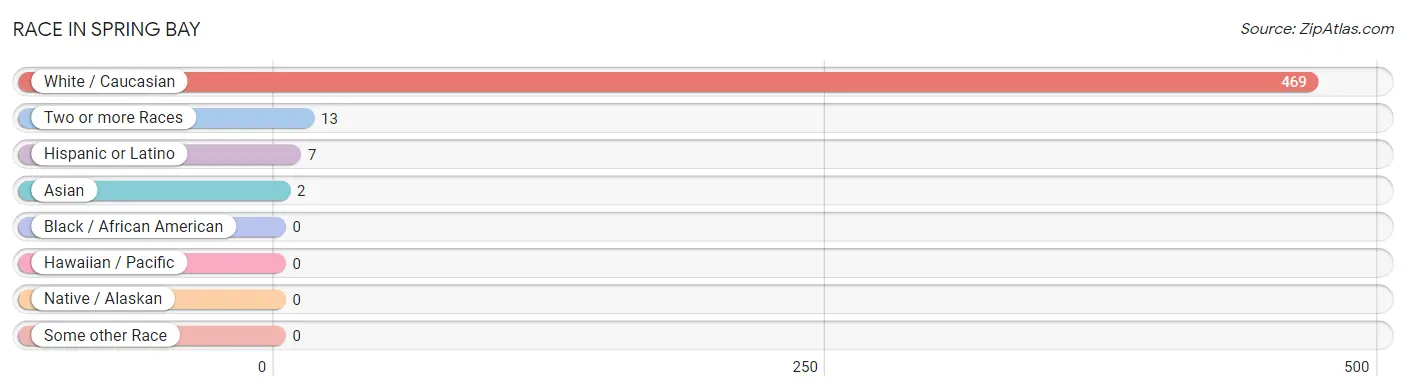
| Race | # Population | % Population |
| Asian | 2 | 0.4% |
| Black / African American | 0 | 0.0% |
| Hawaiian / Pacific | 0 | 0.0% |
| Hispanic or Latino | 7 | 1.5% |
| Native / Alaskan | 0 | 0.0% |
| White / Caucasian | 469 | 96.9% |
| Two or more Races | 13 | 2.7% |
| Some other Race | 0 | 0.0% |
| Total | 484 | 100.0% |
Ancestry in Spring Bay
The most populous ancestries reported in Spring Bay are German (165 | 34.1%), Irish (50 | 10.3%), English (32 | 6.6%), Italian (29 | 6.0%), and Swedish (29 | 6.0%), together accounting for 63.0% of all Spring Bay residents.
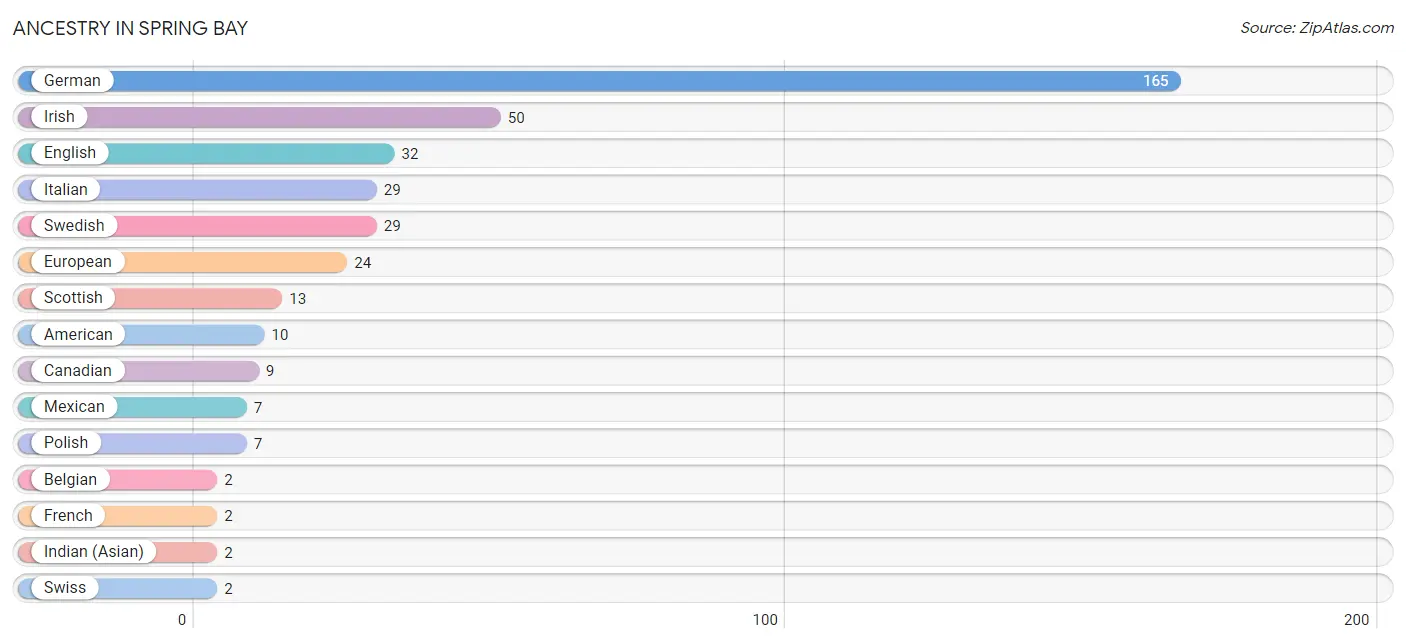
| Ancestry | # Population | % Population |
| American | 10 | 2.1% |
| Belgian | 2 | 0.4% |
| Canadian | 9 | 1.9% |
| English | 32 | 6.6% |
| European | 24 | 5.0% |
| French | 2 | 0.4% |
| German | 165 | 34.1% |
| Indian (Asian) | 2 | 0.4% |
| Irish | 50 | 10.3% |
| Italian | 29 | 6.0% |
| Mexican | 7 | 1.5% |
| Polish | 7 | 1.5% |
| Scottish | 13 | 2.7% |
| Swedish | 29 | 6.0% |
| Swiss | 2 | 0.4% |
| Welsh | 1 | 0.2% | View All 16 Rows |
Immigrants in Spring Bay
The most numerous immigrant groups reported in Spring Bay came from Asia (2 | 0.4%), China (2 | 0.4%), and Eastern Asia (2 | 0.4%), together accounting for 1.2% of all Spring Bay residents.
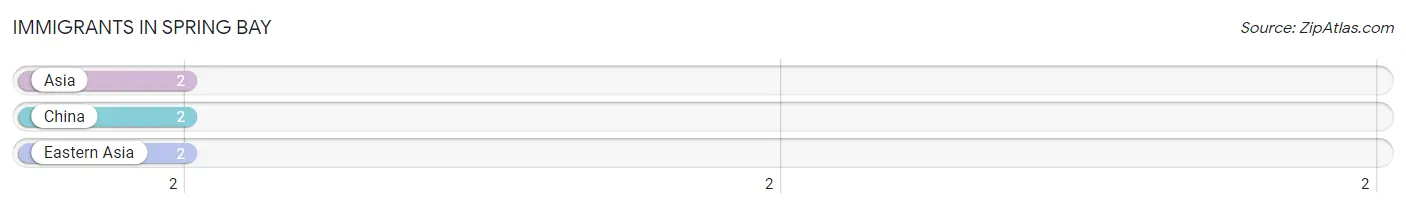
| Immigration Origin | # Population | % Population |
| Asia | 2 | 0.4% |
| China | 2 | 0.4% |
| Eastern Asia | 2 | 0.4% | View All 3 Rows |
Sex and Age in Spring Bay
Sex and Age in Spring Bay
The most populous age groups in Spring Bay are 65 to 69 Years (41 | 14.4%) for men and 15 to 19 Years (30 | 15.1%) for women.
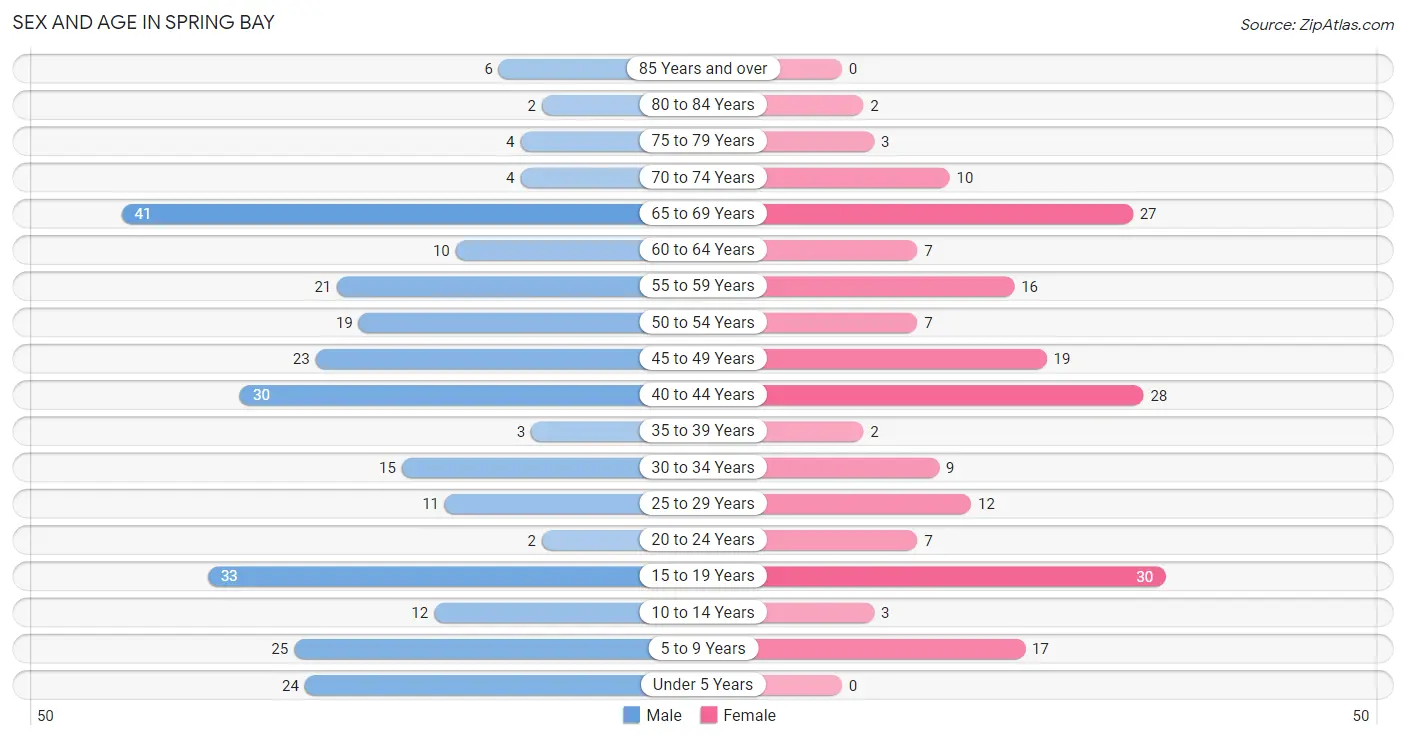
| Age Bracket | Male | Female |
| Under 5 Years | 24 (8.4%) | 0 (0.0%) |
| 5 to 9 Years | 25 (8.8%) | 17 (8.5%) |
| 10 to 14 Years | 12 (4.2%) | 3 (1.5%) |
| 15 to 19 Years | 33 (11.6%) | 30 (15.1%) |
| 20 to 24 Years | 2 (0.7%) | 7 (3.5%) |
| 25 to 29 Years | 11 (3.9%) | 12 (6.0%) |
| 30 to 34 Years | 15 (5.3%) | 9 (4.5%) |
| 35 to 39 Years | 3 (1.1%) | 2 (1.0%) |
| 40 to 44 Years | 30 (10.5%) | 28 (14.1%) |
| 45 to 49 Years | 23 (8.1%) | 19 (9.6%) |
| 50 to 54 Years | 19 (6.7%) | 7 (3.5%) |
| 55 to 59 Years | 21 (7.4%) | 16 (8.0%) |
| 60 to 64 Years | 10 (3.5%) | 7 (3.5%) |
| 65 to 69 Years | 41 (14.4%) | 27 (13.6%) |
| 70 to 74 Years | 4 (1.4%) | 10 (5.0%) |
| 75 to 79 Years | 4 (1.4%) | 3 (1.5%) |
| 80 to 84 Years | 2 (0.7%) | 2 (1.0%) |
| 85 Years and over | 6 (2.1%) | 0 (0.0%) |
| Total | 285 (100.0%) | 199 (100.0%) |
Families and Households in Spring Bay
Median Family Size in Spring Bay
The median family size in Spring Bay is 3.04 persons per family, with married-couple families (93 | 70.5%) accounting for the largest median family size of 3.32 persons per family. On the other hand, single female/mother families (27 | 20.4%) represent the smallest median family size with 2.04 persons per family.
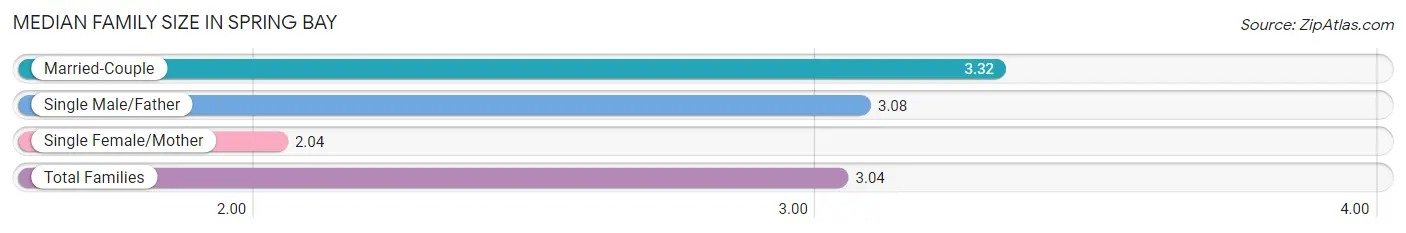
| Family Type | # Families | Family Size |
| Married-Couple | 93 (70.5%) | 3.32 |
| Single Male/Father | 12 (9.1%) | 3.08 |
| Single Female/Mother | 27 (20.4%) | 2.04 |
| Total Families | 132 (100.0%) | 3.04 |
Median Household Size in Spring Bay
The median household size in Spring Bay is 2.69 persons per household, with married-couple households (93 | 51.7%) accounting for the largest median household size of 3.55 persons per household. non-family households (48 | 26.7%) represent the smallest median household size with 1.10 persons per household.
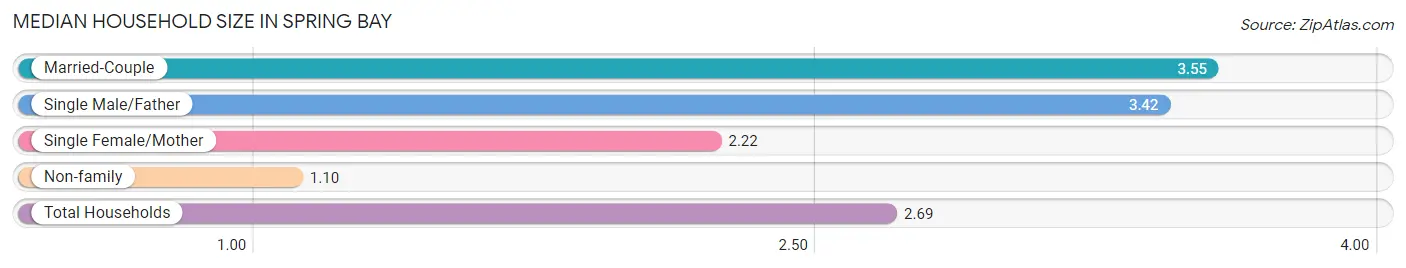
| Household Type | # Households | Household Size |
| Married-Couple | 93 (51.7%) | 3.55 |
| Single Male/Father | 12 (6.7%) | 3.42 |
| Single Female/Mother | 27 (15.0%) | 2.22 |
| Non-family | 48 (26.7%) | 1.10 |
| Total Households | 180 (100.0%) | 2.69 |
Household Size by Marriage Status in Spring Bay
Out of a total of 180 households in Spring Bay, 132 (73.3%) are family households, while 48 (26.7%) are nonfamily households. The most numerous type of family households are 2-person households, comprising 50, and the most common type of nonfamily households are 1-person households, comprising 43.
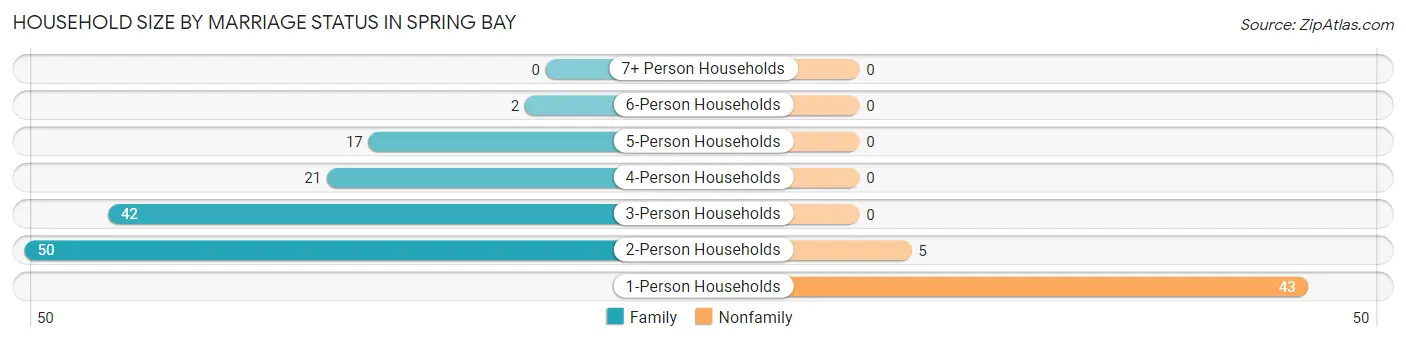
| Household Size | Family Households | Nonfamily Households |
| 1-Person Households | - | 43 (23.9%) |
| 2-Person Households | 50 (27.8%) | 5 (2.8%) |
| 3-Person Households | 42 (23.3%) | 0 (0.0%) |
| 4-Person Households | 21 (11.7%) | 0 (0.0%) |
| 5-Person Households | 17 (9.4%) | 0 (0.0%) |
| 6-Person Households | 2 (1.1%) | 0 (0.0%) |
| 7+ Person Households | 0 (0.0%) | 0 (0.0%) |
| Total | 132 (73.3%) | 48 (26.7%) |
Female Fertility in Spring Bay
Fertility by Age in Spring Bay
Average fertility rate in Spring Bay is 93.0 births per 1,000 women. Women in the age bracket of 20 to 34 years have the highest fertility rate with 357.0 births per 1,000 women. Women in the age bracket of 20 to 34 years acount for 100.0% of all women with births.
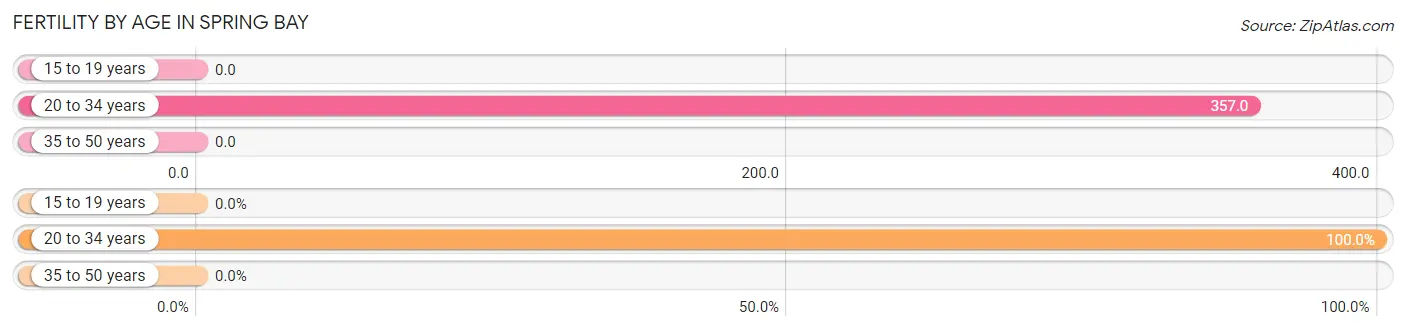
| Age Bracket | Women with Births | Births / 1,000 Women |
| 15 to 19 years | 0 (0.0%) | 0.0 |
| 20 to 34 years | 10 (100.0%) | 357.0 |
| 35 to 50 years | 0 (0.0%) | 0.0 |
| Total | 10 (100.0%) | 93.0 |
Fertility by Age by Marriage Status in Spring Bay
90.0% of women with births (10) in Spring Bay are married. The highest percentage of unmarried women with births falls into 20 to 34 years age bracket with 10.0% of them unmarried at the time of birth, while the lowest percentage of unmarried women with births belong to 20 to 34 years age bracket with 10.0% of them unmarried.
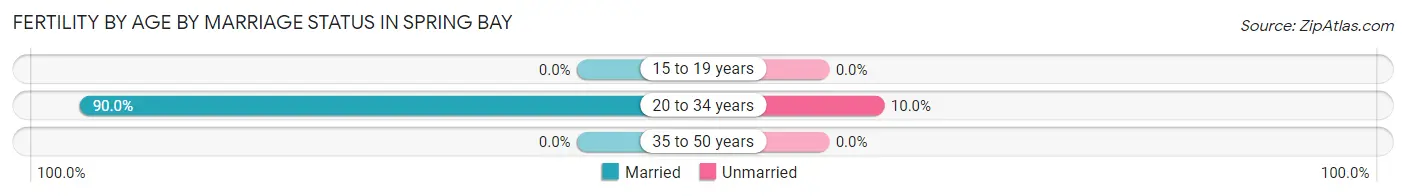
| Age Bracket | Married | Unmarried |
| 15 to 19 years | 0 (0.0%) | 0 (0.0%) |
| 20 to 34 years | 9 (90.0%) | 1 (10.0%) |
| 35 to 50 years | 0 (0.0%) | 0 (0.0%) |
| Total | 9 (90.0%) | 1 (10.0%) |
Fertility by Education in Spring Bay
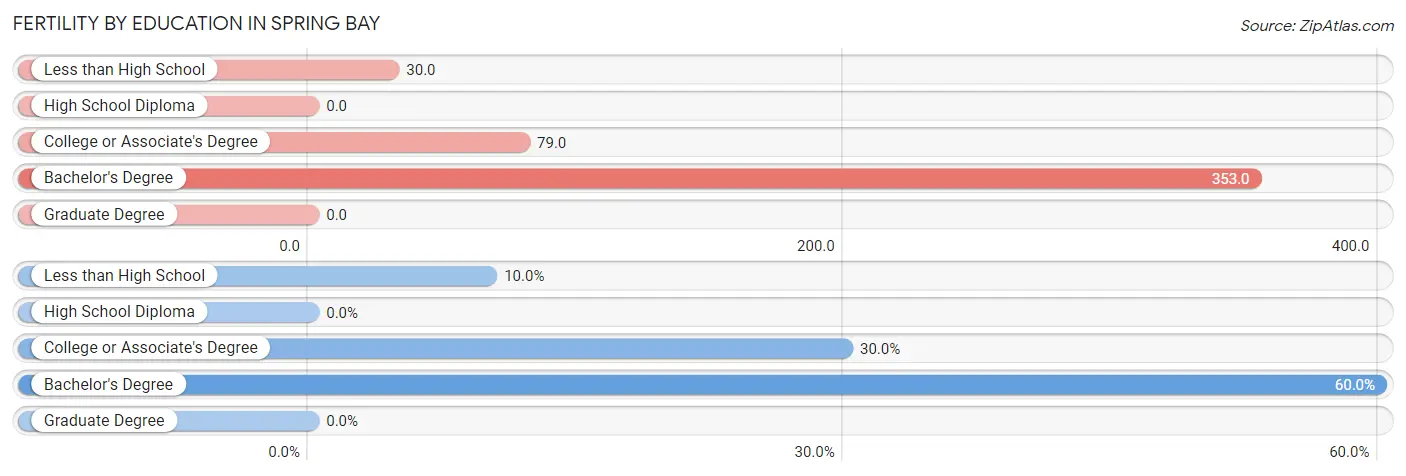
| Educational Attainment | Women with Births | Births / 1,000 Women |
| Less than High School | 1 (10.0%) | 30.0 |
| High School Diploma | 0 (0.0%) | 0.0 |
| College or Associate's Degree | 3 (30.0%) | 79.0 |
| Bachelor's Degree | 6 (60.0%) | 353.0 |
| Graduate Degree | 0 (0.0%) | 0.0 |
| Total | 10 (100.0%) | 93.0 |
Fertility by Education by Marriage Status in Spring Bay
10.0% of women with births in Spring Bay are unmarried. Women with the educational attainment of less than high school are most likely to be married with 100.0% of them married at childbirth, while women with the educational attainment of college or associate's degree are least likely to be married with 33.3% of them unmarried at childbirth.
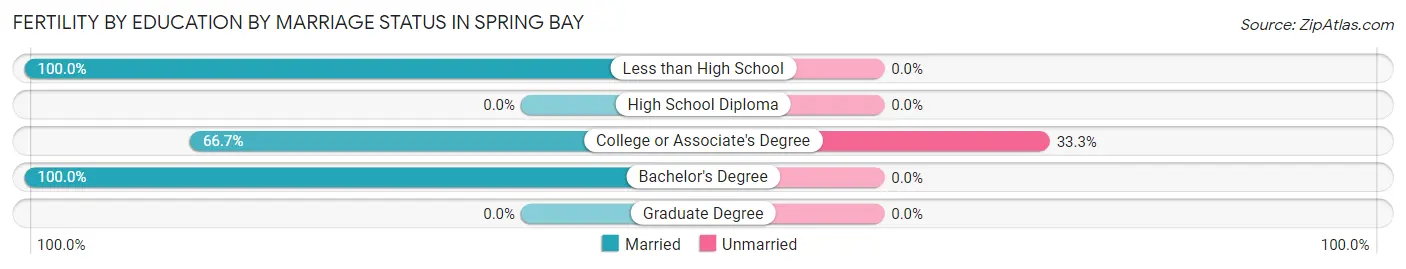
| Educational Attainment | Married | Unmarried |
| Less than High School | 1 (100.0%) | 0 (0.0%) |
| High School Diploma | 0 (0.0%) | 0 (0.0%) |
| College or Associate's Degree | 2 (66.7%) | 1 (33.3%) |
| Bachelor's Degree | 6 (100.0%) | 0 (0.0%) |
| Graduate Degree | 0 (0.0%) | 0 (0.0%) |
| Total | 9 (90.0%) | 1 (10.0%) |
Employment Characteristics in Spring Bay
Employment by Class of Employer in Spring Bay
Among the 206 employed individuals in Spring Bay, private company employees (144 | 69.9%), not-for-profit organizations (31 | 15.0%), and self-employed (not incorporated) (22 | 10.7%) make up the most common classes of employment.
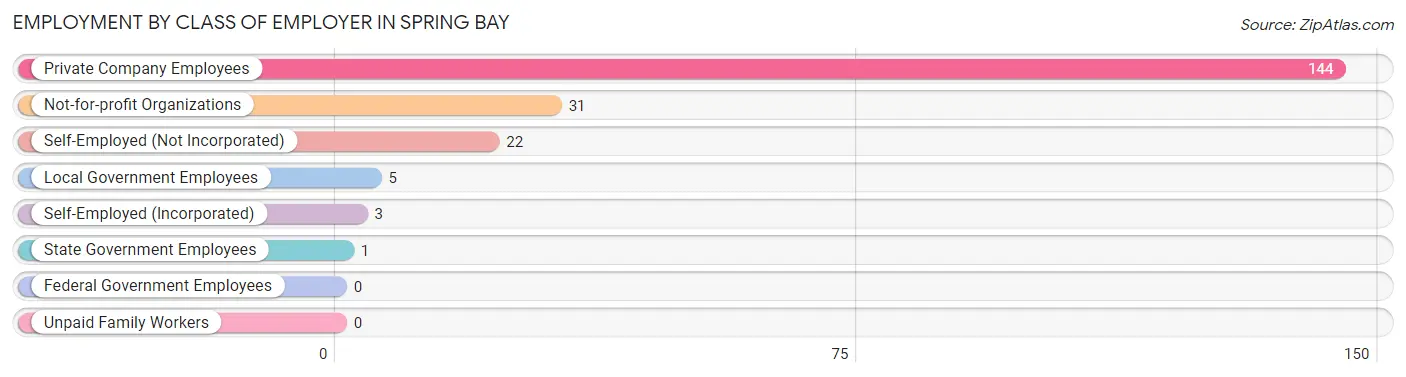
| Employer Class | # Employees | % Employees |
| Private Company Employees | 144 | 69.9% |
| Self-Employed (Incorporated) | 3 | 1.5% |
| Self-Employed (Not Incorporated) | 22 | 10.7% |
| Not-for-profit Organizations | 31 | 15.0% |
| Local Government Employees | 5 | 2.4% |
| State Government Employees | 1 | 0.5% |
| Federal Government Employees | 0 | 0.0% |
| Unpaid Family Workers | 0 | 0.0% |
| Total | 206 | 100.0% |
Employment Status by Age in Spring Bay
According to the labor force statistics for Spring Bay, out of the total population over 16 years of age (393), 55.7% or 219 individuals are in the labor force, with 5.9% or 13 of them unemployed. The age group with the highest labor force participation rate is 30 to 34 years, with 100.0% or 24 individuals in the labor force. Within the labor force, the 55 to 59 years age range has the highest percentage of unemployed individuals, with 17.4% or 4 of them being unemployed.
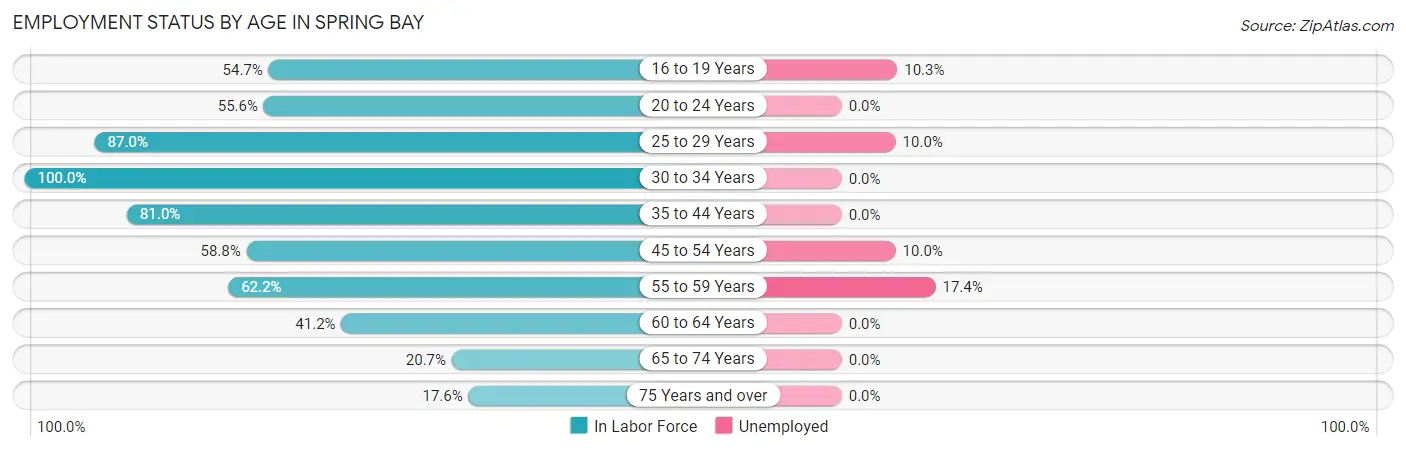
| Age Bracket | In Labor Force | Unemployed |
| 16 to 19 Years | 29 (54.7%) | 3 (10.3%) |
| 20 to 24 Years | 5 (55.6%) | 0 (0.0%) |
| 25 to 29 Years | 20 (87.0%) | 2 (10.0%) |
| 30 to 34 Years | 24 (100.0%) | 0 (0.0%) |
| 35 to 44 Years | 51 (81.0%) | 0 (0.0%) |
| 45 to 54 Years | 40 (58.8%) | 4 (10.0%) |
| 55 to 59 Years | 23 (62.2%) | 4 (17.4%) |
| 60 to 64 Years | 7 (41.2%) | 0 (0.0%) |
| 65 to 74 Years | 17 (20.7%) | 0 (0.0%) |
| 75 Years and over | 3 (17.6%) | 0 (0.0%) |
| Total | 219 (55.7%) | 13 (5.9%) |
Employment Status by Educational Attainment in Spring Bay
According to labor force statistics for Spring Bay, 71.1% of individuals (165) out of the total population between 25 and 64 years of age (232) are in the labor force, with 6.1% or 10 of them being unemployed. The group with the highest labor force participation rate are those with the educational attainment of high school diploma, with 80.4% or 86 individuals in the labor force. Within the labor force, individuals with high school diploma education have the highest percentage of unemployment, with 11.6% or 10 of them being unemployed.
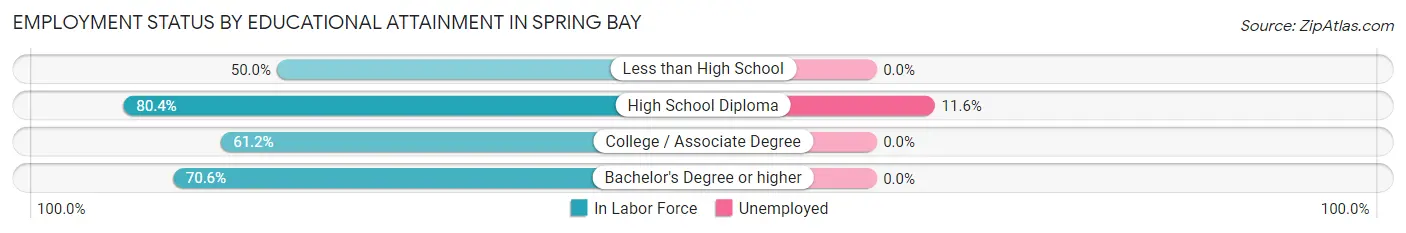
| Educational Attainment | In Labor Force | Unemployed |
| Less than High School | 3 (50.0%) | 0 (0.0%) |
| High School Diploma | 86 (80.4%) | 12 (11.6%) |
| College / Associate Degree | 52 (61.2%) | 0 (0.0%) |
| Bachelor's Degree or higher | 24 (70.6%) | 0 (0.0%) |
| Total | 165 (71.1%) | 14 (6.1%) |
Employment Occupations by Sex in Spring Bay
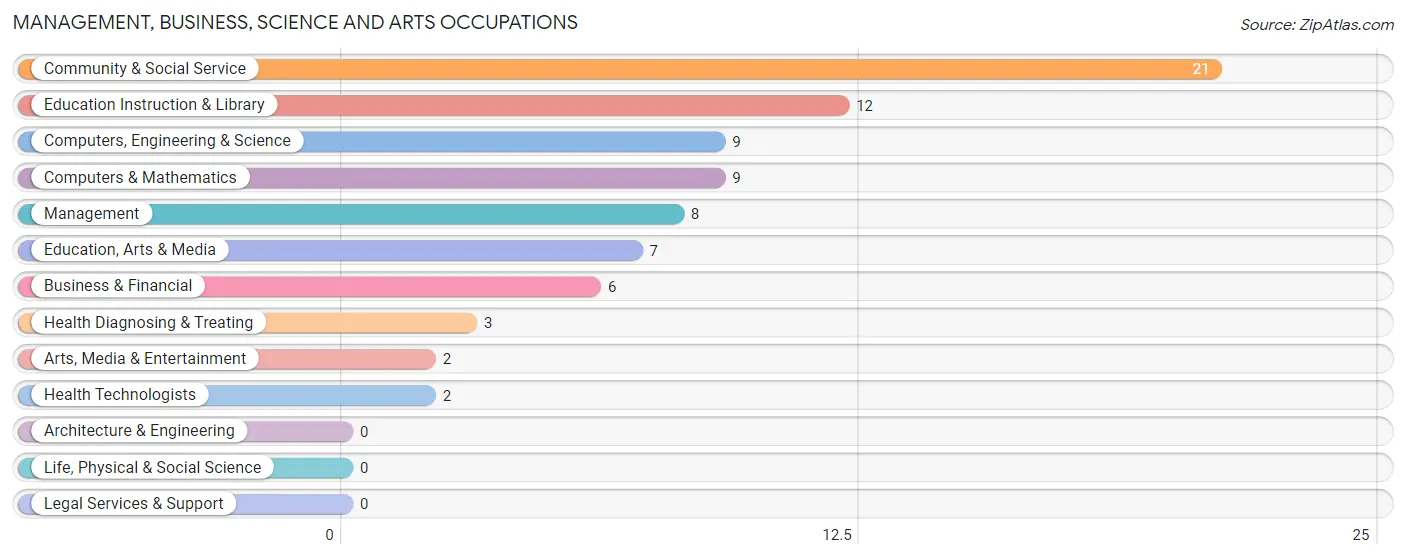
Management, Business, Science and Arts Occupations
The most common Management, Business, Science and Arts occupations in Spring Bay are Community & Social Service (21 | 10.2%), Education Instruction & Library (12 | 5.8%), Computers, Engineering & Science (9 | 4.4%), Computers & Mathematics (9 | 4.4%), and Management (8 | 3.9%).
Management, Business, Science and Arts Occupations by Sex
Within the Management, Business, Science and Arts occupations in Spring Bay, the most male-oriented occupations are Education, Arts & Media (100.0%), Management (87.5%), and Business & Financial (83.3%), while the most female-oriented occupations are Education Instruction & Library (100.0%), Arts, Media & Entertainment (100.0%), and Health Diagnosing & Treating (100.0%).
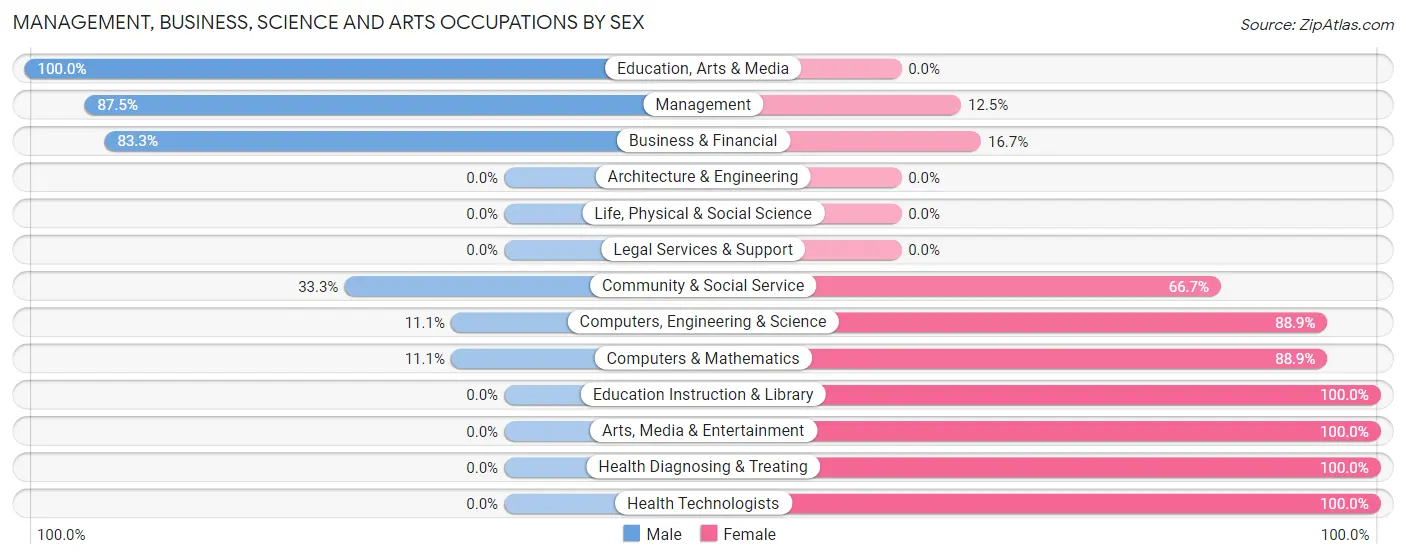
| Occupation | Male | Female |
| Management | 7 (87.5%) | 1 (12.5%) |
| Business & Financial | 5 (83.3%) | 1 (16.7%) |
| Computers, Engineering & Science | 1 (11.1%) | 8 (88.9%) |
| Computers & Mathematics | 1 (11.1%) | 8 (88.9%) |
| Architecture & Engineering | 0 (0.0%) | 0 (0.0%) |
| Life, Physical & Social Science | 0 (0.0%) | 0 (0.0%) |
| Community & Social Service | 7 (33.3%) | 14 (66.7%) |
| Education, Arts & Media | 7 (100.0%) | 0 (0.0%) |
| Legal Services & Support | 0 (0.0%) | 0 (0.0%) |
| Education Instruction & Library | 0 (0.0%) | 12 (100.0%) |
| Arts, Media & Entertainment | 0 (0.0%) | 2 (100.0%) |
| Health Diagnosing & Treating | 0 (0.0%) | 3 (100.0%) |
| Health Technologists | 0 (0.0%) | 2 (100.0%) |
| Total (Category) | 20 (42.5%) | 27 (57.5%) |
| Total (Overall) | 131 (63.6%) | 75 (36.4%) |
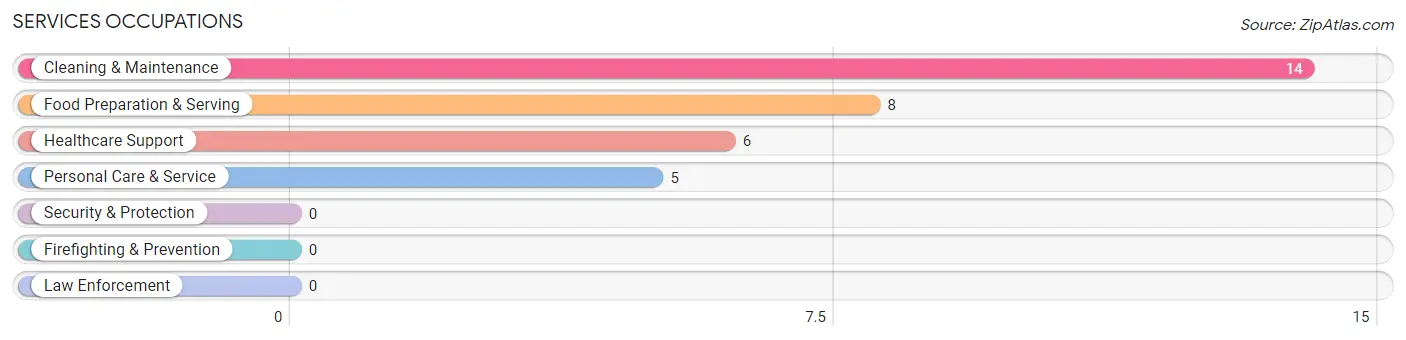
Services Occupations
The most common Services occupations in Spring Bay are Cleaning & Maintenance (14 | 6.8%), Food Preparation & Serving (8 | 3.9%), Healthcare Support (6 | 2.9%), and Personal Care & Service (5 | 2.4%).
Services Occupations by Sex
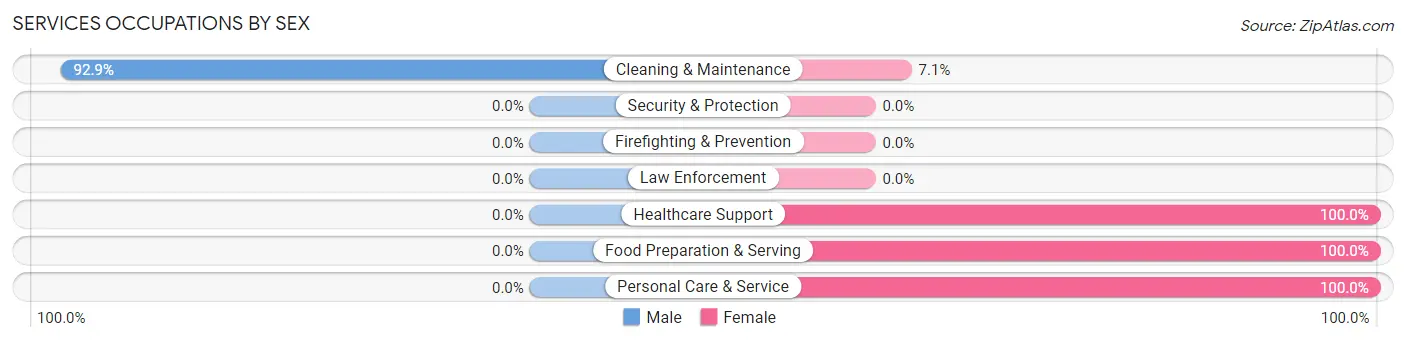
| Occupation | Male | Female |
| Healthcare Support | 0 (0.0%) | 6 (100.0%) |
| Security & Protection | 0 (0.0%) | 0 (0.0%) |
| Firefighting & Prevention | 0 (0.0%) | 0 (0.0%) |
| Law Enforcement | 0 (0.0%) | 0 (0.0%) |
| Food Preparation & Serving | 0 (0.0%) | 8 (100.0%) |
| Cleaning & Maintenance | 13 (92.9%) | 1 (7.1%) |
| Personal Care & Service | 0 (0.0%) | 5 (100.0%) |
| Total (Category) | 13 (39.4%) | 20 (60.6%) |
| Total (Overall) | 131 (63.6%) | 75 (36.4%) |
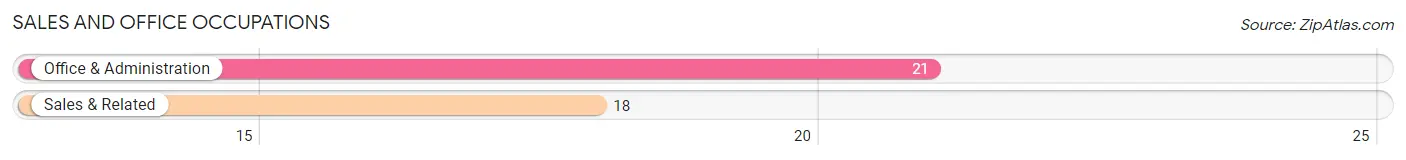
Sales and Office Occupations
The most common Sales and Office occupations in Spring Bay are Office & Administration (21 | 10.2%), and Sales & Related (18 | 8.7%).
Sales and Office Occupations by Sex
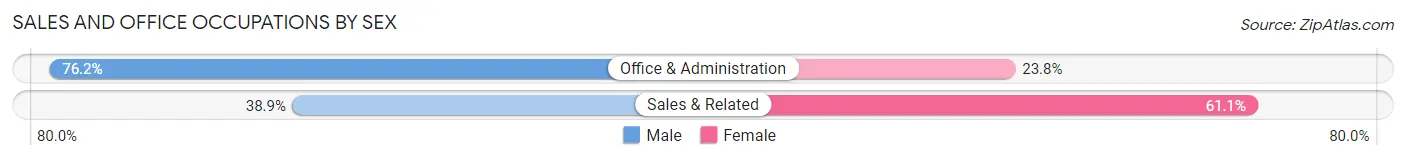
| Occupation | Male | Female |
| Sales & Related | 7 (38.9%) | 11 (61.1%) |
| Office & Administration | 16 (76.2%) | 5 (23.8%) |
| Total (Category) | 23 (59.0%) | 16 (41.0%) |
| Total (Overall) | 131 (63.6%) | 75 (36.4%) |
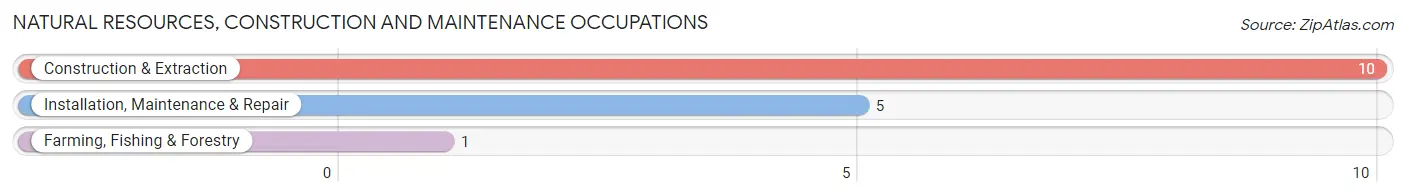
Natural Resources, Construction and Maintenance Occupations
The most common Natural Resources, Construction and Maintenance occupations in Spring Bay are Construction & Extraction (10 | 4.9%), Installation, Maintenance & Repair (5 | 2.4%), and Farming, Fishing & Forestry (1 | 0.5%).
Natural Resources, Construction and Maintenance Occupations by Sex
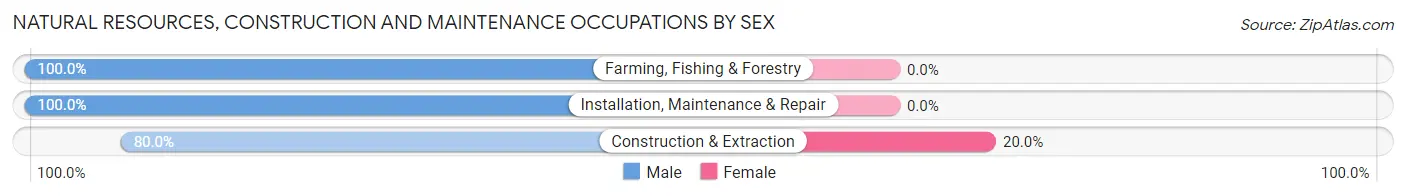
| Occupation | Male | Female |
| Farming, Fishing & Forestry | 1 (100.0%) | 0 (0.0%) |
| Construction & Extraction | 8 (80.0%) | 2 (20.0%) |
| Installation, Maintenance & Repair | 5 (100.0%) | 0 (0.0%) |
| Total (Category) | 14 (87.5%) | 2 (12.5%) |
| Total (Overall) | 131 (63.6%) | 75 (36.4%) |
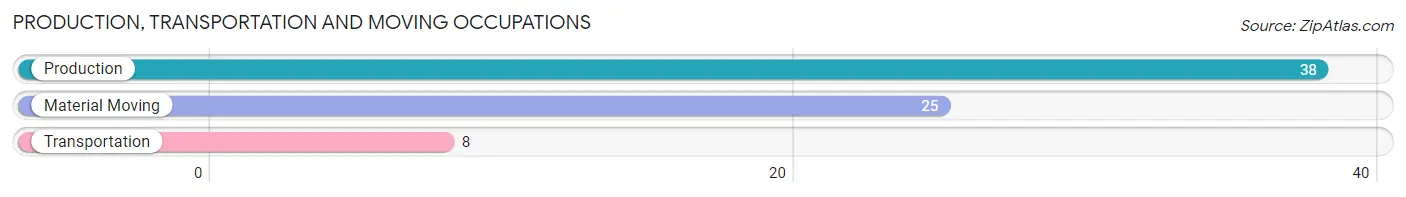
Production, Transportation and Moving Occupations
The most common Production, Transportation and Moving occupations in Spring Bay are Production (38 | 18.4%), Material Moving (25 | 12.1%), and Transportation (8 | 3.9%).
Production, Transportation and Moving Occupations by Sex
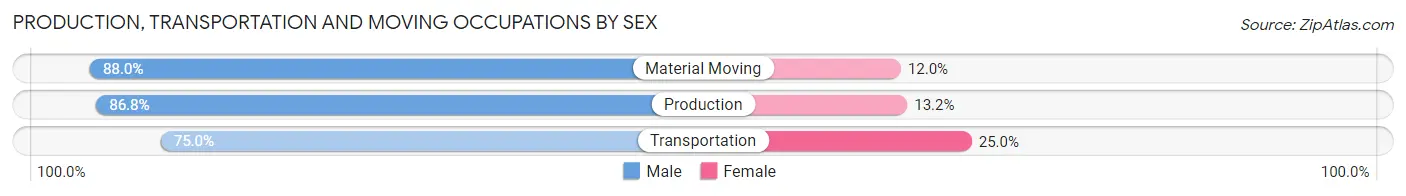
| Occupation | Male | Female |
| Production | 33 (86.8%) | 5 (13.2%) |
| Transportation | 6 (75.0%) | 2 (25.0%) |
| Material Moving | 22 (88.0%) | 3 (12.0%) |
| Total (Category) | 61 (85.9%) | 10 (14.1%) |
| Total (Overall) | 131 (63.6%) | 75 (36.4%) |
Employment Industries by Sex in Spring Bay
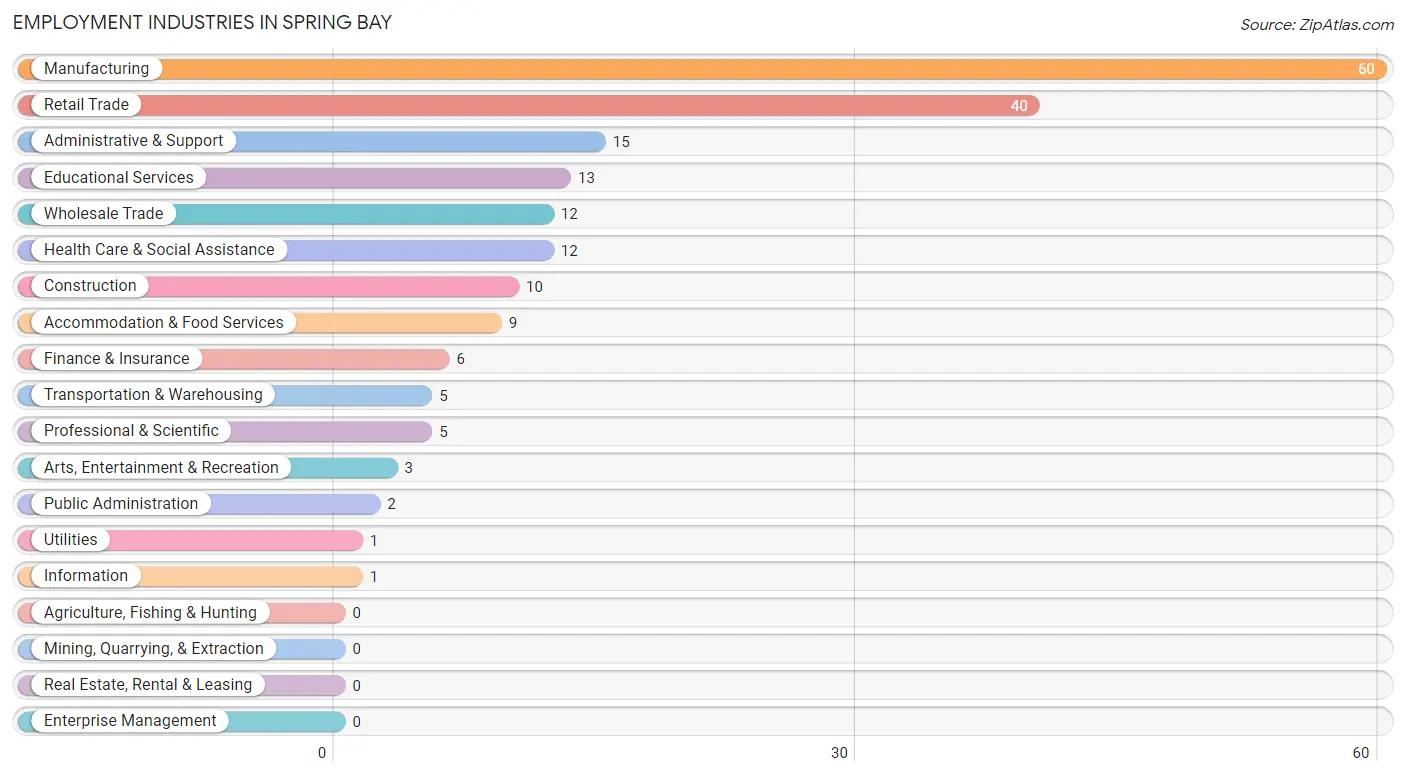
Employment Industries in Spring Bay
The major employment industries in Spring Bay include Manufacturing (60 | 29.1%), Retail Trade (40 | 19.4%), Administrative & Support (15 | 7.3%), Educational Services (13 | 6.3%), and Wholesale Trade (12 | 5.8%).
Employment Industries by Sex in Spring Bay
The Spring Bay industries that see more men than women are Transportation & Warehousing (100.0%), Utilities (100.0%), and Administrative & Support (100.0%), whereas the industries that tend to have a higher number of women are Information (100.0%), Health Care & Social Assistance (100.0%), and Accommodation & Food Services (100.0%).
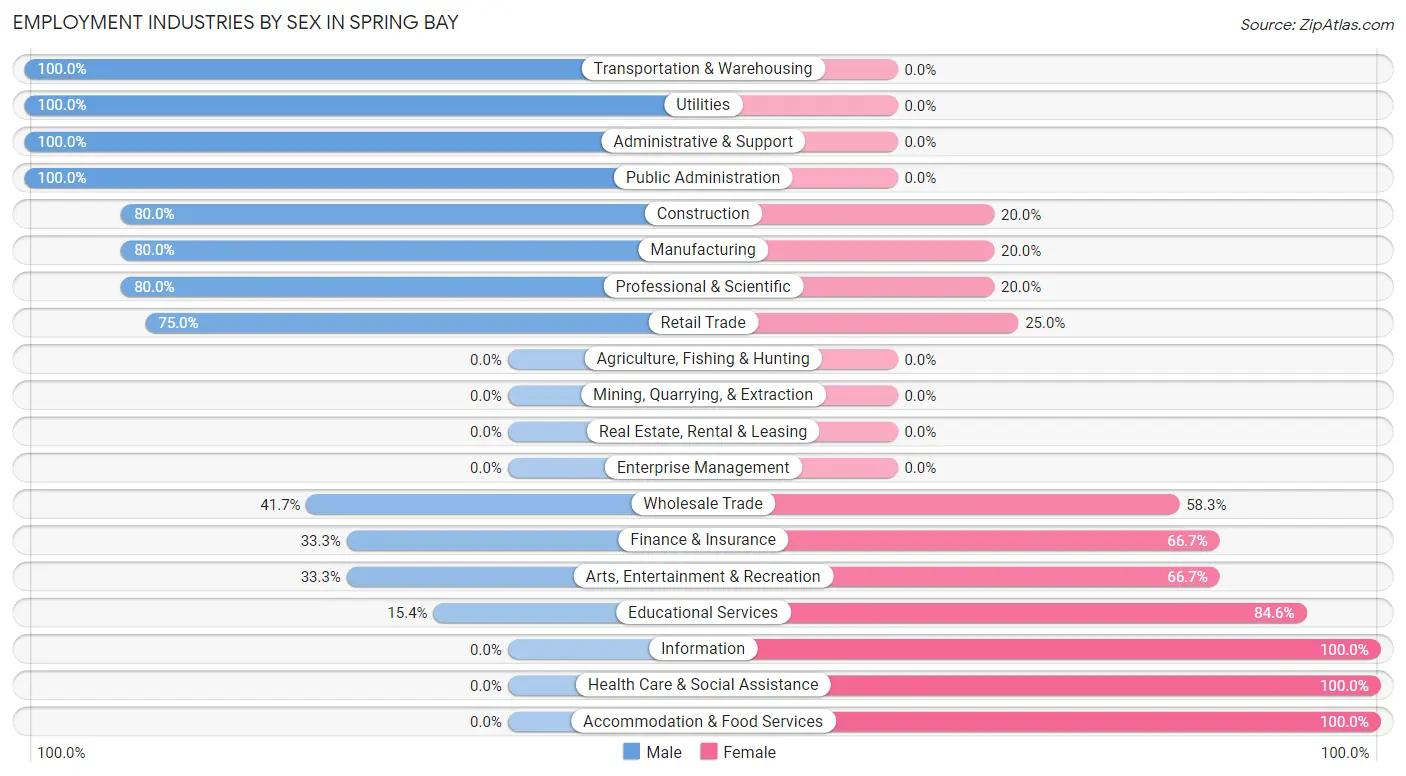
| Industry | Male | Female |
| Agriculture, Fishing & Hunting | 0 (0.0%) | 0 (0.0%) |
| Mining, Quarrying, & Extraction | 0 (0.0%) | 0 (0.0%) |
| Construction | 8 (80.0%) | 2 (20.0%) |
| Manufacturing | 48 (80.0%) | 12 (20.0%) |
| Wholesale Trade | 5 (41.7%) | 7 (58.3%) |
| Retail Trade | 30 (75.0%) | 10 (25.0%) |
| Transportation & Warehousing | 5 (100.0%) | 0 (0.0%) |
| Utilities | 1 (100.0%) | 0 (0.0%) |
| Information | 0 (0.0%) | 1 (100.0%) |
| Finance & Insurance | 2 (33.3%) | 4 (66.7%) |
| Real Estate, Rental & Leasing | 0 (0.0%) | 0 (0.0%) |
| Professional & Scientific | 4 (80.0%) | 1 (20.0%) |
| Enterprise Management | 0 (0.0%) | 0 (0.0%) |
| Administrative & Support | 15 (100.0%) | 0 (0.0%) |
| Educational Services | 2 (15.4%) | 11 (84.6%) |
| Health Care & Social Assistance | 0 (0.0%) | 12 (100.0%) |
| Arts, Entertainment & Recreation | 1 (33.3%) | 2 (66.7%) |
| Accommodation & Food Services | 0 (0.0%) | 9 (100.0%) |
| Public Administration | 2 (100.0%) | 0 (0.0%) |
| Total | 131 (63.6%) | 75 (36.4%) |
Education in Spring Bay
School Enrollment in Spring Bay
The most common levels of schooling among the 124 students in Spring Bay are high school (40 | 32.3%), elementary school (35 | 28.2%), and college / undergraduate (24 | 19.4%).
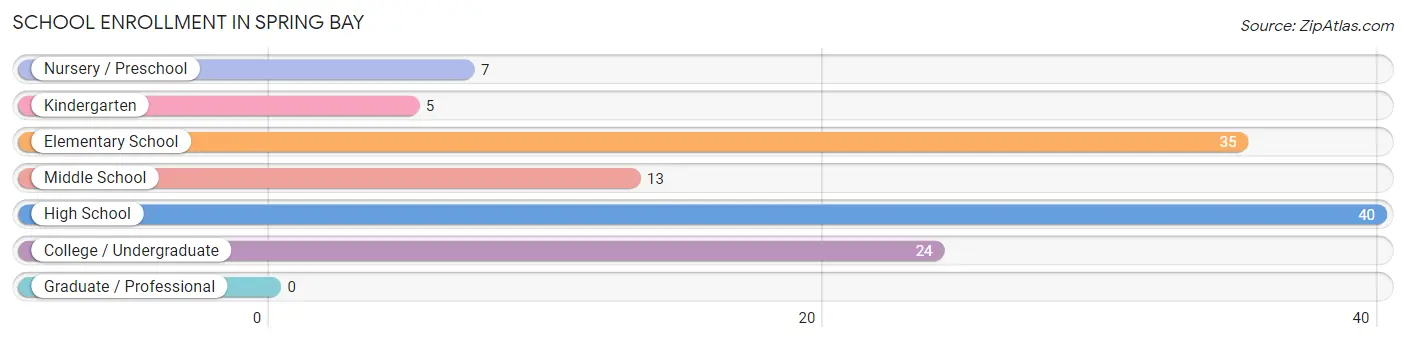
| School Level | # Students | % Students |
| Nursery / Preschool | 7 | 5.7% |
| Kindergarten | 5 | 4.0% |
| Elementary School | 35 | 28.2% |
| Middle School | 13 | 10.5% |
| High School | 40 | 32.3% |
| College / Undergraduate | 24 | 19.4% |
| Graduate / Professional | 0 | 0.0% |
| Total | 124 | 100.0% |
School Enrollment by Age by Funding Source in Spring Bay
Out of a total of 124 students who are enrolled in schools in Spring Bay, 30 (24.2%) attend a private institution, while the remaining 94 (75.8%) are enrolled in public schools. The age group of 3 to 4 year olds has the highest likelihood of being enrolled in private schools, with 6 (100.0% in the age bracket) enrolled. Conversely, the age group of 20 to 24 year olds has the lowest likelihood of being enrolled in a private school, with 2 (100.0% in the age bracket) attending a public institution.
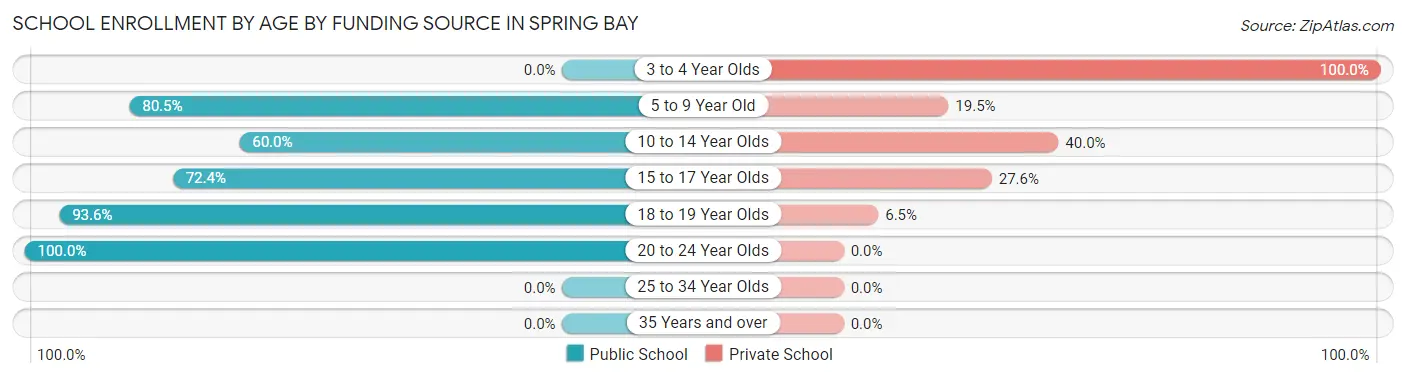
| Age Bracket | Public School | Private School |
| 3 to 4 Year Olds | 0 (0.0%) | 6 (100.0%) |
| 5 to 9 Year Old | 33 (80.5%) | 8 (19.5%) |
| 10 to 14 Year Olds | 9 (60.0%) | 6 (40.0%) |
| 15 to 17 Year Olds | 21 (72.4%) | 8 (27.6%) |
| 18 to 19 Year Olds | 29 (93.5%) | 2 (6.5%) |
| 20 to 24 Year Olds | 2 (100.0%) | 0 (0.0%) |
| 25 to 34 Year Olds | 0 (0.0%) | 0 (0.0%) |
| 35 Years and over | 0 (0.0%) | 0 (0.0%) |
| Total | 94 (75.8%) | 30 (24.2%) |
Educational Attainment by Field of Study in Spring Bay
Business (12 | 27.3%), arts & humanities (8 | 18.2%), visual & performing arts (6 | 13.6%), liberal arts & history (5 | 11.4%), and communications (3 | 6.8%) are the most common fields of study among 44 individuals in Spring Bay who have obtained a bachelor's degree or higher.
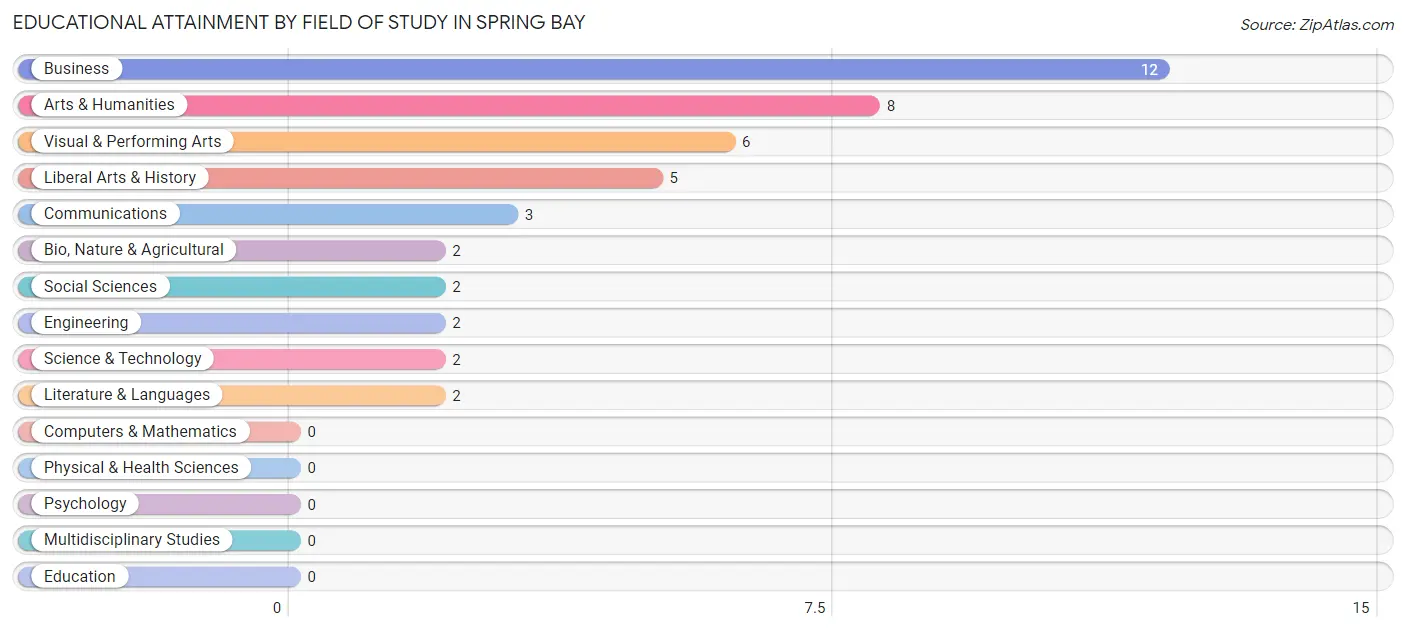
| Field of Study | # Graduates | % Graduates |
| Computers & Mathematics | 0 | 0.0% |
| Bio, Nature & Agricultural | 2 | 4.5% |
| Physical & Health Sciences | 0 | 0.0% |
| Psychology | 0 | 0.0% |
| Social Sciences | 2 | 4.5% |
| Engineering | 2 | 4.5% |
| Multidisciplinary Studies | 0 | 0.0% |
| Science & Technology | 2 | 4.5% |
| Business | 12 | 27.3% |
| Education | 0 | 0.0% |
| Literature & Languages | 2 | 4.5% |
| Liberal Arts & History | 5 | 11.4% |
| Visual & Performing Arts | 6 | 13.6% |
| Communications | 3 | 6.8% |
| Arts & Humanities | 8 | 18.2% |
| Total | 44 | 100.0% |
Transportation & Commute in Spring Bay
Vehicle Availability by Sex in Spring Bay
The most prevalent vehicle ownership categories in Spring Bay are males with 2 vehicles (91, accounting for 69.5%) and females with 2 vehicles (44, making up 121.3%).
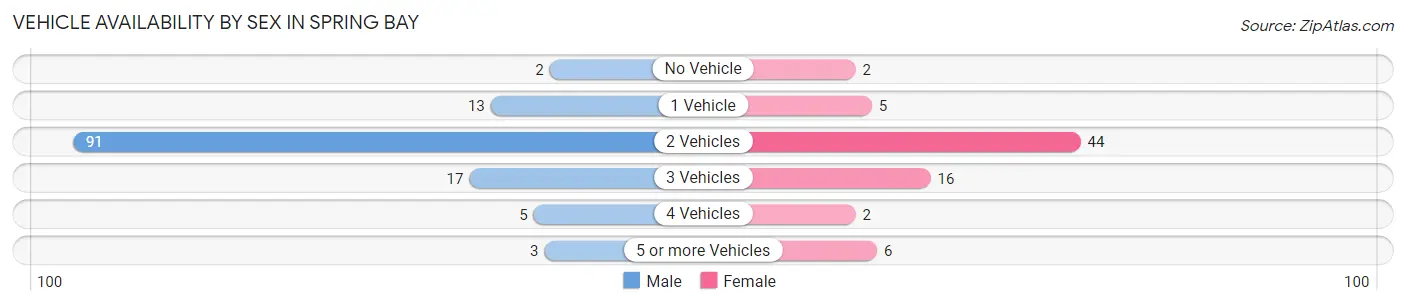
| Vehicles Available | Male | Female |
| No Vehicle | 2 (1.5%) | 2 (2.7%) |
| 1 Vehicle | 13 (9.9%) | 5 (6.7%) |
| 2 Vehicles | 91 (69.5%) | 44 (58.7%) |
| 3 Vehicles | 17 (13.0%) | 16 (21.3%) |
| 4 Vehicles | 5 (3.8%) | 2 (2.7%) |
| 5 or more Vehicles | 3 (2.3%) | 6 (8.0%) |
| Total | 131 (100.0%) | 75 (100.0%) |
Commute Time in Spring Bay
The most frequently occuring commute durations in Spring Bay are 30 to 34 minutes (42 commuters, 22.8%), 20 to 24 minutes (33 commuters, 17.9%), and 5 to 9 minutes (27 commuters, 14.7%).
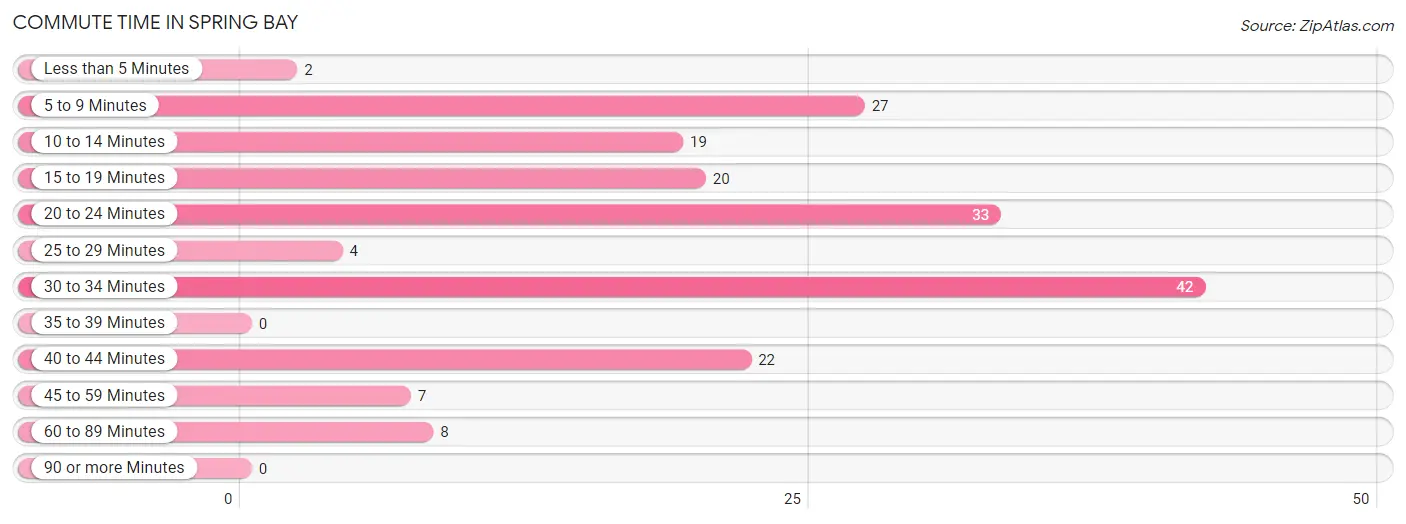
| Commute Time | # Commuters | % Commuters |
| Less than 5 Minutes | 2 | 1.1% |
| 5 to 9 Minutes | 27 | 14.7% |
| 10 to 14 Minutes | 19 | 10.3% |
| 15 to 19 Minutes | 20 | 10.9% |
| 20 to 24 Minutes | 33 | 17.9% |
| 25 to 29 Minutes | 4 | 2.2% |
| 30 to 34 Minutes | 42 | 22.8% |
| 35 to 39 Minutes | 0 | 0.0% |
| 40 to 44 Minutes | 22 | 12.0% |
| 45 to 59 Minutes | 7 | 3.8% |
| 60 to 89 Minutes | 8 | 4.3% |
| 90 or more Minutes | 0 | 0.0% |
Commute Time by Sex in Spring Bay
The most common commute times in Spring Bay are 40 to 44 minutes (22 commuters, 17.9%) for males and 30 to 34 minutes (25 commuters, 41.0%) for females.
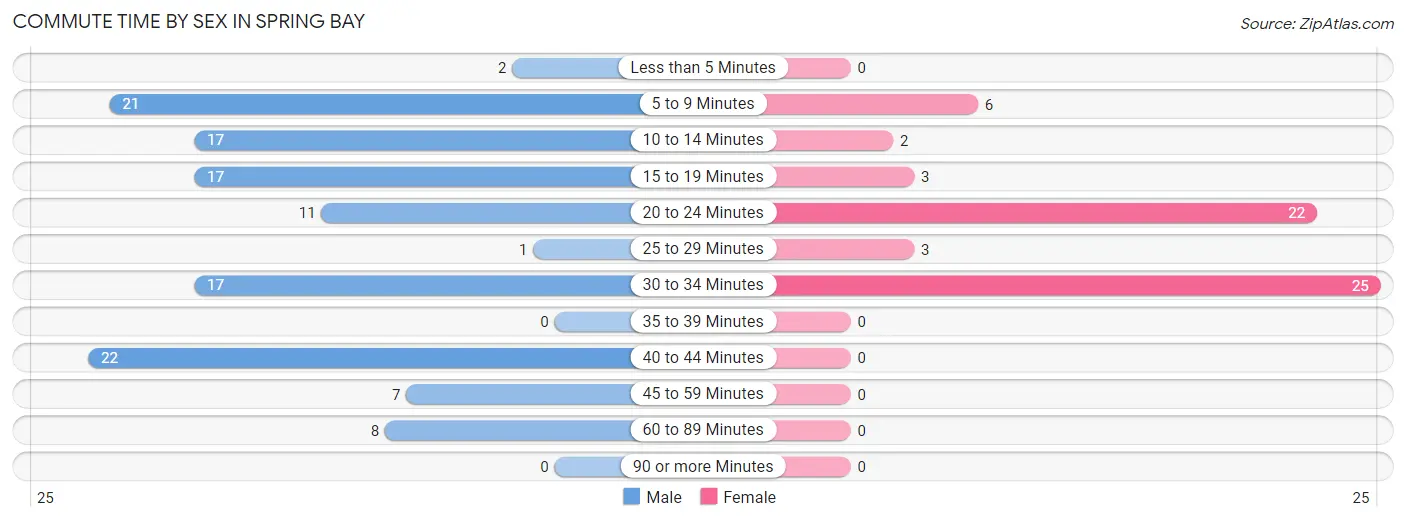
| Commute Time | Male | Female |
| Less than 5 Minutes | 2 (1.6%) | 0 (0.0%) |
| 5 to 9 Minutes | 21 (17.1%) | 6 (9.8%) |
| 10 to 14 Minutes | 17 (13.8%) | 2 (3.3%) |
| 15 to 19 Minutes | 17 (13.8%) | 3 (4.9%) |
| 20 to 24 Minutes | 11 (8.9%) | 22 (36.1%) |
| 25 to 29 Minutes | 1 (0.8%) | 3 (4.9%) |
| 30 to 34 Minutes | 17 (13.8%) | 25 (41.0%) |
| 35 to 39 Minutes | 0 (0.0%) | 0 (0.0%) |
| 40 to 44 Minutes | 22 (17.9%) | 0 (0.0%) |
| 45 to 59 Minutes | 7 (5.7%) | 0 (0.0%) |
| 60 to 89 Minutes | 8 (6.5%) | 0 (0.0%) |
| 90 or more Minutes | 0 (0.0%) | 0 (0.0%) |
Time of Departure to Work by Sex in Spring Bay
The most frequent times of departure to work in Spring Bay are 4:00 PM to 11:59 PM (23, 18.7%) for males and 7:30 AM to 7:59 AM (16, 26.2%) for females.
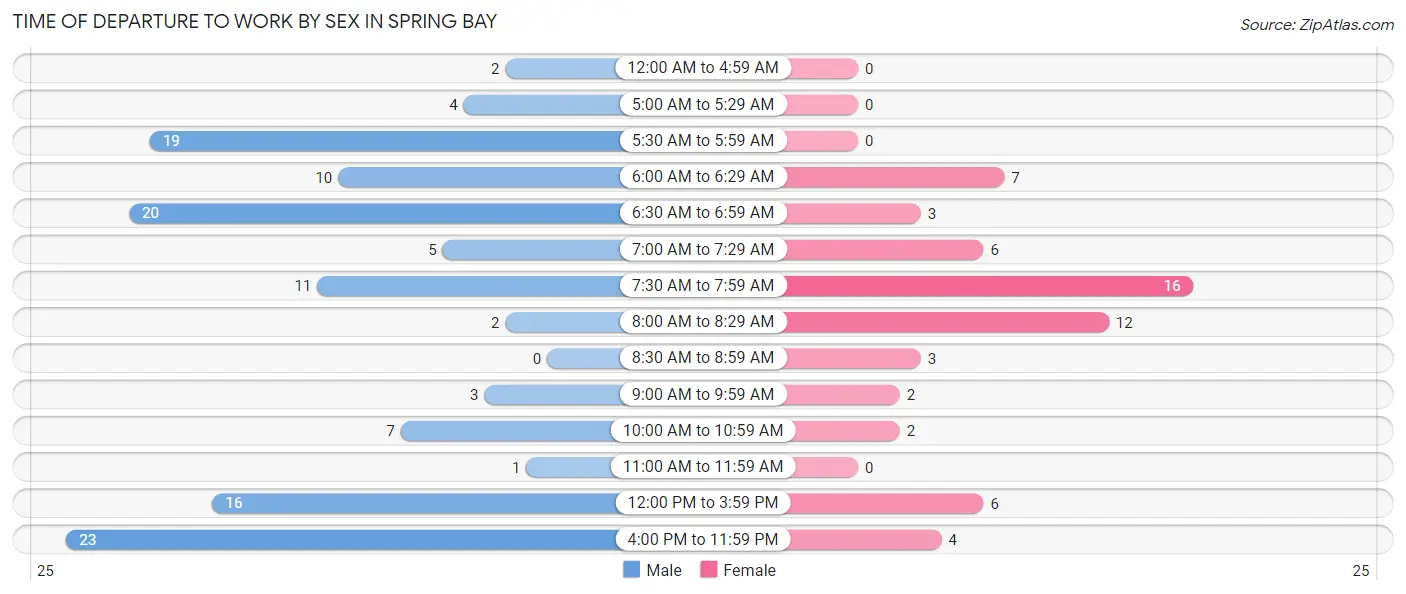
| Time of Departure | Male | Female |
| 12:00 AM to 4:59 AM | 2 (1.6%) | 0 (0.0%) |
| 5:00 AM to 5:29 AM | 4 (3.3%) | 0 (0.0%) |
| 5:30 AM to 5:59 AM | 19 (15.4%) | 0 (0.0%) |
| 6:00 AM to 6:29 AM | 10 (8.1%) | 7 (11.5%) |
| 6:30 AM to 6:59 AM | 20 (16.3%) | 3 (4.9%) |
| 7:00 AM to 7:29 AM | 5 (4.1%) | 6 (9.8%) |
| 7:30 AM to 7:59 AM | 11 (8.9%) | 16 (26.2%) |
| 8:00 AM to 8:29 AM | 2 (1.6%) | 12 (19.7%) |
| 8:30 AM to 8:59 AM | 0 (0.0%) | 3 (4.9%) |
| 9:00 AM to 9:59 AM | 3 (2.4%) | 2 (3.3%) |
| 10:00 AM to 10:59 AM | 7 (5.7%) | 2 (3.3%) |
| 11:00 AM to 11:59 AM | 1 (0.8%) | 0 (0.0%) |
| 12:00 PM to 3:59 PM | 16 (13.0%) | 6 (9.8%) |
| 4:00 PM to 11:59 PM | 23 (18.7%) | 4 (6.6%) |
| Total | 123 (100.0%) | 61 (100.0%) |
Housing Occupancy in Spring Bay
Occupancy by Ownership in Spring Bay
Of the total 180 dwellings in Spring Bay, owner-occupied units account for 123 (68.3%), while renter-occupied units make up 57 (31.7%).
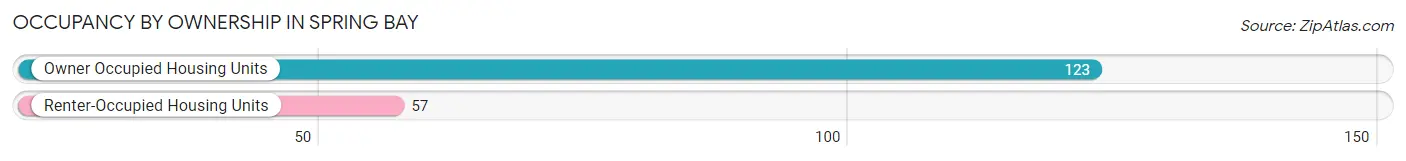
| Occupancy | # Housing Units | % Housing Units |
| Owner Occupied Housing Units | 123 | 68.3% |
| Renter-Occupied Housing Units | 57 | 31.7% |
| Total Occupied Housing Units | 180 | 100.0% |
Occupancy by Household Size in Spring Bay
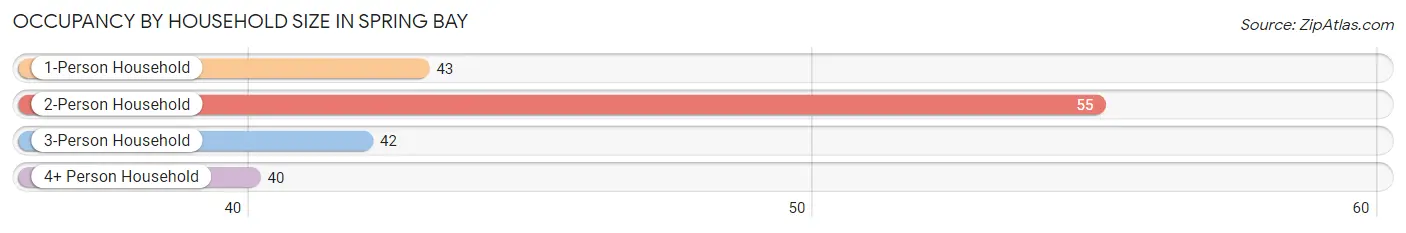
| Household Size | # Housing Units | % Housing Units |
| 1-Person Household | 43 | 23.9% |
| 2-Person Household | 55 | 30.6% |
| 3-Person Household | 42 | 23.3% |
| 4+ Person Household | 40 | 22.2% |
| Total Housing Units | 180 | 100.0% |
Occupancy by Ownership by Household Size in Spring Bay
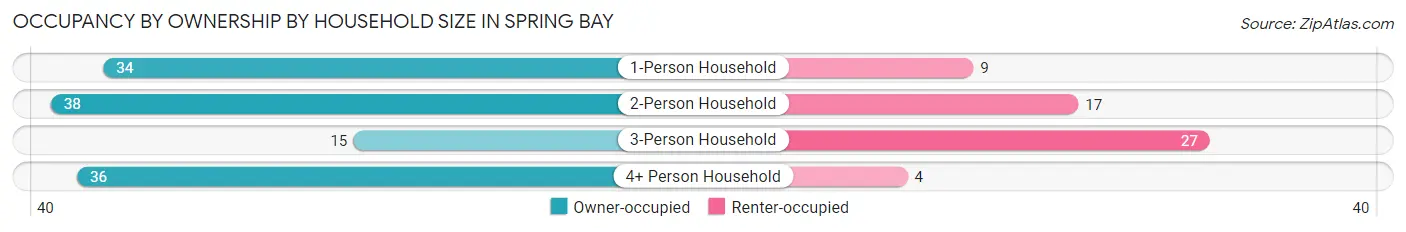
| Household Size | Owner-occupied | Renter-occupied |
| 1-Person Household | 34 (79.1%) | 9 (20.9%) |
| 2-Person Household | 38 (69.1%) | 17 (30.9%) |
| 3-Person Household | 15 (35.7%) | 27 (64.3%) |
| 4+ Person Household | 36 (90.0%) | 4 (10.0%) |
| Total Housing Units | 123 (68.3%) | 57 (31.7%) |
Occupancy by Educational Attainment in Spring Bay
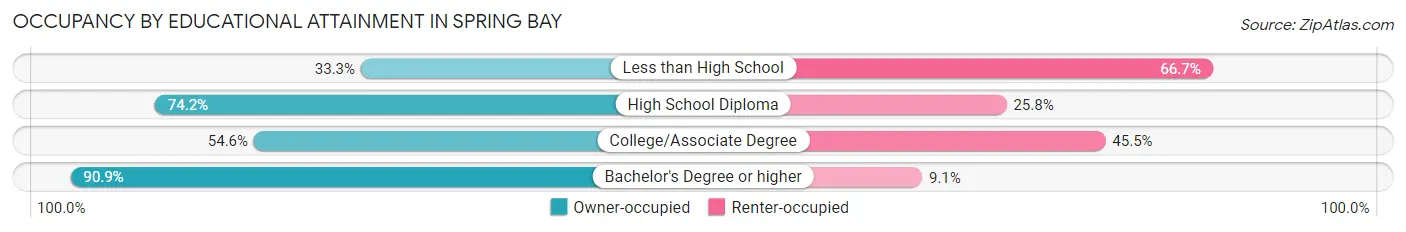
| Household Size | Owner-occupied | Renter-occupied |
| Less than High School | 1 (33.3%) | 2 (66.7%) |
| High School Diploma | 66 (74.2%) | 23 (25.8%) |
| College/Associate Degree | 36 (54.5%) | 30 (45.5%) |
| Bachelor's Degree or higher | 20 (90.9%) | 2 (9.1%) |
Occupancy by Age of Householder in Spring Bay
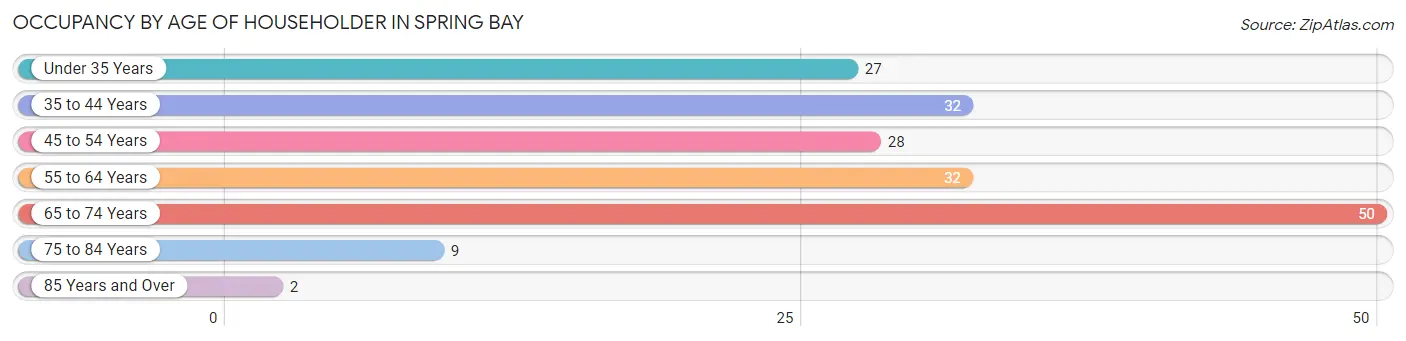
| Age Bracket | # Households | % Households |
| Under 35 Years | 27 | 15.0% |
| 35 to 44 Years | 32 | 17.8% |
| 45 to 54 Years | 28 | 15.6% |
| 55 to 64 Years | 32 | 17.8% |
| 65 to 74 Years | 50 | 27.8% |
| 75 to 84 Years | 9 | 5.0% |
| 85 Years and Over | 2 | 1.1% |
| Total | 180 | 100.0% |
Housing Finances in Spring Bay
Median Income by Occupancy in Spring Bay
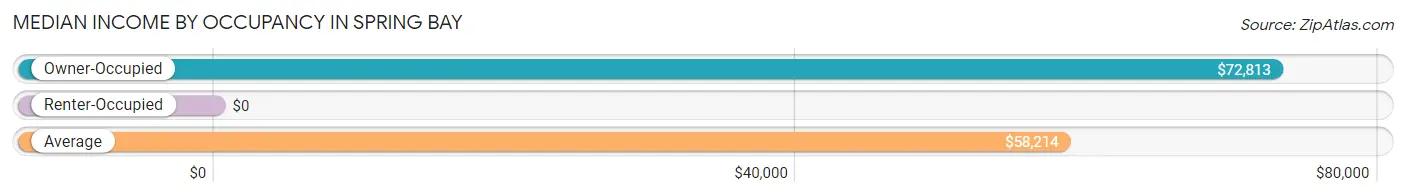
| Occupancy Type | # Households | Median Income |
| Owner-Occupied | 123 (68.3%) | $72,813 |
| Renter-Occupied | 57 (31.7%) | $0 |
| Average | 180 (100.0%) | $58,214 |
Occupancy by Householder Income Bracket in Spring Bay
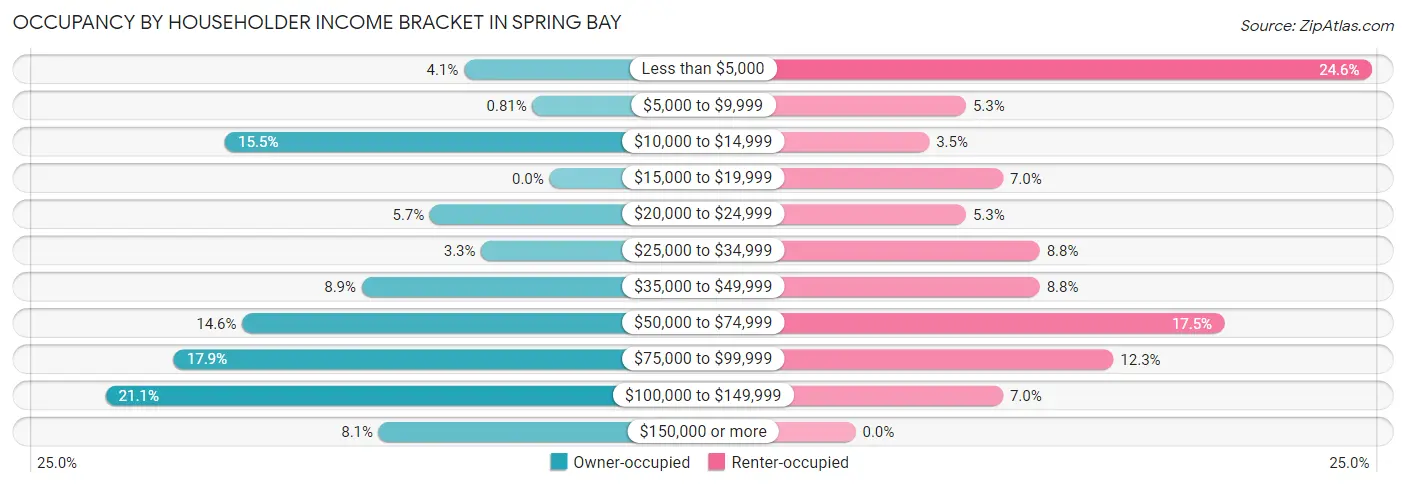
| Income Bracket | Owner-occupied | Renter-occupied |
| Less than $5,000 | 5 (4.1%) | 14 (24.6%) |
| $5,000 to $9,999 | 1 (0.8%) | 3 (5.3%) |
| $10,000 to $14,999 | 19 (15.4%) | 2 (3.5%) |
| $15,000 to $19,999 | 0 (0.0%) | 4 (7.0%) |
| $20,000 to $24,999 | 7 (5.7%) | 3 (5.3%) |
| $25,000 to $34,999 | 4 (3.3%) | 5 (8.8%) |
| $35,000 to $49,999 | 11 (8.9%) | 5 (8.8%) |
| $50,000 to $74,999 | 18 (14.6%) | 10 (17.5%) |
| $75,000 to $99,999 | 22 (17.9%) | 7 (12.3%) |
| $100,000 to $149,999 | 26 (21.1%) | 4 (7.0%) |
| $150,000 or more | 10 (8.1%) | 0 (0.0%) |
| Total | 123 (100.0%) | 57 (100.0%) |
Monthly Housing Cost Tiers in Spring Bay
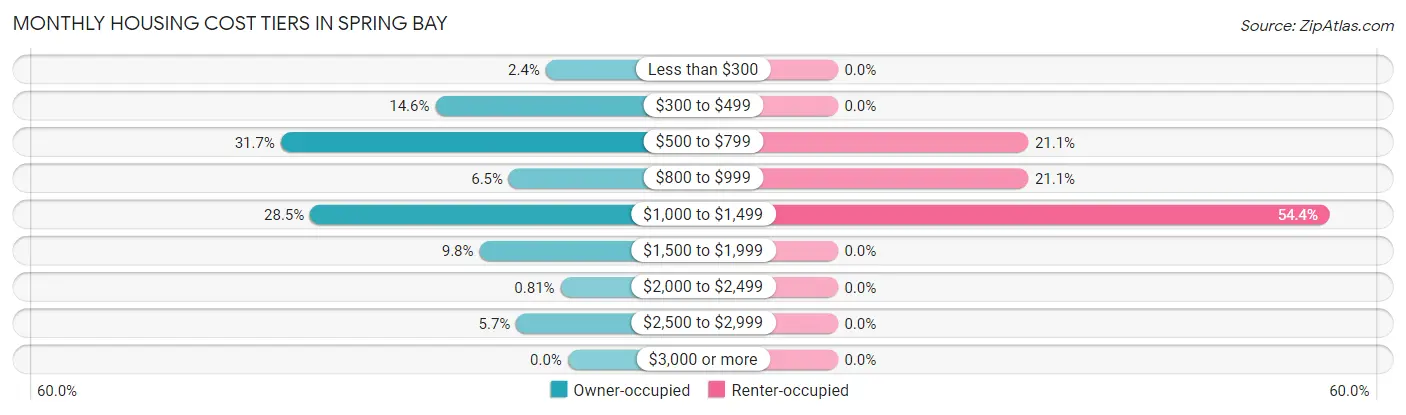
| Monthly Cost | Owner-occupied | Renter-occupied |
| Less than $300 | 3 (2.4%) | 0 (0.0%) |
| $300 to $499 | 18 (14.6%) | 0 (0.0%) |
| $500 to $799 | 39 (31.7%) | 12 (21.0%) |
| $800 to $999 | 8 (6.5%) | 12 (21.0%) |
| $1,000 to $1,499 | 35 (28.5%) | 31 (54.4%) |
| $1,500 to $1,999 | 12 (9.8%) | 0 (0.0%) |
| $2,000 to $2,499 | 1 (0.8%) | 0 (0.0%) |
| $2,500 to $2,999 | 7 (5.7%) | 0 (0.0%) |
| $3,000 or more | 0 (0.0%) | 0 (0.0%) |
| Total | 123 (100.0%) | 57 (100.0%) |
Physical Housing Characteristics in Spring Bay
Housing Structures in Spring Bay
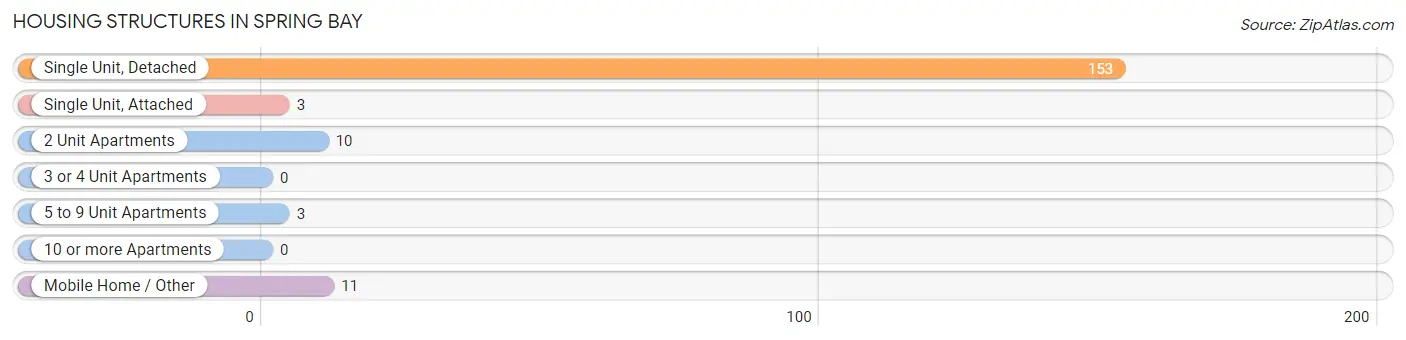
| Structure Type | # Housing Units | % Housing Units |
| Single Unit, Detached | 153 | 85.0% |
| Single Unit, Attached | 3 | 1.7% |
| 2 Unit Apartments | 10 | 5.6% |
| 3 or 4 Unit Apartments | 0 | 0.0% |
| 5 to 9 Unit Apartments | 3 | 1.7% |
| 10 or more Apartments | 0 | 0.0% |
| Mobile Home / Other | 11 | 6.1% |
| Total | 180 | 100.0% |
Housing Structures by Occupancy in Spring Bay
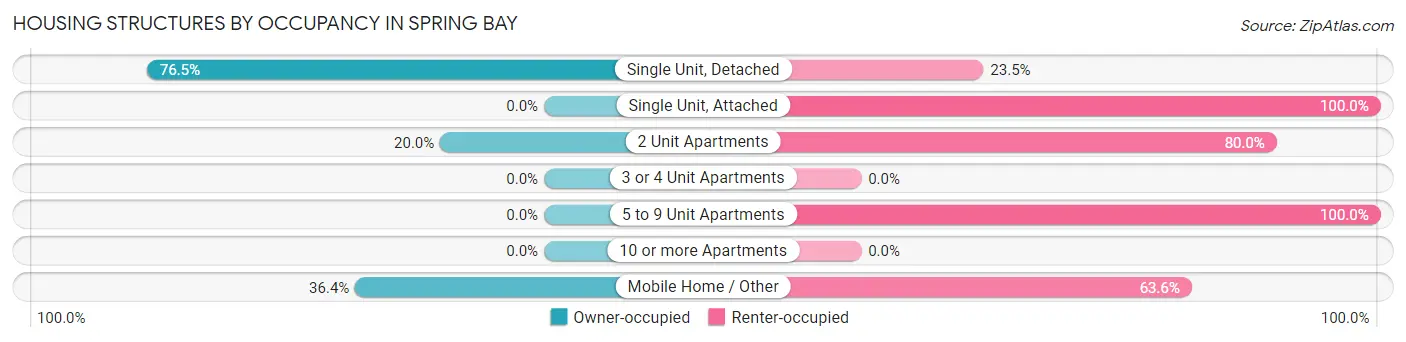
| Structure Type | Owner-occupied | Renter-occupied |
| Single Unit, Detached | 117 (76.5%) | 36 (23.5%) |
| Single Unit, Attached | 0 (0.0%) | 3 (100.0%) |
| 2 Unit Apartments | 2 (20.0%) | 8 (80.0%) |
| 3 or 4 Unit Apartments | 0 (0.0%) | 0 (0.0%) |
| 5 to 9 Unit Apartments | 0 (0.0%) | 3 (100.0%) |
| 10 or more Apartments | 0 (0.0%) | 0 (0.0%) |
| Mobile Home / Other | 4 (36.4%) | 7 (63.6%) |
| Total | 123 (68.3%) | 57 (31.7%) |
Housing Structures by Number of Rooms in Spring Bay
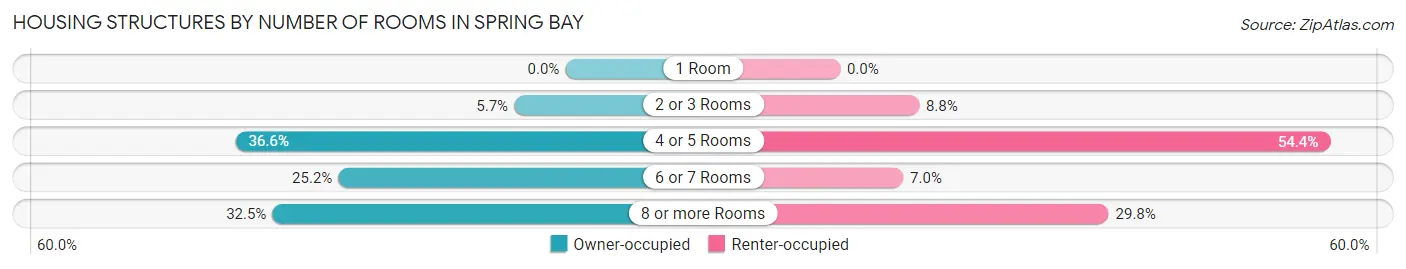
| Number of Rooms | Owner-occupied | Renter-occupied |
| 1 Room | 0 (0.0%) | 0 (0.0%) |
| 2 or 3 Rooms | 7 (5.7%) | 5 (8.8%) |
| 4 or 5 Rooms | 45 (36.6%) | 31 (54.4%) |
| 6 or 7 Rooms | 31 (25.2%) | 4 (7.0%) |
| 8 or more Rooms | 40 (32.5%) | 17 (29.8%) |
| Total | 123 (100.0%) | 57 (100.0%) |
Housing Structure by Heating Type in Spring Bay
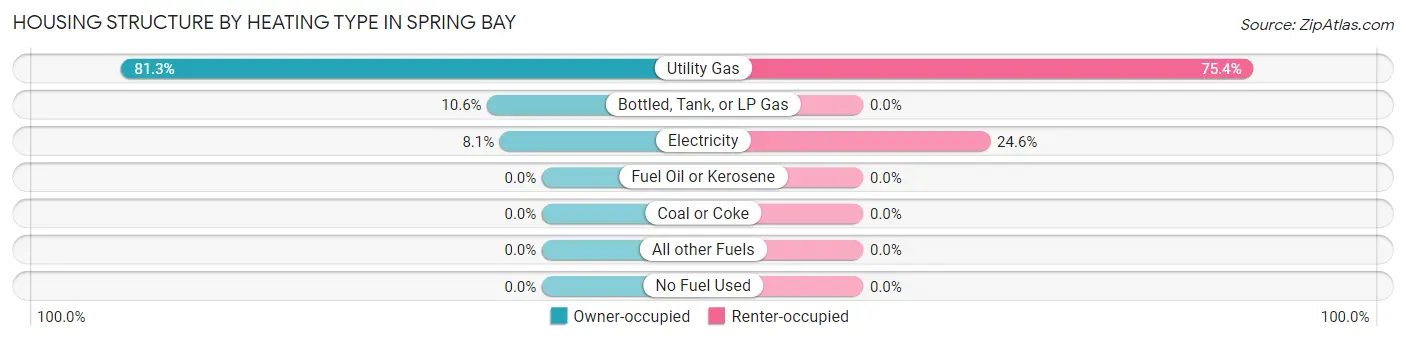
| Heating Type | Owner-occupied | Renter-occupied |
| Utility Gas | 100 (81.3%) | 43 (75.4%) |
| Bottled, Tank, or LP Gas | 13 (10.6%) | 0 (0.0%) |
| Electricity | 10 (8.1%) | 14 (24.6%) |
| Fuel Oil or Kerosene | 0 (0.0%) | 0 (0.0%) |
| Coal or Coke | 0 (0.0%) | 0 (0.0%) |
| All other Fuels | 0 (0.0%) | 0 (0.0%) |
| No Fuel Used | 0 (0.0%) | 0 (0.0%) |
| Total | 123 (100.0%) | 57 (100.0%) |
Household Vehicle Usage in Spring Bay
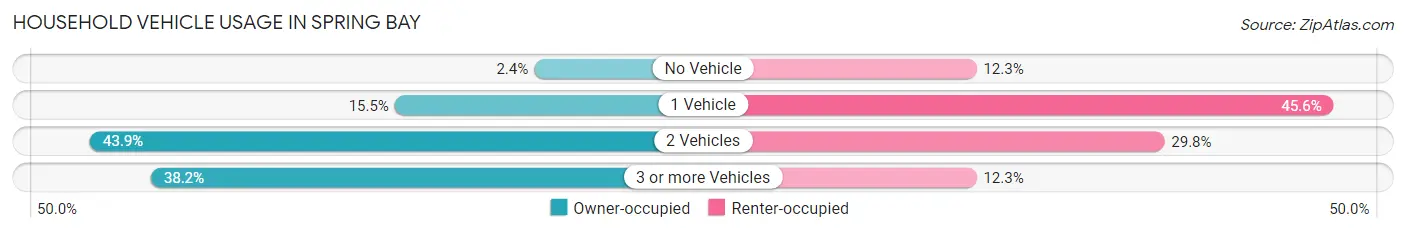
| Vehicles per Household | Owner-occupied | Renter-occupied |
| No Vehicle | 3 (2.4%) | 7 (12.3%) |
| 1 Vehicle | 19 (15.4%) | 26 (45.6%) |
| 2 Vehicles | 54 (43.9%) | 17 (29.8%) |
| 3 or more Vehicles | 47 (38.2%) | 7 (12.3%) |
| Total | 123 (100.0%) | 57 (100.0%) |
Real Estate & Mortgages in Spring Bay
Real Estate and Mortgage Overview in Spring Bay
| Characteristic | Without Mortgage | With Mortgage |
| Housing Units | 42 | 81 |
| Median Property Value | $141,700 | $148,200 |
| Median Household Income | $66,250 | $10 |
| Monthly Housing Costs | $500 | $0 |
| Real Estate Taxes | $2,143 | $0 |
Property Value by Mortgage Status in Spring Bay
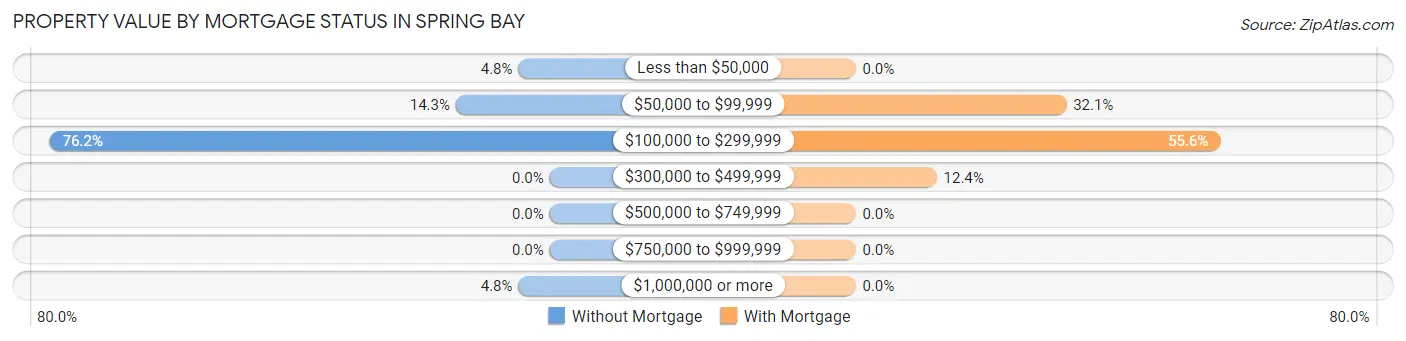
| Property Value | Without Mortgage | With Mortgage |
| Less than $50,000 | 2 (4.8%) | 0 (0.0%) |
| $50,000 to $99,999 | 6 (14.3%) | 26 (32.1%) |
| $100,000 to $299,999 | 32 (76.2%) | 45 (55.6%) |
| $300,000 to $499,999 | 0 (0.0%) | 10 (12.3%) |
| $500,000 to $749,999 | 0 (0.0%) | 0 (0.0%) |
| $750,000 to $999,999 | 0 (0.0%) | 0 (0.0%) |
| $1,000,000 or more | 2 (4.8%) | 0 (0.0%) |
| Total | 42 (100.0%) | 81 (100.0%) |
Household Income by Mortgage Status in Spring Bay
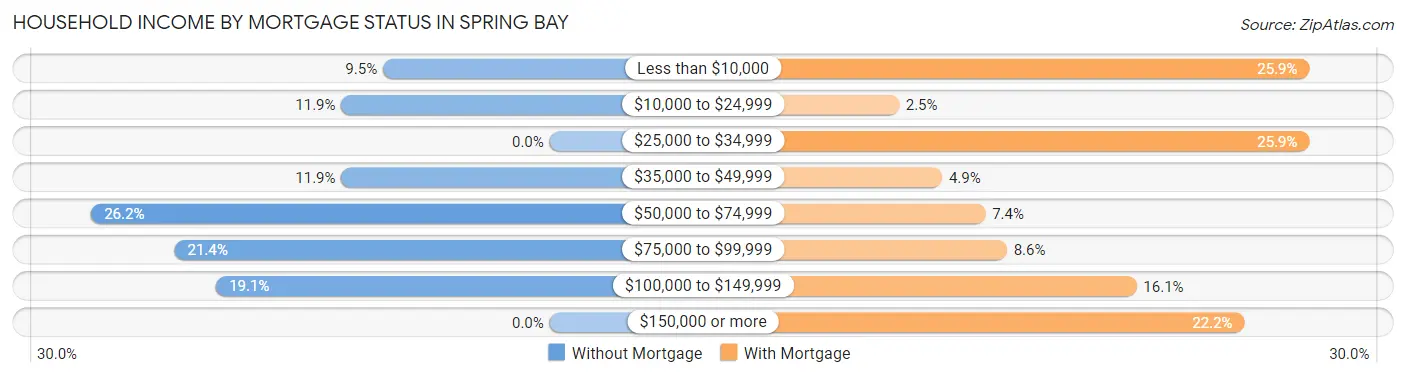
| Household Income | Without Mortgage | With Mortgage |
| Less than $10,000 | 4 (9.5%) | 21 (25.9%) |
| $10,000 to $24,999 | 5 (11.9%) | 2 (2.5%) |
| $25,000 to $34,999 | 0 (0.0%) | 21 (25.9%) |
| $35,000 to $49,999 | 5 (11.9%) | 4 (4.9%) |
| $50,000 to $74,999 | 11 (26.2%) | 6 (7.4%) |
| $75,000 to $99,999 | 9 (21.4%) | 7 (8.6%) |
| $100,000 to $149,999 | 8 (19.1%) | 13 (16.1%) |
| $150,000 or more | 0 (0.0%) | 18 (22.2%) |
| Total | 42 (100.0%) | 81 (100.0%) |
Property Value to Household Income Ratio in Spring Bay
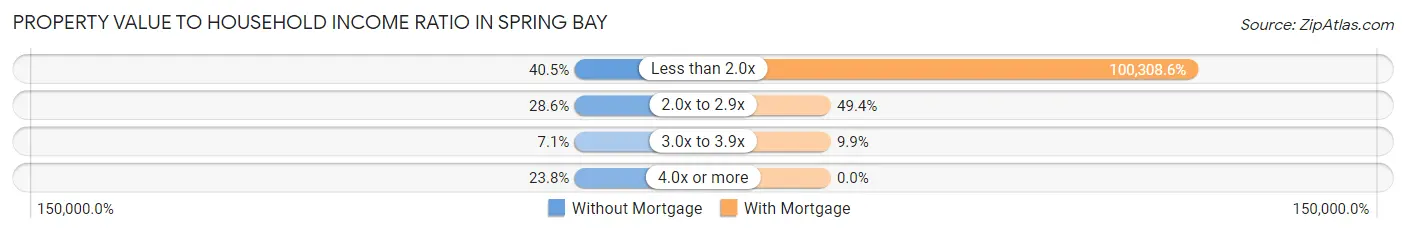
| Value-to-Income Ratio | Without Mortgage | With Mortgage |
| Less than 2.0x | 17 (40.5%) | 81,250 (100,308.6%) |
| 2.0x to 2.9x | 12 (28.6%) | 40 (49.4%) |
| 3.0x to 3.9x | 3 (7.1%) | 8 (9.9%) |
| 4.0x or more | 10 (23.8%) | 0 (0.0%) |
| Total | 42 (100.0%) | 81 (100.0%) |
Real Estate Taxes by Mortgage Status in Spring Bay
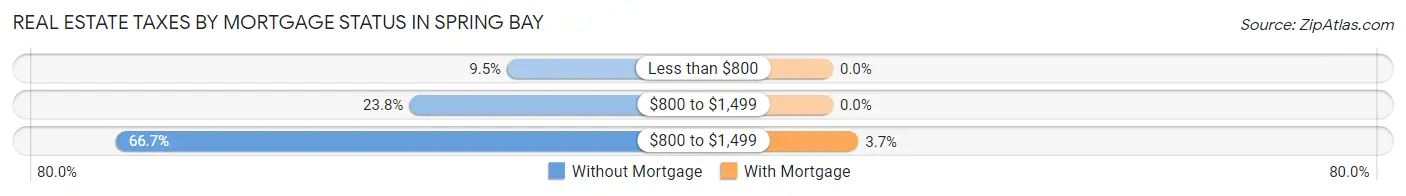
| Property Taxes | Without Mortgage | With Mortgage |
| Less than $800 | 4 (9.5%) | 0 (0.0%) |
| $800 to $1,499 | 10 (23.8%) | 0 (0.0%) |
| $800 to $1,499 | 28 (66.7%) | 3 (3.7%) |
| Total | 42 (100.0%) | 81 (100.0%) |
Health & Disability in Spring Bay
Health Insurance Coverage by Age in Spring Bay
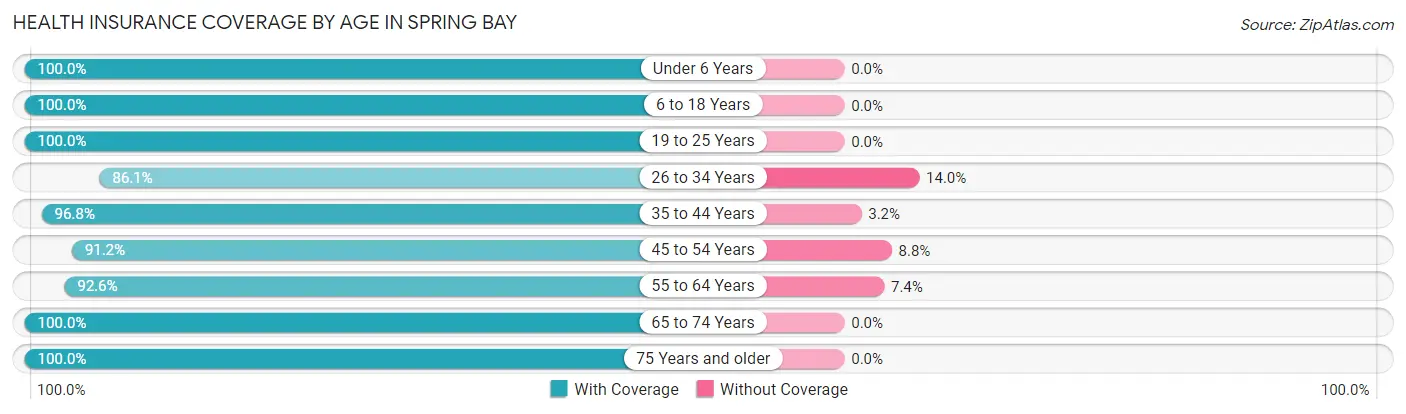
| Age Bracket | With Coverage | Without Coverage |
| Under 6 Years | 25 (100.0%) | 0 (0.0%) |
| 6 to 18 Years | 110 (100.0%) | 0 (0.0%) |
| 19 to 25 Years | 22 (100.0%) | 0 (0.0%) |
| 26 to 34 Years | 37 (86.1%) | 6 (14.0%) |
| 35 to 44 Years | 61 (96.8%) | 2 (3.2%) |
| 45 to 54 Years | 62 (91.2%) | 6 (8.8%) |
| 55 to 64 Years | 50 (92.6%) | 4 (7.4%) |
| 65 to 74 Years | 82 (100.0%) | 0 (0.0%) |
| 75 Years and older | 17 (100.0%) | 0 (0.0%) |
| Total | 466 (96.3%) | 18 (3.7%) |
Health Insurance Coverage by Citizenship Status in Spring Bay
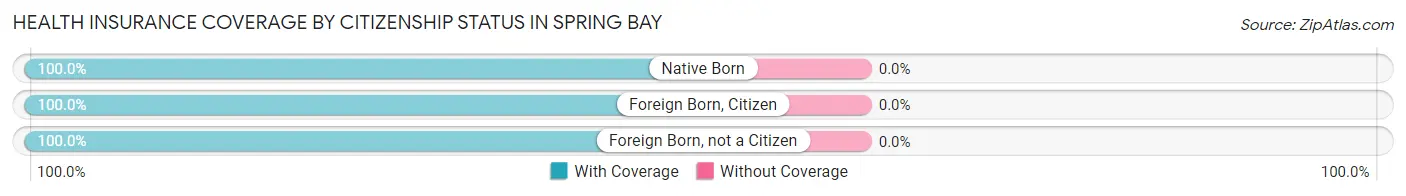
| Citizenship Status | With Coverage | Without Coverage |
| Native Born | 25 (100.0%) | 0 (0.0%) |
| Foreign Born, Citizen | 110 (100.0%) | 0 (0.0%) |
| Foreign Born, not a Citizen | 22 (100.0%) | 0 (0.0%) |
Health Insurance Coverage by Household Income in Spring Bay
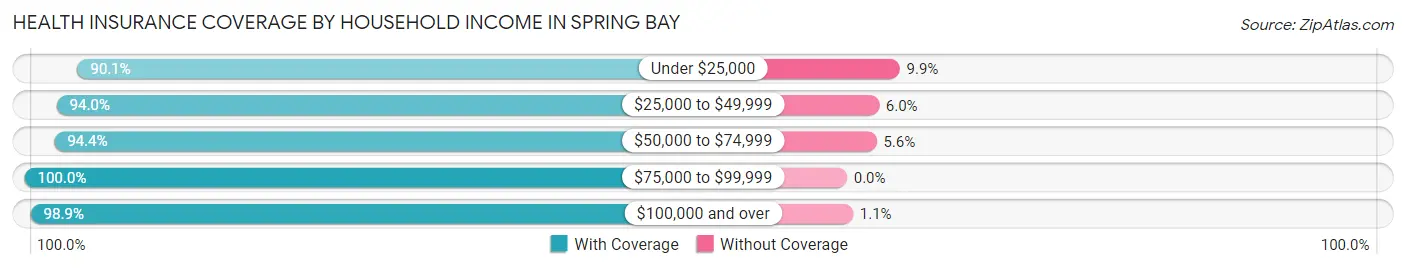
| Household Income | With Coverage | Without Coverage |
| Under $25,000 | 82 (90.1%) | 9 (9.9%) |
| $25,000 to $49,999 | 47 (94.0%) | 3 (6.0%) |
| $50,000 to $74,999 | 68 (94.4%) | 4 (5.6%) |
| $75,000 to $99,999 | 94 (100.0%) | 0 (0.0%) |
| $100,000 and over | 175 (98.9%) | 2 (1.1%) |
Public vs Private Health Insurance Coverage by Age in Spring Bay
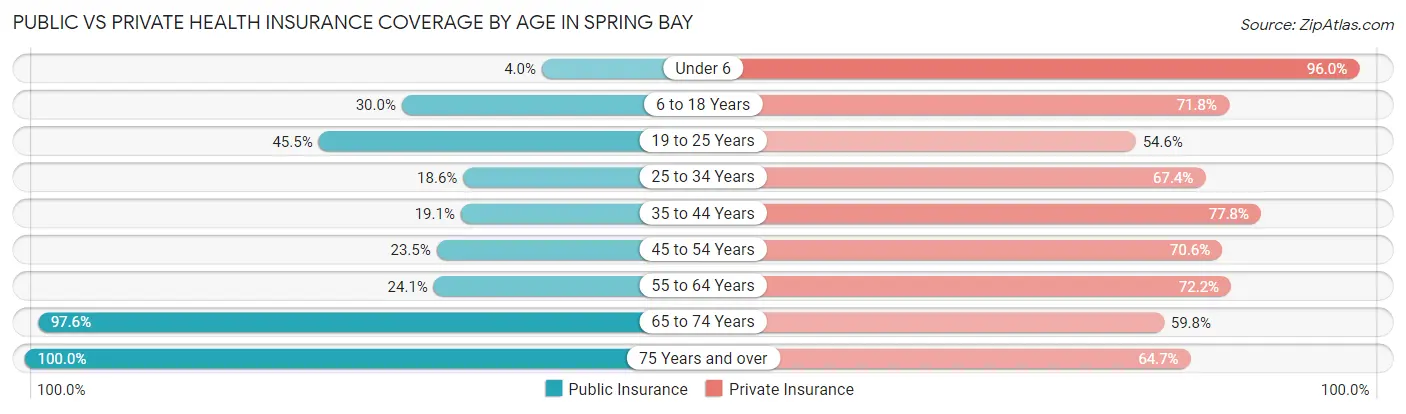
| Age Bracket | Public Insurance | Private Insurance |
| Under 6 | 1 (4.0%) | 24 (96.0%) |
| 6 to 18 Years | 33 (30.0%) | 79 (71.8%) |
| 19 to 25 Years | 10 (45.5%) | 12 (54.5%) |
| 25 to 34 Years | 8 (18.6%) | 29 (67.4%) |
| 35 to 44 Years | 12 (19.1%) | 49 (77.8%) |
| 45 to 54 Years | 16 (23.5%) | 48 (70.6%) |
| 55 to 64 Years | 13 (24.1%) | 39 (72.2%) |
| 65 to 74 Years | 80 (97.6%) | 49 (59.8%) |
| 75 Years and over | 17 (100.0%) | 11 (64.7%) |
| Total | 190 (39.3%) | 340 (70.3%) |
Disability Status by Sex by Age in Spring Bay
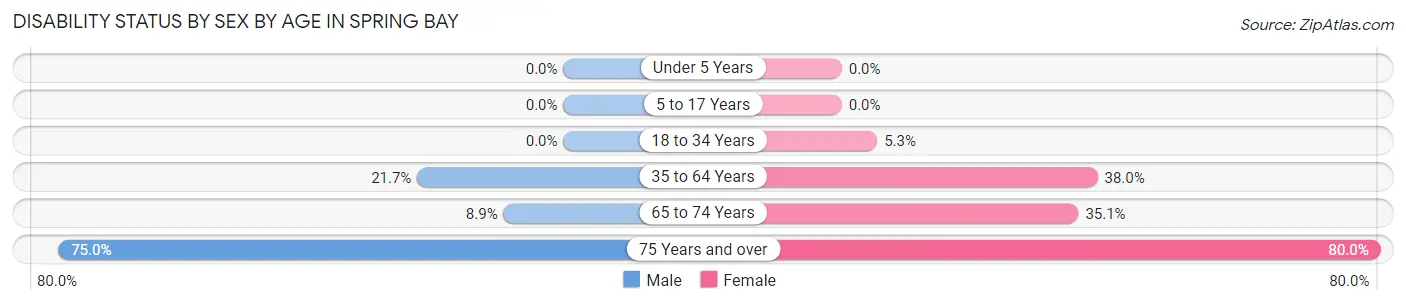
| Age Bracket | Male | Female |
| Under 5 Years | 0 (0.0%) | 0 (0.0%) |
| 5 to 17 Years | 0 (0.0%) | 0 (0.0%) |
| 18 to 34 Years | 0 (0.0%) | 2 (5.3%) |
| 35 to 64 Years | 23 (21.7%) | 30 (38.0%) |
| 65 to 74 Years | 4 (8.9%) | 13 (35.1%) |
| 75 Years and over | 9 (75.0%) | 4 (80.0%) |
Disability Class by Sex by Age in Spring Bay
Disability Class: Hearing Difficulty
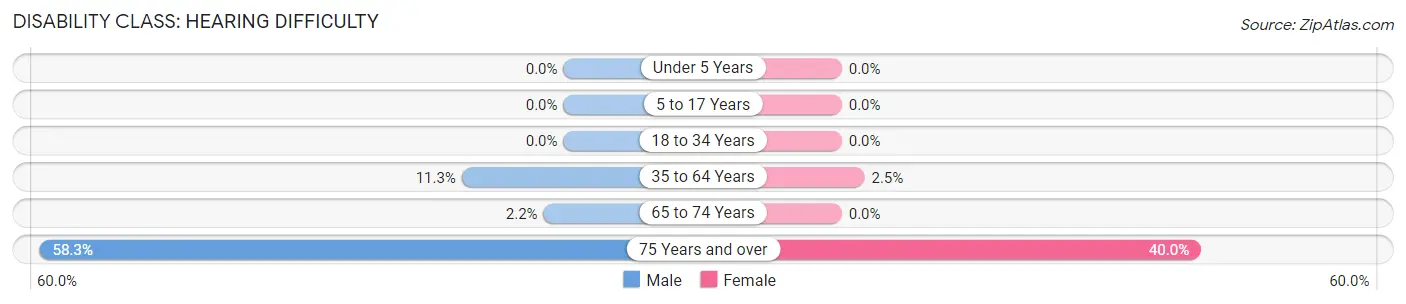
| Age Bracket | Male | Female |
| Under 5 Years | 0 (0.0%) | 0 (0.0%) |
| 5 to 17 Years | 0 (0.0%) | 0 (0.0%) |
| 18 to 34 Years | 0 (0.0%) | 0 (0.0%) |
| 35 to 64 Years | 12 (11.3%) | 2 (2.5%) |
| 65 to 74 Years | 1 (2.2%) | 0 (0.0%) |
| 75 Years and over | 7 (58.3%) | 2 (40.0%) |
Disability Class: Vision Difficulty
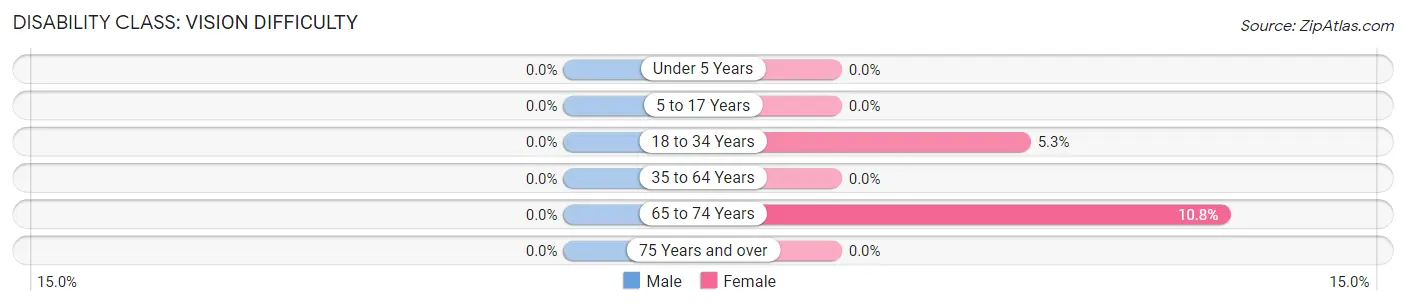
| Age Bracket | Male | Female |
| Under 5 Years | 0 (0.0%) | 0 (0.0%) |
| 5 to 17 Years | 0 (0.0%) | 0 (0.0%) |
| 18 to 34 Years | 0 (0.0%) | 2 (5.3%) |
| 35 to 64 Years | 0 (0.0%) | 0 (0.0%) |
| 65 to 74 Years | 0 (0.0%) | 4 (10.8%) |
| 75 Years and over | 0 (0.0%) | 0 (0.0%) |
Disability Class: Cognitive Difficulty
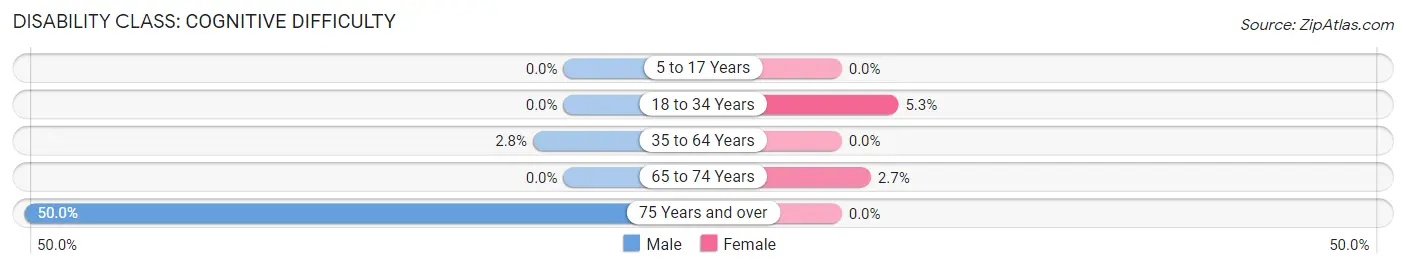
| Age Bracket | Male | Female |
| 5 to 17 Years | 0 (0.0%) | 0 (0.0%) |
| 18 to 34 Years | 0 (0.0%) | 2 (5.3%) |
| 35 to 64 Years | 3 (2.8%) | 0 (0.0%) |
| 65 to 74 Years | 0 (0.0%) | 1 (2.7%) |
| 75 Years and over | 6 (50.0%) | 0 (0.0%) |
Disability Class: Ambulatory Difficulty
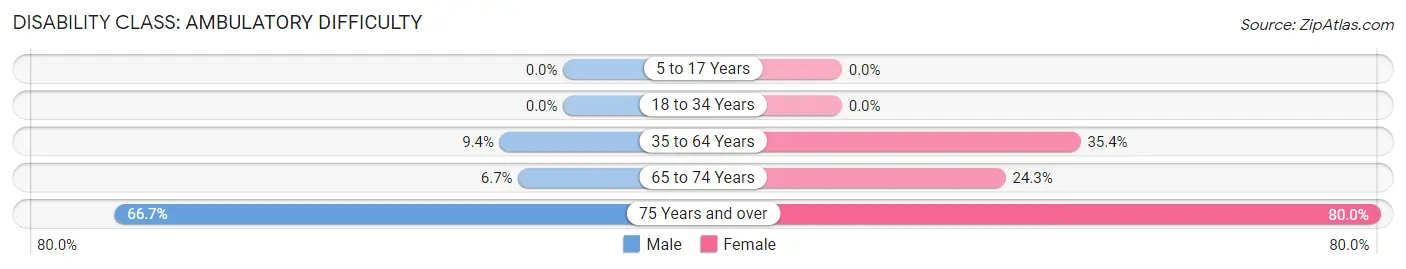
| Age Bracket | Male | Female |
| 5 to 17 Years | 0 (0.0%) | 0 (0.0%) |
| 18 to 34 Years | 0 (0.0%) | 0 (0.0%) |
| 35 to 64 Years | 10 (9.4%) | 28 (35.4%) |
| 65 to 74 Years | 3 (6.7%) | 9 (24.3%) |
| 75 Years and over | 8 (66.7%) | 4 (80.0%) |
Disability Class: Self-Care Difficulty
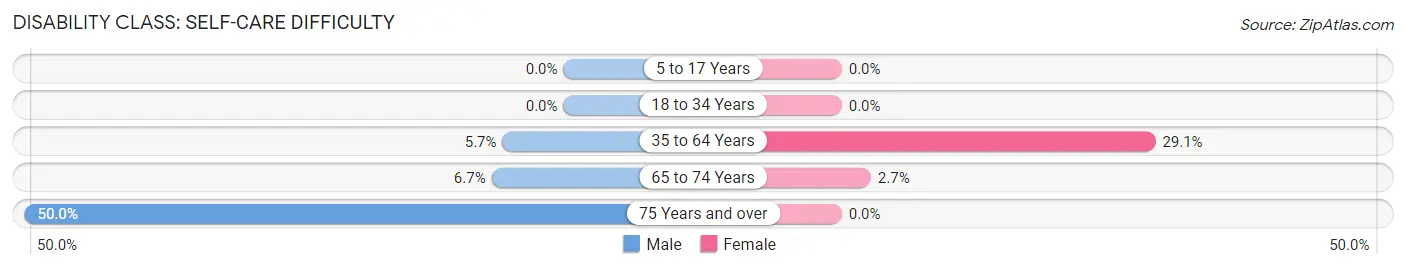
| Age Bracket | Male | Female |
| 5 to 17 Years | 0 (0.0%) | 0 (0.0%) |
| 18 to 34 Years | 0 (0.0%) | 0 (0.0%) |
| 35 to 64 Years | 6 (5.7%) | 23 (29.1%) |
| 65 to 74 Years | 3 (6.7%) | 1 (2.7%) |
| 75 Years and over | 6 (50.0%) | 0 (0.0%) |
Technology Access in Spring Bay
Computing Device Access in Spring Bay
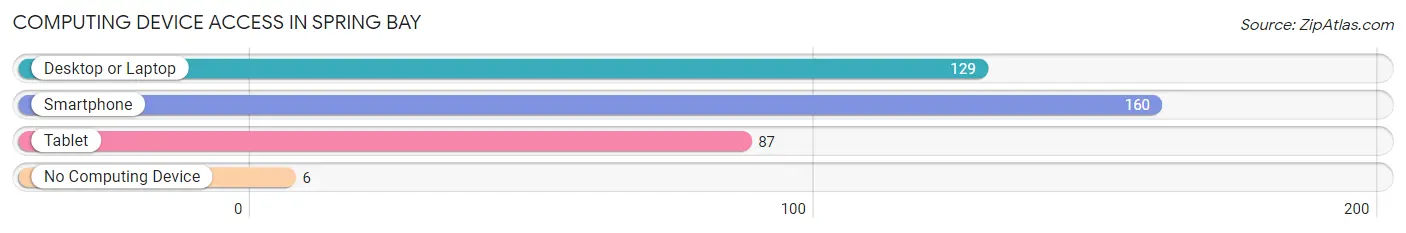
| Device Type | # Households | % Households |
| Desktop or Laptop | 129 | 71.7% |
| Smartphone | 160 | 88.9% |
| Tablet | 87 | 48.3% |
| No Computing Device | 6 | 3.3% |
| Total | 180 | 100.0% |
Internet Access in Spring Bay
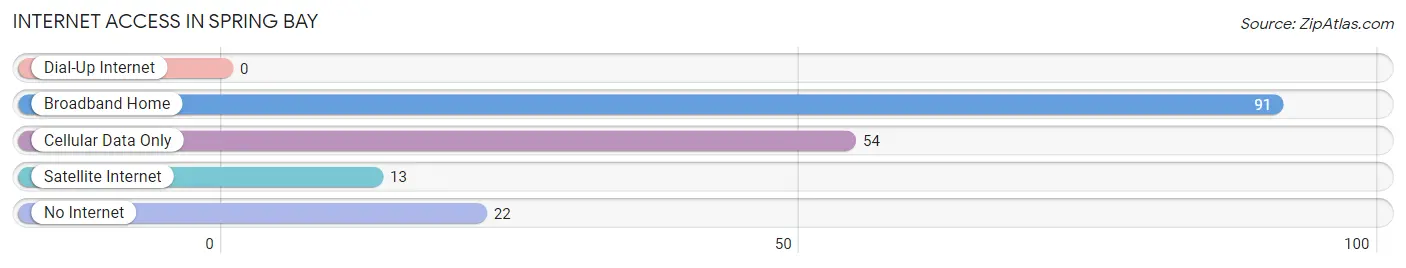
| Internet Type | # Households | % Households |
| Dial-Up Internet | 0 | 0.0% |
| Broadband Home | 91 | 50.6% |
| Cellular Data Only | 54 | 30.0% |
| Satellite Internet | 13 | 7.2% |
| No Internet | 22 | 12.2% |
| Total | 180 | 100.0% |
Spring Bay Summary
Bay, Illinois is a small village located in the northern part of the state, in the county of Lake. It is situated on the shores of Lake Michigan, and is part of the Chicago metropolitan area. The village has a population of approximately 1,500 people, and is a popular tourist destination due to its proximity to the lake and its many attractions.
History
The area that is now Spring Bay was first settled in the early 1800s by a group of settlers from New England. The settlers were attracted to the area due to its abundance of natural resources, including timber, fish, and game. The village was originally known as “Spring Bay” due to the numerous springs that were located in the area.
In 1836, the village was officially incorporated as the Village of Spring Bay. The village was named after the nearby spring-fed lake, which was known as Spring Bay. The village grew slowly over the years, and by the early 1900s, it had become a popular summer destination for Chicagoans looking to escape the city.
Geography
Spring Bay is located in the northern part of Illinois, in the county of Lake. It is situated on the shores of Lake Michigan, and is part of the Chicago metropolitan area. The village is located approximately 40 miles north of Chicago, and is bordered by the towns of Waukegan, North Chicago, and Zion.
The village is situated on a flat plain, with the lake to the east and the Des Plaines River to the west. The village is surrounded by rolling hills and wooded areas, and is home to several parks and nature preserves.
Economy
The economy of Spring Bay is largely based on tourism and recreation. The village is a popular destination for visitors looking to enjoy the lake and its many attractions. The village is home to several marinas, boat launches, and fishing spots, as well as a variety of restaurants and shops.
The village is also home to several manufacturing and industrial businesses, including a paper mill and a steel mill. These businesses provide employment for many of the village’s residents.
Demographics
As of the 2010 census, the population of Spring Bay was 1,500. The village is predominantly white, with a small Hispanic population. The median household income is $50,000, and the median home value is $150,000.
The village is served by the Spring Bay School District, which includes two elementary schools, a middle school, and a high school. The village is also home to several churches, including the Spring Bay United Methodist Church and the Spring Bay Baptist Church.
Conclusion
Spring Bay, Illinois is a small village located in the northern part of the state, in the county of Lake. It is situated on the shores of Lake Michigan, and is part of the Chicago metropolitan area. The village has a population of approximately 1,500 people, and is a popular tourist destination due to its proximity to the lake and its many attractions. The economy of the village is largely based on tourism and recreation, and the village is served by the Spring Bay School District. The village is predominantly white, with a small Hispanic population, and the median household income is $50,000.
Common Questions
What is Per Capita Income in Spring Bay?
Per Capita income in Spring Bay is $26,824.
What is the Median Family Income in Spring Bay?
Median Family Income in Spring Bay is $71,250.
What is the Median Household income in Spring Bay?
Median Household Income in Spring Bay is $58,214.
What is Income or Wage Gap in Spring Bay?
Income or Wage Gap in Spring Bay is 33.7%.
Women in Spring Bay earn 66.3 cents for every dollar earned by a man.
What is Family Income Deficit in Spring Bay?
Family Income Deficit in Spring Bay is $15,368.
Families that are below poverty line in Spring Bay earn $15,368 less on average than the poverty threshold level.
What is Inequality or Gini Index in Spring Bay?
Inequality or Gini Index in Spring Bay is 0.45.
What is the Total Population of Spring Bay?
Total Population of Spring Bay is 484.
What is the Total Male Population of Spring Bay?
Total Male Population of Spring Bay is 285.
What is the Total Female Population of Spring Bay?
Total Female Population of Spring Bay is 199.
What is the Ratio of Males per 100 Females in Spring Bay?
There are 143.22 Males per 100 Females in Spring Bay.
What is the Ratio of Females per 100 Males in Spring Bay?
There are 69.82 Females per 100 Males in Spring Bay.
What is the Median Population Age in Spring Bay?
Median Population Age in Spring Bay is 44.0 Years.
What is the Average Family Size in Spring Bay
Average Family Size in Spring Bay is 3.0 People.
What is the Average Household Size in Spring Bay
Average Household Size in Spring Bay is 2.7 People.
How Large is the Labor Force in Spring Bay?
There are 219 People in the Labor Forcein in Spring Bay.
What is the Percentage of People in the Labor Force in Spring Bay?
55.7% of People are in the Labor Force in Spring Bay.
What is the Unemployment Rate in Spring Bay?
Unemployment Rate in Spring Bay is 5.9%.