Chestnut, IL Map & Demographics
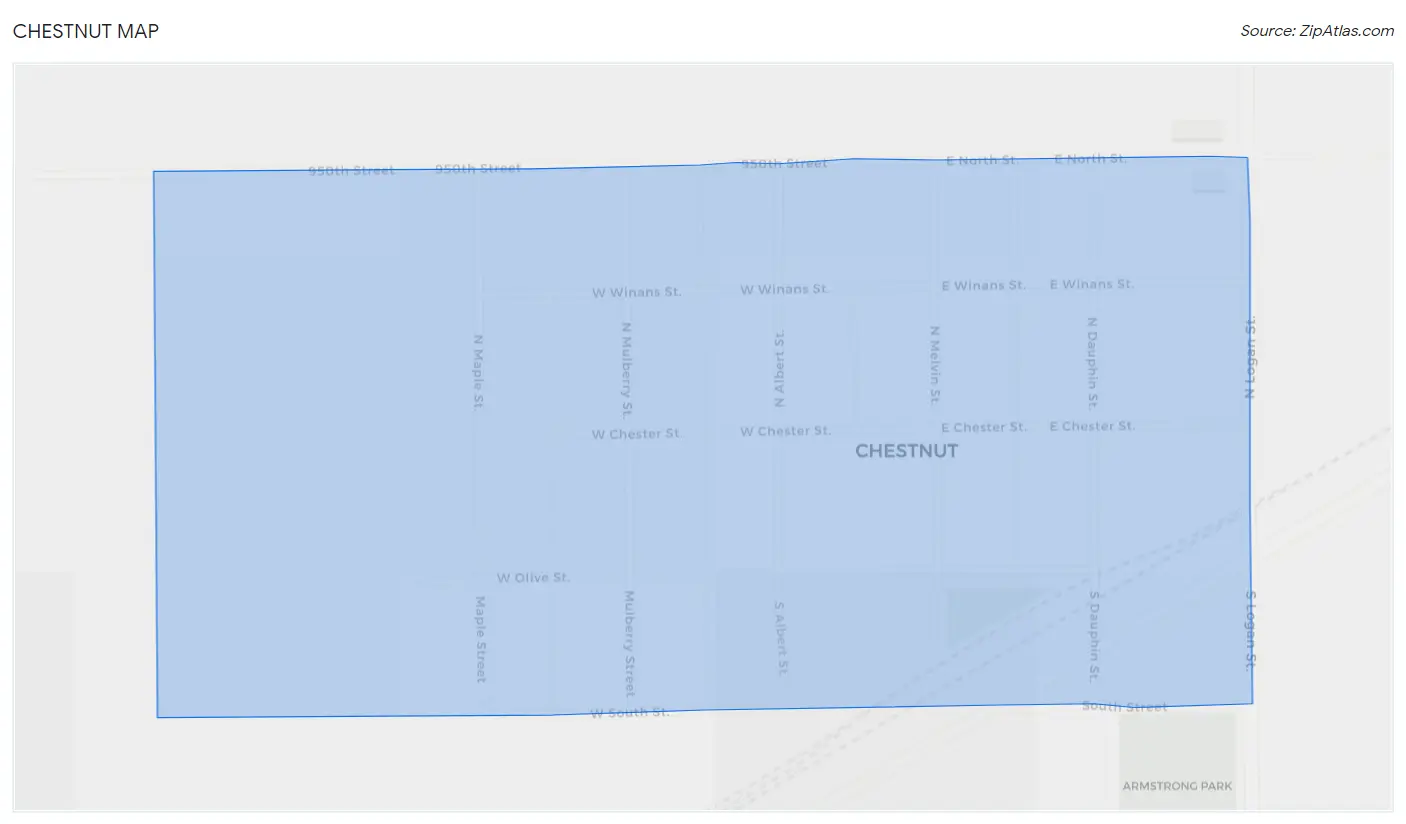
Chestnut Map
Chestnut Overview
$25,488
PER CAPITA INCOME
0.43
INEQUALITY / GINI INDEX
171
TOTAL POPULATION
68
MALE POPULATION
103
FEMALE POPULATION
66.02
MALES / 100 FEMALES
151.47
FEMALES / 100 MALES
42.4
MEDIAN AGE
2.0
AVG FAMILY SIZE
1.6
AVG HOUSEHOLD SIZE
80
LABOR FORCE [ PEOPLE ]
64.0%
PERCENT IN LABOR FORCE
Chestnut Zip Codes
Chestnut Area Codes
Income in Chestnut
Income Overview in Chestnut
| Characteristic | Number | Measure |
| Per Capita Income | 171 | $25,488 |
| Median Family Income | 66 | $0 |
| Mean Family Income | 66 | $0 |
| Median Household Income | 104 | $0 |
| Mean Household Income | 104 | $41,908 |
| Income Deficit | 66 | $0 |
| Wage / Income Gap (%) | 171 | 0.00% |
| Wage / Income Gap ($) | 171 | 100.00¢ per $1 |
| Gini / Inequality Index | 171 | 0.43 |
Earnings by Sex in Chestnut
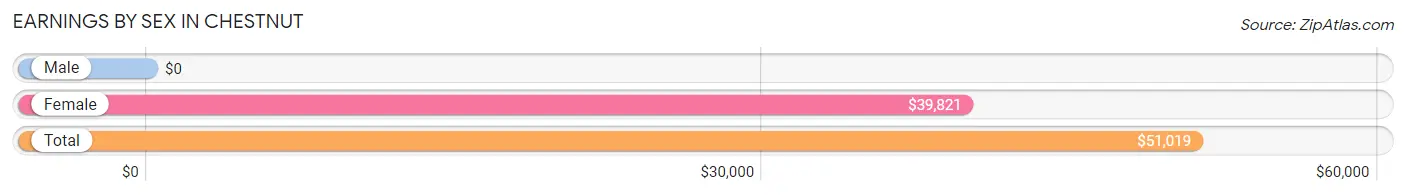
| Sex | Number | Average Earnings |
| Male | 24 (30.0%) | $0 |
| Female | 56 (70.0%) | $39,821 |
| Total | 80 (100.0%) | $51,019 |
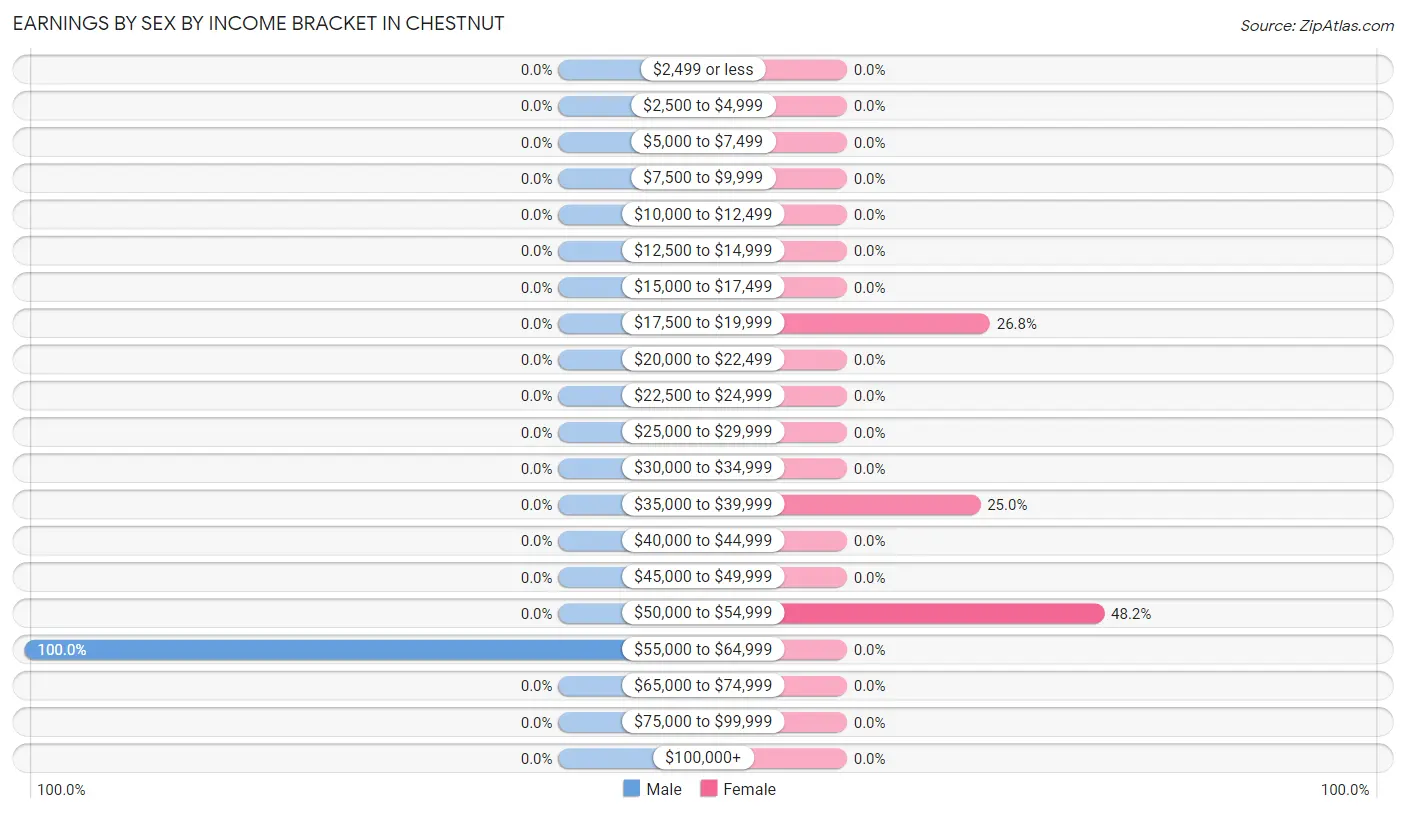
Earnings by Sex by Income Bracket in Chestnut
The most common earnings brackets in Chestnut are $55,000 to $64,999 for men (24 | 100.0%) and $50,000 to $54,999 for women (27 | 48.2%).
| Income | Male | Female |
| $2,499 or less | 0 (0.0%) | 0 (0.0%) |
| $2,500 to $4,999 | 0 (0.0%) | 0 (0.0%) |
| $5,000 to $7,499 | 0 (0.0%) | 0 (0.0%) |
| $7,500 to $9,999 | 0 (0.0%) | 0 (0.0%) |
| $10,000 to $12,499 | 0 (0.0%) | 0 (0.0%) |
| $12,500 to $14,999 | 0 (0.0%) | 0 (0.0%) |
| $15,000 to $17,499 | 0 (0.0%) | 0 (0.0%) |
| $17,500 to $19,999 | 0 (0.0%) | 15 (26.8%) |
| $20,000 to $22,499 | 0 (0.0%) | 0 (0.0%) |
| $22,500 to $24,999 | 0 (0.0%) | 0 (0.0%) |
| $25,000 to $29,999 | 0 (0.0%) | 0 (0.0%) |
| $30,000 to $34,999 | 0 (0.0%) | 0 (0.0%) |
| $35,000 to $39,999 | 0 (0.0%) | 14 (25.0%) |
| $40,000 to $44,999 | 0 (0.0%) | 0 (0.0%) |
| $45,000 to $49,999 | 0 (0.0%) | 0 (0.0%) |
| $50,000 to $54,999 | 0 (0.0%) | 27 (48.2%) |
| $55,000 to $64,999 | 24 (100.0%) | 0 (0.0%) |
| $65,000 to $74,999 | 0 (0.0%) | 0 (0.0%) |
| $75,000 to $99,999 | 0 (0.0%) | 0 (0.0%) |
| $100,000+ | 0 (0.0%) | 0 (0.0%) |
| Total | 24 (100.0%) | 56 (100.0%) |
Earnings by Sex by Educational Attainment in Chestnut
| Educational Attainment | Male Income | Female Income |
| Less than High School | - | - |
| High School Diploma | - | - |
| College or Associate's Degree | - | - |
| Bachelor's Degree | - | - |
| Graduate Degree | - | - |
| Total | - | - |
Family Income in Chestnut
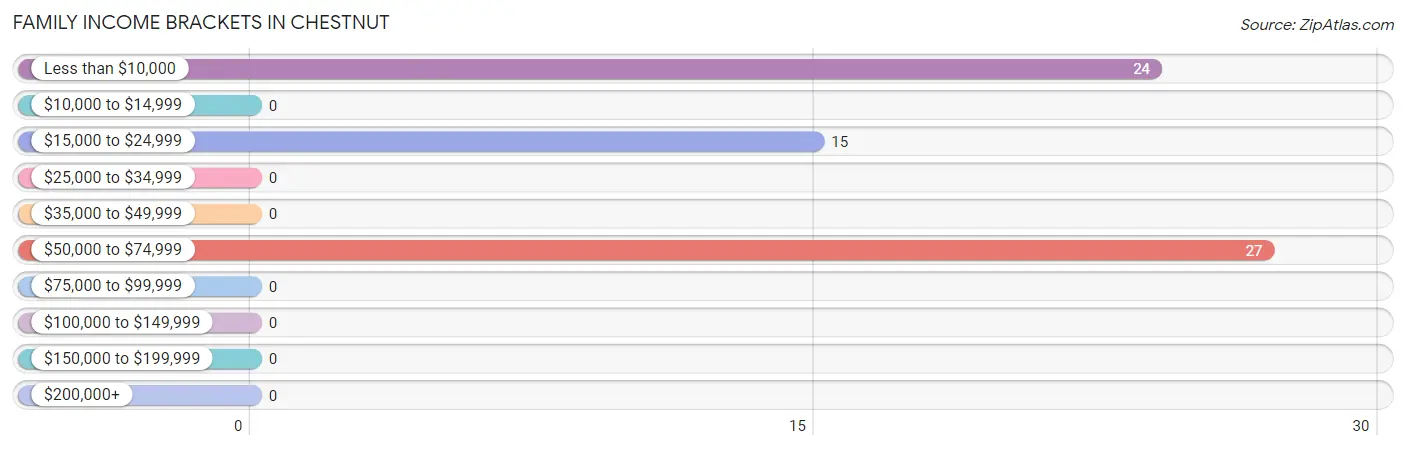
Family Income Brackets in Chestnut
According to the Chestnut family income data, there are 27 families falling into the $50,000 to $74,999 income range, which is the most common income bracket and makes up 40.9% of all families.
| Income Bracket | # Families | % Families |
| Less than $10,000 | 24 | 36.4% |
| $10,000 to $14,999 | 0 | 0.0% |
| $15,000 to $24,999 | 15 | 22.7% |
| $25,000 to $34,999 | 0 | 0.0% |
| $35,000 to $49,999 | 0 | 0.0% |
| $50,000 to $74,999 | 27 | 40.9% |
| $75,000 to $99,999 | 0 | 0.0% |
| $100,000 to $149,999 | 0 | 0.0% |
| $150,000 to $199,999 | 0 | 0.0% |
| $200,000+ | 0 | 0.0% |
Family Income by Famaliy Size in Chestnut
| Income Bracket | # Families | Median Income |
| 2-Person Families | 66 (100.0%) | $0 |
| 3-Person Families | 0 (0.0%) | $0 |
| 4-Person Families | 0 (0.0%) | $0 |
| 5-Person Families | 0 (0.0%) | $0 |
| 6-Person Families | 0 (0.0%) | $0 |
| 7+ Person Families | 0 (0.0%) | $0 |
| Total | 66 (100.0%) | $0 |
Family Income by Number of Earners in Chestnut
| Number of Earners | # Families | Median Income |
| No Earners | 24 (36.4%) | $0 |
| 1 Earner | 42 (63.6%) | $0 |
| 2 Earners | 0 (0.0%) | $0 |
| 3+ Earners | 0 (0.0%) | $0 |
| Total | 66 (100.0%) | $0 |
Household Income in Chestnut
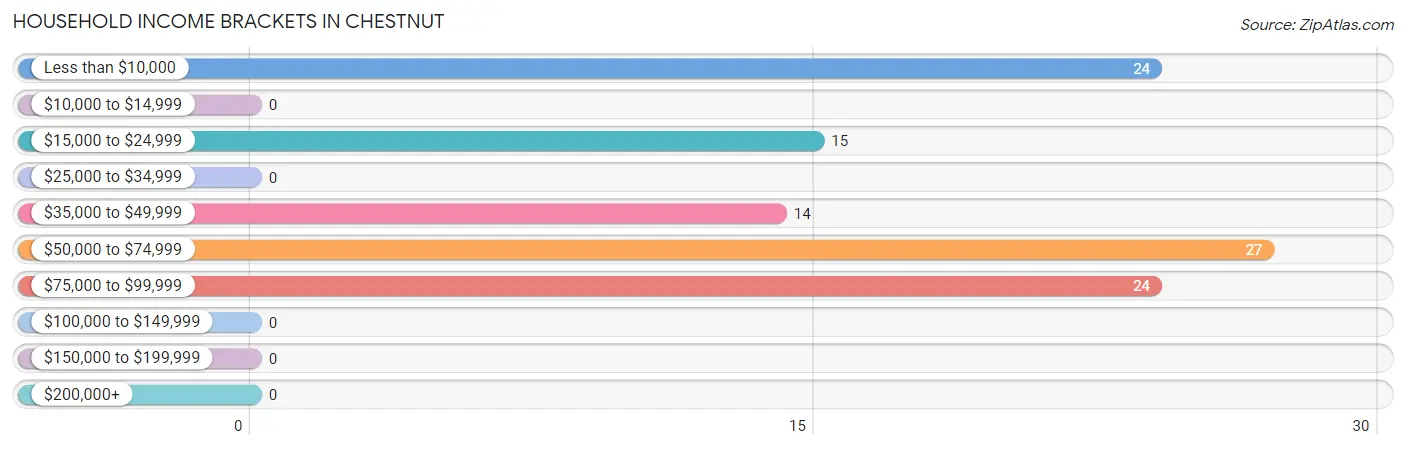
Household Income Brackets in Chestnut
With 27 households falling in the category, the $50,000 to $74,999 income range is the most frequent in Chestnut, accounting for 26.0% of all households.
| Income Bracket | # Households | % Households |
| Less than $10,000 | 24 | 23.1% |
| $10,000 to $14,999 | 0 | 0.0% |
| $15,000 to $24,999 | 15 | 14.4% |
| $25,000 to $34,999 | 0 | 0.0% |
| $35,000 to $49,999 | 14 | 13.5% |
| $50,000 to $74,999 | 27 | 26.0% |
| $75,000 to $99,999 | 24 | 23.1% |
| $100,000 to $149,999 | 0 | 0.0% |
| $150,000 to $199,999 | 0 | 0.0% |
| $200,000+ | 0 | 0.0% |
Household Income by Householder Age in Chestnut
| Income Bracket | # Households | Median Income |
| 15 to 24 Years | 14 (13.5%) | $0 |
| 25 to 44 Years | 42 (40.4%) | $0 |
| 45 to 64 Years | 0 (0.0%) | $0 |
| 65+ Years | 48 (46.2%) | $0 |
| Total | 104 (100.0%) | $0 |
Poverty in Chestnut
Income Below Poverty by Sex and Age in Chestnut
With 64.7% poverty level for males and 37.9% for females among the residents of Chestnut, 6 to 11 year old males and 25 to 34 year old females are the most vulnerable to poverty, with 23 males (100.0%) and 15 females (100.0%) in their respective age groups living below the poverty level.
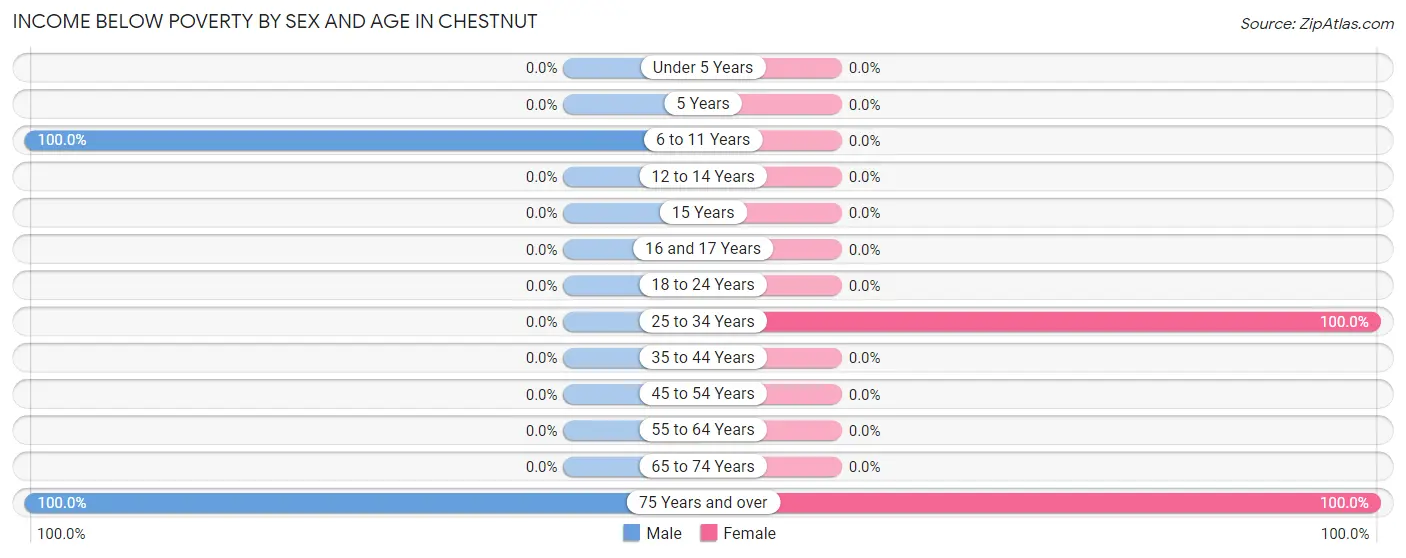
| Age Bracket | Male | Female |
| Under 5 Years | 0 (0.0%) | 0 (0.0%) |
| 5 Years | 0 (0.0%) | 0 (0.0%) |
| 6 to 11 Years | 23 (100.0%) | 0 (0.0%) |
| 12 to 14 Years | 0 (0.0%) | 0 (0.0%) |
| 15 Years | 0 (0.0%) | 0 (0.0%) |
| 16 and 17 Years | 0 (0.0%) | 0 (0.0%) |
| 18 to 24 Years | 0 (0.0%) | 0 (0.0%) |
| 25 to 34 Years | 0 (0.0%) | 15 (100.0%) |
| 35 to 44 Years | 0 (0.0%) | 0 (0.0%) |
| 45 to 54 Years | 0 (0.0%) | 0 (0.0%) |
| 55 to 64 Years | 0 (0.0%) | 0 (0.0%) |
| 65 to 74 Years | 0 (0.0%) | 0 (0.0%) |
| 75 Years and over | 21 (100.0%) | 24 (100.0%) |
| Total | 44 (64.7%) | 39 (37.9%) |
Income Above Poverty by Sex and Age in Chestnut
According to the poverty statistics in Chestnut, males aged 65 to 74 years and females aged 6 to 11 years are the age groups that are most secure financially, with 100.0% of males and 100.0% of females in these age groups living above the poverty line.
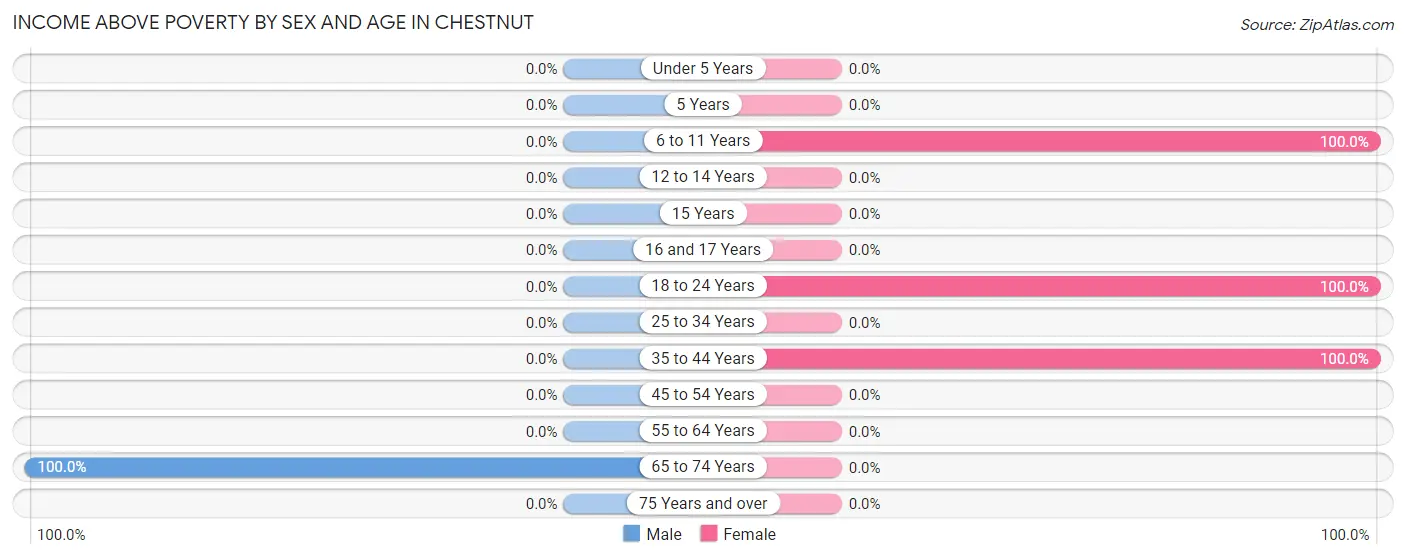
| Age Bracket | Male | Female |
| Under 5 Years | 0 (0.0%) | 0 (0.0%) |
| 5 Years | 0 (0.0%) | 0 (0.0%) |
| 6 to 11 Years | 0 (0.0%) | 23 (100.0%) |
| 12 to 14 Years | 0 (0.0%) | 0 (0.0%) |
| 15 Years | 0 (0.0%) | 0 (0.0%) |
| 16 and 17 Years | 0 (0.0%) | 0 (0.0%) |
| 18 to 24 Years | 0 (0.0%) | 14 (100.0%) |
| 25 to 34 Years | 0 (0.0%) | 0 (0.0%) |
| 35 to 44 Years | 0 (0.0%) | 27 (100.0%) |
| 45 to 54 Years | 0 (0.0%) | 0 (0.0%) |
| 55 to 64 Years | 0 (0.0%) | 0 (0.0%) |
| 65 to 74 Years | 24 (100.0%) | 0 (0.0%) |
| 75 Years and over | 0 (0.0%) | 0 (0.0%) |
| Total | 24 (35.3%) | 64 (62.1%) |
Income Below Poverty Among Married-Couple Families in Chestnut
The poverty statistics for married-couple families in Chestnut show that 100.0% or 24 of the total 24 families live below the poverty line. Families with no children have the highest poverty rate of 100.0%, comprising of 24 families. On the other hand, families with no children have the lowest poverty rate of 100.0%, which includes 24 families.
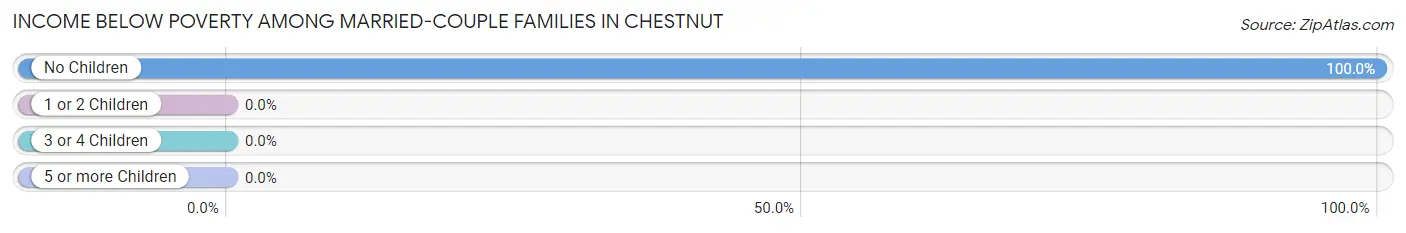
| Children | Above Poverty | Below Poverty |
| No Children | 0 (0.0%) | 24 (100.0%) |
| 1 or 2 Children | 0 (0.0%) | 0 (0.0%) |
| 3 or 4 Children | 0 (0.0%) | 0 (0.0%) |
| 5 or more Children | 0 (0.0%) | 0 (0.0%) |
| Total | 0 (0.0%) | 24 (100.0%) |
Income Below Poverty Among Single-Parent Households in Chestnut
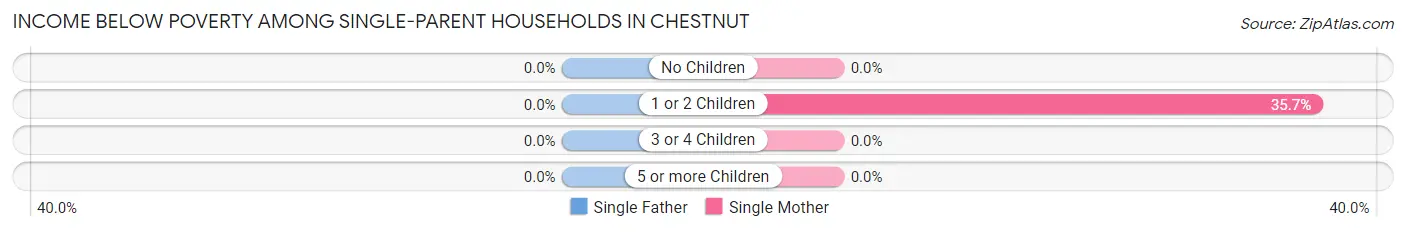
| Children | Single Father | Single Mother |
| No Children | 0 (0.0%) | 0 (0.0%) |
| 1 or 2 Children | 0 (0.0%) | 15 (35.7%) |
| 3 or 4 Children | 0 (0.0%) | 0 (0.0%) |
| 5 or more Children | 0 (0.0%) | 0 (0.0%) |
| Total | 0 (0.0%) | 15 (35.7%) |
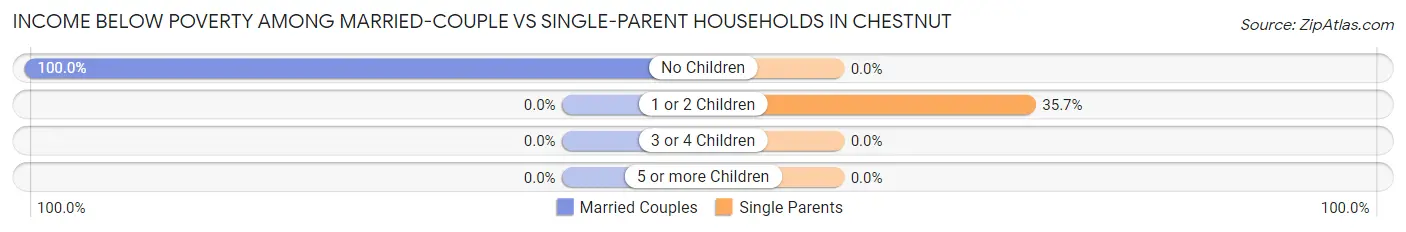
Income Below Poverty Among Married-Couple vs Single-Parent Households in Chestnut
The poverty data for Chestnut shows that 24 of the married-couple family households (100.0%) and 15 of the single-parent households (35.7%) are living below the poverty level. Within the married-couple family households, those with no children have the highest poverty rate, with 24 households (100.0%) falling below the poverty line. Among the single-parent households, those with 1 or 2 children have the highest poverty rate, with 15 household (35.7%) living below poverty.
| Children | Married-Couple Families | Single-Parent Households |
| No Children | 24 (100.0%) | 0 (0.0%) |
| 1 or 2 Children | 0 (0.0%) | 15 (35.7%) |
| 3 or 4 Children | 0 (0.0%) | 0 (0.0%) |
| 5 or more Children | 0 (0.0%) | 0 (0.0%) |
| Total | 24 (100.0%) | 15 (35.7%) |
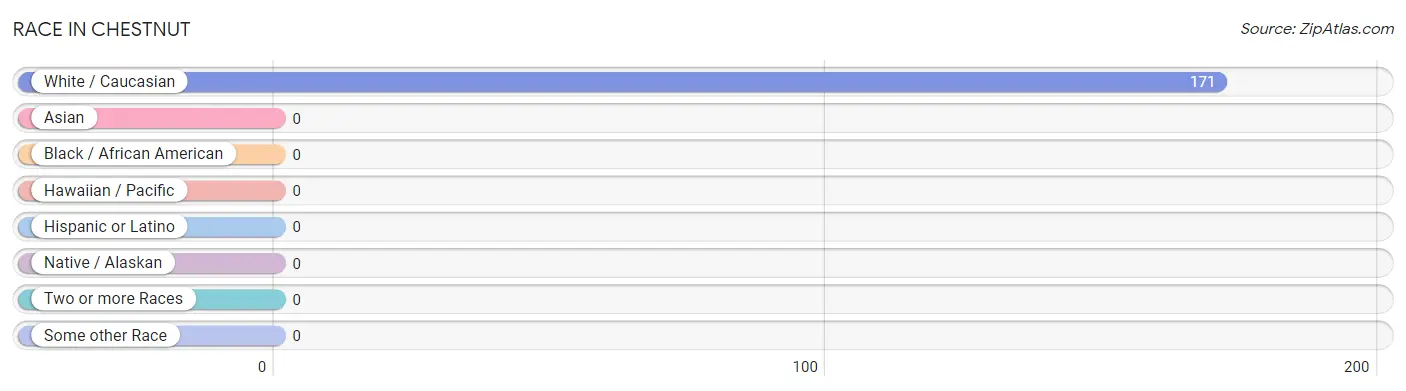
Race in Chestnut
The most populous races in Chestnut are , and White / Caucasian (171 | 100.0%).
| Race | # Population | % Population |
| Asian | 0 | 0.0% |
| Black / African American | 0 | 0.0% |
| Hawaiian / Pacific | 0 | 0.0% |
| Hispanic or Latino | 0 | 0.0% |
| Native / Alaskan | 0 | 0.0% |
| White / Caucasian | 171 | 100.0% |
| Two or more Races | 0 | 0.0% |
| Some other Race | 0 | 0.0% |
| Total | 171 | 100.0% |
Ancestry in Chestnut

| Ancestry | # Population | % Population | View All 0 Rows |
Immigrants in Chestnut

| Immigration Origin | # Population | % Population | View All 0 Rows |
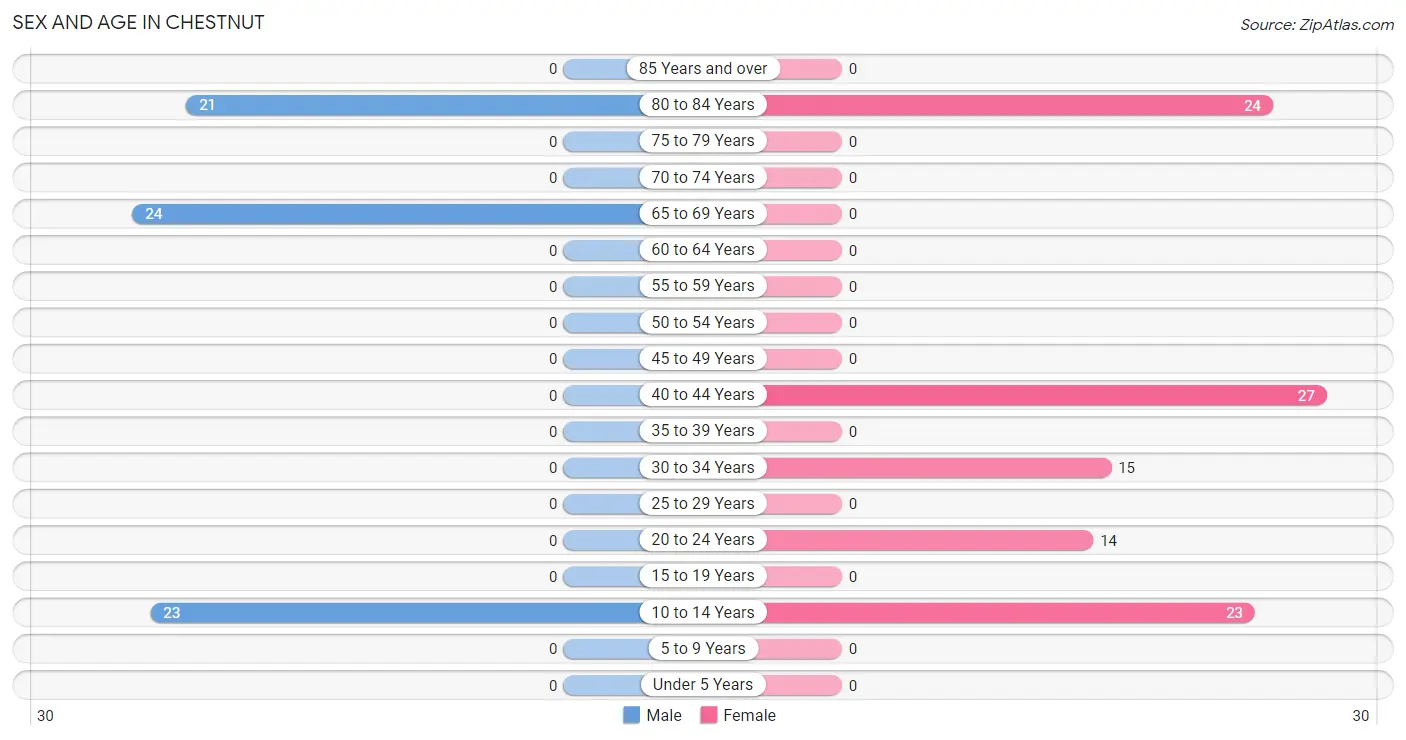
Sex and Age in Chestnut
Sex and Age in Chestnut
The most populous age groups in Chestnut are 65 to 69 Years (24 | 35.3%) for men and 40 to 44 Years (27 | 26.2%) for women.
| Age Bracket | Male | Female |
| Under 5 Years | 0 (0.0%) | 0 (0.0%) |
| 5 to 9 Years | 0 (0.0%) | 0 (0.0%) |
| 10 to 14 Years | 23 (33.8%) | 23 (22.3%) |
| 15 to 19 Years | 0 (0.0%) | 0 (0.0%) |
| 20 to 24 Years | 0 (0.0%) | 14 (13.6%) |
| 25 to 29 Years | 0 (0.0%) | 0 (0.0%) |
| 30 to 34 Years | 0 (0.0%) | 15 (14.6%) |
| 35 to 39 Years | 0 (0.0%) | 0 (0.0%) |
| 40 to 44 Years | 0 (0.0%) | 27 (26.2%) |
| 45 to 49 Years | 0 (0.0%) | 0 (0.0%) |
| 50 to 54 Years | 0 (0.0%) | 0 (0.0%) |
| 55 to 59 Years | 0 (0.0%) | 0 (0.0%) |
| 60 to 64 Years | 0 (0.0%) | 0 (0.0%) |
| 65 to 69 Years | 24 (35.3%) | 0 (0.0%) |
| 70 to 74 Years | 0 (0.0%) | 0 (0.0%) |
| 75 to 79 Years | 0 (0.0%) | 0 (0.0%) |
| 80 to 84 Years | 21 (30.9%) | 24 (23.3%) |
| 85 Years and over | 0 (0.0%) | 0 (0.0%) |
| Total | 68 (100.0%) | 103 (100.0%) |
Families and Households in Chestnut
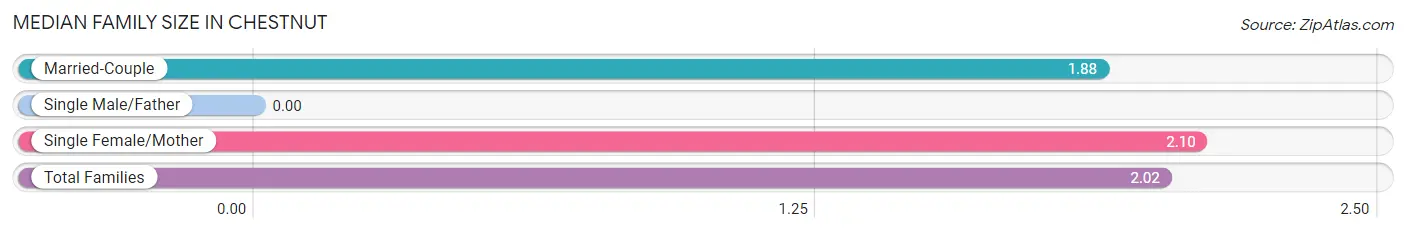
Median Family Size in Chestnut
| Family Type | # Families | Family Size |
| Married-Couple | 24 (36.4%) | 1.88 |
| Single Male/Father | 0 (0.0%) | - |
| Single Female/Mother | 42 (63.6%) | 2.10 |
| Total Families | 66 (100.0%) | 2.02 |
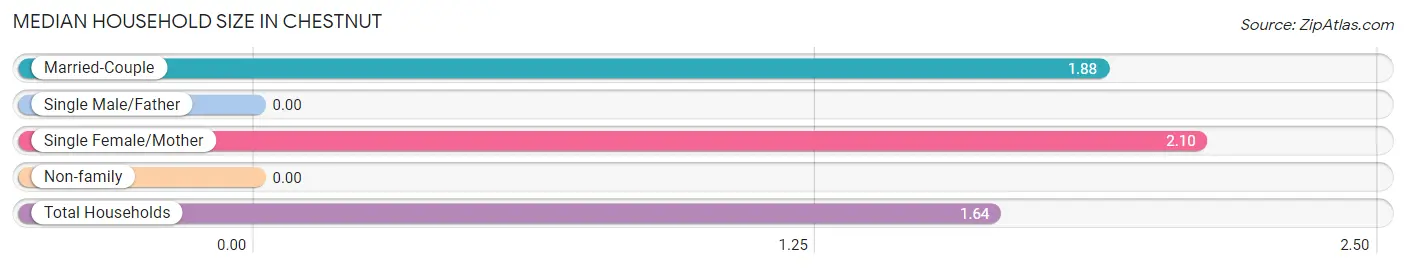
Median Household Size in Chestnut
| Household Type | # Households | Household Size |
| Married-Couple | 24 (23.1%) | 1.88 |
| Single Male/Father | 0 (0.0%) | - |
| Single Female/Mother | 42 (40.4%) | 2.10 |
| Non-family | 38 (36.5%) | - |
| Total Households | 104 (100.0%) | 1.64 |
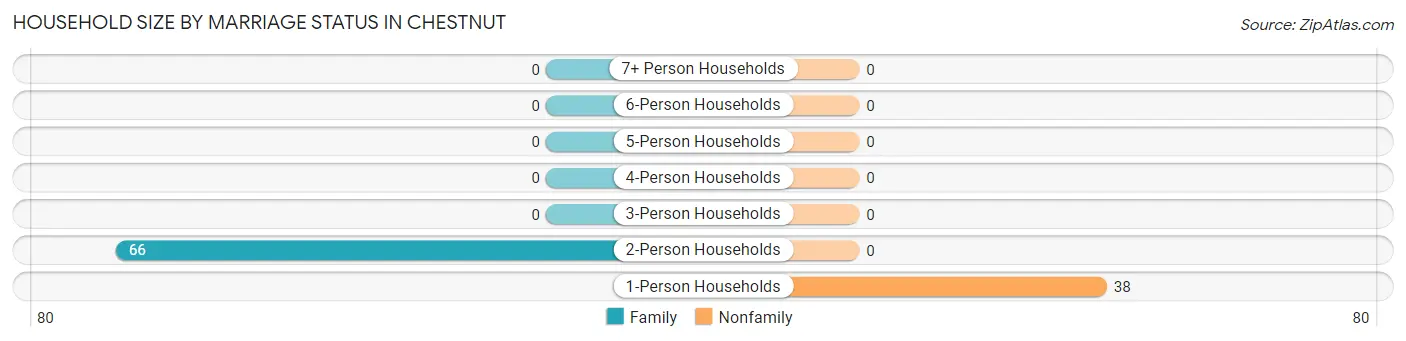
Household Size by Marriage Status in Chestnut
Out of a total of 104 households in Chestnut, 66 (63.5%) are family households, while 38 (36.5%) are nonfamily households. The most numerous type of family households are 2-person households, comprising 66, and the most common type of nonfamily households are 1-person households, comprising 38.
| Household Size | Family Households | Nonfamily Households |
| 1-Person Households | - | 38 (36.5%) |
| 2-Person Households | 66 (63.5%) | 0 (0.0%) |
| 3-Person Households | 0 (0.0%) | 0 (0.0%) |
| 4-Person Households | 0 (0.0%) | 0 (0.0%) |
| 5-Person Households | 0 (0.0%) | 0 (0.0%) |
| 6-Person Households | 0 (0.0%) | 0 (0.0%) |
| 7+ Person Households | 0 (0.0%) | 0 (0.0%) |
| Total | 66 (63.5%) | 38 (36.5%) |
Female Fertility in Chestnut
Fertility by Age in Chestnut
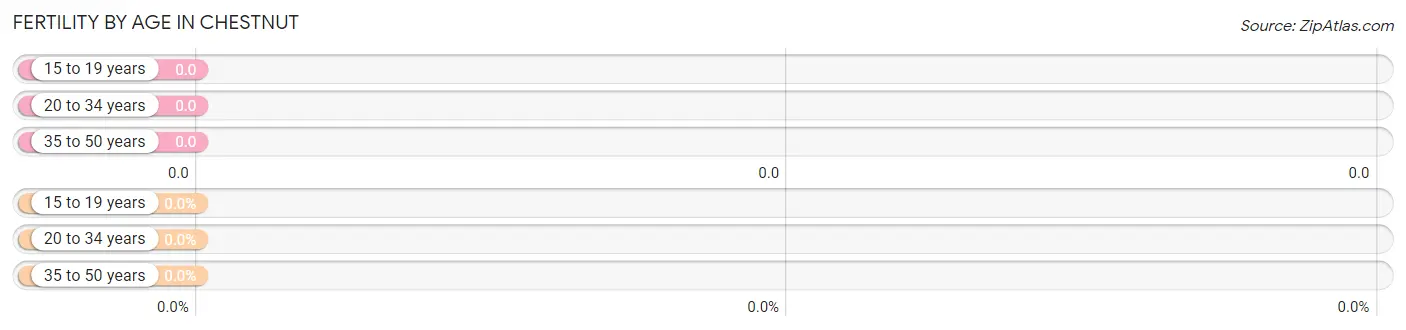
| Age Bracket | Women with Births | Births / 1,000 Women |
| 15 to 19 years | 0 (0.0%) | 0.0 |
| 20 to 34 years | 0 (0.0%) | 0.0 |
| 35 to 50 years | 0 (0.0%) | 0.0 |
| Total | 0 (0.0%) | 0.0 |
Fertility by Age by Marriage Status in Chestnut
| Age Bracket | Married | Unmarried |
| 15 to 19 years | 0 (0.0%) | 0 (0.0%) |
| 20 to 34 years | 0 (0.0%) | 0 (0.0%) |
| 35 to 50 years | 0 (0.0%) | 0 (0.0%) |
| Total | 0 (0.0%) | 0 (0.0%) |
Fertility by Education in Chestnut
| Educational Attainment | Women with Births | Births / 1,000 Women |
| Less than High School | 0 (0.0%) | 0.0 |
| High School Diploma | 0 (0.0%) | 0.0 |
| College or Associate's Degree | 0 (0.0%) | 0.0 |
| Bachelor's Degree | 0 (0.0%) | 0.0 |
| Graduate Degree | 0 (0.0%) | 0.0 |
| Total | 0 (0.0%) | 0.0 |
Fertility by Education by Marriage Status in Chestnut
| Educational Attainment | Married | Unmarried |
| Less than High School | 0 (0.0%) | 0 (0.0%) |
| High School Diploma | 0 (0.0%) | 0 (0.0%) |
| College or Associate's Degree | 0 (0.0%) | 0 (0.0%) |
| Bachelor's Degree | 0 (0.0%) | 0 (0.0%) |
| Graduate Degree | 0 (0.0%) | 0 (0.0%) |
| Total | 0 (0.0%) | 0 (0.0%) |
Employment Characteristics in Chestnut
Employment by Class of Employer in Chestnut
Among the 80 employed individuals in Chestnut, private company employees (39 | 48.7%), not-for-profit organizations (27 | 33.8%), and federal government employees (14 | 17.5%) make up the most common classes of employment.
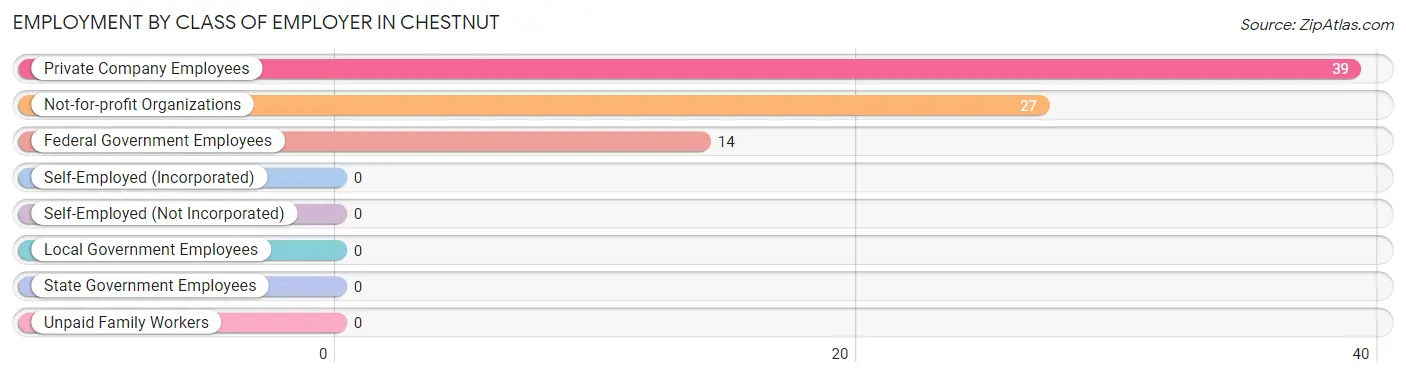
| Employer Class | # Employees | % Employees |
| Private Company Employees | 39 | 48.7% |
| Self-Employed (Incorporated) | 0 | 0.0% |
| Self-Employed (Not Incorporated) | 0 | 0.0% |
| Not-for-profit Organizations | 27 | 33.8% |
| Local Government Employees | 0 | 0.0% |
| State Government Employees | 0 | 0.0% |
| Federal Government Employees | 14 | 17.5% |
| Unpaid Family Workers | 0 | 0.0% |
| Total | 80 | 100.0% |
Employment Status by Age in Chestnut
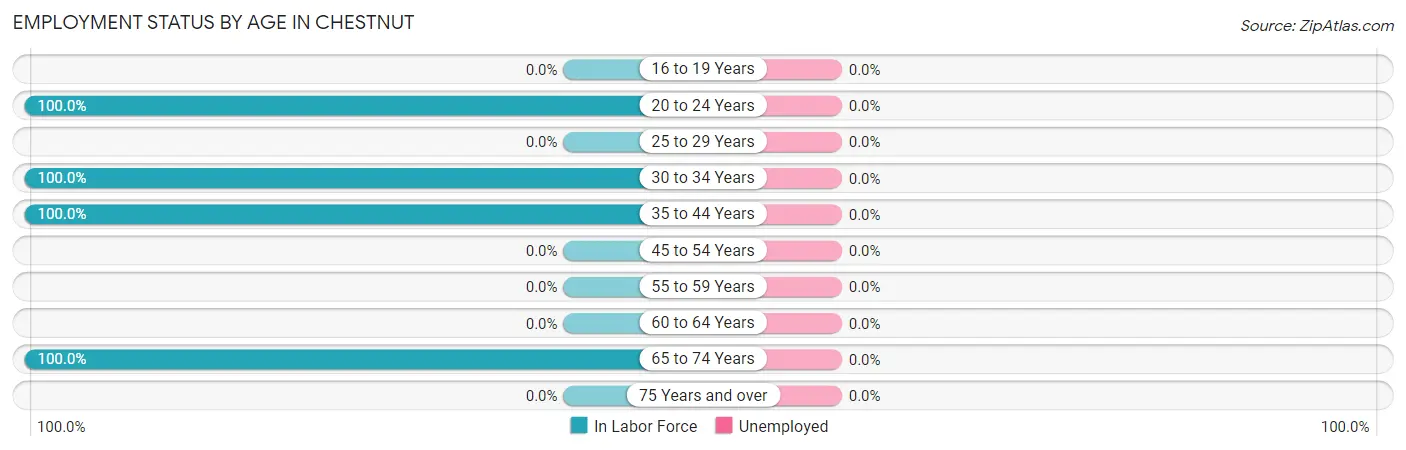
| Age Bracket | In Labor Force | Unemployed |
| 16 to 19 Years | 0 (0.0%) | 0 (0.0%) |
| 20 to 24 Years | 14 (100.0%) | 0 (0.0%) |
| 25 to 29 Years | 0 (0.0%) | 0 (0.0%) |
| 30 to 34 Years | 15 (100.0%) | 0 (0.0%) |
| 35 to 44 Years | 27 (100.0%) | 0 (0.0%) |
| 45 to 54 Years | 0 (0.0%) | 0 (0.0%) |
| 55 to 59 Years | 0 (0.0%) | 0 (0.0%) |
| 60 to 64 Years | 0 (0.0%) | 0 (0.0%) |
| 65 to 74 Years | 24 (100.0%) | 0 (0.0%) |
| 75 Years and over | 0 (0.0%) | 0 (0.0%) |
| Total | 80 (64.0%) | 0 (0.0%) |
Employment Status by Educational Attainment in Chestnut
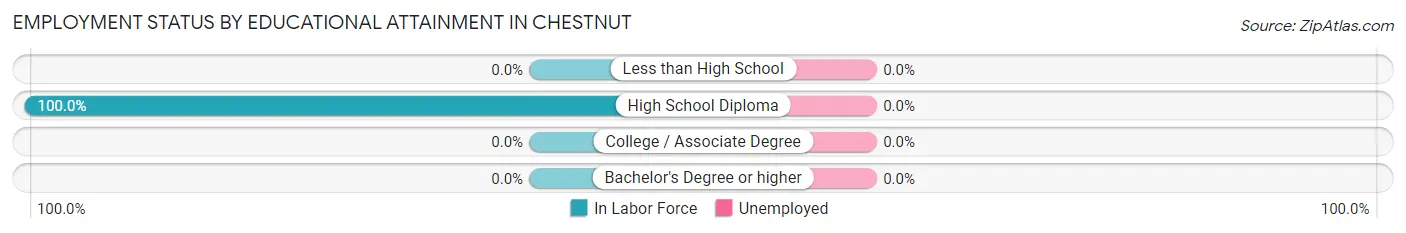
| Educational Attainment | In Labor Force | Unemployed |
| Less than High School | 0 (0.0%) | 0 (0.0%) |
| High School Diploma | 42 (100.0%) | 0 (0.0%) |
| College / Associate Degree | 0 (0.0%) | 0 (0.0%) |
| Bachelor's Degree or higher | 0 (0.0%) | 0 (0.0%) |
| Total | 42 (100.0%) | 0 (0.0%) |
Employment Occupations by Sex in Chestnut
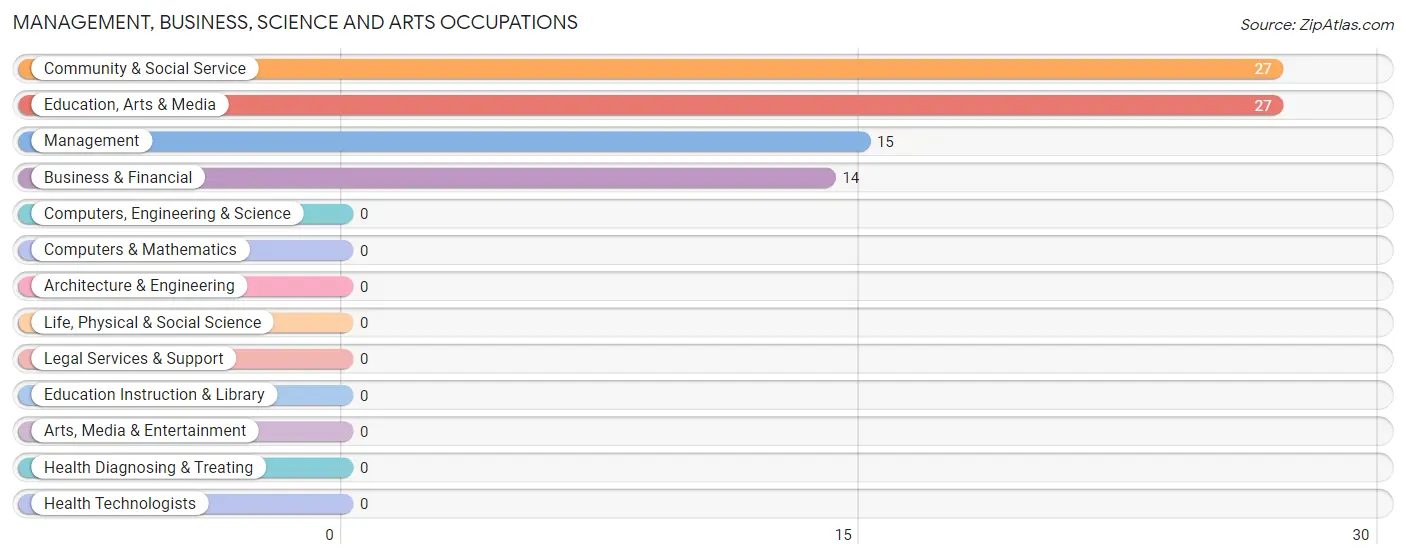
Management, Business, Science and Arts Occupations
The most common Management, Business, Science and Arts occupations in Chestnut are Community & Social Service (27 | 33.8%), Education, Arts & Media (27 | 33.8%), Management (15 | 18.8%), and Business & Financial (14 | 17.5%).
Management, Business, Science and Arts Occupations by Sex
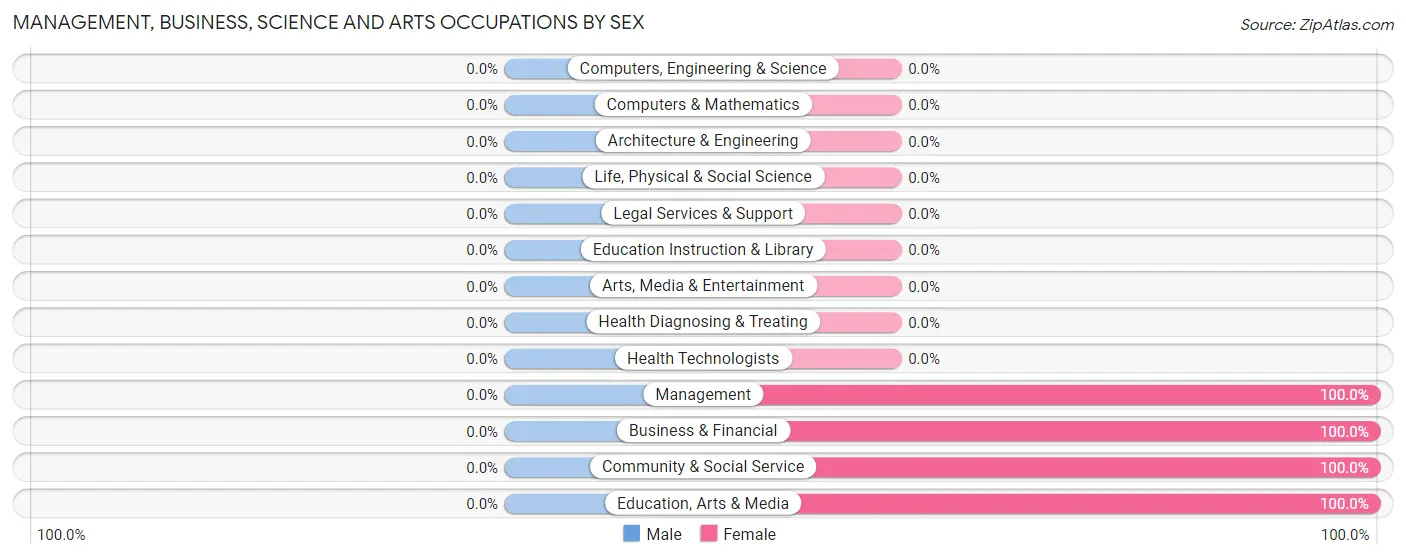
| Occupation | Male | Female |
| Management | 0 (0.0%) | 15 (100.0%) |
| Business & Financial | 0 (0.0%) | 14 (100.0%) |
| Computers, Engineering & Science | 0 (0.0%) | 0 (0.0%) |
| Computers & Mathematics | 0 (0.0%) | 0 (0.0%) |
| Architecture & Engineering | 0 (0.0%) | 0 (0.0%) |
| Life, Physical & Social Science | 0 (0.0%) | 0 (0.0%) |
| Community & Social Service | 0 (0.0%) | 27 (100.0%) |
| Education, Arts & Media | 0 (0.0%) | 27 (100.0%) |
| Legal Services & Support | 0 (0.0%) | 0 (0.0%) |
| Education Instruction & Library | 0 (0.0%) | 0 (0.0%) |
| Arts, Media & Entertainment | 0 (0.0%) | 0 (0.0%) |
| Health Diagnosing & Treating | 0 (0.0%) | 0 (0.0%) |
| Health Technologists | 0 (0.0%) | 0 (0.0%) |
| Total (Category) | 0 (0.0%) | 56 (100.0%) |
| Total (Overall) | 24 (30.0%) | 56 (70.0%) |
Services Occupations
Services Occupations by Sex
| Occupation | Male | Female |
| Healthcare Support | 0 (0.0%) | 0 (0.0%) |
| Security & Protection | 0 (0.0%) | 0 (0.0%) |
| Firefighting & Prevention | 0 (0.0%) | 0 (0.0%) |
| Law Enforcement | 0 (0.0%) | 0 (0.0%) |
| Food Preparation & Serving | 0 (0.0%) | 0 (0.0%) |
| Cleaning & Maintenance | 0 (0.0%) | 0 (0.0%) |
| Personal Care & Service | 0 (0.0%) | 0 (0.0%) |
| Total (Category) | 0 (0.0%) | 0 (0.0%) |
| Total (Overall) | 24 (30.0%) | 56 (70.0%) |
Sales and Office Occupations
Sales and Office Occupations by Sex
| Occupation | Male | Female |
| Sales & Related | 0 (0.0%) | 0 (0.0%) |
| Office & Administration | 0 (0.0%) | 0 (0.0%) |
| Total (Category) | 0 (0.0%) | 0 (0.0%) |
| Total (Overall) | 24 (30.0%) | 56 (70.0%) |
Natural Resources, Construction and Maintenance Occupations
Natural Resources, Construction and Maintenance Occupations by Sex
| Occupation | Male | Female |
| Farming, Fishing & Forestry | 0 (0.0%) | 0 (0.0%) |
| Construction & Extraction | 0 (0.0%) | 0 (0.0%) |
| Installation, Maintenance & Repair | 0 (0.0%) | 0 (0.0%) |
| Total (Category) | 0 (0.0%) | 0 (0.0%) |
| Total (Overall) | 24 (30.0%) | 56 (70.0%) |
Production, Transportation and Moving Occupations
The most common Production, Transportation and Moving occupations in Chestnut are , and Transportation (24 | 30.0%).
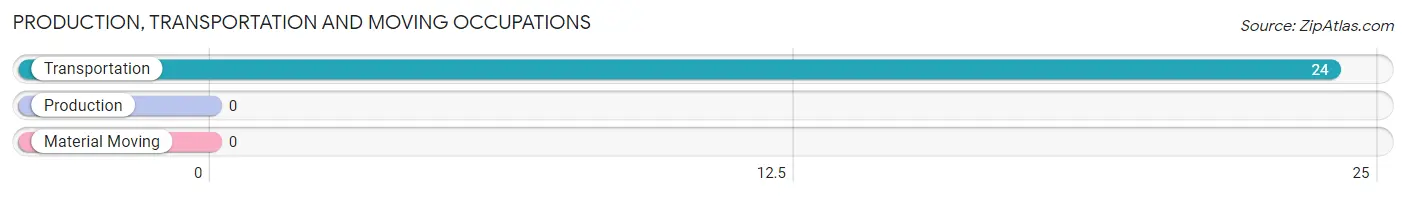
Production, Transportation and Moving Occupations by Sex
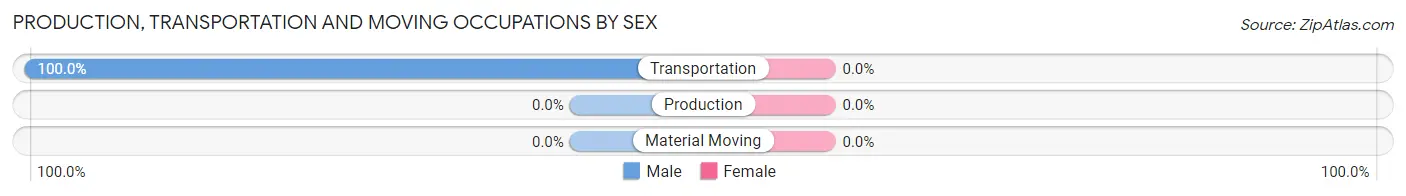
| Occupation | Male | Female |
| Production | 0 (0.0%) | 0 (0.0%) |
| Transportation | 24 (100.0%) | 0 (0.0%) |
| Material Moving | 0 (0.0%) | 0 (0.0%) |
| Total (Category) | 24 (100.0%) | 0 (0.0%) |
| Total (Overall) | 24 (30.0%) | 56 (70.0%) |
Employment Industries by Sex in Chestnut
Employment Industries in Chestnut
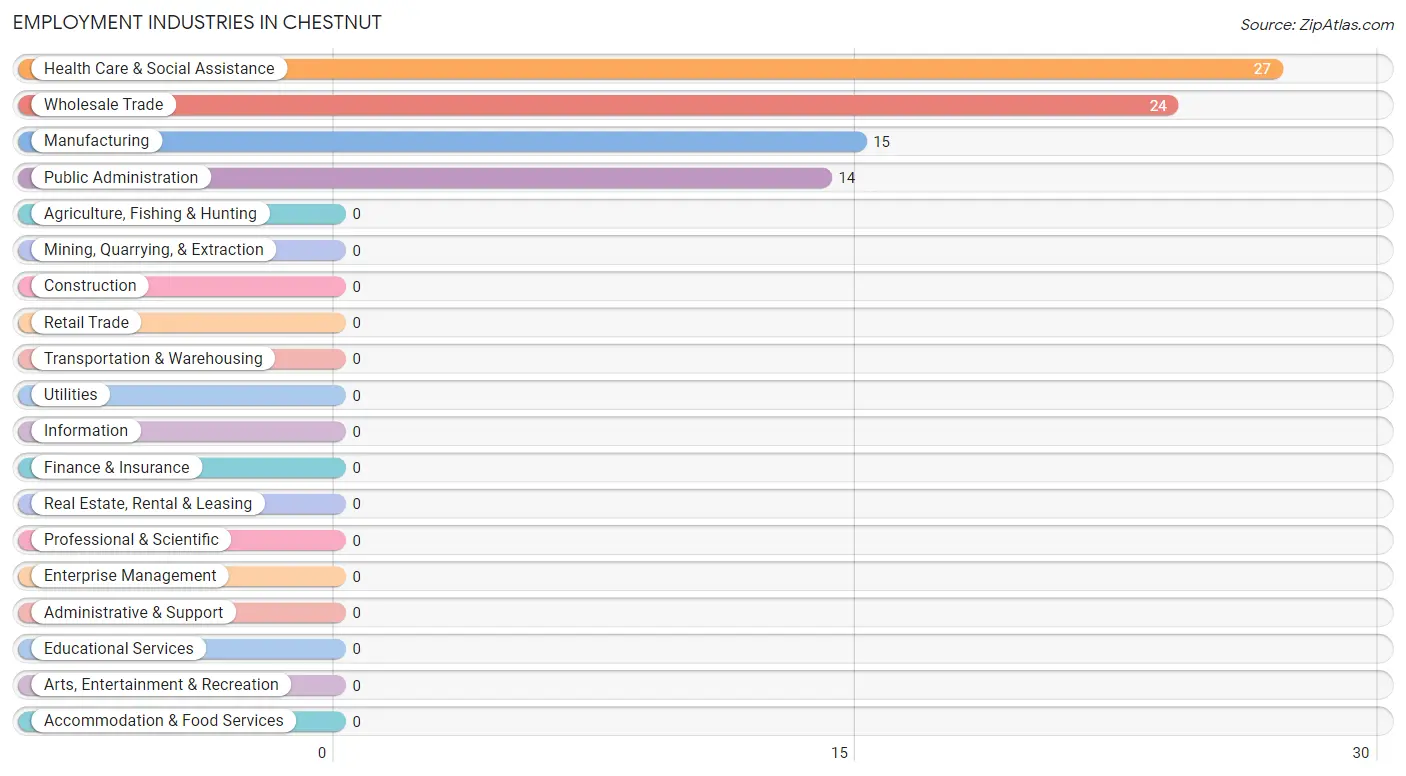
The major employment industries in Chestnut include Health Care & Social Assistance (27 | 33.8%), Wholesale Trade (24 | 30.0%), Manufacturing (15 | 18.8%), and Public Administration (14 | 17.5%).
Employment Industries by Sex in Chestnut
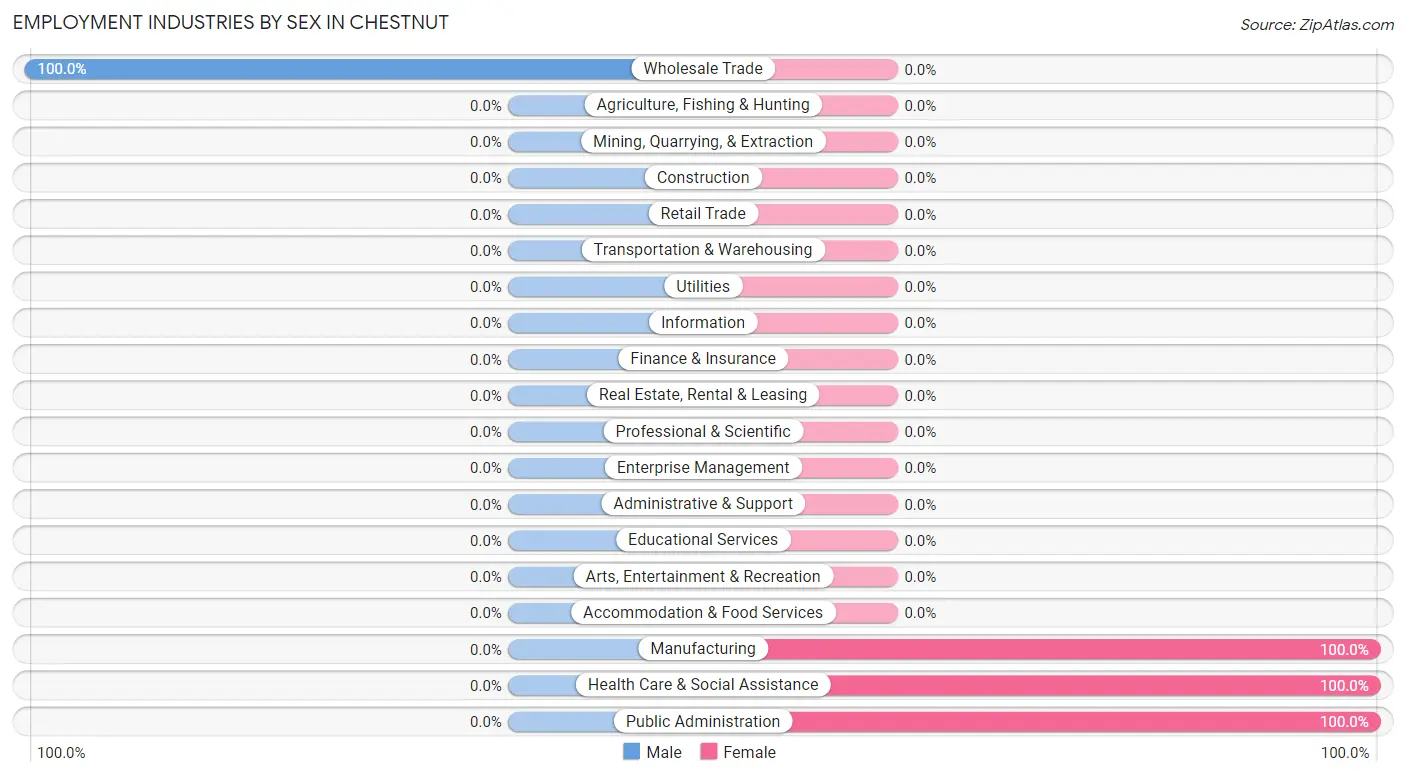
| Industry | Male | Female |
| Agriculture, Fishing & Hunting | 0 (0.0%) | 0 (0.0%) |
| Mining, Quarrying, & Extraction | 0 (0.0%) | 0 (0.0%) |
| Construction | 0 (0.0%) | 0 (0.0%) |
| Manufacturing | 0 (0.0%) | 15 (100.0%) |
| Wholesale Trade | 24 (100.0%) | 0 (0.0%) |
| Retail Trade | 0 (0.0%) | 0 (0.0%) |
| Transportation & Warehousing | 0 (0.0%) | 0 (0.0%) |
| Utilities | 0 (0.0%) | 0 (0.0%) |
| Information | 0 (0.0%) | 0 (0.0%) |
| Finance & Insurance | 0 (0.0%) | 0 (0.0%) |
| Real Estate, Rental & Leasing | 0 (0.0%) | 0 (0.0%) |
| Professional & Scientific | 0 (0.0%) | 0 (0.0%) |
| Enterprise Management | 0 (0.0%) | 0 (0.0%) |
| Administrative & Support | 0 (0.0%) | 0 (0.0%) |
| Educational Services | 0 (0.0%) | 0 (0.0%) |
| Health Care & Social Assistance | 0 (0.0%) | 27 (100.0%) |
| Arts, Entertainment & Recreation | 0 (0.0%) | 0 (0.0%) |
| Accommodation & Food Services | 0 (0.0%) | 0 (0.0%) |
| Public Administration | 0 (0.0%) | 14 (100.0%) |
| Total | 24 (30.0%) | 56 (70.0%) |
Education in Chestnut
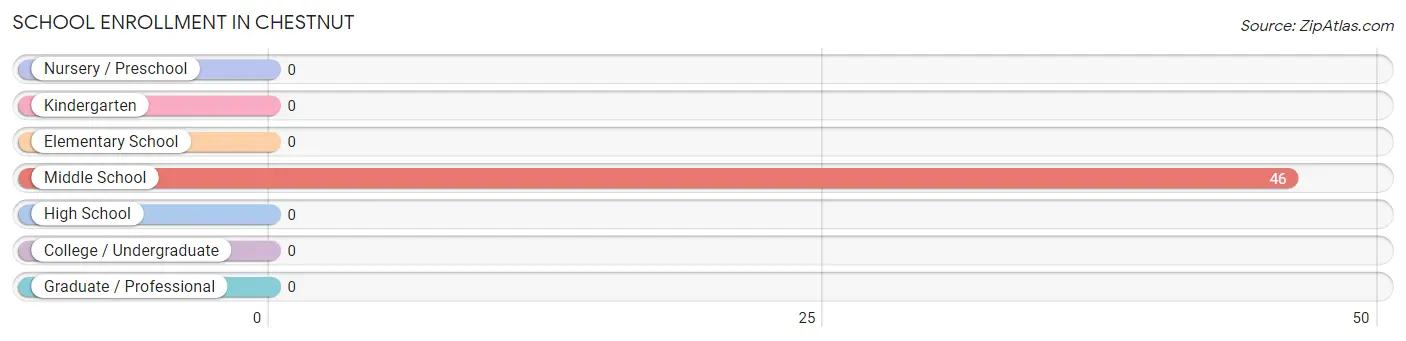
School Enrollment in Chestnut
| School Level | # Students | % Students |
| Nursery / Preschool | 0 | 0.0% |
| Kindergarten | 0 | 0.0% |
| Elementary School | 0 | 0.0% |
| Middle School | 46 | 100.0% |
| High School | 0 | 0.0% |
| College / Undergraduate | 0 | 0.0% |
| Graduate / Professional | 0 | 0.0% |
| Total | 46 | 100.0% |
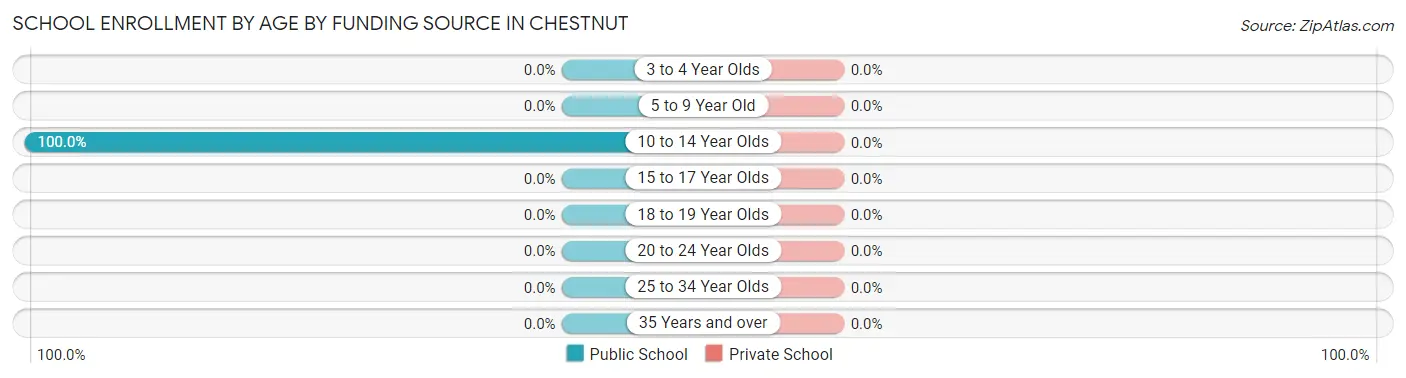
School Enrollment by Age by Funding Source in Chestnut
| Age Bracket | Public School | Private School |
| 3 to 4 Year Olds | 0 (0.0%) | 0 (0.0%) |
| 5 to 9 Year Old | 0 (0.0%) | 0 (0.0%) |
| 10 to 14 Year Olds | 46 (100.0%) | 0 (0.0%) |
| 15 to 17 Year Olds | 0 (0.0%) | 0 (0.0%) |
| 18 to 19 Year Olds | 0 (0.0%) | 0 (0.0%) |
| 20 to 24 Year Olds | 0 (0.0%) | 0 (0.0%) |
| 25 to 34 Year Olds | 0 (0.0%) | 0 (0.0%) |
| 35 Years and over | 0 (0.0%) | 0 (0.0%) |
| Total | 46 (100.0%) | 0 (0.0%) |
Educational Attainment by Field of Study in Chestnut
| Field of Study | # Graduates | % Graduates |
| Computers & Mathematics | 0 | 0.0% |
| Bio, Nature & Agricultural | 0 | 0.0% |
| Physical & Health Sciences | 0 | 0.0% |
| Psychology | 0 | 0.0% |
| Social Sciences | 0 | 0.0% |
| Engineering | 0 | 0.0% |
| Multidisciplinary Studies | 0 | 0.0% |
| Science & Technology | 0 | 0.0% |
| Business | 0 | 0.0% |
| Education | 0 | 0.0% |
| Literature & Languages | 0 | 0.0% |
| Liberal Arts & History | 0 | 0.0% |
| Visual & Performing Arts | 0 | 0.0% |
| Communications | 0 | 0.0% |
| Arts & Humanities | 0 | 0.0% |
| Total | 0 | 0.0% |
Transportation & Commute in Chestnut
Vehicle Availability by Sex in Chestnut
The most prevalent vehicle ownership categories in Chestnut are males with 2 vehicles (24, accounting for 100.0%) and females with 2 vehicles (29, making up 42.9%).
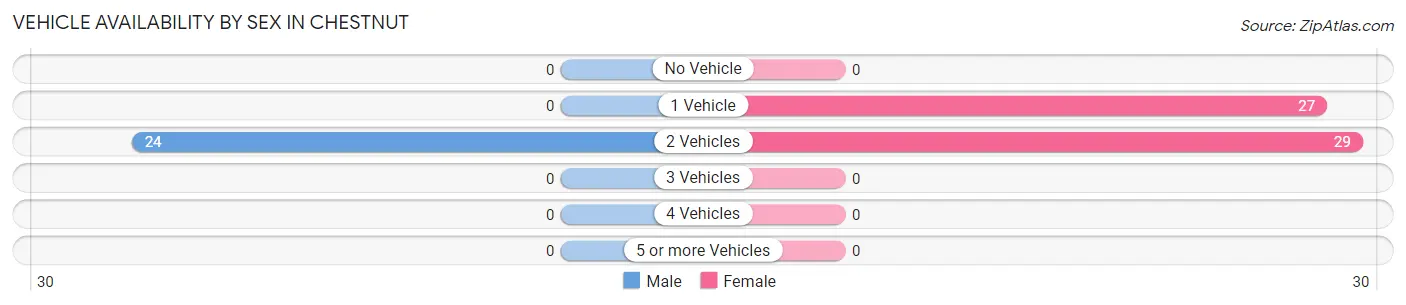
| Vehicles Available | Male | Female |
| No Vehicle | 0 (0.0%) | 0 (0.0%) |
| 1 Vehicle | 0 (0.0%) | 27 (48.2%) |
| 2 Vehicles | 24 (100.0%) | 29 (51.8%) |
| 3 Vehicles | 0 (0.0%) | 0 (0.0%) |
| 4 Vehicles | 0 (0.0%) | 0 (0.0%) |
| 5 or more Vehicles | 0 (0.0%) | 0 (0.0%) |
| Total | 24 (100.0%) | 56 (100.0%) |
Commute Time in Chestnut
The most frequently occuring commute durations in Chestnut are 30 to 34 minutes (42 commuters, 52.5%), less than 5 minutes (24 commuters, 30.0%), and 15 to 19 minutes (14 commuters, 17.5%).
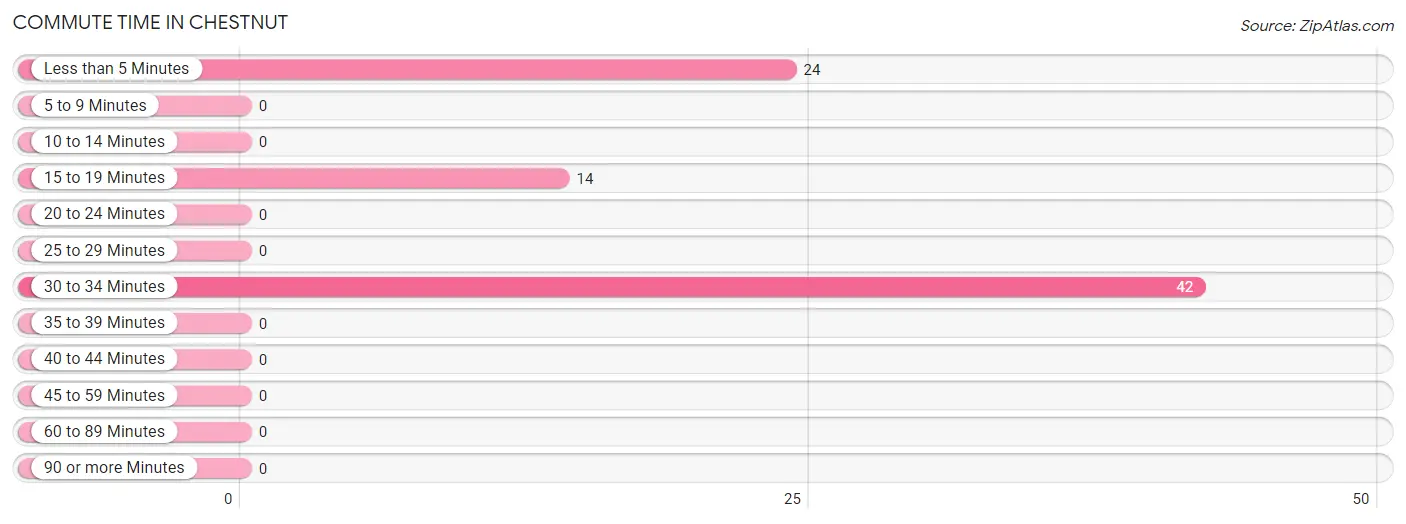
| Commute Time | # Commuters | % Commuters |
| Less than 5 Minutes | 24 | 30.0% |
| 5 to 9 Minutes | 0 | 0.0% |
| 10 to 14 Minutes | 0 | 0.0% |
| 15 to 19 Minutes | 14 | 17.5% |
| 20 to 24 Minutes | 0 | 0.0% |
| 25 to 29 Minutes | 0 | 0.0% |
| 30 to 34 Minutes | 42 | 52.5% |
| 35 to 39 Minutes | 0 | 0.0% |
| 40 to 44 Minutes | 0 | 0.0% |
| 45 to 59 Minutes | 0 | 0.0% |
| 60 to 89 Minutes | 0 | 0.0% |
| 90 or more Minutes | 0 | 0.0% |
Commute Time by Sex in Chestnut
The most common commute times in Chestnut are less than 5 minutes (24 commuters, 100.0%) for males and 30 to 34 minutes (42 commuters, 75.0%) for females.
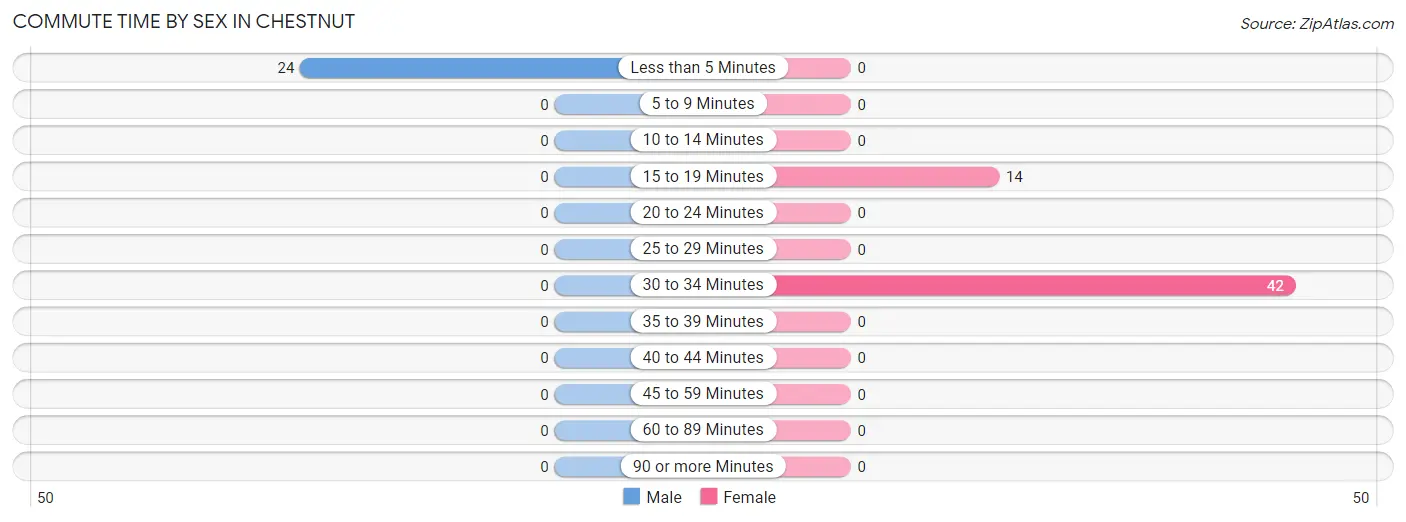
| Commute Time | Male | Female |
| Less than 5 Minutes | 24 (100.0%) | 0 (0.0%) |
| 5 to 9 Minutes | 0 (0.0%) | 0 (0.0%) |
| 10 to 14 Minutes | 0 (0.0%) | 0 (0.0%) |
| 15 to 19 Minutes | 0 (0.0%) | 14 (25.0%) |
| 20 to 24 Minutes | 0 (0.0%) | 0 (0.0%) |
| 25 to 29 Minutes | 0 (0.0%) | 0 (0.0%) |
| 30 to 34 Minutes | 0 (0.0%) | 42 (75.0%) |
| 35 to 39 Minutes | 0 (0.0%) | 0 (0.0%) |
| 40 to 44 Minutes | 0 (0.0%) | 0 (0.0%) |
| 45 to 59 Minutes | 0 (0.0%) | 0 (0.0%) |
| 60 to 89 Minutes | 0 (0.0%) | 0 (0.0%) |
| 90 or more Minutes | 0 (0.0%) | 0 (0.0%) |
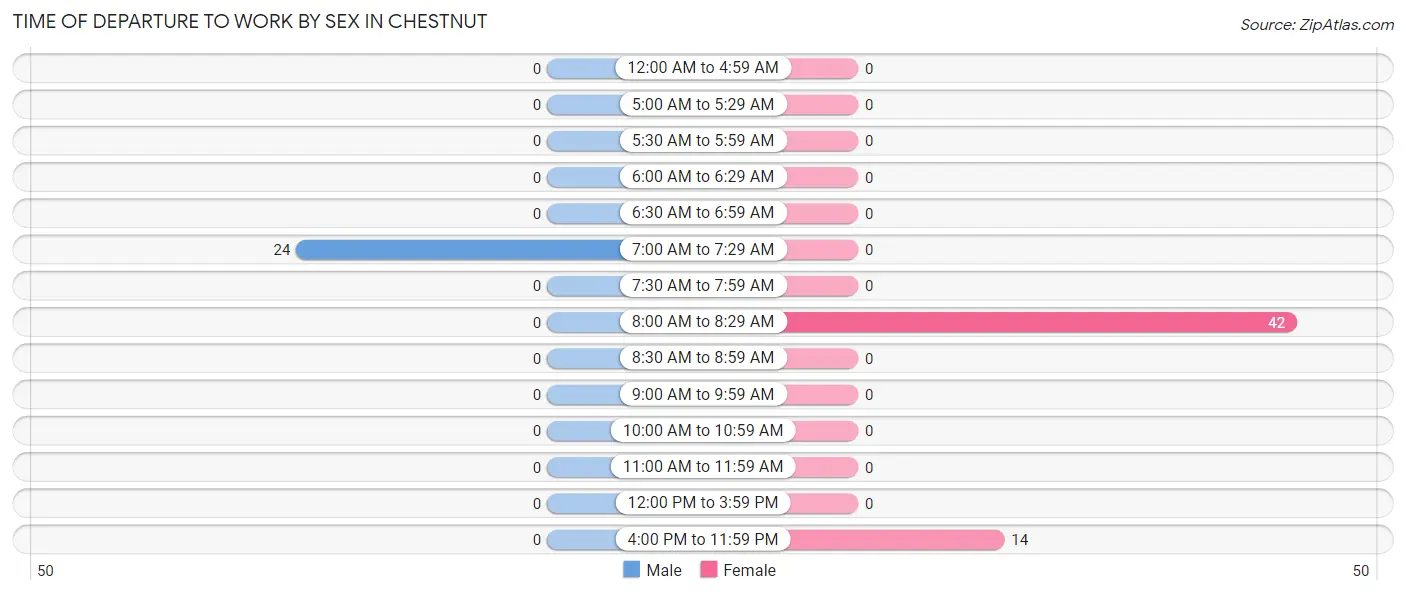
Time of Departure to Work by Sex in Chestnut
The most frequent times of departure to work in Chestnut are 7:00 AM to 7:29 AM (24, 100.0%) for males and 8:00 AM to 8:29 AM (42, 75.0%) for females.
| Time of Departure | Male | Female |
| 12:00 AM to 4:59 AM | 0 (0.0%) | 0 (0.0%) |
| 5:00 AM to 5:29 AM | 0 (0.0%) | 0 (0.0%) |
| 5:30 AM to 5:59 AM | 0 (0.0%) | 0 (0.0%) |
| 6:00 AM to 6:29 AM | 0 (0.0%) | 0 (0.0%) |
| 6:30 AM to 6:59 AM | 0 (0.0%) | 0 (0.0%) |
| 7:00 AM to 7:29 AM | 24 (100.0%) | 0 (0.0%) |
| 7:30 AM to 7:59 AM | 0 (0.0%) | 0 (0.0%) |
| 8:00 AM to 8:29 AM | 0 (0.0%) | 42 (75.0%) |
| 8:30 AM to 8:59 AM | 0 (0.0%) | 0 (0.0%) |
| 9:00 AM to 9:59 AM | 0 (0.0%) | 0 (0.0%) |
| 10:00 AM to 10:59 AM | 0 (0.0%) | 0 (0.0%) |
| 11:00 AM to 11:59 AM | 0 (0.0%) | 0 (0.0%) |
| 12:00 PM to 3:59 PM | 0 (0.0%) | 0 (0.0%) |
| 4:00 PM to 11:59 PM | 0 (0.0%) | 14 (25.0%) |
| Total | 24 (100.0%) | 56 (100.0%) |
Housing Occupancy in Chestnut
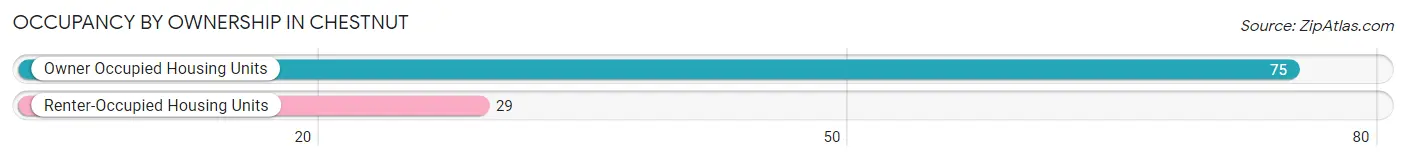
Occupancy by Ownership in Chestnut
Of the total 104 dwellings in Chestnut, owner-occupied units account for 75 (72.1%), while renter-occupied units make up 29 (27.9%).
| Occupancy | # Housing Units | % Housing Units |
| Owner Occupied Housing Units | 75 | 72.1% |
| Renter-Occupied Housing Units | 29 | 27.9% |
| Total Occupied Housing Units | 104 | 100.0% |
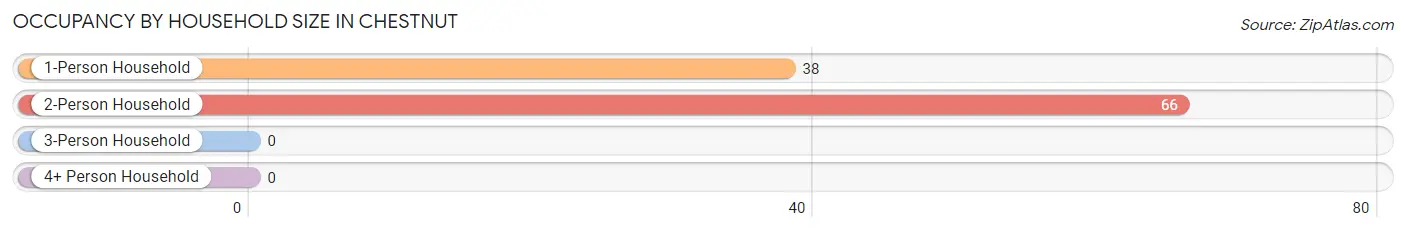
Occupancy by Household Size in Chestnut
| Household Size | # Housing Units | % Housing Units |
| 1-Person Household | 38 | 36.5% |
| 2-Person Household | 66 | 63.5% |
| 3-Person Household | 0 | 0.0% |
| 4+ Person Household | 0 | 0.0% |
| Total Housing Units | 104 | 100.0% |
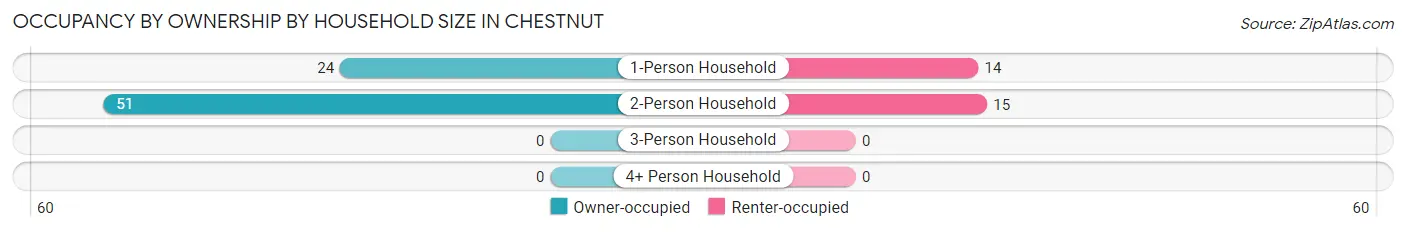
Occupancy by Ownership by Household Size in Chestnut
| Household Size | Owner-occupied | Renter-occupied |
| 1-Person Household | 24 (63.2%) | 14 (36.8%) |
| 2-Person Household | 51 (77.3%) | 15 (22.7%) |
| 3-Person Household | 0 (0.0%) | 0 (0.0%) |
| 4+ Person Household | 0 (0.0%) | 0 (0.0%) |
| Total Housing Units | 75 (72.1%) | 29 (27.9%) |
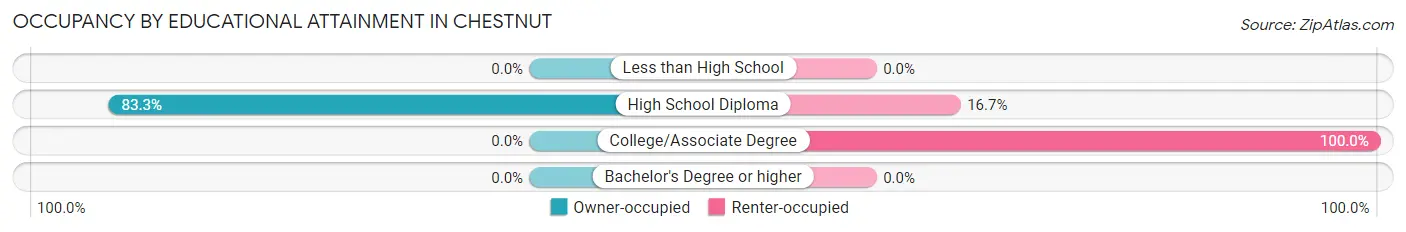
Occupancy by Educational Attainment in Chestnut
| Household Size | Owner-occupied | Renter-occupied |
| Less than High School | 0 (0.0%) | 0 (0.0%) |
| High School Diploma | 75 (83.3%) | 15 (16.7%) |
| College/Associate Degree | 0 (0.0%) | 14 (100.0%) |
| Bachelor's Degree or higher | 0 (0.0%) | 0 (0.0%) |
Occupancy by Age of Householder in Chestnut
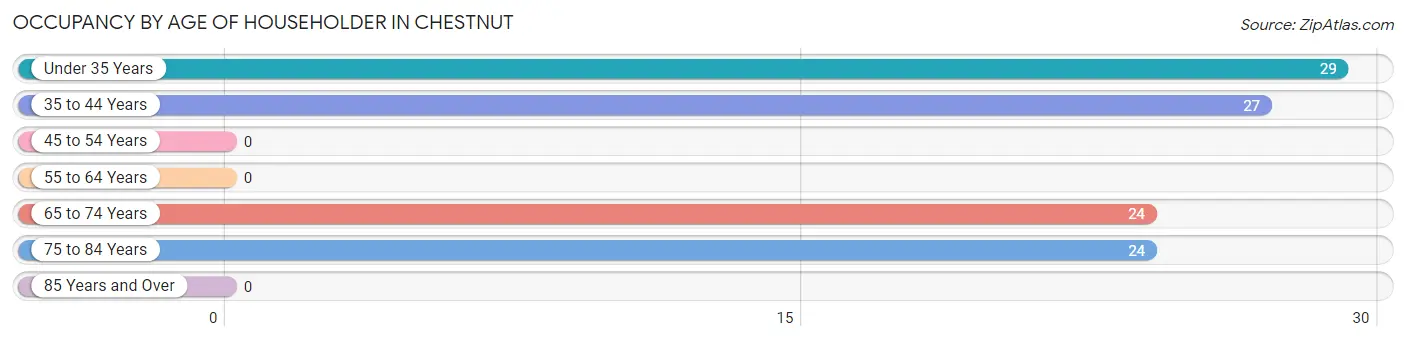
| Age Bracket | # Households | % Households |
| Under 35 Years | 29 | 27.9% |
| 35 to 44 Years | 27 | 26.0% |
| 45 to 54 Years | 0 | 0.0% |
| 55 to 64 Years | 0 | 0.0% |
| 65 to 74 Years | 24 | 23.1% |
| 75 to 84 Years | 24 | 23.1% |
| 85 Years and Over | 0 | 0.0% |
| Total | 104 | 100.0% |
Housing Finances in Chestnut
Median Income by Occupancy in Chestnut
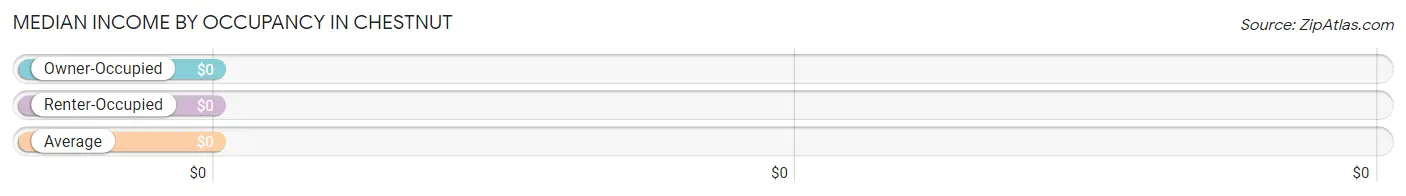
| Occupancy Type | # Households | Median Income |
| Owner-Occupied | 75 (72.1%) | $0 |
| Renter-Occupied | 29 (27.9%) | $0 |
| Average | 104 (100.0%) | $0 |
Occupancy by Householder Income Bracket in Chestnut
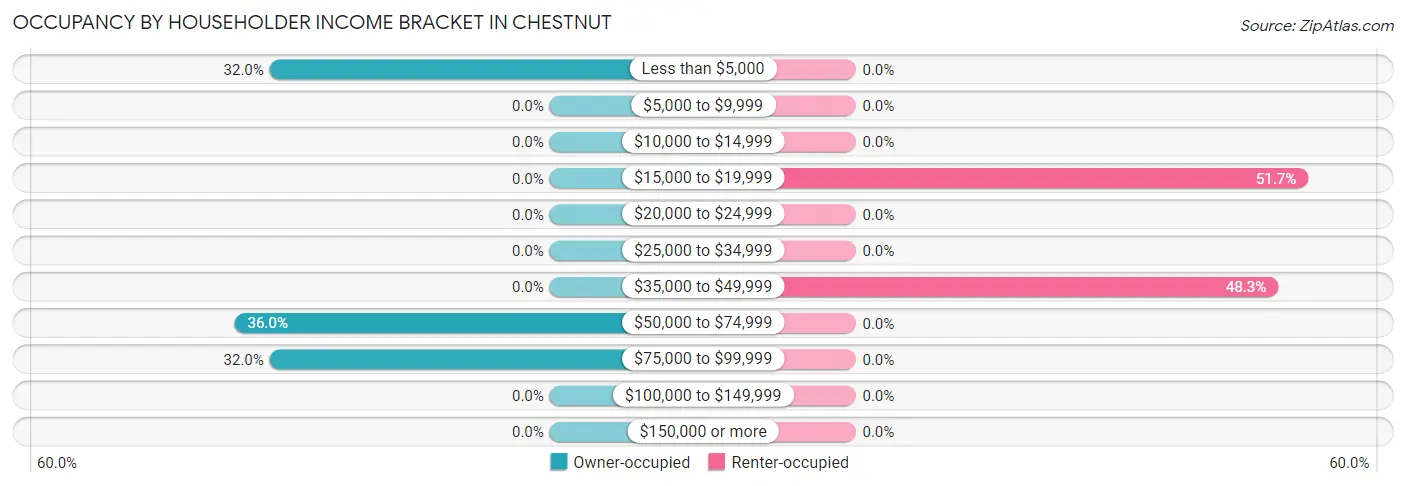
| Income Bracket | Owner-occupied | Renter-occupied |
| Less than $5,000 | 24 (32.0%) | 0 (0.0%) |
| $5,000 to $9,999 | 0 (0.0%) | 0 (0.0%) |
| $10,000 to $14,999 | 0 (0.0%) | 0 (0.0%) |
| $15,000 to $19,999 | 0 (0.0%) | 15 (51.7%) |
| $20,000 to $24,999 | 0 (0.0%) | 0 (0.0%) |
| $25,000 to $34,999 | 0 (0.0%) | 0 (0.0%) |
| $35,000 to $49,999 | 0 (0.0%) | 14 (48.3%) |
| $50,000 to $74,999 | 27 (36.0%) | 0 (0.0%) |
| $75,000 to $99,999 | 24 (32.0%) | 0 (0.0%) |
| $100,000 to $149,999 | 0 (0.0%) | 0 (0.0%) |
| $150,000 or more | 0 (0.0%) | 0 (0.0%) |
| Total | 75 (100.0%) | 29 (100.0%) |
Monthly Housing Cost Tiers in Chestnut
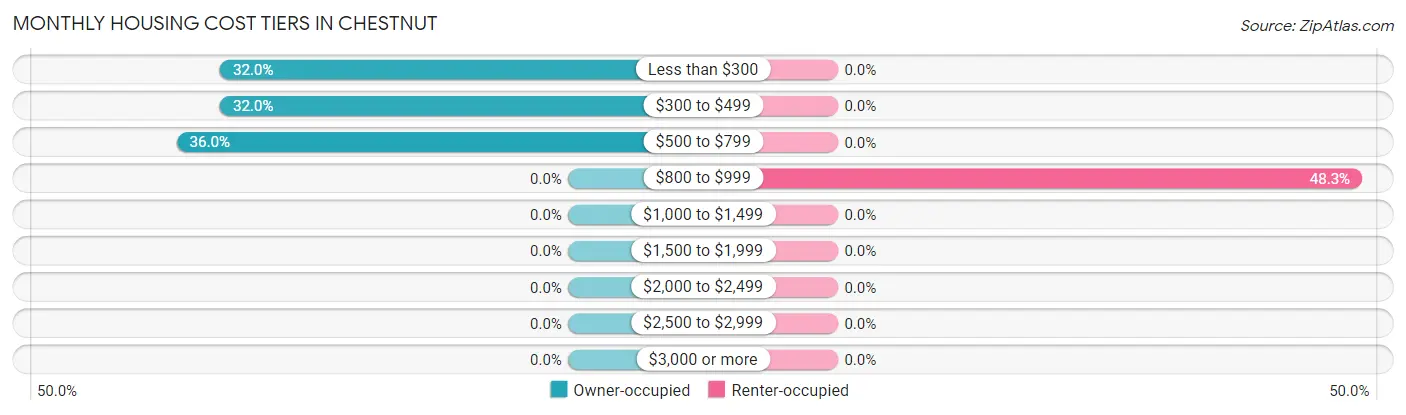
| Monthly Cost | Owner-occupied | Renter-occupied |
| Less than $300 | 24 (32.0%) | 0 (0.0%) |
| $300 to $499 | 24 (32.0%) | 0 (0.0%) |
| $500 to $799 | 27 (36.0%) | 0 (0.0%) |
| $800 to $999 | 0 (0.0%) | 14 (48.3%) |
| $1,000 to $1,499 | 0 (0.0%) | 0 (0.0%) |
| $1,500 to $1,999 | 0 (0.0%) | 0 (0.0%) |
| $2,000 to $2,499 | 0 (0.0%) | 0 (0.0%) |
| $2,500 to $2,999 | 0 (0.0%) | 0 (0.0%) |
| $3,000 or more | 0 (0.0%) | 0 (0.0%) |
| Total | 75 (100.0%) | 29 (100.0%) |
Physical Housing Characteristics in Chestnut
Housing Structures in Chestnut
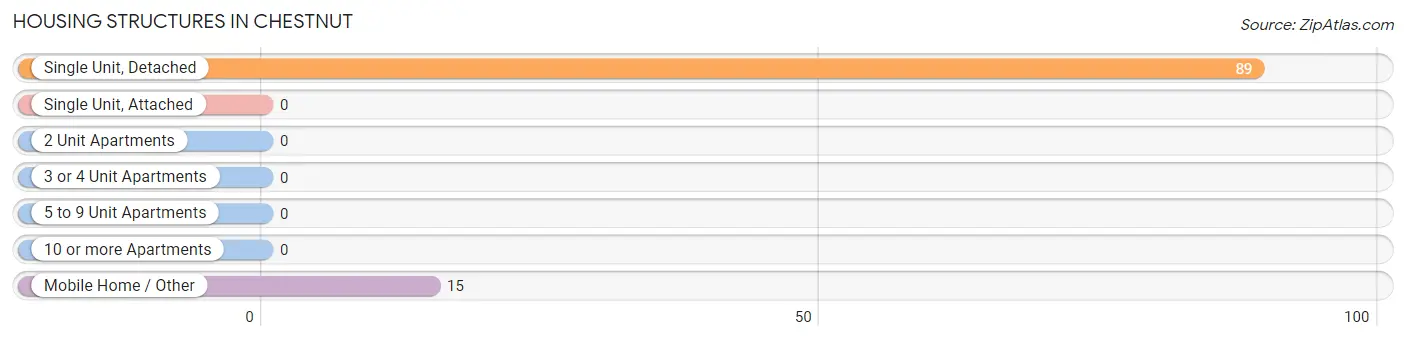
| Structure Type | # Housing Units | % Housing Units |
| Single Unit, Detached | 89 | 85.6% |
| Single Unit, Attached | 0 | 0.0% |
| 2 Unit Apartments | 0 | 0.0% |
| 3 or 4 Unit Apartments | 0 | 0.0% |
| 5 to 9 Unit Apartments | 0 | 0.0% |
| 10 or more Apartments | 0 | 0.0% |
| Mobile Home / Other | 15 | 14.4% |
| Total | 104 | 100.0% |
Housing Structures by Occupancy in Chestnut
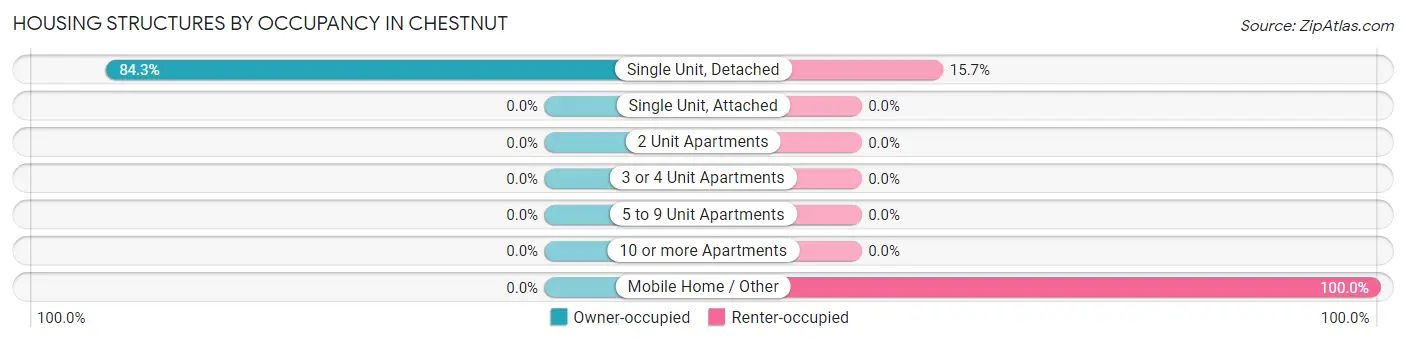
| Structure Type | Owner-occupied | Renter-occupied |
| Single Unit, Detached | 75 (84.3%) | 14 (15.7%) |
| Single Unit, Attached | 0 (0.0%) | 0 (0.0%) |
| 2 Unit Apartments | 0 (0.0%) | 0 (0.0%) |
| 3 or 4 Unit Apartments | 0 (0.0%) | 0 (0.0%) |
| 5 to 9 Unit Apartments | 0 (0.0%) | 0 (0.0%) |
| 10 or more Apartments | 0 (0.0%) | 0 (0.0%) |
| Mobile Home / Other | 0 (0.0%) | 15 (100.0%) |
| Total | 75 (72.1%) | 29 (27.9%) |
Housing Structures by Number of Rooms in Chestnut
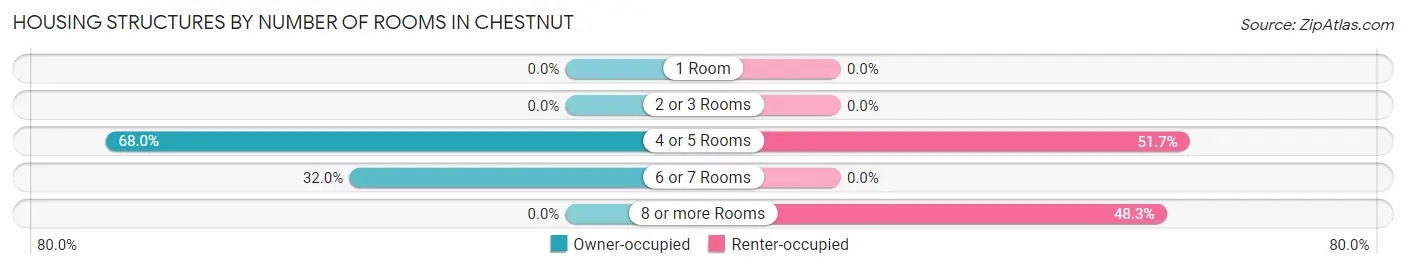
| Number of Rooms | Owner-occupied | Renter-occupied |
| 1 Room | 0 (0.0%) | 0 (0.0%) |
| 2 or 3 Rooms | 0 (0.0%) | 0 (0.0%) |
| 4 or 5 Rooms | 51 (68.0%) | 15 (51.7%) |
| 6 or 7 Rooms | 24 (32.0%) | 0 (0.0%) |
| 8 or more Rooms | 0 (0.0%) | 14 (48.3%) |
| Total | 75 (100.0%) | 29 (100.0%) |
Housing Structure by Heating Type in Chestnut
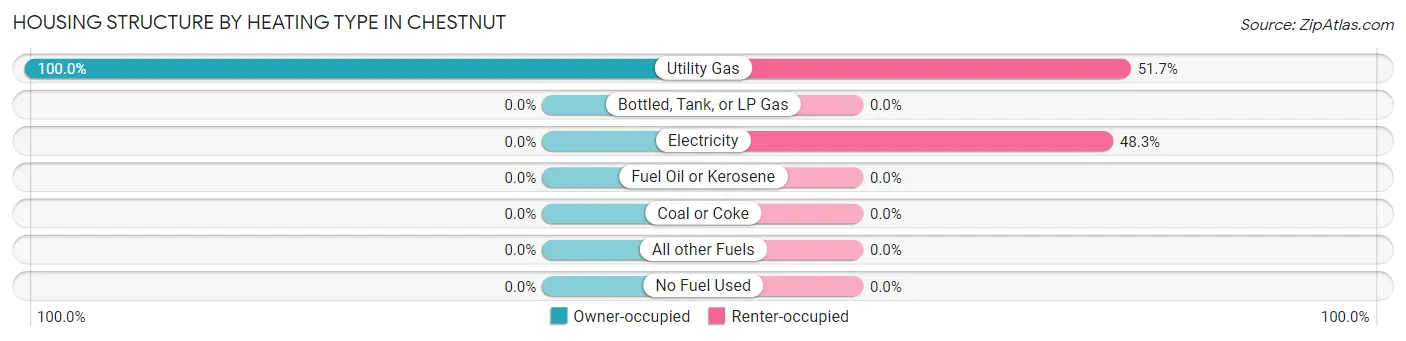
| Heating Type | Owner-occupied | Renter-occupied |
| Utility Gas | 75 (100.0%) | 15 (51.7%) |
| Bottled, Tank, or LP Gas | 0 (0.0%) | 0 (0.0%) |
| Electricity | 0 (0.0%) | 14 (48.3%) |
| Fuel Oil or Kerosene | 0 (0.0%) | 0 (0.0%) |
| Coal or Coke | 0 (0.0%) | 0 (0.0%) |
| All other Fuels | 0 (0.0%) | 0 (0.0%) |
| No Fuel Used | 0 (0.0%) | 0 (0.0%) |
| Total | 75 (100.0%) | 29 (100.0%) |
Household Vehicle Usage in Chestnut
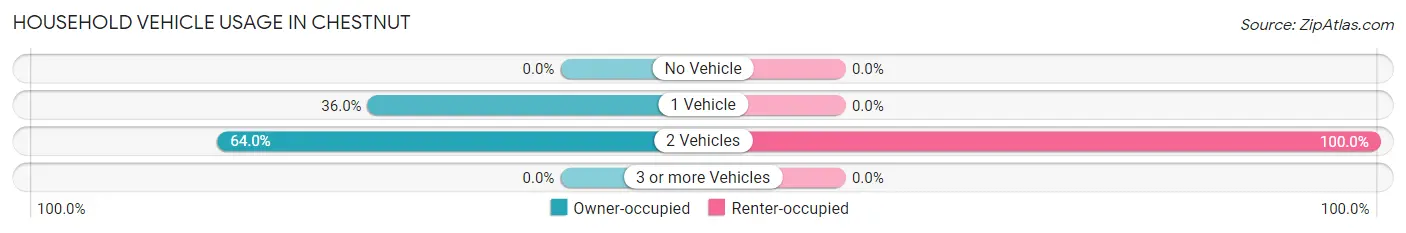
| Vehicles per Household | Owner-occupied | Renter-occupied |
| No Vehicle | 0 (0.0%) | 0 (0.0%) |
| 1 Vehicle | 27 (36.0%) | 0 (0.0%) |
| 2 Vehicles | 48 (64.0%) | 29 (100.0%) |
| 3 or more Vehicles | 0 (0.0%) | 0 (0.0%) |
| Total | 75 (100.0%) | 29 (100.0%) |
Real Estate & Mortgages in Chestnut
Real Estate and Mortgage Overview in Chestnut
| Characteristic | Without Mortgage | With Mortgage |
| Housing Units | 48 | 27 |
| Median Property Value | - | - |
| Median Household Income | - | - |
| Monthly Housing Costs | - | - |
| Real Estate Taxes | - | - |
Property Value by Mortgage Status in Chestnut
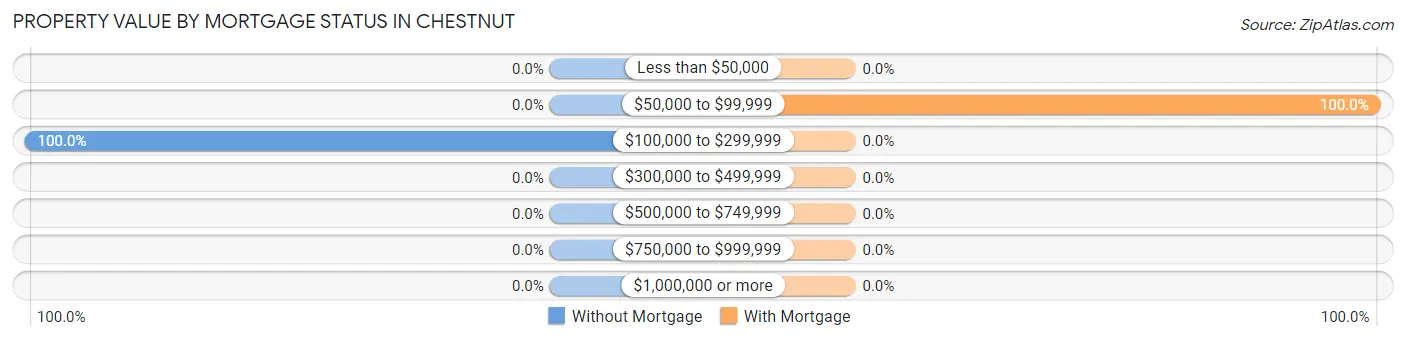
| Property Value | Without Mortgage | With Mortgage |
| Less than $50,000 | 0 (0.0%) | 0 (0.0%) |
| $50,000 to $99,999 | 0 (0.0%) | 27 (100.0%) |
| $100,000 to $299,999 | 48 (100.0%) | 0 (0.0%) |
| $300,000 to $499,999 | 0 (0.0%) | 0 (0.0%) |
| $500,000 to $749,999 | 0 (0.0%) | 0 (0.0%) |
| $750,000 to $999,999 | 0 (0.0%) | 0 (0.0%) |
| $1,000,000 or more | 0 (0.0%) | 0 (0.0%) |
| Total | 48 (100.0%) | 27 (100.0%) |
Household Income by Mortgage Status in Chestnut
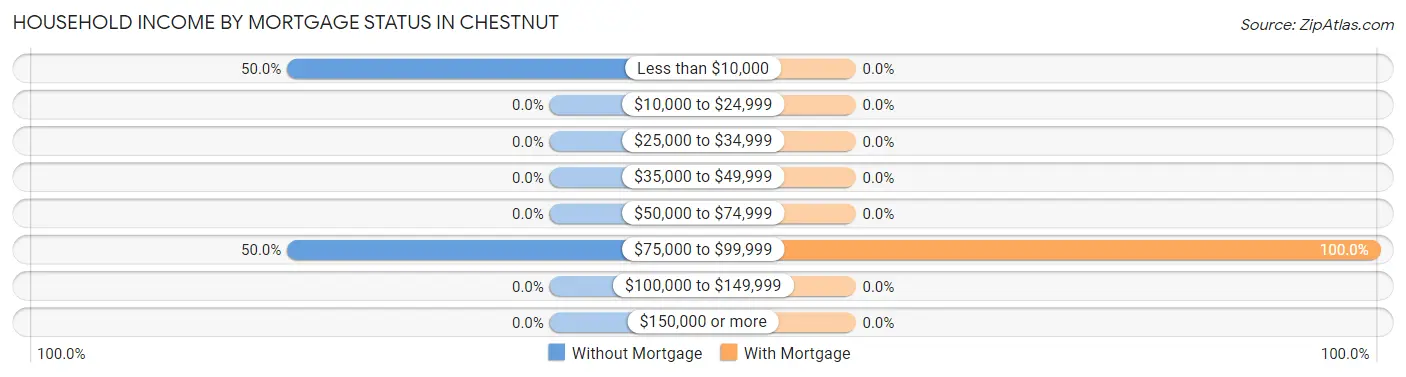
| Household Income | Without Mortgage | With Mortgage |
| Less than $10,000 | 24 (50.0%) | 0 (0.0%) |
| $10,000 to $24,999 | 0 (0.0%) | 0 (0.0%) |
| $25,000 to $34,999 | 0 (0.0%) | 0 (0.0%) |
| $35,000 to $49,999 | 0 (0.0%) | 0 (0.0%) |
| $50,000 to $74,999 | 0 (0.0%) | 0 (0.0%) |
| $75,000 to $99,999 | 24 (50.0%) | 27 (100.0%) |
| $100,000 to $149,999 | 0 (0.0%) | 0 (0.0%) |
| $150,000 or more | 0 (0.0%) | 0 (0.0%) |
| Total | 48 (100.0%) | 27 (100.0%) |
Property Value to Household Income Ratio in Chestnut
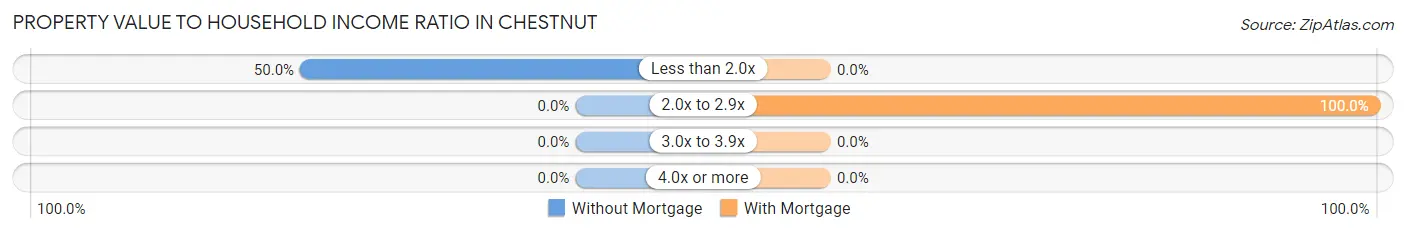
| Value-to-Income Ratio | Without Mortgage | With Mortgage |
| Less than 2.0x | 24 (50.0%) | 0 (0.0%) |
| 2.0x to 2.9x | 0 (0.0%) | 27 (100.0%) |
| 3.0x to 3.9x | 0 (0.0%) | 0 (0.0%) |
| 4.0x or more | 0 (0.0%) | 0 (0.0%) |
| Total | 48 (100.0%) | 27 (100.0%) |
Real Estate Taxes by Mortgage Status in Chestnut
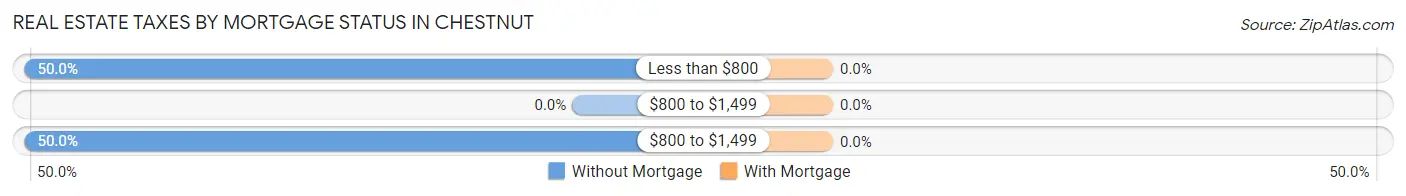
| Property Taxes | Without Mortgage | With Mortgage |
| Less than $800 | 24 (50.0%) | 0 (0.0%) |
| $800 to $1,499 | 0 (0.0%) | 0 (0.0%) |
| $800 to $1,499 | 24 (50.0%) | 0 (0.0%) |
| Total | 48 (100.0%) | 27 (100.0%) |
Health & Disability in Chestnut
Health Insurance Coverage by Age in Chestnut
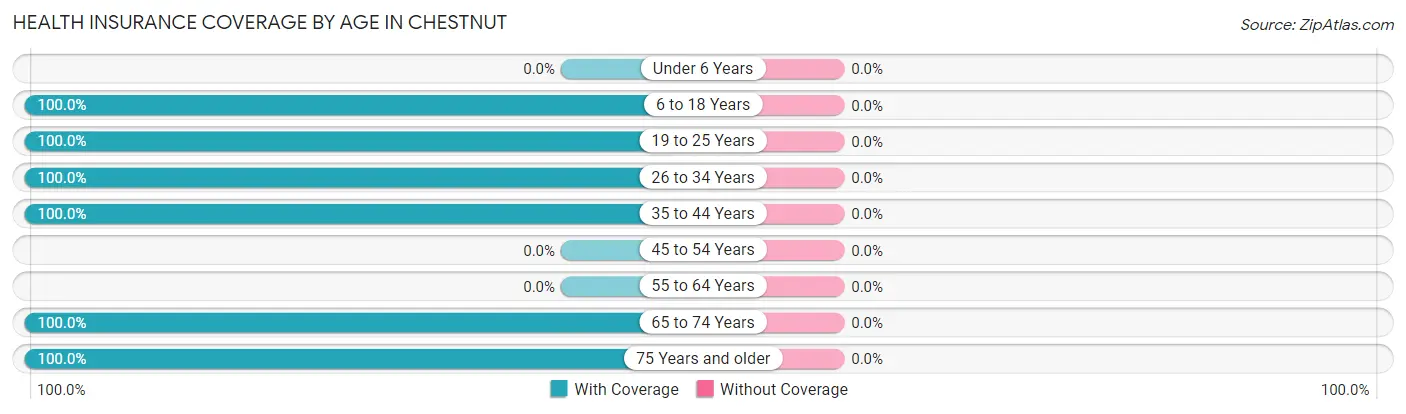
| Age Bracket | With Coverage | Without Coverage |
| Under 6 Years | 0 (0.0%) | 0 (0.0%) |
| 6 to 18 Years | 46 (100.0%) | 0 (0.0%) |
| 19 to 25 Years | 14 (100.0%) | 0 (0.0%) |
| 26 to 34 Years | 15 (100.0%) | 0 (0.0%) |
| 35 to 44 Years | 27 (100.0%) | 0 (0.0%) |
| 45 to 54 Years | 0 (0.0%) | 0 (0.0%) |
| 55 to 64 Years | 0 (0.0%) | 0 (0.0%) |
| 65 to 74 Years | 24 (100.0%) | 0 (0.0%) |
| 75 Years and older | 45 (100.0%) | 0 (0.0%) |
| Total | 171 (100.0%) | 0 (0.0%) |
Health Insurance Coverage by Citizenship Status in Chestnut
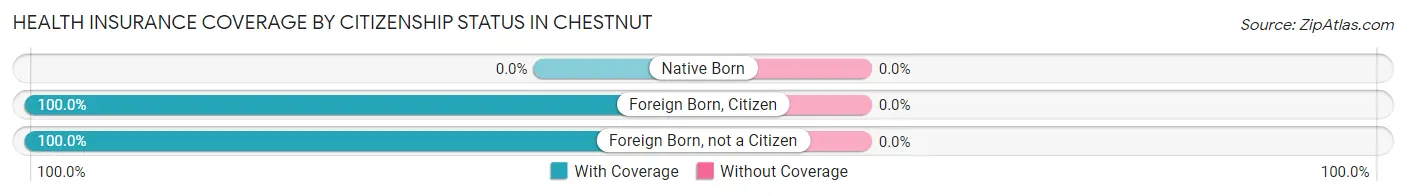
| Citizenship Status | With Coverage | Without Coverage |
| Native Born | 0 (0.0%) | 0 (0.0%) |
| Foreign Born, Citizen | 46 (100.0%) | 0 (0.0%) |
| Foreign Born, not a Citizen | 14 (100.0%) | 0 (0.0%) |
Health Insurance Coverage by Household Income in Chestnut
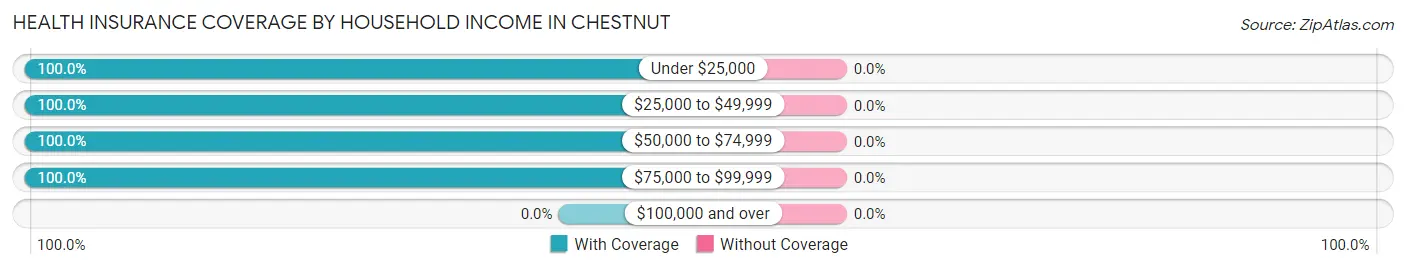
| Household Income | With Coverage | Without Coverage |
| Under $25,000 | 83 (100.0%) | 0 (0.0%) |
| $25,000 to $49,999 | 14 (100.0%) | 0 (0.0%) |
| $50,000 to $74,999 | 50 (100.0%) | 0 (0.0%) |
| $75,000 to $99,999 | 24 (100.0%) | 0 (0.0%) |
| $100,000 and over | 0 (0.0%) | 0 (0.0%) |
Public vs Private Health Insurance Coverage by Age in Chestnut
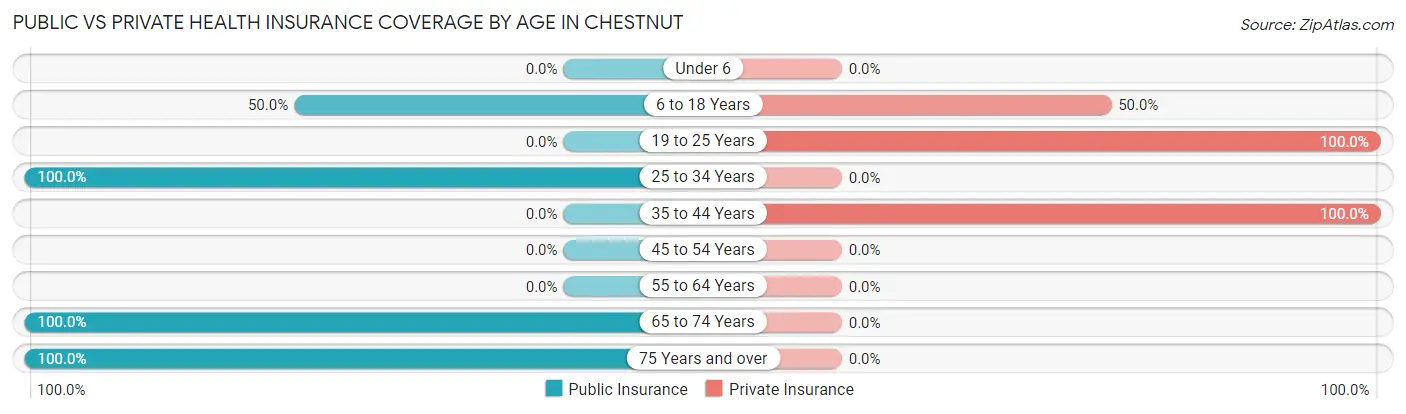
| Age Bracket | Public Insurance | Private Insurance |
| Under 6 | 0 (0.0%) | 0 (0.0%) |
| 6 to 18 Years | 23 (50.0%) | 23 (50.0%) |
| 19 to 25 Years | 0 (0.0%) | 14 (100.0%) |
| 25 to 34 Years | 15 (100.0%) | 0 (0.0%) |
| 35 to 44 Years | 0 (0.0%) | 27 (100.0%) |
| 45 to 54 Years | 0 (0.0%) | 0 (0.0%) |
| 55 to 64 Years | 0 (0.0%) | 0 (0.0%) |
| 65 to 74 Years | 24 (100.0%) | 0 (0.0%) |
| 75 Years and over | 45 (100.0%) | 0 (0.0%) |
| Total | 107 (62.6%) | 64 (37.4%) |
Disability Status by Sex by Age in Chestnut
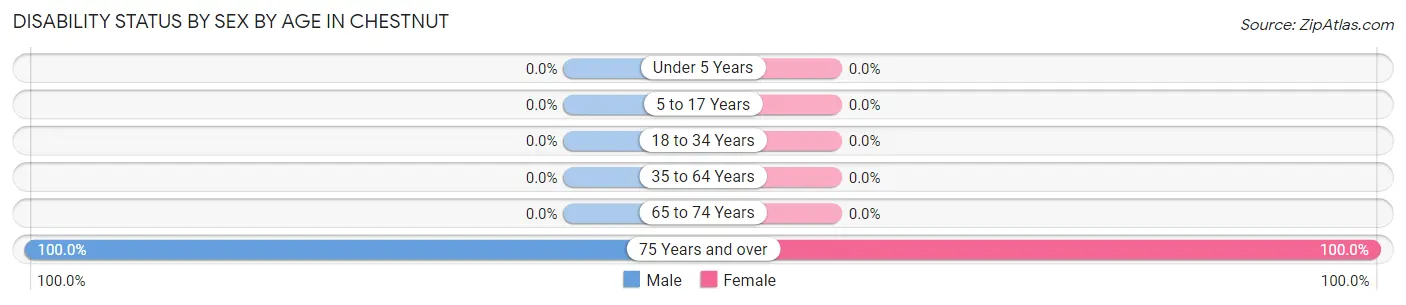
| Age Bracket | Male | Female |
| Under 5 Years | 0 (0.0%) | 0 (0.0%) |
| 5 to 17 Years | 0 (0.0%) | 0 (0.0%) |
| 18 to 34 Years | 0 (0.0%) | 0 (0.0%) |
| 35 to 64 Years | 0 (0.0%) | 0 (0.0%) |
| 65 to 74 Years | 0 (0.0%) | 0 (0.0%) |
| 75 Years and over | 21 (100.0%) | 24 (100.0%) |
Disability Class by Sex by Age in Chestnut
Disability Class: Hearing Difficulty
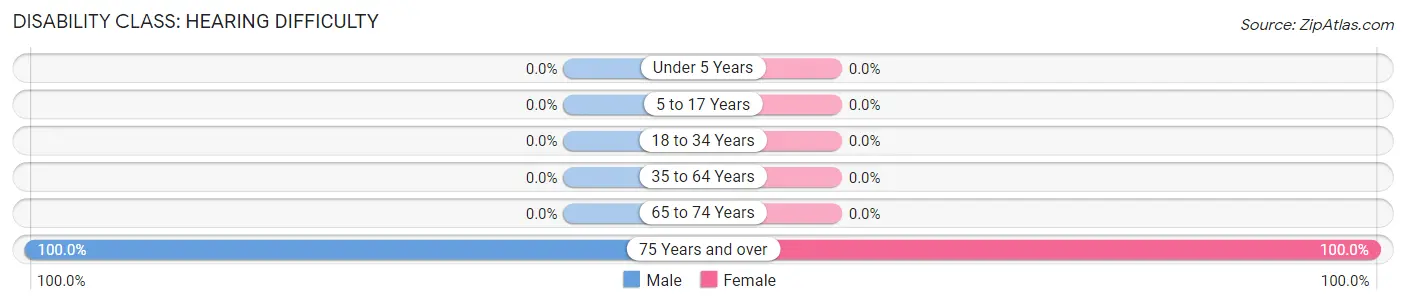
| Age Bracket | Male | Female |
| Under 5 Years | 0 (0.0%) | 0 (0.0%) |
| 5 to 17 Years | 0 (0.0%) | 0 (0.0%) |
| 18 to 34 Years | 0 (0.0%) | 0 (0.0%) |
| 35 to 64 Years | 0 (0.0%) | 0 (0.0%) |
| 65 to 74 Years | 0 (0.0%) | 0 (0.0%) |
| 75 Years and over | 21 (100.0%) | 24 (100.0%) |
Disability Class: Vision Difficulty
| Age Bracket | Male | Female |
| Under 5 Years | 0 (0.0%) | 0 (0.0%) |
| 5 to 17 Years | 0 (0.0%) | 0 (0.0%) |
| 18 to 34 Years | 0 (0.0%) | 0 (0.0%) |
| 35 to 64 Years | 0 (0.0%) | 0 (0.0%) |
| 65 to 74 Years | 0 (0.0%) | 0 (0.0%) |
| 75 Years and over | 0 (0.0%) | 0 (0.0%) |
Disability Class: Cognitive Difficulty
| Age Bracket | Male | Female |
| 5 to 17 Years | 0 (0.0%) | 0 (0.0%) |
| 18 to 34 Years | 0 (0.0%) | 0 (0.0%) |
| 35 to 64 Years | 0 (0.0%) | 0 (0.0%) |
| 65 to 74 Years | 0 (0.0%) | 0 (0.0%) |
| 75 Years and over | 0 (0.0%) | 0 (0.0%) |
Disability Class: Ambulatory Difficulty
| Age Bracket | Male | Female |
| 5 to 17 Years | 0 (0.0%) | 0 (0.0%) |
| 18 to 34 Years | 0 (0.0%) | 0 (0.0%) |
| 35 to 64 Years | 0 (0.0%) | 0 (0.0%) |
| 65 to 74 Years | 0 (0.0%) | 0 (0.0%) |
| 75 Years and over | 21 (100.0%) | 24 (100.0%) |
Disability Class: Self-Care Difficulty
| Age Bracket | Male | Female |
| 5 to 17 Years | 0 (0.0%) | 0 (0.0%) |
| 18 to 34 Years | 0 (0.0%) | 0 (0.0%) |
| 35 to 64 Years | 0 (0.0%) | 0 (0.0%) |
| 65 to 74 Years | 0 (0.0%) | 0 (0.0%) |
| 75 Years and over | 0 (0.0%) | 0 (0.0%) |
Technology Access in Chestnut
Computing Device Access in Chestnut
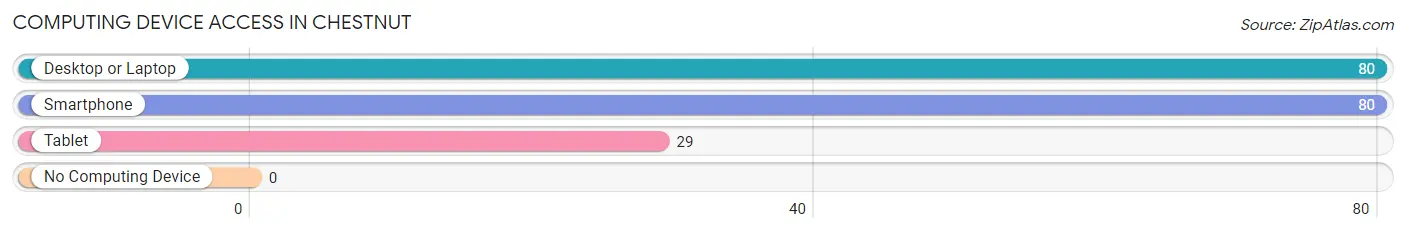
| Device Type | # Households | % Households |
| Desktop or Laptop | 80 | 76.9% |
| Smartphone | 80 | 76.9% |
| Tablet | 29 | 27.9% |
| No Computing Device | 0 | 0.0% |
| Total | 104 | 100.0% |
Internet Access in Chestnut
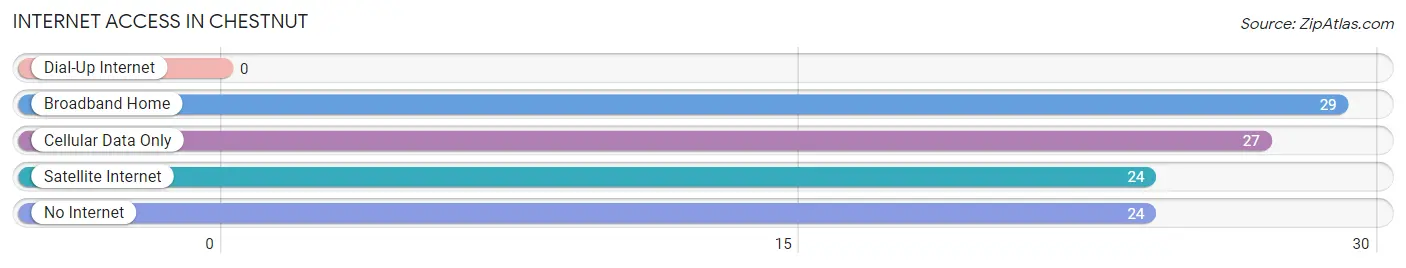
| Internet Type | # Households | % Households |
| Dial-Up Internet | 0 | 0.0% |
| Broadband Home | 29 | 27.9% |
| Cellular Data Only | 27 | 26.0% |
| Satellite Internet | 24 | 23.1% |
| No Internet | 24 | 23.1% |
| Total | 104 | 100.0% |
Chestnut Summary
History
The small village of Chestnut, Illinois is located in the southeastern corner of the state, in the county of Cumberland. It is situated on the banks of the Embarras River, and is surrounded by rolling hills and farmland. The area was first settled in the early 1800s by a group of pioneers from Kentucky, who were attracted to the area by its abundant natural resources. The village was officially founded in 1837, and was named after the chestnut trees that grew in abundance in the area.
The early settlers of Chestnut were primarily farmers, and the village quickly grew to become a thriving agricultural community. The village was also home to a number of small businesses, including a general store, a blacksmith, and a sawmill. In the late 1800s, the village was connected to the outside world by the Illinois Central Railroad, which allowed for the transport of goods and people to and from the village.
The village of Chestnut continued to grow and prosper throughout the early 20th century. In the 1920s, the village was home to a number of small businesses, including a bank, a hotel, a movie theater, and a variety of other stores. The village also had a number of churches, including the Methodist, Baptist, and Presbyterian churches.
In the 1950s, the village began to decline as many of its residents moved away in search of better opportunities. The village was further impacted by the construction of Interstate 57, which bypassed the village and diverted traffic away from it. By the end of the 20th century, the village had become a small, quiet community with a population of just over 500 people.
Geography
Chestnut is located in the southeastern corner of the state of Illinois, in the county of Cumberland. It is situated on the banks of the Embarras River, and is surrounded by rolling hills and farmland. The village is located approximately 30 miles south of the city of Champaign, and is approximately 90 miles south of the city of Chicago.
The village of Chestnut is located in a temperate climate, with hot summers and cold winters. The average temperature in the summer months is around 80 degrees Fahrenheit, while the average temperature in the winter months is around 30 degrees Fahrenheit. The village receives an average of 40 inches of precipitation per year, with most of it falling in the spring and summer months.
Economy
The economy of Chestnut is largely based on agriculture. The village is home to a number of small farms, which produce a variety of crops, including corn, soybeans, wheat, and hay. The village also has a number of small businesses, including a general store, a hardware store, and a variety of other stores.
The village is also home to a number of small manufacturing businesses, which produce a variety of products, including furniture, clothing, and automotive parts. The village is also home to a number of small service businesses, including a bank, a hotel, and a variety of other services.
Demographics
As of the 2010 census, the village of Chestnut had a population of 517 people. The population is largely white, with a small percentage of African Americans and Hispanics. The median age of the population is 44 years, and the median household income is $41,250. The village has a high rate of homeownership, with over 80% of the population owning their own homes.
Common Questions
What is Per Capita Income in Chestnut?
Per Capita income in Chestnut is $25,488.
What is Inequality or Gini Index in Chestnut?
Inequality or Gini Index in Chestnut is 0.43.
What is the Total Population of Chestnut?
Total Population of Chestnut is 171.
What is the Total Male Population of Chestnut?
Total Male Population of Chestnut is 68.
What is the Total Female Population of Chestnut?
Total Female Population of Chestnut is 103.
What is the Ratio of Males per 100 Females in Chestnut?
There are 66.02 Males per 100 Females in Chestnut.
What is the Ratio of Females per 100 Males in Chestnut?
There are 151.47 Females per 100 Males in Chestnut.
What is the Median Population Age in Chestnut?
Median Population Age in Chestnut is 42.4 Years.
What is the Average Family Size in Chestnut
Average Family Size in Chestnut is 2.0 People.
What is the Average Household Size in Chestnut
Average Household Size in Chestnut is 1.6 People.
How Large is the Labor Force in Chestnut?
There are 80 People in the Labor Forcein in Chestnut.
What is the Percentage of People in the Labor Force in Chestnut?
64.0% of People are in the Labor Force in Chestnut.