Nason, IL Map & Demographics
Nason Map
Nason Overview
$23,715
PER CAPITA INCOME
$52,083
AVG FAMILY INCOME
$49,609
AVG HOUSEHOLD INCOME
0.32
INEQUALITY / GINI INDEX
246
TOTAL POPULATION
139
MALE POPULATION
107
FEMALE POPULATION
129.91
MALES / 100 FEMALES
76.98
FEMALES / 100 MALES
45.0
MEDIAN AGE
2.4
AVG FAMILY SIZE
2.3
AVG HOUSEHOLD SIZE
123
LABOR FORCE [ PEOPLE ]
60.0%
PERCENT IN LABOR FORCE
19.5%
UNEMPLOYMENT RATE
Nason Area Codes
Income in Nason
Income Overview in Nason
Per Capita Income in Nason is $23,715, while median incomes of families and households are $52,083 and $49,609 respectively.
| Characteristic | Number | Measure |
| Per Capita Income | 246 | $23,715 |
| Median Family Income | 82 | $52,083 |
| Mean Family Income | 82 | $56,145 |
| Median Household Income | 107 | $49,609 |
| Mean Household Income | 107 | $55,561 |
| Income Deficit | 82 | $0 |
| Wage / Income Gap (%) | 246 | 0.00% |
| Wage / Income Gap ($) | 246 | 100.00¢ per $1 |
| Gini / Inequality Index | 246 | 0.32 |
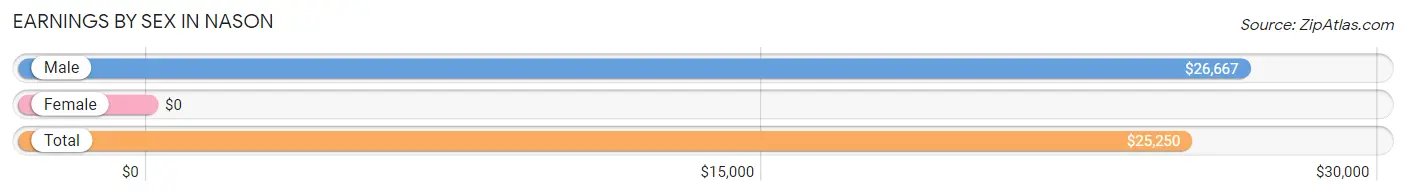
Earnings by Sex in Nason
| Sex | Number | Average Earnings |
| Male | 84 (60.4%) | $26,667 |
| Female | 55 (39.6%) | $0 |
| Total | 139 (100.0%) | $25,250 |
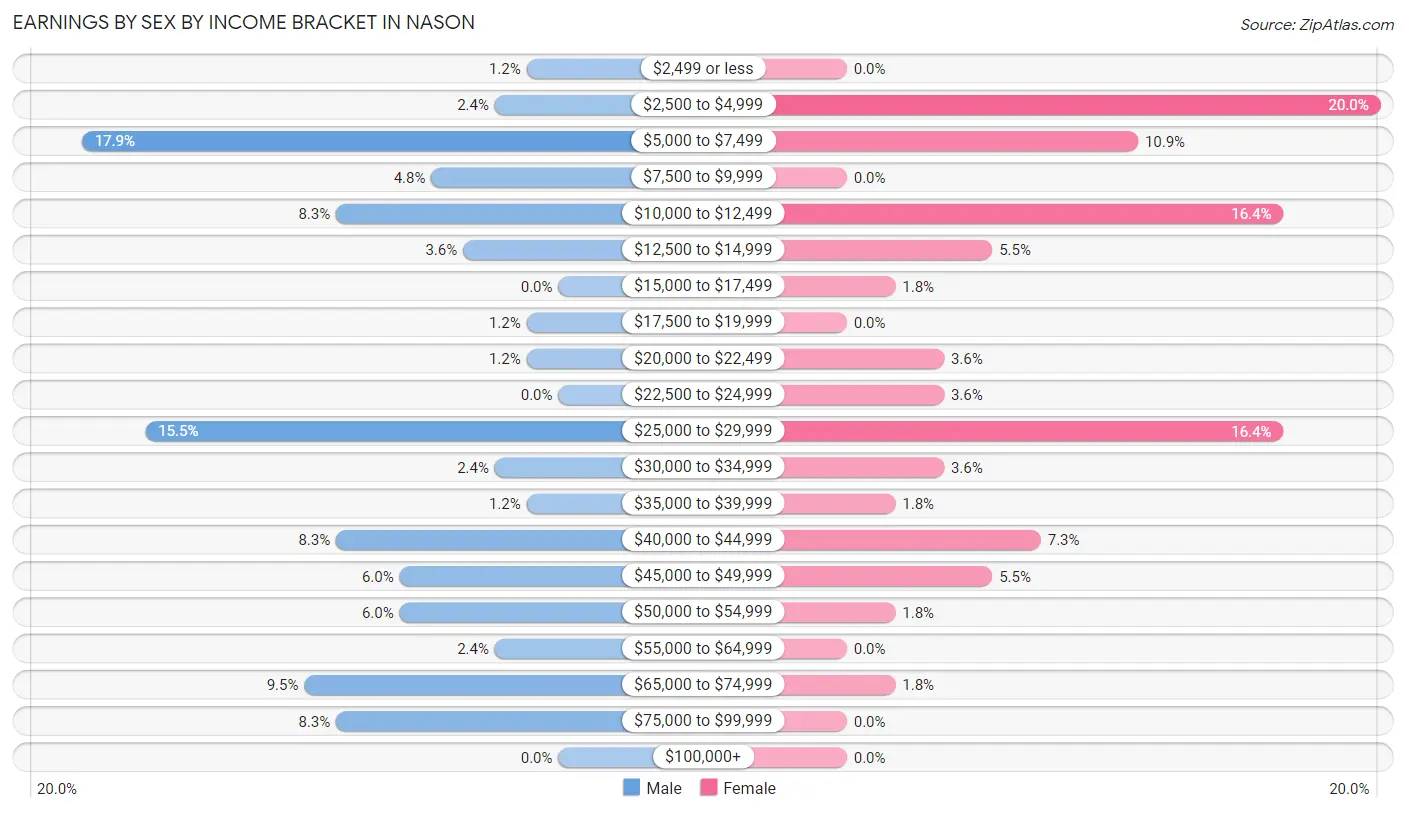
Earnings by Sex by Income Bracket in Nason
The most common earnings brackets in Nason are $5,000 to $7,499 for men (15 | 17.9%) and $2,500 to $4,999 for women (11 | 20.0%).
| Income | Male | Female |
| $2,499 or less | 1 (1.2%) | 0 (0.0%) |
| $2,500 to $4,999 | 2 (2.4%) | 11 (20.0%) |
| $5,000 to $7,499 | 15 (17.9%) | 6 (10.9%) |
| $7,500 to $9,999 | 4 (4.8%) | 0 (0.0%) |
| $10,000 to $12,499 | 7 (8.3%) | 9 (16.4%) |
| $12,500 to $14,999 | 3 (3.6%) | 3 (5.4%) |
| $15,000 to $17,499 | 0 (0.0%) | 1 (1.8%) |
| $17,500 to $19,999 | 1 (1.2%) | 0 (0.0%) |
| $20,000 to $22,499 | 1 (1.2%) | 2 (3.6%) |
| $22,500 to $24,999 | 0 (0.0%) | 2 (3.6%) |
| $25,000 to $29,999 | 13 (15.5%) | 9 (16.4%) |
| $30,000 to $34,999 | 2 (2.4%) | 2 (3.6%) |
| $35,000 to $39,999 | 1 (1.2%) | 1 (1.8%) |
| $40,000 to $44,999 | 7 (8.3%) | 4 (7.3%) |
| $45,000 to $49,999 | 5 (5.9%) | 3 (5.4%) |
| $50,000 to $54,999 | 5 (5.9%) | 1 (1.8%) |
| $55,000 to $64,999 | 2 (2.4%) | 0 (0.0%) |
| $65,000 to $74,999 | 8 (9.5%) | 1 (1.8%) |
| $75,000 to $99,999 | 7 (8.3%) | 0 (0.0%) |
| $100,000+ | 0 (0.0%) | 0 (0.0%) |
| Total | 84 (100.0%) | 55 (100.0%) |
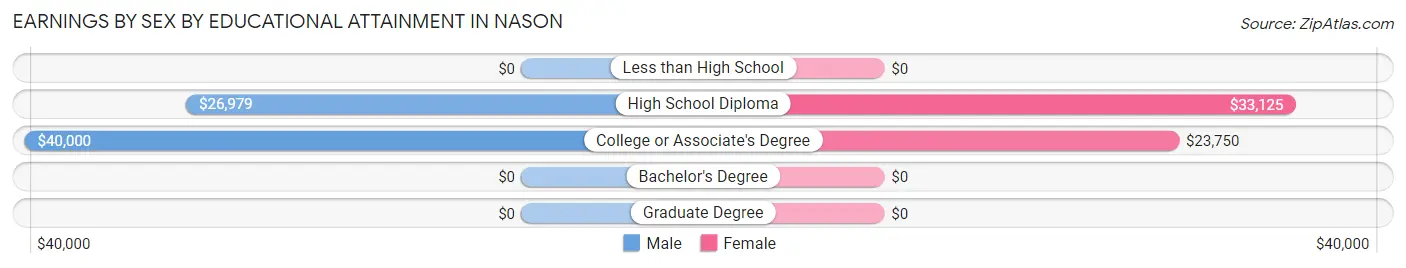
Earnings by Sex by Educational Attainment in Nason
Average earnings in Nason are $28,750 for men and $26,667 for women, a difference of 7.2%. Men with an educational attainment of college or associate's degree enjoy the highest average annual earnings of $40,000, while those with high school diploma education earn the least with $26,979. Women with an educational attainment of high school diploma earn the most with the average annual earnings of $33,125, while those with college or associate's degree education have the smallest earnings of $23,750.
| Educational Attainment | Male Income | Female Income |
| Less than High School | - | - |
| High School Diploma | $26,979 | $33,125 |
| College or Associate's Degree | $40,000 | $23,750 |
| Bachelor's Degree | - | - |
| Graduate Degree | - | - |
| Total | $28,750 | $26,667 |
Family Income in Nason
Family Income Brackets in Nason
According to the Nason family income data, there are 23 families falling into the $50,000 to $74,999 income range, which is the most common income bracket and makes up 28.1% of all families.
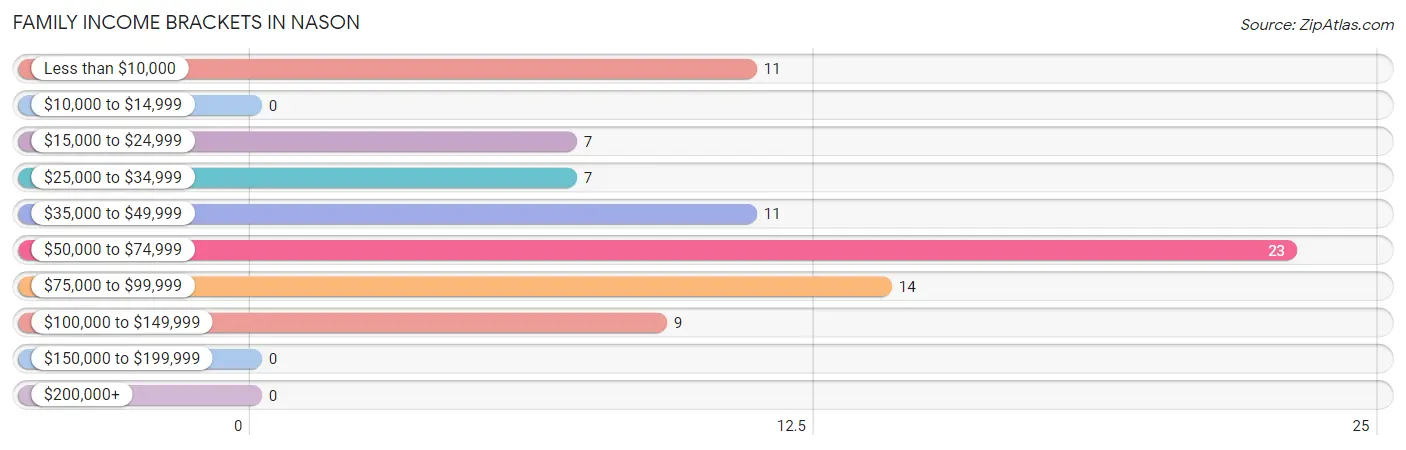
| Income Bracket | # Families | % Families |
| Less than $10,000 | 11 | 13.4% |
| $10,000 to $14,999 | 0 | 0.0% |
| $15,000 to $24,999 | 7 | 8.5% |
| $25,000 to $34,999 | 7 | 8.5% |
| $35,000 to $49,999 | 11 | 13.4% |
| $50,000 to $74,999 | 23 | 28.0% |
| $75,000 to $99,999 | 14 | 17.1% |
| $100,000 to $149,999 | 9 | 11.0% |
| $150,000 to $199,999 | 0 | 0.0% |
| $200,000+ | 0 | 0.0% |
Family Income by Famaliy Size in Nason
4-person families (11 | 13.4%) account for the highest median family income in Nason with $72,188 per family, while 2-person families (58 | 70.7%) have the highest median income of $25,416 per family member.
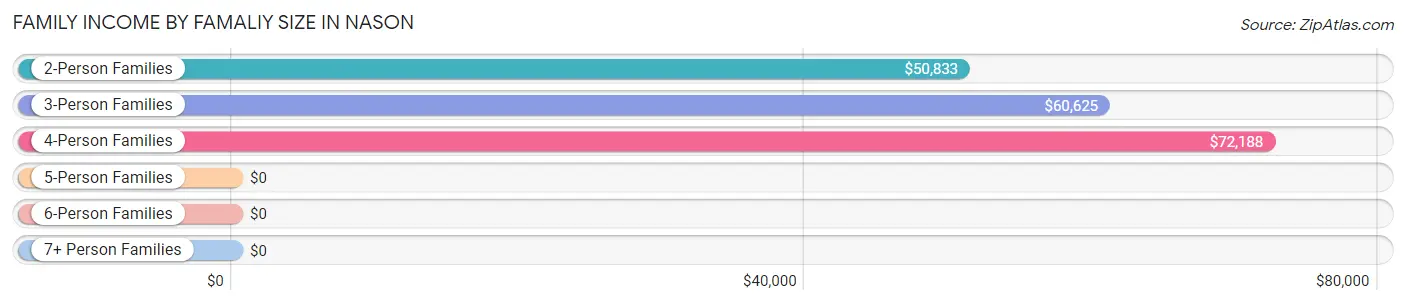
| Income Bracket | # Families | Median Income |
| 2-Person Families | 58 (70.7%) | $50,833 |
| 3-Person Families | 11 (13.4%) | $60,625 |
| 4-Person Families | 11 (13.4%) | $72,188 |
| 5-Person Families | 0 (0.0%) | $0 |
| 6-Person Families | 2 (2.4%) | $0 |
| 7+ Person Families | 0 (0.0%) | $0 |
| Total | 82 (100.0%) | $52,083 |
Family Income by Number of Earners in Nason
The median family income in Nason is $52,083, with families comprising 3+ earners (5) having the highest median family income of $85,625, while families with 1 earner (38) have the lowest median family income of $29,000, accounting for 6.1% and 46.3% of families, respectively.
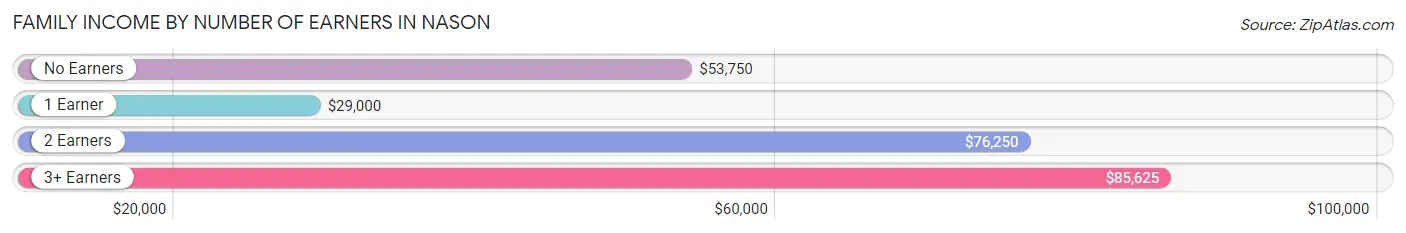
| Number of Earners | # Families | Median Income |
| No Earners | 9 (11.0%) | $53,750 |
| 1 Earner | 38 (46.3%) | $29,000 |
| 2 Earners | 30 (36.6%) | $76,250 |
| 3+ Earners | 5 (6.1%) | $85,625 |
| Total | 82 (100.0%) | $52,083 |
Household Income in Nason
Household Income Brackets in Nason
With 29 households falling in the category, the $35,000 to $49,999 income range is the most frequent in Nason, accounting for 27.1% of all households.
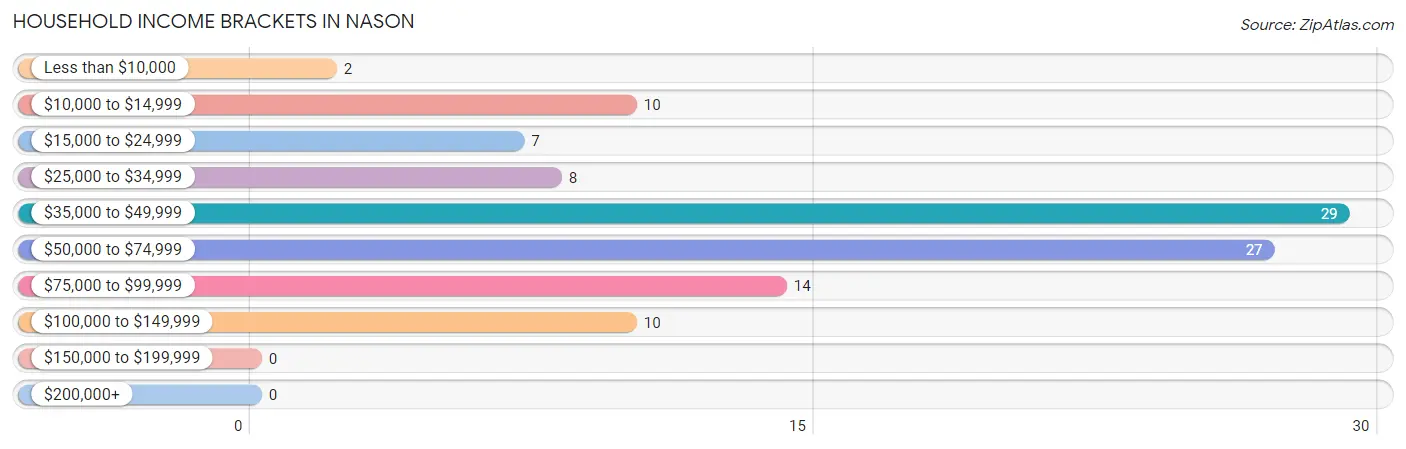
| Income Bracket | # Households | % Households |
| Less than $10,000 | 2 | 1.9% |
| $10,000 to $14,999 | 10 | 9.3% |
| $15,000 to $24,999 | 7 | 6.5% |
| $25,000 to $34,999 | 8 | 7.5% |
| $35,000 to $49,999 | 29 | 27.1% |
| $50,000 to $74,999 | 27 | 25.2% |
| $75,000 to $99,999 | 14 | 13.1% |
| $100,000 to $149,999 | 10 | 9.3% |
| $150,000 to $199,999 | 0 | 0.0% |
| $200,000+ | 0 | 0.0% |
Household Income by Householder Age in Nason
The median household income in Nason is $49,609, with the highest median household income of $70,625 found in the 25 to 44 years age bracket for the primary householder. A total of 18 households (16.8%) fall into this category. Meanwhile, the 15 to 24 years age bracket for the primary householder has the lowest median household income of $0, with 13 households (12.1%) in this group.
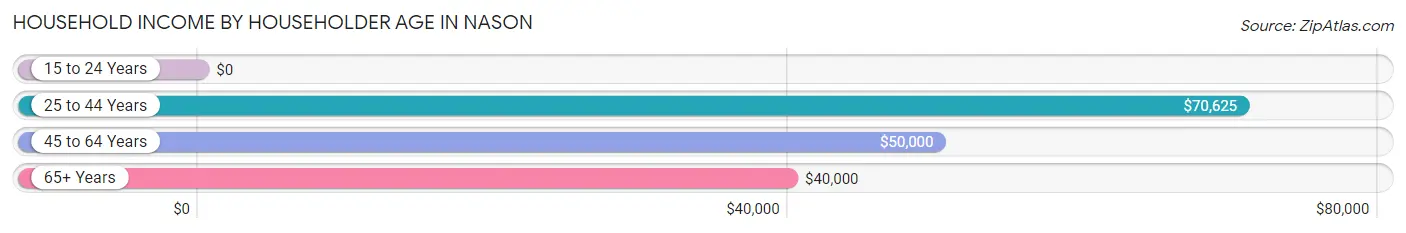
| Income Bracket | # Households | Median Income |
| 15 to 24 Years | 13 (12.1%) | $0 |
| 25 to 44 Years | 18 (16.8%) | $70,625 |
| 45 to 64 Years | 48 (44.9%) | $50,000 |
| 65+ Years | 28 (26.2%) | $40,000 |
| Total | 107 (100.0%) | $49,609 |
Poverty in Nason
Income Below Poverty by Sex and Age in Nason
With 19.7% poverty level for males and 38.3% for females among the residents of Nason, under 5 year old males and under 5 year old females are the most vulnerable to poverty, with 1 males (100.0%) and 1 females (100.0%) in their respective age groups living below the poverty level.
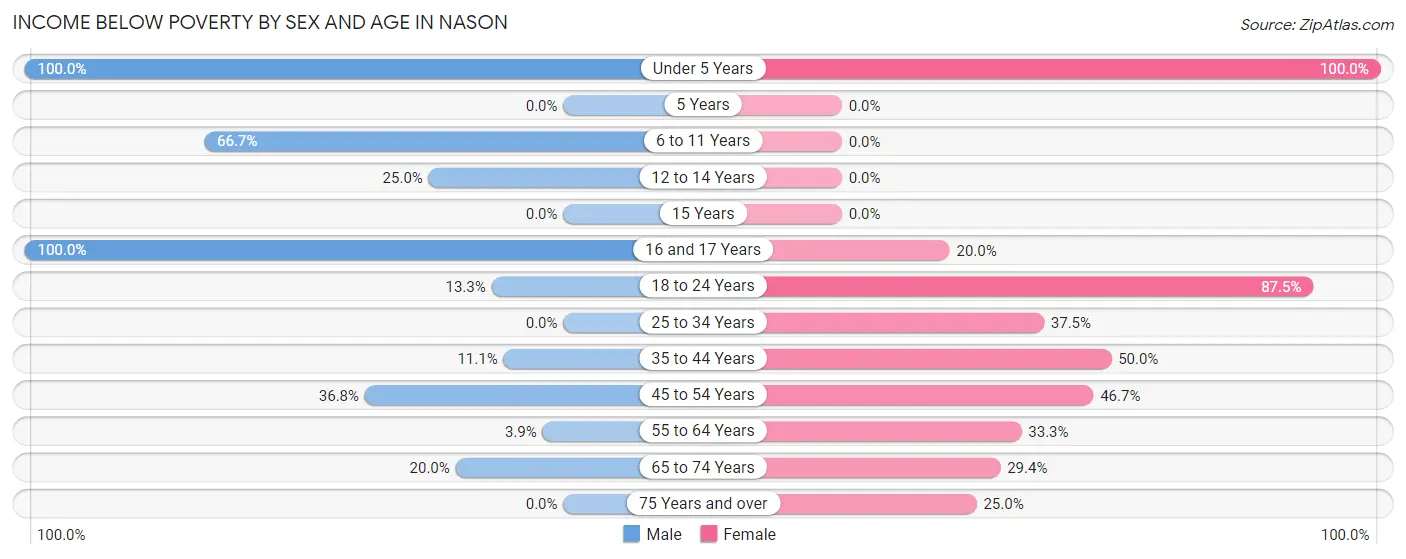
| Age Bracket | Male | Female |
| Under 5 Years | 1 (100.0%) | 1 (100.0%) |
| 5 Years | 0 (0.0%) | 0 (0.0%) |
| 6 to 11 Years | 10 (66.7%) | 0 (0.0%) |
| 12 to 14 Years | 1 (25.0%) | 0 (0.0%) |
| 15 Years | 0 (0.0%) | 0 (0.0%) |
| 16 and 17 Years | 1 (100.0%) | 1 (20.0%) |
| 18 to 24 Years | 2 (13.3%) | 14 (87.5%) |
| 25 to 34 Years | 0 (0.0%) | 3 (37.5%) |
| 35 to 44 Years | 2 (11.1%) | 1 (50.0%) |
| 45 to 54 Years | 7 (36.8%) | 7 (46.7%) |
| 55 to 64 Years | 1 (3.8%) | 7 (33.3%) |
| 65 to 74 Years | 2 (20.0%) | 5 (29.4%) |
| 75 Years and over | 0 (0.0%) | 2 (25.0%) |
| Total | 27 (19.7%) | 41 (38.3%) |
Income Above Poverty by Sex and Age in Nason
According to the poverty statistics in Nason, males aged 5 years and females aged 5 years are the age groups that are most secure financially, with 100.0% of males and 100.0% of females in these age groups living above the poverty line.
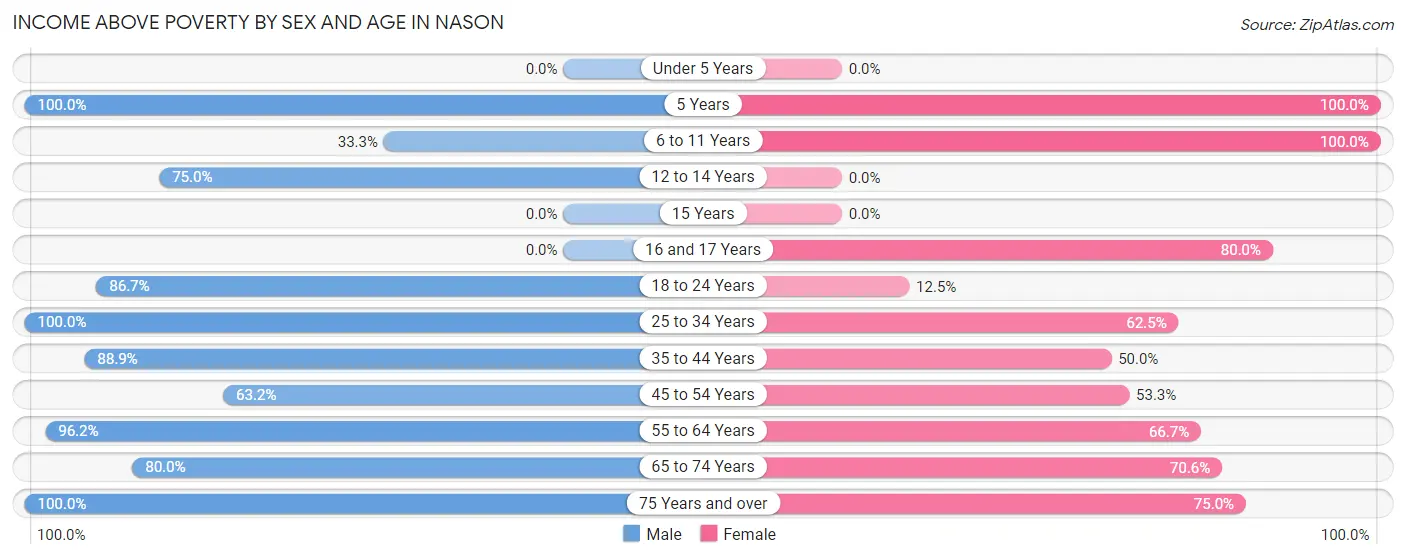
| Age Bracket | Male | Female |
| Under 5 Years | 0 (0.0%) | 0 (0.0%) |
| 5 Years | 4 (100.0%) | 1 (100.0%) |
| 6 to 11 Years | 5 (33.3%) | 13 (100.0%) |
| 12 to 14 Years | 3 (75.0%) | 0 (0.0%) |
| 15 Years | 0 (0.0%) | 0 (0.0%) |
| 16 and 17 Years | 0 (0.0%) | 4 (80.0%) |
| 18 to 24 Years | 13 (86.7%) | 2 (12.5%) |
| 25 to 34 Years | 17 (100.0%) | 5 (62.5%) |
| 35 to 44 Years | 16 (88.9%) | 1 (50.0%) |
| 45 to 54 Years | 12 (63.2%) | 8 (53.3%) |
| 55 to 64 Years | 25 (96.2%) | 14 (66.7%) |
| 65 to 74 Years | 8 (80.0%) | 12 (70.6%) |
| 75 Years and over | 7 (100.0%) | 6 (75.0%) |
| Total | 110 (80.3%) | 66 (61.7%) |
Income Below Poverty Among Married-Couple Families in Nason
The poverty statistics for married-couple families in Nason show that 17.1% or 7 of the total 41 families live below the poverty line. Families with 1 or 2 children have the highest poverty rate of 25.0%, comprising of 2 families. On the other hand, families with no children have the lowest poverty rate of 15.1%, which includes 5 families.
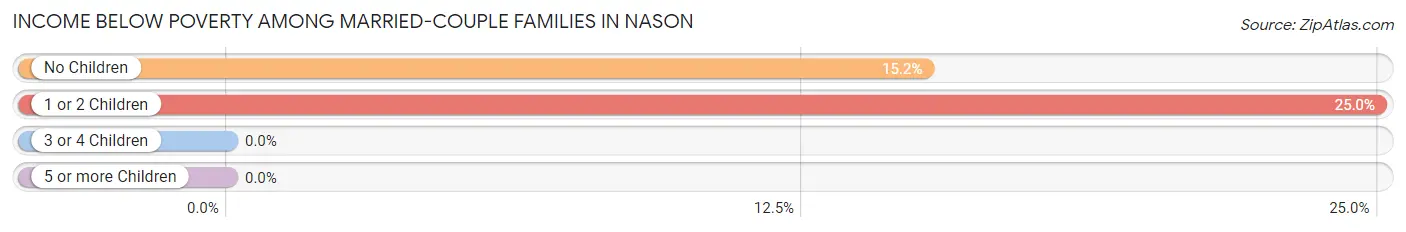
| Children | Above Poverty | Below Poverty |
| No Children | 28 (84.9%) | 5 (15.1%) |
| 1 or 2 Children | 6 (75.0%) | 2 (25.0%) |
| 3 or 4 Children | 0 (0.0%) | 0 (0.0%) |
| 5 or more Children | 0 (0.0%) | 0 (0.0%) |
| Total | 34 (82.9%) | 7 (17.1%) |
Income Below Poverty Among Single-Parent Households in Nason
According to the poverty data in Nason, 9.1% or 2 single-father households and 57.9% or 11 single-mother households are living below the poverty line. Among single-father households, those with 3 or 4 children have the highest poverty rate, with 2 households (33.3%) experiencing poverty. Likewise, among single-mother households, those with 1 or 2 children have the highest poverty rate, with 11 households (100.0%) falling below the poverty line.
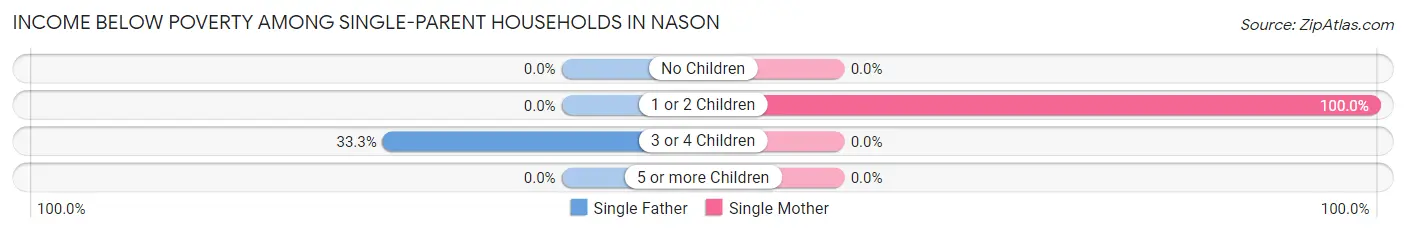
| Children | Single Father | Single Mother |
| No Children | 0 (0.0%) | 0 (0.0%) |
| 1 or 2 Children | 0 (0.0%) | 11 (100.0%) |
| 3 or 4 Children | 2 (33.3%) | 0 (0.0%) |
| 5 or more Children | 0 (0.0%) | 0 (0.0%) |
| Total | 2 (9.1%) | 11 (57.9%) |
Income Below Poverty Among Married-Couple vs Single-Parent Households in Nason
The poverty data for Nason shows that 7 of the married-couple family households (17.1%) and 13 of the single-parent households (31.7%) are living below the poverty level. Within the married-couple family households, those with 1 or 2 children have the highest poverty rate, with 2 households (25.0%) falling below the poverty line. Among the single-parent households, those with 1 or 2 children have the highest poverty rate, with 11 household (68.8%) living below poverty.
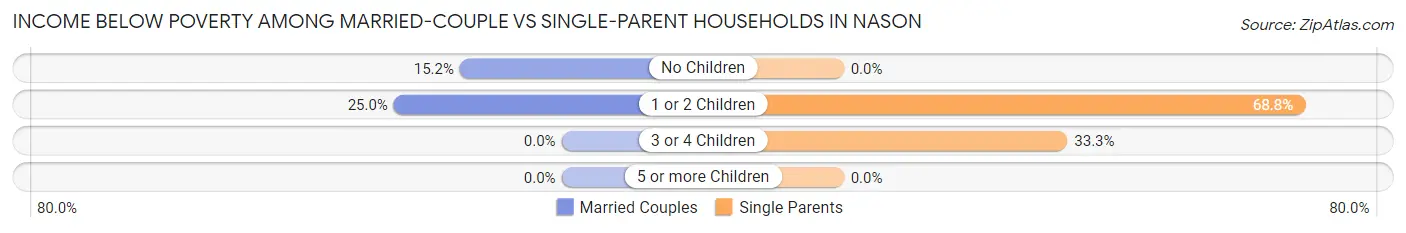
| Children | Married-Couple Families | Single-Parent Households |
| No Children | 5 (15.1%) | 0 (0.0%) |
| 1 or 2 Children | 2 (25.0%) | 11 (68.8%) |
| 3 or 4 Children | 0 (0.0%) | 2 (33.3%) |
| 5 or more Children | 0 (0.0%) | 0 (0.0%) |
| Total | 7 (17.1%) | 13 (31.7%) |
Race in Nason
The most populous races in Nason are White / Caucasian (244 | 99.2%), and Two or more Races (2 | 0.8%).
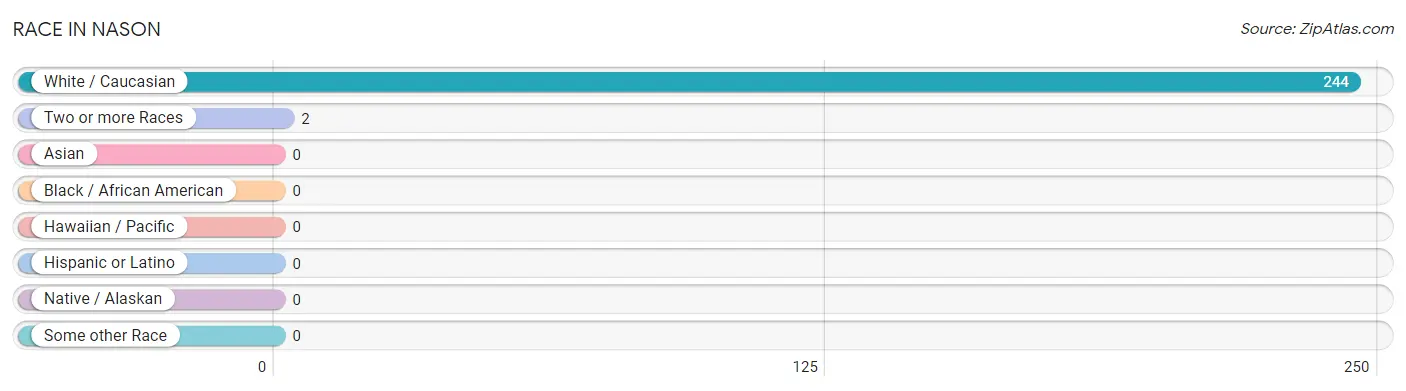
| Race | # Population | % Population |
| Asian | 0 | 0.0% |
| Black / African American | 0 | 0.0% |
| Hawaiian / Pacific | 0 | 0.0% |
| Hispanic or Latino | 0 | 0.0% |
| Native / Alaskan | 0 | 0.0% |
| White / Caucasian | 244 | 99.2% |
| Two or more Races | 2 | 0.8% |
| Some other Race | 0 | 0.0% |
| Total | 246 | 100.0% |
Ancestry in Nason
The most populous ancestries reported in Nason are German (25 | 10.2%), American (18 | 7.3%), Irish (18 | 7.3%), Italian (4 | 1.6%), and Austrian (2 | 0.8%), together accounting for 27.2% of all Nason residents.
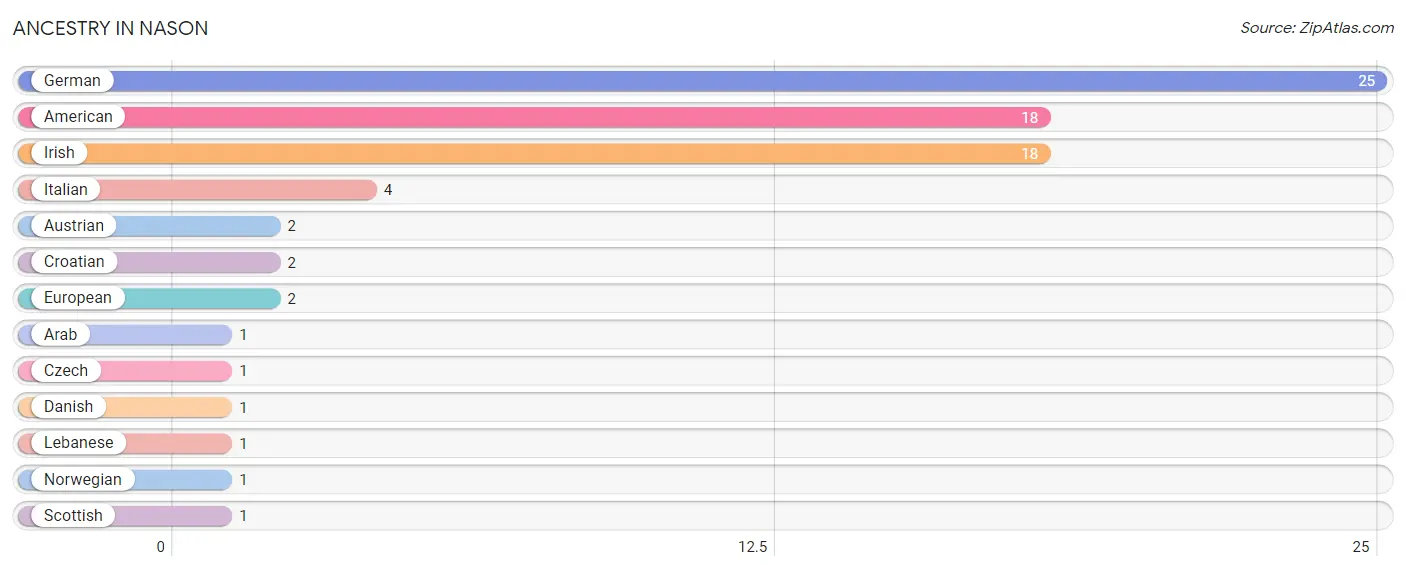
| Ancestry | # Population | % Population |
| American | 18 | 7.3% |
| Arab | 1 | 0.4% |
| Austrian | 2 | 0.8% |
| Croatian | 2 | 0.8% |
| Czech | 1 | 0.4% |
| Danish | 1 | 0.4% |
| European | 2 | 0.8% |
| German | 25 | 10.2% |
| Irish | 18 | 7.3% |
| Italian | 4 | 1.6% |
| Lebanese | 1 | 0.4% |
| Norwegian | 1 | 0.4% |
| Scottish | 1 | 0.4% | View All 13 Rows |
Immigrants in Nason

| Immigration Origin | # Population | % Population | View All 0 Rows |
Sex and Age in Nason
Sex and Age in Nason
The most populous age groups in Nason are 30 to 34 Years (17 | 12.2%) for men and 55 to 59 Years (16 | 14.9%) for women.
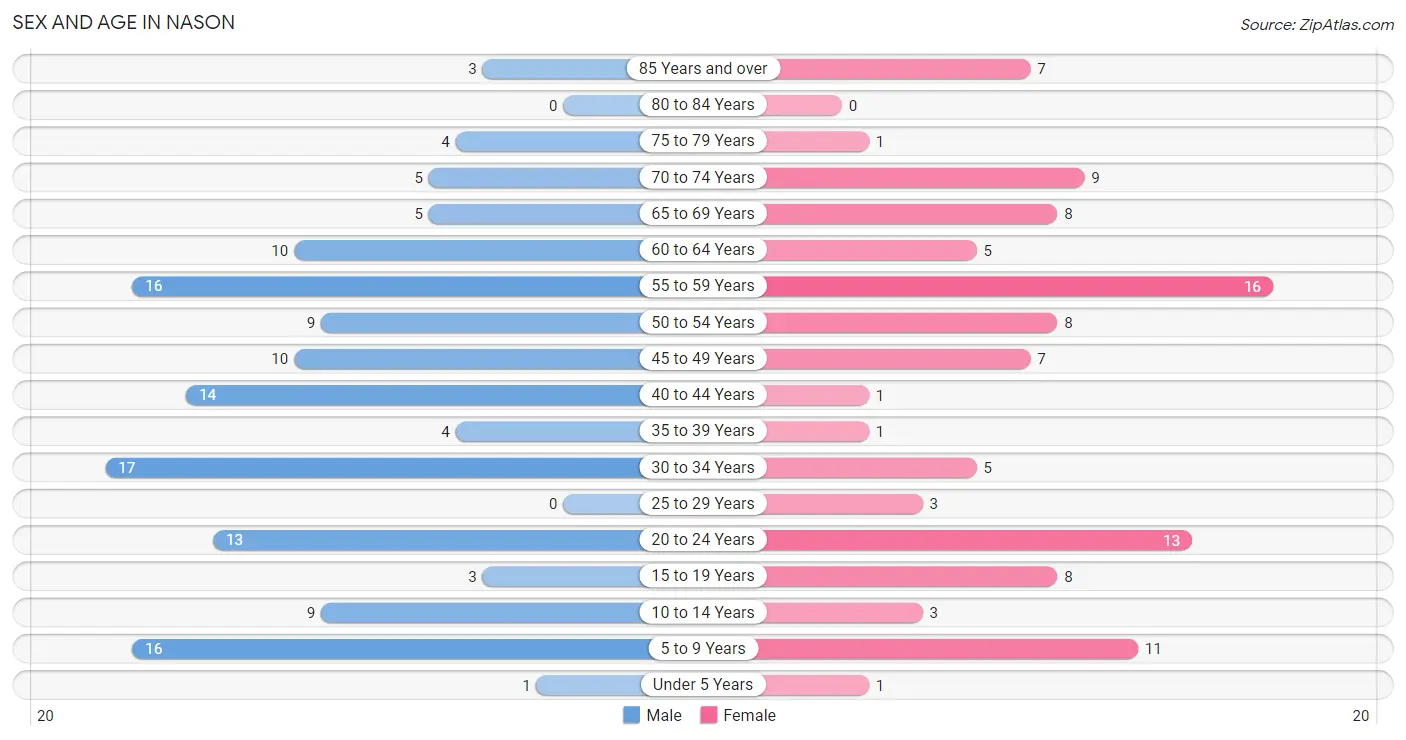
| Age Bracket | Male | Female |
| Under 5 Years | 1 (0.7%) | 1 (0.9%) |
| 5 to 9 Years | 16 (11.5%) | 11 (10.3%) |
| 10 to 14 Years | 9 (6.5%) | 3 (2.8%) |
| 15 to 19 Years | 3 (2.2%) | 8 (7.5%) |
| 20 to 24 Years | 13 (9.3%) | 13 (12.1%) |
| 25 to 29 Years | 0 (0.0%) | 3 (2.8%) |
| 30 to 34 Years | 17 (12.2%) | 5 (4.7%) |
| 35 to 39 Years | 4 (2.9%) | 1 (0.9%) |
| 40 to 44 Years | 14 (10.1%) | 1 (0.9%) |
| 45 to 49 Years | 10 (7.2%) | 7 (6.5%) |
| 50 to 54 Years | 9 (6.5%) | 8 (7.5%) |
| 55 to 59 Years | 16 (11.5%) | 16 (14.9%) |
| 60 to 64 Years | 10 (7.2%) | 5 (4.7%) |
| 65 to 69 Years | 5 (3.6%) | 8 (7.5%) |
| 70 to 74 Years | 5 (3.6%) | 9 (8.4%) |
| 75 to 79 Years | 4 (2.9%) | 1 (0.9%) |
| 80 to 84 Years | 0 (0.0%) | 0 (0.0%) |
| 85 Years and over | 3 (2.2%) | 7 (6.5%) |
| Total | 139 (100.0%) | 107 (100.0%) |
Families and Households in Nason
Median Family Size in Nason
The median family size in Nason is 2.35 persons per family, with single male/father families (22 | 26.8%) accounting for the largest median family size of 2.73 persons per family. On the other hand, single female/mother families (19 | 23.2%) represent the smallest median family size with 1.95 persons per family.
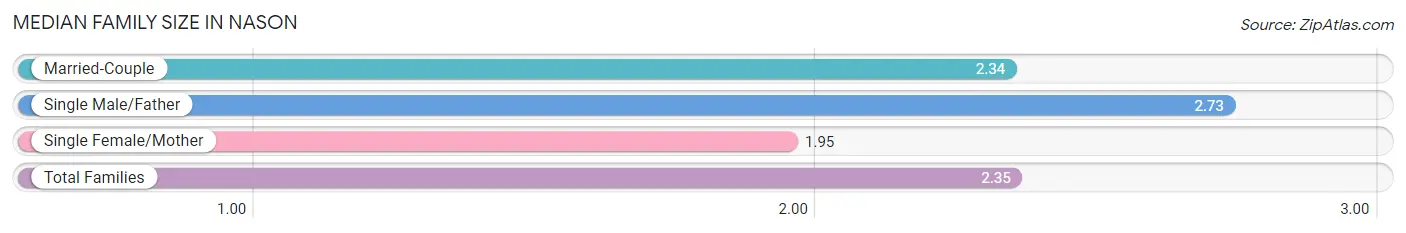
| Family Type | # Families | Family Size |
| Married-Couple | 41 (50.0%) | 2.34 |
| Single Male/Father | 22 (26.8%) | 2.73 |
| Single Female/Mother | 19 (23.2%) | 1.95 |
| Total Families | 82 (100.0%) | 2.35 |
Median Household Size in Nason
The median household size in Nason is 2.30 persons per household, with single male/father households (22 | 20.6%) accounting for the largest median household size of 3.18 persons per household. non-family households (25 | 23.4%) represent the smallest median household size with 1.24 persons per household.
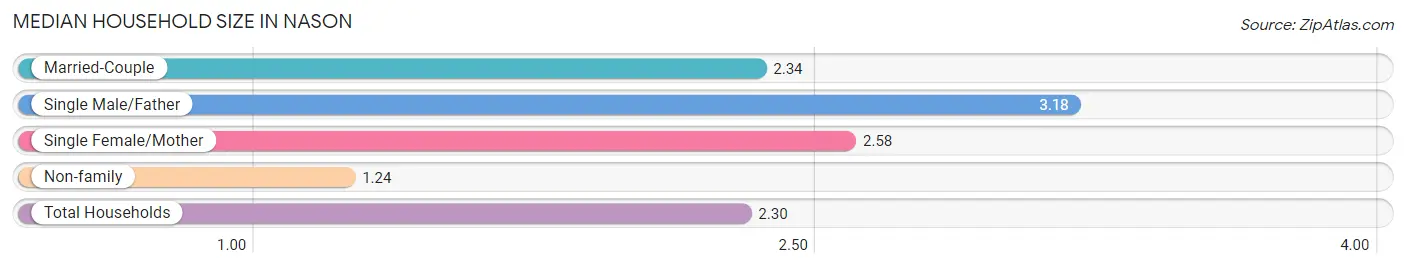
| Household Type | # Households | Household Size |
| Married-Couple | 41 (38.3%) | 2.34 |
| Single Male/Father | 22 (20.6%) | 3.18 |
| Single Female/Mother | 19 (17.8%) | 2.58 |
| Non-family | 25 (23.4%) | 1.24 |
| Total Households | 107 (100.0%) | 2.30 |
Household Size by Marriage Status in Nason
Out of a total of 107 households in Nason, 82 (76.6%) are family households, while 25 (23.4%) are nonfamily households. The most numerous type of family households are 2-person households, comprising 42, and the most common type of nonfamily households are 1-person households, comprising 22.
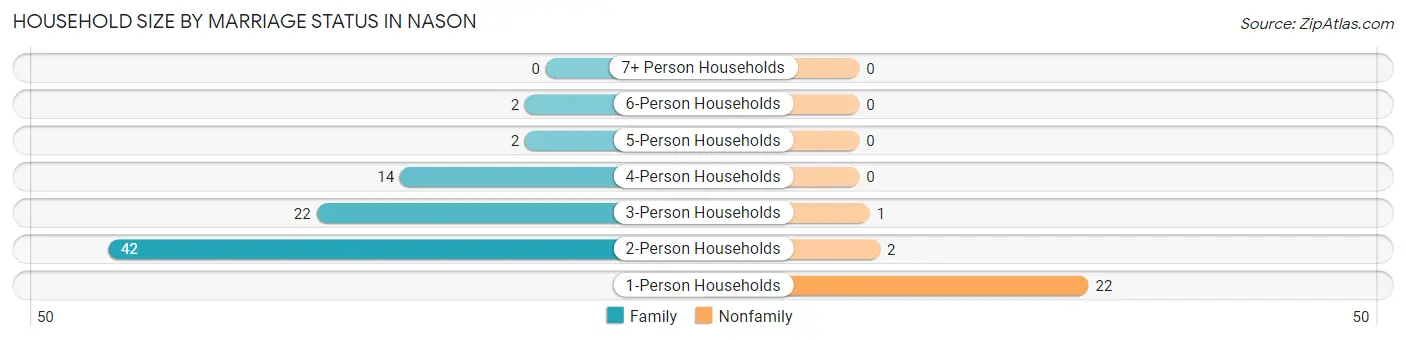
| Household Size | Family Households | Nonfamily Households |
| 1-Person Households | - | 22 (20.6%) |
| 2-Person Households | 42 (39.3%) | 2 (1.9%) |
| 3-Person Households | 22 (20.6%) | 1 (0.9%) |
| 4-Person Households | 14 (13.1%) | 0 (0.0%) |
| 5-Person Households | 2 (1.9%) | 0 (0.0%) |
| 6-Person Households | 2 (1.9%) | 0 (0.0%) |
| 7+ Person Households | 0 (0.0%) | 0 (0.0%) |
| Total | 82 (76.6%) | 25 (23.4%) |
Female Fertility in Nason
Fertility by Age in Nason
Average fertility rate in Nason is 105.0 births per 1,000 women. Women in the age bracket of 15 to 19 years have the highest fertility rate with 375.0 births per 1,000 women. Women in the age bracket of 15 to 19 years acount for 75.0% of all women with births.
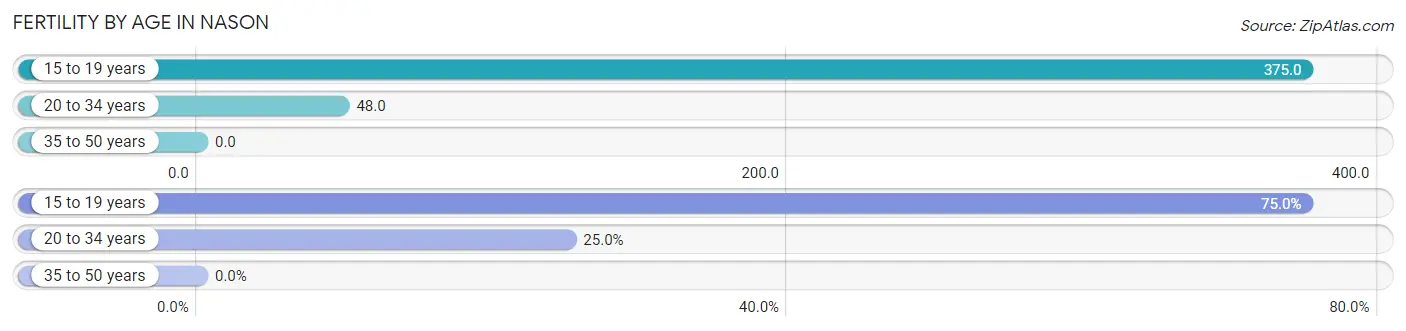
| Age Bracket | Women with Births | Births / 1,000 Women |
| 15 to 19 years | 3 (75.0%) | 375.0 |
| 20 to 34 years | 1 (25.0%) | 48.0 |
| 35 to 50 years | 0 (0.0%) | 0.0 |
| Total | 4 (100.0%) | 105.0 |
Fertility by Age by Marriage Status in Nason
75.0% of women with births (4) in Nason are married. The highest percentage of unmarried women with births falls into 20 to 34 years age bracket with 100.0% of them unmarried at the time of birth, while the lowest percentage of unmarried women with births belong to 15 to 19 years age bracket with 0.0% of them unmarried.
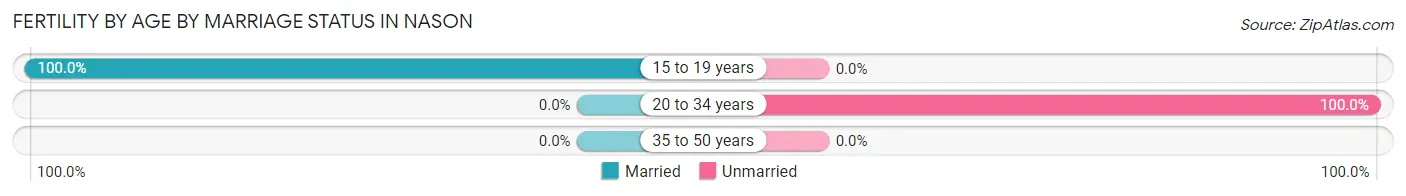
| Age Bracket | Married | Unmarried |
| 15 to 19 years | 3 (100.0%) | 0 (0.0%) |
| 20 to 34 years | 0 (0.0%) | 1 (100.0%) |
| 35 to 50 years | 0 (0.0%) | 0 (0.0%) |
| Total | 3 (75.0%) | 1 (25.0%) |
Fertility by Education in Nason
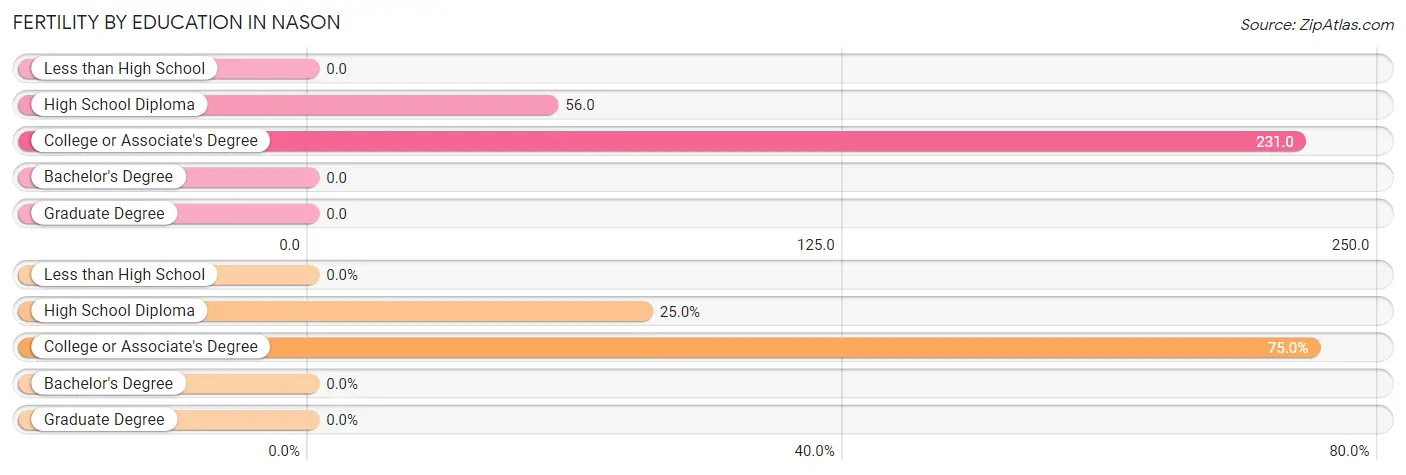
| Educational Attainment | Women with Births | Births / 1,000 Women |
| Less than High School | 0 (0.0%) | 0.0 |
| High School Diploma | 1 (25.0%) | 56.0 |
| College or Associate's Degree | 3 (75.0%) | 231.0 |
| Bachelor's Degree | 0 (0.0%) | 0.0 |
| Graduate Degree | 0 (0.0%) | 0.0 |
| Total | 4 (100.0%) | 105.0 |
Fertility by Education by Marriage Status in Nason
25.0% of women with births in Nason are unmarried. Women with the educational attainment of college or associate's degree are most likely to be married with 100.0% of them married at childbirth, while women with the educational attainment of high school diploma are least likely to be married with 100.0% of them unmarried at childbirth.
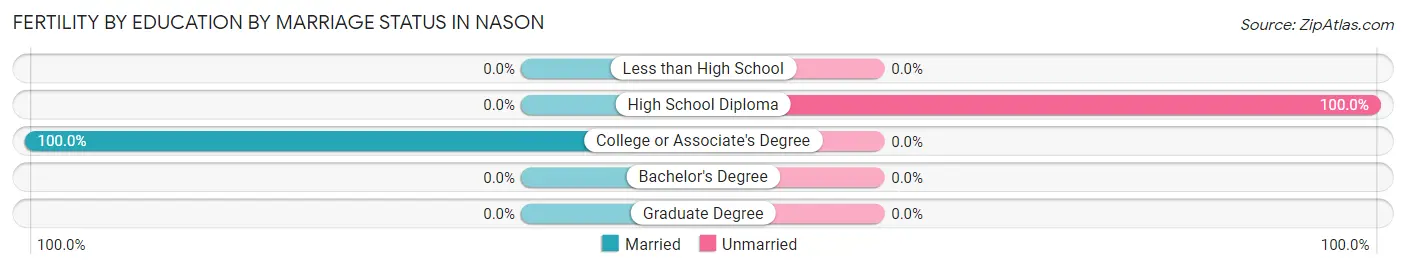
| Educational Attainment | Married | Unmarried |
| Less than High School | 0 (0.0%) | 0 (0.0%) |
| High School Diploma | 0 (0.0%) | 1 (100.0%) |
| College or Associate's Degree | 3 (100.0%) | 0 (0.0%) |
| Bachelor's Degree | 0 (0.0%) | 0 (0.0%) |
| Graduate Degree | 0 (0.0%) | 0 (0.0%) |
| Total | 3 (75.0%) | 1 (25.0%) |
Employment Characteristics in Nason
Employment by Class of Employer in Nason
Among the 99 employed individuals in Nason, private company employees (97 | 98.0%), self-employed (not incorporated) (1 | 1.0%), and not-for-profit organizations (1 | 1.0%) make up the most common classes of employment.
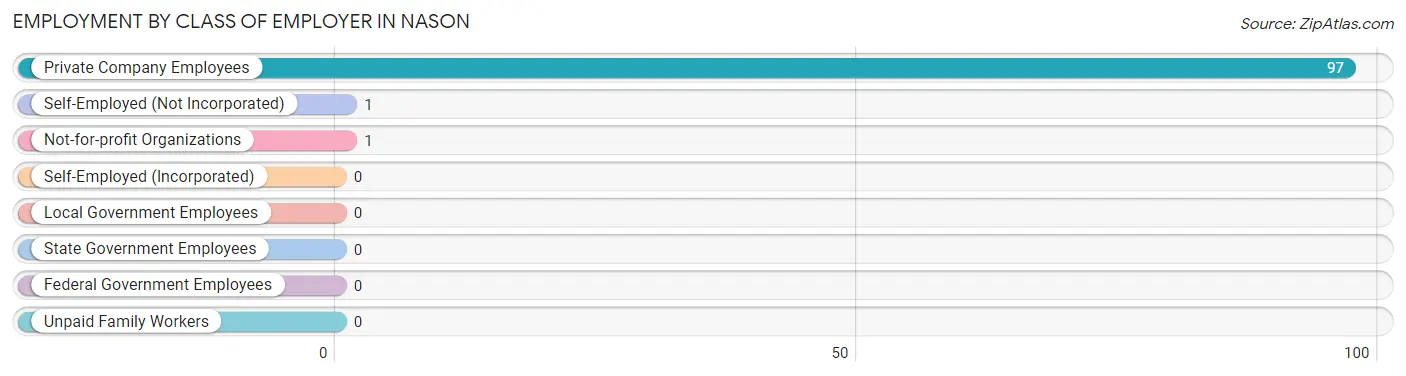
| Employer Class | # Employees | % Employees |
| Private Company Employees | 97 | 98.0% |
| Self-Employed (Incorporated) | 0 | 0.0% |
| Self-Employed (Not Incorporated) | 1 | 1.0% |
| Not-for-profit Organizations | 1 | 1.0% |
| Local Government Employees | 0 | 0.0% |
| State Government Employees | 0 | 0.0% |
| Federal Government Employees | 0 | 0.0% |
| Unpaid Family Workers | 0 | 0.0% |
| Total | 99 | 100.0% |
Employment Status by Age in Nason
According to the labor force statistics for Nason, out of the total population over 16 years of age (205), 60.0% or 123 individuals are in the labor force, with 19.5% or 24 of them unemployed. The age group with the highest labor force participation rate is 25 to 29 years, with 100.0% or 3 individuals in the labor force. Within the labor force, the 25 to 29 years age range has the highest percentage of unemployed individuals, with 66.7% or 2 of them being unemployed.
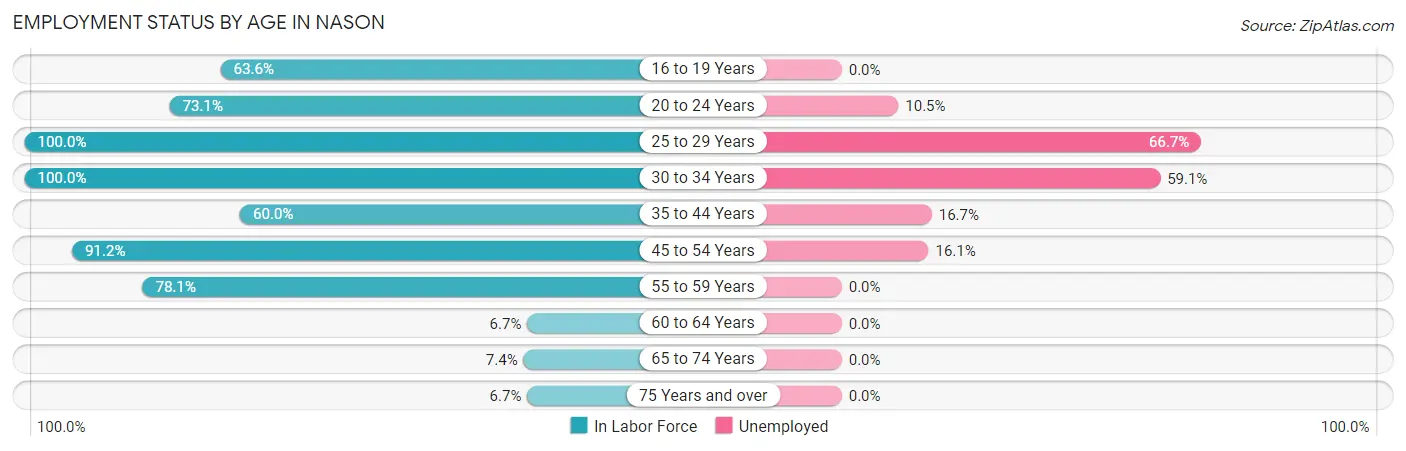
| Age Bracket | In Labor Force | Unemployed |
| 16 to 19 Years | 7 (63.6%) | 0 (0.0%) |
| 20 to 24 Years | 19 (73.1%) | 2 (10.5%) |
| 25 to 29 Years | 3 (100.0%) | 2 (66.7%) |
| 30 to 34 Years | 22 (100.0%) | 13 (59.1%) |
| 35 to 44 Years | 12 (60.0%) | 2 (16.7%) |
| 45 to 54 Years | 31 (91.2%) | 5 (16.1%) |
| 55 to 59 Years | 25 (78.1%) | 0 (0.0%) |
| 60 to 64 Years | 1 (6.7%) | 0 (0.0%) |
| 65 to 74 Years | 2 (7.4%) | 0 (0.0%) |
| 75 Years and over | 1 (6.7%) | 0 (0.0%) |
| Total | 123 (60.0%) | 24 (19.5%) |
Employment Status by Educational Attainment in Nason
According to labor force statistics for Nason, 74.6% of individuals (94) out of the total population between 25 and 64 years of age (126) are in the labor force, with 23.4% or 22 of them being unemployed. The group with the highest labor force participation rate are those with the educational attainment of high school diploma, with 88.9% or 56 individuals in the labor force. Within the labor force, individuals with bachelor's degree or higher education have the highest percentage of unemployment, with 100.0% or 2 of them being unemployed.
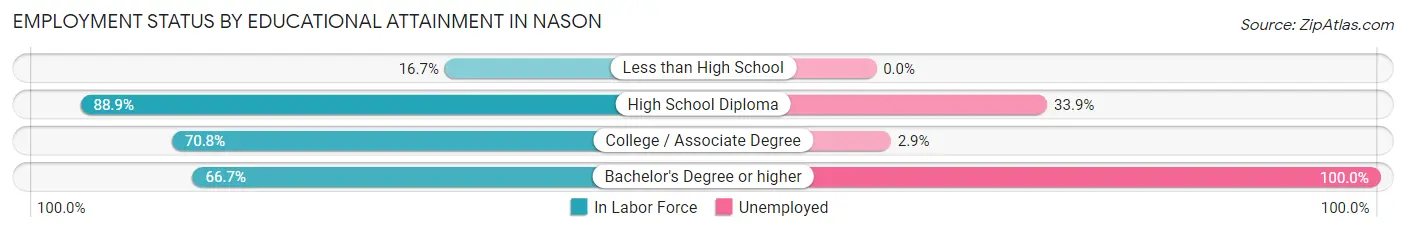
| Educational Attainment | In Labor Force | Unemployed |
| Less than High School | 2 (16.7%) | 0 (0.0%) |
| High School Diploma | 56 (88.9%) | 21 (33.9%) |
| College / Associate Degree | 34 (70.8%) | 1 (2.9%) |
| Bachelor's Degree or higher | 2 (66.7%) | 3 (100.0%) |
| Total | 94 (74.6%) | 29 (23.4%) |
Employment Occupations by Sex in Nason
Management, Business, Science and Arts Occupations
The most common Management, Business, Science and Arts occupations in Nason are Health Diagnosing & Treating (13 | 13.1%), Business & Financial (4 | 4.0%), Management (3 | 3.0%), and Health Technologists (1 | 1.0%).
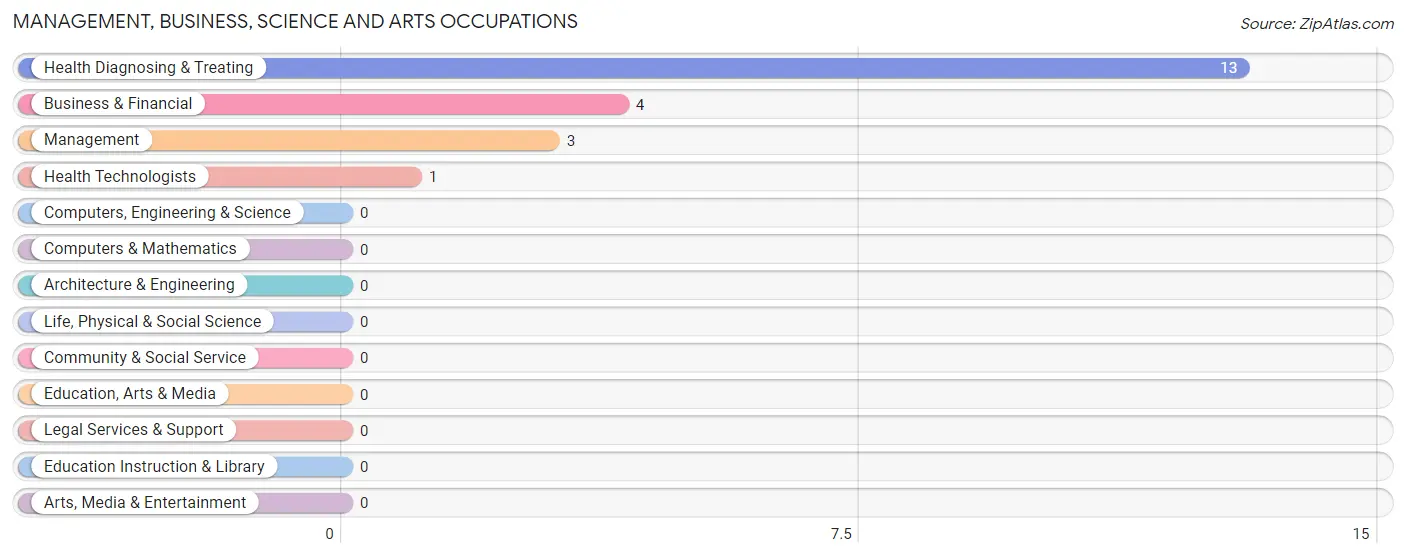
Management, Business, Science and Arts Occupations by Sex
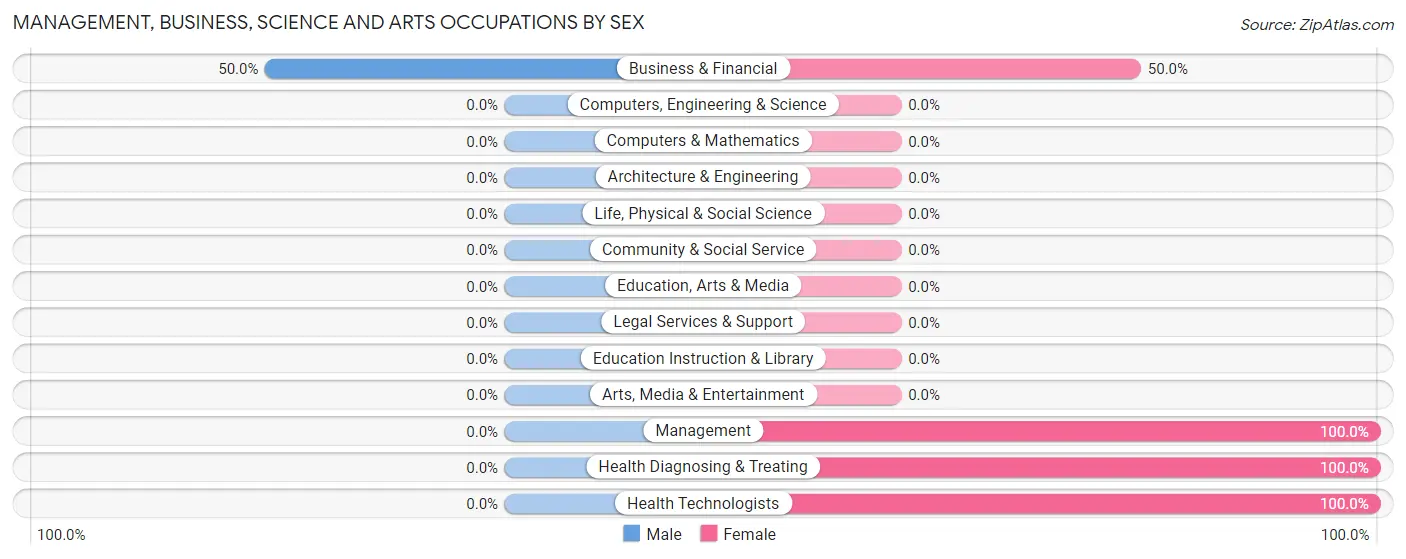
| Occupation | Male | Female |
| Management | 0 (0.0%) | 3 (100.0%) |
| Business & Financial | 2 (50.0%) | 2 (50.0%) |
| Computers, Engineering & Science | 0 (0.0%) | 0 (0.0%) |
| Computers & Mathematics | 0 (0.0%) | 0 (0.0%) |
| Architecture & Engineering | 0 (0.0%) | 0 (0.0%) |
| Life, Physical & Social Science | 0 (0.0%) | 0 (0.0%) |
| Community & Social Service | 0 (0.0%) | 0 (0.0%) |
| Education, Arts & Media | 0 (0.0%) | 0 (0.0%) |
| Legal Services & Support | 0 (0.0%) | 0 (0.0%) |
| Education Instruction & Library | 0 (0.0%) | 0 (0.0%) |
| Arts, Media & Entertainment | 0 (0.0%) | 0 (0.0%) |
| Health Diagnosing & Treating | 0 (0.0%) | 13 (100.0%) |
| Health Technologists | 0 (0.0%) | 1 (100.0%) |
| Total (Category) | 2 (10.0%) | 18 (90.0%) |
| Total (Overall) | 50 (50.5%) | 49 (49.5%) |
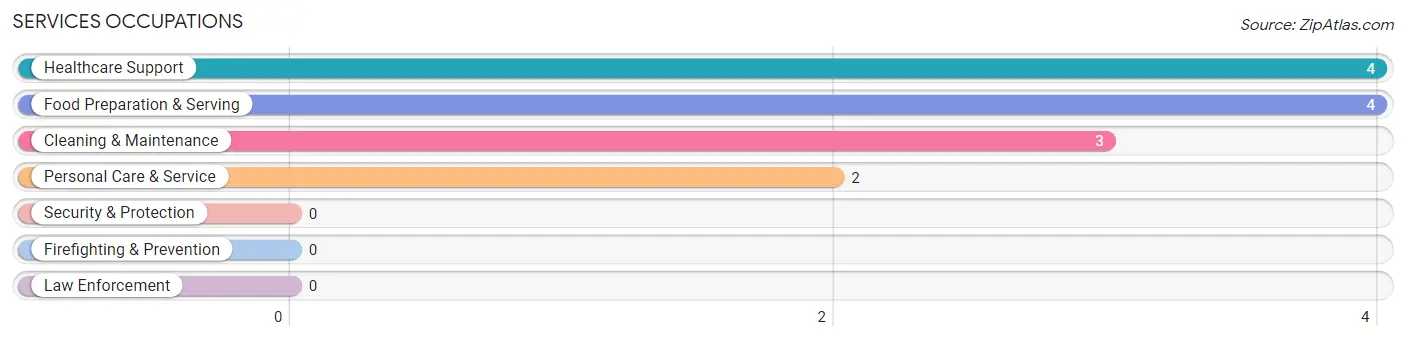
Services Occupations
The most common Services occupations in Nason are Healthcare Support (4 | 4.0%), Food Preparation & Serving (4 | 4.0%), Cleaning & Maintenance (3 | 3.0%), and Personal Care & Service (2 | 2.0%).
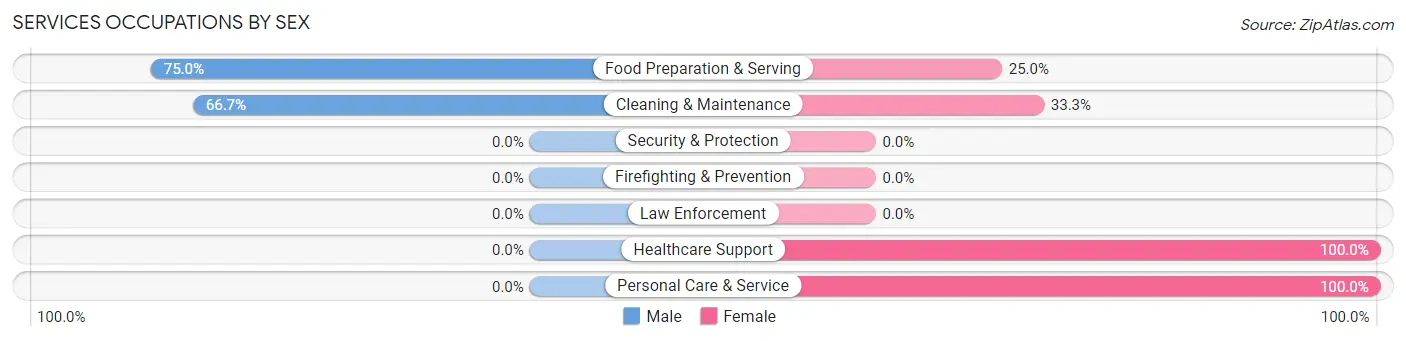
Services Occupations by Sex
Within the Services occupations in Nason, the most male-oriented occupations are Food Preparation & Serving (75.0%), and Cleaning & Maintenance (66.7%), while the most female-oriented occupations are Healthcare Support (100.0%), Personal Care & Service (100.0%), and Cleaning & Maintenance (33.3%).
| Occupation | Male | Female |
| Healthcare Support | 0 (0.0%) | 4 (100.0%) |
| Security & Protection | 0 (0.0%) | 0 (0.0%) |
| Firefighting & Prevention | 0 (0.0%) | 0 (0.0%) |
| Law Enforcement | 0 (0.0%) | 0 (0.0%) |
| Food Preparation & Serving | 3 (75.0%) | 1 (25.0%) |
| Cleaning & Maintenance | 2 (66.7%) | 1 (33.3%) |
| Personal Care & Service | 0 (0.0%) | 2 (100.0%) |
| Total (Category) | 5 (38.5%) | 8 (61.5%) |
| Total (Overall) | 50 (50.5%) | 49 (49.5%) |
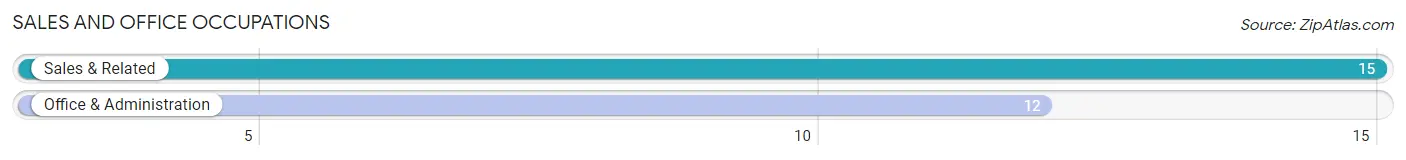
Sales and Office Occupations
The most common Sales and Office occupations in Nason are Sales & Related (15 | 15.1%), and Office & Administration (12 | 12.1%).
Sales and Office Occupations by Sex
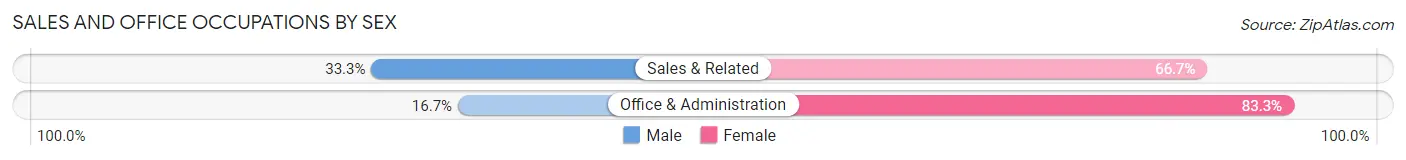
| Occupation | Male | Female |
| Sales & Related | 5 (33.3%) | 10 (66.7%) |
| Office & Administration | 2 (16.7%) | 10 (83.3%) |
| Total (Category) | 7 (25.9%) | 20 (74.1%) |
| Total (Overall) | 50 (50.5%) | 49 (49.5%) |
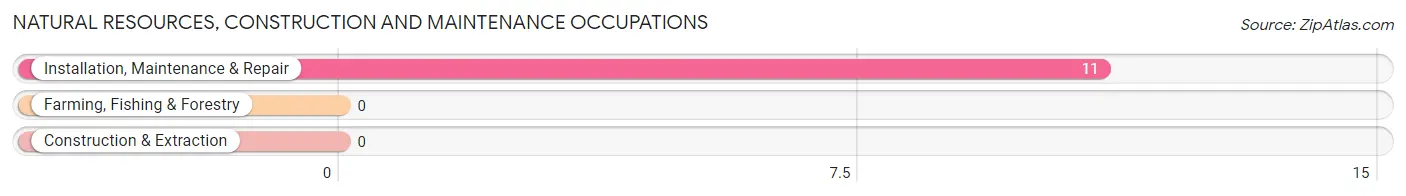
Natural Resources, Construction and Maintenance Occupations
The most common Natural Resources, Construction and Maintenance occupations in Nason are , and Installation, Maintenance & Repair (11 | 11.1%).
Natural Resources, Construction and Maintenance Occupations by Sex
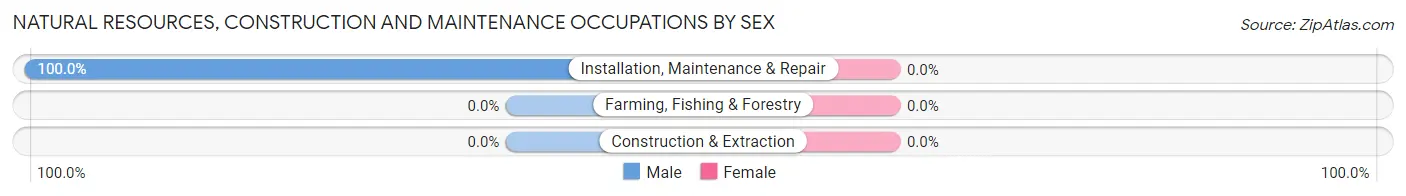
| Occupation | Male | Female |
| Farming, Fishing & Forestry | 0 (0.0%) | 0 (0.0%) |
| Construction & Extraction | 0 (0.0%) | 0 (0.0%) |
| Installation, Maintenance & Repair | 11 (100.0%) | 0 (0.0%) |
| Total (Category) | 11 (100.0%) | 0 (0.0%) |
| Total (Overall) | 50 (50.5%) | 49 (49.5%) |
Production, Transportation and Moving Occupations
The most common Production, Transportation and Moving occupations in Nason are Production (21 | 21.2%), Transportation (6 | 6.1%), and Material Moving (1 | 1.0%).
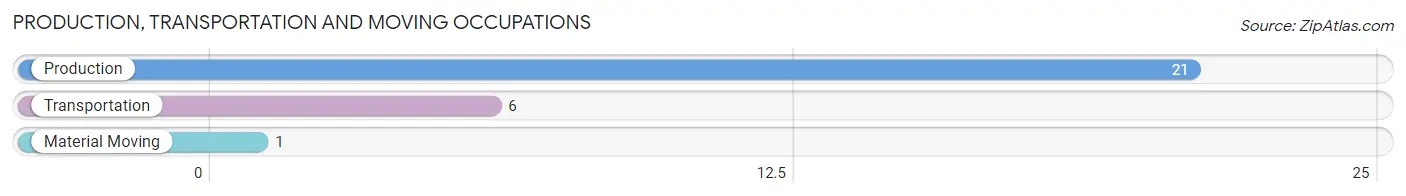
Production, Transportation and Moving Occupations by Sex
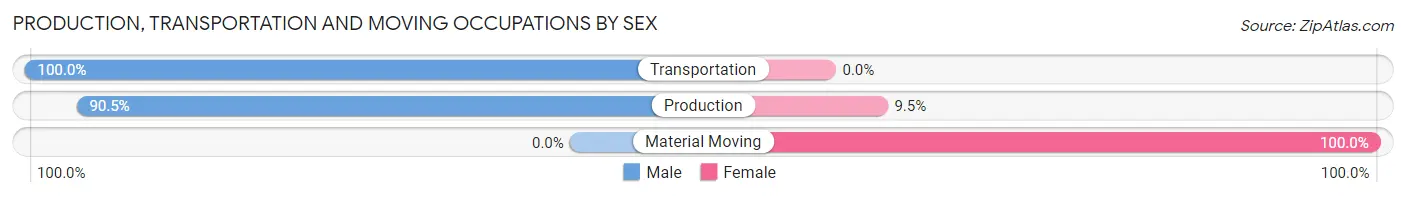
| Occupation | Male | Female |
| Production | 19 (90.5%) | 2 (9.5%) |
| Transportation | 6 (100.0%) | 0 (0.0%) |
| Material Moving | 0 (0.0%) | 1 (100.0%) |
| Total (Category) | 25 (89.3%) | 3 (10.7%) |
| Total (Overall) | 50 (50.5%) | 49 (49.5%) |
Employment Industries by Sex in Nason
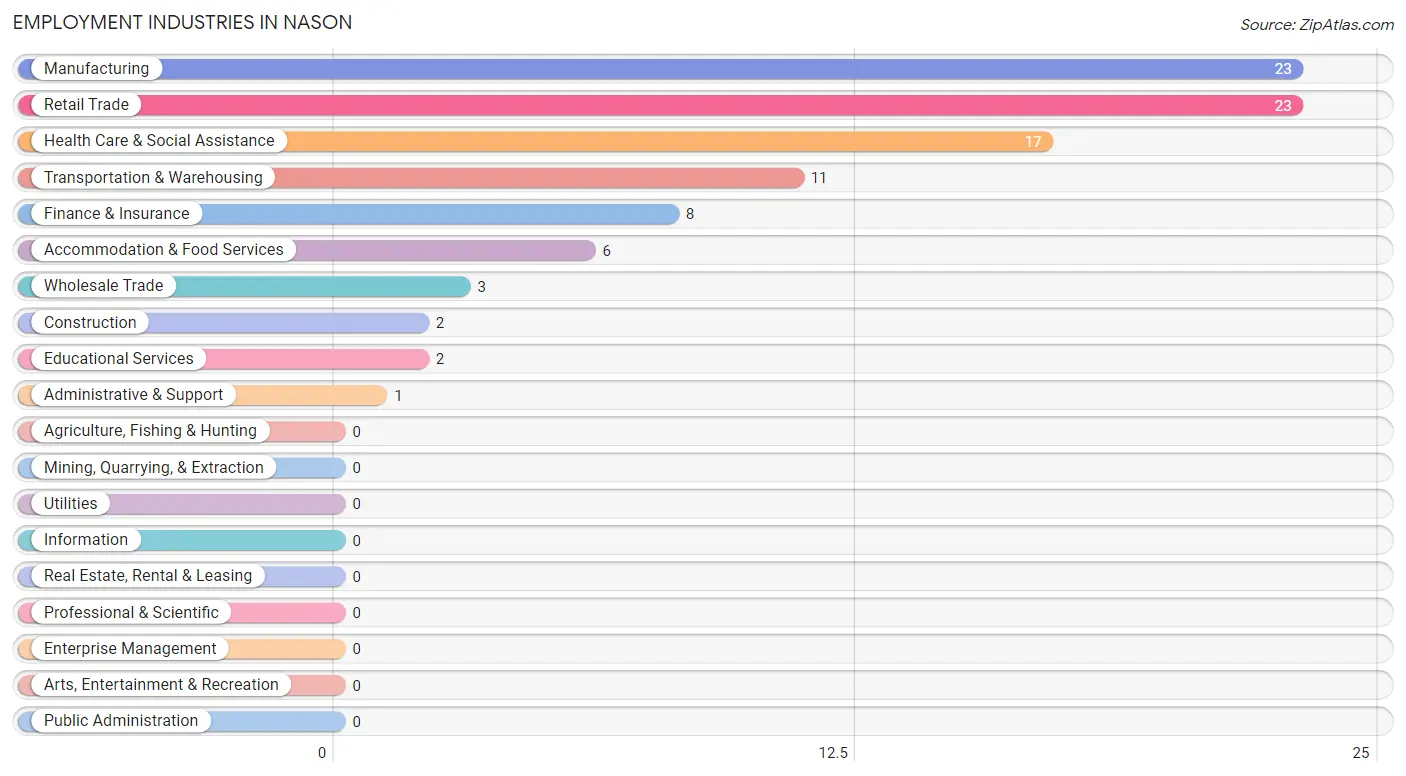
Employment Industries in Nason
The major employment industries in Nason include Manufacturing (23 | 23.2%), Retail Trade (23 | 23.2%), Health Care & Social Assistance (17 | 17.2%), Transportation & Warehousing (11 | 11.1%), and Finance & Insurance (8 | 8.1%).
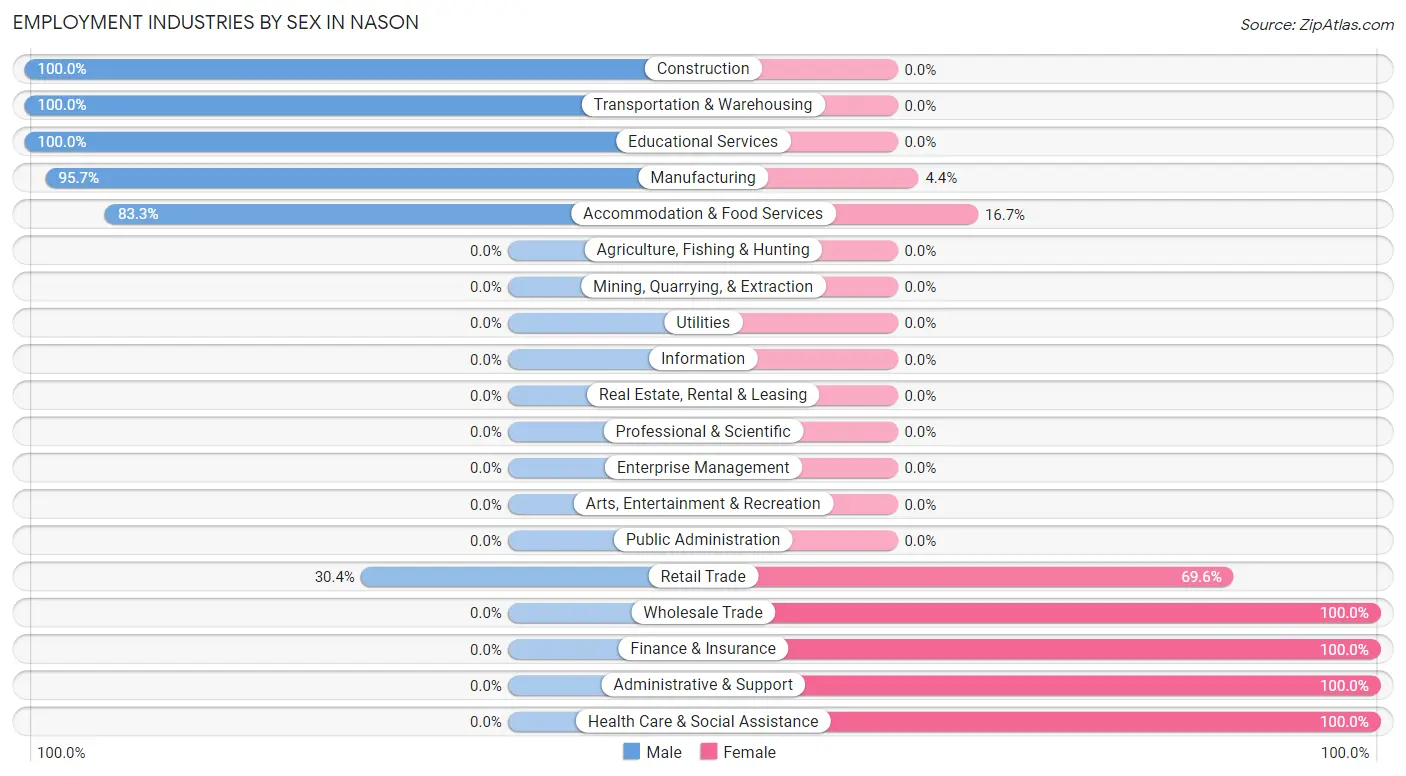
Employment Industries by Sex in Nason
The Nason industries that see more men than women are Construction (100.0%), Transportation & Warehousing (100.0%), and Educational Services (100.0%), whereas the industries that tend to have a higher number of women are Wholesale Trade (100.0%), Finance & Insurance (100.0%), and Administrative & Support (100.0%).
| Industry | Male | Female |
| Agriculture, Fishing & Hunting | 0 (0.0%) | 0 (0.0%) |
| Mining, Quarrying, & Extraction | 0 (0.0%) | 0 (0.0%) |
| Construction | 2 (100.0%) | 0 (0.0%) |
| Manufacturing | 22 (95.7%) | 1 (4.3%) |
| Wholesale Trade | 0 (0.0%) | 3 (100.0%) |
| Retail Trade | 7 (30.4%) | 16 (69.6%) |
| Transportation & Warehousing | 11 (100.0%) | 0 (0.0%) |
| Utilities | 0 (0.0%) | 0 (0.0%) |
| Information | 0 (0.0%) | 0 (0.0%) |
| Finance & Insurance | 0 (0.0%) | 8 (100.0%) |
| Real Estate, Rental & Leasing | 0 (0.0%) | 0 (0.0%) |
| Professional & Scientific | 0 (0.0%) | 0 (0.0%) |
| Enterprise Management | 0 (0.0%) | 0 (0.0%) |
| Administrative & Support | 0 (0.0%) | 1 (100.0%) |
| Educational Services | 2 (100.0%) | 0 (0.0%) |
| Health Care & Social Assistance | 0 (0.0%) | 17 (100.0%) |
| Arts, Entertainment & Recreation | 0 (0.0%) | 0 (0.0%) |
| Accommodation & Food Services | 5 (83.3%) | 1 (16.7%) |
| Public Administration | 0 (0.0%) | 0 (0.0%) |
| Total | 50 (50.5%) | 49 (49.5%) |
Education in Nason
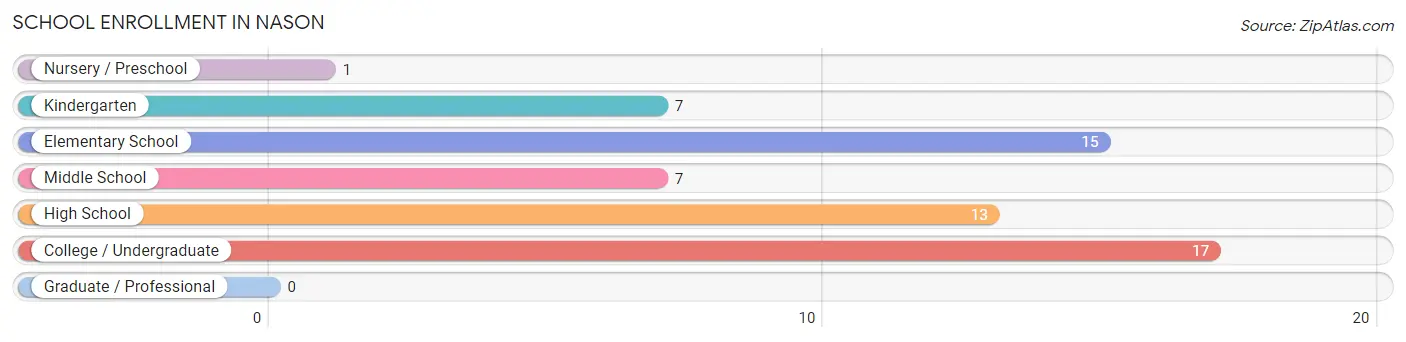
School Enrollment in Nason
The most common levels of schooling among the 60 students in Nason are college / undergraduate (17 | 28.3%), elementary school (15 | 25.0%), and high school (13 | 21.7%).
| School Level | # Students | % Students |
| Nursery / Preschool | 1 | 1.7% |
| Kindergarten | 7 | 11.7% |
| Elementary School | 15 | 25.0% |
| Middle School | 7 | 11.7% |
| High School | 13 | 21.7% |
| College / Undergraduate | 17 | 28.3% |
| Graduate / Professional | 0 | 0.0% |
| Total | 60 | 100.0% |
School Enrollment by Age by Funding Source in Nason
Out of a total of 60 students who are enrolled in schools in Nason, 5 (8.3%) attend a private institution, while the remaining 55 (91.7%) are enrolled in public schools. The age group of 20 to 24 year olds has the highest likelihood of being enrolled in private schools, with 5 (27.8% in the age bracket) enrolled. Conversely, the age group of 5 to 9 year old has the lowest likelihood of being enrolled in a private school, with 21 (100.0% in the age bracket) attending a public institution.
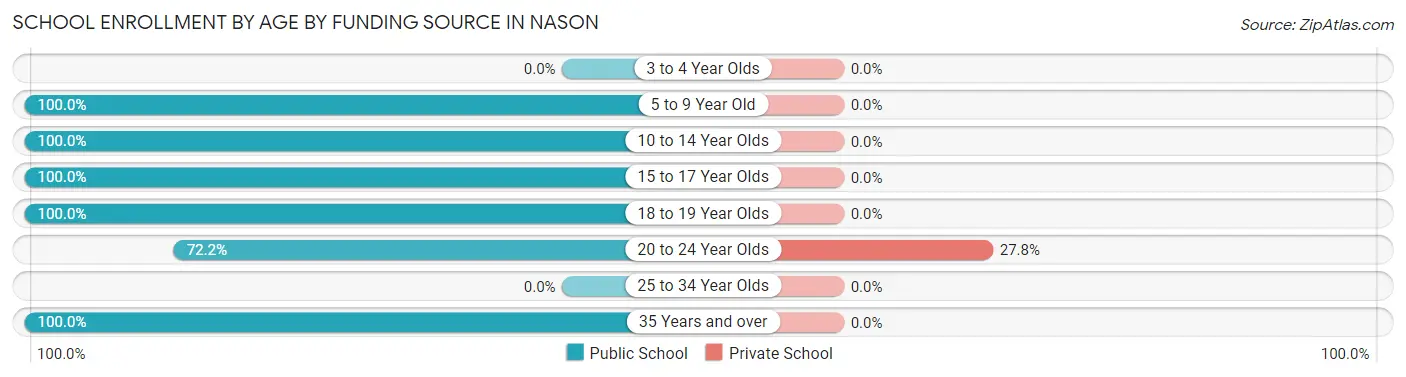
| Age Bracket | Public School | Private School |
| 3 to 4 Year Olds | 0 (0.0%) | 0 (0.0%) |
| 5 to 9 Year Old | 21 (100.0%) | 0 (0.0%) |
| 10 to 14 Year Olds | 12 (100.0%) | 0 (0.0%) |
| 15 to 17 Year Olds | 5 (100.0%) | 0 (0.0%) |
| 18 to 19 Year Olds | 2 (100.0%) | 0 (0.0%) |
| 20 to 24 Year Olds | 13 (72.2%) | 5 (27.8%) |
| 25 to 34 Year Olds | 0 (0.0%) | 0 (0.0%) |
| 35 Years and over | 2 (100.0%) | 0 (0.0%) |
| Total | 55 (91.7%) | 5 (8.3%) |
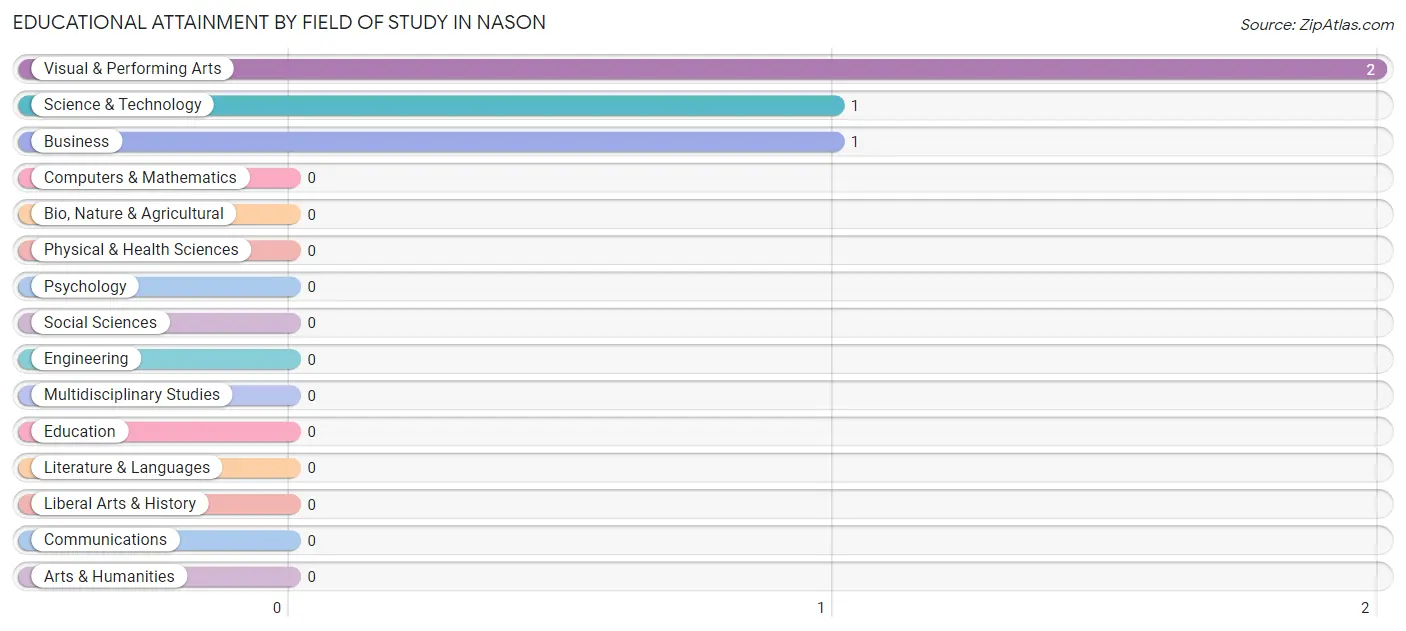
Educational Attainment by Field of Study in Nason
Visual & performing arts (2 | 50.0%), science & technology (1 | 25.0%), and business (1 | 25.0%) are the most common fields of study among 4 individuals in Nason who have obtained a bachelor's degree or higher.
| Field of Study | # Graduates | % Graduates |
| Computers & Mathematics | 0 | 0.0% |
| Bio, Nature & Agricultural | 0 | 0.0% |
| Physical & Health Sciences | 0 | 0.0% |
| Psychology | 0 | 0.0% |
| Social Sciences | 0 | 0.0% |
| Engineering | 0 | 0.0% |
| Multidisciplinary Studies | 0 | 0.0% |
| Science & Technology | 1 | 25.0% |
| Business | 1 | 25.0% |
| Education | 0 | 0.0% |
| Literature & Languages | 0 | 0.0% |
| Liberal Arts & History | 0 | 0.0% |
| Visual & Performing Arts | 2 | 50.0% |
| Communications | 0 | 0.0% |
| Arts & Humanities | 0 | 0.0% |
| Total | 4 | 100.0% |
Transportation & Commute in Nason
Vehicle Availability by Sex in Nason
The most prevalent vehicle ownership categories in Nason are males with 2 vehicles (23, accounting for 46.0%) and females with 2 vehicles (31, making up 46.9%).
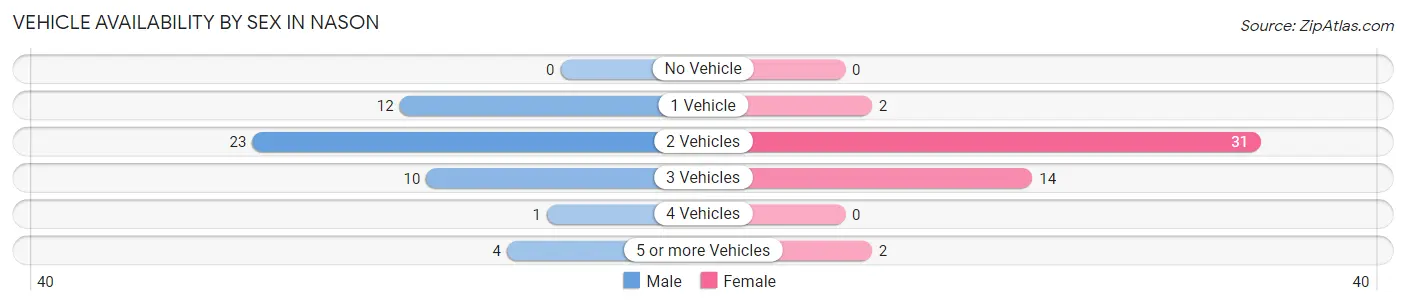
| Vehicles Available | Male | Female |
| No Vehicle | 0 (0.0%) | 0 (0.0%) |
| 1 Vehicle | 12 (24.0%) | 2 (4.1%) |
| 2 Vehicles | 23 (46.0%) | 31 (63.3%) |
| 3 Vehicles | 10 (20.0%) | 14 (28.6%) |
| 4 Vehicles | 1 (2.0%) | 0 (0.0%) |
| 5 or more Vehicles | 4 (8.0%) | 2 (4.1%) |
| Total | 50 (100.0%) | 49 (100.0%) |
Commute Time in Nason
The most frequently occuring commute durations in Nason are 20 to 24 minutes (33 commuters, 34.0%), 15 to 19 minutes (14 commuters, 14.4%), and 30 to 34 minutes (14 commuters, 14.4%).
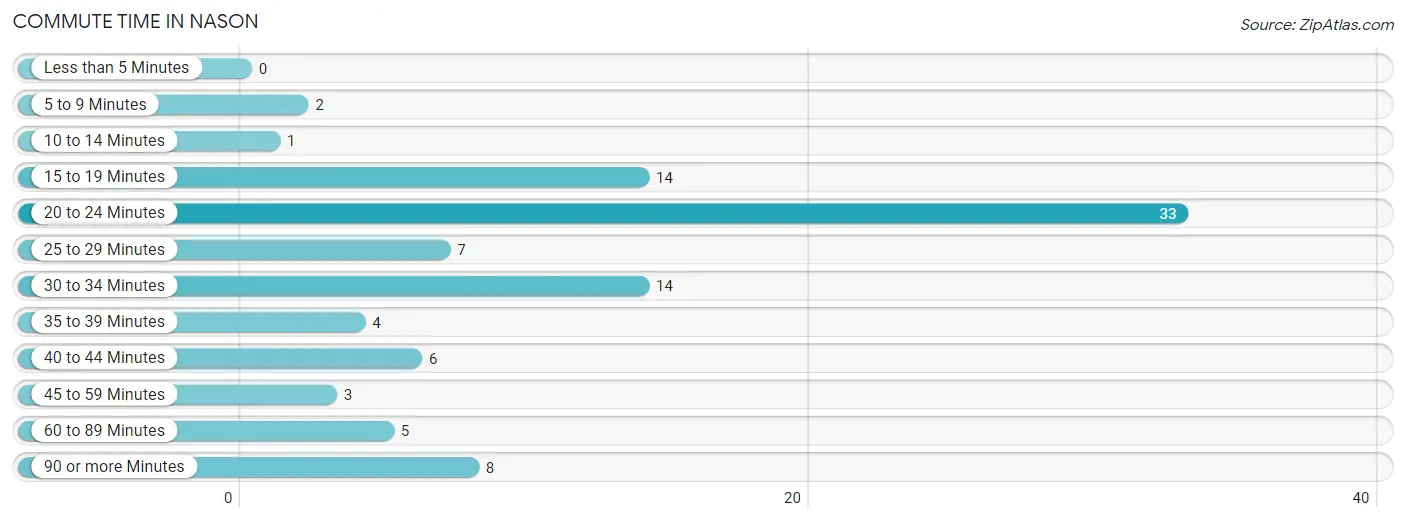
| Commute Time | # Commuters | % Commuters |
| Less than 5 Minutes | 0 | 0.0% |
| 5 to 9 Minutes | 2 | 2.1% |
| 10 to 14 Minutes | 1 | 1.0% |
| 15 to 19 Minutes | 14 | 14.4% |
| 20 to 24 Minutes | 33 | 34.0% |
| 25 to 29 Minutes | 7 | 7.2% |
| 30 to 34 Minutes | 14 | 14.4% |
| 35 to 39 Minutes | 4 | 4.1% |
| 40 to 44 Minutes | 6 | 6.2% |
| 45 to 59 Minutes | 3 | 3.1% |
| 60 to 89 Minutes | 5 | 5.1% |
| 90 or more Minutes | 8 | 8.3% |
Commute Time by Sex in Nason
The most common commute times in Nason are 20 to 24 minutes (16 commuters, 32.0%) for males and 20 to 24 minutes (17 commuters, 36.2%) for females.
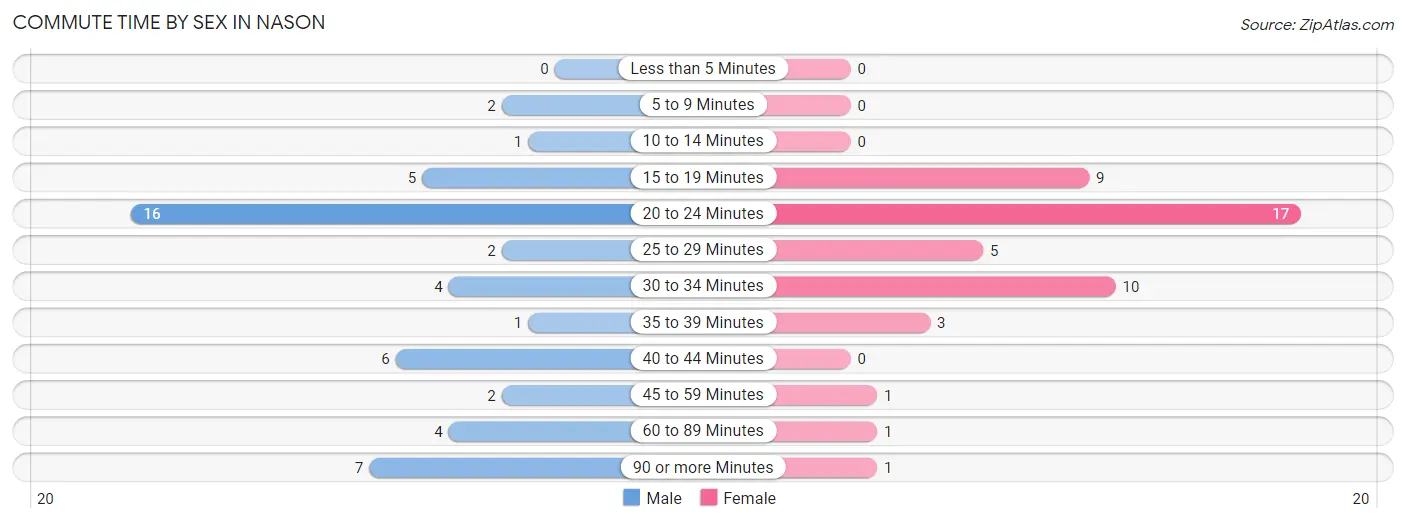
| Commute Time | Male | Female |
| Less than 5 Minutes | 0 (0.0%) | 0 (0.0%) |
| 5 to 9 Minutes | 2 (4.0%) | 0 (0.0%) |
| 10 to 14 Minutes | 1 (2.0%) | 0 (0.0%) |
| 15 to 19 Minutes | 5 (10.0%) | 9 (19.2%) |
| 20 to 24 Minutes | 16 (32.0%) | 17 (36.2%) |
| 25 to 29 Minutes | 2 (4.0%) | 5 (10.6%) |
| 30 to 34 Minutes | 4 (8.0%) | 10 (21.3%) |
| 35 to 39 Minutes | 1 (2.0%) | 3 (6.4%) |
| 40 to 44 Minutes | 6 (12.0%) | 0 (0.0%) |
| 45 to 59 Minutes | 2 (4.0%) | 1 (2.1%) |
| 60 to 89 Minutes | 4 (8.0%) | 1 (2.1%) |
| 90 or more Minutes | 7 (14.0%) | 1 (2.1%) |
Time of Departure to Work by Sex in Nason
The most frequent times of departure to work in Nason are 12:00 AM to 4:59 AM (9, 18.0%) for males and 7:30 AM to 7:59 AM (16, 34.0%) for females.
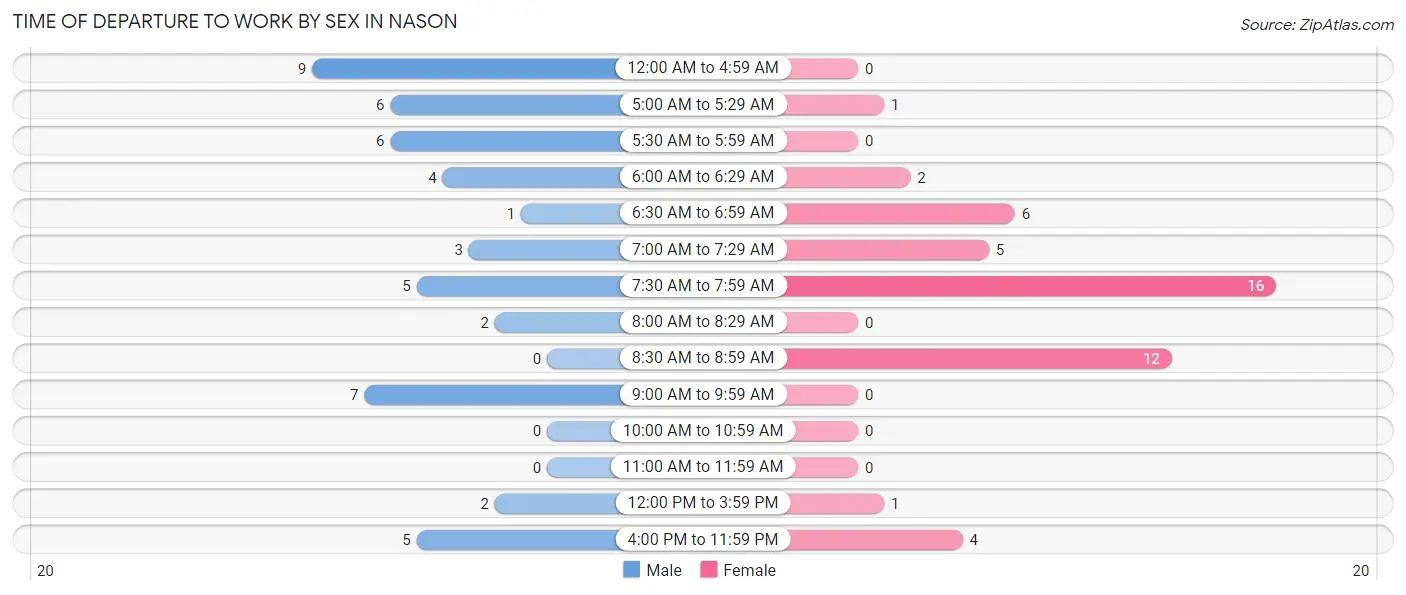
| Time of Departure | Male | Female |
| 12:00 AM to 4:59 AM | 9 (18.0%) | 0 (0.0%) |
| 5:00 AM to 5:29 AM | 6 (12.0%) | 1 (2.1%) |
| 5:30 AM to 5:59 AM | 6 (12.0%) | 0 (0.0%) |
| 6:00 AM to 6:29 AM | 4 (8.0%) | 2 (4.3%) |
| 6:30 AM to 6:59 AM | 1 (2.0%) | 6 (12.8%) |
| 7:00 AM to 7:29 AM | 3 (6.0%) | 5 (10.6%) |
| 7:30 AM to 7:59 AM | 5 (10.0%) | 16 (34.0%) |
| 8:00 AM to 8:29 AM | 2 (4.0%) | 0 (0.0%) |
| 8:30 AM to 8:59 AM | 0 (0.0%) | 12 (25.5%) |
| 9:00 AM to 9:59 AM | 7 (14.0%) | 0 (0.0%) |
| 10:00 AM to 10:59 AM | 0 (0.0%) | 0 (0.0%) |
| 11:00 AM to 11:59 AM | 0 (0.0%) | 0 (0.0%) |
| 12:00 PM to 3:59 PM | 2 (4.0%) | 1 (2.1%) |
| 4:00 PM to 11:59 PM | 5 (10.0%) | 4 (8.5%) |
| Total | 50 (100.0%) | 47 (100.0%) |
Housing Occupancy in Nason
Occupancy by Ownership in Nason
Of the total 107 dwellings in Nason, owner-occupied units account for 94 (87.8%), while renter-occupied units make up 13 (12.1%).
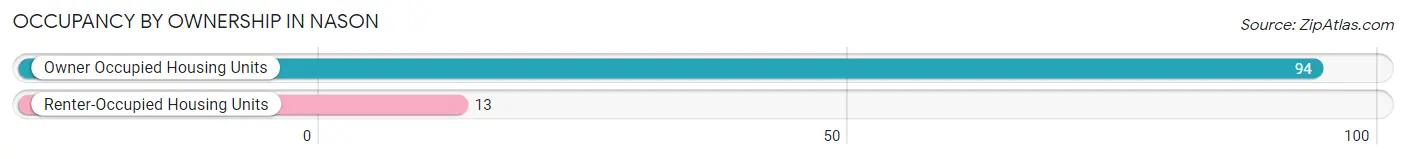
| Occupancy | # Housing Units | % Housing Units |
| Owner Occupied Housing Units | 94 | 87.8% |
| Renter-Occupied Housing Units | 13 | 12.1% |
| Total Occupied Housing Units | 107 | 100.0% |
Occupancy by Household Size in Nason
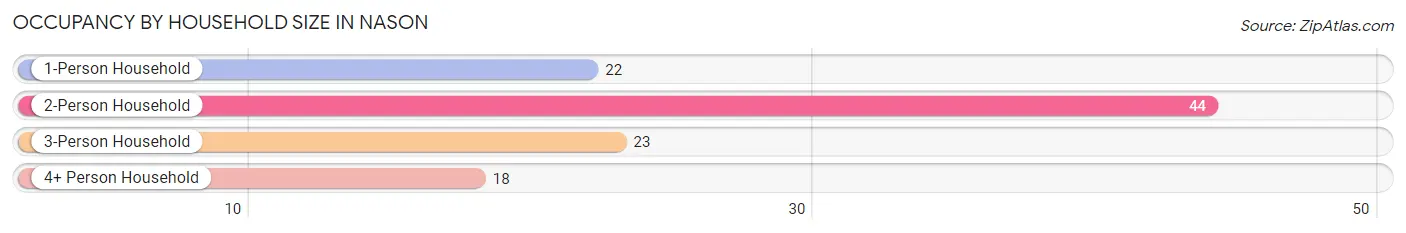
| Household Size | # Housing Units | % Housing Units |
| 1-Person Household | 22 | 20.6% |
| 2-Person Household | 44 | 41.1% |
| 3-Person Household | 23 | 21.5% |
| 4+ Person Household | 18 | 16.8% |
| Total Housing Units | 107 | 100.0% |
Occupancy by Ownership by Household Size in Nason
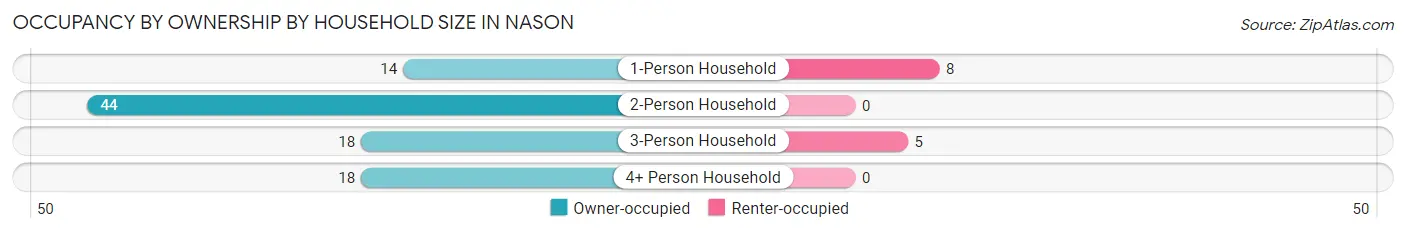
| Household Size | Owner-occupied | Renter-occupied |
| 1-Person Household | 14 (63.6%) | 8 (36.4%) |
| 2-Person Household | 44 (100.0%) | 0 (0.0%) |
| 3-Person Household | 18 (78.3%) | 5 (21.7%) |
| 4+ Person Household | 18 (100.0%) | 0 (0.0%) |
| Total Housing Units | 94 (87.8%) | 13 (12.1%) |
Occupancy by Educational Attainment in Nason
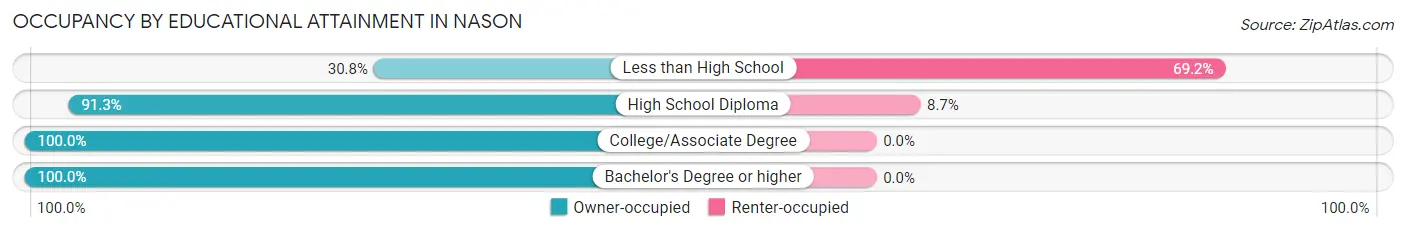
| Household Size | Owner-occupied | Renter-occupied |
| Less than High School | 4 (30.8%) | 9 (69.2%) |
| High School Diploma | 42 (91.3%) | 4 (8.7%) |
| College/Associate Degree | 46 (100.0%) | 0 (0.0%) |
| Bachelor's Degree or higher | 2 (100.0%) | 0 (0.0%) |
Occupancy by Age of Householder in Nason
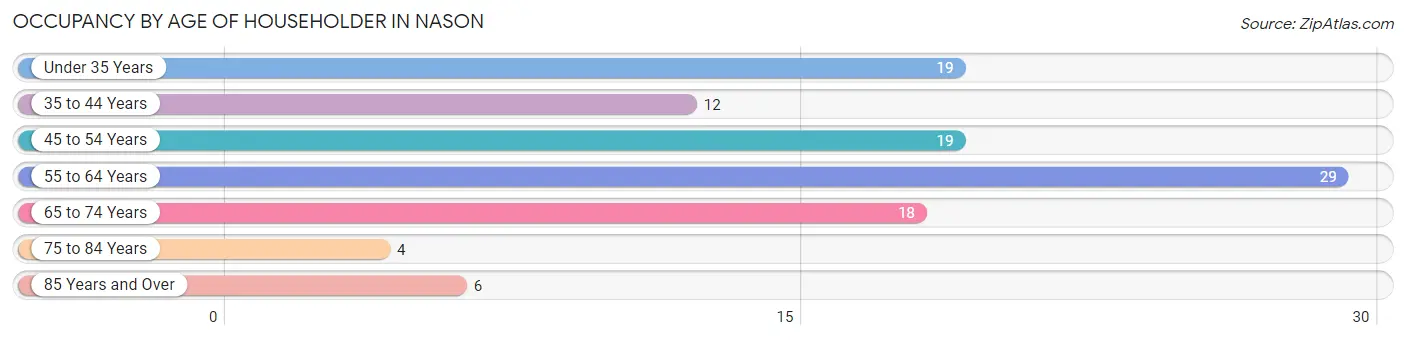
| Age Bracket | # Households | % Households |
| Under 35 Years | 19 | 17.8% |
| 35 to 44 Years | 12 | 11.2% |
| 45 to 54 Years | 19 | 17.8% |
| 55 to 64 Years | 29 | 27.1% |
| 65 to 74 Years | 18 | 16.8% |
| 75 to 84 Years | 4 | 3.7% |
| 85 Years and Over | 6 | 5.6% |
| Total | 107 | 100.0% |
Housing Finances in Nason
Median Income by Occupancy in Nason
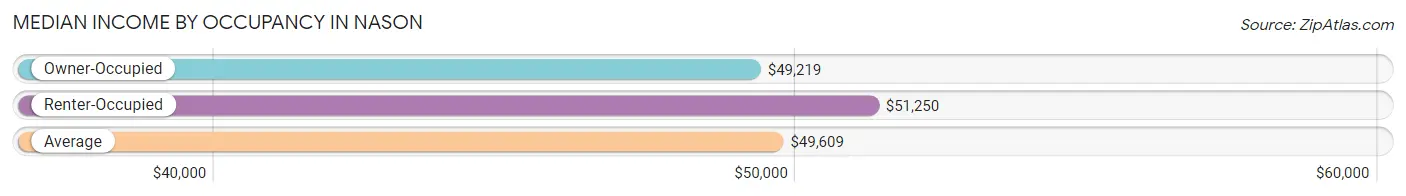
| Occupancy Type | # Households | Median Income |
| Owner-Occupied | 94 (87.8%) | $49,219 |
| Renter-Occupied | 13 (12.1%) | $51,250 |
| Average | 107 (100.0%) | $49,609 |
Occupancy by Householder Income Bracket in Nason
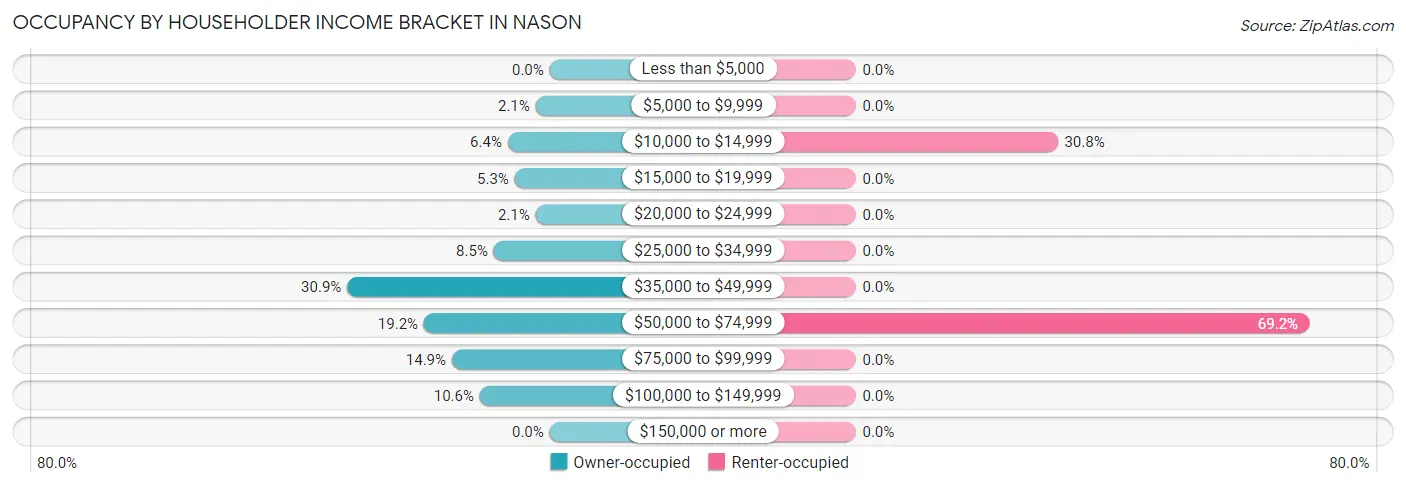
| Income Bracket | Owner-occupied | Renter-occupied |
| Less than $5,000 | 0 (0.0%) | 0 (0.0%) |
| $5,000 to $9,999 | 2 (2.1%) | 0 (0.0%) |
| $10,000 to $14,999 | 6 (6.4%) | 4 (30.8%) |
| $15,000 to $19,999 | 5 (5.3%) | 0 (0.0%) |
| $20,000 to $24,999 | 2 (2.1%) | 0 (0.0%) |
| $25,000 to $34,999 | 8 (8.5%) | 0 (0.0%) |
| $35,000 to $49,999 | 29 (30.8%) | 0 (0.0%) |
| $50,000 to $74,999 | 18 (19.2%) | 9 (69.2%) |
| $75,000 to $99,999 | 14 (14.9%) | 0 (0.0%) |
| $100,000 to $149,999 | 10 (10.6%) | 0 (0.0%) |
| $150,000 or more | 0 (0.0%) | 0 (0.0%) |
| Total | 94 (100.0%) | 13 (100.0%) |
Monthly Housing Cost Tiers in Nason
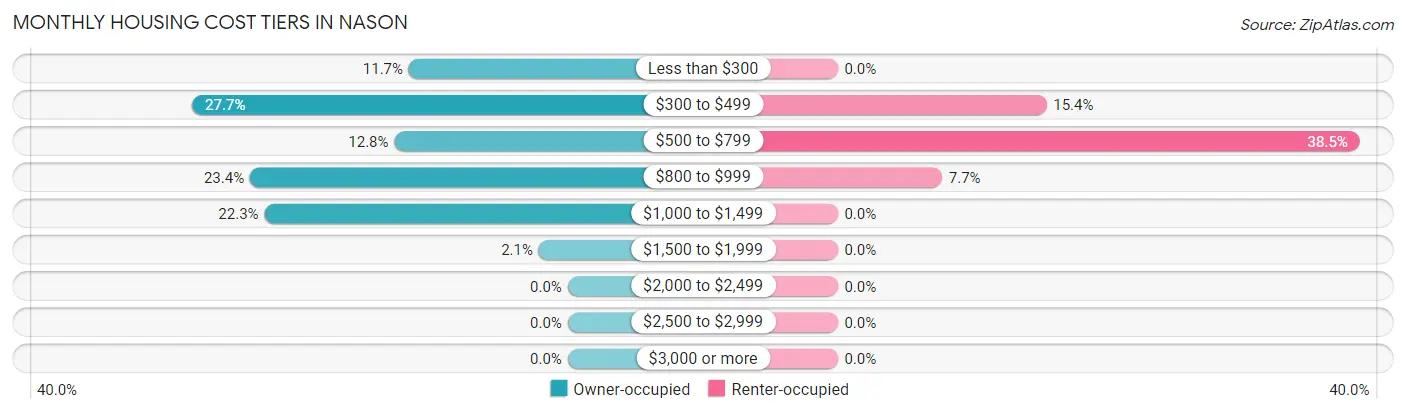
| Monthly Cost | Owner-occupied | Renter-occupied |
| Less than $300 | 11 (11.7%) | 0 (0.0%) |
| $300 to $499 | 26 (27.7%) | 2 (15.4%) |
| $500 to $799 | 12 (12.8%) | 5 (38.5%) |
| $800 to $999 | 22 (23.4%) | 1 (7.7%) |
| $1,000 to $1,499 | 21 (22.3%) | 0 (0.0%) |
| $1,500 to $1,999 | 2 (2.1%) | 0 (0.0%) |
| $2,000 to $2,499 | 0 (0.0%) | 0 (0.0%) |
| $2,500 to $2,999 | 0 (0.0%) | 0 (0.0%) |
| $3,000 or more | 0 (0.0%) | 0 (0.0%) |
| Total | 94 (100.0%) | 13 (100.0%) |
Physical Housing Characteristics in Nason
Housing Structures in Nason
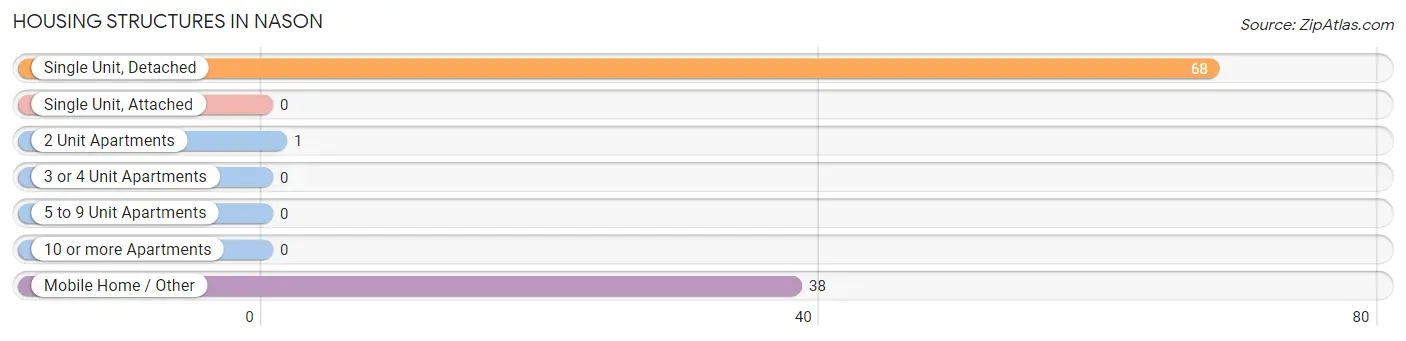
| Structure Type | # Housing Units | % Housing Units |
| Single Unit, Detached | 68 | 63.5% |
| Single Unit, Attached | 0 | 0.0% |
| 2 Unit Apartments | 1 | 0.9% |
| 3 or 4 Unit Apartments | 0 | 0.0% |
| 5 to 9 Unit Apartments | 0 | 0.0% |
| 10 or more Apartments | 0 | 0.0% |
| Mobile Home / Other | 38 | 35.5% |
| Total | 107 | 100.0% |
Housing Structures by Occupancy in Nason
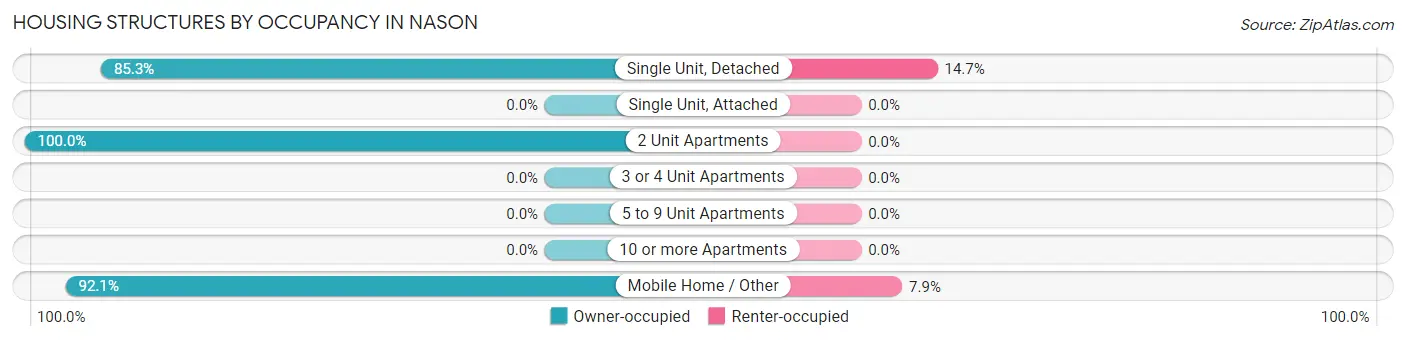
| Structure Type | Owner-occupied | Renter-occupied |
| Single Unit, Detached | 58 (85.3%) | 10 (14.7%) |
| Single Unit, Attached | 0 (0.0%) | 0 (0.0%) |
| 2 Unit Apartments | 1 (100.0%) | 0 (0.0%) |
| 3 or 4 Unit Apartments | 0 (0.0%) | 0 (0.0%) |
| 5 to 9 Unit Apartments | 0 (0.0%) | 0 (0.0%) |
| 10 or more Apartments | 0 (0.0%) | 0 (0.0%) |
| Mobile Home / Other | 35 (92.1%) | 3 (7.9%) |
| Total | 94 (87.8%) | 13 (12.1%) |
Housing Structures by Number of Rooms in Nason
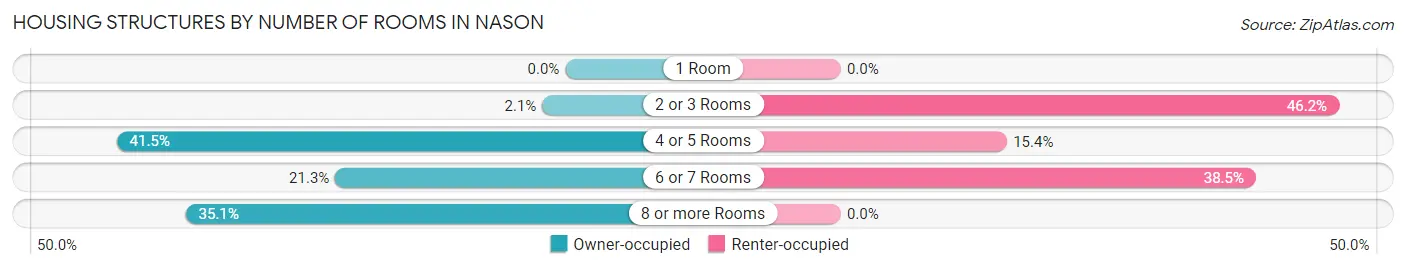
| Number of Rooms | Owner-occupied | Renter-occupied |
| 1 Room | 0 (0.0%) | 0 (0.0%) |
| 2 or 3 Rooms | 2 (2.1%) | 6 (46.2%) |
| 4 or 5 Rooms | 39 (41.5%) | 2 (15.4%) |
| 6 or 7 Rooms | 20 (21.3%) | 5 (38.5%) |
| 8 or more Rooms | 33 (35.1%) | 0 (0.0%) |
| Total | 94 (100.0%) | 13 (100.0%) |
Housing Structure by Heating Type in Nason
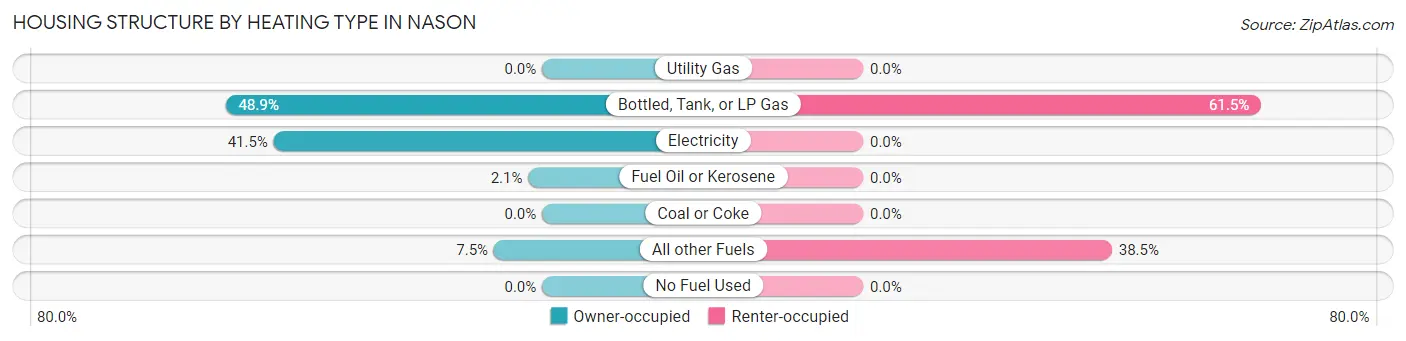
| Heating Type | Owner-occupied | Renter-occupied |
| Utility Gas | 0 (0.0%) | 0 (0.0%) |
| Bottled, Tank, or LP Gas | 46 (48.9%) | 8 (61.5%) |
| Electricity | 39 (41.5%) | 0 (0.0%) |
| Fuel Oil or Kerosene | 2 (2.1%) | 0 (0.0%) |
| Coal or Coke | 0 (0.0%) | 0 (0.0%) |
| All other Fuels | 7 (7.4%) | 5 (38.5%) |
| No Fuel Used | 0 (0.0%) | 0 (0.0%) |
| Total | 94 (100.0%) | 13 (100.0%) |
Household Vehicle Usage in Nason
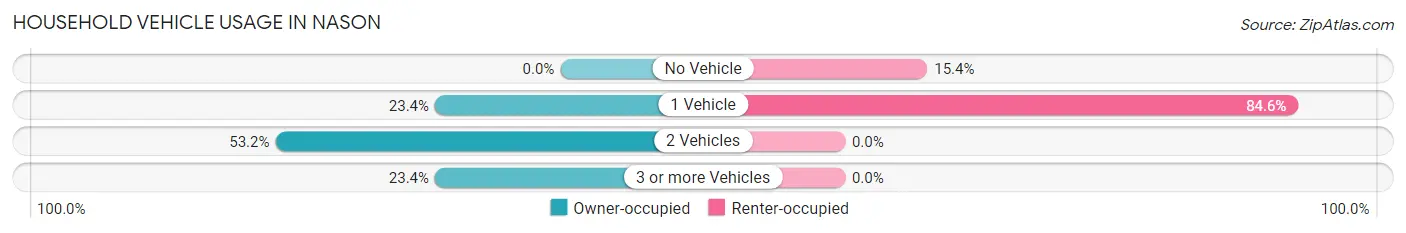
| Vehicles per Household | Owner-occupied | Renter-occupied |
| No Vehicle | 0 (0.0%) | 2 (15.4%) |
| 1 Vehicle | 22 (23.4%) | 11 (84.6%) |
| 2 Vehicles | 50 (53.2%) | 0 (0.0%) |
| 3 or more Vehicles | 22 (23.4%) | 0 (0.0%) |
| Total | 94 (100.0%) | 13 (100.0%) |
Real Estate & Mortgages in Nason
Real Estate and Mortgage Overview in Nason
| Characteristic | Without Mortgage | With Mortgage |
| Housing Units | 57 | 37 |
| Median Property Value | $73,900 | $77,500 |
| Median Household Income | $49,659 | $0 |
| Monthly Housing Costs | $438 | $0 |
| Real Estate Taxes | $1,143 | $0 |
Property Value by Mortgage Status in Nason
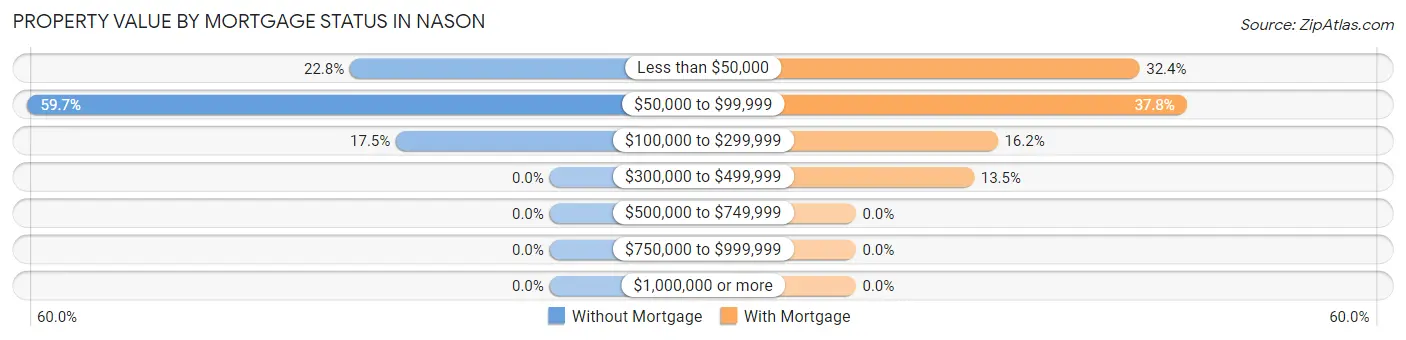
| Property Value | Without Mortgage | With Mortgage |
| Less than $50,000 | 13 (22.8%) | 12 (32.4%) |
| $50,000 to $99,999 | 34 (59.7%) | 14 (37.8%) |
| $100,000 to $299,999 | 10 (17.5%) | 6 (16.2%) |
| $300,000 to $499,999 | 0 (0.0%) | 5 (13.5%) |
| $500,000 to $749,999 | 0 (0.0%) | 0 (0.0%) |
| $750,000 to $999,999 | 0 (0.0%) | 0 (0.0%) |
| $1,000,000 or more | 0 (0.0%) | 0 (0.0%) |
| Total | 57 (100.0%) | 37 (100.0%) |
Household Income by Mortgage Status in Nason
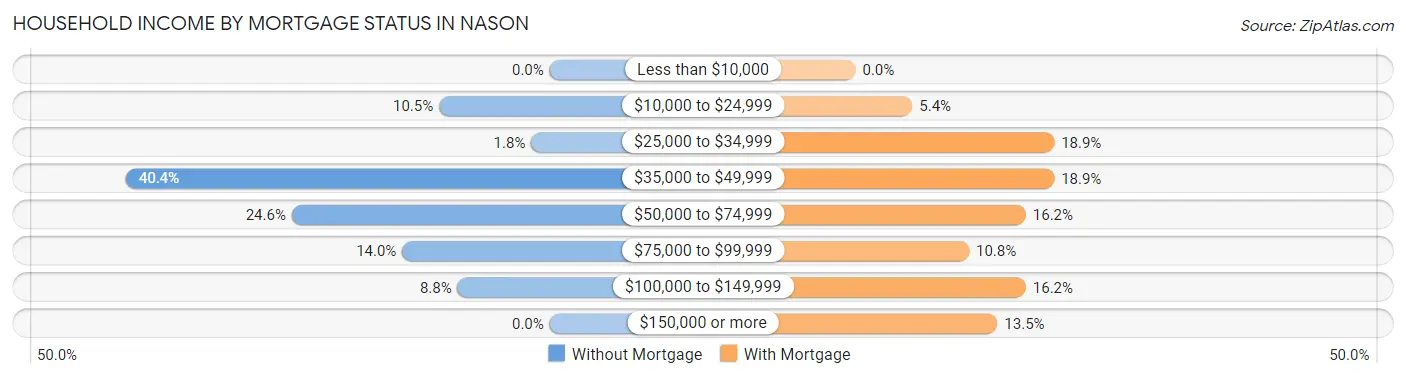
| Household Income | Without Mortgage | With Mortgage |
| Less than $10,000 | 0 (0.0%) | 0 (0.0%) |
| $10,000 to $24,999 | 6 (10.5%) | 2 (5.4%) |
| $25,000 to $34,999 | 1 (1.8%) | 7 (18.9%) |
| $35,000 to $49,999 | 23 (40.4%) | 7 (18.9%) |
| $50,000 to $74,999 | 14 (24.6%) | 6 (16.2%) |
| $75,000 to $99,999 | 8 (14.0%) | 4 (10.8%) |
| $100,000 to $149,999 | 5 (8.8%) | 6 (16.2%) |
| $150,000 or more | 0 (0.0%) | 5 (13.5%) |
| Total | 57 (100.0%) | 37 (100.0%) |
Property Value to Household Income Ratio in Nason
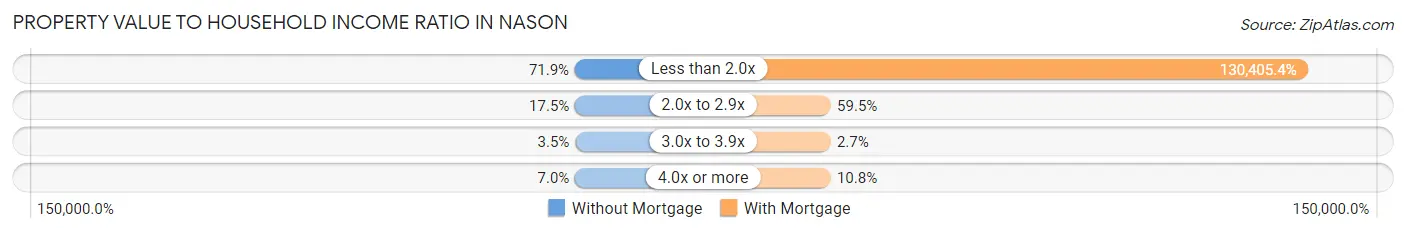
| Value-to-Income Ratio | Without Mortgage | With Mortgage |
| Less than 2.0x | 41 (71.9%) | 48,250 (130,405.4%) |
| 2.0x to 2.9x | 10 (17.5%) | 22 (59.5%) |
| 3.0x to 3.9x | 2 (3.5%) | 1 (2.7%) |
| 4.0x or more | 4 (7.0%) | 4 (10.8%) |
| Total | 57 (100.0%) | 37 (100.0%) |
Real Estate Taxes by Mortgage Status in Nason
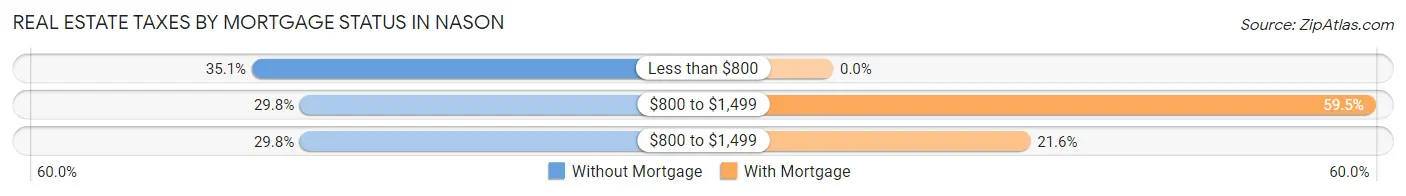
| Property Taxes | Without Mortgage | With Mortgage |
| Less than $800 | 20 (35.1%) | 0 (0.0%) |
| $800 to $1,499 | 17 (29.8%) | 22 (59.5%) |
| $800 to $1,499 | 17 (29.8%) | 8 (21.6%) |
| Total | 57 (100.0%) | 37 (100.0%) |
Health & Disability in Nason
Health Insurance Coverage by Age in Nason
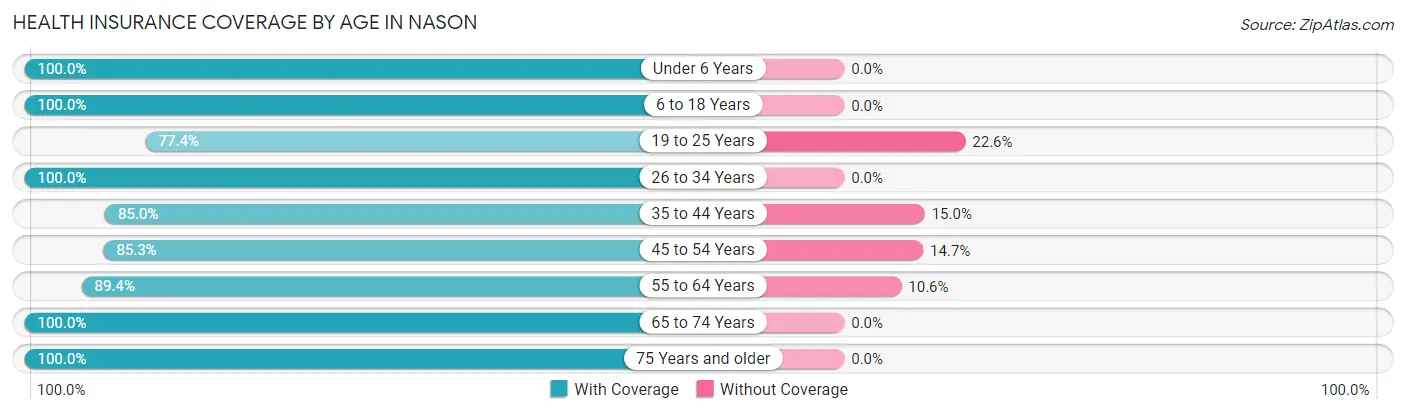
| Age Bracket | With Coverage | Without Coverage |
| Under 6 Years | 7 (100.0%) | 0 (0.0%) |
| 6 to 18 Years | 40 (100.0%) | 0 (0.0%) |
| 19 to 25 Years | 24 (77.4%) | 7 (22.6%) |
| 26 to 34 Years | 25 (100.0%) | 0 (0.0%) |
| 35 to 44 Years | 17 (85.0%) | 3 (15.0%) |
| 45 to 54 Years | 29 (85.3%) | 5 (14.7%) |
| 55 to 64 Years | 42 (89.4%) | 5 (10.6%) |
| 65 to 74 Years | 27 (100.0%) | 0 (0.0%) |
| 75 Years and older | 15 (100.0%) | 0 (0.0%) |
| Total | 226 (91.9%) | 20 (8.1%) |
Health Insurance Coverage by Citizenship Status in Nason
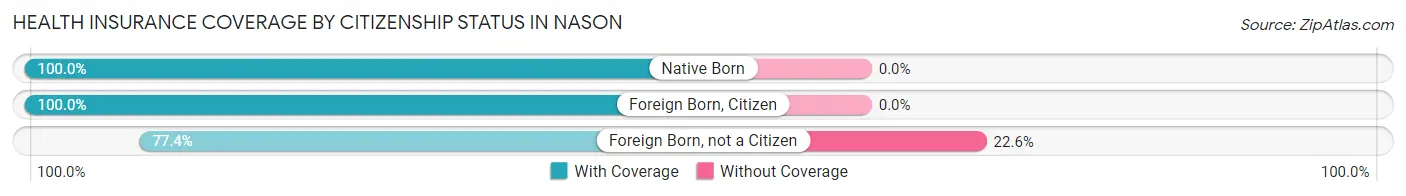
| Citizenship Status | With Coverage | Without Coverage |
| Native Born | 7 (100.0%) | 0 (0.0%) |
| Foreign Born, Citizen | 40 (100.0%) | 0 (0.0%) |
| Foreign Born, not a Citizen | 24 (77.4%) | 7 (22.6%) |
Health Insurance Coverage by Household Income in Nason
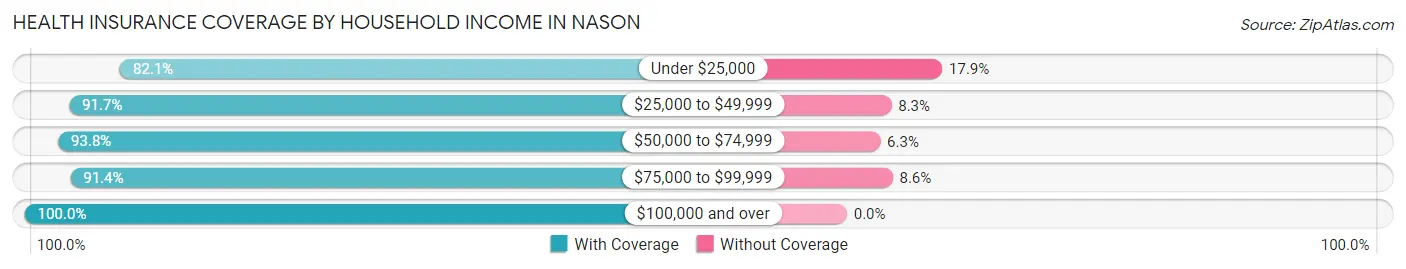
| Household Income | With Coverage | Without Coverage |
| Under $25,000 | 23 (82.1%) | 5 (17.9%) |
| $25,000 to $49,999 | 88 (91.7%) | 8 (8.3%) |
| $50,000 to $74,999 | 60 (93.8%) | 4 (6.2%) |
| $75,000 to $99,999 | 32 (91.4%) | 3 (8.6%) |
| $100,000 and over | 23 (100.0%) | 0 (0.0%) |
Public vs Private Health Insurance Coverage by Age in Nason
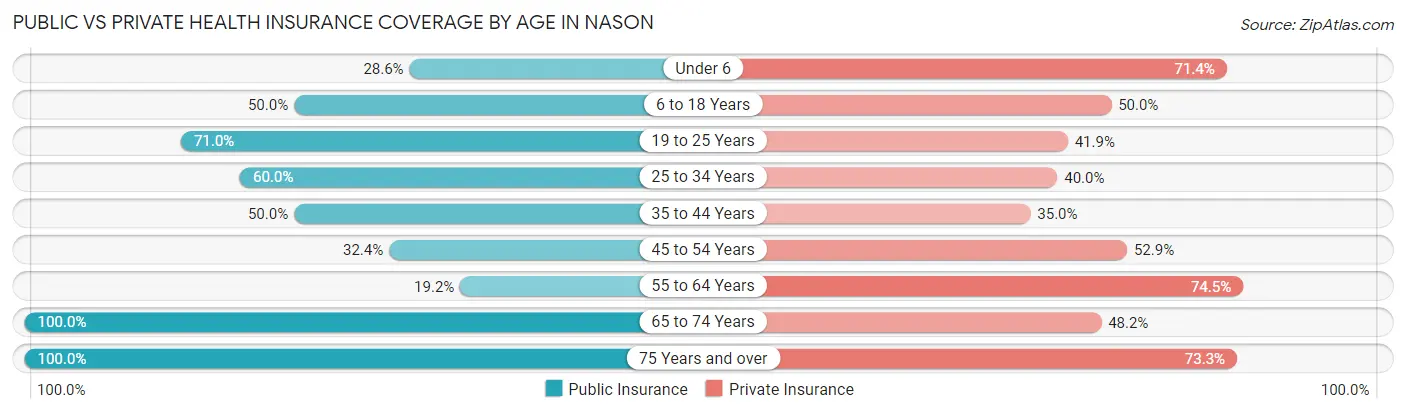
| Age Bracket | Public Insurance | Private Insurance |
| Under 6 | 2 (28.6%) | 5 (71.4%) |
| 6 to 18 Years | 20 (50.0%) | 20 (50.0%) |
| 19 to 25 Years | 22 (71.0%) | 13 (41.9%) |
| 25 to 34 Years | 15 (60.0%) | 10 (40.0%) |
| 35 to 44 Years | 10 (50.0%) | 7 (35.0%) |
| 45 to 54 Years | 11 (32.4%) | 18 (52.9%) |
| 55 to 64 Years | 9 (19.2%) | 35 (74.5%) |
| 65 to 74 Years | 27 (100.0%) | 13 (48.1%) |
| 75 Years and over | 15 (100.0%) | 11 (73.3%) |
| Total | 131 (53.2%) | 132 (53.7%) |
Disability Status by Sex by Age in Nason
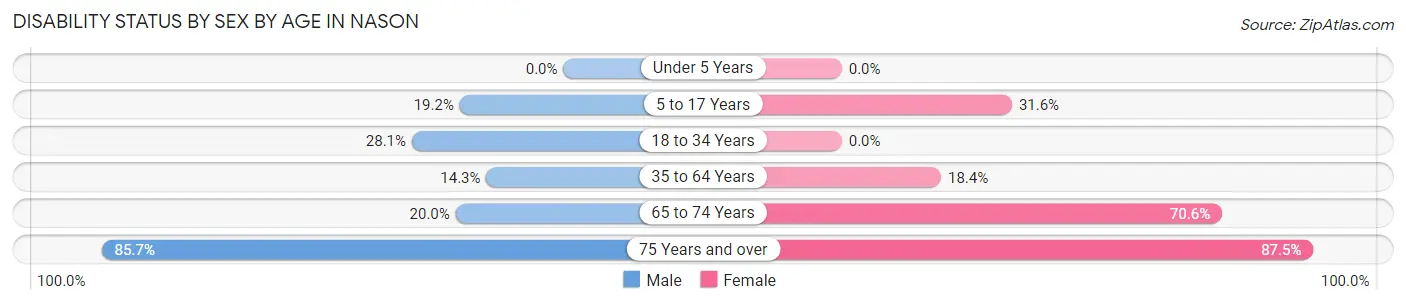
| Age Bracket | Male | Female |
| Under 5 Years | 0 (0.0%) | 0 (0.0%) |
| 5 to 17 Years | 5 (19.2%) | 6 (31.6%) |
| 18 to 34 Years | 9 (28.1%) | 0 (0.0%) |
| 35 to 64 Years | 9 (14.3%) | 7 (18.4%) |
| 65 to 74 Years | 2 (20.0%) | 12 (70.6%) |
| 75 Years and over | 6 (85.7%) | 7 (87.5%) |
Disability Class by Sex by Age in Nason
Disability Class: Hearing Difficulty
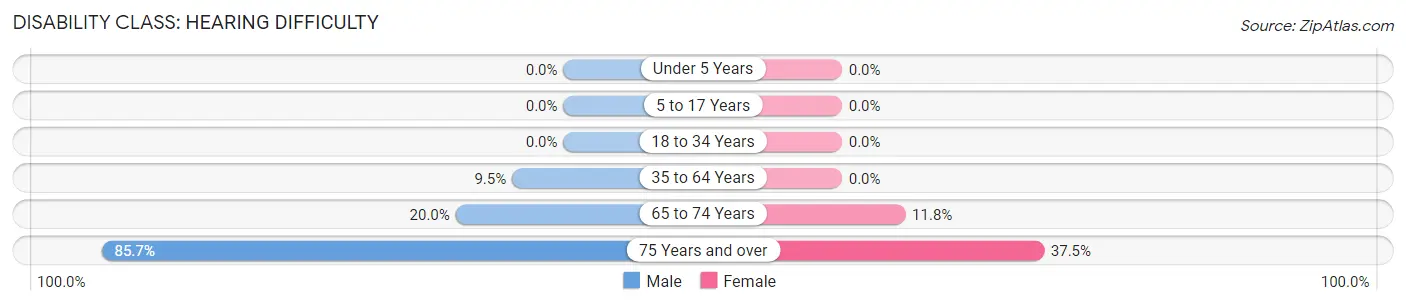
| Age Bracket | Male | Female |
| Under 5 Years | 0 (0.0%) | 0 (0.0%) |
| 5 to 17 Years | 0 (0.0%) | 0 (0.0%) |
| 18 to 34 Years | 0 (0.0%) | 0 (0.0%) |
| 35 to 64 Years | 6 (9.5%) | 0 (0.0%) |
| 65 to 74 Years | 2 (20.0%) | 2 (11.8%) |
| 75 Years and over | 6 (85.7%) | 3 (37.5%) |
Disability Class: Vision Difficulty
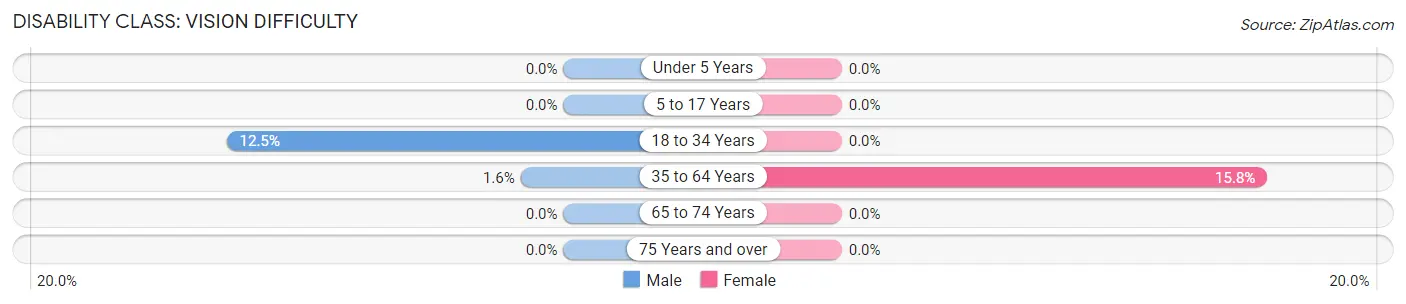
| Age Bracket | Male | Female |
| Under 5 Years | 0 (0.0%) | 0 (0.0%) |
| 5 to 17 Years | 0 (0.0%) | 0 (0.0%) |
| 18 to 34 Years | 4 (12.5%) | 0 (0.0%) |
| 35 to 64 Years | 1 (1.6%) | 6 (15.8%) |
| 65 to 74 Years | 0 (0.0%) | 0 (0.0%) |
| 75 Years and over | 0 (0.0%) | 0 (0.0%) |
Disability Class: Cognitive Difficulty
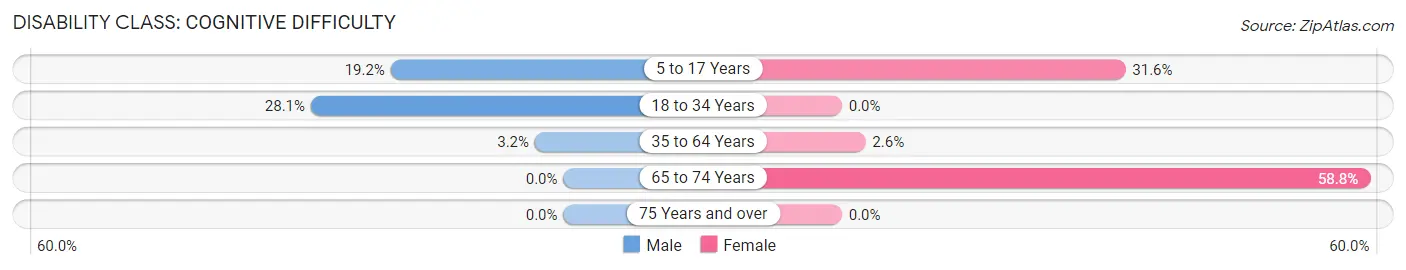
| Age Bracket | Male | Female |
| 5 to 17 Years | 5 (19.2%) | 6 (31.6%) |
| 18 to 34 Years | 9 (28.1%) | 0 (0.0%) |
| 35 to 64 Years | 2 (3.2%) | 1 (2.6%) |
| 65 to 74 Years | 0 (0.0%) | 10 (58.8%) |
| 75 Years and over | 0 (0.0%) | 0 (0.0%) |
Disability Class: Ambulatory Difficulty
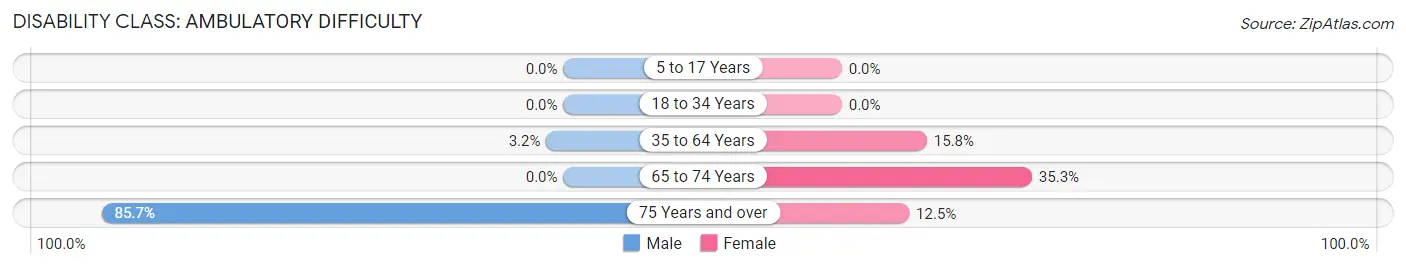
| Age Bracket | Male | Female |
| 5 to 17 Years | 0 (0.0%) | 0 (0.0%) |
| 18 to 34 Years | 0 (0.0%) | 0 (0.0%) |
| 35 to 64 Years | 2 (3.2%) | 6 (15.8%) |
| 65 to 74 Years | 0 (0.0%) | 6 (35.3%) |
| 75 Years and over | 6 (85.7%) | 1 (12.5%) |
Disability Class: Self-Care Difficulty
| Age Bracket | Male | Female |
| 5 to 17 Years | 0 (0.0%) | 0 (0.0%) |
| 18 to 34 Years | 0 (0.0%) | 0 (0.0%) |
| 35 to 64 Years | 0 (0.0%) | 0 (0.0%) |
| 65 to 74 Years | 0 (0.0%) | 0 (0.0%) |
| 75 Years and over | 0 (0.0%) | 0 (0.0%) |
Technology Access in Nason
Computing Device Access in Nason
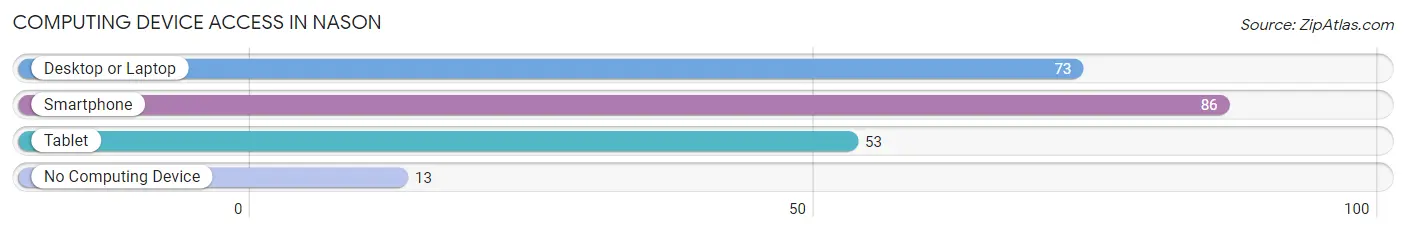
| Device Type | # Households | % Households |
| Desktop or Laptop | 73 | 68.2% |
| Smartphone | 86 | 80.4% |
| Tablet | 53 | 49.5% |
| No Computing Device | 13 | 12.1% |
| Total | 107 | 100.0% |
Internet Access in Nason
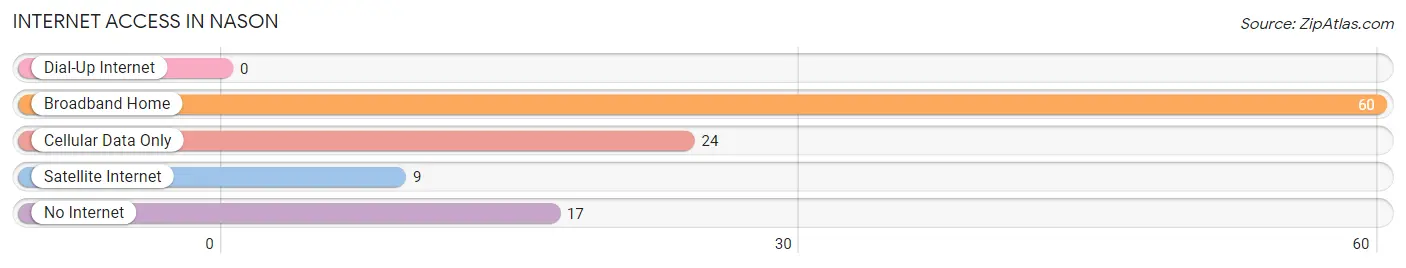
| Internet Type | # Households | % Households |
| Dial-Up Internet | 0 | 0.0% |
| Broadband Home | 60 | 56.1% |
| Cellular Data Only | 24 | 22.4% |
| Satellite Internet | 9 | 8.4% |
| No Internet | 17 | 15.9% |
| Total | 107 | 100.0% |
Nason Summary
Nason is a small village located in Jefferson County, Illinois. It is situated on the banks of the Big Muddy River, about 10 miles south of Mount Vernon. The population of Nason was estimated to be around 500 people in 2000.
Nason was founded in 1819 by William Nason, a Revolutionary War veteran. He purchased the land from the federal government and established a trading post. The village was named after him. Nason quickly grew into a thriving community, with a post office, a general store, a blacksmith shop, and a school.
The economy of Nason was largely based on agriculture. The fertile soil of the area was ideal for growing corn, wheat, and other crops. The Big Muddy River provided a convenient means of transportation for the farmers to get their goods to market. In addition, the river was also used for fishing and recreation.
The population of Nason remained relatively stable until the 1950s, when the construction of Interstate 57 brought an influx of new residents. This led to an increase in the number of businesses in the area, including restaurants, gas stations, and motels.
The geography of Nason is characterized by rolling hills and wooded areas. The Big Muddy River runs through the village, providing a scenic backdrop. The village is surrounded by farmland, with corn and soybean fields stretching for miles.
The demographics of Nason in 2000 were largely white, with a small African American population. The median household income was $35,000, and the median age was 40. The village was home to a variety of religious denominations, including Baptist, Methodist, and Catholic.
Nason is a small, rural village with a rich history and a strong sense of community. The village has remained largely unchanged over the years, and its residents take pride in their heritage. The village is a great place to live, work, and raise a family.
Common Questions
What is Per Capita Income in Nason?
Per Capita income in Nason is $23,715.
What is the Median Family Income in Nason?
Median Family Income in Nason is $52,083.
What is the Median Household income in Nason?
Median Household Income in Nason is $49,609.
What is Inequality or Gini Index in Nason?
Inequality or Gini Index in Nason is 0.32.
What is the Total Population of Nason?
Total Population of Nason is 246.
What is the Total Male Population of Nason?
Total Male Population of Nason is 139.
What is the Total Female Population of Nason?
Total Female Population of Nason is 107.
What is the Ratio of Males per 100 Females in Nason?
There are 129.91 Males per 100 Females in Nason.
What is the Ratio of Females per 100 Males in Nason?
There are 76.98 Females per 100 Males in Nason.
What is the Median Population Age in Nason?
Median Population Age in Nason is 45.0 Years.
What is the Average Family Size in Nason
Average Family Size in Nason is 2.4 People.
What is the Average Household Size in Nason
Average Household Size in Nason is 2.3 People.
How Large is the Labor Force in Nason?
There are 123 People in the Labor Forcein in Nason.
What is the Percentage of People in the Labor Force in Nason?
60.0% of People are in the Labor Force in Nason.
What is the Unemployment Rate in Nason?
Unemployment Rate in Nason is 19.5%.