West City, IL Map & Demographics
West City Map
West City Overview
$20,769
PER CAPITA INCOME
$50,446
AVG FAMILY INCOME
$44,375
AVG HOUSEHOLD INCOME
25.9%
WAGE / INCOME GAP [ % ]
74.1¢/ $1
WAGE / INCOME GAP [ $ ]
0.35
INEQUALITY / GINI INDEX
640
TOTAL POPULATION
322
MALE POPULATION
318
FEMALE POPULATION
101.26
MALES / 100 FEMALES
98.76
FEMALES / 100 MALES
35.8
MEDIAN AGE
3.0
AVG FAMILY SIZE
2.5
AVG HOUSEHOLD SIZE
272
LABOR FORCE [ PEOPLE ]
57.7%
PERCENT IN LABOR FORCE
7.0%
UNEMPLOYMENT RATE
Income in West City
Income Overview in West City
Per Capita Income in West City is $20,769, while median incomes of families and households are $50,446 and $44,375 respectively.
| Characteristic | Number | Measure |
| Per Capita Income | 640 | $20,769 |
| Median Family Income | 157 | $50,446 |
| Mean Family Income | 157 | $53,704 |
| Median Household Income | 261 | $44,375 |
| Mean Household Income | 261 | $50,633 |
| Income Deficit | 157 | $0 |
| Wage / Income Gap (%) | 640 | 25.91% |
| Wage / Income Gap ($) | 640 | 74.09¢ per $1 |
| Gini / Inequality Index | 640 | 0.35 |
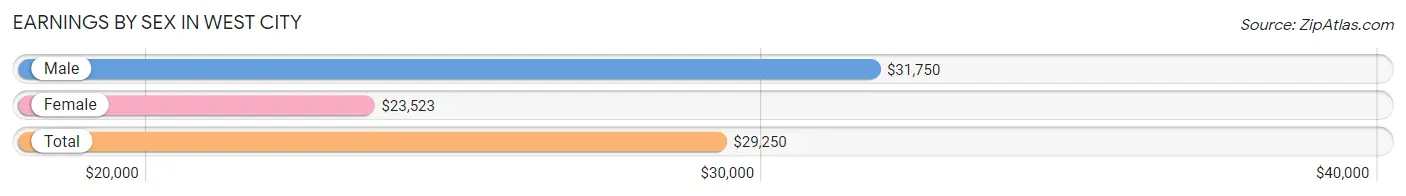
Earnings by Sex in West City
Average Earnings in West City are $29,250, $31,750 for men and $23,523 for women, a difference of 25.9%.
| Sex | Number | Average Earnings |
| Male | 124 (45.8%) | $31,750 |
| Female | 147 (54.2%) | $23,523 |
| Total | 271 (100.0%) | $29,250 |
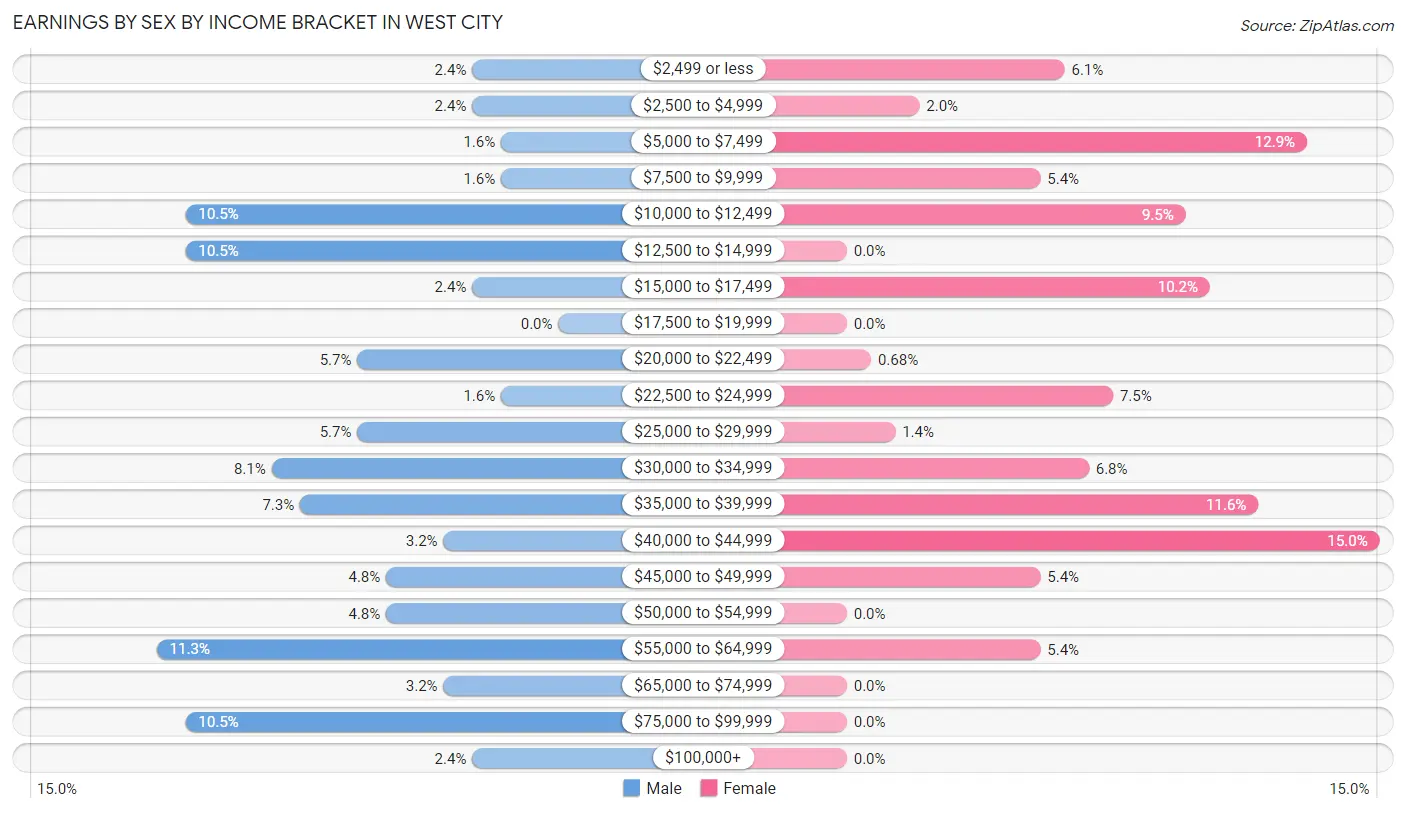
Earnings by Sex by Income Bracket in West City
The most common earnings brackets in West City are $55,000 to $64,999 for men (14 | 11.3%) and $40,000 to $44,999 for women (22 | 15.0%).
| Income | Male | Female |
| $2,499 or less | 3 (2.4%) | 9 (6.1%) |
| $2,500 to $4,999 | 3 (2.4%) | 3 (2.0%) |
| $5,000 to $7,499 | 2 (1.6%) | 19 (12.9%) |
| $7,500 to $9,999 | 2 (1.6%) | 8 (5.4%) |
| $10,000 to $12,499 | 13 (10.5%) | 14 (9.5%) |
| $12,500 to $14,999 | 13 (10.5%) | 0 (0.0%) |
| $15,000 to $17,499 | 3 (2.4%) | 15 (10.2%) |
| $17,500 to $19,999 | 0 (0.0%) | 0 (0.0%) |
| $20,000 to $22,499 | 7 (5.7%) | 1 (0.7%) |
| $22,500 to $24,999 | 2 (1.6%) | 11 (7.5%) |
| $25,000 to $29,999 | 7 (5.7%) | 2 (1.4%) |
| $30,000 to $34,999 | 10 (8.1%) | 10 (6.8%) |
| $35,000 to $39,999 | 9 (7.3%) | 17 (11.6%) |
| $40,000 to $44,999 | 4 (3.2%) | 22 (15.0%) |
| $45,000 to $49,999 | 6 (4.8%) | 8 (5.4%) |
| $50,000 to $54,999 | 6 (4.8%) | 0 (0.0%) |
| $55,000 to $64,999 | 14 (11.3%) | 8 (5.4%) |
| $65,000 to $74,999 | 4 (3.2%) | 0 (0.0%) |
| $75,000 to $99,999 | 13 (10.5%) | 0 (0.0%) |
| $100,000+ | 3 (2.4%) | 0 (0.0%) |
| Total | 124 (100.0%) | 147 (100.0%) |
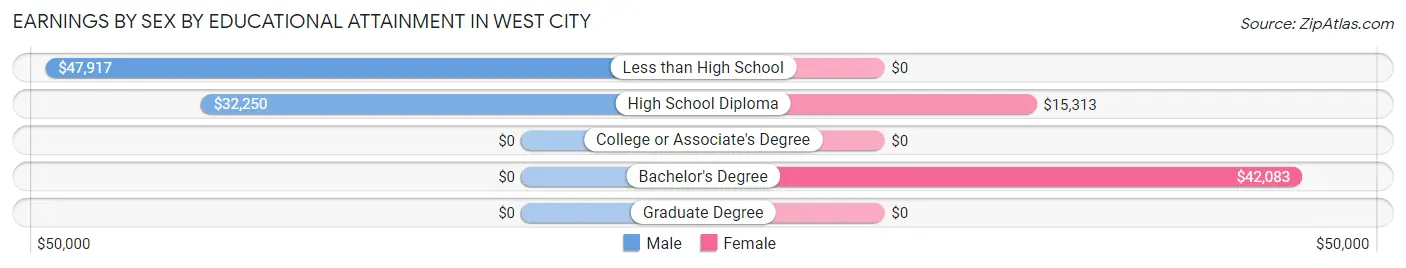
Earnings by Sex by Educational Attainment in West City
Average earnings in West City are $35,500 for men and $30,625 for women, a difference of 13.7%. Men with an educational attainment of less than high school enjoy the highest average annual earnings of $47,917, while those with high school diploma education earn the least with $32,250. Women with an educational attainment of bachelor's degree earn the most with the average annual earnings of $42,083, while those with high school diploma education have the smallest earnings of $15,313.
| Educational Attainment | Male Income | Female Income |
| Less than High School | $47,917 | $0 |
| High School Diploma | $32,250 | $15,313 |
| College or Associate's Degree | - | - |
| Bachelor's Degree | - | - |
| Graduate Degree | - | - |
| Total | $35,500 | $30,625 |
Family Income in West City
Family Income Brackets in West City
According to the West City family income data, there are 34 families falling into the $50,000 to $74,999 income range, which is the most common income bracket and makes up 21.7% of all families. Conversely, the $200,000+ income bracket is the least frequent group with only 1 families (0.6%) belonging to this category.
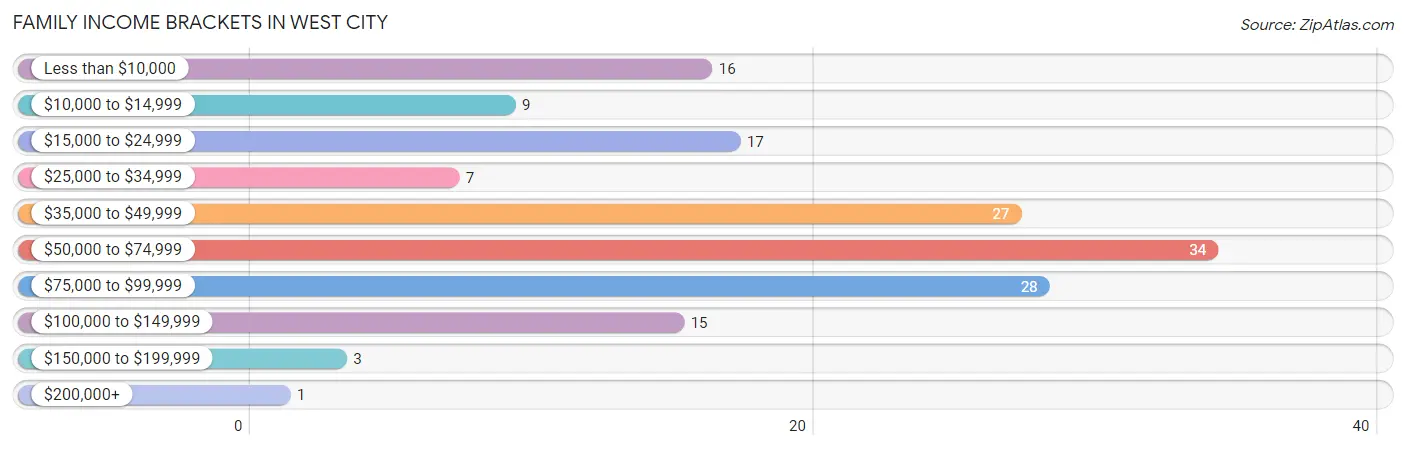
| Income Bracket | # Families | % Families |
| Less than $10,000 | 16 | 10.2% |
| $10,000 to $14,999 | 9 | 5.7% |
| $15,000 to $24,999 | 17 | 10.8% |
| $25,000 to $34,999 | 7 | 4.5% |
| $35,000 to $49,999 | 27 | 17.2% |
| $50,000 to $74,999 | 34 | 21.7% |
| $75,000 to $99,999 | 28 | 17.8% |
| $100,000 to $149,999 | 15 | 9.6% |
| $150,000 to $199,999 | 3 | 1.9% |
| $200,000+ | 1 | 0.6% |
Family Income by Famaliy Size in West City
4-person families (18 | 11.5%) account for the highest median family income in West City with $82,857 per family, while 2-person families (98 | 62.4%) have the highest median income of $25,090 per family member.
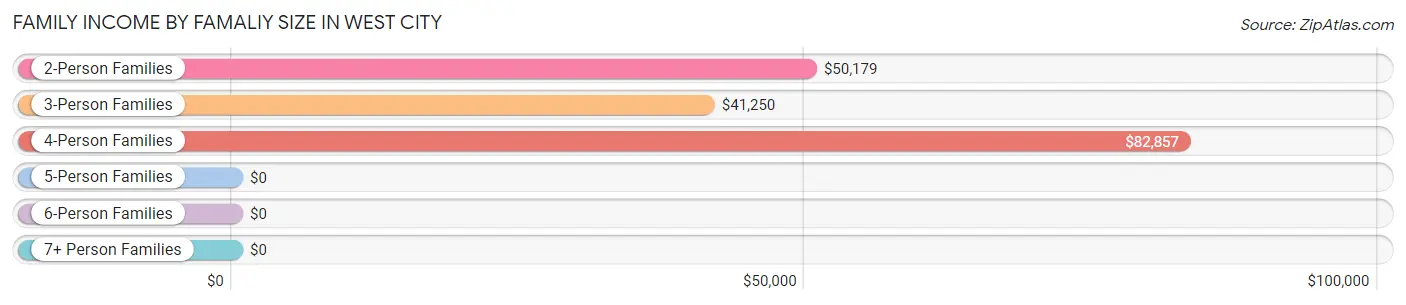
| Income Bracket | # Families | Median Income |
| 2-Person Families | 98 (62.4%) | $50,179 |
| 3-Person Families | 22 (14.0%) | $41,250 |
| 4-Person Families | 18 (11.5%) | $82,857 |
| 5-Person Families | 0 (0.0%) | $0 |
| 6-Person Families | 12 (7.6%) | $0 |
| 7+ Person Families | 7 (4.5%) | $0 |
| Total | 157 (100.0%) | $50,446 |
Family Income by Number of Earners in West City
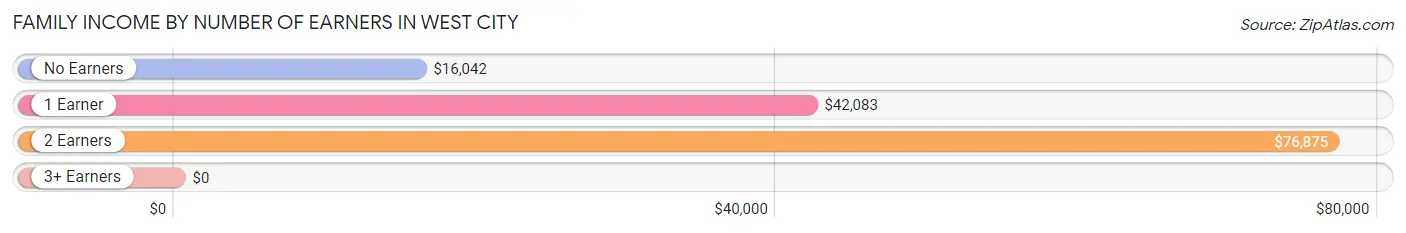
| Number of Earners | # Families | Median Income |
| No Earners | 38 (24.2%) | $16,042 |
| 1 Earner | 62 (39.5%) | $42,083 |
| 2 Earners | 45 (28.7%) | $76,875 |
| 3+ Earners | 12 (7.6%) | $0 |
| Total | 157 (100.0%) | $50,446 |
Household Income in West City
Household Income Brackets in West City
With 63 households falling in the category, the $35,000 to $49,999 income range is the most frequent in West City, accounting for 24.1% of all households. In contrast, only 1 households (0.4%) fall into the $200,000+ income bracket, making it the least populous group.
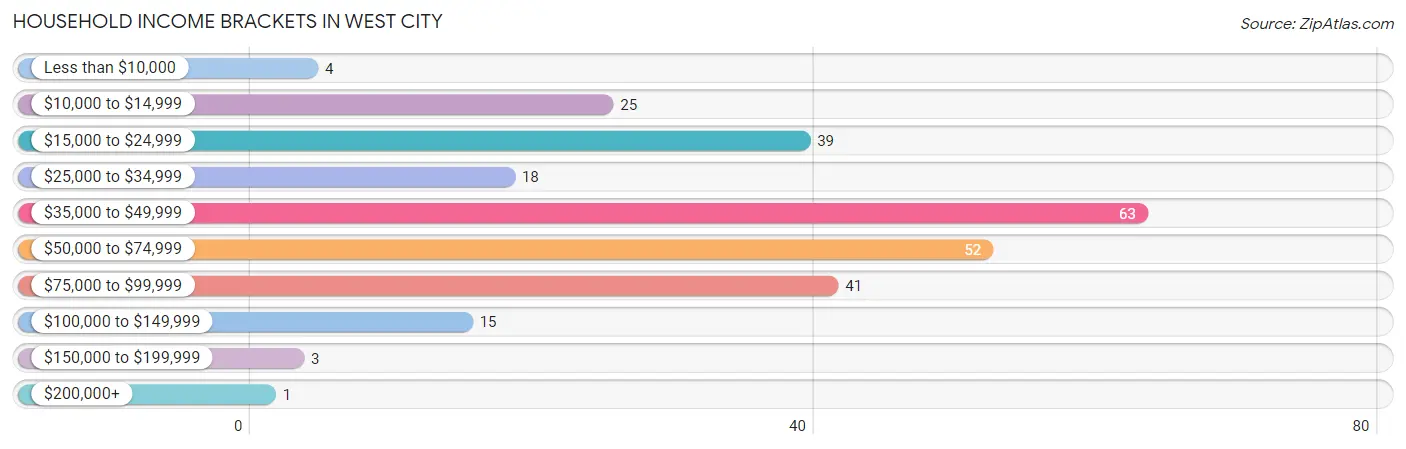
| Income Bracket | # Households | % Households |
| Less than $10,000 | 4 | 1.5% |
| $10,000 to $14,999 | 25 | 9.6% |
| $15,000 to $24,999 | 39 | 14.9% |
| $25,000 to $34,999 | 18 | 6.9% |
| $35,000 to $49,999 | 63 | 24.1% |
| $50,000 to $74,999 | 52 | 19.9% |
| $75,000 to $99,999 | 41 | 15.7% |
| $100,000 to $149,999 | 15 | 5.7% |
| $150,000 to $199,999 | 3 | 1.1% |
| $200,000+ | 1 | 0.4% |
Household Income by Householder Age in West City
The median household income in West City is $44,375, with the highest median household income of $72,857 found in the 25 to 44 years age bracket for the primary householder. A total of 72 households (27.6%) fall into this category. Meanwhile, the 15 to 24 years age bracket for the primary householder has the lowest median household income of $40,521, with 25 households (9.6%) in this group.
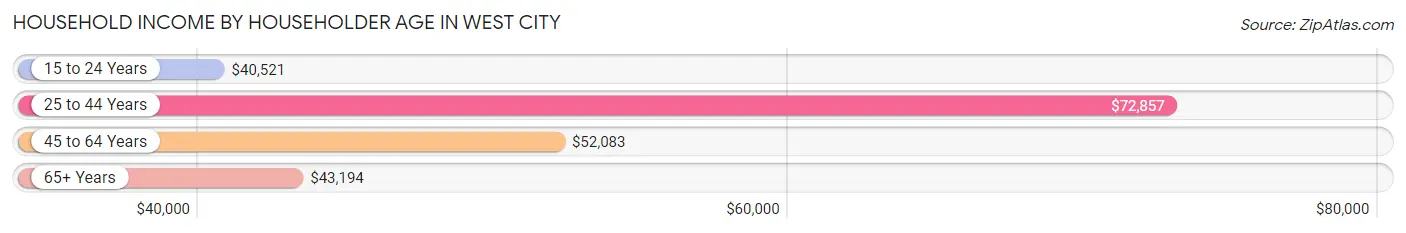
| Income Bracket | # Households | Median Income |
| 15 to 24 Years | 25 (9.6%) | $40,521 |
| 25 to 44 Years | 72 (27.6%) | $72,857 |
| 45 to 64 Years | 84 (32.2%) | $52,083 |
| 65+ Years | 80 (30.6%) | $43,194 |
| Total | 261 (100.0%) | $44,375 |
Poverty in West City
Income Below Poverty by Sex and Age in West City
With 36.3% poverty level for males and 36.2% for females among the residents of West City, 5 year old males and 12 to 14 year old females are the most vulnerable to poverty, with 6 males (100.0%) and 3 females (100.0%) in their respective age groups living below the poverty level.
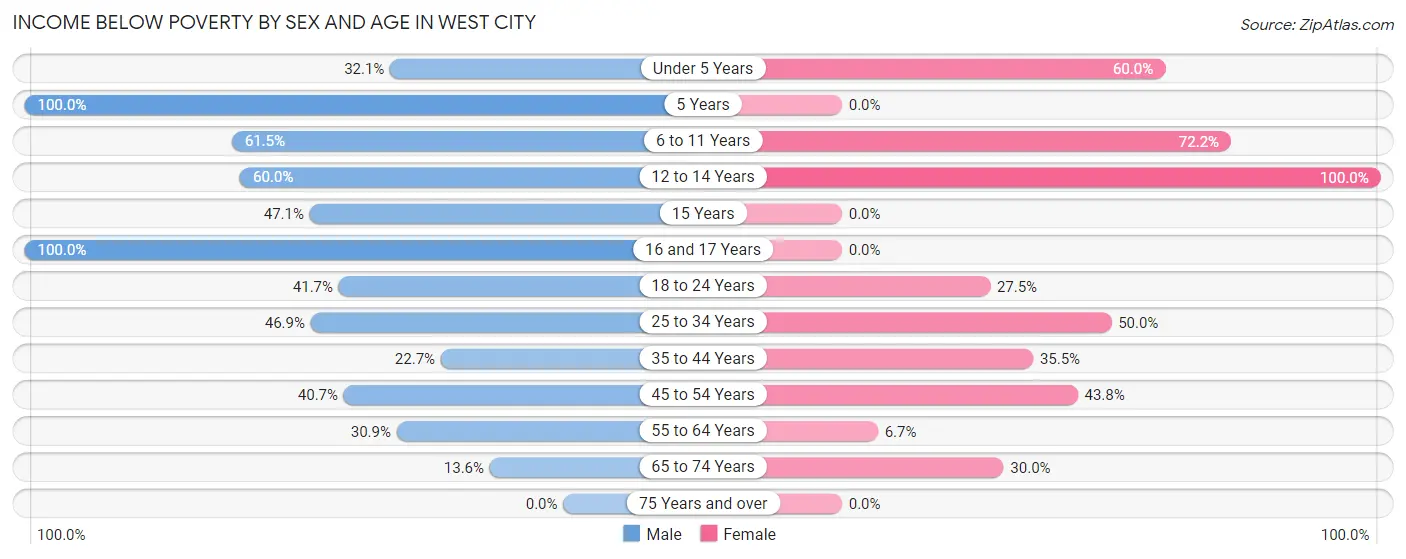
| Age Bracket | Male | Female |
| Under 5 Years | 9 (32.1%) | 18 (60.0%) |
| 5 Years | 6 (100.0%) | 0 (0.0%) |
| 6 to 11 Years | 24 (61.5%) | 26 (72.2%) |
| 12 to 14 Years | 6 (60.0%) | 3 (100.0%) |
| 15 Years | 8 (47.1%) | 0 (0.0%) |
| 16 and 17 Years | 3 (100.0%) | 0 (0.0%) |
| 18 to 24 Years | 5 (41.7%) | 11 (27.5%) |
| 25 to 34 Years | 15 (46.9%) | 23 (50.0%) |
| 35 to 44 Years | 10 (22.7%) | 11 (35.5%) |
| 45 to 54 Years | 11 (40.7%) | 14 (43.8%) |
| 55 to 64 Years | 17 (30.9%) | 3 (6.7%) |
| 65 to 74 Years | 3 (13.6%) | 6 (30.0%) |
| 75 Years and over | 0 (0.0%) | 0 (0.0%) |
| Total | 117 (36.3%) | 115 (36.2%) |
Income Above Poverty by Sex and Age in West City
According to the poverty statistics in West City, males aged 75 years and over and females aged 16 and 17 years are the age groups that are most secure financially, with 100.0% of males and 100.0% of females in these age groups living above the poverty line.
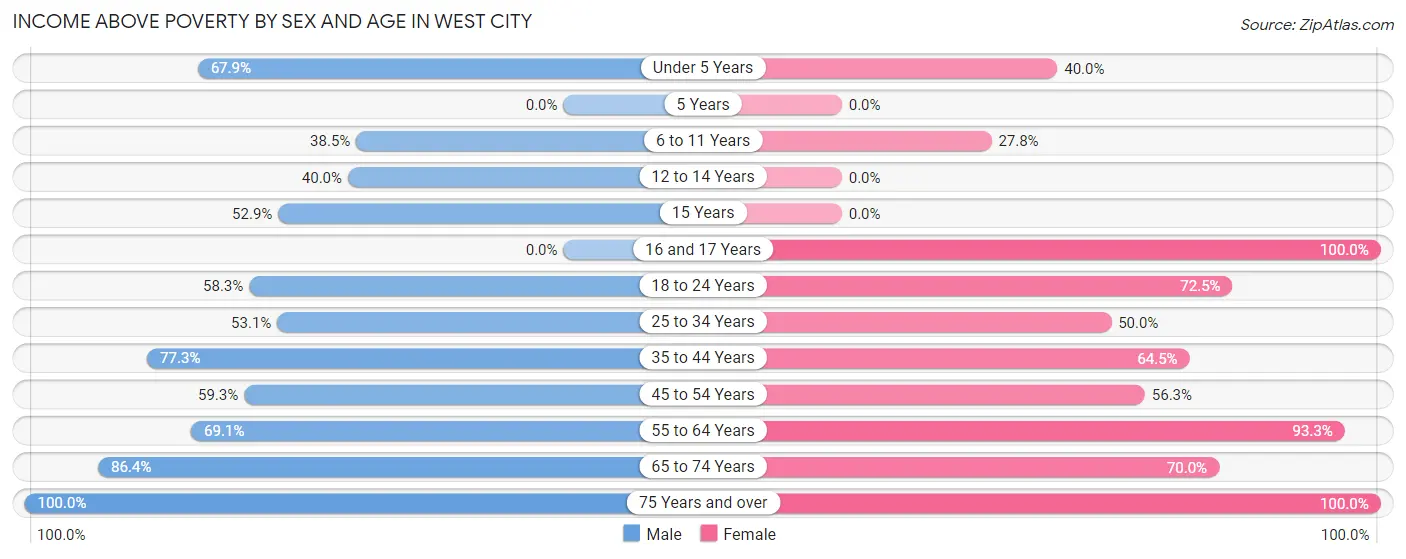
| Age Bracket | Male | Female |
| Under 5 Years | 19 (67.9%) | 12 (40.0%) |
| 5 Years | 0 (0.0%) | 0 (0.0%) |
| 6 to 11 Years | 15 (38.5%) | 10 (27.8%) |
| 12 to 14 Years | 4 (40.0%) | 0 (0.0%) |
| 15 Years | 9 (52.9%) | 0 (0.0%) |
| 16 and 17 Years | 0 (0.0%) | 8 (100.0%) |
| 18 to 24 Years | 7 (58.3%) | 29 (72.5%) |
| 25 to 34 Years | 17 (53.1%) | 23 (50.0%) |
| 35 to 44 Years | 34 (77.3%) | 20 (64.5%) |
| 45 to 54 Years | 16 (59.3%) | 18 (56.2%) |
| 55 to 64 Years | 38 (69.1%) | 42 (93.3%) |
| 65 to 74 Years | 19 (86.4%) | 14 (70.0%) |
| 75 Years and over | 27 (100.0%) | 27 (100.0%) |
| Total | 205 (63.7%) | 203 (63.8%) |
Income Below Poverty Among Married-Couple Families in West City
The poverty statistics for married-couple families in West City show that 24.7% or 19 of the total 77 families live below the poverty line. Families with 1 or 2 children have the highest poverty rate of 40.0%, comprising of 4 families. On the other hand, families with no children have the lowest poverty rate of 21.8%, which includes 12 families.
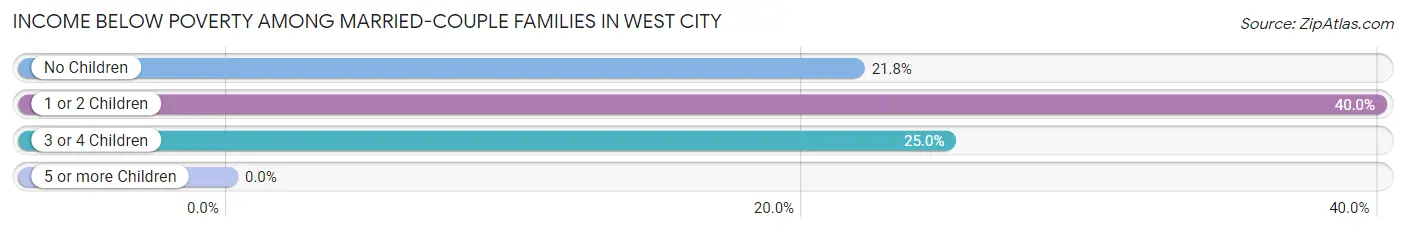
| Children | Above Poverty | Below Poverty |
| No Children | 43 (78.2%) | 12 (21.8%) |
| 1 or 2 Children | 6 (60.0%) | 4 (40.0%) |
| 3 or 4 Children | 9 (75.0%) | 3 (25.0%) |
| 5 or more Children | 0 (0.0%) | 0 (0.0%) |
| Total | 58 (75.3%) | 19 (24.7%) |
Income Below Poverty Among Single-Parent Households in West City
According to the poverty data in West City, 100.0% or 7 single-father households and 20.5% or 15 single-mother households are living below the poverty line. Among single-father households, those with 1 or 2 children have the highest poverty rate, with 7 households (100.0%) experiencing poverty. Likewise, among single-mother households, those with 5 or more children have the highest poverty rate, with 7 households (100.0%) falling below the poverty line.
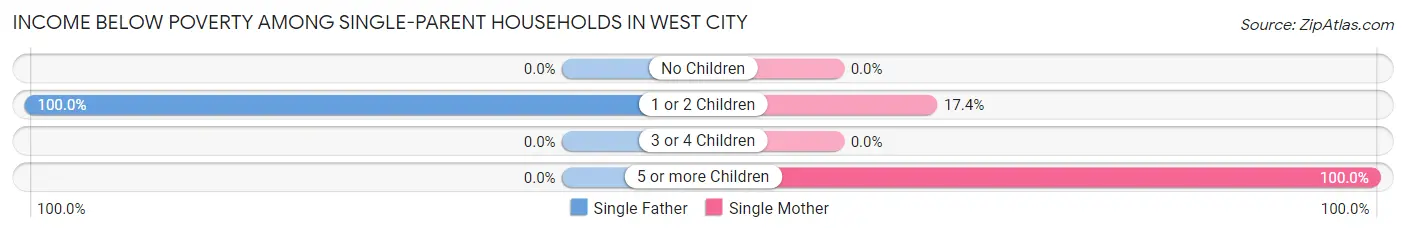
| Children | Single Father | Single Mother |
| No Children | 0 (0.0%) | 0 (0.0%) |
| 1 or 2 Children | 7 (100.0%) | 8 (17.4%) |
| 3 or 4 Children | 0 (0.0%) | 0 (0.0%) |
| 5 or more Children | 0 (0.0%) | 7 (100.0%) |
| Total | 7 (100.0%) | 15 (20.5%) |
Income Below Poverty Among Married-Couple vs Single-Parent Households in West City
The poverty data for West City shows that 19 of the married-couple family households (24.7%) and 22 of the single-parent households (27.5%) are living below the poverty level. Within the married-couple family households, those with 1 or 2 children have the highest poverty rate, with 4 households (40.0%) falling below the poverty line. Among the single-parent households, those with 5 or more children have the highest poverty rate, with 7 household (100.0%) living below poverty.
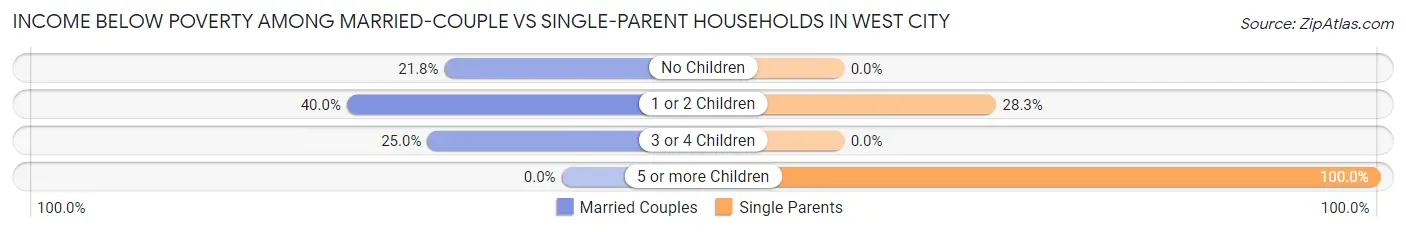
| Children | Married-Couple Families | Single-Parent Households |
| No Children | 12 (21.8%) | 0 (0.0%) |
| 1 or 2 Children | 4 (40.0%) | 15 (28.3%) |
| 3 or 4 Children | 3 (25.0%) | 0 (0.0%) |
| 5 or more Children | 0 (0.0%) | 7 (100.0%) |
| Total | 19 (24.7%) | 22 (27.5%) |
Race in West City
The most populous races in West City are White / Caucasian (610 | 95.3%), Two or more Races (20 | 3.1%), and Hispanic or Latino (16 | 2.5%).
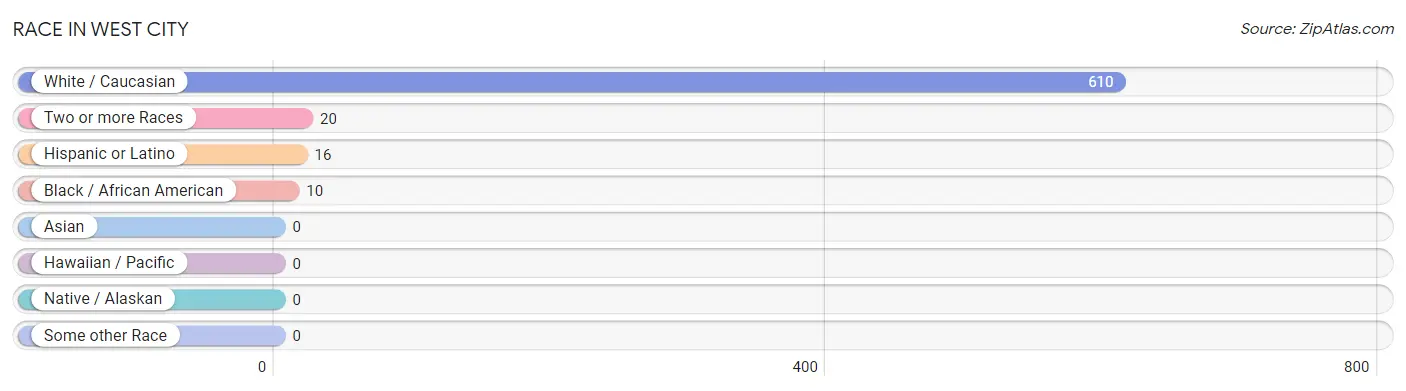
| Race | # Population | % Population |
| Asian | 0 | 0.0% |
| Black / African American | 10 | 1.6% |
| Hawaiian / Pacific | 0 | 0.0% |
| Hispanic or Latino | 16 | 2.5% |
| Native / Alaskan | 0 | 0.0% |
| White / Caucasian | 610 | 95.3% |
| Two or more Races | 20 | 3.1% |
| Some other Race | 0 | 0.0% |
| Total | 640 | 100.0% |
Ancestry in West City
The most populous ancestries reported in West City are Irish (68 | 10.6%), German (57 | 8.9%), Italian (54 | 8.4%), American (32 | 5.0%), and Scottish (20 | 3.1%), together accounting for 36.1% of all West City residents.
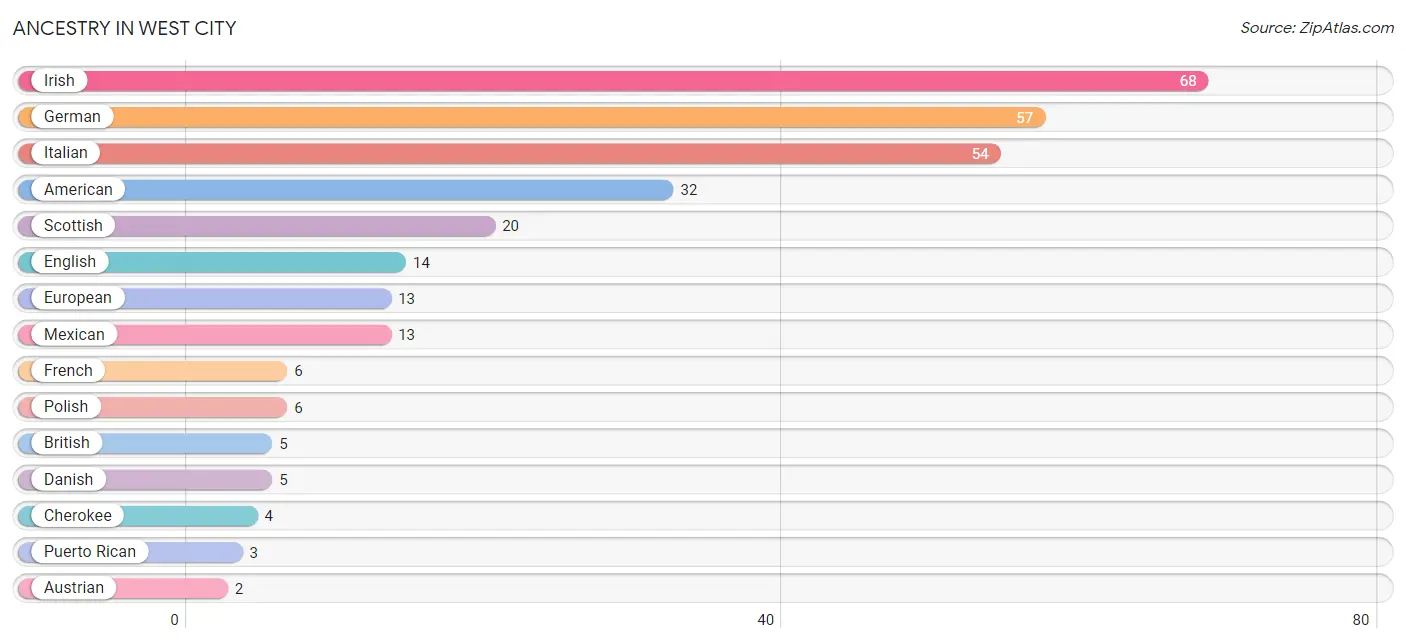
| Ancestry | # Population | % Population |
| American | 32 | 5.0% |
| Austrian | 2 | 0.3% |
| British | 5 | 0.8% |
| Cherokee | 4 | 0.6% |
| Danish | 5 | 0.8% |
| English | 14 | 2.2% |
| European | 13 | 2.0% |
| French | 6 | 0.9% |
| German | 57 | 8.9% |
| Irish | 68 | 10.6% |
| Italian | 54 | 8.4% |
| Mexican | 13 | 2.0% |
| Polish | 6 | 0.9% |
| Puerto Rican | 3 | 0.5% |
| Scottish | 20 | 3.1% |
| Welsh | 2 | 0.3% | View All 16 Rows |
Immigrants in West City
The most numerous immigrant groups reported in West City came from Central America (4 | 0.6%), Latin America (4 | 0.6%), Mexico (4 | 0.6%), Europe (2 | 0.3%), and Germany (2 | 0.3%), together accounting for 2.5% of all West City residents.
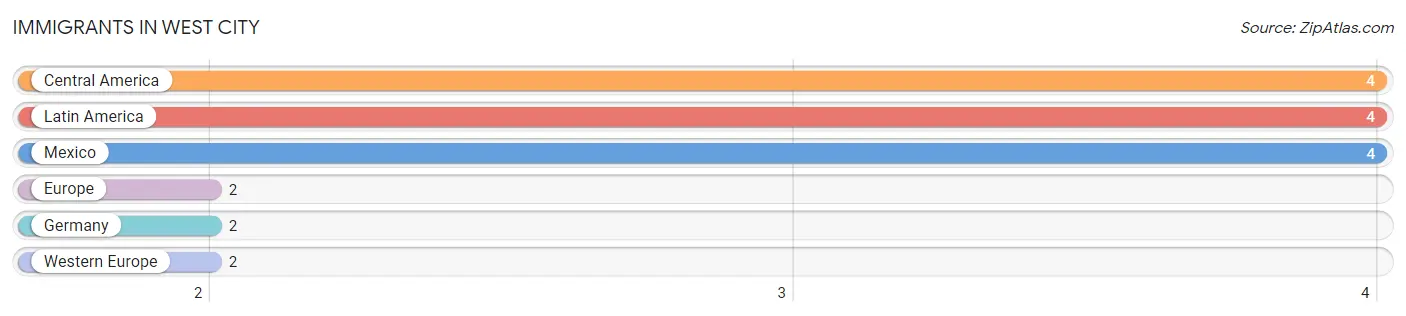
| Immigration Origin | # Population | % Population |
| Central America | 4 | 0.6% |
| Europe | 2 | 0.3% |
| Germany | 2 | 0.3% |
| Latin America | 4 | 0.6% |
| Mexico | 4 | 0.6% |
| Western Europe | 2 | 0.3% | View All 6 Rows |
Sex and Age in West City
Sex and Age in West City
The most populous age groups in West City are 5 to 9 Years (39 | 12.1%) for men and 20 to 24 Years (32 | 10.1%) for women.
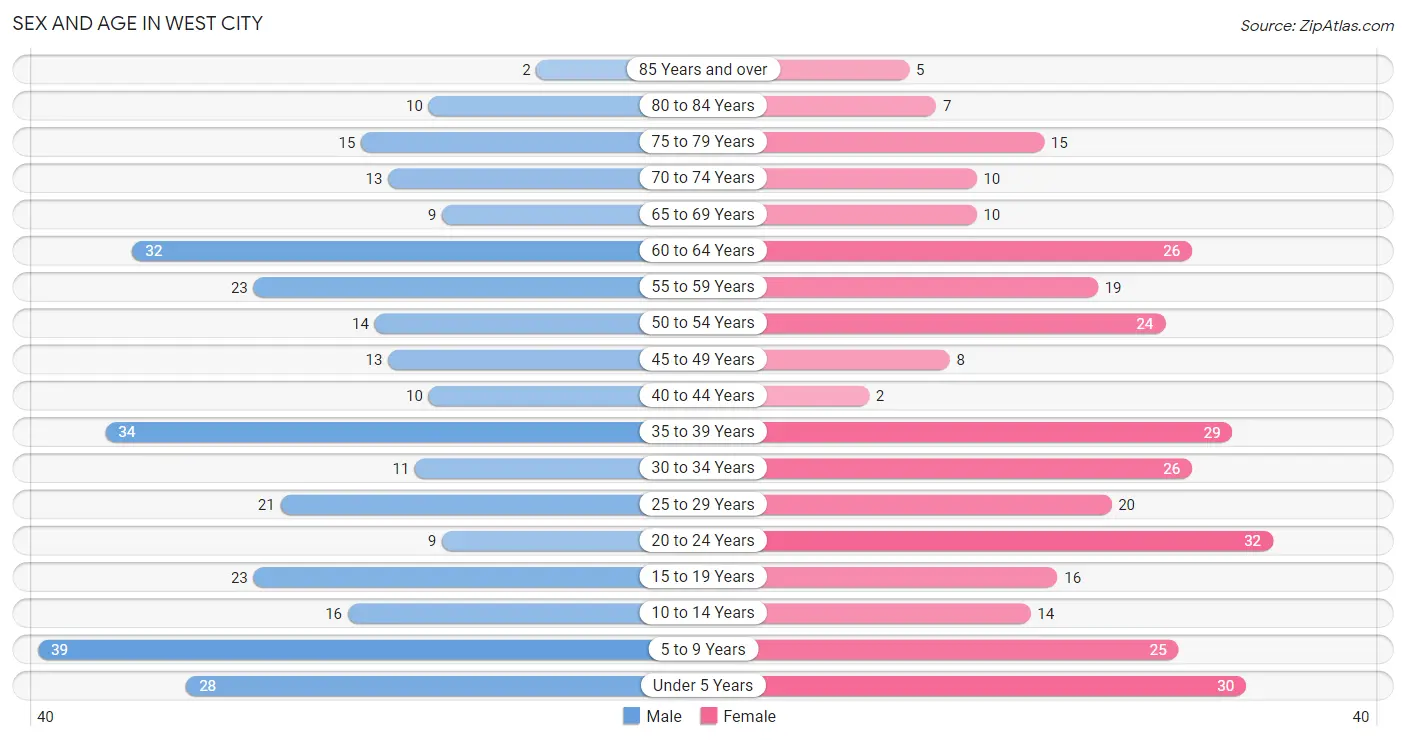
| Age Bracket | Male | Female |
| Under 5 Years | 28 (8.7%) | 30 (9.4%) |
| 5 to 9 Years | 39 (12.1%) | 25 (7.9%) |
| 10 to 14 Years | 16 (5.0%) | 14 (4.4%) |
| 15 to 19 Years | 23 (7.1%) | 16 (5.0%) |
| 20 to 24 Years | 9 (2.8%) | 32 (10.1%) |
| 25 to 29 Years | 21 (6.5%) | 20 (6.3%) |
| 30 to 34 Years | 11 (3.4%) | 26 (8.2%) |
| 35 to 39 Years | 34 (10.6%) | 29 (9.1%) |
| 40 to 44 Years | 10 (3.1%) | 2 (0.6%) |
| 45 to 49 Years | 13 (4.0%) | 8 (2.5%) |
| 50 to 54 Years | 14 (4.3%) | 24 (7.5%) |
| 55 to 59 Years | 23 (7.1%) | 19 (6.0%) |
| 60 to 64 Years | 32 (9.9%) | 26 (8.2%) |
| 65 to 69 Years | 9 (2.8%) | 10 (3.1%) |
| 70 to 74 Years | 13 (4.0%) | 10 (3.1%) |
| 75 to 79 Years | 15 (4.7%) | 15 (4.7%) |
| 80 to 84 Years | 10 (3.1%) | 7 (2.2%) |
| 85 Years and over | 2 (0.6%) | 5 (1.6%) |
| Total | 322 (100.0%) | 318 (100.0%) |
Families and Households in West City
Median Family Size in West City
The median family size in West City is 3.04 persons per family, with married-couple families (77 | 49.0%) accounting for the largest median family size of 3.25 persons per family. On the other hand, single male/father families (7 | 4.5%) represent the smallest median family size with 1.86 persons per family.
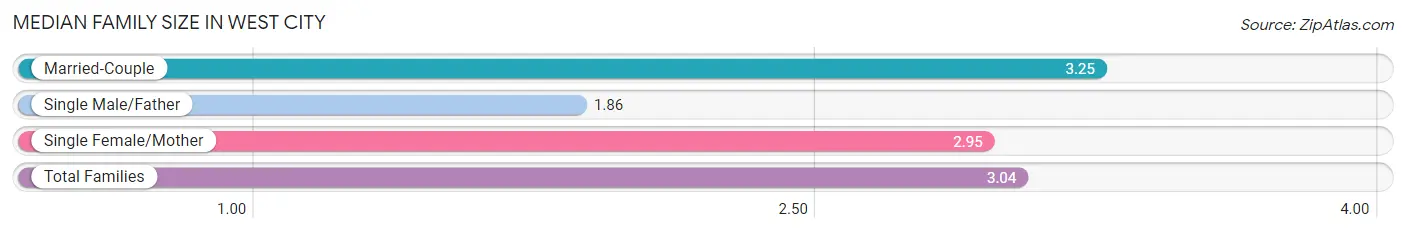
| Family Type | # Families | Family Size |
| Married-Couple | 77 (49.0%) | 3.25 |
| Single Male/Father | 7 (4.5%) | 1.86 |
| Single Female/Mother | 73 (46.5%) | 2.95 |
| Total Families | 157 (100.0%) | 3.04 |
Median Household Size in West City
The median household size in West City is 2.45 persons per household, with married-couple households (77 | 29.5%) accounting for the largest median household size of 3.29 persons per household. non-family households (104 | 39.9%) represent the smallest median household size with 1.29 persons per household.
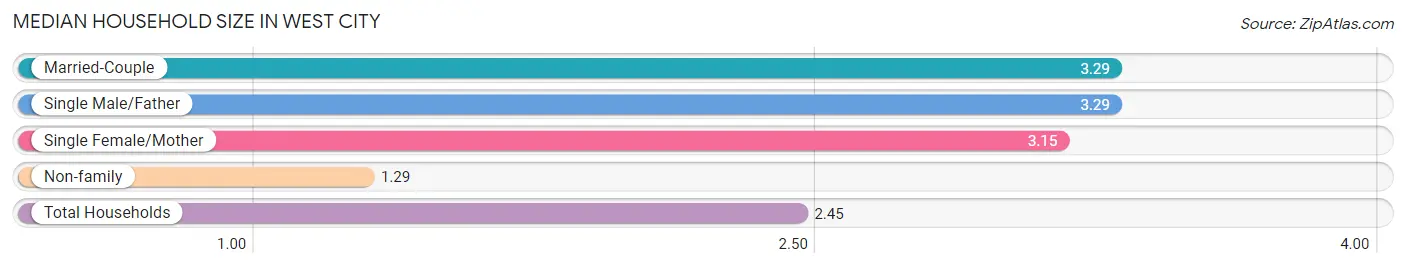
| Household Type | # Households | Household Size |
| Married-Couple | 77 (29.5%) | 3.29 |
| Single Male/Father | 7 (2.7%) | 3.29 |
| Single Female/Mother | 73 (28.0%) | 3.15 |
| Non-family | 104 (39.9%) | 1.29 |
| Total Households | 261 (100.0%) | 2.45 |
Household Size by Marriage Status in West City
Out of a total of 261 households in West City, 157 (60.2%) are family households, while 104 (39.9%) are nonfamily households. The most numerous type of family households are 2-person households, comprising 85, and the most common type of nonfamily households are 1-person households, comprising 82.
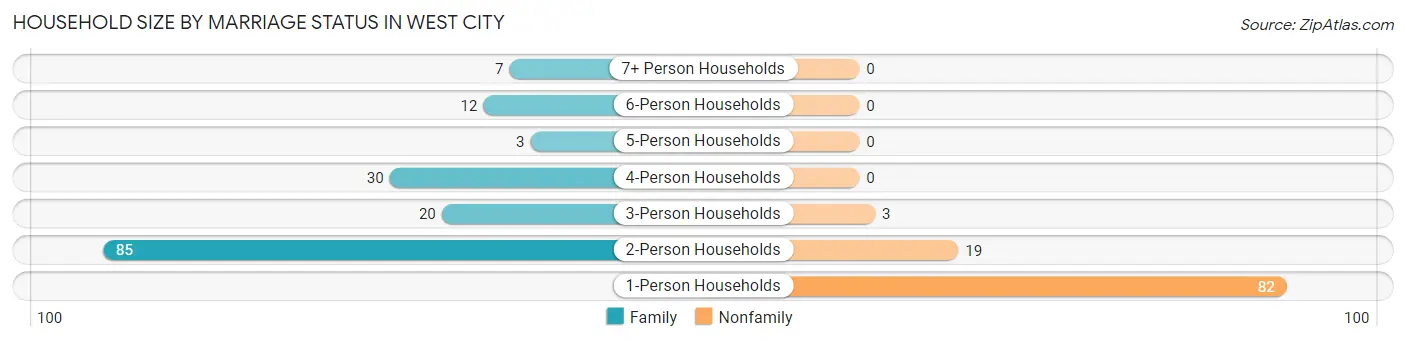
| Household Size | Family Households | Nonfamily Households |
| 1-Person Households | - | 82 (31.4%) |
| 2-Person Households | 85 (32.6%) | 19 (7.3%) |
| 3-Person Households | 20 (7.7%) | 3 (1.1%) |
| 4-Person Households | 30 (11.5%) | 0 (0.0%) |
| 5-Person Households | 3 (1.1%) | 0 (0.0%) |
| 6-Person Households | 12 (4.6%) | 0 (0.0%) |
| 7+ Person Households | 7 (2.7%) | 0 (0.0%) |
| Total | 157 (60.2%) | 104 (39.9%) |
Female Fertility in West City
Fertility by Age in West City
Average fertility rate in West City is 113.0 births per 1,000 women. Women in the age bracket of 20 to 34 years have the highest fertility rate with 192.0 births per 1,000 women. Women in the age bracket of 20 to 34 years acount for 100.0% of all women with births.
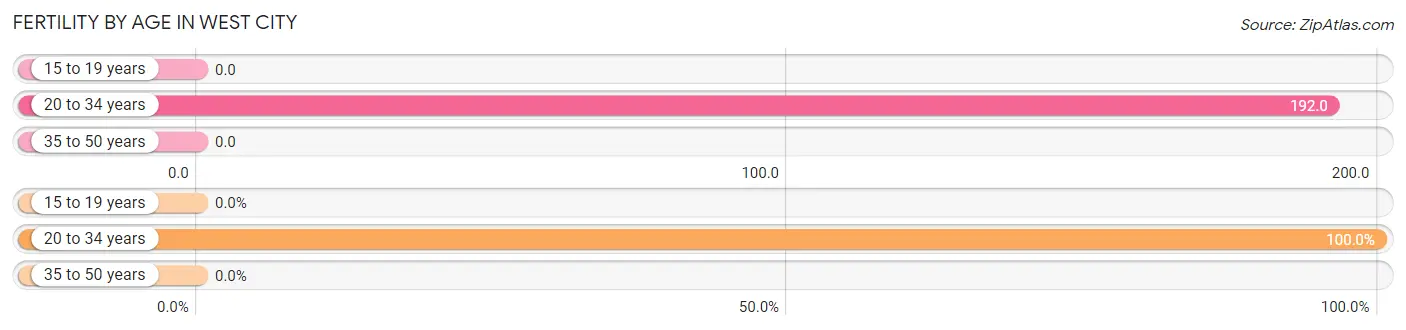
| Age Bracket | Women with Births | Births / 1,000 Women |
| 15 to 19 years | 0 (0.0%) | 0.0 |
| 20 to 34 years | 15 (100.0%) | 192.0 |
| 35 to 50 years | 0 (0.0%) | 0.0 |
| Total | 15 (100.0%) | 113.0 |
Fertility by Age by Marriage Status in West City
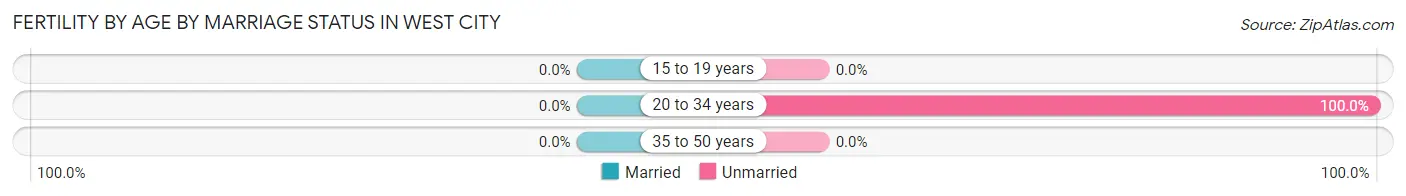
| Age Bracket | Married | Unmarried |
| 15 to 19 years | 0 (0.0%) | 0 (0.0%) |
| 20 to 34 years | 0 (0.0%) | 15 (100.0%) |
| 35 to 50 years | 0 (0.0%) | 0 (0.0%) |
| Total | 0 (0.0%) | 15 (100.0%) |
Fertility by Education in West City
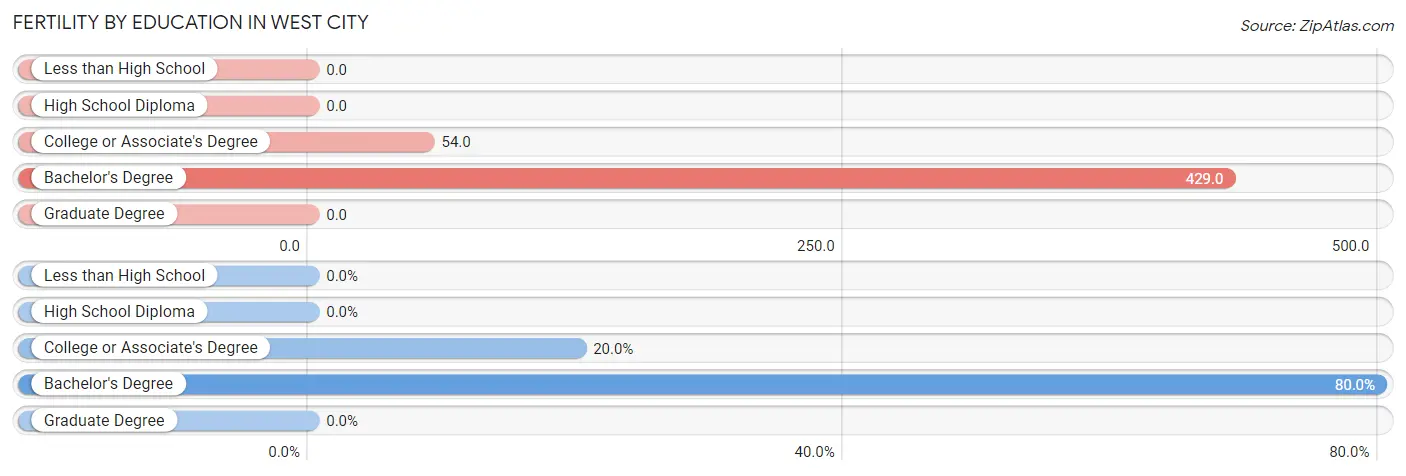
| Educational Attainment | Women with Births | Births / 1,000 Women |
| Less than High School | 0 (0.0%) | 0.0 |
| High School Diploma | 0 (0.0%) | 0.0 |
| College or Associate's Degree | 3 (20.0%) | 54.0 |
| Bachelor's Degree | 12 (80.0%) | 429.0 |
| Graduate Degree | 0 (0.0%) | 0.0 |
| Total | 15 (100.0%) | 113.0 |
Fertility by Education by Marriage Status in West City
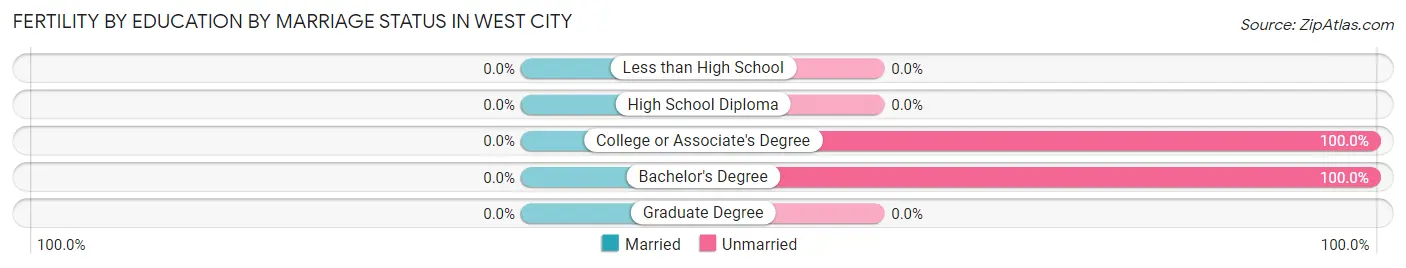
| Educational Attainment | Married | Unmarried |
| Less than High School | 0 (0.0%) | 0 (0.0%) |
| High School Diploma | 0 (0.0%) | 0 (0.0%) |
| College or Associate's Degree | 0 (0.0%) | 3 (100.0%) |
| Bachelor's Degree | 0 (0.0%) | 12 (100.0%) |
| Graduate Degree | 0 (0.0%) | 0 (0.0%) |
| Total | 0 (0.0%) | 15 (100.0%) |
Employment Characteristics in West City
Employment by Class of Employer in West City
Among the 241 employed individuals in West City, private company employees (165 | 68.5%), local government employees (26 | 10.8%), and state government employees (18 | 7.5%) make up the most common classes of employment.
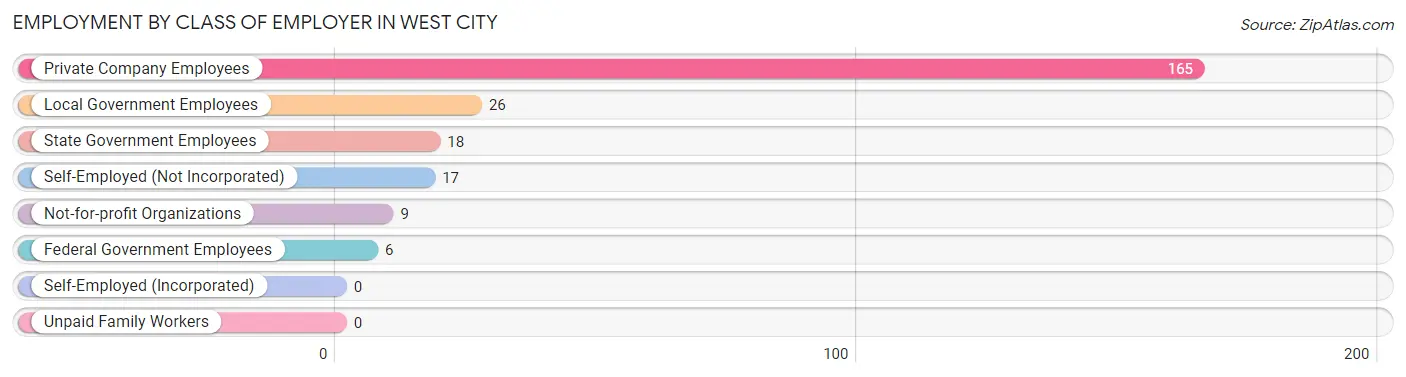
| Employer Class | # Employees | % Employees |
| Private Company Employees | 165 | 68.5% |
| Self-Employed (Incorporated) | 0 | 0.0% |
| Self-Employed (Not Incorporated) | 17 | 7.0% |
| Not-for-profit Organizations | 9 | 3.7% |
| Local Government Employees | 26 | 10.8% |
| State Government Employees | 18 | 7.5% |
| Federal Government Employees | 6 | 2.5% |
| Unpaid Family Workers | 0 | 0.0% |
| Total | 241 | 100.0% |
Employment Status by Age in West City
According to the labor force statistics for West City, out of the total population over 16 years of age (471), 57.7% or 272 individuals are in the labor force, with 7.0% or 19 of them unemployed. The age group with the highest labor force participation rate is 25 to 29 years, with 100.0% or 41 individuals in the labor force. Within the labor force, the 25 to 29 years age range has the highest percentage of unemployed individuals, with 36.6% or 15 of them being unemployed.
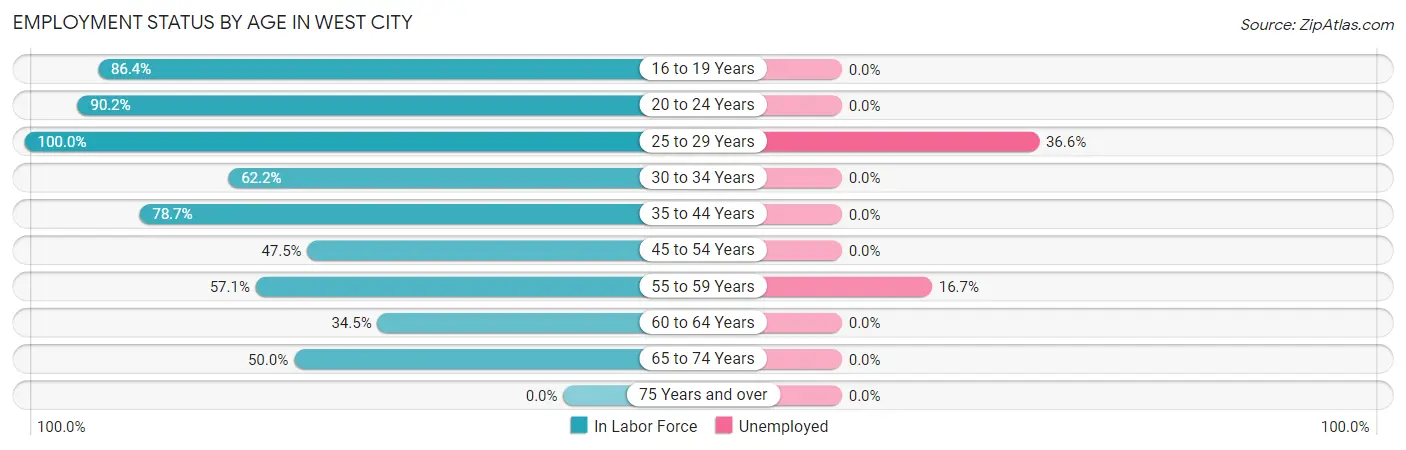
| Age Bracket | In Labor Force | Unemployed |
| 16 to 19 Years | 19 (86.4%) | 0 (0.0%) |
| 20 to 24 Years | 37 (90.2%) | 0 (0.0%) |
| 25 to 29 Years | 41 (100.0%) | 15 (36.6%) |
| 30 to 34 Years | 23 (62.2%) | 0 (0.0%) |
| 35 to 44 Years | 59 (78.7%) | 0 (0.0%) |
| 45 to 54 Years | 28 (47.5%) | 0 (0.0%) |
| 55 to 59 Years | 24 (57.1%) | 4 (16.7%) |
| 60 to 64 Years | 20 (34.5%) | 0 (0.0%) |
| 65 to 74 Years | 21 (50.0%) | 0 (0.0%) |
| 75 Years and over | 0 (0.0%) | 0 (0.0%) |
| Total | 272 (57.7%) | 19 (7.0%) |
Employment Status by Educational Attainment in West City
According to labor force statistics for West City, 62.5% of individuals (195) out of the total population between 25 and 64 years of age (312) are in the labor force, with 9.7% or 19 of them being unemployed. The group with the highest labor force participation rate are those with the educational attainment of bachelor's degree or higher, with 72.3% or 34 individuals in the labor force. Within the labor force, individuals with high school diploma education have the highest percentage of unemployment, with 27.1% or 19 of them being unemployed.
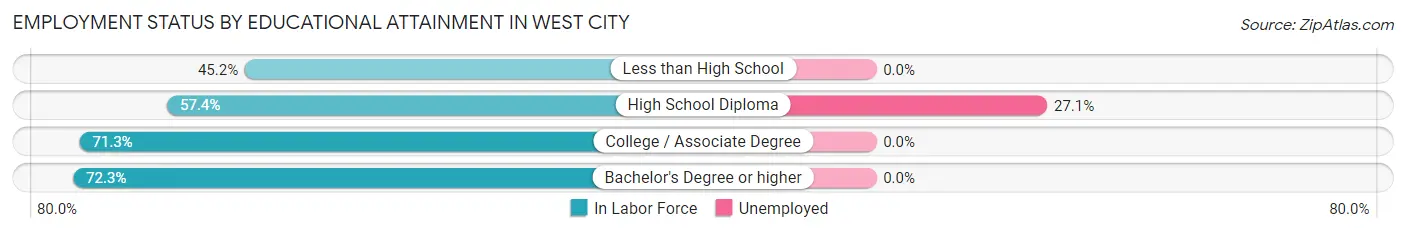
| Educational Attainment | In Labor Force | Unemployed |
| Less than High School | 19 (45.2%) | 0 (0.0%) |
| High School Diploma | 70 (57.4%) | 33 (27.1%) |
| College / Associate Degree | 72 (71.3%) | 0 (0.0%) |
| Bachelor's Degree or higher | 34 (72.3%) | 0 (0.0%) |
| Total | 195 (62.5%) | 30 (9.7%) |
Employment Occupations by Sex in West City
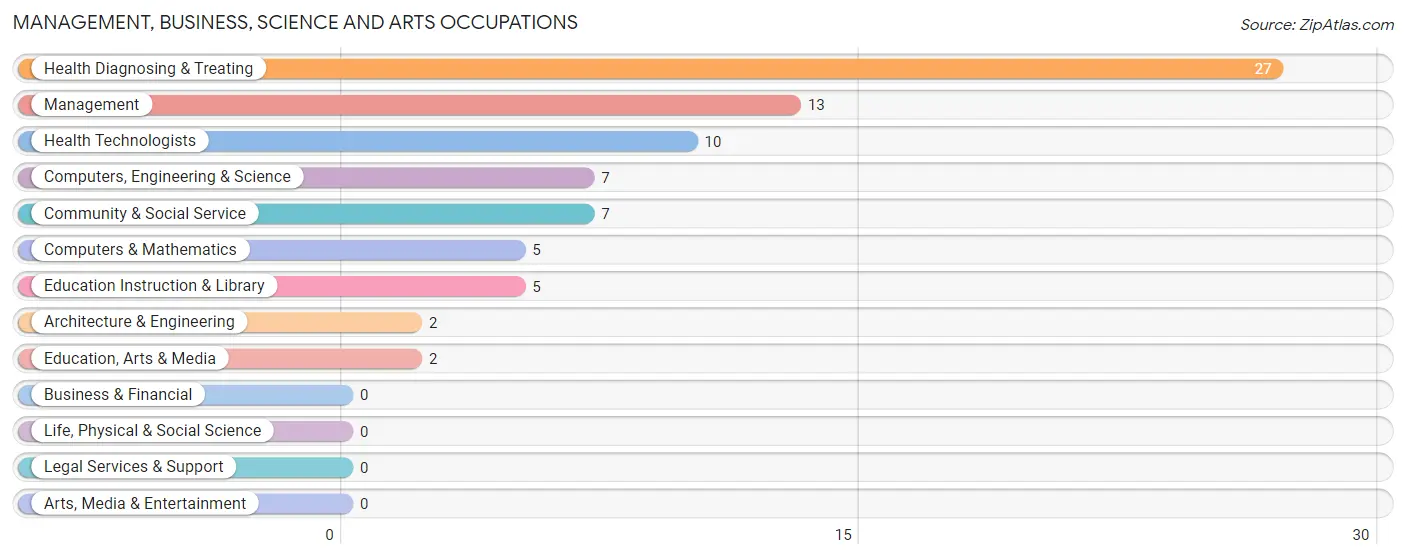
Management, Business, Science and Arts Occupations
The most common Management, Business, Science and Arts occupations in West City are Health Diagnosing & Treating (27 | 10.7%), Management (13 | 5.1%), Health Technologists (10 | 4.0%), Computers, Engineering & Science (7 | 2.8%), and Community & Social Service (7 | 2.8%).
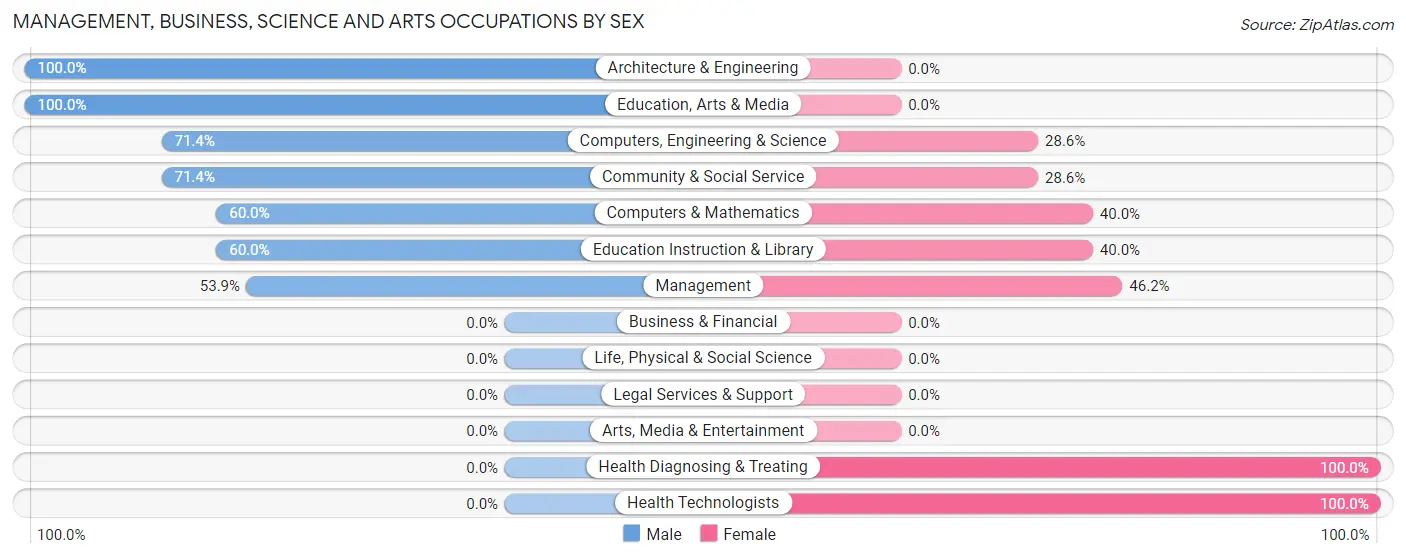
Management, Business, Science and Arts Occupations by Sex
Within the Management, Business, Science and Arts occupations in West City, the most male-oriented occupations are Architecture & Engineering (100.0%), Education, Arts & Media (100.0%), and Computers, Engineering & Science (71.4%), while the most female-oriented occupations are Health Diagnosing & Treating (100.0%), Health Technologists (100.0%), and Management (46.2%).
| Occupation | Male | Female |
| Management | 7 (53.8%) | 6 (46.2%) |
| Business & Financial | 0 (0.0%) | 0 (0.0%) |
| Computers, Engineering & Science | 5 (71.4%) | 2 (28.6%) |
| Computers & Mathematics | 3 (60.0%) | 2 (40.0%) |
| Architecture & Engineering | 2 (100.0%) | 0 (0.0%) |
| Life, Physical & Social Science | 0 (0.0%) | 0 (0.0%) |
| Community & Social Service | 5 (71.4%) | 2 (28.6%) |
| Education, Arts & Media | 2 (100.0%) | 0 (0.0%) |
| Legal Services & Support | 0 (0.0%) | 0 (0.0%) |
| Education Instruction & Library | 3 (60.0%) | 2 (40.0%) |
| Arts, Media & Entertainment | 0 (0.0%) | 0 (0.0%) |
| Health Diagnosing & Treating | 0 (0.0%) | 27 (100.0%) |
| Health Technologists | 0 (0.0%) | 10 (100.0%) |
| Total (Category) | 17 (31.5%) | 37 (68.5%) |
| Total (Overall) | 114 (45.1%) | 139 (54.9%) |
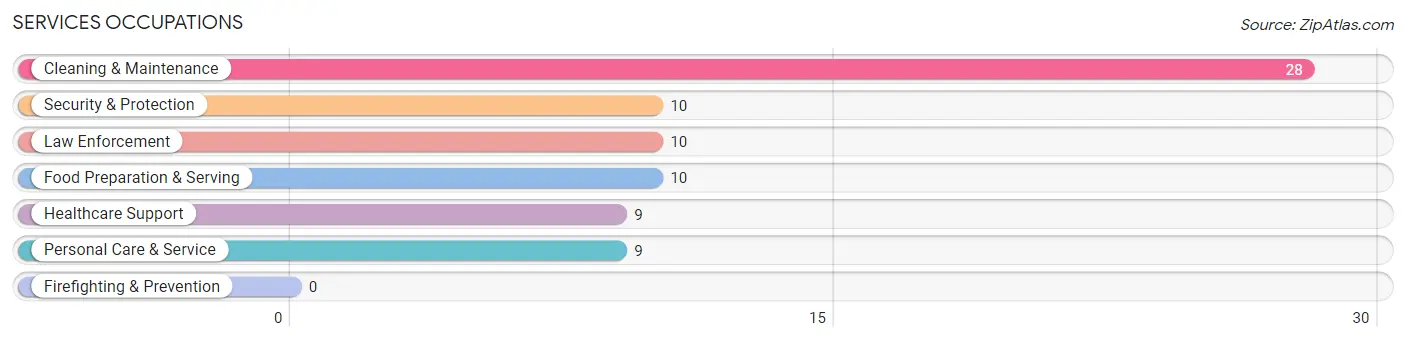
Services Occupations
The most common Services occupations in West City are Cleaning & Maintenance (28 | 11.1%), Security & Protection (10 | 4.0%), Law Enforcement (10 | 4.0%), Food Preparation & Serving (10 | 4.0%), and Healthcare Support (9 | 3.6%).
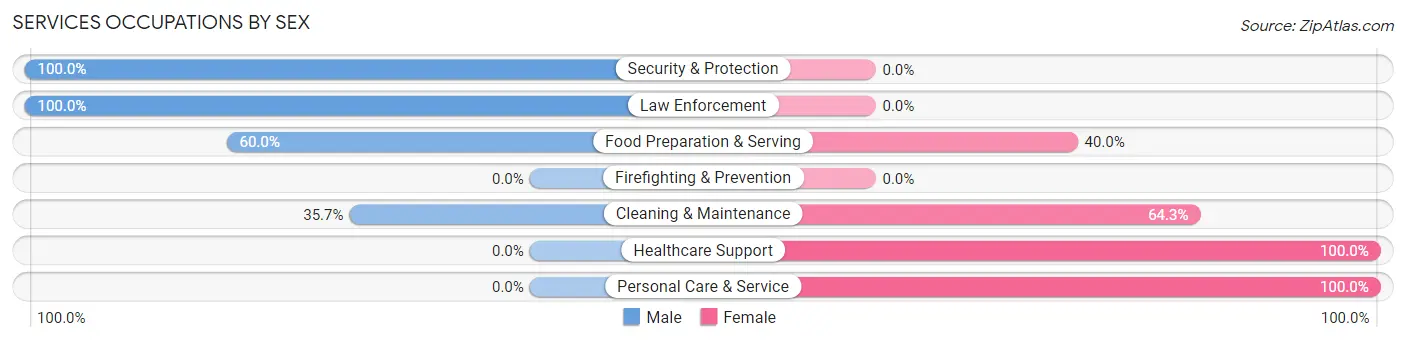
Services Occupations by Sex
Within the Services occupations in West City, the most male-oriented occupations are Security & Protection (100.0%), Law Enforcement (100.0%), and Food Preparation & Serving (60.0%), while the most female-oriented occupations are Healthcare Support (100.0%), Personal Care & Service (100.0%), and Cleaning & Maintenance (64.3%).
| Occupation | Male | Female |
| Healthcare Support | 0 (0.0%) | 9 (100.0%) |
| Security & Protection | 10 (100.0%) | 0 (0.0%) |
| Firefighting & Prevention | 0 (0.0%) | 0 (0.0%) |
| Law Enforcement | 10 (100.0%) | 0 (0.0%) |
| Food Preparation & Serving | 6 (60.0%) | 4 (40.0%) |
| Cleaning & Maintenance | 10 (35.7%) | 18 (64.3%) |
| Personal Care & Service | 0 (0.0%) | 9 (100.0%) |
| Total (Category) | 26 (39.4%) | 40 (60.6%) |
| Total (Overall) | 114 (45.1%) | 139 (54.9%) |
Sales and Office Occupations
The most common Sales and Office occupations in West City are Sales & Related (44 | 17.4%), and Office & Administration (22 | 8.7%).
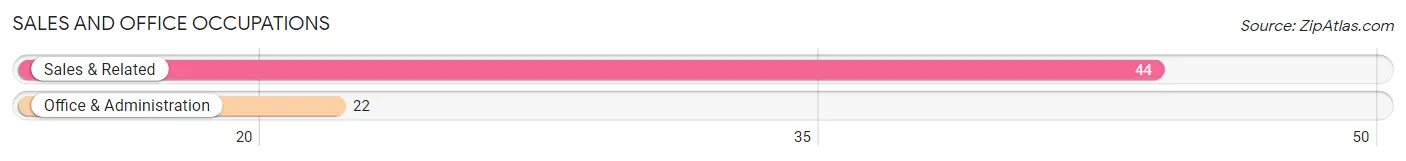
Sales and Office Occupations by Sex

| Occupation | Male | Female |
| Sales & Related | 16 (36.4%) | 28 (63.6%) |
| Office & Administration | 0 (0.0%) | 22 (100.0%) |
| Total (Category) | 16 (24.2%) | 50 (75.8%) |
| Total (Overall) | 114 (45.1%) | 139 (54.9%) |
Natural Resources, Construction and Maintenance Occupations
The most common Natural Resources, Construction and Maintenance occupations in West City are Construction & Extraction (13 | 5.1%), and Installation, Maintenance & Repair (9 | 3.6%).
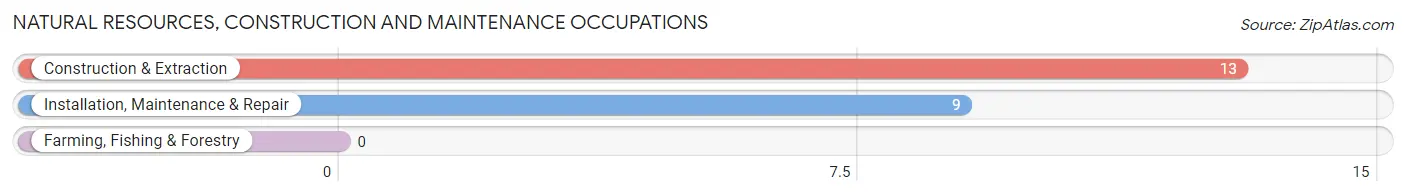
Natural Resources, Construction and Maintenance Occupations by Sex
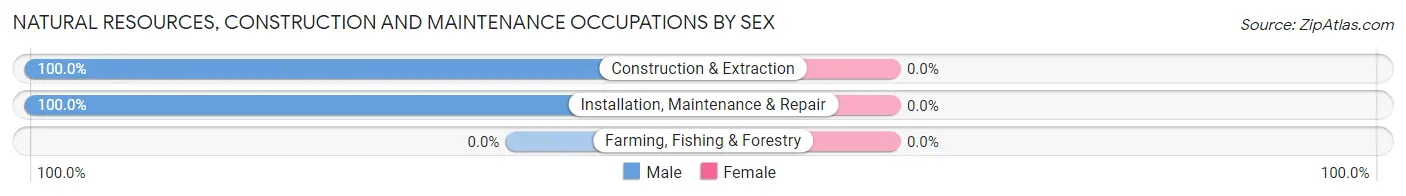
| Occupation | Male | Female |
| Farming, Fishing & Forestry | 0 (0.0%) | 0 (0.0%) |
| Construction & Extraction | 13 (100.0%) | 0 (0.0%) |
| Installation, Maintenance & Repair | 9 (100.0%) | 0 (0.0%) |
| Total (Category) | 22 (100.0%) | 0 (0.0%) |
| Total (Overall) | 114 (45.1%) | 139 (54.9%) |
Production, Transportation and Moving Occupations
The most common Production, Transportation and Moving occupations in West City are Material Moving (19 | 7.5%), Production (18 | 7.1%), and Transportation (8 | 3.2%).
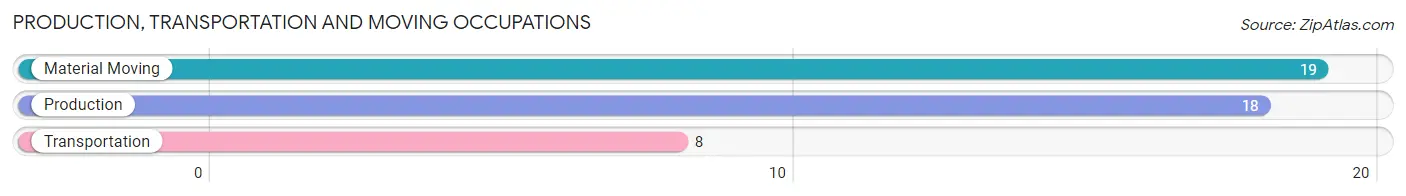
Production, Transportation and Moving Occupations by Sex
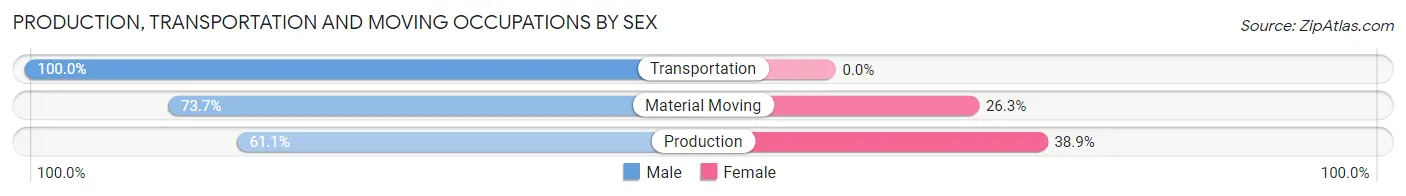
| Occupation | Male | Female |
| Production | 11 (61.1%) | 7 (38.9%) |
| Transportation | 8 (100.0%) | 0 (0.0%) |
| Material Moving | 14 (73.7%) | 5 (26.3%) |
| Total (Category) | 33 (73.3%) | 12 (26.7%) |
| Total (Overall) | 114 (45.1%) | 139 (54.9%) |
Employment Industries by Sex in West City
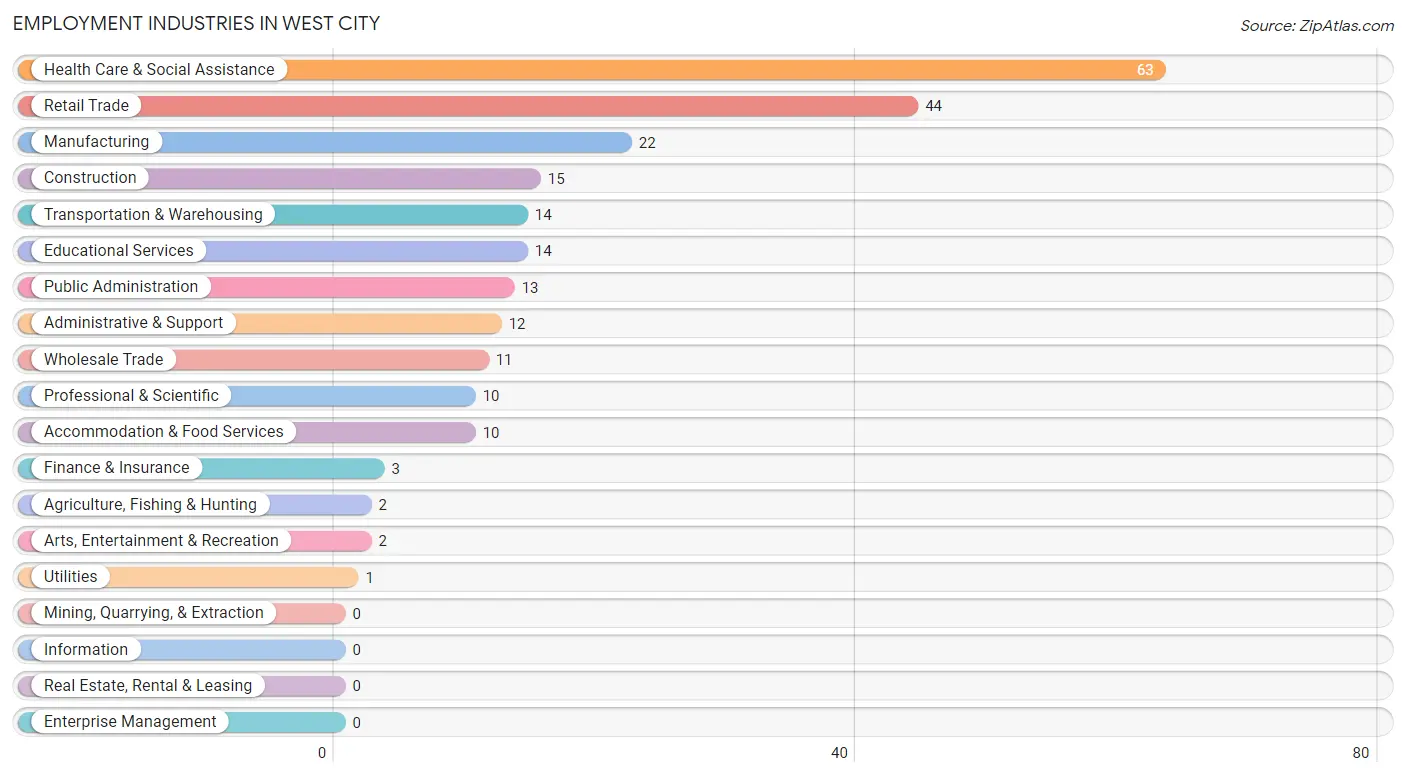
Employment Industries in West City
The major employment industries in West City include Health Care & Social Assistance (63 | 24.9%), Retail Trade (44 | 17.4%), Manufacturing (22 | 8.7%), Construction (15 | 5.9%), and Transportation & Warehousing (14 | 5.5%).
Employment Industries by Sex in West City
The West City industries that see more men than women are Agriculture, Fishing & Hunting (100.0%), Construction (100.0%), and Wholesale Trade (100.0%), whereas the industries that tend to have a higher number of women are Health Care & Social Assistance (100.0%), Arts, Entertainment & Recreation (100.0%), and Educational Services (78.6%).
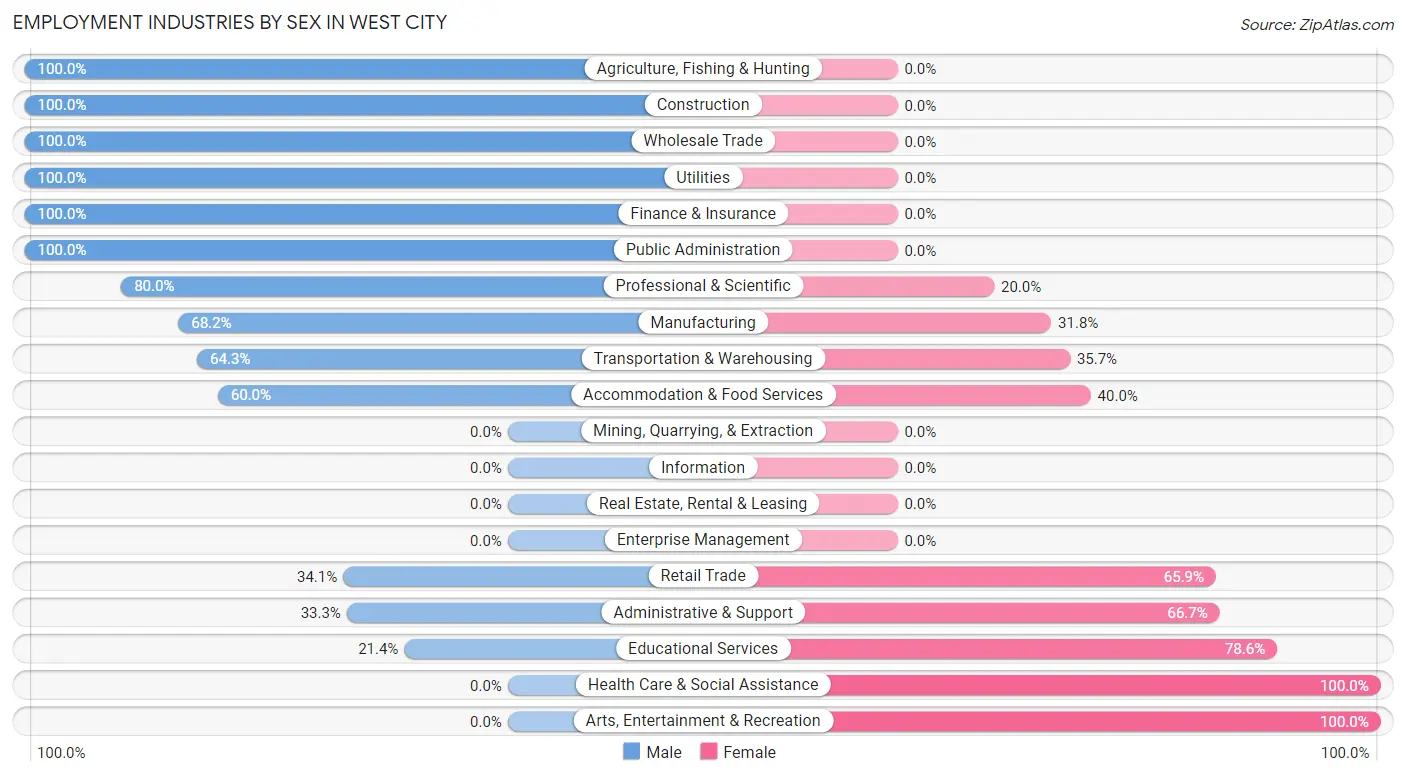
| Industry | Male | Female |
| Agriculture, Fishing & Hunting | 2 (100.0%) | 0 (0.0%) |
| Mining, Quarrying, & Extraction | 0 (0.0%) | 0 (0.0%) |
| Construction | 15 (100.0%) | 0 (0.0%) |
| Manufacturing | 15 (68.2%) | 7 (31.8%) |
| Wholesale Trade | 11 (100.0%) | 0 (0.0%) |
| Retail Trade | 15 (34.1%) | 29 (65.9%) |
| Transportation & Warehousing | 9 (64.3%) | 5 (35.7%) |
| Utilities | 1 (100.0%) | 0 (0.0%) |
| Information | 0 (0.0%) | 0 (0.0%) |
| Finance & Insurance | 3 (100.0%) | 0 (0.0%) |
| Real Estate, Rental & Leasing | 0 (0.0%) | 0 (0.0%) |
| Professional & Scientific | 8 (80.0%) | 2 (20.0%) |
| Enterprise Management | 0 (0.0%) | 0 (0.0%) |
| Administrative & Support | 4 (33.3%) | 8 (66.7%) |
| Educational Services | 3 (21.4%) | 11 (78.6%) |
| Health Care & Social Assistance | 0 (0.0%) | 63 (100.0%) |
| Arts, Entertainment & Recreation | 0 (0.0%) | 2 (100.0%) |
| Accommodation & Food Services | 6 (60.0%) | 4 (40.0%) |
| Public Administration | 13 (100.0%) | 0 (0.0%) |
| Total | 114 (45.1%) | 139 (54.9%) |
Education in West City
School Enrollment in West City
The most common levels of schooling among the 145 students in West City are elementary school (56 | 38.6%), high school (34 | 23.4%), and middle school (25 | 17.2%).
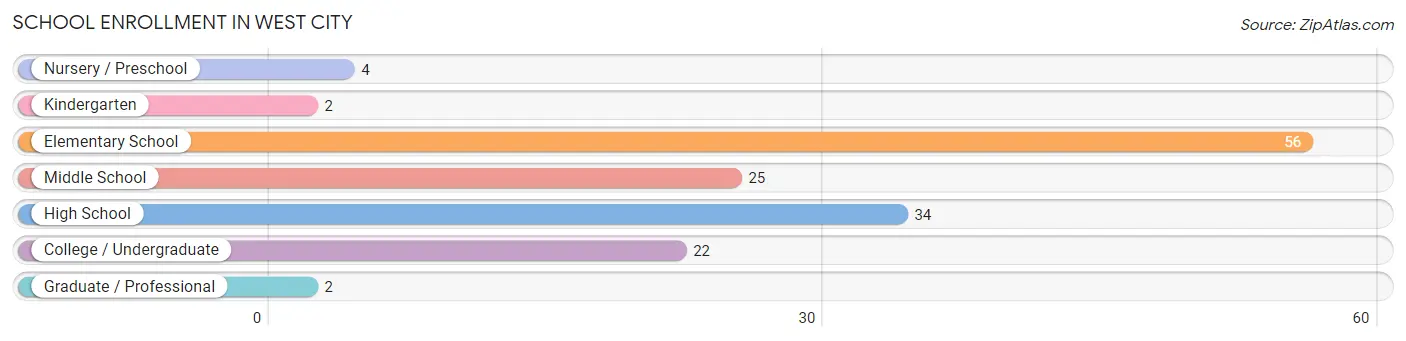
| School Level | # Students | % Students |
| Nursery / Preschool | 4 | 2.8% |
| Kindergarten | 2 | 1.4% |
| Elementary School | 56 | 38.6% |
| Middle School | 25 | 17.2% |
| High School | 34 | 23.4% |
| College / Undergraduate | 22 | 15.2% |
| Graduate / Professional | 2 | 1.4% |
| Total | 145 | 100.0% |
School Enrollment by Age by Funding Source in West City
Out of a total of 145 students who are enrolled in schools in West City, 50 (34.5%) attend a private institution, while the remaining 95 (65.5%) are enrolled in public schools. The age group of 3 to 4 year olds has the highest likelihood of being enrolled in private schools, with 4 (100.0% in the age bracket) enrolled. Conversely, the age group of 18 to 19 year olds has the lowest likelihood of being enrolled in a private school, with 11 (100.0% in the age bracket) attending a public institution.
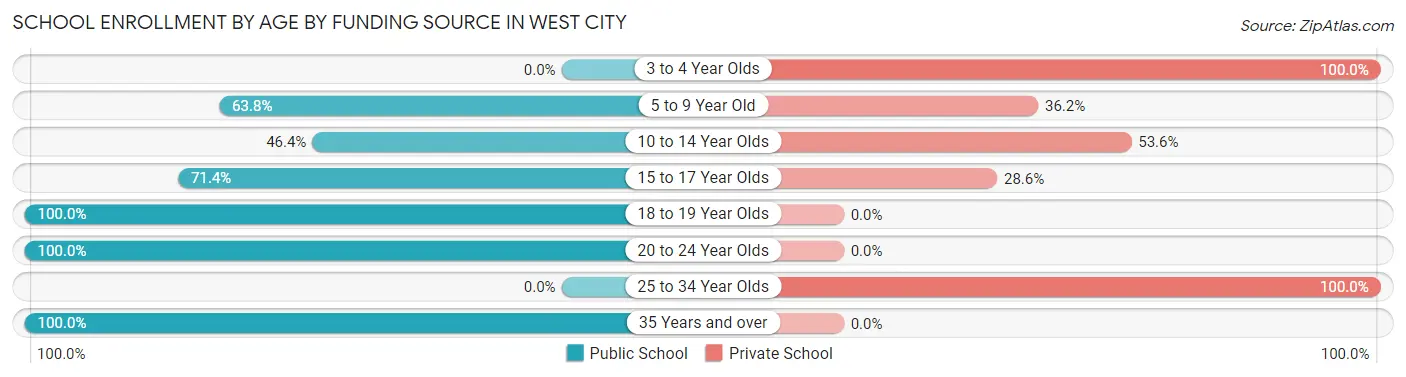
| Age Bracket | Public School | Private School |
| 3 to 4 Year Olds | 0 (0.0%) | 4 (100.0%) |
| 5 to 9 Year Old | 37 (63.8%) | 21 (36.2%) |
| 10 to 14 Year Olds | 13 (46.4%) | 15 (53.6%) |
| 15 to 17 Year Olds | 20 (71.4%) | 8 (28.6%) |
| 18 to 19 Year Olds | 11 (100.0%) | 0 (0.0%) |
| 20 to 24 Year Olds | 8 (100.0%) | 0 (0.0%) |
| 25 to 34 Year Olds | 0 (0.0%) | 2 (100.0%) |
| 35 Years and over | 6 (100.0%) | 0 (0.0%) |
| Total | 95 (65.5%) | 50 (34.5%) |
Educational Attainment by Field of Study in West City
Education (17 | 27.9%), science & technology (14 | 23.0%), business (14 | 23.0%), social sciences (6 | 9.8%), and arts & humanities (3 | 4.9%) are the most common fields of study among 61 individuals in West City who have obtained a bachelor's degree or higher.
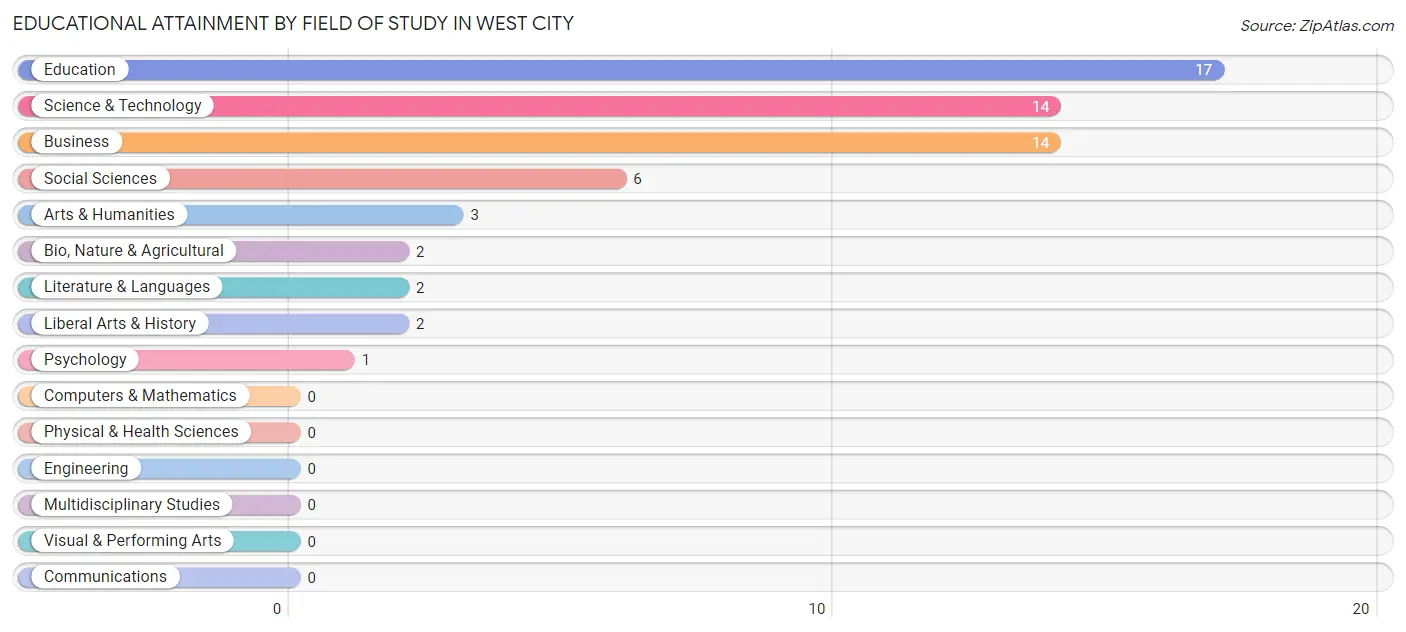
| Field of Study | # Graduates | % Graduates |
| Computers & Mathematics | 0 | 0.0% |
| Bio, Nature & Agricultural | 2 | 3.3% |
| Physical & Health Sciences | 0 | 0.0% |
| Psychology | 1 | 1.6% |
| Social Sciences | 6 | 9.8% |
| Engineering | 0 | 0.0% |
| Multidisciplinary Studies | 0 | 0.0% |
| Science & Technology | 14 | 23.0% |
| Business | 14 | 23.0% |
| Education | 17 | 27.9% |
| Literature & Languages | 2 | 3.3% |
| Liberal Arts & History | 2 | 3.3% |
| Visual & Performing Arts | 0 | 0.0% |
| Communications | 0 | 0.0% |
| Arts & Humanities | 3 | 4.9% |
| Total | 61 | 100.0% |
Transportation & Commute in West City
Vehicle Availability by Sex in West City
The most prevalent vehicle ownership categories in West City are males with 1 vehicle (48, accounting for 42.1%) and females with 1 vehicle (34, making up 37.8%).
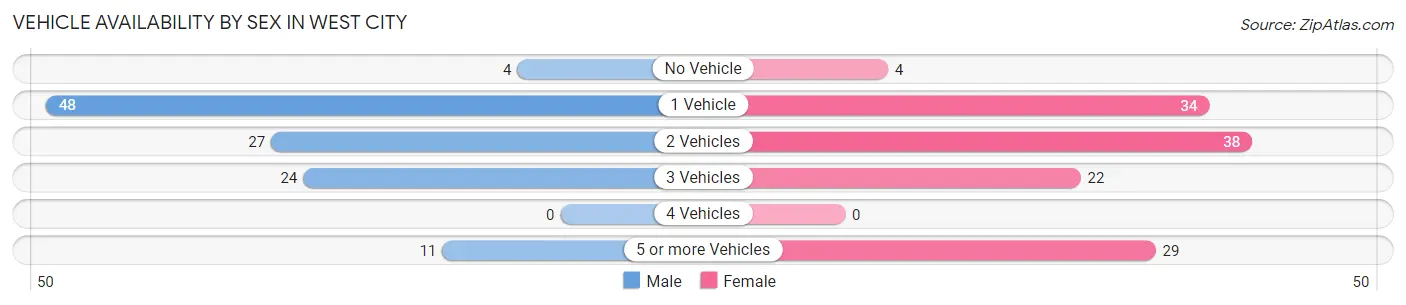
| Vehicles Available | Male | Female |
| No Vehicle | 4 (3.5%) | 4 (3.2%) |
| 1 Vehicle | 48 (42.1%) | 34 (26.8%) |
| 2 Vehicles | 27 (23.7%) | 38 (29.9%) |
| 3 Vehicles | 24 (21.0%) | 22 (17.3%) |
| 4 Vehicles | 0 (0.0%) | 0 (0.0%) |
| 5 or more Vehicles | 11 (9.7%) | 29 (22.8%) |
| Total | 114 (100.0%) | 127 (100.0%) |
Commute Time in West City
The most frequently occuring commute durations in West City are 5 to 9 minutes (56 commuters, 23.8%), 20 to 24 minutes (42 commuters, 17.9%), and 30 to 34 minutes (29 commuters, 12.3%).
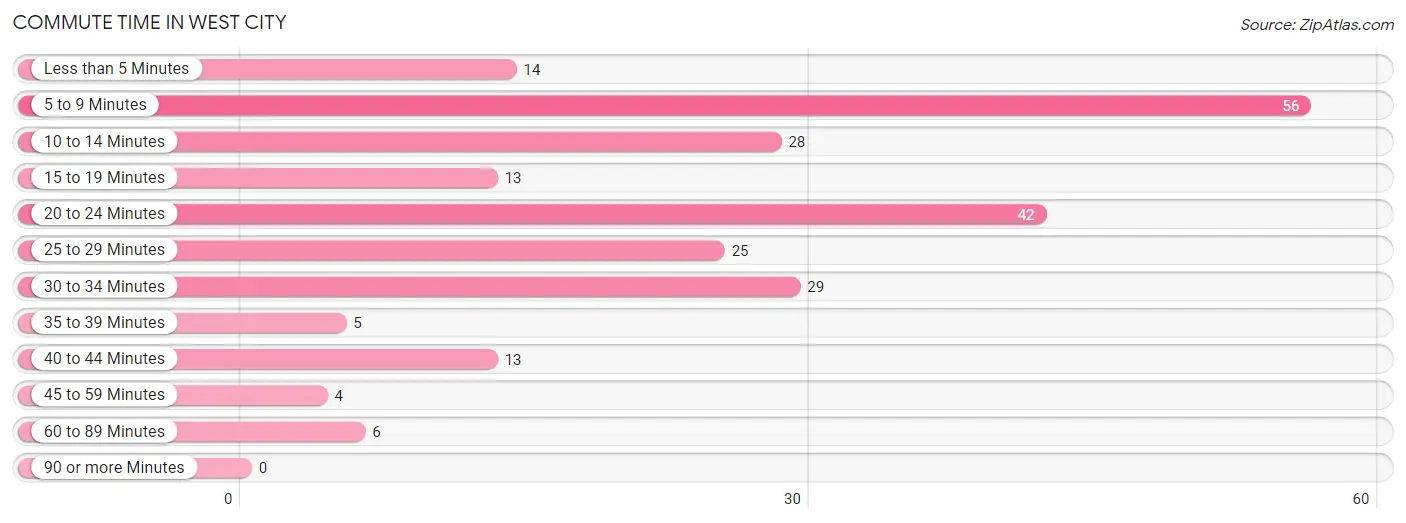
| Commute Time | # Commuters | % Commuters |
| Less than 5 Minutes | 14 | 6.0% |
| 5 to 9 Minutes | 56 | 23.8% |
| 10 to 14 Minutes | 28 | 11.9% |
| 15 to 19 Minutes | 13 | 5.5% |
| 20 to 24 Minutes | 42 | 17.9% |
| 25 to 29 Minutes | 25 | 10.6% |
| 30 to 34 Minutes | 29 | 12.3% |
| 35 to 39 Minutes | 5 | 2.1% |
| 40 to 44 Minutes | 13 | 5.5% |
| 45 to 59 Minutes | 4 | 1.7% |
| 60 to 89 Minutes | 6 | 2.5% |
| 90 or more Minutes | 0 | 0.0% |
Commute Time by Sex in West City
The most common commute times in West City are 5 to 9 minutes (38 commuters, 34.5%) for males and 20 to 24 minutes (36 commuters, 28.8%) for females.
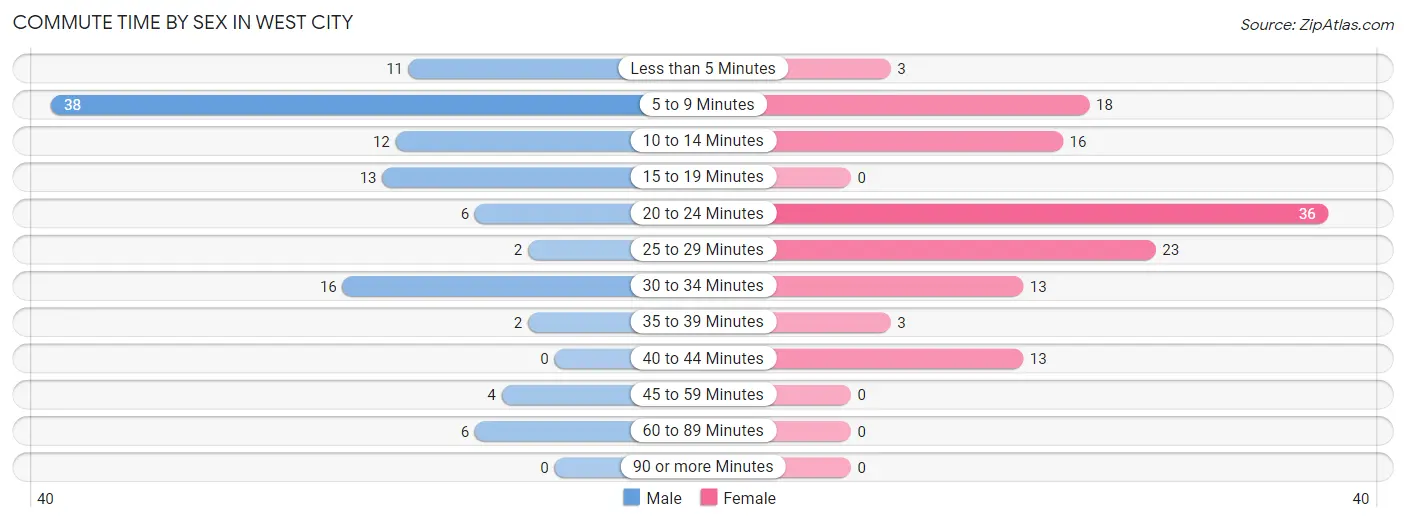
| Commute Time | Male | Female |
| Less than 5 Minutes | 11 (10.0%) | 3 (2.4%) |
| 5 to 9 Minutes | 38 (34.5%) | 18 (14.4%) |
| 10 to 14 Minutes | 12 (10.9%) | 16 (12.8%) |
| 15 to 19 Minutes | 13 (11.8%) | 0 (0.0%) |
| 20 to 24 Minutes | 6 (5.4%) | 36 (28.8%) |
| 25 to 29 Minutes | 2 (1.8%) | 23 (18.4%) |
| 30 to 34 Minutes | 16 (14.5%) | 13 (10.4%) |
| 35 to 39 Minutes | 2 (1.8%) | 3 (2.4%) |
| 40 to 44 Minutes | 0 (0.0%) | 13 (10.4%) |
| 45 to 59 Minutes | 4 (3.6%) | 0 (0.0%) |
| 60 to 89 Minutes | 6 (5.4%) | 0 (0.0%) |
| 90 or more Minutes | 0 (0.0%) | 0 (0.0%) |
Time of Departure to Work by Sex in West City
The most frequent times of departure to work in West City are 6:30 AM to 6:59 AM (25, 22.7%) for males and 7:00 AM to 7:29 AM (36, 28.8%) for females.
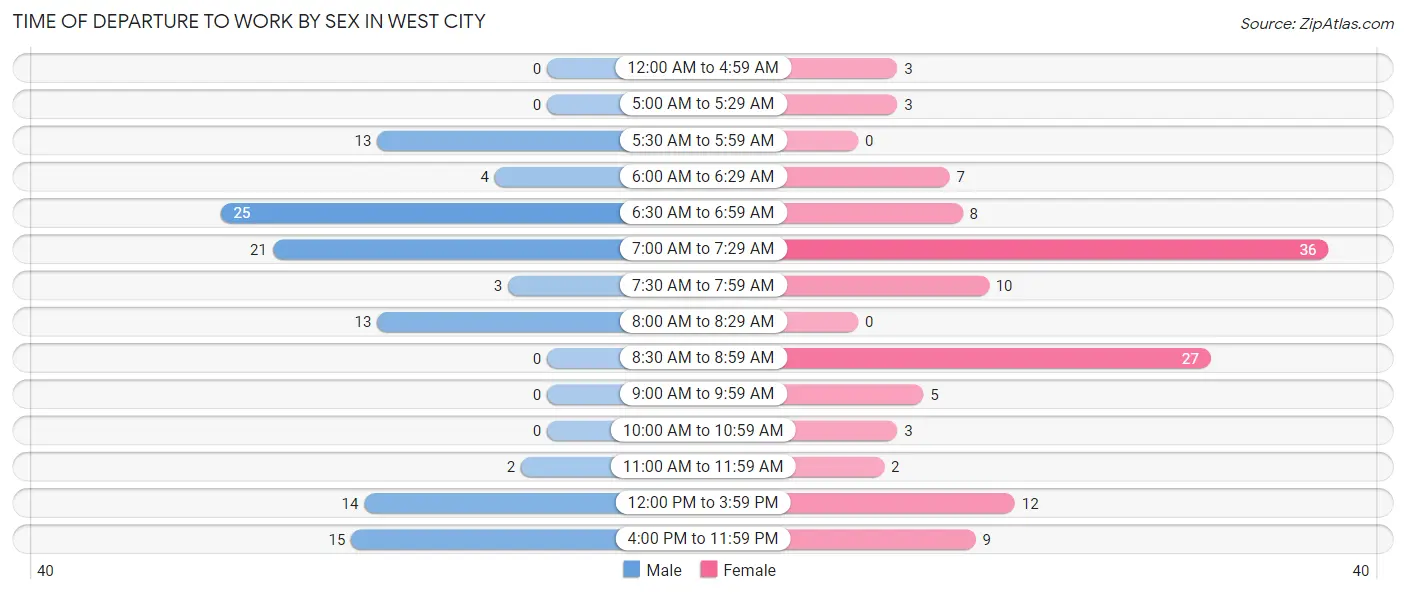
| Time of Departure | Male | Female |
| 12:00 AM to 4:59 AM | 0 (0.0%) | 3 (2.4%) |
| 5:00 AM to 5:29 AM | 0 (0.0%) | 3 (2.4%) |
| 5:30 AM to 5:59 AM | 13 (11.8%) | 0 (0.0%) |
| 6:00 AM to 6:29 AM | 4 (3.6%) | 7 (5.6%) |
| 6:30 AM to 6:59 AM | 25 (22.7%) | 8 (6.4%) |
| 7:00 AM to 7:29 AM | 21 (19.1%) | 36 (28.8%) |
| 7:30 AM to 7:59 AM | 3 (2.7%) | 10 (8.0%) |
| 8:00 AM to 8:29 AM | 13 (11.8%) | 0 (0.0%) |
| 8:30 AM to 8:59 AM | 0 (0.0%) | 27 (21.6%) |
| 9:00 AM to 9:59 AM | 0 (0.0%) | 5 (4.0%) |
| 10:00 AM to 10:59 AM | 0 (0.0%) | 3 (2.4%) |
| 11:00 AM to 11:59 AM | 2 (1.8%) | 2 (1.6%) |
| 12:00 PM to 3:59 PM | 14 (12.7%) | 12 (9.6%) |
| 4:00 PM to 11:59 PM | 15 (13.6%) | 9 (7.2%) |
| Total | 110 (100.0%) | 125 (100.0%) |
Housing Occupancy in West City
Occupancy by Ownership in West City
Of the total 261 dwellings in West City, owner-occupied units account for 157 (60.2%), while renter-occupied units make up 104 (39.9%).
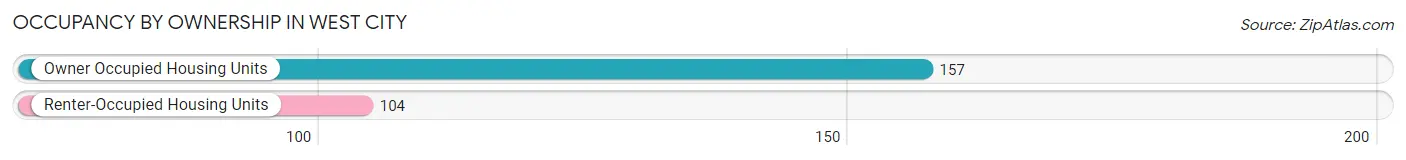
| Occupancy | # Housing Units | % Housing Units |
| Owner Occupied Housing Units | 157 | 60.2% |
| Renter-Occupied Housing Units | 104 | 39.9% |
| Total Occupied Housing Units | 261 | 100.0% |
Occupancy by Household Size in West City
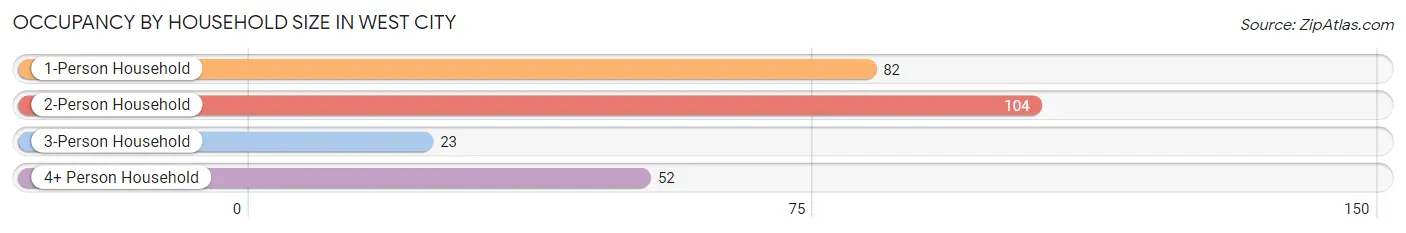
| Household Size | # Housing Units | % Housing Units |
| 1-Person Household | 82 | 31.4% |
| 2-Person Household | 104 | 39.9% |
| 3-Person Household | 23 | 8.8% |
| 4+ Person Household | 52 | 19.9% |
| Total Housing Units | 261 | 100.0% |
Occupancy by Ownership by Household Size in West City
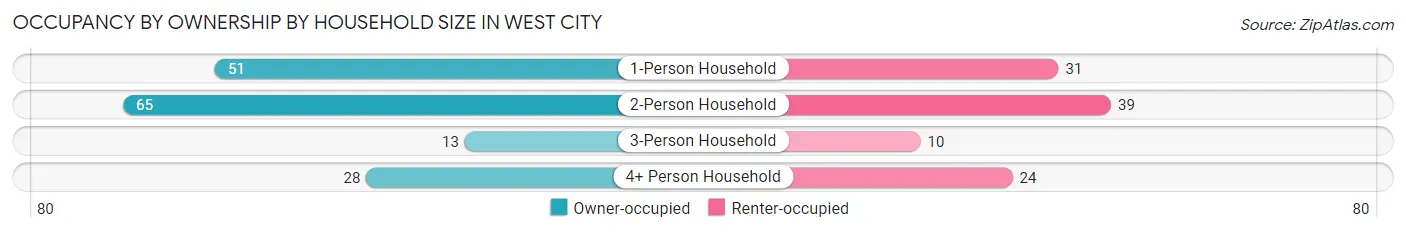
| Household Size | Owner-occupied | Renter-occupied |
| 1-Person Household | 51 (62.2%) | 31 (37.8%) |
| 2-Person Household | 65 (62.5%) | 39 (37.5%) |
| 3-Person Household | 13 (56.5%) | 10 (43.5%) |
| 4+ Person Household | 28 (53.8%) | 24 (46.2%) |
| Total Housing Units | 157 (60.2%) | 104 (39.9%) |
Occupancy by Educational Attainment in West City
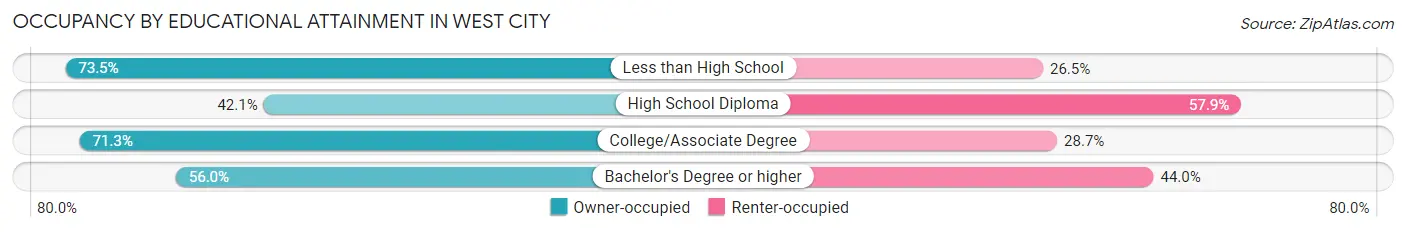
| Household Size | Owner-occupied | Renter-occupied |
| Less than High School | 25 (73.5%) | 9 (26.5%) |
| High School Diploma | 32 (42.1%) | 44 (57.9%) |
| College/Associate Degree | 72 (71.3%) | 29 (28.7%) |
| Bachelor's Degree or higher | 28 (56.0%) | 22 (44.0%) |
Occupancy by Age of Householder in West City
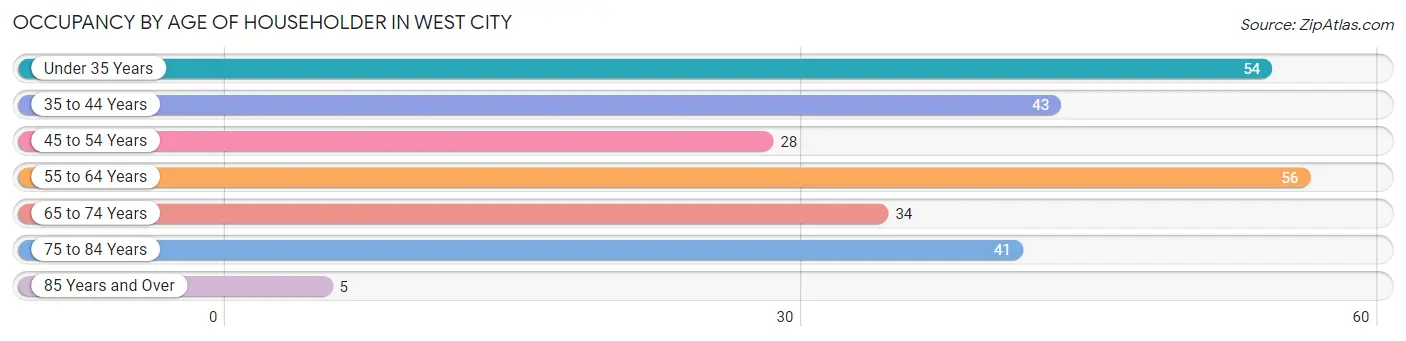
| Age Bracket | # Households | % Households |
| Under 35 Years | 54 | 20.7% |
| 35 to 44 Years | 43 | 16.5% |
| 45 to 54 Years | 28 | 10.7% |
| 55 to 64 Years | 56 | 21.5% |
| 65 to 74 Years | 34 | 13.0% |
| 75 to 84 Years | 41 | 15.7% |
| 85 Years and Over | 5 | 1.9% |
| Total | 261 | 100.0% |
Housing Finances in West City
Median Income by Occupancy in West City
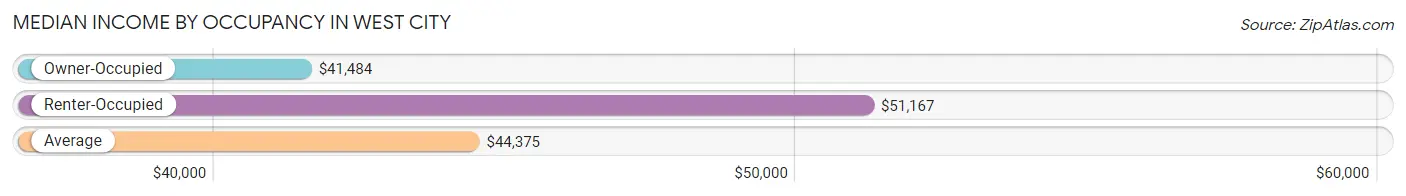
| Occupancy Type | # Households | Median Income |
| Owner-Occupied | 157 (60.2%) | $41,484 |
| Renter-Occupied | 104 (39.9%) | $51,167 |
| Average | 261 (100.0%) | $44,375 |
Occupancy by Householder Income Bracket in West City
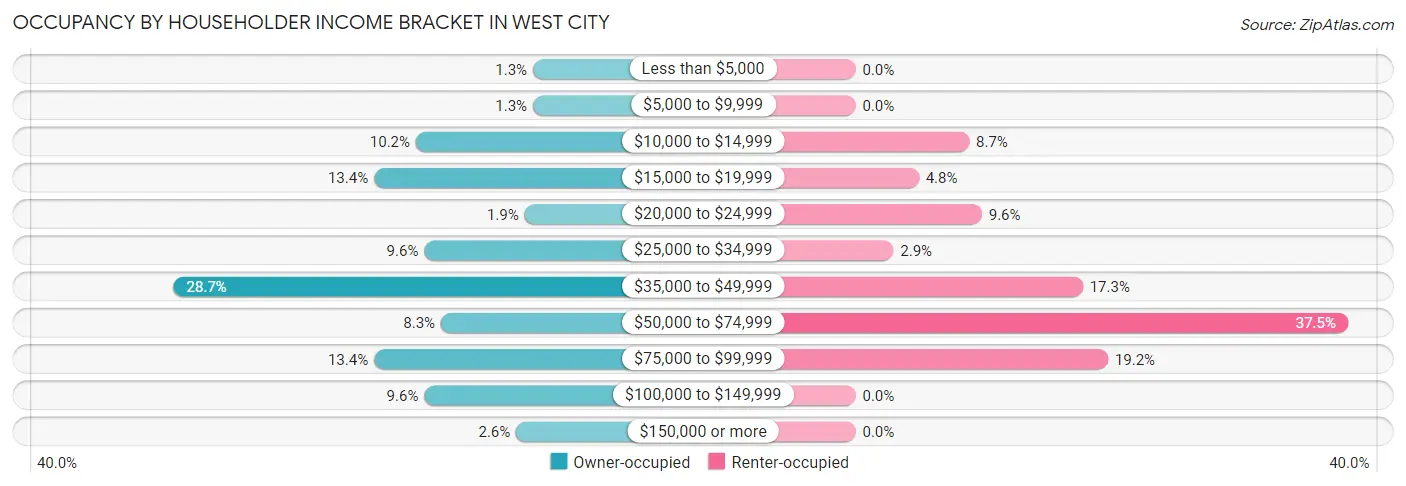
| Income Bracket | Owner-occupied | Renter-occupied |
| Less than $5,000 | 2 (1.3%) | 0 (0.0%) |
| $5,000 to $9,999 | 2 (1.3%) | 0 (0.0%) |
| $10,000 to $14,999 | 16 (10.2%) | 9 (8.6%) |
| $15,000 to $19,999 | 21 (13.4%) | 5 (4.8%) |
| $20,000 to $24,999 | 3 (1.9%) | 10 (9.6%) |
| $25,000 to $34,999 | 15 (9.6%) | 3 (2.9%) |
| $35,000 to $49,999 | 45 (28.7%) | 18 (17.3%) |
| $50,000 to $74,999 | 13 (8.3%) | 39 (37.5%) |
| $75,000 to $99,999 | 21 (13.4%) | 20 (19.2%) |
| $100,000 to $149,999 | 15 (9.6%) | 0 (0.0%) |
| $150,000 or more | 4 (2.5%) | 0 (0.0%) |
| Total | 157 (100.0%) | 104 (100.0%) |
Monthly Housing Cost Tiers in West City
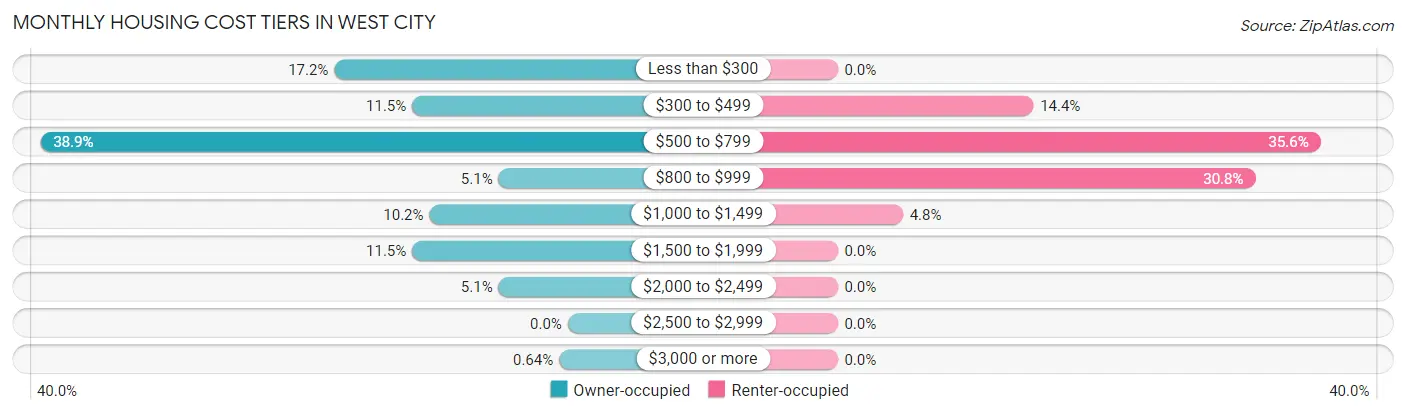
| Monthly Cost | Owner-occupied | Renter-occupied |
| Less than $300 | 27 (17.2%) | 0 (0.0%) |
| $300 to $499 | 18 (11.5%) | 15 (14.4%) |
| $500 to $799 | 61 (38.9%) | 37 (35.6%) |
| $800 to $999 | 8 (5.1%) | 32 (30.8%) |
| $1,000 to $1,499 | 16 (10.2%) | 5 (4.8%) |
| $1,500 to $1,999 | 18 (11.5%) | 0 (0.0%) |
| $2,000 to $2,499 | 8 (5.1%) | 0 (0.0%) |
| $2,500 to $2,999 | 0 (0.0%) | 0 (0.0%) |
| $3,000 or more | 1 (0.6%) | 0 (0.0%) |
| Total | 157 (100.0%) | 104 (100.0%) |
Physical Housing Characteristics in West City
Housing Structures in West City
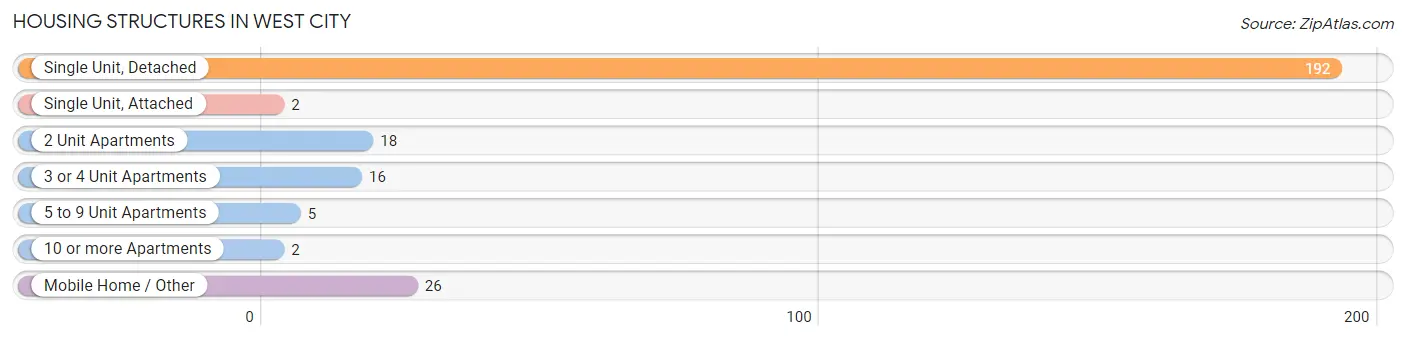
| Structure Type | # Housing Units | % Housing Units |
| Single Unit, Detached | 192 | 73.6% |
| Single Unit, Attached | 2 | 0.8% |
| 2 Unit Apartments | 18 | 6.9% |
| 3 or 4 Unit Apartments | 16 | 6.1% |
| 5 to 9 Unit Apartments | 5 | 1.9% |
| 10 or more Apartments | 2 | 0.8% |
| Mobile Home / Other | 26 | 10.0% |
| Total | 261 | 100.0% |
Housing Structures by Occupancy in West City
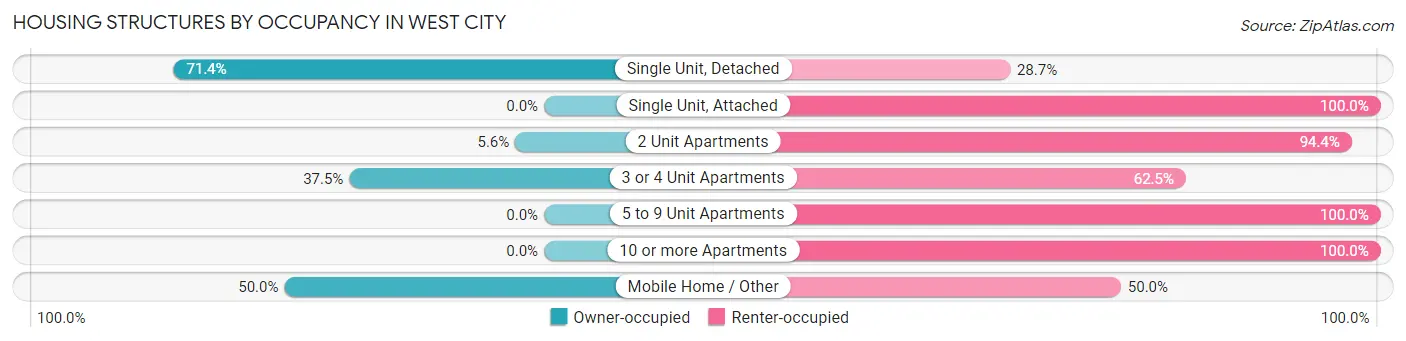
| Structure Type | Owner-occupied | Renter-occupied |
| Single Unit, Detached | 137 (71.4%) | 55 (28.6%) |
| Single Unit, Attached | 0 (0.0%) | 2 (100.0%) |
| 2 Unit Apartments | 1 (5.6%) | 17 (94.4%) |
| 3 or 4 Unit Apartments | 6 (37.5%) | 10 (62.5%) |
| 5 to 9 Unit Apartments | 0 (0.0%) | 5 (100.0%) |
| 10 or more Apartments | 0 (0.0%) | 2 (100.0%) |
| Mobile Home / Other | 13 (50.0%) | 13 (50.0%) |
| Total | 157 (60.2%) | 104 (39.9%) |
Housing Structures by Number of Rooms in West City
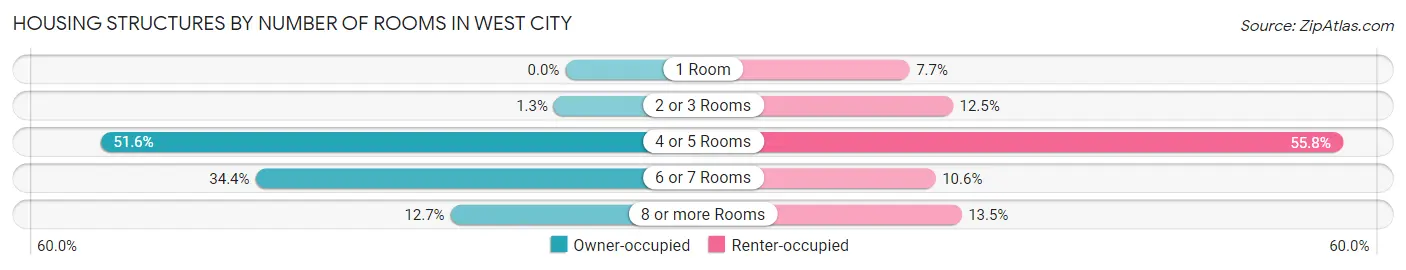
| Number of Rooms | Owner-occupied | Renter-occupied |
| 1 Room | 0 (0.0%) | 8 (7.7%) |
| 2 or 3 Rooms | 2 (1.3%) | 13 (12.5%) |
| 4 or 5 Rooms | 81 (51.6%) | 58 (55.8%) |
| 6 or 7 Rooms | 54 (34.4%) | 11 (10.6%) |
| 8 or more Rooms | 20 (12.7%) | 14 (13.5%) |
| Total | 157 (100.0%) | 104 (100.0%) |
Housing Structure by Heating Type in West City
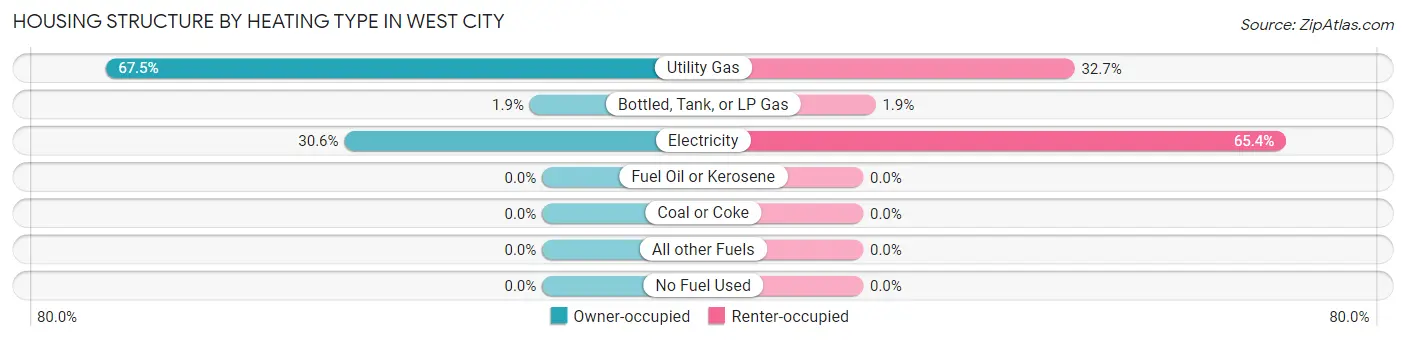
| Heating Type | Owner-occupied | Renter-occupied |
| Utility Gas | 106 (67.5%) | 34 (32.7%) |
| Bottled, Tank, or LP Gas | 3 (1.9%) | 2 (1.9%) |
| Electricity | 48 (30.6%) | 68 (65.4%) |
| Fuel Oil or Kerosene | 0 (0.0%) | 0 (0.0%) |
| Coal or Coke | 0 (0.0%) | 0 (0.0%) |
| All other Fuels | 0 (0.0%) | 0 (0.0%) |
| No Fuel Used | 0 (0.0%) | 0 (0.0%) |
| Total | 157 (100.0%) | 104 (100.0%) |
Household Vehicle Usage in West City
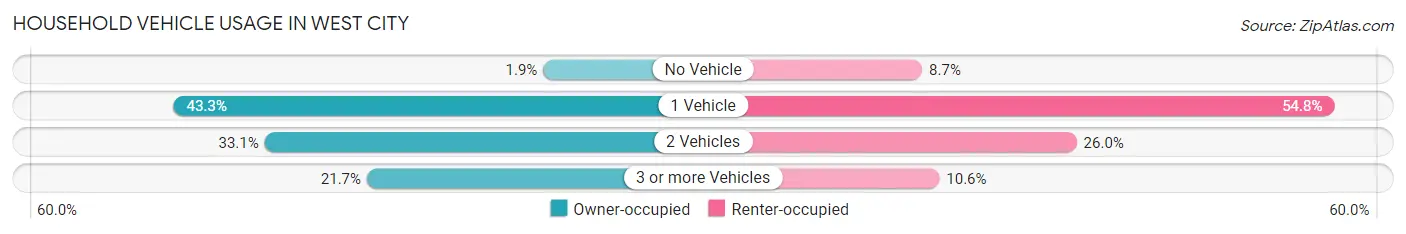
| Vehicles per Household | Owner-occupied | Renter-occupied |
| No Vehicle | 3 (1.9%) | 9 (8.6%) |
| 1 Vehicle | 68 (43.3%) | 57 (54.8%) |
| 2 Vehicles | 52 (33.1%) | 27 (26.0%) |
| 3 or more Vehicles | 34 (21.7%) | 11 (10.6%) |
| Total | 157 (100.0%) | 104 (100.0%) |
Real Estate & Mortgages in West City
Real Estate and Mortgage Overview in West City
| Characteristic | Without Mortgage | With Mortgage |
| Housing Units | 90 | 67 |
| Median Property Value | $54,400 | $113,100 |
| Median Household Income | $42,667 | $3 |
| Monthly Housing Costs | $505 | $0 |
| Real Estate Taxes | $700 | $4 |
Property Value by Mortgage Status in West City
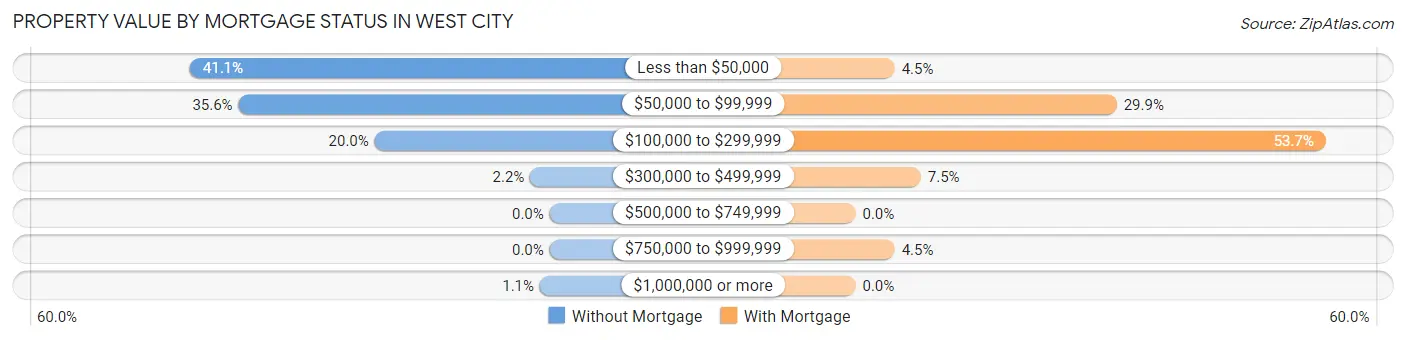
| Property Value | Without Mortgage | With Mortgage |
| Less than $50,000 | 37 (41.1%) | 3 (4.5%) |
| $50,000 to $99,999 | 32 (35.6%) | 20 (29.8%) |
| $100,000 to $299,999 | 18 (20.0%) | 36 (53.7%) |
| $300,000 to $499,999 | 2 (2.2%) | 5 (7.5%) |
| $500,000 to $749,999 | 0 (0.0%) | 0 (0.0%) |
| $750,000 to $999,999 | 0 (0.0%) | 3 (4.5%) |
| $1,000,000 or more | 1 (1.1%) | 0 (0.0%) |
| Total | 90 (100.0%) | 67 (100.0%) |
Household Income by Mortgage Status in West City
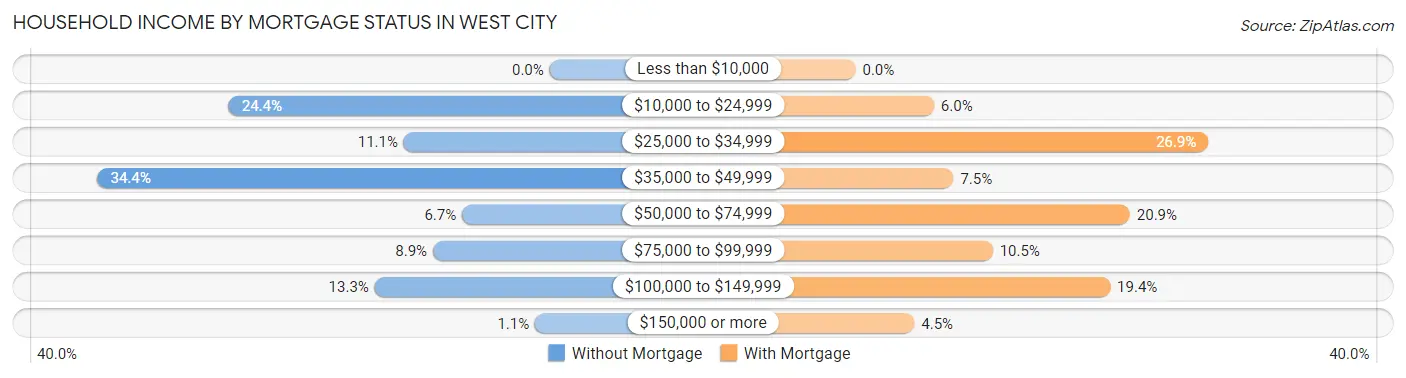
| Household Income | Without Mortgage | With Mortgage |
| Less than $10,000 | 0 (0.0%) | 0 (0.0%) |
| $10,000 to $24,999 | 22 (24.4%) | 4 (6.0%) |
| $25,000 to $34,999 | 10 (11.1%) | 18 (26.9%) |
| $35,000 to $49,999 | 31 (34.4%) | 5 (7.5%) |
| $50,000 to $74,999 | 6 (6.7%) | 14 (20.9%) |
| $75,000 to $99,999 | 8 (8.9%) | 7 (10.4%) |
| $100,000 to $149,999 | 12 (13.3%) | 13 (19.4%) |
| $150,000 or more | 1 (1.1%) | 3 (4.5%) |
| Total | 90 (100.0%) | 67 (100.0%) |
Property Value to Household Income Ratio in West City
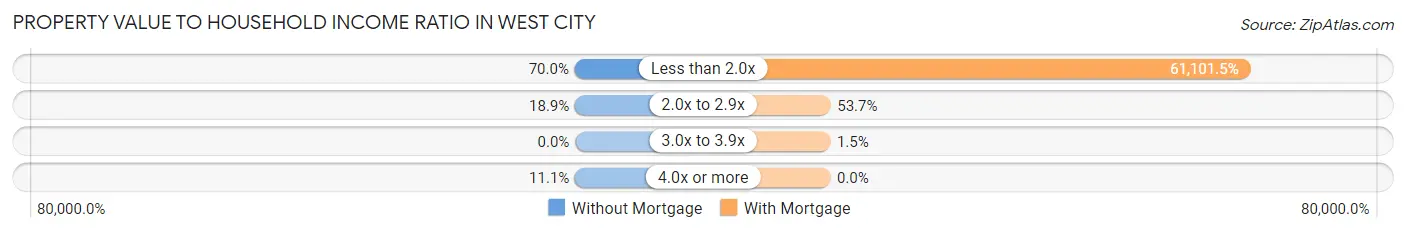
| Value-to-Income Ratio | Without Mortgage | With Mortgage |
| Less than 2.0x | 63 (70.0%) | 40,938 (61,101.5%) |
| 2.0x to 2.9x | 17 (18.9%) | 36 (53.7%) |
| 3.0x to 3.9x | 0 (0.0%) | 1 (1.5%) |
| 4.0x or more | 10 (11.1%) | 0 (0.0%) |
| Total | 90 (100.0%) | 67 (100.0%) |
Real Estate Taxes by Mortgage Status in West City
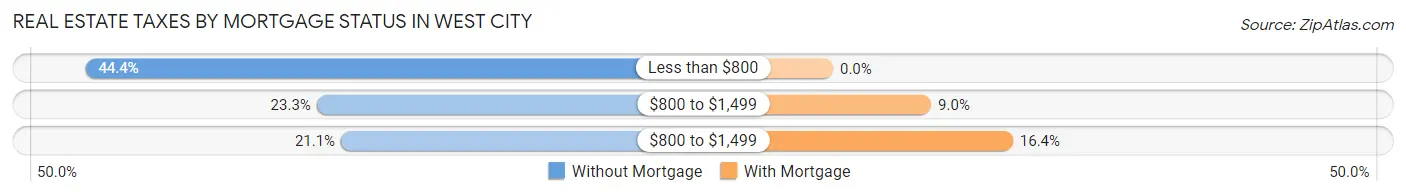
| Property Taxes | Without Mortgage | With Mortgage |
| Less than $800 | 40 (44.4%) | 0 (0.0%) |
| $800 to $1,499 | 21 (23.3%) | 6 (9.0%) |
| $800 to $1,499 | 19 (21.1%) | 11 (16.4%) |
| Total | 90 (100.0%) | 67 (100.0%) |
Health & Disability in West City
Health Insurance Coverage by Age in West City
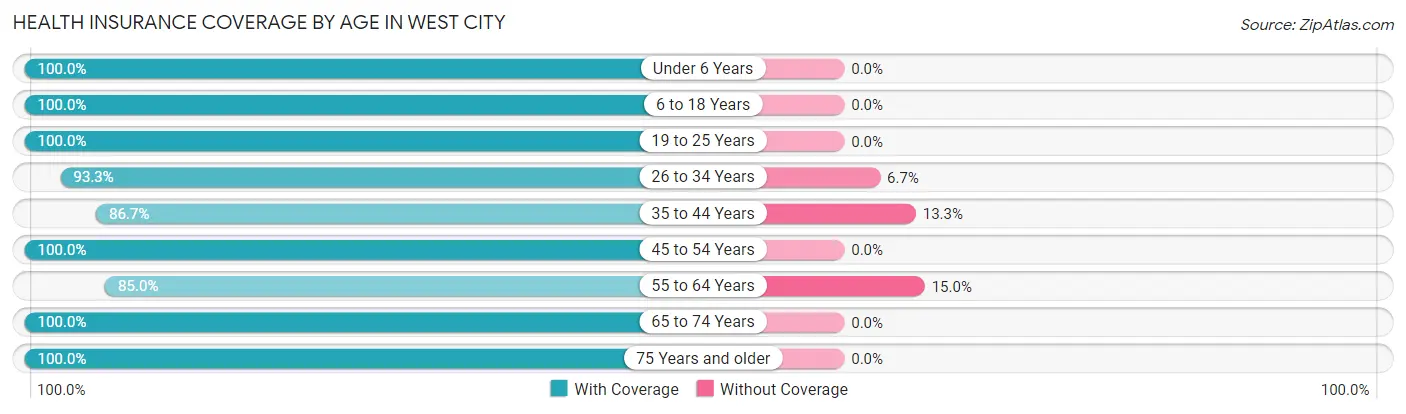
| Age Bracket | With Coverage | Without Coverage |
| Under 6 Years | 64 (100.0%) | 0 (0.0%) |
| 6 to 18 Years | 119 (100.0%) | 0 (0.0%) |
| 19 to 25 Years | 52 (100.0%) | 0 (0.0%) |
| 26 to 34 Years | 70 (93.3%) | 5 (6.7%) |
| 35 to 44 Years | 65 (86.7%) | 10 (13.3%) |
| 45 to 54 Years | 59 (100.0%) | 0 (0.0%) |
| 55 to 64 Years | 85 (85.0%) | 15 (15.0%) |
| 65 to 74 Years | 42 (100.0%) | 0 (0.0%) |
| 75 Years and older | 54 (100.0%) | 0 (0.0%) |
| Total | 610 (95.3%) | 30 (4.7%) |
Health Insurance Coverage by Citizenship Status in West City
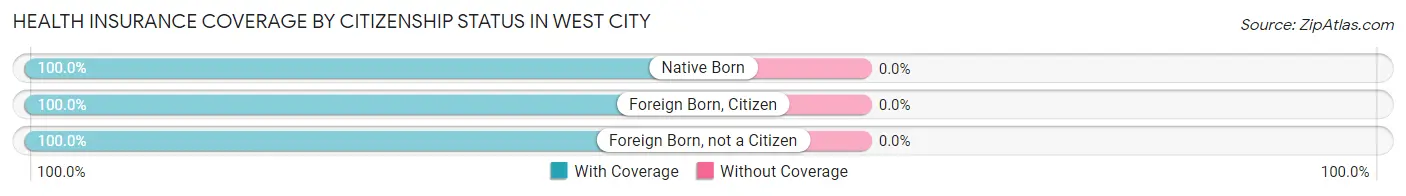
| Citizenship Status | With Coverage | Without Coverage |
| Native Born | 64 (100.0%) | 0 (0.0%) |
| Foreign Born, Citizen | 119 (100.0%) | 0 (0.0%) |
| Foreign Born, not a Citizen | 52 (100.0%) | 0 (0.0%) |
Health Insurance Coverage by Household Income in West City
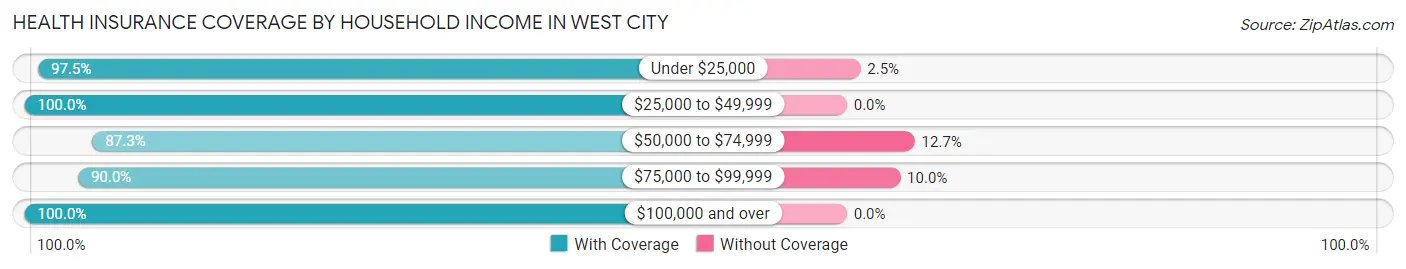
| Household Income | With Coverage | Without Coverage |
| Under $25,000 | 192 (97.5%) | 5 (2.5%) |
| $25,000 to $49,999 | 146 (100.0%) | 0 (0.0%) |
| $50,000 to $74,999 | 103 (87.3%) | 15 (12.7%) |
| $75,000 to $99,999 | 90 (90.0%) | 10 (10.0%) |
| $100,000 and over | 79 (100.0%) | 0 (0.0%) |
Public vs Private Health Insurance Coverage by Age in West City
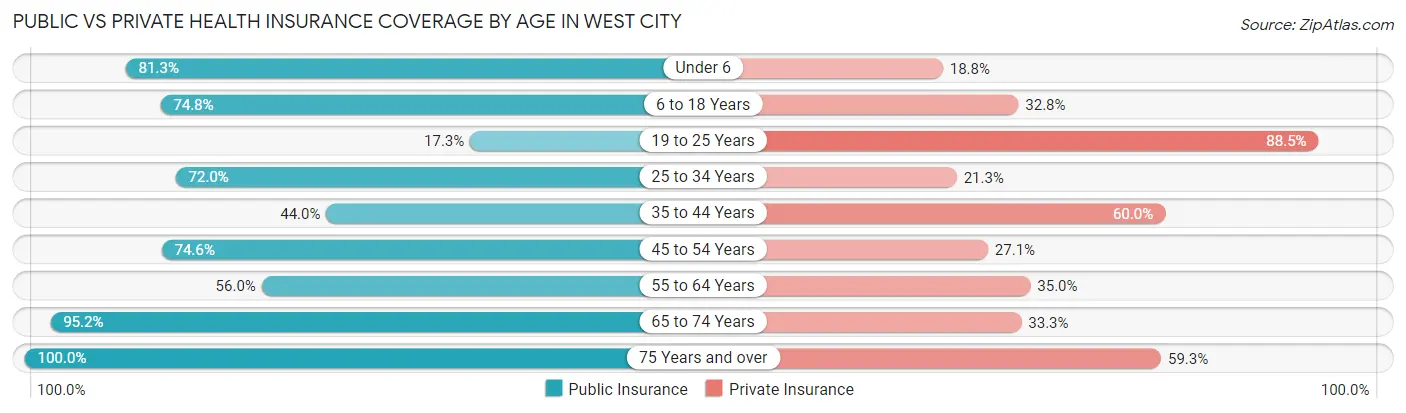
| Age Bracket | Public Insurance | Private Insurance |
| Under 6 | 52 (81.2%) | 12 (18.8%) |
| 6 to 18 Years | 89 (74.8%) | 39 (32.8%) |
| 19 to 25 Years | 9 (17.3%) | 46 (88.5%) |
| 25 to 34 Years | 54 (72.0%) | 16 (21.3%) |
| 35 to 44 Years | 33 (44.0%) | 45 (60.0%) |
| 45 to 54 Years | 44 (74.6%) | 16 (27.1%) |
| 55 to 64 Years | 56 (56.0%) | 35 (35.0%) |
| 65 to 74 Years | 40 (95.2%) | 14 (33.3%) |
| 75 Years and over | 54 (100.0%) | 32 (59.3%) |
| Total | 431 (67.3%) | 255 (39.8%) |
Disability Status by Sex by Age in West City
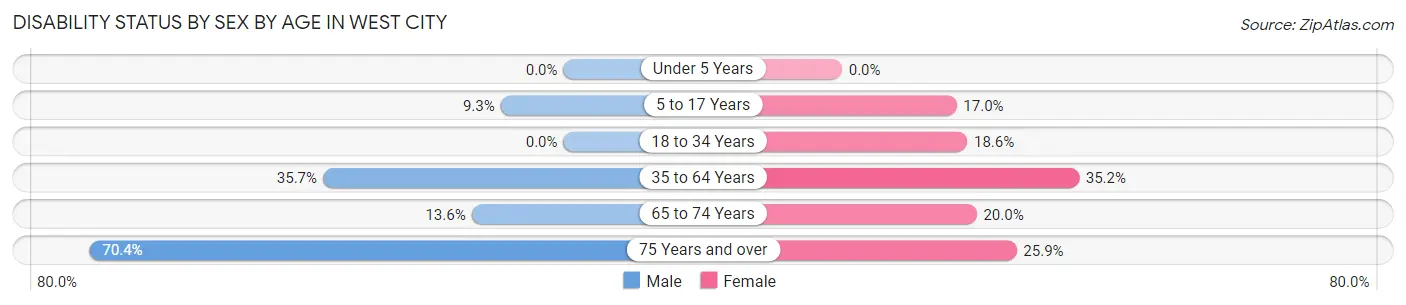
| Age Bracket | Male | Female |
| Under 5 Years | 0 (0.0%) | 0 (0.0%) |
| 5 to 17 Years | 7 (9.3%) | 8 (17.0%) |
| 18 to 34 Years | 0 (0.0%) | 16 (18.6%) |
| 35 to 64 Years | 45 (35.7%) | 38 (35.2%) |
| 65 to 74 Years | 3 (13.6%) | 4 (20.0%) |
| 75 Years and over | 19 (70.4%) | 7 (25.9%) |
Disability Class by Sex by Age in West City
Disability Class: Hearing Difficulty
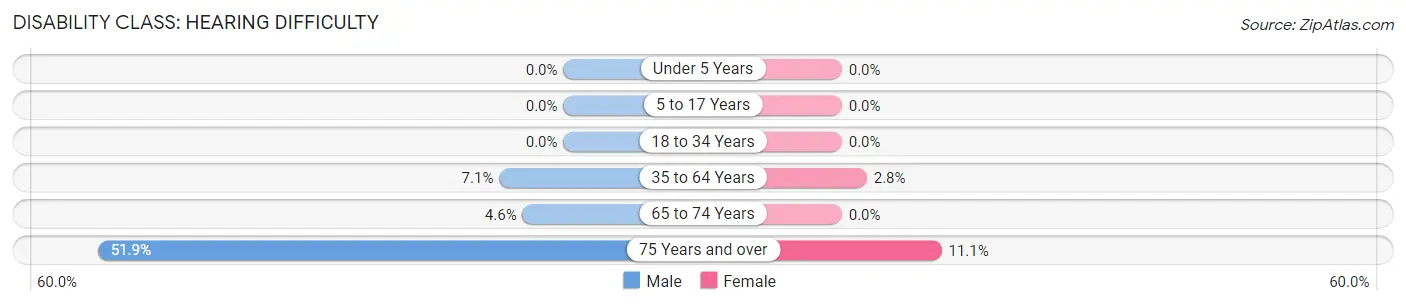
| Age Bracket | Male | Female |
| Under 5 Years | 0 (0.0%) | 0 (0.0%) |
| 5 to 17 Years | 0 (0.0%) | 0 (0.0%) |
| 18 to 34 Years | 0 (0.0%) | 0 (0.0%) |
| 35 to 64 Years | 9 (7.1%) | 3 (2.8%) |
| 65 to 74 Years | 1 (4.5%) | 0 (0.0%) |
| 75 Years and over | 14 (51.8%) | 3 (11.1%) |
Disability Class: Vision Difficulty
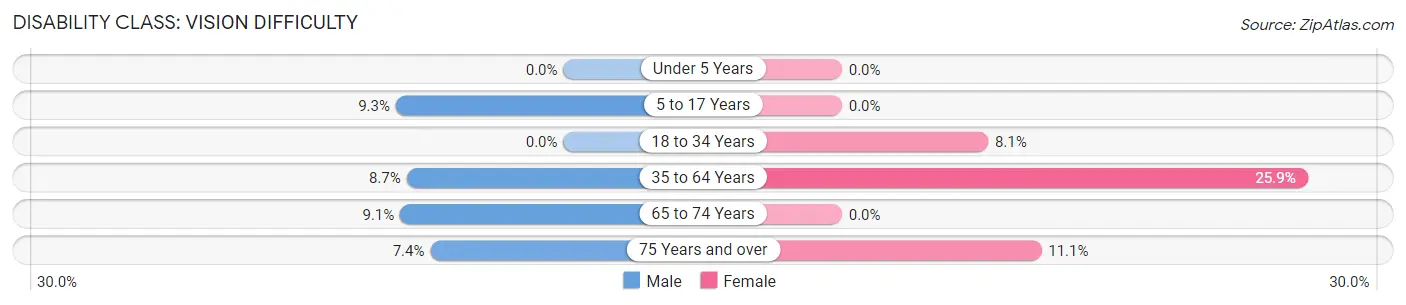
| Age Bracket | Male | Female |
| Under 5 Years | 0 (0.0%) | 0 (0.0%) |
| 5 to 17 Years | 7 (9.3%) | 0 (0.0%) |
| 18 to 34 Years | 0 (0.0%) | 7 (8.1%) |
| 35 to 64 Years | 11 (8.7%) | 28 (25.9%) |
| 65 to 74 Years | 2 (9.1%) | 0 (0.0%) |
| 75 Years and over | 2 (7.4%) | 3 (11.1%) |
Disability Class: Cognitive Difficulty
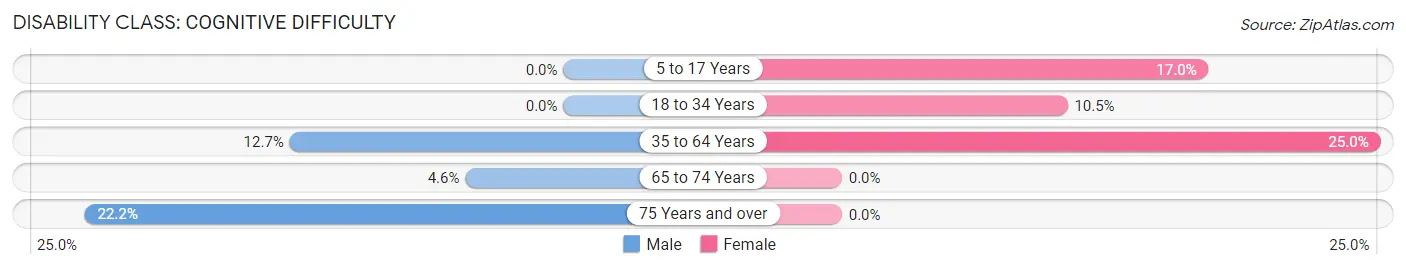
| Age Bracket | Male | Female |
| 5 to 17 Years | 0 (0.0%) | 8 (17.0%) |
| 18 to 34 Years | 0 (0.0%) | 9 (10.5%) |
| 35 to 64 Years | 16 (12.7%) | 27 (25.0%) |
| 65 to 74 Years | 1 (4.5%) | 0 (0.0%) |
| 75 Years and over | 6 (22.2%) | 0 (0.0%) |
Disability Class: Ambulatory Difficulty
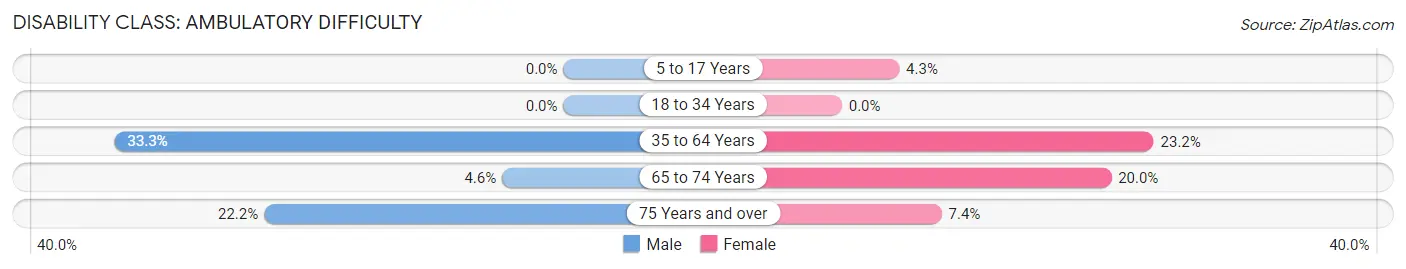
| Age Bracket | Male | Female |
| 5 to 17 Years | 0 (0.0%) | 2 (4.3%) |
| 18 to 34 Years | 0 (0.0%) | 0 (0.0%) |
| 35 to 64 Years | 42 (33.3%) | 25 (23.2%) |
| 65 to 74 Years | 1 (4.5%) | 4 (20.0%) |
| 75 Years and over | 6 (22.2%) | 2 (7.4%) |
Disability Class: Self-Care Difficulty
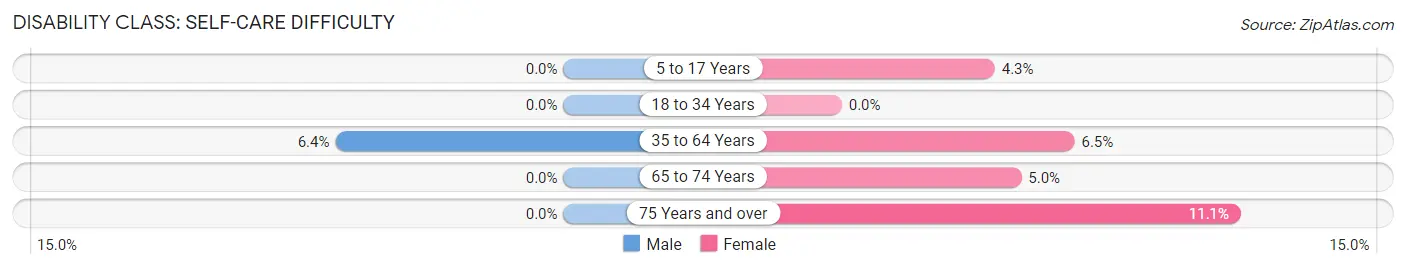
| Age Bracket | Male | Female |
| 5 to 17 Years | 0 (0.0%) | 2 (4.3%) |
| 18 to 34 Years | 0 (0.0%) | 0 (0.0%) |
| 35 to 64 Years | 8 (6.4%) | 7 (6.5%) |
| 65 to 74 Years | 0 (0.0%) | 1 (5.0%) |
| 75 Years and over | 0 (0.0%) | 3 (11.1%) |
Technology Access in West City
Computing Device Access in West City
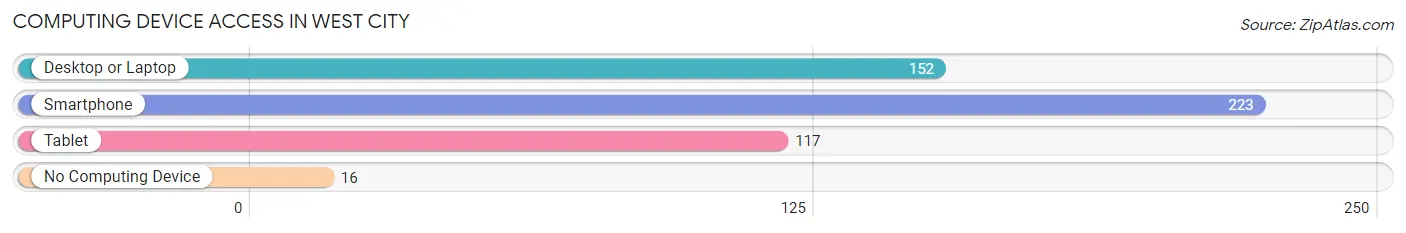
| Device Type | # Households | % Households |
| Desktop or Laptop | 152 | 58.2% |
| Smartphone | 223 | 85.4% |
| Tablet | 117 | 44.8% |
| No Computing Device | 16 | 6.1% |
| Total | 261 | 100.0% |
Internet Access in West City
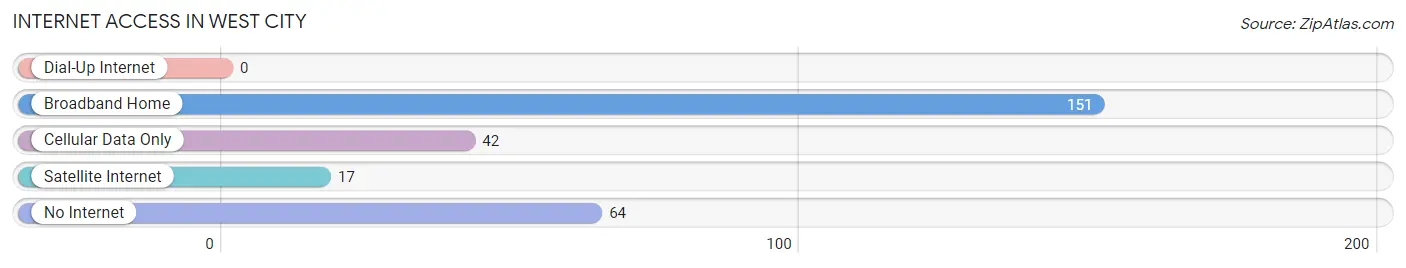
| Internet Type | # Households | % Households |
| Dial-Up Internet | 0 | 0.0% |
| Broadband Home | 151 | 57.9% |
| Cellular Data Only | 42 | 16.1% |
| Satellite Internet | 17 | 6.5% |
| No Internet | 64 | 24.5% |
| Total | 261 | 100.0% |
West City Summary
West City is a small city located in the state of Illinois. It is situated in the northern part of the state, about 30 miles from the city of Chicago. The city has a population of approximately 8,000 people and covers an area of about 4.5 square miles.
History
West City was founded in 1836 by a group of settlers from New York. The settlers were looking for a place to settle and start a new life. They chose the area because of its proximity to the Great Lakes and the abundance of natural resources. The settlers named the town West City because of its location on the western edge of the state.
The city quickly grew and prospered due to its location on the Great Lakes and its access to the Chicago and North Western Railway. The city was incorporated in 1854 and soon became a major hub for trade and commerce. The city was also home to several manufacturing plants, including a paper mill, a flour mill, and a sawmill.
In the late 19th century, West City was a popular destination for immigrants from Europe. Many of these immigrants settled in the city and opened businesses, which helped to further fuel the city’s growth.
Geography
West City is located in the northern part of Illinois, about 30 miles from the city of Chicago. The city is situated on the western edge of the state, near the Great Lakes. The city is bordered by the towns of North Chicago, Waukegan, and Zion.
The city is located in a flat, low-lying area, with an elevation of about 600 feet above sea level. The city is located in a temperate climate zone, with hot summers and cold winters. The average annual temperature is around 50 degrees Fahrenheit.
Economy
West City’s economy is largely based on manufacturing and services. The city is home to several manufacturing plants, including a paper mill, a flour mill, and a sawmill. The city is also home to several service-based businesses, such as restaurants, retail stores, and medical offices.
The city is also home to several educational institutions, including a community college and a vocational school. The city is also home to a number of parks and recreational facilities, which attract visitors from all over the state.
Demographics
As of the 2010 census, West City had a population of 8,000 people. The population is largely white, with a small percentage of African Americans, Hispanics, and Asians. The median household income is around $50,000, and the median age is around 40 years old.
The city is home to several churches, including Catholic, Lutheran, and Methodist. The city is also home to several schools, including a public elementary school, a middle school, and a high school.
Conclusion
West City is a small city located in the northern part of Illinois. The city has a population of 8,000 people and covers an area of 4.5 square miles. The city was founded in 1836 by a group of settlers from New York and quickly grew and prospered due to its location on the Great Lakes and its access to the Chicago and North Western Railway. The city’s economy is largely based on manufacturing and services, and the city is home to several educational institutions, churches, and parks. The population is largely white, with a small percentage of African Americans, Hispanics, and Asians.
Common Questions
What is Per Capita Income in West City?
Per Capita income in West City is $20,769.
What is the Median Family Income in West City?
Median Family Income in West City is $50,446.
What is the Median Household income in West City?
Median Household Income in West City is $44,375.
What is Income or Wage Gap in West City?
Income or Wage Gap in West City is 25.9%.
Women in West City earn 74.1 cents for every dollar earned by a man.
What is Inequality or Gini Index in West City?
Inequality or Gini Index in West City is 0.35.
What is the Total Population of West City?
Total Population of West City is 640.
What is the Total Male Population of West City?
Total Male Population of West City is 322.
What is the Total Female Population of West City?
Total Female Population of West City is 318.
What is the Ratio of Males per 100 Females in West City?
There are 101.26 Males per 100 Females in West City.
What is the Ratio of Females per 100 Males in West City?
There are 98.76 Females per 100 Males in West City.
What is the Median Population Age in West City?
Median Population Age in West City is 35.8 Years.
What is the Average Family Size in West City
Average Family Size in West City is 3.0 People.
What is the Average Household Size in West City
Average Household Size in West City is 2.5 People.
How Large is the Labor Force in West City?
There are 272 People in the Labor Forcein in West City.
What is the Percentage of People in the Labor Force in West City?
57.7% of People are in the Labor Force in West City.
What is the Unemployment Rate in West City?
Unemployment Rate in West City is 7.0%.